ckd hira instructions for use · ckd hira instructions for use. the . ckd hira is a risk management...
TRANSCRIPT

61ONTARIO RENAL NETWORK
Tools and Templates Appendix J
CKD HIRA Instructions for Use
The CKD HIRA is a risk management planning tool designed to help identify hazards and assess their associated risks, as the first step in the emergency management planning cycle. The focus of the CKD HIRA is to better identify and understand hazards specific to your CKD program needs which may not have been previously or adequately addressed by the hospital’s Emergency Preparedness Plan.
PART 1 - GETTING STARTEDOpen the CKD HIRA Workbook and note the five tabs along the bottom of the document.
TAB DETAILS
The HIRA Process tab provides a high-level version of this document explaining how to use the work-book. This guide complements these Instructions by elaborating on methodologies used, describing expectations set by the Ontario Renal Network and providing a few helpful hints regarding how to use Excel.
The Facility HIRA Template (CKD) tab is the working document used to assess CKD program and facility hazards. The content and framework represent an interactive CKD adaption of Emergency Management Ontario’s 2012 HIRA workbook. Note that some definitions and categories have been modified to better reflect CKD requirements.

62 ONTARIO RENAL NETWORK
The Facility HIRA Analysis – Table tab is the first of two outputs from the Facility HIRA Template tab. This tab will summarize, in a few easy steps, the risk assessments from your responses to each hazard assessed. The Facility HIRA Analysis – Graph tab is the second of two outputs from the Facility HIRA Template tab. This tab will summarize in graph format the total scores from each hazard assessed in a visual format. Both tables and graphs will support the next steps of emergency management planning.
The Provincial HIRA (CKD) tab is for reference only. The details on this tab have been obtained from a review of the MOHLTC and Province of Ontario HIRA tools. This tab provides additional resource and information, which, when used in combination with the program/facility and municipal HIRA, can be leveraged to ensure all hazards and risks associated with CKD have been identified and thoroughly assessed. There are no mandatory actions associated with this spreadsheet. The Provincial HIRA references used to support the page content were obtained from: • The 2012 Ontario HIRA as assessed by Emergency Management Ontario (EMO), including hazard descriptions • The 2007 Ministry of Health and Long-Term Care HIRA as assessed by the Ministry’s Emegency Management Unit • Ontario Renal Network’s supplemental CKD considerations for identified Ontario risks
PART 2 - THE CKD HIRA PROCESS
This guide will walk you through each of the essential actions in developing and maintaining a HIRA.
i. Hazard Identification: identify which hazards can impact your program and those that cannot
ii. Risk Assessment: assess the level of risk for each of the relevant hazards
iii. Risk Analysis: analyze the hazards to support prioritization for your emergency management program
iv. Monitor & Review: monitor and review hazards and their associated risks on at least an annual basis
HAZARD IDENTIFICATION AND RISK ASSESSMENTOpen the Facility HIRA Template (CKD) tab, as shown below. Both the (i) Hazard Identification and (ii) Risk Assessment steps will be completed using this spreadsheet.

63ONTARIO RENAL NETWORK
ONTARIO RENAL NETWORK HIRA RECOMMENDATIONS
A detailed list of potential hazard (types, names) are listed on this tab. The Ontario Renal Network HIRA Rec-ommendation drop down menu identifies each potential hazard as either Mandatory, Recommended or Optional. Ontario Renal Network HIRA Recommendations cannot be modified within the tool.
i. Mandatory – Hazards listed as ‘mandatory’ require every renal program and facility to complete a HIRA forthe specific hazard type/name. There are four (4) mandatory hazards each program must assess using thetool.
ii. Recommended – Hazards listed as’ recommended’ require every renal program and facility to review thehazard type and determine if the hazard and associated risks are relevant based on local, historical orregional factors. There are twelve (12) recommended hazards each program/facility should reviewand determine if the listed hazard is applicable to their local environment.
iii. Optional – Hazards listed as ‘optional’ should be reviewed and a complete hazard identification and riskassessment completed for each as relevant to local, historical or regional factors.
STEP 1: HAZARD IDENTIFICATION
Review the complete list of hazards and identify whether the hazard applies to you by selecting the adjacent cell under “Local Hazard” (column E) and choosing “Yes” or “No” from the drop down menu that appears.
Note: All Mandatory CKD HIRA require a “Yes” response under Local Hazard.

64 ONTARIO RENAL NETWORK
H Helpful Hint: You can find high level descriptions of
these hazards, along with the Ontario Renal Network’s evaluation of the potential impact to CKD care, on the Provincial HIRA (CKD) tab.
STEP 2: ADD HAZARDS NOT PREVIOUSLY LISTED AS REQUIRED
Identify any additional critical local hazards not previously listed and enter them on this worksheet.
Note: We also recommend you review your facility and municipal HIRA for any critical local hazards that may impact the delivery of CKD care. The workbook allows you to enter these into the spreadsheet, leveraging blank rows at the bottom. Please be sure to classify these as Mandatory, Recommended or Optional based on your assessment of the impact to CKD care and remember to save your work.

65ONTARIO RENAL NETWORK
H
Helpful Hint: After reviewing the risks to see if they are applicable to you, you can filter the list to only show the hazards that apply to you, or sort the list so all the hazards that apply to you are at the top. See the images below for both options.

66 ONTARIO RENAL NETWORK
H
RISK ASSESSMENT
Helpful Hint: With up to 50 local hazards to assess, consider completing this assessment in phases, beginning with hazards assessed as “Mandatory” by the Ontario Renal Network and expanding scope on a quarterly or annual basis.
The Ontario Renal Network reviewed the Ontario hazard list and identified which hazards could have an impact on the delivery of CKD therapy, leveraging the definitions below:
Ontario Renal Network Recommendation
Description
Hazards with a significant impact on the delivery of CKD care and a Mandatoryprobable or greater likelihood of occurrence in Ontario.
Recommended Hazards with a likely impact to CKD care with varied probabilities.
Optional Hazards which are either local in nature or may not directly impact CKD care.
The Risk Assessment evaluates the likelihood, impact and changes to risk over time for each hazard identified. The CKD HIRA Workbook allows you to quickly evaluate each hazard and associated risk using a standardized approach. Complete the Risk Assessment by following the steps outlined below:
STEP 1: FREQUENCY ASSESSMENT (LIKELIHOOD)
Complete the frequency risk assessment evaluating the likelihood of each hazard you are assessing by selecting the appropriate response from the drop-down menu as shown below, leveraging the definitions below.

67ONTARIO RENAL NETWORK
Frequency Assessment Definition
Rare
Very Unlikely
Unlikely
Probable
Likely
Almost Certain
Less than a 1% chance of occurrence in any year. Hazards with return periods >100 years.
Between a 1% - 2% chance of occurrence in any year. Occurs every 50 - 100 years and includes hazards that have not occurred but are reported to be more likely to occur in the near future.
Between a 2% - 10% chance of occurrence in any year. Occurs every 20 - 50 years.
Between a 10% - 50% chance of occurrence in any year. Occurs every 5 - 20 years.
Between a 50% - 100% chance of occurrence in any year. Occurs within 5 years.
100% chance of occurrence in any year. The hazard occurs annually.
The “Frequency Score” will auto-populate a numeric value associated with your rating, where 1 equals “rare” and 6 equals “almost certain”.
The “Frequency Notes” column allows you to input any comments regarding the frequency of the hazard. For instance, under “energy emergency” if your facility’s back-up generator was in need of replacement and a risk is therefore more likely, you could capture this here.

68 ONTARIO RENAL NETWORK
STEP 2: CONSEQUENCE ASSESSMENT (IMPACT) For each hazard you are assessing, complete the consequence assessment.
The consequence assessment examines the impact the hazard will have, evaluating the following factors: fatalities, injuries, evacuation requirements, property damage, critical infrastructure, environmental damage, business continuity, and psychosocial impacts.
Select each of the appropriate cells to access the drop down menu to input your assessment. Definitions for each factor are below. Remember to save your work regularly.
Fatalities Assessment Definition
None Not likely to result in fatalities within the community.
Minor Could result < 5 fatalities within the community.
Moderate Could result in 5 - 10 fatalities within the community.
Severe Could result in 10 - 50 fatalities within the community.
Catastrophic Could result > 50 fatalities within the community.
InjuriesAssessment Definition
None Not likely to result in injuries within the community.
Minor Could injure < 25 people within the community.
Moderate Could injure 25 - 100 people within the community.
Severe Could injure > 100 people within the community.
The definitions for assessing each consequence factor are as follows:

69ONTARIO RENAL NETWORK
EvacuationAssessment Definition
None Not likely to result in an evacuation shelter-in-place orders or people stranded.
Minor Could result in < 50 people being evacuated, sheltered-in-place, or stranded.
Could result in 50 - 100 people being evacuated, sheltered-in-place, or stranded.
Could result in > 100 people being evacuated, sheltered-in-place, or stranded.
Definition
Not likely to result in property damage within the community.
Could cause minor and mostly cosmetic damage.
Localized severe damage (a few buildings destroyed).
Localized severe damage (a few buildings destroyed).
Definition
Not likely to result in property damage within the community.
Could cause minor and mostly cosmetic damage.
Localized severe damage (a few buildings destroyed).
Localized severe damage (a few buildings destroyed).
Definition
Not likely to disrupt critical infrastructure services.
Could disrupt 1 critical infrastructure service such as water, power, and capital equipment (HD machines, water treatment machines, portable water machines, backup generators).
Could disrupt 2-3 critical infrastructure services such as water, power, and capital equipment (HD machines, water treatment machines, portable water machines, backup generators).
Moderate
Severe
Property DamageAssessment
None
Minor
Moderate
Severe
Critical Infrastructure Failure/Service Impact Assessment
None
Minor
Moderate
Severe
Environmental Damage Assessment
None
Minor
Moderate
Severe
Could disrupt > 3 critical infrastructure services such as water, power, and capital equipment (HD machines, water treatment machines, portable water machines, backup generators).

70 ONTARIO RENAL NETWORK
Business Continuity Impact Assessment Definition
None
Moderate
Severe
Not likely to disrupt business/financial activities.
Could result in losses for a few businesses.
Could result in losses for an industry.
Psychosocial ImpactAssessment Definition
None
Moderate
Severe
Not likely to result in significant psychosocial impacts.
Significant psychosocial impacts including limited panic, hoarding, self-evacuation, and long-term psychosocial impacts.
Widespread psychosocial impacts, e.g. mass panic, widespread hoarding and self-evacuation and long-term psychological impacts.
The consequence score and assessment are calculated automatically leveraging the responses you provide to the individual factors. This calculation is based on Emergency Management Ontario’s (EMO) methodology where:
• Fatalities are scored on a scale of 0 to 4 where none equals 0 and catastrophicequals 4.
• Injuries, evacuation, property damage, critical infrastructure, and environmentaldamage are scored on a scale of 0 to 3, where none equals 0 and severe equals 3.
• Business continuity impact and psychosocial impact are scored on a scale of 0to 2, where none equals 0 and severe equals 2.
These values are subtotaled and then adjusted to allow equal weighting of frequency and conse-quence assessments in the evaluation, calculated as per the table below:
Consequence Subtotal Consequence Assessment Consequence
Score
1-4 Minor 1
5-6 Slight 2
7-8 Moderate 3
9-10 Severe 4
11-12 Very Severe 5
>13 Catastrophic 6

71ONTARIO RENAL NETWORK
Similar to the frequency assessment, the consequence assessment provides a cell for inputting any notes related to the impact of that hazard, as indicated below:
STEP 3: CHANGE IN RISK (OVER TIME, DYNAMIC NATURE OF RISK)Hazards and their risks do not remain static over time. Assess how the risks of this hazard will change in both their likelihood of occurring (frequency) and in how vulnerable your facility will be to that hazard (conse-quence) by answering “yes” or “no” to each of the questions in the table header, also written below.
Changing Risk = Change in Frequency + Change in Vulnerability
Change in Frequency Assessment• Is the number of reported non-emergency occurrences of the hazard increasing?• Is human activity (e.g. population expansion, altering of drainage flow patterns) likely to lead to more interaction with the hazard or an increase in frequency?• Is there an environmental reason (e.g. climate change) why the frequency of the hazard may increase?• Are human factors such as business, financial, international practices more likely to increase the risk?
Change in Vulnerability Assessment• Is a large percentage of the population vulnerable or is the number of people vulnerable to this hazard increasing?• Does critical infrastructure reliance or a “just-on-time” delivery system (e.g. hemodialysis and peritoneal dialysis solutions supply) make the population more vulnerable?• Are response agencies not aware of, practiced, and prepared for this hazard?• Are no prevention/ mitigation measures currently in use for this hazard?
For each assessment, the score is calculated automatically leveraging EMO’s methodology as described below: • If the answer is “yes” to two or more questions, then the assessment score equals 2. • If the answer is “yes” to one or fewer questions, then the assessment score equals 1.
As always, remember to save your progress.

72 ONTARIO RENAL NETWORK
STEP 4: TOTAL RISK SCORECalculate total risk – though there is no action required as the spreadsheet completes this for you! The Total Risk Score is based on the frequency, consequence, and changing risk assessments you completed for the applicable hazards.
The total risk score is determined by the formulas used within the workbook for both Frequency and Consequence. Each variable for frequency, consequence and changing risk selected as the response trigger an automatic score for each category. Therefore:
Total Risk = Frequency x Consequence x Changing Risk
Risk AnalysisThe objective of the Risk Analysis is to rank hazards based on risk to prioritize for execution in your emergency management program. Based on the responses you submitted in the Risk Identification and Risk Assessment steps, the total risk has been calculated and is presented in two formats: pivot tables and bubble graphs.
Pivot TablesIf you prefer your information presented in a table, this is the analysis for you. Start by opening the Facility HIRA Analysis – Table spreadsheet to see the following screen:
To Update the tables with your assessment results, simply follow these steps:
Step 1: Right-click on any of the teal-coloured cells in the table’s header

73ONTARIO RENAL NETWORK
Step 2: When you right-click a cell in the header, the menu below will appear. Select the “Refresh” button to update the table with your assessments.
Below is an example of what you should see, leveraging mock data. The two tables list all the local hazards you assessed, ranked by the total risk score (Frequency x Consequence x Changing Risk), and grouped by risk level (defined below). All of the hazards that the Ontario Renal Network mandated to assess as presented in one table, with recommended and optional assessments consolidated in another.

74 ONTARIO RENAL NETWORK
Total Risk Total Risk Level CategoryScore
>50 Extreme
41-50 Very High
31-40 High
21-30 Moderate
11-20 Low
<10 Very Low
H
The risk level categories you see on the previous page are
defined by EMO’s HIRA methodology:
Next Steps:For example, the CKD Program has identified a number of risks to be incorporated into your new local CKD Emergency Management Plan in order to develop and implement mitigation and prevention strategies targeting 8 hazards. Leveraging the previous mock data, consider starting first with any hazards with a high score which were flagged as Mandatory and hazards where total scores rated “Extreme” and “Very High” in the non-mandatory assessments. To optimize your resources, consider where hazards have similar strategies, such as an energy emergency and an oil/gas emergency.
Helpful Hint: Focus on the total risk scores associated with the individual hazards instead of the sum associated with the risk level grouping, which could be misleading. Let’s look at a segment of the mock data as an example.
Here we are showing two risk levels (Moderate and Low) where the sum of the total risks under Moderate (54) is lower than that under Low (84).
In isolation, this may appear to suggest that the program should focuson the Low risk level hazards given it represents a higher total risk. How-ever, if you only have resources to prepare for one hazard, targeting one hazard under Moderate will always provide a better return on your investment than a hazard under Low. As it is better to invest in mitigating a few high-risk hazards instead of many low risk hazards, the total risk score calculated at the risk level category should not be used for the purposes of prioritization.
Note: There is no easy way to hide those values from the pivot table, should you want to remove them so not to cause any confusion. However, you can always change the font of those cells to white so they are not visible on the white backdrop.

75ONTARIO RENAL NETWORK
H
Helpful Hint: Note that if you added your own unique local hazards to the Facility HIRA Template (CKD) spreadsheet, they will default to the non-mandatory assessments unless you categorize them as “mandatory” (column D) on that spreadsheet.
Helpful Hint: If you update your data on the Facility HIRA Template (CKD) spreadsheet, you will need to again
update the pivot tables following the original directions provided above.
Bubble Graphs:
If you prefer visuals, start by opening the Facility HIRA Analysis – Graphs spreadsheet.
There are three graphs corresponding to the Ontario Renal Network’s recommendation for assessing the haz-ard: Mandatory, Recommended, and Optional. The size of the bubble represents the size of the total risk score (Frequency x Consequence x Changing Risk) and the location of that bubble on the axis is determined by its frequency (x axis) and consequence (y axis) scores.
These graphs update automatically so there are no additional actions for you to review your data, although as you will see in the helpful hints, you may need to tweak some of the labels.
H

76 ONTARIO RENAL NETWORK
Below is an example of what you might see. Note that for the purposes of the representation, mock data is used.
t) Catastrophic
mpa
c
Very Severe
e (I
or Severe
ce
Son
sequ
enc Moderate
Slight
Minor
C
Rare Very Unlikely Unlikely Probable Very Likely Almost Certain
Frequency Score (Likelihood)
Geomagnetic storm
Terrorism/CBRNE
Cyber Attack Tornado
ExSnotreme Twstoremperaturm/BlizzardesFreezing Rain
Forest/Woodland Fire
EarthquakeFlood
To leverage these graphs to prioritize for execution in your emergency management program, start with all hazards on the “Mandatory” graph, beginning with both the largest bubbles and any bubbles that appear in the upper right-hand quadrant, as highlighted below. Then move on to the “Recommended” graph, likewise beginning with the largest bubbles and any bubbles in the upper-right hand quadrant.
t) Catastrophic
mpa
c
Very Severe
e (I
or Severe
ce
Son
sequ
enc Moderate
Slight
Minor
C
Rare Very Unlikely Unlikely Probable Very Likely Almost Certain
Frequency Score (Likelihood)
Geomagnetic storm
Terrorism/CBRNE
Cyber Attack Tornado
ExSnotreme Twstoremperaturm/BlizzardesFreezing Rain
Forest/Woodland Fire
EarthquakeFlood
H
Helpful Hint: Note that if you added your own unique local hazards to the Facility HIRA Template (CKD) spreadsheet, they will not appear in any of these charts unless you selected a Mandatory, Recommended, or Optional response, based on the segment to which you feel this hazard belongs.

77ONTARIO RENAL NETWORK
Helpful Hint: You are likely to end up with a few hazards that have the same frequency and consequence assessment, causing those hazard labels to be illegible as they overlap. In the example above, you can’t make out “Snow-storm/blizzard” and “Extreme Temperatures” on the large light blue bubble.
H
78 ONTARIO RENAL NETWORK
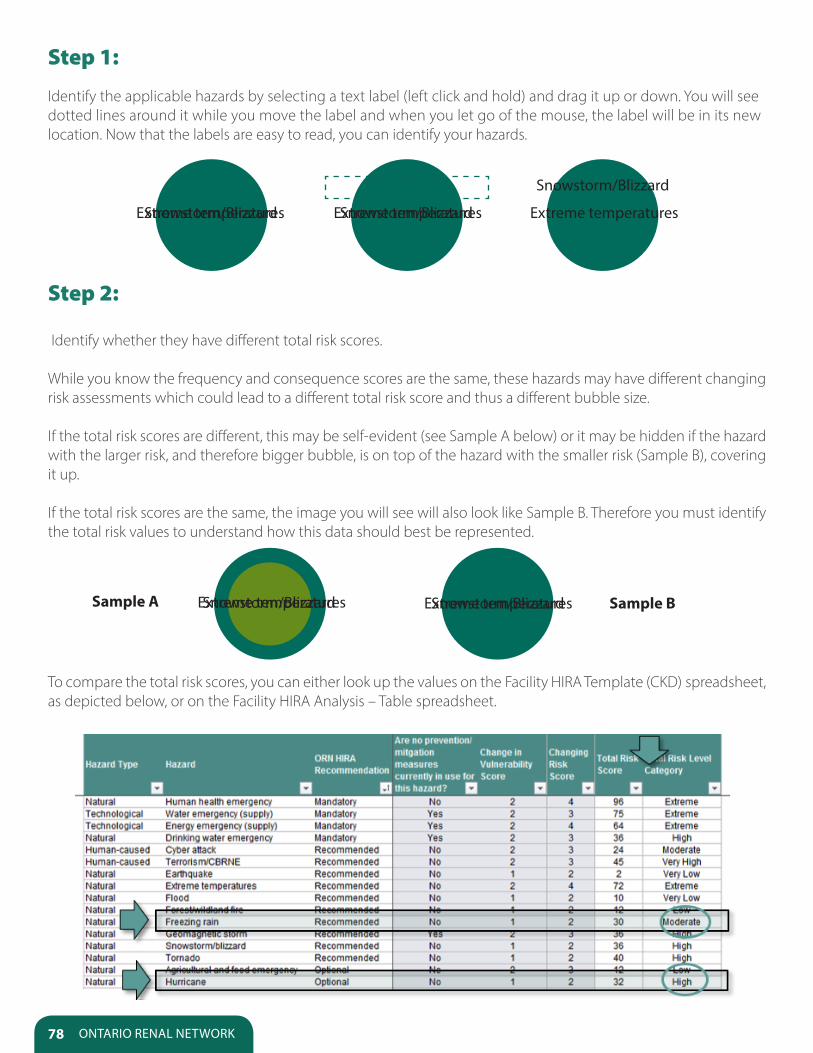
Step 1:
Identify the applicable hazards by selecting a text label (left click and hold) and drag it up or down. You will see dotted lines around it while you move the label and when you let go of the mouse, the label will be in its new location. Now that the labels are easy to read, you can identify your hazards.
Snowstorm/Blizzard
ExSnotreme twstoremperm/Blizzaraturdes ExSnotreme twstoremperm/Blizzaraturdes Extreme temperatures
Step 2:
Identify whether they have different total risk scores.
While you know the frequency and consequence scores are the same, these hazards may have different changing risk assessments which could lead to a different total risk score and thus a different bubble size.
If the total risk scores are different, this may be self-evident (see Sample A below) or it may be hidden if the hazard with the larger risk, and therefore bigger bubble, is on top of the hazard with the smaller risk (Sample B), covering it up.
If the total risk scores are the same, the image you will see will also look like Sample B. Therefore you must identify the total risk values to understand how this data should best be represented.
Sample A ExSnotreme twstoremperm/Blizzaraturdes ExSnotreme twstoremperm/Blizzaraturdes Sample B
To compare the total risk scores, you can either look up the values on the Facility HIRA Template (CKD) spreadsheet, as depicted below, or on the Facility HIRA Analysis – Table spreadsheet.

79ONTARIO RENAL NETWORK
Step 3: Adjust how the data is presented, as required.
Situation 1: Your overlapping hazards have the same total risk score.
In this circumstance, having two labels on the same bubble represents the data accurately. The only action you would need to take is to make the labels visible so they do not overlap, which you already completed in Step 1. Visually, the bubble on your graph would have resembled Sample B on the previous page and your total risk scores would be identical (which they are not in the table on the previous page).
Situation 2: Your overlapping hazards have different total risk scores and your bubbles looks like “Sample A” on the previous page.
In this circumstance, you need to ensure that the label on the smaller, internal bubble corresponds to the hazard with the smaller risk score. Follow Step 1 if you need to reposition your labels. In the example on the previous page, the smaller bubble would be associated with “Snowstorm/blizzard”, so you will want to position that label accordingly to accurately reflect the appropriate bubble size and risk level.
Situation 3: Your overlapping hazards have different total risk scores and your bubbles looks like “Sample B” on the previous page.
In this circumstance, the bubble associated with the larger risk is covering up the bubble associated with the smaller risk. To move the bigger bubble behind the smaller bubble, you need to reorder the data that is feeding this graph.
First: right-click anywhere on the respective graph and select “Select Data” from the menu that appears, as is shown to the right.
Next: the menu below will appear, listing all the data coming to this chart. Scroll down through the list until you find the associated hazard with the smaller risk score, by pushing on the indicated arrow below.

80 ONTARIO RENAL NETWORK
Select the hazard with the smaller risk score, in this case, “Snowstorm/blizzard”. Do not select “OK” yet.
Now that you have selected the smaller hazard, you will want to move this hazard down the list so that it follows after the larger hazard, in this case “Extreme temperatures”. Make sure the applicable hazard is highlighted, as is seen below, then push the down arrow as many times as necessary so that “Snowstorm/blizzard” comes after “Extreme temperatures”, in the example shown here. It only needs to be pressed once.

81ONTARIO RENAL NETWORK
Once you have done so, your graph will have moved the smaller bubble to the front. Select “OK” to close the window.
Just like in Situation 2 described above, you may need to move your labels so they clearly indicate which hazard is the larger risk. Complete that step here, if required (as it is in this example) and remember to save your work.
Monitor & Review
The last step in the HIRA process – congratulations on your progress!
Both the frequency of hazards we face and our vulnerability to them are dynamic and always changing. As such, it is critical to review your HIRA at least annually to ensure it reflects current risks. Further, if you have decided to tackle your HIRA in phases (e.g. only starting with the Mandatory hazard assessments), your pre-determined review cycle is an excellent opportunity to assess the next phase of hazards.