ck2017: mapping, measuring and mitigating urban water challenges
TRANSCRIPT

A product of WRI Ross Center for Sustainable Cities
VITTAL BOGGARAM & RAJ BAGATH
MAPPING, MEASURING AND MITIGATING
URBAN WATER CHALLENGES
Photo Credit: Arnie Papp/Flickr

WHY DO WE NEED IUWM
Image Source – WB, WRI, ToI, UConn
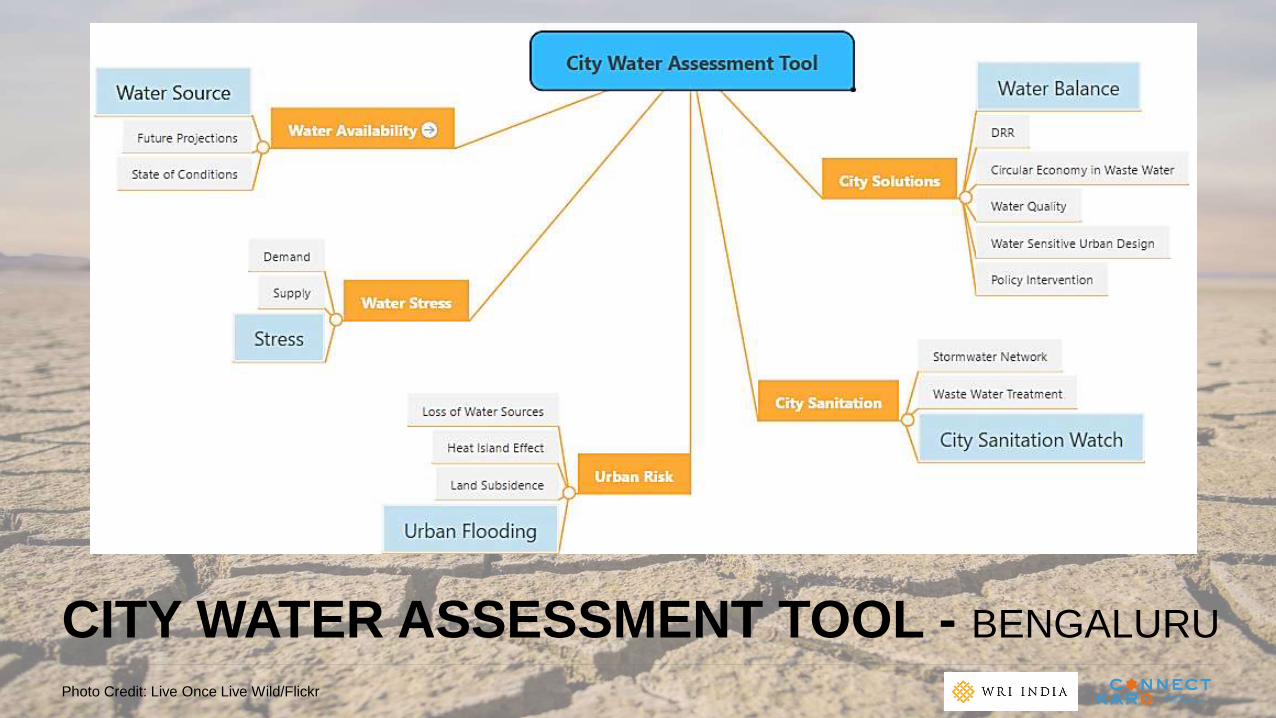
CITY WATER ASSESSMENT TOOL - BENGALURU
Photo Credit: Live Once Live Wild/Flickr
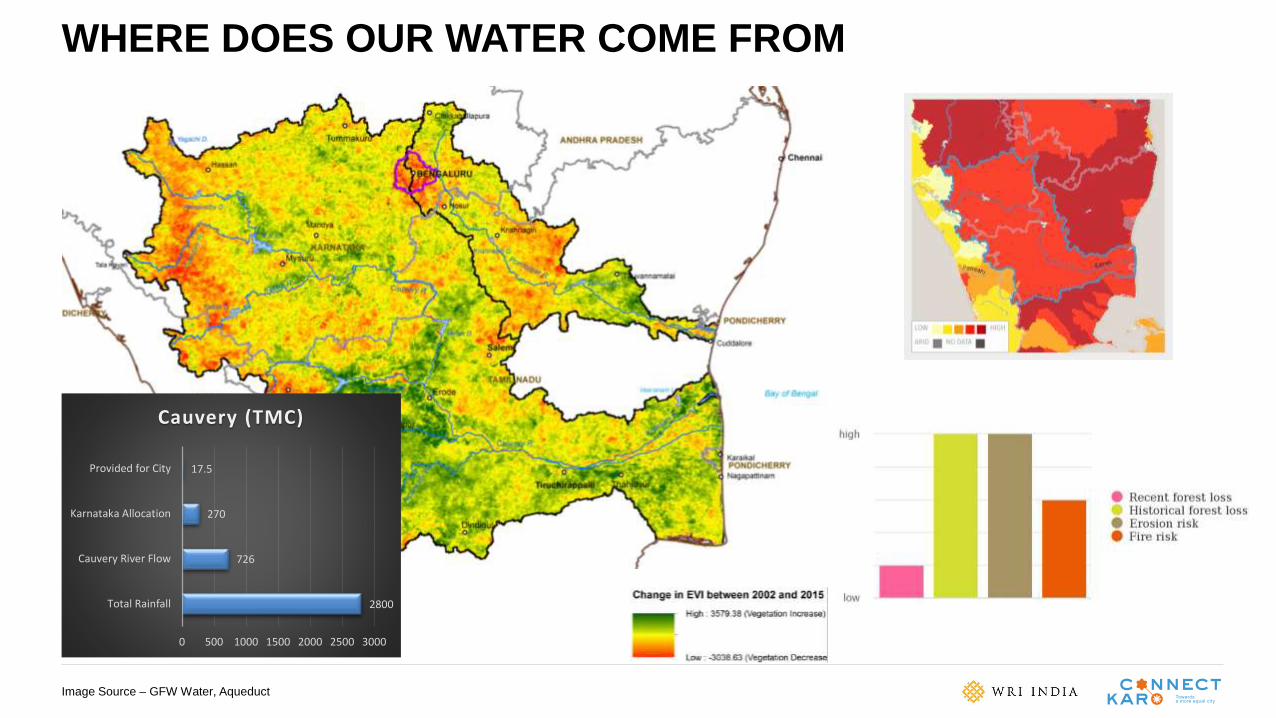
WHERE DOES OUR WATER COME FROM
Image Source – GFW Water, Aqueduct
2800
726
270
17.5
0 500 1000 1500 2000 2500 3000
Total Rainfall
Cauvery River Flow
Karnataka Allocation
Provided for City
Cauvery (TMC)

FUTURE THREATS TO AVAILABILITY
Image Source – GFW Water, KSAPCC

BENGALURU’S WATER
DEMAND
836
372
67
1752
3027
0 1000 2000 3000 4000
Domestic
Commercial and Public
Industrial
Vegetation
Total
Water Demand 2011 (MLD)
• Total = human + vegetation• Human (2011) = 1,275MLD• Human (2017) = 1,595MLD• Vegetation (2014) = 1,752MLD
Photo Credit: Chetiya Sahabandu/Flickr

BENGALURU’S WATER
SUPPLY
1350
-664
686
1611
244
1367
2961
-1000
-500
0
500
1000
1500
2000
2500
3000
3500
Water Availability (MLD)
• Kaveri = 1,350MLD• NRW (49.25%) = 664MLD• Human Supply = 68lpcd• Rainfall = 1,611MLD• Total Available = 2961MLD

BENGALURU’S WATER
STRESS
• Around 2.2million no piped supply (25%)
• Areas outside former BMP area at most stress
• Self provision by buying water or groundwater extraction
Photo Credit: John Loo/Flickr
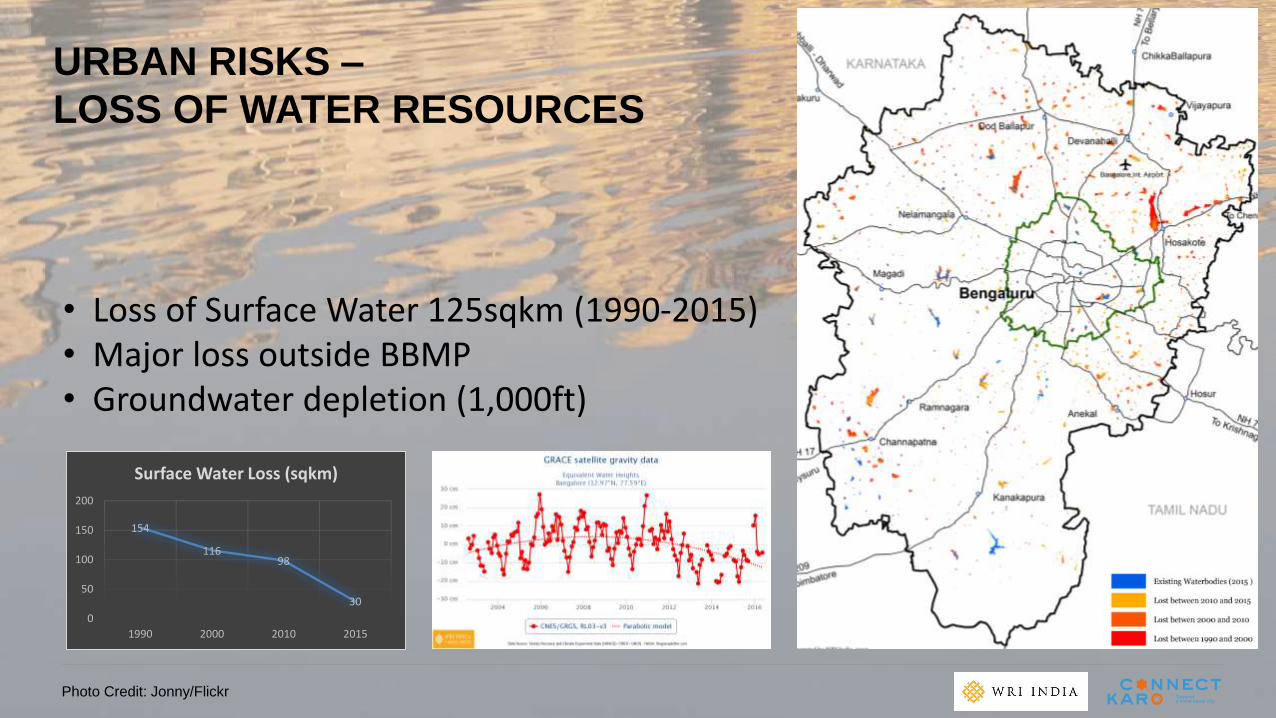
URBAN RISKS –
LOSS OF WATER RESOURCES
154
11698
30
0
50
100
150
200
1990 2000 2010 2015
Surface Water Loss (sqkm)
• Loss of Surface Water 125sqkm (1990-2015)• Major loss outside BBMP• Groundwater depletion (1,000ft)
Photo Credit: Jonny/Flickr

URBAN RISKS –
LAND SUBSIDANCE
• City is Sinking• City Subsidance – 2.34cm to
3.17cm (average 2.73cm)• Excessive groundwater
pumping• Reduced recharge potential
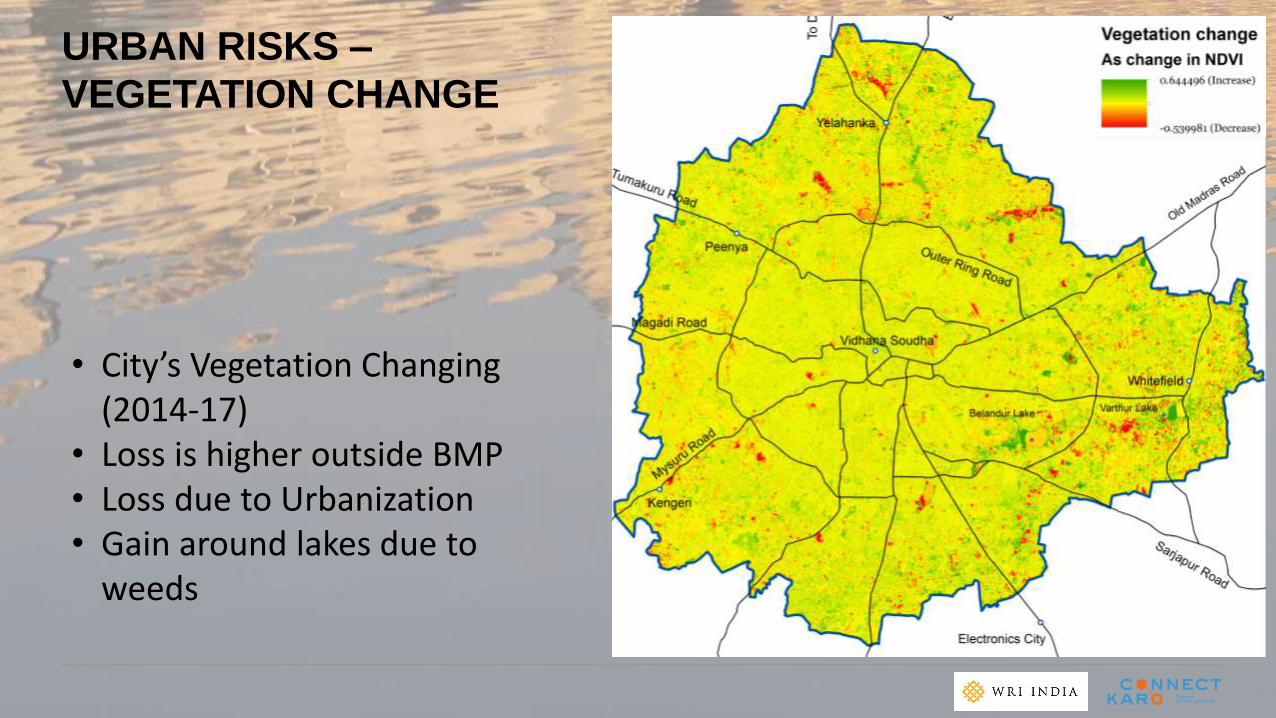
URBAN RISKS –
VEGETATION CHANGE
• City’s Vegetation Changing (2014-17)
• Loss is higher outside BMP• Loss due to Urbanization• Gain around lakes due to
weeds

URBAN RISKS – HEAT ISLAND &
LST JANUARY 2017
Shanti Nagar Bus Depot Langford
Town
Kalasipalayam
JayanagarLal Bagh
2,601,513
11,072
1,524,389
0
500,000
1,000,000
1,500,000
2,000,000
2,500,000
3,000,000
Above Mean Extremetemperature(above 34)
1 DegreeIncrease
People Exposed to Heat in Jan 2017(C)

• LST 2014-17• Change in temp +8C and -10C• North, west and south-west
getting hotter• South and south-east cooler.
URBAN RISKS – LST CHANGE
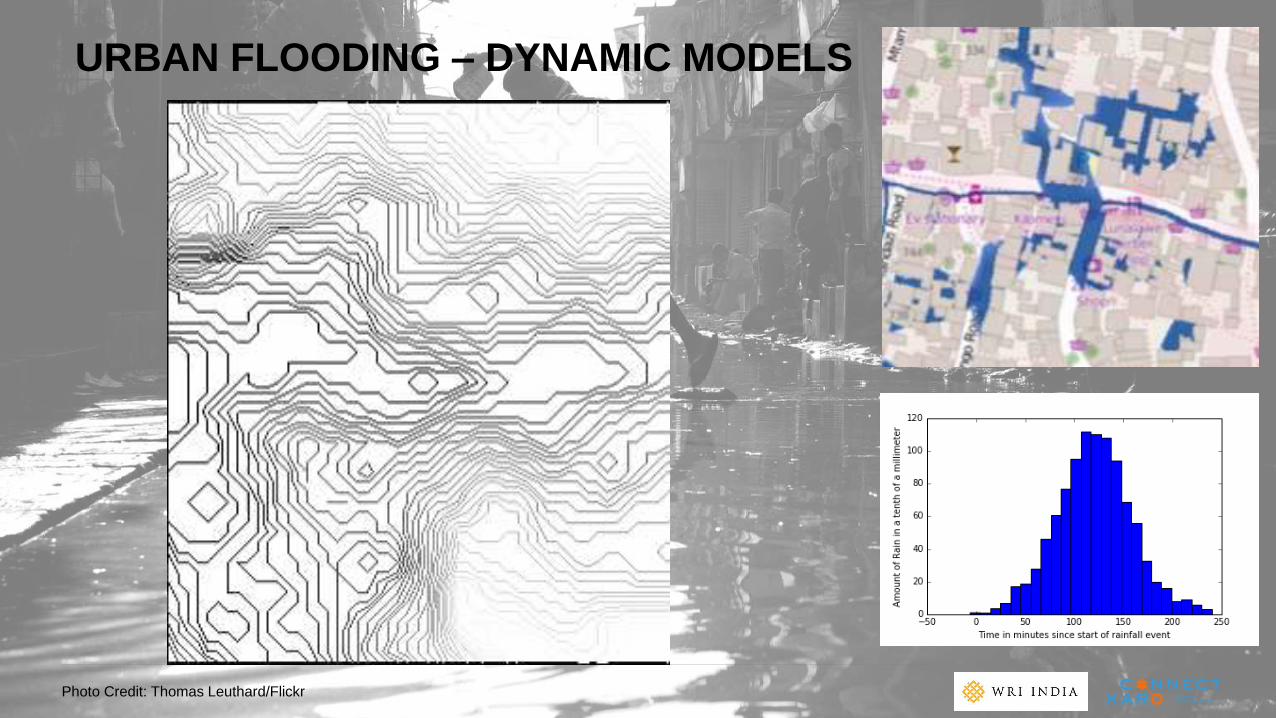
URBAN FLOODING – DYNAMIC MODELS
Photo Credit: Thomas Leuthard/Flickr

URBAN FLOODING –
ANALYSIS
138,249
29,994
Urban Flooding
Population in Begur and Arakere wards
Population facing stagnation / flooding in Begur andarakere wards
• Begur & Arakere Wards• 10cm for 5 hours• 1,40,000 population• 30,000 Impacted

CITY SANITATION WATCH
– OPEN DEFECATION
2011 Data – 1,33,913 OD
Photo Credit: McKay Savage/Flickr

CITY SANITATION WATCH –
PIPED SEWER NETWORK
2million no access to piped sewer

CITY SOLUTIONS
Photo Credit: Diego Torres Silverstre/Flickr

BENGALURU’S
WATER BALANCE
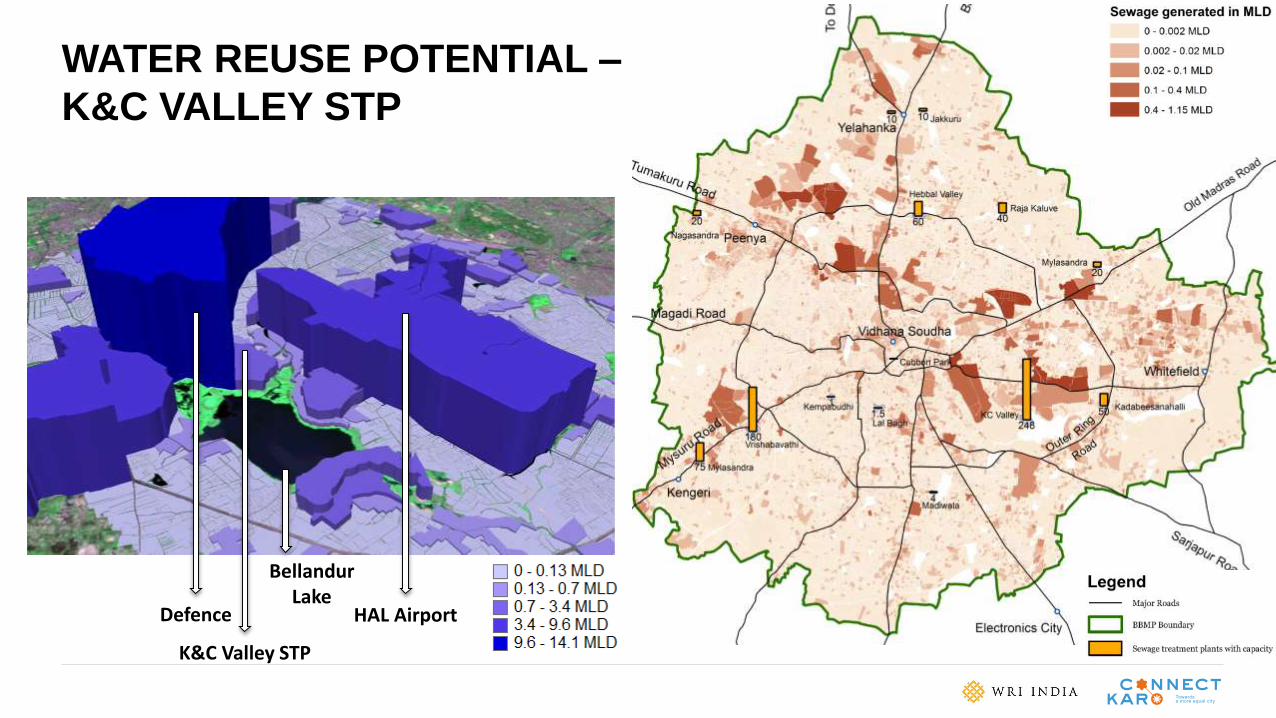
WATER REUSE POTENTIAL –
K&C VALLEY STP
Defence
K&C Valley STP
HAL Airport
Bellandur Lake

CHIKKABALLAPURA MASTER PLAN 2031

LAKE REVIVAL – ‘KERE’ PROJECT
Design Credit: Rajeev Malagi
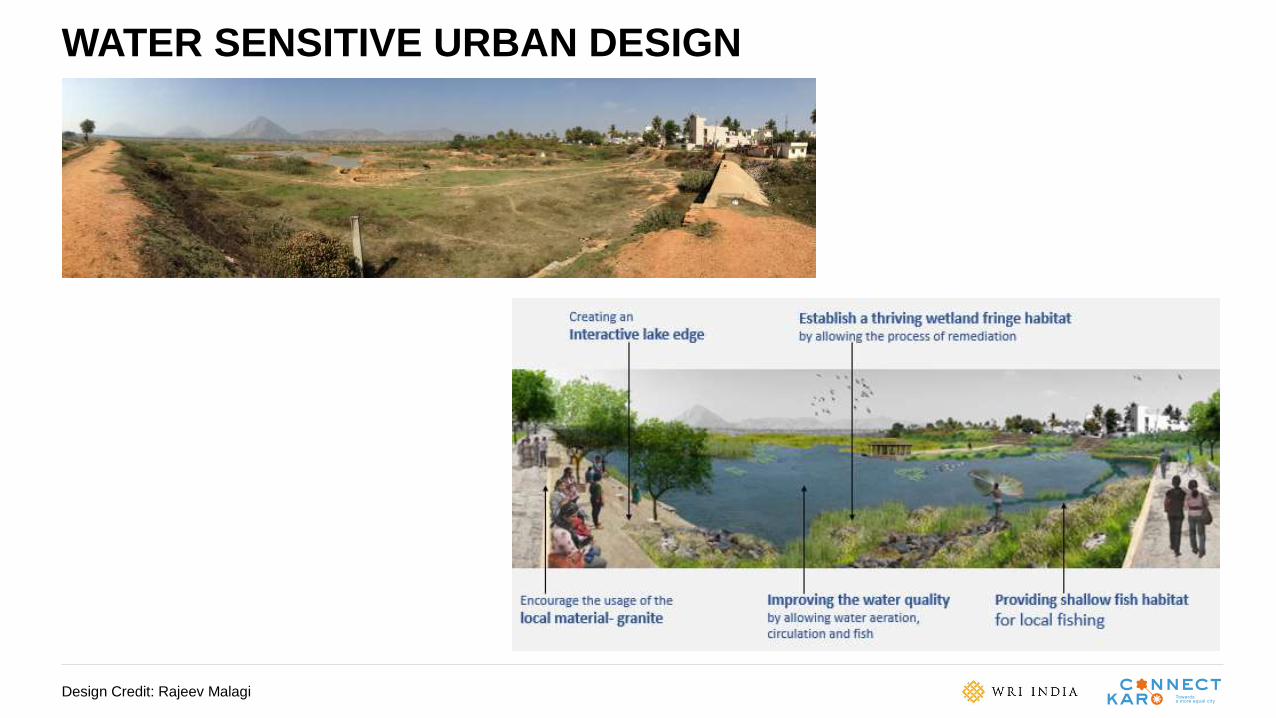
WATER SENSITIVE URBAN DESIGN
Design Credit: Rajeev Malagi
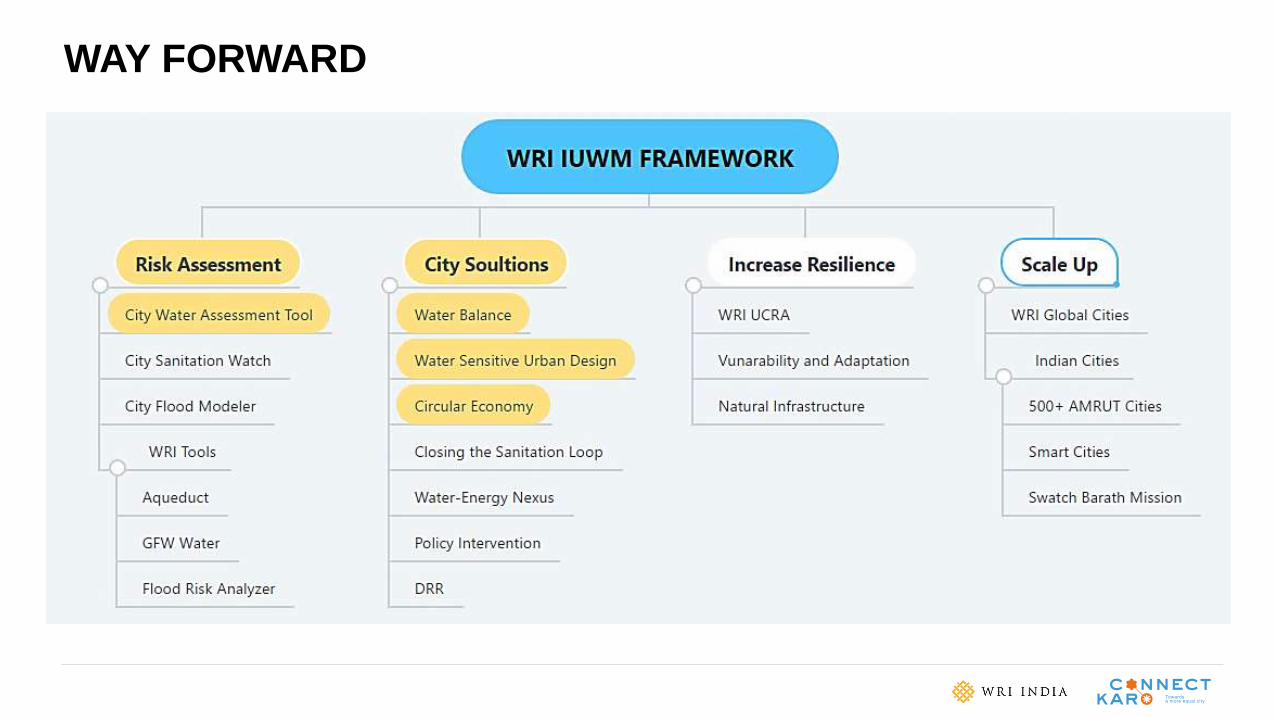
WAY FORWARD
THANK YOU FROM WRI INDIA
Vittal Boggaram Sahana Goswami
Raj Bhagat
V Surya Prakash
Radha Chanchani