civil service salary - michigan service commission role ... table b state employee wage increases...
TRANSCRIPT

Civil Service Salary and
Benefit Comparisons
Mitchell E. Bean, Director November 2008

HOUSE FISCAL AGENCY GOVERNING COMMITTEE
Representatives George Cushingberry, Jr. Daniel Acciavatti
Andy Dillon Craig DeRoche
Steve Tobocman Dave Hildenbrand
MICHIGAN HOUSE OF REPRESENTATIVES APPROPRIATIONS COMMITTEE
Representatives George Cushingberry, Jr., Chair Alma Wheeler Smith
Matthew Gillard, Vice Chair Dudley Spade
Joan Bauer Aldo Vagnozzi
Doug Bennett Daniel Acciavatti, Minority Vice Chair
Pam Byrnes David Agema
Marsha Cheeks Fran Amos
John Espinoza Darwin Booher
Lee Gonzales Jack Brandenburg
Richard Hammel Bruce Caswell
Morris Hood III Bill Caul
Shanelle Jackson Goeff Hansen
Michael Lahti Chuck Moss
Richard LeBlanc Mike Nofs
Gary McDowell John Proos
Michael Sak Rick Shaffer

This report was prepared at the request of the Speaker of the
House, State Representative Andy Dillon, for a comparison of wages
and benefits for State of Michigan classified employees and wages and
benefits for similar positions in the private sector.
Viola Bay Wild, Fiscal Analyst; Jim Stansell, Economist; and Mitch Bean,
Director of the House Fiscal Agency, are the authors of this report.
Report production was coordinated by Jeanne Dee, Administrative
Assistant.


TABLE OF CONTENTS
Executive Summary ..................................................................................................1
Classified Civil Service ..............................................................................................3
Collective Bargaining Process..................................................................................5 Civil Service Commission Role.....................................................................................................6 Office of the State Employer (OSE) Role...................................................................................7 Legislative Role .................................................................................................................................8
Michigan Employee Compensation Survey............................................................9 Survey Job Classifications...............................................................................................................9 Survey Participants ........................................................................................................................10 Salary Data.......................................................................................................................................11 Benefits Data...................................................................................................................................11
Collective Bargaining Agreements........................................................................13 Recent State Employee Concessions ........................................................................................14 Healthcare Changes in Collective Bargaining Agreement ....................................................14 Civil Service Retirement Plan Changes.....................................................................................16 Retiree Healthcare Benefit Changes .........................................................................................17 Retirement Systems ......................................................................................................................17
State Employee Workforce Characteristics ........................................................21 Michigan Employee Compensation Survey...............................................................................22 American Community Survey .....................................................................................................24
Appendices...............................................................................................................29 Appendix A: January 2007 Michigan Employee Compensation Survey Participants..........................30
Appendix B: 2000 Educational Attainment for Michigan and Counties ...............................................32
Appendix C: June 2008: Michigan State Classified Civil Service Job Descriptions/ Educational Requirements ......................................................................................................34
Appendix D: 2007 Michigan Employee Compensation Survey Data.....................................................41


FIGURES AND TABLES
Figure 1 Michigan Classified Civil Service Employees ...........................................................3
Figure 2 State Classified Employment by Bargaining Unit....................................................5
Figure 3 2006 Educational Attainment by Sector of Year-Round Michigan Workers ..........................................................................25
Table A State of Michigan FY 2006-07 Classified Employees by Department................4
Table B State Employee Wage Increases..............................................................................13
Table C Michigan State Police Wage Increases....................................................................14
Table D Health Insurance Plans of Employers in Michigan................................................15
Table E Comparison of State Employee Retirement Systems .........................................18
Table F 2007 Michigan Employee Compensation Survey: Retirement Plans of Private Employers in Michigan ............................................19
Table G 2008 National Study of Employers: Retirement Plans of Private Employers..................................................................20
Table H Summary: June 2008 Michigan State Classified Civil Service Education Requirements............................................................................................22
Table I Overview of 2007 Employee Compensation Survey Data ................................23
Table J 2007 Total Employment of Full-Time, Year-Round Michigan Workers by Sector and Educational Attainment...................................................................24
Table K 2007 Average Earnings and Average Age for Full-Time, Year-Round Michigan Workers by Sector and Educational Attainment................................26
Table L 2007 Labor Force Participation by Educational Attainment for Michigan Residents Aged 16 to 72 ...................................................................27


CIVIL SERVICE SALARY AND BENEFIT COMPARISONS House Fiscal Agency: November 2008 Page 1
EXECUTIVE SUMMARY At the request of the Speaker of the House, State Representative Andy Dillon, the House Fiscal Agency (HFA) compared wages and benefits of State of Michigan classified employees to wages and benefits for similar positions in the private sector. Data sets used for wage and benefit comparisons included:
• 2007 Michigan Employee Compensation Survey conducted by O. William Rye & Co., LLC, Okemos, Michigan.
• 2007 American Community Survey, U.S. Census Bureau.
• Demographic Profile DP-2 Profiles of Selected Social Characteristics, DP2007-DP2014, Michigan Center for Geographic Information.
• Data provided by Michigan Civil Service Commission.
• 2006 Comparative Study of Major Public Employee Retirement Systems.
• 2008 National Study of Employers, financed by the Alfred P. Sloan Foundation and conducted by the Families at Work Institute.
The Michigan Employee Compensation Survey data set is smaller and more focused; approximately 10 percent of state jobs that represent approximately one-third of the state labor force are included in the survey. Although the American Community Survey data set is much more broad-based than that of the Michigan Employee Compensation Survey, the results of the surveys were remarkably similar. The data in this report demonstrate the following:
• Michigan’s workforce tends to be more highly educated than the private-sector workforce: 54.8 percent of the state workforce has earned a college degree compared to 26.9 percent of the private-sector workforce. (Table J)
• Michigan state employees who do not hold a college degree tend to be compensated somewhat better than private-sector employees. Over three-quarters of the state jobs listed in the Michigan Employee Compensation Survey as requiring only a high school diploma received higher compensation, on average, than similar jobs in the public or private sector. (Table I)
• Michigan state employees with college degrees tend to earn appreciably less than their counterparts in the private sector. (Table K)
• The difference in earnings between Michigan state employees and private-sector employees grows significantly as the level of educational attainment rises. Wage and

CIVIL SERVICE SALARY AND BENEFIT COMPARISONS
Page 2 House Fiscal Agency: November 2008
salary increases under the current contract—0.0 percent in the first year (FY 2008-09) and 1.0 percent in the second year (FY 2009-10)—are likely to exacerbate these differences. (Table B)
• Unlike the majority of private sector jobs, the majority of state classified civil service positions require a college degree. (Table H)
74.3 percent of all state civil service positions require some college courses. 51.4 percent of all state civil service positions require a college degree.
• Benefit information from the Michigan Employee Compensation Survey demonstrates that before employee concessions made in the 2007 contracts, state employees paid a lower portion of their health insurance premiums, on average, than workers in the private/public sector. Under the new contract, effective in FY 2008-09, the state employee portion of health care premiums will be higher than that paid, on average, by private/public sector employees in 2007. (Table D)
• Of private firms reporting retirement benefit data (Table F):
56.3 percent offered defined contribution retirement plans only. 29.4 percent offered defined benefit retirement plans only. 9.5 percent offered both defined contribution and defined benefit plans. 4.8 percent offered no retirement plan.
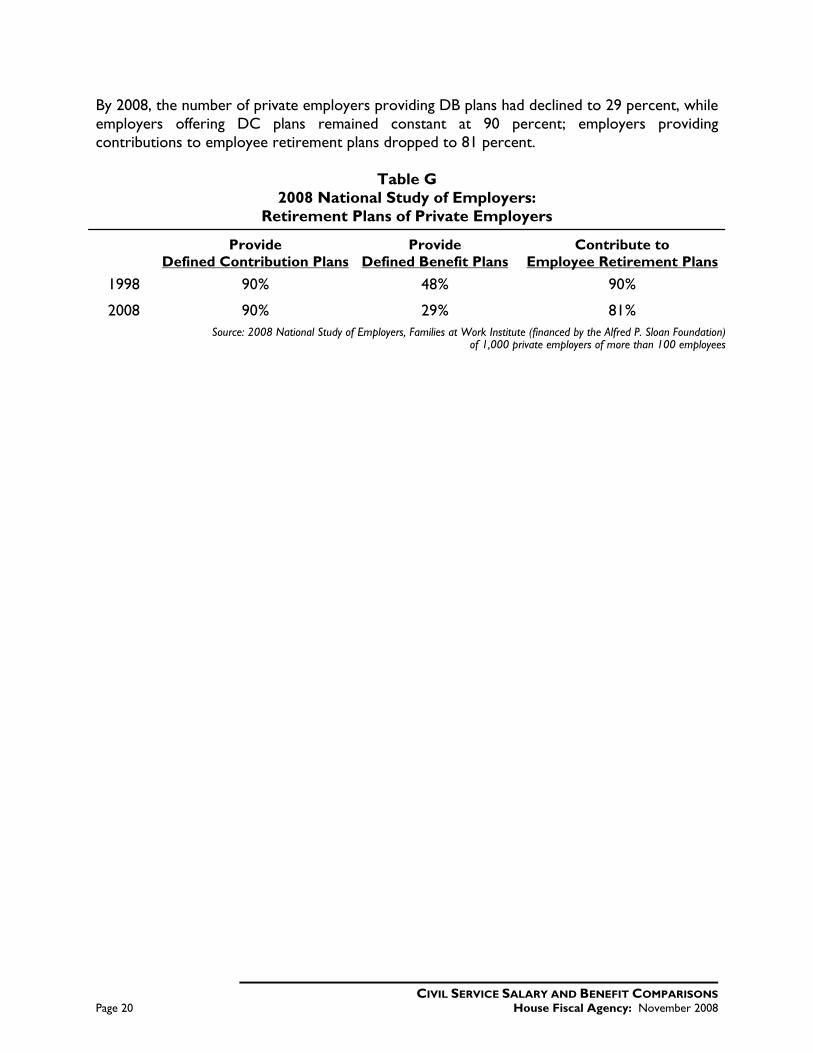
• The 2008 National Study of Employers found the following trends in retirement benefits offered by private employers (Table G):
In 1998, 48 percent of employers provided defined benefit plans, while 90 percent provided defined contribution plans.
By 2008, the number of employers providing defined benefit plans had declined to 29 percent, while employers offering defined contribution plans remained constant at 90 percent.
• In comparison with retirement plans of all other states, the defined benefit retirement plan for state employees in Michigan uses the second lowest multiplier—1.5 percent—for calculating retirement compensation. (Page 19)
• Michigan is one of only two states that has a mandatory defined contribution retirement system for its new employees. Data from the Office of Retirement Services indicate that since Michigan moved to a mandatory defined contribution retirement plan for all employees hired after March 1997, the state has saved an estimated $143 million.
This publication begins with a description of Michigan’s classified civil service system, and describes the process for negotiating compensation increases and setting compensation levels and benefits for Michigan Civil Service Employees. Descriptions of the Michigan Employee Compensation Survey and the American Community Survey are provided, along with descriptions of recent employee contract changes and concessions and tables compiled from survey data sets. Additional data are provided in the appendices; complete data sets are available upon request.

CIVIL SERVICE SALARY AND BENEFIT COMPARISONS House Fiscal Agency: November 2008 Page 3
CLASSIFIED CIVIL SERVICE The Constitution of the State of Michigan of 1963, Article XI, Section 5, establishes the classified state civil service and authorizes the Civil Service Commission (CSC) to classify all state positions and establish state employee compensation rates. The Governor appoints the Director of the Office of the State Employer (State Employer), who negotiates with six different unions—representing over 70 percent of Michigan’s 52,000 classified state employees—to reach collective bargaining agreements every three years. Michigan has experienced a downward trend in the number of employees over the past two decades, dropping from almost 67,000 employees in 1990 to just over 52,000 in 2007. In the six years since 2001, the state employee workforce has been reduced by 10,000 employees—a 16.2 percent reduction. Figure 1 provides a seven-year history of the number of classified civil service employees. Table A notes the number of classified civil service employees, by department, for FY 2006-07.
Figure 1
Source: Michigan Civil Service Commission
Michigan Classified Civil Service Employees
62,057
60,148
54,866 54,876
52,614 52,279 52,013
FY 01 FY 02 FY 03 FY 04 FY 05 FY 06 FY 07
Average
Nu
mb
er o
f E
mp
loye
es f
or
Fis
cal Y
ear

CIVIL SERVICE SALARY AND BENEFIT COMPARISONS
Page 4 House Fiscal Agency: November 2008
Table A
State of Michigan FY 2006-07 Classified Employees by Department*
Department Classified
Employees % of State
Classified Employees
Agriculture 537.0 1.0% Attorney General 498.0 0.9% Auditor General 144.0 0.3% Civil Rights 119.0 0.2% Civil Service Commission 201.0 0.4% Community Health 4,126.5 7.8% Corrections 16,103.0 30.5% Education 361.0 0.7% Environmental Quality 1,426.5 2.7% Executive Office 46.0 0.1% History, Arts, and Libraries 243.5 0.5% Human Services 9,605.5 18.2% Information Technology 1,734.0 3.3% Labor and Economic Growth 3,980.5 7.5% Management and Budget 996.0 1.9% Military and Veterans Affairs 937.0 1.8% Natural Resources 2,633.5 5.0% State 1,730.0 3.3% State Police 2,622.0 5.0% Strategic Fund 228.0 0.4% Transportation 3,056.0 5.8% Treasury 1,554.5 2.9%
Total 52,882.5 100.0%
*Actual number of employees as of September 22, 2007
Source: Michigan Civil Service Commission

CIVIL SERVICE SALARY AND BENEFIT COMPARISONS House Fiscal Agency: November 2008 Page 5
COLLECTIVE BARGAINING PROCESS
The Civil Service Commission (CSC) authorization allows classified employees in eligible positions to organize, elect an exclusive representative, and negotiate with the State Employer over proper subjects of bargaining. At this time, there are ten employee bargaining units within six unions that are eligible to collectively bargain on behalf of state employees—70 percent of approximately 52,000 State of Michigan employees are currently represented by state employee unions.
Figure 2
Source: Michigan Civil Service Commission
State employees in business and administrative services and managerial, supervisory, and confidential positions are considered nonexclusively represented employees (NEREs). Employees in supervisory, managerial, and confidential positions are not eligible for exclusive union representation and the collective bargaining process. Business and administrative service
State Classified Employment by Bargaining UnitFiscal Year 2006-07
State Police Enlisted
2.9% Safety and Regulatory
2.7%Technical
2.1%
Human Services Support
1.5%
Scientific and Engineering
4.2%
Institutional4.5%
Labor and Trades6.4%
Administrative Support13.6%
Security16.5%
Human Services17.3%
Non-Exclusively Represented
28.2%

CIVIL SERVICE SALARY AND BENEFIT COMPARISONS
Page 6 House Fiscal Agency: November 2008
employees are eligible for union representation, but this group of employees has not elected an exclusive representative. Compensation packages for NEREs are determined by the Civil Service Employee Relations Board, which provides a coordinated NERE compensation plan to the CSC each year. Final approval of these coordinated compensation plans rests with the CSC, and—as with collective bargaining agreements—the CSC has the authority to modify or reject any or all language in the plans. The terms of the coordinated compensation plans are usually similar to those of the collective bargaining agreements. Prior to beginning the collective bargaining process, the Office of the State Employer (OSE) contracts with a local private firm to conduct a survey with primary emphasis on collection and analysis of salary and employee benefit data. Although surveys have been used for many years to gather salary and employee benefit information, a more detailed survey has been conducted every three years since 1995. Surveys are conducted at the discretion of the OSE. Civil Service Commission Role Article XI, Section 5, of the State Constitution establishes the classified state civil service, specifies the authority and responsibilities of the CSC, and stipulates that the classified state civil service shall consist of all positions within state government—with certain exceptions. Positions excluded are:
• Elected officials. • Heads of principal departments. • Executive officers and members of boards and commissions. • Employees of courts of record. • The Legislature. • State universities. • State armed forces. • Up to eight positions in the Governor’s office. • Up to six positions in each state department.
The CSC, comprised of four non-salaried members (no more than two of the same political party) who are appointed by the Governor for eight-year terms, is responsible for the following:
• Classifying all positions in the classified service according to duties and responsibilities.
• Establishing rates of compensation for all classes of positions.
• Determining qualifications of all candidates for positions exclusively on the basis of merit, efficiency, and fitness.
• Making rules and regulations covering personnel transactions.
• Regulating conditions of employment in the classified service—except for Michigan State Police Troopers and Sergeants. (Michigan voters approved a constitutional amendment

CIVIL SERVICE SALARY AND BENEFIT COMPARISONS House Fiscal Agency: November 2008 Page 7
in 1978 which grants collective bargaining rights concerning compensation, working conditions, and retirement to State Police Troopers and Sergeants; promotions are determined by competitive examination and performance.)
Prior to 1978, the CSC did not recognize that it had the authority to grant collective bargaining rights to classified state employees; in 1978, however, an Attorney General opinion declared that the CSC did have the constitutional authority to do so. Because of this clarification, the CSC began collective bargaining for classified state civil service employees in 1980 for fiscal years (FYs) 1981–82. The collective bargaining process is established in Chapter 6 of the CSC Rules; CSC plenary authority over the collective bargaining process is stated in CSC Rule 6.3.1:
The ability of eligible employees to elect an exclusive representative and engage in collective bargaining is a privilege granted by the civil service commission under its exclusive constitutional authority. However, the commission cannot delegate its constitutional responsibilities to the collective bargaining parties and the privilege to engage in collective bargaining remains subject to the commission’s sovereign authority and the rules of the commission.
The CSC exercises final approval of collective bargaining agreements and, under CSC Rule 6-3.1(c), has the authority to modify collective bargaining agreements at any time during the term of the agreements without notification or approval of the associated parties. Office of the State Employer (OSE) Role Executive Order 1979-5 established the OSE in the Department of Management and Budget. The State Employer—appointed by the Governor—is an unclassified employee who, under CSC Rule 6-9.1, negotiates on behalf of the employer (the Governor) during collective bargaining. The Rule states:
The state employer, acting in consultation with principal departments, the attorney general, and the secretary of state, shall direct primary negotiations on behalf of the employer. The state employer shall coordinate all negotiations and administration of collective bargaining agreements with the appointing authorities. Upon request of the attorney general or the secretary of state, the state employer shall reserve all noneconomic issues in the office of attorney general or department of state for secondary negotiations. The parties may coordinate bargaining between the state and employer and more than one exclusive representative.
Once collective bargaining agreements are reached, the CSC reviews and either approves or rejects the agreements. Any approved increases in compensation rates become effective only at the start of a fiscal year, and require prior notice to the Governor. Negotiated compensation increases are included in the Executive Budget Recommendation for each year of a collective bargaining agreement.

CIVIL SERVICE SALARY AND BENEFIT COMPARISONS
Page 8 House Fiscal Agency: November 2008
Legislative Role The State Constitution provides that within 60 days of receiving the Executive Budget Recommendation (which includes employee compensation rate increases), the Legislature—by a two-thirds vote of the members elected and serving in each house—may reject or reduce increases in rates of compensation authorized by the CSC; but the Legislature may not reduce compensation rates to a figure lower than that which was in effect at the time of transmission of CSC-authorized increases. Any reduction ordered by the Legislature must apply uniformly across all classes of employees affected by the compensation increases, and may not adjust pay differentials already established by the CSC. Under the 60-day constitutional provision, the current three-year collective bargaining agreements authorizing increases of 1.0 percent in FY 2009-10 and 3.0 percent in 2010-11 could be reduced or rejected by the Legislature. To do so, the Legislature would have to act—each year—within 60 days of receiving the Executive Recommendation for that year. As of this date, according to the OSE, the Legislature has never reduced or rejected wage increases approved by the CSC. The Legislature also has the authority—by a majority vote of the members elected and serving in each house—to waive the notice period and allow compensation rate increases to be effective at a time other than at the start of a fiscal year.

CIVIL SERVICE SALARY AND BENEFIT COMPARISONS House Fiscal Agency: November 2008 Page 9
MICHIGAN EMPLOYEE COMPENSATION SURVEY
In the past, the Civil Service Commission has used various compensation surveys to determine compensation rates and periodic general pay raises. Since 1995, the State of Michigan has contracted with O. William Rye & Co., LLC, located in Okemos, Michigan, to conduct a compensation survey every three years prior to collective bargaining negotiations. All employers in Michigan of 1,000 employees or more receive, by mail, a cover letter and response card to be used to indicate whether the organization would be willing to participate in the compensation survey. There is no obligation for any organization to participate, and survey participants may request that the organization not be identified (in the 2007 survey, ten employers requested not to be identified). To ensure obtaining an adequate amount of information, the survey is also conducted with neighboring state governments. Survey Job Classifications Because Michigan has a wide diversity of state jobs, selecting the jobs to be included in the survey is a critical step in obtaining an accurate information sample—and complete job classification descriptions are critical when determining appropriate job matches between state positions and positions in the private sector. The job classification descriptions are based on position specifications such as the nature, level, and scope of job responsibilities, and may also include requirements for education, experience, and licensure or registration. A sample job classification for Corrections Officer is as follows:
Job Title: Corrections Officer Participates in the custody, security, and treatment of prisoners in correctional facilities including major prisons, camps, and corrections centers. This is an experienced level. The employee observes prisoners’ activities, regularly counts prisoners under their jurisdiction, conducts searches of prisoners, visitors, employees, mail, packages, and cell blocks and other structures for prohibited items, attempts to obtain prisoners’ compliance with rules and regulations, writes disciplinary actions, and observes and responds to critical incidents. Transport prisoners via vehicles ranging from automobiles to buses. Controls entry and exit from the facility, oversees prisoners on work assignment, and prepares records of shift activities. Requires high school graduation or equivalent and 15 semester college credit hours in specified correctional administration and human services areas. There is no experience requirement for entry to this series but this level requires 1 year at a lower level within the series.

CIVIL SERVICE SALARY AND BENEFIT COMPARISONS
Page 10 House Fiscal Agency: November 2008
In January 2007, 58 job classifications—including new state positions—were used to survey other states. The 58 job classifications comprise approximately 10 percent of all positions in the state and almost 18,000 (over one-third) of all state employees. Michigan employers were surveyed for only 49 job classifications, due to a lack of positions in the private sector that were similar to state positions. For example, the job of corrections officer could not be matched to any classification in the private sector, so it was matched with corrections officer jobs in other states. Survey Participants A number of different surveys may be developed based on a variety of employers in different types of industries.
• Public employers (counties, cities, road commissions, community mental health agencies, medical care facilities, libraries and other public entities).
• Education employers (state colleges and universities, community colleges and private colleges).
• Manufacturing employers (all employers with a manufacturing Standard Industrial Classification (SIC) code).
• Health employers (hospitals and other private health-related institutions).
• Finance employers (banking, insurance, credit unions, retail and wholesale trade).
• Other non-manufacturing employers. All employers participating in the survey receive the same pay practices and employee benefits questionnaire, but the salary questionnaire includes only those jobs found in an employer’s specific industry type. For example, the education industry receives only education job classifications that may match those in the state government. Employment data are collected from 200 to 250 employers in both the private and public sectors. Private sector employers are generally those with at least 1,000 employees, but private employers with 500 to 1,000 employees may be included in order to achieve the 200 to 250 employers by area and industry. Employers such as hotel and restaurant chains are generally excluded from the survey due to a lack of matches with state jobs. Public school districts are also excluded because of differences in work schedules and the difficulty in comparing salary and benefit data. In the January 2007 survey, information was obtained from 197 employers in Michigan employing a total of 354,170 full-time employees. The following is a sample of companies that may participate in a State of Michigan Compensation Survey:
• Blue Cross Blue Shield of Michigan. • Consumers Energy.

CIVIL SERVICE SALARY AND BENEFIT COMPARISONS House Fiscal Agency: November 2008 Page 11
• Dow Chemical. • General Motors Corporation. • Interlochen Center for the Arts. • Johnson Controls. • Michigan Supreme Court. • Plante & Moran. • Saginaw Chippewa Indian Tribe. • Sparrow Health System. • United Parcel Service. • Various cities, counties, and universities.
States in the Great Lakes region—including Ohio, Indiana, Illinois, Wisconsin, and Minnesota—are included in the survey process. Appendix A provides a complete list of January 2007 Michigan Employee Compensation Survey participants. Salary Data After surveys have been completed and returned by participating employers in Michigan’s public and private sectors and by states in the Great Lakes region, salary data are compiled for each job classification. Survey results are then used to prepare a report which provides a summary of compensation (including average minimum and maximum ranges reported by all organizations with a job classification match) and weighted averages of compensation with regard to the total employees in all organizations, the average compensation, and median minimums, maximums, and averages for all organizations. Each of the job classifications are compared with employers within the same geographic area and with other employers in similar industries. To help determine the geographic location of the government workforce, Michigan was divided into the following three areas for the January 2007 survey:
• Area 1: Wayne, Oakland and Macomb counties.
• Area 2: The remainder of southern Michigan bordered on the north by a line that includes Bay and Midland counties and goes west to Oceana County.
• Area 3: The remainder of the Lower Peninsula and all of the Upper Peninsula. Benefits Data The survey also includes comparison data for employee benefits, including information concerning health, dental and vision insurance, retirement, vacation, paid leave, and other benefits. In addition to health insurance data in the compensation survey, the OSE also uses various sources for additional research to determine the most comprehensive and competitive package. The Survey Report on Employee Benefits, compiled by Watson Wyatt Data Services, is one of the sources used for additional healthcare research; this report identifies average co-pay and deductible provisions of healthcare plans offered by other employers. Other sources include Blue Cross Blue Shield of Michigan and the health plans of state governments in nearby states.

CIVIL SERVICE SALARY AND BENEFIT COMPARISONS
Page 12 House Fiscal Agency: November 2008
The Michigan Employee Compensation Survey information provides a benchmark for the collective bargaining process, and allows the OSE to compare Michigan’s compensation rates and employee benefits to those of other Michigan employers and employees of nearby states.

CIVIL SERVICE SALARY AND BENEFIT COMPARISONS House Fiscal Agency: November 2008 Page 13
COLLECTIVE BARGAINING AGREEMENTS
The last three collective bargaining agreements (2001, 2004, and 2007) resulted in annual state employee wage increases which ranged from 0.0 percent to 4.0 percent. Table B shows wage increases for collective bargaining and nonexclusively represented employees (NEREs) for the last three contracts.
Table B State Employee Wage Increases*
Fiscal Year Increase Effective Date
2002-03 2% 10/1/02 2003-04 3% 10/1/03 2004-05 4% 10/1/04
1% 10/1/05 2005-06
1% 4/9/06 2% 10/1/06
2006-07 2% 4/8/07 2% 10/1/07
2007-08 2% 4/6/08
2008-09 0% 10/1/08 2009-10 1% 10/1/09 2010-11 3% 10/1/10
*Does not include Michigan State Police Troopers and Sergeants
Because NERE compensation plans are determined on an annual basis through a Coordinated Compensation Panel, compensation plans for these employees have not been formalized for FYs 2009-10 and 2010-11 at this time. Over the last six years, union-represented employees of the Michigan State Police have received an annual wage increase between 1.0 percent and 4.0 percent. The collective bargaining negotiations for State Police employees are not normally conducted at the same time as the other five employee unions; the current State Police contract expires on December 31, 2008. Table C shows Michigan State Police wage increases for the last six years.

CIVIL SERVICE SALARY AND BENEFIT COMPARISONS
Page 14 House Fiscal Agency: November 2008
Table C Michigan State Police Wage Increases*
Fiscal Year Increase Effective Date
2002-03 2% 10/1/02 2003-04 3% 10/1/03 2004-05 4% 10/1/04
1% 10/1/05 2005-06
1% 4/9/06 2% 10/1/06
2006-07 1% 4/8/07 2% 10/1/07
2007-08 1% 4/6/08
*Includes only State Troopers and Sergeants
Recent State Employee Concessions In FY 2003-04 and FY 2004-05, the state experienced budgetary shortfalls due to declining revenue. In response to the revenue shortfall, the State Employer negotiated concessions from the state employee unions to help offset the added expense of wage and benefit increases. The first concession involved two banked leave time (BLT) programs. In the FY 2003-04 BLT program, employees worked a regular 40-hour workweek, but were paid for only 38 hours (a 5 percent reduction) each week. In the FY 2004-05 BLT program, employees worked a regular 40-hour workweek, but were paid for only 38.4 hours (a 4 percent reduction) each week. In both BLT programs, the unpaid hours were banked to be used as leave time which did not count toward an employee’s regular annual leave cap. These BLT programs saved the state an estimated $243.8 million over the two-year (FYs 2003-04 and 2004-05) period; other more unit-specific concessions—such as compensatory time meetings and suspension of training or education—saved the state an additional $19.4 million over the same period. In FY 2003-04, a second concession instituted employee furlough days, whereby full-time employees were required to take 40 hours of unpaid leave; this program saved the state approximately $31.7 million in FY 2003-04. During both FY 2003-04 and FY 2004-05, state employees were able to retain the negotiated cost-of-living wage increases—3 percent and 4 percent, respectively. Healthcare Changes in Collective Bargaining Agreement In December 2007, the Civil Service Commission approved collective bargaining agreements for FY 2008-09 through FY 2010-11 for the state employees that are exclusively represented by five of the state employee unions—not including the State Troopers. In these agreements, negotiated employee concessions for healthcare made significant changes—beginning in October 2008—which increased state employee co-pays and premiums; when healthcare

CIVIL SERVICE SALARY AND BENEFIT COMPARISONS House Fiscal Agency: November 2008 Page 15
changes are negotiated for current employees, the CSC will approve similar changes for state retirees. It is estimated that these changes will save the state approximately $300.0 million over the three-year contract period. Significant state employee concessions for FY 2008-09 through FY 2010-11 include:
• Increased employee contribution (from 5 percent to 10 percent for the state health plan) for health insurance premiums.
• Deductibles under the state PPO plan for in-network services double; out-of-network deductibles increase.
• Co-pays for prescription drugs and office visits increase.
• New $50 charge for emergency room visit (if patient is not admitted to the hospital) implemented.
The Michigan Employee Compensation Survey compares state employee benefit information with benefit information from other employers in Michigan. Before the employee concessions in the contract agreements for FY 2008-09 through FY 2010-11, the survey showed that, on average, state employees paid a lower portion of their health insurance premiums than workers in the private/public sector. Under the contracts for FY 2008-09 through FY 2010-11, however, the state employee-paid portion of healthcare premiums is more than double that of the previous year. Table D shows the average monthly healthcare premiums paid by employees of the businesses surveyed, and shows the average state employee-paid monthly premiums for both 2007 and under the new contract provisions beginning October 5, 2008.
Table D Health Insurance Plans of Employers in Michigan*
Employee Monthly Cost for Family Coverage
June 2007 Private Employers Average $138.15 Median $125.36 Public Employers Average $62.01 Median $52.74 All Employers Average $112.77 Median $90.92
FY 2006-07 State of Michigan $67.80
FY 2008-09 State of Michigan $142.37 *Data from responses of 128 private employers and 66 public employers.
Source: 2007 Michigan Employee Compensation Survey, O. William Rye & Co., LLC, and Michigan Civil Service Commission

CIVIL SERVICE SALARY AND BENEFIT COMPARISONS
Page 16 House Fiscal Agency: November 2008
As shown in Table D, employees of public/private employers surveyed in Michigan paid an average of $112.77 per month for health insurance premiums in 2007, while Michigan’s state employees paid an average of $67.80 per month for health insurance premiums. As a result of the new contract agreements, however, Michigan’s state employees will pay an average of $142.37 per month beginning October 2008—more than double the amount paid in the previous year and an amount higher than that paid (on average) by private/public-sector employees surveyed in 2007. The Michigan Employee Compensation Survey provides information concerning the average health insurance premium paid by employees in both the private/public sector and state government; this makes it possible to compare average health insurance premiums for public/private-sector employees and state government employees. It is important, however, to emphasize that the Michigan Employee Compensation Survey does not include information on specific benefits and features provided in the average public/private-sector health insurance plan; thus, survey information cannot determine whether benefits and features are comparable for state employee health plans and public/private-sector employee health plans. Civil Service Retirement Plan Changes Until 1997, Michigan provided state employees with a defined benefit (DB) retirement plan that guaranteed a lifetime pension for employees vested in the system by having ten years of state service. Under the DB plan, the amount of an employee’s benefit is determined by a formula which multiplies years of service times average final compensation times a multiplier of 1.5 percent. The DB plan is funded with annual contributions from the state that ensure enough assets exist to pay current retirees’ benefits. In 1996, the state instituted a major change to the state employees’ retirement system. Public Act 487 of 1996 amended the State Employees Retirement Act to establish a new defined contribution (DC) plan, and specified that all new employees hired on or after March 31, 1997, would be enrolled in the DC plan. Employees hired before 1997 had until April 30, 1998, to either enroll in the new DC program or remain in the existing DB program. Under the DC plan, the state contributes a fixed amount of funding for each employee annually—four percent of an employee’s salary plus an additional matching contribution of up to 3 percent if the employee contributes an equal portion. Under the DC plan, the state’s contribution remains stable—up to 7 percent of the payroll; under the DB plan, the state’s annual contribution varies—depending on factors such as investment projections and the number and ages of retirees and current employees. Michigan is now approaching the point where almost half of its employees will be covered under the DC plan rather than the DB plan: in FY 2006-07, Michigan had approximately 30,000 state employees who were vested members in the DB plan and 23,700 employees in the DC plan.

CIVIL SERVICE SALARY AND BENEFIT COMPARISONS House Fiscal Agency: November 2008 Page 17
According to the Michigan Office of Retirement Services, the change from a DB plan to a DC plan resulted in an estimated $143.0 million in cost avoidance savings for the state from FY 1997-98 through FY 2005-06 ($13.0 million average each year, with $19.0 million in FYs 2004-05 and 2005-06).1 It is anticipated that the cost avoidance savings will be magnified in future years as more new employees enter the DC plan. Michigan was one of the first states to move to a mandatory DC plan for new employees, and it is currently one of only two states that offer only a DC plan for its new employees (the other state is Alaska, which recently converted to a DC plan). In the past, both West Virginia and Nebraska had DC plans—West Virginia has since switched back to a DB plan, and Nebraska has converted to a cash balance plan (which is a hybrid DB plan). Nebraska’s system blends elements of both DB and DC plans, whereby employees are guaranteed an annual 5 percent annual return on personal employee accounts. According to the National Conference of State Legislatures (NCSL), there are six other states that offer DC plans as an option along with a DB plan,2 and five states that provide hybrid plans that have features of both DC and DB plans.3 Currently, the vast majority of public retirement systems in the United States offer DB retirement plans only; Michigan and Alaska are the only states with mandatory DC plans. Retiree Healthcare Benefit Changes With the change to a DC retirement system in 1997, the retirement healthcare benefits for new state employees in Michigan also changed. While retired employees in the DB plan would continue to have their health insurance premiums paid at the same amount as for current DB employees (currently 90 percent), employees enrolled in the DC plan would receive retirement health insurance premium payments that were based on years of service (employees would earn 3 percent of their premiums for each year of service when they retire, up to 90 percent of the premium). In addition, DC plan employees would not be eligible to receive the retirement healthcare benefit unless they had ten years of service with the state. Retirement Systems When comparing Michigan’s DB retirement systems with retirement systems of other states, it is important to consider all of the following:
• The mandatory employer and/or employee contribution to the system (percentage of employee salary).
• The length of vesting period.
• The formula multiplier used to determine the amount of an employee’s benefit. 1 During this time period, an unfunded actuarially accrued liability (UAAL) has emerged for the DB plan. This UAAL developed
due to factors such as the stock market downturn and the 2002 early retirement program. While establishment of the DC plan did not cause the UAAL, the DC plan does require the state to pay larger annual required contributions (ARC)—which are amortization payments to the unfunded liability of the DB system. These increased payments partially offset the annual cost avoidance savings realized.
2 Colorado, Florida, Montana, North Dakota, Ohio, and South Carolina. 3 Florida, Indiana, Ohio, Oregon, and Washington.

CIVIL SERVICE SALARY AND BENEFIT COMPARISONS
Page 18 House Fiscal Agency: November 2008
Every two years since 1982, the Wisconsin Legislative Council has conducted a comparative study on the major state and local public employee retirement systems in the United States. The 2006 report (issued in 2007) contains data concerning the major state employee retirement systems for all fifty states.4 Using data from this study, Table E compares the retirement systems of all other states to Michigan’s DB plan.5
Table E Comparison of State Employee Retirement Systems
Plan Feature Average Amount Maximum Minimum Michigan
Employer Contribution* 8.69% 16.77% 2.18% 13.6%
Employee Contribution 5.00% 10.50% 0.0% 0.0%
Vesting Period 5.7 years 10 years 0 years 10 years
*Contribution percentage could not be determined for Connecticut, Illinois, or New Jersey
Source: Wisconsin Legislative Council, 2006 As shown in Table E, Michigan’s DB plan requires a state employer contribution of 13.6 percent6—which is higher than the national average of 8.69 percent (the maximum state employer contribution is 16.77 percent). Michigan’s employer contribution rate is higher, in part, because in 2002 the state offered an early retirement program as a budgetary savings measure and over 8,000 employees participated—which added an $800.0 million unfunded actuarially accrued liability (UAAL) requiring a higher state contribution to the system. The national average of employee contribution is 5.0 percent (the maximum is 10.5 percent); Michigan is one of five states that require no employee contribution to the retirement system. The vesting period establishes the length of service required before an employee can be considered eligible to receive benefits at retirement. The national average period for vesting is 5.7 years, two states offer immediate eligibility with no vesting period required, and Michigan requires ten years of service—the maximum amount—for an employee to be vested. Another important factor in calculating an employee’s retirement benefits is the formula multiplier. In a state’s DB plan, an employee’s benefits are generally calculated by multiplying the employee’s years of service by a formula multiplier, and then multiplying that product by the employee’s final average salary. All but seven of the state employee DB retirement plans are coordinated with Social Security (i.e., a state employee earns Social Security benefits while employed by the state). Plans that are not coordinated with Social Security tend to have a higher formula multiplier to help compensate for the lack of Social Security benefits.
4 “2006 Comparative Study of Major Public Employee Retirement Systems,” William Ford, Senior Staff Attorney, 2007,
Wisconsin Legislative Council. 5 The Wisconsin Legislative Council notes that employer contributions often vary between categories of employees; Council
data are derived from actuarial reports and information from plan administrators. 6 According to Michigan’s Office of Retirement Services, the Michigan rate was scheduled to be 18.1 percent before a
revaluation of retirement system assets reduced state costs.

CIVIL SERVICE SALARY AND BENEFIT COMPARISONS House Fiscal Agency: November 2008 Page 19
As shown below, the size of the formula multiplier has a great impact on the amount of funds a retiree receives.
Formula Multiplier Annual Retirement Benefit
Calculated Using $50,000 Final Average Salary X 30 Years of Service
1.5% $22,500 2.0% $30,000 2.5% $37,500 3.0% $45,000
Of the states that coordinate with Social Security, the highest multiplier—3.0 percent—is used by New Mexico. Only two states use a multiplier of 1.5 percent or lower; all other states use higher multipliers. Michigan’s employees’ retirement benefits are calculated by using a formula multiplier of 1.5 percent. This means that in comparison with the retirement plans of all other states—including those that coordinate with Social Security—the retirement plan for state employees in Michigan uses the second lowest multiplier for calculating retirement compensation. The tables below provide information on the types of retirement plans offered by private employers in Michigan (Table F) and nationwide (Table G). Table F provides information from the 2007 Michigan Employee Compensation Survey. Survey results show that of the 126 private employers in Michigan responding to questions regarding retirement plans, 56.3 percent offered DC plans, 29.4 percent offered DB plans, 9.5 percent offered both DB and DC plans, and 4.8 percent offered no retirement plan.
Table F 2007 Michigan Employee Compensation Survey:
Retirement Plans of Private Employers in Michigan
Defined Contribution (DC) Defined Benefit (DB) DC and DB None
56.3% 29.4% 9.5% 4.8% Source: 2007 Michigan Employee Compensation Survey responses from 126 private employers on retirement plans
The 2008 National Study of Employers, financed by the Alfred P. Sloan Foundation and conducted by the Families at Work Institute, surveyed 1,000 employers with more than 100 employees. Study results (in Table G) show that in 1998, 48 percent of private employers provided DB plans while 90 percent provided DC plans—with some firms offering both DB and DC plans. Of those firms providing retirement plans, 91 percent contributed to the employee retirement plans.
CIVIL SERVICE SALARY AND BENEFIT COMPARISONS
Page 20 House Fiscal Agency: November 2008
By 2008, the number of private employers providing DB plans had declined to 29 percent, while employers offering DC plans remained constant at 90 percent; employers providing contributions to employee retirement plans dropped to 81 percent.
Table G 2008 National Study of Employers:
Retirement Plans of Private Employers
Provide
Defined Contribution Plans Provide
Defined Benefit Plans Contribute to
Employee Retirement Plans
1998 90% 48% 90%
2008 90% 29% 81% Source: 2008 National Study of Employers, Families at Work Institute (financed by the Alfred P. Sloan Foundation)
of 1,000 private employers of more than 100 employees

CIVIL SERVICE SALARY AND BENEFIT COMPARISONS House Fiscal Agency: November 2008 Page 21
STATE EMPLOYEE WORKFORCE CHARACTERISTICS
Michigan state employee workforce statistics for FY 2006-07 include the following:
• Michigan employed approximately 52,000 classified civil service employees.
• The average state employee age was 46 years.
• The average length of a state employee’s service was 14.4 years.
• Of the total state workforce in FY 2006-07:
Over 16,000 state employees (30.5 percent) worked for the Department of Corrections.
Almost 10,000 state employees (18.2 percent) worked for the Department of Human Services.
When compared to the Michigan workforce in general (public and private), state employees have a higher level of education attainment. According to the Civil Service Commission, 51.4 percent of all state positions require a college degree, and 74.3 percent of all state positions require completion of some college coursework. In comparison, only 28.7 percent of the total Michigan workforce over the age of 25 has earned a college degree. Appendix B provides detail (from 2000) on the educational attainment for Michigan and counties. Table H summarizes detail on educational requirements for Michigan classified civil service positions. For a complete list of Michigan’s state classified civil service job descriptions and educational requirements (at June 2008), see Appendix C. As shown in Table H, only 1.3 percent of state classified civil service positions have no requirement for a specific type or amount of education. In contrast, 39.5 percent of all state classified civil service positions require either a Bachelor’s, Master’s, or Doctoral degree.

CIVIL SERVICE SALARY AND BENEFIT COMPARISONS
Page 22 House Fiscal Agency: November 2008
Table H Summary: June 2008 Michigan State Classified Civil Service Education Requirements
Education Requirement # of
Employees% of Total
Employees No specific type or amount required 690 1.3% High School completion 12,524 24.3% High School completion/MSPTA 1,687 3.3% 15 semester credits 9,766 19.0% Certificate 352 0.7% Associate’s Degree 6,127 11.9% Bachelor’s Degree 17,651 34.3% Master’s Degree 2,000 3.9% Doctoral Degree 680 1.3%
Total 51,477 100.0%
# of
Employees% of Total
EmployeesState classified positions requiring some college coursework 11,805 22.9%State classified positions requiring a college degree 26,458 51.4%
State classified positions requiring education beyond high school completion 38,263 74.3%
State classified positions with no specific education requirement, or requiring high school completion only 13,214 25.7%
Total state classified employees 51,477 100.0%
Source: Michigan Civil Service Commission 2008
Michigan Employee Compensation Survey Commissioned by the OSE, the Michigan Employee Compensation Survey compares the salaries and benefits of state employees with those of employees in the private and public sectors. Because the survey cannot include all positions within state government, the survey report emphasizes that the jobs included in the survey are carefully selected based on the following criteria:
• Jobs with large numbers of incumbents.
• Jobs that are likely to have good “matches” in other organizations.
• Jobs that represent a cross-section of an occupational group.
• Jobs that represent a cross-section of pay levels.
• Jobs that present particular pay issues for the state.

CIVIL SERVICE SALARY AND BENEFIT COMPARISONS House Fiscal Agency: November 2008 Page 23
The 2007 survey included 58 state job classifications representing the positions held by almost one-third of all State of Michigan employees. The 197 Michigan employers (with an aggregate total of over 350,000 employees) who participated in the 2007 survey reported that the specific positions noted in the survey were filled by approximately 61,000 employees. Educational requirements for each position are included as part of the survey’s job description information. The 2007 survey results showed that, on average, many state employees in positions requiring college degrees or college coursework received a lower rate of compensation than that of employees holding similar jobs in the private/public sector. A more detailed analysis of the results of the Employee Compensation Survey demonstrates that overall—when positions included in the survey are grouped by state-required education level—the weighted average wage of an employee in the private/public sector was higher than the average wage of a state employee in a similar position (this was the case for all education levels except for the high school completion level). Of the positions included in the survey, the average wage for employees in positions with a state-required level of high school completion was higher for state workers than was the weighted average wage of private/public sector employees in comparable positions. Table I provides a comparison overview of salary information—grouped by the state-required education level for a position—for each of the 49 job positions included in the private/public portion of the 2007 Michigan Employee Compensation Survey. In Table I, the average wage of state positions by required education level is compared to the average wage per weighted employee of similar positions in the private/public sector. It is important to note that although the education level required for each state position in the survey is known, the education level for the private/public sector positions was not included in the survey. Appendix D provides additional detail from the survey.
Table I Overview of 2007 Employee Compensation Survey Data
State Private/Public Sector
# of Employees in Average
Average Wage/Hour
per Employee
# of Employees in
Weighted Average
Average Wage/Hour per
Weighted Employee
No High School completion 339 $17.36 14,959 $20.87 High School completion 3,835 $19.17 15,132 $18.11 Some college; License 6,455 $22.32 6,670 $25.53 Associate’s Degree 727 $25.49 17,838 $27.68 Bachelor’s Degree 3,085 $26.14 4,460 $28.63 Master’s, Professional’s, or Doctoral Degree 744 $28.38 1,747 $42.59
All Employees 15,185 $22.64 60,806 $23.88 Note: Comparison is between similar positions; exact education level of employees in private/public sector positions is unknown.
Source: HFA calculations based on Michigan Employee Compensation Survey, O. William Rye & Co., LLC, June 2007

CIVIL SERVICE SALARY AND BENEFIT COMPARISONS
Page 24 House Fiscal Agency: November 2008
For positions included in the 2007 Michigan Employee Compensation Survey, Table I shows that:
• State workers in all positions—other than those positions for which the state requires only a high school diploma—receive an average wage that is lower than the weighted average wage of private/public sector employees.
• State workers in positions that require some college training or a college degree receive, on average, less compensation than private/public sector employees in similar positions that were included in the survey.
These findings from the 2007 Michigan Employee Compensation Survey are similar to the findings from the American Community Survey presented below. American Community Survey Tables J and K present data based on the 2007 American Community Survey on employment and average wages for Michigan workers. The American Community Survey is an ongoing effort by the U.S. Census Bureau that collects economic, social, demographic, and housing information from over three million households each year. The survey has been conducted annually since 1996, and draws responses from all 3,141 counties in the United States. Michigan-specific data from the 2007 survey are derived from more than 100,000 respondents.
Table J 2007 Total Employment of Full-Time, Year-Round Michigan Workers
by Sector and Educational Attainment
Private Sector
Employment
% of Total Private Sector
Employment State
Employment
% of Total State
Employment
State % of Total
Employment
No High School completion 118,868 6.0% 789 0.8% 0.7% High School completion 621,616 31.3% 14,110 14.1% 2.2% Some college; no degree 521,919 26.3% 20,530 20.5% 3.8% Associate’s Degree 191,193 9.6% 9,804 9.8% 4.9% Bachelor’s Degree 376,740 19.0% 27,538 27.5% 6.8% Master’s Degree 114,328 5.8% 16,477 16.5% 12.6% Professional’s Degree 27,160 1.4% 3,599 3.6% 11.7% Doctoral Degree 13,843 0.7% 7,202 7.2% 34.2% Total 1,985,667 100.0% 100,049 100.0% 4.8% Note: Private-sector employment does not include self-employed individuals or those working for nonprofit entities; state employment is comprised primarily of civil service, legislative, judiciary, and university workers.
Source: HFA calculations based on the 2007 American Community Survey, U.S. Census Bureau Table J and Figure 3 compare total employment in the private sector to state employment for full-time, year-round workers in Michigan by educational attainment; state employment figures

CIVIL SERVICE SALARY AND BENEFIT COMPARISONS House Fiscal Agency: November 2008 Page 25
include civil service, legislative, judiciary, and university employees. It is important to impose the full-time (at least 36 hours per week) and year-round (at least 48 weeks per year) constraints to make valid comparisons. Although the vast majority of state workers already fall into these categories, only about 70 percent of private-sector workers meet these criteria. As demonstrated in Table J, state workers have higher levels of education on average than workers in the private sector. For example:
Employees With No High School Diploma Employees With a Bachelor’s Degree
0.8% of state employees 27.5% of state employees
6.0% of private-sector employees 19.0% of private sector employees
A similar comparison can be made with the last column in Table J. Overall, the state employs about 4.8 percent of full-time, year-round workers, but only 0.7 percent of workers without high school degrees are employed by the state. In contrast, the state employs 6.8 percent of workers who have a Bachelor’s degree, 12.6 percent of workers who have a Master’s degree, and 34.2 percent of workers who have a Doctoral degree. All of these are well above the 4.8 percent overall average.
Figure 3
Source: HFA calculations based on the 2007 American Community Survey, U.S. Census Bureau
2007 Educational Attainment by Sector of Year-Round Michigan Workers Private Sector Employment
NoHigh School
Diploma6.0%
Professional'sDegree
1.4%
Master's Degree5.8%
DoctoralDegree
0.7%
Some college;no degree
26.3%
High SchoolDiploma
31.3%
Associate'sDegree
9.6%
Bachelor'sDegree19.0%
No High School Diploma High School Diploma Some college; no degree Associate's Degree
Bachelor's Degree Master's Degree Professional's Degree Doctoral Degree
State Employment
NoHigh School
Diploma0.8%
Doctoral Degree
7.2%Professional'sDegree
3.6%
High School Diploma
14.1%
Master's Degree16.5%
Bachelor's Degree27.5% Associate's
Degree9.8%
Some college; no degree
20.5%

CIVIL SERVICE SALARY AND BENEFIT COMPARISONS
Page 26 House Fiscal Agency: November 2008
Table K uses the same data to compare average earnings and average age by educational attainment.
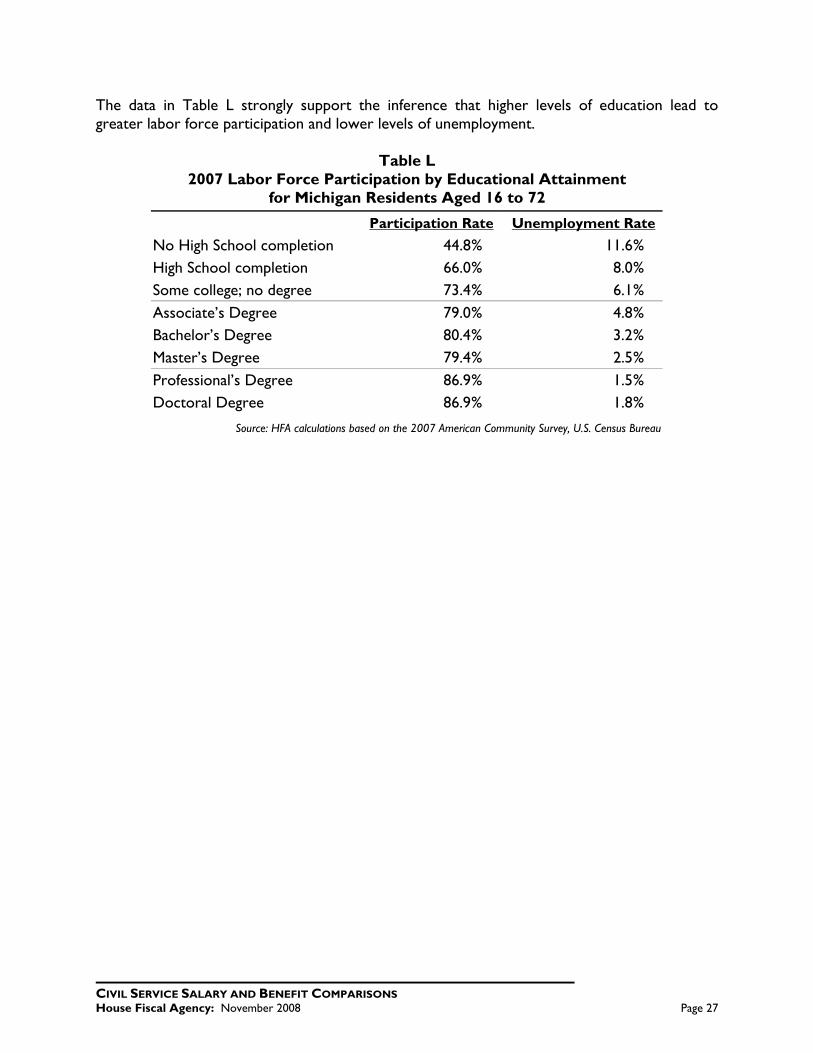
Table K shows that for all educational levels, state employees—on average—receive lower earnings than their private-sector counterparts. While earnings are relatively comparable for workers with high school degrees and for those who have attended college, the divergence in wages rises with the level of education. State employees with Master’s degrees make an average of 37.8 percent less than private-sector employees; state employees with Bachelor’s degrees make an average of 27.6 percent less than private-sector employees. While it is true that overall average earnings are higher for state workers, this is because the state employs a much higher percentage of more highly-educated workers. Calculations made using data from the American Community Survey indicate that roughly 64.6 percent of state workers have at least a Bachelor’s degree, whereas only about 36.4 percent of private-sector workers have attained that educational level. Table L presents labor force participation and unemployment rates by educational attainment for Michigan residents between the ages of 16 and 72. Labor force participation is defined as those individuals who are either currently employed or actively seeking employment; as such, it provides a broader sample than the first two tables which were limited to those workers with full-time, year-round employment.
Table K 2007 Average Earnings and Average Age for
Full-Time, Year-Round Michigan Workers by Sector and Educational Attainment
Average Earnings Average Age Private Sector State Private Sector State
No High School completion $32,315 $17,729 42 44 High School completion $38,150 $35,568 42 46 Some college; no degree $44,179 $43,933 41 45 Associate’s Degree $48,008 $45,539 41 44 Bachelor’s Degree $71,378 $51,646 41 42 Master’s Degree $97,937 $60,926 44 45 Professional’s Degree $125,259 $100,684 43 46 Doctoral Degree $119,666 $91,028 46 50
Statewide Average $51,841 $53,057 41 45 Note: Private-sector employment does not include self-employed individuals or those working for nonprofit entities; state employment is comprised primarily of civil service, legislative, and university workers.
Source: HFA calculations based on the 2007 American Community Survey, U.S. Census Bureau
CIVIL SERVICE SALARY AND BENEFIT COMPARISONS House Fiscal Agency: November 2008 Page 27
The data in Table L strongly support the inference that higher levels of education lead to greater labor force participation and lower levels of unemployment.
Table L 2007 Labor Force Participation by Educational Attainment
for Michigan Residents Aged 16 to 72
Participation Rate Unemployment Rate
No High School completion 44.8% 11.6% High School completion 66.0% 8.0% Some college; no degree 73.4% 6.1% Associate’s Degree 79.0% 4.8% Bachelor’s Degree 80.4% 3.2% Master’s Degree 79.4% 2.5% Professional’s Degree 86.9% 1.5% Doctoral Degree 86.9% 1.8%
Source: HFA calculations based on the 2007 American Community Survey, U.S. Census Bureau


APPENDICES

CIVIL SERVICE SALARY AND BENEFIT COMPARISONS
Page 30 House Fiscal Agency: November 2008
Appendix A January 2007 Michigan Employee Compensation Survey Participants
Abbott Industries Detroit Medical Center Accident Fund Insurance Company Detroit Public Library Alcoa Howmet Dickinson County Healthcare Alpena Regional Medical Center Dickinson Wright, PLCC AZ Automotive Group Dow Chemical Barry-Eaton District Health Department DTE Energy Company Battle Creek Health Authority Eastern Michigan University Bay-Arenac Behavioral Health Eaton County Bell Hospital Emergent Bio Solutions Berrien Mental Health System Ferris State University Besser Company Flagstar Bank Blue Cross Blue Shield of Michigan Foote Hospital Board of Water & Light Ford Motor Credit Botsford Health Care Four Winns Boats Branch-Hillsdale-St. Joseph Community Health Freedom Village Calvin College General Dynamics Carson City Hospital General Motors Corporation CATA Genesee County Community Mental Health Central Michigan Distribution Health Department Genesee County Road Commission Central Michigan University Genesys Health Enterprises Chippewa County Grand Rapids Community College Citizens Bank Grand Traverse County Road Commission Citizens Financial Group Grand Valley State University City of Adrian Great Lakes Works City of Ann Arbor Hastings Mutual Insurance Company City of Detroit Haworth, Inc. City of East Lansing Health Alliance Plan City of Grand Rapids HealthPlus of Michigan City of Jackson Henry Ford Health System City of Kalamazoo Holland Hospital City of Lansing Honigman Miller Schwartz City of Livonia Hope College City of Marquette Huntington National Bank City of Midland Hurley Medical Center City of Muskegon Huron Clinton Metropolitan Authority City of Sault Ste. Marie Ingham County City of Traverse City Ingham County Road Commission Compuware Corporation Interlochen Center for the Arts Consumers Energy Ionia County Cook Nuclear Plant Irwin Seating Company Copper Country Mental Health Jabil Covenant Healthcare Jackson Community College Delta College Jackson County Delta Dental Plan of Michigan Jackson County Medical Care Delta Township Jackson National Life Dematic Corporation Johnson Controls

CIVIL SERVICE SALARY AND BENEFIT COMPARISONS House Fiscal Agency: November 2008 Page 31
Appendix A January 2007 Michigan Employee Compensation Survey Participants
Kalamazoo County NSK Corporation Kalamazoo County Road Commission NuUnion Credit Union Kent County Oakland County Community Mental Health Key Safety Systems Oakland County Road Commission Knoll, Inc. Ogihara Ambrica Lake Superior State University O-N Minerals Lansing Community College Ottawa County Road Commission Lansing State Journal Parker Hannifin Corp LaSalle Bank Corporation Pathways Lenawee Community Mental Health Perrigo Human Resources Lenawee County Plante & Moran Lifeways Port Huron Hospital Macatawa Bank Portage Health Macomb County Presbyterian Villages of Michigan Macomb County Community Mental Health Priority Health Macomb County Road Commission Quicken Loans MacSteel R.L. Polk & Co. Magna Donnelly Corporation Saginaw Chippewa Indian Tribe Manistee County Saginaw County Marquette County Saginaw County Community Mental Health Marquette County Health Department Saginaw Valley State University Marquette County Road Commission Severstal NA Marquette General Health System Shape Corporation Masonic Pathways Shiawassee County Medical Care Facility McLaren Regional Medical Center Soaring Eagle Casino & Resort Meridian Township Sparrow Health System Merillet Industries, LLC Spartan Corporation Michigan Farm Bureau Spectrum Health Michigan Health & Hospital Association St. Joseph Mercy Health System Michigan Millers Mutual Insurance Company St. Joseph Mercy Oakland Michigan State University St. Mary’s of Michigan Michigan Supreme Court Starr Commonwealth Michigan Technological University Steelcase Inc. Mid-Michigan Health Thomas M. Cooley Law School Mott Community College Tower Automotive Mount Clemens Regional Medical Center United Parcel Service Muskegon County University of Michigan Health System Muskegon County CMH Van Buren CMHA Muskegon County Road Commission Washtenaw Community College National City Washtenaw County Road Commission NE Michigan Comm Service Agency Wayne County Network 180 Wayne County Airport Authority Nissan Technical Center Wayne State University North Country Community Mental Health Western Michigan University Northern Lakes Community Mental Health Wexford District Health Department #10 Northern Michigan University Whirlpool Northwest Michigan Community Health Wolverine World Wide
Source: 2007 Michigan Employee Compensation Survey

CIVIL SERVICE SALARY AND BENEFIT COMPARISONS
Page 32 House Fiscal Agency: November 2008
Appendix B 2000 Educational Attainment for Michigan and Counties
County
Population 25 Years
And Over Less Than 9th Grade
9th to 12th Grade;
No Diploma
High School Graduate (Including
Equivalency)
Some College;
No Degree Associate’s
Degree Bachelor’s
Degree
Graduate or Professional
Degree Alcona 8,958 504 1,310 3,750 1,880 537 589 388 Alger 7,169 428 895 3,035 1,463 296 760 292 Allegan 66,925 4,015 7,820 26,190 14,067 4,238 7,231 3,364 Alpena 21,399 1,577 2,040 7,631 5,380 1,954 1,688 1,129 Antrim 16,025 536 1,931 5,946 3,558 952 2,015 1,087 Arenac 11,868 900 1,856 5,011 2,295 728 651 427 Baraga 6,097 397 786 2,376 1,463 408 524 143 Barry 37,132 1,105 3,810 14,577 9,489 2,679 3,651 1,821 Bay 74,146 4,522 8,505 27,407 17,264 5,933 7,224 3,291 Benzie 11,283 393 1,258 4,107 2,506 761 1,497 761 Berrien 106,690 6,065 13,219 33,998 24,234 8,244 13,031 7,899 Branch 30,300 2,039 4,027 12,364 6,762 1,887 2,127 1,094 Calhoun 90,137 3,935 11,177 32,083 21,514 6,989 9,424 5,015 Cass 34,286 1,738 4,969 12,906 7,979 2,556 2,735 1,403 Charlevoix 17,528 675 1,776 6,158 3,988 1,452 2,271 1,208 Cheboygan 18,562 1,041 2,325 7,533 3,982 1,092 1,612 977 Chippewa 25,683 1,298 3,227 9,232 6,650 1,430 2,611 1,235 Clare 21,333 1,368 3,726 8,617 4,558 1,181 1,161 722 Clinton 41,864 1,577 2,945 13,753 10,962 3,740 5,793 3,094 Crawford 9,871 436 1,457 3,715 2,342 643 845 433 Delta 26,362 1,271 2,388 9,444 6,178 2,578 3,070 1,433 Dickinson 18,831 573 1,541 8,365 3,886 1,328 2,091 1,047 Eaton 67,044 1,800 5,217 20,361 19,301 5,805 9,908 4,652 Emmet 21,258 667 1,679 6,658 4,880 1,812 3,506 2,056 Genesee 277,660 10,917 35,893 92,661 71,023 22,107 29,272 15,787 Gladwin 18,308 1,236 2,742 7,609 4,008 1,032 1,160 521 Gogebic 12,311 549 1,238 4,735 2,691 1,151 1,330 617 Grand Traverse 51,801 1,487 4,059 14,443 13,297 4,995 8,504 5,016 Gratiot 27,322 1,447 3,069 11,508 6,183 1,587 2,401 1,127 Hillsdale 29,595 1,601 3,389 12,719 6,687 1,640 2,215 1,344 Houghton 21,233 1,102 2,167 7,639 3,809 1,636 2,984 1,896 Huron 24,954 2,422 3,000 10,712 4,493 1,609 1,844 874 Ingham 162,909 5,360 13,981 38,118 39,290 12,470 30,151 23,539 Ionia 37,835 1,756 4,525 15,277 9,748 2,454 2,882 1,193 Iosco 19,764 1,053 3,306 7,951 4,324 903 1,429 798 Iron 9,670 406 1,064 4,412 1,864 598 881 445 Isabella 31,677 1,579 2,835 10,731 7,096 1,859 4,337 3,240 Jackson 104,880 3,665 12,880 34,477 28,385 8,421 11,704 5,348 Kalamazoo 144,995 4,307 11,967 37,615 35,150 10,767 27,586 17,603 Kalkaska 11,073 540 1,679 4,942 2,281 553 724 354 Kent 351,875 16,001 38,147 99,420 80,393 27,076 61,488 29,350 Keweenaw 1,634 93 173 608 348 100 199 113 Lake 7,964 556 1,655 3,166 1,615 347 443 182

CIVIL SERVICE SALARY AND BENEFIT COMPARISONS House Fiscal Agency: November 2008 Page 33
Appendix B 2000 Educational Attainment for Michigan and Counties
County
Population 25 Years
And Over Less Than 9th Grade
9th to 12th Grade;
No Diploma
High School Graduate (Including
Equivalency)
Some College;
No Degree Associate’s
Degree Bachelor’s
Degree
Graduate or Professional
Degree Lapeer 56,454 2,189 6,555 21,751 14,560 4,217 4,950 2,232 Leelanau 14,785 404 966 3,912 3,532 1,335 2,913 1,723 Lenawee 64,311 3,173 7,502 24,734 14,531 3,909 6,979 3,483 Livingston 101,381 1,701 7,030 28,702 26,479 8,929 19,206 9,334 Luce 4,927 374 832 1,844 1,020 277 414 166 Mackinac 8,588 478 1,025 3,546 1,801 457 863 418 Macomb 535,836 25,755 65,616 175,565 132,819 41,936 63,603 30,542 Manistee 17,298 867 2,342 6,827 3,618 1,195 1,642 807 Marquette 41,934 1,559 3,274 14,815 9,674 2,669 6,685 3,258 Mason 19,449 1,009 2,362 6,898 4,569 1,525 1,941 1,145 Mecosta 23,314 1,207 2,566 8,521 4,828 1,740 2,716 1,736 Menominee 17,342 1,014 1,852 8,041 3,511 1,021 1,336 567 Midland 53,497 1,745 4,156 16,030 11,403 4,510 9,426 6,227 Missaukee 9,466 563 1,458 4,036 1,904 540 646 319 Monroe 94,281 4,466 11,452 35,166 22,743 6,931 9,060 4,463 Montcalm 39,560 2,115 5,334 15,801 9,336 2,696 2,863 1,415 Montmorency 7,604 512 1,401 3,175 1,511 380 399 226 Muskegon 108,661 5,193 13,210 38,522 27,349 9,297 10,215 4,875 Newaygo 30,329 2,011 4,447 12,242 6,337 1,835 2,332 1,125 Oakland 807,910 23,921 62,796 178,541 180,206 53,723 187,273 121,450 Oceana 17,134 1,313 2,153 6,754 3,533 1,224 1,373 784 Ogemaw 15,191 1,057 2,741 6,058 3,078 804 922 531 Ontonagon 5,899 378 578 2,566 1,221 390 512 254 Osceola 15,033 852 2,077 6,585 2,907 914 1,166 532 Oscoda 6,716 531 1,237 2,719 1,304 386 379 160 Otsego 15,468 585 1,665 5,629 3,877 1,021 1,849 842 Ottawa 141,870 7,349 11,622 44,106 31,376 10,583 25,592 11,242 Presque Isle 10,463 958 1,444 4,016 2,213 631 774 427 Roscommon 18,930 838 3,050 7,429 4,384 1,167 1,227 835 Saginaw 135,198 6,979 17,927 48,877 29,897 10,020 14,217 7,281 St. Clair 107,583 4,546 13,915 40,018 27,241 8,339 8,562 4,962 St. Joseph 39,807 2,770 5,754 15,254 8,698 2,257 3,403 1,671 Sanilac 29,197 1,841 4,085 12,814 5,821 1,721 1,796 1,119 Schoolcraft 6,272 357 934 2,754 1,161 356 514 196 Shiawassee 46,557 1,821 5,455 17,897 11,429 3,561 4,120 2,274 Tuscola 37,898 2,217 4,924 15,828 8,320 2,590 2,689 1,330 Van Buren 48,920 3,519 6,815 17,570 10,912 3,101 4,721 2,282 Washtenaw 197,414 4,673 12,043 33,752 40,063 11,857 48,034 46,992 Wayne 1,305,288 80,328 220,178 399,885 303,851 76,254 141,866 82,926 Wexford 19,965 909 2,693 7,721 4,293 1,286 1,953 1,110 Michigan 6,415,941 299,014 765,119 2,010,861 1,496,576 448,112 878,680 517,579
Source: Demographic Profile DP-2 Profiles of Selected Social Characteristics, DP2007-DP2014, Michigan Center for Geographic Information

CIVIL SERVICE SALARY AND BENEFIT COMPARISONS
Page 34 House Fiscal Agency: November 2008
Appendix C June 2008: Michigan State Classified Civil Service Job Descriptions/Educational Requirements
Position # of
Employees Position # of
Employees Minimum Education Required: No specific amount or type (690 employees) Storekeeper 390 Laborer 124 Storekeeper Supervisor 59 Machinist 3 Trades Helper 15 Microfilm Machine Operator 17 Institution Worker 1 Microfilm/Scanning Machine Operator 1 Janitor 30 Motor Vehicle Operator 49 Laboratory Glassware Worker 1 Minimum Education Required: High School Completion (12,524 employees) Administrative Technician Supervisor 11 Heavy Equipment Mechanic Supervisor 5 Aircraft Mechanic 2 Home Aide 12 Aircraft Mechanic Supervisor 2 Human Resources Customer Service Rep. 18 Aircraft Pilot 7 Human Resources Customer Service Supervisor 1 Automotive Body Repairer 2 Industries Production Leader 75 Automotive Mechanic 14 Industries Supervisor 29 Barber Cosmetologist 4 Institutional Training Technician 3 Boiler Inspector 14 Interpreter Deaf 3 Bridge Operator 24 Legal Secretary 121 Bridge Operator Supervisor 1 Library Assistant 14 Bridge Safety Officer 48 Lift/Ride Inspector 4 Bridge Safety Supervisor 14 Locksmith 10 Bridge Worker 10 Maintenance Mechanic 422 Building Code Inspector 13 Maintenance Mechanic Supervisor 14 Building Trades Crew Leader 59 Mason-Plasterer 1 Building Trades Supervisor 22 Mechanical Code Inspector 11 Calculations Assistant 213 Medical Benefits Reviewer 25 Carpenter 70 Motor Carrier Investigator 10 Central Control Operator 6 Motor Carrier Lieutenant 8 Client Resident Affairs Supervisor 1 Motor Carrier Sergeant 21 Code Inspection Supervisor 13 Motor Carrier Specialist Sergeant 1 Communications Assistant 183 Motor Carrier Officer 119 Communications Network Installer 9 Motor Equipment Supervisor 2 Conservation Officer 141 Office Supervisor 192 Conservation Officer Specialist 3 Painter 17 Conservation Officer Supervisor 22 Park & Recreation Ranger 295 Conservation Officer-Law Supervisor 33 Park & Recreation Supervisor 69 Construction Safety Inspector 16 Parking Officer 5 Construction Safety Supervisor 4 Personnel Management Assistant 127 Cook 40 Personnel Management Technician 46 Data Coding Operator 151 Pharmacy Assistant 60 Data Processing Assistant 1 Photo Services Assistant 4 Dental Aide 59 Physical Plant Supervisor 68 Department of State Aide 611 Plumber 21 Departmental Technician 978 Plumber-Licensed 30 Disability Determination Assistant 28 Plumbing Inspector 12 Division Head Legal Secretary 4 Power Plant Operator 57 Division Legal Secretary 31 Power Plant Supervisor 4 Domestic Services Aide 238 Printing Typesetter 1 Domestic Services Supervisor 14 Procurement Technician 61 Electrical Inspector 17 Railroad Safety Inspector 5 Electrician Licensed 52 Refrigeration Mechanic 6

CIVIL SERVICE SALARY AND BENEFIT COMPARISONS House Fiscal Agency: November 2008 Page 35
Appendix C June 2008: Michigan State Classified Civil Service Job Descriptions/Educational Requirements
Position # of
Employees Position # of
Employees Minimum Education Required: High School Completion . . . continued Electrician Master Licensed 81 Refrigeration Mechanic Licensed 30 Electrician Supervisor 5 Reproduction Machine Repairer 1 Elevator Inspector 23 Reproduction Machine Supervisor 9 Emergency Dispatcher 81 Reproduction Machines Operator 49 Emergency Dispatcher Supervisor 5 Resident Care Aide 891 Equipment Operator 67 Resident Care Aide Supervisor 9 Executive Office Assistant 2 Secretary 1,485 Executive Office Associate 10 Secretary Supervisor 14 Executive Secretary 497 Senior Executive Management Assistant 148 Farm Crew Leader 3 State Police Aircraft Pilot (Sergeant) 1 Farm Supervisor 1 State Properties Security Officer 15 Fingerprint Technician 8 State Properties Security Supervisor 2 Fingerprint Technician Supervisor 1 State Services Assistant 161 Fire & Safety Officer Supervisor 5 Steeplejack 48 Fire Crash Rescue Officer 29 Teacher Aide 11 Fire Crash Rescue Supervisor 2 Television/Equipment Repairer 3 Fire Safety Inspector 30 Transportation Maintenance Coordinator 25 Fire Safety Officer 58 Transportation Maintenance Supervisor 51 Fire Safety Supervisor 6 Transportation Maintenance Worker 531 Fisheries Boat Captain Supervisor 8 Treasury Customer Service Representative 98 Food Service Supervisor 1 Vehicle Safety Inspector 14 Food Services Leader-Prisoner 399 Wastewater Treatment Plant Operator 4 Food Services Supervisor 74 Weights/Measures Inspector 9 Forensic Security Aide 196 Welder 12 Forensic Security Supervisor 36 Wildlife Assistant 29 Forest Fire Officer 59 Workers Compensation Assistant 4 Forest Fire Officer Supervisor 18 World Processing Assistant 986 Fruit/Vegetable Inspector 7 Youth Aide 10 Fruits/Vegetables Inspector Supervisor 1 Departmental Administrator 7 General Office Assistant 831 Engineering Support Assistant 3 Groundskeeper 15 Monitor Services 2 Groundskeeper Supervisor 6 Non-state Supervisor 1 Hazardous Materials Storage Inspector 20 Public Transportation Specialist 1 Hearings Reporter 4 Special Worker 2 Heavy Equipment Mechanic 75 Minimum Education Required: High School Completion/MSPTA (1,687 employees) State Police Detective (Trooper Specialist) 36 State Police Sergeant 233 State Police Detective First Lieutenant 23 State Police Specialist First Lieutenant 3 State Police Detective Lieutenant 46 State Police Specialist Lieutenant 15 State Police Detective Sergeant 176 State Police Specialist Sergeant 63 State Police First Lieutenant 63 State Police Specialist Trooper 2 State Police Lieutenant 14 State Police Trooper 1,013 Minimum Education Required: 15 Semester Credits (9,766 employees) Corrections Medical Aide 1 Corrections Security Representative 11 Corrections Medical Officer 11 Corrections Shift Supervisor 874 Corrections Officer 5,554 Corrections Transportation Officer 210 Corrections Resident Representative 77 Resident Unit Officer 2,887 Corrections Security Inspector 47 Special Alternative Incarceration Officer 94

CIVIL SERVICE SALARY AND BENEFIT COMPARISONS
Page 36 House Fiscal Agency: November 2008
Appendix C June 2008: Michigan State Classified Civil Service Job Descriptions/Educational Requirements
Position # of
Employees Position # of
Employees Minimum Education Required: Certificate (352 employees) Practical Nurse Licensed 335 Practical Nurse Supervisor 17 Minimum Education Required: Associate’s Degree (6,127 employees) Account Examiner 125 Graphic Arts Designer Supervisor 3 Account Examiner Supervisor 28 Indian Outreach Worker 12 Accounting Assistant 423 Information Technology Technician 310 Accounting Technician 215 Laboratory Assistant 11 Assistance Payments Supervisor 4 Laboratory Technician 57 Assistance Payments Worker 1,701 Liability Examiner 14 Assistant Resident Unit Supervisor 347 Library Research Analyst 3 Attorney General Investigator 29 Library Technician 35 Attorney General Investigator Supervisor 6 Medical Record Examiner 38 Aviation Communication Technician 2 Medical Record Examiner Supervisor 15 Child Care Worker 67 Medical Technician Supervisor 2 Civil Technician Supervisor 21 Migrant Program Worker 44 Construction Technician 202 Migrant Services Worker 15 Corrections Field Services Assistant 17 Natural Resources Technician Supervisor 9 Dental Hygienist 35 Paralegal 11 Dental Laboratory Technician 1 Photographer Supervisor 1 Department of State Branch Supervisor 187 Photographer 7 Drafting Technician 109 Radio Communications Technician 49 Electronics Technician 6 Registered Nurse 501 Employment Service Interviewer 92 Respiratory Therapy Technician 1 Engineering Technician 117 Social Services Administrative Supervisor 46 Environmental Technician 17 Surveying Technician 32 Environmental Technician 1 Trades Instructor 113 Environmental Technician Supervisor 2 Traffic Technician 22 Equipment Technician 36 Unemployment Insurance Examiner 548 Fisheries Assistant 47 Veterinary Technician 3 Fisheries Technician 49 Water Quality Technician 2 Forensic Technician 14 Wildlife Technician 34 Forest Technician 21 X-Ray Technician 12 Geological Technician 13 Youth Specialist 194 Graphic Arts Designer 18 Youth Specialist Supervisor 31 Minimum Education Required: Bachelor's Degree (17,651 employees) Account Manager 102 Land Surveyor Licensed 8 Accountant 125 Land Surveyor Licensed Specialist 9 Accounting Specialist 60 Land Surveyor Manager 9 Activities Therapy Aide 37 Landscape Design Manager 2 Activities Therapy Aide Supervisor 2 Landscape Design Specialist 4 Activities Therapy Manager 8 Landscape Designer 13 Aeronautic Specialist 1 Lottery District Sales Representative 63 Aquatic Biologist 20 Lottery Regional Sales Manager 9 Aquatic Biology Specialist 3 Media Production Specialist 6 Archaeologist Manager 1 Medicaid Utilization Analyst 27 Archaeologist 9 Medical Claims Analyst 1 Architect Manager (Licensed) 6 Mental Health Social Worker 7 Architect Specialist 7 Meteorologist 1 Architect 13 Meteorology Specialist 1

CIVIL SERVICE SALARY AND BENEFIT COMPARISONS House Fiscal Agency: November 2008 Page 37
Appendix C June 2008: Michigan State Classified Civil Service Job Descriptions/Educational Requirements
Position # of
Employees Position # of
Employees Minimum Education Required: Bachelor's Degree . . . continued Assistant Auditor General Manager 34 Meteorologist Manager 6 Assistant Auditor General 51 Meteorologist 15 Assistant Auditor General Specialist 1 Metrology Specialist 1 Auditing Specialist 52 Microbiologist 43 Auditor 350 Microbiologist Specialist 2 Auditor General Manager 22 Music Therapist 11 Auditor Manager 82 Natural Resources Manager 48 Aviation Manager 3 Nurse Consultant 50 Aviation Specialist 2 Occupation Safety Advisor 4 Building Construction Manager 4 Occupation Safety Inspection 30 Building Construction Project Superintendent 34 Occupational Safety Supervisor 4 Building Construction Specialist 1 Occupational Therapist 31 Buyer 29 Park & Recreation Manager 28 Buyer Manager 8 Park Interpreter 12 Buyer Specialist 22 Parole Probation Manager 156 Child Support Manager 7 Parole Probation Specialist 4Child Support Specialist 84 Parole/Probation Officer 1,184 Civil Rights Manager 11 Parole/Probation Specialist 2 Civil Rights Representative 54 Personnel Management Analyst 73 Civil Rights Specialist 8 Personnel Management Specialist 114 Claims Examiner 10 Pharmacist 15 Client Resident Affairs Representative 7 Pharmacist Manager 5 Communications Representative 39 Pharmacist Specialist 2 Communications Representative Manager 10 Physical Therapist 1 Communications Specialist 20 Physical Therapy Aide 7 Corrections Internal Affairs Specialist 6 Physician Assistant 2 Corrections Program Coordinator 150 Physician Manager 12 Corrections Program Manager 6 Physicist 15 Dairy Industry Manager 5 Physicist Manager 6 Dairy Industry Scientist 18 Physicist Specialist 4 Dairy Industry Specialist 4 Planning Analyst 9 Departmental Analyst 1,592 Planning Manager 2 Departmental Analyst-Trainee 72 Plant Industry Manager 8 Departmental Manager 413 Plant Industry Scientist 45 Departmental Specialist 536 Plant Industry Specialist 6 Departmental Supervisor 123 Plant Pathologist Specialist 1 Deputy Prison Warden 73 Prison Counselor 5 Developmental Disabilities Manager 7 Promotional Agent 19 Developmental Disabilities Programmer 11 Promotional Specialist 8 Dietitian/Nutritionist 24 Property Analyst 75 Dietitian/Nutritionist Manager 7 Property Manager 30 Disability Examiner 319 Property Specialist 17 Disability Examiner Manager 43 Public Utilities Auditor 1 Economic Analyst 20 Public Utilities Engineer 14 Economic Community Development Analyst 13 Public Utilities Engineering Specialist 8 Economic Community Development Manager 5 Recreational Therapist 46 Economic Community Development Specialist 28 Registered Nurse Director 14 Economic Manager 4 Registered Nurse Manager 380 Economic Specialist 7 Regulation Agent 227

CIVIL SERVICE SALARY AND BENEFIT COMPARISONS
Page 38 House Fiscal Agency: November 2008
Appendix C June 2008: Michigan State Classified Civil Service Job Descriptions/Educational Requirements
Position # of
Employees Position # of
Employees Minimum Education Required: Bachelor’s Degree . . . continued Education Specialist 3 Regulation Manager 42 Employment Counselor 6 Regulation Officer Trainee 1 Employment Services Analyst 7 Regulation Officer Trainee 36 Employment Service Manager 10 Regulation Specialist 11 Engineer 11 Rehabilitation Service Coordinator 5 Engineer Manager 26 Resident Unit Manager 128 Engineer Manager-Licensed 163 Resource Analyst 68 Engineering Assistant 17 Resource Program Analyst 19 Engineering Assistant Supervisor 3 Resource Specialist 21 Engineering Licensed Specialist 8 Rights Representative 17 Engineering Specialist 9 Rights Representative Manager 1 Environmental Engineer 92 Rights Representative Manager 2 Environmental Engineer Licensed 41 Rights Specialist 7 Environmental Engineering Licensed Specialist 7 School Teacher 87 Environmental Engineering Specialist 21 Senior Chief Deputy Director 6 Environmental Manager 128 Senior Deputy Director 37 Environmental Quality Analyst 388 Senior Deputy Director Treasury Investment 1 Environmental Quality Specialist 96 Senior Executive Assistant Director 25 Environmental Sanitarian 9 Senior Management Executive 38 Environmental Sanitarian Specialist 6 Senior Management Warden 27 Executive Office Advisor/Administrator 9 Senior Policy Executive 44 Executive Office Manager/Specialist 12 Services Program Manager 388 Executive Office Official 8 Services Specialist 1,541 Executive Office Representative 5 Services Specialist Assistant 41 Facilities Engineer 9 Social Services Administrative Manager 7 Facilities Engineering Licensed Specialist 7 Social Services Division Administrator 93 Facilities Manager 1 Social Services Licensing Manager 15 Facilities Supervisor 22 Soil Science Specialist 1 Family Independence Manager 357 Soil Scientist 4 Family Independence Specialist 1,449 Special Education Teacher 21 Financial Manager 41 Speech Therapist 1 Financial Analyst 154 State Administrative Manager 524 Financial Institutions Examiner 55 State Assistant Administrator 55 Financial Institutions Manager 43 State Bureau Administrator 72 Financial Institutions Specialists 5 State Division Administrator 242 Financial Specialist 96 State Office Administrator 147 Fisheries Biologist 28 State Police Lab Director 6 Fisheries Biology Specialist 1 State Police Lab Manager 28 Food Industry Field Scientist 49 State Policy Administrator 3 Food Industry Manager 8 State Policy Assistant 1 Food Industry Specialist 7 Statistician 9 Forensic Scientist 84 Statistician Manager 1 Forest Management Specialist 12 Statistician Specialist 9 Forester 85 Transportation Engineer 293 General Engineer 1 Transportation Engineer Licensed 4 Geologist 78 Transportation Engineer Licensed Specialist 99 Geology Specialist 13 Transportation Planner 55 Health Care Surveyor 49 Transportation Planner Specialist 20 Human Resources Developer 129 Transportation Planning Manager 26

CIVIL SERVICE SALARY AND BENEFIT COMPARISONS House Fiscal Agency: November 2008 Page 39
Appendix C June 2008: Michigan State Classified Civil Service Job Descriptions/Educational Requirements
Position # of
Employees Position # of
Employees Minimum Education Required: Bachelor’s Degree . . . continued Human Resources Developer Specialist 27 Treasury Investment Administration Manager 5 Human Resources Developer Trainee 5 Treasury Investment Administrator 5 Human Resources Manager 30 Treasury Investment Analyst 2 Industrial Hygienist 36 Treasury Investment Specialist 25 Industrial Hygienist Manager 8 Unemployment Claims Manager 56 Industrial Hygienist Specialist 7 Unemployment Claims Supervisor 1 Information Technology Manager 122 Unemployment Insurance Analyst 52 Information Technology Programmer/Analyst 734 Vehicle Services Coordinator 3 Information Technology Specialist 256 Wildlife Biologist 39 Information Technology Supervisor 25 Wildlife Biologist Specialist 8Institution Chaplain 38 Workers Compensation Mediator 4 Labor Mediator 9 Youth Challenge Academy Advisor 2 Labor Relations Specialist 4 Youth Challenge Academy Cadre Aide 23 Laboratory Evaluation 2 Youth Challenge Academy Cadre Supervisor 1 Laboratory Scientist 72 Youth Challenge Academy Recreation 7 Laboratory Scientist Manager 22 Youth Challenge Academy Supervisor 1 Laboratory Scientist Specialist 8 Youth Group Leader 19 Land Surveyor 9 Minimum Education Required: Master’s Degree (2,000 employees) Administrative Manager 45 Psychologist Manager 21 Adult Foster Care Consultant 50 Public Health Consultant 63 Audiologist 1 Public Health Consultant Manager 10 Blind Rehabilitation Instructor 25 Research Biology Specialist 16 Camp Consultant 11 Rehabilitation Consultant 6 Child Day Care Consultant 69 Rehabilitation Consultant Manager 4 Child Welfare Consultant 18 Rehabilitation Counselor 284 Clinical Social Work Manager 9 Research Biologist 2 Clinical Social Worker 119 Research Biologist Manager 6 Community Health Services Manager 22 School District Consultant 8 Education Consultant 27 School Principal 27 Education Consultant Manager 27 School Psychologist 1 Education Field Services Consultant 14 School Teacher 95 Education Research Consultant 16 Services Specialist 567 Epidemiologist 19 Social Work Specialist 2 Epidemiologist Specialist 5 Special Education Consultant 8 Higher Education Consultant 17 Special Education Teacher 47 Historian 17 Speech and Language Pathologist 2 Historian Manager 3 Speech and Language Pathologist Manager 1 Historian Specialist 1 Toxicologist 11 History Specialist 11 Toxicologist Manager 2 Librarian 53 Toxicology Specialist 4 Librarian Manager 7 Vocational Education Consultant 3 Library Consultant 2 Vocational Rehabilitation Manager 49 Nutrition/Food Management Consultant Mgr. 13 Wilderness Instructor 4 Psychologist 141 Youth Residential Director 15

CIVIL SERVICE SALARY AND BENEFIT COMPARISONS
Page 40 House Fiscal Agency: November 2008
Appendix C June 2008: Michigan State Classified Civil Service Job Descriptions/Educational Requirements
Position # of
Employees Position # of
Employees Minimum Education Required: Doctoral Degree (680 employees) Administrative Law Examiner 120 Physician 31 Administrative Law Manager 11 Prosecutor Training Coordinator Manager 1 Administrative Law Specialist 47 Psychiatric Resident 2 Attorney Administrator 74 Psychiatrist 44 Attorney Specialist 21 Psychiatrist Director 12 Attorney-Senior 106 Psychiatrist Manager 13 Attorney-Staff 77 Veterinarian 16 Clinical Health Scientist Manager 2 Veterinarian Manager 4 Clinical Health Scientist Specialist 1 Veterinary Specialist 4 Dentist 45 Physician Executive 2 Dentist Manager 3 Forensic Psychiatrist 6 Law Library Consultant 1 Forensic Psychologist 29 Law Library Manager 1 Forensic Psychologist Manager 7
Total All Employees = 51,477
Source: Michigan Civil Service Commission
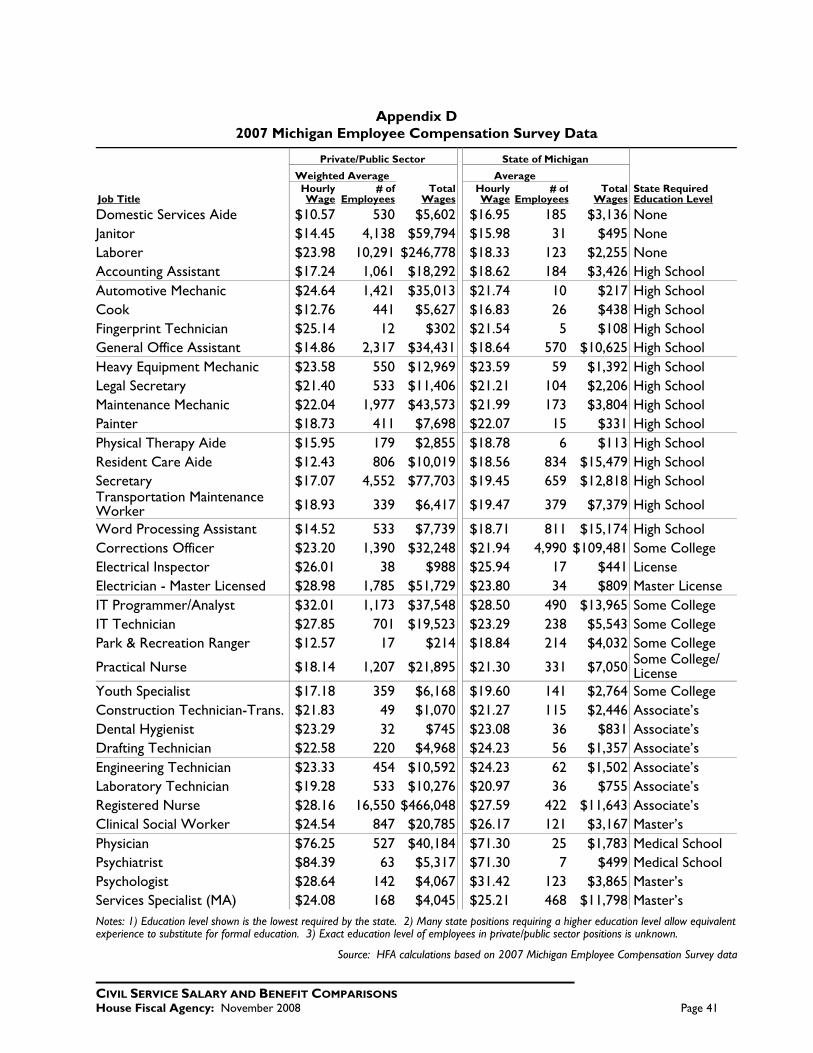
CIVIL SERVICE SALARY AND BENEFIT COMPARISONS House Fiscal Agency: November 2008 Page 41
Appendix D 2007 Michigan Employee Compensation Survey Data
Private/Public Sector State of Michigan Weighted Average Average
Job Title Hourly Wage
# of Employees
Total Wages
Hourly Wage
# ofEmployees
Total Wages
State Required Education Level
Domestic Services Aide $10.57 530 $5,602 $16.95 185 $3,136 None Janitor $14.45 4,138 $59,794 $15.98 31 $495 None Laborer $23.98 10,291 $246,778 $18.33 123 $2,255 None Accounting Assistant $17.24 1,061 $18,292 $18.62 184 $3,426 High School Automotive Mechanic $24.64 1,421 $35,013 $21.74 10 $217 High School Cook $12.76 441 $5,627 $16.83 26 $438 High School Fingerprint Technician $25.14 12 $302 $21.54 5 $108 High School General Office Assistant $14.86 2,317 $34,431 $18.64 570 $10,625 High School Heavy Equipment Mechanic $23.58 550 $12,969 $23.59 59 $1,392 High School Legal Secretary $21.40 533 $11,406 $21.21 104 $2,206 High School Maintenance Mechanic $22.04 1,977 $43,573 $21.99 173 $3,804 High School Painter $18.73 411 $7,698 $22.07 15 $331 High School Physical Therapy Aide $15.95 179 $2,855 $18.78 6 $113 High School Resident Care Aide $12.43 806 $10,019 $18.56 834 $15,479 High School Secretary $17.07 4,552 $77,703 $19.45 659 $12,818 High School Transportation Maintenance Worker $18.93 339 $6,417 $19.47 379 $7,379 High School
Word Processing Assistant $14.52 533 $7,739 $18.71 811 $15,174 High School Corrections Officer $23.20 1,390 $32,248 $21.94 4,990 $109,481 Some College Electrical Inspector $26.01 38 $988 $25.94 17 $441 License Electrician - Master Licensed $28.98 1,785 $51,729 $23.80 34 $809 Master License IT Programmer/Analyst $32.01 1,173 $37,548 $28.50 490 $13,965 Some College IT Technician $27.85 701 $19,523 $23.29 238 $5,543 Some College Park & Recreation Ranger $12.57 17 $214 $18.84 214 $4,032 Some College
Practical Nurse $18.14 1,207 $21,895 $21.30 331 $7,050 Some College/ License
Youth Specialist $17.18 359 $6,168 $19.60 141 $2,764 Some College Construction Technician-Trans. $21.83 49 $1,070 $21.27 115 $2,446 Associate’s Dental Hygienist $23.29 32 $745 $23.08 36 $831 Associate’s Drafting Technician $22.58 220 $4,968 $24.23 56 $1,357 Associate’s Engineering Technician $23.33 454 $10,592 $24.23 62 $1,502 Associate’s Laboratory Technician $19.28 533 $10,276 $20.97 36 $755 Associate’s Registered Nurse $28.16 16,550 $466,048 $27.59 422 $11,643 Associate’s Clinical Social Worker $24.54 847 $20,785 $26.17 121 $3,167 Master’s Physician $76.25 527 $40,184 $71.30 25 $1,783 Medical School Psychiatrist $84.39 63 $5,317 $71.30 7 $499 Medical School Psychologist $28.64 142 $4,067 $31.42 123 $3,865 Master’s Services Specialist (MA) $24.08 168 $4,045 $25.21 468 $11,798 Master’s Notes: 1) Education level shown is the lowest required by the state. 2) Many state positions requiring a higher education level allow equivalent experience to substitute for formal education. 3) Exact education level of employees in private/public sector positions is unknown.
Source: HFA calculations based on 2007 Michigan Employee Compensation Survey data


Mitchell E. Bean, Director
Bill Fairgrieve, Deputy Director Agriculture .................................................................................................................. William E. Hamilton, Senior Fiscal Analyst Capital Outlay .............................................................................................................................. Al Valenzio, Associate Director Community Colleges .................................................Benjamin Gielczyk, Fiscal Analyst; Kyle I. Jen, Senior Fiscal Analyst Community Health Medicaid ................................................................................................................................. Steve Stauff, Senior Fiscal Analyst Mental Health/Substance Abuse ........................................................................Margaret Alston, Senior Fiscal Analyst Public Health/Aging ............................................................................................................Susan Frey, Senior Fiscal Analyst Corrections ....................................................................................................................... Marilyn Peterson, Senior Fiscal Analyst Education (Department).................... Mary Ann Cleary, Associate Director; Bethany Wicksall, Senior Fiscal Analyst Environmental Quality......................................................................................................Kirk Lindquist, Senior Fiscal Analyst General Government: Attorney General/Civil Rights/Executive/ Information Technology/Legislature/Legislative Auditor General/ Lottery/Management & Budget/State/Treasury ........................................................Viola Bay Wild, Fiscal Analyst Higher Education ........................................................................................................................ Kyle I. Jen, Senior Fiscal Analyst Human Services (Department) ...................Robert Schneider, Senior Fiscal Analyst; Kevin Koorstra, Fiscal Analyst History, Arts, and Libraries ...............................................................................................................Mark Wolf, Fiscal Analyst Judiciary ...............................................................Benjamin Gielczyk, Fiscal Analyst; Bethany Wicksall, Senior Fiscal Analyst Labor & Economic Growth................................................................................................................Mark Wolf, Fiscal Analyst Military & Veterans Affairs ........................................................................................... Jan Wisniewski, Senior Fiscal Analyst Natural Resources ...............................................................................................................Kirk Lindquist, Senior Fiscal Analyst State Police........................................................................................................................... Jan Wisniewski, Senior Fiscal Analyst School Aid ................................................. Mary Ann Cleary, Associate Director; Bethany Wicksall, Senior Fiscal Analyst Transportation .......................................................................................................... William E. Hamilton, Senior Fiscal Analyst Economics Revenue/Tax Analysis ........................................................................................................Rebecca Ross, Senior Economist Tax Analysis/Revenue Sharing ....................................................................................................... Jim Stansell, Economist Legislative Analysis ..................................................................................................................Chris Couch, Associate Director Edith Best, Joan Hunault, Shannan Kane, Sue Stutzky, Legislative Analysts Legislative Transfers ......................................................................................................Margaret Alston, Senior Fiscal Analyst Retirement..................................................................................................................................... Al Valenzio, Associate Director Supplementals ................................................................. Al Valenzio, Associate Director; Kyle I. Jen, Senior Fiscal Analyst Administrative Assistant...............................................................................................................................................Jeanne Dee Budget Assistants Agriculture/Community Colleges/Education/Higher Education/School Aid/ Transportation/Transfers/HFA Internet/Bill Analysis .................................................................... Barbara Graves Capital Outlay/Environmental Quality/General Government/ History, Arts, & Libraries/Labor & Economic Growth/ Military & Veterans Affairs/Natural Resources/Retirement/ State Police/Supplementals .................................................................................................................................Amber Fox Community Health/Corrections/Human Services/Judiciary/HFA Library ....................................Tumai Burris Receptionist ..................................................................................................................................................................D’Andrea Long November 2008

P.O. Box 30014 Lansing, MI 48909-7514 (517) 373-8080 FAX (517) 373-5874
www.house.mi.gov/hfa