civil service retirement - opm.gov · - 5 - civil service retirement and disability fund statements...
TRANSCRIPT

United States Office Of Personnel Management
Civil Service Retirement and Disability Fund Annual Report
Fiscal Year Ended September 30, 2016
OPM.GOV FEBRUARY 2017

Table of Contents
Financial Section Statements of Net Assets Available for Benefits 4 Statements of Actuarial Present Value of Accumulated Plan Benefits 6 Schedule of Investments 7 Notes to Financial Statements 11 Actuarial Section General Information 17 Actuarial Valuation of the CSRDF 19 Opinion of the Enrolled Actuary 25 Table 1A: Actuarial Status Information as of Beginning of Plan Year 26 Table 1B: Projected Future Cash Flow for Current Participants 28 Table 1C: Statement of Pension Expense 30 Table 1D: Present Value of Future Benefits Obligations 31 Table 2: Past and Projected Flow of Plan Assets 32 Table 3: Past and Projected Flow of Plan Assets, FERS 36 Table 4: Past and Projected Flow of Plan Assets, CSRS 40 Table 5: Valuation Assumption History 45 Table 6: Employee Population Data 46 Table 7: Demographic Assumptions 48 Table 8: Plan Provisions 64

Financial Section

- 4 -
CIVIL SERVICE RETIREMENT AND DISABILITY FUND
STATEMENTS OF NET ASSETS AVAILABLE FOR BENEFITS
As of September 30, 2016 and 2015 – Unaudited (In Thousands)
Civil Service Retirement
System
Federal Employees Retirement
System Total Fund
2016
Total Fund 2015
Assets: Investments, at Fair Value [Note 5] $296,291,194 $ 590,869,579 $887,160,773
$731,266,603
Receivables: Contributions by Employers 62,401 1,466,226 1,528,627
1,247,645
Contributions by Participants 33,831 114,302 148,133
114,003 Accrued Interest on Investments 2,754,543 3,803,893 6,558,436
6,467,021
Other 86,589 236,793 323,382
991,384
Total Receivables 2,937,364 5,621,214 8,558,578
8,820,053
Cash [Note 3] 12,431 - 12,431
140,619,716
Total Assets 299,240,989 596,490,793 895,731,782
880,706,372
Liabilities: Annuities Benefits Payable 5,361,317 1,051,827 6,413,144
6,352,744
Refunds of Contributions Payable 2,859 3,522 6,381
57,010 Taxes, Insurance and Other Withholdings 630,334 253,230 883,564
871,289
Administrative and Other Liabilities 40,829 18,649 59,478
103,544
Total Liabilities 6,035,339 1,327,228 7,362,567
7,384,587
Net Assets Available for Benefits $293,205,650 $595,163,565 $888,369,215
$873,321,785
The accompanying notes are an integral part of the financial statements.
- 5 -
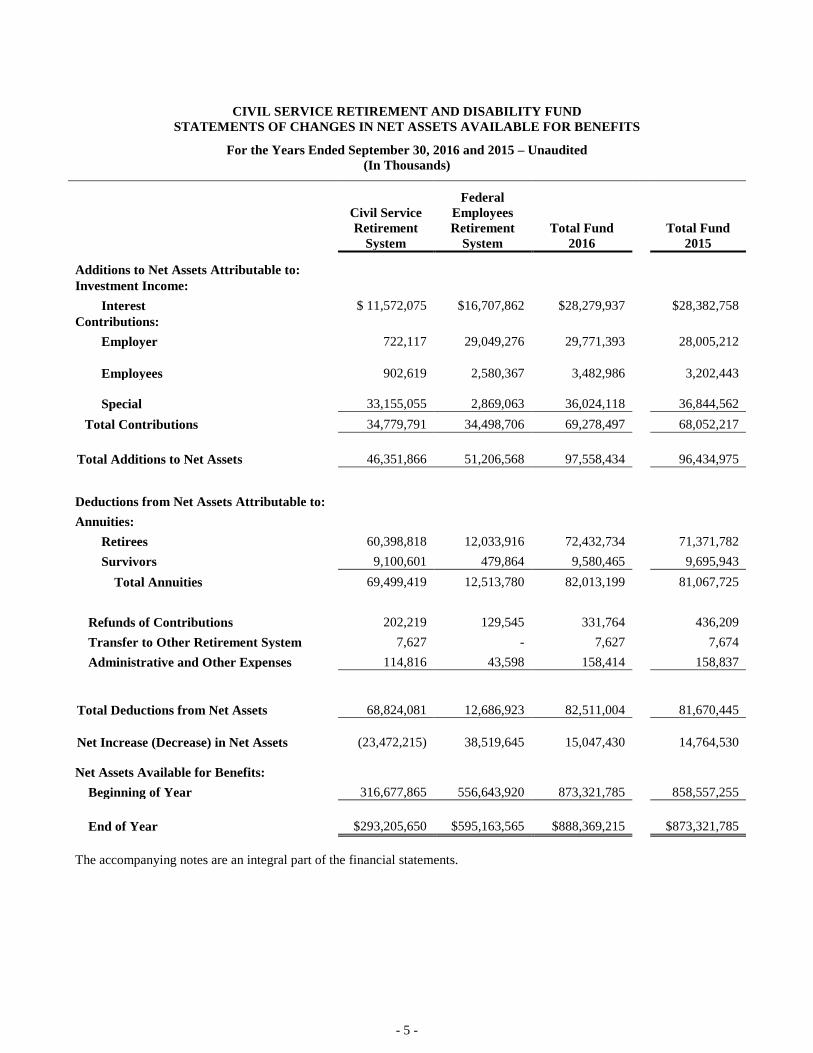
CIVIL SERVICE RETIREMENT AND DISABILITY FUND STATEMENTS OF CHANGES IN NET ASSETS AVAILABLE FOR BENEFITS
For the Years Ended September 30, 2016 and 2015 – Unaudited (In Thousands)
Civil Service Retirement
System
Federal Employees Retirement
System Total Fund
2016 Total Fund
2015
Additions to Net Assets Attributable to: Investment Income:
Interest $ 11,572,075 $16,707,862 $28,279,937 $28,382,758 Contributions:
Employer 722,117 29,049,276 29,771,393 28,005,212
Employees 902,619 2,580,367 3,482,986 3,202,443
Special 33,155,055 2,869,063
36,024,118
36,844,562 Total Contributions 34,779,791 34,498,706 69,278,497 68,052,217
Total Additions to Net Assets 46,351,866 51,206,568 97,558,434 96,434,975
Deductions from Net Assets Attributable to: Annuities:
Retirees 60,398,818 12,033,916 72,432,734 71,371,782 Survivors 9,100,601 479,864 9,580,465 9,695,943
Total Annuities 69,499,419 12,513,780 82,013,199 81,067,725
Refunds of Contributions 202,219 129,545 331,764 436,209 Transfer to Other Retirement System 7,627 - 7,627 7,674 Administrative and Other Expenses 114,816 43,598 158,414 158,837
Total Deductions from Net Assets 68,824,081 12,686,923 82,511,004 81,670,445
Net Increase (Decrease) in Net Assets (23,472,215) 38,519,645 15,047,430 14,764,530
Net Assets Available for Benefits: Beginning of Year 316,677,865 556,643,920 873,321,785 858,557,255
End of Year $293,205,650 $595,163,565 $888,369,215 $873,321,785
The accompanying notes are an integral part of the financial statements.

- 6 -
CIVIL SERVICE RETIREMENT AND DISABILITY FUND STATEMENTS OF ACTUARIAL PRESENT VALUE OF ACCUMULATED PLAN BENEFITS
As of September 30, 2015 and 2014 – Unaudited (In Millions)
Civil Service Retirement
System
Federal Employees Retirement
System Total Fund
2015 Total Fund
2014
Actuarial Present Value of Accumulated Plan Benefits:
Participants Receiving Benefits $920,500 $177,100 $1,097,600 $1,094,200 Participants Not Receiving Benefits 124,700 305,600 430,300 436,700
Total Actuarial Present Value of Accumulated Plan Benefits $1,045,200 $482,700 $1,527,900 $1,530,900
CIVIL SERVICE RETIREMENT & DISABILITY FUND
STATEMENTS OF CHANGES IN ACTUARIAL PRESENT VALUE OF ACCUMULATED PLAN BENEFITS
For the Years Ended September 30, 2015 and 2014 – Unaudited (In Millions)
Civil Service Retirement
System
Federal Employees Retirement
System Total Fund
2015 Total Fund
2014
Actuarial Present Value of Accumulated Plan Benefits at Beginning of Year $1,080,700 $450,200 $1,530,900 $1,510,900
Increase (Decrease) During the Year Attributable to:
Benefits Accumulated, Less Benefits Paid (35,500) 32,500 (3,000) 20,000
Changes in Actuarial Assumptions -
- - -
Net Increase (Decrease) (35,500) 32,500 (3,000) 20,000
Actuarial Present Value of Accumulated Plan Benefits at End of Year $1,045,200 $482,700 $1,527,900 $1,530,900

- 7 -
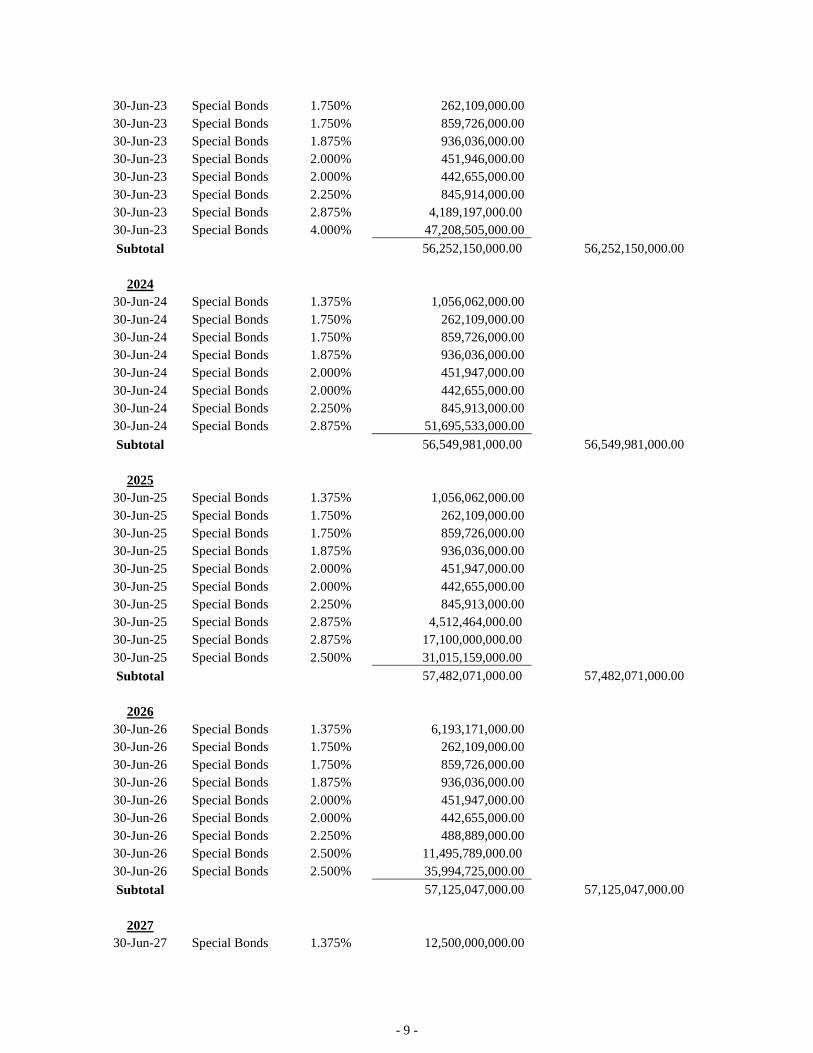
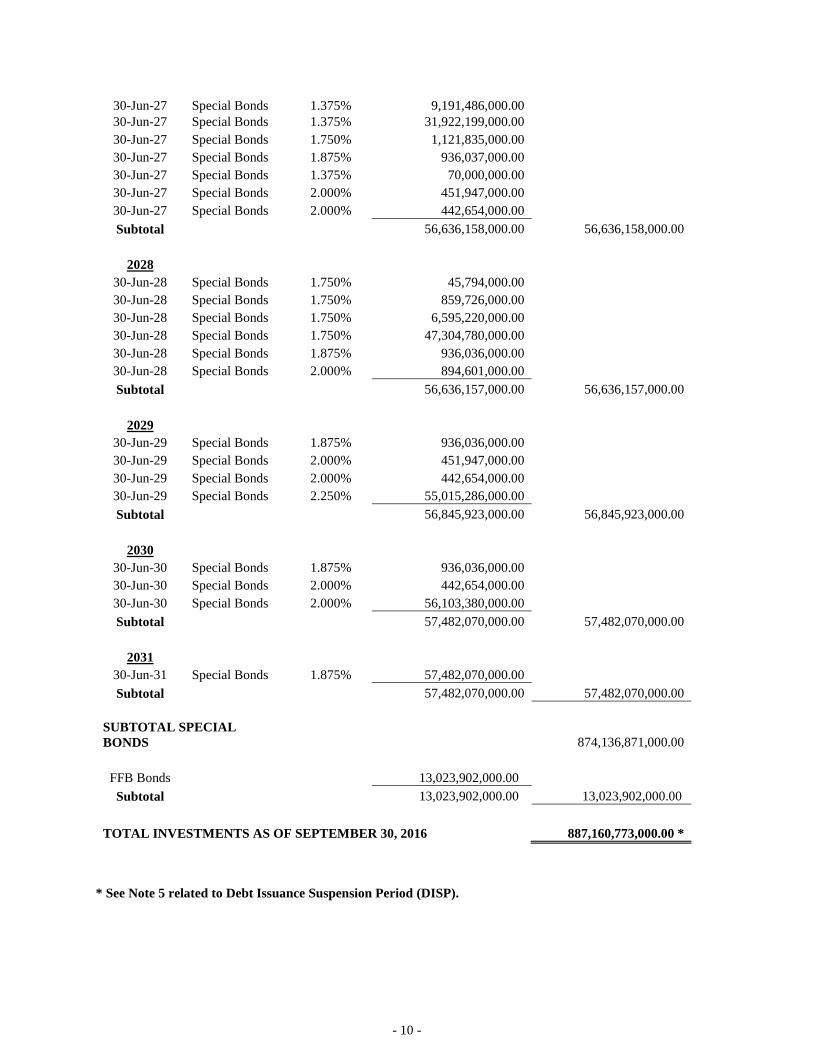
CIVIL SERVICE RETIREMENT & DISABILITY FUND SCHEDULE OF INVESTMENTS
AS OF SEPTEMBER 30, 2016
MATURITY
INTEREST PAR DATE SECURITY RATE VALUE TOTAL
2017 30-Jun-17 C of I 1.625% 39,139,603,000.00
30-Jun-17 Special Bonds 4.125% 1,022,095,000.00 30-Jun-17 Special Bonds 4.625% 983,610,000.00 30-Jun-17 Special Bonds 5.000% 670,126,000.00 30-Jun-17 Special Bonds 5.125% 1,846,146,000.00 30-Jun-17 Special Bonds 5.250% 37,183,500,000.00 Subtotal
80,845,080,000.00 80,845,080,000.00
2018 30-Jun-18 Special Bonds 1.375% 1,056,063,000.00
30-Jun-18 Special Bonds 1.750% 262,108,000.00 30-Jun-18 Special Bonds 1.750% 859,726,000.00 30-Jun-18 Special Bonds 1.875% 936,036,000.00 30-Jun-18 Special Bonds 2.000% 451,947,000.00 30-Jun-18 Special Bonds 2.000% 442,654,000.00 30-Jun-18 Special Bonds 2.250% 845,914,000.00 30-Jun-18 Special Bonds 3.250% 4,869,819,000.00 30-Jun-18 Special Bonds 3.500% 39,143,910,000.00 30-Jun-18 Special Bonds 4.000% 1,833,592,000.00 30-Jun-18 Special Bonds 4.125% 1,974,210,000.00 30-Jun-18 Special Bonds 4.625% 1,172,079,000.00 30-Jun-18 Special Bonds 5.000% 670,126,000.00 30-Jun-18 Special Bonds 5.125% 1,846,146,000.00 Subtotal
56,364,330,000.00 56,364,330,000.00
2019 30-Jun-19 Special Bonds 1.375% 1,056,062,000.00
30-Jun-19 Special Bonds 1.750% 262,109,000.00 30-Jun-19 Special Bonds 1.750% 859,726,000.00 30-Jun-19 Special Bonds 1.875% 936,036,000.00 30-Jun-19 Special Bonds 2.000% 451,947,000.00 30-Jun-19 Special Bonds 2.000% 442,654,000.00 30-Jun-19 Special Bonds 2.250% 845,914,000.00 30-Jun-19 Special Bonds 3.250% 4,580,347,000.00 30-Jun-19 Special Bonds 4.000% 1,833,592,000.00 30-Jun-19 Special Bonds 4.125% 1,974,210,000.00 30-Jun-19 Special Bonds 4.625% 40,192,942,000.00

- 8 -
30-Jun-19 Special Bonds 5.000% 670,126,000.00 30-Jun-19 Special Bonds 5.125% 1,846,146,000.00 Subtotal
55,951,811,000.00 55,951,811,000.00
2020 30-Jun-20 Special Bonds 1.375% 1,056,062,000.00
30-Jun-20 Special Bonds 1.750% 262,109,000.00 30-Jun-20 Special Bonds 1.750% 859,726,000.00 30-Jun-20 Special Bonds 1.875% 936,036,000.00 30-Jun-20 Special Bonds 2.000% 451,947,000.00 30-Jun-20 Special Bonds 2.000% 442,654,000.00 30-Jun-20 Special Bonds 2.250% 845,914,000.00 30-Jun-20 Special Bonds 2.875% 3,871,777,000.00 30-Jun-20 Special Bonds 4.000% 1,833,592,000.00 30-Jun-20 Special Bonds 4.125% 42,858,641,000.00 30-Jun-20 Special Bonds 5.000% 670,126,000.00 30-Jun-20 Special Bonds 5.125% 1,846,146,000.00 Subtotal
55,934,730,000.00 55,934,730,000.00
2021 30-Jun-21 Special Bonds 1.375% 1,056,062,000.00
30-Jun-21 Special Bonds 1.750% 262,109,000.00 30-Jun-21 Special Bonds 1.750% 859,726,000.00 30-Jun-21 Special Bonds 1.875% 936,036,000.00 30-Jun-21 Special Bonds 2.000% 451,947,000.00 30-Jun-21 Special Bonds 2.000% 442,654,000.00 30-Jun-21 Special Bonds 2.250% 845,914,000.00 30-Jun-21 Special Bonds 2.875% 4,210,300,000.00 30-Jun-21 Special Bonds 4.000% 1,833,592,000.00 30-Jun-21 Special Bonds 5.000% 670,126,000.00 30-Jun-21 Special Bonds 5.125% 44,704,787,000.00 Subtotal
56,273,253,000.00 56,273,253,000.00
2022 30-Jun-22 Special Bonds 1.375% 1,056,062,000.00
30-Jun-22 Special Bonds 1.750% 262,109,000.00 30-Jun-22 Special Bonds 1.750% 859,726,000.00 30-Jun-22 Special Bonds 1.875% 936,036,000.00 30-Jun-22 Special Bonds 2.000% 451,947,000.00 30-Jun-22 Special Bonds 2.000% 442,654,000.00 30-Jun-22 Special Bonds 2.250% 845,914,000.00 30-Jun-22 Special Bonds 2.875% 4,213,087,000.00 30-Jun-22 Special Bonds 4.000% 1,833,592,000.00 30-Jun-22 Special Bonds 5.000% 45,374,913,000.00 Subtotal
56,276,040,000.00 56,276,040,000.00
2023 30-Jun-23 Special Bonds 1.375% 1,056,062,000.00
- 9 -
30-Jun-23 Special Bonds 1.750% 262,109,000.00 30-Jun-23 Special Bonds 1.750% 859,726,000.00 30-Jun-23 Special Bonds 1.875% 936,036,000.00 30-Jun-23 Special Bonds 2.000% 451,946,000.00 30-Jun-23 Special Bonds 2.000% 442,655,000.00 30-Jun-23 Special Bonds 2.250% 845,914,000.00 30-Jun-23 Special Bonds 2.875% 4,189,197,000.00 30-Jun-23 Special Bonds 4.000% 47,208,505,000.00 Subtotal
56,252,150,000.00 56,252,150,000.00
2024 30-Jun-24 Special Bonds 1.375% 1,056,062,000.00
30-Jun-24 Special Bonds 1.750% 262,109,000.00 30-Jun-24 Special Bonds 1.750% 859,726,000.00 30-Jun-24 Special Bonds 1.875% 936,036,000.00 30-Jun-24 Special Bonds 2.000% 451,947,000.00 30-Jun-24 Special Bonds 2.000% 442,655,000.00 30-Jun-24 Special Bonds 2.250% 845,913,000.00 30-Jun-24 Special Bonds 2.875% 51,695,533,000.00 Subtotal
56,549,981,000.00 56,549,981,000.00
2025 30-Jun-25 Special Bonds 1.375% 1,056,062,000.00
30-Jun-25 Special Bonds 1.750% 262,109,000.00 30-Jun-25 Special Bonds 1.750% 859,726,000.00 30-Jun-25 Special Bonds 1.875% 936,036,000.00 30-Jun-25 Special Bonds 2.000% 451,947,000.00 30-Jun-25 Special Bonds 2.000% 442,655,000.00 30-Jun-25 Special Bonds 2.250% 845,913,000.00 30-Jun-25 Special Bonds 2.875% 4,512,464,000.00 30-Jun-25 Special Bonds 2.875% 17,100,000,000.00 30-Jun-25 Special Bonds 2.500% 31,015,159,000.00 Subtotal
57,482,071,000.00 57,482,071,000.00
2026 30-Jun-26 Special Bonds 1.375% 6,193,171,000.00
30-Jun-26 Special Bonds 1.750% 262,109,000.00 30-Jun-26 Special Bonds 1.750% 859,726,000.00 30-Jun-26 Special Bonds 1.875% 936,036,000.00 30-Jun-26 Special Bonds 2.000% 451,947,000.00 30-Jun-26 Special Bonds 2.000% 442,655,000.00 30-Jun-26 Special Bonds 2.250% 488,889,000.00 30-Jun-26 Special Bonds 2.500% 11,495,789,000.00 30-Jun-26 Special Bonds 2.500% 35,994,725,000.00 Subtotal
57,125,047,000.00 57,125,047,000.00
2027 30-Jun-27 Special Bonds 1.375% 12,500,000,000.00
- 10 -
30-Jun-27 Special Bonds 1.375% 9,191,486,000.00 30-Jun-27 Special Bonds 1.375% 31,922,199,000.00 30-Jun-27 Special Bonds 1.750% 1,121,835,000.00 30-Jun-27 Special Bonds 1.875% 936,037,000.00 30-Jun-27 Special Bonds 1.375% 70,000,000.00 30-Jun-27 Special Bonds 2.000% 451,947,000.00 30-Jun-27 Special Bonds 2.000% 442,654,000.00 Subtotal
56,636,158,000.00 56,636,158,000.00
2028 30-Jun-28 Special Bonds 1.750% 45,794,000.00
30-Jun-28 Special Bonds 1.750% 859,726,000.00 30-Jun-28 Special Bonds 1.750% 6,595,220,000.00 30-Jun-28 Special Bonds 1.750% 47,304,780,000.00 30-Jun-28 Special Bonds 1.875% 936,036,000.00 30-Jun-28 Special Bonds 2.000% 894,601,000.00 Subtotal
56,636,157,000.00 56,636,157,000.00
2029 30-Jun-29 Special Bonds 1.875% 936,036,000.00
30-Jun-29 Special Bonds 2.000% 451,947,000.00 30-Jun-29 Special Bonds 2.000% 442,654,000.00 30-Jun-29 Special Bonds 2.250% 55,015,286,000.00 Subtotal
56,845,923,000.00 56,845,923,000.00
2030 30-Jun-30 Special Bonds 1.875% 936,036,000.00
30-Jun-30 Special Bonds 2.000% 442,654,000.00 30-Jun-30 Special Bonds 2.000% 56,103,380,000.00 Subtotal
57,482,070,000.00 57,482,070,000.00
2031 30-Jun-31 Special Bonds 1.875% 57,482,070,000.00
Subtotal
57,482,070,000.00 57,482,070,000.00
SUBTOTAL SPECIAL BONDS
874,136,871,000.00
FFB Bonds
13,023,902,000.00 Subtotal
13,023,902,000.00 13,023,902,000.00
TOTAL INVESTMENTS AS OF SEPTEMBER 30, 2016 887,160,773,000.00 *
* See Note 5 related to Debt Issuance Suspension Period (DISP).

- 11 -
CIVIL SERVICE RETIREMENT AND DISABILITY FUND NOTES TO FINANCIAL STATEMENTS
September 30, 2016 and 2015
NOTE 1 - DESCRIPTION OF PLANS The following brief description of the Civil Service Retirement and Disability Fund (the “Fund”) is provided for general information purposes only. Participants should refer to Title 5, United States Code Chapters 83 and 84, for a complete description of the Fund’s provisions.
A. General The United States Office of Personnel Management (OPM) administers two defined-benefit retirement plans, via the Fund: the Civil Service Retirement System (CSRS) and the Federal Employees' Retirement System (FERS). Combined, the two Plans cover 100 percent of all eligible employees. As government-sponsored benefit plans, the CSRS and FERS are not subject to the provisions of the Employee Retirement Income Security Act of 1974, as amended.
The CSRS was established by the Civil Service Retirement Act, which was enacted on May 22, 1920. It is a stand-alone retirement plan intended to provide reasonable benefits for long-service Federal employees. The CSRS, which is closed to new participants, covers most Federal employees who first entered a covered position before 1984.
The FERS was established by the Federal Employees' Retirement System Act of 1986, which was enacted on June 6, 1986. Using Social Security as a base, the FERS provides an additional defined benefit and a voluntary thrift savings plan. The FERS generally covers employees who first entered a covered position after December 31, 1983. When FERS became effective on January 1, 1987, CSRS interim employees with less than 5 years of creditable civilian service on December 31, 1986, were automatically converted to FERS.
B. Retirement Benefits The CSRS provides full retirement benefits at age 55 with 30 years of service, age 60 with 20 years of service, or age 62 with 5 years of service. Deferred benefits are payable at age 62 with 5 years of service. The annuity formula provides 1.5 percent of average salary for the first five years of service, 1.75 percent for the next five years, and 2 percent for any remaining service, up to a maximum of 80 percent of average salary (based on the highest three consecutive years of salary). Special benefits are provided for certain law enforcement officers, firefighters, air traffic controllers, bankruptcy judges, congressional employees, Members of Congress, and certain other groups.
The FERS provides full retirement benefits at the “Minimum Retirement Age” (MRA) with 30 years of service, age 60 with 20 years of service, or age 62 with 5 years of service. The MRA is 55 for those born before 1948, and incrementally increases to 57 for those born in or after 1970. Deferred retirement benefits are available at or after the MRA with 10 years of service at reduced benefit levels. The annuity formula generally provides one percent of the employee's average salary (based on the highest three consecutive years of salary) times the number of years of creditable service. If retirement is at age 62 or later, with at least 20 years of service, a factor of 1.1 percent is used rather than 1 percent. Special benefits are provided for certain law enforcement officers, firefighters, air traffic controllers, bankruptcy judges, congressional employees, Members of Congress, and certain other groups.

- 12 -
C. Disability Benefits The CSRS requires that employees have at least five years of creditable civilian service to qualify for disability retirement benefits. Benefits are generally equal to the higher of (1) the CSRS computation described in Note 1.B. or (2) a guaranteed minimum disability annuity, consisting of the lower of 40 percent of the highest three years’ average salary or the regular earned annuity formula using service projected to age 60.
Under the FERS, disability retirement may occur at any age with 18 months of service. In the first year of retirement, disability benefits are generally 60 percent of the average of the highest three consecutive years of salary, minus the employee’s Social Security disability benefits. Subsequently, disabled employees receive 40 percent of their high-three average yearly salary, minus 60 percent of their Social Security disability benefit, until recomputation at age 62.
D. Death Benefits Under the CSRS, the spouses of employees who die in service receive 55 percent of the retirement benefits the employee would have received had they retired on disability. The spouses of deceased annuitants receive 55 percent of the annuity, unless a survivor benefit was waived or a less than full survivor benefit was elected. Children receive a flat monthly benefit amount.
Under the FERS, the spouses of employees who die in service after at least 18 months of service receive one-half of the annual rate of pay at death, or one-half of the average of the highest three consecutive years of salary as of the date of death, whichever is higher, plus a lump-sum payment adjusted annually for COLAs (cost-of-living allowances) under CSRS rules. If the employee had at least 10 years of service, the surviving spouse also receives an annuity equaling 50 percent of the accrued basic retirement benefit. The spouses of deceased annuitants receive 50 percent of the annuity, unless a survivor benefit was waived or a less than full survivor benefit was elected. Children receive a flat monthly benefit amount, minus the amount of Social Security benefits payable to them. Annuity benefits for children end when the child reaches age 18, marries, or dies. Benefits for student children, stop at the end of the month before the one in which the student child: turns 22; marries; dies; stops attending school; transfers to a school that is not recognized; changes to less than full-time attendance; enters military service or a Government service academy; or fails to submit certification of full-time school attendance.
NOTE 2 - SUMMARY OF SIGNIFICANT ACCOUNTING POLICIES
A. Reporting Entity The accompanying financial statements include all Fund financial activities for which OPM has fiduciary responsibility. These comprise the CSRS and the defined benefit portion of the FERS. The financial activities related to the Social Security and thrift savings plan provisions of the FERS are not activities of the Fund, are not administered by OPM and are, therefore, not included in the accompanying financial statements.
B. Basis of Accounting The accompanying financial statements are prepared on the accrual basis of accounting.
C. Use of Estimates As part of the process of preparing financial statements, management is required to make estimates and assumptions that affect the reported amounts of assets and liabilities and changes therein, disclosure of contingent assets and liabilities, and the actuarial present value of accumulated plan benefits at the date of the financial statements. Actual results could differ from those estimates.

- 13 -
D. Investment Valuation and Income Recognition All Fund investments are in interest-bearing U.S. Treasury securities guaranteed as to principal and interest. Throughout the year, monies are invested initially in Certificates of Indebtedness (“Certificates”), which are issued at par value and mature on the following June 30. The Certificates are routinely redeemed at face value to pay for authorized expenditures. Each June 30, the outstanding Certificates are “rolled over” into government account series (GAS) securities that are issued to the Fund at par-value, with maturities spread over a 15-year period and a yield equaling the average of all marketable U.S. Treasury securities with four or more years to maturity. The Fund also carries, but does not routinely invest in, securities issued by the Federal Financing Bank (FFB) as well as marketable Treasury bonds. As of September 30, 2016 and September 30, 2015, there were no Treasury bonds among the Fund’s investments. The invested assets of the CSRS and FERS (and related interest income) represent allocations from the Fund’s invested assets, based upon the proportionate investment contribution balance of each Plan.
The fair value of the GAS securities, Certificates, and FFB securities is equal to their par values. The fair value of the marketable Treasury bonds, as well as their appreciation and depreciation, is based on quoted market prices. Purchases and sales of securities are recorded on a trade-date basis. Interest income is recorded on the accrual basis.
E. Actuarial Present Value of Accumulated Plan Benefits Accumulated plan benefits are those future periodic payments (including lump-sum distributions) that are attributable under the Plans’ provision to services that employees have rendered. Accumulated plan benefits include benefits expected to be paid to (a) retired or terminated employees or their beneficiaries; (b) beneficiaries of employees who have died; and (c) present employees or their beneficiaries. Benefits under the Plans are based on employee service and compensation. The accumulated plan benefits for active employees are based on compensation as of the valuation date. Benefits payable under all circumstances -- retirement, death, disability, and termination of employment -- are included to the extent they are deemed attributable to employee service rendered to the valuation date.
The Actuarial Present Value of Accumulated Plan Benefits is determined by an actuary employed by OPM and is the amount that results from applying actuarial assumptions to adjust the accumulated plan benefits to reflect the time value of money (through discounts for interest) and the probability of payment (by means of decrements such as for death, disability, withdrawal, or retirement) between the valuation date and the expected date of payment. The Actuarial Present Value of Accumulated Plan Benefits is measured as of the first day of the fiscal year.
The significant demographic assumptions used in the valuation are mortality rates of participants and retirement age assumptions. All demographic rates are based on recent experience under the CSRS and FERS.
The following table presents the significant economic assumptions used to compute the Actuarial Present Value of Accumulated Plan Benefits for 2016 and 2015:
Economic Assumptions: 2016 2015
Interest rate (%) 5.25 5.25
Rate of inflation (%) 3.00 3.00
The foregoing actuarial assumptions are based on the presumption that the Plans will continue. Were the Plans to terminate, different actuarial assumptions and other factors might be applicable in determining the Actuarial Present Value of Accumulated Plan Benefits.
F. Payment of Benefits Benefit payments to participants are recorded upon distribution.

- 14 -
G. Risks and Uncertainties Contributions to the Plan and the actuarial present value of accumulated plan benefits are based on certain assumptions pertaining to interest rates, inflation rates, employee compensation and demographics. Due to the uncertainties inherent in the estimation process, it is reasonable that changes in these assumptions in the near term could have a material effect on the financial statements.
NOTE 3 - CASH Cash represents the amount on deposit with the U.S. Treasury that is immediately available to the Fund for the payment of benefits and other expenses. There are no restrictions or pledges over cash.
NOTE 4 - FUNDING POLICY
A. CSRS
Employer and Employee Contributions. As a condition of participation in the CSRS, participating employees are required to contribute a percentage of their pay to the Fund.
For fiscal years 2016 and 2015, the employee contribution rate was 7.0 percent of pay. Participating law enforcement officers, firefighters, congressional employees, and Members of Congress contributed a higher percentage.
Employing agencies contributed a higher percentage for law enforcement officers, firefighters, congressional employees, and Members of Congress.
Special Contribution. The combined 14.0 percent of pay does not cover the service cost of a CSRS benefit. To lessen the shortfall, the Fund receives an annual contribution from the U.S. Treasury that includes amounts that (a) amortize, over a 30-year period, increases in the actuarial present value of accumulated plan benefits resulting from new or liberalized benefits, increases in pay, or extension of coverage to new employee groups; (b) pays 5.0 percent interest on the unfunded portion of the actuarial present value of the static actuarial liability; and (c) reimburses the Fund for the cost of benefits attributable to military service credit and certain survivor annuities.
B. FERS Employer and Employee Contributions. As a condition of participation in the FERS, participating employees are required to contribute a percentage of their pay to the Fund. FERS employee contributions are a percentage of pay that is equal to the difference between the contribution rate for CSRS participants (as set forth above, 7.0 percent) and the Old Age, Survivors, and Disability Insurance (OASDI) rate, currently 6.2 percent of pay. Thus, the contribution rate for most of the FERS participants in fiscal years 2016 and 2015 is 0.8 percent of pay. Participating law enforcement officers, firefighters, congressional employees, and Members of Congress contributed a higher percentage.
Employing agencies must also make contributions to the Fund on behalf of their participating employees. The employer contribution rate is equal to the FERS service cost, less the participant contribution rate (13.2% during FY 2015 and 13.7% during FY 2016 for most participants).
The Middle Class Tax Relief and Job Creation Act of 2012, P.L. 112-96, Section 5001 - Federal Employees Retirement, increased by 2.3 percent the employee pension contribution for Federal employees entering service during calendar year 2013. The participant contribution rate for these FERS-Revised Annuity Employees (FERS-RAE) is 3.1 percent of pay and the employer contribution rate is 11.1% during FY 2015 and 11.9% during FY 2016.
The Bipartisan Budget Act of 2013 (P.L. 113-67), includes further revisions to contribution rates required for FERS-Further Revised Annuity Employees (FERS-FRAE), first hired after December 31, 2013. FERS-FRAE provides for an additional 1.3 percent increase to employee contribution rates. The FERS-FRAE agency contributions for non-Postal employing agencies are generally held at the same rate as for FERS-RAE; P.L. 113-67 requires that FERS-FRAE contributions in excess of the normal cost be used to address the unfunded actuarial liability for CSRS.

- 15 -
NOTE 5 - INVESTMENTS The following table presents the estimated fair value of Fund investments at September 30, 2016 and 2015 (in millions):
CSRS 2016
FERS 2016
Total 2016
Total 2015
GAS Securities:
5.125% due 2021 $18,776 $25,929 $44,705 $44,705
5.000% due 2022 19,058 26,317 45,375 45,375
4.000% due 2023 19,828 27,381 47,209 47,209
2.875% due 2024 21,712 29,983 51,695 51,695
1.750% due 2028 19,868 27,437 47,305 53,946
2.250% due 2029 23,106 31,909 55,015
2.000% due 2030 23,563 32,540 56,103 1.875% due 2031 24,143 33,340 57,483
Other GAS Securities 117,361 351,886 469,247 476,022
Total GAS Securities 287,415 586,722 874,137 718,952
Other Securities 8,876 4,148 13,024 12,315
Total Investments $296,291 $ 590,870 $ 887,161 $ 731,267
Debt Issuance Suspension Period (DISP). During the DISP, which began on May 16, 2015 and was extended to November 2, 2015, the U.S. Treasury took extraordinary measures to avoid exceeding the statutory debt limit. Treasury fully restored the federal fund accounts to the condition they would have been in had there not been a debt issuance suspension period. Section 8348 of Title 5, U.S. Code, authorizes the Secretary of the Treasury to suspend additional investment of Treasury securities in the Civil Service Retirement and Disability Fund (CSRDF) if such additional investment could not be made without causing the public debt of the United States to exceed the public debt limit. In addition, the Secretary may sell or redeem securities, obligations, and other invested assets of the CSRDF before maturity in order to prevent the public debt from exceeding the public debt limit.
NOTE 6 - PLAN TERMINATION Since the Plans have been established by an act of Congress, they cannot be terminated unless legislation should be enacted to do so. As there is no anticipation that such legislation will be introduced, the Plans are expected to continue indefinitely.
NOTE 7 - CONTINGENCIES Certain claims, lawsuits, and complaints have been filed against the Fund. It is the opinion of the administrator and OPM’s General Counsel that the resolution of these matters would not materially affect the financial position or the results of operations of the Fund.
NOTE 8 - TAX STATUS The Fund is not subject to income taxes by Federal statute.

- 16 -
Actuarial Section

- 17 -
Civil Service Retirement & Disability Fund General Information Report for the Fiscal Year ended September 30, 2016
1. Name of plan:
The Civil Service Retirement and Disability Fund, consisting of two components: Civil Service Retirement System (CSRS) and Federal Employees’ Retirement System (FERS).
2. Name and address of plan sponsor:
U.S. Office of Personnel Management 1900 E Street, NW Washington, DC 20415-0001
3. Type of plan entity:
Single-employer plan.
4. Date plans were established:
CSRS was established on May 22, 1920; FERS, on June 6, 1986.
5. Plan participants at beginning of fiscal year (9/30/2015):
Participants CSRS FERS Total
Active employees* 159,000 2,529,000 2,688,000 Separated employees entitled to deferred benefits 5,000 50,000 55,000 Annuitants:
Retirees 1,435,000 647,000 2,082,000 Survivors 495,000 59,000 554,000
Total annuitants 1,930,000 706,000 2,636,000
6. Type of plan:
Defined benefit. FERS also has a defined contribution component (the Thrift Savings Plan), which is not part of the Civil Service Retirement and Disability Fund.
7. Administrative costs:
Administrative costs are borne by the Fund.
8. In this plan year, was the plan merged or consolidated into another plan or were assets or liabilities transferred to another plan?
No.
9. Funding arrangement:
Trust Fund.
10. Date of most recent actuarial valuation:
September 30, 2015
* Number of employees determined on a full-time equivalent basis, includes those employees on leave without pay who retain coverage. See Table 6 for additional detail.

- 18 -
11. Actuarial cost method:
Actuarial valuations are performed using an aggregate entry-age normal cost method.
The CSRS Board of Actuaries, established by 5 U.S.C. 8347(f), provides recommendations regarding methods and assumptions. For the fiscal year ended September 30, 2016, the members of the Board are:
Thomas S. Terry, Chair Edwin C. Hustead R. Evan Inglis
12. Actuarial assumptions:
A. Economic:
1. Rate of return on Plan investments: 5.25 percent.
2. Rate of general salary increase: 3.25 percent, plus individual merit increases based on Plan experience.
3. Inflation rate: 3.00 percent. Assumed FERS annuitant COLA: 2.40 percent
B. Decrements (See Table 7 for additional detail):
1. Basis of mortality assumptions: Plan experience
2. Normal Retirement age*:
a. CSRS: 55 with 30 years of service 60 with 20 years of service 62 with 5 years of service
b. FERS: 56 with 30 years of service (will transition to age 57) 60 with 20 years of service 62 with 5 years of service
3. Basis of withdrawal assumptions: Plan experience.
4. Basis of disability assumption: Plan experience.
13. Major Plan Provisions:
See Table 8.
* Certain special groups may retire at younger ages.

- 19 -
Actuarial Valuation of the Civil Service Retirement and Disability Fund
Since the Civil Service Retirement and Disability Fund (CSRDF) is available to pay both the Civil Service Retirement System (CSRS) and the Federal Employees’ Retirement System (FERS) benefits, it comprises a single retirement plan, even though there are two different benefit tiers and funding methods, and the activities associated with each tier are accounted for separately. The results of the actuarial valuation for plan participants as of September 30, 2015 are shown for CSRS and FERS on a combined basis in Table 1. Table 1B shows the projected future cash flows associated with these participants. Table 2 shows the total combined cash flows for the CSRDF as a whole assuming future new entrants into FERS; Table 3 and Table 4 show these past and future projected cash flows separately for FERS and CSRS.
Employee and Annuitant Population
Essentially, employees who have been hired since December 31, 1983, are covered under FERS. Those CSRS employees not automatically transferred to FERS were given an opportunity to elect FERS during an open enrollment period from July 1, 1987, through December 31, 1987, and during a second open enrollment period from July 1, 1998 through December 31, 1998.
The actuarial valuation of the CSRDF is based on the employee and annuitant populations as of September 30, 2015. There were a total of 2,688,000 employees as of this date, determined on a full-time equivalent basis, including 2,529,000 covered under FERS. The balance of 159,000 employees is covered under CSRS.
On a full-time equivalent basis, the active employee population as of September 30, 2015 is as follows:
CSRS-Offset: 24,000 CSRS: 135,000 CSRS Total: 159,000
FERS-Elect: 16,000 FERS: 2,182,000 FERS-RAE: 98,000 FERS-FRAE: 233,000 FERS Total: 2,529,000
CSRS+FERS Total: 2,688,000
The inactive population as of September 30, 2015, consists of: 2,082,000 retired employees (1,873,000 non-disability retirees, average age 72; and 209,000 disability retirees, average age 65); 459,000 spouse survivors of annuitants; 77,000 spouse survivors of employees; 18,000 child survivors; and 55,000 separated employees entitled to deferred benefits.
The population of active employees is based on data from OPM’s Enterprise Human Resources Integration (EHRI) Statistical Data Mart and from the United States Postal Service. These sources provide demographic information for most employee participants in CSRS and FERS but do not contain records for some participants (e.g. Legislative and Judicial branch employees, security sensitive employees of Executive branch agencies). The population data is controlled to accounting records of employee withholdings and agency contributions in order to represent the complete full-time equivalent population of CSRS and FERS active employee participants.
There is no census data for separated employees entitled to a deferred annuity. This population is constructed at the time the demographic data is developed based on information about recent ascensions of new deferred annuitants. The assumed population of separated employees has been projected to the valuation date according to the employee demographic rate assumptions as applied to the prior populations.
The data for annuitants as of the beginning of the year (September 30, 2015) is obtained from the OPM annuity roll. In order to capture annuitants in special pay status as of the beginning of the fiscal year (i.e. individuals who recently became annuitants for whom the retirement claim is still being processed), the population data is obtained from the annuity roll in March during the fiscal year. A small adjustment is made to the data to account for annuitants retired as of the beginning of the year but still in special pay status in March.

- 20 -
Economic and Demographic Assumptions
The actuarial valuation presented in Table 1 is based on “dynamic” economic assumptions that explicitly take into account expected future inflation and general salary increases.
On July 13, 2012, the Board of Actuaries recommended adoption of the following long term economic assumptions:
3.00 percent inflation rate; 2.40 percent rate of FERS annuitant cost-of-living adjustments; 3.25 percent rate of general salary increase; and 5.25 percent interest rate
These economic assumptions are selected to be used primarily for funding purposes and for the long term projections of the system reflected in this report. In recommending the assumed rates the Board considers long term history as well as the recent and anticipated future economic environment. The inflation assumption was selected in consideration of long term inflation history, the recent period of sustained low inflation and potential future inflationary pressure including that created by the federal budgetary environment. The assumed rate of FERS annuitant cost-of-living adjustments (COLAs) is 80 percent of the assumed inflation rate, which was based on the application of the FERS COLA formula to observed long term inflation history. The general salary increase rate was selected in consideration of the long term history of real federal general salary increases relative to inflation, recent federal salary increase trends and the expected impact of the future federal budgetary environment. The interest rate assumption represents a long term expected rate of return, encompassing returns on future investments as well as returns on the current investment schedule of plan assets. The assumption was selected in consideration of historical real rates of return relative to inflation, current rates of return, the composition of CSRDF investments and the expected sensitivity of future Treasury rates to future global market forces and federal budgetary factors. The interest rate assumption is developed in recognition that plan assets are valued at par for determining the unfunded actuarial liabilities. At the assumed valuation interest rate, discounting the scheduled principal and coupon payments of invested plan assets would currently produce a present value that is less than par value. However, the Board would expect to revisit the selection of the interest rate assumption were the asset valuation method revised from valuation at par.
At its meeting on July 13, 2012, the Board of Actuaries recommended the adoption of long term demographic assumptions based on the results of an experience study conducted by OPM. The Board of Actuaries recommended certain revisions to the demographic assumptions at its meeting on June 18, 2013. The demographic assumptions are generally based on actual experience under the plan averaged over the most recent ten years. The choice of the 10-year experience period reflects a balance between using the most recently available data to best represent current expected behavior within the system, and sufficient exposure to historical data in order to soften the effects of any short term fluctuations.
CSRS is a closed population so certain CSRS assumptions are based on earlier experience. Rates of retirement for longer service FERS employees are estimated due to lack of observed historical experience. Rates of early and involuntary retirement are based on a 20-year experience period, assumed to be more representative of long term expectations than the historically low experience observed during the most recent 10-year period. Assumed refund rates for FERS employees terminating with 20 or more years of service are based on the most recent 10 year experience; rates for FERS employees terminating with less than 20 years of service were developed to produce new deferred annuity amounts approximating recent averages.
Mortality rates incorporate projected generational mortality improvement for employees, survivors and non-disabled retirees. An ultimate 1.0 percent annual rate of mortality improvement (less than 1.0 percent above age 90) is assumed beginning in fiscal year 2020. Assumed mortality improvement prior to 2020 grades linearly from experience-based improvement factors, which are given 100 percent weight in FY 2010, to the ultimate rate of 1.0 percent that is given 100 percent weight in 2020 and beyond. The Aggregate Entry Age Normal Cost Percentages are determined using an assumed new entrant distribution. The assumed Survivor and Non-Disabled Annuitant mortality rates for the normal cost percentage calculation are the rates projected

- 21 -
to year 2031 for the CSRS Normal Cost Percentage, 2044 for FERS, 2056 for FERS-RAE and 2056 for FERS-FRAE. The assumed employee mortality rates for calculation of the normal cost percentage are those projected to year 2014 for CSRS and FERS, and year 2024 for FERS-RAE and FERS-FRAE.
Employee and employing agency contributions are paid for employees in active pay status. The assumed percentage of payroll on leave without pay for which no contributions are paid is 2.6%. Administrative expenses are assumed to equal 0.27% of benefits.
The demographic rates are displayed in Table 7.
The economic and demographic assumptions recommended for adoption at the July 13, 2012 meeting of the Board of Actuaries, with revisions recommended at the June 18, 2013 Board meeting, were first effective for the September 30, 2012 actuarial valuation. At its meeting on July 8, 2016, the Board recommended use of these assumptions for the current valuation.
Dynamic Normal Cost
The dynamic normal cost is the level percentage of pay which would have to be contributed for a typical group of new employees over their entire working careers in order to fully finance, with interest, all of their retirement benefits, based on dynamic economic assumptions. FERS is funded under a dynamic entry age normal funding method as prescribed in Chapter 84 of Title 5, United States Code, and employees and agencies together contribute the full amount of the dynamic normal cost.
Under FERS, the dynamic normal cost is 14.5 percent of pay for regular employees, as determined according to the actuarial assumptions used for this valuation. The dynamic normal cost for CSRS regular employees is 29.3 percent of pay. However, CSRS is financed under a statutory funding method that does not directly take into account the cost of benefit increases that are due to expected future inflation. Employees and non-Postal agencies each contribute 7.0 percent of pay for CSRS.
If all agencies including the Postal Service were to contribute the full dynamic normal cost for CSRS, less employee contributions, agency contributions for CSRS employees would have totaled approximately $3.3 billion in Fiscal Year 2015. This assumes dynamic normal cost percentages determined under the assumptions that were in effect at the time of determination of the FERS agency contribution rates in effect for FY 2015.
Unfunded Actuarial Liability
The unfunded actuarial liability is a projection of the amount which, if deposited in the Fund, would fully finance the total cost of the CSRS and FERS retirement benefits for the current, closed group of employees and annuitants, assuming that the full normal cost is contributed over the balance of the employees’ working careers. As of September 30, 2015, the unfunded actuarial liability amounted to $789.6 billion. It represents the difference between the par value of net assets on September 30, 2015, $873.3 billion, and that which would theoretically be the Fund’s net assets had the full normal cost been contributed over the entire working careers of all current employees and annuitants.
In Table 1, the unfunded actuarial liability is expressed as:
(1) the actuarial present value of future benefits; less (2) the present value of future normal cost contributions; less (3) the net assets in the fund.
The actuarial present value of future benefits is the value of plan benefits that are expected to be paid in the future to current employees and annuitants stated in today’s dollars, i.e., future amounts discounted for the time value of money. It assumes that current employees will continue to earn benefits over their expected future working lives, that their salaries will increase by the assumed salary increases and that annuities will rise based on the assumed Cost of Living Allowances (COLAs).
The present value of future normal costs is the value, in today’s dollars, of the future normal cost contributions to be made over the expected future working lifetimes of all current employees. In Table 1, the present value of

- 22 -
future normal cost contributions is determined separately for CSRS and FERS. For CSRS, it is based on the CSRS dynamic normal cost which for most employees is 29.3 percent; and for FERS, it is based on the FERS normal cost which for most employees is 14.5 percent.
Different normal cost percentages apply to certain groups within CSRS and FERS with special retirement system provisions (e.g. Law enforcement). The additional actuarial liability attributable to enhanced retirement provisions for active employees as of September 30, 2015 amounted to $0.5 billion for CSRS and $30.9 billion for FERS.
Funding Provisions for CSRS
The CSRS has been financed under a statutory funding method passed by Congress in 1969. This funding method is based on the “static” economic assumptions of no future inflation, no future general schedule salary increases, and a 5.00 percent interest rate.
Separate CSRS funding provisions for the Postal Service were enacted under the Postal Civil Service Retirement System Funding Reform Act of 2003 (P. L. 108-18) and amended by the Postal Accountability and Enhancement Act of 2006 (P.L. 109-435). Under current law, the assets and liabilities of the Postal Service under CSRS are accounted for separately, retroactive to July 1, 1971, which was the date the Postal Service became independent.
Under P.L. 108-18, the Postal Service was liable for the cost of all benefits attributable to post-1971 service, including benefits attributable to military service, and it was required to contribute the full dynamic normal cost for CSRS, and to finance any unfunded liabilities. Under the 2006 amendments, the liability for military service benefits was transferred to the Treasury, and the Postal Service share of the CSRS assets was defined to include all Postal Service contributions since June 30, 1971, less benefits paid to current and former Postal employees that are attributable to post-1971 civilian service, accumulated with interest at the historical rates earned by the entire CSRS fund. Under these amendments, the assets attributable to the Postal Service as of September 30, 2006, exceeded its actuarial liabilities, and the Postal Service agency contributions which had been scheduled under P.L. 108-18 were cancelled starting September 30, 2006. The surplus as of September 30, 2006, which amounted to $17.1 billion, was transferred to a Postal Health Benefits Fund on June 30, 2007, to help finance Postal Service post-retirement health care benefits. Any future CSRS surplus in the Postal fund will be transferred to the Postal Service Retiree Health Benefits Fund as of September 30, 2025, 2035 or 2039. Beginning in 2017, the Postal Service also is required to amortize any additional unfunded actuarial liabilities which may arise. Postal CSRS employees continue to contribute 7.0 percent of pay.
Under the static funding method, the Postal Service had been making 30-year amortization payments to cover the cost of salary increases for Postal employees, and 15-year amortization payments for the cost of COLAs paid to Postal annuitants. These 15-year and 30-year Postal amortization payments were cancelled under P.L. 108-18 starting in fiscal year 2003.
Under CSRS, regular employees contribute 7.0 percent of pay. Law enforcement officers and firefighters, and Congressional employees contribute an extra 0.5 percent of pay, and Members of Congress an extra 1.0 percent of pay. Non-Postal agencies match the employee contributions.
Under the static funding method for CSRS, which remains in effect for non-Postal employees, the Treasury pays interest on any static unfunded liabilities for CSRS benefits attributable to civilian service that are not being financed by the Postal Service. The Treasury also makes payments to amortize, over a 30-year period, any increases in the static unfunded liability due to salary increases for non-Postal employees that occurred during the year. In addition the Treasury pays the cost of CSRS benefits attributable to military service for both Postal and non-Postal employees that were paid out during the year. In fiscal year 2007 the Treasury made a retroactive payment to cover military service benefits that previously had been attributed to the Postal Service for FY2003 through FY2006.
The static unfunded liability for non-Postal CSRS was $425.2 billion as of September 30, 2015, as determined under the most recently revised demographic assumptions and assuming an interest rate of 5.00 percent with no future inflation and no future general salary increases. Based on the statutory CSRS funding provisions, the Treasury made the following payments to the CSRDF on September 30, 2016:

- 23 -
Interest on Static Unfunded Liability (UL): $21.260 billion 30-year Amortization of Increases in Static UL: $ 8.494 billion Military Service Payment: $ 3.620 billion Other CSRS Funding Provisions: $ 0.058 billion
Funding Provisions for FERS
Under FERS, employees and agencies contribute the full dynamic normal cost. This normal cost is for the defined benefit plan only, and does not include the cost of Social Security or the Thrift Plan. Most FERS employees hired before January 1, 2013, contribute a percentage of salary that is equal to the contribution rate for CSRS employees, as set forth above, less the 6.2 percent tax rate applicable under the Old Age, Survivors and Disability Insurance (OASDI) portion of Social Security. Thus for these regular employees in FERS, the contribution rate is 0.8 percent of the employee’s total salary. Employees generally hired during calendar year 2013 who are subject to FERS-RAE contribute an additional 2.3 percent of salary above the CSRS rate. Employees generally hired after December 31, 2013, subject to FERS-FRAE contribute an additional 3.6 percent of salary above the CSRS rate. An extra 0.5 percent of pay is contributed by certain employees with enhanced benefit provisions (e.g. air traffic controllers, law enforcement officers and firefighters). Agencies contribute the normal cost of FERS, less the employee contributions. Non-Postal agencies are required to contribute above the normal cost for employees under FERS-FRAE, with the excess used to address the CSRS unfunded actuarial liability.
Under FERS, any supplemental liabilities are amortized over 30 years. The payments on the initial supplemental liability as of September 30, 1988, began on September 30, 1989. Each year thereafter, any change in the supplemental liability is amortized by means of a new series of 30-year payments. Increases in liabilities attributable to non-Postal employees are made by the Treasury. Any supplemental liabilities attributable to Postal employees are amortized by separate 30-year payments made by the Postal Service. In order to determine the value of FERS assets attributable to Postal employees, an account is maintained that is credited with net contributions for Postal employees with interest at the same rate as is earned by the entire FERS fund. A negative supplemental liability generates negative amortization payments. Negative payments are used only to offset any positive payments that have already been scheduled. If the net assets exceed the actuarial liability, all remaining amortization payments are cancelled. Apart from cancellation of any future amortization payments there is no provision in the law for disposition of any FERS surplus either for non-Postal or Postal participants; in this case the excess assets remain in the fund where they accrue interest and are available to offset potential future losses.
A Treasury payment for FERS of $3.232 billion was made on September 30, 2016. This amount included a new 30-year payment of $0.033 billion to amortize a supplemental liability of $0.5 billion as of September 30, 2015, for non-Postal FERS participants as determined according to the actuarial assumptions first recommended for adoption at the June 18, 2013 meeting of the Board of Actuaries.
A payment of $0.248 billion was due from the Postal Service to the CSRDF on September 30, 2016. This amount included a new 30-year payment of $0.007 billion to amortize a supplemental liability of $0.1 billion as of September 30, 2015, for Postal FERS participants as determined according to the actuarial assumptions first recommended for adoption at the June 18, 2013 meeting of the Board of Actuaries. As of the valuation date, payments of $0.007 billion due September 30, 2014, and $0.241 billion due September 30, 2015, remain unpaid to the CSRDF from the Postal Service.

- 24 -
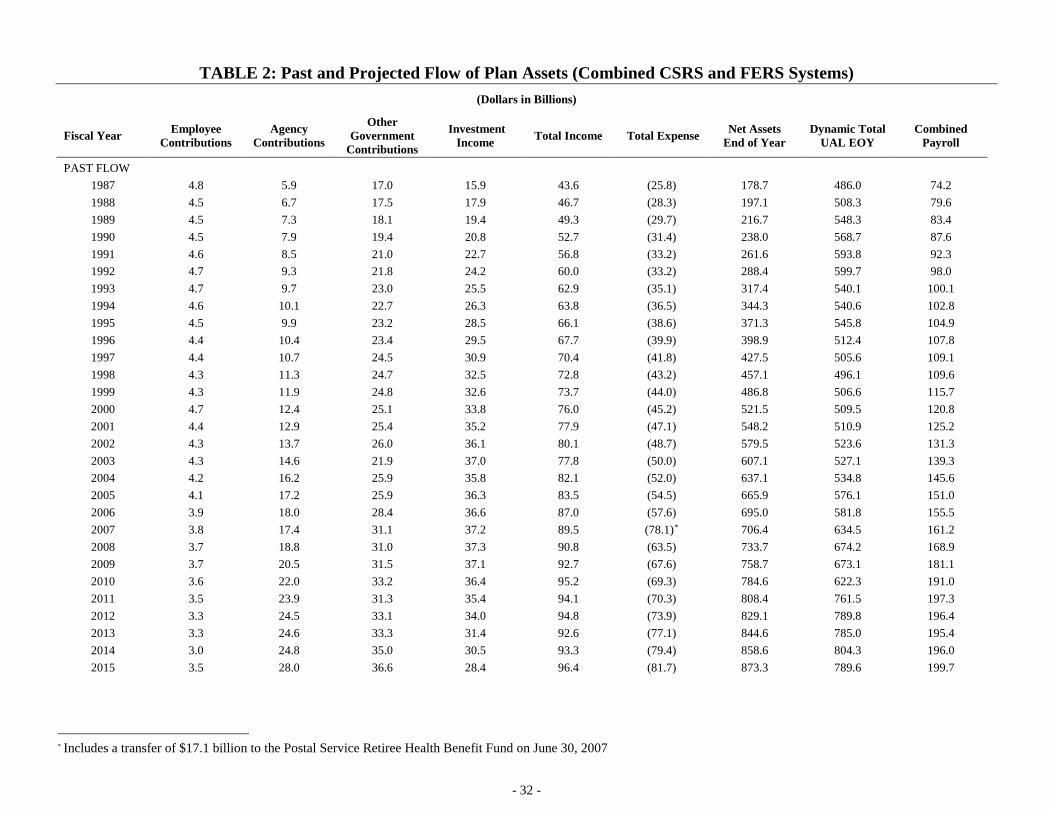
Projected Flow of Plan Assets
Tables 2 and 2A show a 75-year projection of the actual funding for the CSRDF under conditions of expected future inflation. A sufficient number of new employees are assumed to be hired each year so that the total employee population remains constant. Along with this consolidated projection for the entire CSRDF, there are also separate tables for the FERS population (Tables 3 and 3A) and CSRS population (Tables 4 and 4A).
The Projected Flow of plan assets calculated in Tables 2 and 3 for future years reflects the provisions for FERS Revised Annuity Employees (FERS-RAE) and FERS Further Revised Annuity Employees (FERS-FRAE). FERS-RAE, as established by the Middle Class Tax Relief and Job Creation Act of 2012 (P.L. 112-96), provides for increased employee contributions and lower agency contributions for employees first hired during calendar year 2013. P.L. 112-96 also requires that Congress Members and Congressional staff initially employed after December 31, 2012, will accrue FERS benefits according a regular, rather than enhanced, benefit formula. FERS-FRAE, as established by the Bipartisan Budget Act of 2013 (P.L. 113-67), provides an additional increase to employee contribution rates for employees first hired after December 31, 2013. The FERS-FRAE agency contributions for non-Postal employing agencies are generally held at the same rate as for FERS-RAE; P.L. 113-67 requires that FERS-FRAE contributions in excess of the normal cost be used to address the unfunded actuarial liability for CSRS. Excess agency contributions for FERS-FRAE expected to be allocated to CSRS are included in the projected Agency Contributions shown for FERS in Table 3 and in the projected transfer payments from FERS to CSRS shown in Tables 3 and 4. In this projection the excess agency contributions for FERS-FRAE cease in the year 2059.
The CSRS assets shown in Table 4 represent the combined Postal and non-Postal share. In this projection the CSRS assets attributable to non-Postal employees are depleted in the year 2022. Because the CSRS benefits continue to be paid from the assets of the CSRDF, the assets attributable to non-Postal FERS employees (as shown in Table 3) will be reduced each year by the amount that the non-Postal CSRS benefits exceed the non-Postal CSRS contributions. The Postal Service is required to make payments to amortize the dynamic actuarial liabilities for the Postal share of CSRS benefits, so the Postal share of CSRS assets is not projected to be depleted until all benefits to Postal annuitants have been paid. The total assets of the CSRDF as projected in Table 2, including both CSRS and FERS, are expected to continue to grow throughout the term of the projection under the existing statutory funding provisions.
These tables also include a projection of the dynamic unfunded actuarial liability (UAL) under CSRS and FERS. These actuarial liabilities are defined in the same manner as in Table 1 but they apply to future years. A projection of the total unfunded actuarial liability for CSRS and FERS combined is shown in Tables 2 and 2A. The projected future assets and unfunded actuarial liabilities when shown separately for FERS (Tables 3 and 3A) and CSRS (Tables 4 and 4A) are affected by projected future asset balance transfers from FERS to CSRS. When the non-Postal CSRS account is depleted, projected to occur in 2022, the resulting transfers from the FERS account to the CSRS account create supplemental liabilities for the non-Postal FERS account. These supplemental liabilities for non-Postal FERS must then be amortized by means of 30-year payments made by the Treasury. The projections in Tables 3 and 3A reflect increases in the FERS UAL for years 2022 and beyond, due to the use of assets in the FERS account for payment of CSRS benefits.

- 25 -
Opinion of the Enrolled Actuary Civil Service Retirement and Disability Fund
Actuarial Valuation of the Civil Service Retirement and Disability Fund as of September 30, 2015
The purpose of this report is to represent the actuarial valuation of the Civil Service Retirement and Disability Fund (CSRDF), which includes both the Civil Service Retirement System (CSRS) and the Federal Employees’ Retirement System (FERS), prepared according to the methodology and dynamic long term assumptions used for funding. The methodologies, assumptions and results may differ from those reflected in the actuarial liabilities reported in the U.S. Office of Personnel Management’s Annual Financial Statement.
This actuarial valuation incorporates the economic assumptions first recommended for adoption at the July 13, 2012 meeting of the Board of Actuaries. The long-term economic assumptions are: 3.00 percent inflation rate; 3.25 percent rate of general salary increase; and 5.25 percent rate of long-term interest. The demographic assumptions used for this actuarial valuation are those recommended for adoption at the July 13, 2012 meeting of the Board of Actuaries, as modified at the June 18, 2013 Board meeting. At its meeting on July 8, 2016, the Board of Actuaries recommended use of these assumptions for the actuarial valuation as of September 30, 2015. This report assumes a 1.3 percent general salary increase for 2016 based on the actual increase in the federal General Schedule salary tables. A 0.0 percent CSRS annuitant COLA and 0.0 percent FERS annuitant COLA are assumed in year 2016 based on the actual COLAs received.
The populations used for this actuarial valuation include employees hired during calendar year 2013 according to the FERS “Revised Annuity Employee” provisions of the Middle Class Tax Relief and Job Creation Act of 2012; and employees generally hired after calendar year 2013 according to the FERS “Further Revised Annuity Employee” provisions of the Bipartisan Budget Act of 2013.
This statement has been prepared in accordance with generally accepted principles and practices of the Actuarial Standards Board and to the best of my knowledge fairly reflects the results of the actuarial valuation. In preparing this statement I have relied upon the financial information provided by OPM’s Office of the Chief Financial Officer, and upon population data provided by OPM’s Office of Retirement Services, Chief Information Office and Data Analysis Group, and have reviewed the contributions of other OPM actuaries.
In my opinion, the actuarial methods and assumptions used in preparation of this report are reasonable in the aggregate and reflect a fair estimate of anticipated experience under the plan, both the CSRS and the FERS, based on provisions of the plan in effect at the beginning of fiscal year 2016. Future actuarial reports may reflect different results due to such factors as: actual experience that has differed from assumptions, future revisions to actuarial assumptions, and future changes to plan provisions. To the best of my knowledge, the report is complete and accurate.
By:
Gregory Kissel Enrolled Actuary # 14-6967 U.S. Office of Personnel Management 1900 E Street, NW Washington, D.C. 20415-3000 (202) 606-0722 Email: [email protected]

- 26 -
Table 1A Actuarial Status Information as of Beginning of Plan Year
(Dollars in Billions)
Unfunded Actuarial Accrued Liability – September 30, 2015
CSRS FERS Total
1. Actuarial Present Value of Future Benefits & Expenses
(a) Annuitants on roll $920.5 $177.1 $1,097.6
(b) Separated Employees 1.4 4.2 5.6
(c) Active Employees 150.8 808.9 959.7
Total 1,072.7 990.2 2,062.9
2. Less: Present Value of Future Normal Costs: 16.3 383.7 400.0
3. Actuarial Accrued Liability 1,056.4 606.5 1,662.9
4. Assets (at Par Value) 316.8 556.5 873.3
5. Unfunded Actuarial Liability1 $739.6 $50.0 $789.6
Normal Cost as a Percentage of Covered Payroll2: CSRS FERS FERS-RAE FERS-FRAE Employee 7.0% 0.8% 3.1% 4.4% Employing Agency 7.0% 13.7% 11.9% 11.9% Other/(Excess) 15.3%3 0.0% 0.0% (1.2%)4 Total Normal Cost % 29.3% 14.5% 15.0% 15.1%
1 A portion of the CSRS unfunded actuarial liability will be met with transfers from FERS assets; see Technical notes. 2 Different rates are applicable for special groups; see Technical Notes. 3 The combined employee and agency contribution for CSRS is generally less than the full dynamic normal cost percentage. 4 Non-Postal agencies are required to contribute at the RAE rate for FRAE; contributions in excess of the normal cost percentage are transferred to the CSRS account.

- 27 -
Table 1A Technical Notes The date of the actuarial valuation is the beginning of the fiscal year (i.e. the end of the previous fiscal year). Thus, the actuarial liabilities reported for fiscal year 2016 are determined as of September 30, 2015. The valuation of the CSRDF as of September 30, 2015, is based on the employee and annuitant populations as of that date.
The present values of future benefits and normal costs as of September 30, 2015, are based on long term economic assumptions recommended for adoption at the July 13, 2012 meeting of the Board of Actuaries, and on demographic assumptions recommended for adoption on July 13, 2012 and modified at the June 18, 2013 meeting of the Board of Actuaries. The long term economic assumptions are 3.00 percent inflation; 2.40 percent FERS annuitant Cost of Living Adjustment (COLA), 3.25 percent annual general salary increases, and 5.25 percent interest. A general salary increase of 1.3 percent is assumed in year 2016 to match the actual increase in federal General Schedule pay tables. A 0.0 percent CSRS annuitant COLA and 0.0 percent FERS annuitant COLA are assumed in year 2016 based on the actual COLAs received. There were no changes to long term economic assumptions or demographic assumptions from those used for the prior year’s actuarial valuation.
The CSRS normal cost is defined as the level percentage of pay necessary to fully fund all retirement benefits for a typical group of new Federal employees who are assumed to be covered under CSRS, even though all new Federal employees are now actually covered under FERS. For FERS, future agency contributions are assumed to equal the full normal cost less the employee contribution. For regular FERS employees the agency contribution equals the full normal cost of 14.5 percent less the 0.8 percent employee contribution, or a total of 13.7 percent of pay. For regular FERS-RAE the agency contribution equals the full normal cost of 15.0 percent less the 3.1 percent employee contribution, or a total of 11.9 percent of pay. The employee contribution for FERS-FRAE is 1.3 percent greater than for FERS-RAE; for regular FERS-FRAE the employee contribution rate is 4.4 percent. By statute, the non-Postal agency contribution rate for FERS-FRAE equals the agency contribution rate for FERS-RAE. Thus the combined agency and employee contribution for non-Postal FERS-FRAE exceeds the FERS-FRAE normal cost. For the Postal Service, the regular FERS-FRAE the agency contribution for regular FERS-FRAE equals the full normal cost of 15.1 percent less the 4.4 percent employee contribution, or a total of 10.7 percent of pay.
The September 30, 2015, unfunded actuarial liability of $739.6 billion shown for CSRS in Table 1 consists of an unfunded actuarial liability of $722.9 billion for the non-Postal CSRS account and an unfunded actuarial liability of $16.7 billion for the Postal CSRS account. The Table 1 September 30, 2015, unfunded actuarial liability of $50.0 billion for FERS consists of an unfunded actuarial liability of $46.1 billion for the non-Postal FERS account and an unfunded actuarial liability of $3.9 billion for the Postal FERS account. In addition to employee contributions and employing agency contributions, funding payments to the CSRDF from the Treasury for fiscal year 2016 totaled approximately $33.4 billion for CSRS and approximately $3.2 billion for FERS. Funding payments of approximately $0.2 billion were due from the Postal Service for FERS for fiscal year 2016.
Supplemental liabilities under FERS are amortized by 30-year payments to be made by the Treasury for non-Postal employees, and by the Postal Service for Postal employees. The supplemental liability is determined by subtracting the present value of any remaining 30-year payments that have already been scheduled from the amount of the unfunded actuarial liability. The CSRS unfunded actuarial liability will be met with future payments made by the Treasury and by the Postal Service as required under CSRS statute, excess contributions required for FERS-FRAE from non-Postal employing agencies, plus transfers from the non-Postal FERS account to the non-Postal CSRS account. The transfers create supplemental liabilities for the non-Postal FERS account, which are then amortized by means of thirty-year payments made by the Treasury to the FERS account. The present values of projected future funding components are shown in Table 1D.
- 28 -
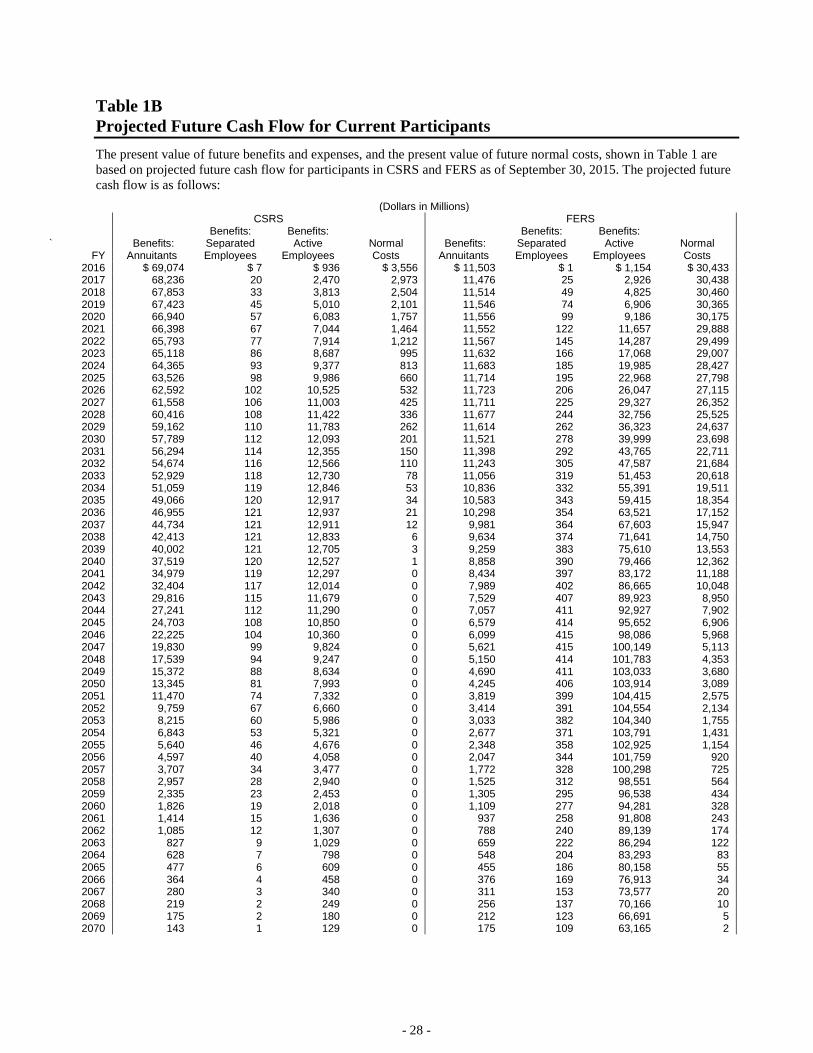
Table 1B Projected Future Cash Flow for Current Participants The present value of future benefits and expenses, and the present value of future normal costs, shown in Table 1 are based on projected future cash flow for participants in CSRS and FERS as of September 30, 2015. The projected future cash flow is as follows:
(Dollars in Millions)
CSRS FERS
Benefits: Benefits: Benefits: Benefits: ` Benefits: Separated Active Normal Benefits: Separated Active Normal
FY Annuitants Employees Employees Costs Annuitants Employees Employees Costs 2016 $ 69,074 $ 7 $ 936 $ 3,556 $ 11,503 $ 1 $ 1,154 $ 30,433 2017 68,236 20 2,470 2,973 11,476 25 2,926 30,438 2018 67,853 33 3,813 2,504 11,514 49 4,825 30,460 2019 67,423 45 5,010 2,101 11,546 74 6,906 30,365 2020 66,940 57 6,083 1,757 11,556 99 9,186 30,175 2021 66,398 67 7,044 1,464 11,552 122 11,657 29,888 2022 65,793 77 7,914 1,212 11,567 145 14,287 29,499 2023 65,118 86 8,687 995 11,632 166 17,068 29,007 2024 64,365 93 9,377 813 11,683 185 19,985 28,427 2025 63,526 98 9,986 660 11,714 195 22,968 27,798 2026 62,592 102 10,525 532 11,723 206 26,047 27,115 2027 61,558 106 11,003 425 11,711 225 29,327 26,352 2028 60,416 108 11,422 336 11,677 244 32,756 25,525 2029 59,162 110 11,783 262 11,614 262 36,323 24,637 2030 57,789 112 12,093 201 11,521 278 39,999 23,698 2031 56,294 114 12,355 150 11,398 292 43,765 22,711 2032 54,674 116 12,566 110 11,243 305 47,587 21,684 2033 52,929 118 12,730 78 11,056 319 51,453 20,618 2034 51,059 119 12,846 53 10,836 332 55,391 19,511 2035 49,066 120 12,917 34 10,583 343 59,415 18,354 2036 46,955 121 12,937 21 10,298 354 63,521 17,152 2037 44,734 121 12,911 12 9,981 364 67,603 15,947 2038 42,413 121 12,833 6 9,634 374 71,641 14,750 2039 40,002 121 12,705 3 9,259 383 75,610 13,553 2040 37,519 120 12,527 1 8,858 390 79,466 12,362 2041 34,979 119 12,297 0 8,434 397 83,172 11,188 2042 32,404 117 12,014 0 7,989 402 86,665 10,048 2043 29,816 115 11,679 0 7,529 407 89,923 8,950 2044 27,241 112 11,290 0 7,057 411 92,927 7,902 2045 24,703 108 10,850 0 6,579 414 95,652 6,906 2046 22,225 104 10,360 0 6,099 415 98,086 5,968 2047 19,830 99 9,824 0 5,621 415 100,149 5,113 2048 17,539 94 9,247 0 5,150 414 101,783 4,353 2049 15,372 88 8,634 0 4,690 411 103,033 3,680 2050 13,345 81 7,993 0 4,245 406 103,914 3,089 2051 11,470 74 7,332 0 3,819 399 104,415 2,575 2052 9,759 67 6,660 0 3,414 391 104,554 2,134 2053 8,215 60 5,986 0 3,033 382 104,340 1,755 2054 6,843 53 5,321 0 2,677 371 103,791 1,431 2055 5,640 46 4,676 0 2,348 358 102,925 1,154 2056 4,597 40 4,058 0 2,047 344 101,759 920 2057 3,707 34 3,477 0 1,772 328 100,298 725 2058 2,957 28 2,940 0 1,525 312 98,551 564 2059 2,335 23 2,453 0 1,305 295 96,538 434 2060 1,826 19 2,018 0 1,109 277 94,281 328 2061 1,414 15 1,636 0 937 258 91,808 243 2062 1,085 12 1,307 0 788 240 89,139 174 2063 827 9 1,029 0 659 222 86,294 122 2064 628 7 798 0 548 204 83,293 83 2065 477 6 609 0 455 186 80,158 55 2066 364 4 458 0 376 169 76,913 34 2067 280 3 340 0 311 153 73,577 20 2068 219 2 249 0 256 137 70,166 10 2069 175 2 180 0 212 123 66,691 5 2070 143 1 129 0 175 109 63,165 2

- 29 -
Table 1B Projected Future Cash Flow for Current Participants (Continued)
(Dollars in Millions)
CSRS FERS
Benefits: Benefits: Benefits: Benefits: ` Benefits: Separated Active Normal Benefits: Separated Active Normal
FY Annuitants Employees Employees Costs Annuitants Employees Employees Costs
2071 $ 121 $ 1 $ 91 $ 0 $ 146 $ 97 $ 59,602 $ 1 2072 105 1 64 0 122 85 56,015 0 2073 93 1 46 0 102 75 52,415 0 2074 85 1 33 0 87 65 48,814 0 2075 79 0 24 0 74 56 45,227 0 2076 75 0 18 0 64 49 41,672 0 2077 71 0 14 0 56 42 38,166 0 2078 68 0 12 0 49 36 34,732 0 2079 65 0 11 0 44 30 31,389 0 2080 61 0 11 0 39 26 28,161 0 2081 58 0 10 0 35 22 25,069 0 2082 55 0 10 0 32 18 22,136 0 2083 52 0 10 0 30 15 19,380 0 2084 49 0 9 0 27 13 16,814 0 2085 46 0 9 0 25 11 14,453 0 2086 43 0 9 0 23 9 12,304 0 2087 40 0 9 0 22 8 10,372 0 2088 37 0 8 0 20 7 8,655 0 2089 34 0 8 0 19 6 7,149 0 2090 32 0 8 0 17 5 5,844 0 2091 29 0 7 0 16 5 4,728 0 2092 27 0 7 0 15 5 3,787 0 2093 24 0 6 0 14 4 3,003 0 2094 22 0 6 0 13 4 2,359 0 2095 20 0 6 0 12 4 1,837 0 2096 18 0 5 0 11 4 1,419 0 2097 16 0 5 0 10 3 1,090 0 2098 15 0 5 0 9 3 835 0 2099 13 0 4 0 8 3 639 0 2100 12 0 4 0 7 3 491 0 2101 10 0 4 0 7 3 380 0 2102 9 0 3 0 6 3 298 0 2103 8 0 3 0 5 3 239 0 2104 7 0 3 0 5 3 197 0 2105 6 0 3 0 4 3 166 0 2106 5 0 2 0 4 2 144 0 2107 4 0 2 0 3 2 129 0 2108 3 0 2 0 3 2 117 0 2109 3 0 2 0 2 2 108 0 2110 2 0 1 0 2 2 101 0 2111 2 0 1 0 2 2 95 0 2112 1 0 1 0 2 2 90 0 2113 1 0 1 0 1 2 85 0 2114 1 0 1 0 1 2 80 0 2115 1 0 1 0 1 1 76 0
- 30 -
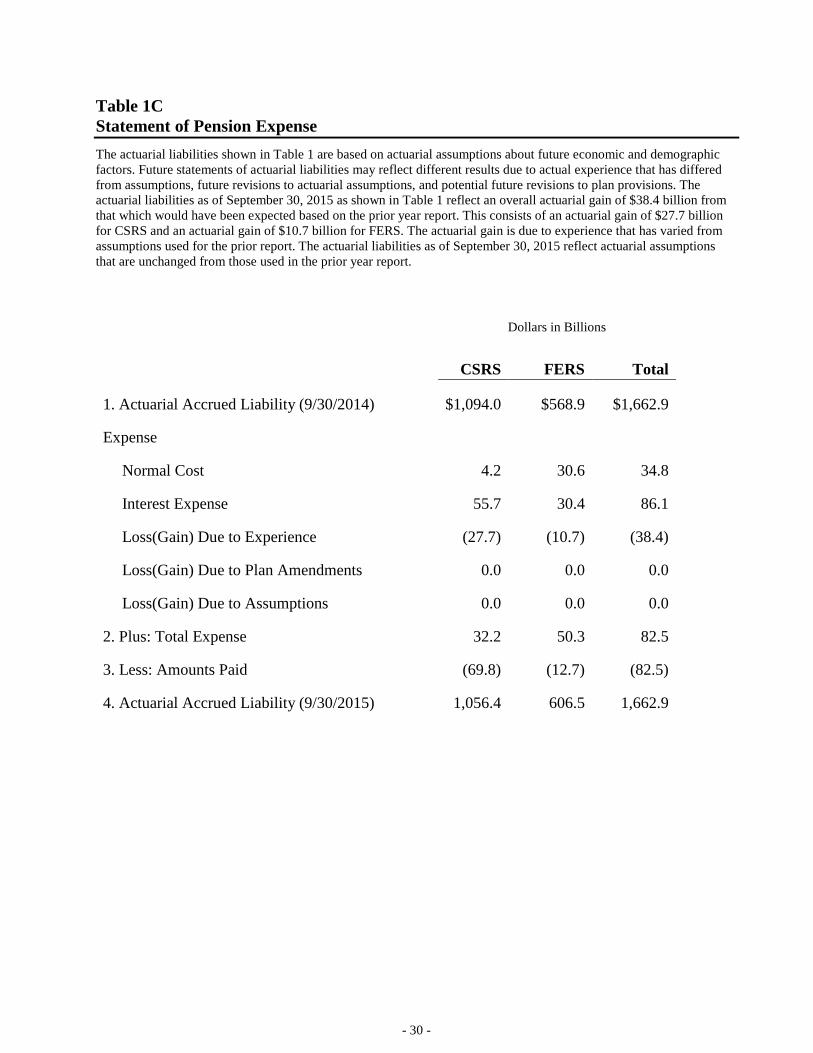
Table 1C Statement of Pension Expense The actuarial liabilities shown in Table 1 are based on actuarial assumptions about future economic and demographic factors. Future statements of actuarial liabilities may reflect different results due to actual experience that has differed from assumptions, future revisions to actuarial assumptions, and potential future revisions to plan provisions. The actuarial liabilities as of September 30, 2015 as shown in Table 1 reflect an overall actuarial gain of $38.4 billion from that which would have been expected based on the prior year report. This consists of an actuarial gain of $27.7 billion for CSRS and an actuarial gain of $10.7 billion for FERS. The actuarial gain is due to experience that has varied from assumptions used for the prior report. The actuarial liabilities as of September 30, 2015 reflect actuarial assumptions that are unchanged from those used in the prior year report.
Dollars in Billions
CSRS FERS Total
1. Actuarial Accrued Liability (9/30/2014) $1,094.0 $568.9 $1,662.9
Expense
Normal Cost 4.2 30.6 34.8
Interest Expense 55.7 30.4 86.1
Loss(Gain) Due to Experience (27.7) (10.7) (38.4)
Loss(Gain) Due to Plan Amendments 0.0 0.0 0.0
Loss(Gain) Due to Assumptions 0.0 0.0 0.0
2. Plus: Total Expense 32.2 50.3 82.5
3. Less: Amounts Paid (69.8) (12.7) (82.5)
4. Actuarial Accrued Liability (9/30/2015) 1,056.4 606.5 1,662.9

- 31 -
Table 1D Present Value of Future Benefits Obligations The present value of future benefits and expenses shown in Table 1 is $2,062.9 billion as of September 30, 2015 (consisting of $1,072.7 billion for CSRS and $990.2 billion for FERS). These benefits obligations for participants as of September 30, 2015 are projected to be met under existing statutory funding provisions as follows:
Present Values as of September 30, 2015 (dollars in billions)
CSRS FERS Total
PV Future Contributions from Employee & Employing Agency: $ 7.1 $383.7 $390.8
+ PV Fut. Excess Contrib. from Employing Agency for FERS-FRAE: 0.0 37.1 37.1
+ PV Future Treasury Amortization Payments (already established): 73.1 46.1 119.2
+ PV Future Treasury Amortization Payments (to be established): 6.2 245.4 251.6
+ PV Future Postal Service Amortization Pmts (already established): 0.0 3.9 3.9
+ PV Future Postal Service Amortization Pmts (to be established): 16.7 0.0 16.7
+ PV Future Treasury Payments of Interest on Static UAL: 315.4 0.0 315.4
+ PV Future Treasury Payments for Military Service costs: 54.9 0.0 54.9
PV Future Statutory Funding Payments: $473.4 $716.2 $1,189.6
+ Assets (at Par Value): 316.8 556.5 873.3
PV Total Amt Available under Statutory Funding Provisions: $790.2 $1,272.7 $2,062.9
+ PV Future Transfers to CSRS from Non-Postal FERS: 282.5 (282.5) 0.0
PV Future Benefits and Expenses: $1,072.7 $990.2 $2,062.9
- 32 -
TABLE 2: Past and Projected Flow of Plan Assets (Combined CSRS and FERS Systems) (Dollars in Billions)
Fiscal Year Employee Contributions
Agency Contributions
Other Government
Contributions
Investment Income Total Income Total Expense Net Assets
End of Year Dynamic Total
UAL EOY Combined
Payroll
PAST FLOW 1987 4.8 5.9 17.0 15.9 43.6 (25.8) 178.7 486.0 74.2 1988 4.5 6.7 17.5 17.9 46.7 (28.3) 197.1 508.3 79.6 1989 4.5 7.3 18.1 19.4 49.3 (29.7) 216.7 548.3 83.4 1990 4.5 7.9 19.4 20.8 52.7 (31.4) 238.0 568.7 87.6 1991 4.6 8.5 21.0 22.7 56.8 (33.2) 261.6 593.8 92.3 1992 4.7 9.3 21.8 24.2 60.0 (33.2) 288.4 599.7 98.0 1993 4.7 9.7 23.0 25.5 62.9 (35.1) 317.4 540.1 100.1 1994 4.6 10.1 22.7 26.3 63.8 (36.5) 344.3 540.6 102.8 1995 4.5 9.9 23.2 28.5 66.1 (38.6) 371.3 545.8 104.9 1996 4.4 10.4 23.4 29.5 67.7 (39.9) 398.9 512.4 107.8 1997 4.4 10.7 24.5 30.9 70.4 (41.8) 427.5 505.6 109.1 1998 4.3 11.3 24.7 32.5 72.8 (43.2) 457.1 496.1 109.6 1999 4.3 11.9 24.8 32.6 73.7 (44.0) 486.8 506.6 115.7 2000 4.7 12.4 25.1 33.8 76.0 (45.2) 521.5 509.5 120.8 2001 4.4 12.9 25.4 35.2 77.9 (47.1) 548.2 510.9 125.2 2002 4.3 13.7 26.0 36.1 80.1 (48.7) 579.5 523.6 131.3 2003 4.3 14.6 21.9 37.0 77.8 (50.0) 607.1 527.1 139.3 2004 4.2 16.2 25.9 35.8 82.1 (52.0) 637.1 534.8 145.6 2005 4.1 17.2 25.9 36.3 83.5 (54.5) 665.9 576.1 151.0 2006 3.9 18.0 28.4 36.6 87.0 (57.6) 695.0 581.8 155.5 2007 3.8 17.4 31.1 37.2 89.5 (78.1)* 706.4 634.5 161.2 2008 3.7 18.8 31.0 37.3 90.8 (63.5) 733.7 674.2 168.9 2009 3.7 20.5 31.5 37.1 92.7 (67.6) 758.7 673.1 181.1 2010 3.6 22.0 33.2 36.4 95.2 (69.3) 784.6 622.3 191.0 2011 3.5 23.9 31.3 35.4 94.1 (70.3) 808.4 761.5 197.3 2012 3.3 24.5 33.1 34.0 94.8 (73.9) 829.1 789.8 196.4 2013 3.3 24.6 33.3 31.4 92.6 (77.1) 844.6 785.0 195.4 2014 3.0 24.8 35.0 30.5 93.3 (79.4) 858.6 804.3 196.0 2015 3.5 28.0 36.6 28.4 96.4 (81.7) 873.3 789.6 199.7
* Includes a transfer of $17.1 billion to the Postal Service Retiree Health Benefit Fund on June 30, 2007
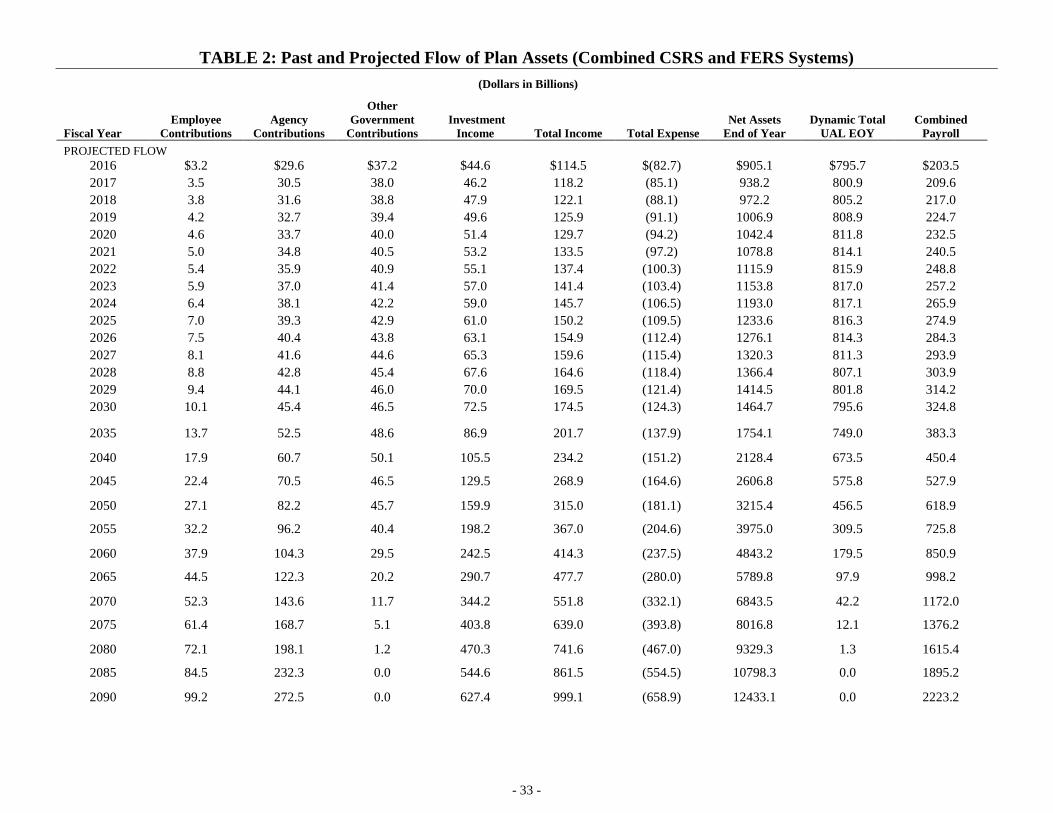
TABLE 2: Past and Projected Flow of Plan Assets (Combined CSRS and FERS Systems)
- 33 -
(Dollars in Billions)
Fiscal Year Employee
Contributions Agency
Contributions
Other Government
Contributions Investment
Income Total Income Total Expense Net Assets
End of Year Dynamic Total
UAL EOY Combined
Payroll PROJECTED FLOW
2016 $3.2 $29.6 $37.2 $44.6 $114.5 $(82.7) $905.1 $795.7 $203.5 2017 3.5 30.5 38.0 46.2 118.2 (85.1) 938.2 800.9 209.6 2018 3.8 31.6 38.8 47.9 122.1 (88.1) 972.2 805.2 217.0 2019 4.2 32.7 39.4 49.6 125.9 (91.1) 1006.9 808.9 224.7 2020 4.6 33.7 40.0 51.4 129.7 (94.2) 1042.4 811.8 232.5 2021 5.0 34.8 40.5 53.2 133.5 (97.2) 1078.8 814.1 240.5 2022 5.4 35.9 40.9 55.1 137.4 (100.3) 1115.9 815.9 248.8 2023 5.9 37.0 41.4 57.0 141.4 (103.4) 1153.8 817.0 257.2 2024 6.4 38.1 42.2 59.0 145.7 (106.5) 1193.0 817.1 265.9 2025 7.0 39.3 42.9 61.0 150.2 (109.5) 1233.6 816.3 274.9 2026 7.5 40.4 43.8 63.1 154.9 (112.4) 1276.1 814.3 284.3 2027 8.1 41.6 44.6 65.3 159.6 (115.4) 1320.3 811.3 293.9 2028 8.8 42.8 45.4 67.6 164.6 (118.4) 1366.4 807.1 303.9 2029 9.4 44.1 46.0 70.0 169.5 (121.4) 1414.5 801.8 314.2 2030 10.1 45.4 46.5 72.5 174.5 (124.3) 1464.7 795.6 324.8
2035 13.7 52.5 48.6 86.9 201.7 (137.9) 1754.1 749.0 383.3
2040 17.9 60.7 50.1 105.5 234.2 (151.2) 2128.4 673.5 450.4
2045 22.4 70.5 46.5 129.5 268.9 (164.6) 2606.8 575.8 527.9
2050 27.1 82.2 45.7 159.9 315.0 (181.1) 3215.4 456.5 618.9
2055 32.2 96.2 40.4 198.2 367.0 (204.6) 3975.0 309.5 725.8
2060 37.9 104.3 29.5 242.5 414.3 (237.5) 4843.2 179.5 850.9
2065 44.5 122.3 20.2 290.7 477.7 (280.0) 5789.8 97.9 998.2
2070 52.3 143.6 11.7 344.2 551.8 (332.1) 6843.5 42.2 1172.0
2075 61.4 168.7 5.1 403.8 639.0 (393.8) 8016.8 12.1 1376.2
2080 72.1 198.1 1.2 470.3 741.6 (467.0) 9329.3 1.3 1615.4
2085 84.5 232.3 0.0 544.6 861.5 (554.5) 10798.3 0.0 1895.2
2090 99.2 272.5 0.0 627.4 999.1 (658.9) 12433.1 0.0 2223.2
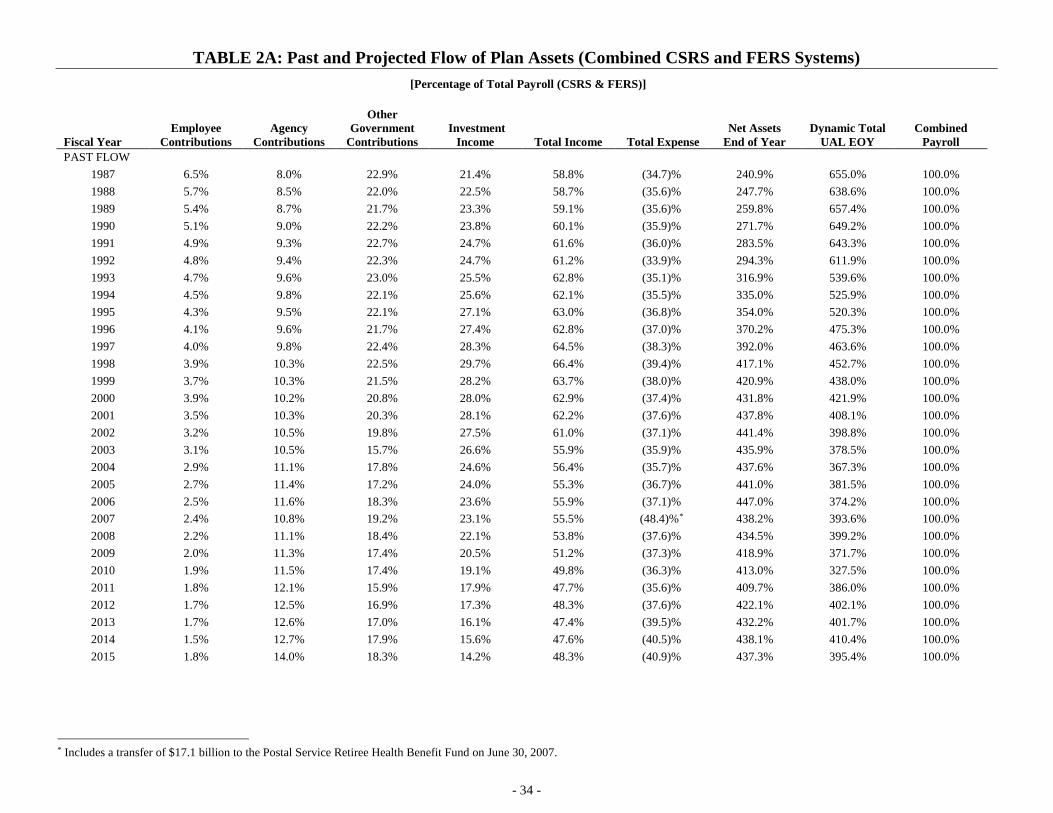
TABLE 2A: Past and Projected Flow of Plan Assets (Combined CSRS and FERS Systems)
- 34 -
[Percentage of Total Payroll (CSRS & FERS)]
Fiscal Year Employee
Contributions Agency
Contributions
Other Government
Contributions Investment
Income Total Income Total Expense Net Assets
End of Year Dynamic Total
UAL EOY Combined
Payroll PAST FLOW
1987 6.5% 8.0% 22.9% 21.4% 58.8% (34.7)% 240.9% 655.0% 100.0% 1988 5.7% 8.5% 22.0% 22.5% 58.7% (35.6)% 247.7% 638.6% 100.0% 1989 5.4% 8.7% 21.7% 23.3% 59.1% (35.6)% 259.8% 657.4% 100.0% 1990 5.1% 9.0% 22.2% 23.8% 60.1% (35.9)% 271.7% 649.2% 100.0% 1991 4.9% 9.3% 22.7% 24.7% 61.6% (36.0)% 283.5% 643.3% 100.0% 1992 4.8% 9.4% 22.3% 24.7% 61.2% (33.9)% 294.3% 611.9% 100.0% 1993 4.7% 9.6% 23.0% 25.5% 62.8% (35.1)% 316.9% 539.6% 100.0% 1994 4.5% 9.8% 22.1% 25.6% 62.1% (35.5)% 335.0% 525.9% 100.0% 1995 4.3% 9.5% 22.1% 27.1% 63.0% (36.8)% 354.0% 520.3% 100.0% 1996 4.1% 9.6% 21.7% 27.4% 62.8% (37.0)% 370.2% 475.3% 100.0% 1997 4.0% 9.8% 22.4% 28.3% 64.5% (38.3)% 392.0% 463.6% 100.0% 1998 3.9% 10.3% 22.5% 29.7% 66.4% (39.4)% 417.1% 452.7% 100.0% 1999 3.7% 10.3% 21.5% 28.2% 63.7% (38.0)% 420.9% 438.0% 100.0% 2000 3.9% 10.2% 20.8% 28.0% 62.9% (37.4)% 431.8% 421.9% 100.0% 2001 3.5% 10.3% 20.3% 28.1% 62.2% (37.6)% 437.8% 408.1% 100.0% 2002 3.2% 10.5% 19.8% 27.5% 61.0% (37.1)% 441.4% 398.8% 100.0% 2003 3.1% 10.5% 15.7% 26.6% 55.9% (35.9)% 435.9% 378.5% 100.0% 2004 2.9% 11.1% 17.8% 24.6% 56.4% (35.7)% 437.6% 367.3% 100.0% 2005 2.7% 11.4% 17.2% 24.0% 55.3% (36.7)% 441.0% 381.5% 100.0% 2006 2.5% 11.6% 18.3% 23.6% 55.9% (37.1)% 447.0% 374.2% 100.0% 2007 2.4% 10.8% 19.2% 23.1% 55.5% (48.4)%* 438.2% 393.6% 100.0% 2008 2.2% 11.1% 18.4% 22.1% 53.8% (37.6)% 434.5% 399.2% 100.0% 2009 2.0% 11.3% 17.4% 20.5% 51.2% (37.3)% 418.9% 371.7% 100.0% 2010 1.9% 11.5% 17.4% 19.1% 49.8% (36.3)% 413.0% 327.5% 100.0% 2011 1.8% 12.1% 15.9% 17.9% 47.7% (35.6)% 409.7% 386.0% 100.0% 2012 1.7% 12.5% 16.9% 17.3% 48.3% (37.6)% 422.1% 402.1% 100.0% 2013 1.7% 12.6% 17.0% 16.1% 47.4% (39.5)% 432.2% 401.7% 100.0% 2014 1.5% 12.7% 17.9% 15.6% 47.6% (40.5)% 438.1% 410.4% 100.0% 2015 1.8% 14.0% 18.3% 14.2% 48.3% (40.9)% 437.3% 395.4% 100.0%
* Includes a transfer of $17.1 billion to the Postal Service Retiree Health Benefit Fund on June 30, 2007.

TABLE 2A: Past and Projected Flow of Plan Assets (Combined CSRS and FERS Systems)
- 35 -
[Percentage of Total Payroll (CSRS & FERS)]
Fiscal Year Employee
Contributions Agency
Contributions
Other Government
Contributions Investment
Income Total Income Total Expense Net Assets
End of Year Dynamic Total
UAL EOY Combined
Payroll
PROJECTED FLOW 2016 1.6% 14.5% 18.3% 21.9% 56.3% (40.6)% 444.9% 391.1% 100.0% 2017 1.7% 14.6% 18.1% 22.0% 56.4% (40.6)% 447.6% 382.1% 100.0% 2018 1.7% 14.6% 17.9% 22.1% 56.2% (40.6)% 447.9% 371.0% 100.0% 2019 1.9% 14.5% 17.5% 22.1% 56.0% (40.6)% 448.2% 360.0% 100.0% 2020 2.0% 14.5% 17.2% 22.1% 55.8% (40.5)% 448.4% 349.2% 100.0% 2021 2.1% 14.5% 16.8% 22.1% 55.5% (40.4)% 448.5% 338.5% 100.0% 2022 2.2% 14.4% 16.5% 22.2% 55.2% (40.3)% 448.6% 328.0% 100.0% 2023 2.3% 14.4% 16.1% 22.2% 55.0% (40.2)% 448.6% 317.7% 100.0% 2024 2.4% 14.3% 15.9% 22.2% 54.8% (40.1)% 448.7% 307.3% 100.0% 2025 2.5% 14.3% 15.6% 22.2% 54.6% (39.8)% 448.7% 296.9% 100.0% 2026 2.7% 14.2% 15.4% 22.2% 54.5% (39.6)% 448.8% 286.4% 100.0% 2027 2.8% 14.2% 15.2% 22.2% 54.3% (39.3)% 449.2% 276.0% 100.0% 2028 2.9% 14.1% 14.9% 22.2% 54.2% (39.0)% 449.6% 265.6% 100.0% 2029 3.0% 14.0% 14.7% 22.3% 54.0% (38.6)% 450.2% 255.2% 100.0% 2030 3.1% 14.0% 14.3% 22.3% 53.7% (38.3)% 451.0% 245.0% 100.0%
2035 3.6% 13.7% 12.7% 22.7% 52.6% (36.0)% 457.6% 195.4% 100.0%
2040 4.0% 13.5% 11.1% 23.4% 52.0% (33.6)% 472.5% 149.5% 100.0%
2045 4.2% 13.3% 8.8% 24.5% 50.9% (31.2)% 493.8% 109.1% 100.0%
2050 4.4% 13.3% 7.4% 25.8% 50.9% (29.3)% 519.5% 73.8% 100.0%
2055 4.4% 13.3% 5.6% 27.3% 50.6% (28.2)% 547.7% 42.6% 100.0%
2060 4.5% 12.3% 3.5% 28.5% 48.7% (27.9)% 569.2% 21.1% 100.0%
2065 4.5% 12.3% 2.0% 29.1% 47.9% (28.1)% 580.0% 9.8% 100.0%
2070 4.5% 12.3% 1.0% 29.4% 47.1% (28.3)% 583.9% 3.6% 100.0%
2075 4.5% 12.3% 0.4% 29.3% 46.4% (28.6)% 582.5% 0.9% 100.0%
2080 4.5% 12.3% 0.1% 29.1% 45.9% (28.9)% 577.5% 0.1% 100.0%
2085 4.5% 12.3% 0.0% 28.7% 45.5% (29.3)% 569.8% 0.0% 100.0%
2090 4.5% 12.3% 0.0% 28.2% 44.9% (29.6)% 559.2% 0.0% 100.0%

- 36 -
TABLE 3: Past and Projected Flow of Plan Assets (FERS)
(Dollars in Billions)
Fiscal Year
Employee Contribu-
tions
Agency Contribu-
tions
Treasury Amortized Payment
Postal Amortized Payment
Total Government
Contributions Investment
Income Total
Income
FERS Benefit
Payment
Transfer from (to)
CSRS Total
Expense
Net Assets End of Year
Dynamic FERS
UAL EOY FERS
Payroll
PAST FLOW 1987 $0.3 $1.5 $0.0 $0.0 $1.5 $0.2 $2.0 $0.0 $1.81 $1.8 $3.8 $4.4 $11.0 1988 0.2 2.4 0.0 0.0 2.4 0.4 3.0 (0.2) 1.32 1.1 8.0 5.6 18.1 1989 0.2 3.0 0.5 0.0 3.5 0.8 4.5 (0.2) 0.0 (0.2) 12.3 5.5 23.0 1990 0.2 3.7 0.5 0.0 4.1 1.3 5.6 (0.2) 0.0 (0.2) 17.7 5.6 26.7 1991 0.3 4.3 0.5 0.0 4.8 1.7 6.8 (0.2) 0.0 (0.2) 24.3 6.1 31.2 1992 0.3 4.9 0.5 0.0 5.7 2.3 8.0 (0.3) 0.0 (0.3) 32.0 4.7 35.5 1993 0.3 5.4 0.5 0.0 5.9 2.8 9.0 (0.3) 0.0 (0.3) 40.7 1.8 38.9 1994 0.4 5.8 0.2 0.0 6.0 3.4 9.8 (0.4) 0.0 (0.4) 50.0 (0.1) 42.2 1995 0.4 5.7 0.2 0.0 6.0 4.1 10.5 (0.6) 0.0 (0.6) 59.9 (0.6) 46.4 1996 0.5 6.3 0.0 0.0 6.3 3.9 10.7 (0.6) 0.0 (0.6) 69.9 (5.8) 50.2 1997 0.5 6.6 0.0 0.0 6.6 7.2 14.3 (0.8) 0.0 (0.8) 83.4 (9.6) 53.0 1998 0.5 6.7 0.0 0.0 6.7 6.8 14.0 (0.9) 0.0 (0.9) 96.5 (7.9) 54.4 1999 0.6 7.4 0.0 0.0 7.4 7.3 15.3 (1.0) 0.0 (1.0) 110.8 (6.3) 62.6 2000 0.9 8.0 0.0 0.0 8.0 8.2 17.1 (1.2) 0.0 (1.2) 126.8 (11.3) 68.1 2001 0.7 8.7 0.0 0.0 8.7 9.1 18.5 (1.4) 0.0 (1.4) 143.8 (14.9) 73.9 2002 0.7 9.6 0.0 0.0 9.6 9.9 20.2 (1.6) 0.0 (1.6) 162.4 (9.3) 80.4 2003 0.8 10.6 0.0 0.0 10.6 10.6 22.0 (1.8) 0.0 (1.8) 182.6 (11.7) 89.5 2004 0.9 11.6 0.0 0.0 11.6 11.3 23.8 (2.1) 0.0 (2.1) 204.3 (12.1) 97.6 2005 1.0 13.2 0.0 0.0 13.2 12.2 26.4 (2.5) 0.0 (2.5) 228.1 (5.2) 105.7 2006 1.0 14.1 0.2 0.0 14.4 12.9 28.3 (2.9) 0.0 (2.9) 253.4 (6.1) 113.4 2007 1.1 15.2 0.2 0.0 15.4 14.1 30.6 (3.6) 0.0 (3.6) 280.4 1.0 121.6 2008 1.2 16.7 0.7 0.0 17.4 15.6 34.2 (4.1) 0.0 (4.1) 310.5 0.9 131.6 2009 1.3 18.5 0.6 0.0 19.1 16.5 36.9 (4.8) 0.0 (4.8) 342.0 9.7 146.0 2010 1.4 20.1 1.2 0.0 21.3 16.7 39.4 (5.4) 0.0 (5.4) 376.0 (12.2) 159.1 2011 1.5 22.2 0.0 0.0 22.2 17.5 41.3 (6.1) 0.0 (6.1) 411.2 20.1 168.7 2012 1.5 23.1 1.5 0.0 24.6 16.8 43.0 (7.2) 0.0 (7.2) 446.9 38.9 172.0 2013 1.6 23.4 2.9 0.0 26.4 17.4 45.4 (8.4) 0.0 (8.4) 483.8 33.6 175.0 2014 1.8 23.7 2.3 0.0 26.0 17.1 44.9 (9.7) 0.0 (9.7) 519.0 49.9 178.6 2015 2.1 27.1 3.6 0.0 30.7 16.0 48.8 (11.3) (0.1) (11.4) 556.5 50.0 184.9
1 Transfer of funds from CSRS to FERS for the individuals who were automatically transferred to FERS on January 1, 1987. 2 Transfer of funds from CSRS to FERS for the individuals electing FERS coverage.

TABLE 3: Past and Projected Flow of Plan Assets (FERS)
- 37 -
(Dollars in Billions)
Fiscal Year
Employee Contribu-
tions
Agency Contribu-
tions
Treasury Amortized Payment
Postal Amortized Payment
Total Government
Contributions Investment
Income Total
Income
FERS Benefit
Payment
Transfer from (to)
CSRS Total
Expense
Net Assets End of Year
Dynamic FERS
UAL EOY FERS
Payroll
PROJECTED FLOW 2016 $2.4 $28.8 $3.2 $0.5 $32.6 $29.7 $64.7 $(12.7) $(0.2) $(12.8) $608.4 $48.9 $190.8 2017 2.8 29.9 3.2 0.2 33.4 32.4 68.6 (14.5) (0.3) (14.7) 662.2 47.9 199.0 2018 3.2 31.1 3.2 0.2 34.5 35.2 73.0 (16.5) (0.3) (16.8) 718.4 47.0 208.0 2019 3.7 32.2 3.2 0.2 35.7 38.2 77.5 (18.7) (0.4) (19.1) 776.8 46.0 217.1 2020 4.2 33.4 3.2 0.2 36.9 41.2 82.2 (21.1) (0.5) (21.7) 837.4 44.9 226.1 2021 4.6 34.5 3.2 0.2 38.0 44.3 87.0 (23.7) (0.7) (24.4) 900.0 43.8 235.2 2022 5.2 35.7 3.2 0.2 39.1 47.6 91.9 (26.5) (5.4) (31.9) 960.0 47.2 244.3 2023 5.7 36.8 3.5 0.2 40.6 50.7 97.0 (29.5) (25.3) (54.9) 1002.1 70.4 253.5 2024 6.2 37.9 5.2 0.2 43.4 52.9 102.5 (32.7) (26.2) (58.9) 1045.7 93.8 262.9 2025 6.8 39.1 6.9 0.2 46.2 55.1 108.2 (35.9) (26.9) (62.9) 1091.1 117.4 272.5 2026 7.4 40.3 8.6 0.2 49.1 57.5 114.0 (39.2) (27.5) (66.7) 1138.4 140.9 282.3 2027 8.0 41.5 10.3 0.2 52.1 59.9 120.1 (42.8) (28.0) (70.8) 1187.7 164.3 292.4 2028 8.7 42.8 12.1 0.2 55.1 62.4 126.3 (46.5) (28.4) (74.8) 1239.1 187.4 302.7 2029 9.3 44.0 13.9 0.2 58.2 65.1 132.6 (50.3) (28.8) (79.1) 1292.7 210.1 313.2 2030 10.0 45.4 15.7 0.2 61.3 67.8 139.2 (54.3) (29.2) (83.5) 1348.4 232.5 324.1
2035 13.7 52.5 24.9 0.2 77.6 83.5 174.9 (75.8) (29.6) (105.3) 1666.5 333.5 383.2
2040 17.9 60.7 33.4 0.2 94.3 103.3 215.5 (101.0) (26.4) (127.4) 2067.8 400.4 450.4
2045 22.4 70.5 36.8 0.0 107.3 128.1 257.8 (129.0) (19.8) (148.7) 2569.8 420.5 527.9
2050 27.1 82.2 40.6 0.0 122.9 159.2 309.2 (159.6) (12.5) (172.1) 3197.6 381.4 618.9
2055 32.2 96.2 38.2 0.0 134.4 197.8 364.4 (194.2) (7.0) (201.3) 3967.3 280.8 725.8
2060 37.9 104.3 29.3 0.0 133.6 241.9 413.4 (233.6) 0.0 (233.6) 4832.3 178.9 850.9
2065 44.5 122.3 20.2 0.0 142.5 290.5 477.5 (279.0) 0.0 (279.0) 5786.7 97.7 998.2
2070 52.3 143.6 11.7 0.0 155.3 344.2 551.7 (331.8) 0.0 (331.8) 6842.3 42.1 1172.0
2075 61.4 168.7 5.1 0.0 173.8 403.7 638.9 (393.7) 0.0 (393.7) 8016.0 12.0 1376.2
2080 72.1 198.1 1.2 0.0 199.2 470.2 741.5 (467.0) 0.0 (467.0) 9328.7 1.2 1615.4
2085 84.5 232.3 0.0 0.0 232.3 544.6 861.5 (554.5) 0.0 (554.5) 10797.9 0.0 1895.2
2090 99.2 272.5 0.0 0.0 272.5 627.4 999.1 (658.8) 0.0 (658.8) 12432.8 0.0 2223.2

- 38 -
TABLE 3A: Past and Projected Flow of Assets (FERS)
[Percentage of Total Payroll (CSRS & FERS)]
Fiscal Year
Employee Contribu-
tions
Agency Contribu-
tions
Treasury Amortized Payment
Postal Amortized Payment
Total Government
Contributions Investment
Income Total
Income
FERS Benefit
Payment
Transfer from (to)
CSRS Total
Expense
Net Assets End of Year
Dynamic FERS
UAL EOY FERS
Payroll
PAST FLOW 1987 0.4% 2.0% 0.0% 0.0% 2.0% 0.3% 2.7% 0.0% 2.4%** 2.4% 5.2% 5.9% 14.8% 1988 0.2% 3.0% 0.0% 0.0% 3.0% 0.6% 3.8% (0.2)% 1.6% 1.4% 10.0% 7.0% 22.7% 1989 0.3% 3.7% 0.5% 0.0% 4.2% 0.9% 5.4% (0.2)% 0.0% (0.2)% 14.8% 6.6% 27.6% 1990 0.3% 4.2% 0.5% 0.0% 4.7% 1.4% 6.4% (0.3)% 0.0% (0.3)% 20.2% 6.4% 30.5% 1991 0.3% 4.6% 0.5% 0.0% 5.2% 1.9% 7.3% (0.2)% 0.0% (0.2)% 26.3% 6.6% 33.8% 1992 0.3% 5.0% 0.5% 0.0% 5.8% 2.3% 8.1% (0.3)% 0.0% (0.3)% 32.6% 4.8% 36.3% 1993 0.3% 5.4% 0.5% 0.0% 5.9% 2.8% 9.0% (0.3)% 0.0% (0.3)% 40.6% 1.8% 38.8% 1994 0.3% 5.7% 0.2% 0.0% 5.9% 3.3% 9.5% (0.4)% 0.0% (0.4)% 48.6% (0.1)% 41.1% 1995 0.4% 5.5% 0.2% 0.0% 5.7% 3.9% 10.0% (0.5)% 0.0% (0.5)% 57.1% (0.6)% 44.2% 1996 0.4% 5.8% 0.0% 0.0% 5.8% 3.7% 9.9% (0.6)% 0.0% (0.6)% 64.9% (5.4)% 46.6% 1997 0.4% 6.1% 0.0% 0.0% 6.1% 6.6% 13.1% (0.7)% 0.0% (0.7)% 76.5% (8.8)% 48.6% 1998 0.5% 6.1% 0.0% 0.0% 6.1% 6.2% 12.8% (0.8)% 0.0% (0.8)% 88.1% (7.2)% 49.6% 1999 0.6% 6.4% 0.0% 0.0% 6.4% 6.3% 13.2% (0.9)% 0.0% (0.9)% 95.8% (5.4)% 54.1% 2000 0.7% 6.6% 0.0% 0.0% 6.6% 6.8% 14.1% (1.0)% 0.0% (1.0)% 105.0% (9.4)% 56.4% 2001 0.6% 6.9% 0.0% 0.0% 6.9% 7.3% 14.8% (1.1)% 0.0% (1.1)% 114.8% (11.9)% 59.0% 2002 0.5% 7.3% 0.0% 0.0% 7.3% 7.6% 15.4% (1.2)% 0.0% (1.2)% 123.7% (7.1)% 61.3% 2003 0.6% 7.6% 0.0% 0.0% 7.6% 7.6% 15.8% (1.3)% 0.0% (1.3)% 131.1% (8.4)% 64.3% 2004 0.6% 8.0% 0.0% 0.0% 8.0% 7.7% 16.3% (1.4)% 0.0% (1.3)% 140.3% (8.3)% 67.1% 2005 0.6% 8.7% 0.0% 0.0% 8.7% 8.1% 17.5% (1.7)% 0.0% (1.7)% 151.1% (3.4)% 70.0% 2006 0.7% 9.1% 0.1% 0.0% 9.2% 8.3% 18.2% (1.9)% 0.0% (1.9)% 163.0% (3.9)% 72.9% 2007 0.7% 9.4% 0.2% 0.0% 9.6% 8.7% 19.0% (2.2)% 0.0% (2.2)% 174.0% 0.6% 75.5% 2008 0.7% 9.9% 0.4% 0.0% 10.3% 9.2% 20.3% (2.4)% 0.0% (2.4)% 183.9% 0.5% 77.9% 2009 0.7% 10.2% 0.3% 0.0% 10.5% 9.1% 20.4% (2.6)% 0.0% (2.6)% 188.8% 5.4% 80.6% 2010 0.7% 10.5% 0.6% 0.0% 11.2% 8.7% 20.6% (2.8)% 0.0% (2.8)% 196.9% (6.4)% 83.2% 2011 0.8% 11.3% 0.0% 0.0% 11.3% 8.9% 20.9% (3.1)% 0.0% (3.1)% 208.4% 10.2% 85.5% 2012 0.8% 11.8% 0.8% 0.0% 12.5% 8.6% 21.9% (3.7)% 0.0% (3.7)% 227.5% 19.8% 87.6% 2013 0.8% 12.0% 1.5% 0.0% 13.5% 8.9% 23.2% (4.3)% 0.0% (4.3)% 247.6% 17.2% 89.6% 2014 0.9% 12.1% 1.2% 0.0% 13.3% 8.7% 22.9% (4.9)% 0.0% (4.9)% 264.8% 25.5% 91.1% 2015 1.1% 13.6% 1.8% 0.0% 15.4% 8.0% 24.4% (5.7)% (0.1)% (5.7)% 278.7% 25.0% 92.6%
** Transfer of funds from CSRS to FERS for the individuals who were automatically transferred to FERS on January 1, 1987.

TABLE 3A: Past and Projected Flow of Assets (FERS)
- 39 -
[Percentage of Total Payroll (CSRS & FERS)]
Fiscal Year
Employee Contribu-
tions
Agency Contribu-
tions
Treasury Amortized Payment
Postal Amortized Payment
Total Government
Contributions Investment
Income Total
Income
FERS Benefit
Payment
Transfer from (to)
CSRS Total
Expense
Net Assets End of Year
Dynamic FERS
UAL EOY FERS
Payroll
PROJECTED FLOW 2016 1.2% 14.2% 1.6% 0.2% 16.0% 14.6% 31.8% (6.2)% (0.1)% (6.3)% 299.0% 24.0% 93.8% 2017 1.3% 14.3% 1.5% 0.1% 15.9% 15.5% 32.7% (6.9)% (0.1)% (7.0)% 315.9% 22.9% 94.9% 2018 1.5% 14.3% 1.5% 0.1% 15.9% 16.2% 33.6% (7.6)% (0.2)% (7.7)% 331.0% 21.6% 95.8% 2019 1.6% 14.3% 1.4% 0.1% 15.9% 17.0% 34.5% (8.3)% (0.2)% (8.5)% 345.8% 20.5% 96.6% 2020 1.8% 14.4% 1.4% 0.1% 15.9% 17.7% 35.4% (9.1)% (0.2)% (9.3)% 360.2% 19.3% 97.3% 2021 1.9% 14.4% 1.3% 0.1% 15.8% 18.4% 36.2% (9.9)% (0.3)% (10.1)% 374.2% 18.2% 97.8% 2022 2.1% 14.3% 1.3% 0.1% 15.7% 19.1% 36.9% (10.7)% (2.2)% (12.8)% 385.9% 19.0% 98.2% 2023 2.2% 14.3% 1.4% 0.1% 15.8% 19.7% 37.7% (11.5)% (9.8)% (21.3)% 389.6% 27.4% 98.6% 2024 2.3% 14.3% 1.9% 0.1% 16.3% 19.9% 38.5% (12.3)% (9.8)% (22.1)% 393.3% 35.3% 98.9% 2025 2.5% 14.2% 2.5% 0.1% 16.8% 20.1% 39.3% (13.1)% (9.8)% (22.9)% 396.9% 42.7% 99.1% 2026 2.6% 14.2% 3.0% 0.1% 17.3% 20.2% 40.1% (13.8)% (9.7)% (23.5)% 400.4% 49.6% 99.3% 2027 2.7% 14.1% 3.5% 0.1% 17.7% 20.4% 40.8% (14.5)% (9.5)% (24.1)% 404.1% 55.9% 99.5% 2028 2.9% 14.1% 4.0% 0.1% 18.1% 20.5% 41.5% (15.3)% (9.3)% (24.6)% 407.8% 61.7% 99.6% 2029 3.0% 14.0% 4.4% 0.1% 18.5% 20.7% 42.2% (16.0)% (9.2)% (25.2)% 411.5% 66.9% 99.7% 2030 3.1% 14.0% 4.8% 0.1% 18.9% 20.9% 42.9% (16.7)% (9.0)% (25.7)% 415.1% 71.6% 99.8%
2035 3.6% 13.7% 6.5% 0.1% 20.2% 21.8% 45.6% (19.8)% (7.7)% (27.5)% 434.7% 87.0% 100.0%
2040 4.0% 13.5% 7.4% 0.1% 20.9% 22.9% 47.8% (22.4)% (5.9)% (28.3)% 459.1% 88.9% 100.0%
2045 4.2% 13.3% 7.0% 0.0% 20.3% 24.3% 48.8% (24.4)% (3.7)% (28.2)% 486.8% 79.7% 100.0%
2050 4.4% 13.3% 6.6% 0.0% 19.9% 25.7% 50.0% (25.8)% (2.0)% (27.8)% 516.6% 61.6% 100.0%
2055 4.4% 13.3% 5.3% 0.0% 18.5% 27.3% 50.2% (26.8)% (1.0)% (27.7)% 546.6% 38.7% 100.0%
2060 4.5% 12.3% 3.4% 0.0% 15.7% 28.4% 48.6% (27.5)% 0.0% (27.5)% 567.9% 21.0% 100.0%
2065 4.5% 12.3% 2.0% 0.0% 14.3% 29.1% 47.8% (27.9)% 0.0% (27.9)% 579.7% 9.8% 100.0%
2070 4.5% 12.3% 1.0% 0.0% 13.3% 29.4% 47.1% (28.3)% 0.0% (28.3)% 583.8% 3.6% 100.0%
2075 4.5% 12.3% 0.4% 0.0% 12.6% 29.3% 46.4% (28.6)% 0.0% (28.6)% 582.5% 0.9% 100.0%
2080 4.5% 12.3% 0.1% 0.0% 12.3% 29.1% 45.9% (28.9)% 0.0% (28.9)% 577.5% 0.1% 100.0%
2085 4.5% 12.3% 0.0% 0.0% 12.3% 28.7% 45.5% (29.3)% 0.0% (29.3)% 569.7% 0.0% 100.0% 2090 4.5% 12.3% 0.0% 0.0% 12.3% 28.2% 44.9% (29.6)% 0.0% (29.6)% 559.2% 0.0% 100.0%

- 40 -
TABLE 4: Past and Projected Flow of Plan Assets (CSRS) (Dollars in Billions)
Fiscal Year
Employee Contribu-
tions
Agency Contribu-
tions
Treasury 30 Year Payment
Postal Amort.
Payment
Interest Payment on UAL
Military Service
Payment
Total Government
Contrib.
Transfer from (to)
FERS
Invest-ment
Income Total
Income Total
Outlays
Fund End of Year
Dynamic CSRS
UAL EOY CSRS
Payroll PAST FLOW
1987 4.5 4.4 6.0 0.0 9.0 2.0 21.4 (1.8)1 15.6 39.8 (25.7) 174.9 481.6 63.2 1988 4.3 4.3 6.3 0.0 9.0 2.2 21.8 (1.3)2 17.4 42.4 (28.1) 189.1 502.7 61.5 1989 4.3 4.2 6.5 0.0 8.8 2.3 21.9 0.0 18.7 44.8 (29.5) 204.4 542.8 60.4 1990 4.3 4.3 6.8 0.1 9.5 2.5 23.2 0.0 19.6 47.1 (31.2) 220.3 563.1 60.9 1991 4.3 4.3 7.5 0.6 9.7 2.6 24.7 0.0 21.0 50.0 (33.0) 237.3 587.7 61.0 1992 4.4 4.4 8.0 0.8 9.8 2.8 25.8 0.0 21.9 52.0 (32.9) 256.4 595.0 62.5 1993 4.4 4.3 9.0 0.9 9.7 2.9 26.8 0.0 22.7 53.9 (34.8) 276.7 538.3 61.3 1994 4.2 4.3 9.2 1.0 9.3 3.0 26.8 0.0 23.0 54.0 (36.1) 294.3 540.7 60.5 1995 4.1 4.2 9.6 1.2 9.1 3.1 27.2 0.0 24.4 55.6 (38.1) 311.4 546.4 58.5 1996 4.0 4.1 10.1 1.0 9.1 3.2 27.5 0.0 25.6 57.1 (39.2) 329.0 518.2 57.6 1997 3.9 4.1 10.5 1.0 9.8 3.4 28.6 0.0 23.7 56.3 (41.0) 344.1 515.2 56.1 1998 3.8 4.6 10.9 0.9 9.4 3.4 29.2 0.0 25.8 58.8 (42.3) 360.6 504.0 55.2 1999 3.6 4.6 11.3 0.9 9.2 3.5 29.4 0.0 25.3 58.4 (43.0) 376.0 512.9 53.1 2000 3.8 4.4 11.7 1.0 9.0 3.5 29.5 0.0 25.6 58.9 (44.0) 394.7 520.8 52.7 2001 3.6 4.2 11.9 1.1 8.7 3.7 29.6 0.0 26.2 59.4 (45.7) 404.4 525.8 51.3 2002 3.5 4.2 12.3 1.2 8.8 3.7 30.2 0.0 26.2 59.9 (47.1) 417.1 532.9 50.9 2003 3.5 4.0 9.9 0.0 8.8 3.2 25.9 0.0 26.4 55.8 (48.2) 424.5 538.8 49.8 2004 3.3 4.6 10.2 0.2 12.2 3.3 30.5 0.0 24.5 58.3 (49.9) 432.8 546.9 47.9 2005 3.1 4.1 10.2 0.3 12.1 3.2 30.0 0.0 24.0 57.1 (52.0) 437.8 581.3 45.3 2006 2.9 3.9 10.4 0.3 14.2 3.3 32.0 0.0 23.7 58.7 (54.7) 441.5 587.9 42.1 2007 2.7 2.2 10.2 0.0 14.4 6.2 33.0 0.0 23.2 58.9 (74.5)3 426.0 634.5 39.5 2008 2.5 2.1 10.2 0.0 16.1 4.0 32.4 0.0 21.7 56.6 (59.4) 423.2 673.3 37.3 2009 2.3 2.0 10.2 0.0 16.4 4.1 32.9 0.0 20.6 55.8 (62.9) 416.7 663.4 35.1 2010 2.2 1.8 10.0 0.0 17.8 4.1 33.9 0.0 19.7 55.8 (63.9) 408.6 634.5 31.9 2011 2.0 1.7 9.5 0.0 17.7 4.0 33.0 0.0 17.8 52.8 (64.2) 397.2 741.4 28.6 2012 1.7 1.4 9.2 0.0 18.3 4.0 32.9 0.0 17.2 51.8 (66.8) 382.2 750.9 24.5 2013 1.6 1.2 8.9 0.0 17.4 3.9 31.5 0.0 14.0 47.2 (68.6) 360.8 751.4 20.4 2014 1.2 1.0 8.7 0.0 20.1 3.8 33.7 0.0 13.5 48.4 (69.6) 339.6 754.4 17.4 2015 1.3 0.9 8.5 0.0 20.6 3.8 33.9 0.1 12.3 47.6 (70.4) 316.8 739.6 14.8
1 Transfer of funds from CSRS to FERS for individuals who automatically transferred to FERS on January 1, 1987. 2 Transfer of funds from CSRS to FERS for the individuals electing FERS coverage. 3 Includes a transfer of $17.1 billion to the Postal Service Retiree Health Benefit Fund on June 30, 2007
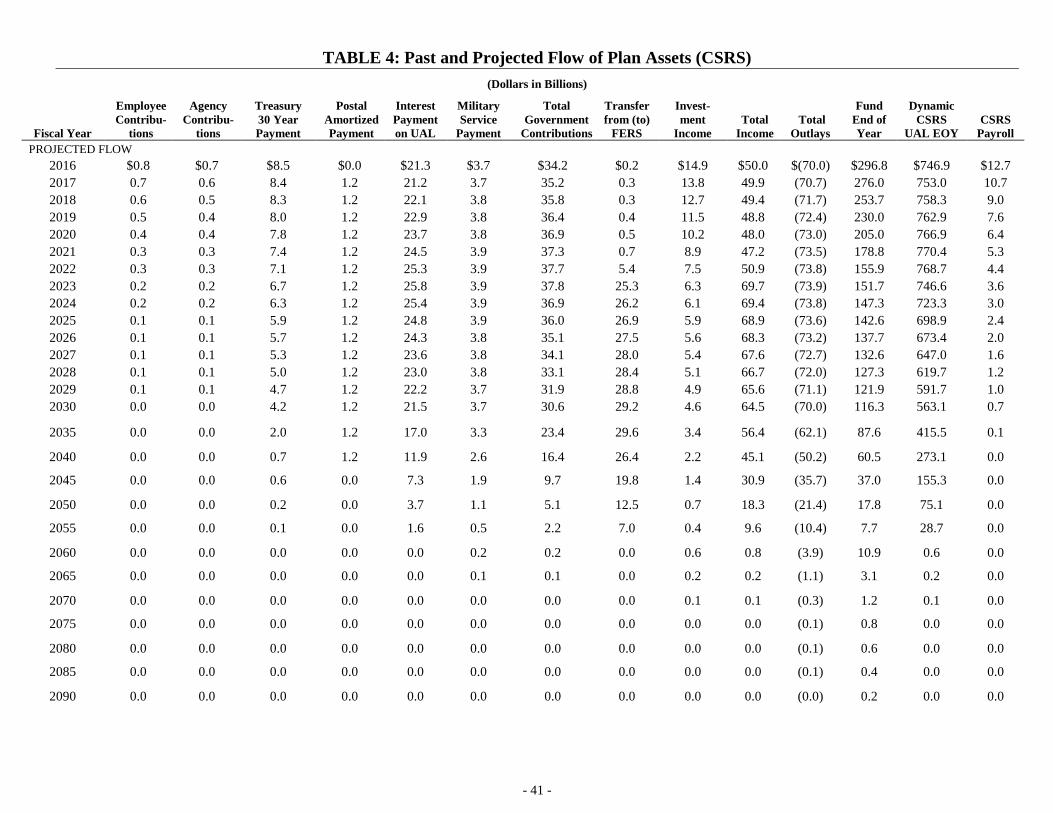
TABLE 4: Past and Projected Flow of Plan Assets (CSRS) (Dollars in Billions)
- 41 -
Fiscal Year
Employee Contribu-
tions
Agency Contribu-
tions
Treasury 30 Year Payment
Postal Amortized Payment
Interest Payment on UAL
Military Service
Payment
Total Government
Contributions
Transfer from (to)
FERS
Invest-ment
Income Total
Income Total
Outlays
Fund End of Year
Dynamic CSRS
UAL EOY CSRS
Payroll PROJECTED FLOW
2016 $0.8 $0.7 $8.5 $0.0 $21.3 $3.7 $34.2 $0.2 $14.9 $50.0 $(70.0) $296.8 $746.9 $12.7 2017 0.7 0.6 8.4 1.2 21.2 3.7 35.2 0.3 13.8 49.9 (70.7) 276.0 753.0 10.7 2018 0.6 0.5 8.3 1.2 22.1 3.8 35.8 0.3 12.7 49.4 (71.7) 253.7 758.3 9.0 2019 0.5 0.4 8.0 1.2 22.9 3.8 36.4 0.4 11.5 48.8 (72.4) 230.0 762.9 7.6 2020 0.4 0.4 7.8 1.2 23.7 3.8 36.9 0.5 10.2 48.0 (73.0) 205.0 766.9 6.4 2021 0.3 0.3 7.4 1.2 24.5 3.9 37.3 0.7 8.9 47.2 (73.5) 178.8 770.4 5.3 2022 0.3 0.3 7.1 1.2 25.3 3.9 37.7 5.4 7.5 50.9 (73.8) 155.9 768.7 4.4 2023 0.2 0.2 6.7 1.2 25.8 3.9 37.8 25.3 6.3 69.7 (73.9) 151.7 746.6 3.6 2024 0.2 0.2 6.3 1.2 25.4 3.9 36.9 26.2 6.1 69.4 (73.8) 147.3 723.3 3.0 2025 0.1 0.1 5.9 1.2 24.8 3.9 36.0 26.9 5.9 68.9 (73.6) 142.6 698.9 2.4 2026 0.1 0.1 5.7 1.2 24.3 3.8 35.1 27.5 5.6 68.3 (73.2) 137.7 673.4 2.0 2027 0.1 0.1 5.3 1.2 23.6 3.8 34.1 28.0 5.4 67.6 (72.7) 132.6 647.0 1.6 2028 0.1 0.1 5.0 1.2 23.0 3.8 33.1 28.4 5.1 66.7 (72.0) 127.3 619.7 1.2 2029 0.1 0.1 4.7 1.2 22.2 3.7 31.9 28.8 4.9 65.6 (71.1) 121.9 591.7 1.0 2030 0.0 0.0 4.2 1.2 21.5 3.7 30.6 29.2 4.6 64.5 (70.0) 116.3 563.1 0.7
2035 0.0 0.0 2.0 1.2 17.0 3.3 23.4 29.6 3.4 56.4 (62.1) 87.6 415.5 0.1
2040 0.0 0.0 0.7 1.2 11.9 2.6 16.4 26.4 2.2 45.1 (50.2) 60.5 273.1 0.0
2045 0.0 0.0 0.6 0.0 7.3 1.9 9.7 19.8 1.4 30.9 (35.7) 37.0 155.3 0.0
2050 0.0 0.0 0.2 0.0 3.7 1.1 5.1 12.5 0.7 18.3 (21.4) 17.8 75.1 0.0
2055 0.0 0.0 0.1 0.0 1.6 0.5 2.2 7.0 0.4 9.6 (10.4) 7.7 28.7 0.0
2060 0.0 0.0 0.0 0.0 0.0 0.2 0.2 0.0 0.6 0.8 (3.9) 10.9 0.6 0.0
2065 0.0 0.0 0.0 0.0 0.0 0.1 0.1 0.0 0.2 0.2 (1.1) 3.1 0.2 0.0
2070 0.0 0.0 0.0 0.0 0.0 0.0 0.0 0.0 0.1 0.1 (0.3) 1.2 0.1 0.0
2075 0.0 0.0 0.0 0.0 0.0 0.0 0.0 0.0 0.0 0.0 (0.1) 0.8 0.0 0.0
2080 0.0 0.0 0.0 0.0 0.0 0.0 0.0 0.0 0.0 0.0 (0.1) 0.6 0.0 0.0
2085 0.0 0.0 0.0 0.0 0.0 0.0 0.0 0.0 0.0 0.0 (0.1) 0.4 0.0 0.0
2090 0.0 0.0 0.0 0.0 0.0 0.0 0.0 0.0 0.0 0.0 (0.0) 0.2 0.0 0.0

- 42 -
TABLE 4A: Past and Projected Flow of Plan Assets (CSRS) [Percentage of Total Payroll (CSRS & FERS)]
Fiscal Year
Employee Contribu-
tions
Agency Contribu-
tions
Treasury 30 Year Payment
Postal Amortized Payment
Interest Payment on UAL
Military Service
Payment
Total Government
Contributions
Transfer from (to)
FERS Investment
Income Total
Income Total
Outlays Fund End
of Year
Dynamic CSRS UAL
EOY CSRS
Payroll PAST FLOW 1987 6.1% 6.0% 8.0% 0.0% 12.1% 2.8% 28.8% (2.4)%1 21.1% 53.6% (34.7)% 235.7% 649.1% 85.2% 1988 5.5% 5.5% 7.9% 0.0% 11.4% 2.7% 27.4% (1.6)%2 21.9% 53.2% (35.3)% 237.6% 631.5% 77.3% 1989 5.1% 5.1% 7.8% 0.0% 10.6% 2.8% 26.2% 0.0% 22.4% 53.7% (35.4)% 245.1% 650.8% 72.4% 1990 4.9% 4.9% 7.8% 0.1% 10.8% 2.9% 26.5% 0.0% 22.3% 53.7% (35.6)% 251.4% 642.8% 69.5% 1991 4.6% 4.6% 8.1% 0.7% 10.5% 2.9% 26.8% 0.0% 22.8% 54.2% (35.8)% 257.2% 636.7% 66.2% 1992 4.5% 4.5% 8.1% 0.8% 10.0% 2.8% 26.2% 0.0% 22.4% 53.1% (33.6)% 261.6% 607.1% 63.7% 1993 4.4% 4.3% 9.0% 0.9% 9.7% 2.9% 26.8% 0.0% 22.6% 53.8% (34.7)% 276.3% 537.8% 61.2% 1994 4.1% 4.2% 8.9% 1.0% 9.7% 2.9% 26.1% 0.0% 22.4% 52.6% (35.1)% 286.3% 526.0% 58.9% 1995 3.9% 4.0% 9.2% 1.1% 8.7% 2.9% 25.9% 0.0% 23.2% 53.0% (36.3)% 296.9% 520.9% 55.8% 1996 3.7% 3.8% 9.4% 0.9% 8.4% 3.0% 25.5% 0.0% 23.7% 52.9% (36.4)% 305.3% 480.7% 53.4% 1997 3.6% 3.7% 9.6% 1.0% 9.0% 3.1% 26.2% 0.0% 21.7% 51.7% (37.6)% 315.5% 472.4% 51.4% 1998 3.5% 4.2% 9.9% 0.8% 8.6% 3.1% 26.7% 0.0% 23.5% 53.6% (38.6)% 329.1% 459.9% 50.4% 1999 3.1% 4.0% 9.7% 0.8% 7.9% 3.0% 25.4% 0.0% 21.9% 50.5% (37.2)% 325.1% 443.4% 45.9% 2000 3.2% 3.6% 9.7% 0.8% 7.4% 2.9% 24.4% 0.0% 21.2% 48.8% (36.4)% 326.8% 431.3% 43.6% 2001 2.9% 3.3% 9.5% 0.9% 6.9% 3.0% 23.6% 0.0% 20.9% 47.4% (36.5)% 323.0% 420.0% 41.0% 2002 2.7% 3.2% 9.3% 1.0% 6.7% 2.8% 23.0% 0.0% 19.9% 45.6% (35.9)% 317.7% 405.9% 38.7% 2003 2.5% 2.9% 7.1% 0.0% 6.3% 2.3% 18.6% 0.0% 19.0% 40.1% (34.6)% 304.8% 386.9% 35.7% 2004 2.3% 3.2% 7.0% 0.2% 8.4% 2.2% 21.0% 0.0% 16.8% 40.1% (34.3)% 297.3% 375.6% 32.9% 2005 2.1% 2.7% 6.8% 0.2% 8.1% 2.1% 19.9% 0.0% 15.9% 37.8% (34.4)% 290.0% 385.0% 30.0% 2006 1.9% 2.5% 6.7% 0.2% 9.1% 2.1% 20.6% 0.0% 15.2% 37.7% (35.2)% 284.0% 378.2% 27.1% 2007 1.7% 1.4% 6.4% 0.0% 8.9% 3.8% 20.5% 0.0% 14.3% 36.5% (46.2)%3 264.3% 393.0% 24.5% 2008 1.5% 1.2% 6.0% 0.0% 9.5% 2.4% 19.1% 0.0% 12.9% 33.5% (35.2)% 250.6% 398.7% 22.1% 2009 1.3% 1.1% 5.6% 0.0% 9.1% 2.3% 18.2% 0.0% 11.4% 30.8% (34.7)% 230.1% 366.3% 19.4% 2010 1.2% 0.9% 5.2% 0.0% 9.3% 2.1% 17.7% 0.0% 10.3% 29.2% (33.5)% 213.9% 332.2% 16.7% 2011 1.0% 0.9% 4.8% 0.0% 9.0% 2.0% 16.7% 0.0% 9.0% 26.8% (32.5)% 201.3% 375.8% 14.5% 2012 0.9% 0.7% 4.7% 0.0% 9.3% 2.0% 16.8% 0.0% 8.8% 26.4% (34.0)% 194.6% 382.3% 12.5% 2013 0.8% 0.6% 4.6% 0.0% 8.9% 2.0% 16.1% 0.0% 7.2% 24.2% (35.1)% 184.6% 384.5% 10.4% 2014 0.6% 0.5% 4.4% 0.0% 10.3% 1.9% 17.2% 0.0% 6.9% 24.7% (35.5)% 173.3% 384.9% 8.9% 2015 0.7% 0.5% 4.3% 0.0% 10.3% 1.9% 17.0% 0.1% 6.2% 23.8% (35.3)% 158.6% 370.4% 7.4%
1 Transfer of funds from CSRS to FERS for individuals who automatically transferred to FERS on January 1, 1987. 2 Transfer of funds from CSRS to FERS for the individuals electing FERS coverage. 3 Includes a transfer of $17.1 billion to the Postal Service Retiree Health Benefit Fund on June 30, 2007

TABLE 4A: Past and Projected Flow of Plan Assets (CSRS) [Percentage of Total Payroll (CSRS & FERS)]
- 43 -
Fiscal Year
Employee Contribu-
tions
Agency Contribu-
tions
Treasury 30 Year Payment
Postal Amortized Payment
Interest Payment on UAL
Military Service
Payment
Total Government
Contributions
Transfer from (to)
FERS Investment
Income Total
Income Total
Outlays Fund End
of Year
Dynamic CSRS UAL
EOY CSRS
Payroll
PROJECTED FLOW 2016 0.4% 0.4% 4.2% 0.0% 10.4% 1.8% 16.8% 0.1% 7.3% 24.6% (34.4)% 145.9% 367.1% 6.2% 2017 0.3% 0.3% 4.0% 0.6% 10.1% 1.8% 16.8% 0.1% 6.6% 23.8% (33.7)% 131.6% 359.2% 5.1% 2018 0.3% 0.2% 3.8% 0.6% 10.2% 1.7% 16.5% 0.2% 5.8% 22.8% (33.0)% 116.9% 349.4% 4.2% 2019 0.2% 0.2% 3.6% 0.5% 10.2% 1.7% 16.2% 0.2% 5.1% 21.7% (32.2)% 102.4% 339.6% 3.4% 2020 0.2% 0.2% 3.3% 0.5% 10.2% 1.7% 15.9% 0.2% 4.4% 20.7% (31.4)% 88.2% 329.9% 2.7% 2021 0.1% 0.1% 3.1% 0.5% 10.2% 1.6% 15.5% 0.3% 3.7% 19.6% (30.5)% 74.3% 320.3% 2.2% 2022 0.1% 0.1% 2.8% 0.5% 10.2% 1.6% 15.2% 2.2% 3.0% 20.5% (29.7)% 62.7% 309.0% 1.8% 2023 0.1% 0.1% 2.6% 0.5% 10.0% 1.5% 14.7% 9.8% 2.5% 27.1% (28.7)% 59.0% 290.3% 1.4% 2024 0.1% 0.1% 2.4% 0.5% 9.5% 1.5% 13.9% 9.8% 2.3% 26.1% (27.8)% 55.4% 272.1% 1.1% 2025 0.1% 0.1% 2.1% 0.4% 9.0% 1.4% 13.1% 9.8% 2.1% 25.1% (26.8)% 51.9% 254.2% 0.9% 2026 0.0% 0.0% 2.0% 0.4% 8.5% 1.4% 12.3% 9.7% 2.0% 24.0% (25.8)% 48.4% 236.9% 0.7% 2027 0.0% 0.0% 1.8% 0.4% 8.0% 1.3% 11.6% 9.5% 1.8% 23.0% (24.7)% 45.1% 220.1% 0.5% 2028 0.0% 0.0% 1.7% 0.4% 7.6% 1.2% 10.9% 9.3% 1.7% 21.9% (23.7)% 41.9% 203.9% 0.4% 2029 0.0% 0.0% 1.5% 0.4% 7.1% 1.2% 10.2% 9.2% 1.6% 20.9% (22.6)% 38.8% 188.3% 0.3% 2030 0.0% 0.0% 1.3% 0.4% 6.6% 1.1% 9.4% 9.0% 1.4% 19.8% (21.6)% 35.8% 173.4% 0.2%
2035 0.0% 0.0% 0.5% 0.3% 4.4% 0.9% 6.1% 7.7% 0.9% 14.7% (16.2)% 22.9% 108.4% 0.0%
2040 0.0% 0.0% 0.1% 0.3% 2.6% 0.6% 3.7% 5.9% 0.5% 10.0% (11.1)% 13.4% 60.6% 0.0%
2045 0.0% 0.0% 0.1% 0.0% 1.4% 0.4% 1.8% 3.7% 0.3% 5.8% (6.8)% 7.0% 29.4% 0.0%
2050 0.0% 0.0% 0.0% 0.0% 0.6% 0.2% 0.8% 2.0% 0.1% 3.0% (3.5)% 2.9% 12.1% 0.0%
2055 0.0% 0.0% 0.0% 0.0% 0.2% 0.1% 0.3% 1.0% 0.0% 1.3% (1.4)% 1.1% 4.0% 0.0%
2060 0.0% 0.0% 0.0% 0.0% 0.0% 0.0% 0.0% 0.0% 0.1% 0.1% (0.5)% 1.3% 0.1% 0.0%
2065 0.0% 0.0% 0.0% 0.0% 0.0% 0.0% 0.0% 0.0% 0.0% 0.0% (0.1)% 0.3% 0.0% 0.0%
2070 0.0% 0.0% 0.0% 0.0% 0.0% 0.0% 0.0% 0.0% 0.0% 0.0% (0.0)% 0.1% 0.0% 0.0%
2075 0.0% 0.0% 0.0% 0.0% 0.0% 0.0% 0.0% 0.0% 0.0% 0.0% (0.0)% 0.1% 0.0% 0.0%
2080 0.0% 0.0% 0.0% 0.0% 0.0% 0.0% 0.0% 0.0% 0.0% 0.0% (0.0)% 0.0% 0.0% 0.0%
2085 0.0% 0.0% 0.0% 0.0% 0.0% 0.0% 0.0% 0.0% 0.0% 0.0% (0.0)% 0.0% 0.0% 0.0%
2090 0.0% 0.0% 0.0% 0.0% 0.0% 0.0% 0.0% 0.0% 0.0% 0.0% (0.0)% 0.0% 0.0% 0.0%
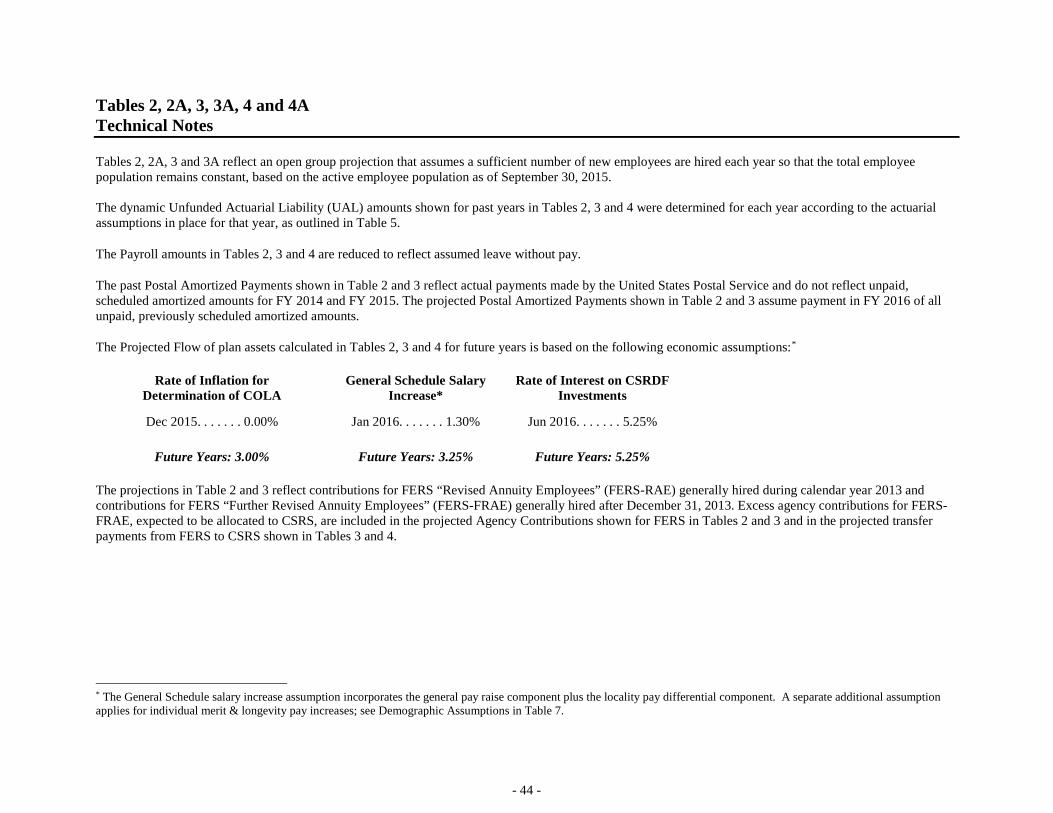
- 44 -
Tables 2, 2A, 3, 3A, 4 and 4A Technical Notes
Tables 2, 2A, 3 and 3A reflect an open group projection that assumes a sufficient number of new employees are hired each year so that the total employee population remains constant, based on the active employee population as of September 30, 2015. The dynamic Unfunded Actuarial Liability (UAL) amounts shown for past years in Tables 2, 3 and 4 were determined for each year according to the actuarial assumptions in place for that year, as outlined in Table 5.
The Payroll amounts in Tables 2, 3 and 4 are reduced to reflect assumed leave without pay.
The past Postal Amortized Payments shown in Table 2 and 3 reflect actual payments made by the United States Postal Service and do not reflect unpaid, scheduled amortized amounts for FY 2014 and FY 2015. The projected Postal Amortized Payments shown in Table 2 and 3 assume payment in FY 2016 of all unpaid, previously scheduled amortized amounts.
The Projected Flow of plan assets calculated in Tables 2, 3 and 4 for future years is based on the following economic assumptions:*
Rate of Inflation for Determination of COLA
General Schedule Salary Increase*
Rate of Interest on CSRDF Investments
Dec 2015. . . . . . . 0.00% Jan 2016. . . . . . . 1.30% Jun 2016. . . . . . . 5.25%
Future Years: 3.00% Future Years: 3.25% Future Years: 5.25%
The projections in Table 2 and 3 reflect contributions for FERS “Revised Annuity Employees” (FERS-RAE) generally hired during calendar year 2013 and contributions for FERS “Further Revised Annuity Employees” (FERS-FRAE) generally hired after December 31, 2013. Excess agency contributions for FERS-FRAE, expected to be allocated to CSRS, are included in the projected Agency Contributions shown for FERS in Tables 2 and 3 and in the projected transfer payments from FERS to CSRS shown in Tables 3 and 4.
* The General Schedule salary increase assumption incorporates the general pay raise component plus the locality pay differential component. A separate additional assumption applies for individual merit & longevity pay increases; see Demographic Assumptions in Table 7.

- 45 -
Table 5 Valuation Assumption History
Recommend Date Effective for Valuation Dates
Long Term Economic Assumptions Normal Cost Percentage
Inflation Interest Salary
Growth CSRS FERS FERS-RAE
FERS-FRAE
10/1/1979 9/30/1979 - 9/30/1982 5.00% 6.00% 5.50% 36.8% N/A N/A N/A 10/1/1983* 9/30/1983 - 9/30/1986 5.00% 6.50% 5.50% 34.8% 16.1% N/A N/A 10/1/1987 9/30/1987 - 9/30/1988 5.00% 7.00% 5.00% 28.9% 13.8% N/A N/A 4/1/1989 9/30/1989 - 9/30/1992 5.00% 7.00% 5.00% 28.3% 13.7% N/A N/A 12/31/1992 9/30/1993 - 9/30/1995 4.50% 7.00% 4.50% 25.1% 12.2% N/A N/A 2/11/1997* 9/30/1996 - 9/30/1999 4.00% 7.00% 4.25% 24.2% 11.5% N/A N/A 3/16/2001 9/30/2000 - 9/30/2001 3.75% 6.75% 4.25% 24.4% 11.5% N/A N/A 5/8/2003 9/30/2002 - 9/30/2004 3.25% 6.25% 4.00% 25.0% 12.0% N/A N/A 6/8/2006* 9/30/2005 - 9/30/2006 3.50% 6.25% 4.25% 25.2% 12.0% N/A N/A 7/25/2008* 9/30/2007 - 9/30/2008 3.50% 6.25% 4.25% 25.8% 12.3% N/A N/A 6/11/2010 9/30/2009 - 9/30/2010 3.00% 5.75% 3.75% 26.0% 12.7% N/A N/A 7/13/2012* 9/30/2011 - 9/30/2011 3.00% 5.25% 3.25% 29.1% 14.0% 14.2% N/A 6/18/2013* 9/30/2012 - 3.00% 5.25% 3.25% 29.3% 14.5% 15.0% 15.1%
* Change in Demographic Assumptions
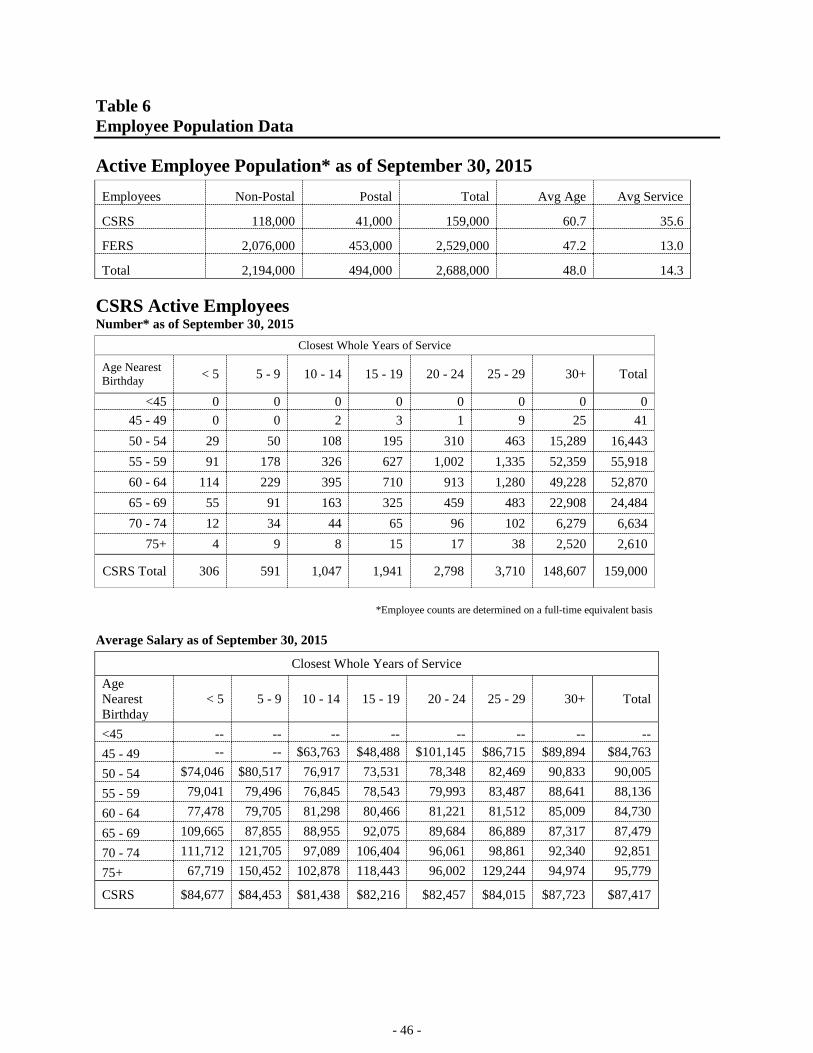
- 46 -
Table 6 Employee Population Data
Active Employee Population* as of September 30, 2015 Employees Non-Postal Postal Total Avg Age Avg Service
CSRS 118,000 41,000 159,000 60.7 35.6
FERS 2,076,000 453,000 2,529,000 47.2 13.0
Total 2,194,000 494,000 2,688,000 48.0 14.3
CSRS Active Employees Number* as of September 30, 2015
Closest Whole Years of Service Age Nearest Birthday < 5 5 - 9 10 - 14 15 - 19 20 - 24 25 - 29 30+ Total
<45 0 0 0 0 0 0 0 0 45 - 49 0 0 2 3 1 9 25 41 50 - 54 29 50 108 195 310 463 15,289 16,443 55 - 59 91 178 326 627 1,002 1,335 52,359 55,918 60 - 64 114 229 395 710 913 1,280 49,228 52,870 65 - 69 55 91 163 325 459 483 22,908 24,484 70 - 74 12 34 44 65 96 102 6,279 6,634
75+ 4 9 8 15 17 38 2,520 2,610
CSRS Total 306 591 1,047 1,941 2,798 3,710 148,607 159,000
*Employee counts are determined on a full-time equivalent basis
Average Salary as of September 30, 2015
Closest Whole Years of Service Age Nearest Birthday
< 5 5 - 9 10 - 14 15 - 19 20 - 24 25 - 29 30+ Total
<45 -- -- -- -- -- -- -- -- 45 - 49 -- -- $63,763 $48,488 $101,145 $86,715 $89,894 $84,763 50 - 54 $74,046 $80,517 76,917 73,531 78,348 82,469 90,833 90,005 55 - 59 79,041 79,496 76,845 78,543 79,993 83,487 88,641 88,136 60 - 64 77,478 79,705 81,298 80,466 81,221 81,512 85,009 84,730 65 - 69 109,665 87,855 88,955 92,075 89,684 86,889 87,317 87,479 70 - 74 111,712 121,705 97,089 106,404 96,061 98,861 92,340 92,851 75+ 67,719 150,452 102,878 118,443 96,002 129,244 94,974 95,779
CSRS $84,677 $84,453 $81,438 $82,216 $82,457 $84,015 $87,723 $87,417

Table 6 Employee Population Data
- 47 -
FERS Active Employees Number* as of September 30, 2015
Closest Whole Years of Service
Age Nearest Birthday < 5 5 - 9 10 - 14 15 - 19 20 - 24 25 - 29 30+ Total
15 - 19 343 0 0 0 0 0 0 343 20 - 24 24,925 783 0 0 0 0 0 25,708 25 - 29 85,308 37,241 1,222 0 0 0 0 123,772 30 - 34 99,733 113,779 31,855 1,335 0 0 0 246,702 35 - 39 76,017 104,235 79,220 24,306 817 0 0 284,596 40 - 44 60,810 79,152 72,059 59,384 20,573 2,782 0 294,760 45 - 49 61,090 81,542 65,669 66,588 56,838 44,099 3,851 379,677 50 - 54 50,895 84,915 69,432 57,224 53,507 97,561 46,861 460,396 55 - 59 34,998 63,799 61,294 51,372 41,395 73,939 60,704 387,500 60 - 64 17,762 37,662 36,869 34,334 27,273 39,847 33,709 227,455 65 - 69 5,253 13,350 13,264 11,856 10,143 12,831 11,215 77,912 70 - 74 1,173 2,470 2,639 2,458 2,054 2,658 2,191 15,642 75+ 311 654 702 675 605 844 746 4,538
FERS Total 518,618 619,582 434,226 309,531 213,207 274,559 159,277 2,529,000
*Employee counts are determined on a full-time equivalent basis
Average Salary as of September 30, 2015
Closest Whole Years of Service Age Nearest Birthday < 5 5 - 9 10 - 14 15 - 19 20 - 24 25 - 29 30+ Total
15 - 19 $30,097 -- -- -- -- -- -- $30,097 20 - 24 41,560 $44,281 -- -- -- -- -- 41,643 25 - 29 50,273 63,741 $59,283 -- -- -- -- 54,414 30 - 34 58,877 71,507 73,179 $72,379 -- -- -- 66,622 35 - 39 65,414 75,313 79,601 78,218 $80,802 -- -- 74,126 40 - 44 65,365 77,593 80,465 80,863 81,233 $87,867 -- 76,782 45 - 49 65,259 75,603 79,469 81,480 86,444 89,204 $89,195 78,979 50 - 54 67,306 76,383 77,659 79,340 84,003 89,443 87,820 80,757 55 - 59 68,902 77,220 77,769 77,119 81,374 83,298 85,261 79,406 60 - 64 73,529 79,345 79,426 77,677 80,538 83,044 84,259 80,171 65 - 69 82,978 82,718 81,400 81,548 83,524 84,751 87,757 83,498 70 - 74 93,840 91,968 85,309 86,269 88,407 88,459 92,330 89,076 75+ 97,948 102,166 90,182 87,337 94,944 90,847 93,713 93,359
FERS $61,433 $75,051 $78,719 $79,578 $83,471 $86,581 $86,210 $76,107

- 48 -
Table 7 Demographic Assumptions
MALE Normal Retirement Rates-CSRS
Age (ANB)
Service 5 - 9 0 - 14 15-19 20 21-29 30 31+
55 0.0000 0.0000 0.0000 0.0000 0.0000 0.1810 0.3472 56 - 59 0.0000 0.0000 0.0000 0.0000 0.0000 0.1580 0.1614
60 0.0000 0.0000 0.0000 0.3017 0.2224 0.2374 0.1947 61 0.0000 0.0000 0.0000 0.2385 0.1116 0.1401 0.1803 62 0.2897 0.3702 0.3629 0.3412 0.1441 0.1699 0.2038 63 0.1538 0.1641 0.1688 0.1974 0.1279 0.1570 0.1907 64 0.1756 0.1937 0.1692 0.1802 0.1366 0.1421 0.1984 65 0.3046 0.3649 0.3108 0.3079 0.1982 0.2225 0.2335
66 - 69 0.2104 0.2300 0.2020 0.2254 0.1594 0.1802 0.1937 70-74 0.1775 0.2006 0.2090 0.2055 0.1667 0.1886 0.1745
Normal Retirement Rates-FERS Age
(ANB) Service
5 - 9 10-14 15-19 20 21-29 30 31+ MRA 0.0000 0.0000 0.0000 0.0000 0.0000 0.1308 0.2297
58* - 59 0.0000 0.0000 0.0000 0.0000 0.0000 0.0867 0.0916 60 0.0000 0.0000 0.0000 0.2180 0.1472 0.1304 0.1105 61 0.0000 0.0000 0.0000 0.1310 0.0633 0.0770 0.1023 62 0.2572 0.1964 0.2037 0.3184 0.2036 0.2402 0.2881 63 0.0830 0.1063 0.1041 0.2054 0.1210 0.1570 0.1907 64 0.0875 0.1045 0.1091 0.1695 0.1150 0.1421 0.1984 65 0.1289 0.1752 0.1894 0.2862 0.1734 0.2225 0.2335
66 - 69 0.1133 0.1354 0.1391 0.2195 0.1475 0.1802 0.1937 70-74 0.1244 0.1310 0.1381 0.2063 0.1354 0.1886 0.1745
Involuntary Retirement Age CSRS FERS 42 0.0213 0.0073 43 0.0213 0.0073 44 0.0213 0.0073 45 0.0178 0.0092 46 0.0160 0.0100 47 0.0159 0.0105 48 0.0170 0.0097 49 0.0191 0.0104 50 0.0220 0.0109 51 0.0253 0.0107 52 0.0290 0.0103 53 0.0326 0.0118 54 0.036 0.0151 55 0.0389 0.0179 56 0.0410 0.0185 57 0.0422 0.0170 58 0.0421 0.0169
59+ 0.0405 0.0170
* FERS retirement rate for ages “58-59” applies for [Minimum Retirement Age+1] through age 59
Merit/Longevity Salary Increases
SERVICE Age Nearest Birthday
17-24 25-29 30-34 35-44 45-54 55+ 0 0.0850 0.0765 0.0563 0.0465 0.0437 0.0348 1 0.0915 0.0943 0.0768 0.0643 0.0563 0.0449 2 0.0832 0.0849 0.0671 0.0542 0.0476 0.0391 3 0.0654 0.0690 0.0553 0.0438 0.0387 0.0331 4 0.0657 0.0627 0.0541 0.0446 0.0390 0.0327 5 0.0645 0.0499 0.0421 0.0334 0.0299 0.0277 6 0.0688 0.0465 0.0380 0.0296 0.0263 0.0247 7 0.0761 0.0445 0.0359 0.0284 0.0244 0.0224 8 0.0000 0.0448 0.0334 0.0252 0.0216 0.0197 9 0.0000 0.0471 0.0341 0.0266 0.0219 0.0188
10 0.0000 0.0482 0.0325 0.0237 0.0186 0.0161 11 0.0000 0.0515 0.0321 0.0222 0.0168 0.0146 12 0.0000 0.0552 0.0325 0.0217 0.0163 0.0145 13 0.0000 0.0000 0.0323 0.0197 0.0147 0.0127 14 0.0000 0.0000 0.0335 0.0189 0.0132 0.0116 15 0.0000 0.0000 0.0349 0.0186 0.0126 0.0107 16 0.0000 0.0000 0.0376 0.0193 0.0131 0.0111 17 0.0000 0.0000 0.0393 0.0189 0.0127 0.0106 18 0.0000 0.0000 0.0000 0.0184 0.0119 0.0097 19 0.0000 0.0000 0.0000 0.0186 0.0125 0.0099
20+ 0.0000 0.0000 0.0000 0.0177 0.0112 0.0075
Assumed Distribution of New Entrants Age
(ANB) Amount Prior Service (Years)
0-1 2-5 6-10 11-15 16-20 17-19 787 1 0 0 0 20-24 7052 396 63 0 0 25-29 7521 914 744 34 0 30-34 6278 772 831 293 10 35-39 6102 684 618 340 63 40-44 8274 753 464 283 78 45-49 7012 728 325 201 74 50-54 4723 743 235 118 51 55-59 2585 697 160 66 30 60-64 898 249 63 20 9 65-69 229 58 16 4 3 70-74 68 19 4 1 0 75+ 5 2 0 0 0
Assumed New Entrants : Average Salary (as of FY 2010) Age
(ANB) Amount Prior Service (Years)
0-1 2-5 6-10 11-15 16-20 17-19 $31,389 $34,028 - - - 20-24 $40,349 $37,919 $42,515 - - 25-29 $46,608 $42,582 $45,626 $49,515 - 30-34 $56,360 $46,376 $52,145 $51,413 $51,988 35-39 $58,167 $48,647 $54,269 $56,780 $52,814 40-44 $57,543 $50,832 $53,644 $56,191 $54,873 45-49 $60,001 $48,878 $54,454 $55,603 $54,093 50-54 $63,232 $47,685 $54,072 $57,975 $56,076 55-59 $65,238 $47,883 $55,113 $60,669 $58,841 60-64 $71,214 $51,893 $56,940 $62,376 $66,430 65-69 $76,308 $52,255 $60,636 $66,488 $63,581 70-74 $76,926 $46,763 $48,732 $51,517 - 75+ $70,088 $38,793 - - -
MRA+10 Retirement
Age FERS
55 0.0150 56 0.0142 57 0.0135 58 0.0156 59 0.0191 60 0.0404 61 0.0580

Table 7 Demographic Assumptions
MALE
- 49 -
Withdrawal Rates (Offset for Re-entry)
SERVICE Age Nearest Birthday
17-24 25-29 30-34 35-39 40-44 45+ 0 0.0019 0.0022 0.0024 0.0023 0.0023 0.0033 1 0.0665 0.0473 0.0483 0.0407 0.0281 0.0281 2 0.0908 0.0664 0.0602 0.0581 0.0382 0.0386 3 0.0915 0.0642 0.0585 0.0586 0.0394 0.0351 4 0.0605 0.0517 0.0473 0.0441 0.0319 0.0284 5 0.0576 0.0474 0.0416 0.0403 0.0321 0.0262 6 0.0654 0.0456 0.0386 0.0364 0.0323 0.0240 7 0.0407 0.0451 0.0369 0.0348 0.0313 0.0215 8 0.0000 0.0432 0.0337 0.0304 0.0273 0.0197 9 0.0000 0.0452 0.0322 0.0291 0.0262 0.0173
10 0.0000 0.0429 0.0300 0.0255 0.0221 0.0179 11 0.0000 0.0429 0.0264 0.0228 0.0220 0.0166 12 0.0000 0.0453 0.0288 0.0209 0.0195 0.0158 13 0.0000 0.0000 0.0275 0.0187 0.0172 0.0157 14 0.0000 0.0000 0.0308 0.0197 0.0164 0.0135 15 0.0000 0.0000 0.0297 0.0175 0.0144 0.0130 16 0.0000 0.0000 0.0285 0.0159 0.0128 0.0123 17 0.0000 0.0000 0.0309 0.0191 0.0121 0.0113 18 0.0000 0.0000 0.0000 0.0185 0.0110 0.0101 19 0.0000 0.0000 0.0000 0.0177 0.0109 0.0087
20+ 0.0000 0.0000 0.0000 0.0167 0.0099 0.0049
% Withdrawing Employees Electing Refunds SERVICE CSRS FERS FERS-RAE FERS-FRAE
0 1.0000 1.0000 1.0000 1.0000 1 1.0000 1.0000 1.0000 1.0000 2 1.0000 1.0000 1.0000 1.0000 3 1.0000 1.0000 1.0000 1.0000 4 1.0000 1.0000 1.0000 1.0000 5 0.9300 0.9100 0.9200 0.9200 6 0.9200 0.8700 0.8900 0.9000 7 0.9200 0.8200 0.8600 0.8800 8 0.9100 0.7800 0.8300 0.8600 9 0.9100 0.7300 0.8000 0.8300
10 0.9100 0.6900 0.7700 0.8200 11 0.9100 0.6400 0.7400 0.8000 12 0.9000 0.6000 0.7100 0.7700 13 0.8900 0.5500 0.6800 0.7500 14 0.8900 0.5100 0.6500 0.7300 15 0.8800 0.4600 0.6200 0.7000 16 0.8800 0.4200 0.5900 0.6900 17 0.8700 0.3700 0.5600 0.6600 18 0.8600 0.3300 0.5300 0.6400 19 0.8600 0.2800 0.5000 0.6200
20+ 0.7800 0.2400 0.4400 0.5500

Table 7 Demographic Assumptions
MALE
- 50 -
Death Rate Fiscal Year Annual
Improvement Age 2014 2015 2016 2017 2018 2019 2020 2021+ 17 0.00064 0.00063 0.00062 0.00061 0.00060 0.00059 0.00059 0.010 18 0.00059 0.00058 0.00057 0.00056 0.00055 0.00054 0.00054 0.010 19 0.00055 0.00053 0.00053 0.00052 0.00051 0.00050 0.00050 0.010 20 0.00051 0.00050 0.00049 0.00048 0.00047 0.00047 0.00046 0.010 21 0.00047 0.00046 0.00045 0.00044 0.00044 0.00043 0.00043 0.010 22 0.00043 0.00042 0.00041 0.00041 0.00040 0.00040 0.00039 0.010 23 0.00039 0.00039 0.00038 0.00037 0.00037 0.00036 0.00036 0.010 24 0.00036 0.00036 0.00035 0.00034 0.00034 0.00034 0.00033 0.010 25 0.00034 0.00033 0.00033 0.00032 0.00032 0.00031 0.00031 0.010 26 0.00032 0.00032 0.00031 0.00030 0.00030 0.00030 0.00029 0.010 27 0.00031 0.00030 0.00030 0.00029 0.00029 0.00029 0.00028 0.010 28 0.00031 0.00030 0.00029 0.00029 0.00028 0.00028 0.00028 0.010 29 0.00031 0.00030 0.00030 0.00029 0.00029 0.00029 0.00028 0.010 30 0.00032 0.00032 0.00031 0.00031 0.00030 0.00030 0.00030 0.010 31 0.00035 0.00034 0.00033 0.00033 0.00032 0.00032 0.00032 0.010 32 0.00037 0.00036 0.00035 0.00035 0.00034 0.00034 0.00034 0.010 33 0.00037 0.00037 0.00036 0.00035 0.00035 0.00034 0.00034 0.010 34 0.00037 0.00037 0.00036 0.00035 0.00035 0.00034 0.00034 0.010 35 0.00039 0.00038 0.00037 0.00037 0.00036 0.00036 0.00035 0.010 36 0.00042 0.00042 0.00041 0.00040 0.00040 0.00039 0.00039 0.010 37 0.00048 0.00047 0.00046 0.00046 0.00045 0.00044 0.00044 0.010 38 0.00054 0.00053 0.00052 0.00051 0.00051 0.00050 0.00050 0.010 39 0.00060 0.00059 0.00058 0.00057 0.00056 0.00055 0.00055 0.010 40 0.00064 0.00063 0.00062 0.00061 0.00060 0.00059 0.00059 0.010 41 0.00070 0.00068 0.00067 0.00066 0.00065 0.00064 0.00064 0.010 42 0.00076 0.00075 0.00073 0.00072 0.00071 0.00071 0.00070 0.010 43 0.00084 0.00082 0.00081 0.00080 0.00079 0.00078 0.00077 0.010 44 0.00091 0.00089 0.00087 0.00086 0.00085 0.00084 0.00083 0.010 45 0.00096 0.00095 0.00093 0.00092 0.00090 0.00089 0.00089 0.010 46 0.00104 0.00102 0.00101 0.00099 0.00098 0.00097 0.00096 0.010 47 0.00115 0.00113 0.00111 0.00110 0.00108 0.00107 0.00106 0.010 48 0.00128 0.00126 0.00124 0.00122 0.00120 0.00119 0.00117 0.010 49 0.00141 0.00139 0.00137 0.00135 0.00133 0.00131 0.00130 0.010 50 0.00153 0.00151 0.00148 0.00146 0.00144 0.00143 0.00141 0.010 51 0.00167 0.00164 0.00162 0.00159 0.00157 0.00156 0.00154 0.010 52 0.00184 0.00181 0.00178 0.00176 0.00174 0.00172 0.00170 0.010 53 0.00201 0.00198 0.00195 0.00193 0.00190 0.00188 0.00186 0.010 54 0.00213 0.00209 0.00206 0.00204 0.00201 0.00199 0.00197 0.010 55 0.00219 0.00216 0.00213 0.00210 0.00207 0.00205 0.00203 0.010 56 0.00226 0.00222 0.00219 0.00216 0.00213 0.00210 0.00208 0.010 57 0.00235 0.00231 0.00227 0.00224 0.00221 0.00218 0.00216 0.010 58 0.00249 0.00244 0.00240 0.00237 0.00234 0.00231 0.00229 0.010 59 0.00265 0.00260 0.00255 0.00252 0.00248 0.00245 0.00243 0.010 60 0.00279 0.00274 0.00269 0.00265 0.00262 0.00258 0.00256 0.010 61 0.00293 0.00287 0.00282 0.00278 0.00274 0.00271 0.00268 0.010 62 0.00307 0.00301 0.00295 0.00291 0.00287 0.00283 0.00280 0.010 63 0.00326 0.00320 0.00314 0.00309 0.00305 0.00302 0.00299 0.010 64 0.00353 0.00346 0.00340 0.00335 0.00330 0.00327 0.00323 0.010 65 0.00384 0.00377 0.00371 0.00365 0.00360 0.00356 0.00352 0.010 66 0.00422 0.00414 0.00407 0.00401 0.00396 0.00391 0.00387 0.010 67 0.00467 0.00458 0.00451 0.00444 0.00438 0.00433 0.00429 0.010 68 0.00521 0.00511 0.00503 0.00496 0.00489 0.00484 0.00479 0.010 69 0.00583 0.00573 0.00564 0.00555 0.00548 0.00542 0.00537 0.010 70 0.00653 0.00642 0.00632 0.00622 0.00614 0.00607 0.00601 0.010 71 0.00725 0.00713 0.00702 0.00693 0.00684 0.00676 0.00669 0.010 72 0.00796 0.00783 0.00771 0.00760 0.00751 0.00742 0.00735 0.010 73 0.00862 0.00848 0.00836 0.00824 0.00814 0.00805 0.00797 0.010 74 0.00923 0.00909 0.00896 0.00884 0.00873 0.00863 0.00855 0.010 75 0.00980 0.00965 0.00952 0.00939 0.00928 0.00918 0.00909 0.010
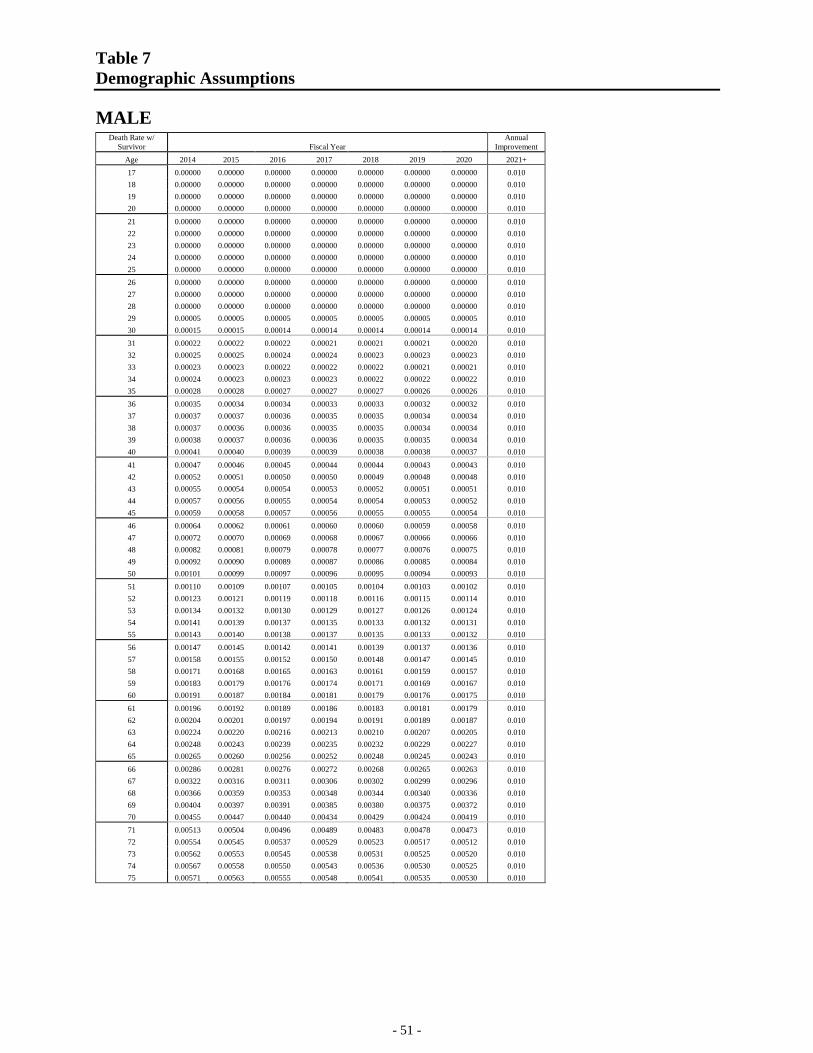
Table 7 Demographic Assumptions
MALE
- 51 -
Death Rate w/ Survivor Fiscal Year
Annual Improvement
Age 2014 2015 2016 2017 2018 2019 2020 2021+ 17 0.00000 0.00000 0.00000 0.00000 0.00000 0.00000 0.00000 0.010 18 0.00000 0.00000 0.00000 0.00000 0.00000 0.00000 0.00000 0.010 19 0.00000 0.00000 0.00000 0.00000 0.00000 0.00000 0.00000 0.010 20 0.00000 0.00000 0.00000 0.00000 0.00000 0.00000 0.00000 0.010 21 0.00000 0.00000 0.00000 0.00000 0.00000 0.00000 0.00000 0.010 22 0.00000 0.00000 0.00000 0.00000 0.00000 0.00000 0.00000 0.010 23 0.00000 0.00000 0.00000 0.00000 0.00000 0.00000 0.00000 0.010 24 0.00000 0.00000 0.00000 0.00000 0.00000 0.00000 0.00000 0.010 25 0.00000 0.00000 0.00000 0.00000 0.00000 0.00000 0.00000 0.010 26 0.00000 0.00000 0.00000 0.00000 0.00000 0.00000 0.00000 0.010 27 0.00000 0.00000 0.00000 0.00000 0.00000 0.00000 0.00000 0.010 28 0.00000 0.00000 0.00000 0.00000 0.00000 0.00000 0.00000 0.010 29 0.00005 0.00005 0.00005 0.00005 0.00005 0.00005 0.00005 0.010 30 0.00015 0.00015 0.00014 0.00014 0.00014 0.00014 0.00014 0.010 31 0.00022 0.00022 0.00022 0.00021 0.00021 0.00021 0.00020 0.010 32 0.00025 0.00025 0.00024 0.00024 0.00023 0.00023 0.00023 0.010 33 0.00023 0.00023 0.00022 0.00022 0.00022 0.00021 0.00021 0.010 34 0.00024 0.00023 0.00023 0.00023 0.00022 0.00022 0.00022 0.010 35 0.00028 0.00028 0.00027 0.00027 0.00027 0.00026 0.00026 0.010 36 0.00035 0.00034 0.00034 0.00033 0.00033 0.00032 0.00032 0.010 37 0.00037 0.00037 0.00036 0.00035 0.00035 0.00034 0.00034 0.010 38 0.00037 0.00036 0.00036 0.00035 0.00035 0.00034 0.00034 0.010 39 0.00038 0.00037 0.00036 0.00036 0.00035 0.00035 0.00034 0.010 40 0.00041 0.00040 0.00039 0.00039 0.00038 0.00038 0.00037 0.010 41 0.00047 0.00046 0.00045 0.00044 0.00044 0.00043 0.00043 0.010 42 0.00052 0.00051 0.00050 0.00050 0.00049 0.00048 0.00048 0.010 43 0.00055 0.00054 0.00054 0.00053 0.00052 0.00051 0.00051 0.010 44 0.00057 0.00056 0.00055 0.00054 0.00054 0.00053 0.00052 0.010 45 0.00059 0.00058 0.00057 0.00056 0.00055 0.00055 0.00054 0.010 46 0.00064 0.00062 0.00061 0.00060 0.00060 0.00059 0.00058 0.010 47 0.00072 0.00070 0.00069 0.00068 0.00067 0.00066 0.00066 0.010 48 0.00082 0.00081 0.00079 0.00078 0.00077 0.00076 0.00075 0.010 49 0.00092 0.00090 0.00089 0.00087 0.00086 0.00085 0.00084 0.010 50 0.00101 0.00099 0.00097 0.00096 0.00095 0.00094 0.00093 0.010 51 0.00110 0.00109 0.00107 0.00105 0.00104 0.00103 0.00102 0.010 52 0.00123 0.00121 0.00119 0.00118 0.00116 0.00115 0.00114 0.010 53 0.00134 0.00132 0.00130 0.00129 0.00127 0.00126 0.00124 0.010 54 0.00141 0.00139 0.00137 0.00135 0.00133 0.00132 0.00131 0.010 55 0.00143 0.00140 0.00138 0.00137 0.00135 0.00133 0.00132 0.010 56 0.00147 0.00145 0.00142 0.00141 0.00139 0.00137 0.00136 0.010 57 0.00158 0.00155 0.00152 0.00150 0.00148 0.00147 0.00145 0.010 58 0.00171 0.00168 0.00165 0.00163 0.00161 0.00159 0.00157 0.010 59 0.00183 0.00179 0.00176 0.00174 0.00171 0.00169 0.00167 0.010 60 0.00191 0.00187 0.00184 0.00181 0.00179 0.00176 0.00175 0.010 61 0.00196 0.00192 0.00189 0.00186 0.00183 0.00181 0.00179 0.010 62 0.00204 0.00201 0.00197 0.00194 0.00191 0.00189 0.00187 0.010 63 0.00224 0.00220 0.00216 0.00213 0.00210 0.00207 0.00205 0.010 64 0.00248 0.00243 0.00239 0.00235 0.00232 0.00229 0.00227 0.010 65 0.00265 0.00260 0.00256 0.00252 0.00248 0.00245 0.00243 0.010 66 0.00286 0.00281 0.00276 0.00272 0.00268 0.00265 0.00263 0.010 67 0.00322 0.00316 0.00311 0.00306 0.00302 0.00299 0.00296 0.010 68 0.00366 0.00359 0.00353 0.00348 0.00344 0.00340 0.00336 0.010 69 0.00404 0.00397 0.00391 0.00385 0.00380 0.00375 0.00372 0.010 70 0.00455 0.00447 0.00440 0.00434 0.00429 0.00424 0.00419 0.010 71 0.00513 0.00504 0.00496 0.00489 0.00483 0.00478 0.00473 0.010 72 0.00554 0.00545 0.00537 0.00529 0.00523 0.00517 0.00512 0.010 73 0.00562 0.00553 0.00545 0.00538 0.00531 0.00525 0.00520 0.010 74 0.00567 0.00558 0.00550 0.00543 0.00536 0.00530 0.00525 0.010 75 0.00571 0.00563 0.00555 0.00548 0.00541 0.00535 0.00530 0.010

Table 7 Demographic Assumptions
MALE
- 52 -
Age Non-Disability Annuitant Death Rate
Death Rate for Spouse Survivor of Male Annual
Improvement Duration 3+ Duration
1 Duration
2 2015 2016 2017 2018 2019 2020 2015 2016 2017 2018 2019 2020 2020 2020 2021+
17 0.00287 0.00285 0.00283 0.00281 0.00278 0.00275 0.01906 0.01893 0.01878 0.01862 0.01845 0.01827 0.0087 0.0052 0.0100 18 0.00287 0.00285 0.00283 0.00281 0.00278 0.00275 0.01906 0.01893 0.01878 0.01862 0.01845 0.01827 0.0087 0.0052 0.0100 19 0.00287 0.00285 0.00283 0.00281 0.00278 0.00275 0.01906 0.01893 0.01878 0.01862 0.01845 0.01827 0.0087 0.0052 0.0100 20 0.00287 0.00285 0.00283 0.00281 0.00278 0.00275 0.01906 0.01893 0.01878 0.01862 0.01845 0.01827 0.0087 0.0052 0.0100 21 0.00287 0.00285 0.00283 0.00281 0.00278 0.00275 0.01906 0.01893 0.01878 0.01862 0.01845 0.01827 0.0087 0.0052 0.0100 22 0.00287 0.00285 0.00283 0.00281 0.00278 0.00275 0.01906 0.01893 0.01878 0.01862 0.01845 0.01827 0.0087 0.0052 0.0100 23 0.00287 0.00285 0.00283 0.00281 0.00278 0.00275 0.01906 0.01893 0.01878 0.01862 0.01845 0.01827 0.0087 0.0052 0.0100 24 0.00287 0.00285 0.00283 0.00281 0.00278 0.00275 0.01906 0.01893 0.01878 0.01862 0.01845 0.01827 0.0087 0.0052 0.0100 25 0.00287 0.00285 0.00283 0.00281 0.00278 0.00275 0.01906 0.01893 0.01878 0.01862 0.01845 0.01827 0.0087 0.0052 0.0100 26 0.00287 0.00285 0.00283 0.00281 0.00278 0.00275 0.01906 0.01893 0.01878 0.01862 0.01845 0.01827 0.0087 0.0052 0.0100 27 0.00287 0.00285 0.00283 0.00281 0.00278 0.00275 0.01906 0.01893 0.01878 0.01862 0.01845 0.01827 0.0087 0.0052 0.0100 28 0.00287 0.00285 0.00283 0.00281 0.00278 0.00275 0.01906 0.01893 0.01878 0.01862 0.01845 0.01827 0.0087 0.0052 0.0100 29 0.00287 0.00285 0.00283 0.00281 0.00278 0.00275 0.01906 0.01893 0.01878 0.01862 0.01845 0.01827 0.0087 0.0052 0.0100 30 0.00287 0.00285 0.00283 0.00281 0.00278 0.00275 0.01906 0.01893 0.01878 0.01862 0.01845 0.01827 0.0087 0.0052 0.0100 31 0.00287 0.00285 0.00283 0.00281 0.00278 0.00275 0.01906 0.01893 0.01878 0.01862 0.01845 0.01827 0.0087 0.0052 0.0100 32 0.00287 0.00285 0.00283 0.00281 0.00278 0.00275 0.01906 0.01893 0.01878 0.01862 0.01845 0.01827 0.0087 0.0052 0.0100 33 0.00287 0.00285 0.00283 0.00281 0.00278 0.00275 0.01906 0.01893 0.01878 0.01862 0.01845 0.01827 0.0087 0.0052 0.0100 34 0.00287 0.00285 0.00283 0.00281 0.00278 0.00275 0.01906 0.01893 0.01878 0.01862 0.01845 0.01827 0.0087 0.0052 0.0100 35 0.00287 0.00285 0.00283 0.00281 0.00278 0.00275 0.01906 0.01893 0.01878 0.01862 0.01845 0.01827 0.0087 0.0052 0.0100 36 0.00287 0.00285 0.00283 0.00281 0.00278 0.00275 0.00619 0.00614 0.00610 0.00604 0.00599 0.00593 0.0029 0.0015 0.0100 37 0.00287 0.00285 0.00283 0.00281 0.00278 0.00275 0.00033 0.00033 0.00033 0.00032 0.00032 0.00032 0.0010 0.0000 0.0100 38 0.00287 0.00285 0.00283 0.00281 0.00278 0.00275 0.00000 0.00000 0.00000 0.00000 0.00000 0.00000 0.0019 0.0000 0.0100 39 0.00287 0.00285 0.00283 0.00281 0.00278 0.00275 0.00190 0.00189 0.00187 0.00186 0.00184 0.00182 0.0033 0.0000 0.0100 40 0.00287 0.00285 0.00283 0.00281 0.00278 0.00275 0.00347 0.00345 0.00342 0.00339 0.00336 0.00333 0.0031 0.0014 0.0100 41 0.00287 0.00285 0.00283 0.00281 0.00278 0.00275 0.00252 0.00250 0.00248 0.00246 0.00244 0.00241 0.0026 0.0031 0.0100 42 0.00287 0.00285 0.00283 0.00281 0.00278 0.00275 0.00188 0.00187 0.00186 0.00184 0.00182 0.00180 0.0024 0.0042 0.0100 43 0.00287 0.00285 0.00283 0.00281 0.00278 0.00275 0.00278 0.00276 0.00274 0.00272 0.00269 0.00267 0.0016 0.0046 0.0100 44 0.00287 0.00285 0.00283 0.00281 0.00278 0.00275 0.00280 0.00278 0.00276 0.00274 0.00271 0.00269 0.0014 0.0040 0.0100 45 0.00287 0.00285 0.00283 0.00281 0.00278 0.00275 0.00241 0.00239 0.00237 0.00235 0.00233 0.00231 0.0021 0.0020 0.0100 46 0.00287 0.00285 0.00283 0.00281 0.00278 0.00275 0.00295 0.00292 0.00290 0.00288 0.00285 0.00282 0.0030 0.0011 0.0100 47 0.00287 0.00285 0.00283 0.00281 0.00278 0.00275 0.00375 0.00372 0.00369 0.00366 0.00363 0.00359 0.0033 0.0022 0.0100 48 0.00287 0.00285 0.00283 0.00281 0.00278 0.00275 0.00307 0.00305 0.00302 0.00300 0.00297 0.00294 0.0032 0.0042 0.0100 49 0.00287 0.00285 0.00283 0.00280 0.00278 0.00275 0.00408 0.00405 0.00402 0.00398 0.00395 0.00391 0.0034 0.0046 0.0100 50 0.00282 0.00280 0.00278 0.00275 0.00273 0.00270 0.00505 0.00501 0.00497 0.00493 0.00489 0.00484 0.0028 0.0028 0.0100 51 0.00415 0.00411 0.00408 0.00404 0.00400 0.00396 0.00461 0.00458 0.00454 0.00450 0.00446 0.00441 0.0012 0.0013 0.0100 52 0.00402 0.00398 0.00394 0.00390 0.00386 0.00383 0.00366 0.00363 0.00360 0.00357 0.00354 0.00350 0.0019 0.0013 0.0100 53 0.00357 0.00353 0.00349 0.00346 0.00342 0.00339 0.00346 0.00343 0.00340 0.00337 0.00334 0.00330 0.0044 0.0028 0.0100 54 0.00444 0.00439 0.00434 0.00429 0.00425 0.00421 0.00460 0.00455 0.00451 0.00446 0.00442 0.00437 0.0049 0.0056 0.0100 55 0.00425 0.00420 0.00415 0.00411 0.00406 0.00402 0.00452 0.00447 0.00442 0.00438 0.00433 0.00429 0.0032 0.0067 0.0100 56 0.00482 0.00476 0.00470 0.00464 0.00459 0.00455 0.00490 0.00484 0.00479 0.00474 0.00469 0.00464 0.0026 0.0058 0.0100 57 0.00506 0.00499 0.00492 0.00486 0.00481 0.00476 0.00533 0.00527 0.00521 0.00515 0.00510 0.00505 0.0033 0.0037 0.0100 58 0.00500 0.00492 0.00486 0.00480 0.00474 0.00470 0.00601 0.00594 0.00587 0.00580 0.00574 0.00569 0.0040 0.0041 0.0100 59 0.00525 0.00517 0.00509 0.00503 0.00497 0.00492 0.00644 0.00636 0.00629 0.00622 0.00615 0.00609 0.0048 0.0058 0.0100 60 0.00569 0.00560 0.00552 0.00545 0.00538 0.00533 0.00717 0.00708 0.00700 0.00692 0.00685 0.00678 0.0055 0.0069 0.0100 61 0.00625 0.00615 0.00606 0.00598 0.00591 0.00585 0.00804 0.00794 0.00785 0.00777 0.00768 0.00761 0.0063 0.0062 0.0100 62 0.00665 0.00654 0.00644 0.00635 0.00628 0.00622 0.00829 0.00819 0.00810 0.00801 0.00793 0.00785 0.0054 0.0069 0.0100 63 0.00684 0.00672 0.00661 0.00652 0.00645 0.00638 0.00900 0.00889 0.00879 0.00870 0.00861 0.00852 0.0067 0.0094 0.0100 64 0.00761 0.00747 0.00735 0.00725 0.00717 0.00709 0.01048 0.01036 0.01025 0.01014 0.01003 0.00993 0.0086 0.0098 0.0100 65 0.00873 0.00857 0.00844 0.00832 0.00822 0.00814 0.01114 0.01102 0.01090 0.01078 0.01067 0.01056 0.0092 0.0099 0.0100
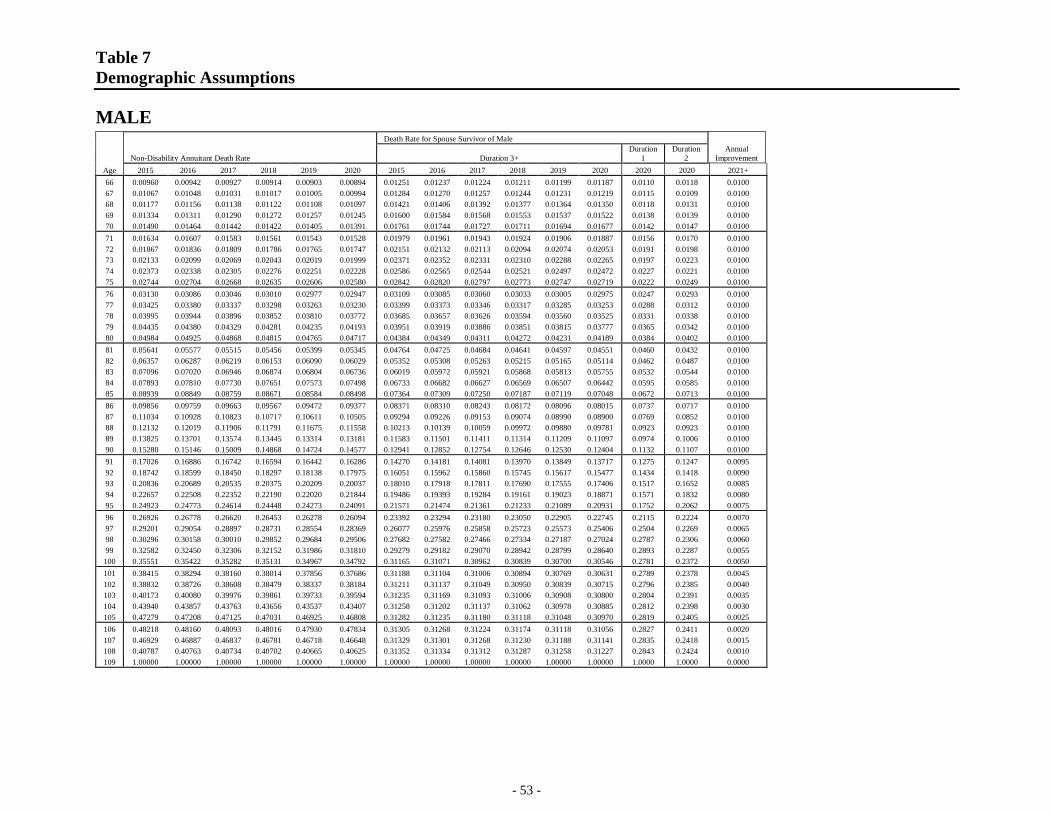
Table 7 Demographic Assumptions
MALE
- 53 -
Age Non-Disability Annuitant Death Rate
Death Rate for Spouse Survivor of Male Annual
Improvement Duration 3+ Duration
1 Duration
2 2015 2016 2017 2018 2019 2020 2015 2016 2017 2018 2019 2020 2020 2020 2021+
66 0.00960 0.00942 0.00927 0.00914 0.00903 0.00894 0.01251 0.01237 0.01224 0.01211 0.01199 0.01187 0.0110 0.0118 0.0100 67 0.01067 0.01048 0.01031 0.01017 0.01005 0.00994 0.01284 0.01270 0.01257 0.01244 0.01231 0.01219 0.0115 0.0109 0.0100 68 0.01177 0.01156 0.01138 0.01122 0.01108 0.01097 0.01421 0.01406 0.01392 0.01377 0.01364 0.01350 0.0118 0.0131 0.0100 69 0.01334 0.01311 0.01290 0.01272 0.01257 0.01245 0.01600 0.01584 0.01568 0.01553 0.01537 0.01522 0.0138 0.0139 0.0100 70 0.01490 0.01464 0.01442 0.01422 0.01405 0.01391 0.01761 0.01744 0.01727 0.01711 0.01694 0.01677 0.0142 0.0147 0.0100 71 0.01634 0.01607 0.01583 0.01561 0.01543 0.01528 0.01979 0.01961 0.01943 0.01924 0.01906 0.01887 0.0156 0.0170 0.0100 72 0.01867 0.01836 0.01809 0.01786 0.01765 0.01747 0.02151 0.02132 0.02113 0.02094 0.02074 0.02053 0.0191 0.0198 0.0100 73 0.02133 0.02099 0.02069 0.02043 0.02019 0.01999 0.02371 0.02352 0.02331 0.02310 0.02288 0.02265 0.0197 0.0223 0.0100 74 0.02373 0.02338 0.02305 0.02276 0.02251 0.02228 0.02586 0.02565 0.02544 0.02521 0.02497 0.02472 0.0227 0.0221 0.0100 75 0.02744 0.02704 0.02668 0.02635 0.02606 0.02580 0.02842 0.02820 0.02797 0.02773 0.02747 0.02719 0.0222 0.0249 0.0100 76 0.03130 0.03086 0.03046 0.03010 0.02977 0.02947 0.03109 0.03085 0.03060 0.03033 0.03005 0.02975 0.0247 0.0293 0.0100 77 0.03425 0.03380 0.03337 0.03298 0.03263 0.03230 0.03399 0.03373 0.03346 0.03317 0.03285 0.03253 0.0288 0.0312 0.0100 78 0.03995 0.03944 0.03896 0.03852 0.03810 0.03772 0.03685 0.03657 0.03626 0.03594 0.03560 0.03525 0.0331 0.0338 0.0100 79 0.04435 0.04380 0.04329 0.04281 0.04235 0.04193 0.03951 0.03919 0.03886 0.03851 0.03815 0.03777 0.0365 0.0342 0.0100 80 0.04984 0.04925 0.04868 0.04815 0.04765 0.04717 0.04384 0.04349 0.04311 0.04272 0.04231 0.04189 0.0384 0.0402 0.0100 81 0.05641 0.05577 0.05515 0.05456 0.05399 0.05345 0.04764 0.04725 0.04684 0.04641 0.04597 0.04551 0.0460 0.0432 0.0100 82 0.06357 0.06287 0.06219 0.06153 0.06090 0.06029 0.05352 0.05308 0.05263 0.05215 0.05165 0.05114 0.0462 0.0487 0.0100 83 0.07096 0.07020 0.06946 0.06874 0.06804 0.06736 0.06019 0.05972 0.05921 0.05868 0.05813 0.05755 0.0532 0.0544 0.0100 84 0.07893 0.07810 0.07730 0.07651 0.07573 0.07498 0.06733 0.06682 0.06627 0.06569 0.06507 0.06442 0.0595 0.0585 0.0100 85 0.08939 0.08849 0.08759 0.08671 0.08584 0.08498 0.07364 0.07309 0.07250 0.07187 0.07119 0.07048 0.0672 0.0713 0.0100 86 0.09856 0.09759 0.09663 0.09567 0.09472 0.09377 0.08371 0.08310 0.08243 0.08172 0.08096 0.08015 0.0737 0.0717 0.0100 87 0.11034 0.10928 0.10823 0.10717 0.10611 0.10505 0.09294 0.09226 0.09153 0.09074 0.08990 0.08900 0.0769 0.0852 0.0100 88 0.12132 0.12019 0.11906 0.11791 0.11675 0.11558 0.10213 0.10139 0.10059 0.09972 0.09880 0.09781 0.0923 0.0923 0.0100 89 0.13825 0.13701 0.13574 0.13445 0.13314 0.13181 0.11583 0.11501 0.11411 0.11314 0.11209 0.11097 0.0974 0.1006 0.0100 90 0.15280 0.15146 0.15009 0.14868 0.14724 0.14577 0.12941 0.12852 0.12754 0.12646 0.12530 0.12404 0.1132 0.1107 0.0100 91 0.17026 0.16886 0.16742 0.16594 0.16442 0.16286 0.14270 0.14181 0.14081 0.13970 0.13849 0.13717 0.1275 0.1247 0.0095 92 0.18742 0.18599 0.18450 0.18297 0.18138 0.17975 0.16051 0.15962 0.15860 0.15745 0.15617 0.15477 0.1434 0.1418 0.0090 93 0.20836 0.20689 0.20535 0.20375 0.20209 0.20037 0.18010 0.17918 0.17811 0.17690 0.17555 0.17406 0.1517 0.1652 0.0085 94 0.22657 0.22508 0.22352 0.22190 0.22020 0.21844 0.19486 0.19393 0.19284 0.19161 0.19023 0.18871 0.1571 0.1832 0.0080 95 0.24923 0.24773 0.24614 0.24448 0.24273 0.24091 0.21571 0.21474 0.21361 0.21233 0.21089 0.20931 0.1752 0.2062 0.0075 96 0.26926 0.26778 0.26620 0.26453 0.26278 0.26094 0.23392 0.23294 0.23180 0.23050 0.22905 0.22745 0.2115 0.2224 0.0070 97 0.29201 0.29054 0.28897 0.28731 0.28554 0.28369 0.26077 0.25976 0.25858 0.25723 0.25573 0.25406 0.2504 0.2269 0.0065 98 0.30296 0.30158 0.30010 0.29852 0.29684 0.29506 0.27682 0.27582 0.27466 0.27334 0.27187 0.27024 0.2787 0.2306 0.0060 99 0.32582 0.32450 0.32306 0.32152 0.31986 0.31810 0.29279 0.29182 0.29070 0.28942 0.28799 0.28640 0.2893 0.2287 0.0055 100 0.35551 0.35422 0.35282 0.35131 0.34967 0.34792 0.31165 0.31071 0.30962 0.30839 0.30700 0.30546 0.2781 0.2372 0.0050 101 0.38415 0.38294 0.38160 0.38014 0.37856 0.37686 0.31188 0.31104 0.31006 0.30894 0.30769 0.30631 0.2789 0.2378 0.0045 102 0.38832 0.38726 0.38608 0.38479 0.38337 0.38184 0.31211 0.31137 0.31049 0.30950 0.30839 0.30715 0.2796 0.2385 0.0040 103 0.40173 0.40080 0.39976 0.39861 0.39733 0.39594 0.31235 0.31169 0.31093 0.31006 0.30908 0.30800 0.2804 0.2391 0.0035 104 0.43940 0.43857 0.43763 0.43656 0.43537 0.43407 0.31258 0.31202 0.31137 0.31062 0.30978 0.30885 0.2812 0.2398 0.0030 105 0.47279 0.47208 0.47125 0.47031 0.46925 0.46808 0.31282 0.31235 0.31180 0.31118 0.31048 0.30970 0.2819 0.2405 0.0025 106 0.48218 0.48160 0.48093 0.48016 0.47930 0.47834 0.31305 0.31268 0.31224 0.31174 0.31118 0.31056 0.2827 0.2411 0.0020 107 0.46929 0.46887 0.46837 0.46781 0.46718 0.46648 0.31329 0.31301 0.31268 0.31230 0.31188 0.31141 0.2835 0.2418 0.0015 108 0.40787 0.40763 0.40734 0.40702 0.40665 0.40625 0.31352 0.31334 0.31312 0.31287 0.31258 0.31227 0.2843 0.2424 0.0010 109 1.00000 1.00000 1.00000 1.00000 1.00000 1.00000 1.00000 1.00000 1.00000 1.00000 1.00000 1.00000 1.0000 1.0000 0.0000
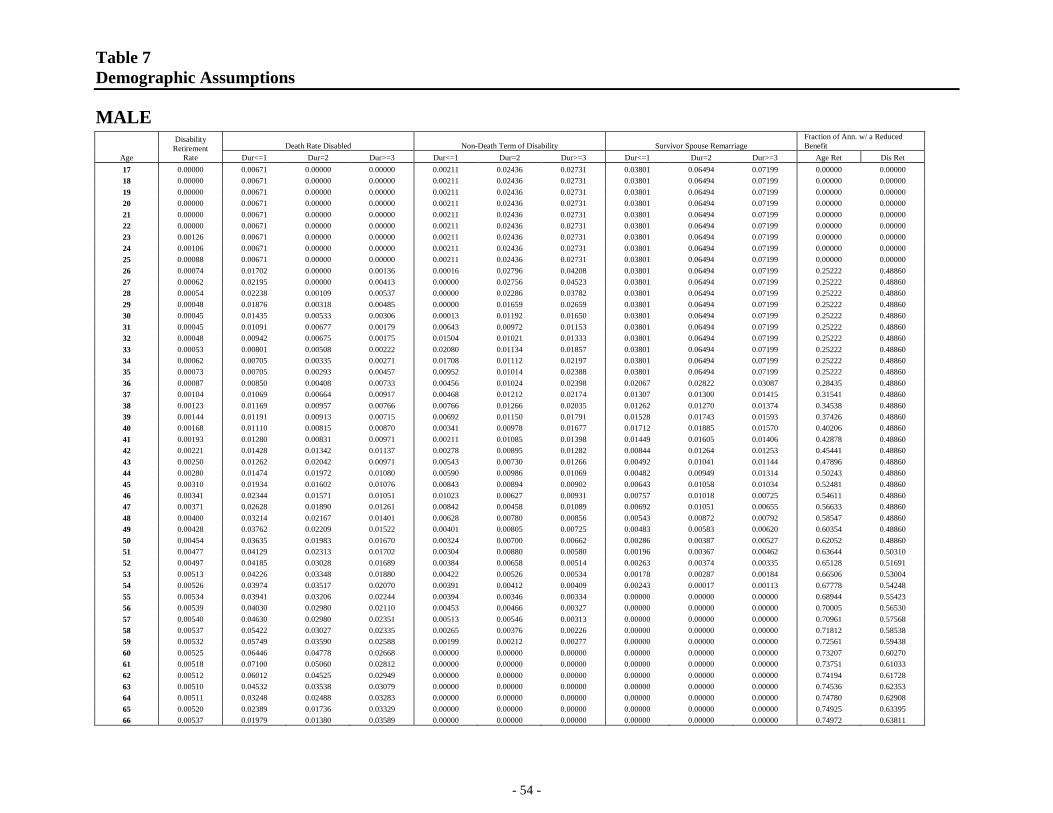
Table 7 Demographic Assumptions
MALE
- 54 -
Age
Disability Retirement
Rate Death Rate Disabled Non-Death Term of Disability Survivor Spouse Remarriage
Fraction of Ann. w/ a Reduced Benefit
Dur<=1 Dur=2 Dur>=3 Dur<=1 Dur=2 Dur>=3 Dur<=1 Dur=2 Dur>=3 Age Ret Dis Ret 17 0.00000 0.00671 0.00000 0.00000 0.00211 0.02436 0.02731 0.03801 0.06494 0.07199 0.00000 0.00000 18 0.00000 0.00671 0.00000 0.00000 0.00211 0.02436 0.02731 0.03801 0.06494 0.07199 0.00000 0.00000 19 0.00000 0.00671 0.00000 0.00000 0.00211 0.02436 0.02731 0.03801 0.06494 0.07199 0.00000 0.00000 20 0.00000 0.00671 0.00000 0.00000 0.00211 0.02436 0.02731 0.03801 0.06494 0.07199 0.00000 0.00000 21 0.00000 0.00671 0.00000 0.00000 0.00211 0.02436 0.02731 0.03801 0.06494 0.07199 0.00000 0.00000 22 0.00000 0.00671 0.00000 0.00000 0.00211 0.02436 0.02731 0.03801 0.06494 0.07199 0.00000 0.00000 23 0.00126 0.00671 0.00000 0.00000 0.00211 0.02436 0.02731 0.03801 0.06494 0.07199 0.00000 0.00000 24 0.00106 0.00671 0.00000 0.00000 0.00211 0.02436 0.02731 0.03801 0.06494 0.07199 0.00000 0.00000 25 0.00088 0.00671 0.00000 0.00000 0.00211 0.02436 0.02731 0.03801 0.06494 0.07199 0.00000 0.00000 26 0.00074 0.01702 0.00000 0.00136 0.00016 0.02796 0.04208 0.03801 0.06494 0.07199 0.25222 0.48860 27 0.00062 0.02195 0.00000 0.00413 0.00000 0.02756 0.04523 0.03801 0.06494 0.07199 0.25222 0.48860 28 0.00054 0.02238 0.00109 0.00537 0.00000 0.02286 0.03782 0.03801 0.06494 0.07199 0.25222 0.48860 29 0.00048 0.01876 0.00318 0.00485 0.00000 0.01659 0.02659 0.03801 0.06494 0.07199 0.25222 0.48860 30 0.00045 0.01435 0.00533 0.00306 0.00013 0.01192 0.01650 0.03801 0.06494 0.07199 0.25222 0.48860 31 0.00045 0.01091 0.00677 0.00179 0.00643 0.00972 0.01153 0.03801 0.06494 0.07199 0.25222 0.48860 32 0.00048 0.00942 0.00675 0.00175 0.01504 0.01021 0.01333 0.03801 0.06494 0.07199 0.25222 0.48860 33 0.00053 0.00801 0.00508 0.00222 0.02080 0.01134 0.01857 0.03801 0.06494 0.07199 0.25222 0.48860 34 0.00062 0.00705 0.00335 0.00271 0.01708 0.01112 0.02197 0.03801 0.06494 0.07199 0.25222 0.48860 35 0.00073 0.00705 0.00293 0.00457 0.00952 0.01014 0.02388 0.03801 0.06494 0.07199 0.25222 0.48860 36 0.00087 0.00850 0.00408 0.00733 0.00456 0.01024 0.02398 0.02067 0.02822 0.03087 0.28435 0.48860 37 0.00104 0.01069 0.00664 0.00917 0.00468 0.01212 0.02174 0.01307 0.01300 0.01415 0.31541 0.48860 38 0.00123 0.01169 0.00957 0.00766 0.00766 0.01266 0.02035 0.01262 0.01270 0.01374 0.34538 0.48860 39 0.00144 0.01191 0.00913 0.00715 0.00692 0.01150 0.01791 0.01528 0.01743 0.01593 0.37426 0.48860 40 0.00168 0.01110 0.00815 0.00870 0.00341 0.00978 0.01677 0.01712 0.01885 0.01570 0.40206 0.48860 41 0.00193 0.01280 0.00831 0.00971 0.00211 0.01085 0.01398 0.01449 0.01605 0.01406 0.42878 0.48860 42 0.00221 0.01428 0.01342 0.01137 0.00278 0.00895 0.01282 0.00844 0.01264 0.01253 0.45441 0.48860 43 0.00250 0.01262 0.02042 0.00971 0.00543 0.00730 0.01266 0.00492 0.01041 0.01144 0.47896 0.48860 44 0.00280 0.01474 0.01972 0.01080 0.00590 0.00986 0.01069 0.00482 0.00949 0.01314 0.50243 0.48860 45 0.00310 0.01934 0.01602 0.01076 0.00843 0.00894 0.00902 0.00643 0.01058 0.01034 0.52481 0.48860 46 0.00341 0.02344 0.01571 0.01051 0.01023 0.00627 0.00931 0.00757 0.01018 0.00725 0.54611 0.48860 47 0.00371 0.02628 0.01890 0.01261 0.00842 0.00458 0.01089 0.00692 0.01051 0.00655 0.56633 0.48860 48 0.00400 0.03214 0.02167 0.01401 0.00628 0.00780 0.00856 0.00543 0.00872 0.00792 0.58547 0.48860 49 0.00428 0.03762 0.02209 0.01522 0.00401 0.00805 0.00725 0.00483 0.00583 0.00620 0.60354 0.48860 50 0.00454 0.03635 0.01983 0.01670 0.00324 0.00700 0.00662 0.00286 0.00387 0.00527 0.62052 0.48860 51 0.00477 0.04129 0.02313 0.01702 0.00304 0.00880 0.00580 0.00196 0.00367 0.00462 0.63644 0.50310 52 0.00497 0.04185 0.03028 0.01689 0.00384 0.00658 0.00514 0.00263 0.00374 0.00335 0.65128 0.51691 53 0.00513 0.04226 0.03348 0.01880 0.00422 0.00526 0.00534 0.00178 0.00287 0.00184 0.66506 0.53004 54 0.00526 0.03974 0.03517 0.02070 0.00391 0.00412 0.00409 0.00243 0.00017 0.00113 0.67778 0.54248 55 0.00534 0.03941 0.03206 0.02244 0.00394 0.00346 0.00334 0.00000 0.00000 0.00000 0.68944 0.55423 56 0.00539 0.04030 0.02980 0.02110 0.00453 0.00466 0.00327 0.00000 0.00000 0.00000 0.70005 0.56530 57 0.00540 0.04630 0.02980 0.02351 0.00513 0.00546 0.00313 0.00000 0.00000 0.00000 0.70961 0.57568 58 0.00537 0.05422 0.03027 0.02335 0.00265 0.00376 0.00226 0.00000 0.00000 0.00000 0.71812 0.58538 59 0.00532 0.05749 0.03590 0.02588 0.00199 0.00212 0.00277 0.00000 0.00000 0.00000 0.72561 0.59438 60 0.00525 0.06446 0.04778 0.02668 0.00000 0.00000 0.00000 0.00000 0.00000 0.00000 0.73207 0.60270 61 0.00518 0.07100 0.05060 0.02812 0.00000 0.00000 0.00000 0.00000 0.00000 0.00000 0.73751 0.61033 62 0.00512 0.06012 0.04525 0.02949 0.00000 0.00000 0.00000 0.00000 0.00000 0.00000 0.74194 0.61728 63 0.00510 0.04532 0.03538 0.03079 0.00000 0.00000 0.00000 0.00000 0.00000 0.00000 0.74536 0.62353 64 0.00511 0.03248 0.02488 0.03283 0.00000 0.00000 0.00000 0.00000 0.00000 0.00000 0.74780 0.62908 65 0.00520 0.02389 0.01736 0.03329 0.00000 0.00000 0.00000 0.00000 0.00000 0.00000 0.74925 0.63395 66 0.00537 0.01979 0.01380 0.03589 0.00000 0.00000 0.00000 0.00000 0.00000 0.00000 0.74972 0.63811

Table 7 Demographic Assumptions
MALE
- 55 -
Age
Disability Retirement
Rate Death Rate Disabled Non-Death Term of Disability Survivor Spouse Remarriage
Fraction of Ann. w/ a Reduced Benefit
Dur<=1 Dur=2 Dur>=3 Dur<=1 Dur=2 Dur>=3 Dur<=1 Dur=2 Dur>=3 Age Ret Dis Ret 67 0.00566 0.01972 0.01348 0.03896 0.00000 0.00000 0.00000 0.00000 0.00000 0.00000 0.74923 0.64157 68 0.00608 0.02311 0.01516 0.03814 0.00000 0.00000 0.00000 0.00000 0.00000 0.00000 0.74778 0.64432 69 0.00665 0.02930 0.01794 0.04306 0.00000 0.00000 0.00000 0.00000 0.00000 0.00000 0.74539 0.64636 70 0.00740 0.03755 0.02115 0.04334 0.00000 0.00000 0.00000 0.00000 0.00000 0.00000 0.74206 0.64768 71 0.00835 0.03755 0.02115 0.04902 0.00000 0.00000 0.00000 0.00000 0.00000 0.00000 0.73780 0.64828 72 0.00953 0.03755 0.02115 0.05057 0.00000 0.00000 0.00000 0.00000 0.00000 0.00000 0.73263 0.64815 73 0.01095 0.03755 0.02115 0.05298 0.00000 0.00000 0.00000 0.00000 0.00000 0.00000 0.72654 0.64729 74 0.01263 0.03755 0.02115 0.05644 0.00000 0.00000 0.00000 0.00000 0.00000 0.00000 0.71955 0.64569 75 0.00000 0.03755 0.02115 0.06083 0.00000 0.00000 0.00000 0.00000 0.00000 0.00000 0.71166 0.64334 76 0.03755 0.02115 0.06445 0.00000 0.00000 0.00000 0.00000 0.00000 0.00000 0.70288 0.64025 77 0.03755 0.02115 0.07144 0.00000 0.00000 0.00000 0.00000 0.00000 0.00000 0.69323 0.63640 78 0.03755 0.02115 0.07385 0.00000 0.00000 0.00000 0.00000 0.00000 0.00000 0.68269 0.63179 79 0.03755 0.02115 0.07981 0.00000 0.00000 0.00000 0.00000 0.00000 0.00000 0.67128 0.62642 80 0.03755 0.02115 0.08789 0.00000 0.00000 0.00000 0.00000 0.00000 0.00000 0.65901 0.62028 81 0.03755 0.02115 0.09073 0.00000 0.00000 0.00000 0.00000 0.00000 0.00000 0.64586 0.61338 82 0.03755 0.02115 0.10143 0.00000 0.00000 0.00000 0.00000 0.00000 0.00000 0.63186 0.60570 83 0.03755 0.02115 0.10760 0.00000 0.00000 0.00000 0.00000 0.00000 0.00000 0.61700 0.59726 84 0.03755 0.02115 0.11592 0.00000 0.00000 0.00000 0.00000 0.00000 0.00000 0.60127 0.58804 85 0.03755 0.02115 0.12676 0.00000 0.00000 0.00000 0.00000 0.00000 0.00000 0.58469 0.57805 86 0.03755 0.02115 0.14102 0.00000 0.00000 0.00000 0.00000 0.00000 0.00000 0.56726 0.56728 87 0.03755 0.02115 0.15036 0.00000 0.00000 0.00000 0.00000 0.00000 0.00000 0.54897 0.55574 88 0.03755 0.02115 0.16819 0.00000 0.00000 0.00000 0.00000 0.00000 0.00000 0.52982 0.54343 89 0.03755 0.02115 0.17481 0.00000 0.00000 0.00000 0.00000 0.00000 0.00000 0.50982 0.53034 90 0.03755 0.02115 0.19484 0.00000 0.00000 0.00000 0.00000 0.00000 0.00000 0.48897 0.51647 91 0.03755 0.02115 0.22175 0.00000 0.00000 0.00000 0.00000 0.00000 0.00000 0.46726 0.50183 92 0.03755 0.02115 0.24119 0.00000 0.00000 0.00000 0.00000 0.00000 0.00000 0.44469 0.48641 93 0.03755 0.02115 0.25402 0.00000 0.00000 0.00000 0.00000 0.00000 0.00000 0.42127 0.47022 94 0.03755 0.02115 0.26279 0.00000 0.00000 0.00000 0.00000 0.00000 0.00000 0.42127 0.47022 95 0.03755 0.02115 0.27807 0.00000 0.00000 0.00000 0.00000 0.00000 0.00000 0.42127 0.47022 96 0.03755 0.02115 0.28936 0.00000 0.00000 0.00000 0.00000 0.00000 0.00000 0.42127 0.47022 97 0.03755 0.02115 0.30795 0.00000 0.00000 0.00000 0.00000 0.00000 0.00000 0.42127 0.47022 98 0.03755 0.02115 0.34861 0.00000 0.00000 0.00000 0.00000 0.00000 0.00000 0.42127 0.47022 99 0.03755 0.02115 0.38228 0.00000 0.00000 0.00000 0.00000 0.00000 0.00000 0.42127 0.47022
100 0.03755 0.02115 0.39319 0.00000 0.00000 0.00000 0.00000 0.00000 0.00000 0.42127 0.47022 101 0.03755 0.02115 0.39319 0.00000 0.00000 0.00000 0.00000 0.00000 0.00000 0.42127 0.47022 102 0.03755 0.02115 0.39319 0.00000 0.00000 0.00000 0.00000 0.00000 0.00000 0.42127 0.47022 103 0.03755 0.02115 0.39319 0.00000 0.00000 0.00000 0.00000 0.00000 0.00000 0.42127 0.47022 104 0.03755 0.02115 0.39319 0.00000 0.00000 0.00000 0.00000 0.00000 0.00000 0.42127 0.47022 105 0.03755 0.02115 0.39319 0.00000 0.00000 0.00000 0.00000 0.00000 0.00000 0.42127 0.47022 106 0.03755 0.02115 0.39319 0.00000 0.00000 0.00000 0.00000 0.00000 0.00000 0.42127 0.47022 107 0.03755 0.02115 0.39319 0.00000 0.00000 0.00000 0.00000 0.00000 0.00000 0.42127 0.47022 108 0.03755 0.02115 0.39319 0.00000 0.00000 0.00000 0.00000 0.00000 0.00000 0.42127 0.47022 109 1.00000 1.00000 1.00000 0.00000 0.00000 0.00000 0.00000 0.00000 0.00000 0.42127 0.47022

- 56 -
Table 7 Demographic Assumptions
FEMALENormal Retirement Rates-CSRS
Age (ANB)
Service 5 - 9 10 - 14 15-19 20 21-29 30 31+
55 0 0 0 0 0 0.2849 0.343 56 - 59 0 0 0 0 0 0.2615 0.1619
60 0 0 0 0.3525 0.2904 0.3105 0.1868 61 0 0 0 0.2861 0.1305 0.1982 0.1738 62 0.2185 0.2684 0.3184 0.3477 0.1595 0.2157 0.1886 63 0.1169 0.1196 0.1346 0.2031 0.1413 0.2185 0.1801 64 0.1336 0.1368 0.1526 0.1941 0.1454 0.2134 0.1847 65 0.2311 0.2552 0.2249 0.2744 0.1885 0.2432 0.2095
66 - 69 0.1579 0.1721 0.1708 0.2202 0.1581 0.2085 0.1783 70-74 0.1403 0.151 0.1716 0.1892 0.1675 0.2307 0.1763
Normal Retirement Rates-FERS Age
(ANB) Service
5 - 9 10-14 15-19 20 21-29 30 31+ MRA 0.0000 0.0000 0.0000 0.0000 0.0000 0.1897 0.1841
58* - 59 0.0000 0.0000 0.0000 0.0000 0.0000 0.1340 0.0835 60 0.0000 0.0000 0.0000 0.2347 0.1559 0.1591 0.0964 61 0.0000 0.0000 0.0000 0.1466 0.0673 0.1015 0.0897 62 0.3635 0.2212 0.2030 0.3411 0.1917 0.2593 0.2267 63 0.1133 0.1125 0.1108 0.2031 0.1256 0.2185 0.1801 64 0.1070 0.1161 0.1073 0.1881 0.1228 0.2134 0.1847 65 0.1907 0.2273 0.2000 0.3175 0.1795 0.2432 0.2095
66 - 69 0.1522 0.1536 0.1479 0.2688 0.1582 0.2085 0.1783 70-74 0.1675 0.1684 0.1562 0.2127 0.1381 0.2307 0.1763
Involuntary Retirement Age CSRS FERS 42 0.0167 0.0073 43 0.0167 0.0073 44 0.0167 0.0073 45 0.0150 0.0083 46 0.0147 0.0093 47 0.0157 0.0104 48 0.0178 0.0104 49 0.0208 0.0118 50 0.0244 0.0122 51 0.0285 0.0126 52 0.0329 0.0127 53 0.0372 0.0148 54 0.0415 0.0189 55 0.0453 0.0221 56 0.0486 0.0241 57 0.0511 0.0234 58 0.0526 0.0244
59+ 0.0530 0.0244
* FERS retirement rate for ages “58-59” applies for [Minimum Retirement Age+1] through age 59.
Merit/Longevity Salary Increases
SERVICE Age Nearest Birthday
17-24 25-29 30-34 35-44 45-54 55+ 0 0.085 0.0765 0.0563 0.0465 0.0437 0.0348 1 0.0915 0.0943 0.0768 0.0643 0.0563 0.0449 2 0.0832 0.0849 0.0671 0.0542 0.0476 0.0391 3 0.0654 0.069 0.0553 0.0438 0.0387 0.0331 4 0.0657 0.0627 0.0541 0.0446 0.039 0.0327 5 0.0645 0.0499 0.0421 0.0334 0.0299 0.0277 6 0.0688 0.0465 0.038 0.0296 0.0263 0.0247 7 0.0761 0.0445 0.0359 0.0284 0.0244 0.0224 8 0 0.0448 0.0334 0.0252 0.0216 0.0197 9 0 0.0471 0.0341 0.0266 0.0219 0.0188
10 0 0.0482 0.0325 0.0237 0.0186 0.0161 11 0 0.0515 0.0321 0.0222 0.0168 0.0146 12 0 0.0552 0.0325 0.0217 0.0163 0.0145 13 0 0 0.0323 0.0197 0.0147 0.0127 14 0 0 0.0335 0.0189 0.0132 0.0116 15 0 0 0.0349 0.0186 0.0126 0.0107 16 0 0 0.0376 0.0193 0.0131 0.0111 17 0 0 0.0393 0.0189 0.0127 0.0106 18 0 0 0 0.0184 0.0119 0.0097 19 0 0 0 0.0186 0.0125 0.0099
20+ 0 0 0 0.0177 0.0112 0.0075
Assumed Distribution of New Entrants Age
(ANB) Amount Prior Service (Years)
0-1 2-5 6-10 11-15 16-20 17-19 670 1 0 0 0 20-24 7293 188 26 0 0 25-29 8626 422 351 15 0 30-34 7575 346 387 115 3 35-39 7120 270 286 130 17 40-44 6870 220 184 106 27 45-49 5697 164 104 69 20 50-54 3871 88 51 31 11 55-59 2002 37 16 10 4 60-64 578 9 3 2 0 65-69 120 3 1 0 0 70-74 31 0 0 0 0 75+ 3 0 0 0 0
Assumed New Entrants : Average Salary (as of FY 2010) Age
(ANB) Amount Prior Service (Years)
0-1 2-5 6-10 11-15 16-20 17-19 $29,435 $32,138 - - - 20-24 $38,102 $34,445 $36,562 - - 25-29 $45,206 $39,233 $40,477 $45,501 - 30-34 $49,826 $42,236 $44,965 $45,661 $48,024 35-39 $49,165 $43,994 $47,090 $48,495 $51,179 40-44 $49,649 $45,860 $46,938 $49,742 $48,899 45-49 $50,948 $46,882 $50,247 $49,951 $52,471 50-54 $53,139 $50,235 $54,404 $54,614 $50,334 55-59 $53,544 $50,753 $54,474 $60,621 $52,959 60-64 $53,408 $48,393 $65,096 $54,673 - 65-69 $50,148 $36,228 $36,663 - - 70-74 $41,762 - - - - 75+ $38,355 - - - -
MRA+10 Retirement Age FERS 55 0.0178 56 0.0174 57 0.0155 58 0.0157 59 0.0182 60 0.0418 61 0.0586
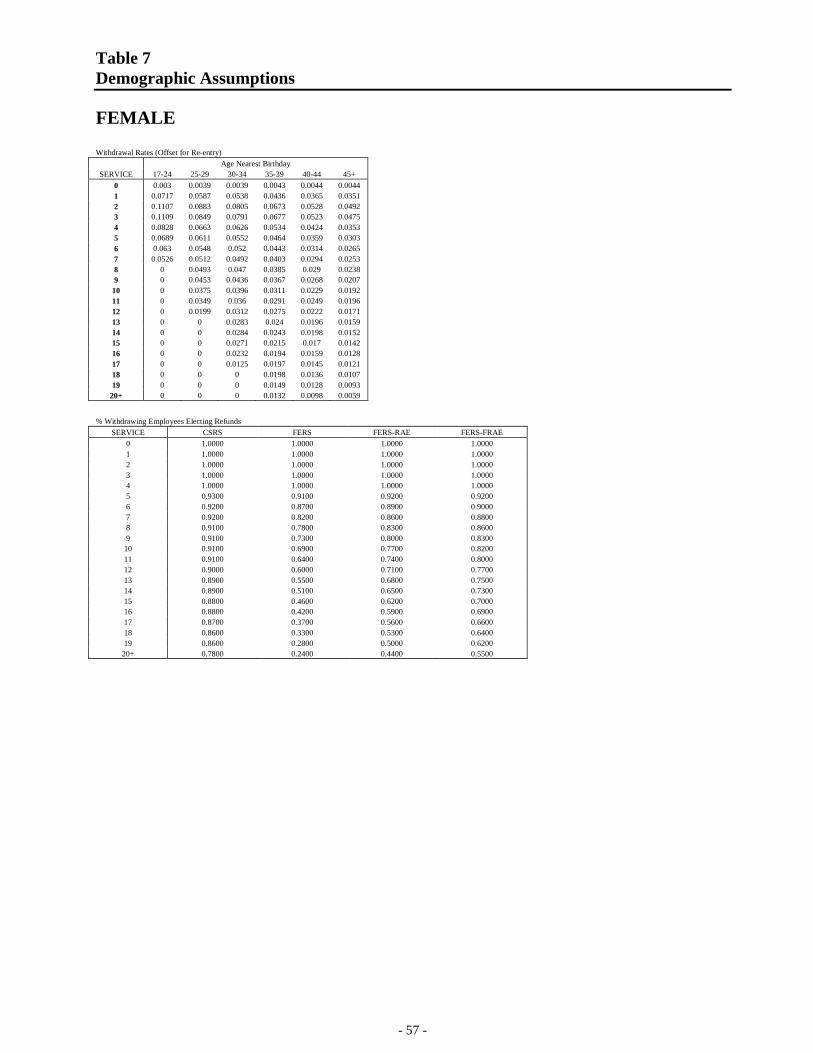
Table 7 Demographic Assumptions
FEMALE
- 57 -
Withdrawal Rates (Offset for Re-entry)
SERVICE Age Nearest Birthday
17-24 25-29 30-34 35-39 40-44 45+ 0 0.003 0.0039 0.0039 0.0043 0.0044 0.0044 1 0.0717 0.0587 0.0538 0.0436 0.0365 0.0351 2 0.1107 0.0883 0.0805 0.0673 0.0528 0.0492 3 0.1109 0.0849 0.0791 0.0677 0.0523 0.0475 4 0.0828 0.0663 0.0626 0.0534 0.0424 0.0353 5 0.0689 0.0611 0.0552 0.0464 0.0359 0.0303 6 0.063 0.0548 0.052 0.0443 0.0314 0.0265 7 0.0526 0.0512 0.0492 0.0403 0.0294 0.0253 8 0 0.0493 0.047 0.0385 0.029 0.0238 9 0 0.0453 0.0436 0.0367 0.0268 0.0207
10 0 0.0375 0.0396 0.0311 0.0229 0.0192 11 0 0.0349 0.036 0.0291 0.0249 0.0196 12 0 0.0199 0.0312 0.0275 0.0222 0.0171 13 0 0 0.0283 0.024 0.0196 0.0159 14 0 0 0.0284 0.0243 0.0198 0.0152 15 0 0 0.0271 0.0215 0.017 0.0142 16 0 0 0.0232 0.0194 0.0159 0.0128 17 0 0 0.0125 0.0197 0.0145 0.0121 18 0 0 0 0.0198 0.0136 0.0107 19 0 0 0 0.0149 0.0128 0.0093
20+ 0 0 0 0.0132 0.0098 0.0059
% Withdrawing Employees Electing Refunds SERVICE CSRS FERS FERS-RAE FERS-FRAE
0 1.0000 1.0000 1.0000 1.0000 1 1.0000 1.0000 1.0000 1.0000 2 1.0000 1.0000 1.0000 1.0000 3 1.0000 1.0000 1.0000 1.0000 4 1.0000 1.0000 1.0000 1.0000 5 0.9300 0.9100 0.9200 0.9200 6 0.9200 0.8700 0.8900 0.9000 7 0.9200 0.8200 0.8600 0.8800 8 0.9100 0.7800 0.8300 0.8600 9 0.9100 0.7300 0.8000 0.8300
10 0.9100 0.6900 0.7700 0.8200 11 0.9100 0.6400 0.7400 0.8000 12 0.9000 0.6000 0.7100 0.7700 13 0.8900 0.5500 0.6800 0.7500 14 0.8900 0.5100 0.6500 0.7300 15 0.8800 0.4600 0.6200 0.7000 16 0.8800 0.4200 0.5900 0.6900 17 0.8700 0.3700 0.5600 0.6600 18 0.8600 0.3300 0.5300 0.6400 19 0.8600 0.2800 0.5000 0.6200
20+ 0.7800 0.2400 0.4400 0.5500

Table 7 Demographic Assumptions
FEMALE
- 58 -
Death Rate Fiscal Year
Annual Improvement
Age 2014 2015 2016 2017 2018 2019 2020 2021+ 17 0.00016 0.00016 0.00015 0.00015 0.00015 0.00015 0.00015 0.010 18 0.00014 0.00014 0.00014 0.00013 0.00013 0.00013 0.00013 0.010 19 0.00013 0.00013 0.00013 0.00013 0.00013 0.00012 0.00012 0.010 20 0.00013 0.00013 0.00013 0.00013 0.00013 0.00012 0.00012 0.010 21 0.00014 0.00014 0.00014 0.00013 0.00013 0.00013 0.00013 0.010 22 0.00015 0.00015 0.00015 0.00015 0.00015 0.00014 0.00014 0.010 23 0.00017 0.00017 0.00016 0.00016 0.00016 0.00016 0.00016 0.010 24 0.00018 0.00018 0.00018 0.00017 0.00017 0.00017 0.00017 0.010 25 0.00019 0.00018 0.00018 0.00018 0.00018 0.00017 0.00017 0.010 26 0.00018 0.00018 0.00018 0.00017 0.00017 0.00017 0.00017 0.010 27 0.00018 0.00018 0.00017 0.00017 0.00017 0.00017 0.00017 0.010 28 0.00018 0.00018 0.00018 0.00017 0.00017 0.00017 0.00017 0.010 29 0.00019 0.00019 0.00018 0.00018 0.00018 0.00018 0.00017 0.010 30 0.00020 0.00020 0.00019 0.00019 0.00019 0.00019 0.00018 0.010 31 0.00022 0.00022 0.00022 0.00021 0.00021 0.00021 0.00020 0.010 32 0.00025 0.00025 0.00024 0.00024 0.00024 0.00023 0.00023 0.010 33 0.00028 0.00028 0.00027 0.00027 0.00027 0.00026 0.00026 0.010 34 0.00031 0.00030 0.00030 0.00029 0.00029 0.00028 0.00028 0.010 35 0.00032 0.00032 0.00031 0.00031 0.00030 0.00030 0.00030 0.010 36 0.00034 0.00033 0.00033 0.00032 0.00032 0.00032 0.00031 0.010 37 0.00036 0.00036 0.00035 0.00035 0.00034 0.00034 0.00034 0.010 38 0.00040 0.00040 0.00039 0.00039 0.00038 0.00038 0.00037 0.010 39 0.00046 0.00046 0.00045 0.00045 0.00044 0.00044 0.00043 0.010 40 0.00054 0.00053 0.00053 0.00052 0.00052 0.00051 0.00050 0.010 41 0.00061 0.00061 0.00060 0.00059 0.00059 0.00058 0.00058 0.010 42 0.00067 0.00066 0.00066 0.00065 0.00064 0.00064 0.00063 0.010 43 0.00071 0.00071 0.00070 0.00069 0.00068 0.00068 0.00067 0.010 44 0.00075 0.00074 0.00073 0.00072 0.00072 0.00071 0.00070 0.010 45 0.00079 0.00078 0.00077 0.00076 0.00075 0.00075 0.00074 0.010 46 0.00085 0.00084 0.00084 0.00083 0.00082 0.00081 0.00080 0.010 47 0.00095 0.00094 0.00093 0.00092 0.00091 0.00090 0.00089 0.010 48 0.00104 0.00103 0.00102 0.00101 0.00100 0.00099 0.00098 0.010 49 0.00112 0.00111 0.00110 0.00108 0.00107 0.00106 0.00105 0.010 50 0.00119 0.00118 0.00117 0.00116 0.00115 0.00113 0.00112 0.010 51 0.00126 0.00125 0.00123 0.00122 0.00121 0.00120 0.00118 0.010 52 0.00132 0.00131 0.00129 0.00128 0.00126 0.00125 0.00124 0.010 53 0.00140 0.00138 0.00137 0.00135 0.00134 0.00132 0.00131 0.010 54 0.00148 0.00146 0.00144 0.00142 0.00141 0.00139 0.00138 0.010 55 0.00150 0.00148 0.00146 0.00144 0.00143 0.00141 0.00140 0.010 56 0.00150 0.00148 0.00146 0.00144 0.00142 0.00141 0.00139 0.010 57 0.00154 0.00152 0.00150 0.00148 0.00146 0.00144 0.00143 0.010 58 0.00165 0.00163 0.00160 0.00158 0.00156 0.00155 0.00153 0.010 59 0.00180 0.00177 0.00175 0.00173 0.00170 0.00169 0.00167 0.010 60 0.00196 0.00193 0.00191 0.00188 0.00186 0.00184 0.00182 0.010 61 0.00212 0.00209 0.00206 0.00203 0.00201 0.00199 0.00197 0.010 62 0.00226 0.00223 0.00220 0.00217 0.00215 0.00212 0.00210 0.010 63 0.00240 0.00237 0.00234 0.00231 0.00229 0.00226 0.00224 0.010 64 0.00257 0.00254 0.00251 0.00248 0.00246 0.00243 0.00241 0.010 65 0.00280 0.00277 0.00274 0.00271 0.00268 0.00265 0.00263 0.010 66 0.00309 0.00306 0.00303 0.00300 0.00296 0.00293 0.00290 0.010 67 0.00344 0.00341 0.00338 0.00334 0.00331 0.00328 0.00324 0.010 68 0.00380 0.00376 0.00373 0.00369 0.00365 0.00362 0.00358 0.010 69 0.00425 0.00421 0.00417 0.00412 0.00408 0.00404 0.00400 0.010 70 0.00481 0.00476 0.00472 0.00467 0.00462 0.00458 0.00453 0.010 71 0.00548 0.00543 0.00538 0.00532 0.00527 0.00522 0.00517 0.010 72 0.00626 0.00620 0.00614 0.00607 0.00601 0.00595 0.00589 0.010 73 0.00711 0.00704 0.00697 0.00690 0.00683 0.00677 0.00670 0.010 74 0.00802 0.00794 0.00787 0.00779 0.00771 0.00763 0.00756 0.010 75 0.00899 0.00890 0.00881 0.00873 0.00864 0.00855 0.00847 0.010

Table 7 Demographic Assumptions
FEMALE
- 59 -
Death
Rate w/ Survivor Fiscal Year
Annual Improvement
Age 2014 2015 2016 2017 2018 2019 2020 2021+ 17 0.00000 0.00000 0.00000 0.00000 0.00000 0.00000 0.00000 0.010 18 0.00000 0.00000 0.00000 0.00000 0.00000 0.00000 0.00000 0.010 19 0.00000 0.00000 0.00000 0.00000 0.00000 0.00000 0.00000 0.010 20 0.00000 0.00000 0.00000 0.00000 0.00000 0.00000 0.00000 0.010 21 0.00000 0.00000 0.00000 0.00000 0.00000 0.00000 0.00000 0.010 22 0.00000 0.00000 0.00000 0.00000 0.00000 0.00000 0.00000 0.010 23 0.00000 0.00000 0.00000 0.00000 0.00000 0.00000 0.00000 0.010 24 0.00000 0.00000 0.00000 0.00000 0.00000 0.00000 0.00000 0.010 25 0.00000 0.00000 0.00000 0.00000 0.00000 0.00000 0.00000 0.010 26 0.00000 0.00000 0.00000 0.00000 0.00000 0.00000 0.00000 0.010 27 0.00000 0.00000 0.00000 0.00000 0.00000 0.00000 0.00000 0.010 28 0.00000 0.00000 0.00000 0.00000 0.00000 0.00000 0.00000 0.010 29 0.00003 0.00003 0.00003 0.00003 0.00003 0.00003 0.00003 0.010 30 0.00007 0.00007 0.00007 0.00007 0.00007 0.00007 0.00007 0.010 31 0.00010 0.00009 0.00009 0.00009 0.00009 0.00009 0.00009 0.010 32 0.00009 0.00009 0.00008 0.00008 0.00008 0.00008 0.00008 0.010 33 0.00008 0.00008 0.00008 0.00008 0.00008 0.00008 0.00008 0.010 34 0.00010 0.00010 0.00010 0.00010 0.00010 0.00009 0.00009 0.010 35 0.00012 0.00012 0.00012 0.00012 0.00012 0.00012 0.00011 0.010 36 0.00014 0.00013 0.00013 0.00013 0.00013 0.00013 0.00013 0.010 37 0.00014 0.00014 0.00014 0.00014 0.00014 0.00013 0.00013 0.010 38 0.00016 0.00016 0.00016 0.00016 0.00015 0.00015 0.00015 0.010 39 0.00020 0.00020 0.00020 0.00019 0.00019 0.00019 0.00019 0.010 40 0.00024 0.00024 0.00024 0.00023 0.00023 0.00023 0.00023 0.010 41 0.00027 0.00027 0.00027 0.00026 0.00026 0.00026 0.00026 0.010 42 0.00029 0.00029 0.00029 0.00028 0.00028 0.00028 0.00028 0.010 43 0.00032 0.00032 0.00031 0.00031 0.00031 0.00030 0.00030 0.010 44 0.00036 0.00035 0.00035 0.00035 0.00034 0.00034 0.00034 0.010 45 0.00040 0.00039 0.00039 0.00038 0.00038 0.00038 0.00037 0.010 46 0.00044 0.00043 0.00043 0.00042 0.00042 0.00041 0.00041 0.010 47 0.00047 0.00046 0.00046 0.00045 0.00045 0.00044 0.00044 0.010 48 0.00048 0.00047 0.00047 0.00046 0.00046 0.00045 0.00045 0.010 49 0.00048 0.00048 0.00047 0.00047 0.00046 0.00046 0.00045 0.010 50 0.00051 0.00051 0.00050 0.00049 0.00049 0.00048 0.00048 0.010 51 0.00056 0.00055 0.00054 0.00054 0.00053 0.00053 0.00052 0.010 52 0.00059 0.00059 0.00058 0.00057 0.00057 0.00056 0.00056 0.010 53 0.00062 0.00061 0.00061 0.00060 0.00059 0.00059 0.00058 0.010 54 0.00063 0.00062 0.00061 0.00060 0.00060 0.00059 0.00058 0.010 55 0.00061 0.00060 0.00059 0.00058 0.00058 0.00057 0.00056 0.010 56 0.00060 0.00059 0.00058 0.00057 0.00057 0.00056 0.00055 0.010 57 0.00064 0.00063 0.00062 0.00061 0.00060 0.00060 0.00059 0.010 58 0.00069 0.00068 0.00067 0.00066 0.00065 0.00065 0.00064 0.010 59 0.00070 0.00069 0.00068 0.00067 0.00066 0.00065 0.00065 0.010 60 0.00068 0.00067 0.00066 0.00065 0.00064 0.00064 0.00063 0.010 61 0.00072 0.00071 0.00070 0.00069 0.00068 0.00067 0.00067 0.010 62 0.00077 0.00076 0.00075 0.00074 0.00074 0.00073 0.00072 0.010 63 0.00079 0.00078 0.00077 0.00076 0.00075 0.00075 0.00074 0.010 64 0.00077 0.00076 0.00075 0.00074 0.00074 0.00073 0.00072 0.010 65 0.00082 0.00081 0.00080 0.00080 0.00079 0.00078 0.00077 0.010 66 0.00088 0.00087 0.00086 0.00085 0.00084 0.00083 0.00082 0.010 67 0.00091 0.00090 0.00090 0.00089 0.00088 0.00087 0.00086 0.010 68 0.00098 0.00097 0.00096 0.00095 0.00094 0.00093 0.00093 0.010 69 0.00123 0.00122 0.00120 0.00119 0.00118 0.00117 0.00116 0.010 70 0.00137 0.00136 0.00134 0.00133 0.00132 0.00130 0.00129 0.010 71 0.00123 0.00122 0.00121 0.00120 0.00119 0.00117 0.00116 0.010 72 0.00100 0.00099 0.00098 0.00097 0.00096 0.00095 0.00094 0.010 73 0.00095 0.00094 0.00093 0.00092 0.00091 0.00090 0.00089 0.010 74 0.00095 0.00094 0.00093 0.00092 0.00091 0.00090 0.00089 0.010 75 0.00095 0.00094 0.00093 0.00092 0.00091 0.00090 0.00089 0.010

Table 7 Demographic Assumptions
FEMALE
- 60 -
Age
Non-Disability Annuitant Death Rate Death Rate for Spouse Survivors of Females
Annual Improvement Fiscal Year Duration 3+
Duration 1
Duration 2
2015 2016 2017 2018 2019 2020 2015 2016 2017 2018 2019 2020 2020 2020 2021+ 17 0.00281 0.00279 0.00277 0.00275 0.00272 0.00269 0.00026 0.00026 0.00025 0.00025 0.00025 0.00025 0.0126 0.0193 0.0100 18 0.00281 0.00279 0.00277 0.00275 0.00272 0.00269 0.00026 0.00026 0.00025 0.00025 0.00025 0.00025 0.0126 0.0193 0.0100 19 0.00281 0.00279 0.00277 0.00275 0.00272 0.00269 0.00026 0.00026 0.00025 0.00025 0.00025 0.00025 0.0126 0.0193 0.0100 20 0.00281 0.00279 0.00277 0.00275 0.00272 0.00269 0.00026 0.00026 0.00025 0.00025 0.00025 0.00025 0.0126 0.0193 0.0100 21 0.00281 0.00279 0.00277 0.00275 0.00272 0.00269 0.00026 0.00026 0.00025 0.00025 0.00025 0.00025 0.0126 0.0193 0.0100 22 0.00281 0.00279 0.00277 0.00275 0.00272 0.00269 0.00026 0.00026 0.00025 0.00025 0.00025 0.00025 0.0126 0.0193 0.0100 23 0.00281 0.00279 0.00277 0.00275 0.00272 0.00269 0.00026 0.00026 0.00025 0.00025 0.00025 0.00025 0.0126 0.0193 0.0100 24 0.00281 0.00279 0.00277 0.00275 0.00272 0.00269 0.00026 0.00026 0.00025 0.00025 0.00025 0.00025 0.0126 0.0193 0.0100 25 0.00281 0.00279 0.00277 0.00275 0.00272 0.00269 0.00026 0.00026 0.00025 0.00025 0.00025 0.00025 0.0126 0.0193 0.0100 26 0.00281 0.00279 0.00277 0.00275 0.00272 0.00269 0.00026 0.00026 0.00025 0.00025 0.00025 0.00025 0.0126 0.0193 0.0100 27 0.00281 0.00279 0.00277 0.00275 0.00272 0.00269 0.00026 0.00026 0.00025 0.00025 0.00025 0.00025 0.0126 0.0193 0.0100 28 0.00281 0.00279 0.00277 0.00275 0.00272 0.00269 0.00026 0.00026 0.00025 0.00025 0.00025 0.00025 0.0126 0.0193 0.0100 29 0.00281 0.00279 0.00277 0.00275 0.00272 0.00269 0.00026 0.00026 0.00025 0.00025 0.00025 0.00025 0.0126 0.0193 0.0100 30 0.00281 0.00279 0.00277 0.00275 0.00272 0.00269 0.00026 0.00026 0.00025 0.00025 0.00025 0.00025 0.0126 0.0193 0.0100 31 0.00281 0.00279 0.00277 0.00275 0.00272 0.00269 0.00026 0.00026 0.00025 0.00025 0.00025 0.00025 0.0126 0.0193 0.0100 32 0.00281 0.00279 0.00277 0.00275 0.00272 0.00269 0.00026 0.00026 0.00025 0.00025 0.00025 0.00025 0.0126 0.0193 0.0100 33 0.00281 0.00279 0.00277 0.00275 0.00272 0.00269 0.00026 0.00026 0.00025 0.00025 0.00025 0.00025 0.0126 0.0193 0.0100 34 0.00281 0.00279 0.00277 0.00275 0.00272 0.00269 0.00026 0.00026 0.00025 0.00025 0.00025 0.00025 0.0126 0.0193 0.0100 35 0.00281 0.00279 0.00277 0.00275 0.00272 0.00269 0.00026 0.00026 0.00025 0.00025 0.00025 0.00025 0.0126 0.0193 0.0100 36 0.00281 0.00279 0.00277 0.00275 0.00272 0.00269 0.00056 0.00055 0.00055 0.00055 0.00054 0.00054 0.0085 0.0093 0.0100 37 0.00281 0.00279 0.00277 0.00275 0.00272 0.00269 0.00095 0.00094 0.00094 0.00093 0.00092 0.00091 0.0084 0.0035 0.0100 38 0.00281 0.00279 0.00277 0.00275 0.00272 0.00269 0.00162 0.00160 0.00159 0.00158 0.00156 0.00155 0.0111 0.0013 0.0100 39 0.00281 0.00279 0.00277 0.00275 0.00272 0.00269 0.00248 0.00247 0.00245 0.00243 0.00240 0.00238 0.0146 0.0017 0.0100 40 0.00281 0.00279 0.00277 0.00275 0.00272 0.00269 0.00305 0.00303 0.00301 0.00298 0.00295 0.00292 0.0156 0.0035 0.0100 41 0.00281 0.00279 0.00277 0.00275 0.00272 0.00269 0.00279 0.00277 0.00275 0.00273 0.00270 0.00268 0.0118 0.0061 0.0100 42 0.00281 0.00279 0.00277 0.00275 0.00272 0.00269 0.00208 0.00207 0.00205 0.00204 0.00202 0.00200 0.0060 0.0089 0.0100 43 0.00281 0.00279 0.00277 0.00275 0.00272 0.00269 0.00227 0.00226 0.00224 0.00222 0.00220 0.00218 0.0013 0.0104 0.0100 44 0.00281 0.00279 0.00277 0.00275 0.00272 0.00269 0.00323 0.00321 0.00319 0.00316 0.00313 0.00310 0.0000 0.0090 0.0100 45 0.00281 0.00279 0.00277 0.00275 0.00272 0.00269 0.00342 0.00340 0.00337 0.00334 0.00331 0.00328 0.0000 0.0055 0.0100 46 0.00281 0.00279 0.00277 0.00275 0.00272 0.00269 0.00333 0.00331 0.00328 0.00326 0.00323 0.00319 0.0015 0.0029 0.0100 47 0.00281 0.00279 0.00277 0.00275 0.00272 0.00269 0.00429 0.00426 0.00423 0.00419 0.00415 0.00411 0.0050 0.0029 0.0100 48 0.00281 0.00279 0.00277 0.00275 0.00272 0.00269 0.00569 0.00565 0.00561 0.00556 0.00551 0.00546 0.0075 0.0051 0.0100 49 0.00281 0.00279 0.00277 0.00275 0.00272 0.00269 0.00742 0.00737 0.00731 0.00725 0.00718 0.00711 0.0066 0.0067 0.0100 50 0.00281 0.00279 0.00277 0.00275 0.00272 0.00269 0.00694 0.00690 0.00684 0.00678 0.00672 0.00665 0.0040 0.0060 0.0100 51 0.00275 0.00273 0.00271 0.00268 0.00266 0.00263 0.00594 0.00590 0.00585 0.00580 0.00575 0.00569 0.0023 0.0047 0.0100 52 0.00351 0.00349 0.00346 0.00343 0.00339 0.00336 0.00630 0.00625 0.00620 0.00615 0.00609 0.00603 0.0031 0.0049 0.0100 53 0.00355 0.00352 0.00348 0.00345 0.00342 0.00338 0.00796 0.00790 0.00784 0.00777 0.00770 0.00763 0.0057 0.0076 0.0100 54 0.00358 0.00354 0.00351 0.00347 0.00344 0.00341 0.00851 0.00845 0.00839 0.00832 0.00824 0.00816 0.0092 0.0134 0.0100 55 0.00392 0.00387 0.00383 0.00379 0.00375 0.00372 0.00986 0.00979 0.00971 0.00963 0.00954 0.00945 0.0098 0.0170 0.0100 56 0.00362 0.00358 0.00354 0.00350 0.00347 0.00343 0.01103 0.01095 0.01086 0.01076 0.01066 0.01055 0.0078 0.0140 0.0100 57 0.00414 0.00409 0.00405 0.00400 0.00396 0.00392 0.01176 0.01166 0.01156 0.01145 0.01134 0.01122 0.0066 0.0092 0.0100 58 0.00416 0.00411 0.00406 0.00401 0.00397 0.00393 0.01215 0.01203 0.01191 0.01179 0.01168 0.01156 0.0075 0.0089 0.0100 59 0.00453 0.00448 0.00442 0.00437 0.00432 0.00428 0.01155 0.01142 0.01130 0.01118 0.01106 0.01095 0.0095 0.0111 0.0100 60 0.00467 0.00460 0.00455 0.00449 0.00445 0.00440 0.01048 0.01035 0.01022 0.01011 0.01000 0.00990 0.0105 0.0124 0.0100 61 0.00506 0.00500 0.00493 0.00488 0.00482 0.00477 0.01293 0.01275 0.01259 0.01244 0.01230 0.01218 0.0110 0.0115 0.0100 62 0.00560 0.00552 0.00545 0.00539 0.00533 0.00527 0.01321 0.01301 0.01283 0.01266 0.01252 0.01240 0.0123 0.0121 0.0100 63 0.00606 0.00598 0.00590 0.00583 0.00577 0.00571 0.01452 0.01429 0.01408 0.01390 0.01374 0.01360 0.0132 0.0132 0.0100 64 0.00707 0.00698 0.00689 0.00681 0.00674 0.00667 0.01526 0.01501 0.01479 0.01459 0.01442 0.01428 0.0099 0.0133 0.0100 65 0.00764 0.00754 0.00745 0.00736 0.00728 0.00721 0.01301 0.01280 0.01261 0.01245 0.01231 0.01218 0.0083 0.0148 0.0100
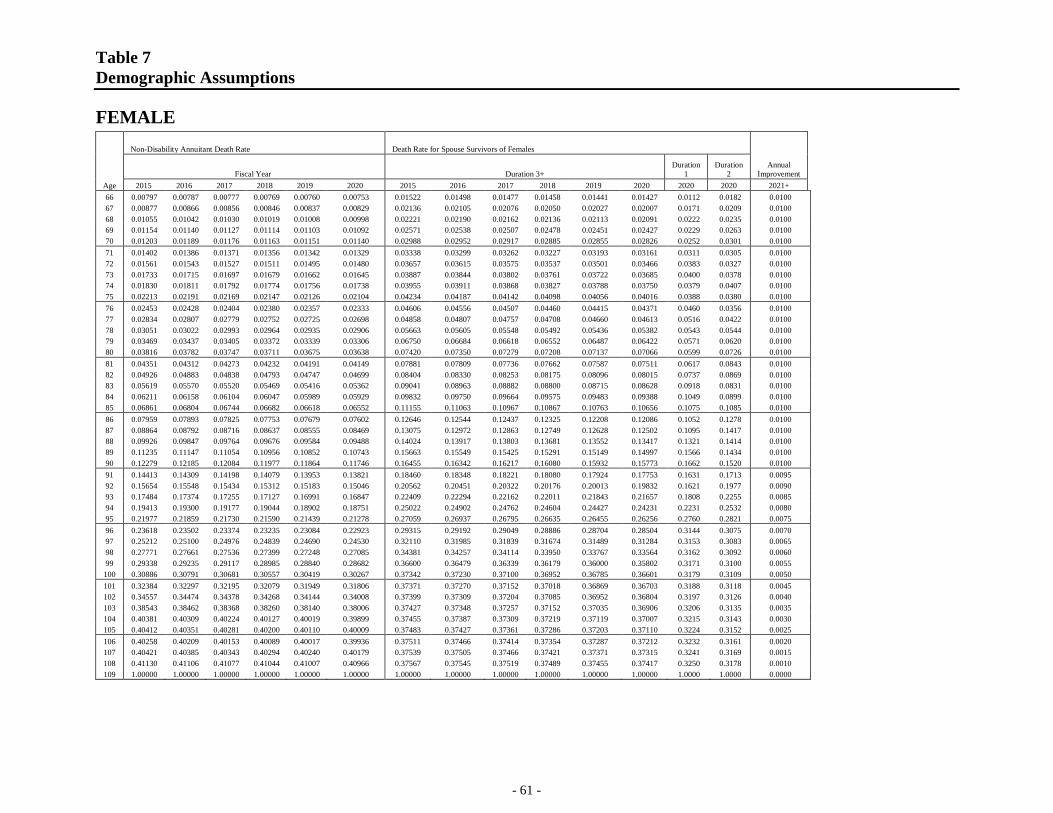
Table 7 Demographic Assumptions
FEMALE
- 61 -
Age
Non-Disability Annuitant Death Rate Death Rate for Spouse Survivors of Females
Annual Improvement Fiscal Year Duration 3+
Duration 1
Duration 2
2015 2016 2017 2018 2019 2020 2015 2016 2017 2018 2019 2020 2020 2020 2021+ 66 0.00797 0.00787 0.00777 0.00769 0.00760 0.00753 0.01522 0.01498 0.01477 0.01458 0.01441 0.01427 0.0112 0.0182 0.0100 67 0.00877 0.00866 0.00856 0.00846 0.00837 0.00829 0.02136 0.02105 0.02076 0.02050 0.02027 0.02007 0.0171 0.0209 0.0100 68 0.01055 0.01042 0.01030 0.01019 0.01008 0.00998 0.02221 0.02190 0.02162 0.02136 0.02113 0.02091 0.0222 0.0235 0.0100 69 0.01154 0.01140 0.01127 0.01114 0.01103 0.01092 0.02571 0.02538 0.02507 0.02478 0.02451 0.02427 0.0229 0.0263 0.0100 70 0.01203 0.01189 0.01176 0.01163 0.01151 0.01140 0.02988 0.02952 0.02917 0.02885 0.02855 0.02826 0.0252 0.0301 0.0100 71 0.01402 0.01386 0.01371 0.01356 0.01342 0.01329 0.03338 0.03299 0.03262 0.03227 0.03193 0.03161 0.0311 0.0305 0.0100 72 0.01561 0.01543 0.01527 0.01511 0.01495 0.01480 0.03657 0.03615 0.03575 0.03537 0.03501 0.03466 0.0383 0.0327 0.0100 73 0.01733 0.01715 0.01697 0.01679 0.01662 0.01645 0.03887 0.03844 0.03802 0.03761 0.03722 0.03685 0.0400 0.0378 0.0100 74 0.01830 0.01811 0.01792 0.01774 0.01756 0.01738 0.03955 0.03911 0.03868 0.03827 0.03788 0.03750 0.0379 0.0407 0.0100 75 0.02213 0.02191 0.02169 0.02147 0.02126 0.02104 0.04234 0.04187 0.04142 0.04098 0.04056 0.04016 0.0388 0.0380 0.0100 76 0.02453 0.02428 0.02404 0.02380 0.02357 0.02333 0.04606 0.04556 0.04507 0.04460 0.04415 0.04371 0.0460 0.0356 0.0100 77 0.02834 0.02807 0.02779 0.02752 0.02725 0.02698 0.04858 0.04807 0.04757 0.04708 0.04660 0.04613 0.0516 0.0422 0.0100 78 0.03051 0.03022 0.02993 0.02964 0.02935 0.02906 0.05663 0.05605 0.05548 0.05492 0.05436 0.05382 0.0543 0.0544 0.0100 79 0.03469 0.03437 0.03405 0.03372 0.03339 0.03306 0.06750 0.06684 0.06618 0.06552 0.06487 0.06422 0.0571 0.0620 0.0100 80 0.03816 0.03782 0.03747 0.03711 0.03675 0.03638 0.07420 0.07350 0.07279 0.07208 0.07137 0.07066 0.0599 0.0726 0.0100 81 0.04351 0.04312 0.04273 0.04232 0.04191 0.04149 0.07881 0.07809 0.07736 0.07662 0.07587 0.07511 0.0617 0.0843 0.0100 82 0.04926 0.04883 0.04838 0.04793 0.04747 0.04699 0.08404 0.08330 0.08253 0.08175 0.08096 0.08015 0.0737 0.0869 0.0100 83 0.05619 0.05570 0.05520 0.05469 0.05416 0.05362 0.09041 0.08963 0.08882 0.08800 0.08715 0.08628 0.0918 0.0831 0.0100 84 0.06211 0.06158 0.06104 0.06047 0.05989 0.05929 0.09832 0.09750 0.09664 0.09575 0.09483 0.09388 0.1049 0.0899 0.0100 85 0.06861 0.06804 0.06744 0.06682 0.06618 0.06552 0.11155 0.11063 0.10967 0.10867 0.10763 0.10656 0.1075 0.1085 0.0100 86 0.07959 0.07893 0.07825 0.07753 0.07679 0.07602 0.12646 0.12544 0.12437 0.12325 0.12208 0.12086 0.1052 0.1278 0.0100 87 0.08864 0.08792 0.08716 0.08637 0.08555 0.08469 0.13075 0.12972 0.12863 0.12749 0.12628 0.12502 0.1095 0.1417 0.0100 88 0.09926 0.09847 0.09764 0.09676 0.09584 0.09488 0.14024 0.13917 0.13803 0.13681 0.13552 0.13417 0.1321 0.1414 0.0100 89 0.11235 0.11147 0.11054 0.10956 0.10852 0.10743 0.15663 0.15549 0.15425 0.15291 0.15149 0.14997 0.1566 0.1434 0.0100 90 0.12279 0.12185 0.12084 0.11977 0.11864 0.11746 0.16455 0.16342 0.16217 0.16080 0.15932 0.15773 0.1662 0.1520 0.0100 91 0.14413 0.14309 0.14198 0.14079 0.13953 0.13821 0.18460 0.18348 0.18221 0.18080 0.17924 0.17753 0.1631 0.1713 0.0095 92 0.15654 0.15548 0.15434 0.15312 0.15183 0.15046 0.20562 0.20451 0.20322 0.20176 0.20013 0.19832 0.1621 0.1977 0.0090 93 0.17484 0.17374 0.17255 0.17127 0.16991 0.16847 0.22409 0.22294 0.22162 0.22011 0.21843 0.21657 0.1808 0.2255 0.0085 94 0.19413 0.19300 0.19177 0.19044 0.18902 0.18751 0.25022 0.24902 0.24762 0.24604 0.24427 0.24231 0.2231 0.2532 0.0080 95 0.21977 0.21859 0.21730 0.21590 0.21439 0.21278 0.27059 0.26937 0.26795 0.26635 0.26455 0.26256 0.2760 0.2821 0.0075 96 0.23618 0.23502 0.23374 0.23235 0.23084 0.22923 0.29315 0.29192 0.29049 0.28886 0.28704 0.28504 0.3144 0.3075 0.0070 97 0.25212 0.25100 0.24976 0.24839 0.24690 0.24530 0.32110 0.31985 0.31839 0.31674 0.31489 0.31284 0.3153 0.3083 0.0065 98 0.27771 0.27661 0.27536 0.27399 0.27248 0.27085 0.34381 0.34257 0.34114 0.33950 0.33767 0.33564 0.3162 0.3092 0.0060 99 0.29338 0.29235 0.29117 0.28985 0.28840 0.28682 0.36600 0.36479 0.36339 0.36179 0.36000 0.35802 0.3171 0.3100 0.0055 100 0.30886 0.30791 0.30681 0.30557 0.30419 0.30267 0.37342 0.37230 0.37100 0.36952 0.36785 0.36601 0.3179 0.3109 0.0050 101 0.32384 0.32297 0.32195 0.32079 0.31949 0.31806 0.37371 0.37270 0.37152 0.37018 0.36869 0.36703 0.3188 0.3118 0.0045 102 0.34557 0.34474 0.34378 0.34268 0.34144 0.34008 0.37399 0.37309 0.37204 0.37085 0.36952 0.36804 0.3197 0.3126 0.0040 103 0.38543 0.38462 0.38368 0.38260 0.38140 0.38006 0.37427 0.37348 0.37257 0.37152 0.37035 0.36906 0.3206 0.3135 0.0035 104 0.40381 0.40309 0.40224 0.40127 0.40019 0.39899 0.37455 0.37387 0.37309 0.37219 0.37119 0.37007 0.3215 0.3143 0.0030 105 0.40412 0.40351 0.40281 0.40200 0.40110 0.40009 0.37483 0.37427 0.37361 0.37286 0.37203 0.37110 0.3224 0.3152 0.0025 106 0.40258 0.40209 0.40153 0.40089 0.40017 0.39936 0.37511 0.37466 0.37414 0.37354 0.37287 0.37212 0.3232 0.3161 0.0020 107 0.40421 0.40385 0.40343 0.40294 0.40240 0.40179 0.37539 0.37505 0.37466 0.37421 0.37371 0.37315 0.3241 0.3169 0.0015 108 0.41130 0.41106 0.41077 0.41044 0.41007 0.40966 0.37567 0.37545 0.37519 0.37489 0.37455 0.37417 0.3250 0.3178 0.0010 109 1.00000 1.00000 1.00000 1.00000 1.00000 1.00000 1.00000 1.00000 1.00000 1.00000 1.00000 1.00000 1.0000 1.0000 0.0000

Table 7 Demographic Assumptions
FEMALE
- 62 -
Age
Disability Retirement
Rate Death Rate Disabled Non-Death Term of Disability Survivor Spouse Remarriage
Fraction of Ann. w/ a Reduced Benefit
Dur<=1 Dur=2 Dur>=3 Dur<=1 Dur=2 Dur>=3 Dur<=1 Dur=2 Dur>=3 Age Ret Dis Ret 17 0.00000 0.00000 0.00000 0.00296 0.00516 0.00000 0.00080 0.05054 0.06045 0.08354 0.00000 0.00000 18 0.00000 0.00000 0.00000 0.00296 0.00516 0.00000 0.00080 0.05054 0.06045 0.08354 0.00000 0.00000 19 0.00000 0.00000 0.00000 0.00296 0.00516 0.00000 0.00080 0.05054 0.06045 0.08354 0.00000 0.00000 20 0.00000 0.00000 0.00000 0.00296 0.00516 0.00000 0.00080 0.05054 0.06045 0.08354 0.00000 0.00000 21 0.00000 0.00000 0.00000 0.00296 0.00516 0.00000 0.00080 0.05054 0.06045 0.08354 0.00000 0.00000 22 0.00000 0.00000 0.00000 0.00296 0.00516 0.00000 0.00080 0.05054 0.06045 0.08354 0.00000 0.00000 23 0.00093 0.00000 0.00000 0.00296 0.00516 0.00000 0.00080 0.05054 0.06045 0.08354 0.00000 0.00000 24 0.00073 0.00000 0.00000 0.00296 0.00516 0.00000 0.00080 0.05054 0.06045 0.08354 0.00000 0.00000 25 0.00058 0.00000 0.00000 0.00296 0.00516 0.00000 0.00080 0.05054 0.06045 0.08354 0.00000 0.00000 26 0.00047 0.00000 0.00123 0.00093 0.00703 0.00000 0.00423 0.05054 0.06045 0.08354 0.35233 0.30247 27 0.00041 0.00577 0.00476 0.00000 0.00654 0.00336 0.00711 0.05054 0.06045 0.08354 0.35233 0.30247 28 0.00040 0.01149 0.00702 0.00011 0.00410 0.00599 0.00946 0.05054 0.06045 0.08354 0.35233 0.30247 29 0.00042 0.01558 0.00791 0.00131 0.00166 0.00736 0.01145 0.05054 0.06045 0.08354 0.35233 0.30247 30 0.00048 0.01606 0.00777 0.00327 0.00076 0.00717 0.01434 0.05054 0.06045 0.08354 0.35233 0.30247 31 0.00058 0.01389 0.00671 0.00527 0.00180 0.00639 0.01694 0.05054 0.06045 0.08354 0.35233 0.30247 32 0.00070 0.00982 0.00654 0.00657 0.00386 0.00555 0.01626 0.05054 0.06045 0.08354 0.35233 0.30247 33 0.00086 0.00617 0.00810 0.00652 0.00491 0.00625 0.01292 0.05054 0.06045 0.08354 0.35233 0.30247 34 0.00103 0.00468 0.01037 0.00644 0.00315 0.00760 0.00969 0.05054 0.06045 0.08354 0.35233 0.30247 35 0.00123 0.00578 0.01123 0.00615 0.00121 0.00701 0.01084 0.05054 0.06045 0.08354 0.35233 0.30247 36 0.00145 0.00782 0.01138 0.00582 0.00075 0.00605 0.01341 0.06040 0.09549 0.08858 0.35426 0.30247 37 0.00168 0.01025 0.00942 0.00503 0.00147 0.00615 0.01207 0.05977 0.11149 0.08351 0.35586 0.30247 38 0.00192 0.01247 0.00818 0.00677 0.00200 0.00790 0.01071 0.05038 0.11094 0.07017 0.35712 0.30247 39 0.00216 0.01203 0.01027 0.00736 0.00233 0.00914 0.00869 0.03837 0.09717 0.05342 0.35804 0.30247 40 0.00241 0.01293 0.01085 0.00647 0.00313 0.00917 0.00898 0.02846 0.07674 0.04198 0.35863 0.30247 41 0.00266 0.01454 0.01018 0.00628 0.00264 0.00605 0.01044 0.02173 0.05689 0.03927 0.35889 0.30247 42 0.00291 0.01744 0.01063 0.00675 0.00275 0.00469 0.00985 0.01739 0.04279 0.04263 0.35880 0.30247 43 0.00315 0.02040 0.01144 0.00817 0.00186 0.00499 0.00909 0.01499 0.03439 0.04196 0.35839 0.30247 44 0.00338 0.01880 0.01294 0.00852 0.00181 0.00708 0.00756 0.01291 0.03102 0.03671 0.35764 0.30247 45 0.00360 0.01711 0.01735 0.01002 0.00163 0.00668 0.00626 0.01261 0.02996 0.02859 0.35655 0.30247 46 0.00379 0.01738 0.01914 0.00991 0.00137 0.00720 0.00604 0.01314 0.02810 0.02542 0.35513 0.30247 47 0.00397 0.01887 0.01758 0.01075 0.00187 0.00647 0.00584 0.01205 0.02644 0.02668 0.35338 0.30247 48 0.00413 0.02166 0.01684 0.01077 0.00287 0.00654 0.00644 0.01021 0.02703 0.02645 0.35130 0.30247 49 0.00427 0.02339 0.02095 0.01260 0.00276 0.00725 0.00600 0.01014 0.03005 0.02190 0.34888 0.30247 50 0.00438 0.02877 0.02431 0.01367 0.00304 0.00486 0.00491 0.01058 0.03273 0.01693 0.34614 0.30247 51 0.00448 0.03390 0.02288 0.01257 0.00491 0.00232 0.00477 0.00881 0.03056 0.01345 0.34308 0.30007 52 0.00455 0.03536 0.02475 0.01280 0.00352 0.00218 0.00462 0.00647 0.02385 0.01196 0.33969 0.29752 53 0.00461 0.04093 0.03056 0.01502 0.00174 0.00354 0.00391 0.00376 0.01359 0.00955 0.33599 0.29483 54 0.00466 0.04683 0.03282 0.01473 0.00174 0.00408 0.00385 0.00097 0.00264 0.00197 0.33196 0.29199 55 0.00472 0.04653 0.03184 0.01677 0.00148 0.00245 0.00293 0.00000 0.00000 0.00000 0.32763 0.28901 56 0.00478 0.04180 0.03030 0.01881 0.00141 0.00169 0.00317 0.00000 0.00000 0.00000 0.32299 0.28587 57 0.00487 0.04931 0.02910 0.01951 0.00149 0.00291 0.00303 0.00000 0.00000 0.00000 0.31805 0.28260 58 0.00499 0.05562 0.03069 0.01988 0.00184 0.00397 0.00221 0.00000 0.00000 0.00000 0.31282 0.27918 59 0.00516 0.05241 0.03193 0.02207 0.00189 0.00419 0.00209 0.00000 0.00000 0.00000 0.30729 0.27561 60 0.00540 0.05306 0.03744 0.02225 0.00000 0.00000 0.00000 0.00000 0.00000 0.00000 0.30149 0.27190 61 0.00573 0.05769 0.04266 0.02168 0.00000 0.00000 0.00000 0.00000 0.00000 0.00000 0.29541 0.26804 62 0.00617 0.06367 0.04116 0.02480 0.00000 0.00000 0.00000 0.00000 0.00000 0.00000 0.28906 0.26404 63 0.00673 0.06958 0.04245 0.02483 0.00000 0.00000 0.00000 0.00000 0.00000 0.00000 0.28246 0.25989 64 0.00743 0.07556 0.04367 0.02424 0.00000 0.00000 0.00000 0.00000 0.00000 0.00000 0.27561 0.25560 65 0.00830 0.08258 0.04508 0.02741 0.00000 0.00000 0.00000 0.00000 0.00000 0.00000 0.26853 0.25117 66 0.00934 0.09128 0.04579 0.02691 0.00000 0.00000 0.00000 0.00000 0.00000 0.00000 0.26123 0.24659 67 0.01058 0.10126 0.04498 0.02478 0.00000 0.00000 0.00000 0.00000 0.00000 0.00000 0.25371 0.24187
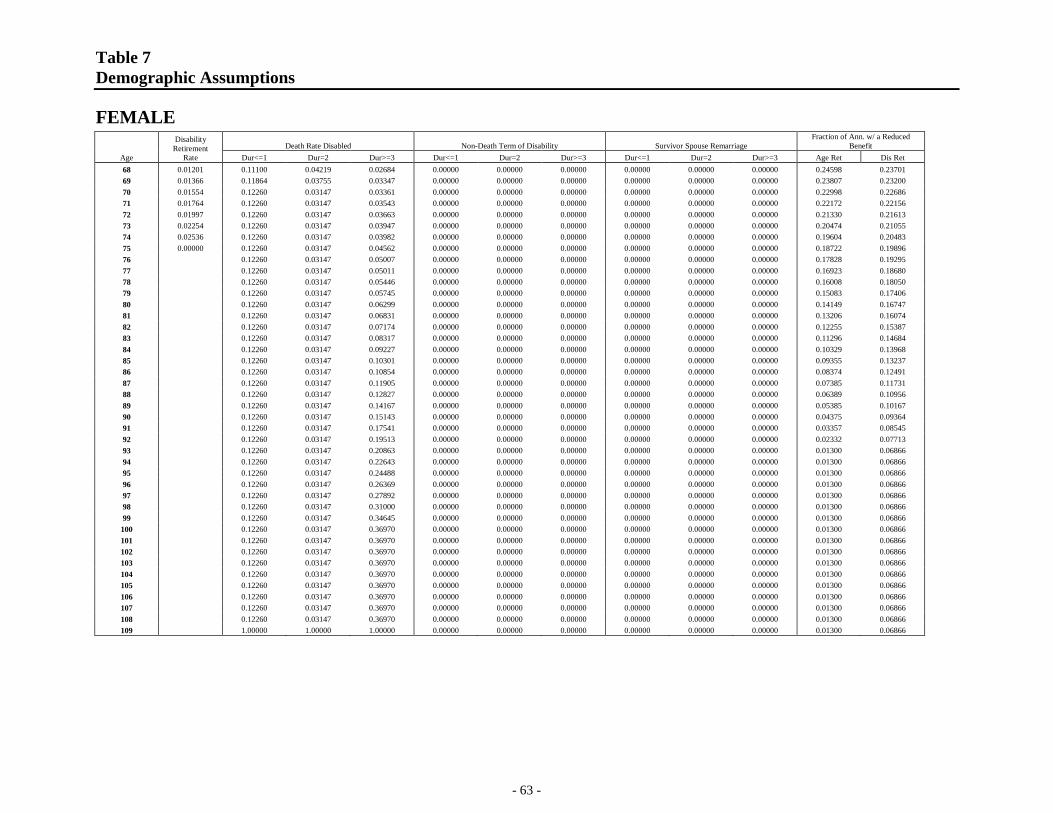
Table 7 Demographic Assumptions
FEMALE
- 63 -
Age
Disability Retirement
Rate Death Rate Disabled Non-Death Term of Disability Survivor Spouse Remarriage
Fraction of Ann. w/ a Reduced Benefit
Dur<=1 Dur=2 Dur>=3 Dur<=1 Dur=2 Dur>=3 Dur<=1 Dur=2 Dur>=3 Age Ret Dis Ret 68 0.01201 0.11100 0.04219 0.02684 0.00000 0.00000 0.00000 0.00000 0.00000 0.00000 0.24598 0.23701 69 0.01366 0.11864 0.03755 0.03347 0.00000 0.00000 0.00000 0.00000 0.00000 0.00000 0.23807 0.23200 70 0.01554 0.12260 0.03147 0.03361 0.00000 0.00000 0.00000 0.00000 0.00000 0.00000 0.22998 0.22686 71 0.01764 0.12260 0.03147 0.03543 0.00000 0.00000 0.00000 0.00000 0.00000 0.00000 0.22172 0.22156 72 0.01997 0.12260 0.03147 0.03663 0.00000 0.00000 0.00000 0.00000 0.00000 0.00000 0.21330 0.21613 73 0.02254 0.12260 0.03147 0.03947 0.00000 0.00000 0.00000 0.00000 0.00000 0.00000 0.20474 0.21055 74 0.02536 0.12260 0.03147 0.03982 0.00000 0.00000 0.00000 0.00000 0.00000 0.00000 0.19604 0.20483 75 0.00000 0.12260 0.03147 0.04562 0.00000 0.00000 0.00000 0.00000 0.00000 0.00000 0.18722 0.19896 76 0.12260 0.03147 0.05007 0.00000 0.00000 0.00000 0.00000 0.00000 0.00000 0.17828 0.19295 77 0.12260 0.03147 0.05011 0.00000 0.00000 0.00000 0.00000 0.00000 0.00000 0.16923 0.18680 78 0.12260 0.03147 0.05446 0.00000 0.00000 0.00000 0.00000 0.00000 0.00000 0.16008 0.18050 79 0.12260 0.03147 0.05745 0.00000 0.00000 0.00000 0.00000 0.00000 0.00000 0.15083 0.17406 80 0.12260 0.03147 0.06299 0.00000 0.00000 0.00000 0.00000 0.00000 0.00000 0.14149 0.16747 81 0.12260 0.03147 0.06831 0.00000 0.00000 0.00000 0.00000 0.00000 0.00000 0.13206 0.16074 82 0.12260 0.03147 0.07174 0.00000 0.00000 0.00000 0.00000 0.00000 0.00000 0.12255 0.15387 83 0.12260 0.03147 0.08317 0.00000 0.00000 0.00000 0.00000 0.00000 0.00000 0.11296 0.14684 84 0.12260 0.03147 0.09227 0.00000 0.00000 0.00000 0.00000 0.00000 0.00000 0.10329 0.13968 85 0.12260 0.03147 0.10301 0.00000 0.00000 0.00000 0.00000 0.00000 0.00000 0.09355 0.13237 86 0.12260 0.03147 0.10854 0.00000 0.00000 0.00000 0.00000 0.00000 0.00000 0.08374 0.12491 87 0.12260 0.03147 0.11905 0.00000 0.00000 0.00000 0.00000 0.00000 0.00000 0.07385 0.11731 88 0.12260 0.03147 0.12827 0.00000 0.00000 0.00000 0.00000 0.00000 0.00000 0.06389 0.10956 89 0.12260 0.03147 0.14167 0.00000 0.00000 0.00000 0.00000 0.00000 0.00000 0.05385 0.10167 90 0.12260 0.03147 0.15143 0.00000 0.00000 0.00000 0.00000 0.00000 0.00000 0.04375 0.09364 91 0.12260 0.03147 0.17541 0.00000 0.00000 0.00000 0.00000 0.00000 0.00000 0.03357 0.08545 92 0.12260 0.03147 0.19513 0.00000 0.00000 0.00000 0.00000 0.00000 0.00000 0.02332 0.07713 93 0.12260 0.03147 0.20863 0.00000 0.00000 0.00000 0.00000 0.00000 0.00000 0.01300 0.06866 94 0.12260 0.03147 0.22643 0.00000 0.00000 0.00000 0.00000 0.00000 0.00000 0.01300 0.06866 95 0.12260 0.03147 0.24488 0.00000 0.00000 0.00000 0.00000 0.00000 0.00000 0.01300 0.06866 96 0.12260 0.03147 0.26369 0.00000 0.00000 0.00000 0.00000 0.00000 0.00000 0.01300 0.06866 97 0.12260 0.03147 0.27892 0.00000 0.00000 0.00000 0.00000 0.00000 0.00000 0.01300 0.06866 98 0.12260 0.03147 0.31000 0.00000 0.00000 0.00000 0.00000 0.00000 0.00000 0.01300 0.06866 99 0.12260 0.03147 0.34645 0.00000 0.00000 0.00000 0.00000 0.00000 0.00000 0.01300 0.06866
100 0.12260 0.03147 0.36970 0.00000 0.00000 0.00000 0.00000 0.00000 0.00000 0.01300 0.06866 101 0.12260 0.03147 0.36970 0.00000 0.00000 0.00000 0.00000 0.00000 0.00000 0.01300 0.06866 102 0.12260 0.03147 0.36970 0.00000 0.00000 0.00000 0.00000 0.00000 0.00000 0.01300 0.06866 103 0.12260 0.03147 0.36970 0.00000 0.00000 0.00000 0.00000 0.00000 0.00000 0.01300 0.06866 104 0.12260 0.03147 0.36970 0.00000 0.00000 0.00000 0.00000 0.00000 0.00000 0.01300 0.06866 105 0.12260 0.03147 0.36970 0.00000 0.00000 0.00000 0.00000 0.00000 0.00000 0.01300 0.06866 106 0.12260 0.03147 0.36970 0.00000 0.00000 0.00000 0.00000 0.00000 0.00000 0.01300 0.06866 107 0.12260 0.03147 0.36970 0.00000 0.00000 0.00000 0.00000 0.00000 0.00000 0.01300 0.06866 108 0.12260 0.03147 0.36970 0.00000 0.00000 0.00000 0.00000 0.00000 0.00000 0.01300 0.06866 109 1.00000 1.00000 1.00000 0.00000 0.00000 0.00000 0.00000 0.00000 0.00000 0.01300 0.06866

- 64 -
Table 8 Plan Provisions
CSRS AND FERS PLAN SUMMARIES CSRS Basic Benefit FERS Basic Benefit
REGULAR ANNUITY
Guaranteed annuity based on service and salary.
Guaranteed annuity based on service and salary.
ALTERNATIVE ANNUITY
Lump-sum payment generally available only to non-disability retirees with life-threatening or critical condition and only with spousal consent.
Lump-sum payment generally available only to non-disability retirees with life-threatening or critical condition and only with spousal consent.
COVERAGE All employees hired prior to January 1, 1984, except for those who transferred to FERS during an open season.
All employees who were first employed in a covered position after December 31, 1983, or who were hired after December 31, 1986, with less than 5 years of creditable civilian service, or who transferred to FERS during an open season.
EMPLOYEE CONTRIBUTIONS
7.0% of total pay (does not apply to Special Employee groups).
Contribution for FERS basic benefit plus Social security taxes generally equals: FERS: 7.0% FERS-RAE: 9.3% FERS-FRAE: 10.6% Special employee groups contribute an additional 0.5% of pay.
REFUND OPTION Withdrawal of contributions plus interest is allowed when leaving Federal employment. Interest is paid only to an employee with at least one year of covered service (but less than five years of total creditable civilian service). Contributions may be redeposited after reemployment with the Federal government for annuity credit.
Withdrawal of contributions plus interest is allowed when leaving Federal employment (employee must have more than one year of covered service to accrue interest). Effective for 2010 forward, contributions may be redeposited after reemployment with the Federal government for annuity credit.
COLAs COLAs are paid annually to all annuitants. COLAs equal the rate of inflation as measured by the Consumer Price Index for Urban Wage Earners and Clerical Workers (CPI-W).
COLAs are paid annually to retirees over age 62, to disability benefit recipients (after one year of payments), to survivor benefit recipients, and to certain other special groups. COLA is based on the Consumer Price Index (CPI-W) as follows:
CPI COLA 0 to 2% CPI 2 to 3% 2%
3% or more CPI minus 1%
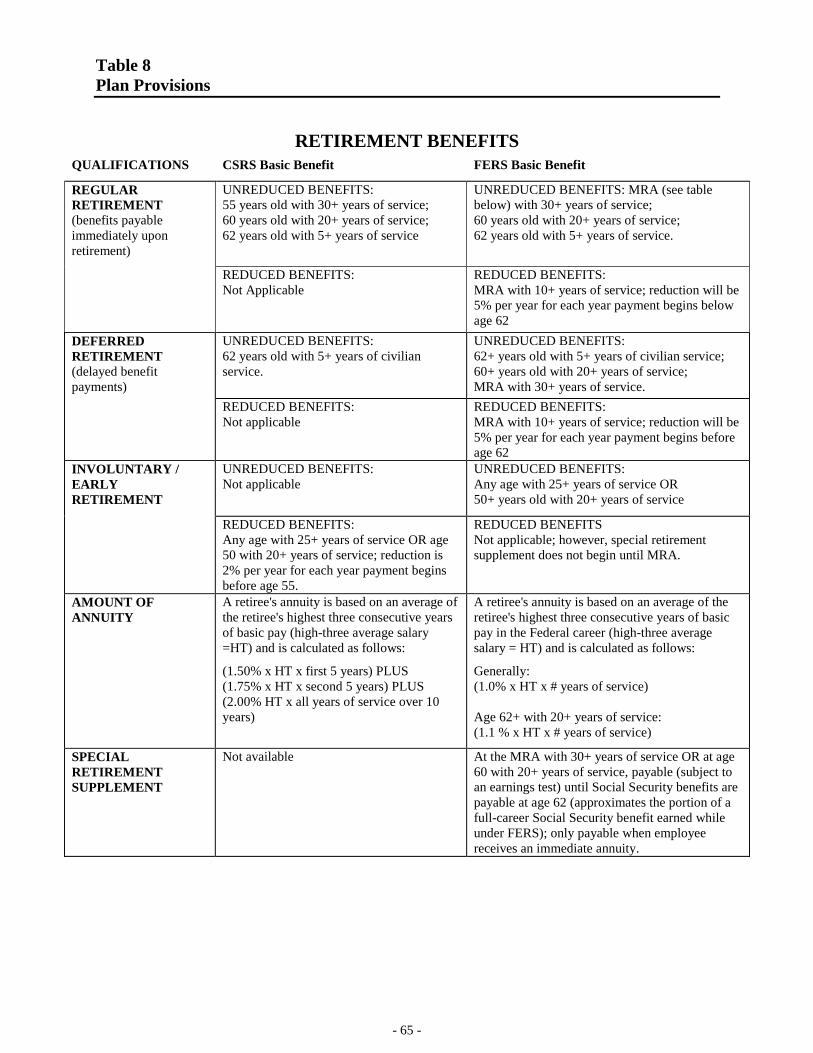
Table 8 Plan Provisions
- 65 -
RETIREMENT BENEFITS
QUALIFICATIONS CSRS Basic Benefit FERS Basic Benefit
REGULAR RETIREMENT (benefits payable immediately upon retirement)
UNREDUCED BENEFITS: 55 years old with 30+ years of service; 60 years old with 20+ years of service; 62 years old with 5+ years of service
UNREDUCED BENEFITS: MRA (see table below) with 30+ years of service; 60 years old with 20+ years of service; 62 years old with 5+ years of service.
REDUCED BENEFITS: Not Applicable
REDUCED BENEFITS: MRA with 10+ years of service; reduction will be 5% per year for each year payment begins below age 62
DEFERRED RETIREMENT (delayed benefit payments)
UNREDUCED BENEFITS: 62 years old with 5+ years of civilian service.
UNREDUCED BENEFITS: 62+ years old with 5+ years of civilian service; 60+ years old with 20+ years of service; MRA with 30+ years of service.
REDUCED BENEFITS: Not applicable
REDUCED BENEFITS: MRA with 10+ years of service; reduction will be 5% per year for each year payment begins before age 62
INVOLUNTARY / EARLY RETIREMENT
UNREDUCED BENEFITS: Not applicable
UNREDUCED BENEFITS: Any age with 25+ years of service OR 50+ years old with 20+ years of service
REDUCED BENEFITS: Any age with 25+ years of service OR age 50 with 20+ years of service; reduction is 2% per year for each year payment begins before age 55.
REDUCED BENEFITS Not applicable; however, special retirement supplement does not begin until MRA.
AMOUNT OF ANNUITY
A retiree's annuity is based on an average of the retiree's highest three consecutive years of basic pay (high-three average salary =HT) and is calculated as follows:
(1.50% x HT x first 5 years) PLUS (1.75% x HT x second 5 years) PLUS (2.00% HT x all years of service over 10 years)
A retiree's annuity is based on an average of the retiree's highest three consecutive years of basic pay in the Federal career (high-three average salary = HT) and is calculated as follows:
Generally: (1.0% x HT x # years of service) Age 62+ with 20+ years of service: (1.1 % x HT x # years of service)
SPECIAL RETIREMENT SUPPLEMENT
Not available At the MRA with 30+ years of service OR at age 60 with 20+ years of service, payable (subject to an earnings test) until Social Security benefits are payable at age 62 (approximates the portion of a full-career Social Security benefit earned while under FERS); only payable when employee receives an immediate annuity.

Table 8 Plan Provisions
- 66 -
DISABILITY BENEFITS CSRS Basic Benefit FERS Basic Benefit QUALIFICATIONS An employee must have 5 or more years of
creditable civilian service. An employee must be unable to do his/her job and must not refuse a suitable vacancy within the agency in the same commuting area at the same grade or pay level as the current position. Disability benefits will end if the employee recovers from the disabling condition or earns more than 80% of the current salary of the position from which retired. Disabled employees may be required at times to prove continued disability.
An employee must have 18+ months of creditable civilian service and must apply for or show ineligibility for Social Security benefits. An employee must be unable to do his/her job and must not refuse a suitable vacancy within the agency in the same commuting area at the same grade or pay level as the current position. Disability benefits will end if the employee recovers from the disabling condition or earns more than 80% of the current salary of the position from which retired. Disabled employees may be required at times to prove continued disability.
AMOUNT OF BENEFITS
Benefits are equal to the lesser of (1) 40% of high-three average salary or (2) annuity computed according to the general formula after first increasing the time base as if the employee worked to age 60, unless actual earned annuity is greater.
Benefits differ depending on how many years an employee is disabled. During the first year of disability, FERS pays 60% of an employee's high-three average salary minus 100% of any Social Security benefits received. No COLAs are paid during this year.
During the second year and any additional years of disability until an employee reaches age 62, the employee will receive 40% of his/her high-three average salary minus 60% of any Social security benefits received. COLAs are paid for these years.
FERS disability benefits are recomputed at age 62 to equal the individual's non-disability benefit, including credit for the period the individual was receiving disability benefits, with the average salary increased by all FERS COLAs that were effective during the periods of disability. Whenever the individual's earned benefit based on years of service and average salary provide a higher benefit than that payable under the disability provisions, the person is entitled to the earned rate.

Table 8 Plan Provisions
- 67 -
SURVIVOR BENEFITS CSRS Basic Benefit FERS Basic Benefit
QUALIFICATIONS Eligible survivors of an employee may receive benefits if the employee had at least 18 months of creditable civilian service. Eligible survivors may include current and former spouses and children who meet certain age and/or length of marriage requirements.
Eligible survivors of an employee may receive benefits if the employee had at least 18 months of creditable civilian service. Eligible survivors may include current and former spouses and children who meet certain age and/or length of marriage requirements.
AMOUNT OF BENEFITS
Survivor benefits are based on the relationship of the survivor and are calculated as follows:
Survivor benefits are based on the relationship of the survivor and the employee's length of Federal service and are calculated as follows:
Spouse of an employee who dies
55% of the disability annuity that would have been payable if the employee had retired on the date of death;
With 18 months to 10 years of service, lump-sum payment only; in 2016 the amount is $32,326.58 plus the LARGER of (1) 50% of the employee's annual salary at death OR (2) 50% of the employee's HT;
With 10+ years of service, lump sum payment as above plus annuity equal to 50% of the employee's accrued basic benefit.
Spouse of an annuitant who dies
Up to 55% of the retiree's annuity, depending on elected survivor benefit;
50% (or 25% if jointly elected by employee and spouse) of the retiree's annuity amount plus a special retirement supplement if the spouse is younger than age 60 and not yet eligible for Social Security benefits;
Spouse of an employee who dies after leaving Federal service but before annuity payments begin
Refund of the deceased's retirement contributions only; no other benefits.
With less than 10 years of service, refund of contributions;
With 10+ years of service without a refund of contributions, 50% of the employee's accrued basic benefit beginning when the employee would have reached age 62.
Child(ren) Varies according to the number of children and whether there is a surviving parent who was married to the employee.
Varies according to the number of children and whether there is a surviving parent who was married to the employee, reduced by Social Security benefits the child(ren) are entitled to receive.

Table 8 Plan Provisions
- 68 -
CSRS Basic Benefit FERS Basic Benefit
ANNUITY REDUCTION TO COVER SURVIVOR BENEFITS
A retiree's annuity will be reduced as follows to provide for a survivor benefit:
First $3,600 reduced 2.5%;
Amounts over $3,600 reduced 10%.
Note: The 55% spouse's benefit is based on the amount of the annuity before this reduction is taken.
A retiree's annuity will be reduced 10% (or 5%) of the entire annual benefit in order to provide for a survivor benefit unless waived by both the retiree and the spouse.
Note: The 50% (or 25% if jointly elected by employee and spouse) spouse's benefit is based on the amount of the annuity before this reduction is taken.
MINIMUM RETIREMENT AGE (MRA) FOR FERS BASIC BENEFIT
Birth Year MRA Before 1948 55 1948 55 and 2 months 1949 55 and 4 months 1950 55 and 6 months 1951 55 & and 8 months 1952 55 and 10 months 1953-1964 56 1965 56 and 2 months 1966 56 and 4 months 1967 56 and 6 months 1968 56 and 8 months 1969 56 and 10 months 1970 and after 57