civil and water engineering department, laval ... -...
TRANSCRIPT

The Puvirnituq airstrip pilot project; results from the first three monitoring years
Félix Gravel Gaumond 1,2, ing. jr Guy Doré 1,2, ing. PhD., professor Chantal Lemieux 1,2, research coordinator ARQULUK Anick Guimond 3 1Civil and Water Engineering Department, Laval University, Quebec, Canada 2Centre for Northern Studies, Laval University, Quebec, Canada 3Transports Québec, Rouyn-Noranda, Quebec, Canada
Paper prepared for presentation
at the Innovation in Geotechnique for Transportation Session
of the 2013 Conference of the
Transportation Association of Canada
Winnipeg, Manitoba

Abstract The Puvirnituq airstrip was originally constructed using a thick embankment to fill a fine-grained sediment filled valley. Since the construction of the airstrip, subsidence has been observed in the thick-fill area. Construction work was done in 2009 to allow the landing of a Boeing 737. As part of this work, the thermal and mechanical stabilization of the embankment that fills the valley was realized. A convective embankment with a ventilation system has been constructed. A berm, made with the same convective material was also constructed to resist a possible lateral instability of the embankment. The construction work also included the deviation of the small creek flowing in the valley. The project has two main objectives. First, it aims to improve the heat extraction system design and to validate its effectiveness in the context of the Puvirnituq airstrip. Second, the project aims to refine the evaluation procedure for stability analysis in the context of degrading permafrost. In order to determine the effectiveness of the heat extraction system, thermistor strings have been installed in the convective embankment, under the ground surface and horizontally on the ground surface under the berm. Instrumentation has shown a decreasing active layer thickness between 0.44 and 1.53 meters and evidence of convection in the convective embankment. An inclinometer was also installed at the toe of the embankment. The movement monitored by the inclinometer suggest that only vertical compression movement has occurred since the construction of the convective embankment. The movement observed would therefore be associated with the consolidation of the soil under the embankment weight.
1 INTRODUCTION
The Northern Village of Puvirnituq is located in Nunavik, Northern Quebec. Puvirnituq is one of the two Nunavik’s administrative centers with Kuujjuaq. The airport has a major role for supplying the village but also serves as a gateway to more remote communities of Nunavik. The airstrip is mostly constructed on bedrock but crosses a valley oriented NW–SE. Water seepage has been observed in this valley during summer until late fall. The valley is mostly filled with saline fine-grained sediments. The geotechnical investigation has also exposed presence of millimetric ice lenses on 1.8 meter (Allard, Doré, L'Hérault, Sarrazin, & Verreault, 2009). A thick embankment, with a maximum height of 8 meters, has been built to fill the depression. This embankment tends to subside and has been monitored for several years. The combination of many factors may explain the observed subsidence. First, the permafrost is degraded by water seepage under the embankment and the snow accumulation on the slope of the embankment. Second, the creep of the warm permafrost under the weight of the embankment may also contribute to the problem observed. A possible embankment slope failure was also expected in a scenario of complete permafrost degradation. This event would have serious consequences on the airport operations. The Puvirnituq airstrip has been extended and upgraded in order to allow landing of a Boeing 737. In this context, thermal and mechanical stabilization of the embankment was needed. Stabilization measures were taken during the construction work in 2009. These measures include the deviation of the water source upstream (west side of the airstrip) and the construction of convective embankments and berm. The convective embankment allows the extraction of heat and the berm allows the mechanical stabilization. The berm is made with the same convective material as the embankment. It is important to mention that the water source deviation has been completed at the end of summer 2010, see details on Figure 1. Thus, only the second monitoring year takes into account this corrective measure. The time allowed to proceed with the construction work was unfortunately not long enough to allow optimization of the thermal design of the mitigation method. The mitigation method was first study in the context of other research projects (Beaulac, 2006; Voyer, 2009). The convective embankment and berm design constructed on the Puvirnituq airstrip is shown on Figure 2. The ventilation system added to the convective embankment allows open convective movement. The Puvirnituq research project focuses on the thermal and mechanical behavior monitoring of the airstrip embankment. The monitoring program should allow to evaluate if the solutions applied (deviation of the small creek and the construction of convective embankment and berm) were appropriate under the conditions prevailing on the site. In order to make this evaluation, several measuring instruments were installed in the valley area during the construction work. The instrumentation consisted in five thermistor strings installed in the convective embankment and berm (29 thermistors), four thermistor strings installed in the natural ground (33 thermistors) and one thermistor string placed horizontally at the interface natural ground/ convective embankment (8 thermistors). A Measurand Inc. automated inclinometer was also installed at the foot slope of the embankment where the movements were the most

likely to occur. The inclinometer is composed of 32 segments of 500 mm each, for a total length of 16.0 m. It reached a depth of 14.0 m, and 2.0 m are installed in the convective embankment. Figure 3 shows the location of the instruments placed on the west and the east sides of the Puvirnituq airstrip.
2 GROUND TEMPERATURE EVOLUTION (2009-2012)
2.1 Climatic data
In order to compare climatic data from the three first monitoring years, air freezing and thawing indices were calculated from daily temperature data using the method presented by (Doré & Zubeck, 2009). The freezing index is calculated by summing the negative air temperature values during the year and the thawing index is calculated by summing the positive temperature values during the same period. This simple method allows a quick comparison between the different monitoring years. Table 1 shows air thawing and freezing index for the three first monitoring years. The thawing index is fairly stable since the monitoring beginning with a maximum difference of about 100 ° C*day between year 1 and year 2. But, the freezing index has an increasing tendency since the monitoring beginning. An increase of 200 °C*day was observed between Year 1 and Year 2 and an increase of 450 °C*day was observed between year 2 and year 3.The freezing index increase by about 650 °C*day since the first monitoring year.
2.2 Thermal behavior of the natural ground
Figure 4 shows the evolution of soil temperature at 1 m and 2 m for the thermistors string F5 (upstream side), between June 15 and October 2 for years 2009 to 2012. Thermistors at 100 cm and 200 cm show significantly different behavior between summers. In summer 2010, ground at 200 cm had reached a temperature above 0 °C three days before the ground at 100 cm, respectively on July 6 and July 9. This behavior is quite different in summer 2011. The ground at 100 cm reaches a temperature above 0 °C on August 11 2011 while the ground at 200 cm temperature reaches this temperature on August 26 2011. There is therefore a time offset of soil warming, which suggests that the heat intake is significantly lower. It is possible to believe that the predominant heat transfer mode between the two summers is different. The difference in maximum temperatures reached during summers 2010 and 2011 also give indications in this regard. The evolution and the maximum temperature reached after the deviation are similar for summers 2011 and 2012. Finally, few values from summer 2009 provide the indication that the maximum temperatures reached at 1 and 2 meters were even higher than those reached in summer 2010.
The trumpet curves show significant differences between the three monitoring years. Table 2 summarizes the active layer thickness variations between each year and the variations since the monitoring beginning. Between the first and second monitoring year, the active layer thickness decreased for thermistors string F, G, F2 and remained fairly stable for the thermistors sting F5. Between the second and third monitoring year, the active layer thickness remained stable for thermistors sting F and F2, it has increased for the thermistors sting G and it has decreased for the thermistors sting F5. Since the beginning of thermal behavior monitoring, the permafrost active layer has decrease, i.e. the permafrost table has risen for all thermistors string. The active layer thickenings are 1.53 m, 1.16 m, 0.53 m and 0.44 m respectively for thermistors string F, G, F2 and F5.
Figure 5 shows the thermistors string F2 trumpet curves for the first (2009-2010) and the last monitoring year (2011-2012). The trend at lower depth is not easily noticeable due to surface temperature influence. But, the ground thermal regime has change since the monitoring beginning. The maximum temperatures observed are lower during the last monitoring year (2011-2012). At 1 meter depth, the maximum temperature is 1.0 °C lower; at 2 meters depth, the maximum temperature is 1.1 °C lower, and finally, at 3 meters depth, the maximum temperature is 0.6 °C lower. The minimum soil temperatures reached at the end the monitoring are essentially the same to those reached during the first year.
Figure 6 shows the thermistors string F5 trumpet curves for the first (2009-2010) and the last monitoring year (2011-2012). The ground thermal regime on the west side of the airstrip has considerably changed since the monitoring beginning. A significant decrease in maximum temperatures reached was observed during this period. The maximum temperatures reached difference is 2.9 °C at 1 meter, 3.2 °C at 2.0 m, 3.1 °C at 3.0 m and 1.9 °C at 4, 0 m. The decrease in maximum temperature observed can be directly related to the water source deviation. The minimum temperature reached difference is 2.3 °C at 0.5 meters. This figure allows noting that active layer thickness decreasing is not really important, even if the difference between the maximum and minimum temperatures of the first and last year of monitoring is important. Latent heat prevents a rapid permafrost table rise, but if the trend continues, the permafrost could migrate upward significantly over the coming years.
The significant decrease in maximum temperatures on the upstream side (F5) can be directly related to the water source deviation. The decrease in maximum temperatures downstream (F2) can also be attributed to the water source deviation. It is possible to note that the decrease in maximum temperatures is greater on the upstream side. The water that seeped into the valley was blocked by the embankment on the west side of the airstrip, warming the ground at this location. The water then seeped under the embankment. Once on the downstream side of the airstrip, the water was probably

colder. The heat intake caused by water seepage was then smaller, but still noticeable. Thus, the water source deviation had a more significant effect on the east side (downstream) than the west side (upstream).
Decreasing minimum temperatures were expected due to convection embankment addition. Because this type of system extracts heat from the ground in winter, decreasing minimum temperatures were expected. However, this situation did not occur.
2.3 Thermal behavior in the convective embankment
Thermistors string D, the one located at half height of the convective embankment, shows an interesting behavior in winter. In winter, the normal behavior consists in having colder temperatures in the upper part of the embankment and warmer temperatures in the lower part of the embankment. This situation is caused by the fact that the heat extracted from the natural ground warms the bottom of the embankment while the temperature at the top of the embankment is influenced by the air temperature. This situation is observable for the different thermistors strings except for thermistors string D, where the temperature is constant through the entire embankment, see Figure 7. This situation can be explained by convection cells, which make the temperature uniform in the convective embankment.
3 MECHANICAL BEHAVIOR
Cumulative displacements as functions of depth are shown in Figure 8 for September 26 2009, September 26 2010, September 25 2011 and September 26 2012. This figure shows that the main movements occur principally at three depths; in the middle of the convective embankment (1.0 m), between 2.5 and 4.0 m depth and between 4.5 and 6.5 m depth. These cumulative displacements are respectively 27 mm, 49 mm and 39 mm. It should be noted that the two movements occurring in the natural ground are in opposite directions.
The general trend observed during the three monitoring years is not related to a failure movement of the embankment as schematize by Figure 9 a), but is more likely related to a vertical compression movement as schematize Figure 9 b). Consolidation of the silty-clay layer seems to occur, resulting from the vertical stress induced by the convective embankment construction built over the instrumentation.

4 FIELD OBSERVATIONS
4.1 Summer observations
Water seepage has been observed at the south-east end of the convective embankment, at the limit between the granular materials (MG-20) and the convective materials, see Figure 10. This water likely comes from intense precipitations that occurred in the hours before the visit. All the water that has fallen on the convective embankment must have seeped freely to the east end where compacted granular materials cover the ventilation systems. The water then flows to the south end of the embankment and finally returns to the center of the valley.
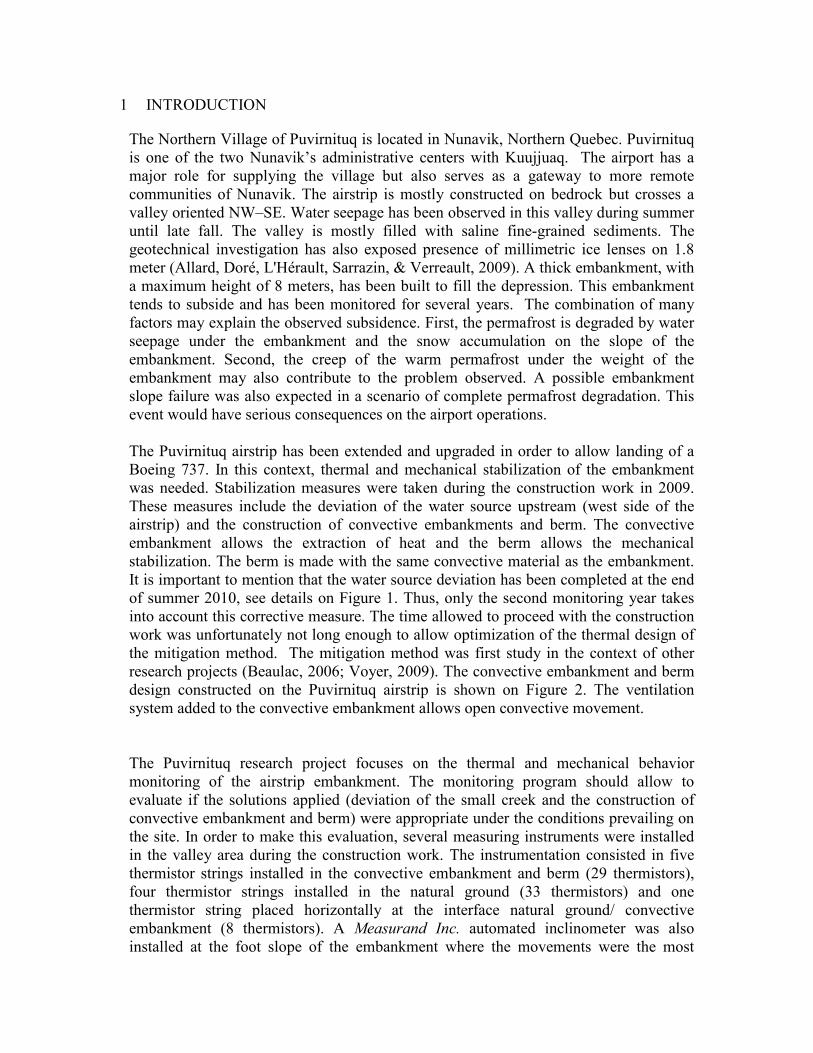
Some deteriorations have been observed three years after the convective embankment construction. Granular materials adjacent to the convective berm slipped and exposed the ventilation system. Figure 11 shows the half culvert from the ventilation system at two different places, either at the base of a ventilation pipe and between two pipes.
4.2 Winter observations
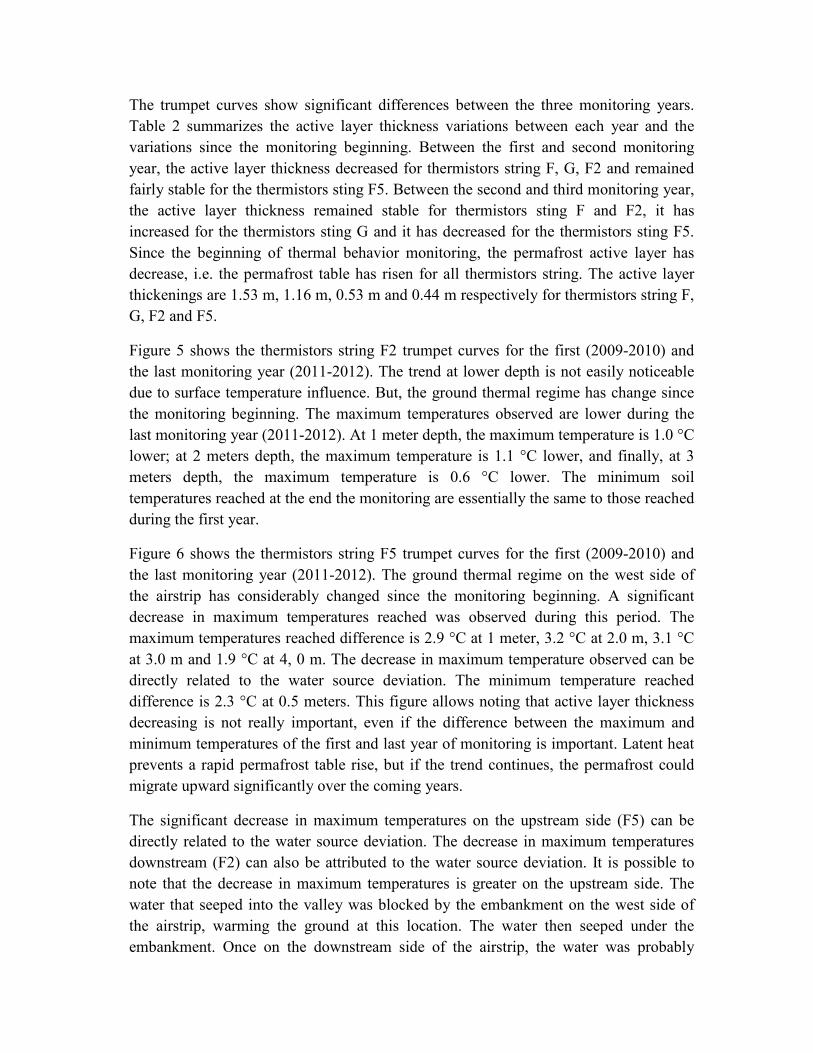
Figure 12 compares the convective embankment on the east side at different times, with a view towards the water deviation channel. It is possible to note that snow covers all ventilation chimneys at the base of the convective embankment are completely covered with snow. The data-acquisition box is also completely covered with snow.
During the March 2013 visit, several ventilation covers were removed to check inside of the ventilation system. Figure 13 shows four cases where chimneys are clogged directly under the cover. This situation has been observed under almost all cover removed. The thickness of the ice covers varies from few millimeters to more than two centimeters. When no ice cover was observed, it is quite possible that it was broken during the ventilation cover removal operation.
Inside the ventilation chimneys, at a depth corresponding approximately to the snow cover, ice chunks accumulation clogged the chimneys, see Figure 14. These ice chunks accumulations were observed in most ventilation chimneys, including all those located at the top of the convective embankment on the east side. Ice accumulation is also observable on the ventilation chimney walls. Ice chunks details are shown on Figure 15. These ice chunks are likely formed by condensation on chimney walls. These ice chunks falls in the chimneys forming a plug.

5 CONCLUSION
The first three monitoring years have highlighted some interesting facts on the thermal behaviour:
• All thermistors strings installed in the natural ground have shown a decreasing active layer between 0.44 and 1.53 meters.
• The significant decrease in maximum temperatures reached on the upstream, and the downstream sides can be directly related to the water source deviation.
• Decreasing minimum temperatures reached were expected due to convective embankment addition, but this situation did not occur.
• Evidence of convection in the convective embankment was noted in the thermistors string D during the three monitoring winters.
The first three monitoring years have also highlighted some interesting facts on the mechanical behaviour:
• Displacements observed at the monitoring beginning are similar to a vertical compression movement, following the berm construction. Displacements stabilized after the first year.
• The observed displacements are not compromising for the infrastructure. They are modest at shallow depths, and occur at a slow rate.
Finally, field observations have exposed interesting and useful facts:
• Some minor deteriorations have exposed the ventilation system. • Snow accumulation has completely covered the bottom ventilation system on the
west side. • Ice covers clogged the ventilation system under the ventilation covers. • Ice chunks accumulation clogged the chimneys.

Figure 1: Water source deviation
Figure 2: Convective embankment and berm design (modified from Verreault 2010)

Figure 3: Measuring instruments installed on the west and the east sides of the Puvirnituq airstrip
Figure 4- Evolution of soil temperature at 1 m and 2 m for the thermistors string F5
(upstream side), between June 15 and October 2 for years 2009 to 2012

Figure 5: Thermistors string F2 trumpets curves for the first (2009-2010) and the last monitoring year (2011-2012) and the temperature difference at different depth
Figure 6: Thermistors string F5 trumpets curves for the first (2009-2010) and the last monitoring year (2011-2012) and the temperature difference at different depth
2,9 °C
3,2 °C
1,9 °C
3,1 °C
2,3 °C
1,0 °1,1 °
0,6 °

Figure 7: Temperature profiles for thermistors string D
Figure 8 : Cumulative displacement as functions of depth for September 26 2009, September 26 2010, September 25 2011 and September 26 2012

Figure 9: a) Related displacement associated with failure movement and b) vertical compression movement
Figure 10: Water seepage observed at the south-east end of the convective embankment, at the limit between the granular materials (MG-20) and the convective materials
a) b)
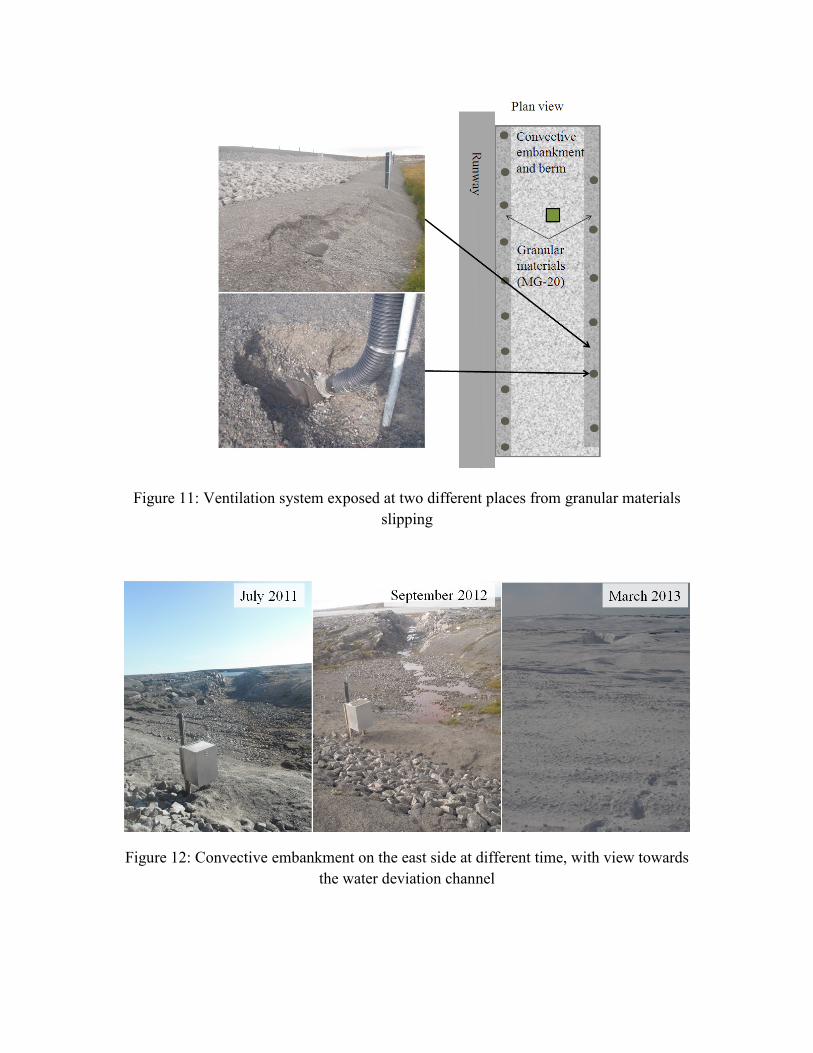
Figure 11: Ventilation system exposed at two different places from granular materials slipping
Figure 12: Convective embankment on the east side at different time, with view towards the water deviation channel

Figure 13: Ice covers forming under the ventilation covers
Figure 14: Ice chunks accumulation were observed in most ventilation chimneys

Figure 15: Ice chunks details
Table 1: Air thawing and freezing index for the three first monitoring years
Air thawing index (°C*day)
Air freezing index (°C*day)
Year 1 (2009-2010) 1196 2641 Year 2 (2010-2011) 1092 2859 Year 3 (2011-2012) 1123 3308
Table 2 : Active layer thickness variations between each monitoring year and the total variations since the monitoring beginning
*= linear extrapolation from the two last measurements

BIBLIOGRAPHY
Allard, M., Doré, G., L'Hérault, E., Sarrazin, D., & Verreault, J. (2009). Investigations
géotechniques, caractérisation du pergélisol et stratégie d’adaptation pour les aéroports du MTQ au Nunavik: Rapport d’étape 1 : État d’avancement du projet et résultats préliminaires. Québec, Québec, Canada: Centre d'étude nordique, Université Laval.
Beaulac, I. (2006). Impacts de la fonte du pergélisol et adaptations des infrastructures de transports routier et aérien au Nunavik. Université Laval, Québec.
Doré, G., & Zubeck, H. K. (2009). Cold Regions Pavement Engineering: McGraw-Hill. Voyer, É. (2009). Expérimentation des méthodes de mitigation de la dégradation du
pergélisol sur les infrastructures de transport du Nunavik, Nord du Québec. Université Laval, Québec.