civic center property and business improvement district · civic center property and business...
TRANSCRIPT

nbsgov.com
Prepared by:
Corporate Headquarters
32605 Temecula Parkway, Suite 100
Temecula, CA 92592
Toll free: 800.676.7516
Renewal Engineer’s Report For:
Civic Center Property and Business
Improvement District
March 15, 2019

TABLE OF CONTENTS
ENGINEER’S STATEMENT ............................................................................................................ 1
INTRODUCTION ......................................................................................................................... 2
2.1 District History ...................................................................................................................... 2
2.2 Proposed Duration ................................................................................................................ 2
2.3 Location ................................................................................................................................ 2
2.4 Legislative Context ................................................................................................................ 2
2.5 Court Rulings ......................................................................................................................... 3
IMPROVEMENTS ........................................................................................................................ 5
3.1 Cleaning and Maintenance ................................................................................................... 5
3.2 Safety and Activation ............................................................................................................ 5
3.3 Marketing and Communications .......................................................................................... 6
3.4 Administration and Contingency .......................................................................................... 6
ASSESSMENTS ........................................................................................................................... 7
4.1 Initial Maximum Assessment Rates ...................................................................................... 7
4.2 Annual Assessment Rate Increases ...................................................................................... 7
4.3 Rate Development ................................................................................................................ 8
4.4 Data for Annual Assessment Calculations ............................................................................ 8
4.5 Appeals ................................................................................................................................. 9
4.6 Method of Collection ............................................................................................................ 9
SPECIAL BENEFITS .................................................................................................................... 10
5.1 Improved Aesthetics ........................................................................................................... 10
5.2 Increased Safety ................................................................................................................. 10
5.3 Increased Promotional Activity .......................................................................................... 10
5.4 Improved Livability ............................................................................................................. 10
SPECIAL BENEFIT DISTRIBUTION ............................................................................................... 11
6.1 Parcel Characteristics ......................................................................................................... 11
6.2 Land Use Types ................................................................................................................... 12
6.3 Zones of Benefit .................................................................................................................. 14
6.4 Total Special Benefit Points ................................................................................................ 14
SEPARATION AND QUANTIFICATION OF GENERAL BENEFITS ..................................................... 15
7.1 Summary ............................................................................................................................. 15
7.2 Detailed Analysis ................................................................................................................. 15
BUDGET ................................................................................................................................... 19
8.1 Balance to Be Assessed ....................................................................................................... 19
ASSESSMENT RATE DEVELOPMENT .......................................................................................... 20
9.1 Assessment per Special Benefit Point ................................................................................ 20
9.2 Component Values ............................................................................................................. 20
BOUNDARY MAP ..................................................................................................................... 22
ASSESSMENT ROLL ................................................................................................................... 23
REFERENCES ............................................................................................................................ 24
APPENDICES ............................................................................................................................ 25
Civic Center Property and Business Improvement District Renewal Engineer’s Report (March 15, 2019) 1
ENGINEER’S STATEMENT
The assessments described in this Report have been prepared pursuant to Article XIII D of the California
Constitution and the Property and Business Improvement District Law of 1994 as augmented and modified
by Article 15 of the San Francisco Business and Tax Regulations Code (collectively, the “Assessment Law”).
In preparing these assessments:
1. I have identified all parcels that will have a special benefit conferred upon them by the
Improvements described in Section 2 of this Report (the “Specially Benefited Parcels”).
a. For particulars as to the identification of these parcels, reference is made to the
Assessment Diagram, a copy of which is included in Section 10 of this Report.
2. I have assessed the estimated costs and expenses of the Improvements upon the Specially
Benefited Parcels. In making such assessment:
a. The proportionate special benefit derived from the Improvements by each Specially
Benefited Parcel was determined in relationship to the total special benefits derived by all
Specially Benefited Parcels;
b. No assessment has been imposed on any Specially Benefited Parcel which exceeds the
reasonable cost of the proportional special benefit conferred on such parcel by the
Improvements; and
c. The general benefits have been separated from the special benefits and only special
benefits have been assessed.
I, the undersigned, respectfully submit this Engineer’s Report and, to the best of my knowledge,
information and belief, this Report, the assessments, and the Assessment Diagram herein have been
prepared and computed in accordance with the Assessment Law.
By:
John G. Egan
Assessment Engineer
R.C.E. 14853

Civic Center Property and Business Improvement District Renewal Engineer’s Report (March 15, 2019) 2
INTRODUCTION
2.1 District History
The Board of Directors for the Civic Center Community Benefit District (CBD) desires that the City levy an
assessment to fund certain services and activities (the “Improvements”) as described in Section 2 of this
Report. The proposed assessment is subject to the substantive and procedural requirements described in
Section 4, Article XIII D of the California Constitution (“Article XIII D”).
The City is authorized to levy an assessment pursuant to the Property and Business Improvement District
Law of 1994 as augmented and modified by Article 15 of the San Francisco Business and Tax Regulations
Code (collectively, the “PBID Law”).
The proposed assessment district will be known as the “Civic Center Property and Business Improvement
District” (“District”). The City formed an assessment district in the Civic Center area in 2010 with a ten-year
term. The City desires to renew the assessment district and expand the boundary through the proposed
formation of the District. The City’s Board of Supervisors will act as the legislative body for the District. The
CBD is the non-profit owners’ association that will represent the interests of the property owners. The CBD
will make recommendations to the City regarding the budget, services to be provided, and assessment
rates.
2.2 Proposed Duration
Assessments for the proposed District will be levied upon renewal of the District, to fund District
Improvements over the next 15 years. The first levy of assessments for improvements will be Fiscal Year
2019/20 and the final levy will be Fiscal Year 2033/34.
2.3 Location
The District will be located in the Civic Center area of the City. The District will generally be bounded by
Golden Gate Avenue and Turk Street to the North, Market Street to the South, 7th Street to the East, and
Gough Street to the West. A boundary map is provided in Section 10 of this report, which shows the
specific boundaries and parcel frontages to be included in the District.
2.4 Legislative Context
This Engineer’s Report is intended to comply with the requirements of Article XIII D and the PBID Law. The
following is a description of the legislative context within which this report is written.
In 1996, California Voters adopted Proposition 218, the “Right to Vote on Taxes Act” which added Articles
XIII C and XIII D to the California Constitution. Article XIII D imposes certain substantive and procedural
requirements on any agency that wishes to levy special assessments.
The substantive requirements are twofold: (1) assessments can only be imposed for a “special benefit”
conferred on an assessed parcel, and (2) assessments must be no greater than the reasonable cost of the
proportionate special benefit conferred on an assessed parcel.

Civic Center Property and Business Improvement District Renewal Engineer’s Report (March 15, 2019) 3
The special benefit and proportionality requirements are described in Section 4, Subdivision (a) of Article
XIII D: “An agency which proposes to levy an assessment shall identify all parcels which will have a special
benefit conferred upon them and upon which an assessment will be imposed. The proportionate special
benefit derived by each identified parcel shall be determined in relationship to the entirety of the capital
cost of a public improvement, the maintenance and operation expenses of a public improvement, or the
cost of the property related service being provided. No assessment shall be imposed on any parcel which
exceeds the reasonable cost of the proportional special benefit conferred on that parcel. Only special
benefits are assessable, and an agency shall separate the general benefits from the special benefits
conferred on a parcel. …”
In addition to its substantive requirements, Article XIII D imposes certain procedural requirements, which
include preparing an engineer’s report, providing written notice to property owners, providing assessment
protest ballots to property owners, holding a public hearing, and tabulating the assessment protest ballots.
2.5 Court Rulings
Since the initial passage of Proposition 218, several court rulings have helped provide context and direction
on the practical implementation procedures and requirements for levying assessments. Several of the key
concepts from these rulings are summarized below.
2.5.1 GENERAL BENEFIT
Article XIII D requires an agency to separate the general benefits from the special benefits conferred
because only special benefits are assessable.
The Court of Appeal in Golden Hills Neighborhood Assn., Inc. v. City of San Diego (2011) (Golden Hills)
clarified this concept by stating, “Separation and quantification of general and special benefits must be
accomplished by apportioning the cost of a service or improvement between the two and assessing
property owners only for the portion of the cost representing special benefits.”
The Court of Appeal in Beutz v. County of Riverside (2010) (Beutz) quoted from the Legislative Analyst’s
Office pamphlet titled “Understanding Proposition 218” which states an agency must, “estimate the
amount of special benefit landowners would receive from the project or service, as well as the amount of
‘general benefit.’ This step is needed because Proposition 218 allows local government to recoup from
assessments only the proportionate share of cost to provide the special benefit.”
The Court in Beutz further stated, “Separating the general from the special benefits of a public
improvement project and estimating the quantity of each in relation to the other is essential if an
assessment is to be limited to the special benefits.”
2.5.2 BENEFIT-BASED NOT COST-BASED
In Bonander v. Town of Tiburon (2009) (Tiburon), the Court of Appeal clarified the idea that assessments
must be apportioned based upon benefit rather than cost. The Court stated, “Proportionate special benefit
is the basis upon which a project’s total assessable costs are apportioned among parcels within an
assessment district.”
The assessment on a particular property cannot be based on the relative cost of the improvements, but
rather the special benefit conferred on such property. The Court in Tiburon also stated, “an assessment

Civic Center Property and Business Improvement District Renewal Engineer’s Report (March 15, 2019) 4
represents the entirety of the cost of the improvement or property-related service, less any amount
attributable to general benefits (which may not be assessed), allocated to individual properties in
proportion to the relative special benefit conferred on the property.”
2.5.3 PUBLIC PROPERTY
Section 4, Subdivision (a) of Article XIII D states, in part, “Parcels within a district that are owned or used by
any agency, the State of California or the United States shall not be exempt from assessment unless the
agency can demonstrate by clear and convincing evidence that those publicly owned parcels in fact receive
no special benefit.” Historically, there were differing opinions about the application of this requirement. The
language in Article XIII D seemed clear that publicly owned property could not be exempted, but it was
unclear whether the language required publicly owned property to be assessed.
The Court of Appeal in Manteca Unified School District v. Reclamation District No. 17 et al (2017)
(Manteca) clarified this issue by stating, “section 4, subdivision (a) of article XIII D of the California
Constitution unambiguously conditions any continuing benefit assessment exemption on a showing by clear
and convincing evidence of no special benefit.”
2.5.4 IMPRECISION
The Court in Tiburon acknowledged the difficulty of trying to precisely assign and measure special benefit,
stating, “Any attempt to classify special benefits conferred on particular properties and to assign relative
weights to those benefits will necessarily involve some degree of imprecision.”
The Court in Tiburon went on to say that a formula assigning equal weight to different special benefits
“may be a legally justifiable approach to measuring and apportioning special benefits, [but] it is not
necessarily the only valid approach. Whichever approach is taken to measuring and apportioning special
benefits, however, it must be both defensible and consistently applied.”

Civic Center Property and Business Improvement District Renewal Engineer’s Report (March 15, 2019) 5
IMPROVEMENTS
The proposed District will fund the following services and activities (the “Improvements”):
Cleaning and Maintenance
Safety and Activation
Marketing and Communications
The Improvements to be funded are those currently desired by District stakeholders and believed to be of
benefit to District properties. Every effort will be made to provide the services and activities according to
the estimates provided. Below is a description of the anticipated Improvements for the first year of the
District.
3.1 Cleaning and Maintenance
Cleaning and maintenance services including sidewalk sweeping, graffiti removal, and landscape
maintenance will be provided along the frontages of property within the District from 6 a.m. to 6 p.m.
seven days per week.
Zones 1 and 2 will each receive 40 hours of pressure washing per week. Workforce Development Cleaners,
or similar, will also provide an enhanced level of cleaning and maintenance services in Zone 2, Monday
through Friday.
3.2 Safety and Activation
Ambassadors will provide information, referrals, and support for pedestrians in Zone 1 from 7 a.m. to 7
p.m. seven days per week, and from 6 p.m. to 11 p.m. Tuesday through Saturday.
Stewards providing information, referrals, and support for pedestrians will serve Zone 2 from 7 a.m. to 7
p.m. seven days per week.
A Garage Greeter will be stationed at the Civic Center Garage in Zone 2 street-level elevators and pay
stations for pedestrian/customer service from 6 p.m. to 11 p.m., five nights per week (Tuesday through
Saturday).
Activation may include, but is not limited to, oversight of the Civic Center Plaza café kiosk (which the CBD
owns), and the daily setup of tables, chairs and games in Civic Center Commons. Additional Activation may
include programs and events such as markets, public art installations, musical performances, block parties,
recreational activities, and the annual Holiday Tree Lighting.

Civic Center Property and Business Improvement District Renewal Engineer’s Report (March 15, 2019) 6
3.3 Marketing and Communications
The District will provide the following marketing and communications services to improve the District’s
image and visibility, communicate with District stakeholders, and to communicate activities taking place
within the District. Work may include, but is not limited to, the following:
District Stakeholder Outreach
Website & Social Media
Service Presentations
General Benefit Fundraising
Branding
Events
Media Relations
Destination Marketing
3.4 Administration and Contingency
Administration includes daily oversight and operation of the District, adherence to the Management
District Plan, and compliance with audit/reporting requirements. The Improvements will be managed by a
professional staff that will oversee the District’s services, which will be delivered seven days per week.
Administration includes efforts to actively work on behalf of the District to ensure City and County services
and policies support the District. Also included in this category are administrative expenses necessary to
manage the District services. District funds for Administration may be used to establish and/or renew the
District. A well-managed District provides necessary oversight and guidance that produces higher quality
and more efficient programs.
The assessments will also fund a contingency reserve that may be used to cover possible unforeseen future
expenses and help to smooth out cash flows, which are affected by the timing of property owner
payments.

Civic Center Property and Business Improvement District Renewal Engineer’s Report (March 15, 2019) 7
ASSESSMENTS
4.1 Initial Maximum Assessment Rates
The rates below represent the maximum assessment rates for Fiscal Year 2019/20:
Zone 1
Land Use Type (1)
Rate per
Front ft
Rate per
Bldg sq ft
Rate per
Lot sq ft
Commercial, Office, Cultural $15.24399 $0.05217 $0.21773
Residential 15.24399 0.05217 0.21773
Educational, Philanthropic/Religious/Charitable 10.16266 0.03478 0.14515
Zone 2
Land Use Type (1)
Rate per
Front ft
Rate per
Bldg sq ft
Rate per
Lot sq ft
Commercial, Office, Cultural $36.12826 $0.12364 $0.51601
Residential 36.12826 0.12364 0.51601
Educational, Philanthropic/Religious/Charitable 24.08550 0.08243 0.34401
(1) Land use types are defined in Section 5.2
Based on the most recent parcel characteristics, these rates are expected to generate approximately
$3,240,387 in revenue during the first year of levy (2019/20). This assessment revenue will be
supplemented by non-assessment funds of $163,381, to meet the total estimated 2019/20 budget of
$3,403,768. Non-assessment funds represent 4.8% of the total budget, which corresponds to the general
benefit percentage identified in the Separation and Quantification of General Benefits section of this
report.
Future changes to parcel characteristics (lot, building, frontage, and land use) may cause changes in the
total assessment revenue. The assessment revenue for any given year will be the product of the District’s
parcel characteristics and the budget in effect for such fiscal year. Development within the District that
increases the overall building square footage, for example, will lead to increased assessment revenue, even
if assessment rates are not increased.
4.2 Annual Assessment Rate Increases
Each year the maximum assessment rates may be increased by up to 5% per year. Each year, prior to the
annual levy of assessments, the CBD shall estimate the cost to fund the Improvements for the upcoming
year. The assessment rates shall be levied at amounts necessary to generate sufficient revenue to meet the
estimated costs to fund the Improvements. However, except for increases due to development as set forth
in Section 4.1, annual assessment rate increases cannot exceed 5%.

Civic Center Property and Business Improvement District Renewal Engineer’s Report (March 15, 2019) 8
4.3 Rate Development
The rates in Section 4.1 are the product of a detailed analysis presented in Sections 6 through 9 of this
report.
4.4 Data for Annual Assessment Calculations
Each year, as part of the assessment calculation procedures, the CBD shall determine the land use type for
each parcel based on the County Assessor's use code or other appropriate supplementary information. The
parcel characteristics of lot square footage and building square footage shall similarly be based on the
County Assessor's secured rolled data for the applicable year and may be supplemented with other reliable
data sources. The frontage of each parcel shall be determined by reference to County Assessor's parcel
maps or, if necessary, to GIS data.
Assessment amounts may change over time in accordance with changes to parcel characteristics including
land use type and building square footage.
4.4.1 MIXED USE
Parcels in the District may have multiple land uses and could be categorized as having more than one of the
identified land use types. If the CBD is made aware of a parcel with more than one land use type, the
following shall apply:
If there are multiple land use types on one parcel, but those land use types all have the same assessment
rate, the CBD shall select the most appropriate land use type designation and levy the applicable
assessment rates.
If there are multiple land use types on one parcel, and those land use types have different assessment rates,
the CBD shall attempt to separate out the land use types by actual building square footage. The CBD shall
then pro-rate the total underlying lot square footage and frontage feet proportion to the building square
footage assigned to each land use type. After each land use type is assigned lot square feet, building square
feet, and frontage feet, the CBD shall calculate the applicable assessment rates for the respective land use
types.
For example, if a parcel has both Educational and Office uses, the Educational land use represents
40% of the total building square footage, and the Office land use represents 60% of the total
building square footage, the underlying lot’s frontage and lot square footage shall be assigned 40%
to the Educational land use and 60% to the Office land use. Those characteristics assigned to the
Educational land use shall be used to calculate an assessment at the Educational rates, and those
characteristics assigned to the Office land use shall be used to calculate the remaining portion of
the assessment at the Office rates.
If there are multiple land use types on one parcel and those land use types have different assessment
rates, but data sufficient to delineate the building square footages is not available, the CBD shall choose
the most appropriate land use type and the assessment shall be calculated according to those rates.

Civic Center Property and Business Improvement District Renewal Engineer’s Report (March 15, 2019) 9
4.5 Appeals
If a property owner believes the data used to calculate their assessment is inaccurate or that the identified
land use type is incorrect, the property owner may submit, in writing, a request for review to the CBD. The
property owner shall provide documentation needed to support the request for review. The CBD shall
review the request and provide a response to the property owner. The property owner must be current in
the payment of all assessments when filing the request for review and must remain current during the
review process. The property owner should continue to pay all amounts owed according to the County's
due dates.
If the review results in changes to any parcel characteristics used to compute the assessment, the CBD shall
recalculate the assessment. When recalculating the assessments, the assessment rates actually applied in
such fiscal year shall be used. Only the assessment for the parcel or parcels subject to review shall be
recalculated.
If the recalculated assessment is less than the amount submitted to the County on the secured property tax
roll, the difference shall be credited back to the property owner. This credit shall be limited to the current
fiscal year and the prior fiscal year, if applicable. The “fiscal year” shall follow the County’s fiscal year for
property taxes, from July 1 to June 30. The applicable fiscal year shall be determined by the date the
request for review is submitted to the CBD.
For example, if a request for review is submitted to the CBD during Fiscal Year 2020/21, the Fiscal
Year 2020/21 and 2019/20 assessments will be reviewed. The property owner credit shall be limited
to any difference calculated for Fiscal Year 2020/21 (the current fiscal year) and Fiscal Year 2019/20
(the prior fiscal year).
The credit may be provided in the form of a check to the property owner, an adjustment to the current
year’s property tax roll (if possible), or a credit to the succeeding year’s assessment thereby reducing the
amount placed on the secured property tax roll for such year.
If the recalculated assessment is greater than the amount submitted to the County on the secured property
tax roll, the CBD shall apply the recalculated assessment to the succeeding year’s property tax roll and no
adjustments shall be made to the prior or current fiscal years’ assessments.
If a property owner is dissatisfied with the CBD’s decision on their appeal, the property owner may appeal
the matter further to the City (OEWD), who shall make a conclusive determination and whose decision
shall be final.
4.6 Method of Collection
The assessments will be collected annually on the County Treasurer & Tax Collector’s (“Treasurer”) secured
property tax roll. The assessments will be subject to the Treasurer’s assigned due dates and late penalties.
However, the City may choose to collect the assessments in an alternate manner (including directly billing
the property owner) as may be deemed appropriate or necessary by the City.

Civic Center Property and Business Improvement District Renewal Engineer’s Report (March 15, 2019) 10
SPECIAL BENEFITS
The Improvements will confer special benefits upon certain parcels within the proposed District. This
section provides a description of those special benefits.
5.1 Improved Aesthetics
Several of the proposed services will confer aesthetic benefits. The cleaning and maintenance services are
designed to improve the visual appearance immediately surrounding properties within the District. It is
believed a cleaner environment is more aesthetically pleasing. Research shows that when areas where
consumers conduct business are more aesthetically pleasing, they are also more desirable (Vilnai-Yavetz
2010). Therefore, the Improvements will confer aesthetic benefits.
5.2 Increased Safety
Research has shown vandalism, such as graffiti, is a key factor in determining attitudes about safety (Austin
2007). The perception of neighborhood problems has a stronger effect on the fear of crime than
demographic factors (Dowler 2003). If this research holds true, the proposed District’s graffiti removal
services should have a positive effect on reducing fear of crime.
Research has shown that business improvement districts that provide services such as the stewards and
ambassadors proposed within the District have been successful in reducing crime rates (Brooks 2005). The
increased safety should be experienced by both residential and non-residential properties. Research shows
there are safety benefits related to living in or near a commercial area managed by a business improvement
district (Hoyt 2005). Therefore, the Improvements will confer safety benefits.
5.3 Increased Promotional Activity
The Improvements will confer promotional benefits upon certain parcels within the proposed District.
Certain land use types are interested in attracting customers, tenants, patrons, or visitors, or a combination
thereof. The Improvements will promote the area, thereby helping to attract these groups. These groups,
whether customers, tenants, patrons, or visitors, are interested in utilizing each property for its intended
design. Although these groups vary according to their intended use of the property, the commonality can be
found in each land use type’s advantage gained by attracting their specific group. Therefore, the
Improvements will confer promotional benefits.
5.4 Improved Livability
Livability can have a wide range of meanings but as used in this analysis it represents the desirability to
reside in an area based on the characteristics of urban environments that make them more attractive places
to live (Throsby 2005). The proposed Improvements will positively impact the urban environment by
creating a sense of place and local identity and improving feelings of security, all of which can influence
livability. Therefore, the Improvements will confer livability benefits.

Civic Center Property and Business Improvement District Renewal Engineer’s Report (March 15, 2019) 11
SPECIAL BENEFIT DISTRIBUTION
As described in the Introduction, once special benefits are identified, those special benefits must then be
assigned based on the estimated proportionate special benefit derived by each parcel. This section
describes the assignment of special benefit to each parcel.
6.1 Parcel Characteristics
The following parcel characteristics are used to determine each parcel’s proportionate special benefit:
Lot square footage
Building square footage
Linear frontage
Parcels of the same land use type will experience different degrees of special benefit in relation to
differences in their lot size, building size, and linear frontage. For example, a parcel with a large building
will experience greater special benefit than a parcel with a small building. Accordingly, as lot size, building
size, and linear frontage increase, parcels are considered to receive proportionately greater special benefit.
Therefore, these parcel characteristics are deemed appropriate factors for determining proportional
special benefit.
In order to relate differing parcel characteristics to one another, a relative factor is determined for each.
6.1.1 LOT FACTOR
The average lot size in the proposed District is approximately 4,620 square feet. Each parcel’s actual lot size
was divided by the District’s average lot size to determine a Lot Factor.
Parcel's
Lot Sq Ft / District's
Average
Lot Sq Ft =
Parcel's
Lot Factor
6.1.2 BUILDING FACTOR
The average building size in the proposed District is approximately 19,280 square feet. Each parcel’s actual
building size was divided by the District’s average building size to determine a Building Factor.
Parcel's
Building Sq Ft / District's
Average
Building Sq Ft =
Parcel's
Building Factor
6.1.3 FRONTAGE FACTOR
The average linear frontage in the proposed District is approximately 66 feet. Each parcel’s actual linear
frontage was divided by the District’s average linear frontage to determine a Frontage Factor.
Parcel's
Frontage Ft / District's
Average
Frontage Ft =
Parcel's
Frontage Factor

Civic Center Property and Business Improvement District Renewal Engineer’s Report (March 15, 2019) 12
6.2 Land Use Types
In addition to lot size, building size, and linear frontage, a parcel’s land use type will also affect the special
benefits received. Following the calculation of each parcel characteristic factor, Land Use Benefit Points
were assigned. These benefit points correspond to the special benefits described in Section 4.
Each parcel within the proposed District is assigned a land use type for purposes of determining the special
benefits received. Below is a description of the land use type categories to be assessed within the
proposed District.
Commercial land use types include parcels used for a commercial purpose including, but not limited to,
retail, restaurants, parking lots, parking garages, hotels/motels, and hospitals.
Office land use types include parcels used as administrative workplaces whether privately or publicly
owned including courthouses, administration offices of educational institutions, and governmental
administration (including, but not limited to, the Public Utilities Commission, SFMTA, and City Hall).
Cultural land use types include parcels used for cultural or entertainment purposes such as museums,
theaters, and libraries as well as artistic performance venues (including Civic Center Plaza) and
auditoriums, whether publicly or privately owned.
Residential land use types include parcels used as residential dwellings including condominiums and
for-rent multi-unit parcels such as duplexes, triplexes, and apartments of four or more units.
Educational land use types include parcels used for instructive purposes whether privately or publicly
owned including SFUSD school sites, the Chris Hellman Center for Dance (SF Ballet school), SF
Conservatory of Music, City College of SF, and the Boys & Girls Club.
Philanthropic/Religious/Charitable land use types include parcels used for humanitarian assistance,
faith-based meetings, or benevolent social organization meetings, and are operated by non-profit
entities not otherwise included in the definition of Cultural.
As described below, some special benefits are conferred upon all land use types, and others are conferred
only upon certain land use types.
6.2.1 APPORTIONING AESTHETIC BENEFITS
The aesthetic benefits conferred by the Improvements will be enjoyed by all assessable land use types. The
benefit of visual appeal is not restricted to any particular land use. A more attractive public environment
can be enjoyed by all parcels irrespective of land use type. Accordingly, each assessable land use type will
be assigned one Aesthetic Benefit Point.
6.2.2 APPORTIONING SAFETY BENEFITS
Similarly, the safety benefits conferred by the Improvements will be enjoyed by all assessable land use
types. Safety can be thought of as a universal need. Its importance can be seen in the fact that everyone
desires to live and work in safe, crime-free areas (Lau Leby 2010). Therefore, because levels of safety affect
all land uses, it follows that an increase in safety will benefit all land use types. Accordingly, each
assessable land use type will be assigned one Safety Benefit Point.

Civic Center Property and Business Improvement District Renewal Engineer’s Report (March 15, 2019) 13
6.2.3 APPORTIONING PROMOTIONAL BENEFITS
The Improvements are designed to engage customers, patrons, and visitors by attracting them to the area,
encouraging them to stay longer, and creating an enjoyable experience such that they wish to return and
convey a positive message about the area through referral.
Those land use types interested in attracting customers benefit from increased revenues. The proposed
services will create a more aesthetically pleasing environment, which has been shown to “increase
consumer’s intentions to spend money” (Vilnai-Yavetz 2010). In addition, the City’s Office of Economic and
Workforce Development (“OEWD”), in its 2012 report “Impact Analysis of San Francisco’s Property &
Business Improvement Districts (CBDs/BIDs)” (“CBD Analysis”) found that during the recession of 2007 to
2009, CBDs “saw less significant reductions in sales tax revenues” than other areas of the City.
Those land use types interested in attracting tenants benefit from improved economics and lower vacancy
rates. The OEWD, in its CBD Analysis, found that CBDs “maintained lower commercial vacancy rates than
what was experienced across San Francisco” during the recession of 2007 to 2009.
Those land use types interested in attracting patrons and visitors benefit from the District being marketed
and promoted as a cultural and entertainment destination. This marketing and promotion is designed to
increase awareness of the area and highlight events and performances with the ultimate goal of bringing
more potential patrons and visitors to the area.
Therefore, all land use types engaged in activities that are concerned with the experience of customers,
tenants, patrons, and visitors will receive this Promotional Benefit. Parcels designated as Commercial,
Office, or Cultural will be assigned one Promotional Benefit Point. All other land use types receive no
Promotional Benefit Points.
6.2.4 APPORTIONING LIVABILITY BENEFITS
The Improvements are designed to positively impact the urban environment. These impacts influence local
identity and feelings of security, which affect Livability. Livability represents the desirability to reside in an
area and as such is unique to parcels used as residences. Therefore, parcels designated as Residential will
receive one Livability Benefit Point and all non-residential land uses will receive no Livability Benefit Points.
6.2.5 LAND USE BENEFIT POINT SUMMARY
The table below summarizes the Land Use Benefit Points:
Land Use Type
Aesthetic
Benefit
Points
Safety
Benefit
Points
Promo-
tional
Benefit
Points
Livability
Benefit
Points
Total
Land Use
Benefit
Points
Commercial, Office, Cultural 1.00 1.00 1.00 0.00 3.00
Residential 1.00 1.00 0.00 1.00 3.00
Educational, Philanthropic/Religious/Charitable 1.00 1.00 0.00 0.00 2.00

Civic Center Property and Business Improvement District Renewal Engineer’s Report (March 15, 2019) 14
6.3 Zones of Benefit
In addition to parcel characteristics and land use types, location also plays a role in determining special
benefit. The District will provide two different levels of service across two distinct areas within the
proposed boundary of the District. Therefore, it is important to distinguish the differing improvement
levels between the two zones to assign an appropriate Zone Benefit Factor to the parcels within each Zone.
Service/Activity
Zone 1
Factor
Zone 2
Factor
Cleaning and Maintenance 2.00 6.81
Safety and Activation 2.00 6.30
Marketing and Communications 1.00 1.47
Administration 2.00 2.00
Factor Totals 7.00 16.59
Zone Factors 1.00 2.37
Based on this analysis, a Zone Benefit Factor of 1.00 is assigned to parcels in Zone 1, and a Zone Benefit
Factor of 2.37 is assigned to parcels in Zone 2. A detailed breakdown of the Zone Benefit Factor
calculations is provided in Appendix A.
6.4 Total Special Benefit Points
The calculation of Special Benefit Points for each parcel takes into account each component analyzed and
described above, Parcel Characteristics, Land Use, and Zone. The formula for determining each parcel’s
Special Benefit Points is as follows:
( Lot
Factor + Building
Factor + Frontage
Factor ) x Land Use
Benefit
Points x
Zone
Factor = Special
Benefit
Points
The Special Benefit Points were computed for each parcel in the proposed District and summed. Based on
the most current data available at the time of writing this report, the sum of Special Benefit Points for the
entire District is 9,664.84. This total was used to determine the 2019/20 Assessment per Special Benefit
Point shown in Section 7.

Civic Center Property and Business Improvement District Renewal Engineer’s Report (March 15, 2019) 15
SEPARATION AND QUANTIFICATION OF GENERAL
BENEFITS
As described in the Introduction, only special benefits are assessable and in order to assess only special
benefits, the general benefits resulting from the Improvements must be separated and quantified. This
section describes the process used to separate and quantify the general benefits. We rely on a “multi-
perspective average approach” (MPAA), which entails analyzing the general benefits in totality by taking an
average across multiple perspectives, to account for the overlap across services and to ensure that any
single approach does not dominate the District’s general benefit percentage.
7.1 Summary
As detailed below, it is estimated the Improvements will confer 4.8% general benefit.
7.2 Detailed Analysis
The subsections below provide the detailed analysis of two approaches to quantifying general benefits.
7.2.1 PERIPHERAL PARCEL APPROACH
One approach is to define general benefit as the benefit that accrues to properties on the periphery of the
District. Parcels with frontage adjacent to or across from District parcels are referred to as peripheral
parcels. The Improvements will be provided solely within the District, but for purposes of this analysis, we
assume a certain level of benefit will be conferred on peripheral parcels.
Peripheral parcels may receive some ancillary benefit from the presence of the stewards and ambassadors
and the adjacent, cleaner streets. It is possible the stewards and ambassadors will report suspicious or
criminal activity they witness outside the District, as long as it is close enough to see from their position
within the District boundary. Likewise, the marketing activities could draw consumers to the District who
might also explore the broader area and patronize businesses on the periphery of the District.
To calculate the benefit accruing to peripheral parcels as a result of the Improvements, the total Benefit
Points were recalculated by including peripheral parcels. The following figures represent the adjusted parcel
characteristic averages resulting from the inclusion of the peripheral parcels:
Average lot square footage: 2,882.02
Average building square footage: 12,106.73
Average linear frontage: 40.55
The methodology described in Section 6 was applied to all parcels, including the peripheral parcels.
Adjustments were made to the characteristics of certain peripheral parcels by determining the proportion
of frontage adjacent to the District boundary as compared to frontage not adjacent to the District boundary.
If this proportion was less than one (i.e. the peripheral parcel has a portion of its frontage not adjacent to
the District boundary), the parcel’s building and lot square footages were modified by the frontage
proportion.

Civic Center Property and Business Improvement District Renewal Engineer’s Report (March 15, 2019) 16
This resulted in a total of 3,098 benefit points for those parcels outside the District and a total of 18,633
benefit points for all parcels. This equates to approximately 16.6% of the total benefit points assigned to
peripheral parcels. This preliminary figure would be an appropriate measure of the benefit conferred to
peripheral parcels if they received the full benefit of the Improvements. However, the peripheral parcels do
not directly receive any cleaning or maintenance services, ambassadors and stewards do not specifically
patrol the areas beyond the District boundary, and the promotional efforts are not focused on these
parcels. Therefore, it is necessary to reduce the initial figure in order to reflect the reduced benefit.
Because the general benefits are conferred by multiple benefit types, it was necessary to calculate a
blended reduction factor in order to estimate the reduced benefit conferred upon peripheral parcels. The
table below shows the reduction factors for each benefit type:
Benefit Type
Reduction
Factor
Improved Aesthetics (1) 0.82
Increased Safety (2) 0.86
Increased Promotional Activity (3) 0.50
Improved Livability (3) 0.50
Average Reduction 0.70
(1) The Improvements are physically separated from peripheral parcels. The Improvements
will be located within close physical proximity to parcels within the District. The cleaning
services are largely provided along parcel frontages which, given the City's typical
sidewalk width of 12 feet, should be approximately 12 feet from any parcel within the
District. Distances greater than 12 feet will see diminishing benefit as distance increases.
Distances between parcels in the District and peripheral parcels were computed using
GIS data. This showed an average distance of 67.9 feet from the Improvements. This is a
reduction of approximately 82% from the typical distance to Improvements for a parcel
within the District.
(2) The ambassador and steward services are provided only along frontages of District
property. The total street length within the District is approximately 6.8 miles. The net
street length fronting peripheral parcels is approximately 0.95 miles. This is a reduction
of approximately 86% for the estimated time peripheral parcels may expect to receive
ancillary safety benefits.
(3) Reduction estimated to be half.
Accordingly, the initial percentage derived through the application of benefit points was reduced by a factor
of 0.7. This results in a general benefit of 5% using the peripheral parcel approach.
7.2.2 PEDESTRIAN TRAFFIC APPROACH
Given the observed volume of pedestrian traffic within the District, it was appropriate to also estimate the
overall general benefit by analyzing benefits to the general public through a pedestrian traffic analysis.
Benefits to pedestrians who live within the District, work within the District, and to tourists, consumers, and
patrons visiting the District are all related to the special benefits conferred by the Improvements and are all
related to properties receiving special benefits. This general benefits analysis therefore only focuses on
pedestrians passing through the District.

Civic Center Property and Business Improvement District Renewal Engineer’s Report (March 15, 2019) 17
Because the pedestrian traffic generated by and for specially benefiting parcels represents the special
benefit itself, the general benefits enjoyed by pass-through pedestrian traffic must be averaged along with
the peripheral property approach, which also analyzed overall general benefits.
Both approaches attempt to analyze the overall general benefit, and as such taking two separate
approaches to quantifying the same overall general benefit should prevent either approach from skewing
the estimate too far one way.
The first step was to estimate pedestrian traffic generated by parcels within the District. To do this, Average
Daily Trips (ADT) were computed for each parcel based on the trip generation rates from the Institute for
Transportation Engineers (ITE) Trip Generation Manual (9th Edition). The ADT used in this analysis are shown
below:
Land Use Type ADT (1) ADT per
Commercial 54.3 1,000 sq ft of building
Office 16.7 1,000 sq ft of building
Cultural 56.0 1,000 sq ft of building
BART 19,402.0 BART station
Residential 5.2 dwelling unit
Educational 17.4 1,000 sq ft of building
Charitable/Religious 9.9 1,000 sq ft of building
(1) ADT values are detailed in Appendix B
The ADT was computed for each parcel. However, this figure represents vehicles trips, and the goal in this
analysis was to estimate pedestrian traffic. In order to estimate the equivalent pedestrian traffic, an average
of 1.54 persons per vehicle (Davis 2019) was multiplied by the total ADT and resulted in a figure of
approximately 683,006 for the entire district. For purposes of this analysis, this figure represents the total
estimated pedestrian traffic generated by specially benefiting parcels.
The next step was to estimate the total pedestrian traffic in the district, including traffic generated by
parcels as well as pedestrian traffic simply passing through the district. To do this, the average of observed
pedestrian traffic at specific intersections was determined using SFCTA data for eight District-related
intersections (Van Ness BRT 2013). This data showed an average of 18,834 daily pedestrian crossings per
intersection. Data was not available for all intersections within the District and therefore the averages were
applied throughout the District.
There are approximately 65 intersections within the District, but 18 were considered to be minor streets
and therefore wholly excluded from the count. Further, there are approximately 18 additional intersections
that are split, one side of the street having frontage within the District, and one side not having District
frontage. These intersections were reduced by half to account for this split. Therefore, the result was a net
total of 38 intersections used to estimate the total pedestrian traffic within the District. Multiplying the
average daily pedestrian crossings per intersection (18,834) by the net intersections (38) yields an initial
estimate of 715,703 total pedestrians.
Therefore, of the total estimated pedestrian trips (715,703), approximately 95.4% (683,006) were estimated
to be related to District parcels. This leaves an estimated 32,697 pass-through pedestrian trips, which

Civic Center Property and Business Improvement District Renewal Engineer’s Report (March 15, 2019) 18
equates to approximately 4.6%. This figure represents the overall general benefits as measured by the
pedestrian traffic approach.
7.2.3 OVERALL GENERAL BENEFIT
As noted earlier, the analyses above represent two approaches to quantifying the overall general benefit
within the District. The pedestrians generated by properties within the District are directly linked to the
property-related benefits described in this report. Therefore, because these two approaches seek to
quantify the same District general benefit, but from two different perspectives, the figures were averaged
to determine a single, overall general benefit percentage. The table below presents the overall general
benefit calculation:
General Benefit
Quantification Approach
General
Benefit Percentage
Peripheral Parcels 5.0%
Pedestrian Traffic 4.6%
Average, Overall General Benefit 4.8%
Therefore, 4.8% of the estimated total budget must be funded from sources other than assessments.

Civic Center Property and Business Improvement District Renewal Engineer’s Report (March 15, 2019) 19
BUDGET
The following table is a summary of the estimated annual costs to fund the Improvements for Fiscal Year
2019/20:
Budget Items
FY 2019/20
Estimated Budget
Cleaning, Maintenance, Safety, & Activation $2,583,768.00
Marketing and Communications 250,000.00
Administration and Contingency 570,000.00
Total Estimated Costs (2019/20) $3,403,768.00
8.1 Balance to Be Assessed
The total amount to be assessed upon the specially benefitting parcels is the total cost of the
Improvements, as detailed above, less the portion attributable to General Benefit as detailed in the
Separation and Quantification of General Benefits section.
The calculation of the balance to be assessed is shown below:
Description Amount
Total Estimated Costs (2019/20) $3,403,768.00
Less General Benefit Portion (4.8%) 163,380.86
Balance to Be Assessed $3,240,387.14
Each year the estimated budget may change, which will cause a corresponding change in the dollar amount
of general benefit. However, the general benefit percentage will remain at 4.8% in future years.

Civic Center Property and Business Improvement District Renewal Engineer’s Report (March 15, 2019) 20
ASSESSMENT RATE DEVELOPMENT
9.1 Assessment per Special Benefit Point
The Assessment per Special Benefit Point was determined by dividing the Balance to Be Assessed (from
Section 7.1) by the 2019/20 Total District Special Benefit Points (from Section 5.4).
The calculation of the 2019/20 Assessment per Special Benefit Point is shown below:
Description Amount
Balance to Be Assessed $3,240,387.14
Total District Special Benefit Points 9,664.84
Assessment per Special Benefit Point (2019/20) $335.28
The Assessment per Special Benefit Point computed above was used to determine the 2019/20 assessment
rates per parcel characteristic shown in Section 3.1 as well as in Section 8.3. Future changes to a parcel’s
characteristics (lot, building, frontage, and land use) will cause changes in the assessment amount. The
assessment amounts for any given year will be the product of each parcel’s characteristics and the District
budget in effect for such fiscal year.
Development within the District that increases the overall building square footage, for example, will lead to
a greater total levy, even if assessment rates are not increased.
9.2 Component Values
The 2019/20 levy for each component of the assessment (lot, building, and frontage) can be broken down
as follows:
Lot
Factor x Land Use
Benefit
Points x
Zone
Factor x Assessment
per Special
Benefit Point =
Lot
Levy
Building
Factor x Land Use
Benefit
Points x
Zone
Factor x Assessment
per Special
Benefit Point =
Building
Levy
Frontage
Factor x Land Use
Benefit
Points x
Zone
Factor x Assessment
per Special
Benefit Point =
Frontage
Levy
The determination of the 2019/20 value for each component of the assessment is the component’s levy
divided by the component value.
Civic Center Property and Business Improvement District Renewal Engineer’s Report (March 15, 2019) 21
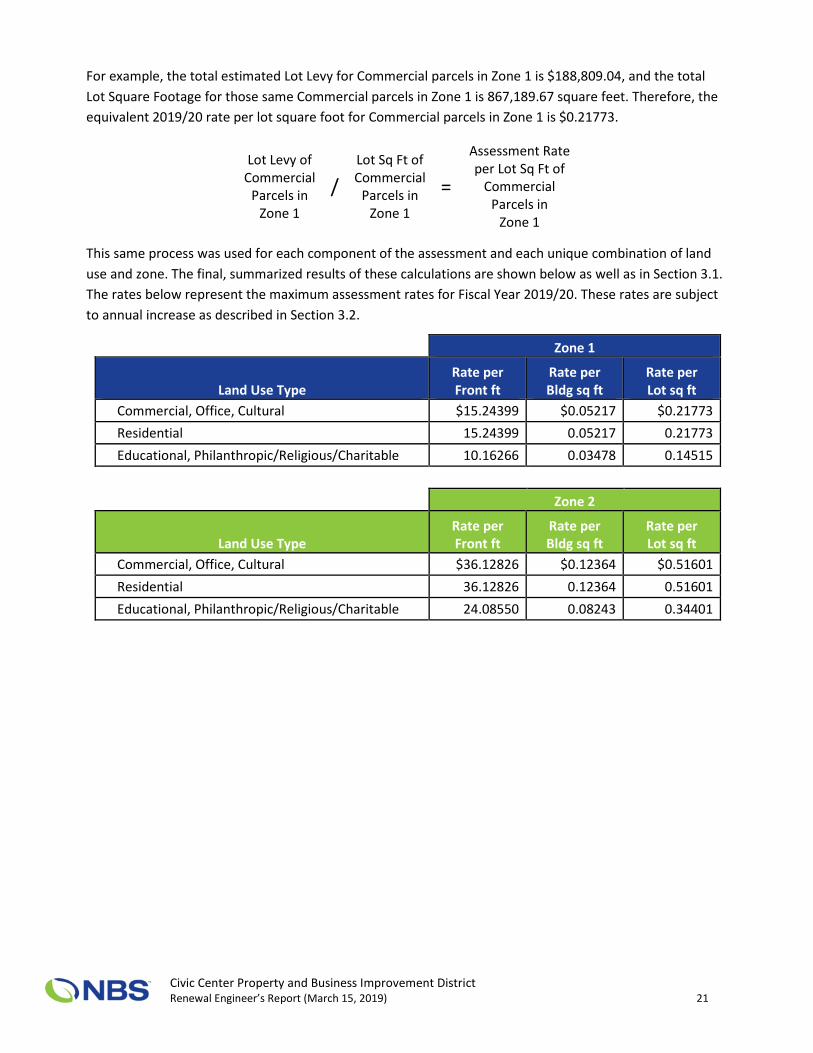
For example, the total estimated Lot Levy for Commercial parcels in Zone 1 is $188,809.04, and the total
Lot Square Footage for those same Commercial parcels in Zone 1 is 867,189.67 square feet. Therefore, the
equivalent 2019/20 rate per lot square foot for Commercial parcels in Zone 1 is $0.21773.
Lot Levy of
Commercial
Parcels in
Zone 1
/
Lot Sq Ft of
Commercial
Parcels in
Zone 1
=
Assessment Rate
per Lot Sq Ft of
Commercial
Parcels in
Zone 1
This same process was used for each component of the assessment and each unique combination of land
use and zone. The final, summarized results of these calculations are shown below as well as in Section 3.1.
The rates below represent the maximum assessment rates for Fiscal Year 2019/20. These rates are subject
to annual increase as described in Section 3.2.
Zone 1
Land Use Type
Rate per
Front ft
Rate per
Bldg sq ft
Rate per
Lot sq ft
Commercial, Office, Cultural $15.24399 $0.05217 $0.21773
Residential 15.24399 0.05217 0.21773
Educational, Philanthropic/Religious/Charitable 10.16266 0.03478 0.14515
Zone 2
Land Use Type
Rate per
Front ft
Rate per
Bldg sq ft
Rate per
Lot sq ft
Commercial, Office, Cultural $36.12826 $0.12364 $0.51601
Residential 36.12826 0.12364 0.51601
Educational, Philanthropic/Religious/Charitable 24.08550 0.08243 0.34401

Civic Center Property and Business Improvement District Renewal Engineer’s Report (March 15, 2019) 22
BOUNDARY MAP
The following pages contain the assessment diagram for the District.

ON
ES
ST
TURK ST
MIS
SIO
N S
T
07TH
ST
GO
UG
H S
T
MIN
NA
ST
08TH
ST H
OW
AR
D S
T
GROVE ST
NATO
MA
ST
MCALLISTER ST
MA
RK
ET S
T
FR
AN
KL
IN S
T
09TH
ST
HAYES ST
GOLDEN GATE AVE
FELL ST
10TH
ST
LA
RK
IN S
T
HY
DE
ST
06TH
ST
FOLS
OM
ST
OAK ST
11TH
ST
VA
N N
ES
S A
VE
RU
SS
ST
STE
VE
NSO
N S
T
JESSIE
ST
IVY ST
LA
NG
TO
N S
T
PAGE ST
JO
NE
S S
T
PO
LK
ST
12TH
ST
ELM STM
OSS S
T
LE
AV
EN
WO
RT
H S
T
GR
AC
E S
T
CLE
MEN
TIN
A S
T
FULTON ST
TEH
AM
A S
T
RA
USC
H S
T
TA
YL
OR
ST
HA
RR
ISO
N S
T
WA
SH
BU
RN
ST
DO
RE S
T
SO
UT
H V
AN
NE
SS
AV
E
SU
MN
ER
ST
HA
RR
IET S
T
BR
AD
Y S
T
JU
LIA
ST
LA
SK
IE S
T
AN
GELO
S A
LY
OD
D F
ELLO
WS W
AY
HA
LLA
M S
T
HER
ON
ST
RO
DG
ER
S S
T
UNITED NATIONS PLZ
I-80 W
OFF R
AM
P
DR
CA
RLT
ON
B G
OO
DL
ET
T P
L
CLE
VELA
ND
ST
SH
ER
MA
N S
T
MA
SO
N S
T
BR
EE
N P
L
DO
DG
E S
T
MIN
T P
LZ
DEC
KER
ALY
JESSIE
ST
STE
VE
NSO
N S
T
PO
LK
ST
NATO
MA
ST
JESSIE
ST
MIN
NA
ST
FULTON ST
S A N F R A N C I S C OS A N F R A N C I S C O
S I T ES I T E O
0 250 500125 Feet
Zone 1 Frontage
Zone 2 Frontage
District Block Lots
Surrounding Area Block Lots
O
C I V I C C E N T E RC I V I C C E N T E RP R O P E R T Y A N D B U S I N E S SP R O P E R T Y A N D B U S I N E S S
I M P R O V E M E N T D I S T R I C TI M P R O V E M E N T D I S T R I C T

Civic Center Property and Business Improvement District Renewal Engineer’s Report (March 15, 2019) 23
ASSESSMENT ROLL
The following pages contain the proposed 2019/20 assessment roll for the District.

City of San Francisco
Civic Center Property and Business Improvement DistrictFiscal Year 2019/20 Proposed Assessment Roll
APN
Front
Ft
Bldg
Sq Ft
Lot
Sq Ft
Land Use
Type (1) Zone
Front
Factor
Bldg
Factor
Lot
Factor
Land Use
BP
Zone
Factor
Total
BP
Preliminary
Assessment
0351 -022 605.25 6,030.00 32,534.00 COM 2 9.1729 0.3128 7.0424 3 2.37 117.51 $39,399.82
0351 -033 116.59 4,800.00 2,391.00 COM 2 1.7670 0.2490 0.5176 3 2.37 18.01 6,039.44
0351 -035 1,270.06 350,000.00 94,085.00 OFC 2 19.2486 18.1531 20.3660 3 2.37 410.73 137,707.13
0351 -037 37.63 1,005.00 335.00 COM 2 0.5702 0.0521 0.0725 3 2.37 4.94 1,656.45
0351 -039 115.00 0.00 2,962.08 OFC 2 1.7429 0.0000 0.6412 3 2.37 16.95 5,683.21
0351 -041 25.00 0.00 958.32 OFC 2 0.3789 0.0000 0.2074 3 2.37 4.17 1,397.71
0351 -043 70.72 0.00 814.00 COM 2 1.0718 0.0000 0.1762 3 2.37 8.87 2,975.02
0351 -046 238.16 73,929.00 6,080.00 OFC 2 3.6094 3.8344 1.3161 3 2.37 62.28 20,881.98
0351 -049 216.35 0.00 6,385.00 OFC 2 3.2790 0.0000 1.3821 3 2.37 33.14 11,111.15
0351 -050 194.55 76,500.00 11,750.00 COM 2 2.9486 3.9677 2.5435 3 2.37 67.26 22,550.29
0351 -051 56.00 41,100.00 5,568.00 EDU 2 0.8487 2.1317 1.2053 2 2.37 19.84 6,651.91
0351 -052 1.58 452.00 157.72 COM 2 0.0239 0.0234 0.0341 3 2.37 0.58 194.31
0351 -053 3.91 1,119.00 390.46 COM 2 0.0592 0.0580 0.0845 3 2.37 1.43 481.05
0351 -054 0.73 210.00 73.28 RES 2 0.0111 0.0109 0.0159 3 2.37 0.27 90.28
0351 -055 0.72 207.00 72.23 RES 2 0.0110 0.0107 0.0156 3 2.37 0.27 88.99
0351 -056 1.81 517.00 180.40 RES 2 0.0274 0.0268 0.0391 3 2.37 0.66 222.25
0351 -057 0.96 276.00 96.31 RES 2 0.0146 0.0143 0.0208 3 2.37 0.35 118.65
0351 -058 0.97 278.00 97.00 RES 2 0.0147 0.0144 0.0210 3 2.37 0.36 119.51
0351 -059 0.99 283.00 98.75 RES 2 0.0150 0.0147 0.0214 3 2.37 0.36 121.66
0351 -060 1.55 444.00 154.93 RES 2 0.0235 0.0230 0.0335 3 2.37 0.57 190.87
0351 -061 1.50 428.00 149.34 RES 2 0.0227 0.0222 0.0323 3 2.37 0.55 183.99
0351 -062 1.62 464.00 161.91 RES 2 0.0246 0.0241 0.0350 3 2.37 0.59 199.47
0351 -063 0.89 256.00 89.33 RES 2 0.0136 0.0133 0.0193 3 2.37 0.33 110.05
0351 -064 0.89 256.00 89.33 RES 2 0.0136 0.0133 0.0193 3 2.37 0.33 110.05
0351 -065 0.92 263.00 91.77 RES 2 0.0139 0.0136 0.0199 3 2.37 0.34 113.06
0351 -066 0.89 254.00 88.63 RES 2 0.0134 0.0132 0.0192 3 2.37 0.33 109.19
0351 -067 1.39 399.00 139.23 RES 2 0.0211 0.0207 0.0301 3 2.37 0.51 171.53
0351 -068 1.44 412.00 143.76 RES 2 0.0218 0.0214 0.0311 3 2.37 0.53 177.12
0351 -069 1.75 500.00 174.47 RES 2 0.0265 0.0259 0.0378 3 2.37 0.64 214.95
Page 1 of 27

City of San Francisco
Civic Center Property and Business Improvement DistrictFiscal Year 2019/20 Proposed Assessment Roll
APN
Front
Ft
Bldg
Sq Ft
Lot
Sq Ft
Land Use
Type (1) Zone
Front
Factor
Bldg
Factor
Lot
Factor
Land Use
BP
Zone
Factor
Total
BP
Preliminary
Assessment
0351 -070 0.92 264.00 92.12 RES 2 0.0140 0.0137 0.0199 3 2.37 0.34 113.49
0351 -071 0.92 264.00 92.12 RES 2 0.0140 0.0137 0.0199 3 2.37 0.34 113.49
0351 -072 0.94 270.00 94.21 RES 2 0.0143 0.0140 0.0204 3 2.37 0.35 116.07
0351 -073 0.91 261.00 91.07 RES 2 0.0138 0.0135 0.0197 3 2.37 0.33 112.20
0351 -074 1.32 379.00 132.25 RES 2 0.0201 0.0197 0.0286 3 2.37 0.49 162.93
0351 -075 1.61 460.00 160.51 RES 2 0.0244 0.0239 0.0347 3 2.37 0.59 197.75
0351 -076 0.89 255.00 88.98 RES 2 0.0135 0.0132 0.0193 3 2.37 0.33 109.62
0351 -077 0.89 255.00 88.98 RES 2 0.0135 0.0132 0.0193 3 2.37 0.33 109.62
0351 -078 0.92 262.00 91.42 RES 2 0.0139 0.0136 0.0198 3 2.37 0.34 112.63
0351 -079 0.88 252.00 87.93 RES 2 0.0133 0.0131 0.0190 3 2.37 0.32 108.33
0351 -080 1.40 400.00 139.57 RES 2 0.0212 0.0207 0.0302 3 2.37 0.51 171.96
0351 -081 1.44 412.00 143.76 RES 2 0.0218 0.0214 0.0311 3 2.37 0.53 177.12
0351 -082 1.75 500.00 174.47 RES 2 0.0265 0.0259 0.0378 3 2.37 0.64 214.95
0351 -083 0.92 264.00 92.12 RES 2 0.0140 0.0137 0.0199 3 2.37 0.34 113.49
0351 -084 0.92 264.00 92.12 RES 2 0.0140 0.0137 0.0199 3 2.37 0.34 113.49
0351 -085 0.94 270.00 94.21 RES 2 0.0143 0.0140 0.0204 3 2.37 0.35 116.07
0351 -086 0.91 261.00 91.07 RES 2 0.0138 0.0135 0.0197 3 2.37 0.33 112.20
0351 -087 1.48 423.00 147.60 RES 2 0.0224 0.0219 0.0320 3 2.37 0.54 181.84
0351 -088 1.61 460.00 160.51 RES 2 0.0244 0.0239 0.0347 3 2.37 0.59 197.75
0351 -089 0.89 256.00 89.33 RES 2 0.0136 0.0133 0.0193 3 2.37 0.33 110.05
0351 -090 0.89 256.00 89.33 RES 2 0.0136 0.0133 0.0193 3 2.37 0.33 110.05
0351 -091 0.92 263.00 91.77 RES 2 0.0139 0.0136 0.0199 3 2.37 0.34 113.06
0351 -092 0.89 254.00 88.63 RES 2 0.0134 0.0132 0.0192 3 2.37 0.33 109.19
0351 -093 1.40 400.00 139.57 RES 2 0.0212 0.0207 0.0302 3 2.37 0.51 171.96
0351 -094 1.42 407.00 142.02 RES 2 0.0215 0.0211 0.0307 3 2.37 0.52 174.97
0351 -095 1.43 408.00 142.37 RES 2 0.0216 0.0212 0.0308 3 2.37 0.52 175.40
0351 -096 0.92 264.00 92.12 RES 2 0.0140 0.0137 0.0199 3 2.37 0.34 113.49
0351 -097 0.92 264.00 92.12 RES 2 0.0140 0.0137 0.0199 3 2.37 0.34 113.49
0351 -098 0.92 264.00 92.12 RES 2 0.0140 0.0137 0.0199 3 2.37 0.34 113.49
Page 2 of 27

City of San Francisco
Civic Center Property and Business Improvement DistrictFiscal Year 2019/20 Proposed Assessment Roll
APN
Front
Ft
Bldg
Sq Ft
Lot
Sq Ft
Land Use
Type (1) Zone
Front
Factor
Bldg
Factor
Lot
Factor
Land Use
BP
Zone
Factor
Total
BP
Preliminary
Assessment
0351 -099 0.90 258.00 90.03 RES 2 0.0137 0.0134 0.0195 3 2.37 0.33 110.91
0351 -100 1.48 424.00 147.95 RES 2 0.0224 0.0220 0.0320 3 2.37 0.54 182.27
0351 -101 2.03 582.00 203.08 RES 2 0.0308 0.0302 0.0440 3 2.37 0.75 250.20
0351 -102 0.89 255.00 88.98 RES 2 0.0135 0.0132 0.0193 3 2.37 0.33 109.62
0351 -103 0.89 255.00 88.98 RES 2 0.0135 0.0132 0.0193 3 2.37 0.33 109.62
0351 -104 0.91 261.00 91.07 RES 2 0.0138 0.0135 0.0197 3 2.37 0.33 112.20
0351 -105 0.90 259.00 90.37 RES 2 0.0137 0.0134 0.0196 3 2.37 0.33 111.34
0351 -106 1.43 408.00 142.37 RES 2 0.0216 0.0212 0.0308 3 2.37 0.52 175.40
0351 -107 1.94 555.00 193.66 RES 2 0.0294 0.0288 0.0419 3 2.37 0.71 238.59
0351 -108 1.81 517.00 180.40 RES 2 0.0274 0.0268 0.0391 3 2.37 0.66 222.25
0351 -109 0.94 268.00 93.51 RES 2 0.0142 0.0139 0.0202 3 2.37 0.34 115.21
0351 -110 0.94 268.00 93.51 RES 2 0.0142 0.0139 0.0202 3 2.37 0.34 115.21
0351 -111 0.96 275.00 95.96 RES 2 0.0146 0.0143 0.0208 3 2.37 0.35 118.22
0351 -112 0.97 277.00 96.66 RES 2 0.0147 0.0144 0.0209 3 2.37 0.36 119.08
0351 -113 1.32 379.00 132.25 RES 2 0.0201 0.0197 0.0286 3 2.37 0.49 162.93
0353 -001 1,245.75 185,000.00 90,256.00 CUL 2 18.8802 9.5952 19.5372 3 2.37 341.37 114,452.82
0354 -001 1,245.75 376,000.00 90,256.00 OFC 2 18.8802 19.5016 19.5372 3 2.37 411.80 138,067.81
0763 -001 285.00 19,582.00 8,999.00 COM 1 4.3194 1.0156 1.9480 3 1.00 21.85 7,325.40
0763 -002 285.00 29,688.00 9,896.00 COM 1 4.3194 1.5398 2.1421 3 1.00 24.00 8,047.92
0763 -005 120.00 16,920.00 7,200.00 COM 1 1.8187 0.8776 1.5585 3 1.00 12.76 4,279.59
0763 -006 65.00 3,900.00 3,900.00 COM 1 0.9851 0.2023 0.8442 3 1.00 6.09 2,043.44
0763 -007 50.00 4,250.00 3,000.00 COM 1 0.7578 0.2204 0.6494 3 1.00 4.88 1,637.09
0763 -008 50.00 0.00 2,996.00 COM 1 0.7578 0.0000 0.6485 3 1.00 4.22 1,414.50
0763 -009 338.00 10,770.00 13,080.00 COM 1 5.1226 0.5586 2.8313 3 1.00 25.54 8,562.17
0763 -010 132.33 4,523.00 2,539.00 EDU 1 2.0056 0.2346 0.5496 2 1.00 5.58 1,870.67
0763 -011 46.67 10,136.00 5,083.00 EDU 1 0.7073 0.5257 1.1003 2 1.00 4.67 1,564.58
0763 -012 159.00 5,292.00 5,450.00 COM 1 2.4098 0.2745 1.1797 3 1.00 11.59 3,886.47
0763 -013 55.00 3,240.00 3,297.00 EDU 1 0.8336 0.1680 0.7137 2 1.00 3.43 1,150.19
0763 -014 180.00 15,815.00 10,798.00 EDU 1 2.7280 0.8203 2.3374 2 1.00 11.77 3,946.64
Page 3 of 27

City of San Francisco
Civic Center Property and Business Improvement DistrictFiscal Year 2019/20 Proposed Assessment Roll
APN
Front
Ft
Bldg
Sq Ft
Lot
Sq Ft
Land Use
Type (1) Zone
Front
Factor
Bldg
Factor
Lot
Factor
Land Use
BP
Zone
Factor
Total
BP
Preliminary
Assessment
0763 -015 150.00 15,815.00 10,800.00 EDU 1 2.2734 0.8203 2.3378 2 1.00 10.86 3,642.05
0763 -016 100.00 10,050.00 6,000.00 COM 1 1.5156 0.5213 1.2988 3 1.00 10.01 3,355.04
0765 -002 652.50 1,130,000.00 63,937.00 OFC 2 9.8891 58.6086 13.8400 3 2.37 585.42 196,277.46
0765 -003 722.50 447,559.00 63,937.00 OFC 2 10.9500 23.2131 13.8400 3 2.37 341.30 114,430.32
0766 -001 483.00 277,000.00 21,780.00 OFC 1 7.3202 14.3669 4.7146 3 1.00 79.20 26,555.50
0766 -002 395.00 231,000.00 16,496.00 OFC 2 5.9865 11.9810 3.5708 3 2.37 153.14 51,343.28
0766 -003 137.50 16,500.00 8,245.00 OFC 2 2.0839 0.8558 1.7847 3 2.37 33.59 11,262.17
0766 -004 68.75 8,250.00 4,120.00 OFC 2 1.0420 0.4279 0.8918 3 2.37 16.79 5,629.79
0766 -005 68.75 8,250.00 4,120.00 OFC 2 1.0420 0.4279 0.8918 3 2.37 16.79 5,629.79
0766 -006 338.00 46,500.00 13,076.00 RES 2 5.1226 2.4118 2.8305 3 2.37 73.69 24,707.88
0766 -010 132.00 7,919.00 7,919.00 COM 1 2.0005 0.4107 1.7142 3 1.00 12.38 4,149.49
0766 -013 393.00 39,166.00 16,380.00 COM 1 5.9562 2.0314 3.5457 3 1.00 34.60 11,600.45
0767 -001 132.00 8,526.16 2,591.00 OFC 1 2.0005 0.4422 0.5609 3 1.00 9.01 3,021.13
0767 -002 48.00 17,055.61 5,183.00 OFC 1 0.7275 0.8846 1.1219 3 1.00 8.20 2,749.94
0767 -003 48.00 17,055.61 5,183.00 OFC 1 0.7275 0.8846 1.1219 3 1.00 8.20 2,749.94
0767 -004 60.00 21,655.98 6,581.00 OFC 1 0.9093 1.1232 1.4245 3 1.00 10.37 3,477.24
0767 -005 169.75 21,655.98 6,581.00 OFC 1 2.5727 1.1232 1.4245 3 1.00 15.36 5,150.27
0767 -006 55.00 21,718.50 6,600.00 OFC 1 0.8336 1.1265 1.4287 3 1.00 10.17 3,408.42
0767 -007 82.50 32,577.76 9,900.00 OFC 1 1.2503 1.6897 2.1430 3 1.00 15.25 5,112.63
0767 -008 395.00 51,240.00 16,500.00 RES 1 5.9865 2.6576 3.5717 3 1.00 36.65 12,286.94
0767 -009 290.00 33,564.96 10,200.00 OFC 1 4.3951 1.7409 2.2079 3 1.00 25.03 8,392.58
0767 -010 100.00 19,744.09 6,000.00 OFC 1 1.5156 1.0240 1.2988 3 1.00 11.52 3,860.76
0767 -011 47.00 18,559.45 5,640.00 OFC 1 0.7123 0.9626 1.2209 3 1.00 8.69 2,912.65
0767 -012 23.00 9,082.28 2,760.00 OFC 1 0.3486 0.4711 0.5974 3 1.00 4.25 1,425.34
0767 -013 71.73 28,234.05 8,580.00 OFC 1 1.0871 1.4644 1.8573 3 1.00 13.23 4,434.45
0767 -014 70.00 28,476.74 8,653.75 OFC 1 1.0609 1.4770 1.8732 3 1.00 13.23 4,436.80
0768 -013 395.00 95,000.00 16,496.00 RES 1 5.9865 4.9273 3.5708 3 1.00 43.45 14,568.95
0768 -015 325.96 60,000.00 48,939.00 EDU 1 4.9401 3.1120 10.5935 2 1.00 37.29 12,502.85
0768 -021 15.09 1,541.00 586.55 RES 1 0.2287 0.0799 0.1270 3 1.00 1.31 438.11
Page 4 of 27

City of San Francisco
Civic Center Property and Business Improvement DistrictFiscal Year 2019/20 Proposed Assessment Roll
APN
Front
Ft
Bldg
Sq Ft
Lot
Sq Ft
Land Use
Type (1) Zone
Front
Factor
Bldg
Factor
Lot
Factor
Land Use
BP
Zone
Factor
Total
BP
Preliminary
Assessment
0768 -022 8.60 878.00 334.19 RES 1 0.1303 0.0455 0.0723 3 1.00 0.74 249.62
0768 -023 10.56 1,078.00 410.32 RES 1 0.1600 0.0559 0.0888 3 1.00 0.91 306.48
0768 -024 10.48 1,070.00 407.27 RES 1 0.1588 0.0555 0.0882 3 1.00 0.91 304.20
0768 -025 12.02 1,228.00 467.41 RES 1 0.1822 0.0637 0.1012 3 1.00 1.04 349.12
0768 -026 16.28 1,663.00 632.98 RES 1 0.2468 0.0863 0.1370 3 1.00 1.41 472.79
0768 -027 9.19 939.00 357.41 RES 1 0.1393 0.0487 0.0774 3 1.00 0.80 266.96
0768 -028 11.38 1,162.00 442.29 RES 1 0.1724 0.0603 0.0957 3 1.00 0.99 330.36
0768 -029 11.29 1,153.00 438.86 RES 1 0.1711 0.0598 0.0950 3 1.00 0.98 327.80
0768 -030 13.23 1,351.00 514.23 RES 1 0.2005 0.0701 0.1113 3 1.00 1.15 384.09
0768 -031 16.27 1,662.00 632.60 RES 1 0.2466 0.0862 0.1369 3 1.00 1.41 472.51
0768 -032 9.19 939.00 357.41 RES 1 0.1393 0.0487 0.0774 3 1.00 0.80 266.96
0768 -033 11.38 1,162.00 442.29 RES 1 0.1724 0.0603 0.0957 3 1.00 0.99 330.36
0768 -034 11.27 1,151.00 438.10 RES 1 0.1708 0.0597 0.0948 3 1.00 0.98 327.23
0768 -035 5.90 1,021.00 379.68 RES 1 0.0894 0.0530 0.0822 3 1.00 0.67 225.89
0768 -036 4.45 770.00 286.34 RES 1 0.0675 0.0399 0.0620 3 1.00 0.51 170.36
0768 -037 5.76 997.00 370.76 RES 1 0.0873 0.0517 0.0803 3 1.00 0.66 220.58
0768 -038 6.83 1,182.00 439.55 RES 1 0.1035 0.0613 0.0951 3 1.00 0.78 261.51
0768 -039 7.88 1,363.00 506.86 RES 1 0.1194 0.0707 0.1097 3 1.00 0.90 301.55
0768 -040 7.88 1,363.00 506.86 RES 1 0.1194 0.0707 0.1097 3 1.00 0.90 301.55
0768 -041 8.80 1,522.00 565.99 RES 1 0.1333 0.0789 0.1225 3 1.00 1.00 336.73
0768 -042 5.95 1,030.00 383.03 RES 1 0.0902 0.0534 0.0829 3 1.00 0.68 227.88
0768 -043 9.44 1,634.00 607.64 RES 1 0.1431 0.0847 0.1315 3 1.00 1.08 361.51
0768 -044 7.61 1,316.00 489.38 RES 1 0.1153 0.0683 0.1059 3 1.00 0.87 291.15
0768 -045 5.76 997.00 370.76 RES 1 0.0873 0.0517 0.0803 3 1.00 0.66 220.58
0768 -046 5.76 997.00 370.76 RES 1 0.0873 0.0517 0.0803 3 1.00 0.66 220.58
0768 -047 8.47 1,466.00 545.17 RES 1 0.1284 0.0760 0.1180 3 1.00 0.97 324.34
0768 -048 7.88 1,363.00 506.86 RES 1 0.1194 0.0707 0.1097 3 1.00 0.90 301.55
0768 -049 7.88 1,363.00 506.86 RES 1 0.1194 0.0707 0.1097 3 1.00 0.90 301.55
0768 -050 8.88 1,536.00 571.20 RES 1 0.1345 0.0797 0.1236 3 1.00 1.01 339.83
Page 5 of 27

City of San Francisco
Civic Center Property and Business Improvement DistrictFiscal Year 2019/20 Proposed Assessment Roll
APN
Front
Ft
Bldg
Sq Ft
Lot
Sq Ft
Land Use
Type (1) Zone
Front
Factor
Bldg
Factor
Lot
Factor
Land Use
BP
Zone
Factor
Total
BP
Preliminary
Assessment
0768 -051 5.95 1,030.00 383.03 RES 1 0.0902 0.0534 0.0829 3 1.00 0.68 227.88
0768 -052 9.44 1,634.00 607.64 RES 1 0.1431 0.0847 0.1315 3 1.00 1.08 361.51
0768 -053 7.61 1,316.00 489.38 RES 1 0.1153 0.0683 0.1059 3 1.00 0.87 291.15
0768 -054 5.76 997.00 370.76 RES 1 0.0873 0.0517 0.0803 3 1.00 0.66 220.58
0768 -055 5.76 997.00 370.76 RES 1 0.0873 0.0517 0.0803 3 1.00 0.66 220.58
0768 -056 8.47 1,466.00 545.17 RES 1 0.1284 0.0760 0.1180 3 1.00 0.97 324.34
0768 -057 6.83 1,182.00 439.55 RES 1 0.1035 0.0613 0.0951 3 1.00 0.78 261.51
0768 -058 7.88 1,363.00 506.86 RES 1 0.1194 0.0707 0.1097 3 1.00 0.90 301.55
0768 -059 8.88 1,536.00 571.20 RES 1 0.1345 0.0797 0.1236 3 1.00 1.01 339.83
0768 -060 5.95 1,030.00 383.03 RES 1 0.0902 0.0534 0.0829 3 1.00 0.68 227.88
0768 -061 9.44 1,634.00 607.64 RES 1 0.1431 0.0847 0.1315 3 1.00 1.08 361.51
0768 -062 7.61 1,316.00 489.38 RES 1 0.1153 0.0683 0.1059 3 1.00 0.87 291.15
0768 -063 5.76 997.00 370.76 RES 1 0.0873 0.0517 0.0803 3 1.00 0.66 220.58
0768 -064 5.76 997.00 370.76 RES 1 0.0873 0.0517 0.0803 3 1.00 0.66 220.58
0768 -065 8.47 1,466.00 545.17 RES 1 0.1284 0.0760 0.1180 3 1.00 0.97 324.34
0768 -066 7.88 1,363.00 506.86 RES 1 0.1194 0.0707 0.1097 3 1.00 0.90 301.55
0768 -067 7.88 1,363.00 506.86 RES 1 0.1194 0.0707 0.1097 3 1.00 0.90 301.55
0768 -068 9.12 1,578.00 586.82 RES 1 0.1382 0.0818 0.1270 3 1.00 1.04 349.12
0768 -069 5.95 1,030.00 383.03 RES 1 0.0902 0.0534 0.0829 3 1.00 0.68 227.88
0768 -070 9.44 1,634.00 607.64 RES 1 0.1431 0.0847 0.1315 3 1.00 1.08 361.51
0768 -071 11.27 1,151.00 438.10 RES 1 0.1708 0.0597 0.0948 3 1.00 0.98 327.23
0768 -072 198.56 0.00 8,295.00 COM 1 3.0093 0.0000 1.7956 3 1.00 14.41 4,832.88
0768 -073 252.98 0.00 11,138.00 COM 1 3.8341 0.0000 2.4110 3 1.00 18.74 6,281.45
0785 -013 230.00 18,050.00 6,600.00 RES 1 3.4858 0.9362 1.4287 3 1.00 17.55 5,884.74
0785 -028 220.00 28,840.00 14,420.00 OFC 1 3.3342 1.4958 3.1214 3 1.00 23.85 7,997.81
0785 -030 151.43 0.00 22,200.00 OFC 1 2.2950 0.0000 4.8055 3 1.00 21.30 7,141.90
0785 -033 42.41 0.00 7,140.00 OFC 1 0.6428 0.0000 1.5456 3 1.00 6.56 2,201.06
0785 -035 313.75 96,000.00 24,814.56 OFC 1 4.7551 4.9791 5.3715 3 1.00 45.32 15,193.71
0785 -036 78.57 0.00 5,216.49 OFC 1 1.1908 0.0000 1.1292 3 1.00 6.96 2,333.48
Page 6 of 27

City of San Francisco
Civic Center Property and Business Improvement DistrictFiscal Year 2019/20 Proposed Assessment Roll
APN
Front
Ft
Bldg
Sq Ft
Lot
Sq Ft
Land Use
Type (1) Zone
Front
Factor
Bldg
Factor
Lot
Factor
Land Use
BP
Zone
Factor
Total
BP
Preliminary
Assessment
0785 -038 27.50 4,208.00 3,300.00 COM 1 0.4168 0.2183 0.7143 3 1.00 4.05 1,357.23
0785 -039 17.50 5,454.00 2,100.00 COM 1 0.2652 0.2829 0.4546 3 1.00 3.01 1,008.52
0785 -052 132.00 38,000.00 15,840.00 EDU 1 2.0005 1.9709 3.4288 2 1.00 14.80 4,962.24
0785 -053 0.00 0.00 364.00 OFC 1 0.0000 0.0000 0.0788 3 1.00 0.24 79.25
0785 -061 10.21 1,208.00 388.97 COM 1 0.1548 0.0627 0.0842 3 1.00 0.90 303.41
0785 -062 16.08 1,902.00 612.43 COM 1 0.2437 0.0986 0.1326 3 1.00 1.42 477.71
0785 -066 5.93 701.00 225.72 RES 1 0.0898 0.0364 0.0489 3 1.00 0.53 176.07
0785 -067 6.59 779.00 250.83 RES 1 0.0998 0.0404 0.0543 3 1.00 0.58 195.66
0785 -068 2.76 326.00 104.97 RES 1 0.0418 0.0169 0.0227 3 1.00 0.24 81.88
0785 -069 2.76 326.00 104.97 RES 1 0.0418 0.0169 0.0227 3 1.00 0.24 81.88
0785 -070 6.09 720.00 231.83 RES 1 0.0923 0.0373 0.0502 3 1.00 0.54 180.84
0785 -071 2.99 354.00 113.98 RES 1 0.0454 0.0184 0.0247 3 1.00 0.27 88.91
0785 -072 3.14 371.00 119.46 RES 1 0.0475 0.0192 0.0259 3 1.00 0.28 93.18
0785 -073 4.10 485.00 156.17 RES 1 0.0621 0.0252 0.0338 3 1.00 0.36 121.81
0785 -074 3.09 366.00 117.85 RES 1 0.0469 0.0190 0.0255 3 1.00 0.27 91.93
0785 -075 2.93 347.00 111.73 RES 1 0.0445 0.0180 0.0242 3 1.00 0.26 87.15
0785 -076 6.04 714.00 229.90 RES 1 0.0915 0.0370 0.0498 3 1.00 0.53 179.33
0785 -077 3.42 404.00 130.08 RES 1 0.0518 0.0210 0.0282 3 1.00 0.30 101.47
0785 -078 6.28 743.00 239.24 RES 1 0.0952 0.0385 0.0518 3 1.00 0.56 186.62
0785 -079 5.99 708.00 227.97 RES 1 0.0907 0.0367 0.0493 3 1.00 0.53 177.82
0785 -080 5.99 708.00 227.97 RES 1 0.0907 0.0367 0.0493 3 1.00 0.53 177.82
0785 -081 6.59 779.00 250.83 RES 1 0.0998 0.0404 0.0543 3 1.00 0.58 195.66
0785 -082 2.76 326.00 104.97 RES 1 0.0418 0.0169 0.0227 3 1.00 0.24 81.88
0785 -083 2.76 326.00 104.97 RES 1 0.0418 0.0169 0.0227 3 1.00 0.24 81.88
0785 -084 6.09 720.00 231.83 RES 1 0.0923 0.0373 0.0502 3 1.00 0.54 180.84
0785 -085 2.99 354.00 113.98 RES 1 0.0454 0.0184 0.0247 3 1.00 0.27 88.91
0785 -086 3.14 371.00 119.46 RES 1 0.0475 0.0192 0.0259 3 1.00 0.28 93.18
0785 -087 4.10 485.00 156.17 RES 1 0.0621 0.0252 0.0338 3 1.00 0.36 121.81
0785 -088 3.09 366.00 117.85 RES 1 0.0469 0.0190 0.0255 3 1.00 0.27 91.93
Page 7 of 27

City of San Francisco
Civic Center Property and Business Improvement DistrictFiscal Year 2019/20 Proposed Assessment Roll
APN
Front
Ft
Bldg
Sq Ft
Lot
Sq Ft
Land Use
Type (1) Zone
Front
Factor
Bldg
Factor
Lot
Factor
Land Use
BP
Zone
Factor
Total
BP
Preliminary
Assessment
0785 -089 2.93 347.00 111.73 RES 1 0.0445 0.0180 0.0242 3 1.00 0.26 87.15
0785 -090 6.04 714.00 229.90 RES 1 0.0915 0.0370 0.0498 3 1.00 0.53 179.33
0785 -091 3.42 404.00 130.08 RES 1 0.0518 0.0210 0.0282 3 1.00 0.30 101.47
0785 -092 6.28 743.00 239.24 RES 1 0.0952 0.0385 0.0518 3 1.00 0.56 186.62
0785 -093 5.99 708.00 227.97 RES 1 0.0907 0.0367 0.0493 3 1.00 0.53 177.82
0785 -094 5.99 708.00 227.97 RES 1 0.0907 0.0367 0.0493 3 1.00 0.53 177.82
0785 -095 6.59 779.00 250.83 RES 1 0.0998 0.0404 0.0543 3 1.00 0.58 195.66
0785 -096 2.76 326.00 104.97 RES 1 0.0418 0.0169 0.0227 3 1.00 0.24 81.88
0785 -097 2.76 326.00 104.97 RES 1 0.0418 0.0169 0.0227 3 1.00 0.24 81.88
0785 -098 6.09 720.00 231.83 RES 1 0.0923 0.0373 0.0502 3 1.00 0.54 180.84
0785 -099 2.99 354.00 113.98 RES 1 0.0454 0.0184 0.0247 3 1.00 0.27 88.91
0785 -100 3.14 371.00 119.46 RES 1 0.0475 0.0192 0.0259 3 1.00 0.28 93.18
0785 -101 4.10 485.00 156.17 RES 1 0.0621 0.0252 0.0338 3 1.00 0.36 121.81
0785 -102 3.09 366.00 117.85 RES 1 0.0469 0.0190 0.0255 3 1.00 0.27 91.93
0785 -103 2.93 347.00 111.73 RES 1 0.0445 0.0180 0.0242 3 1.00 0.26 87.15
0785 -104 6.04 714.00 229.90 RES 1 0.0915 0.0370 0.0498 3 1.00 0.53 179.33
0785 -105 3.42 404.00 130.08 RES 1 0.0518 0.0210 0.0282 3 1.00 0.30 101.47
0785 -106 6.28 743.00 239.24 RES 1 0.0952 0.0385 0.0518 3 1.00 0.56 186.62
0785 -107 5.99 708.00 227.97 RES 1 0.0907 0.0367 0.0493 3 1.00 0.53 177.82
0785 -108 5.93 701.00 225.72 RES 1 0.0898 0.0364 0.0489 3 1.00 0.53 176.07
0785 -109 4.73 559.00 179.99 RES 1 0.0716 0.0290 0.0390 3 1.00 0.42 140.40
0785 -110 2.76 326.00 104.97 RES 1 0.0418 0.0169 0.0227 3 1.00 0.24 81.88
0785 -111 2.76 326.00 104.97 RES 1 0.0418 0.0169 0.0227 3 1.00 0.24 81.88
0785 -112 6.09 720.00 231.83 RES 1 0.0923 0.0373 0.0502 3 1.00 0.54 180.84
0785 -113 2.99 354.00 113.98 RES 1 0.0454 0.0184 0.0247 3 1.00 0.27 88.91
0785 -114 3.14 371.00 119.46 RES 1 0.0475 0.0192 0.0259 3 1.00 0.28 93.18
0785 -115 4.10 485.00 156.17 RES 1 0.0621 0.0252 0.0338 3 1.00 0.36 121.81
0785 -116 3.09 366.00 117.85 RES 1 0.0469 0.0190 0.0255 3 1.00 0.27 91.93
0785 -117 2.93 347.00 111.73 RES 1 0.0445 0.0180 0.0242 3 1.00 0.26 87.15
Page 8 of 27
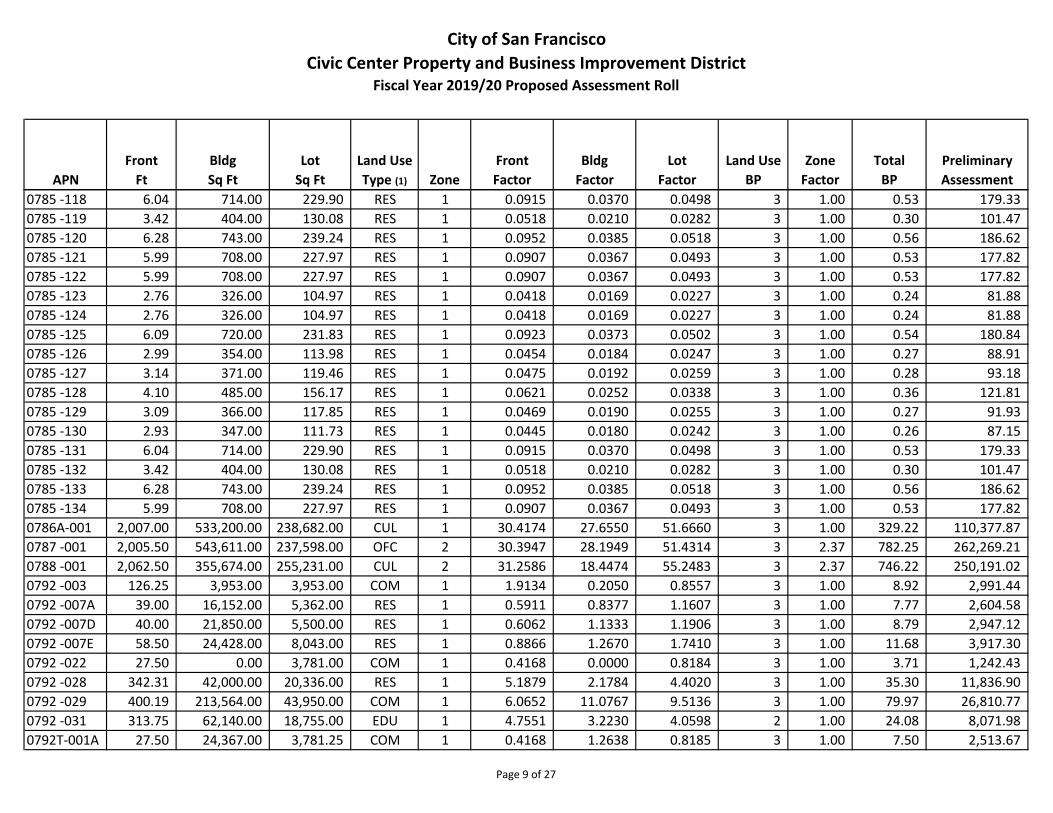
City of San Francisco
Civic Center Property and Business Improvement DistrictFiscal Year 2019/20 Proposed Assessment Roll
APN
Front
Ft
Bldg
Sq Ft
Lot
Sq Ft
Land Use
Type (1) Zone
Front
Factor
Bldg
Factor
Lot
Factor
Land Use
BP
Zone
Factor
Total
BP
Preliminary
Assessment
0785 -118 6.04 714.00 229.90 RES 1 0.0915 0.0370 0.0498 3 1.00 0.53 179.33
0785 -119 3.42 404.00 130.08 RES 1 0.0518 0.0210 0.0282 3 1.00 0.30 101.47
0785 -120 6.28 743.00 239.24 RES 1 0.0952 0.0385 0.0518 3 1.00 0.56 186.62
0785 -121 5.99 708.00 227.97 RES 1 0.0907 0.0367 0.0493 3 1.00 0.53 177.82
0785 -122 5.99 708.00 227.97 RES 1 0.0907 0.0367 0.0493 3 1.00 0.53 177.82
0785 -123 2.76 326.00 104.97 RES 1 0.0418 0.0169 0.0227 3 1.00 0.24 81.88
0785 -124 2.76 326.00 104.97 RES 1 0.0418 0.0169 0.0227 3 1.00 0.24 81.88
0785 -125 6.09 720.00 231.83 RES 1 0.0923 0.0373 0.0502 3 1.00 0.54 180.84
0785 -126 2.99 354.00 113.98 RES 1 0.0454 0.0184 0.0247 3 1.00 0.27 88.91
0785 -127 3.14 371.00 119.46 RES 1 0.0475 0.0192 0.0259 3 1.00 0.28 93.18
0785 -128 4.10 485.00 156.17 RES 1 0.0621 0.0252 0.0338 3 1.00 0.36 121.81
0785 -129 3.09 366.00 117.85 RES 1 0.0469 0.0190 0.0255 3 1.00 0.27 91.93
0785 -130 2.93 347.00 111.73 RES 1 0.0445 0.0180 0.0242 3 1.00 0.26 87.15
0785 -131 6.04 714.00 229.90 RES 1 0.0915 0.0370 0.0498 3 1.00 0.53 179.33
0785 -132 3.42 404.00 130.08 RES 1 0.0518 0.0210 0.0282 3 1.00 0.30 101.47
0785 -133 6.28 743.00 239.24 RES 1 0.0952 0.0385 0.0518 3 1.00 0.56 186.62
0785 -134 5.99 708.00 227.97 RES 1 0.0907 0.0367 0.0493 3 1.00 0.53 177.82
0786A-001 2,007.00 533,200.00 238,682.00 CUL 1 30.4174 27.6550 51.6660 3 1.00 329.22 110,377.87
0787 -001 2,005.50 543,611.00 237,598.00 OFC 2 30.3947 28.1949 51.4314 3 2.37 782.25 262,269.21
0788 -001 2,062.50 355,674.00 255,231.00 CUL 2 31.2586 18.4474 55.2483 3 2.37 746.22 250,191.02
0792 -003 126.25 3,953.00 3,953.00 COM 1 1.9134 0.2050 0.8557 3 1.00 8.92 2,991.44
0792 -007A 39.00 16,152.00 5,362.00 RES 1 0.5911 0.8377 1.1607 3 1.00 7.77 2,604.58
0792 -007D 40.00 21,850.00 5,500.00 RES 1 0.6062 1.1333 1.1906 3 1.00 8.79 2,947.12
0792 -007E 58.50 24,428.00 8,043.00 RES 1 0.8866 1.2670 1.7410 3 1.00 11.68 3,917.30
0792 -022 27.50 0.00 3,781.00 COM 1 0.4168 0.0000 0.8184 3 1.00 3.71 1,242.43
0792 -028 342.31 42,000.00 20,336.00 RES 1 5.1879 2.1784 4.4020 3 1.00 35.30 11,836.90
0792 -029 400.19 213,564.00 43,950.00 COM 1 6.0652 11.0767 9.5136 3 1.00 79.97 26,810.77
0792 -031 313.75 62,140.00 18,755.00 EDU 1 4.7551 3.2230 4.0598 2 1.00 24.08 8,071.98
0792T-001A 27.50 24,367.00 3,781.25 COM 1 0.4168 1.2638 0.8185 3 1.00 7.50 2,513.67
Page 9 of 27

City of San Francisco
Civic Center Property and Business Improvement DistrictFiscal Year 2019/20 Proposed Assessment Roll
APN
Front
Ft
Bldg
Sq Ft
Lot
Sq Ft
Land Use
Type (1) Zone
Front
Factor
Bldg
Factor
Lot
Factor
Land Use
BP
Zone
Factor
Total
BP
Preliminary
Assessment
0809 -001 155.00 6,876.00 5,105.00 COM 1 2.3491 0.3566 1.1050 3 1.00 11.43 3,833.01
0809 -002 47.50 10,212.00 5,106.00 COM 1 0.7199 0.5297 1.1053 3 1.00 7.06 2,368.54
0809 -003 93.50 5,175.00 1,712.00 COM 1 1.4171 0.2684 0.3706 3 1.00 6.17 2,068.03
0809 -003A 39.00 2,811.00 971.00 RES 1 0.5911 0.1458 0.2102 3 1.00 2.84 952.57
0809 -004 135.00 9,690.00 4,500.00 RES 1 2.0460 0.5026 0.9741 3 1.00 10.57 3,543.21
0809 -004A 135.00 11,310.00 4,500.00 RES 1 2.0460 0.5866 0.9741 3 1.00 10.82 3,627.72
0809 -005 50.00 3,750.00 3,000.00 COM 1 0.7578 0.1945 0.6494 3 1.00 4.81 1,611.01
0809 -006 50.00 5,250.00 2,996.00 COM 1 0.7578 0.2723 0.6485 3 1.00 5.04 1,688.39
0809 -007 100.00 29,460.00 6,000.00 RES 1 1.5156 1.5280 1.2988 3 1.00 13.03 4,367.63
0809 -011 100.00 10,175.00 6,000.00 COM 1 1.5156 0.5277 1.2988 3 1.00 10.03 3,361.56
0809 -012 50.00 3,120.00 2,996.00 COM 1 0.7578 0.1618 0.6485 3 1.00 4.70 1,577.27
0809 -014 395.00 49,500.00 16,496.00 COM 1 5.9865 2.5674 3.5708 3 1.00 36.37 12,195.30
0809 -015 55.00 7,047.00 3,300.00 RES 1 0.8336 0.3655 0.7143 3 1.00 5.74 1,924.54
0809 -016 55.00 9,060.00 3,300.00 RES 1 0.8336 0.4699 0.7143 3 1.00 6.05 2,029.56
0809 -017 55.00 9,560.00 3,300.00 RES 1 0.8336 0.4958 0.7143 3 1.00 6.13 2,055.64
0809 -018 27.50 3,150.00 1,650.00 COM 1 0.4168 0.1634 0.3572 3 1.00 2.81 942.79
0809 -019 55.17 6,786.00 3,306.00 RES 1 0.8361 0.3520 0.7156 3 1.00 5.71 1,914.78
0809 -020 59.83 0.00 3,589.00 COM 1 0.9068 0.0000 0.7769 3 1.00 5.05 1,693.51
0809 -021 214.50 20,655.00 9,475.00 COM 1 3.2509 1.0713 2.0510 3 1.00 19.12 6,410.32
0809 -022 130.50 8,111.00 4,125.00 RES 1 1.9778 0.4207 0.8929 3 1.00 9.87 3,310.59
0809 -029 5.07 714.00 152.23 COM 1 0.0769 0.0370 0.0330 3 1.00 0.44 147.74
0809 -030 4.24 596.00 127.07 COM 1 0.0642 0.0309 0.0275 3 1.00 0.37 123.33
0809 -031 7.78 1,095.00 233.46 RES 1 0.1179 0.0568 0.0505 3 1.00 0.68 226.58
0809 -032 7.69 1,082.00 230.69 RES 1 0.1165 0.0561 0.0499 3 1.00 0.67 223.89
0809 -033 7.20 1,013.00 215.98 RES 1 0.1091 0.0525 0.0468 3 1.00 0.63 209.61
0809 -034 6.35 894.00 190.60 RES 1 0.0963 0.0464 0.0413 3 1.00 0.55 184.99
0809 -035 7.69 1,082.00 230.69 RES 1 0.1165 0.0561 0.0499 3 1.00 0.67 223.89
0809 -036 7.72 1,086.00 231.54 RES 1 0.1170 0.0563 0.0501 3 1.00 0.67 224.72
0809 -037 7.78 1,095.00 233.46 RES 1 0.1179 0.0568 0.0505 3 1.00 0.68 226.58
Page 10 of 27

City of San Francisco
Civic Center Property and Business Improvement DistrictFiscal Year 2019/20 Proposed Assessment Roll
APN
Front
Ft
Bldg
Sq Ft
Lot
Sq Ft
Land Use
Type (1) Zone
Front
Factor
Bldg
Factor
Lot
Factor
Land Use
BP
Zone
Factor
Total
BP
Preliminary
Assessment
0809 -038 5.71 804.00 171.42 RES 1 0.0866 0.0417 0.0371 3 1.00 0.50 166.37
0809 -039 5.62 791.00 168.64 RES 1 0.0852 0.0410 0.0365 3 1.00 0.49 163.68
0809 -040 5.58 785.00 167.37 RES 1 0.0846 0.0407 0.0362 3 1.00 0.48 162.44
0809 -041 4.48 630.00 134.32 RES 1 0.0679 0.0327 0.0291 3 1.00 0.39 130.36
0809 -042 5.69 800.00 170.56 RES 1 0.0862 0.0415 0.0369 3 1.00 0.49 165.54
0809 -043 5.69 800.00 170.56 RES 1 0.0862 0.0415 0.0369 3 1.00 0.49 165.54
0809 -044 5.71 804.00 171.42 RES 1 0.0866 0.0417 0.0371 3 1.00 0.50 166.37
0809 -061 6.88 518.00 412.50 RES 1 0.1042 0.0269 0.0893 3 1.00 0.66 221.64
0809 -062 6.88 518.00 412.50 RES 1 0.1042 0.0269 0.0893 3 1.00 0.66 221.64
0809 -063 6.88 518.00 412.50 RES 1 0.1042 0.0269 0.0893 3 1.00 0.66 221.64
0809 -064 6.88 518.00 412.50 RES 1 0.1042 0.0269 0.0893 3 1.00 0.66 221.64
0810 -001 1,319.50 229,500.00 105,802.00 CUL 1 19.9979 11.9032 22.9023 3 1.00 164.41 55,122.81
0811 -001 533.58 104,000.00 24,811.00 OFC 2 8.0868 5.3941 5.3707 3 2.37 134.03 44,938.58
0811 -010 169.07 17,640.00 6,547.00 RES 1 2.5624 0.9149 1.4172 3 1.00 14.68 4,923.04
0811 -012 168.93 12,360.00 6,529.00 COM 1 2.5602 0.6411 1.4133 3 1.00 13.84 4,641.45
0811 -016 70.21 4,163.00 4,186.00 CUL 2 1.0640 0.2159 0.9061 3 2.37 15.54 5,211.21
0811 -018 134.00 5,450.00 2,722.00 COM 2 2.0309 0.2827 0.5892 3 2.37 20.64 6,919.59
0811 -019 50.00 15,950.00 5,449.00 OFC 2 0.7578 0.8273 1.1795 3 2.37 19.66 6,590.18
0811 -020 150.00 9,450.00 4,721.00 COM 2 2.2734 0.4901 1.0219 3 2.37 26.91 9,023.70
0811 -021 70.21 0.00 4,116.00 CUL 2 1.0640 0.0000 0.8910 3 2.37 13.90 4,660.38
0811 -022 330.00 138,460.00 19,793.00 EDU 1 5.0014 7.1814 4.2845 2 1.00 32.93 11,042.11
0811 -031 340.00 155,218.00 13,200.00 RES 1 5.1529 8.0505 2.8573 3 1.00 48.18 16,154.38
0812 -001 1,375.00 312,870.00 113,434.00 CUL 2 20.8391 16.2273 24.5544 3 2.37 438.12 146,892.12
0813 -007 257.69 144,784.00 5,300.00 COM 1 3.9054 7.5094 1.1473 3 1.00 37.69 12,635.23
0813 -008 403.33 314,600.00 26,971.00 RES 1 6.1128 16.3170 5.8382 3 1.00 84.80 28,432.81
0813 -009 380.93 216,653.00 22,500.00 COM 1 5.7732 11.2369 4.8704 3 1.00 65.64 22,008.07
0813 -010 78.43 41,791.00 16,500.00 COM 1 1.1886 2.1675 3.5717 3 1.00 20.78 6,968.15
0814 -001 160.00 91,609.76 6,000.00 RES 1 2.4249 4.7514 1.2988 3 1.00 25.43 8,524.51
0814 -003 30.00 6,580.00 3,000.00 COM 1 0.4547 0.3413 0.6494 3 1.00 4.34 1,453.76
Page 11 of 27
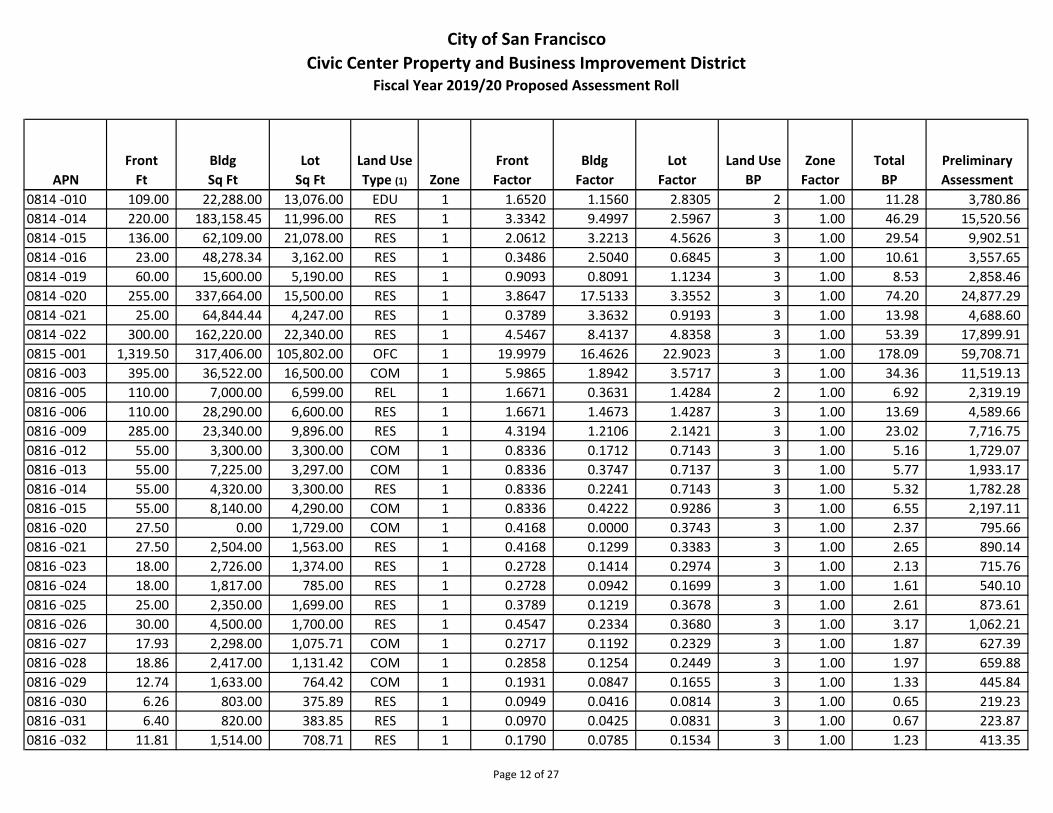
City of San Francisco
Civic Center Property and Business Improvement DistrictFiscal Year 2019/20 Proposed Assessment Roll
APN
Front
Ft
Bldg
Sq Ft
Lot
Sq Ft
Land Use
Type (1) Zone
Front
Factor
Bldg
Factor
Lot
Factor
Land Use
BP
Zone
Factor
Total
BP
Preliminary
Assessment
0814 -010 109.00 22,288.00 13,076.00 EDU 1 1.6520 1.1560 2.8305 2 1.00 11.28 3,780.86
0814 -014 220.00 183,158.45 11,996.00 RES 1 3.3342 9.4997 2.5967 3 1.00 46.29 15,520.56
0814 -015 136.00 62,109.00 21,078.00 RES 1 2.0612 3.2213 4.5626 3 1.00 29.54 9,902.51
0814 -016 23.00 48,278.34 3,162.00 RES 1 0.3486 2.5040 0.6845 3 1.00 10.61 3,557.65
0814 -019 60.00 15,600.00 5,190.00 RES 1 0.9093 0.8091 1.1234 3 1.00 8.53 2,858.46
0814 -020 255.00 337,664.00 15,500.00 RES 1 3.8647 17.5133 3.3552 3 1.00 74.20 24,877.29
0814 -021 25.00 64,844.44 4,247.00 RES 1 0.3789 3.3632 0.9193 3 1.00 13.98 4,688.60
0814 -022 300.00 162,220.00 22,340.00 RES 1 4.5467 8.4137 4.8358 3 1.00 53.39 17,899.91
0815 -001 1,319.50 317,406.00 105,802.00 OFC 1 19.9979 16.4626 22.9023 3 1.00 178.09 59,708.71
0816 -003 395.00 36,522.00 16,500.00 COM 1 5.9865 1.8942 3.5717 3 1.00 34.36 11,519.13
0816 -005 110.00 7,000.00 6,599.00 REL 1 1.6671 0.3631 1.4284 2 1.00 6.92 2,319.19
0816 -006 110.00 28,290.00 6,600.00 RES 1 1.6671 1.4673 1.4287 3 1.00 13.69 4,589.66
0816 -009 285.00 23,340.00 9,896.00 RES 1 4.3194 1.2106 2.1421 3 1.00 23.02 7,716.75
0816 -012 55.00 3,300.00 3,300.00 COM 1 0.8336 0.1712 0.7143 3 1.00 5.16 1,729.07
0816 -013 55.00 7,225.00 3,297.00 COM 1 0.8336 0.3747 0.7137 3 1.00 5.77 1,933.17
0816 -014 55.00 4,320.00 3,300.00 RES 1 0.8336 0.2241 0.7143 3 1.00 5.32 1,782.28
0816 -015 55.00 8,140.00 4,290.00 COM 1 0.8336 0.4222 0.9286 3 1.00 6.55 2,197.11
0816 -020 27.50 0.00 1,729.00 COM 1 0.4168 0.0000 0.3743 3 1.00 2.37 795.66
0816 -021 27.50 2,504.00 1,563.00 RES 1 0.4168 0.1299 0.3383 3 1.00 2.65 890.14
0816 -023 18.00 2,726.00 1,374.00 RES 1 0.2728 0.1414 0.2974 3 1.00 2.13 715.76
0816 -024 18.00 1,817.00 785.00 RES 1 0.2728 0.0942 0.1699 3 1.00 1.61 540.10
0816 -025 25.00 2,350.00 1,699.00 RES 1 0.3789 0.1219 0.3678 3 1.00 2.61 873.61
0816 -026 30.00 4,500.00 1,700.00 RES 1 0.4547 0.2334 0.3680 3 1.00 3.17 1,062.21
0816 -027 17.93 2,298.00 1,075.71 COM 1 0.2717 0.1192 0.2329 3 1.00 1.87 627.39
0816 -028 18.86 2,417.00 1,131.42 COM 1 0.2858 0.1254 0.2449 3 1.00 1.97 659.88
0816 -029 12.74 1,633.00 764.42 COM 1 0.1931 0.0847 0.1655 3 1.00 1.33 445.84
0816 -030 6.26 803.00 375.89 RES 1 0.0949 0.0416 0.0814 3 1.00 0.65 219.23
0816 -031 6.40 820.00 383.85 RES 1 0.0970 0.0425 0.0831 3 1.00 0.67 223.87
0816 -032 11.81 1,514.00 708.71 RES 1 0.1790 0.0785 0.1534 3 1.00 1.23 413.35
Page 12 of 27

City of San Francisco
Civic Center Property and Business Improvement DistrictFiscal Year 2019/20 Proposed Assessment Roll
APN
Front
Ft
Bldg
Sq Ft
Lot
Sq Ft
Land Use
Type (1) Zone
Front
Factor
Bldg
Factor
Lot
Factor
Land Use
BP
Zone
Factor
Total
BP
Preliminary
Assessment
0816 -033 175.24 15,727.00 5,603.03 COM 1 2.6559 0.8157 1.2129 3 1.00 14.05 4,711.78
0816 -034 10.95 983.00 350.21 RES 1 0.1660 0.0510 0.0758 3 1.00 0.88 294.51
0816 -035 12.66 1,136.00 404.72 RES 1 0.1918 0.0589 0.0876 3 1.00 1.02 340.34
0816 -036 8.31 746.00 265.78 RES 1 0.1260 0.0387 0.0575 3 1.00 0.67 223.50
0816 -037 11.49 1,031.00 367.31 RES 1 0.1741 0.0535 0.0795 3 1.00 0.92 308.89
0816 -038 11.72 1,052.00 374.79 RES 1 0.1777 0.0546 0.0811 3 1.00 0.94 315.18
0816 -039 11.90 1,068.00 380.49 RES 1 0.1804 0.0554 0.0824 3 1.00 0.95 319.97
0816 -040 11.96 1,073.00 382.28 RES 1 0.1812 0.0557 0.0827 3 1.00 0.96 321.47
0816 -041 11.92 1,070.00 381.21 RES 1 0.1807 0.0555 0.0825 3 1.00 0.96 320.57
0816 -042 8.32 747.00 266.13 RES 1 0.1262 0.0387 0.0576 3 1.00 0.67 223.80
0816 -043 7.74 695.00 247.61 RES 1 0.1174 0.0360 0.0536 3 1.00 0.62 208.22
0816 -044 7.70 691.00 246.18 RES 1 0.1167 0.0358 0.0533 3 1.00 0.62 207.02
0816 -045 9.95 893.00 318.15 RES 1 0.1508 0.0463 0.0689 3 1.00 0.80 267.54
0816 -046 11.66 1,046.00 372.66 RES 1 0.1766 0.0543 0.0807 3 1.00 0.93 313.38
0816 -047 8.31 746.00 265.78 RES 1 0.1260 0.0387 0.0575 3 1.00 0.67 223.50
0816 -048 11.89 1,067.00 380.14 RES 1 0.1802 0.0553 0.0823 3 1.00 0.95 319.67
0816 -049 11.72 1,052.00 374.79 RES 1 0.1777 0.0546 0.0811 3 1.00 0.94 315.18
0816 -050 11.90 1,068.00 380.49 RES 1 0.1804 0.0554 0.0824 3 1.00 0.95 319.97
0816 -051 11.96 1,073.00 382.28 RES 1 0.1812 0.0557 0.0827 3 1.00 0.96 321.47
0816 -052 11.92 1,070.00 381.21 RES 1 0.1807 0.0555 0.0825 3 1.00 0.96 320.57
0816 -053 8.32 747.00 266.13 RES 1 0.1262 0.0387 0.0576 3 1.00 0.67 223.80
0816 -054 7.74 695.00 247.61 RES 1 0.1174 0.0360 0.0536 3 1.00 0.62 208.22
0816 -055 7.70 691.00 246.18 RES 1 0.1167 0.0358 0.0533 3 1.00 0.62 207.02
0816 -056 9.95 893.00 318.15 RES 1 0.1508 0.0463 0.0689 3 1.00 0.80 267.54
0816 -057 11.50 1,032.00 367.67 RES 1 0.1743 0.0535 0.0796 3 1.00 0.92 309.19
0816 -058 8.16 732.00 260.79 RES 1 0.1236 0.0380 0.0565 3 1.00 0.65 219.31
0816 -059 11.73 1,053.00 375.15 RES 1 0.1778 0.0546 0.0812 3 1.00 0.94 315.48
0816 -060 11.57 1,038.00 369.81 RES 1 0.1753 0.0538 0.0800 3 1.00 0.93 310.98
0816 -061 11.74 1,054.00 375.51 RES 1 0.1780 0.0547 0.0813 3 1.00 0.94 315.78
Page 13 of 27

City of San Francisco
Civic Center Property and Business Improvement DistrictFiscal Year 2019/20 Proposed Assessment Roll
APN
Front
Ft
Bldg
Sq Ft
Lot
Sq Ft
Land Use
Type (1) Zone
Front
Factor
Bldg
Factor
Lot
Factor
Land Use
BP
Zone
Factor
Total
BP
Preliminary
Assessment
0816 -062 11.80 1,059.00 377.29 RES 1 0.1788 0.0549 0.0817 3 1.00 0.95 317.27
0816 -063 11.78 1,057.00 376.58 RES 1 0.1785 0.0548 0.0815 3 1.00 0.94 316.68
0816 -064 8.32 747.00 266.13 RES 1 0.1262 0.0387 0.0576 3 1.00 0.67 223.80
0816 -065 7.74 695.00 247.61 RES 1 0.1174 0.0360 0.0536 3 1.00 0.62 208.22
0816 -066 7.70 691.00 246.18 RES 1 0.1167 0.0358 0.0533 3 1.00 0.62 207.02
0816 -068 11.41 995.00 469.71 RES 1 0.1729 0.0516 0.1017 3 1.00 0.98 328.05
0816 -069 16.15 1,409.00 665.15 RES 1 0.2448 0.0731 0.1440 3 1.00 1.39 464.54
0816 -070 9.82 1,195.00 378.40 RES 1 0.1488 0.0620 0.0819 3 1.00 0.88 294.44
0816 -071 6.99 850.00 269.16 RES 1 0.1059 0.0441 0.0583 3 1.00 0.62 209.44
0816 -072 10.36 1,260.00 398.98 RES 1 0.1569 0.0654 0.0864 3 1.00 0.93 310.46
0816 -073 6.99 850.00 269.16 RES 1 0.1059 0.0441 0.0583 3 1.00 0.62 209.44
0816 -074 6.99 850.00 269.16 RES 1 0.1059 0.0441 0.0583 3 1.00 0.62 209.44
0816 -075 7.73 940.00 297.66 RES 1 0.1171 0.0488 0.0644 3 1.00 0.69 231.61
0816 -076 6.00 730.00 231.16 RES 1 0.0909 0.0379 0.0500 3 1.00 0.54 179.87
0816 -077 6.41 780.00 246.99 RES 1 0.0972 0.0405 0.0535 3 1.00 0.57 192.19
0816 -078 12.29 1,495.00 473.40 RES 1 0.1862 0.0775 0.1025 3 1.00 1.10 368.36
0816 -079 10.60 1,290.00 408.48 RES 1 0.1607 0.0669 0.0884 3 1.00 0.95 317.85
0816 -080 7.15 870.00 275.49 RES 1 0.1084 0.0451 0.0596 3 1.00 0.64 214.36
0816 -081 11.05 1,345.00 425.90 RES 1 0.1675 0.0698 0.0922 3 1.00 0.99 331.40
0816 -082 7.15 870.00 275.49 RES 1 0.1084 0.0451 0.0596 3 1.00 0.64 214.36
0816 -083 7.15 870.00 275.49 RES 1 0.1084 0.0451 0.0596 3 1.00 0.64 214.36
0816 -084 11.18 1,360.00 430.65 RES 1 0.1694 0.0705 0.0932 3 1.00 1.00 335.10
0816 -085 9.78 1,190.00 376.82 RES 1 0.1482 0.0617 0.0816 3 1.00 0.87 293.21
0816 -086 12.57 1,530.00 484.48 RES 1 0.1906 0.0794 0.1049 3 1.00 1.12 376.98
0816 -087 10.60 1,290.00 408.48 RES 1 0.1607 0.0669 0.0884 3 1.00 0.95 317.85
0816 -088 7.15 870.00 275.49 RES 1 0.1084 0.0451 0.0596 3 1.00 0.64 214.36
0816 -089 11.05 1,345.00 425.90 RES 1 0.1675 0.0698 0.0922 3 1.00 0.99 331.40
0816 -090 7.15 870.00 275.49 RES 1 0.1084 0.0451 0.0596 3 1.00 0.64 214.36
0816 -091 7.15 870.00 275.49 RES 1 0.1084 0.0451 0.0596 3 1.00 0.64 214.36
Page 14 of 27

City of San Francisco
Civic Center Property and Business Improvement DistrictFiscal Year 2019/20 Proposed Assessment Roll
APN
Front
Ft
Bldg
Sq Ft
Lot
Sq Ft
Land Use
Type (1) Zone
Front
Factor
Bldg
Factor
Lot
Factor
Land Use
BP
Zone
Factor
Total
BP
Preliminary
Assessment
0816 -092 11.18 1,360.00 430.65 RES 1 0.1694 0.0705 0.0932 3 1.00 1.00 335.10
0816 -093 9.78 1,190.00 376.82 RES 1 0.1482 0.0617 0.0816 3 1.00 0.87 293.21
0816 -094 12.57 1,530.00 484.48 RES 1 0.1906 0.0794 0.1049 3 1.00 1.12 376.98
0816 -095 10.60 1,290.00 408.48 RES 1 0.1607 0.0669 0.0884 3 1.00 0.95 317.85
0816 -096 7.15 870.00 275.49 RES 1 0.1084 0.0451 0.0596 3 1.00 0.64 214.36
0816 -097 11.05 1,345.00 425.90 RES 1 0.1675 0.0698 0.0922 3 1.00 0.99 331.40
0816 -098 7.15 870.00 275.49 RES 1 0.1084 0.0451 0.0596 3 1.00 0.64 214.36
0816 -099 7.15 870.00 275.49 RES 1 0.1084 0.0451 0.0596 3 1.00 0.64 214.36
0816 -100 19.03 2,315.00 733.06 RES 1 0.2883 0.1201 0.1587 3 1.00 1.70 570.40
0816 -101 51.04 6,210.00 1,966.42 COM 1 0.7735 0.3221 0.4257 3 1.00 4.56 1,530.11
0816 -102 15.92 1,389.00 655.71 RES 1 0.2413 0.0720 0.1419 3 1.00 1.37 457.94
0816 -103 11.52 1,005.00 474.43 RES 1 0.1746 0.0521 0.1027 3 1.00 0.99 331.34
0833 -002 110.00 7,185.00 2,395.00 COM 1 1.6671 0.3727 0.5184 3 1.00 7.67 2,573.12
0833 -003 1,065.00 252,450.00 49,500.00 EDU 1 16.1408 13.0936 10.7150 2 1.00 79.90 26,788.08
0833 -014 161.50 9,517.00 3,293.00 RES 1 2.4476 0.4936 0.7128 3 1.00 10.96 3,675.36
0833 -015 220.00 0.00 13,200.00 EDU 1 3.3342 0.0000 2.8573 2 1.00 12.38 4,151.77
0833 -018 100.00 30,000.00 6,000.00 RES 1 1.5156 1.5560 1.2988 3 1.00 13.11 4,395.80
0833 -019 175.00 10,000.00 10,497.00 REL 1 2.6522 0.5187 2.2722 2 1.00 10.89 3,649.89
0833 -020 55.00 0.00 3,297.00 COM 1 0.8336 0.0000 0.7137 3 1.00 4.64 1,556.26
0833 -021 60.00 9,900.00 3,598.00 RES 1 0.9093 0.5135 0.7788 3 1.00 6.60 2,214.48
0833 -022 4.80 446.00 203.15 RES 1 0.0727 0.0231 0.0440 3 1.00 0.42 140.62
0833 -023 4.80 446.00 203.15 RES 1 0.0727 0.0231 0.0440 3 1.00 0.42 140.62
0833 -024 2.51 233.00 106.13 RES 1 0.0380 0.0121 0.0230 3 1.00 0.22 73.46
0833 -025 8.52 792.00 360.75 RES 1 0.1291 0.0411 0.0781 3 1.00 0.74 249.71
0833 -026 8.72 811.00 369.41 RES 1 0.1322 0.0421 0.0800 3 1.00 0.76 255.70
0833 -027 8.80 818.00 372.59 RES 1 0.1333 0.0424 0.0807 3 1.00 0.77 257.90
0833 -028 8.80 818.00 372.59 RES 1 0.1333 0.0424 0.0807 3 1.00 0.77 257.90
0833 -029 8.80 818.00 372.59 RES 1 0.1333 0.0424 0.0807 3 1.00 0.77 257.90
0833 -030 8.96 833.00 379.43 RES 1 0.1358 0.0432 0.0821 3 1.00 0.78 262.63
Page 15 of 27

City of San Francisco
Civic Center Property and Business Improvement DistrictFiscal Year 2019/20 Proposed Assessment Roll
APN
Front
Ft
Bldg
Sq Ft
Lot
Sq Ft
Land Use
Type (1) Zone
Front
Factor
Bldg
Factor
Lot
Factor
Land Use
BP
Zone
Factor
Total
BP
Preliminary
Assessment
0833 -031 9.07 843.00 383.98 RES 1 0.1374 0.0437 0.0831 3 1.00 0.79 265.79
0833 -032 8.41 782.00 356.20 RES 1 0.1275 0.0406 0.0771 3 1.00 0.74 246.55
0833 -033 8.28 770.00 350.73 RES 1 0.1255 0.0399 0.0759 3 1.00 0.72 242.77
0833 -034 8.44 785.00 357.56 RES 1 0.1280 0.0407 0.0774 3 1.00 0.74 247.50
0833 -035 8.80 818.00 372.59 RES 1 0.1333 0.0424 0.0807 3 1.00 0.77 257.90
0833 -036 8.29 771.00 351.19 RES 1 0.1257 0.0400 0.0760 3 1.00 0.73 243.09
0833 -037 8.77 815.00 371.23 RES 1 0.1328 0.0423 0.0804 3 1.00 0.77 256.96
0833 -038 8.77 815.00 371.23 RES 1 0.1328 0.0423 0.0804 3 1.00 0.77 256.96
0833 -039 8.41 782.00 356.20 RES 1 0.1275 0.0406 0.0771 3 1.00 0.74 246.55
0833 -040 9.60 893.00 406.76 RES 1 0.1456 0.0463 0.0880 3 1.00 0.84 281.55
0833 -041 8.77 815.00 371.23 RES 1 0.1328 0.0423 0.0804 3 1.00 0.77 256.96
0833 -042 9.71 903.00 411.31 RES 1 0.1472 0.0468 0.0890 3 1.00 0.85 284.70
0834 -004 456.00 130,000.00 19,740.00 OFC 1 6.9110 6.7426 4.2730 3 1.00 53.78 18,031.02
0834 -008 267.50 0.00 8,850.00 COM 1 4.0541 0.0000 1.9157 3 1.00 17.91 6,004.64
0834 -012 220.00 23,550.00 3,000.00 RES 1 3.3342 1.2214 0.6494 3 1.00 15.62 5,235.42
0834 -013 65.00 6,680.00 3,898.00 COM 1 0.9851 0.3465 0.8438 3 1.00 6.53 2,188.04
0834 -014 55.00 6,594.00 3,297.00 COM 1 0.8336 0.3420 0.7137 3 1.00 5.67 1,900.26
0834 -015 55.00 5,415.00 3,297.00 COM 1 0.8336 0.2809 0.7137 3 1.00 5.48 1,838.75
0834 -016 55.00 6,594.00 3,297.00 COM 1 0.8336 0.3420 0.7137 3 1.00 5.67 1,900.26
0834 -017 55.00 4,300.00 3,297.00 COM 1 0.8336 0.2230 0.7137 3 1.00 5.31 1,780.58
0834 -018 82.50 18,780.00 4,950.00 RES 1 1.2503 0.9740 1.0715 3 1.00 9.89 3,315.09
0834 -019 82.50 9,896.00 4,948.00 COM 1 1.2503 0.5133 1.0711 3 1.00 8.50 2,851.19
0834 -027 286.00 73,000.00 17,940.00 EDU 1 4.3345 3.7862 3.8834 2 1.00 24.01 8,049.37
0834 -032 4.29 831.00 166.55 RES 1 0.0651 0.0431 0.0361 3 1.00 0.43 145.06
0834 -033 2.70 522.00 104.62 RES 1 0.0409 0.0271 0.0226 3 1.00 0.27 91.12
0834 -034 5.85 1,133.00 227.08 RES 1 0.0887 0.0588 0.0492 3 1.00 0.59 197.78
0834 -035 4.36 844.00 169.16 RES 1 0.0661 0.0438 0.0366 3 1.00 0.44 147.33
0834 -036 4.75 920.00 184.39 RES 1 0.0720 0.0477 0.0399 3 1.00 0.48 160.60
0834 -037 4.09 792.00 158.74 RES 1 0.0620 0.0411 0.0344 3 1.00 0.41 138.26
Page 16 of 27

City of San Francisco
Civic Center Property and Business Improvement DistrictFiscal Year 2019/20 Proposed Assessment Roll
APN
Front
Ft
Bldg
Sq Ft
Lot
Sq Ft
Land Use
Type (1) Zone
Front
Factor
Bldg
Factor
Lot
Factor
Land Use
BP
Zone
Factor
Total
BP
Preliminary
Assessment
0834 -038 4.29 830.00 166.35 RES 1 0.0650 0.0430 0.0360 3 1.00 0.43 144.89
0834 -039 5.84 1,131.00 226.68 RES 1 0.0886 0.0587 0.0491 3 1.00 0.59 197.43
0834 -040 2.78 538.00 107.83 RES 1 0.0421 0.0279 0.0233 3 1.00 0.28 93.92
0834 -041 4.46 864.00 173.17 RES 1 0.0677 0.0448 0.0375 3 1.00 0.45 150.83
0834 -042 4.29 831.00 166.55 RES 1 0.0651 0.0431 0.0361 3 1.00 0.43 145.06
0834 -043 2.71 524.00 105.02 RES 1 0.0410 0.0272 0.0227 3 1.00 0.27 91.47
0834 -044 5.90 1,141.00 228.69 RES 1 0.0893 0.0592 0.0495 3 1.00 0.59 199.18
0834 -045 4.91 950.00 190.40 RES 1 0.0744 0.0493 0.0412 3 1.00 0.49 165.84
0834 -046 4.89 947.00 189.80 RES 1 0.0742 0.0491 0.0411 3 1.00 0.49 165.31
0834 -047 4.33 838.00 167.96 RES 1 0.0656 0.0435 0.0364 3 1.00 0.44 146.29
0834 -048 5.05 977.00 195.82 RES 1 0.0765 0.0507 0.0424 3 1.00 0.51 170.55
0834 -049 5.85 1,132.00 226.88 RES 1 0.0886 0.0587 0.0491 3 1.00 0.59 197.61
0834 -050 2.81 543.00 108.83 RES 1 0.0425 0.0282 0.0236 3 1.00 0.28 94.79
0834 -051 4.48 867.00 173.77 RES 1 0.0679 0.0450 0.0376 3 1.00 0.45 151.35
0834 -052 4.31 834.00 167.16 RES 1 0.0653 0.0433 0.0362 3 1.00 0.43 145.59
0834 -053 2.70 523.00 104.82 RES 1 0.0410 0.0271 0.0227 3 1.00 0.27 91.30
0834 -054 5.91 1,143.00 229.09 RES 1 0.0895 0.0593 0.0496 3 1.00 0.60 199.53
0834 -055 4.38 847.00 169.76 RES 1 0.0663 0.0439 0.0367 3 1.00 0.44 147.86
0834 -056 4.89 946.00 189.60 RES 1 0.0741 0.0491 0.0410 3 1.00 0.49 165.14
0834 -057 4.33 838.00 167.96 RES 1 0.0656 0.0435 0.0364 3 1.00 0.44 146.29
0834 -058 5.06 979.00 196.22 RES 1 0.0767 0.0508 0.0425 3 1.00 0.51 170.90
0834 -059 5.89 1,140.00 228.49 RES 1 0.0893 0.0591 0.0495 3 1.00 0.59 199.01
0834 -060 2.81 544.00 109.03 RES 1 0.0426 0.0282 0.0236 3 1.00 0.28 94.96
0834 -061 4.50 871.00 174.57 RES 1 0.0682 0.0452 0.0378 3 1.00 0.45 152.05
0834 -062 4.29 831.00 166.55 RES 1 0.0651 0.0431 0.0361 3 1.00 0.43 145.06
0834 -063 2.71 525.00 105.22 RES 1 0.0411 0.0272 0.0228 3 1.00 0.27 91.65
0834 -064 5.86 1,135.00 227.48 RES 1 0.0889 0.0589 0.0492 3 1.00 0.59 198.13
0834 -065 4.37 846.00 169.56 RES 1 0.0662 0.0439 0.0367 3 1.00 0.44 147.68
0834 -066 4.85 938.00 188.00 RES 1 0.0734 0.0487 0.0407 3 1.00 0.49 163.74
Page 17 of 27

City of San Francisco
Civic Center Property and Business Improvement DistrictFiscal Year 2019/20 Proposed Assessment Roll
APN
Front
Ft
Bldg
Sq Ft
Lot
Sq Ft
Land Use
Type (1) Zone
Front
Factor
Bldg
Factor
Lot
Factor
Land Use
BP
Zone
Factor
Total
BP
Preliminary
Assessment
0834 -067 4.30 832.00 166.75 RES 1 0.0651 0.0432 0.0361 3 1.00 0.43 145.24
0834 -068 5.04 975.00 195.42 RES 1 0.0763 0.0506 0.0423 3 1.00 0.51 170.20
0834 -069 5.84 1,131.00 226.68 RES 1 0.0886 0.0587 0.0491 3 1.00 0.59 197.43
0834 -070 2.80 541.00 108.43 RES 1 0.0424 0.0281 0.0235 3 1.00 0.28 94.44
0834 -071 4.46 864.00 173.17 RES 1 0.0677 0.0448 0.0375 3 1.00 0.45 150.83
0834 -072 4.31 835.00 167.36 RES 1 0.0654 0.0433 0.0362 3 1.00 0.43 145.76
0834 -073 2.70 523.00 104.82 RES 1 0.0410 0.0271 0.0227 3 1.00 0.27 91.30
0834 -074 5.89 1,140.00 228.49 RES 1 0.0893 0.0591 0.0495 3 1.00 0.59 199.01
0834 -075 4.40 852.00 170.76 RES 1 0.0667 0.0442 0.0370 3 1.00 0.44 148.73
0834 -076 4.90 948.00 190.00 RES 1 0.0742 0.0492 0.0411 3 1.00 0.49 165.49
0834 -077 4.32 837.00 167.76 RES 1 0.0655 0.0434 0.0363 3 1.00 0.44 146.11
0834 -078 5.00 967.00 193.81 RES 1 0.0757 0.0502 0.0420 3 1.00 0.50 168.81
0834 -079 5.84 1,131.00 226.68 RES 1 0.0886 0.0587 0.0491 3 1.00 0.59 197.43
0834 -080 2.82 545.00 109.23 RES 1 0.0427 0.0283 0.0236 3 1.00 0.28 95.14
0834 -081 4.50 871.00 174.57 RES 1 0.0682 0.0452 0.0378 3 1.00 0.45 152.05
0834 -083 9.13 1,767.00 354.15 COM 1 0.1384 0.0916 0.0767 3 1.00 0.92 308.46
0834 -144 9.13 1,767.00 354.15 COM 1 0.1384 0.0916 0.0767 3 1.00 0.92 308.46
0834 -145 9.13 1,767.00 354.15 COM 1 0.1384 0.0916 0.0767 3 1.00 0.92 308.46
0834 -146 9.13 1,767.00 354.15 COM 1 0.1384 0.0916 0.0767 3 1.00 0.92 308.46
0834 -147 9.13 1,767.00 354.15 COM 1 0.1384 0.0916 0.0767 3 1.00 0.92 308.46
0834 -148 9.13 1,767.00 354.15 COM 1 0.1384 0.0916 0.0767 3 1.00 0.92 308.46
0834 -149 9.13 1,767.00 354.15 COM 1 0.1384 0.0916 0.0767 3 1.00 0.92 308.46
0834 -150 9.13 1,767.00 354.15 COM 1 0.1384 0.0916 0.0767 3 1.00 0.92 308.46
0834 -151 12.77 2,472.00 495.45 COM 1 0.1936 0.1282 0.1072 3 1.00 1.29 431.53
0834 -152 12.82 2,481.00 497.26 COM 1 0.1943 0.1287 0.1076 3 1.00 1.29 433.10
0834 -153 9.13 1,767.00 354.15 COM 1 0.1384 0.0916 0.0767 3 1.00 0.92 308.46
0834 -154 9.13 1,767.00 354.15 COM 1 0.1384 0.0916 0.0767 3 1.00 0.92 308.46
0835 -001 315.46 35,921.00 8,651.00 COM 1 4.7810 1.8631 1.8726 3 1.00 25.55 8,566.33
0835 -002 69.21 23,260.00 3,844.00 COM 1 1.0489 1.2064 0.8321 3 1.00 9.26 3,105.37
Page 18 of 27

City of San Francisco
Civic Center Property and Business Improvement DistrictFiscal Year 2019/20 Proposed Assessment Roll
APN
Front
Ft
Bldg
Sq Ft
Lot
Sq Ft
Land Use
Type (1) Zone
Front
Factor
Bldg
Factor
Lot
Factor
Land Use
BP
Zone
Factor
Total
BP
Preliminary
Assessment
0835 -003 122.78 16,994.00 8,520.00 COM 1 1.8608 0.8814 1.8443 3 1.00 13.76 4,613.24
0835 -004 635.33 180,939.00 38,123.00 COM 1 9.6289 9.3846 8.2523 3 1.00 81.80 27,424.61
0836 -001 90.52 2,750.00 1,092.00 COM 1 1.3719 0.1426 0.2364 3 1.00 5.25 1,761.12
0836 -002 49.12 0.00 1,398.00 COM 1 0.7444 0.0000 0.3026 3 1.00 3.14 1,053.09
0836 -003 49.12 0.00 1,746.00 COM 1 0.7444 0.0000 0.3779 3 1.00 3.37 1,128.86
0836 -004 98.23 25,365.00 5,073.00 COM 1 1.4887 1.3156 1.0981 3 1.00 11.71 3,925.17
0836 -005 147.34 48,225.00 9,426.00 COM 1 2.2331 2.5012 2.0404 3 1.00 20.32 6,814.20
0836 -006 27.39 7,014.00 2,338.00 COM 1 0.4150 0.3638 0.5061 3 1.00 3.85 1,292.41
0836 -007 119.96 14,822.00 10,227.00 COM 1 1.8180 0.7688 2.2138 3 1.00 14.40 4,828.55
0836 -008 71.12 0.00 8,588.00 COM 1 1.0778 0.0000 1.8590 3 1.00 8.81 2,953.90
0836 -009 27.12 14,730.00 2,946.00 COM 1 0.4109 0.7640 0.6377 3 1.00 5.44 1,823.20
0836 -010 207.16 61,553.00 8,600.00 RES 1 3.1396 3.1925 1.8616 3 1.00 24.58 8,241.43
0836 -013 222.75 0.00 12,218.00 COM 1 3.3759 0.0000 2.6448 3 1.00 18.06 6,055.77
0836 -031 50.00 27,361.00 4,337.00 RES 1 0.7578 1.4191 0.9388 3 1.00 9.35 3,133.85
0837 -001 175.00 10,098.00 3,300.00 COM 1 2.6522 0.5237 0.7143 3 1.00 11.67 3,912.99
0837 -002 170.00 9,780.00 6,600.00 RES 1 2.5765 0.5072 1.4287 3 1.00 13.54 4,538.67
0837 -005 55.00 6,480.00 3,300.00 COM 1 0.8336 0.3361 0.7143 3 1.00 5.65 1,894.96
0837 -006 109.00 36,186.00 6,540.00 COM 1 1.6520 1.8768 1.4157 3 1.00 14.83 4,973.28
0837 -007 56.00 6,736.00 3,360.00 RES 1 0.8487 0.3494 0.7273 3 1.00 5.78 1,936.63
0837 -008 110.00 13,200.00 6,599.00 COM 1 1.6671 0.6846 1.4284 3 1.00 11.34 3,802.23
0837 -010 27.50 3,840.00 1,646.00 RES 1 0.4168 0.1992 0.3563 3 1.00 2.92 977.91
0837 -011 110.00 7,599.00 6,599.00 COM 1 1.6671 0.3941 1.4284 3 1.00 10.47 3,510.03
0837 -012 175.00 13,200.00 3,297.00 RES 1 2.6522 0.6846 0.7137 3 1.00 12.15 4,074.16
0837 -013 115.00 9,540.00 3,300.00 RES 1 1.7429 0.4948 0.7143 3 1.00 8.86 2,969.24
0837 -014 115.00 6,600.00 3,300.00 COM 1 1.7429 0.3423 0.7143 3 1.00 8.40 2,815.86
0837 -015 165.00 12,100.00 9,896.00 RES 1 2.5007 0.6276 2.1421 3 1.00 15.81 5,301.10
0837 -025 110.00 5,599.00 6,599.00 OFC 1 1.6671 0.2904 1.4284 3 1.00 10.16 3,405.70
0837 -067 385.00 6,240.00 23,086.80 EDU 1 5.8349 0.3236 4.9975 2 1.00 22.31 7,480.70
0837 -068 14.43 1,794.00 857.25 RES 1 0.2187 0.0930 0.1856 3 1.00 1.49 500.23
Page 19 of 27

City of San Francisco
Civic Center Property and Business Improvement DistrictFiscal Year 2019/20 Proposed Assessment Roll
APN
Front
Ft
Bldg
Sq Ft
Lot
Sq Ft
Land Use
Type (1) Zone
Front
Factor
Bldg
Factor
Lot
Factor
Land Use
BP
Zone
Factor
Total
BP
Preliminary
Assessment
0837 -069 8.03 998.00 476.89 RES 1 0.1217 0.0518 0.1032 3 1.00 0.83 278.28
0837 -070 10.83 1,346.00 643.17 RES 1 0.1641 0.0698 0.1392 3 1.00 1.12 375.31
0837 -071 9.31 1,157.00 552.86 RES 1 0.1411 0.0600 0.1197 3 1.00 0.96 322.61
0837 -072 12.40 1,542.00 736.83 RES 1 0.1880 0.0800 0.1595 3 1.00 1.28 429.97
0837 -081 5.50 672.00 329.40 RES 1 0.0834 0.0349 0.0713 3 1.00 0.57 190.62
0837 -082 5.50 672.00 329.40 RES 1 0.0834 0.0349 0.0713 3 1.00 0.57 190.62
0837 -083 5.50 672.00 329.40 RES 1 0.0834 0.0349 0.0713 3 1.00 0.57 190.62
0837 -084 5.50 672.00 329.40 RES 1 0.0834 0.0349 0.0713 3 1.00 0.57 190.62
0837 -085 5.50 672.00 329.40 RES 1 0.0834 0.0349 0.0713 3 1.00 0.57 190.62
0837 -095 7.32 1,129.00 284.01 COM 1 0.1109 0.0586 0.0615 3 1.00 0.69 232.25
0837 -096 4.50 694.00 174.58 COM 1 0.0682 0.0360 0.0378 3 1.00 0.43 142.77
0837 -097 7.02 1,084.00 272.69 COM 1 0.1065 0.0562 0.0590 3 1.00 0.67 223.00
0837 -098 5.26 812.00 204.27 RES 1 0.0797 0.0421 0.0442 3 1.00 0.50 167.04
0837 -099 3.40 524.00 131.82 RES 1 0.0515 0.0272 0.0285 3 1.00 0.32 107.79
0837 -100 2.88 445.00 111.95 RES 1 0.0437 0.0231 0.0242 3 1.00 0.27 91.54
0837 -101 2.95 455.00 114.46 RES 1 0.0447 0.0236 0.0248 3 1.00 0.28 93.60
0837 -102 3.54 547.00 137.60 RES 1 0.0537 0.0284 0.0298 3 1.00 0.34 112.53
0837 -103 5.75 887.00 223.14 RES 1 0.0871 0.0460 0.0483 3 1.00 0.54 182.47
0837 -104 5.26 812.00 204.27 RES 1 0.0797 0.0421 0.0442 3 1.00 0.50 167.04
0837 -105 3.40 524.00 131.82 RES 1 0.0515 0.0272 0.0285 3 1.00 0.32 107.79
0837 -106 2.88 445.00 111.95 RES 1 0.0437 0.0231 0.0242 3 1.00 0.27 91.54
0837 -107 3.10 479.00 120.50 RES 1 0.0470 0.0248 0.0261 3 1.00 0.29 98.54
0837 -108 3.54 547.00 137.60 RES 1 0.0537 0.0284 0.0298 3 1.00 0.34 112.53
0837 -109 6.09 940.00 236.47 RES 1 0.0923 0.0488 0.0512 3 1.00 0.58 193.37
0837 -110 5.26 812.00 204.27 RES 1 0.0797 0.0421 0.0442 3 1.00 0.50 167.04
0837 -111 3.40 524.00 131.82 RES 1 0.0515 0.0272 0.0285 3 1.00 0.32 107.79
0837 -112 2.88 445.00 111.95 RES 1 0.0437 0.0231 0.0242 3 1.00 0.27 91.54
0837 -113 3.10 479.00 120.50 RES 1 0.0470 0.0248 0.0261 3 1.00 0.29 98.54
0837 -114 3.54 547.00 137.60 RES 1 0.0537 0.0284 0.0298 3 1.00 0.34 112.53
Page 20 of 27

City of San Francisco
Civic Center Property and Business Improvement DistrictFiscal Year 2019/20 Proposed Assessment Roll
APN
Front
Ft
Bldg
Sq Ft
Lot
Sq Ft
Land Use
Type (1) Zone
Front
Factor
Bldg
Factor
Lot
Factor
Land Use
BP
Zone
Factor
Total
BP
Preliminary
Assessment
0837 -115 6.09 940.00 236.47 RES 1 0.0923 0.0488 0.0512 3 1.00 0.58 193.37
0837 -116 5.26 812.00 204.27 RES 1 0.0797 0.0421 0.0442 3 1.00 0.50 167.04
0837 -117 3.26 503.00 126.54 RES 1 0.0494 0.0261 0.0274 3 1.00 0.31 103.47
0837 -118 2.88 445.00 111.95 RES 1 0.0437 0.0231 0.0242 3 1.00 0.27 91.54
0837 -119 3.10 479.00 120.50 RES 1 0.0470 0.0248 0.0261 3 1.00 0.29 98.54
0837 -120 3.54 547.00 137.60 RES 1 0.0537 0.0284 0.0298 3 1.00 0.34 112.53
0837 -121 6.09 940.00 236.47 RES 1 0.0923 0.0488 0.0512 3 1.00 0.58 193.37
0837 -122 5.26 812.00 204.27 RES 1 0.0797 0.0421 0.0442 3 1.00 0.50 167.04
0837 -123 3.26 503.00 126.54 RES 1 0.0494 0.0261 0.0274 3 1.00 0.31 103.47
0837 -124 6.64 1,025.00 257.85 RES 1 0.1007 0.0532 0.0558 3 1.00 0.63 210.86
0837 -125 3.10 479.00 120.50 RES 1 0.0470 0.0248 0.0261 3 1.00 0.29 98.54
0837 -126 6.53 1,008.00 253.58 RES 1 0.0990 0.0523 0.0549 3 1.00 0.62 207.36
0837 -127 3.26 503.00 126.54 RES 1 0.0494 0.0261 0.0274 3 1.00 0.31 103.47
0837 -128 5.10 787.00 197.98 RES 1 0.0773 0.0408 0.0429 3 1.00 0.48 161.90
0837 -129 3.10 479.00 120.50 RES 1 0.0470 0.0248 0.0261 3 1.00 0.29 98.54
0837 -130 6.99 1,079.00 271.44 RES 1 0.1060 0.0560 0.0588 3 1.00 0.66 221.97
0837 -131 6.34 979.00 246.28 RES 1 0.0961 0.0508 0.0533 3 1.00 0.60 201.40
0837 -132 5.10 787.00 197.98 RES 1 0.0773 0.0408 0.0429 3 1.00 0.48 161.90
0854 -002 217.18 54,445.00 11,800.00 COM 1 3.2915 2.8238 2.5543 3 1.00 26.01 8,720.10
0854 -003 199.38 6,286.00 3,609.00 COM 1 3.0217 0.3260 0.7812 3 1.00 12.39 4,152.97
0854 -004 61.38 9,610.00 2,090.00 COM 1 0.9302 0.4984 0.4524 3 1.00 5.64 1,891.98
0854 -005 121.29 31,200.00 5,665.00 RES 1 1.8383 1.6182 1.2263 3 1.00 14.05 4,710.04
0854 -006 175.00 17,940.00 6,600.00 RES 1 2.6522 0.9305 1.4287 3 1.00 15.03 5,040.58
0854 -011 83.85 18,747.00 3,928.99 COM 1 1.2708 0.9723 0.8505 3 1.00 9.28 3,111.68
0854 -012 3.42 764.00 160.12 COM 1 0.0518 0.0396 0.0347 3 1.00 0.38 126.81
0854 -013 5.82 1,301.00 272.66 RES 1 0.0882 0.0675 0.0590 3 1.00 0.64 215.94
0854 -014 2.05 459.00 96.20 RES 1 0.0311 0.0238 0.0208 3 1.00 0.23 76.19
0854 -015 3.06 685.00 143.56 RES 1 0.0464 0.0355 0.0311 3 1.00 0.34 113.70
0854 -016 2.07 463.00 97.04 RES 1 0.0314 0.0240 0.0210 3 1.00 0.23 76.85
Page 21 of 27

City of San Francisco
Civic Center Property and Business Improvement DistrictFiscal Year 2019/20 Proposed Assessment Roll
APN
Front
Ft
Bldg
Sq Ft
Lot
Sq Ft
Land Use
Type (1) Zone
Front
Factor
Bldg
Factor
Lot
Factor
Land Use
BP
Zone
Factor
Total
BP
Preliminary
Assessment
0854 -017 3.68 822.00 172.27 RES 1 0.0557 0.0426 0.0373 3 1.00 0.41 136.44
0854 -018 3.82 855.00 179.19 RES 1 0.0580 0.0443 0.0388 3 1.00 0.42 141.92
0854 -019 3.83 856.00 179.40 RES 1 0.0580 0.0444 0.0388 3 1.00 0.42 142.08
0854 -020 3.66 819.00 171.65 RES 1 0.0555 0.0425 0.0372 3 1.00 0.41 135.94
0854 -021 2.00 448.00 93.89 RES 1 0.0304 0.0232 0.0203 3 1.00 0.22 74.36
0854 -022 2.30 515.00 107.93 RES 1 0.0349 0.0267 0.0234 3 1.00 0.25 85.48
0854 -023 5.54 1,238.00 259.46 RES 1 0.0839 0.0642 0.0562 3 1.00 0.61 205.49
0854 -024 5.04 1,126.00 235.99 RES 1 0.0763 0.0584 0.0511 3 1.00 0.56 186.90
0854 -025 5.03 1,124.00 235.57 RES 1 0.0762 0.0583 0.0510 3 1.00 0.56 186.56
0854 -026 5.47 1,224.00 256.53 RES 1 0.0830 0.0635 0.0555 3 1.00 0.61 203.16
0854 -027 4.88 1,092.00 228.86 RES 1 0.0740 0.0566 0.0495 3 1.00 0.54 181.25
0854 -028 3.05 683.00 143.14 RES 1 0.0463 0.0354 0.0310 3 1.00 0.34 113.37
0854 -029 5.19 1,160.00 243.11 RES 1 0.0786 0.0602 0.0526 3 1.00 0.57 192.54
0854 -030 1.81 404.00 84.67 RES 1 0.0274 0.0210 0.0183 3 1.00 0.20 67.06
0854 -031 2.89 646.00 135.39 RES 1 0.0438 0.0335 0.0293 3 1.00 0.32 107.22
0854 -032 4.51 1,008.00 211.26 RES 1 0.0683 0.0523 0.0457 3 1.00 0.50 167.31
0854 -033 4.64 1,037.00 217.33 RES 1 0.0703 0.0538 0.0470 3 1.00 0.51 172.12
0854 -034 2.13 476.00 99.76 RES 1 0.0323 0.0247 0.0216 3 1.00 0.24 79.01
0854 -035 3.35 750.00 157.18 RES 1 0.0508 0.0389 0.0340 3 1.00 0.37 124.49
0854 -036 2.14 479.00 100.39 RES 1 0.0325 0.0248 0.0217 3 1.00 0.24 79.51
0854 -037 4.43 990.00 207.48 RES 1 0.0671 0.0513 0.0449 3 1.00 0.49 164.32
0854 -038 1.79 401.00 84.04 RES 1 0.0272 0.0208 0.0182 3 1.00 0.20 66.56
0854 -039 3.34 746.00 156.35 RES 1 0.0506 0.0387 0.0338 3 1.00 0.37 123.82
0854 -040 3.01 674.00 141.26 RES 1 0.0457 0.0350 0.0306 3 1.00 0.33 111.87
0854 -041 3.34 746.00 156.35 RES 1 0.0506 0.0387 0.0338 3 1.00 0.37 123.82
0854 -042 1.81 404.00 84.67 RES 1 0.0274 0.0210 0.0183 3 1.00 0.20 67.06
0854 -043 5.27 1,178.00 246.88 RES 1 0.0799 0.0611 0.0534 3 1.00 0.58 195.53
0854 -044 1.96 438.00 91.80 RES 1 0.0297 0.0227 0.0199 3 1.00 0.22 72.70
0854 -045 3.79 847.00 177.51 RES 1 0.0574 0.0439 0.0384 3 1.00 0.42 140.59
Page 22 of 27

City of San Francisco
Civic Center Property and Business Improvement DistrictFiscal Year 2019/20 Proposed Assessment Roll
APN
Front
Ft
Bldg
Sq Ft
Lot
Sq Ft
Land Use
Type (1) Zone
Front
Factor
Bldg
Factor
Lot
Factor
Land Use
BP
Zone
Factor
Total
BP
Preliminary
Assessment
0854 -046 4.44 993.00 208.11 RES 1 0.0673 0.0515 0.0450 3 1.00 0.49 164.82
0854 -047 4.58 1,023.00 214.40 RES 1 0.0693 0.0531 0.0464 3 1.00 0.51 169.80
0854 -048 2.89 646.00 135.39 RES 1 0.0438 0.0335 0.0293 3 1.00 0.32 107.22
0854 -049 5.11 1,143.00 239.55 RES 1 0.0775 0.0593 0.0519 3 1.00 0.57 189.72
0854 -050 5.11 1,143.00 239.55 RES 1 0.0775 0.0593 0.0519 3 1.00 0.57 189.72
0854 -051 3.30 738.00 154.67 RES 1 0.0500 0.0383 0.0335 3 1.00 0.37 122.50
0854 -052 2.89 646.00 135.39 RES 1 0.0438 0.0335 0.0293 3 1.00 0.32 107.22
0854 -053 4.51 1,008.00 211.26 RES 1 0.0683 0.0523 0.0457 3 1.00 0.50 167.31
0854 -054 4.64 1,037.00 217.33 RES 1 0.0703 0.0538 0.0470 3 1.00 0.51 172.12
0854 -055 2.13 476.00 99.76 RES 1 0.0323 0.0247 0.0216 3 1.00 0.24 79.01
0854 -056 2.13 476.00 99.76 RES 1 0.0323 0.0247 0.0216 3 1.00 0.24 79.01
0854 -057 2.14 479.00 100.39 RES 1 0.0325 0.0248 0.0217 3 1.00 0.24 79.51
0854 -058 4.43 990.00 207.48 RES 1 0.0671 0.0513 0.0449 3 1.00 0.49 164.32
0854 -059 1.79 401.00 84.04 RES 1 0.0272 0.0208 0.0182 3 1.00 0.20 66.56
0854 -060 3.34 746.00 156.35 RES 1 0.0506 0.0387 0.0338 3 1.00 0.37 123.82
0854 -061 2.98 666.00 139.58 RES 1 0.0451 0.0345 0.0302 3 1.00 0.33 110.54
0854 -062 3.34 746.00 156.35 RES 1 0.0506 0.0387 0.0338 3 1.00 0.37 123.82
0854 -063 1.81 404.00 84.67 RES 1 0.0274 0.0210 0.0183 3 1.00 0.20 67.06
0854 -064 4.24 947.00 198.47 RES 1 0.0642 0.0491 0.0430 3 1.00 0.47 157.19
0854 -065 3.87 866.00 181.50 RES 1 0.0587 0.0449 0.0393 3 1.00 0.43 143.74
0854 -066 3.79 847.00 177.51 RES 1 0.0574 0.0439 0.0384 3 1.00 0.42 140.59
0854 -067 4.44 993.00 208.11 RES 1 0.0673 0.0515 0.0450 3 1.00 0.49 164.82
0854 -068 4.58 1,023.00 214.40 RES 1 0.0693 0.0531 0.0464 3 1.00 0.51 169.80
0854 -069 2.89 646.00 135.39 RES 1 0.0438 0.0335 0.0293 3 1.00 0.32 107.22
0854 -070 3.30 738.00 154.67 RES 1 0.0500 0.0383 0.0335 3 1.00 0.37 122.50
0854 -071 2.89 646.00 135.39 RES 1 0.0438 0.0335 0.0293 3 1.00 0.32 107.22
0854 -072 4.51 1,008.00 211.26 RES 1 0.0683 0.0523 0.0457 3 1.00 0.50 167.31
0854 -073 4.64 1,037.00 217.33 RES 1 0.0703 0.0538 0.0470 3 1.00 0.51 172.12
0854 -074 2.13 476.00 99.76 RES 1 0.0323 0.0247 0.0216 3 1.00 0.24 79.01
Page 23 of 27

City of San Francisco
Civic Center Property and Business Improvement DistrictFiscal Year 2019/20 Proposed Assessment Roll
APN
Front
Ft
Bldg
Sq Ft
Lot
Sq Ft
Land Use
Type (1) Zone
Front
Factor
Bldg
Factor
Lot
Factor
Land Use
BP
Zone
Factor
Total
BP
Preliminary
Assessment
0854 -075 3.35 750.00 157.18 RES 1 0.0508 0.0389 0.0340 3 1.00 0.37 124.49
0854 -076 2.14 479.00 100.39 RES 1 0.0325 0.0248 0.0217 3 1.00 0.24 79.51
0854 -077 4.43 990.00 207.48 RES 1 0.0671 0.0513 0.0449 3 1.00 0.49 164.32
0854 -078 1.79 401.00 84.04 RES 1 0.0272 0.0208 0.0182 3 1.00 0.20 66.56
0854 -079 3.34 746.00 156.35 RES 1 0.0506 0.0387 0.0338 3 1.00 0.37 123.82
0854 -080 2.98 666.00 139.58 RES 1 0.0451 0.0345 0.0302 3 1.00 0.33 110.54
0854 -081 3.34 746.00 156.35 RES 1 0.0506 0.0387 0.0338 3 1.00 0.37 123.82
0854 -082 1.81 404.00 84.67 RES 1 0.0274 0.0210 0.0183 3 1.00 0.20 67.06
0854 -083 4.24 947.00 198.47 RES 1 0.0642 0.0491 0.0430 3 1.00 0.47 157.19
0854 -084 4.38 980.00 205.39 RES 1 0.0664 0.0508 0.0445 3 1.00 0.49 162.66
0854 -085 3.79 847.00 177.51 RES 1 0.0574 0.0439 0.0384 3 1.00 0.42 140.59
0854 -086 4.62 1,034.00 216.71 RES 1 0.0701 0.0536 0.0469 3 1.00 0.51 171.63
0854 -087 4.58 1,023.00 214.40 RES 1 0.0693 0.0531 0.0464 3 1.00 0.51 169.80
0854 -088 2.89 646.00 135.39 RES 1 0.0438 0.0335 0.0293 3 1.00 0.32 107.22
0854 -089 3.30 738.00 154.67 RES 1 0.0500 0.0383 0.0335 3 1.00 0.37 122.50
0854 -090 2.89 646.00 135.39 RES 1 0.0438 0.0335 0.0293 3 1.00 0.32 107.22
0854 -091 4.51 1,008.00 211.26 RES 1 0.0683 0.0523 0.0457 3 1.00 0.50 167.31
0854 -092 4.63 1,036.00 217.12 RES 1 0.0702 0.0537 0.0470 3 1.00 0.51 171.96
0854 -093 3.87 865.00 181.29 RES 1 0.0586 0.0449 0.0392 3 1.00 0.43 143.58
0854 -094 3.88 868.00 181.92 RES 1 0.0588 0.0450 0.0394 3 1.00 0.43 144.07
0854 -095 4.43 990.00 207.48 RES 1 0.0671 0.0513 0.0449 3 1.00 0.49 164.32
0854 -096 1.79 401.00 84.04 RES 1 0.0272 0.0208 0.0182 3 1.00 0.20 66.56
0854 -097 3.34 746.00 156.35 RES 1 0.0506 0.0387 0.0338 3 1.00 0.37 123.82
0854 -098 2.98 666.00 139.58 RES 1 0.0451 0.0345 0.0302 3 1.00 0.33 110.54
0854 -099 3.34 746.00 156.35 RES 1 0.0506 0.0387 0.0338 3 1.00 0.37 123.82
0854 -100 1.81 404.00 84.67 RES 1 0.0274 0.0210 0.0183 3 1.00 0.20 67.06
0854 -101 4.43 990.00 207.48 RES 1 0.0671 0.0513 0.0449 3 1.00 0.49 164.32
0854 -102 3.85 861.00 180.45 RES 1 0.0584 0.0447 0.0391 3 1.00 0.43 142.91
0854 -103 3.79 847.00 177.51 RES 1 0.0574 0.0439 0.0384 3 1.00 0.42 140.59
Page 24 of 27

City of San Francisco
Civic Center Property and Business Improvement DistrictFiscal Year 2019/20 Proposed Assessment Roll
APN
Front
Ft
Bldg
Sq Ft
Lot
Sq Ft
Land Use
Type (1) Zone
Front
Factor
Bldg
Factor
Lot
Factor
Land Use
BP
Zone
Factor
Total
BP
Preliminary
Assessment
0854 -104 4.62 1,034.00 216.71 RES 1 0.0701 0.0536 0.0469 3 1.00 0.51 171.63
0854 -105 4.58 1,023.00 214.40 RES 1 0.0693 0.0531 0.0464 3 1.00 0.51 169.80
0854 -106 2.89 646.00 135.39 RES 1 0.0438 0.0335 0.0293 3 1.00 0.32 107.22
0854 -107 3.30 738.00 154.67 RES 1 0.0500 0.0383 0.0335 3 1.00 0.37 122.50
0854 -108 2.89 646.00 135.39 RES 1 0.0438 0.0335 0.0293 3 1.00 0.32 107.22
0854 -109 4.51 1,008.00 211.26 RES 1 0.0683 0.0523 0.0457 3 1.00 0.50 167.31
0854 -110 4.63 1,036.00 217.12 RES 1 0.0702 0.0537 0.0470 3 1.00 0.51 171.96
0854 -111 3.87 865.00 181.29 RES 1 0.0586 0.0449 0.0392 3 1.00 0.43 143.58
0854 -112 3.96 885.00 185.48 RES 1 0.0600 0.0459 0.0401 3 1.00 0.44 146.89
0854 -113 4.43 990.00 207.48 RES 1 0.0671 0.0513 0.0449 3 1.00 0.49 164.32
0854 -114 1.79 401.00 84.04 RES 1 0.0272 0.0208 0.0182 3 1.00 0.20 66.56
0854 -115 3.34 746.00 156.35 RES 1 0.0506 0.0387 0.0338 3 1.00 0.37 123.82
0854 -116 2.98 666.00 139.58 RES 1 0.0451 0.0345 0.0302 3 1.00 0.33 110.54
0854 -117 3.34 746.00 156.35 RES 1 0.0506 0.0387 0.0338 3 1.00 0.37 123.82
0854 -118 1.81 404.00 84.67 RES 1 0.0274 0.0210 0.0183 3 1.00 0.20 67.06
0854 -119 4.43 990.00 207.48 RES 1 0.0671 0.0513 0.0449 3 1.00 0.49 164.32
0854 -120 3.85 861.00 180.45 RES 1 0.0584 0.0447 0.0391 3 1.00 0.43 142.91
0854 -121 3.79 847.00 177.51 RES 1 0.0574 0.0439 0.0384 3 1.00 0.42 140.59
0854 -122 4.62 1,034.00 216.71 RES 1 0.0701 0.0536 0.0469 3 1.00 0.51 171.63
0854 -123 4.58 1,023.00 214.40 RES 1 0.0693 0.0531 0.0464 3 1.00 0.51 169.80
0854 -124 2.87 641.00 134.34 RES 1 0.0435 0.0332 0.0291 3 1.00 0.32 106.39
0854 -125 3.30 738.00 154.67 RES 1 0.0500 0.0383 0.0335 3 1.00 0.37 122.50
0854 -126 2.89 646.00 135.39 RES 1 0.0438 0.0335 0.0293 3 1.00 0.32 107.22
0854 -127 4.51 1,008.00 211.26 RES 1 0.0683 0.0523 0.0457 3 1.00 0.50 167.31
0854 -128 4.63 1,036.00 217.12 RES 1 0.0702 0.0537 0.0470 3 1.00 0.51 171.96
0854 -129 3.87 865.00 181.29 RES 1 0.0586 0.0449 0.0392 3 1.00 0.43 143.58
0854 -130 3.88 868.00 181.92 RES 1 0.0588 0.0450 0.0394 3 1.00 0.43 144.07
0854 -131 6.84 1,530.00 320.66 RES 1 0.1037 0.0794 0.0694 3 1.00 0.76 253.95
0854 -132 3.34 746.00 156.35 RES 1 0.0506 0.0387 0.0338 3 1.00 0.37 123.82
Page 25 of 27

City of San Francisco
Civic Center Property and Business Improvement DistrictFiscal Year 2019/20 Proposed Assessment Roll
APN
Front
Ft
Bldg
Sq Ft
Lot
Sq Ft
Land Use
Type (1) Zone
Front
Factor
Bldg
Factor
Lot
Factor
Land Use
BP
Zone
Factor
Total
BP
Preliminary
Assessment
0854 -133 2.98 666.00 139.58 RES 1 0.0451 0.0345 0.0302 3 1.00 0.33 110.54
0854 -134 3.34 746.00 156.35 RES 1 0.0506 0.0387 0.0338 3 1.00 0.37 123.82
0854 -135 6.69 1,495.00 313.32 RES 1 0.1013 0.0775 0.0678 3 1.00 0.74 248.14
0854 -136 3.85 861.00 180.45 RES 1 0.0584 0.0447 0.0391 3 1.00 0.43 142.91
0854 -137 3.79 847.00 177.51 RES 1 0.0574 0.0439 0.0384 3 1.00 0.42 140.59
0854 -138 4.62 1,034.00 216.71 RES 1 0.0701 0.0536 0.0469 3 1.00 0.51 171.63
0854 -139 4.58 1,023.00 214.40 RES 1 0.0693 0.0531 0.0464 3 1.00 0.51 169.80
0854 -140 2.87 641.00 134.34 RES 1 0.0435 0.0332 0.0291 3 1.00 0.32 106.39
0854 -141 20.17 1,736.00 458.41 COM 1 0.3057 0.0900 0.0992 3 1.00 1.48 497.87
0854 -142 20.18 1,737.00 458.68 COM 1 0.3059 0.0901 0.0993 3 1.00 1.49 498.16
0854 -143 10.25 882.00 232.90 RES 1 0.1553 0.0457 0.0504 3 1.00 0.75 252.95
0854 -144 5.88 506.00 133.62 RES 1 0.0891 0.0262 0.0289 3 1.00 0.43 145.12
0854 -145 9.32 802.00 211.78 RES 1 0.1412 0.0416 0.0458 3 1.00 0.69 230.01
0854 -146 9.53 820.00 216.53 RES 1 0.1444 0.0425 0.0469 3 1.00 0.70 235.17
0854 -147 6.18 532.00 140.48 RES 1 0.0937 0.0276 0.0304 3 1.00 0.46 152.57
0854 -148 6.54 563.00 148.67 RES 1 0.0991 0.0292 0.0322 3 1.00 0.48 161.46
0854 -149 10.25 882.00 232.90 RES 1 0.1553 0.0457 0.0504 3 1.00 0.75 252.95
0854 -150 5.88 506.00 133.62 RES 1 0.0891 0.0262 0.0289 3 1.00 0.43 145.12
0854 -151 9.32 802.00 211.78 RES 1 0.1412 0.0416 0.0458 3 1.00 0.69 230.01
0854 -152 9.53 820.00 216.53 RES 1 0.1444 0.0425 0.0469 3 1.00 0.70 235.17
0854 -153 6.18 532.00 140.48 RES 1 0.0937 0.0276 0.0304 3 1.00 0.46 152.57
0854 -154 6.54 563.00 148.67 RES 1 0.0991 0.0292 0.0322 3 1.00 0.48 161.46
0854 -155 10.25 882.00 232.90 RES 1 0.1553 0.0457 0.0504 3 1.00 0.75 252.95
0854 -156 5.88 506.00 133.62 RES 1 0.0891 0.0262 0.0289 3 1.00 0.43 145.12
0854 -157 9.32 802.00 211.78 RES 1 0.1412 0.0416 0.0458 3 1.00 0.69 230.01
0854 -158 9.53 820.00 216.53 RES 1 0.1444 0.0425 0.0469 3 1.00 0.70 235.17
0854 -159 6.18 532.00 140.48 RES 1 0.0937 0.0276 0.0304 3 1.00 0.46 152.57
0854 -160 6.54 563.00 148.67 RES 1 0.0991 0.0292 0.0322 3 1.00 0.48 161.46
0854 -161 10.25 882.00 232.90 RES 1 0.1553 0.0457 0.0504 3 1.00 0.75 252.95
Page 26 of 27

City of San Francisco
Civic Center Property and Business Improvement DistrictFiscal Year 2019/20 Proposed Assessment Roll
APN
Front
Ft
Bldg
Sq Ft
Lot
Sq Ft
Land Use
Type (1) Zone
Front
Factor
Bldg
Factor
Lot
Factor
Land Use
BP
Zone
Factor
Total
BP
Preliminary
Assessment
0854 -162 5.88 506.00 133.62 RES 1 0.0891 0.0262 0.0289 3 1.00 0.43 145.12
0854 -163 9.32 802.00 211.78 RES 1 0.1412 0.0416 0.0458 3 1.00 0.69 230.01
0854 -164 9.53 820.00 216.53 RES 1 0.1444 0.0425 0.0469 3 1.00 0.70 235.17
0854 -165 6.18 532.00 140.48 RES 1 0.0937 0.0276 0.0304 3 1.00 0.46 152.57
0854 -166 6.54 563.00 148.67 RES 1 0.0991 0.0292 0.0322 3 1.00 0.48 161.46
3505 -001 266.83 40,115.00 8,023.00 COM 1 4.0440 2.0806 1.7367 3 1.00 23.58 7,907.15
3505 -004 125.92 7,600.00 3,794.00 COM 1 1.9084 0.3942 0.8213 3 1.00 9.37 3,142.01
3505 -007 25.00 0.00 2,500.00 COM 1 0.3789 0.0000 0.5412 3 1.00 2.76 925.41
3505 -008 50.00 0.00 5,000.00 COM 1 0.7578 0.0000 1.0823 3 1.00 5.52 1,850.83
3505 -032 320.38 25,268.00 25,268.00 COM 1 4.8555 1.3106 5.4696 3 1.00 34.91 11,703.46
3505 -032A 67.00 24,114.00 12,057.00 COM 1 1.0154 1.2507 2.6099 3 1.00 14.63 4,904.44
3505 -033 150.00 0.00 12,371.00 COM 1 2.2734 0.0000 2.6779 3 1.00 14.85 4,980.08
3505 -033A 50.00 0.00 4,499.00 COM 1 0.7578 0.0000 0.9739 3 1.00 5.19 1,741.75
3506 -001 741.84 656,844.00 65,000.00 OFC 1 11.2430 34.0679 14.0701 3 1.00 178.14 59,727.06
3506 -003A 160.15 0.00 2,600.00 COM 1 2.4272 0.0000 0.5628 3 1.00 8.97 3,007.41
3506 -004 911.13 49,000.00 48,199.00 COM 1 13.8088 2.5414 10.4333 3 1.00 80.35 26,939.61
3507 -040 770.50 1,320,000.00 131,147.00 COM 1 11.6774 68.4631 28.3886 3 1.00 325.59 109,161.56
3507 -041 545.63 836,000.00 66,383.00 RES 1 8.2693 43.3600 14.3695 3 1.00 198.00 66,383.39
3508 -001 730.00 741,667.00 85,547.00 COM 1 11.0636 38.4673 18.5178 3 1.00 204.15 68,445.30
9,664.84 $3,240,387.11
(1) COM = Commercial, CUL = Cultural, EDU = Educational, OFC = Office, REL = Philanthropic/Religious/Charitable, RES = Residential
Totals
Page 27 of 27

Civic Center Property and Business Improvement District Renewal Engineer’s Report (March 15, 2019) 24
REFERENCES
Austin, D. Mark and Claudia Sanders. “Graffiti and Perceptions of Safety: A Pilot Study Using Photographs
and Survey Data.” Journal of Criminal Justice and Popular Culture, 14, 2007.
Beutz v. County of Riverside, 109 Cal. Rptr. 3d 851 (Cal. Ct. App. 2010)
Bonander v. Town of Tiburon, 147 Cal. App. 4th 1116 (Cal. Ct. App. 2007)
Brooks, Leah. “Volunteering to Be Taxed: Business Improvement Districts and the Extra-Governmental
Provision of Public Safety.” Journal of Public Economics, Vol. 92, No. 1, 2008.
Davis, Stacy C. and Robert G. Boundy. “Transportation Energy Data Book: Edition 37.” Prepared by the Oak
Ridge National Laboratory for the Vehicle Technologies Office, Office of Energy Efficiency and
Renewable Energy, U.S. Department of Energy, 2019.
Dowler, Kenneth. “Media Consumption and Public Attitudes toward Crime and Justice: The Relationship
between Fear of Crime, Punitive Attitudes, and Perceived Police Effectiveness.” Journal of Criminal
Justice and Popular Culture, 10, 109-126, 2003.
Ellicott, Stanley and Lisa Pagan. “Impact Analysis of San Francisco’s Property & Business Improvement
Districts (CBDs/BIDs).” San Francisco Office of Economic and Workforce Development, Fall 2012.
Golden Hill Neighborhood Assn. v. City of San Diego CA4/1, D062203 (Cal. Ct. App. 2013)
Hoyt, Lorlene M. “Do Business Improvement Organizations Make a Difference? Crime In and Around
Commercial Areas in Philadelphia.” Journal of Planning Education and Research, 25, 185-199, 2005.
Lau Leby, Jasmine and Ahmad Hariza Hashim. “Liveability Dimensions and Attributes: Their Relative
Importance in the Eyes of Neighbourhood Residents.” Journal of Construction in Developing
Countries, Vol. 15(1), 67-91, 2010.
Manteca Unified School District v. Reclamation District No. 17 et al, C077906 (Cal. Ct. App. 2017)
Throsby, D. "Cultural heritage as financial asset in strategies for urban development and poverty
alleviation." Paper for International Conference for Integrating Urban Knowledge & Practice, 2005.
"Trip Generation Manual, 9th Edition." Volume 2: Data, Volume 3: Data. Washington, D.C.: Institute of
Transportation Engineers, 2012.
"Van Ness Avenue Bus Rapid Transit Project: Final Environmental Impact Statement / Environmental
Impact Report." San Francisco County Transportation Authority, 2013.
Vilnai-Yavetz, Iris and Shaked Gilboa. “The Effect of Servicescape Cleanliness on Customer Reactions.”
Services Marketing Quarterly, 31:2, 213-234, 2010.

Civic Center Property and Business Improvement District Renewal Engineer’s Report (March 15, 2019) 25
APPENDICES
The following pages contain the appendices referenced in this report.

APPENDIX A
The following is a detailed breakdown of the Zone Factor calculations.
Service/Activity
Zone 1
Factor
Zone 2
Factor
Sidewalk Sweeping (1) 1.00 1.28
Pressure Washing (2) 1.00 2.56
Workforce Development Cleaners (3) 0.00 2.98
Ambassadors/Stewards/Garage Greeter (4) 1.00 2.09
Project Director (5) 1.00 1.00
Communications & Marketing (6) 1.00 1.47
Programming Manager (7) 0.00 1.00
Operations Manager (7) 0.00 1.00
Activation (8) 1.00 2.21
Executive Director (9) 1.00 1.00
Factor Totals 7.00 16.59
Zone Factors 1.00 2.37
(1) Sidewalk sweeping is planned for 224 hours in Zone 1 and 112 hours in Zone 2 weekly. The
total frontage of Zones 1 and 2 is 36,658 and 14,345 respectively. This equates to 1.28 times
greater frequency in Zone 2.
(2) Sidewalk pressure washing is planned for 40 hours per week in Zone 1 and 40 hours per
week in Zone 2. However, but because the frontage of Zone 2 is much less than Zone 1, this
equates to approximately 2.56 times greater frequency in Zone 2.
(3) Workforce Development Cleaners (or similar) will service Zone 2 only. The total combined
hours of cleaning per frontage foot for street sweeping and pressure washing, including
Workforce Development Cleaners, is 264 hours in Zone 1 and 472 hours in Zone 2 weekly.
This equates to approximately 3.4 times greater cleaning frequency in Zone 2. The
frequencies of street sweeping and pressure washing are separately analyzed. Therefore, it
is necessary to assign the appropriate value to Zone 2 Workforce Development Cleaners to
bring the aggregate cleaning ratio to 3.4:1 in favor of Zone 2. This necessitates a factor of
2.98 for Workforce Development Cleaners in Zone 2.
(4) Day and evening Ambassadors and Stewards are planned for 324 hours in Zone 1 and 265
hours in Zone 2 weekly (including the garage greeter for Zone 2 hours). The total frontage of
Zones 1 and 2 is 36,658 and 14,345 respectively. This equates to 2.09 times greater intensity
in Zone 2.
(5) Zone 1 and Zone 2 will each have a dedicated Project Director.
(6) Marketing and Communications efforts will be split between Zones 1 and 2. However,
assuming substantially equal effort between the zones, a factor of 1.47 is assigned to Zone 2

to reflect the differences in total square footage. In other words, equal effort between the
zones will result in a greater intensity for Zone 2 because of the smaller, aggregate lot and
building square footage. The total lot and building square footage is 7,986,678 for Zone 1
and 5,420,039 for Zone 2.
(7) The Programming and Operations Managers are dedicated to Zone 2.
(8) Activation will be provided periodically throughout the year and during the holidays in Zone
1. Activation will be provided daily (along with additional holiday events) in Zone 2. The
additional Activation provided in Zone 2, combined with the differences in total square
footage (as noted above), will result in a greater intensity for Zone 2 estimated to be 2.21
times greater than Zone 1.
(9) The Executive Director oversees the organization.

APPENDIX B
The following shows the details of the ADT figures used in Section 7.2.2.
Description / ITE Code
ADT per
1,000 sq ft of Building
Racquet Club 491 14.03
Health Club 492 32.93
Bowling Alley 437 33.33
Government Office Building 730 68.93
Free-Standing Discount Superstore 813 50.75
Free-Standing Discount Store 815 57.24
Hardware/Paint Store 816 51.29
Shopping Center 820 42.70
Factory Outlet Center 823 26.59
Quality Restaurant 931 89.95
High Turnover/Sit Down Rest 932 127.15
Automobile Care Center 942 17.80
New Car Sales 841 32.30
Automobile Parts Sales 843 61.91
Tire Store 848 24.87
Supermarket 850 102.24
Discount Supermarket 854 90.86
Wholesale Market 860 6.73
Discount Club 857 41.80
Home Improvement Store 862 30.74
Electronics Superstore 863 45.04
Apparel Store 876 66.40
Drugstore without Drive-Thru 880 90.06
Furniture Store 890 5.06
Drive-in Bank 912 148.15
Average Commercial 54.35
Description / ITE Code
ADT per
1,000 sq ft of Building
Movie Theater without matinee 443 78.06
Recreational Community Center 495 33.82
Library 590 56.24
Average Cultural 56.04

Description / ITE Code
ADT per
1,000 sq ft of Building
General Office 710 11.03
Corporate Headquarters 714 7.98
Single Tenant Office Bldg 715 11.65
Medical Dental Office 720 36.13
Average Office 16.70
Description / ITE Code
ADT per
1,000 sq ft of Building
Elementary School 520 15.43
Middle/ JR. High School 522 13.78
High School 530 12.89
Junior/ Comm. College 540 27.49
Average Educational 17.40
Description / ITE Code
ADT per
1,000 sq ft of Building
Church 560 9.11
Synagogue 561 10.64
Average Philanthropic/Religious/Charitable 9.88
Description / ITE Code
ADT per
Dwelling Unit
Apartment 220 6.65
High Rise Apartment 222 4.20
Residential Condo/Townhouse 230 5.81
High Rise Residential Condo 232 4.18
Average Residential 5.21
BART Station
The daily pedestrian traffic assigned to the Civic Center BART Station was estimated using the 2018 Monthly
Ridership Reports accessed via www.bart.gov. The entrances and exits from the Civic Center Station were
summed for each month, the monthly totals were divided by 30, and the results were averaged.