city union bank ltd. - hdfcsec.com - pick of the week... · of fy17 deposits and borrowings...
TRANSCRIPT


1 | P a g e
PICK OF THE WEEK
Dec 11, 2017
City Union Bank Ltd.
Recommendation
Buy at CMP and add on declines
Add on dips to
Rs. 161 - 163
Sequential Targets
Rs. 199 – 215
Time Horizon
3-4 Quarters
Industry
Banks
CMP
Rs. 179
FUNDAMENTAL ANALYST
Arpit Bhatt
HDFC Scrip Code CITUNIEQNR
BSE Code 532210
NSE Code CUB
Bloomberg CUBK IN
CMP 179
Equity Capital (Rs Cr) 66.3
Face Value (Rs) 1.0
Eq- Share O/S(Cr) 66.3
Market Cap (Rs Cr) 11876.2
Adj Book Val (FY17-Rs) 52.6
Avg.52 Wk Volume ~578150
52 Week High 186.7
52 Week Low 115.5
Shareholding Pattern % (Sept 30, 17)
Promoters 0.0
Institutions 49.8
Non Institutions 50.2
Total 100.0
CUB is a South India based mid sized bank with a legacy of over 100 years. Based out of Tamil Nadu, it has a network of 555 branches with 494 branches concentrated in southern India and 383 branches in Tamil Nadu alone. A professionally managed bank with no identifiable promoters, CUB mainly caters to the retail/wholesale traders with a granular asset profile. With a workforce of 4,920 employees (Average age <30 years), CUB caters majorly to the southern region of India and has maintained a dominant presence in this region. Investment Rationale:
Higher NIM and increased focus on high yield bearing MSME sector helps CUB generate good NIM;
Strong capital adequacy ratio instills confidence in loan book’s growth potential;
Good asset quality with minimal restructured accounts on books negates the risk of high provisioning;
Improving C/I (Cost to Income) ratio helps company maintain its return ratios;
Loan book growth could accelerate from hereon. Concerns
Regional concentration and unwillingness to move out of South in near term may act against company;
With high proportion of SME and Trader loans in the books, risk of stressed assets prevails in downturns;
Higher competition in the MSME lending to prevail;
View and Valuation City Union Bank, a prominent name in Southern India, is one of the fast growing mid-sized regional banks with good return ratios and strong asset quality. CUB has been earning good NIMs, close to ~4.5%, majorly on account of its major funding to MSME sector and benefit of lower Cost of funds. The NIM fall is inevitable but at the same is not expected to impact the profitability as CUB is expected to grow its loan book along with play of positive operational leverage and reducing C/I ratio. We believe management’s demonstrated ability to deliver RoAs of ~1.5%, even when asset quality stress is peaking, its focus on prudent and conservative growth in specified target segments and the availability of some operating leverage to enhance its return profile paves way for higher valuation levels. Moreover, the bank is sufficiently capitalised, with Tier-1 capital of 15.8% as of FY17, and dilution risk is minimal as management has indicated it will raise capital only when this breaches 14%. Although company is expected to witness some competition in its highest contributing sector, we do not expect it to materially dent its growth prospects.
All of these mean that CUB could witness growing loan books, healthy asset quality, minimal restructuring accounts, healthy NIM (although decreasing from current levels), restricted competition in lower ticket size and sufficient CAR to avoid dilution.
We feel investors could buy the stock at the CMP (2.30x FY12E P/ABV) and add on dips to Rs.161 – 163 (2.08x FY20E P/ABV) for sequential targets of Rs.199 (~2.55x FY20E P/ABV) and Rs.215 (~2.75x FY20E P/ABV) over the next 3-4 quarters.

2 | P a g e
PICK OF THE WEEK
Dec 11, 2017
City Union Bank Ltd.
Financial Summary Particulars (Rs mn) 2QFY18 2QFY17 YoY (%) 1QFY18 QoQ (%) FY17 FY18E FY19E FY20E Net Interest Income 3549.0 3012.0 17.8% 3424.0 3.6% 11988.0 13764.0 15747.0 18542.0 PPOP 3201.0 2367.0 35.2% 2970.0 7.8% 9937.0 11849.0 12704.0 14831.0 APAT 1448.0 1237.0 17.0% 1403.0 3.2% 5028.0 5953.0 6870.0 8203.0 EPS (Rs) 2.2 2.1 5.5% 2.3 -6.5% 8.4 9.0 10.4 12.4 RoAE (%) (ex revaluations) 15.2 15.5 15.4 15.8 RoAA (%) 1.5 1.6 1.6 1.6 Adj. BVPS (Rs) 52.6 55.9 65.8 77.9 P/ABV (x) 3.4 3.2 2.7 2.3 P/E (x) 21.4 19.9 17.2 14.4
Source: (Bank, HDFC sec)
Company Profile: City Union Bank Ltd, the oldest private sector bank in India, was founded on October 31, 1904 and is headquartered at Kumbakonam, Tamil Nadu, India. The main focus of the Bank – lending to MSME, Retail / Wholesale Trade with granular asset profile including providing short term and long term loans to agricultural sector.
CUB employs a total of 4920 employs at its 555 branches with about 494 of them located in Southern India. CUB operates 1569 ATMs and also has an online and android platform interface for its customers to deal.
Geographical Presence (through branches):
KEY HIGHLIGHTS
CUB is the oldest private sector bank in India with a history of more than 100 years.
CUB has a total of 555 branches and 1569 ATMs along with interface for android as well as online transaction for its customers.
Of the total loans lent, MSME and traders (high yield, granular loans) constitute 52%.
With its focus on MSME sector and an economic favourable environment for growing MSME sector, CUB’s loan book is expected to grow and yield better C/I ratio on account of positive operational leverage.
CUB has a healthy asset quality with negligible restructured accounts and a stringent credit appraisal criteria enabling higher asset quality.
3 | P a g e
PICK OF THE WEEK
Dec 11, 2017
City Union Bank Ltd.
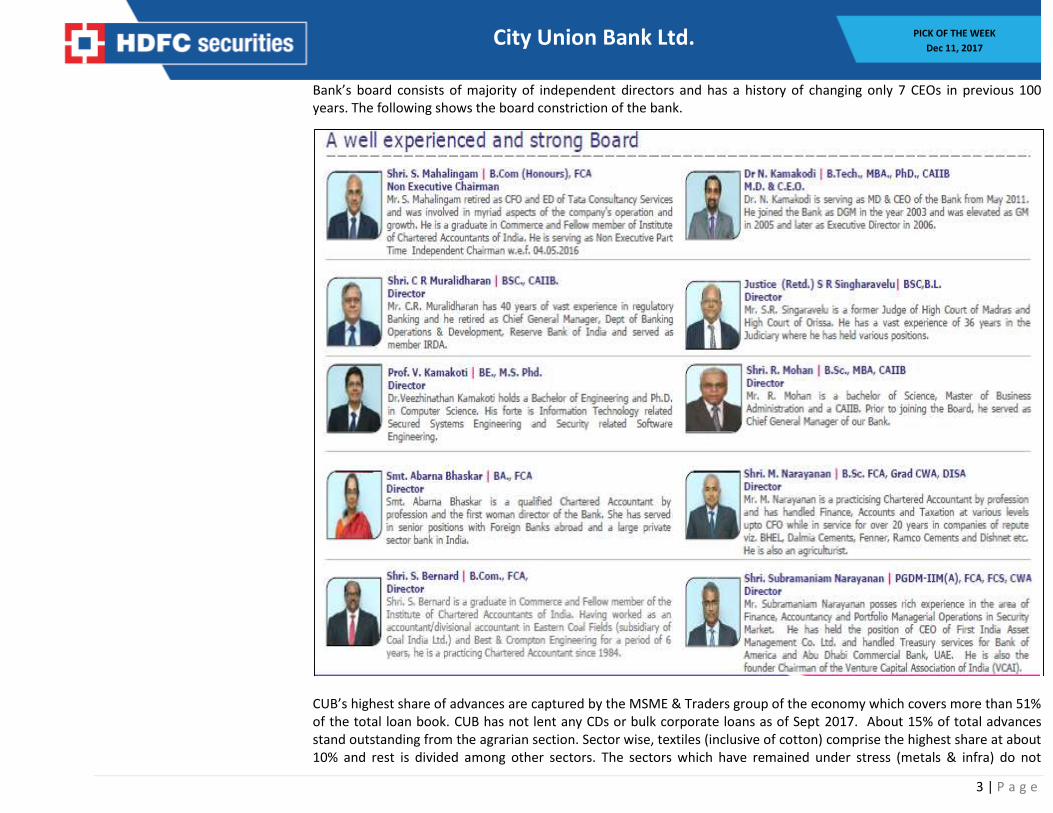
Bank’s board consists of majority of independent directors and has a history of changing only 7 CEOs in previous 100 years. The following shows the board constriction of the bank.
CUB’s highest share of advances are captured by the MSME & Traders group of the economy which covers more than 51% of the total loan book. CUB has not lent any CDs or bulk corporate loans as of Sept 2017. About 15% of total advances stand outstanding from the agrarian section. Sector wise, textiles (inclusive of cotton) comprise the highest share at about 10% and rest is divided among other sectors. The sectors which have remained under stress (metals & infra) do not

4 | P a g e
PICK OF THE WEEK
Dec 11, 2017
City Union Bank Ltd.
constitute a major proportion of the total loan book. Of the total loans, about 65% are cash credit and demand loans, 34% are term loans and remaining 1% is the bills discounted by the bank. Loan Mix: Sectorwise loan book – Q2FY18:
Source: (Bank, HDFC sec)
Investment Rationale: Higher NIMs and increased focus on high yield bearing MSME sector helps CUB generate good NIM: For the past few quarters now, CUB has been in a position to maintain a NIM in the range of 4-4.5% which is comparable to few of the well-established banks of the country. The major reason behind this high NIM level is the cushion provided by the dips in CoF and rise in the CD (Credit Deposit) ratio. The CoF is declining despite a fall in the CASA deposits for the Bank. Also, company has focused on the high yield SME/trader segment which has helped it up its interest income despite falling system rates and rising proportion of MCLR linked book. As mentioned earlier CUB’s CoF has been the major positive for it with CUB’s FY17 Cost of Funds standing at 5.9% compared with 6.5-7% for key peers. This can be attributed to bank’s lower dependence on borrowings which were 1.7% of FY17 Deposits and Borrowings compared with 3.1-19% for key peers, reduced reliance on Bulk Deposits which are 5% of total deposits compared with 15-23% for key peers & prudent reluctance to participate in Saving Account interest rate competition keeping its rate at 4% compared with key peers at 4-7.1%. This has helped company maintain its NIM levels elevated. Also, approximately 95% of the loan book is on a floating rate basis and re-pricing is possible at short intervals thus reducing interest rate risk and increasing the possibility of sustained high NIM in future. The management believes that further pressure on yields and a bottoming out of CoF will push NIMs downward to a sustainable level of 3.6-3.8%. However, we believe that with the focus on the high-yield SME/trader segment, customer retention and >90% of the book being linked to MCLR, NIMs will remain high. On the contrary, we believe our NIM assumption of ~3.9% over FY18-20E actually faces upside risks.

5 | P a g e
PICK OF THE WEEK
Dec 11, 2017
City Union Bank Ltd.
NIM Position:
Source: (Bank, HDFC sec)
Strong capital adequacy ratio instils confidence in CUB’s loan book growth potential: Capital position continues to remain strong with CAR at 15.3% / tier-I CAR at 14.9% and will supplement balance sheet growth. This is to help bank grow its borrowing and lending activity without dilution for at least 2-3 years. This indicates a good growth phase for the bank in the coming fiscals.
Good asset quality with minimal restructured accounts on books negates the risk of high provisioning: Despite the absence of a strong retail franchise (retail loans comprise 12.5% of the overall loan book), CUB has kept its asset quality in control, with GNPA of 3% and NNPA of 1.8% as of Q2FY18. Restructured loans have shrunk from 1.5% in FY15 to 0.06% in Q2FY18. CUB has begun reducing its exposure to risky segments over the past 3 years as the corporate NPA cycle and stress in the gems & jewellery sector cropped up. It has consistently reduced the proportion of corporate loans (7% of loan book currently vs. 14% in FY13) and jewellery loans (9% of loan book currently vs. 22% in FY13). Also, unsecured loans now form only 1% of its loan book.
The dip in NPA was attributed to a sharp reduction in the restructured book as a chunky account (~Rs 740mn) slipped into NPA and one major exposure was upgraded (Rs 421mn) owing to satisfactory performance. With no incremental restructuring during the quarter, the restructured book stood at a mere 0.06% of loans. Despite the relapse of ~Rs 740mn, slippages were stable QoQ at Rs 1.47bn (i.e. 2.38% vs. 2.45% ann). The bank had exposure to only 1 a/c in the 2nd NCLT list, which was classified as a NPA 3-4 years back.
CUB has displayed the foresight to pull back prior to key crises viz. global tech slowdown, the Great Recession and China slowdown, earmarking CUB as the bank stock to own over the long term cycle. The growth rate differential for advances steadily contracted from FY1996 to FY2000, turned significantly negative in FY2006 and then, again in FY2014. We note that these prudent relative growth pullbacks on the part of CUB happened prior to key financial crises. In each of these cases, CUB has shown good foresightedness and slowed down lending to levels even lower than the system. This sense of counter-cyclicality and general risk management prudence displayed by CUB is noteworthy.
6 | P a g e
PICK OF THE WEEK
Dec 11, 2017
City Union Bank Ltd.
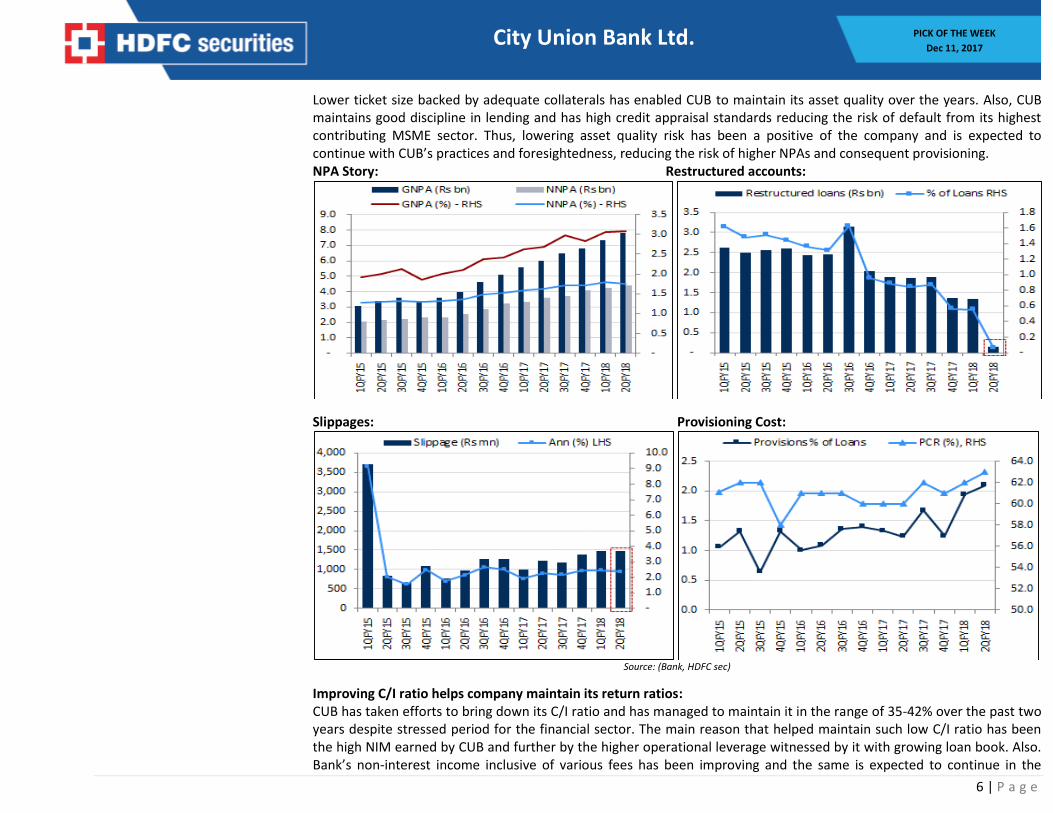
Lower ticket size backed by adequate collaterals has enabled CUB to maintain its asset quality over the years. Also, CUB maintains good discipline in lending and has high credit appraisal standards reducing the risk of default from its highest contributing MSME sector. Thus, lowering asset quality risk has been a positive of the company and is expected to continue with CUB’s practices and foresightedness, reducing the risk of higher NPAs and consequent provisioning. NPA Story: Restructured accounts:
Slippages: Provisioning Cost:
Source: (Bank, HDFC sec)
Improving C/I ratio helps company maintain its return ratios: CUB has taken efforts to bring down its C/I ratio and has managed to maintain it in the range of 35-42% over the past two years despite stressed period for the financial sector. The main reason that helped maintain such low C/I ratio has been the high NIM earned by CUB and further by the higher operational leverage witnessed by it with growing loan book. Also. Bank’s non-interest income inclusive of various fees has been improving and the same is expected to continue in the
7 | P a g e
PICK OF THE WEEK
Dec 11, 2017
City Union Bank Ltd.
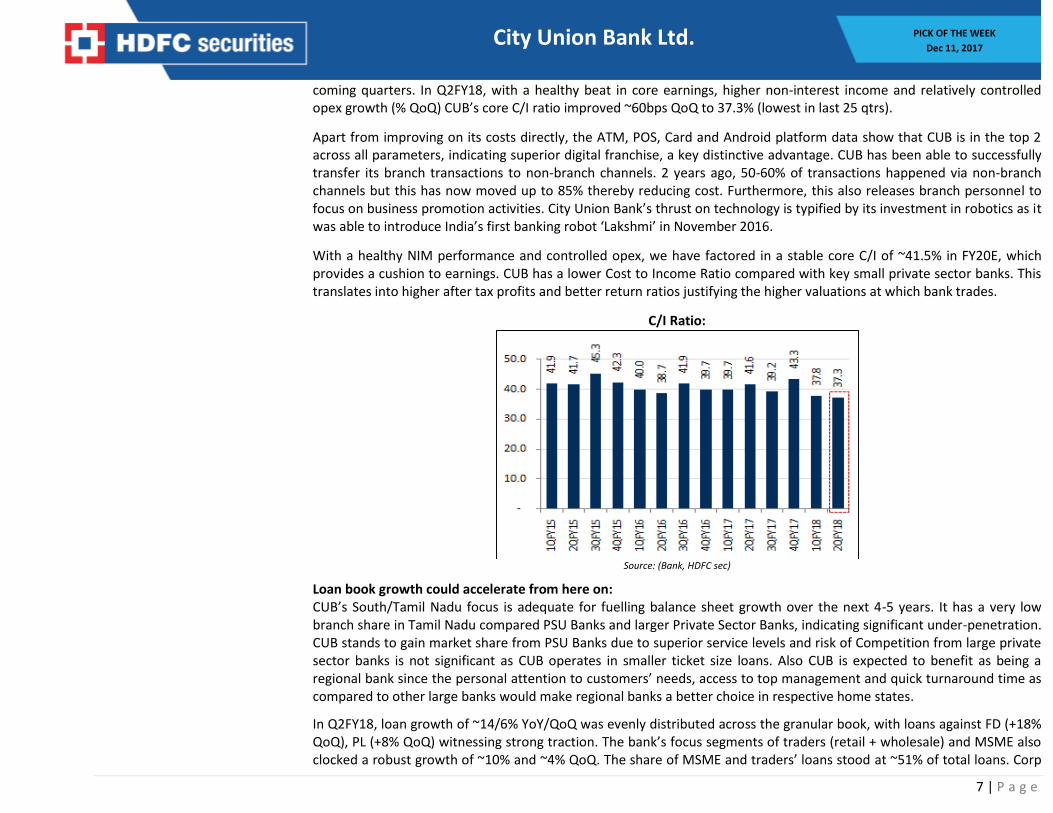
coming quarters. In Q2FY18, with a healthy beat in core earnings, higher non-interest income and relatively controlled opex growth (% QoQ) CUB’s core C/I ratio improved ~60bps QoQ to 37.3% (lowest in last 25 qtrs).
Apart from improving on its costs directly, the ATM, POS, Card and Android platform data show that CUB is in the top 2 across all parameters, indicating superior digital franchise, a key distinctive advantage. CUB has been able to successfully transfer its branch transactions to non-branch channels. 2 years ago, 50-60% of transactions happened via non-branch channels but this has now moved up to 85% thereby reducing cost. Furthermore, this also releases branch personnel to focus on business promotion activities. City Union Bank’s thrust on technology is typified by its investment in robotics as it was able to introduce India’s first banking robot ‘Lakshmi’ in November 2016.
With a healthy NIM performance and controlled opex, we have factored in a stable core C/I of ~41.5% in FY20E, which provides a cushion to earnings. CUB has a lower Cost to Income Ratio compared with key small private sector banks. This translates into higher after tax profits and better return ratios justifying the higher valuations at which bank trades.
C/I Ratio:
Source: (Bank, HDFC sec)
Loan book growth could accelerate from here on: CUB’s South/Tamil Nadu focus is adequate for fuelling balance sheet growth over the next 4-5 years. It has a very low branch share in Tamil Nadu compared PSU Banks and larger Private Sector Banks, indicating significant under-penetration. CUB stands to gain market share from PSU Banks due to superior service levels and risk of Competition from large private sector banks is not significant as CUB operates in smaller ticket size loans. Also CUB is expected to benefit as being a regional bank since the personal attention to customers’ needs, access to top management and quick turnaround time as compared to other large banks would make regional banks a better choice in respective home states.
In Q2FY18, loan growth of ~14/6% YoY/QoQ was evenly distributed across the granular book, with loans against FD (+18% QoQ), PL (+8% QoQ) witnessing strong traction. The bank’s focus segments of traders (retail + wholesale) and MSME also clocked a robust growth of ~10% and ~4% QoQ. The share of MSME and traders’ loans stood at ~51% of total loans. Corp

8 | P a g e
PICK OF THE WEEK
Dec 11, 2017
City Union Bank Ltd.
growth remained subdued (~2% QoQ) as the management is consciously reducing concentration risk. CUB’s loan portfolio has no single exposure above Rs 750mn.
Management has maintained its growth guidance of 15-18% for FY18. We believe an upturn in the economic environment will be conducive for growth, and our loan CAGR of 19% over FY18-20E may be exceeded.
Loan Book: Deposits:
(Source: Bank, HDFC sec)

9 | P a g e
PICK OF THE WEEK
Dec 11, 2017
City Union Bank Ltd.
Concerns: Regional concentration may dent profitability in event of unforeseen circumstances: With major presence for CUB being in Tamil Nadu and two other southern states along with reluctance to move out of the above named states may bring down the profitability in event of unforeseen climatic or economic circumstances affecting these states. Competition for the MSME opportunity: Increasing the share of MSME loans on the balance sheet for any bank means increasing the share of collateralized lower non-bulk high yield bearing assets. This is an attractive proposition for any bank and may attract larger private sector banks and also the PSU banks (post recap programme) and affect CUB’s growth prospects.
MSME exposure may turn bad: With high MSME exposure and in an event of economic downturn, company may end up with a large bundle of stressed assets and thus bring down its profitability.
View and Valuation City Union Bank, a prominent name in Southern India, is one of the fast growing mid-sized regional banks with good return ratios and strong asset quality. CUB has been earning good NIMs, close to ~4.5%, majorly on account of its major funding to MSME sector and benefit of lower Cost of funds. The NIM fall is inevitable but at the same is not expected to impact the profitability as CUB is expected to grow its loan book along with play of positive operational leverage and reducing C/I ratio. We believe management’s demonstrated ability to deliver RoAs of ~1.5%, even when asset quality stress is peaking, its focus on prudent and conservative growth in specified target segments and the availability of some operating leverage to enhance its return profile paves way for higher valuation levels. Moreover, the bank is sufficiently capitalised, with Tier-1 capital of 15.8% as of FY17, and dilution risk is minimal as management has indicated it will raise capital only when this breaches 14%. Although company is expected to witness some competition in its highest contributing sector, we do not expect it to materially dent its growth prospects. All of these mean that CUB could witness growing loan books, healthy asset quality, minimal restructuring accounts, healthy NIM (although decreasing from current levels), restricted competition in lower ticket size and sufficient CAR to avoid dilution. We feel investors could buy the stock at the CMP (2.30x FY12E P/ABV) and add on dips to Rs.161 – 163 (2.08x FY20E P/ABV) for sequential targets of Rs.199 (~2.55x FY20E P/ABV) and Rs.215 (~2.75x FY20E P/ABV) over the next 3-4 quarters.
10 | P a g e
PICK OF THE WEEK
Dec 11, 2017
City Union Bank Ltd.
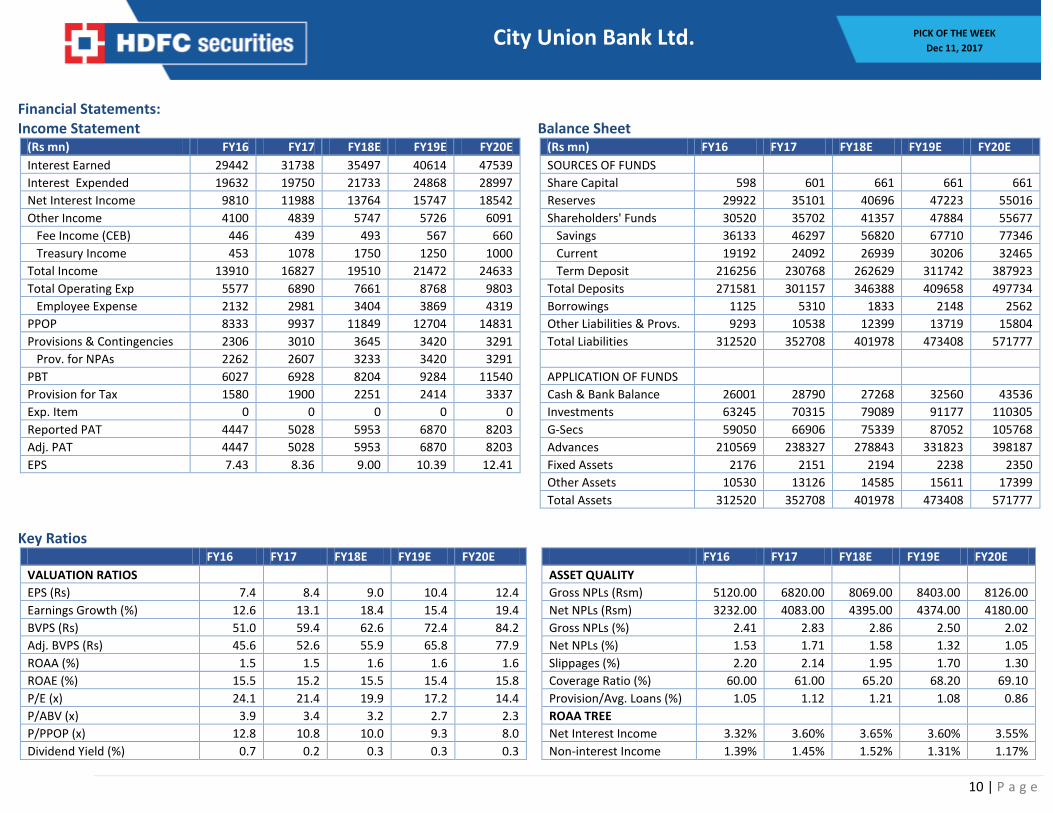
Financial Statements: Income Statement Balance Sheet
(Rs mn) FY16 FY17 FY18E FY19E FY20E
(Rs mn) FY16 FY17 FY18E FY19E FY20E
Interest Earned 29442 31738 35497 40614 47539
SOURCES OF FUNDS
Interest Expended 19632 19750 21733 24868 28997
Share Capital 598 601 661 661 661
Net Interest Income 9810 11988 13764 15747 18542
Reserves 29922 35101 40696 47223 55016
Other Income 4100 4839 5747 5726 6091
Shareholders' Funds 30520 35702 41357 47884 55677
Fee Income (CEB) 446 439 493 567 660
Savings 36133 46297 56820 67710 77346
Treasury Income 453 1078 1750 1250 1000
Current 19192 24092 26939 30206 32465
Total Income 13910 16827 19510 21472 24633
Term Deposit 216256 230768 262629 311742 387923
Total Operating Exp 5577 6890 7661 8768 9803
Total Deposits 271581 301157 346388 409658 497734
Employee Expense 2132 2981 3404 3869 4319
Borrowings 1125 5310 1833 2148 2562
PPOP 8333 9937 11849 12704 14831
Other Liabilities & Provs. 9293 10538 12399 13719 15804
Provisions & Contingencies 2306 3010 3645 3420 3291
Total Liabilities 312520 352708 401978 473408 571777
Prov. for NPAs 2262 2607 3233 3420 3291
PBT 6027 6928 8204 9284 11540
APPLICATION OF FUNDS
Provision for Tax 1580 1900 2251 2414 3337
Cash & Bank Balance 26001 28790 27268 32560 43536
Exp. Item 0 0 0 0 0
Investments 63245 70315 79089 91177 110305
Reported PAT 4447 5028 5953 6870 8203
G-Secs 59050 66906 75339 87052 105768
Adj. PAT 4447 5028 5953 6870 8203
Advances 210569 238327 278843 331823 398187
EPS 7.43 8.36 9.00 10.39 12.41
Fixed Assets 2176 2151 2194 2238 2350
Other Assets 10530 13126 14585 15611 17399
Total Assets 312520 352708 401978 473408 571777
Key Ratios
FY16 FY17 FY18E FY19E FY20E
FY16 FY17 FY18E FY19E FY20E
VALUATION RATIOS
ASSET QUALITY
EPS (Rs) 7.4 8.4 9.0 10.4 12.4
Gross NPLs (Rsm) 5120.00 6820.00 8069.00 8403.00 8126.00
Earnings Growth (%) 12.6 13.1 18.4 15.4 19.4
Net NPLs (Rsm) 3232.00 4083.00 4395.00 4374.00 4180.00
BVPS (Rs) 51.0 59.4 62.6 72.4 84.2
Gross NPLs (%) 2.41 2.83 2.86 2.50 2.02
Adj. BVPS (Rs) 45.6 52.6 55.9 65.8 77.9
Net NPLs (%) 1.53 1.71 1.58 1.32 1.05
ROAA (%) 1.5 1.5 1.6 1.6 1.6
Slippages (%) 2.20 2.14 1.95 1.70 1.30
ROAE (%) 15.5 15.2 15.5 15.4 15.8
Coverage Ratio (%) 60.00 61.00 65.20 68.20 69.10
P/E (x) 24.1 21.4 19.9 17.2 14.4
Provision/Avg. Loans (%) 1.05 1.12 1.21 1.08 0.86
P/ABV (x) 3.9 3.4 3.2 2.7 2.3
ROAA TREE
P/PPOP (x) 12.8 10.8 10.0 9.3 8.0
Net Interest Income 3.32% 3.60% 3.65% 3.60% 3.55%
Dividend Yield (%) 0.7 0.2 0.3 0.3 0.3
Non-interest Income 1.39% 1.45% 1.52% 1.31% 1.17%

11 | P a g e
PICK OF THE WEEK
Dec 11, 2017
City Union Bank Ltd.
PROFITABILITY
Treasury Income 0.15% 0.32% 0.46% 0.29% 0.19%
Yield On Advances (%) 12.13 11.54 11.24 10.98 10.76
Operating Cost 1.89% 2.07% 2.03% 2.00% 1.88%
Yield On Investment (%) 8.87 8.06 7.90 7.70 7.60
Provisions 0.78% 0.90% 0.97% 0.78% 0.63%
Cost Of Funds (%) 7.62 6.82 6.64 6.54 6.36
Provisions For NPAs 0.69% 0.76% 0.83% 0.75% 0.60%
Cost of Deposits (%) 7.51 6.78 6.60 6.51 6.35
Tax 0.53% 0.57% 0.60% 0.55% 0.64%
Core Spread (%) 4.51 4.72 4.60 4.43 4.41
ROAA 1.50% 1.51% 1.58% 1.57% 1.57%
NIM (%) 3.65 3.94 3.95 3.86 3.81
Leverage (x) 10.30 10.00 9.80 9.80 10.10
OPERATING EFFICIENCY
ROAE 15.5% 15.2% 15.5% 15.4% 15.8%
Cost/Avg. Asset Ratio (%) 1.9 2.1 2.0 2.0 1.9 Cost-Inc Ratio (Excl Treas.) 41.4 43.7 43.1 43.4 41.5 BALANCE SHEET Loan Growth (%) 17.2 13.2 17.0 19.0 20.0 Deposit Growth (%) 12.8 10.9 15.0 18.3 21.5 C/D Ratio (%) 77.5 79.1 80.5 81.0 80.0 Equity/Assets (%) 9.8 10.1 10.3 10.1 9.7 Equity/Advances (%) 14.5 15.0 14.8 14.4 14.0 CASA (%) 20.4 23.4 24.2 23.9 22.1 Cap Adequacy Ratio (CAR, %) 15.6 15.8 15.8 15.3 14.5 W/w Tier I CAR (%) 15.1 15.4 15.4 14.9 14.2
1 Year Daily Closing Price Chart:
(Source: BSE Website)

12 | P a g e
PICK OF THE WEEK
Dec 11, 2017
City Union Bank Ltd.
Fundamental Research Analyst: Arpit Bhatt ([email protected]) HDFC securities Limited, I Think Techno Campus, Building - B, "Alpha", Office Floor 8, Near Kanjurmarg Station, Opp. Crompton Greaves, Kanjurmarg (East), Mumbai 400 042 Phone: (022) 3075 3400 Fax: (022) 2496 5066 Website: www.hdfcsec.com Email: [email protected].
Compliance Officer: Binkle R. Oza Email: [email protected] Phone: (022) 3045 3600 __________________________________________________________________________________________________________________________________________________________________________________________ Disclosure: I, (Arpit Bhatt, CA), authors and the names subscribed to this report, hereby certify that all of the views expressed in this research report accurately reflect our views about the subject issuer(s) or securities. HSL has no material adverse disciplinary history as on the date of publication of this report. We also certify that no part of our compensation was, is, or will be directly or indirectly related to the specific recommendation(s) or view(s) in this report. Research Analyst or his/her relative or HDFC Securities Ltd. does not have any financial interest in the subject company. Also Research Analyst or his relative or HDFC Securities Ltd. or its Associate does not have beneficial ownership of 1% or more in the subject company at the end of the month immediately preceding the date of publication of the Research Report. Further Research Analyst or his relative or HDFC Securities Ltd. or its associate does not have any material conflict of interest. Any holding in stock – No HDFC Securities Limited (HSL) is a SEBI Registered Research Analyst having registration no. INH000002475. Disclaimer: This report has been prepared by HDFC Securities Ltd and is meant for sole use by the recipient and not for circulation. The information and opinions contained herein have been compiled or arrived at, based upon information obtained in good faith from sources believed to be reliable. Such information has not been independently verified and no guaranty, representation of warranty, express or implied, is made as to its accuracy, completeness or correctness. All such information and opinions are subject to change without notice. This document is for information purposes only. Descriptions of any company or companies or their securities mentioned herein are not intended to be complete and this document is not, and should not be construed as an offer or solicitation of an offer, to buy or sell any securities or other financial instruments. This report is not directed to, or intended for display, downloading, printing, reproducing or for distribution to or use by, any person or entity who is a citizen or resident or located in any locality, state, country or other jurisdiction where such distribution, publication, reproduction, availability or use would be contrary to law or regulation or what would subject HSL or its affiliates to any registration or licensing requirement within such jurisdiction. If this report is inadvertently send or has reached any individual in such country, especially, USA, the same may be ignored and brought to the attention of the sender. This document may not be reproduced, distributed or published for any purposes without prior written approval of HSL. Foreign currencies denominated securities, wherever mentioned, are subject to exchange rate fluctuations, which could have an adverse effect on their value or price, or the income derived from them. In addition, investors in securities such as ADRs, the values of which are influenced by foreign currencies effectively assume currency risk. It should not be considered to be taken as an offer to sell or a solicitation to buy any security. HSL may from time to time solicit from, or perform broking, or other services for, any company mentioned in this mail and/or its attachments. HSL and its affiliated company(ies), their directors and employees may; (a) from time to time, have a long or short position in, and buy or sell the securities of the company(ies) mentioned herein or (b) be engaged in any other transaction involving such securities and earn brokerage or other compensation or act as a market maker in the financial instruments of the company(ies) discussed herein or act as an advisor or lender/borrower to such company(ies) or may have any other potential conflict of interests with respect to any recommendation and other related information and opinions. HSL, its directors, analysts or employees do not take any responsibility, financial or otherwise, of the losses or the damages sustained due to the investments made or any action taken on basis of this report, including but not restricted to, fluctuation in the prices of shares and bonds, changes in the currency rates, diminution in the NAVs, reduction in the dividend or income, etc. HSL and other group companies, its directors, associates, employees may have various positions in any of the stocks, securities and financial instruments dealt in the report, or may make sell or purchase or other deals in these securities from time to time or may deal in other securities of the companies / organizations described in this report.
HSL or its associates might have managed or co-managed public offering of securities for the subject company or might have been mandated by the subject company for any other assignment in the past twelve months. HSL or its associates might have received any compensation from the companies mentioned in the report during the period preceding twelve months from t date of this report for services in respect of managing or co-managing public offerings, corporate finance, investment banking or merchant banking, brokerage services or other advisory service in a merger or specific transaction in the normal course of business. HSL or its analysts did not receive any compensation or other benefits from the companies mentioned in the report or third party in connection with preparation of the research report. Accordingly, neither HSL nor Research Analysts have any material conflict of interest at the time of publication of this report. Compensation of our Research Analysts is not based on any specific merchant banking, investment banking or brokerage service transactions. HSL may have issued other reports that are inconsistent with and reach different conclusion from the information presented in this report. Research entity has not been engaged in market making activity for the subject company. Research analyst has not served as an officer, director or employee of the subject company. We have not received any compensation/benefits from the subject company or third party in connection with the Research Report.
This report is intended for non-Institutional Clients only. The views and opinions expressed in this report may at times be contrary to or not in consonance with those of Institutional Research or PCG Research teams of HDFC Securities Ltd. and/or may have different time horizons
HDFC Securities Limited, SEBI Reg. No.: NSE-INB/F/E 231109431, BSE-INB/F 011109437, AMFI Reg. No. ARN: 13549, PFRDA Reg. No. POP: 04102015, IRDA Corporate Agent License No.: HDF 2806925/HDF C000222657, SEBI Research Analyst Reg. No.: INH000002475, CIN - U67120MH2000PLC152193