city skyline, new york, usa for professional clients only japanese lessons: global macro and market...
TRANSCRIPT

For professional clients only
Japanese lessons: global macro and market outlook
Date: October 2012Prepared by: Philip Poole

INTERNAL (amend as appropriate)
Tripping up in Tokyo – will others fall?

Insert job number here
3
-3
-2
-1
0
1
2
3
4
5
6
7
82 84 86 88 90 92 94 96 98 00 02 04 06 08 10
(%)
Inflation (y oy ) Policy rates
Japan’s malaise – route map for the wider developed world?
Source: Bloomberg, as at August 2012
Japan’s economic miracle came to a shuddering halt at the end of the ‘80s
An indebtedness overhang, banking crisis and policy mistakes all played a part compounded by ageing
Since then growth has been absent Deflation has been a persistent threat
despite loose monetary policy Government debt has spiraled to 230%
of GDP Equity valuations collapsed and
nominal bond yields stayed very low There are key lessons in this
experience for the rest of DM Europe risks a similar ‘lost decade’
and China needs to heed the warnings

Insert job number here
4
Poor demographics will weigh on DM growth
Source: UN, as at September 2012
0
5
10
15
20
25
30
35
40
45
Japan-1980
Japan-2010
Japan-2020
China-1980
China-2010
China-2020
UK-1980
UK -2010
UK -2020
US -1980
US-2010
US-2020
Percentage aged 0-14 (% of total)
Percentage aged 65 or over (% of total)

Insert job number here
5
Ageing will also keep pressure on government finances
Ageing tends to curb growth depressing activity–sensitive government revenues
As populations age less people pay in and more people try to take out of the system (pensions, health care)
This combination will keep up pressure to reform public sector finances
Source: World Bank development indicators, as at July 2012
8
10
12
14
16
18
20
22
1980
1982
1984
1986
1988
1990
1992
1994
1996
1998
2000
2002
2004
2006
2008
Pub
lic s
ocia
l exp
endi
ture
% G
DP

Insert job number here
6
Lessons from Japan
Growth is likely to be in short supply in the developed world Developed world inflation likely to remain low with a deflationary overhang Compensating for low growth by stimulating investment can backfire badly Flooding the world with liquidity does not guarantee recovery Monetary policy should not be tightened prematurely but largely loses its
potency to stimulate where there is a balance sheet overhang Fix ‘zombie’ banks as quickly as possible or recovery will be further delayed Ageing necessitates pro-active reform of public sector finances or it will add to
fiscal problems Japan also needs to heed Europe’s mistakes - or else investors could lose
confidence and bond yields move sharply higher

Insert job number here
7
Fast forward – the current massive monetary stimulus has not revived DM growth…
Source: Federal reserve website, BOJ, BOE, ECB, as at July 2012
High unemployment and spare capacity reduce inflation risks
And with DM fiscal policy tightening, monetary policy will need to take the strain
This combination is likely to keep DM monetary policy very loose
Labour market developments will be key in determining action by central banks
Weak employment data persuaded the Fed to turn the liquidity tap back on with QE3 and an open ended commitment
Rates could be cut further in Europe But the reality is that DM monetary policy
has lost much of its potency The transmission mechanism through to
the real economy is broken
0
1
2
3
4
5
6
7
8
9
05/0
6
09/0
6
01/0
7
05/0
7
09/0
7
01/0
8
05/0
8
09/0
8
01/0
9
05/0
9
09/0
9
01/1
0
05/1
0
09/1
0
01/1
1
05/1
1
09/1
1
01/1
2
05/1
2
Siz
e o
f ce
ntr
al b
anks
' bal
ance
sh
eet
(U
SD
tiil
lion
at
curr
ent
exch
ang
e ra
te)
BOE
BOJ
ECB
FED

Insert job number here
8
…or significantly dented high unemployment
Source: Bloomberg, date as at September 2012
3
4
5
6
7
8
9
10
11
Mar-04
Sep-04
Mar-05
Sep-05
Mar-06
Sep-06
Mar-07
Sep-07
Mar-08
Sep-08
Mar-09
Sep-09
Mar-10
Sep-10
Mar-11
Sep-11
Mar-12
US Japan Eurozone UK Asia

Insert job number here
9
The eurozone crisis is not over
Solving the eurozone’s problems will require a multi-year work out, whether or not it holds together
There are two key requirements: to clean up the existing mess and to convince markets that it won’t happen again
The debt swap for Greece was an important step forward As are efforts to recapitalise Spanish banks – the first time enough cash has been put
on the table to do the job Yields have to be brought down to sustainable levels for Italy and Spain if the crisis is
to abate The ECB’s new OMT programme should help to cap yields in the short-term... …but can only buy time not fix the problem A solution will necessitate implementation of credible fiscal adjustment plans To be successful it will also require macro stabilisation and concrete moves towards
fiscal union

Insert job number here
10
Eurozone macro deterioration is the additional concern
Growth is declining in most EZ countries and the unemployment trajectory is worrying
Source: Bloomberg, HSBC Global Asset Management, as at September 2012
2
4
6
8
10
12
14
16
18
20
22
24
01/00
01/01
01/02
01/03
01/04
01/05
01/06
01/07
01/08
01/09
01/10
01/11
01/12
Spain Greece France Italy
(%)
-8
-6
-4
-2
0
2
4
6
8
03/00
03/01
03/02
03/03
03/04
03/05
03/06
03/07
03/08
03/09
03/10
03/11
03/12
% y
oy
Germany France Italy Spain
GDP growth Unemployment rate

Insert job number here
11
What will drive EM growth if DM demand is structurally weak?

Insert job number here
12
Headline inflation has fallen in key emerging markets
Falling inflation supports looser EM policy but watch out for food prices
Source: Bloomberg, Data as of September 2012
0
10
20
30
40
50
60
Brazil
Mexico
South A
fica
China
India
Indonesia
Thailand
Russia
Food Energy/fuel related items
Source: OECD, HSBC Global Asset management, date as at September 2012
But EM is vulnerable to food price shocks
%%
-4
-2
0
2
4
6
8
10
12
14
16
Sep-06
Jan-07
May-07
Sep-07
Jan-08
May-08
Sep-08
Jan-09
May-09
Sep-09
Jan-10
May-10
Sep-10
Jan-11
May-11
Sep-11
Jan-12
May-12
China Brazil Russia India (WPI)

INTERNAL (amend as appropriate)
Global recovery. All over bar the shouting?

Insert job number here
14
70
72
74
76
78
80
82
01/1
0
03/1
0
05/1
0
07/1
0
09/1
0
11/1
0
01/1
1
03/1
1
05/1
1
07/1
1
09/1
1
11/1
1
01/1
2
03/1
2
05/1
2
07/1
2
-20
-15
-10
-5
0
5
10
01
/10
03
/10
05
/10
07
/10
09
/10
11
/10
01
/11
03
/11
05
/11
07
/11
09
/11
11
/11
01
/12
03
/12
05
/12
07
/12
-40
-30
-20
-10
0
10
20
30
01/1
0
03/1
0
05/1
0
07/1
0
09/1
0
11/1
0
01/1
1
03/1
1
05/1
1
07/1
1
09/1
1
11/1
1
01/1
2
03/1
2
05/1
2
07/1
2
-45
-40
-35
-30
-25
-20
-15
-10
-5
0
5
01/1
0
03/1
0
05/1
0
07/1
0
09/1
0
11/1
0
01/1
1
03/1
1
05/1
1
07/1
1
09/1
1
11/1
1
01/1
2
03/1
2
05/1
2
07/1
2
Global data has mostly disappointed
Source: HSBC Global Research, as at September 2012
US activity surprise index Eurozone activity surprise index
Japan activity surprise index China activity surprise index

Insert job number here
15
Manufacturing PMIs confirm loss of global growth momentum
Source: Bloomberg, date as at September 2012
30
35
40
45
50
55
60
65
Sep-06
Jan-07
May-07
Sep-07
Jan-08
May-08
Sep-08
Jan-09
May-09
Sep-09
Jan-10
May-10
Sep-10
Jan-11
May-11
Sep-11
Jan-12
May-12
China Eurozone US

Insert job number here
16
…and point to more contraction
> 50 + rising > 50 + falling or < 50 + falling < 50 + rising or > 50 + unchanged < 50 + unchanged
Data unavailable at time of release
Source: Markit, data for PMI’s as at Sept 2012. US data refers to ISM manufacturing

17
China’s economic activity has slowed...
Source: CEIC, HSBC Global Asset Management
25
30
35
40
45
50
55
60
65
Jan-07 Oct-07 Jul-08 Apr-09 Jan-10 Oct-10 Jul-11 Apr-12
0
5
10
15
20
25% yoy
Official PMI, lhsHSBC Manufacturing PMI, lhsIndustrial production, rhs
Manufacturing PMI vs. industrial production
42.1
20.9
-22.9
81.6
27.9
-2.4
-75
-50
-25
0
25
50
75
100
Jan-07 Oct-07 Jul-08 Apr-09 Jan-10 Oct-10 Jul-11 Apr-12
% yoy
-30
-20
-10
0
10
20
30
40% yoy
Total profit growth (Jan-May), lhsNo of loss-making enterprises, rhs
Industrial enterprises (financial data)
International trade
-40
-20
0
20
40
60
80
Jan-07 Oct-07 Jul-08 Apr-09 Jan-10 Oct-10 Jul-11 Apr-12
%; USDbn
Trade balance (USD bn; 3mma)Exports (yoy; 3mma)Imports (yoy; 3mma)
Real estate investment vs. construction
-40
-20
0
20
40
60
80
100
120
Jan-07 Oct-07 Jul-08 Apr-09 Jan-10 Oct-10 Jul-11 Apr-12
% YoY; 3mma
Real estate FAI
Floor space started (commodity building)
- External demand remains challenging and there appear to still be destocking pressure in the industrial sector - Economic slowdown has hurt enterprise profitability. Property construction/investment has also weakened

18
…but pro-growth policies support a soft-landing
Note: * MNI Business Sentiment Survey; ** PBOC 5000 Entrepreneur Survey diffusion index. Source: CEIC, HSBC Global Asset Management
China CPI & PPI inflation
-9-6-30369
1215182124
Jan-07 Oct-07 Jul-08 Apr-09 Jan-10 Oct-10 Jul-11 Apr-12
% yoy
Headline CPI Core CPIFood CPI PPI
- The PBOC cut interest rates twice within a month, on top of RRR cuts and window guidance to support loan growth . Lower inflation leaves more flexibility for further policy loosening. Growth will likely pick up modestly in 2H on further policy support and as effects of earlier easing continue to feed through
Inflation
-2
0
2
4
6
8
10
12
14
16
2002
2003
2004
2005
2006
2007
2008
2009
2010
2011
1Q
10
2Q
10
3Q
10
4Q
10
1Q
11
2Q
11
3Q
11
4Q
11
1Q
12
2Q
12
Jan-1
2F
eb-1
2M
ar-
12
Apr-
12
May-1
2Jun-1
2
CNY trn Bank loans entrust & trust loans
Bank acceptance bills Corporate bonds & equity
Equity financing Total
Total social financing
10
15
20
25
30
35
Jan-07 Oct-07 Jul-08 Apr-09 Jan-10 Oct-10 Jul-11 Apr-12
% yoy
M2 Loan Deposit
Monetary indicators
0
10
20
30
40
50
60
70
80
Jan-07 Oct-07 Jul-08 Apr-09 Jan-10 Oct-10 Jul-11 Apr-12
Lending attitude of banks**
Availability of credit* (current)
Availability of credit* (future)
Business surveys on bank credit availability
Improvement of credit availability

Insert job number here
19
-8.0
-7.0
-6.0
-5.0
-4.0
-3.0
-2.0
-1.0
0.0
2012 2013 2014 2015 2016 2017 2018 2019 2020 2021 2022
Proj
ecte
d fe
dera
l bud
get d
efic
it as
a p
erce
ntag
e of
GD
PFiscal cliff If current policies are extended
Slipping over the edge? The US fiscal cliff
There is an on-going political polarisation between Democrats and Republicans
Fiscal paralysis looks inevitable in the run up to elections and potentially beyond
Under these circumstances the approaching ‘fiscal cliff’ starting in Q1 2012 represents a challenge
On balance we expect a political accommodation to be reached that reduces fiscal drag from 4-5% of GDP to 1-2%
A deal could settle on rolling tax cuts and other allowances in exchange for raising the debt ceiling
Source: CBO, as at July 2012
Any forecast, projection or target where provided is indicative only and is not guaranteed in any way.

Insert job number here
20
US Germany
Japan China
Source: Consensus Economics, as at September 2012
2012 Real GDP growth forecasts (%) 2012 CPI forecasts (%)
Growth forecasts cut but still a little optimistic

INTERNAL (amend as appropriate)
Investment themes
Insert job number here
22
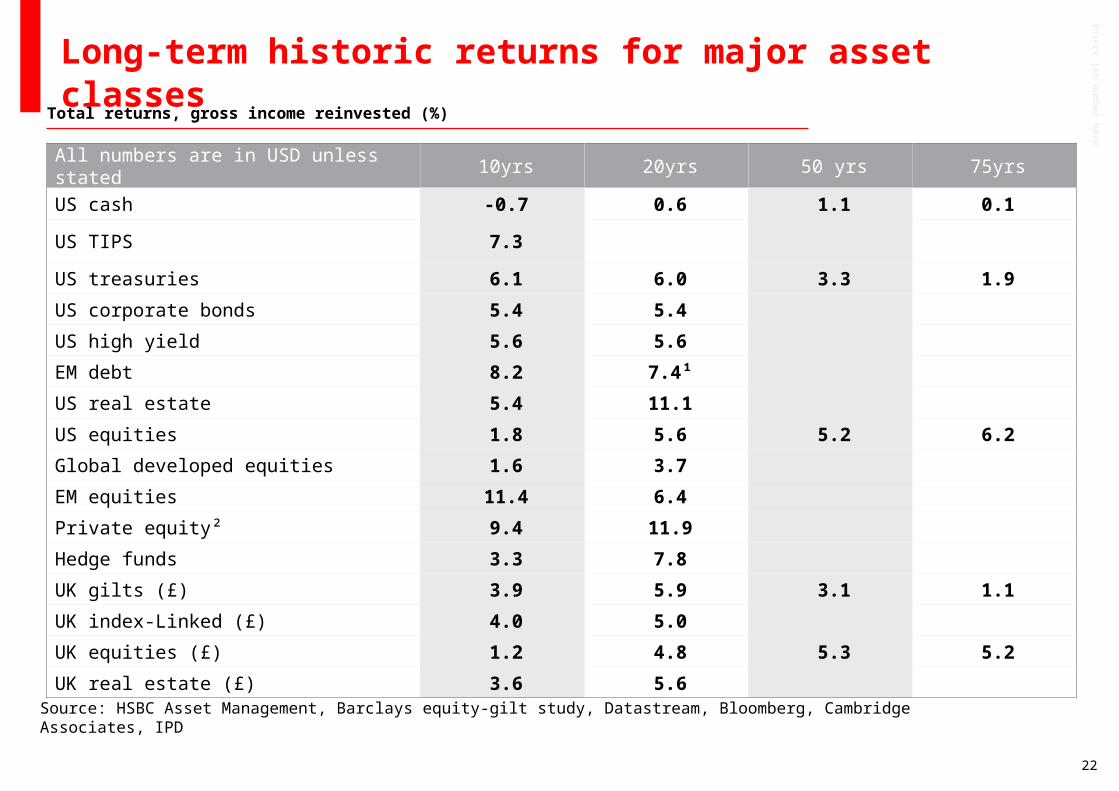
Long-term historic returns for major asset classes
Total returns, gross income reinvested (%)
All numbers are in USD unless stated 10yrs 20yrs 50 yrs 75yrs
US cash -0.7 0.6 1.1 0.1
US TIPS 7.3
US treasuries 6.1 6.0 3.3 1.9
US corporate bonds 5.4 5.4
US high yield 5.6 5.6
EM debt 8.2 7.4¹
US real estate 5.4 11.1
US equities 1.8 5.6 5.2 6.2
Global developed equities 1.6 3.7
EM equities 11.4 6.4
Private equity² 9.4 11.9
Hedge funds 3.3 7.8
UK gilts (£) 3.9 5.9 3.1 1.1
UK index-Linked (£) 4.0 5.0
UK equities (£) 1.2 4.8 5.3 5.2
UK real estate (£) 3.6 5.6
Source: HSBC Asset Management, Barclays equity-gilt study, Datastream, Bloomberg, Cambridge Associates, IPD

Insert job number here
23
Estimated prospective real returns for major asset classes
Source: HSBC, Cambridge Associates, Datastream
Real returns: pecking order of assets (% real return)
(0.5)
0.00.5
1.5
3.03.5 3.7 4.0
4.5
6.0
9.5
(2)
0
2
4
6
8
10
Cash GlobalILBs
Govtbonds
IG Credit EM debt(USD)
RealEstate
HY Credit EM debt(local)
GlobalEquity
EM Equity PE
Core beta-based return
Heterogeneous asset

Insert job number here
24
Look familiar? Japanese and US bond yields and inflation
-4
-2
0
2
4
6
8
10
12
14
16
1982
1984
1986
1988
1990
1992
1994
1996
1998
2000
2002
2004
2006
2008
2010
US CPI 10 year US bond yields
-3
-2
-1
0
1
2
3
4
5
6
1994
1995
1996
1997
1998
1999
2000
2001
2002
2003
2004
2005
2006
2007
2008
2009
2010
2011
Japan CPI 10 year Japanese bond yields
Source: Bloomberg, as at September 2012

Insert job number here
25
Negative US data surprises have helped drag down yields
Source: Bloomberg, HSBC Global Asset management, data as at August 2012
-50
-40
-30
-20
-10
0
10
20
30
40
Ma
r-01
Se
p-0
1
Ma
r-02
Se
p-0
2
Ma
r-03
Se
p-0
3
Ma
r-04
Se
p-0
4
Ma
r-05
Se
p-0
5
Ma
r-06
Se
p-0
6
Ma
r-07
Se
p-0
7
Ma
r-08
Se
p-0
8
Ma
r-09
Se
p-0
9
Ma
r-10
Se
p-1
0
Ma
r-11
Se
p-1
1
Ma
r-12
0
1
2
3
4
5
6
US Supr index (lhs) US 10 year yields (rhs)US surprise index (lhs) US 10 year yield (rhs)
Insert job number here
26
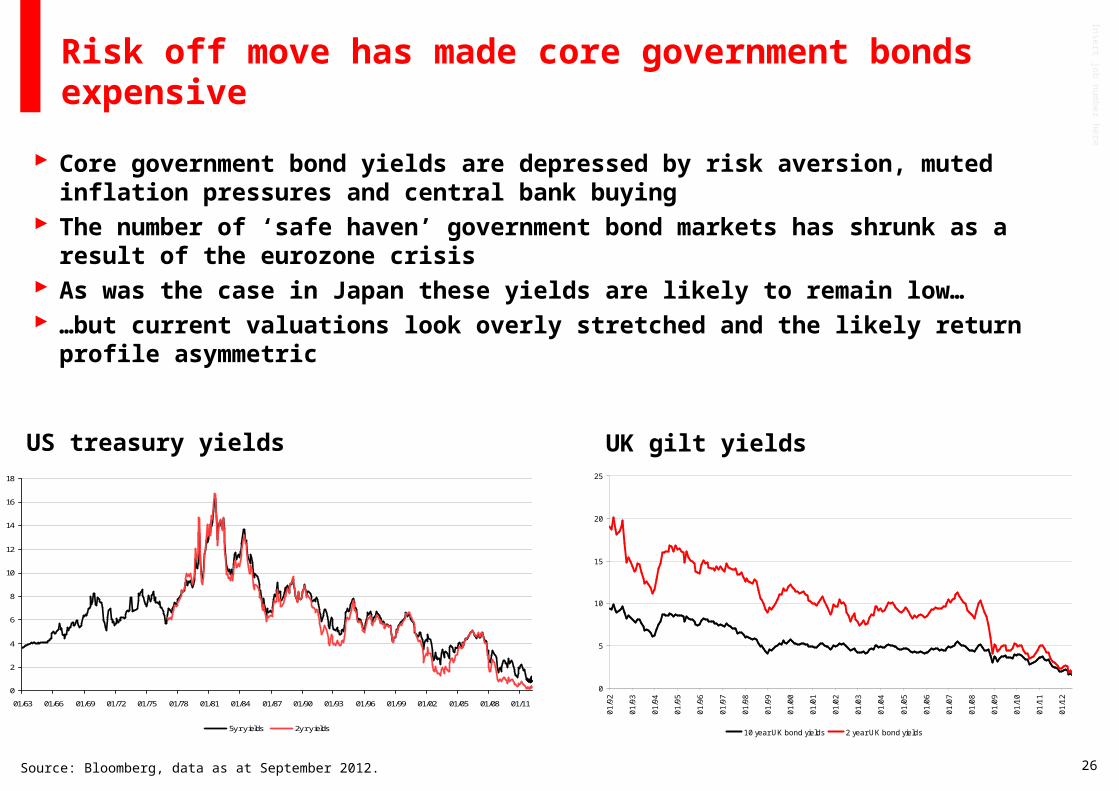
Risk off move has made core government bonds expensive
Core government bond yields are depressed by risk aversion, muted inflation pressures and central bank buying
The number of ‘safe haven’ government bond markets has shrunk as a result of the eurozone crisis
As was the case in Japan these yields are likely to remain low… …but current valuations look overly stretched and the likely return profile asymmetric
Source: Bloomberg, data as at September 2012.
0
2
4
6
8
10
12
14
16
18
01/63 01/66 01/69 01/72 01/75 01/78 01/81 01/84 01/87 01/90 01/93 01/96 01/99 01/02 01/05 01/08 01/11
5y r y ields 2y r y ields
0
5
10
15
20
25
01
/92
01
/93
01
/94
01
/95
01
/96
01
/97
01
/98
01
/99
01
/00
01
/01
01
/02
01
/03
01
/04
01
/05
01
/06
01
/07
01
/08
01
/09
01
/10
01
/11
01
/12
10 year UK bond yields 2 year UK bond yields
US treasury yields UK gilt yields

Insert job number here
27
Strong inflows into high yield and GEM bond space
Year-to-date flows into fixed income funds
Source: HSBC Global Research, EPFR, Data as at August 2012
High yield funds have attracted large inflows YTD exceeding USD37.5bn, equivalent to 18.3% of AuM
GEM bonds have also seen strong inflows of USD 17.5bn YTD (12.9% of AuM)
Within GEM, Latam has seen the strongest inflows YTD, equivalent to 13.1% of AuM
Asia has seen YTD inflows equivalent to 7.9% of AuM

Insert job number here
28
High yield corporate spread pick-up remains attractive
Wider corporate credit spreads reflects flight to quality and are not credit-specific
Although low growth will likely hit earnings, corporate fundamentals are generally supportive of credit markets
In particular, corporate balance sheets are mostly in good shape
This should help to shield corporates from the impact of bank de-leveraging
But investors need to look closely at individual credit fundamentals
Source: HSBC Global Asset Management and Bloomberg, data as at August 2012
0
2
4
6
8
10
12
14
16
18
08/0
0
02/0
1
08/0
1
02/0
2
08/0
2
02/0
3
08/0
3
02/0
4
08/0
4
02/0
5
08/0
5
02/0
6
08/0
6
02/0
7
08/0
7
02/0
8
08/0
8
02/0
9
08/0
9
02/1
0
08/1
0
02/1
1
08/1
1
02/1
2
0
2
4
6
8
10
12
BarCap HY Index ( lhs) Raio of Barcap HY over 5yr UST (%, rhs)

Insert job number here
29
Despite inflows, the relative spread over the underlying treasury yield remains wide
EM debt attractive given credit quality and low risk free rate
Source: JP Morgan and Bloomberg, data as at September 2012.
0
200
400
600
800
1000
1200
01/0
0
01/0
1
01/0
2
01/0
3
01/0
4
01/0
5
01/0
6
01/0
7
01/0
8
01/0
9
01/1
0
01/1
1
01/1
2
0
100
200
300
400
500
600
700
JP Morgan EMBI Global index spread (lhs)
Ratio of JPM EMBI spread over 5yr UST (5, rhs)

Insert job number here
30
0
2
4
6
8
10
12
14
16
09/8
2
09/8
4
09/8
6
09/8
8
09/9
0
09/9
2
09/9
4
09/9
6
09/9
8
09/0
0
09/0
2
09/0
4
09/0
6
09/0
8
09/1
0
S&P 500 earning yield 10 year bond yields
Equity yields attractive relative to government bond yields
US UK
Source: Bloomberg, September 2012
0
1
2
3
4
5
6
7
07/0
2
01/0
3
07/0
3
01/0
4
07/0
4
01/0
5
07/0
5
01/0
6
07/0
6
01/0
7
07/0
7
01/0
8
07/0
8
01/0
9
07/0
9
01/1
0
07/1
0
01/1
1
07/1
1
01/1
2
FTSE div yield 10 yields 10 year bond yields

Insert job number here
31
Equity markets - what’s cheap relative to history?
Source: OECD, HSBC Global Asset management, date as at September 2012
DM forward PE relative to own valuation history (5 yr average)
EM forward PE relative to own valuation history (5 yr average)
0.00
0.20
0.40
0.60
0.80
1.00
1.20
1.40
1.60
1.80
Russia
Chin
a
India
Asia
ex J
apan
Bra
zil
GE
Ms
Kore
a
Mala
ysia
Indonesia
Turk
ey
South
Afric
a
Thaila
nd
Mexic
o
0.00
0.20
0.40
0.60
0.80
1.00
1.20
Italy
Spain
Fra
nce
Germ
any
Unite
d K
ingdom
Europe x
UK
Japan
U.S
.A

Insert job number here
32
EM and DM sector valuations
Source: OECD, HSBC Global Asset management, date as at September 2012
Price to book relative to DM 5 yr average
Price to book relative to EM 5 yr average
0.00
0.20
0.40
0.60
0.80
1.00
1.20
1.40
Health C
are
Consum
er Staples
Consum
erD
iscretionary
Financials
Telecom
munication
Services
Utilities
Energy
Industrials
Materials
Information
Technology
0.00
0.20
0.40
0.60
0.80
1.00
1.20
1.40
Information
Technology
Consum
erD
iscretionary
Utilities
Consum
er Staples
Telecom
munication
Services
Industrials
Financials
Health C
are
Materials
Energy

Insert job number here
33
0
10
20
30
40
50
60
01/10
03/10
05/10
07/10
09/10
11/10
01/11
03/11
05/11
07/11
09/11
11/11
01/12
03/12
05/12
07/12
2012 2013
100
110
120
130
140
150
160
170
01/10
03/10
05/10
07/10
09/10
11/10
01/11
03/11
05/11
07/11
09/11
11/11
01/12
03/12
05/12
07/12
2012 2013
DM earnings expectations. Bad news now in the price?
Source: OECD, HSBC Global Asset management, date as at September 2012
80
85
90
95
100
105
110
115
03/10
05/10
07/10
09/10
11/10
01/11
03/11
05/11
07/11
09/11
11/11
01/12
03/12
05/12
07/12
2012 2013
154
159
164
169
174
179
184
189
194
199
204
03/10
05/10
07/10
09/10
11/10
01/11
03/11
05/11
07/11
09/11
11/11
01/12
03/12
05/12
07/12
2012 2013
US UK
Europe Japan
Inde
xed
earn
ings
Inde
xed
earn
ings
Inde
xed
earn
ings
Inde
xed
earn
ings

Insert job number here
34
80
100
120
140
160
180
200
220
01/1
0
03/1
0
05/1
0
07/1
0
09/1
0
11/1
0
01/1
1
03/1
1
05/1
1
07/1
1
09/1
1
11/1
1
01/1
2
03/1
2
05/1
2
07/1
2
2012 2013
EM earnings expectations. Bad news now in the price?
Source: OECD, HSBC Global Asset management, date as at September 2012
China India
Brazil Russia
4
4.5
5
5.5
6
6.5
7
01/1
0
03/1
0
05/1
0
07/1
0
09/1
0
11/1
0
01/1
1
03/1
1
05/1
1
07/1
1
09/1
1
11/1
1
01/1
2
03/1
2
05/1
2
07/1
2
2012 2013
40
45
50
55
60
65
01/10
03/10
05/10
07/10
09/10
11/10
01/11
03/11
05/11
07/11
09/11
11/11
01/12
03/12
05/12
07/12
2012 2013
15000000000
17000000000
19000000000
21000000000
23000000000
25000000000
27000000000
29000000000
31000000000
01/10
03/10
05/10
07/10
09/10
11/10
01/11
03/11
05/11
07/11
09/11
11/11
01/12
03/12
05/12
07/12
2012 2013
Inde
xed
earn
ings
Inde
xed
earn
ings
Inde
xed
earn
ings
In
dexe
d ea
rnin
gs

Insert job number here
35
Many EM currencies look undervalued relative to DM
Source: IMF World Economic Database, data as at September 2012 – PPP estimates for 2011. Any forecast, projection or target where provided is indicative only and is not guaranteed in any way.
% under / over valued versus USD on PPP PPP versus USD Spot
% under/over valued
CHF 1.66 0.92 80%JPY 106.8 78.4 36%AUD 1.58 1.31 21%EUR 0.83 0.77 8%BRL 1.81 2.01 -10%CLP 401.1 470.5 -15%RUB 22.8 30.7 -26%IDR 6603 9463 -30%TRL 1.22 1.79 -32%MXN 8.63 12.75 -32%HUF 143.9 215.5 -33%CNY 4.17 6.32 -34%PLN 1.97 3.12 -37%MYR 1.91 3.05 -37%PHP 25 41.6 -40%THB 17.5 30.8 -43%TWD 15.7 29.4 -47%INR 19.1 53.9 -65%
-80% -60% -40% -20% 0% 20% 40% 60% 80% 100%
INR
TWD
THB
PHP
MYR
PLN
CNY
HUF
MXN
TRL
IDR
RUB
CLP
BRL
EUR
AUD
JPY
CHF
Insert job number here
36
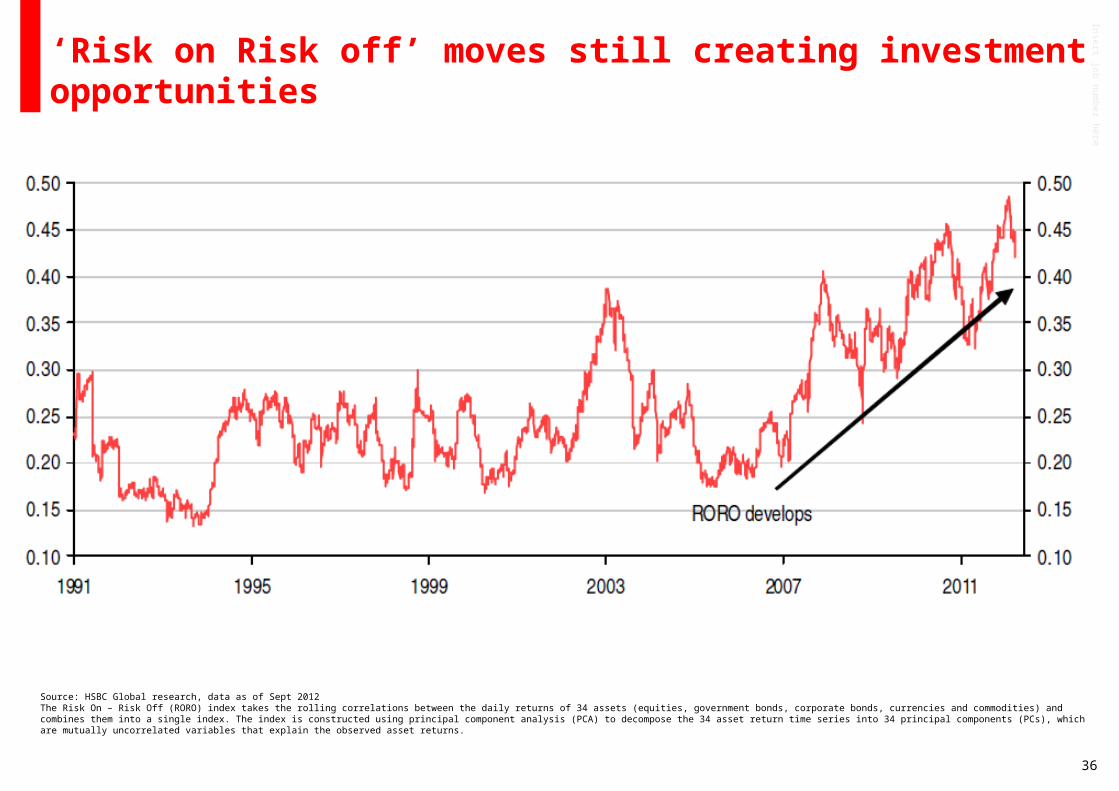
‘Risk on Risk off’ moves still creating investment opportunities
Source: HSBC Global research, data as of Sept 2012The Risk On – Risk Off (RORO) index takes the rolling correlations between the daily returns of 34 assets (equities, government bonds, corporate bonds, currencies and commodities) and combines them into a single index. The index is constructed using principal component analysis (PCA) to decompose the 34 asset return time series into 34 principal components (PCs), which are mutually uncorrelated variables that explain the observed asset returns.

Insert job number here
37
Macro drivers and long run investment themes
Bonds look expensive relative to
equities
Favour EM equity themes
Lock in HY corporate and EMD liquidity/risk
premia
Diversify currency exposure
Dividend yields look attractive relative to core govt bond yields
Upside to bonds capped by very low yields, downside more significant
Seek out attractively priced global stocks with exposure to emerging markets consumption and infrastructure spending themes
HY corporate and EMD credit fundamentals are generally strong
But spreads are still relatively wide
This remains an opportunity
Exposure to EM currencies to capture carry and appreciation
Undervalued EM currencies (CNY, INR KRW, MYR, SGD, MXP) vs. DM currencies
The burden of debt and ageing populations will likely keep DM growth below pre-crisis levels Inflation is unlikely to be a problem in DM over the immediate future Monetary policy to remain very loose (conventional and unconventional) but largely impotent Europe confronts a Japanese-style ‘lost decade’ and the US faces growth and fiscal challenges EM to grow less rapidly than in the past given headwinds but will continue to outperform DM

Insert job number here
38
Appendix 1: consensus global growth and inflation forecasts
Source: Consensus Economics, data as at August 2012.
Consensus revised lower than prior month Consensus revised higher than prior month
2009 2010 2011 2012 F 2013F 2009 2010 2011 2012 F 2013FNorth America -2.6 3.0 1.8 2.2 2.1 -0.2 1.6 3.1 2 2United States -3.5 3.0 1.8 2.2 2.1 -0.3 1.6 3.2 2.0 2.0Canada -2.8 3.2 2.3 2.0 2.1 0.3 1.8 2.9 1.9 2.0Western Europe -4.1 1.9 1.5 -0.2 0.5 0.6 1.8 2.7 2.1 1.8Euro zone -4.2 1.7 1.6 -0.5 0.3 0.3 1.6 2.7 2.3 1.7France -2.6 1.4 1.6 0.1 0.5 0.1 1.5 2.1 2.0 1.7Germany -5.1 3.7 3.0 0.9 1.2 0.4 1.1 2.3 1.9 1.8Italy -5.2 1.2 0.4 -2.1 -0.5 0.8 1.5 2.7 3.0 2.0Spain -3.7 -0.1 0.7 -1.7 -1.4 -0.3 1.8 3.1 2.0 1.9UK -4.9 1.4 0.9 -0.2 1.4 2.2 3.3 4.4 2.6 1.9Switzerland -1.9 2.7 1.7 1.2 1.3 -0.5 0.7 0.2 -0.6 0.6Sweden -5.3 5.4 4.4 0.9 1.9 -0.3 1.3 2.9 1.2 1.4Norway -1.6 2.1 2.6 3.2 2.8 2.2 2.4 1.3 0.9 1.6Eastern Europe -5.2 4.5 4.6 2.7 3.3 6.3 6.6 6.3 6.3 5.3Hungary -6.7 1.2 1.5 -0.9 0.9 4.2 4.9 3.9 5.5 3.9Poland 1.6 3.8 4.1 2.8 2.8 3.5 2.6 4.3 3.8 2.7Czech Republic -4.1 2.2 1.8 -0.7 1.1 1.0 1.4 1.9 3.3 2.4Russia -7.8 4.0 4.2 3.8 3.7 8.8 8.8 6.1 6.3 5.7Turkey -4.8 9.0 8.1 2.7 4.3 6.3 8.6 6.5 9.2 6.8South Africa -1.7 2.8 3.1 2.5 3.3 7.1 4.3 5.0 5.8 5.5Israel 0.8 4.8 4.5 2.8 3.5 3.3 2.7 3.5 2.5 2.4Asia Pacific 1.9 7.0 4.4 5.0 5.0 0.8 2.6 3.6 2.6 2.8Japan -6.3 4.0 -0.6 2.5 1.4 -1.3 -0.7 -0.2 0.1 0.0Australia 1.4 2.7 1.9 3.4 3.1 1.8 2.8 3.5 1.8 3.0New Zealand -2.0 1.7 1.9 2.4 2.8 2.1 2.3 4.2 1.6 2.4China 9.2 10.4 9.2 7.9 8.3 -0.7 3.3 5.4 2.8 3.4South Korea 0.3 6.2 3.6 2.7 3.5 2.8 3.0 4.2 2.4 2.9Hong-Kong -2.7 7.0 5.0 2.1 4.0 0.6 2.3 5.3 4.4 3.8India 8.0 8.5 7.2 6.1 7.1 12.4 10.4 8.2 8.0 7.6Singapore -0.8 14.5 5.0 2.5 4.1 0.6 2.8 5.1 4.4 3.1Taiwan -1.9 10.9 4.4 2.0 4.0 -0.9 1.0 1.4 1.8 1.9Thailand -2.3 7.8 1.6 5.1 4.5 -0.9 3.3 3.9 3.1 3.2Latin America -1.7 6.3 4.1 3.0 3.8 5.7 6.6 6.8 5.8 6.3Brazil -0.6 7.5 2.9 1.9 4.0 4.3 5.9 6.5 4.9 5.4Chile -1.7 5.2 6.2 4.6 4.6 -1.4 3.0 3.8 2.4 3.0Colombia 1.5 4.3 5.2 4.3 4.6 2 3.2 3.6 3.2 3.2Mexico -6.1 5.4 3.9 3.8 3.5 3.6 4.4 3.5 3.8 3.7World -1.8 4.3 2.9 2.6 2.9 1.3 2.8 3.7 3.0 2.9
GDP Inflation

Insert job number here
39
Appendix 2: relative leverage
Source: OECD and HSBC Global Research, as at June 2012
2000 Current
Household debt (%
GDP)Govt debt (%GDP)
Household debt (% GDP)
Govt debt (%GDP)
US 74 55 99 98
UK 77 41 114 90
Japan 70 106 62 212
France 47 66 63 99
Spain 54 62 88 74
Italy 52 109 76 127
Eurozone avg 50 76 65 96
Brazil 16 67 18 66
Russia 1 57 10 11
China 7 10 24 17
India 11 73 13 76
Mexico 10 27 7 22
Turkey 67 77 47 48
South Africa 36 58 48 46
Poland 14 38 33 62

Insert job number here
40
Important information
This presentation is intended for Professional Clients only and should not be distributed to or relied upon by Retail Clients.The contents of this presentation are confidential and may not be reproduced or further distributed to any person or entity, whether in whole or in part, forany purpose.The material contained herein is for information only and does not constitute investment advice or a recommendation to any reader of this material to buy orsell investments.This document is not intended for distribution to or use by any person or entity in any jurisdiction or country where such distribution or use would becontrary to law or regulation. This document is not and should not be construed as an offer to sell or the solicitation of an offer to purchase or subscribe toany investment.HSBC Global Asset Management (UK) Limited has based this presentation on information obtained from sources it believes to be reliable but which it hasnot independently verified. HSBC Global Asset Management (UK) Limited and HSBC Group accept no responsibility as to its accuracy or completeness.This presentation is intended for discussion only and shall not be capable of creating any contractual or other legal obligations on the part of HSBC GlobalAsset Management (UK) Limited or any other HSBC Group company. Care has been taken to ensure the accuracy of this presentation but HSBC Global
Asset Management (UK) Limited accepts no responsibility for any errors or omissions contained therein.This presentation and any issues or disputes arising out of or in connection with it (whether such disputes are contractual or non-contractual in nature, suchas claims in tort, for breach of statute or regulation or otherwise) shall be governed by and construed in accordance with English law.The views expressed above were held at the time of preparation and are subject to change without notice. Any forecast, projection or target whereprovided is indicative only and is not guaranteed in any way. HSBC Global Asset Management (UK) Limited accepts no liability for any failure to meet suchforecast, projection or target.The value of investments and any income from them can go down as well as up and investors may not get back the amount originally invested. Whereoverseas investments are held the rate of currency exchange may also cause the value of such investments to fluctuate. Investments in emerging marketsare by their nature higher risk and potentially more volatile than those inherent in established markets. Stockmarket investments should be viewed as amedium to long term investment and should be held for at least five years. The level of yield is not guaranteed and may rise or fall in the future.Any performance information shown refers to the past and should not be seen as an indication of future returns.HSBC Global Asset Management (UK) Limited provides information to Institutions, Professional Advisers and their clients on the investment products andservices of the HSBC Group.This presentation is approved for issue in the UK by HSBC Global Asset Management (UK) Limited, who are authorised and regulated by the FinancialServices Authority.www.assetmanagement.hsbc.com/ukCopyright © HSBC Global Asset Management (UK) Limited 2012 All rights reserved.
FP12-1237