city region food system tools/examples - fao.org · the ity region food system assessment is aimed...
TRANSCRIPT

City Region Food System Toolkit Assessing and planning sustainable city region food systems
CITY REGION FOOD SYSTEM TOOLS/EXAMPLES
Food for the Cities Programme/RUAF-CityFoodTools Project
Published by the Food and Agriculture Organization of the United Nations and
RUAF Foundation and
Wilfrid Laurier University, Centre for Sustainable Food Systems

City Region Food System Toolkit
Assessing and planning sustainable city region food systems
CITY REGION FOOD SYSTEM TOOLS/EXAMPLES
Food for the Cities Programme/RUAF-CityFoodTools Project
Published by the Food and Agriculture Organization of the United Nations and
RUAF Foundation and
Wilfrid Laurier University, Centre for Sustainable Food Systems

The designations employed and the presentation of material in this information product do not imply the expression of any opinion whatsoever on the part of the Food and Agriculture Organization of the United Nations (FAO), RUAF Foundation or Wilfrid Laurier University (WLU) concerning the legal or development status of any country, territory, city or area or of its authorities, or concerning the delimitation of its frontiers or boundaries. The mention of specific companies or products of manufacturers, whether or not these have been patented, does not imply that these have been endorsed or recommended by FAO, RUAF or WLU in preference to others of a similar nature that are not mentioned. The views expressed in this information product are those of the author(s) and do not necessarily reflect the views or policies of FAO, RUAF or WLU. ISBN 978-92-5-130525-6 (FAO) © FAO, 2018
FAO, RUAF and WLU encourage the use, reproduction and dissemination of material in this information product. Except where otherwise indicated, material may be copied, downloaded and printed for private study, research and teaching purposes, or for use in non-commercial products or services, provided that appropriate acknowledgement of FAO, RUAF and WLU as the source and copyright holders is given and that FAO/RUAF/WLU’s endorsement of users’ views, products or services is not implied in any way. All requests for translation and adaptation rights, and for resale and other commercial use rights should be made via www.fao.org/contact-us/licence-request or addressed to [email protected]. FAO information products are available on the FAO website (www.fao.org/publications) and can be purchased through [email protected] RUAF information products are available on the RUAF website (www.ruaf.org). WLU information products are available on the website of the organisation: www.wlu.ca

iii
Contents
CRFS TOOLKIT INTRODUCTION ......................................................................................................................... 1
GETTING PREPARED ......................................................................................................................................... 3
Initial CRFS Stakeholder Meeting Outline ..................................................................................................... 4 CRFS Stakeholder Mapping and Analysis ...................................................................................................... 6 Entry points into a CRFS assessment and planning process ........................................................................ 12 Terms of Reference CRFS Multi-stakeholder Taskforce ............................................................................... 15 Terms of Reference Institutional Focal Point ............................................................................................... 21 Terms of Reference Research/Project Coordinator ..................................................................................... 23
DEFINING CRFS ............................................................................................................................................... 27
Consultative stakeholder workshops to Define city region boundaries through food sources .................. 28 Literature review for CRFS boundaries definition ....................................................................................... 31 Stakeholder mapping and analysis NetMap method ................................................................................. 35 SocNetV – Social Network Analysis and Visualization Software – for stakeholders mapping exercise .... 38 Medellin Criteria for defining the CRFS ....................................................................................................... 40 Utrecht CRFS Boundaries Options ................................................................................................................ 43 Pros and cons for different definitions of the Toronto city region food system boundaries ...................... 51 Stakeholder Interview Types ........................................................................................................................ 57 Comparison of boundaries delimitation of city region in different cities ................................................... 59
VISION ............................................................................................................................................................ 63
Toronto –Project Visioning Chart ................................................................................................................. 64
CRFS SCAN ...................................................................................................................................................... 67
Consultative stakeholder workshops to Map CRFS stakeholders and Identify local priorities .................. 68 SWOT (Strengths, Weaknesses, Opportunities, Threats) approach for policy environment analysis ....... 78 Food Policy Structures .................................................................................................................................. 81 Key Food Assessment ................................................................................................................................... 83 Literature review for CRFS scan ................................................................................................................... 86 Literature Review Table ............................................................................................................................... 90 Stakeholder Interview Types ...................................................................................................................... 121 CRFS Scan: Priorities and next steps .......................................................................................................... 123 CRFS Scan Guiding Framework .................................................................................................................. 133 Food Governance Barometer ..................................................................................................................... 145 Reporting outline CRFS Scan ...................................................................................................................... 153 Selection of key areas for CRFS research ................................................................................................... 156 Critical Review of Actual Policies, Norms and Regulations bearing on City Region Food Systems .......... 164
CRFS ASSESSMENT ....................................................................................................................................... 173
Design CRFS assessment and data collection ............................................................................................ 174 Questionnaire surveys for primary data collection ................................................................................... 206 Focus group discussions ............................................................................................................................. 225 Key informant interviews ........................................................................................................................... 230 Medellin Food Flow Maps .......................................................................................................................... 245 Quito’s food supply system ........................................................................................................................ 250 Utrecht Stakeholder Engagement-Video ................................................................................................... 252 Stakeholder Engagement “Diner Pensant” ............................................................................................... 254 Agri-food Processing Clusters Map ............................................................................................................ 262 Availability of Essential Numbers .............................................................................................................. 264 Key Food System Data ................................................................................................................................ 269 Top Food Flow Data and Graphics ............................................................................................................. 271 Sampling guidelines ................................................................................................................................... 286
iv
POLICY SUPPORT AND PLANNING ................................................................................................................ 290
Thematic mapping of CRFS ........................................................................................................................ 291 Working group meetings for strategy/action plan identification and design process ............................ 298 Scenario building ........................................................................................................................................ 303

City Region Food System Toolkit Assessing and planning sustainable city region food systems
1
CRFS Toolkit Introduction FAO, RUAF Foundation and Wilfrid Laurier University with the financial support of the German
Federal Ministry of Food and Agriculture and the Daniel and Nina Carasso Foundation
embarked in the period 2015-2017 on a collaborative programme to assess and plan
sustainable city region food systems in 7 cities around the world: Colombo (Sri Lanka), Lusaka
and Kitwe (Zambia), Medellin (Colombia), Quito (Ecuador), Toronto (Canada and Utrecht (the
Netherlands).
This City Region Food System (CRFS) toolkit provides guidance on how to assess and plan for
sustainable city region food systems. It includes practical tools and examples from the seven
cities on how to:
Define and map the city region;
Collect data on the city region food system;
Gather and analyse information on different CRFS components and sustainability dimensions through both rapid and in-depth assessments;
Use a multi-stakeholder process to engage policymakers and other stakeholders in the design of more sustainable and resilient city region food systems.
The City Region Food System assessment is aimed to help strengthen the understanding of the
current functioning and performance of a food system in the context of a city region, within
which rural and urban areas and communities are directly linked. It forms the basis for further
development of policies and programmes to promote the sustainability and resilience of CRFS.
The CRFS assessment and planning approach advocated builds on a formalised process of
identifying and engaging all relevant stakeholders from the start of assessment through to
policy review and planning. This means that a CRFS process can result, not only in revised or
new urban food policies, strategies and projects, but also in the creation of new -or
revitalization of existing- networks for food governance and policy development, such as urban
food policy councils and in new institutional food programmes and policies.
Each city region has its own context, so no guidelines will fit all. This toolkit is however
structured in seven sections or steps generally involved in any CRFS assessment and planning
process, based on actual experiences in the project partner cities:
Getting prepared
Defining the CRFS
Vision

City Region Food System Toolkit Assessing and planning sustainable city region food systems
2
CRFS Scan
CRFS Assessment
Policy Support and Planning
Governance
The toolkit tells the story of why and how project cities have been implementing this process
and what outcomes they achieved. It is meant to be a resource for policymakers, researchers,
and other key stakeholders and participants who want to better understand their own CRFS
and plan for improvements. In this way the examples and tools documented provide valuable
experiences and lessons that may accelerate the development of similar initiatives in other
city regions around the world, wishing to apply, or to customise, and to up-scale similar
practices.
Resources:
For a detailed description of the CRFS assessment process, city examples, tools and project
outputs, please go to:
http://www.fao.org/in-action/food-for-cities-programme/toolkit/introduction/en/
http://www.ruaf.org/projects/developing-tools-mapping-and-assessing-sustainable-city-region-food-systems-cityfoodtools
City Region Food System Toolkit Assessing and planning sustainable city region food systems
3
Getting prepared
City Region Food System Toolkit Assessing and planning sustainable city region food systems
4
Tool/Example:
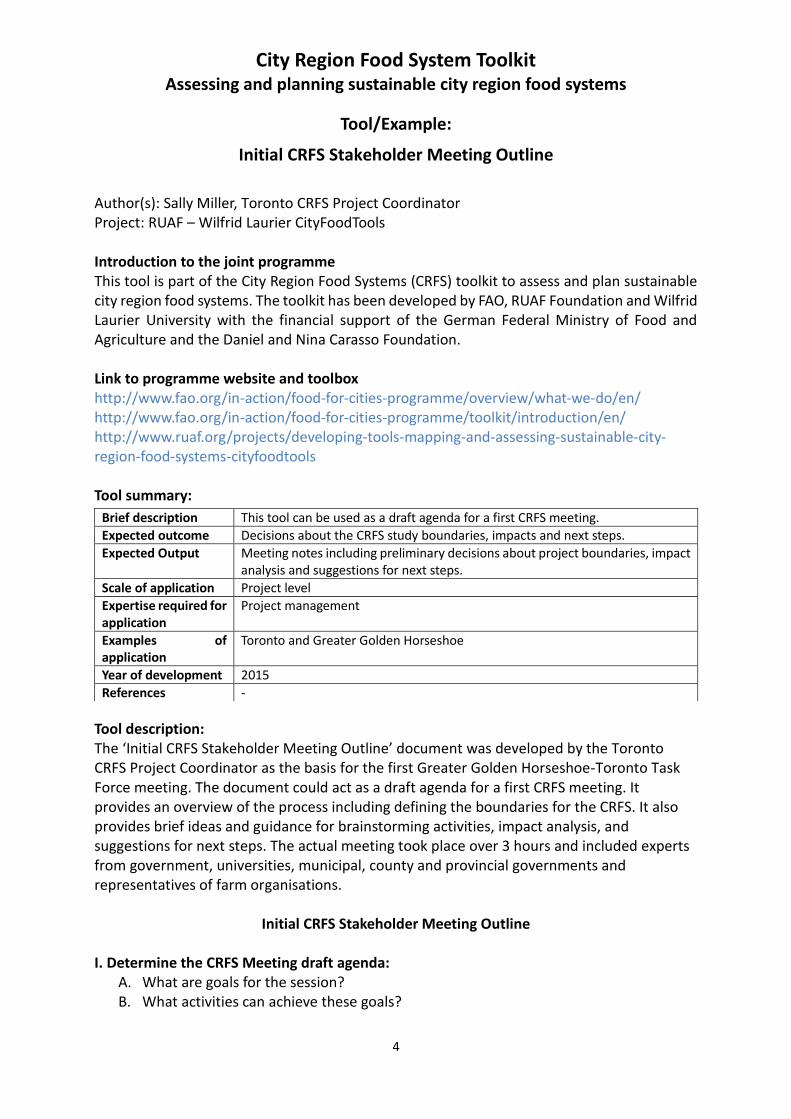
Initial CRFS Stakeholder Meeting Outline
Author(s): Sally Miller, Toronto CRFS Project Coordinator Project: RUAF – Wilfrid Laurier CityFoodTools Introduction to the joint programme This tool is part of the City Region Food Systems (CRFS) toolkit to assess and plan sustainable city region food systems. The toolkit has been developed by FAO, RUAF Foundation and Wilfrid Laurier University with the financial support of the German Federal Ministry of Food and Agriculture and the Daniel and Nina Carasso Foundation. Link to programme website and toolbox http://www.fao.org/in-action/food-for-cities-programme/overview/what-we-do/en/ http://www.fao.org/in-action/food-for-cities-programme/toolkit/introduction/en/ http://www.ruaf.org/projects/developing-tools-mapping-and-assessing-sustainable-city-region-food-systems-cityfoodtools Tool summary:
Tool description: The ‘Initial CRFS Stakeholder Meeting Outline’ document was developed by the Toronto CRFS Project Coordinator as the basis for the first Greater Golden Horseshoe-Toronto Task Force meeting. The document could act as a draft agenda for a first CRFS meeting. It provides an overview of the process including defining the boundaries for the CRFS. It also provides brief ideas and guidance for brainstorming activities, impact analysis, and suggestions for next steps. The actual meeting took place over 3 hours and included experts from government, universities, municipal, county and provincial governments and representatives of farm organisations.
Initial CRFS Stakeholder Meeting Outline
I. Determine the CRFS Meeting draft agenda: A. What are goals for the session? B. What activities can achieve these goals?
Brief description This tool can be used as a draft agenda for a first CRFS meeting.
Expected outcome Decisions about the CRFS study boundaries, impacts and next steps.
Expected Output Meeting notes including preliminary decisions about project boundaries, impact analysis and suggestions for next steps.
Scale of application Project level
Expertise required for application
Project management
Examples of application
Toronto and Greater Golden Horseshoe
Year of development 2015
References -

City Region Food System Toolkit Assessing and planning sustainable city region food systems
5
C. Discuss and develop process for September 29 CRFS meeting (see draft ideas below) II. Process:
1. Present overview of project 2. Discuss definition of city-region (“i.e., the city and its urban, peri-urban fringe and
rural hinterland” from CRFS Process and Methodology: define the extent and boundaries of the local city region and the local/regional food system for Phase 1)
o Criteria to help identify and spatially define and map the city region could include
(from CRFS Process and Methodology): Jurisdictional boundaries: municipality, sub-region, province Natural boundaries: rivers, sea, mountain ridges, watersheds Influence of the city on the region and influence of the region on the
city. Physical interactions or social/cultural interactions can be looked at. Transport distance and mode to the city and ease/sustainability of
transport to the city. Production potential/capacity in relation to the city’s food demand (for
at least fresh products), enclosed production areas like orchards or vegetable production areas or areas that could be converted to food production for the city.
3. Brainstorm stakeholders (creating visual list on sticky wall or other) based on simple
food system graphic (use page 6 graphics from CRFS Process and Methodology), include “food and organic waste management; public health; transport; markets; enterprise creation in the food system, consumption and food insecurity/malnutrition, land use planning, and climate change adaptation strategies” (CRFS Process and Methodology document); include institutional, policy, legal, planning frames, or discuss separately
4. Analyse by impact: Move stakeholders to grid (can use stickies, post-it notes) to
identify their link to food system, level of impact/ influence for change, food system area of impact. Area of impact and priority for project might be two separate steps, or could be handled in an X/Y grid prioritization process.
5. Brainstorm for lit review: o Discussion: what is missing? what are key topics that have limited secondary
information—how do we approach these?
6. Next steps: action grid with what, who and other resources columns Steps include: review secondary literature; hold separate discussions with key stakeholders; develop key question list for interviews and surveys; define frequency of Advisory Group meetings; create tool for management of shared information (base camp)

City Region Food System Toolkit Assessing and planning sustainable city region food systems
6
Tool/Example:
CRFS Stakeholder Mapping and Analysis
Author(s): Marielle Dubbeling, RUAF Foundation Project: RUAF CityFoodTools project/ FAO Food for the Cities Programme Introduction to the joint programme This tool is part of the City Region Food Systems (CRFS) toolkit to assess and plan sustainable city region food systems. The toolkit has been developed by FAO, RUAF Foundation and Wilfrid Laurier University with the financial support of the German Federal Ministry of Food and Agriculture and the Daniel and Nina Carasso Foundation. Link to programme website and toolbox http://www.fao.org/in-action/food-for-cities-programme/overview/what-we-do/en/ http://www.fao.org/in-action/food-for-cities-programme/toolkit/introduction/en/
http://www.ruaf.org/projects/developing-tools-mapping-and-assessing-sustainable-city-region-food-systems-cityfoodtools Tool summary:
Tool description: This tool helps to identify which stakeholders are actually involved in the city region food system and to assess their mandates, information sources, available expertise and resources, opinions and interests. It supports the analysis of relations between the various stakeholders, including cooperation and conflicts, as a basis for the identification of effective strategies to improve networking, communications, coordination and cooperation for policy and planning between the various stakeholders. It is used at different stages in the CRFS assessment: in getting started, during the CRFS scan and as part of policy support and planning. Why stakeholder mapping and analysis? Stakeholder mapping and analysis is useful since it helps:
To identify which stakeholders are actually involved in the city region food system and to assess their mandates, information sources, available expertise and resources, opinions and interests
To analyse the relations between the various stakeholders, including cooperation
Brief description This tool provides guidelines for CRFS stakeholder mapping and analysis.
Expected outcome Stakeholder identification and analysis
Expected Output Report on stakeholder mapping and analysis
Scale of application City region
Expertise required for application
Communication skills, good connections with different stakeholders
Examples of application
-
Year of development 2015
References -

City Region Food System Toolkit Assessing and planning sustainable city region food systems
7
and conflicts, as to provide a basis for identification of effective strategies to improve networking, communications, coordination and cooperation between the various stakeholders.
Types of stakeholders in the city region food system (CRFS) Direct and indirect stakeholders in the city region food system include: 1. Various types of actual rural, peri-urban and urban farmers / groups / organisations; 2. Actors involved in different parts of the food chain including processing industry, wholesale
and retailers, input supply, restaurants, markets, waste management etc. 3. Different municipal, metropolitan and provincial departments, NGO’s,
universities/research institutes, community based organisations and support organisations dealing with food and related areas (transport, health, agriculture, economic development, land use planning, parks and green spaces, social and educational programmes etc.).
The number and types of stakeholders differs from city to city region. Key questions to identify stakeholders in city region food systems include:
Which (formal or informal) organisations are actually representing and/or supporting producers, processors, retailers, consumers in the city region?
What organisations have a specific authority that requires their involvement in activities focusing at formulation of policies and design / implementation of projects/programmes on different components of the city region food system?
What organisations have a mandate, expertise and/or resources that make them important partners?
At least three moments to identify, analyse (and motivate) stakeholders 1. In getting prepared: Why/expected result: Identification of a small number of key institutional stakeholders that are interested and committed to being part of the City region food system assessment programme. These stakeholders should preferably involve at least: a) One or more relevant Municipal Departments, b) One or more research institutes or universities, c) One or more local organisations representing different parts of the food chain (see Figure
2). How:
Expert knowledge and internet search to identify potential interested/knowledgeable partner organisations and the right persons to speak with in these organisations;
Meetings with these partner organisations to present your organisation and explain the project and check on their interests; Follow up by mail/telephone /other meetings where needed.
Note that in the course of the project, other and new stakeholders can be invited to join the task force. It is however important to have a sufficient strong and broad initial task force to undertake

City Region Food System Toolkit Assessing and planning sustainable city region food systems
8
situation analysis as described in this document. 2. As part of the city region food system scan Why/expected result: In this stage the focus is on making a systematic mapping, inventory and analysis of all stakeholders that have something to contribute to the development of the city region food system in order to gain insight in their views on the city region food systems (or specific dimensions/components; sustainability aspects) and the role of their organisation might play in the further assessment and planning of city region food systems and the human, financial and other resources available in these organisations for this purpose. What to analyse: Through the stakeholder analysis we would like to find out:
a) Who are the stakeholders already – or potentially to become- involved in the different aspects and dimensions of the city region food system?
b) What is the mandate / mission of this organisation in relation to the city region food system? What is their main area of operation? Their main target groups?
c) What is their actual involvement in the city region food system and in which part of the food system? what are past, on-going and planned activities in this field?
d) What are existing formal and informal relations and networks between the different stakeholders?
e) What are their views on the functioning of the actual city region food system (or of specific components of the city region food system) and its vulnerabilities?
f) What are their views on current trends and the desired development to enhance sustainability and resilience of the city region food system: constraints to overcome, City Region Food System Toolkit Assessing and planning sustainable city region food systems needs and priorities, main strategies to apply and their own role in and contributions to that process?
g) What human, financial or other resources they have available that might be of interest for the development of more resilient city region food systems?
h) Our own analysis on their potential or desired role in building more resilient and sustainable city region food systems.
How: a. Preparations Meetings are organised with all persons that will be involved in this activity in order:
to familiarise them with the CRFS narrative
to familiarise them with stakeholder mapping and analysis (why, what, when, how),
to define the methodology to be applied and instruments to be used,
to define what products have to be developed as a result of the stakeholder analysis,
work planning: who will do what when how/means,
how to coordinate /monitor these activities. b. Inventory of all relevant stakeholders By reviewing available information from reliable sources (literature, databases) and

City Region Food System Toolkit Assessing and planning sustainable city region food systems
9
“brainstorming” and interviews with key informants, a list of stakeholders is developed. The list of stakeholders should include at least the following information:
name organisation,
type of stakeholder,
contact details (name and function of contact person(s), address, telephone, e-mail),
available sources of information on that organisation (website address, documents). c. Data gathering on identified stakeholders An interview is held with one or more representatives of each organisation included in the list with help of an interview guide. The person to be interviewed should be of senior rank in that organisation and his/her views should represent well the institutional viewpoints. The collected information is added to the stakeholder table which will result in a short stakeholder profiles per organisation (see below). Stakeholder Profile Sheet Profile of Stakeholder …………………. Prepared by:………………………… On the basis of: a. documents:………………………… b. interview with:…………………….
Elements Profile
Institutional mandate and current policies
Available resources (financial, human, in-kind)
Expertise
Main target groups
Main areas of intervention Past, on-going and planned projects related to CRFS
Main relations with other stakeholders; networks they participate in
Information they have on (specific dimensions) of the city region food systems
Perceptions/views on current functioning and key vulnerabilities of the CRFS
Perceptions/views on current trends and desired development for more sustainable and resilient CRFS
……
……
Own analysis
Observations re. eventual participation in multistakeholder taskforce
Specific roles/contributions they can provide to the project
Other observations
d. Analysis of the collected information Once all organisations in the list have been identified and visited, the collected data is analysed by asking: what do we learn from the collected information regarding: a. The congruency/discrepancy in the views that these organisations have on the functioning and vulnerabilities of the current CRFS b. The congruency/discrepancy in the views that these organisations have on the future trends,

City Region Food System Toolkit Assessing and planning sustainable city region food systems
10
development potentials, needs and strategies for building more sustainable CRFS c. The existing relations and networks between the various stakeholders indicating which actors do interact and how, d. The views these organisations have on their own role in the above, and the contributions they might make to future development of the CRFS, e. Our own assessment of their potential role/contributions: expertise, resources, power, legitimacy, representation, etcetera, f. Based on a-e: Which organisations should be included in the multi-stakeholder task force or other project activities and in what ways/roles? What might we expect from each of them? g. Points of attention (themes / methods) regarding building mutual understanding, capacity building, networking and enhancing cooperation and communication among stakeholders. Results of the stakeholder mapping and analysis will be captured in a written document as well as stakeholder relation/network maps. In order to allow for comparison between city regions the following colour scheme is suggested:
local governments: blue
regional/provincial/national governments: red
private sector: black
civil society (including NGO, producer and consumer organisations): green
research institutes/universities: purple
others: brown The draft document/map will be shared with and validated in a meeting of all involved stakeholders. 3. Further stakeholder consultation as part of policy support and planning Why/expected result In this step the key gaps and priority intervention strategies for further development of the CRFS will be identified. At this stage, we will review whether all relevant stakeholders are on board or whether additional organisations have to be invited to take part in this planning and policy design phase. This is important for both broad appropriation of the policy proposal and plan among different stakeholders as well as for defining their roles in design, implementation and monitoring. For any policy or (action) plan to be effective, practical and efficient institutional arrangements are needed for its further operationalisation and implementation. All stakeholders should agree on:
The type and role of the various actors that should be involved in the further operationalisation and implementation of the policy or plan,
The mechanisms that will be applied for to coordinate the operationalisation and implementation process,
The mechanisms that will be applied for monitoring and evaluation of the operationalisation and implementation process (instruments to be used, responsible organisations),
A rough estimate of the budget and other resources (human resources, specialised equipment or institutional capabilities) needed for the operationalisation and

City Region Food System Toolkit Assessing and planning sustainable city region food systems
11
implementation and available sources and mechanisms of financing (municipal budget lines, institutional budgets, public-private cooperation, payments by the beneficiaries, available project funds etc.) and who will be responsible for the management thereof,
Potential sources of additional funding and who will be responsible for negotiation and managing those funds.
If certain strategies are from the start made part of the mandate of specific organisations and included in their regular budgets, implementation of the policy or plan will become much more likely. If such arrangements are missing, for each activity specific approval and funding may have to be obtained which will slow down implementation tremendously, and may result in frustration and dissipation of interests on the part of various stakeholders who were eager to see changes actually taking place.
City Region Food System Toolkit Assessing and planning sustainable city region food systems
12
Tool/Example:
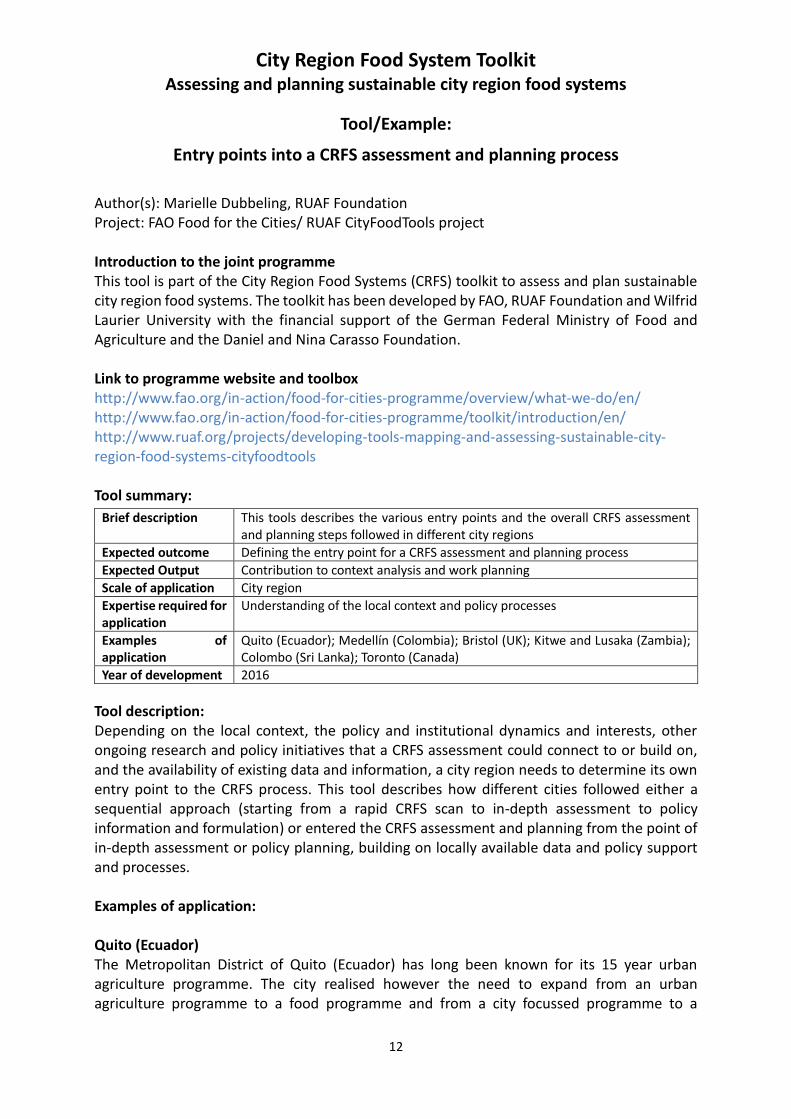
Entry points into a CRFS assessment and planning process
Author(s): Marielle Dubbeling, RUAF Foundation Project: FAO Food for the Cities/ RUAF CityFoodTools project Introduction to the joint programme This tool is part of the City Region Food Systems (CRFS) toolkit to assess and plan sustainable city region food systems. The toolkit has been developed by FAO, RUAF Foundation and Wilfrid Laurier University with the financial support of the German Federal Ministry of Food and Agriculture and the Daniel and Nina Carasso Foundation. Link to programme website and toolbox http://www.fao.org/in-action/food-for-cities-programme/overview/what-we-do/en/ http://www.fao.org/in-action/food-for-cities-programme/toolkit/introduction/en/ http://www.ruaf.org/projects/developing-tools-mapping-and-assessing-sustainable-city-region-food-systems-cityfoodtools Tool summary:
Tool description: Depending on the local context, the policy and institutional dynamics and interests, other ongoing research and policy initiatives that a CRFS assessment could connect to or build on, and the availability of existing data and information, a city region needs to determine its own entry point to the CRFS process. This tool describes how different cities followed either a sequential approach (starting from a rapid CRFS scan to in-depth assessment to policy information and formulation) or entered the CRFS assessment and planning from the point of in-depth assessment or policy planning, building on locally available data and policy support and processes. Examples of application: Quito (Ecuador) The Metropolitan District of Quito (Ecuador) has long been known for its 15 year urban agriculture programme. The city realised however the need to expand from an urban agriculture programme to a food programme and from a city focussed programme to a
Brief description This tools describes the various entry points and the overall CRFS assessment and planning steps followed in different city regions
Expected outcome Defining the entry point for a CRFS assessment and planning process
Expected Output Contribution to context analysis and work planning
Scale of application City region
Expertise required for application
Understanding of the local context and policy processes
Examples of application
Quito (Ecuador); Medellín (Colombia); Bristol (UK); Kitwe and Lusaka (Zambia); Colombo (Sri Lanka); Toronto (Canada)
Year of development 2016

City Region Food System Toolkit Assessing and planning sustainable city region food systems
13
territorial programme that takes into account Quito’s food system linkages with its wider peri-urban and rural area. For this reasons, Quito joined the RUAF CityFoodTools project to analyse its territorial food system (see CRFS Scan in the toolbox). Based on this assessment it formulated with a wide group of stakeholders a Vision for a more Sustainable and Resilient Food System in the Quito city region (see Visioning phase in the toolbox). A food strategy was formulated, identifying clear outcomes, targets, base line indicators and strategies (see Policy support and Planning in the toolbox). This led to further work on actual collection and visualisation and baseline data that can be used for future policy monitoring (see In-depth assessment in the toolbox). Medellín, Colombia In the city of Medellín, Colombia the CRFS assessment, which started in summer 2015, has, from the start, been influenced by a number of specific contextual factors. At the start of the implementation of the CRFS project, the city of Medellin and the region of Antioquia already did have a strong political and policy basis for urban and regional food policies, resulting in active local and regional government engagement from the start of the process. The need to further develop the territorial integration between policies and the need for a stronger vertical coordination between governance levels (creating synergies between the local authorities of the municipality and the region) were considered important challenges for advancing food policies for the city region and focusses CRFS assessment activities and multi-stakeholder dialogues (see Governance section in the toolkit). Another important factor has been the local political calendar, with elections taking place for both the Municipal government and the Regional government of the Gobernacion of Antioquia on 25 October 2015. This resulted in a change in political representatives and policy teams working on food policy , hence the need for an adjustment in the timing of different CRFS project phases and specific attention required to facilitate institutional engagement and stakeholder dialogue and to consolidate policy plans and proposals (see Policy and planning in the toolkit) to enhance the likelihood that these are taken up by new administrations. Thirdly, in the case of the city region of Medellin, and certainly in comparison to other cities in the CRFS assessment project, data on some of the key aspects of the CRFS were quite readily available. The coordination and integrated analysis of data at the territorial city region scale was considered the main challenge in advancing an understanding of the CRFS, rather than data collection itself.
Bristol, UK The City of Bristol (United Kingdom) asked in 2011 for an external assessment of their food system to help them build a resilient food plan. A 2011 Who Feeds Bristol report (using available data and stakeholder interviews) provides a snapshot overview of Bristol’s food system (see CRFS Scan in the toolbox). It is primarily a descriptive analysis of the food system serving Bristol. In addition, there is a discussion of resilience in relation to inputs, outputs and threats. It includes an analysis of the positive powers that cities have in shaping their food system, and it makes suggestions for action. The report informed a vision and Food Plan for Bristol City (see Visioning and Policy Planning). This enabled identification of 10 strategic elements of the food system that

City Region Food System Toolkit Assessing and planning sustainable city region food systems
14
required more attention and the formulation of expected outcomes and related indicators (see CRFS in-depth assessment) and further data collection on baseline data to monitor changes from implemented strategies (see Policy support). Kitwe and Lusaka (Zambia) and Colombo (Sri Lanka)
The cities of Kitwe and Lusaka (Zambia) and Colombo (Sri Lanka) did not yet have a clear policy commitment to design a more comprehensive food system agenda at the start of the project in 2015. Nonetheless, all cities had worked on specific food system components before, such as health and nutrition and waste management in Colombo, while in Zambia local/regional production has always been one of the paramount elements of the food system agenda. Kitwe has specifically worked on urban agriculture. In order to gauge further political and stakeholder interest and commitment, it was imperative to start with a comprehensive diagnosis of the city region food system (see CRFS Scan in the toolbox), followed by more in-depth assessment and policy discussions (see CRFS in-depth assessment). Toronto (Canada) Toronto (Canada) has a long history of food policy and programmes to improve access to healthy food; enhance urban and regional agriculture production; foster food markets, nutrition education and food skills, food business promotion, and localised consumption. As Toronto began to realise its food security is also dependent on preserving rural farmland in surrounding areas, since 2012 the Toronto Food Policy Council has expanded its scope of collaboration to include the Greater Golden Horseshoe area surrounding the city – an area of rapid population growth and diminishing agricultural lands. To support this work and make food a more visible part of the urban and regional system, further assessment of these territorial linkages were needed (see CRFS Scan and in-depth assessment). The CRFS assessment was implemented by a multi-stakeholder task force made up of representatives from the Toronto Food Policy Council and existing organisational networks at regional scale, such as the Greater Golden Horseshoe Alliance. This led to the identification of the need to emphasise food as a critical part of its territorial infrastructure that requires planning and coordination, as well as intentional interventions to improve sustainability, access and equity. Toronto’s policy and planning work focussed on these aspects accordingly with specific attention to the creation of food hubs (see Policy support and planning in the toolbox).

City Region Food System Toolkit Assessing and planning sustainable city region food systems
15
Tool/Example:
Terms of Reference CRFS Multi-stakeholder Taskforce
Author(s): Marielle Dubbeling, RUAF Foundation & Guido Santini, FAO Project: FAO Food for the Cities programme Introduction to the joint programme This tool is part of the City Region Food Systems (CRFS) toolkit to assess and plan sustainable city region food systems. The toolkit has been developed by FAO, RUAF Foundation and Wilfrid Laurier University with the financial support of the German Federal Ministry of Food and Agriculture and the Daniel and Nina Carasso Foundation. Link to programme website and toolbox http://www.fao.org/in-action/food-for-cities-programme/overview/what-we-do/en/ http://www.fao.org/in-action/food-for-cities-programme/toolkit/introduction/en/
http://www.ruaf.org/projects/developing-tools-mapping-and-assessing-sustainable-city-region-food-systems-cityfoodtools Tool summary:
Tool description: The research/project team (including the institutional focal point) should work in close collaboration with a wider group of stakeholders and multi-stakeholder dialogue. This dialogue could initially be implemented through a local CRFS task force involving representatives from various government sectors and levels of government, research organisations and local universities, private sector and civil society. A Terms of Reference for such task force is provided below.
Brief description This tool provides a Terms of Reference for the CRFS multi-stakeholder taskforce Expected outcome Engagement of a multi-stakeholder taskforce in the CRFS project
Expected Output Terms of Reference adapted to the local context
Scale of application Project level
Expertise required for application
Project management
Examples of application
Kitwe and Lusaka (Zambia); Colombo (Sri Lanka)
Year of development 2015
References -

City Region Food System Toolkit Assessing and planning sustainable city region food systems
16
Terms of Reference Background In order to ensure an integrated approach to city region food systems (CRFS) assessment and planning, and to harness knowledge, information and participation of different stakeholders involved in the food system, the CRFS assessment and planning process will be highly participatory and will promote local ownership. Specifically, it will foster inclusive multi-stakeholder dialogue processes to support local governments and other multiple stakeholders, in taking informed decisions on food planning, enhance synergies and reduce costs and prioritise investments. In this context, the methodology recognises the great importance and added value of a consultation-participative processes, balanced with information and data collection and the use of more quantitative assessment tools. The local CRFS Multi-stakeholder Task Force will be formed at the beginning of the process (Inception phase/ Getting started) where possible. This requires however initial stakeholder interest, participation and relations amongst food system stakeholders. In city regions where this is not yet the case, the CRFS task force can be formed in a later stage of the process, for example after the CRFS scan and further stakeholder mapping and analysis. The CRFS multi-stakeholder task force will involve representatives from different relevant levels and sectors of government and other stakeholders that include representatives from the civil society (including producer and consumer associations, NGOs), national and international organisations and institutions, academia (including local universities), private and financing sector, media and professional associations, etcetera. The CRFS Multi-stakeholder Task Force will support the research/project coordinator and the institutional focal point in assessing the CRFS, will contribute to identifying priorities and critical aspects for in-depth assessment and to defining strategies for strengthening the CRFS. Main purpose and key functions Key tasks and initiatives include:
Provide information on your role in the city food system for the city region and any other information and statistics on aspects related to agriculture, food processing, marketing and consumption;
Help identifying priorities and recommendations to improve to the CRFS assessment and planning process by facilitating the provision of inputs and feedback on project outputs by all interested stakeholders;
Ensure building of a participatory food strategy and plan, harnessing inputs and commitments from all stakeholders, including beneficiaries;
Help building a more permanent local food system network of key actors and broad inter-sectoral alliances;
Bridge the communication gap between various stakeholders and engage in and support a multi-stakeholder process to promote a broader understanding of the CRFS components and governance;
Collaborate with other initiatives or groups to create synergies in this area of work;
Facilitating the uptake of research results into the local policy and institutional programmes and
City Region Food System Toolkit Assessing and planning sustainable city region food systems
17
processes;
Provide any other necessary advise/guidance to the CRFS project team.
Annex: Principles and prerequisites for effective functioning of a multi-stakeholder group (This annex was taken from RUAF training material on multi-stakeholder for a or MSF. The principles and prerequisites outlined can help reflect on and guide the organisation of a CRFS task force). A multi-stakeholder group/forum (abbreviated as MSF) can only be effective when certain basic principles or rules are adhered to (for example “shared ownership”, “openness” and equality”). Some of the most important principles are:
- Building partnerships is a goal in itself, - Shared ownership and equal participation, - Matching individual interests with the common agenda, - Openness and transparency, - Open membership.
Building partnerships is a goal in itself It is not enough in a multi-stakeholder forum to simply come together and assume that a partnership for urban agriculture development will magically appear. Building further institutional commitment and relations needs time and should be a conscious effort. Building partnerships should be a goal of the MSF in itself. Practically this means bringing it up as an agenda item and discussing it regularly. Shared ownership and equal participation A second guiding principle in the MSF and joint development of the CRFS assessment and planning implies shared ownership of the CRSF project outputs and an overall sense of joint responsibility for the outcomes of endeavours. Shared ownership and responsibility on their turn imply equal participation. It is important- but challenging in practice- to establish a culture of equality among all actors. This implies on its turn a relative reduction in the central role of the coordinating organisation and the need for all partners to create a balance between accommodating others’ interests and negotiating for their own position. Language barriers and socio-cultural factors might greatly influence the communications between the various stakeholders. A lot of attention should be given to overcome such barriers: building mutual respect and trust, use of interpreters, working in homogeneous subgroups before sharing in plenary (especially important also for presenting women’s interest), good checking of understanding and whether all have been able to express their views before moving on, etcetera. Matching individual interests with the common agenda
The MSF needs to be able to link the common agenda to important institutional and personal interests of all stakeholders involved. Addressing partners’ own institutional interests allows them to spend time on and provide their own resources for the functioning of the MSF and implementation of a future city regional food agenda. The link to personal interests further creates personal commitment. Common interests could further be strengthened by allowing

City Region Food System Toolkit Assessing and planning sustainable city region food systems
18
sufficient time to allow for joint learning and exchange among partners, for example by presenting audio-visual material on partners’ experiences or those in other cities or organising exchange visits.
Openness and transparency A MSF cannot work unless there is openness and transparency in communication and decision-making. All participants should have an “open eye and ear” for differences in the interests and “cultures” of the different stakeholders. Mutual understanding and respect should be seen as a basis for dialogue and negotiation. This also implies that, from the beginning, stakeholders need to make their interests and expectations clear. The resources that can be made available from internal and external resources should be openly discussed. This allows the MSF to build on a common position of understanding and respect for each other’s positions. “Open membership” The MSF needs to be prepared to change its stakeholder composition if and when necessary, for example when identifying new stakeholders after the assessment phase that should be involved in the policy support and planning phase. On the other hand, if one stakeholder wishes to leave- for whatever reason- that should be possible also. Making the MSF work What can we do to ensure that above mentioned principles will become a reality? How to make the MSF work and how sustain it? Working in multi-stakeholder partnerships is a challenge and problems are bound to arise. Being aware of them in advance may help to avoid mayor conflicts. Many lessons can also be learned by regular reflection on the functioning of the MSF through monitoring and periodic review of experiences gained. The MSF should develop an atmosphere of “learning from experience”: documenting the functioning of the MSF and discussion of problems encountered and lessons learned are key to this. Capacity building and learning by doing Working together in a MSF might be a new experience for several or all stakeholders. Stakeholders need to understand what the objectives and potential benefits of the MSF are and what is expected from them. The stakeholders involved may also need training in how to work together with people they have never worked with before and how to engage in constructive dialogue, negotiation, joint decision-making and conflict resolution. For example, urban producers may need to learn to negotiate with different levels of government and other external agencies to achieve their goals. Sometimes it may be needed to organize a separate meeting with the farmer representatives prior to a MSF meeting to discuss the issues on the agenda and to prepare them well for the MSF meeting. Definition of roles and agreements Clarity is needed from the start about roles and responsibilities of all stakeholders. Overlapping roles can be a source of inefficiency, confusion and even conflict. In many cases, there is a need for formalising roles and responsibilities agreed upon, as well as steps that can be taken in case of non-performance, through the signing of an Inter-actor Agreement. The inter-actor

City Region Food System Toolkit Assessing and planning sustainable city region food systems
19
agreement should not just be seen as a formal document, more important is its role in obliging partners to think about, and agree on, what they expect from each other and from the MSF (the common goals and strategies that are to be pursued jointly). Structure and procedures for decision-making should also be agreed upon in such a document. Clear and transparent agreements concerning financial contributions and rewards should be arrived at, including arrangements for transport or arrangements for compensation for loss of income by the farmer representatives in the MSF. It is important to accept that different stakeholders may work at different paces (institutional rhythms) with respect to speed in which they can take on board new ideas, make decisions and act. Sharing of resources Tasks, responsibilities and related resources should be truly shared among partners. Resources are not only needed for implementation, but also for organising and managing meetings of the MSF. This may take the form of financial contributions, but also materials, meeting rooms, vehicles or farmer field sites. One should be open about available budgets and partners’ potential share in them. The principle of “own contribution” should be underlined, participation in the MSF is not a means to acquire easy money”. On the other hand, “benefits” of the partnership should also be equally shared such as attending (international) training or being interviewed by the media. Commitment grows from successful first actions A MSF needs to build on a shared will to succeed, by pooling together experience, expertise and resources. It should be clarified what stakeholders can expect to gain from the MSF and what they are expected to contribute: knowledge, recognition, contacts etcetera. Commitment to the MSF can be demonstrated and reinforced through success. Implementation of some initial actions at local level in an early stage of the process that produce concrete outputs with good visibility within a short period of time will help to reinforce the commitment and participation of those involved, especially the farmers and other intended beneficiaries, and create a positive environment for more complex and long-term processes. Ensuring effective communication, joint monitoring and evaluation Good and effective communication is central to achieve openness and transparency. Results and decisions made in the MSF meetings should be shared with all stakeholders, also those that could not be present in the meeting. Progress and results of activities implemented should also regularly be documented and shared. A budget for information and communication activities should be integrated in the budget needed for functioning of the Forum. Joint monitoring and evaluation are essential in this regard. Need for clarity on decision-making framework There should be clarity, from the very beginning of the process, regarding what will be done with the results of the agreements reached and decision taken in the MSF. In the end, if the CRFS process results in a food strategy or action plan, many cases, this may need to be presented to the Municipal Council (or one of its committees) hat will review the proposals (and adapt it where necessary to the municipal legal/institutional framework in place) and

City Region Food System Toolkit Assessing and planning sustainable city region food systems
20
subsequently present the plan to Mayor and Provincial Director/Minister, who will take the final decisions, formalise the plan, make a budget available, etc. Managing conflicts There will be differing views within the group, which is normal and reflects the different backgrounds, position, knowledge and interests of the various persons and organizations involved in the MSF. Especially since the objective of the MSF is to bring about institutional change and a shift in power and influence relations. When conflicts or disagreements arise, they should be minimized or resolved. Unnecessary conflicts (for example because of misunderstandings or insufficiently clarified roles) can be prevented through appropriate mechanisms (frequent and open communication, articulating expectations, development of an inter-actor agreement). Working with a joint vision (see Visioning as part of the CRFS process) and making optimal use of the differences of opinion, experience and expertise (including the local knowledge of farmers) should help to create win-win situations and build consensus. Ensuring good quality facilitation Poor facilitation is often a reason why MSF fail to achieve good results. A facilitating organization must focus on mediating the partnerships and assuming as neutral a role as possible. Ground rules for effective facilitation include at least involving partners in agenda setting, using participatory methods of decision-making and encouraging an atmosphere of respect, sharing and learning. The facilitating organisation is responsible for good organisation of the MSF meetings, with a clear time-schedule, division of labour, and agreements on how and when participation in decision-making will take place, and how monitoring of progress and results will be implemented. It is important to work with a committed and capable facilitating/coordinating team that has skills in conflict mediation, resolution and facilitation. Involving an external and experienced facilitator can be particularly useful at critical planning moments or when conflicts need to be resolved.

City Region Food System Toolkit Assessing and planning sustainable city region food systems
21
Tool/Example:
Terms of Reference Institutional Focal Point
Author(s): Guido Santini, FAO & Marielle Dubbeling, RUAF Foundation Project: FAO Food for the Cities programme Introduction to the joint programme This tool is part of the City Region Food Systems (CRFS) toolkit to assess and plan sustainable city region food systems. The toolkit has been developed by FAO, RUAF Foundation and Wilfrid Laurier University with the financial support of the German Federal Ministry of Food and Agriculture and the Daniel and Nina Carasso Foundation. Link to programme website and toolbox http://www.fao.org/in-action/food-for-cities-programme/overview/what-we-do/en/ http://www.fao.org/in-action/food-for-cities-programme/toolkit/introduction/en/
http://www.ruaf.org/projects/developing-tools-mapping-and-assessing-sustainable-city-region-food-systems-cityfoodtools Tool summary:
Tool description: Given the policy planning dimension of the CRFS process, it is strongly recommended to identify and engage an institutional focal point (placed within the local or subnational government) from the start. The institutional focal point will act as the reference person for the project within the local/regional government. S/he should preferably have a technical profile and, at the same time, the capacity and position to influence the decision making process. A Terms of Reference for this position is provided below. Terms of Reference Background In the context of a holistic and integrated approach to city region food systems (CRFS), and the assessment process will be developed through multidisciplinary and multilevel cooperation between different actors in the local food system, as detailed in the project process and methodology document.
Brief description This tool provides a Terms of Reference for the institutional focal point participating in the CRFS project team
Expected outcome Engagement of an institutional focal point in the CRFS project
Expected Output Terms of Reference adapted to the local context
Scale of application Project level
Expertise required for application
Project management
Examples of application
Kitwe and Lusaka (Zambia); Colombo (Sri Lanka)
Year of development 2015
References -

City Region Food System Toolkit Assessing and planning sustainable city region food systems
22
The CRFS assessment and planning process is envisaged to be highly participatory and promote local ownership. Specifically, it will foster inclusive multi-stakeholder dialogue processes to support local governments and other multiple stakeholders, in taking informed decisions on food planning, harness knowledge, information and participation of different stakeholders involved in the food system, enhance synergies and reduce costs and prioritise investments. In this context, the methodology recognizes the great importance and added value of a consultation-participative processes, balanced with information and data collection and the use of more quantitative assessment tools. Main purpose and key functions The institutional focal point will act as the reference person for the project in the local or regional government and is responsible to ensure political support and ownership of the CRFS assessment and planning process, and potential future uptake of results in policies, programmes, institutional budgets and actions plans. The focal point ensures regular communication on project activities with other city officials and staff involved in food system related activities, facilitates access to government information on the city region and city region food system, and informs the research coordinator and global project team about relevant (policy) developments in the local food system. S/he should have a technical profile and, at the same time, the capacity and position to influence the decision process. The institutional focal point should have strong capacities in facilitating multi-stakeholder participation and processes of participatory planning. He/she should be well established and linked to different government departments and decision-making processes. More specifically s/he will:
Facilitate contact between the local/regional government institutions and project local team;
Contribute to identifying and mapping relevant local key stakeholders from different government sectors and mandates;
Participate in key project meetings, provide feedback and guidance on project from a policy perspective;
Facilitate access to information regarding the city region, inform the project about relevant developments with regard to issues related to the CRFS. This entails making staff time available to support data collection and processing, as required;
Regularly report progress of project implementation to higher levels of decision-making within the local government, and ensure that project findings are used in the design of future strategies;
Make human and logistic resources available for the smooth implementation of the research activities
If needed, provide office space and facilities (telephone, paper, etc.) to project team;
If needed, provide facilities for stakeholder events, meetings and workshops (venue, supply material, administrative and logistic support);
When possible, provide a vehicle to facilitate field activities at city region level.

City Region Food System Toolkit Assessing and planning sustainable city region food systems
23
Tool/Example:
Terms of Reference Research/Project Coordinator
Author(s): Guido Santini, FAO & Marielle Dubbeling, RUAF Foundation Project: FAO Food for the Cities programme Introduction to the joint programme This tool is part of the City Region Food Systems (CRFS) toolkit to assess and plan sustainable city region food systems. The toolkit has been developed by FAO, RUAF Foundation and Wilfrid Laurier University with the financial support of the German Federal Ministry of Food and Agriculture and the Daniel and Nina Carasso Foundation. Link to programme website and toolbox http://www.fao.org/in-action/food-for-cities-programme/overview/what-we-do/en/ http://www.fao.org/in-action/food-for-cities-programme/toolkit/introduction/en/
http://www.ruaf.org/projects/developing-tools-mapping-and-assessing-sustainable-city-region-food-systems-cityfoodtools
Tool summary:
Tool description: As the CRFS assessment and planning process engages multiple disciplines and expertise, it is suggested that each city region forms a local research/project team that will be in charge of coordinating the CRFS assessment and planning process. The team can be led by a project or research coordinator and a suggested Terms of Reference for this position is provided below. S/he will have an appropriate technical profile coupled with the capacity to effectively manage projects, interact with different institutions/groups of stakeholders and orient research towards policy outcomes. Terms of Reference Background FAO and RUAF’s integrated approach to city region food systems (CRFS) assessment and
Brief description This tool provides a Terms of Reference for the CRFS research/project coordinator
Expected outcome Engagement of a research/project coordinator in the CRFS project
Expected Output Terms of Reference adapted to the local context
Scale of application Project level
Expertise required for application
Project management
Examples of application
Kitwe and Lusaka (Zambia); Colombo (Sri Lanka)
Year of development 2015
References -

City Region Food System Toolkit Assessing and planning sustainable city region food systems
24
planning aims to contribute building a dynamic, resilient and sustainable food system with stronger urban-rural linkages that ensures improved food and nutrition security and livelihoods for urban and peri-urban dwellers. The CRFS assessment will specifically addresses environmental, economic and social sustainability factors and help municipal governments, policymakers and regional authorities to make informed decisions, prioritise investments, improve local production and marketing, and design food policies and strategies. The process will be highly participatory and will promote local ownership of the process. The CRFS assessment and planning process will be articulated as follows: Inception phase (Getting started)
- Set up local project team and local task force involving public sector, academics (including local universities), private sector and civil society.
- Train team and task force members. - Develop a work plan for the assessment and planning activities, including stakeholder engagement
at different stages of the process.
CRFS Assessment phase
- CRFS scan : rapid assessment of the food systems through stakeholder consultations, secondary data collection, etc.
- In-depth assessment: analysis of major critical issues and local priorities (through focus group discussions, interviews, primary data collection, household and individual surveys, etc.)
Policy support and planning phase
- Propose various scenarios for the improvement of the CRFS. - Engage in policy lobbying and advocacy. - Elaborate a territorial food strategy and an action plan.
Terms of Reference for the research/ project coordinator The research/ project coordinator will be the local technical reference person for the project. S/he will have an appropriate technical profile coupled with the capacity to interact effectively with different institutions/groups of stakeholders. S/he will be employed by an acknowledged institution to guarantee necessary institutional/administrative support and future engagement. In close collaboration with the institutional Focal Point, the research coordinator will provide for the necessary technical inputs and arrangements to ensure the timely and effective start-up, implementation and follow-up of different CRFS assessment and planning activities. More specifically s/he will:
Identify and map stakeholders who might be directly or indirectly involved in the assessment and planning process. In collaboration with the Institutional Focal Point s/he will determine key organisations and individuals to be involved in a multi-stakeholder dialogue process;
Contribute to organising, participate in, and facilitate local multi-stakeholder consultations and

City Region Food System Toolkit Assessing and planning sustainable city region food systems
25
dialogue processes (e.g. local Task Force1) and other project events (workshops, expert meetings, technical seminars, training sessions, etc.) as required;
Lead research, and data collection, processing and analysis which are necessary for the CRFS assessment process. This entails:
o Recruiting other CRFS project team members as needed to form a local CRFS project team; supervise and coordinate their work;
o Collecting, processing and making available secondary information and data (maps, GIS datasets, databases, statistics, reports, etc.);
o Conducting primary data collection, processing and analysis; o Producing technical outputs (reports, maps, datasets, etc.).
Participate in CRFS trainings.
Ensure the integration of research data and input from multi-stakeholder into the assessment and planning process;
Ensure regular documentation of project events, communication and progress reporting on project activities with the city officials involved in food system related activities.
Expected outputs Inception phase/Getting started
- Set up of a local CRFS project team. - A Terms of Reference for and set up of the local CRFS task force. - An agreed work plan for the next steps in the CRFS process, and outlining a strategy for multi-
stakeholder engagement. - The project team and task force have participated in a first project training.
CRFS assessment CRFS scan:
- A report characterising the CRFS, including strengths, potential, weaknesses, institutional, policy, legal and planning frameworks, critical issues and priorities.
- A set of maps characterising the local food system in the city region context. - A short fact sheet or policy brief summarising results from the CRFS scan for broader dissemination
and awareness raising.
In-depth analysis - A report describing the in-depth analysis of key critical issues affecting CRFS based on further
analysis and primary data collection. - A report on more in-depth food flow mapping. - Data and maps on CRFS indicators. - Policy lobbying materials.
Policy support and planning phase - A report describing a set of future scenarios for interventions in the CRFS. - A report describing strategies to improve the CRFS on the basis of local priorities and scenarios. - An actual food strategy or plan (if possible and relevant). - Further policy advocacy and dissemination materials.
1 The local Task Force (or Stakeholder Forum) will be composed by key stakeholders previously
identified, and established in close collaboration with the institutional Focal Point.

City Region Food System Toolkit Assessing and planning sustainable city region food systems
26
Competences and skills Ideally the research and project coordinator (and the institution covering this position) should a) be well experienced in project and team management; b) have a strong research background in an area related to CRFS; c) be well connected to the local food system scene; d) have the ability to engage effectively with key stakeholders and other sector experts; e) have a good capacity to listen, stimulate engagement and document process; f) have good communication skills in disseminating information connected with the CRFS assessment process; g) excellent writing and reporting skills. Minimum requirements
- Advanced university degree in food security, agronomy, agricultural economics, planning, nutrition, social sciences, or related fields.
- Ten years of relevant professional experience in assessment of food systems or related areas such as environmental, economic, social, or risk assessment in urban areas;
- Thorough knowledge of the local context and strong connection with local networks of relevant stakeholders;
- Proven prior project management skills; - Excellent oral and written communication skills in English and the local language.
Selection criteria
- Extent of relevant knowledge and experience in food system assessment, or environmental/economic/risk assessment in the context of urban planning, policy or project implementation;
- Strong interpersonal skills (or demonstrated ability) to work and engage effectively with key stakeholders and other sector experts;
- Ability to plan, organise and follow through a number of different activities (participatory dialogue processes, technical meetings and workshops, including training sessions);
- Demonstrated ability to identify, compile and analyse relevant technical information to prepare reports and communication/policy lobbying materials.
Duration The assignment will last approximately 30 months.

City Region Food System Toolkit Assessing and planning sustainable city region food systems
27
Defining CRFS

City Region Food System Toolkit Assessing and planning sustainable city region food systems
28
Tool/Example:
Consultative stakeholder workshops to Define city region boundaries through food sources
Author(s): FAO Project: FAO Food for the Cities Introduction to the joint programme This tool is part of the City Region Food Systems (CRFS) toolkit to assess and plan sustainable city region food systems. The toolkit has been developed by FAO, RUAF Foundation and Wilfrid Laurier University with the financial support of the German Federal Ministry of Food and Agriculture and the Daniel and Nina Carasso Foundation. Link to programme website and toolbox http://www.fao.org/in-action/food-for-cities-programme/overview/what-we-do/en/ http://www.fao.org/in-action/food-for-cities-programme/toolkit/introduction/en/
http://www.ruaf.org/projects/developing-tools-mapping-and-assessing-sustainable-city-region-food-systems-cityfoodtools Tool summary:
Tool description This tool has been defined to support the definition and mapping of the city region, and to help prioritizing the key food commodities to be considered in the CRFS assessment. One of the criteria to define the city region boundaries is often the food flows, and particularly the food sources. This can be qualitatively identified by conducting a consultative multi-stakeholder workshop. The workshop must gather all key stakeholders of the food system, actors involved in the production to the consumption processes, making sure actors for each of the main food stuff consumed in the city are well represented.
Examples of application: Lusaka (Zambia)
Brief description Consultative workshops aim to collect qualitative data and/or come to a multi-stakeholder agreement on a specific topic. It can be used to get an estimate of the food flows for key commodities consumed in the city.
Expected outcome Food sources and flows mapping.
Expected Output Map of the food sources and flows.
Scale of application City region (municipal, district, province)
Expertise required for application
Examples of application
Lusaka (Zambia)
Year of development 2016
References -

City Region Food System Toolkit Assessing and planning sustainable city region food systems
29
Facilitation of the workshop:
During the workshop, the following procedure was carried on in order to delimitate the city
region food system boundaries:
1. The participants were requested to indicate the sources of the different types of food in the below
table based on their experiential knowledge;
2. For the sources beyond the neighboring districts to Lusaka District, the participants were guided to
indicate the exact sources;
3. For each food source, the frequencies were added together for the crop types to generate the total
scores;
4. To generate the proportions for each source, the total scores were divided into the overall total
score of 607;
5. To generate the Lusaka city region, a minimum threshold of 10% was considered to be critical.
Therefore only those sources that scored 10% and above were included in the definition of the city
region.
Table of results
Food type Chongwe Chilanga Shibuyunji Chibombo Mumbwa Kafue Chisamba Lusaka
City
Beyond
Neighbouring
Districts
Fish 1 5 1 5 1 9 1 1 9
Fresh
Vegetables 9 9 8 7 5 6 7 7 3
Fruits 5 4 2 6 3 4 5 4 5
Processed
Beef 4 1 0 5 0 3 5 10 2
Beef 9 7 7 9 8 6 9 10 8
Milk 8 7 5 10 5 7 10 9 6
Poultry 11 9 5 7 6 6 6 8 3
Maize 8 9 7 8 8 8 8 8 7
Wheat 2 6 1 5 2 1 9 7 3
Pork 7 7 3 7 3 8 7 9 1
Goats 6 2 4 6 7 3 6 2 3
Potatoes 5 3 2 4 1 4 6 4 4
Beans 1 0 0 0 1 0 0 1 3
G/nuts 1 1 1 1 1 0 1 1 1
Total Scores 77 70 46 80 51 65 79 81 58
% 12.7 11.5 7.6 13.2 8.4 10.7 13.0 13.3 9.6
City Region Food System Toolkit Assessing and planning sustainable city region food systems
30
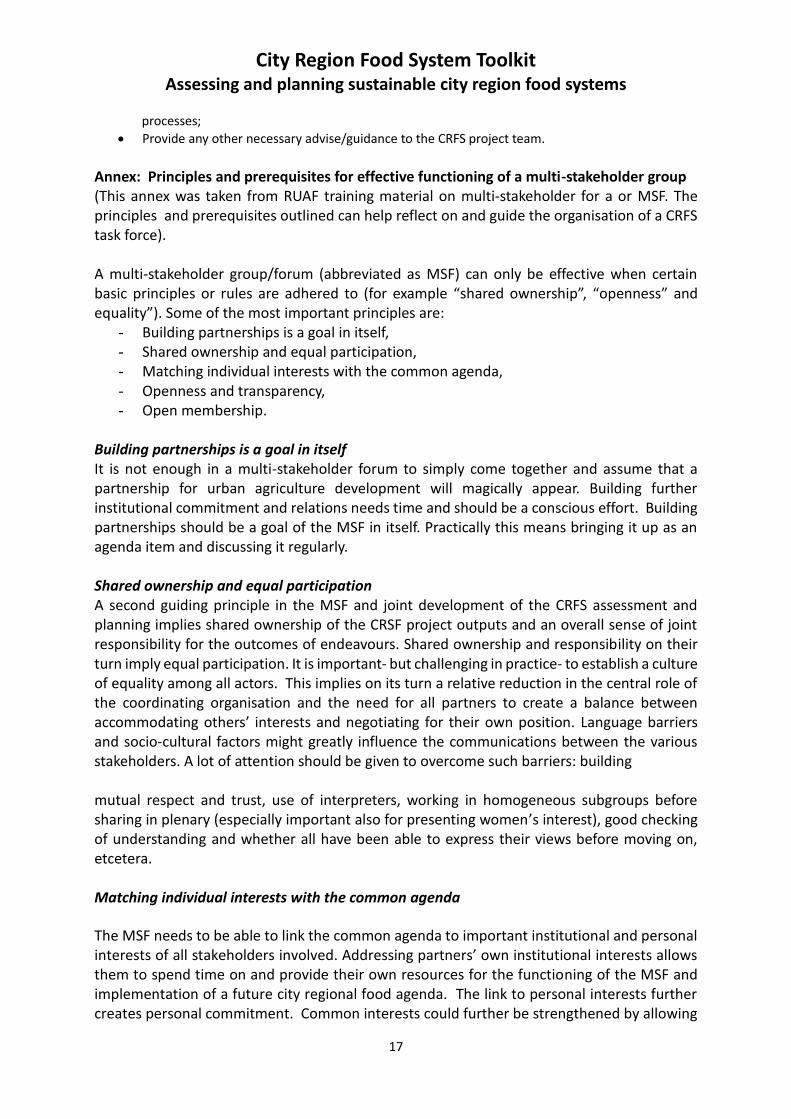
Results – main production districts:
The main results of the procedure are:
The highlights show that Chongwe, Chibombo, and Chisamba are perceived to be criticalsources
of food for the City of Lusaka followed by Kafue and Chilanga;
Other types of food come from beyond Lusaka and Central Provinces. Such sources include
Southern, Western, Eastern, North-Western, Luapula, Muchinga and Northern Provinces. It should
be noted also that many food types come from beyond Zambia;
The Food types that are imported into the City from other provinces are fish, fruits, beef, milkand
maize.
Food sources map: (Source: Lusaka CRFS Workshop 2015)

City Region Food System Toolkit Assessing and planning sustainable city region food systems
31
Tool/Example:
Literature review for CRFS boundaries definition
Author(s): FAO Project: FAO Food for the Cities programme Introduction to the joint programme This tool is part of the City Region Food Systems (CRFS) toolkit to assess and plan sustainable city region food systems. The toolkit has been developed by FAO, RUAF Foundation and Wilfrid Laurier University with the financial support of the German Federal Ministry of Food and Agriculture and the Daniel and Nina Carasso Foundation. Link to programme website and toolbox http://www.fao.org/in-action/food-for-cities-programme/overview/what-we-do/en/ http://www.fao.org/in-action/food-for-cities-programme/toolkit/introduction/en/
http://www.ruaf.org/projects/developing-tools-mapping-and-assessing-sustainable-city-region-food-systems-cityfoodtools Tool summary:
Tool description To define the CRFS boundaries, literature review can be conducted to characterize different elements: Administrative boundaries; Governance instances and their respective roles and responsibilities in terms of decision making; Population density in the city and the surrounding periurban and rural areas; Sources of the food consumed in the city; Production areas around the city; Physical features in and surrounding the city, such as rivers, lakes, mountains, hills, forest, etc. Examples of application Kitwe (Zambia) Literature has been collected for the following criteria: demography, employment in agriculture, fisheries, forestry and hunting, national policies, legislation and strategies, environmental resources, land use and cover, climate change and variability impacts, agricultural and food value chain, input supply and food production, food marketing, catering and retail.
Brief description Literature review aims at collecting secondary data. It can be used to understand and define the geographic limit of the city region.
Expected outcome Identification of city region boundaries.
Expected Output Definition of the geographical perimeter of the area of study.
Scale of application City region (municipal, district, province), regional, national.
Expertise required for application
-
Examples of application
Lusaka (Zambia), Kitwe (Zambia), Colombo (Sri Lanka)
Year of development 2015
References -
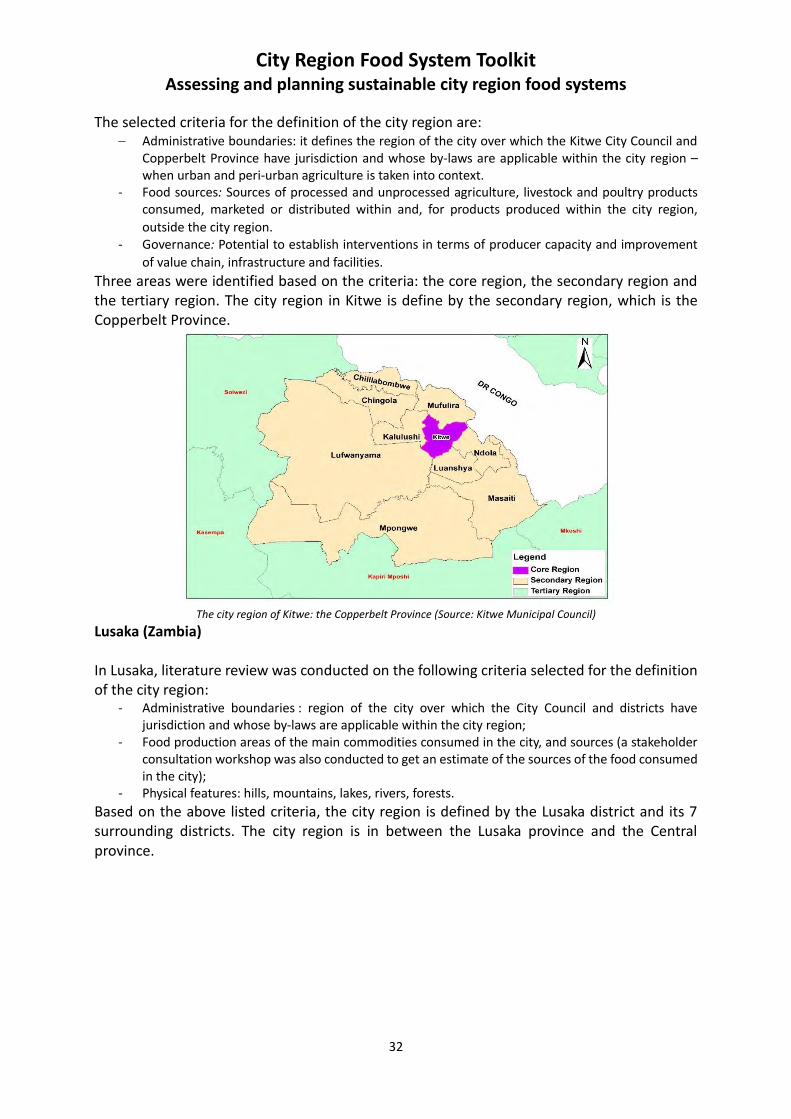
City Region Food System Toolkit Assessing and planning sustainable city region food systems
32
The selected criteria for the definition of the city region are: Administrative boundaries: it defines the region of the city over which the Kitwe City Council and
Copperbelt Province have jurisdiction and whose by-laws are applicable within the city region – when urban and peri-urban agriculture is taken into context.
- Food sources: Sources of processed and unprocessed agriculture, livestock and poultry products consumed, marketed or distributed within and, for products produced within the city region,
outside the city region. - Governance: Potential to establish interventions in terms of producer capacity and improvement
of value chain, infrastructure and facilities.
Three areas were identified based on the criteria: the core region, the secondary region and the tertiary region. The city region in Kitwe is define by the secondary region, which is the Copperbelt Province.
The city region of Kitwe: the Copperbelt Province (Source: Kitwe Municipal Council)
Lusaka (Zambia) In Lusaka, literature review was conducted on the following criteria selected for the definition of the city region:
- Administrative boundaries : region of the city over which the City Council and districts have jurisdiction and whose by-laws are applicable within the city region;
- Food production areas of the main commodities consumed in the city, and sources (a stakeholder consultation workshop was also conducted to get an estimate of the sources of the food consumed in the city);
- Physical features: hills, mountains, lakes, rivers, forests.
Based on the above listed criteria, the city region is defined by the Lusaka district and its 7 surrounding districts. The city region is in between the Lusaka province and the Central province.

City Region Food System Toolkit Assessing and planning sustainable city region food systems
33
The city region of Lusaka : Lusaka district and its 7 surrounding districts (Source: FAO)
Colombo (Sri Lanka) In Sri Lanka, most statistics and national data are available in district level. Based on the locally applicable scenarios, few options for city region food system boundary for Colombo was considered. Literature review was conducted for each of the following criteria:
1. Built up areas and population densities-The basis for this scenario is less dense areas of the region
would act as suppliers to the CMC.
2. Administrative boundaries– Administrative boundary have databases to support the study.
3. Judicial boundaries –These are the governing units and data for some of the areas (coming under
their authority) are available. These judicial units take policy decisions.
4. Supply areas of major nutrients –The major commodity, which supply major nutrients to the CMC;
in this case, rice for carbohydrate, fish for protein, and coconut for fat.
5. Supply areas of major and minor nutrients –The major commodity, which supplies major and micro
(vitamins and minerals) nutrients to the CMC. In this case, rice for carbohydrate, fish for protein,
coconut for fat, and fruits and vegetables for vitamins and minerals.
6. Data availability – Almost all national survey and censes data are available at district level. Hence,
most data is available in district level.
District boundary complies with judicial boundaries, administrative boundaries, and unit level where data is available. Alternatively, no data is available on food supplied to CMC from the Colombo district and other districts to establish the Boundary option 4 and option 5. By considering all facts above, Colombo district seems to be the best city region boundary.

City Region Food System Toolkit Assessing and planning sustainable city region food systems
34
The city region of Colombo: Colombo District (Source: IWMI)

City Region Food System Toolkit Assessing and planning sustainable city region food systems
35
Tool/Example:
Stakeholder mapping and analysis NetMap method
Author(s): Eva Schiffer, independent consultant (previously International Food Policy Research Institute) Project: n.a Introduction to the joint programme This tool is part of the City Region Food Systems (CRFS) toolkit to assess and plan sustainable city region food systems. The toolkit has been developed by FAO, RUAF Foundation and Wilfrid Laurier University with the financial support of the German Federal Ministry of Food and Agriculture and the Daniel and Nina Carasso Foundation. Link to programme website and toolbox http://www.fao.org/in-action/food-for-cities-programme/overview/what-we-do/en/ http://www.fao.org/in-action/food-for-cities-programme/toolkit/introduction/en/
http://www.ruaf.org/projects/developing-tools-mapping-and-assessing-sustainable-city-region-food-systems-cityfoodtools Tool summary:
Tool description: The Netmap method is a tool used for stakeholder mapping and analysis. Net-Map is a
participatory interview technique that combines social network analysis stakeholder mapping,
and power mapping. Net-Map helps understand, visualize, discuss, and improve situations in
which many different actors influence outcomes. By creating maps, individuals and groups
clarify their own view of the present food situation in the city, foster discussion, and help
participants develop a ‘personalised’ broader perspective of the food system and the
stakeholders involved.
Brief description The Netmap method is a tool used for stakeholder mapping and analysis. Net-Map is a participatory interview technique that combines social network analysis stakeholder mapping, and power mapping. It was used in Lusaka (Zambia).
Expected outcome Stakeholder mapping exercise.
Expected Output Diagram with food system’s stakeholders and interlinks.
Scale of application City region, regional, national.
Expertise required for application
-
Examples of application
Lusaka (Zambia).
Year of development 2006
References https://www.infoq.com/articles/net-map
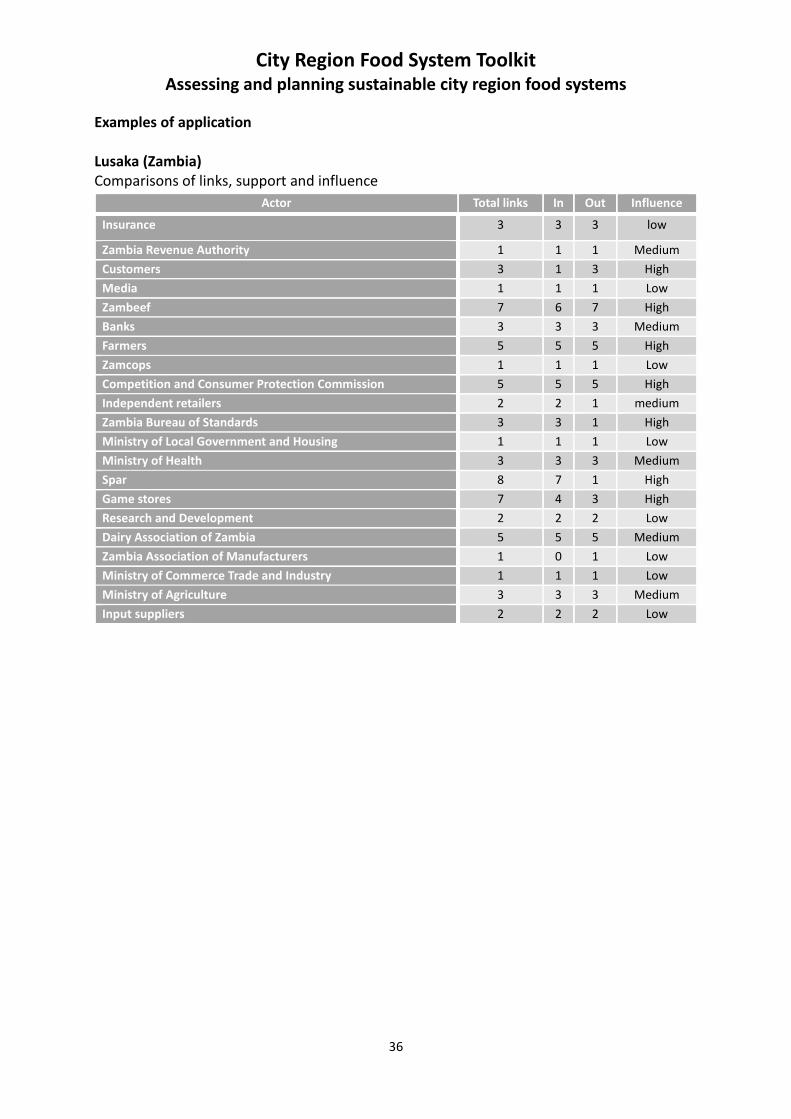
City Region Food System Toolkit Assessing and planning sustainable city region food systems
36
Examples of application Lusaka (Zambia) Comparisons of links, support and influence
Actor Total links In Out Influence
Insurance 3 3 3 low
Zambia Revenue Authority 1 1 1 Medium
Customers 3 1 3 High
Media 1 1 1 Low
Zambeef 7 6 7 High
Banks 3 3 3 Medium
Farmers 5 5 5 High
Zamcops 1 1 1 Low
Competition and Consumer Protection Commission 5 5 5 High
Independent retailers 2 2 1 medium
Zambia Bureau of Standards 3 3 1 High
Ministry of Local Government and Housing 1 1 1 Low
Ministry of Health 3 3 3 Medium
Spar 8 7 1 High
Game stores 7 4 3 High
Research and Development 2 2 2 Low
Dairy Association of Zambia 5 5 5 Medium
Zambia Association of Manufacturers 1 0 1 Low
Ministry of Commerce Trade and Industry 1 1 1 Low
Ministry of Agriculture 3 3 3 Medium
Input suppliers 2 2 2 Low

City Region Food System Toolkit Assessing and planning sustainable city region food systems
37
NetMap map for Lusaka city region (Source: Lusaka CRFS Workshop 2015)

City Region Food System Toolkit Assessing and planning sustainable city region food systems
38
Tool/Example:
SocNetV – Social Network Analysis and Visualization Software – for stakeholders mapping exercise
Author(s): Dimitris V. Kalamaras Project: n.a Introduction to the joint programme This tool is part of the City Region Food Systems (CRFS) toolkit to assess and plan sustainable city region food systems. The toolkit has been developed by FAO, RUAF Foundation and Wilfrid Laurier University with the financial support of the German Federal Ministry of Food and Agriculture and the Daniel and Nina Carasso Foundation. Link to programme website and toolbox http://www.fao.org/in-action/food-for-cities-programme/overview/what-we-do/en/ http://www.fao.org/in-action/food-for-cities-programme/toolkit/introduction/en/
http://www.ruaf.org/projects/developing-tools-mapping-and-assessing-sustainable-city-region-food-systems-cityfoodtools Tool summary:
Tool description: Social Network Visualizer (SocNetV) is a cross-platform, free software application for social network analysis and visualization. SocNetV allows to draw social networks, analyze graph and social network properties, produce diagrams and layouts. This tool can be well combined with a preliminary consultative workshop to identify and characterize the different CRFS stakeholders and their links. Examples of application Kitwe (Zambia)
Brief description The SocNetV tool allows to draw social networks, analyze graph and social network properties, produce diagrams and layouts. It was used in Kitwe (Zambia) to display the results of the stakeholder identification and analysis exercise.
Expected outcome Stakeholder mapping display.
Expected Output Diagram with food system’s stakeholders and interlinks.
Scale of application City region, regional, national.
Expertise required for application
-
Examples of application
Kitwe (Zambia).
Year of development -
References http://www.socnetv.org/

City Region Food System Toolkit Assessing and planning sustainable city region food systems
39
(Source: Lusaka CRFS Workshop 2015)
CRFS stakeholders network – output of stakeholders mapping exercise on SocNetv
Legend: Green circles = civil society organisations; black circles = national government
departments; red triangles = financial institutions; blue diamonds = private sector; blue square
= Kitwe city council. (KDLA=Kitwe district land alliance; KCC=Kitwe city council; sap=sustainable
agriculture programme; NARDC=national agricultural research & development centre;
NSTC=national science & technology centre) prepared using SOCNETV 1.9.
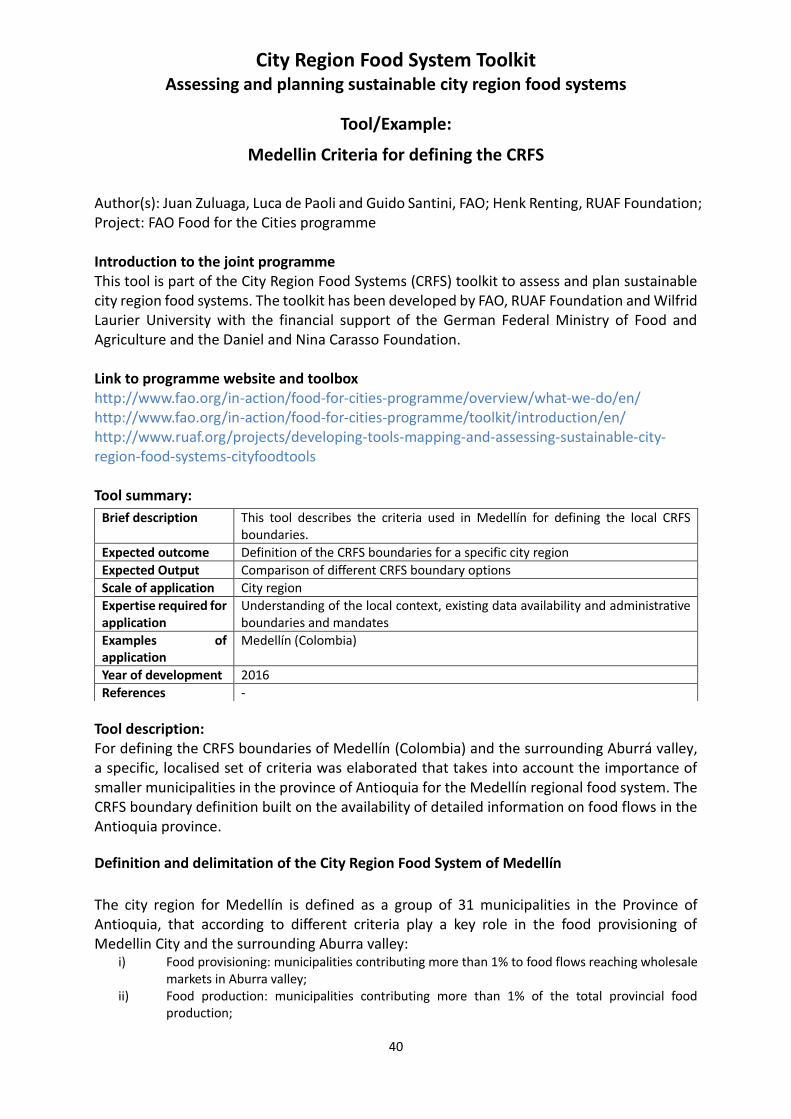
City Region Food System Toolkit Assessing and planning sustainable city region food systems
40
Tool/Example:
Medellin Criteria for defining the CRFS
Author(s): Juan Zuluaga, Luca de Paoli and Guido Santini, FAO; Henk Renting, RUAF Foundation; Project: FAO Food for the Cities programme Introduction to the joint programme This tool is part of the City Region Food Systems (CRFS) toolkit to assess and plan sustainable city region food systems. The toolkit has been developed by FAO, RUAF Foundation and Wilfrid Laurier University with the financial support of the German Federal Ministry of Food and Agriculture and the Daniel and Nina Carasso Foundation. Link to programme website and toolbox http://www.fao.org/in-action/food-for-cities-programme/overview/what-we-do/en/ http://www.fao.org/in-action/food-for-cities-programme/toolkit/introduction/en/
http://www.ruaf.org/projects/developing-tools-mapping-and-assessing-sustainable-city-region-food-systems-cityfoodtools Tool summary:
Tool description: For defining the CRFS boundaries of Medellín (Colombia) and the surrounding Aburrá valley, a specific, localised set of criteria was elaborated that takes into account the importance of smaller municipalities in the province of Antioquia for the Medellín regional food system. The CRFS boundary definition built on the availability of detailed information on food flows in the Antioquia province.
Definition and delimitation of the City Region Food System of Medellín
The city region for Medellín is defined as a group of 31 municipalities in the Province of Antioquia, that according to different criteria play a key role in the food provisioning of Medellin City and the surrounding Aburra valley:
i) Food provisioning: municipalities contributing more than 1% to food flows reaching wholesale markets in Aburra valley;
ii) Food production: municipalities contributing more than 1% of the total provincial food production;
Brief description This tool describes the criteria used in Medellín for defining the local CRFS boundaries.
Expected outcome Definition of the CRFS boundaries for a specific city region
Expected Output Comparison of different CRFS boundary options
Scale of application City region
Expertise required for application
Understanding of the local context, existing data availability and administrative boundaries and mandates
Examples of application
Medellín (Colombia)
Year of development 2016
References -

City Region Food System Toolkit Assessing and planning sustainable city region food systems
41
iii) Proximity: municipalities in the Aburra valley with any agricultural production; iv) Areas of agricultural expansion (this is related to the importance of the western Occidente
subregion, which is conceived as an area of agricultural expansion within the overall development of the Antioquia department and that is increasingly serving as a foodshed for the growing urban area of the Aburrá Valley. It includes the municipalities with the highest levels of agricultural activity),
v) Municipalities with an important political role in territorial governance.
Figure 1. The City region food system of Medellín, Colombia (Source: FAO)
Overall, the Department of Antioquia contributes nearly 30% of the total food supply of the Aburrá Valley. The 31 municipalities that are part of the City Region Food System of Medellín and the food producing territory, represent an area of approximately 2,550 Km2 and produce about 70 commodities totaling 670,440 tons in 2013. Figure 2. below indicates the contribution of the 31 individual municipalities (that make up the Medellín CRFS) to the overall food supply.

City Region Food System Toolkit Assessing and planning sustainable city region food systems
42
Figure 2. Contribution of local production (per municipality) in Antioquia to food in Medellín (Source: FAO)
0.0%
1.0%
2.0%
3.0%
4.0%
5.0%
6.0%
7.0%
8.0%
9.0%
10.0%Origin of food in Medellín CRFS

City Region Food System Toolkit Assessing and planning sustainable city region food systems
43
Tool/Example:
Utrecht CRFS Boundaries Options
Author(s): Henk Renting, RUAF Foundation Project: RUAF CityFoodTools project Introduction to the joint programme This tool is part of the City Region Food Systems (CRFS) toolkit to assess and plan sustainable city region food systems. The toolkit has been developed by FAO, RUAF Foundation and Wilfrid Laurier University with the financial support of the German Federal Ministry of Food and Agriculture and the Daniel and Nina Carasso Foundation. Link to programme website and toolbox http://www.fao.org/in-action/food-for-cities-programme/overview/what-we-do/en/ http://www.fao.org/in-action/food-for-cities-programme/toolkit/introduction/en/
http://www.ruaf.org/projects/developing-tools-mapping-and-assessing-sustainable-city-region-food-systems-cityfoodtools
Tool summary:
Tool description: This document compares the various options and considerations that define the boundaries for the Utrecht City Region. Five different options were considered as described in the document. These possible delimitations of the Utrecht City Region were compared for the following criteria: 1. Data availability and ability to aggregate municipal data; 2. Level of connectivity (urban-rural linkages); and 3. Influence and ability to take policy actions. On this basis, the U10 region was selected as the most appropriate city region with sufficient data availability and potential for generating food policy processes at territorial scale.
Defining the Utrecht City Region boundaries Different studies use different boundaries for the city region. As a general rule, an area of 30 to 100 kilometres around the city centre is included, depending on the local context and the
Brief description This tool compares the various options and considerations that define the boundaries for the City Region Food System of Utrecht.
Expected outcome Definition of the CRFS boundaries for a specific city region
Expected Output Comparison of different CRFS boundary options
Scale of application City region
Expertise required for application
Understanding of the local context, existing data availability and administrative boundaries and mandates
Examples of application
Utrecht (The Netherlands)
Year of development 2016
References -

City Region Food System Toolkit Assessing and planning sustainable city region food systems
44
type of city. Several possibilities for the definition of the Utrecht City Region for the purposes of this project were identified. These are:
1. Utrecht municipality 2. The region ‘U10’: Utrecht municipality with 9 other neighbouring municipalities 3. Utrecht province 4. Stadsgewest Utrecht (urban region) 5. Grootstedelijk agglomeratie Utrecht (large urban agglomeration) 6. A specific region defined by local food marketing initiative ‘Lekker Utregs’
Province of Utrecht
A specific advantage of using the province as boundary for the city region is that data are readily available on this level (disaggregated by municipality). Also, the province has published (or is about to publish) a range of documents on the status and trends of agriculture developments. An example is the ‘landbouwverkenning Provincie Utrecht tot 2015 (LEI, 2011). This document is based on data from the Central Bureau of Statistics (CBS) and the LISA (national register for employment).
Map of the province of Utrecht and its 26 municipalities (Source: Wikipedia)

City Region Food System Toolkit Assessing and planning sustainable city region food systems
45
U10 Region U10 is a network of 10 municipalities around the city of Utrecht. Looking at the province it excludes the municipalities of Amersfoort, the region ‘Gelderse Vallei’ (including the municipalities Utrechtse Heuvelrug, Veenendaal, Renswoude, Eemnes, Baarn, Soest, Woudenberg), and the municipalities Montfoort, Oudewater, Wijk bij Duurstede, De Ronde Venen. As mentioned earlier the U10 region largely overlaps with the region of ‘Lekker Utregs’, a marketing initiative for local food products. The U10 municipalities are:
Bunnik (Werkhoven, Odijk) Stichtse Vecht (Loenen, Maarssen, Breukelen, Tienhoven, Kockengen, Oud-Aa, Loenen a’d Vecht)
De Bilt (Bilthoven, Groenekan, Maartensdijk) Utrecht
Houten (Schalkwijk, t Goy) Vianen
IJsselstein Woerden (Kanis, Kamerik, Zegveld, Harmelen)
Nieuwegein Zeist (Den Dolder)
The U10 region functions as a network of municipalities with the goal to improve cooperation on economic affairs, residential areas, spatial planning, mobility and accessibility, and the social domain (Gemeente Utrecht, Afdeling Onderzoek, 2013).
Lekker Utregs Stichting Lekker Utregs is an initiative that aims to promote consumption of locally produced food. The Stichting promotes food producers from the region: the entire province of Utrecht, with the exception of north-western part of Utrecht and the region Eemland/Gelderse Vallei. Lekker Utregs used the following considerations for defining the region: on the north of the Province of Utrecht, there are towns and villages that are oriented more towards cities such as Amersfoort, Amsterdam and Hilversum. To the east, the hills of the Utrechtse Heuvelrug form a natural boundary; towns and villages beyond the Heuvelrug are considered to be oriented more towards cities such as Veenendaal, Ede, Wageningen, and Arnhem (interview project team with Louis de Jel, Lekker Utregs). To the south, the river Kromme Rijn forms the natural boundary of the region. To the west, the grasslands, the villages and towns are largely orientated on Utrecht city (this is somewhat arbitrary). Also see the document ‘Reglement Keurmerk Lekker Utregs’ (2012).
Rationale for selection of the appropriate city region boundaries
After weighing different options, the CRFS assessment project team decided to select the U10 region (hereafter referred to as the ‘Utrecht Region’) as study area for the Utrecht city region food system assessment. The Utrecht Region consists of the municipalities of Utrecht and 9 neighbouring municipalities: Bunnik, De Bilt, Houten, Ijsselstein, Nieuwegein, Stichtse Vecht, Woerden, Vianen and Zeist.

City Region Food System Toolkit Assessing and planning sustainable city region food systems
46
(Source: Basisregistratie Topografie, Kadaster, 2017) The rationale for choosing U10 as boundary for the Utrecht City Region, is based on the following: 1. Data availability and ability to aggregate municipal data: Many data sets and statistics
are disaggregated at national, provincial and municipal level. The Utrecht Region follows municipal boundaries.
2. Level of connectivity: The Province of Utrecht is home to different larger cities, including the cities of Utrecht and Amersfoort with its respective surrounding areas. Other parts of the Province are more focussed on cities in neighbouring provinces (Amsterdam, Rotterdam, Ede and Wageningen). The Utrecht Region is concentrated around the municipality of Utrecht, and there are very strong connections, in terms of flows of people, employment, goods and services, between the different municipalities in the region.
3. Influence of the city and ability to take policy actions: U10 is an existing network of municipalities that already takes joint decisions and implements (policy) actions. Several

City Region Food System Toolkit Assessing and planning sustainable city region food systems
47
member municipalities (Zeist, De Bilt, Bunnik, Houten and Utrecht) indicated interest in joint food system work.
On this basis, the U10 region was selected as the most appropriate city region with sufficient data availability and potential for generating food policy processes at territorial scale.
Table 1 below gives a more detailed overview of the considerations applied for the different city region options outlined.

City Region Food System Toolkit Assessing and planning sustainable city region food systems
48
Table 1: Overview of options for delineating the Utrecht City Region
Item Utrecht Municipality U10 region Utrecht Province Stadsgewest Utrecht Grootstedelijke agglomeratie
Lekker Utregs (project based)
Policy context Low: municipal boundaries do not include larger food production areas
Relevant: U10 is a network organisation, although it does not have a specific jurisdictional mandate; common themes are discussed at network level and the level of individual municipalities.
Relevant: the province has various instruments to influence its agenda on agricultural development, in relation to environment, economic development. systems. However, the role of Utrecht in these decision-making processes is limited.
Low: Does not have its own institutional body.
Low: Does not have its own institutional body.
Low: Lekker Utregs is a local non-administrative/non- governmental initiative. Project boundaries do not fully coincide with municipal boundaries.
Policy interest High: there is strong interest from the municipality of Utrecht on the theme of food, in relation to other policy themes (like health).
Low: agriculture land-use remains one of the largest land-uses in the region, but food and regional food systems do not yet seem to be high on the agenda of U10. There is interest from some member municipalities to start working on this.
High: several policy documents, strategy documents highlight the potential and importance of urban agriculture, multifunctional agriculture, and regional food.
Low: Not known Low: Not known Difficult to judge: unsure whether Lekker Utregs has sufficient organisational capability/networking capability to influence policies.
Relevance (agricultural potential)
Very low: there are hardly any agricultural areas in the municipality.
Reasonable: Remaining presence of dairy farming, and to a lesser degree fruit farming, albeit low diversity of food production systems.
High: agricultural diversity (compared to U10 region) is higher, although agriculture in the Utrecht province has also a strong representation of dairy farming.
Reasonable: there is substantial agricultural land in the region.
Low : area is made up of the municipality of Utrecht and Stichtse Vecht, and agricultural land-use is limited.
Reasonable: there is substantial agricultural land in the region covered, but again with a strong presence of dairy farming, and to a lesser degree fruit farming.

City Region Food System Toolkit Assessing and planning sustainable city region food systems
49
Item Utrecht Municipality U10 region Utrecht Province Stadsgewest Utrecht Grootstedelijke agglomeratie
Lekker Utregs (project based)
Relevance (environmental)
Reasonable: city greening (though not necessarily through multifunctional agriculture) is an important interest with regards to public health.
Reasonable to high: Land-use, agriculture, and environment are strongly linked in this region. Environmental concerns are management of the fragile grass peat lands in the west of the region and water tables, compaction of soils, as well as nature and agricultural landscape conservation,.
Very high: Land-use, agriculture, and environment are strongly linked in this region. Environmental concerns include height of water tables, agricultural pollution of ground- and surface water (nitrogen, pesticides), compaction of soils.
Reasonable to high: Land-use, agriculture, and environment are strongly linked in this region. Environmental concerns are management of the fragile grass peat lands in the west of the region and water tables, compaction of soils..
Reasonable: city greening (though not necessarily through multifunctional agriculture) is an important interest with regards to public health.
Reasonable to high: Land-use, agriculture, and environment are strongly linked in this region. Environmental concerns are management of the fragile grass peat lands in the west of the region and water tables, compaction of soils.
Relevance (economic)
Low to reasonable: food system services, specifically distribution, retail, but also research and development around food and food systems provide a relatively small share of employment.
Reasonable: current and potential future role of food system services, production, processing, distribution, retail, to provide employment
High: on provincial level, the economic contribution of food system services is higher compared to smaller regions, stronger representation of food production. Some specific food production sectors are under strong economic stress.
Reasonable: current and potential future role of food system services, production, processing, distribution, retail, to provide employment
Low to reasonable: food system services, specifically distribution, retail, but also research and development around food and food systems provides a relatively small share of employment.
Reasonable: current and potential future role of food system services, production, processing, distribution, retail, to provide employment
Relevance (social) High: Utrecht municipality will see continued population growth, and a relative young population, with high degree of ethnic diversity. Increasing consumer demand for more sustainable food. Large variety of social initiatives.
High: idem as for Utrecht Municipality
Reasonable: strong relations exist between people and places in the region, in terms of work, growth, housing, mobility. No clear link with food systems however.
Reasonable: strong relations exist between people and places in the region, in terms of work, growth, housing, mobility. No clear link with food systems however.
Reasonable: strong relations exist between people and places in the region, in terms of work, growth, housing, mobility. No clear link with food systems however.
High strong social relation between different food system actors are supported.

City Region Food System Toolkit Assessing and planning sustainable city region food systems
50
Item Utrecht Municipality U10 region Utrecht Province Stadsgewest Utrecht Grootstedelijke agglomeratie
Lekker Utregs (project based)
Level of existing data
High; data are collected for municipal boundaries; several municipal institutions have data, also national and provincial institutes collect data on municipal level.
High; data are collected for different municipalities in U10; several municipal institutions have and publish data, also national and provincial institutes that collect and analyse data on municipal level.
High High Reasonable: the boundaries not always overlap with municipal boundaries.
Low: for data, the region does not overlap with administrative boundaries. Lekker Utregs did carry out some studies for the city of Utrecht.
Presence of historical data
High, longer term data collection for health, economy, less for consumption of local/regional food.
High, idem as for Utrecht Municipality.
High, specifically for agriculture
High: boundaries overlap with municipal boundaries.
Reasonable: see above. Low: see above
Number of sources for data
High; although different for different themes. Also national studies and publications.
Reasonable to high: availability of a range of data sources and publications on food related issues. Larger cities (such as Utrecht) tend to have more data.
High: the provincial boundaries are used by the province itself but also by other research organisations
Low to reasonable: although boundaries overlap with municipal boundaries, there have been few publications or other data sources for this region.
Low to reasonable: although boundaries overlap with municipal boundaries, there have been few publications or other data sources for this region.
Low: see above
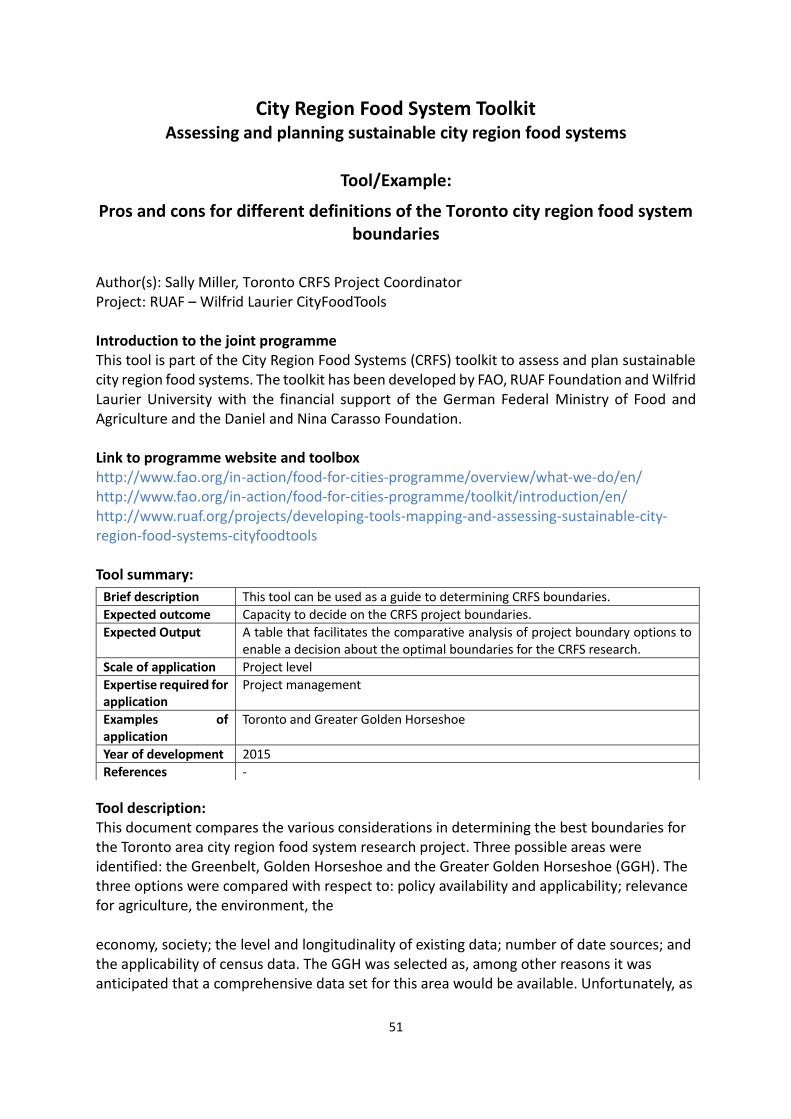
City Region Food System Toolkit Assessing and planning sustainable city region food systems
51
Tool/Example:
Pros and cons for different definitions of the Toronto city region food system boundaries
Author(s): Sally Miller, Toronto CRFS Project Coordinator Project: RUAF – Wilfrid Laurier CityFoodTools Introduction to the joint programme This tool is part of the City Region Food Systems (CRFS) toolkit to assess and plan sustainable city region food systems. The toolkit has been developed by FAO, RUAF Foundation and Wilfrid Laurier University with the financial support of the German Federal Ministry of Food and Agriculture and the Daniel and Nina Carasso Foundation. Link to programme website and toolbox http://www.fao.org/in-action/food-for-cities-programme/overview/what-we-do/en/ http://www.fao.org/in-action/food-for-cities-programme/toolkit/introduction/en/
http://www.ruaf.org/projects/developing-tools-mapping-and-assessing-sustainable-city-region-food-systems-cityfoodtools Tool summary:
Tool description: This document compares the various considerations in determining the best boundaries for the Toronto area city region food system research project. Three possible areas were identified: the Greenbelt, Golden Horseshoe and the Greater Golden Horseshoe (GGH). The three options were compared with respect to: policy availability and applicability; relevance for agriculture, the environment, the economy, society; the level and longitudinality of existing data; number of date sources; and the applicability of census data. The GGH was selected as, among other reasons it was anticipated that a comprehensive data set for this area would be available. Unfortunately, as
Brief description This tool can be used as a guide to determining CRFS boundaries.
Expected outcome Capacity to decide on the CRFS project boundaries.
Expected Output A table that facilitates the comparative analysis of project boundary options to enable a decision about the optimal boundaries for the CRFS research.
Scale of application Project level
Expertise required for application
Project management
Examples of application
Toronto and Greater Golden Horseshoe
Year of development 2015
References -

City Region Food System Toolkit Assessing and planning sustainable city region food systems
52
some jurisdictions refused to give permission for access, this did not happen in the end. This points to the need for caution in assessing resources and setting the research parameters. Pros and cons for different definitions of the Toronto city region food system boundaries
Item Greenbelt Golden Horseshoe Greater Golden
Horseshoe
Policy availability Yes; several See GGH Yes; Places to Grow
Policy applicability (for changing context)
Yes; currently proposed to expand into some of the other areas
See GGH Focus of policy development and action currently
Relevance (agricultural)
Key policies that only apply to farms in this area; less homogeneous data and policies if full agricultural area is also considered (“whitebelt”)
Covers a larger agricultural area, though not all that are in market distance of GH
Addresses key agricultural areas with relevance to urban markets
Relevance (environmental)
Includes key watershed, conservation areas (a designated environmental protection zone)
Has important impact on environmental goods in the area, studies from David Suzuki Foundation evaluate these
Has important impact on environmental goods in the area, studies from David Suzuki Foundation evaluate these
Relevance (economic)
Has specific economic issues related to frozen farm assets (limiting market for land sales); generally closest area to key urban market in GTA, as well as significant agricultural areas (Holland Marsh, etc.), has specific supports from Greenbelt Fund to
Has a significant impact on Canada’s economy based on percentage of population; also has much of the best soil in Canada, increasing its relevance as a food shed over other lands; similar agricultural lands to Greenbelt, but more complete (includes whitebelt)
Has a significant impact on Canada’s economy based on percentage of population; also has much of the best soil in Canada, increasing its relevance as a food shed over other lands; similar agricultural lands to Greenbelt and Golden Horseshoe, but more complete

City Region Food System Toolkit Assessing and planning sustainable city region food systems
53
build agricultural business success, agri-tourism, supportive policies, etc. Note that recently Greenbelt has been funding projects across the province too.
Relevance (social) Less of a socially defined area; social issues on either side of Greenbelt border are fairly similar, all peri-urban
More relevant and complete as the peri-urban and sprawl area is result of population growth and creates increased commuter distances for urban jobs (a social impact); numbers available from census, corresponds to CMAs
More relevant as sprawling areas is result of population growth and creates increased commuter distances for urban jobs (a social impact); numbers available from census, corresponds to CMAs
Level of existing data Excellent collection of reports, analysis, etc.; upcoming expansion of area will render these inaccurate
Excellent reports from the Golden Horseshoe Food and Farming Alliance
Excellent reports from the Golden Horseshoe Food and Farming Alliance which has now shifted attention to the GGH so current research focuses on the wider area
Longitudinality of data
Data available since the Greenbelt’s inception; crosses municipal borders: Stats Canada and Ag. Census data are challenging to use in this region (borders not contiguous with CMAs)
Corresponds to municipal borders, matching Stats Can and Ag. Census regions, has been producing reports for several years
Corresponds to municipal borders, matching Stats Can and Ag. Census regions, new research underway, DSF report for environmental goods
Number of sources for data
David Suzuki Foundation,
David Suzuki Foundation,
David Suzuki Foundation,

City Region Food System Toolkit Assessing and planning sustainable city region food systems
54
Greenbelt Fund reports, Dollars and Sense with other foundations
Greenbelt Fund reports, Dollars and Sense with other foundations, Stats Can and Ag. Census data, detailed reports from Planscape and others
Greenbelt Fund reports, Dollars and Sense with other foundations, Stats Can and Ag. Census data, few reports available as data collection is underway now by GGHFFA
Applicability of census data (does it cut across census lines)
crosses municipal borders: Stats Canada and Ag. Census data are challenging to use
Corresponds to municipal borders, matching Stats Can and Ag. Census regions, has been producing reports for several years
Corresponds to municipal borders, matching Stats Can and Ag. Census regions
Summary Although each approach has merits, the Golden Horseshoe or the expanded Greater Golden Horseshoe hold more relevance for this study, with greater policy impact from a focus on the Greater Golden Horseshoe. The Greenbelt area does not correspond to municipal, economic (food market) or agricultural boundaries, so access to this data and the use of census material would be challenging. Both the GH and GGH correspond to census regions. In addition, agricultural lands have been demonstrated to exist on both sides of the Greenbelt boundary, with similar access to urban markets and growing populations. An agricultural economy would encompass these areas as well, and would be based more on transportation and infrastructure options rather than environmentally sensitive areas. Finally, the Greenbelt area may expand soon, and old reports based on the initial boundaries will be outdated. Excellent work is available from the Greater Golden Horseshoe Food and Farming Alliance on the Golden Horseshoe and is now underway for the larger area. The material comes from a range of sources, including environmental impact reports from the David Suzuki Foundation (including Greenbelt focused and more recently GH focused reports). From the point of view of input to policy development, this area also seems to be receiving important attention with a coalition of urban and rural actors. In all cases, although Toronto and the GTA was left out of the last agricultural census, separate reports exist from various sources, in particular from Toronto Food Strategy and the Toronto Food Policy Council at Toronto Public Health. The Greater Golden Horseshoe seems to offer the best data, the most policy relevance, and integration with ongoing important work by the GGHFFA. However, some important work (for instance, environmentally focused reports from the Greenbelt Fund) does not correspeond to the area but should nonetheless be addressed and included. Overall, a combination of areas

City Region Food System Toolkit Assessing and planning sustainable city region food systems
55
with a principal focus on the Greater Golden Horseshoe will probably best address the needs for the City Region Food System Assessment for Toronto. 3 boundary options for the Toronto CRFS project:
1. The greenbelt
2. The golden horseshoe

City Region Food System Toolkit Assessing and planning sustainable city region food systems
56
3. The Greater Golden Horseshoe
(Source: Neptis Foundation 2014)

City Region Food System Toolkit Assessing and planning sustainable city region food systems
57
Tool/Example:
Stakeholder Interview Types
Author(s): Sally Miller, Toronto CRFS Project Coordinator Project: RUAF – Wilfrid Laurier CityFoodTools Introduction to the joint programme This tool is part of the City Region Food Systems (CRFS) toolkit to assess and plan sustainable city region food systems. The toolkit has been developed by FAO, RUAF Foundation and Wilfrid Laurier University with the financial support of the German Federal Ministry of Food and Agriculture and the Daniel and Nina Carasso Foundation. Link to programme website and toolbox http://www.fao.org/in-action/food-for-cities-programme/overview/what-we-do/en/ http://www.fao.org/in-action/food-for-cities-programme/toolkit/introduction/en/
http://www.ruaf.org/projects/developing-tools-mapping-and-assessing-sustainable-city-region-food-systems-cityfoodtools
Tool summary:
Tool description: This table allowed the Toronto team to ‘count’ the number of stakeholders proposed for interviews. The table includes columns for points along the food chain and rows for possible stakeholders. Stakeholders include: government, public institutions, non-governmental organisations, round tables, commissions, sector associations, foundations and funding organisations, community groups, lobby groups, education organisations, consulting groups, research groups, think tanks, marketing groups and private businesses. The goal of
Brief description This table allowed the Toronto team to ‘count’ the number of stakeholders proposed for interviews. The goal of developing this table was to identify where there were gaps and/or over-representation in the stakeholder group.
Expected outcome Decisions about the CRFS study boundaries, impacts and next steps.
Expected Output Meeting notes including preliminary decisions about project boundaries, impact analysis and suggestions for next steps.
Scale of application Project level
Expertise required for application
Project management
Examples of application
Toronto and Greater Golden Horseshoe
Year of development 2015
References -
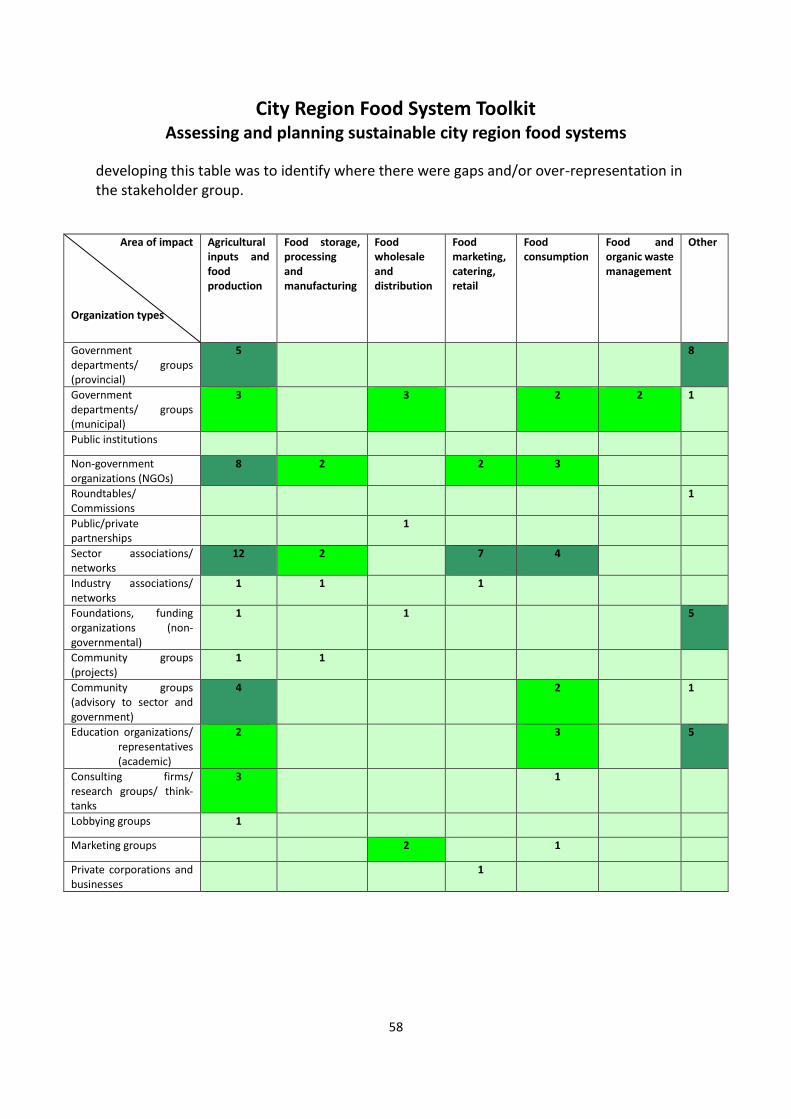
City Region Food System Toolkit Assessing and planning sustainable city region food systems
58
developing this table was to identify where there were gaps and/or over-representation in the stakeholder group.
Area of impact Organization types
Agricultural inputs and food production
Food storage, processing and manufacturing
Food wholesale and distribution
Food marketing, catering, retail
Food consumption
Food and organic waste management
Other
Government departments/ groups (provincial)
5 8
Government departments/ groups (municipal)
3 3 2 2 1
Public institutions
Non-government organizations (NGOs)
8 2 2 3
Roundtables/ Commissions
1
Public/private partnerships
1
Sector associations/ networks
12 2 7 4
Industry associations/ networks
1 1 1
Foundations, funding organizations (non-governmental)
1 1 5
Community groups (projects)
1 1
Community groups (advisory to sector and government)
4 2 1
Education organizations/ representatives (academic)
2 3 5
Consulting firms/ research groups/ think-tanks
3 1
Lobbying groups 1
Marketing groups 2 1
Private corporations and businesses
1
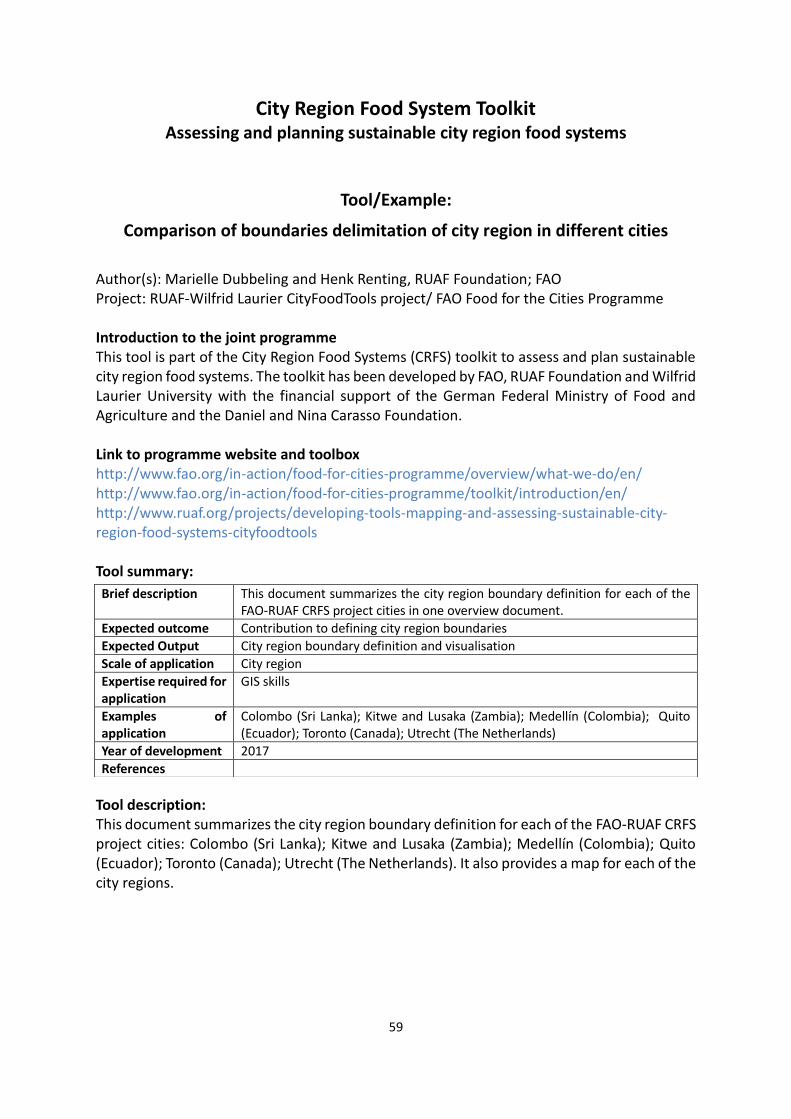
City Region Food System Toolkit Assessing and planning sustainable city region food systems
59
Tool/Example:
Comparison of boundaries delimitation of city region in different cities
Author(s): Marielle Dubbeling and Henk Renting, RUAF Foundation; FAO Project: RUAF-Wilfrid Laurier CityFoodTools project/ FAO Food for the Cities Programme Introduction to the joint programme This tool is part of the City Region Food Systems (CRFS) toolkit to assess and plan sustainable city region food systems. The toolkit has been developed by FAO, RUAF Foundation and Wilfrid Laurier University with the financial support of the German Federal Ministry of Food and Agriculture and the Daniel and Nina Carasso Foundation. Link to programme website and toolbox http://www.fao.org/in-action/food-for-cities-programme/overview/what-we-do/en/ http://www.fao.org/in-action/food-for-cities-programme/toolkit/introduction/en/
http://www.ruaf.org/projects/developing-tools-mapping-and-assessing-sustainable-city-region-food-systems-cityfoodtools Tool summary:
Tool description: This document summarizes the city region boundary definition for each of the FAO-RUAF CRFS project cities: Colombo (Sri Lanka); Kitwe and Lusaka (Zambia); Medellín (Colombia); Quito (Ecuador); Toronto (Canada); Utrecht (The Netherlands). It also provides a map for each of the city regions.
Brief description This document summarizes the city region boundary definition for each of the FAO-RUAF CRFS project cities in one overview document.
Expected outcome Contribution to defining city region boundaries
Expected Output City region boundary definition and visualisation
Scale of application City region
Expertise required for application
GIS skills
Examples of application
Colombo (Sri Lanka); Kitwe and Lusaka (Zambia); Medellín (Colombia); Quito (Ecuador); Toronto (Canada); Utrecht (The Netherlands)
Year of development 2017
References

City Region Food System Toolkit Assessing and planning sustainable city region food systems
60
Examples of application:
City City region Colombo, Sri Lanka
The Western Province or “Western Megapolis” region is a new, very recent, administrative unit for regional economic development in the Western Province. This administrative unit will replace that of Colombo Metropolitan Region and explicitly refers to city region development, although it does not yet address food issues. The megalopolis area will be the most suitable territorial area when (food system) land use planning is concerned. (Source: IWMI)
Lusaka, Zambia
For Lusaka, the city region was defined taking into account nearby production areas for main commodities consumed in the city, including fruits & vegetables, livestock (beef, poultry, pork), dairy products and fish. The city region thus involves Lusaka province and its neighbouring districts, an area that had already been identified as a new future area for joint development planning. (Source: Lusaka CRFS Workshop 2015)
Kitwe, Zambia In Kitwe, the city region was defined to
encompass the city of Kitwe and its adjoining food production areas, including the districts of Chambeshi, Kalulushi, Luanshya, Mufulira and Ndola, mainly situated in the Copperbelt province. It is acknowledged that the city region is dependent on complementary food supply from more distant areas for specific agriculture and livestock/poultry products. (Source: Lusaka CRFS Workshop 2015)

City Region Food System Toolkit Assessing and planning sustainable city region food systems
61
Medellin, Colombia
The city region is defined as a group of 31 municipalities in the Province of Antioquia, that according to different criteria play a key role in the food provisioning of Medellin City and the surrounding Aburra valley: i) food provisioning: municipalities contributing more than 1% to food flows reaching wholesale markets in Aburra valley; ii) food production: municipalities contributing more than 1% of the total provincial food production; iii) proximity: municipalities in the Aburra valley with any agricultural production; iv) areas of agricultural expansion, v) municipalities with an important political role in territorial governance. (Source: FAO)
Quito, Ecuador
The Province of Pichincha is identified as the most appropriate scale of the city region. The three rings in the image identify the degree of self-sufficiency consumption of food for the given territory (ring). It compares total food consumption (by weight) of the population in the given territory for specific products with actual production in that area. Consumption figures are based on household consumption data multiplied by population figures. Production data are based on data from agricultural census. The calculation does not account for any food imports or exports. The second ring was identified as the city region as it includes key production areas, major food processing industry and allows for cross-jurisdictional planning coordination between the city of Quito, surrounding municipalities and the Province. (Source: CONQUITO, 2017)
Toronto, Canada
The city region encompasses the Greater Golden Horseshoe area: Toronto city + surrounding peri-urban and rural region. This area is a recognised territorial area, and as such data exist for this area and joint land use and regional planning is already taking place. (Source: Neptis Foundation 2014)

City Region Food System Toolkit Assessing and planning sustainable city region food systems
62
Utrecht, The Netherlands
The city region is defined as the U10 region, which is an inter-municipal platform of the city of Utrecht and 9 neighbouring municipalities which whom Utrecht already collaborates in other policy areas. (Source: Basisregistratie Topografie, Kadaster, 2017)

City Region Food System Toolkit Assessing and planning sustainable city region food systems
63
Vision

City Region Food System Toolkit Assessing and planning sustainable city region food systems
64
Tool/Example:
Toronto –Project Visioning Chart
Author(s): Sally Miller, Toronto CRFS Project Coordinator Project: RUAF – Wilfrid Laurier CityFoodTools Introduction to the joint programme This tool is part of the City Region Food Systems (CRFS) toolkit to assess and plan sustainable city region food systems. The toolkit has been developed by FAO, RUAF Foundation and Wilfrid Laurier University with the financial support of the German Federal Ministry of Food and Agriculture and the Daniel and Nina Carasso Foundation. Link to programme website and toolbox http://www.fao.org/in-action/food-for-cities-programme/overview/what-we-do/en/ http://www.fao.org/in-action/food-for-cities-programme/toolkit/introduction/en/ http://www.ruaf.org/projects/developing-tools-mapping-and-assessing-sustainable-city-region-food-systems-cityfoodtools
Tool summary:
Tool description: The vision chart is an outcome of a Toronto Task Force focus group meeting to determine possible City Region Food System activities. It was developed at the start of the CRFS project to align a common vision on ultimate CRFS outcomes and to generate a joint understanding of what type of information and data could be analysed and what type of stakeholders could be engaged in the process. The chart was completed following the definition of an overarching project vision (‘Healthy food for all, sourced as regionally as possible and as sustainably produced, processed, packaged, and distributed as possible’) using sustainability
Brief description This vision chart was developed at the start of the CRFS project to determine possible City Region Food System activities.
Expected outcome To align a common vision on ultimate CRFS outcomes and to generate a joint understanding of what type of information and data could be analysed and what type of stakeholders could be engaged in the process.
Expected Output To generate a joint understanding of what type of information and data could be analysed and what type of stakeholders could be engaged in the process.
Scale of application Project level
Expertise required for application
Project management
Examples of application
Toronto and Greater Golden Horseshoe
Year of development 2015
References -

City Region Food System Toolkit Assessing and planning sustainable city region food systems
65
goals applied across the food chain. The sustainability goals were captured as: Improve health, well-being and social sustainability; Increase economic growth, jobs and agricultural viability, and; Improve stewardship of resources and land based management. The value chain categories include: Agricultural inputs and production; Storage, processing and manufacturing; Wholesale and distribution; Marketing, catering and retail; Consumption; Organic waste management; Food and farm policy; Democratic engagement, and; Education. The circles on the inside of the diagram were written on sticky notes as part of a brainstorming exercise and then aligned within the sustainability/food chain framework. It should be noted that the building of much more detailed vision at this stage in the process was possible in Toronto as the Toronto Task Force could build on earlier food systems work. In cities where such previous work and engagement does not exist, formulation of more detailed vision and sustainability dimensions may only take place later in the process. However, a more global project vision can be established as the process begins based on the materials provided in this toolkit. (See next page for the sample visioning tool)

City Region Food System Toolkit Assessing and planning sustainable city region food systems
66
(Source: Toronto Public Health)

City Region Food System Toolkit Assessing and planning sustainable city region food systems
67
CRFS Scan

City Region Food System Toolkit Assessing and planning sustainable city region food systems
68
Tool/Example:
Consultative stakeholder workshops to Map CRFS stakeholders and Identify local priorities
Author(s): FAO Project: FAO Food for the Cities Introduction to the joint programme This tool is part of the City Region Food Systems (CRFS) toolkit to assess and plan sustainable city region food systems. The toolkit has been developed by FAO, RUAF Foundation and Wilfrid Laurier University with the financial support of the German Federal Ministry of Food and Agriculture and the Daniel and Nina Carasso Foundation. Link to programme website and toolbox http://www.fao.org/in-action/food-for-cities-programme/overview/what-we-do/en/ http://www.fao.org/in-action/food-for-cities-programme/toolkit/introduction/en/
http://www.ruaf.org/projects/developing-tools-mapping-and-assessing-sustainable-city-region-food-systems-cityfoodtools Tool summary:
1. Experts consultation for stakeholders mapping
Tool description A consultation with the main stakeholders involved in the food system can be used to conduct
a stakeholder mapping and analysis. First of all, the participants are asked to list and categorize
the stakeholders involved in the food system, based on, for instance, the following categories:
Direct participants in the food value chain (corporate entities, civil society, traders and
Brief description Consultative workshops aim to collect qualitative data and/or come to a multistakeholder agreement on a specific topic. It can be used for different purposes: i) Identify the stakeholders involved in the city region food systems, their roles
and linkages; ii) Identify local priorities to focus on for further analysis.
Expected outcome i) Identification of local priorities for assessment or policy planning phases. ii) Identification of key research questions, data and information sources, data collection instruments.
Expected Output Preliminary roadmap for assessment phase.
Scale of application City region (municipal, district, province)
Expertise required for application
Examples of application
Lusaka and Kitwe (Zambia), Colombo (Sri Lanka)
Year of development 2016
References -

City Region Food System Toolkit Assessing and planning sustainable city region food systems
69
producer representatives that provide technical services and inputs to farmers), organisations
that provide awareness and communication (farmer organisations and other civil society
organizations), institutions and organisations that formulate, influence and implement policies
and legislation, institutions and organisations that have advisory roles (academia and research
institutes), elected officials (the elected officials within the CRFS are several and from different
political persuasions). Location and roles of each stakeholder are provided. Secondly, the
participants are asked to specify the responsabilities/obligations, and collaborators of each
identified stakeholder. A preliminary stakeholder map can then be generated.

City Region Food System Toolkit Assessing and planning sustainable city region food systems
70
Examples of application: Kitwe (Zambia) Stakeholder roles, responsibilities and collaborative framework:
Stakeholder Role in food production, marketing, consumption,
nutrition, storage & distribution
Responsibilities / Obligations Collaborators
Kitwe District Education
Board
Training of community members; sensitization ;
scaling up of production units in school in order to
contribute to CRFS.
Mandated to promote good health and
nutrition in Schools and communities
through implementation of various
policies including Educating our Future
(1996) & School Health and Nutrition
Policy (SHN).
Ministry of Agriculture for technical support
and provide technical training, inputs in
agriculture production and nutrition; NGOs,
CBOs and community agents involved in
nutrition and food production programs.
Kitwe District
Community Health
Office
Monitoring aspects related to nutrition of children
and pregnant mothers; provision of food packs to
HIV & AIDS, TB & pregnant women from poor
households.
To effectively and efficiently facilitate
provision of equitable social protection
and quality primary health care
services to communities in order to
contribute to sustainable human
development; & to provide equity of
access to cost effective, quality
healthcare as close to the family as
possible.
KCC, ZPCTII, JSI, WHO, UNICEF, CSO, Ministry
of Education, and CHAZ.
District Agricultural
Office
National policy & legislation formulation, technical
service provider, assessment of production.
Farmer support. Rural & urban producers, crop marketers,
financial & training institutions, other
government depts., civil society
organisations, international organizations.
Kitwe City Council (KCC) Local development & social policy & legislation
formulation, management of the city, logistics,
Provision of a conducive city service,
infrastructure & environment for the
Local community organisations, civil society,
national government, private sector, farmers
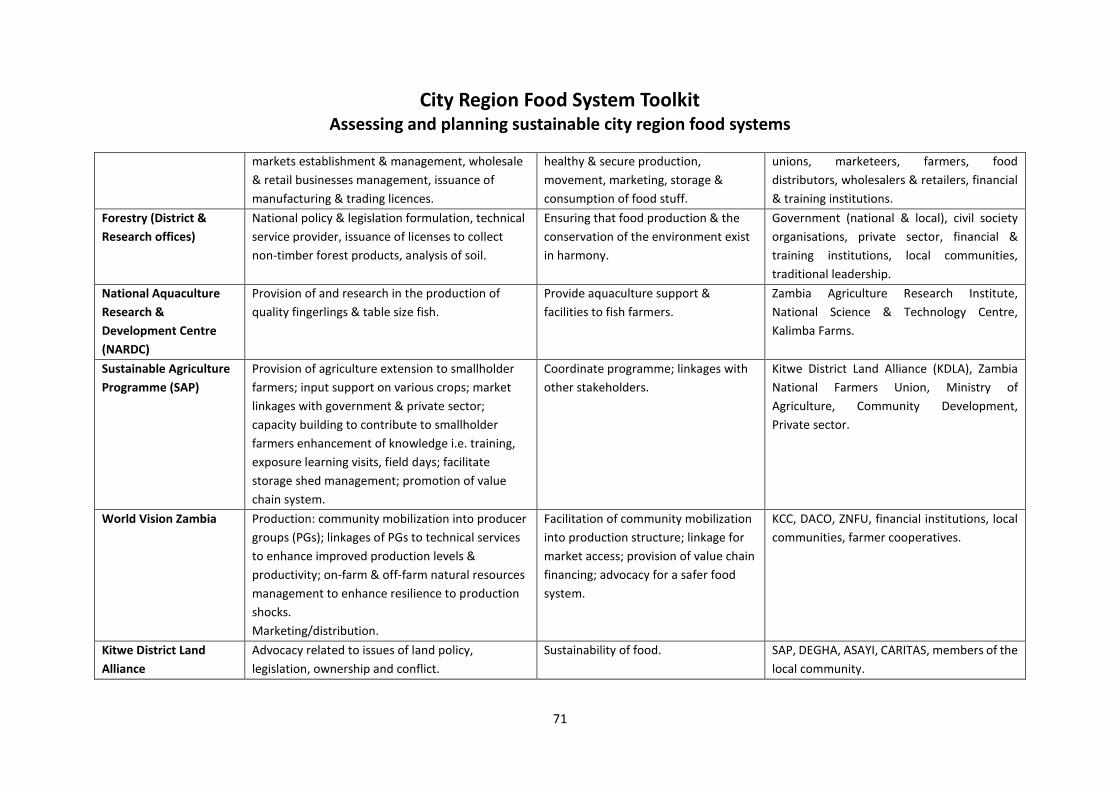
City Region Food System Toolkit Assessing and planning sustainable city region food systems
71
markets establishment & management, wholesale
& retail businesses management, issuance of
manufacturing & trading licences.
healthy & secure production,
movement, marketing, storage &
consumption of food stuff.
unions, marketeers, farmers, food
distributors, wholesalers & retailers, financial
& training institutions.
Forestry (District &
Research offices)
National policy & legislation formulation, technical
service provider, issuance of licenses to collect
non-timber forest products, analysis of soil.
Ensuring that food production & the
conservation of the environment exist
in harmony.
Government (national & local), civil society
organisations, private sector, financial &
training institutions, local communities,
traditional leadership.
National Aquaculture
Research &
Development Centre
(NARDC)
Provision of and research in the production of
quality fingerlings & table size fish.
Provide aquaculture support &
facilities to fish farmers.
Zambia Agriculture Research Institute,
National Science & Technology Centre,
Kalimba Farms.
Sustainable Agriculture
Programme (SAP)
Provision of agriculture extension to smallholder
farmers; input support on various crops; market
linkages with government & private sector;
capacity building to contribute to smallholder
farmers enhancement of knowledge i.e. training,
exposure learning visits, field days; facilitate
storage shed management; promotion of value
chain system.
Coordinate programme; linkages with
other stakeholders.
Kitwe District Land Alliance (KDLA), Zambia
National Farmers Union, Ministry of
Agriculture, Community Development,
Private sector.
World Vision Zambia Production: community mobilization into producer
groups (PGs); linkages of PGs to technical services
to enhance improved production levels &
productivity; on-farm & off-farm natural resources
management to enhance resilience to production
shocks.
Marketing/distribution.
Facilitation of community mobilization
into production structure; linkage for
market access; provision of value chain
financing; advocacy for a safer food
system.
KCC, DACO, ZNFU, financial institutions, local
communities, farmer cooperatives.
Kitwe District Land
Alliance
Advocacy related to issues of land policy,
legislation, ownership and conflict.
Sustainability of food. SAP, DEGHA, ASAYI, CARITAS, members of the
local community.
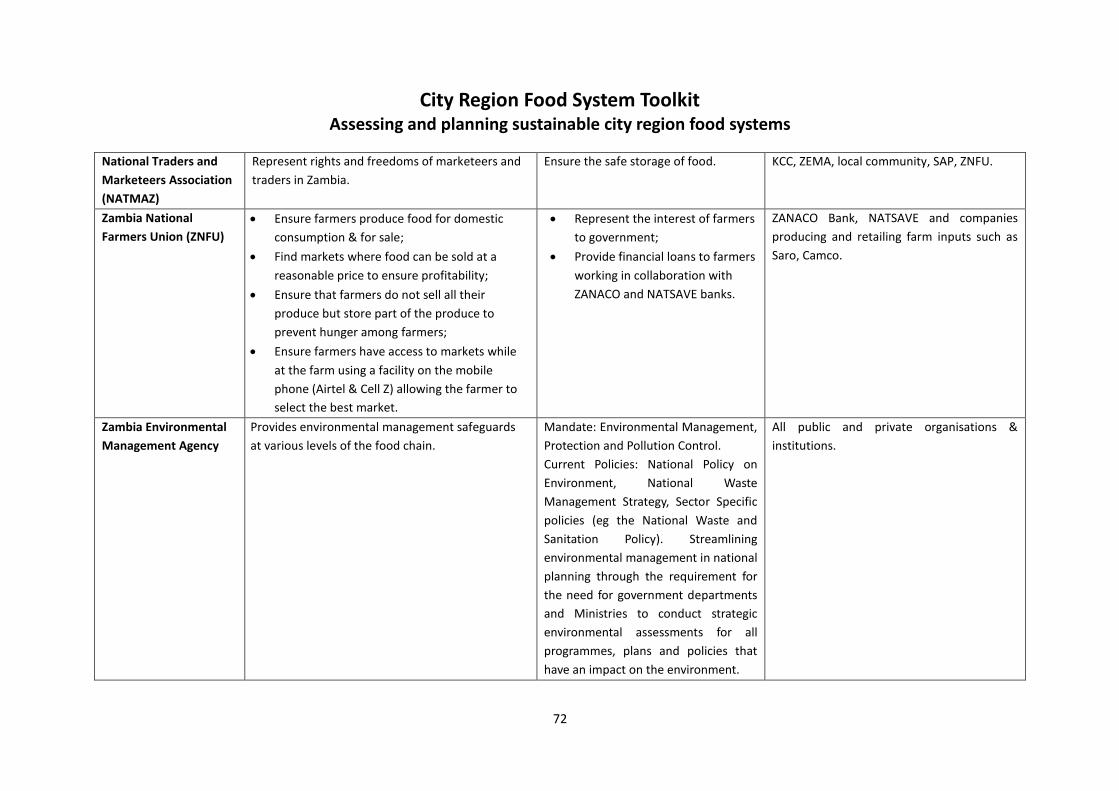
City Region Food System Toolkit Assessing and planning sustainable city region food systems
72
National Traders and
Marketeers Association
(NATMAZ)
Represent rights and freedoms of marketeers and
traders in Zambia.
Ensure the safe storage of food. KCC, ZEMA, local community, SAP, ZNFU.
Zambia National
Farmers Union (ZNFU)
Ensure farmers produce food for domestic
consumption & for sale;
Find markets where food can be sold at a
reasonable price to ensure profitability;
Ensure that farmers do not sell all their
produce but store part of the produce to
prevent hunger among farmers;
Ensure farmers have access to markets while
at the farm using a facility on the mobile
phone (Airtel & Cell Z) allowing the farmer to
select the best market.
Represent the interest of farmers
to government;
Provide financial loans to farmers
working in collaboration with
ZANACO and NATSAVE banks.
ZANACO Bank, NATSAVE and companies
producing and retailing farm inputs such as
Saro, Camco.
Zambia Environmental
Management Agency
Provides environmental management safeguards
at various levels of the food chain.
Mandate: Environmental Management,
Protection and Pollution Control.
Current Policies: National Policy on
Environment, National Waste
Management Strategy, Sector Specific
policies (eg the National Waste and
Sanitation Policy). Streamlining
environmental management in national
planning through the requirement for
the need for government departments
and Ministries to conduct strategic
environmental assessments for all
programmes, plans and policies that
have an impact on the environment.
All public and private organisations &
institutions.

City Region Food System Toolkit Assessing and planning sustainable city region food systems
73
Colombo (Sri Lanka)
In Colombo, stakeholders were mapped in different ways, depending on their focus in the
value chain, in the sustainability of the food system, on their scale of action.
Public institutions based on their focused value chain activity: (source: IWMI)

City Region Food System Toolkit Assessing and planning sustainable city region food systems
74
Colombo city region food system stakeholders, based on their food system’s component main
focus: (source: IWMI)

City Region Food System Toolkit Assessing and planning sustainable city region food systems
75
2. Experts consultation to identify local priorities
Tool description
This approach has been developed and used to assist local stakeholders in identifying and
prioritize key areas for further in-depth analysis on the basis of the initial CRFS scan that
provides a first understanding of the main characteristic, constraints and knowledge gaps in
the CRFS. This process can be done through a consultative workshop with key stakeholders.
All relevant stakeholders from the food system need to be represented: public authorities,
private sector and civil society from different areas of work including from agricultural
production to consumption and food waste management. In a plenary discussion, participants
commonly agreed on a number local priorities. Participants are then divided in working groups,
one per key priority, to identify: key research questions or research issues, data and
information sources, data and information collection approaches and instruments. These
elements are of use for the in-depth assessment (CRFS Assessment phase) that can be
conducted after this step.
Examples of application:
Lusaka (Zambia):
In Lusaka, the stakeholders identified the 3 following key priorities to focus on. For each of the
theme, they identified collectively the main research issues, the data sources, and data
collection instruments.
Food distribution system
Under the food distribution system, the group identified the strategic role of infrastructure in
facilitating an efficient food distribution system. The group focused on distribution issues
from the farm gate to the consumers. The group proposed the following as key issues for the
next phase: markets, storage, and transportation infrastructure.
Research issues: Location and seasonality of food markets. The second issues were
about type and security of markets and also challenges faced by farmers to access
markets.
Data sources: Market management structures, food traders (marketeers), food
consumers, key informants such as traditional leaders and civic leaders.
Data collection instruments: Focus group discussion, personal interviews and
questionnaire.
The groups considered transport infrastructure as a separate category of infrastructure that
is essential for ensuring efficient food distribution system. The road sub-category of transport
infrastructure is of particular importance.

City Region Food System Toolkit Assessing and planning sustainable city region food systems
76
Research questions: Must establish the status of the roads, accessibility to the farms
and the markets.
Data sources: producers, village headmen, agricultural extension officers, Food
Reserve Agency and type of transport vis-à-vis the existing nature of transport
infrastructure.
Data collection instruments: Focus group discussion, personal interviews and
questionnaire.
Sustainable production
Research questions:
o The research questions should seek to establish farming practices by farmers:
Farming practices farmers use to produce food
Land preparation methods used by farmers
Methods of disease and pesticides control methods
Herbicides control methods
Crop rotation?
o Questions should seek to establish current harvesting techniques
Risk management mechanisms- insurance?
Post harvesting techniques and technologies- storage and quality
control
Land management in-between seasons
Quality control practices on the farm
o Skills and training: Have farmers undergone any training in sustainable
farming?
Type of training and by who
Frequency of training per given period
Management of natural resources such as water, forests/trees, land.
Focus on issues around irrigation and pasture land.
Data sources: Key informants such as agricultural extension officers, District
Agricultural Coordinators (DACOs), Ministry of Lands, Natural Resources and
Environmental Protection, and local councils. Other sources of data include farmers.
Data collection instruments: Structured questionnaire, interview guide, meetings and
secondary data.
Food security and consumption
Research issues: The question must focus on types of food mostly consumed by the
population of Lusaka. The questions should address the following:
o Food availability, accessibility and affordability
o Food quality
o Production methods
o Packaging

City Region Food System Toolkit Assessing and planning sustainable city region food systems
77
o Nutritional value
o Storage and preservation
o Quantity of food
o Supply and demand issues (prices and food inflation)
o Seasonality of food and the implications
o Methods of storing food for off season periods
o Distance to food sources
o Resilient systems in food consumption
Data sources:
o Markets
o Chain stores
o Households
o Strategic institutions such as Jesuit Centre for Theological Reflection and
Programme Against Malnutrition (PAM).
Data collection instruments
o Questionnaire (survey)
o Interviews with key informants
o Secondary data.

City Region Food System Toolkit Assessing and planning sustainable city region food systems
78
Tool/Example:
SWOT (Strengths, Weaknesses, Opportunities, Threats) approach for policy environment analysis
Author(s): FAO
Project: FAO Food for the Cities programme
Introduction to the joint programme
This tool is part of the City Region Food Systems (CRFS) toolkit to assess and plan sustainable
city region food systems. The toolkit has been developed by FAO, RUAF Foundation and Wilfrid
Laurier University with the financial support of the German Federal Ministry of Food and
Agriculture and the Daniel and Nina Carasso Foundation.
Link to programme website and toolbox
http://www.fao.org/in-action/food-for-cities-programme/overview/what-we-do/en/
http://www.fao.org/in-action/food-for-cities-programme/toolkit/introduction/en/
http://www.ruaf.org/projects/developing-tools-mapping-and-assessing-sustainable-city-
region-food-systems-cityfoodtools
Tool summary:
Tool description:
SWOT is an acronym for Strengths, Weaknesses, Opportunities, Threats. A SWOT analysis can
be used to analyze the policy and legal environment, for better target possible gaps and
identify areas of improvement.
Examples of application:
Colombo (Sri Lanka):
In Colombo, two SWOT analysis were used to evaluate the policy and legal environment. It
Brief description This tool gives an example on how to evaluate the policy and legal environment ruling the food system.
Expected outcome Identification of policy gaps and strengths.
Expected Output Policy and legal environment analysis report, including a SWOT table.
Scale of application City region, regional, national.
Expertise required for application
-
Examples of application
Colombo (Sri Lanka)
Year of development
References -

City Region Food System Toolkit Assessing and planning sustainable city region food systems
79
was particularly used to assess: the Food Act & Consumer Affairs Act, and the institutional
environment.
SWOT Analysis – Food Act & Consumer Affairs Act
Act Strengths Weaknesses Opportunities Threats
Food Act No. 26 of 1980
- Provides extensive authority to prevent sale of unsafe, adulterated, insanitary or misbranded food products. - Appointed food advisory committee controls all administration of the Food Act. - Provides power of entry to the authorized officers to eateries or food manufacturing establishments, inspect and take samples. - Laboratory facilities to do chemical analysis of food at CMC and Govt. analyst.
- Food Inspectors, PHI’s (Authorized officers) cannot give closure orders. Therefore lengthy court procedure to close eateries. - Insufficient fines. So the owners pay the fine and start the business again. - PHIs have no legal mandate to inspect the conditions of agricultural produces.
- Good Manufacturing Certificate for all food handling establishment is mandatory within Colombo Municipality Area.
- Poor visibility of Food Act enforcement. - Political interest is poor - Poor coordination among regulatory agencies.
Consumer Affairs Authority Act No.9 of 2003
- Provides regulations for the establishment of Consumer Affairs Authority. -Promote effective competition and protect the consumer. - Prices of articles or service declared as essential to the life of the community cannot be increased without the written approval of the Authority.
- Less effective as competition legislation without provision to investigate monopolies and mergers. - Too much power to the minister. - Penalties of fines and imprisonments for errant traders and manufacturers are not sufficient.
- Competition issues are in the curriculum of law and economics curriculum of universities and other professional institutes
- Lack of Financial and human resources with desired skills and qualifications. - Political interference

City Region Food System Toolkit Assessing and planning sustainable city region food systems
80
SWOT of Institutional Environment Sector Strengths Weaknesses Opportunities Threats
Food Production
Food production act no.40 of 1954 Sri Lanka National Agricultural Policy by Ministry of Agriculture and Agrarian Services (2007)
Address short term issues in agriculture. Value chains of food products are not considered. Absence of integrated strategy to implement the national agriculture policy.
Trained personal to at organizational level to implement the act and the policy.
Changes in the climatic factors affect the targets. Social dynamics and infrastructure development makes the policy outdated.
Food Importation
Import of food items is controlled by multiple regulations. i. Import and export control Act No.1 of 1969. ii. Food regulations 2001. iii. Customs ordinance and customs regulations. iv. Government budget and other special regulations.
Import taxes and tax exemptions changes time to time without considering the local production. Weaknesses in law enforcement.
Skilled and trained personnel at Government analyst Department and Department of Customs to check the imported food items prior to releasing to the market.
Authorized officials at the regulatory organizations do not do a proper job.
Environmental Protection
National Environment Act No.47 of 1980 National Climate Change Policy of Sri Lanka, Ministry of Environment (2012). National Land use Policy of Sri Lanka
Less penalties and imprisonments for accused. Absence of proper mechanism to implement land-use policy and climate change policy.
Infrastructure and trained human resources within the country.
Lack of awareness among farmers and food manufacturers on policies and acts on environment protection. Political interference.

City Region Food System Toolkit Assessing and planning sustainable city region food systems
81
Tool/Example:
Food Policy Structures
Author(s): Sally Miller, Toronto CRFS Project Coordinator
Project: RUAF – Wilfrid Laurier CityFoodTools
Introduction to the joint programme
This tool is part of the City Region Food Systems (CRFS) toolkit to assess and plan sustainable
city region food systems. The toolkit has been developed by FAO, RUAF Foundation and Wilfrid
Laurier University with the financial support of the German Federal Ministry of Food and
Agriculture and the Daniel and Nina Carasso Foundation.
Link to programme website and toolbox
http://www.fao.org/in-action/food-for-cities-programme/overview/what-we-do/en/
http://www.fao.org/in-action/food-for-cities-programme/toolkit/introduction/en/
http://www.ruaf.org/projects/developing-tools-mapping-and-assessing-sustainable-city-
region-food-systems-cityfoodtools
Tool summary:
Tool description:
This table is an example of the occurrence of various food policy tools, groups and other
food-related organisations by region in the Greater Golden Horseshoe. The table indicates
the presence of, lack of or stage of development for each food-related tool or institution. In
some cases, the title of the, for example, committee or tool is provided.
Brief description This table provides an example of the location of food policy tools, groups and other food-related organisations by region in the Greater Golden Horseshoe.
Expected outcome Deeper understanding of the food policy resources and organizations in a CRFS.
Expected Output The table will help to make decisions about how to connect existing resources and help identify where more support would be useful.
Scale of application Project level
Expertise required for application
Project management
Examples of application
Toronto and Greater Golden Horseshoe
Year of development 2015
References -

City Region Food System Toolkit Assessing and planning sustainable city region food systems
82
Food policy tool or organization
Food charter
Agriculture committee
Agri-food strategy
Food policy council
Local food maps
Municipal food security group
Guelph X
Chamber of Commerce Food and Agriculture Committee
in development X X (round table)
York X X in process X X Niagara in process X X in process X Halton X X X X X Simcoe City X X X Hamilton X X X X X X Durham X X X X X Peel in process X X X
Toronto X GTAAC Food strategy X X Toronto Food Strategy
Waterloo X food system plan X
Food System Roundtable
Wellington X in development X
Haldimand Norfolk X X
Brant X X Food System Coalition
Kawartha Lakes X X Ag action plan X
Kawartha Lakes Food Coalition
Dufferin in development interest X
Northumberland X Food Policy Committee X
Peterborough X
Peterborough Community Food Network X
Sustainable Peterborough

City Region Food System Toolkit Assessing and planning sustainable city region food systems
83
Tool/Example:
Key Food Assessment
Author(s): Sally Miller, Toronto CRFS Project Coordinator
Project: RUAF – Wilfrid Laurier CityFoodTools
Introduction to the joint programme
This tool is part of the City Region Food Systems (CRFS) toolkit to assess and plan sustainable
city region food systems. The toolkit has been developed by FAO, RUAF Foundation and Wilfrid
Laurier University with the financial support of the German Federal Ministry of Food and
Agriculture and the Daniel and Nina Carasso Foundation.
Link to programme website and toolbox
http://www.fao.org/in-action/food-for-cities-programme/overview/what-we-do/en/
http://www.fao.org/in-action/food-for-cities-programme/toolkit/introduction/en/
http://www.ruaf.org/projects/developing-tools-mapping-and-assessing-sustainable-city-
region-food-systems-cityfoodtools
Tool summary:
Tool description:
This table provides the criteria used to determine the key foods in the Greater Golden
Horseshoe as part of deciding which foods to study for the food flow mapping and analysis.
Brief description This table provides the criteria used to determine the key foods in the Greater Golden Horseshoe as part of deciding which foods to study for the food flow mapping and analysis.
Expected outcome Decisions about which foods to study for the food flow and mapping analysis. Based on this analysis, the score for each food was established. The foods with the highest score were then assessed using a food flow analysis as part of the CRFS in-depth assessment.
Expected Output Table to facilitate decision-making about which foods to use for food flow analysis.
Scale of application Project level
Expertise required for application
Project management
Examples of application
Toronto and Greater Golden Horseshoe
Year of development 2015
References -

City Region Food System Toolkit Assessing and planning sustainable city region food systems
84
Food categories include meat, grains, dairy, fruits and vegetables. Attributes used to assess
the potential for each food for food flow analysis were: the opportunity for import
substitution; commonness of food; level of data available; and the match of food to GGH
demographics using ethno-cultural among other considerations. Based on this analysis, the
score for each food was established. The foods with the highest score were then assessed
using a food flow analysis as part of the CRFS in-depth assessment.
Top foods assessment table
Attribute Fresh food type
Health implications (Desjardins 2010 or Cummings; nutritious food basket)
First note shows if increase is recommended for optimal food intake;
Second note identifies whether the item is included in the Nutritious Food Basket
Opportunity for import substitution Yes= enough produced to cover consumption No= not enough to cover consumption Yellow: hard to expand production due to climate or other challenges
Common-ness of food across different groups
Level of data available
Match of food to GGH demo-graphics (ethno-cultural?)
Number of positive attributes for research out of 5 Top ratings (4,5) are in green
Sheep/ lamb n/a; no no no available ethno-cultural
2
Beef n/a; yes no high available yes 4
Chicken n/a; yes yes (note that weakening of supply management has led to increased imports which could be supplied locally)
high available yes 5
Pork n/a; yes yes high low yes 4
Turkey n/a; no yes no low no 1
Milk No change; yes yes high low yes 3
Eggs n/a; yes yes high low yes 4
Wheat decrease; yes (bread, flour)
yes high low yes 4
Oats Increase; no yes no low no 2
Barley n/a; no yes no low no 1
Soybean n/a; no yes high low yes 3
Apples Increase; yes some high high yes 5 (preference for imported varieties is a problem)
Grapes n/a; yes no high available yes 4 (wine vs. table grapes is a problem)
Peaches n/a; no no no available no 1
Strawberries Increase; yes (frozen)
no high available yes 4
Cabbage Increase; yes no high available ethno-cultural
3

City Region Food System Toolkit Assessing and planning sustainable city region food systems
85
Beans Increase; yes (frozen)
yes no available no 3
Potatoes Increase; yes no high available yes 4
Carrots Increase; yes yes high high (one county source)
yes 5
Sweet corn increase; no yes high high yes 4
Tomatoes Increase; yes no high available yes 4
Peppers Increase; yes no high available yes 4
Onions n/a; yes yes (Simcoe) high available yes 5
Desjardins:
Rye increase; no yes no no no 1
Broccoli Increase; yes some no no no 2
Bok choy increase; no little no no ethno-cultural
1
Squash Increase; yes some no no ethno-cultural
3
Peas Increase; yes (frozen)
yes no no no 2 (frozen)
Lettuce Increase; yes little high no yes 3
Melons Increase; yes little high no yes 3
Other berries increase; no some no no no 2
White beans increase; no yes no no no 2
Asparagus increase; no little no no no 1

City Region Food System Toolkit Assessing and planning sustainable city region food systems
86
Tool/Example:
Literature review for CRFS scan
Author(s): FAO
Project: FAO Food for the Cities programme
Introduction to the joint programme
This tool is part of the City Region Food Systems (CRFS) toolkit to assess and plan sustainable
city region food systems. The toolkit has been developed by FAO, RUAF Foundation and Wilfrid
Laurier University with the financial support of the German Federal Ministry of Food and
Agriculture and the Daniel and Nina Carasso Foundation.
Link to programme website and toolbox
http://www.fao.org/in-action/food-for-cities-programme/overview/what-we-do/en/
http://www.fao.org/in-action/food-for-cities-programme/toolkit/introduction/en/
http://www.ruaf.org/projects/developing-tools-mapping-and-assessing-sustainable-city-
region-food-systems-cityfoodtools
Tool summary:
Tool description
A literature review can also be conducted to get an initial snapshot of the local context, and
build the basis for further data collection and analysis. This first literature review contributes
in the identification of the main challenges the city region is facing in terms of food, and the
main priorities to focus on for a more in-depth assessment.
The city regions of Colombo (Sri Lanka), Lusaka (Zambia) and Kitwe (Zambia) have conducted
Brief description Literature review aims at collecting secondary data. It can be used to develop an overall view and description of the local context and to start characterising the city region food system.
Expected outcome Identification the main dynamics in the city region and setting the scene for a more in-depth assessment on key challenges.
Expected Output Production of situational analysis report, including maps, policy frameworks and maps.
Scale of application City region (municipal, district, province), regional, national.
Expertise required for application
-
Examples of application
Lusaka (Zambia), Kitwe (Zambia), Colombo (Sri Lanka)
Year of development 2015
References -

City Region Food System Toolkit Assessing and planning sustainable city region food systems
87
this first literature review. The review was organized in 3 parts: snapshop of local context, legal
and policy framework, and characterization of the CRFS. Different types of information were
collected depending on the data available.
Examples of application
Kitwe (Zambia)
In Kitwe, the following areas were looked at when conducting the literature review for the
CRFS scan:
1. National policy
and legal framework
National development framework
Environment and natural resources policies and legal framework
Energy policy and legislation
Land policy and legal framework
Agriculture policy and legislation
City by-laws
Institutions and service organizations 2. Snapshot of the
local context Population in the core and peripheral city region food system
Economy and poverty in the core and peripheral region 3. City region food
system characterization
Natural resources, land use and cover, climate change mitigation and adaptation
The agriculture and food value chain in the Kitwe CRFS
Input supply and food production
Food storage, processing and manufacturing
Food wholesale and distribution
Food marketing, catering and retail
Food consumption, safety and nutrition
Food and organic waste management
Health, health facilities, water and sanitation

City Region Food System Toolkit Assessing and planning sustainable city region food systems
88
Lusaka (Zambia)
In Lusaka, the following areas were looked at when conducting the literature review for the
CRFS scan:
1. Snap-shot of the
local context
Lusaka district: location and land, land use institutional and legal framework, water resources, surface water, underground water, water resources institutional and legal structure, forests, forest resources institutional and legal structure, road infrastructure, road infrastructure institutional and legal structure, airport and air transport, land tenure, conversions, demographics, local leadership and representation, governance and land use management in Lusaka.
Kafue district: geographical location, climate , topography, hydrology, wildlife and vegetation, forest reserves, land and land use, land tenure, roads and transport, mining.
Chongwe district: location, topography, soil types and climate, forest types and reserves, land tenure.
Chibombo district: location, climate, topography, vegetation and soils, hydrology, land tenure, roads and transport.
Chilanga district: location, topography, climate, hydrology and vegetation.
2. National policy and legal framework
Institutional and legislative framework relevant to the local food system
General descriptions of individual legislation 3. City region food
system characterization
Input supply and food production
Food production and consumption in Lusaka
Food storage, processing and manufacturing
Food wholesale and distribution
Retailing and marketing
Consumption
Food waste and management

City Region Food System Toolkit Assessing and planning sustainable city region food systems
89
Colombo (Sri Lanka)
In Colombo, the following areas were looked at when conducting the literature review for the
CRFS scan:
1. Legal & Policy
Framework
Food legislations framework
National Regulations
National Level Laws and regulations
National Policies and Strategic plans relating to food system
Colombo Municipal Council Food regulations
Current Regulation framework of Colombo Food system
Current Regulation framework of Provincial Councils (Under 13th amendment to 1978 constitution)
Current Regulation framework of Colombo Municipal Council
2. Snap shot of local context
Introduction to Colombo Municipal Council (CMC)
Population in Colombo and Western Province
Socio-Cultural Profile of Colombo City Region, including age and gender diversity, ethnic diversity, religious diversity, education level, living environment, poverty, economic engagement, income level, etc.
3. Characterization of Colombo CRFS
Identification of major food commodities- There are 12-13 major commodities identified for Colombo district that complies much with the commodities in national level.
Food and Nutrition Security, including malnutrition among children
Food printers and supply chain of food items (pics in Situational Report)
Food storage, processing and wholesale
Food waste
Food safety
Natural Resource Management and Climate Change
Strengths and vulnerabilities of the city region food system

City Region Food System Toolkit Assessing and planning sustainable city region food systems
90
Tool/Example:
Literature Review Table
Author(s): Sally Miller, Toronto CRFS Project Coordinator
Project: RUAF – Wilfrid Laurier CityFoodTools
Introduction to the joint programme
This tool is part of the City Region Food Systems (CRFS) toolkit to assess and plan sustainable
city region food systems. The toolkit has been developed by FAO, RUAF Foundation and Wilfrid
Laurier University with the financial support of the German Federal Ministry of Food and
Agriculture and the Daniel and Nina Carasso Foundation.
Link to programme website and toolbox
http://www.fao.org/in-action/food-for-cities-programme/overview/what-we-do/en/
http://www.fao.org/in-action/food-for-cities-programme/toolkit/introduction/en/
http://www.ruaf.org/projects/developing-tools-mapping-and-assessing-sustainable-city-
region-food-systems-cityfoodtools
Tool summary:
Tool description:
This table provides a list of all the identified available data sources for the Greater Golden
Horseshoe and Toronto as well as some national level information. The Toronto literature
review required approximately 150 hours to complete. It includes the names of reports,
publication dates, and website links where available.
Brief description This table provides a list of all the identified available data sources for the Greater Golden Horseshoe and Toronto as well as some national level information.
Expected outcome Consolidated list of data available across the food chain including web links as appropriate.
Expected Output This table allows for a more holistic understanding of data availability and gaps for a CRFS.
Scale of application Project level
Expertise required for application
Project management
Examples of application
Toronto and Greater Golden Horseshoe
Year of development 2015
References -
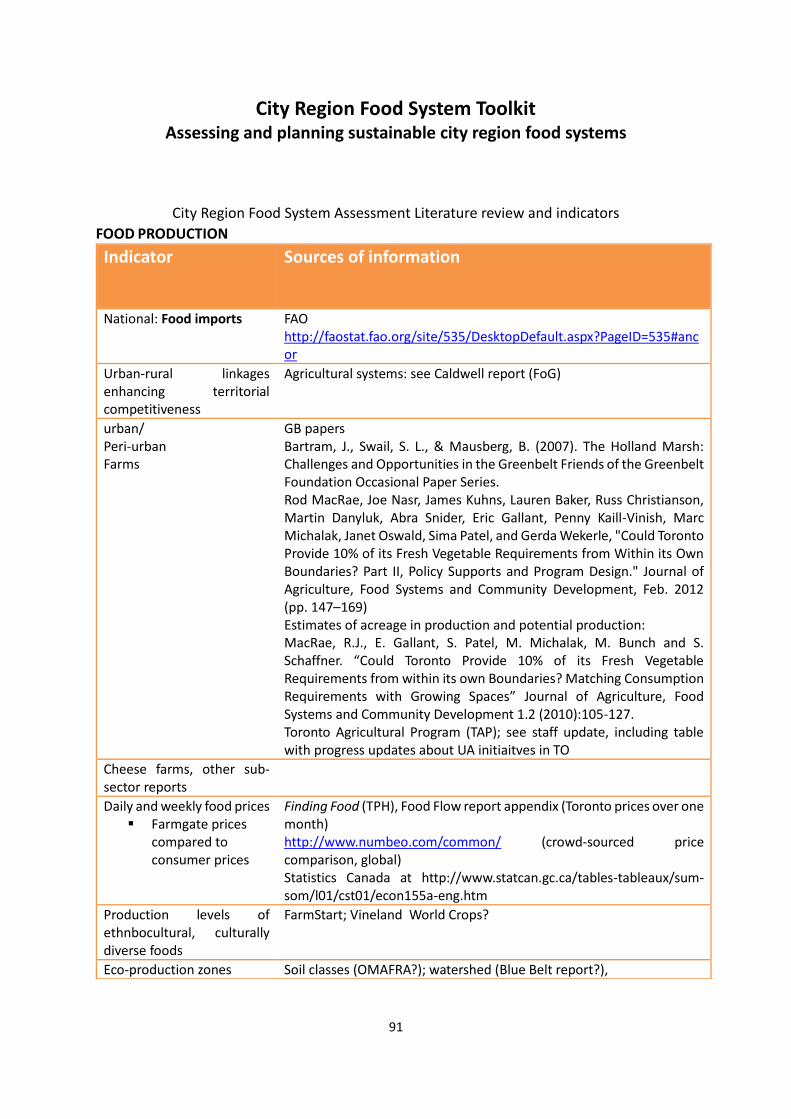
City Region Food System Toolkit Assessing and planning sustainable city region food systems
91
City Region Food System Assessment Literature review and indicators
FOOD PRODUCTION
Indicator Sources of information
National: Food imports FAO http://faostat.fao.org/site/535/DesktopDefault.aspx?PageID=535#ancor
Urban-rural linkages enhancing territorial competitiveness
Agricultural systems: see Caldwell report (FoG)
urban/ Peri-urban Farms
GB papers Bartram, J., Swail, S. L., & Mausberg, B. (2007). The Holland Marsh: Challenges and Opportunities in the Greenbelt Friends of the Greenbelt Foundation Occasional Paper Series. Rod MacRae, Joe Nasr, James Kuhns, Lauren Baker, Russ Christianson, Martin Danyluk, Abra Snider, Eric Gallant, Penny Kaill-Vinish, Marc Michalak, Janet Oswald, Sima Patel, and Gerda Wekerle, "Could Toronto Provide 10% of its Fresh Vegetable Requirements from Within its Own Boundaries? Part II, Policy Supports and Program Design." Journal of Agriculture, Food Systems and Community Development, Feb. 2012 (pp. 147–169)
Estimates of acreage in production and potential production: MacRae, R.J., E. Gallant, S. Patel, M. Michalak, M. Bunch and S. Schaffner. “Could Toronto Provide 10% of its Fresh Vegetable Requirements from within its own Boundaries? Matching Consumption Requirements with Growing Spaces” Journal of Agriculture, Food Systems and Community Development 1.2 (2010):105-127. Toronto Agricultural Program (TAP); see staff update, including table with progress updates about UA initiaitves in TO
Cheese farms, other sub-sector reports
Daily and weekly food prices Farmgate prices
compared to consumer prices
Finding Food (TPH), Food Flow report appendix (Toronto prices over one month) http://www.numbeo.com/common/ (crowd-sourced price comparison, global) Statistics Canada at http://www.statcan.gc.ca/tables-tableaux/sum-som/l01/cst01/econ155a-eng.htm
Production levels of ethnbocultural, culturally diverse foods
FarmStart; Vineland World Crops?
Eco-production zones Soil classes (OMAFRA?); watershed (Blue Belt report?),

City Region Food System Toolkit Assessing and planning sustainable city region food systems
92
Agriculture, urban and peri-urban agriculture land use
Area of agricultural land
Area of urban agricultural land
Total area for land protected for ag.
Types and percentage of ag. uses in area
Policies/ regulations for agricultural land preservation
Greenbelt papers Zoning by-law changes Hamilton for urban ag: (GGH) http://www.foodandfarming.ca/hamilton-pushes-for-urban-farming/ Parks and Rec map; compare NY and Phil. projects Grenbelt papers GHFFA website: TRCA overview in blog: http://www.trca.on.ca/the-living-city/land/urban-agriculture/#sthash.NQYgbh0y.dpbs Toronto Region Conservation Authority. (2012a). Near Urban Agriculture, from http://www.trca.on.ca/the-living-city/programs-of-the-living-city/near-urban-agriculture/ Toronto Region Conservation Authority. (2012b). Sustainable Near-Urban Agriculture Policy. Toronto Region Conservation Authority. (n/a). Living City Scorecard. Cowell, S.J., and S. Parkinson. 2002. Localization of UK food production: An analysis using land area and energy as indicators. Cummings, H. 2003. Growing food and economy: Economic impact study of the agriculture and food-related sectors in Waterloo Region. Region of Waterloo Public Health. http://chd.region.waterloo.on.ca/web/health.nsf/4f4813c75e78d713852
56e5a0057f5e1/4bb1aceaadd5d9e885256dce006768da!OpenDocument. Agriculture, Ecosystems, and Environment 94: 221–236. Aggregates: Binstock, M., & Carter-Whitney, M. (2011). Aggregate extraction in Ontario: A strategy for the future — Executive summary. Retrieved from Canadian Institute for Environmental Law and Policy website: http://cielap.org/pdf/AggregatesStrategyExecSumm.pdf Winfield, M. (2005). Building Sustainable Urban Communities in Ontario: A Provincial Progress Report. Toronto: The Pembina Institute. growTO: an urban agriculture action plan for Toronto (2012) http://tfpc.to/wordpress/wp-content/uploads/2012/08/GrowTO_ActionPlan_lowresFINAL.pdf Snapshot of existing projects: Commercial Farms and Market Gardens; Residential Gardens and Edible Landscaping; Community Gardens on City-owned Land; Gardens or Farms on Institutional Land; Gardens at Schools; Entrepreneurial Farms/Community Supported Agriculture; Gleaning Projects and Orchards; Rooftop Farms; Greenhouses; Therapeutic Gardens; Urban Livestock Priorities moving forward: link growers to land and space; strengthen education and training; increase vitality and promotion; add value to urban gardens; cultivate partnerships; develop supportive policy
Land use policy Zoning regulations
and impact
Places to Grow Act Greenbelt Plan Oak Ridges Moraine Act Niagara Escarpment Act GGH Plan Ontario Greenbelt Alliance. (2010). Green among the grey: Fifth anniversary progress report on the Greater Golden Horseshoe Greenbelt. Retrieved from:

City Region Food System Toolkit Assessing and planning sustainable city region food systems
93
http://greenbeltalliance.ca/files/pdf/GreenbeltProgressReportFINAL.pdf Wilson, S. J. (2008). Ontario’s wealth, Canada’s future: Appreciating the
value of the Greenbelt’s eco-services. Report prepared for the David Suzuki Foundation. Retrieved from www.davidsu-zuki.org/publications/reports/2008/ontarios-wealth-canadas-future-appreciating-the-value-of-the-greenbelts-eco-serv/
Resilience of local agriculture
Diversity of crops; availability of crop
varieities for drought, cold snaps, other climate
Access for food producers to land and clean water
DSF studies? crises Conversion assessments: balmford 2002 for trade off between conserving land rather than converting for ag or residential http://www.ncbi.nlm.nih.gov/pubmed/12169718 Ducks Unlimited Canada. (2010). Southern Ontario wetland conversion analysis. Retrieved from www.ducks.ca/aboutduc/news/archives/prov2010/pdf/duc_ontariowca.pdf
Number (or percentage) of farms in city region (economic vitality) for different products
Farm size Farm type
Stats can provincial, GH report for GH, see Ag. by the numbers (FoG) Provincial: National Farmers Union. (2011). Farms, farmers and Agriculture in Ontario. Ontario: National Farmers Union. Poce, V. D., Goarley, E., & Mausberg, B. (2009). Greenbelt Grown: A Profile of Agriculture in Ontario's Greenbelt. Online: Friends of the Greenbelt Foundation. Numbers for mixed farms? Organic? No till? holistic mgmt livestock?
Urban agriculture Number of urban
ag. production sites Production
volumes/ value (in market and overall)
Number of community garden organizations
Scaling Up Urban Agriculture http://metcalffoundation.com/wp-content/uploads/2011/05/scaling-urban-agriculture.pdf GrowTO Action Plan
Number of producers (for different products; organic) and farm size operations
See stats from Commodity groups Longitudinal: Statistics Canada. (2006a). Agricultural perspectives from seven censuses, Canada and provinces: census years 1976 to 2006. Online: Retrieved from http://www.statcan.gc.ca/pub/95-632-x/2007000/t/4185579-eng.htm - 35 Statistics Canada, Census of Agriculture (2011). Highlights and Analyses. Retrieved August 30 from http://www.statcan.gc.ca/pub/95-640-x/2012002/prov/35-eng.htm Toronto Forthcoming The TFPC has compiled a list of community food assets ward by ward

City Region Food System Toolkit Assessing and planning sustainable city region food systems
94
across Toronto. Mapping includes: community gardens and urban farms supported by the City, farmers markets, coops, healthy food retail outlets, emergency food organizations, community food programs, student nutrition programs
Production volumes (for different products)
Volume of food produced (products appropriate to city-region production)
Volume of production of #1 that is produced locally currently
Volume of imported food that could be replaced by local food
Assessment of volume of food that cannot be grown in TO area that could be shifted through education (shift to seasonal menus)
Number of farms producing for local markets: direct, retail, wholesale
Volume of product sold to local markets from local producers
Health: percentage of local food sold as fresh vs. processed
Dollars and Sense, stats Canada (provincial), Greater Golden Horseshoe and Greenbelt papers JRG Consulting Group, Agriculture by the Numbers: Understanding the greenbelt’s Unique Advantages. Friends of the Greenbelt Foundation. August 2014. Cummings, H. 2005. Region of Waterloo food flow analysis. Region of Waterloo Public Health. http://chd.region.waterloo.on.ca/web/health.nsf/4f4813c75e78d713852
56e5a0057f5e1/54ed787f44aca44c852571410056aeb0!OpenDocument. Producer organizations: Holland marsh Growers, OFVGA, etc. Number of supply managed vs. not (dairy without supply mgmt—Monforte) Production levels for biodiesel (vs. biodiesel from recovered waste like restaurant oil)
Production technologies/ systems used
Toronto, 2011: Scaling up Urban Agriculture in Toronto http://metcalffoundation.com/wp-content/uploads/2011/05/scaling-urban-agriculture.pdf Van Bers, Caroline and Robinson, John B.(1994) 'Farming in 2031',

City Region Food System Toolkit Assessing and planning sustainable city region food systems
95
Journal of Sustainable Agriculture, 4: 1, 41 — 65. URL: http://dx.doi.org/10.1300/J064v04n01_05 LFP, no till, IPM, organic, natural, mixed farms compared to specialized Ontario Fresh sorts by organic: https://ontariofresh.ca/profile-
search?search=organic ; lists 124 organic farms in Ontario, but includes Org. Meadow, Pefeenings, so aggregators as well as farms, could be duplicates (Pefennings is farm and whoelesaler, since this is promo, may list in both cateogries Organic Council 2008 numbers: http://www.organiccouncil.ca/organics/faq(1.5% of Canada farms)
Number and location of community gardens/ CSAs/ school gardens, etc
Parks and Rec maps TUG?
Aquaculture and fisheries Ontario Nature Blue Belt Report Ontario Commerical Fishieries Association: http://www.ocfa.ca/fisheries-industry Aquaponics PDF for large-scale aquaponics (farming and fish under cover)
Number of farmers practicing sustainable production methods
Health: food safety assessments for local production
Agricultural practices range and types (number of organic/ sustainable acres)
Number and size of farms working with organizations for stewardhsip
Number, type of organizations promoting stewardship in ag.
Toronto 1999 Feeding the City from the Back 40: A Commercial Food Production Plan for the City of Toronto http://www1.toronto.ca/city_of_toronto/toronto_public_health/healthy_families/nutrition/toronto_food_policy_council/files/pdf/tfpc_feeding.pdf Nature Counts MNR 2006, estiamting value of natural capital to sust. ag.
Organic production Rod MacRae, Russ Christianson paper for WWF
Farm employment/income/wages
off-farm income Urban ag. jobs
Stats Can FoG Economic Benefit of GB report Statistics Canada. (2011). 2011 Farm and farm operator data. Online: Retrieved from http://www29.statcan.gc.ca/ceag-web/eng/community-agriculture-profile-profil-agricole?geoId=350000000&dataType=1.
Permaculture Jane Hayes
Urban agriculture
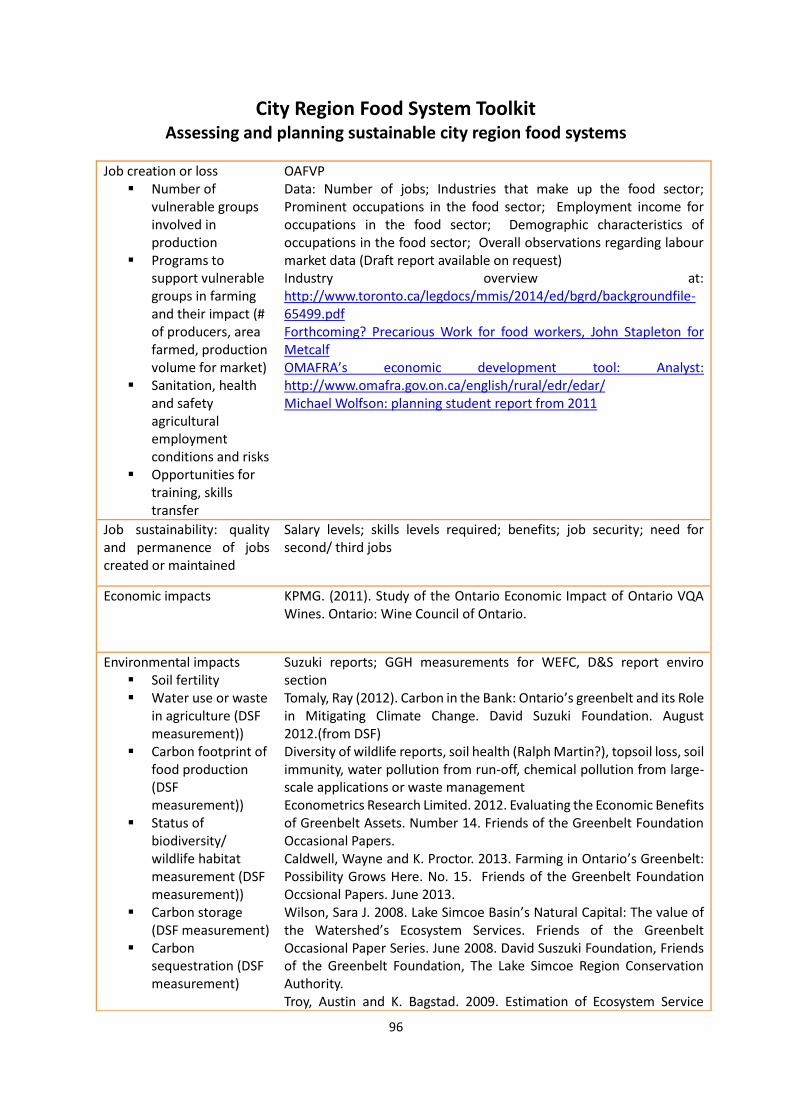
City Region Food System Toolkit Assessing and planning sustainable city region food systems
96
Job creation or loss Number of
vulnerable groups involved in production
Programs to support vulnerable groups in farming and their impact (# of producers, area farmed, production volume for market)
Sanitation, health and safety agricultural employment conditions and risks
Opportunities for training, skills transfer
OAFVP Data: Number of jobs; Industries that make up the food sector; Prominent occupations in the food sector; Employment income for occupations in the food sector; Demographic characteristics of occupations in the food sector; Overall observations regarding labour market data (Draft report available on request) Industry overview at: http://www.toronto.ca/legdocs/mmis/2014/ed/bgrd/backgroundfile-65499.pdf Forthcoming? Precarious Work for food workers, John Stapleton for Metcalf OMAFRA’s economic development tool: Analyst: http://www.omafra.gov.on.ca/english/rural/edr/edar/ Michael Wolfson: planning student report from 2011
Job sustainability: quality and permanence of jobs created or maintained
Salary levels; skills levels required; benefits; job security; need for second/ third jobs
Economic impacts KPMG. (2011). Study of the Ontario Economic Impact of Ontario VQA Wines. Ontario: Wine Council of Ontario.
Environmental impacts Soil fertility Water use or waste
in agriculture (DSF measurement))
Carbon footprint of food production (DSF measurement))
Status of biodiversity/ wildlife habitat measurement (DSF measurement))
Carbon storage (DSF measurement)
Carbon sequestration (DSF measurement)
Suzuki reports; GGH measurements for WEFC, D&S report enviro section Tomaly, Ray (2012). Carbon in the Bank: Ontario’s greenbelt and its Role in Mitigating Climate Change. David Suzuki Foundation. August 2012.(from DSF) Diversity of wildlife reports, soil health (Ralph Martin?), topsoil loss, soil immunity, water pollution from run-off, chemical pollution from large-scale applications or waste management Econometrics Research Limited. 2012. Evaluating the Economic Benefits of Greenbelt Assets. Number 14. Friends of the Greenbelt Foundation Occasional Papers. Caldwell, Wayne and K. Proctor. 2013. Farming in Ontario’s Greenbelt: Possibility Grows Here. No. 15. Friends of the Greenbelt Foundation Occsional Papers. June 2013. Wilson, Sara J. 2008. Lake Simcoe Basin’s Natural Capital: The value of the Watershed’s Ecosystem Services. Friends of the Greenbelt Occasional Paper Series. June 2008. David Suszuki Foundation, Friends of the Greenbelt Foundation, The Lake Simcoe Region Conservation Authority. Troy, Austin and K. Bagstad. 2009. Estimation of Ecosystem Service
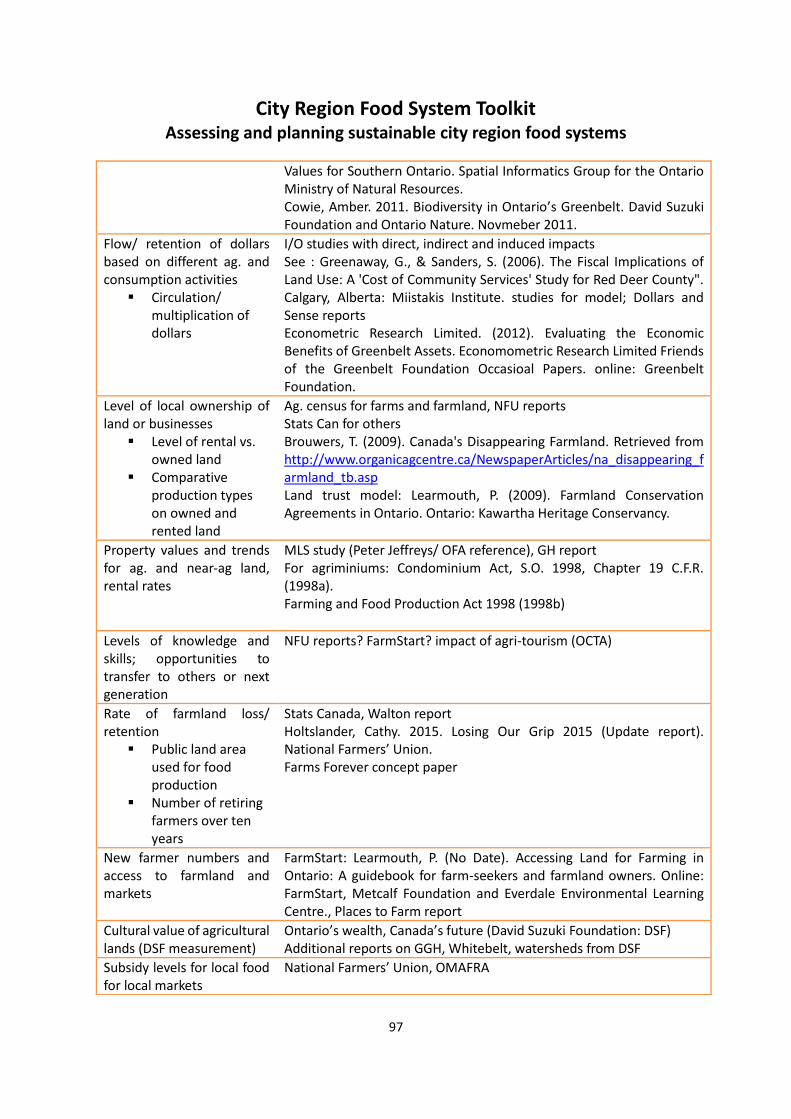
City Region Food System Toolkit Assessing and planning sustainable city region food systems
97
Values for Southern Ontario. Spatial Informatics Group for the Ontario Ministry of Natural Resources. Cowie, Amber. 2011. Biodiversity in Ontario’s Greenbelt. David Suzuki Foundation and Ontario Nature. Novmeber 2011.
Flow/ retention of dollars based on different ag. and consumption activities
Circulation/ multiplication of dollars
I/O studies with direct, indirect and induced impacts See : Greenaway, G., & Sanders, S. (2006). The Fiscal Implications of Land Use: A 'Cost of Community Services' Study for Red Deer County". Calgary, Alberta: Miistakis Institute. studies for model; Dollars and Sense reports Econometric Research Limited. (2012). Evaluating the Economic Benefits of Greenbelt Assets. Economometric Research Limited Friends of the Greenbelt Foundation Occasioal Papers. online: Greenbelt Foundation.
Level of local ownership of land or businesses
Level of rental vs. owned land
Comparative production types on owned and rented land
Ag. census for farms and farmland, NFU reports Stats Can for others Brouwers, T. (2009). Canada's Disappearing Farmland. Retrieved from http://www.organicagcentre.ca/NewspaperArticles/na_disappearing_farmland_tb.asp Land trust model: Learmouth, P. (2009). Farmland Conservation Agreements in Ontario. Ontario: Kawartha Heritage Conservancy.
Property values and trends for ag. and near-ag land, rental rates
MLS study (Peter Jeffreys/ OFA reference), GH report For agriminiums: Condominium Act, S.O. 1998, Chapter 19 C.F.R. (1998a). Farming and Food Production Act 1998 (1998b)
Levels of knowledge and skills; opportunities to transfer to others or next generation
NFU reports? FarmStart? impact of agri-tourism (OCTA)
Rate of farmland loss/ retention
Public land area used for food production
Number of retiring farmers over ten years
Stats Canada, Walton report Holtslander, Cathy. 2015. Losing Our Grip 2015 (Update report). National Farmers’ Union. Farms Forever concept paper
New farmer numbers and access to farmland and markets
FarmStart: Learmouth, P. (No Date). Accessing Land for Farming in Ontario: A guidebook for farm-seekers and farmland owners. Online: FarmStart, Metcalf Foundation and Everdale Environmental Learning Centre., Places to Farm report
Cultural value of agricultural lands (DSF measurement)
Ontario’s wealth, Canada’s future (David Suzuki Foundation: DSF) Additional reports on GGH, Whitebelt, watersheds from DSF
Subsidy levels for local food for local markets
National Farmers’ Union, OMAFRA

City Region Food System Toolkit Assessing and planning sustainable city region food systems
98
Import and trade regulations
National Farmers’ Union reports, briefs
Soil fertility Ralph Martin: Soil Organic Matter Soil classification maps/ reports
Water use or waste in agriculture (DSF measurement))
Ontario’s wealth, Canada’s future (David Suzuki Foundation: DSF) Molnar, Michelle et al. 2012. Watersheds of the Ontario Greenbelt. David Suzuki Foundation. May 2012.
Carbon footprint of food production (DSF measurement))
Ontario’s wealth, Canada’s future (David Suzuki Foundation: DSF) Additional reports on GGH, Whitebelt, watersheds from DSF
Status of biodiversity/ wildlife habitat measurement (DSF measurement))
Ontario’s wealth, Canada’s future (David Suzuki Foundation: DSF) Additional reports on GGH, Whitebelt, watersheds from DSF
Carbon storage (DSF measurement)
Ontario’s wealth, Canada’s future (David Suzuki Foundation: DSF) Additional reports on GGH, Whitebelt, watersheds from DSF ALUS?
Carbon sequestration (DSF measurement)
Ontario’s wealth, Canada’s future (David Suzuki Foundation: DSF) Additional reports on GGH, Whitebelt, watersheds from DSF

City Region Food System Toolkit Assessing and planning sustainable city region food systems
99
FOOD DISTRIBUTION AND WHOLESALE
Daily and weekly food prices Ontario Food Terminal
Number and type of wholesalers (for different products)
Spacing Magazine on food Include aggregators like Pfennings
Wholesale market food flows, challenges and investment needs (2011)
Corn production by marketing channels http://www.statcan.gc.ca/pub/96-325-x/2014001/article/11913-eng.htm#a9 Apple production by marketing channels http://www.omafra.gov.on.ca/english/stats/hort/applebymc.htmactual trajectory of products: corn for whiskey? biofuels? feeding US cows? http://www.suncor.com/en/about/212.aspx 20% of corn crop in Ontario goes to Suncor! Maan Miedema, J. 2006. Redundant trade study in Waterloo Region. Region of Waterloo Public Health. http://chd.region.waterloo.on.ca/web/health.nsf/4f4813c75e78d71385256e5a0057f5e1/54ED787F44ACA44C852571410056AEB0/$file/Redundant_Trade.pdf?openelement. Maan Miedema, J. 2008. Neighborhood markets initiative: Evaluation report. Region of Waterloo Public Health. http://chd.region.waterloo.on.ca/web/health.nsf/4f4813c75e78d71385256e5a0057f5e1/54ED787F44ACA44C852571410056AEB0/$file/Neighbourhood%20Markets.pdf?openelement.
UA Infrastructure needs Toronto: Scaling up Urban Agriculture in Toronto Building the Infrastructure http://metcalffoundation.com/wp-content/uploads/2011/05/scaling-urban-agriculture.pdf Food chain analysis; food infrastructure, material flows
Food distribution and wholesale Toronto Canadian Business Patterns, Census Tract Aggregation Tool, December 2013, Food wholesale and distribution by NAICS; can be used to count number of firms by category and locate them http://www1.toronto.ca/wps/portal/contentonly?vgnextoid=bc2f2cd2563d6410VgnVCM10000071d60f89RCRD&vgnextchannel=e71032d0b6d1e310VgnVCM10000071d60f89RCRD

City Region Food System Toolkit Assessing and planning sustainable city region food systems
100
Jobs Toronto Data: Number of jobs; Industries that make up the food sector; Prominent occupations in the food sector; Employment income for occupations in the food sector; Demographic characteristics of occupations in the food sector; Overall observations regarding labour market data
Flow/ retention of dollars based on different ag. and consumption activities Circulation/ multiplication of dollars
I/O studies with direct, indirect and induced impacts See COCs studies for model; Dollars and Sense reports
Food and beverage Ontario Food and Beverage Organization
Availability of food hubs FoG, LOFC, CountryGuide report (Lois Harris)
Transportation costs and emissions
Worth a million report; reports on food miles (Waterloo/ Xuereb)
GHG emissions and availability of local farm supply, vets, processing: regional infrastructure
i.e., impact of loss of slaughterhouses?

City Region Food System Toolkit Assessing and planning sustainable city region food systems
101
FOOD PROCESSORS Agri-food sector
Food processing companies
AoFP, OFVPA, OPVG M. Wolfson? How to capture small, micro and mixed enterprises (e.g, production kitchen at West End Food Co-op)
Extent of food processing sector
AoFP Synthesis (agri-food consulting). 2011. A Global Hub for Food Processing: Agri-Food Asset Map. For Ontario government (OMAFRA?).
Urban and peri-urban levels of food processing
AoFP WCM Consulting. 2002. Food Industry Outlook: A Study of Food Industry Growth Trends in Toronto. for Omafra and Toronto Economic Development.
Food processors
Toronto, 2013 Alliance of Food Processors report: Ontario’s Food and Beverage Industry: The New Engine of Ontario’s Economy Includes industry profile http://www.aofp.ca/pub/docs/Ontarios_Food_and_Beverage_Processing_Industry_Strategy_The_New_Engine_of_Ontarios_Economy.pdf Toronto.net directory, 35 processors, paid listings http://www.toronto.net/Food_Production.html
Food and beverage sector
Toronto Web page with Toronto Food and Beverage industry facts http://www1.toronto.ca/wps/portal/contentonly?vgnextoid=67c4c1b5c62ca310VgnVCM10000071d60f89RCRD&vgnextchannel=401132d0b6d1e310VgnVCM10000071d60f89RCRD
Food processing Toronto Canadian Business Patterns, Census Tract Aggregation Tool, December 2013, Food processing by NAICS; can be used to count number of firms by category and locate them http://www1.toronto.ca/wps/portal/contentonly?vgnextoid=bc2f2cd2563d6410VgnVCM10000071d60f89RCRD&vgnextchannel=e71032d0b6d1e310VgnVCM10000071d60f89RCRD
Industry overview Toronto Data: Number of jobs; Industries that make up the food sector; Prominent occupations in the food sector; Employment income for occupations in the food sector; Demographic characteristics of occupations in the food sector; Overall observations regarding labour market data Bure, Claire and S. Laban, H-D Chung, J van den Steenhoven. 2015. Building a Resilient Tender Fruit Industry in Ontario. June 2015. The Ontario Tender Fruit Lab Food for Action.
Flow/ retention of dollars based on different ag. and consumption activities Circulation/
I/O studies with direct, indirect and induced impacts See COCs studies for model; Dollars and Sense reports Use of local banks for mortgages, use of local farm supplies and inputs, local banks and loan agencies, local machinery repair, local markets and local meeting areas (increased use of community centres vs. large-scale conference centres)

City Region Food System Toolkit Assessing and planning sustainable city region food systems
102
multiplication of dollars
Trade flows Amount in and out of specific commodities, redundant trade figures
Emissions from food transportation
UK study and responses; Suzuki reports?, D&S enviro section? Xuereb Food Miles report for Waterlooo

City Region Food System Toolkit Assessing and planning sustainable city region food systems
103
POINT OF SALE: MARKETS, CATERING AND RETAIL
Location of points of sale (farmers’ markets, food stores)
Google maps, streetview TFS- retail mapping (see below for link) FM Networks for fm mapping Map locations and street views Toronto and much of surrounding area, 2014: streetview adequate enough to do significant mapping of green space/ land use TFPC food asset mapping Co-ops: Big Carrot, WEFC, Karma (Toronto), Garden City (St. Cath), Mustard Seed (Hamilton) public markets --- St. Lawrence, Kensington, anticipated Westfiield market with CSI at Honest Ed’s site
Farmers’ Markets
GHFFA: 7 regions working on maps of local food markets (retail, csa, etc.0 Marina/ Brickworks for econ. impact of farmers’ markets (Mary Lou Morgan report too) http://www.edibletoronto.com/local/farmers-markets?id=628:farmers-market-directory&catid=93 Toronto FMs: http://tfmn.ca/?page_id=76 Greenbelt markets are here: https://www.greenbeltfresh.ca
Farm direct sales companies
#s of pick your own establishments #s of CSAs on-farm markets agritourism #s Farm/ restaurant collaboratives (Harvest Kitchen) CSA directort (Ontario CSA Network) http://csafarms.ca/CSA%20map.html
Daily and weekly food prices
OFT
Food retail Toronto http://tfpc.to/policy/food-strategy-update-food-retail-mapping-in-torontoFood Strategy: Food Retail Mapping; environmental and income barriers to healthy food access Toronto http://www1.toronto.ca/wps/portal/contentonly?vgnextoid=bc2f2cd2563d6410VgnVCM10000071d60f89RCRD&vgnextchannel=e71032d0b6d1e310VgnVCM10000071d60f89RCRD Canadian Business Patterns, Census Tract Aggregation Tool, December 2013, Food retail by NAICS; can be used to count number of firms by category and locate them Toronto Extensive data collecting and mapping work on this issue Food Asset map: Page 13 Other material available through Lauren Baker http://www.toronto.ca/legdocs/mmis/2014/ed/comm/communicationfile-44865.pdf
Community food Miller, S. 2013. Finding Food. TFS/ TPH.

City Region Food System Toolkit Assessing and planning sustainable city region food systems
104
agencies, banks CBC online. 2007. Food banks provide low nutritional value: study. January 11, 2007. Online at http://www.cbc.ca/news/health/story/2007/01/11/food-banks.html.
Food businesses COGs (cost of food for retail in Ontario) http://www5.statcan.gc.ca/cansim/a26?lang=eng&retrLang=eng&id=3550009&pattern=&csid= (35.5% food= 9.59 billion Canada) 7.8 m pop, 13.8 m,
Fresh produce report
Fresh produce price instability
CPI by province http://www.statcan.gc.ca/tables-tableaux/sum-som/l01/cst01/cpis08g-eng.htm By city http://www.statcan.gc.ca/tables-tableaux/sum-som/l01/cst01/cpis02a-
eng.htm 1.4% increase over 2002 from Sept 204-Sept 2015
Farm/school program
SNPs FoodShare TDSB
Public Facilities
Collective food purchase case study
Miller, Kamizaki, Finding Food and Food Flow reports (TPH/ PARC)
Direct organic markets
Ontario Farm Fresh Association member directory?
Food retail sector Total dollars http://www5.statcan.gc.ca/cansim/a26?lang=eng&retrLang=eng&id=3550004&&pattern=&stByVal=1&p1=1&p2=-1&tabMode=dataTable&csid= over 27 billion for Canada
Farmers’ markets Toronto Farmers’ market by district with links http://www.toronto.com/articles/torontos-best-farmers-markets/
Public food procurement
Toronto Finding Food: Community Food Procurement in the City of Toronto http://tfpc.to/wordpress/wp-content/uploads/2014/02/CFP-Finding-Food.pdf Toronto 1. Approves children services pilot project; describes benefits of local, sustainable food procurement; allocation of additional finds to offset potential increase in costs 2. Increase in LSF procurement by 13.4%; increase cost 0.07% 3. Adjusts RFP language to reflect LSF purchasing priority Municipal initiatives to support procurement of local sustainable food (LSF) 1.http://app.toronto.ca/tmmis/viewAgendaItemHistory.do?item=2008.GM14.3 2. http://app.toronto.ca/tmmis/viewAgendaItemHistory.do?item=2009.GM24.19 3. http://app.toronto.ca/tmmis/viewAgendaItemHistory.do?item=2011.GM5.13

City Region Food System Toolkit Assessing and planning sustainable city region food systems
105
Food for Life Partnership. June 2011. Good food for all: The impact of the Food for Life Partnership. Bristol, U.K. Online at www.foodforlife.org.uk/LinkClick.aspx?fileticket...tabid=310 (PDF).
Labour market OAFP report? Distination Excellence? M Wolfson has Zizys, Tom. 2015. Good Food, Good Jobs: Seeking Better Employment Outcomes in the Food Sector in Toronto. Prepared for Toronto Food Strategy. TPH/ TFPC. January 2015.
Flow/ retention of dollars based on different ag. and consumption activities Circulation/ multiplication of dollars
I/O studies with direct, indirect and induced impacts See Cost of Communities studies for model; Dollars and Sense reports
Emissions Miller Climate Spark grid: emissions from small local food store
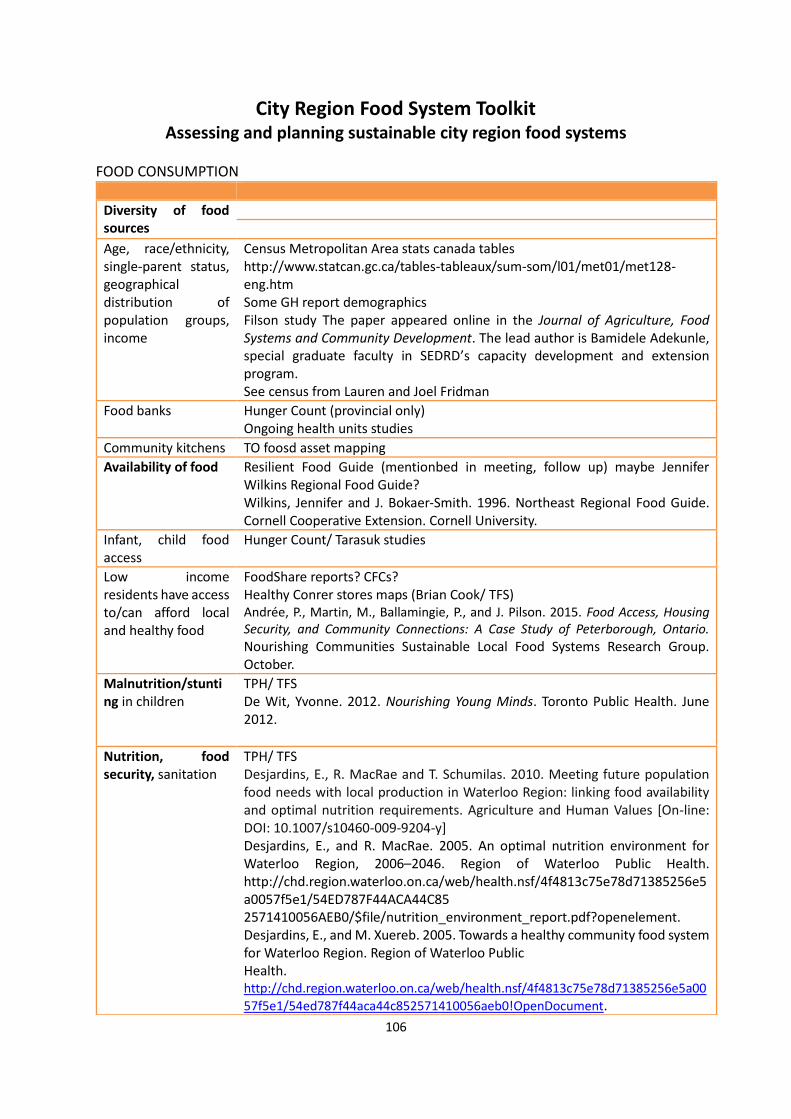
City Region Food System Toolkit Assessing and planning sustainable city region food systems
106
FOOD CONSUMPTION
Diversity of food sources
Age, race/ethnicity, single-parent status, geographical distribution of population groups, income
Census Metropolitan Area stats canada tables http://www.statcan.gc.ca/tables-tableaux/sum-som/l01/met01/met128-eng.htm Some GH report demographics Filson study The paper appeared online in the Journal of Agriculture, Food Systems and Community Development. The lead author is Bamidele Adekunle, special graduate faculty in SEDRD’s capacity development and extension program. See census from Lauren and Joel Fridman
Food banks Hunger Count (provincial only) Ongoing health units studies
Community kitchens TO foosd asset mapping
Availability of food Resilient Food Guide (mentionbed in meeting, follow up) maybe Jennifer Wilkins Regional Food Guide? Wilkins, Jennifer and J. Bokaer-Smith. 1996. Northeast Regional Food Guide. Cornell Cooperative Extension. Cornell University.
Infant, child food access
Hunger Count/ Tarasuk studies
Low income residents have access to/can afford local and healthy food
FoodShare reports? CFCs? Healthy Conrer stores maps (Brian Cook/ TFS) Andrée, P., Martin, M., Ballamingie, P., and J. Pilson. 2015. Food Access, Housing Security, and Community Connections: A Case Study of Peterborough, Ontario.
Nourishing Communities Sustainable Local Food Systems Research Group. October.
Malnutrition/stunting in children
TPH/ TFS De Wit, Yvonne. 2012. Nourishing Young Minds. Toronto Public Health. June 2012.
Nutrition, food security, sanitation
TPH/ TFS Desjardins, E., R. MacRae and T. Schumilas. 2010. Meeting future population food needs with local production in Waterloo Region: linking food availability and optimal nutrition requirements. Agriculture and Human Values [On-line: DOI: 10.1007/s10460-009-9204-y] Desjardins, E., and R. MacRae. 2005. An optimal nutrition environment for Waterloo Region, 2006–2046. Region of Waterloo Public Health. http://chd.region.waterloo.on.ca/web/health.nsf/4f4813c75e78d71385256e5a0057f5e1/54ED787F44ACA44C85 2571410056AEB0/$file/nutrition_environment_report.pdf?openelement. Desjardins, E., and M. Xuereb. 2005. Towards a healthy community food system for Waterloo Region. Region of Waterloo Public Health. http://chd.region.waterloo.on.ca/web/health.nsf/4f4813c75e78d71385256e5a00
57f5e1/54ed787f44aca44c852571410056aeb0!OpenDocument.

City Region Food System Toolkit Assessing and planning sustainable city region food systems
107
Union of Concerned Scientists. August 2013. “The $11 Trillion Reward: How Simple Dietary Changes can Save Lives and Money, and How We Get There”. Online at http://www.ucsusa.org/food_and_agriculture/solutions/expand-healthy-food-access/11-trillion-reward.html. Willows, Noreen and P. Veugelers, K. Raine and S. Kuhle. 2011. “Associations between household food insecurity and health outcomes in the Aboriginal population (excluding reserves)”. Statistics Canada, Catalogue no. 82-003-XPE • Health Reports, Vol. 22, no. 2, June 2011. Consider indicators that link back to production: nourishment per acre? See Jules Pretty on “Regenerating Agriculture”
Nutrition and farmers’ market access/ good food markets
FoodShare? Double Up Food Bucks? (effect of increased acccess and knowledge on health)
Diet composition, nutrient poverty
TPH/ TFS
Average household income, % poverty level, employment statistics, assistance programs spatial distribution of socio-economic characteristic
Stats Can Bread and Butter Toronto CMA census GH? Neighbourhood Equity Index (City of TO report) Social Policy Analysis and Rsearch, City of Toronto. 2014. TSNS 2020 Neighbourhood Equity Index: Methodological Documentation. Prepared for the Toronto Strong Neighbourhoods Strategy 2020. March 2014. City of Toronto Social Development, Finance and Administration.
Newcomer stats Guelph research report, FarmStart (Watkins), see ethnocultural paper for WEFC. GH report 9 Prof. Glen Filson, School of Environmental Design and Rural Development (SEDRD) discussed at http://atguelph.uoguelph.ca/2011/11/demand-for-ethnocultural-vegetables-far-exceeds-supply/. See also, EthnoCultural Vegetables in Ontario blob at http://evcontario2011.blogspot.ca Toronto Public Health and Access Alliance Multicultural Health and Community Services. The Global City: Newcomer Health in Toronto. November 2011.
Food basket prices Nutritious Food Basket information http://www1.toronto.ca/wps/portal/contentonly?vgnextoid=5bc0ce7e2b322410VgnVCM10000071d60f89RCRD&vgnextchannel=7209ce7e2b322410VgnVCM10000071d60f89RCRD
HH/local income (including gov/institutional) spent on food
Beyond Bread and Butter? Ontario: http://www.statcan.gc.ca/tables-tableaux/sum-
som/l01/cst01/famil132g-eng.htm food expenditures Household income tables: http://www.statcan.gc.ca/tables-tableaux/sum-som/l01/ind01/l3_3868_2812-eng.htm?hili_none
Suite of household food insecurity indicators
Tarasuk, V, Mitchell, A, Dachner, N. Research to identify policy options to reduce food insecurity (PROOF). (2013). Household food insecurity in Canada 2011.
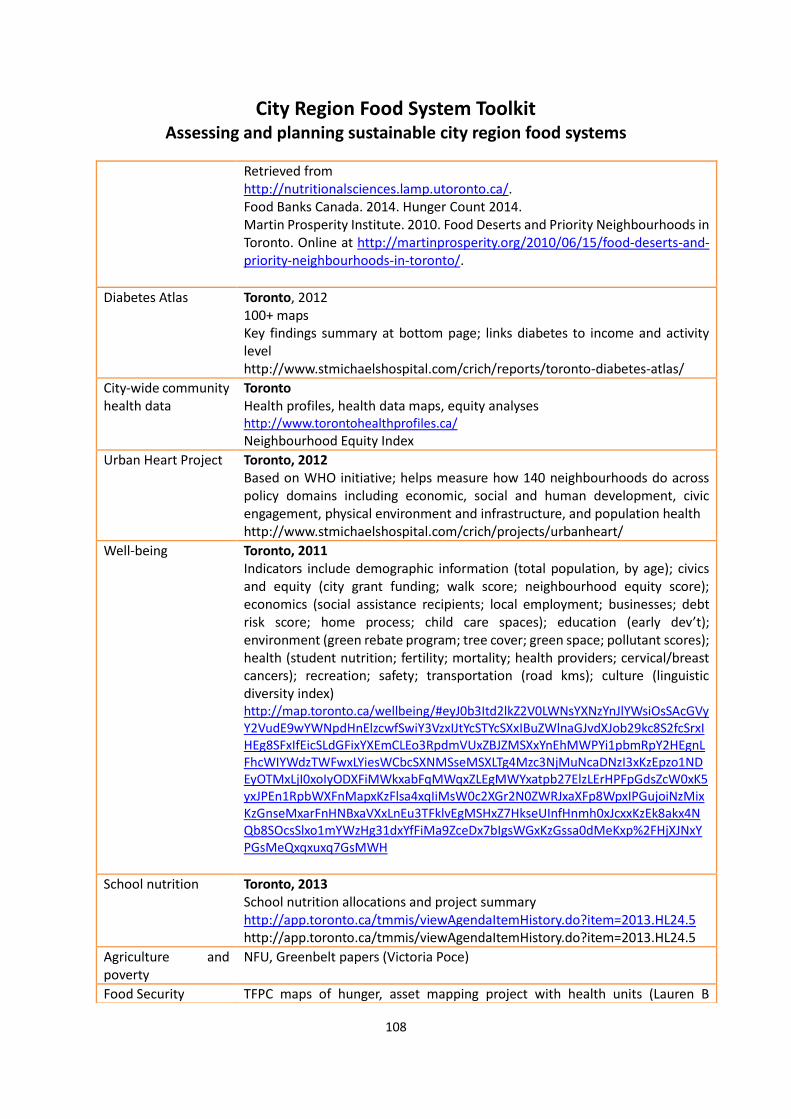
City Region Food System Toolkit Assessing and planning sustainable city region food systems
108
Retrieved from http://nutritionalsciences.lamp.utoronto.ca/. Food Banks Canada. 2014. Hunger Count 2014. Martin Prosperity Institute. 2010. Food Deserts and Priority Neighbourhoods in Toronto. Online at http://martinprosperity.org/2010/06/15/food-deserts-and-priority-neighbourhoods-in-toronto/.
Diabetes Atlas Toronto, 2012 100+ maps Key findings summary at bottom page; links diabetes to income and activity level http://www.stmichaelshospital.com/crich/reports/toronto-diabetes-atlas/
City-wide community health data
Toronto Health profiles, health data maps, equity analyses http://www.torontohealthprofiles.ca/ Neighbourhood Equity Index
Urban Heart Project Toronto, 2012 Based on WHO initiative; helps measure how 140 neighbourhoods do across policy domains including economic, social and human development, civic engagement, physical environment and infrastructure, and population health http://www.stmichaelshospital.com/crich/projects/urbanheart/
Well-being Toronto, 2011 Indicators include demographic information (total population, by age); civics and equity (city grant funding; walk score; neighbourhood equity score); economics (social assistance recipients; local employment; businesses; debt risk score; home process; child care spaces); education (early dev’t); environment (green rebate program; tree cover; green space; pollutant scores); health (student nutrition; fertility; mortality; health providers; cervical/breast cancers); recreation; safety; transportation (road kms); culture (linguistic diversity index) http://map.toronto.ca/wellbeing/#eyJ0b3Itd2lkZ2V0LWNsYXNzYnJlYWsiOsSAcGVyY2VudE9wYWNpdHnElzcwfSwiY3VzxIJtYcSTYcSXxIBuZWlnaGJvdXJob29kc8S2fcSrxIHEg8SFxIfEicSLdGFixYXEmCLEo3RpdmVUxZBJZMSXxYnEhMWPYi1pbmRpY2HEgnLFhcWIYWdzTWFwxLYiesWCbcSXNMSseMSXLTg4Mzc3NjMuNcaDNzI3xKzEpzo1NDEyOTMxLjI0xoIyODXFiMWkxabFqMWqxZLEgMWYxatpb27ElzLErHPFpGdsZcW0xK5yxJPEn1RpbWXFnMapxKzFlsa4xqIiMsW0c2XGr2N0ZWRJxaXFp8WpxIPGujoiNzMixKzGnseMxarFnHNBxaVXxLnEu3TFklvEgMSHxZ7HkseUInfHnmh0xJcxxKzEk8akx4NQb8SOcsSlxo1mYWzHg31dxYfFiMa9ZceDx7bIgsWGxKzGssa0dMeKxp%2FHjXJNxYPGsMeQxqxuxq7GsMWH
School nutrition Toronto, 2013 School nutrition allocations and project summary http://app.toronto.ca/tmmis/viewAgendaItemHistory.do?item=2013.HL24.5 http://app.toronto.ca/tmmis/viewAgendaItemHistory.do?item=2013.HL24.5
Agriculture and poverty
NFU, Greenbelt papers (Victoria Poce)
Food Security TFPC maps of hunger, asset mapping project with health units (Lauren B

City Region Food System Toolkit Assessing and planning sustainable city region food systems
109
contact) Health Canada for food access mapping Food swamps review by Leah (?) and Catherin Mah Daily Bread Food Bank. 2008. Nutritious Food to Drop-ins: Final Report. February 2008 (unpublished). Irwin, Jennifer D. et al. 2007. “Can Food Banks Sustain Nutrient Requirements? A Case Study in Southwestern Ontario”. Canadian Journal of Public Health. Vol. 98, Issue 1, pp. 17-20.
Poverty overview (see well-being indicators for TO for social assistance numbers) http://www5.statcan.gc.ca/cansim/a26 (Ontario poverty levels, including market basket idnicator)
Cost of living Stats Can, CCPA reports?
Agriculture and health
Rod MacRae; DSF; Pretty? Effect of increased knowledge of farm issues on health? Heath impacts of urban agroculture (literature review Buzby, J.C., H. Farah, Wells, and G. Vocke. 2006. Possible implications for US agriculture from adoption of select dietary guidelines. Economic Research Report No. ERR-31, Washington, DC: Economic Research Service, USDA. http://www.ers.usda. gov/publications/err31. Peters, C., N. Bills, J. Wilkins, and R. Smith. 2003a. Fruit consumption, dietary guidelines, and agricultural production in New York State—Implications for local food economies. Ithaca, NY: College of Agriculture and Life Sciences, Cornell University. Peters, C.J., G.W. Fick, and J.L. Wilkins. 2003b. Cultivating better nutrition: Can the food pyramid help translate dietary recommendations into agricultural goals? Agronomy Journal 95(6): 1424–1431. Peters, C.J., J.L. Wilkins, and G.W. Fick. 2007. Testing a completediet model for estimating the land resource requirements of food consumption and agricultural carrying capacity: The New York State example. Renewable Agriculture and Food Systems 22(2): 145–153. Peters, C., N. Bills, Lembo, A.J., Wilkins, J.L., and Fick. G.W. 2009 Mapping potential foodsheds in New York State: A spatial model for evaluating the capacity to localize food production. Renewable Agriculture and Food Systems 24(1): 72-84. Cohen, Larry et al. 2004. “Cultivating Common Ground: Linking Health and Sustainable Agriculture”. The Prevention Institute. Oakland, CA. September 2004. Online at http://www.preventioninstitute.org/component/jlibrary/article/id-67/127.html. David, Linor. 2013. “Growing People First: Emerging Best Practices from a Mental Health and Gardening Knowledge Swap”. Ontario Health Promotion E-Bulletin. Online at http://www.ohpe.ca/node/14050. Horrigan, Leo et al. 2002. “How Sustainable Agriculture Can Address the Environmental and Human Health Harms of Industrial Agriculture”. Center for

City Region Food System Toolkit Assessing and planning sustainable city region food systems
110
WASTE AND OTHER MATERIAL RESOURCES
a Livable Future, Johns Hopkins, Baltimore, MD. May 2002. pp. 445-456.
Food safety stats Industry reports? TPH?
Volume food waste re used
Guelphfoodwaste.com researchers at U of G, little info on the site though TPH Southwest Food Collaborative (GHFFA website) TPH paper on food waste (LB) Uzea, N. et al, Developing an Industry Led Approach to Addressing Food Waste in Canada Gunders, D. (2012). Wasted: How America is losing up to 40 percent of its food from farm to fork to landfill. Natural Resource Defense Council (NRDC) Issue Paper 12-06-B. August. Available online at http://www.nrdc.org/food/files/ wasted-food-ip.pdf von Massow, M. and R.C. Martin (2013). Residential food waste numbers: Preliminary findings. University of Guelph. Vidoni, Michael. 2011. Community Composting in Toronto.
http://www.davidsuzuki.org/what-you-can-do/food-and-our-planet/help-end-food-waste/
Energy production from waste
Biodiesel from restaurant waste
Waste management Lee, Heather. 2014. Food Waste Reduction and Diversion: Opportunities for Toronto. Prepared for the Toronto Food Policy Council. October 27, 2014. Wally Seccombe on green bins; also Helene St. jacques
Solid waste management September 30, 2014 : City Council meeting minutes : excellent source of indicators
Toronto: Draft policy report available Current compost success rates and project evolution; new strategy for waste diversion to further reduce waste
Environmental impacts FoG and OMAFRA reports; indicators from DSF, Rod MacRae; studies from US soil conservation program?
Water contamination

City Region Food System Toolkit Assessing and planning sustainable city region food systems
111

City Region Food System Toolkit Assessing and planning sustainable city region food systems
112
GOVERNANCE AND POLICY
Growth management and greenbelt policy Urban/rural fringe land use management
GHFFA Local Leadership report (FoG) Churchyard, A. (n/a). Planning Regional Food Systems: A guide for municipal planning and development in the Greater Golden Horseshoe Greenbelt Plan 2005 (2005a). Places to Grow Act, 2005, S.O. 2005, Chapter 13 C.F.R. (2005b). Provincial Planning Act (2005c) Lister, N. M. (2010). Planting the Seeds for Farm Innovation: A Guide to Achieving Flexible Land Use Policy in Ontario’s Greater Golden Horseshoe. online Miedema, J. M., & Piggott, K. (2007). A Healthy Community Food System Plan for Waterloo Region. Waterloo, Ontario: Grand By Design and Region of Waterloo Public Health. Ontario Greenbelt Alliance, & Environmental Defence Fund. Places to Sprawl: Report on Municipal Conformity with the Growth Plan for the Greater Golden Horseshoe, as provided under Ontario's Places to Grow Act. online. Milan Urban Food Policy Pact Allen, Rien and P. Campsie. 2013. Implementing the Growth Plan for the Greater Golden Horseshoe: Has the strategic vision been compromised? Neptis Foundation.
Provincial land use policy re UA
Provincial Policy Statement, P2G, GB Act, Niagara Escarpment and Oak Ridges plans Places to Farm (Miller 2013) FarmON Alliance. (2005). Five-Year Review of the Provincial Policy Statement.
Municipal policies Hamilton zoning by-law changes, TFPC, food charters (TO, other?) Draw on Places to Farm for use of policies/ zoning to protect ag. Christianson, Russ. 2015. . Report of Porceedings November 20, 2014 Meeting. York Region Food Collaborative. January 2015.
Modeling Christian Peters/ Jennifer Wilkins work at Tufts: Foodprints and FoodShed Analysis
Land Use policy Caldwell, W., Churchyard, A., Dodds-Weir, C., Eckert, A., & Procter, K. (2011). Lot Creation in Ontario's Agricultural Landscapes: Trends, Impacts and Policy Implications Report 3: Impacts and Analysis. Caldwell, W., & Weir, C. (2002). Ontario's Countryside: A Resource to Preserve or an Urban Area in Waiting? A Review of Severance Activity in Ontario's Agricultural Land During the 19902. Online: School of Rural Planning and Development, University of Guelph. Caldwell, W., & Weir, C. (2003). Rural Non-Farm Development: Its Impact on the Viability and Sustainability of Agricultural and Rural Communities. Online: School of Rural Planning and development, University of Guelph. Walton, M. (2012). Food and Farming: An Action Plan 2021. Ontario:

City Region Food System Toolkit Assessing and planning sustainable city region food systems
113
Greater Toronto Area Agricultural Action Committee (and Appendices). Markham food belt proposal
Food security Council of Canadians advocating in Niagara (GHFFA website) Also Community Food Advisory program in ON http://www.communityfoodadvisor.ca
Sustainable consumable goods levers for change and best practices
OECD countries, 2008, report on sustainable consumption across range of consumer goods: http://www.oecd.org/greengrowth/40317373.pdf Standards and labels (includes food content (e.g. GE) and/or nutritional labelling); taxes and charges; subsidies and incentives; communication campaigns (to reduce consumption of junk food; ethical food consumption); education (sustainable schools that promote healthy eating; voluntary labeling; corporate reporting; advertising; public procurement (The Netherlands identified as a ‘Deep Green’ country for public procurement of non-food consumables)
Regulations in place to protect agricultural land Codes/regulations that allow/promote UA/local food Policies regarding use of open space/ zoning etc Land use planning includes consideration food system Policies require labeling of food origin / food miles etc
Toronto 2011: Assessing urban impacted soil for urban gardening: Decision support tool, Technical report and rationale, May, 2011 http://tcgn.ca/wiki/uploads/DonationsTradesSharing/urban_gardening_assessment.pdf
Plans, public policies, fiscal incentives
FAO, 2011 The Place Of Urban And Peri-Urban Agriculture (UPA) In National Food Security Programmes, P. 38 http://www.fao.org/docrep/014/i2177e/i2177e00.pdf
National Food Sovereignty Food Secure Canada Milan Urban Food Policy Pact (endorsed by Toronto City Council). October 15m, 2015.
Open/ public space use for local ag.
http://publicspaces.ca
Policies that support/restrict healthy food retail, farm to school, state food policy councils, institutions
Review paper on how to avoid trade restrictions Policies from the Field: Promising Food Policies from Other Places http://s.cela.ca/files/Local%20Food%20Procurement%20%28Feb.2013%29.pdf Wylie-Toal, B., Padanyi, P., Varangu, L., Kanetkar, V. (2013). Local Food Provision in Ontario’s Hospitals and Long-Term Care Facilities; Recommendations for Stakeholders. Report for the University of Guelph/Ontario Ministry of Agriculture, Food and Rural Affairs Partnership.

City Region Food System Toolkit Assessing and planning sustainable city region food systems
114
Baker for Ryerson planning paper on this topic
Toronto region, 2012 Food and Farming: An Action Plan 2021 https://www1.toronto.ca/static_files/economic_development_and_culture/docs/Sectors_Reports/foodfarming_actionplan.pdf
Food assistance programmes
Finding Food Food flow report Canada, 2104 Food banks, welfare, and food insecurity in Canada http://nutritionalsciences.lamp.utoronto.ca/wp-content/uploads/2014/ 09/BFJ-02-2014-0077.pdf
Presence of policies that encourage local processing, such as flexible food regulation and certification policies, and industrial land use planning.
Toronto, 2010 Nurturing Fruit and Vegetable Processing in Ontario, Carter-Whitney, CIELA, Sally Miller, West End Food Co-op http://metcalffoundation.com/wp-content/uploads/2011/05/nurturing-fruit-and-vegetable-processing.pdf
Action goals for sustainable food system
Toronto, 2010 Cultivating Food Connections: Toward a Healthy and Sustainable Food System for Toronto Overview of action goals for healthy, sustainable food system Appendix 1: http://www.toronto.ca/legdocs/mmis/2010/hl/bgrd/backgroundfile-30483.pdffile:///Users/alisonpalmer/Downloads/Cultivating%20Food%20Connections%252cToronto%20Food%20Strategy%20(FINAL)_1.pdf Food strategies for CFA, political parties
Urban agriculture action plan for Toronto
growTO: an urban agriculture action plan for Toronto (2012) http://tfpc.to/wordpress/wp-content/uploads/2012/08/GrowTO_ActionPlan_lowresFINAL.pdf Snapshot of existing projects: Commercial Farms and Market Gardens; Residential Gardens and Edible Landscaping; Community Gardens on City-owned Land; Gardens or Farms on Institutional Land; Gardens at Schools; Entrepreneurial Farms/Community Supported Agriculture; Gleaning Projects and Orchards; Rooftop Farms; Greenhouses; Therapeutic Gardens; Urban Livestock Priorities moving forward: link growers to land and space; strengthen education and training; increase vitality and promotion; add value to urban gardens; cultivate partnerships; develop supportive policy
UA production potential for Toronto
Rod MacRae et al. 2012.. Could Toronto Provide 10% of its Fresh Vegetable Requirements from Within its Own Boundaries? Part II, Policy Supports and Program Design. Journal of Agriculture, Food Systems and Community Development, Feb. 2012 (pp. 147–169) Scaling up urban agricultural activities in the City of Toronto could supply ten percent of the city's commercial demand for fresh vegetables, create jobs and economic opportunity, engage diverse communities, and enhance the urban environment. From City of Toronto minutes,
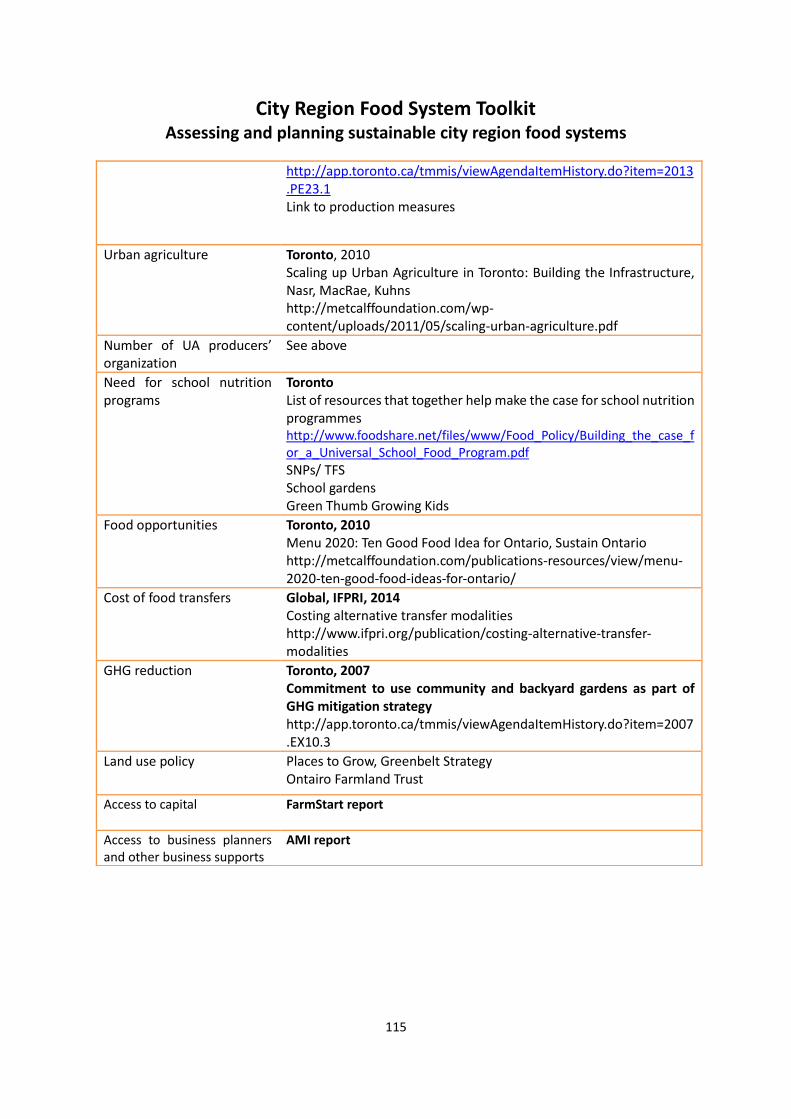
City Region Food System Toolkit Assessing and planning sustainable city region food systems
115
http://app.toronto.ca/tmmis/viewAgendaItemHistory.do?item=2013.PE23.1 Link to production measures
Urban agriculture Toronto, 2010 Scaling up Urban Agriculture in Toronto: Building the Infrastructure, Nasr, MacRae, Kuhns http://metcalffoundation.com/wp-content/uploads/2011/05/scaling-urban-agriculture.pdf
Number of UA producers’ organization
See above
Need for school nutrition programs
Toronto List of resources that together help make the case for school nutrition programmes http://www.foodshare.net/files/www/Food_Policy/Building_the_case_for_a_Universal_School_Food_Program.pdf SNPs/ TFS School gardens Green Thumb Growing Kids
Food opportunities Toronto, 2010 Menu 2020: Ten Good Food Idea for Ontario, Sustain Ontario http://metcalffoundation.com/publications-resources/view/menu-2020-ten-good-food-ideas-for-ontario/
Cost of food transfers Global, IFPRI, 2014 Costing alternative transfer modalities http://www.ifpri.org/publication/costing-alternative-transfer-modalities
GHG reduction Toronto, 2007 Commitment to use community and backyard gardens as part of GHG mitigation strategy http://app.toronto.ca/tmmis/viewAgendaItemHistory.do?item=2007.EX10.3
Land use policy Places to Grow, Greenbelt Strategy Ontairo Farmland Trust
Access to capital FarmStart report
Access to business planners and other business supports
AMI report

City Region Food System Toolkit Assessing and planning sustainable city region food systems
116
NATIONAL INDICATORS, CONTEXT
Impact of food prices
Urban Profile, UN Habitat, 2007
Other jurisdictions
Greater Philadelphia Food System Study
Water access, waste collection
UN Economic, social, environmental by country http://data.un.org/Default.aspx
GDP data, national accounts http://unstats.un.org/unsd/nationalaccount/sdPubs/ama-2013.pdf
WHO http://apps.who.int/gho/data/node.country
High level health indicator data by country
FAO FAO-STAT – Food Security indicators, by country AVAILABILITY (Average dietary energy supply adequacy; Average value of food production; Share of dietary energy supply derived from cereals, roots and tubers; Average protein supply; Average supply of protein of animal origin) ACCESS (Percent of paved roads over total roads; Road density; Rail lines density; Gross domestic product per capita (in purchasing power equivalent); Domestic food price index; Prevalence of undernourishment; Share of food expenditure of the poor ; Depth of the food deficit; Prevalence of food inadequacy) STABILITY (Cereal import dependency ratio; Percent of arable land equipped for irrigation; Value of food imports over total merchandise exports; Political stability and absence of violence/terrorism; Domestic food price volatility ; Per capita food production variability; Per capita food supply variability) UTILIZATION (Access to improved water sources; Access to improved sanitation facilities; Percentage of children under 5 years of age affected by wasting; Percentage of children under 5 years of age who are stunted; Percentage of children under 5 years of age who are underweight; Percentage of adults who are underweight; Prevalence of anaemia among pregnant women; Prevalence of anaemia among children under 5 years of age; Prevalence of vitamin A deficiency in the population; Prevalence of iodine deficiency) ADDITIONAL USEFUL STATISTICS (Total population; Number of people undernourished; Minimum Dietary Energy Requirement (MDER); Average Dietary Energy Requirement (ADER); Minimum Dietary Energy Requirement (MDER) - PAL=1.75; Coefficient of variation of habitual caloric consumption distribution; Skewness of habitual caloric consumption distribution; Incidence of caloric losses at retail distribution level; Dietary Energy Supply (DES); Average fat supply) http://faostat3.fao.org/download/D/*/E
Food security indicators, by country, 1987-2014,

City Region Food System Toolkit Assessing and planning sustainable city region food systems
117
Prevalence of undernourishment (%) (3-year average) Average dietary energy supply adequacy (%) (3-year average)
Prevalence of food inadequacy (%) (3-year average) Number of people undernourished (millions) (3-year average)
Depth of the food deficit (kcal/capita/day) (3-year average)
Per capita food supply variability (kcal/capita/day) http://faostat3.fao.org/download/D/FS/E Can generate custom tables
MAPS Area of agricultural land for urban/ peri urban/ rural food production
NASA MAPS, Vegetation cover 1. There are two sensors - the MODIS sensor from 2000 to the present at various resolutions - 250m at the native resolution and 5000m aggregated. There are maps for display or for exploration using various viewers developed by the remote sensing community for agriculture: 2. 250m MODIS viewer - lots of features, esp time series analysis MODIS-based time series analysis viewer: 3. Explorer that uses coarse resolution (10km) datasets, but displays NDVI, rainfall, and temperature together 1. MODIS viewer http://pekko.geog.umd.edu/usda/beta/ 2. MODIS-based time series analysis viewer: http://wamis.meraka.org.za/time-series-viewer 3. Coarse resolution Explorer http://earlywarning.usgs.gov:8080/EWX/index.html
NASA MAPS roads Best source of ‘standard’ road data is just a GIS package with ESRI files that have vectors for the major roads. In Africa the USGS has a really great GIS layer of roads that actually function and keep it up to date (harder than you’d think) but these are very hard to work with and are frankly not easy to access. Lots of places take the World Bank GIS layers and put them online - see http://www.infrastructureafrica.org/documents/tools/list/arcgis-shape-files?page=11 for the Zambia layers for example. There has been an effort recently in the research community to make gridded files on how long it takes to get to major city (defined as over 50000) which is useful for understanding if a particular place is isolated or not. See http://bioval.jrc.ec.europa.eu/products/gam/index.htm This map is particularly useful in Africa and the mountainous areas of Asia where places are very remote despite being ‘near’.
FAO Geonetwork, Global scale, some country data Administrative and Political Boundaries; Agriculture and Livestock; Applied Ecology; Base Maps, Remote Sensing and Toponomy; Biological and Ecological Resources; Climate; Fisheries and Aquaculture; Forestry; Human Health; Hydrology and Water Resources; Infrastructures; Land Cover and Land Use; Population and Socio-Economic Indicators; Soils and Soil Resources; Topography http://www.fao.org/geonetwork/srv/en/main.home

City Region Food System Toolkit Assessing and planning sustainable city region food systems
118
http://harvestchoice.org/products/data
Interactive maps and tables; data by country; seems to requires GIS software to create maps from raw data sets; exploring availability of data at city-region scale
http://gaez.fao.org/Main.html All maps only for 2000 Maps available for at 1000 ha pixels for land resources (soil, water, terrain, land cover, protected areas, agro-ecological zones, selected socio-economic), agro-climatic resources (thermal/moisture regimes, growing period), suitability and potential yield (agro-climatic yield, climate yield constraints, crop calendar, agro-ecological suitability and productivity), actual yield and production (crop production value, crop harvested area), yield and production gaps (aggregate yield ratio, crop yield ratio and production gap)
IFPRI
CGIAR
IFPRI
MDG Progress
http://www.statistics.gov.lk/MDG/Mid-term.pdf (2008) Especially pages 22+ re poverty, minimum level of dietary consumption; some data by city, province, gender; urban/rural
General info, UA, 2011
Farmer/gardener interviews Maps: land use; public green spaces; soils Enumeration of UA and related activities Stakeholder table
Health: Obesity rates per wealth class; for school children Diet related diseases
WHO Interactive map: Maps with data by country, 2008, obesity rates per capita, by male/female http://gamapserver.who.int/gho/interactive_charts/ncd/risk_factors/overweight_obesity/atlas.html Data: http://apps.who.int/gho/data/view.main.2430

City Region Food System Toolkit Assessing and planning sustainable city region food systems
119
PENDING INDICATORS
Extent of food deserts: a. Food deserts are defined as urban neighbourhoods and rural towns without ready access to fresh,
healthy, and affordable food. Instead of supermarkets and grocery stores, these communities may have no food access or are served only by fast food restaurants and convenience stores that offer few healthy, affordable food options. The lack of access contributes to a poor diet and can lead to higher levels of obesity and other diet-related diseases, such as diabetes and heart disease
Number/% of farms with direct sales
Economic value of produce directly sold to consumers/ from UA/ from CSA/ sold on roadsides
Access to local food by residents from different wealth classes
Number of farm to school/farm to institution/ farm to restaurant programmes
Wage information and number of workers in local distribution organizations
Area of agricultural land under organic/conventional production
Number of food banks/ soup kitchens
Customer preference for local food/ willingness to pay
Proportion of different types of farms (family owned, etc)
Surface (or percentage) area in region per type of crop/product
Tenure on farm
Number of producers who use a locally grown label
Carbon foot print production
Urban, agricultural and recycled water use
Agricultural income versus other sources of income for farmers
Number of food waste recovery programs, such as community composting, rendering companies that collect food service grease, and food scrap processing facilities]
Number of Waste disposal, recycle, large-scale composting, backyard composting, school composting programmes/initiatives
Percent of green waste/ organic waste recycled; Organic waste disposed vs recycled
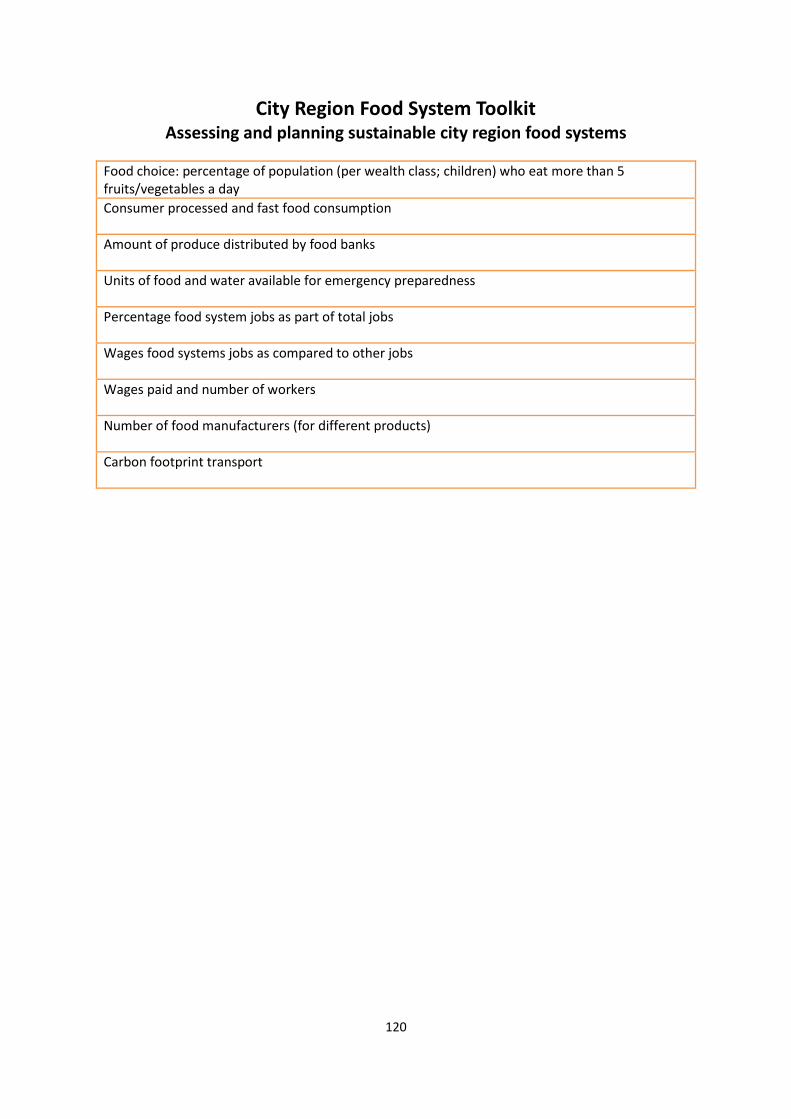
City Region Food System Toolkit Assessing and planning sustainable city region food systems
120
Food choice: percentage of population (per wealth class; children) who eat more than 5 fruits/vegetables a day
Consumer processed and fast food consumption
Amount of produce distributed by food banks
Units of food and water available for emergency preparedness
Percentage food system jobs as part of total jobs
Wages food systems jobs as compared to other jobs
Wages paid and number of workers
Number of food manufacturers (for different products)
Carbon footprint transport

City Region Food System Toolkit Assessing and planning sustainable city region food systems
121
Tool/Example:
Stakeholder Interview Types
Author(s): Sally Miller, Toronto CRFS Project Coordinator
Project: RUAF – Wilfrid Laurier CityFoodTools
Introduction to the joint programme
This tool is part of the City Region Food Systems (CRFS) toolkit to assess and plan sustainable
city region food systems. The toolkit has been developed by FAO, RUAF Foundation and Wilfrid
Laurier University with the financial support of the German Federal Ministry of Food and
Agriculture and the Daniel and Nina Carasso Foundation.
Link to programme website and toolbox
http://www.fao.org/in-action/food-for-cities-programme/overview/what-we-do/en/
http://www.fao.org/in-action/food-for-cities-programme/toolkit/introduction/en/
http://www.ruaf.org/projects/developing-tools-mapping-and-assessing-sustainable-city-
region-food-systems-cityfoodtools
Tool summary:
Tool description:
This table allowed the Toronto team to ‘count’ the number of stakeholders proposed for
interviews. The table includes columns for points along the food chain and rows for possible
stakeholders. Stakeholders include: government, public institutions, non-governmental
organisations, round tables, commissions, sector associations, foundations and funding
organisations, community groups, lobby groups, education organisations, consulting groups,
research groups, think tanks, marketing groups and private businesses. The goal of
Brief description This table allowed the Toronto team to ‘count’ the number of stakeholders proposed for interviews. The goal of developing this table was to identify where there were gaps and/or over-representation in the stakeholder group.
Expected outcome Decisions about the CRFS study boundaries, impacts and next steps.
Expected Output Meeting notes including preliminary decisions about project boundaries, impact analysis and suggestions for next steps.
Scale of application Project level
Expertise required for application
Project management
Examples of application
Toronto and Greater Golden Horseshoe
Year of development 2015
References -

City Region Food System Toolkit Assessing and planning sustainable city region food systems
122
developing this table was to identify where there were gaps and/or over-representation in
the stakeholder group.
Area of impact Organization types
Agricultural inputs and food production
Food storage, processing and manufacturing
Food wholesale and distribution
Food marketing, catering, retail
Food consumption
Food and organic waste management
Other
Government departments/ groups (provincial)
5 8
Government departments/ groups (municipal)
3 3 2 2 1
Public institutions
Non-government organizations (NGOs)
8 2 2 3
Roundtables/ Commissions
1
Public/private partnerships
1
Sector associations/ networks
12 2 7 4
Industry associations/ networks
1 1 1
Foundations, funding organizations (non-governmental)
1 1 5
Community groups (projects)
1 1
Community groups (advisory to sector and government)
4 2 1
Education organizations/ representatives (academic)
2 3 5
Consulting firms/ research groups/ think-tanks
3 1
Lobbying groups 1
Marketing groups 2 1
Private corporations and businesses
1

City Region Food System Toolkit Assessing and planning sustainable city region food systems
123
Tool/Example:
CRFS Scan: Priorities and next steps
Author(s): Sally Miller, Toronto CRFS Project Coordinator
Project: RUAF – Wilfrid Laurier CityFoodTools
Introduction to the joint programme
This tool is part of the City Region Food Systems (CRFS) toolkit to assess and plan sustainable
city region food systems. The toolkit has been developed by FAO, RUAF Foundation and Wilfrid
Laurier University with the financial support of the German Federal Ministry of Food and
Agriculture and the Daniel and Nina Carasso Foundation.
Link to programme website and toolbox
http://www.fao.org/in-action/food-for-cities-programme/overview/what-we-do/en/
http://www.fao.org/in-action/food-for-cities-programme/toolkit/introduction/en/
http://www.ruaf.org/projects/developing-tools-mapping-and-assessing-sustainable-city-
region-food-systems-cityfoodtools
Tool summary:
Tool description:
This powerpoint presentation provides a brief overview of the methodology followed in the
Toronto city region in implementing the CRFS Scan and Assessment. The presentation also
highlights how these activities are feeding into a policy support process.
Brief description This powerpoint presentation provides a brief overview of the methodology followed in the Toronto city region in implementing the CRFS Scan and Assessment.
Expected outcome The presentation highlights how CRFS activities feed into a policy support process and so enables decision-making about next steps in the CRFS research.
Expected Output Improved decision making about policy gaps and assets for sustainable food systems.
Scale of application Project level
Expertise required for application
Project management
Examples of application
Toronto and Greater Golden Horseshoe
Year of development 2015
References -

City Region Food System Toolkit Assessing and planning sustainable city region food systems
124
Source: Local Organic Food Co-ops Network
Toronto City Region Food Systems (CRFS) project
Supporters and partners
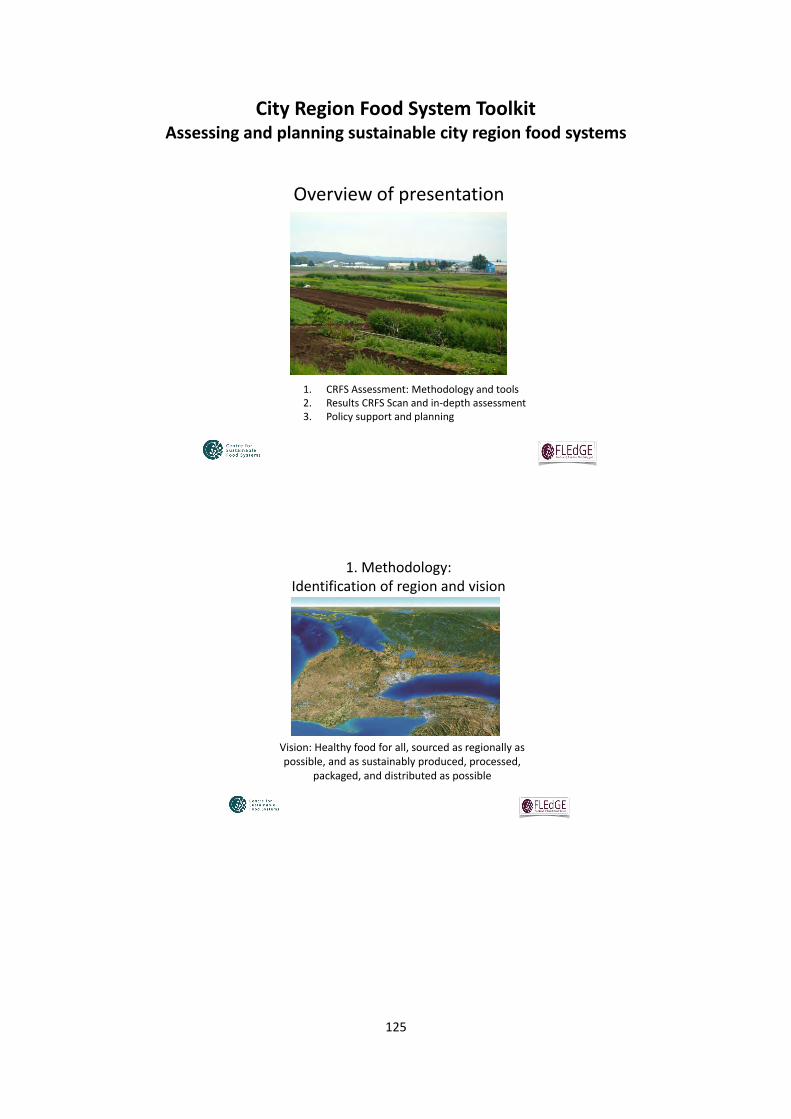
City Region Food System Toolkit Assessing and planning sustainable city region food systems
125
Overview of presentation
1. CRFS Assessment: Methodology and tools2. Results CRFS Scan and in-depth assessment3. Policy support and planning
1. Methodology: Identification of region and vision
Vision: Healthy food for all, sourced as regionally as possible, and as sustainably produced, processed,
packaged, and distributed as possible
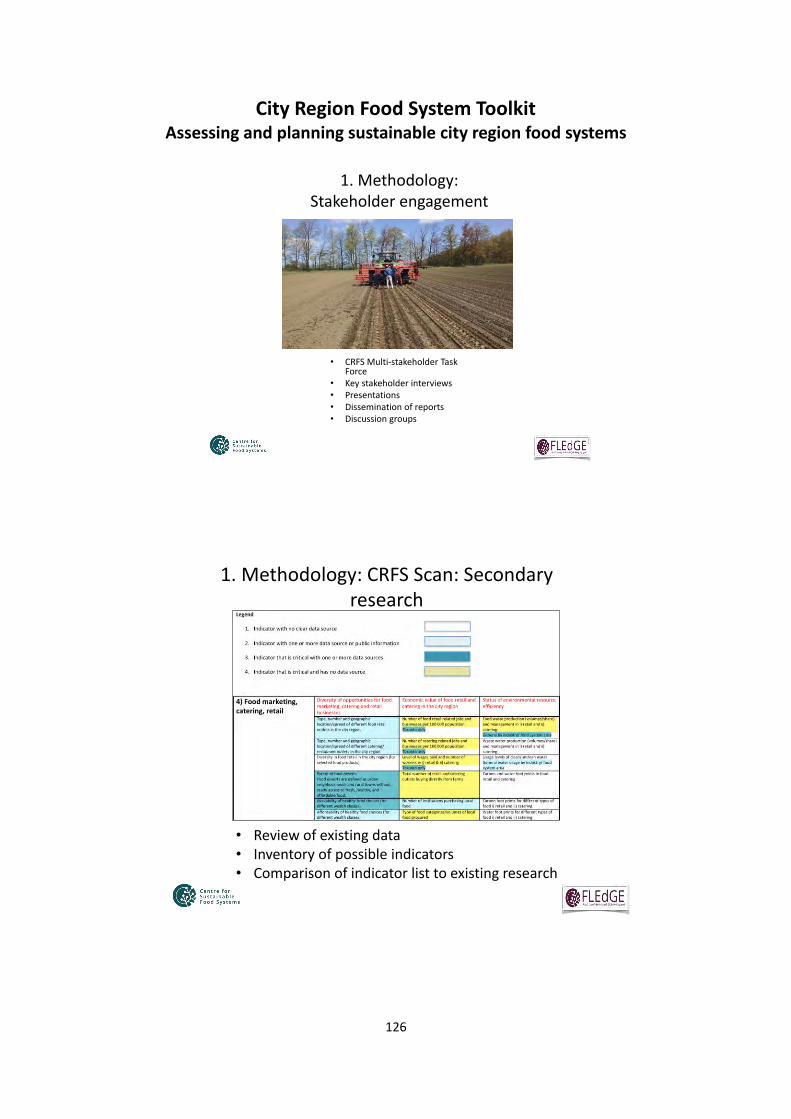
City Region Food System Toolkit Assessing and planning sustainable city region food systems
126
1. Methodology: Stakeholder engagement
• CRFS Multi-stakeholder Task Force
• Key stakeholder interviews• Presentations• Dissemination of reports• Discussion groups
1. Methodology: CRFS Scan: Secondary research
• Review of existing data• Inventory of possible indicators• Comparison of indicator list to existing research

City Region Food System Toolkit Assessing and planning sustainable city region food systems
127
1. Methodology: CRFS Scan- Tools
• Census of agriculture
• Statistics Canada
– Import/ export tables
– Community Health Survey
– Consumption data
• Secondary research on economic, environment, social measurements of food system
Research Challenges
• Gaps in census data• Complexity of import export flows• Aggregated data differed from research area• Broad region and food system issues
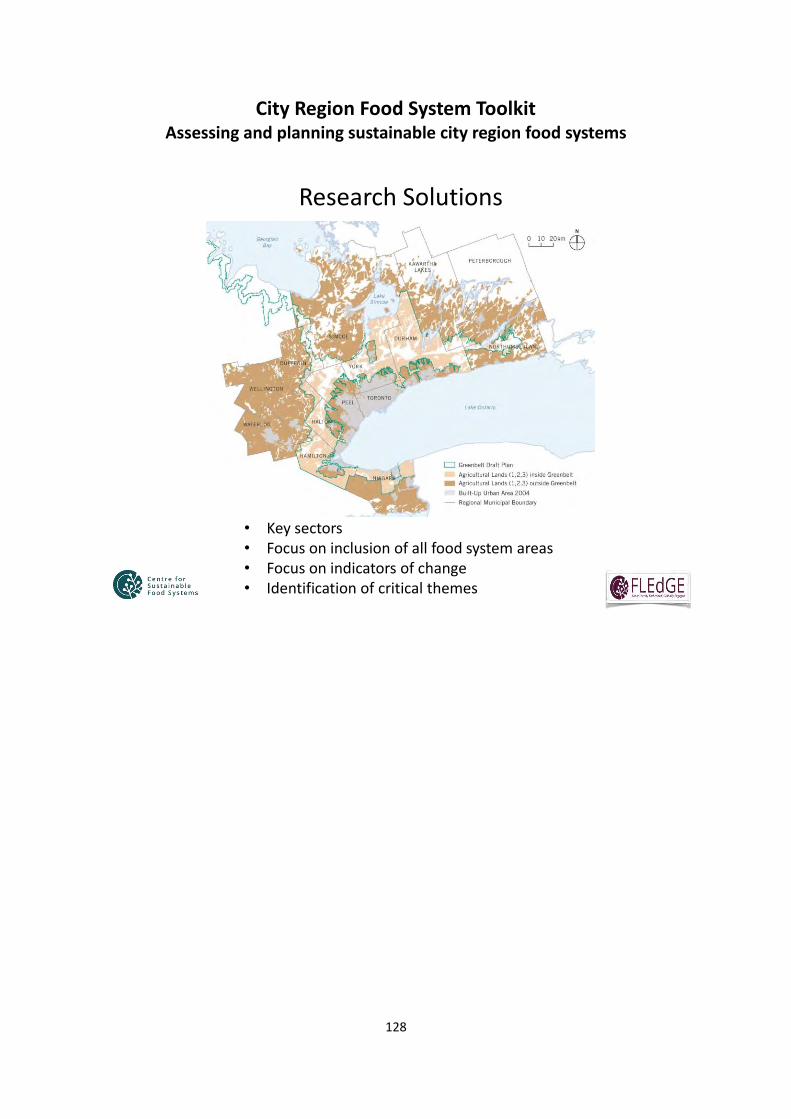
City Region Food System Toolkit Assessing and planning sustainable city region food systems
128
Research Solutions
• Key sectors• Focus on inclusion of all food system areas• Focus on indicators of change• Identification of critical themes

City Region Food System Toolkit Assessing and planning sustainable city region food systems
129
2. CRFS Scan: Results
2. CRFS Scan results: Food flows
(50.000.000)
-
50.000.000
100.000.000
150.000.000
200.000.000
250.000.000
Production Consumption Difference
Carrots (lbs)

City Region Food System Toolkit Assessing and planning sustainable city region food systems
130
3. Methodology: CRFS Assessment- primary research
• Presentations (8)
• Interview participants (80)
• Group discussions (18)
3. CRFS Assessment priority research areas
• Regional food flows
• Labour and work quality
• Waste
• Democratic engagement
• Education
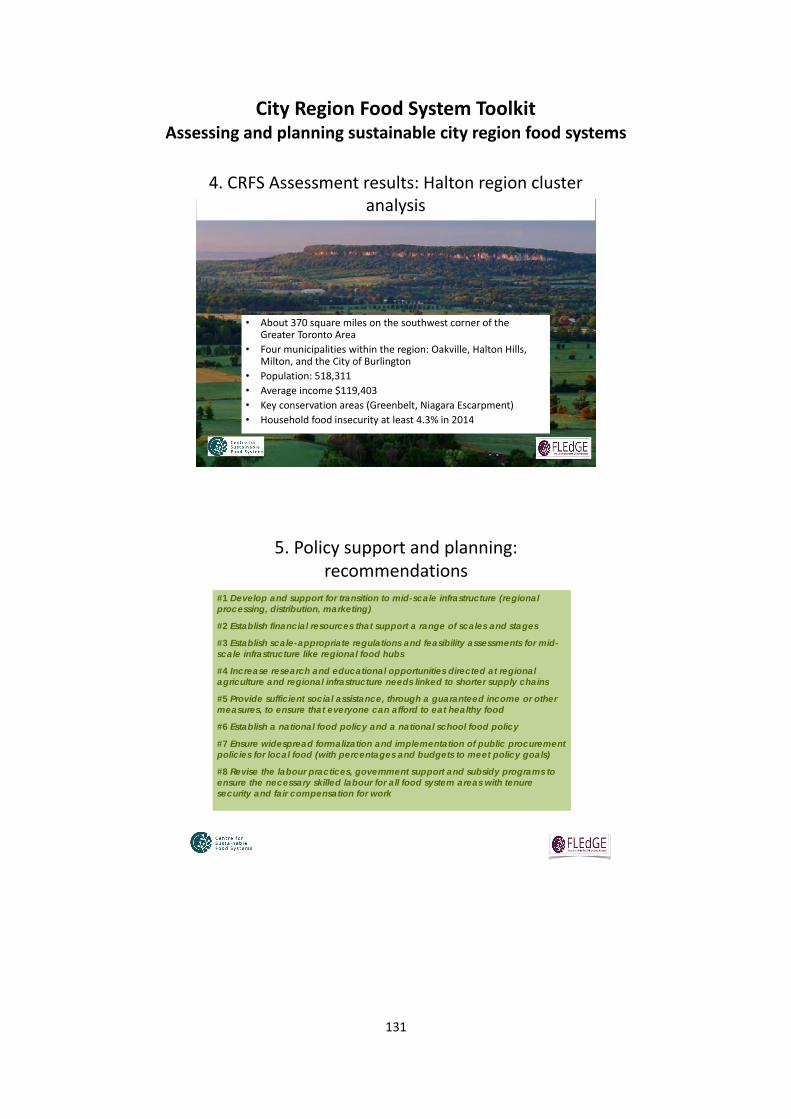
City Region Food System Toolkit Assessing and planning sustainable city region food systems
131
4. CRFS Assessment results: Halton region cluster analysis
• About 370 square miles on the southwest corner of the Greater Toronto Area
• Four municipalities within the region: Oakville, Halton Hills, Milton, and the City of Burlington
• Population: 518,311
• Average income $119,403
• Key conservation areas (Greenbelt, Niagara Escarpment)
• Household food insecurity at least 4.3% in 2014
5. Policy support and planning: recommendations
#1 Develop and support for transition to mid-scale infrastructure (regional
processing, distribution, marketing)
#2 Establish financial resources that support a range of scales and stages
#3 Establish scale-appropriate regulations and feasibility assessments for mid-
scale infrastructure like regional food hubs
#4 Increase research and educational opportunities directed at regional
agriculture and regional infrastructure needs linked to shorter supply chains
#5 Provide sufficient social assistance, through a guaranteed income or other
measures, to ensure that everyone can afford to eat healthy food
#6 Establish a national food policy and a national school food policy
#7 Ensure widespread formalization and implementation of public procurement
policies for local food (with percentages and budgets to meet policy goals)
#8 Revise the labour practices, government support and subsidy programs to
ensure the necessary skilled labour for all food system areas with tenure
security and fair compensation for work
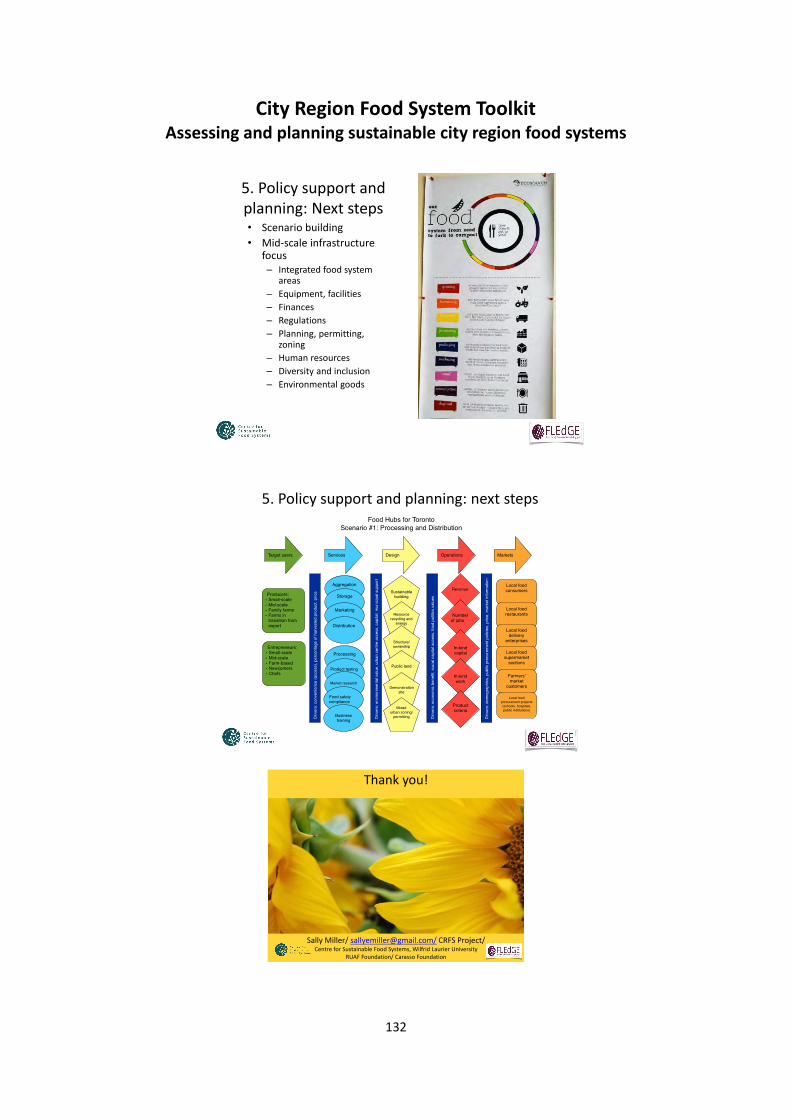
City Region Food System Toolkit Assessing and planning sustainable city region food systems
132
5. Policy support and planning: Next steps• Scenario building
• Mid-scale infrastructure focus– Integrated food system
areas
– Equipment, facilities
– Finances
– Regulations
– Planning, permitting, zoning
– Human resources
– Diversity and inclusion
– Environmental goods
5. Policy support and planning: next steps
Thank you!
Sally Miller/ [email protected]/ CRFS Project/ Centre for Sustainable Food Systems, Wilfrid Laurier University
RUAF Foundation/ Carasso Foundation

City Region Food System Toolkit Assessing and planning sustainable city region food systems
133
Tool/Example:
CRFS Scan Guiding Framework
Author(s): Marielle Dubbeling and Joy Carey, RUAF Foundation
Note: The document benefitted from important expert inputs and FAO consultation2.
Project: RUAF CityFoodTools project/ FAO Food for the Cities Programme
Introduction to the joint programme
This tool is part of the City Region Food Systems (CRFS) toolkit to assess and plan sustainable
city region food systems. The toolkit has been developed by FAO, RUAF Foundation and Wilfrid
Laurier University with the financial support of the German Federal Ministry of Food and
Agriculture and the Daniel and Nina Carasso Foundation.
Link to programme website and toolbox
http://www.fao.org/in-action/food-for-cities-programme/overview/what-we-do/en/
http://www.fao.org/in-action/food-for-cities-programme/toolkit/introduction/en/
http://www.ruaf.org/projects/developing-tools-mapping-and-assessing-sustainable-city-
region-food-systems-cityfoodtools
Tool summary:
Tool description:
The CRFS data framework provides a set of research questions and data types that can be
looked at when implementing a CRFS Scan. The data framework also provides possible sources
2 The following people participated in the FAO experts consultation: Guido Santini, Makiko Taguchi, Michela
Carucci, Louison Lancon, Jia Ni, Yota Nicolarea, Carlo Cafiero, Erdgin Mane, Anne Kepple, Jorge Fonseca,
Warren Lee, Camelia Bucatariu, Cecilia Marocchino, Vito Cistulli, Stefania Amato, Emily Mattheisen,
Florence Egal, Sudarshana Fernando and Alison Blay Palmer.
Brief description The CRFS Scan Guiding framework provides a set of research questions and data that can be looked at when implementing the CRFS Scan.
Expected outcome Collection of information and data for the CRFS Scan Expected Output Data sources identified, data surveys elaborated and targeted key stakeholders
selected Scale of application City region Expertise required Data enumeration, interview skills Examples of application
Kitwe and Lusaka (Zambia), Utrecht (The Netherlands), Toronto (Canada), Colombo (Sri Lanka), Quito (Ecuador) and Medellin (Colombia)
Year of development 2016

City Region Food System Toolkit Assessing and planning sustainable city region food systems
134
for data collection and, for each of the key actors involved in the food system, categories of
information that can be collected, and questions that can be asked in view of an interview or
survey. The data framework can be used by the local CRFS project team to guide researchers,
by (i) selecting areas of investigation and sources of information (ii) identifying the key actors
to interview for each area, and/or (iii) identifying the questions to be asked to collect specific
data. It gives an extensive overview of relevant data for each of these areas that may help
respond to the key questions that help characterising the CRFS. Its aim is not to collect
information on all indicators listed. It rather provides guidance on what data to possibly look
for, where to find that data and the type of surveys that could be used to collect information
through interviews with key stakeholders to help fill data gaps.
A local CRFS team might wish to make use of this tool to assemble information in response to
the following ‘big picture’ questions about the performance and longer-term sustainability
and resilience of the city region food system:
A. Who feeds the city region: Where does the food come from? What and how much
food is produced locally in the city region? Where are inputs and resources sourced from?
How does the city region’s food supply system fit into the wider national and global food
supply system? It is usually recommended that the research focus on the main food items
consumed and produced in the city region. Food items may also be grouped in specific
categories like meat products, dairy, fruits and vegetables, eggs and grains (based on the
household consumption basket or at local/potential agricultural and livestock production.
B. Food processing and manufacturing: Which companies prepare/manufacture the
food consumed in the city region?
C. Food wholesale and distribution: Who supplies the food to businesses/markets that
sell food to consumers?
D. Food marketing, catering and retail: Where do citizens buy their food? Please
differentiate between citizens of different socio economic conditions and urban-rural areas.
E. Food consumption: What do people in the city region eat? What is the composition
of their actual diet and food basket? What are food security/nutrition/food related health
concerns? Can people access local food and where? Please differentiate between citizens of
different socio-economic conditions and for different areas (urban and rural).
F. Food and organic waste: Where and how much food and organic waste is generated
along the food chain and how is it managed?
G. What policies and plans influence the CRFS? Identify policies directly related to food
production, processing etc., as well as other sectoral policies (health, economic development,
land use planning) that have a bearing on the CRFS.
H. Who governs the food system? What role and power do decision-makers and key
stakeholders have in shaping a more sustainable/resilient food system that serves the city
region?

City Region Food System Toolkit Assessing and planning sustainable city region food systems
135
I. What are the strengths and vulnerabilities of the current city region food system?
This can be analysed for different sustainability dimensions and parts of the food chain.
J. To what extent is the current food system (and different parts of the food system)
resilient to shocks and projected circumstances in the longer-term?
K. Which areas of the city region, what parts of the food chain and which groups of
residents/involved stakeholders would be most adversely affected by vulnerabilities in the
food system?
L. What are the key priority areas that need to be addressed to develop a more
sustainable and resilient food system for the future? Note: consider the different
sustainability and food systems areas and dimensions.
M. What are the 5-10 main key issues that require further research and in-depth
assessment?
Taking a ‘whole food system’ approach, the data types suggested are based on a matrix of
food system dimensions: the sustainability areas that reflect the multifunctional nature of the
food system; and ii) the components of the whole food system (from production through to
waste, and also food system policy and planning). The table below sets out this early stage
matrix and the above mentioned overarching research questions that relate to the various
components of the food system.
Deciding on the most relevant research questions and data to be collected is an important
early stage in shaping the CRFS assessment and planning process.
More detailed guidance on data sources and survey questions are provided in the
accompanying Guidance for Researchers that can be accessed here:
http://www.ruaf.org/projects/developing-tools-mapping-and-assessing-sustainable-city-
region-food-systems-cityfoodtools.

City Region Food System Toolkit Assessing and planning sustainable city region food systems
136
Sustainability areas / Components of food system and overarching *research
questions
Social sustainability
and equity (Improve
health and well-being)
Economic sustainability
(Increase local
economic growth
and decent jobs)
Environmental sustainability
(Improve stewardship
of environmental
resources)
Urban-rural integration
(Improve city region food
supply)
Food governance
(Improve governance for
sustainable food systems)
Reduce vulnerability and increase
resilience
Input supply and food production Food system aim: develop and strengthen the city region food production capacity and potential. Overarching research questions:
Has your city region got enough food to feed its population now and in the near future?
To what extent does the volume of available city region produced food contribute to city region consumption? What is the potential for a re-localised food system in the city region?
Can sustainability and resilience of city region food production and input supply be increased?
Specific research questions:
Who feeds the city region? Where does the food come from that is consumed in
the city region? How, what and how much food is produced locally in
the city region? Can this be increased? How does city regions food supply system fit into the
wider national and global food supply system?
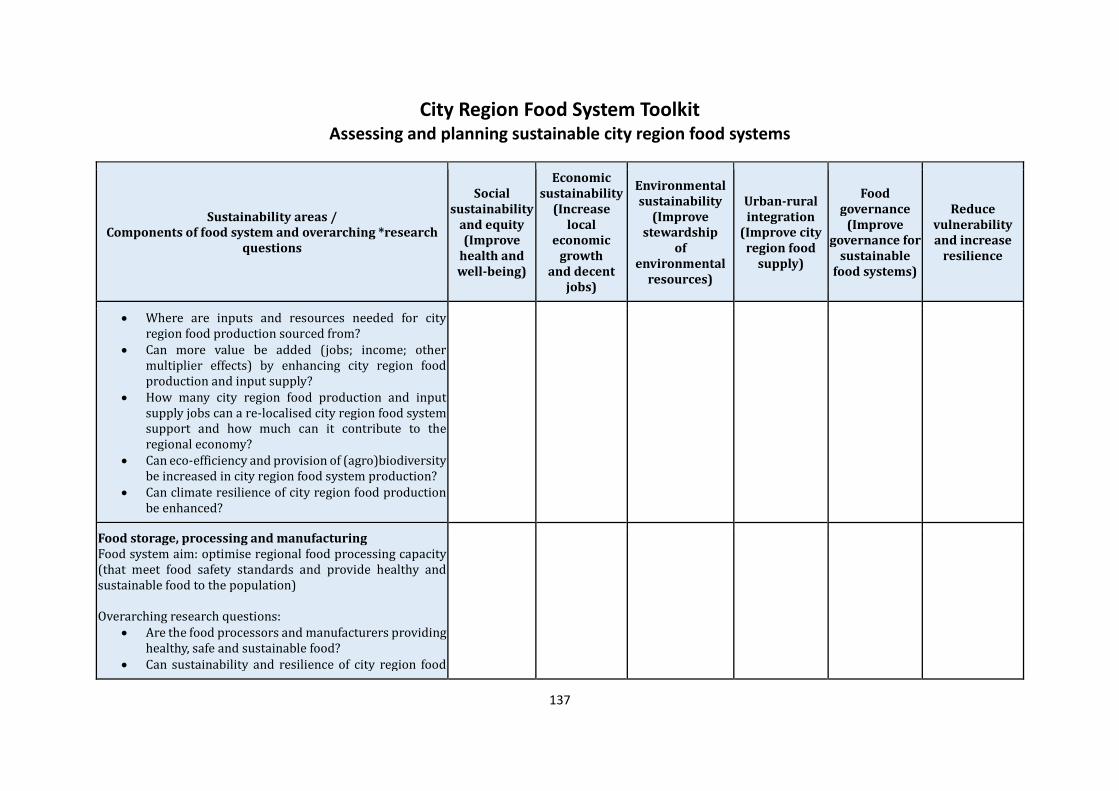
City Region Food System Toolkit Assessing and planning sustainable city region food systems
137
Sustainability areas / Components of food system and overarching *research
questions
Social sustainability
and equity (Improve
health and well-being)
Economic sustainability
(Increase local
economic growth
and decent jobs)
Environmental sustainability
(Improve stewardship
of environmental
resources)
Urban-rural integration
(Improve city region food
supply)
Food governance
(Improve governance for
sustainable food systems)
Reduce vulnerability and increase
resilience
Where are inputs and resources needed for city region food production sourced from?
Can more value be added (jobs; income; other multiplier effects) by enhancing city region food production and input supply?
How many city region food production and input supply jobs can a re-localised city region food system support and how much can it contribute to the regional economy?
Can eco-efficiency and provision of (agro)biodiversity be increased in city region food system production?
Can climate resilience of city region food production be enhanced?
Food storage, processing and manufacturing Food system aim: optimise regional food processing capacity (that meet food safety standards and provide healthy and sustainable food to the population) Overarching research questions:
Are the food processors and manufacturers providing healthy, safe and sustainable food?
Can sustainability and resilience of city region food
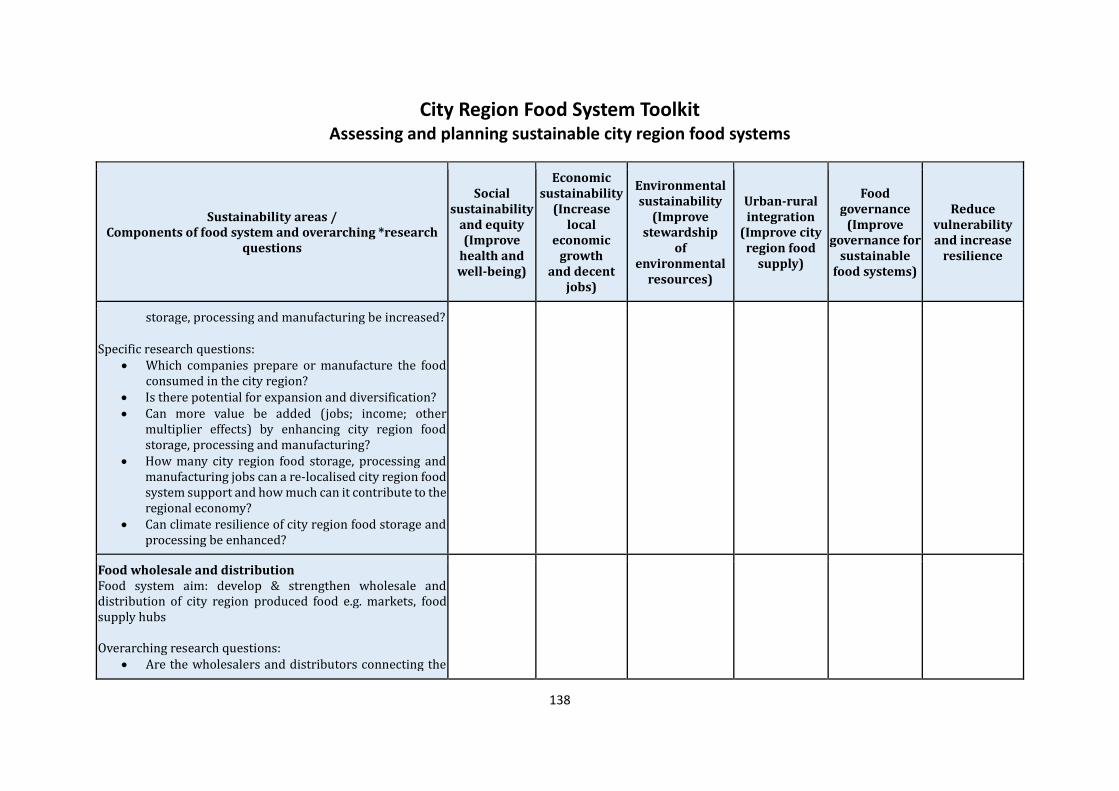
City Region Food System Toolkit Assessing and planning sustainable city region food systems
138
Sustainability areas / Components of food system and overarching *research
questions
Social sustainability
and equity (Improve
health and well-being)
Economic sustainability
(Increase local
economic growth
and decent jobs)
Environmental sustainability
(Improve stewardship
of environmental
resources)
Urban-rural integration
(Improve city region food
supply)
Food governance
(Improve governance for
sustainable food systems)
Reduce vulnerability and increase
resilience
storage, processing and manufacturing be increased? Specific research questions:
Which companies prepare or manufacture the food consumed in the city region?
Is there potential for expansion and diversification? Can more value be added (jobs; income; other
multiplier effects) by enhancing city region food storage, processing and manufacturing?
How many city region food storage, processing and manufacturing jobs can a re-localised city region food system support and how much can it contribute to the regional economy?
Can climate resilience of city region food storage and processing be enhanced?
Food wholesale and distribution Food system aim: develop & strengthen wholesale and distribution of city region produced food e.g. markets, food supply hubs Overarching research questions:
Are the wholesalers and distributors connecting the

City Region Food System Toolkit Assessing and planning sustainable city region food systems
139
Sustainability areas / Components of food system and overarching *research
questions
Social sustainability
and equity (Improve
health and well-being)
Economic sustainability
(Increase local
economic growth
and decent jobs)
Environmental sustainability
(Improve stewardship
of environmental
resources)
Urban-rural integration
(Improve city region food
supply)
Food governance
(Improve governance for
sustainable food systems)
Reduce vulnerability and increase
resilience
city with food from the region? Can sustainability and resilience of city region food
wholesale and distribution be increased? Specific research questions:
Who supplies the food to businesses/markets that sell food to the consumers?
Can the sector by expanded and diversified? Can more value be added (jobs; income; other
multiplier effects) by enhancing city region food whole-sale and distribution?
How many city region food wholesale and distribution jobs can a re-localised city region food system support and how much can it contribute to the regional economy?
Can transport efficiency be increased (more efficient modes of transport/distribution; use of non-fossil fuel modes of transport)?
Can climate resilience of city region food wholesale and distribution be enhanced?
Food marketing, catering and retail Food system aim: develop and strengthen the presence of food

City Region Food System Toolkit Assessing and planning sustainable city region food systems
140
Sustainability areas / Components of food system and overarching *research
questions
Social sustainability
and equity (Improve
health and well-being)
Economic sustainability
(Increase local
economic growth
and decent jobs)
Environmental sustainability
(Improve stewardship
of environmental
resources)
Urban-rural integration
(Improve city region food
supply)
Food governance
(Improve governance for
sustainable food systems)
Reduce vulnerability and increase
resilience
outlets (shops, canteens, markets, street traders) that supply fresh healthy food to city region residents Overarching research questions:
Does each citizen in the city region have access to affordable and healthy food outlets?
Can sustainability and resilience of city region food marketing, catering and retail be increased?
Specific research questions:
Where do citizens buy their food? Can the city region food marketing, catering and retail
sector be expanded and diversified? Can availability, affordability and accessibility of
healthy/nutritious and culturally appropriate food choices be increased?
Can more value be added (jobs; income; other multiplier effects) by enhancing city region food marketing, catering and retail?
How many city region food catering and retail jobs can a re-localised city region food system support and how much can it contribute to the regional economy?
Can climate resilience of city region food marketing, catering and retail be enhanced?

City Region Food System Toolkit Assessing and planning sustainable city region food systems
141
Sustainability areas / Components of food system and overarching *research
questions
Social sustainability
and equity (Improve
health and well-being)
Economic sustainability
(Increase local
economic growth
and decent jobs)
Environmental sustainability
(Improve stewardship
of environmental
resources)
Urban-rural integration
(Improve city region food
supply)
Food governance
(Improve governance for
sustainable food systems)
Reduce vulnerability and increase
resilience
Food consumption Food system aim: all city region residents consume healthy, safe and nutritious food in the right amounts for good health Overarching research questions:
Are city region residents eating nutritious, safe and healthy food in the right amounts for good health?
Can sustainability and resilience of city region food consumption be increased?
Specific research questions:
What do people in the city region eat? What is the composition of their actual diet and food
basket? What are related food security/nutrition/food related
health concerns? Can they access food produced in the city region and
where? How can city region food security, availability, safety,
appropriateness, utilisation and transparency be enhanced? Please differentiate for citizens of different socio economic conditions.

City Region Food System Toolkit Assessing and planning sustainable city region food systems
142
Sustainability areas / Components of food system and overarching *research
questions
Social sustainability
and equity (Improve
health and well-being)
Economic sustainability
(Increase local
economic growth
and decent jobs)
Environmental sustainability
(Improve stewardship
of environmental
resources)
Urban-rural integration
(Improve city region food
supply)
Food governance
(Improve governance for
sustainable food systems)
Reduce vulnerability and increase
resilience
Food and organic waste management Food system aims: reduce overall food waste throughout the food chain in the city region and optimise recycling of nutrients, water and energy for city region food production Overarching research questions:
Is food waste actively being reduced? Are closed loop systems being used in organic waste
(water) management? Can sustainability and resilience of city region food
and organic waste management be increased? Specific research questions:
Where and how much food and organic waste is generated along the food chain and how is it managed?
Where can food waste and organic waste along the food chain (for production to consumption) be reduced and better managed?
Can more value be added (jobs; income; other multiplier effects) by enhancing city region food and organic waste management?
How many city region food and organic waste management jobs can a re-localised city region food

City Region Food System Toolkit Assessing and planning sustainable city region food systems
143
Sustainability areas / Components of food system and overarching *research
questions
Social sustainability
and equity (Improve
health and well-being)
Economic sustainability
(Increase local
economic growth
and decent jobs)
Environmental sustainability
(Improve stewardship
of environmental
resources)
Urban-rural integration
(Improve city region food
supply)
Food governance
(Improve governance for
sustainable food systems)
Reduce vulnerability and increase
resilience
system support and how much can it contribute to the regional economy?
(Cross cutting): City region food system policy planning Food system aim: develop, implement and monitor improved and more resilient city region food policies and strategies Overarching research questions:
Is there a mechanism for implementing food system change?
Can sustainability and resilience of city region food system planning be increased?
Specific research questions: What are the strengths and vulnerabilities of the
current city region food system? To what extent is the current city region food system
(e.g. different parts of the food system) resilient to shocks and projected circumstances in the longer-term?
Which areas of the city region, what parts of the food chain and which groups of residents/involved

City Region Food System Toolkit Assessing and planning sustainable city region food systems
144
Sustainability areas / Components of food system and overarching *research
questions
Social sustainability
and equity (Improve
health and well-being)
Economic sustainability
(Increase local
economic growth
and decent jobs)
Environmental sustainability
(Improve stewardship
of environmental
resources)
Urban-rural integration
(Improve city region food
supply)
Food governance
(Improve governance for
sustainable food systems)
Reduce vulnerability and increase
resilience
stakeholders would be most adversely affected by vulnerabilities in the food system?
What are the priority areas that need to be addressed in order to develop a more sustainable and resilient city region food system for the future (think again of the different sustainability and food systems areas and dimensions)?
What role and powers do the city’s and city region decision-makers and key stakeholders have in shaping a more sustainable/resilient food system that serves the city region? How can these roles be enhanced/made more equitable?

City Region Food System Toolkit Assessing and planning sustainable city region food systems
145
Tool/Example:
Food Governance Barometer
Author(s): Marielle Dubbeling, RUAF Foundation
Project: RUAF CityFoodTools project
Introduction to the joint programme
This tool is part of the City Region Food Systems (CRFS) toolkit to assess and plan sustainable
city region food systems. The toolkit has been developed by FAO, RUAF Foundation and Wilfrid
Laurier University with the financial support of the German Federal Ministry of Food and
Agriculture and the Daniel and Nina Carasso Foundation.
Link to programme website and toolbox
http://www.fao.org/in-action/food-for-cities-programme/overview/what-we-do/en/
http://www.fao.org/in-action/food-for-cities-programme/toolkit/introduction/en/
http://www.ruaf.org/projects/developing-tools-mapping-and-assessing-sustainable-city-
region-food-systems-cityfoodtools
Tool summary:
Tool description:
The Milan Urban Food Policy Pact (MUFPP) lists six potential actions of importance under the
work-stream Food Governance. This barometer can be used to self-assess performance on
these different aspects. Cities can score their performance for each of the six actions using a
“traffic light” colouring scheme (from green to red). Results can be compared for different years.
Brief description This tool was developed to support a self-assessment of strong and weak points in local food governance. The barometer builds on the actions defined in the Milan Urban Food Policy Pact framework under the work-stream ‘Food Governance’. The barometer can be developed by local policy makers and other stakeholders and helps define areas for improvement.
Expected outcome Identification of areas of improvement in the field of food governance
Expected Output Self-assessment of performance in the area of food governance
Scale of application City region
Expertise required for application
Understanding of the local context and policy processes
Examples of application
Utrecht (The Netherlands)
Year of development 2017

City Region Food System Toolkit Assessing and planning sustainable city region food systems
146
Scoring:
1. Facilitate collaboration across city agencies and departments and seek alignment of
policies and programmes that impact the food system across multiple sectors and
administrative levels, adopting and mainstreaming a rights-based approach; options
can include dedication of permanent city staff, review of tasks and procedures and
reallocation of resources.
The city government has an interdepartmental body or mechanisms mechanism that
is responsible for advisory and decision-making regarding the formulation and/or
implementation of food policies and programmes. The food body/mechanism is
functioning well and meeting regularly. Information is publicly available about its
composition, representativeness, functioning and level of participation.
The city government does not have an interdepartmental body or mechanism that is
responsible for advisory and decision-making regarding the formulation and/or
implementation of food policies and programmes.
The city government has a well-functioning interdepartmental body or mechanisms
mechanism that is responsible for advisory and decision-making regarding the
formulation and/or implementation of food policies and programmes. It includes or
coordinates activities with other levels of government (neighbouring cities, province,
national ministries).
The city government does not have an interdepartmental body or mechanism (yet),
but is fostering collaboration across city agencies and departments on food and
related issues in other ways (e.g. sharing of information in council meetings; bilateral
programmatic collaboration on food between 2 departments).
The city government has an interdepartmental body or mechanisms mechanism that is
responsible for advisory and decision-making regarding the formulation and/or
implementation of food policies and programmes. The food body/mechanism is
however is not functioning and meeting regularly. Information is not publicly available
about its composition, representativeness, functioning and level of participation.

City Region Food System Toolkit Assessing and planning sustainable city region food systems
147
2. Enhance stakeholder participation at the city level through political dialogue, and if
appropriate, appointment of a food policy advisor and/or development of a multi-
stakeholder platform or food council, as well as through education and awareness
raising.
The city government does not (yet) have a (informal or formal) multi-stakeholder
platform responsible for advisory and decision-making regarding the formulation
and/or implementation of food policies and programs (e.g. food councils, food boards,
food working groups etc.). However it has a strategy to align interest of different
stakeholders and foster broader stakeholder engagement on food issues at city level in
others ways (for example public consultations; regular information and awareness
activities).
The city government does not have any (formal or informal) strategy for multi-
stakeholder engagement in advisory and decision-making regarding the formulation
and/or implementation of food policies and programmes.
The city government has a formally recognised multi-stakeholder platform
responsible for advisory and decision-making regarding the formulation and/or
implementation of food policies and programs (e.g. food councils, food boards, food
working groups etc.) The multi-stakeholder platform functions well and meets
regularly. It receives government funding for its functioning. Information about its
composition, representativeness, functioning and level of participation is publicly
available.
The city collaborates with in food related projects and programmes with one or more
other stakeholders (e.g. private sector, NGOs, research). However this stakeholder
participation is determined by the type of project, donor request or other and does not
form part of a stakeholder engagement strategy.
The city government has an informal multi-stakeholder platform responsible for
advisory and decision-making regarding the formulation and/or implementation of
food policies and programs (e.g. food councils, food boards, food working groups etc.)
The multi-stakeholder platform is however not institutionalised nor more
permanently financially supported.

City Region Food System Toolkit Assessing and planning sustainable city region food systems
148
3. Identify, map and evaluate local initiatives and civil society food movements in order
to transform best practices into relevant programmes and policies, with the support
of local research or academic institutions.
Non-governmental stakeholders map and evaluate local food initiatives, without any
government involvement or support. Their (policy) recommendations are shared with
the city government or multi-stakeholder food platform.
The city government- or any other stakeholder- have no information on local food
initiatives and their results, nor build on such possible initiatives to design or enhance
efficiency of its own projects and programmes.
The city government –with support of local NGOs or research organisations- regularly
maps and evaluates local food initiatives implemented by various government and
non-governmental stakeholders as a basis for monitoring, revision and planning of city
food policies and programmes.
The city government –with support of local NGOs or research organisations- regularly
maps local food initiatives implemented by various government and non-
governmental stakeholders. Such information is however not (yet) systematically
evaluated so that analysis results can be used to further build on those initiatives
(strengthening or upscaling them; supporting them by relevant policies).
Non-governmental stakeholders map and evaluate local food initiatives, without any
government involvement or support. The city government is not aware of this
information, nor does it use it in any way.

City Region Food System Toolkit Assessing and planning sustainable city region food systems
149
4. Develop or revise urban food policies and plans and ensure allocation of appropriate
resources within city administration regarding food-related policies and
programmes; review, harmonize and strengthen municipal regulations; build up
strategic capacities for a more sustainable, healthy and equitable food system
balancing urban and rural interests.
The city government does not (yet) have a comprehensive strategy/action
plan/policy/programmes/projects related to food, but it promotes regular inclusion of
food activities in other city projects and programmes and budgets.
The city government does not work on food-related activities.
The city government has a comprehensive strategy/action
plan/policy/programmes/projects related to food. It has allocated budget to its
implementation in the city’s annual budget. It has set clear (monitoring) targets and
assigns financial and human resources to conduct regular monitoring and/or
evaluation of its food policies and programmes.
The city government does have a comprehensive strategy/action
plan/policy/programmes/projects related to food. It has however not (yet) set clear
(monitoring) targets nor assigns financial and human resources to conduct regular
monitoring and/or evaluation of its food policies and programmes.
The city has one or more specific and time-bound projects and programmes on urban
food systems (e.g. urban agriculture; farmers markets; nutrition campaigns). It does
not have a comprehensive food strategy, nor promotes inclusion in other projects and
budgets.

City Region Food System Toolkit Assessing and planning sustainable city region food systems
150
5. Develop or improve multisectoral information systems for policy development and
accountability by enhancing the availability, quality, quantity, coverage and
management and exchange of data related to urban food systems, including both
formal data collection and data generated by civil society and other partners.
The city government (incidentally) collects food system data (e.g. on food
consumption, production, employment in the food system, nutrition, food supply
sources etc.) Data are not used to monitor or guide food- related policy and programs.
The city government does not collect nor uses food system data (e.g. on food
consumption, production, employment in the food system, nutrition, food supply
sources etc.) to monitor or guide food- related policy and programs. It also does not
use data that might be available from other sources (NGOs, research etc.).
The city government regularly collects food system data (e.g. on food consumption,
production, employment in the food system, nutrition, food supply sources etc.) and
used these data to monitor or guide food- related policy and programs. Data are
disaggregated for different income groups and spatial levels (urban/rural; different
areas in the city).
The city government regularly collects food system data (e.g. on food consumption,
production, employment in the food system, nutrition, food supply sources etc.) and
used these data to monitor or guide food- related policy and programs. Data are not
disaggregated for different income groups and spatial levels (urban/rural; different
areas in the city).
The city government is aware of food system data collected by non-government
stakeholders. It incidentally requests those data.

City Region Food System Toolkit Assessing and planning sustainable city region food systems
151
6. Develop a disaster risk reduction strategy to enhance the resilience of urban food
systems, including those cities most affected by climate change, protracted crises and
chronic food
Urban food and agriculture projects implemented by non-governmental stakeholders
include climate and disaster resilience strategies. Monitoring of these
projects/strategies are shared with governments who demand and use this
information.
The city government –nor any other stakeholders- have not (yet) looked into the
climate and disaster vulnerability of its urban food and agriculture system, nor have
they developed any strategy/programme to increase its resilience.
The city government has implemented a comprehensive vulnerability assessment of
its urban food system and has included food and agriculture in the city region in its
climate change and/or disaster resilience plan or strategy.
The city government has implemented a comprehensive vulnerability assessment of
its urban food and agriculture system. It has not (yet) integrated food and city-
regional agriculture in its climate change and/or disaster risk reduction
plans/strategies. It has put in place specific strategies to reduce the vulnerability of
the food system (for example counting with an emergency plan; considering flood
risks when zoning food industries, promoting climate smart agriculture etc.).
Urban food and agriculture projects implemented by non-governmental stakeholders
include climate and disaster resilience strategies. Monitoring is either not done or
information is not shared with city governments for possible uptake and use.

City Region Food System Toolkit Assessing and planning sustainable city region food systems
152
Overall self-assessment. City x. Year 1.

City Region Food System Toolkit Assessing and planning sustainable city region food systems
153
Tool/Example:
Reporting outline CRFS Scan
Author(s): Marielle Dubbeling, RUAF Foundation
Project: RUAF CityFoodTools project
Introduction to the joint programme
This tool is part of the City Region Food Systems (CRFS) toolkit to assess and plan sustainable
city region food systems. The toolkit has been developed by FAO, RUAF Foundation and Wilfrid
Laurier University with the financial support of the German Federal Ministry of Food and
Agriculture and the Daniel and Nina Carasso Foundation.
Link to programme website and toolbox
http://www.fao.org/in-action/food-for-cities-programme/overview/what-we-do/en/
http://www.fao.org/in-action/food-for-cities-programme/toolkit/introduction/en/
http://www.ruaf.org/projects/developing-tools-mapping-and-assessing-sustainable-city-
region-food-systems-cityfoodtools
Tool summary:
Tool description:
This tool provides a detailed content outline for a report on the CRFS Scan. It proposes chapter
headings and length.
Brief description This tool provides a detailed content outline for a report on the CRFS Scan
Expected outcome Completed CRFS Scan and inputs for the CRFS Assessment
Expected Output Report on the CRFS Scan
Scale of application Project
Expertise required for application
Reporting and analysis skills
Examples of application
All project cities
Year of development 2017
References -

City Region Food System Toolkit Assessing and planning sustainable city region food systems
154
Suggested content outline CRFS Scan reports
1. Executive summary (2 pages)
2. About the project (2 pages)
3. Project methodology (3 pages)
4. Describing the city region (with visual data/maps) (2 pages)
5. Providing a brief context of the city region (social, environmental,
political/institutional) (8 pages)
6. Describing the CRFS by answering the following questions (illustrated as much as
possible with graphs, images , maps. This includes data from the situational and in-
depth assessment): 30-40 pages
A. Who feeds the city region; where does the food come from; what and how much
food is produced locally in the city region? Where are inputs and resources sourced
from? How does city’ regions food supply system fit into the wider national and global
food supply system?
B. Food processing and manufacturing: which companies prepare/manufacture the
food consumed in the city region?
C. Food wholesale and distribution: who supplies the food to businesses/markets that
sell food to the consumers?
D. Food marketing, catering and retail: where do citizens buy their food? Please
different for citizens of different wealth call-socio economic conditions.
E. Food consumption: what do people in the city region eat? What is the composition
of their actual diet and food basket? What are related food security/nutrition/food
related health concerns? Can they access local food and where?
F. Food and organic waste: where and how much food and organic waste is generated
along the food chain and how is it managed?
G. What policies and plans influence the CRFS? Think of policies directly related to
food production, processing etc., but also of other sectoral policies (health, economic
development, land use planning) that have a bearing on the CRFS.
H. Who governs the food system? What role and power do decision-makers and key
stakeholders have in shaping a more sustainable/resilient food system that serves the
city and the city region?
In responding to these questions emphasis will be given to different sustainability
dimensions (social, economic, environmental, governance, resilience) where relevant

City Region Food System Toolkit Assessing and planning sustainable city region food systems
155
(for example by looking at specific population groups from different wealth classes
when discussing consumption; or looking at environmental sustainability when
discussing production). These aspects will be highlighted again in the following
chapters.
Please also use as much as possible data/indicators to describe the above aspects in
an integrated way. And make use of graphs and maps were possible.
7. What are the strengths and vulnerabilities of the current city region food system?
This can be analysed for different sustainability dimensions and parts of the food
chain. (possibly zoom in on different parts of the food system or different stakeholders
groups; illustrate with case studies where available) 5-8 pages
8. To what extent is the current food system (and different parts of the food system)
resilient to shocks and projected circumstances in the longer-term? 5 pages
9. Which areas of the city region, what parts of the food chain and which groups of
residents/involved stakeholders would be most adversely affected by vulnerabilities
in the food system? 5 pages
10. What are the key priority areas that need to be addressed to develop a more
sustainable and resilient food system for the future? Note: consider the different
sustainability and food systems areas and dimensions. 5 pages
11. What are the 5-10 main key issues that require further research and in-depth
assessment?
12. Conclusions 3 pages
13. Lessons learned and recommendations (also on methodology, stakeholder dialogue,
data gaps) 3 pages
14. References

City Region Food System Toolkit Assessing and planning sustainable city region food systems
156
Tool/Example:
Selection of key areas for CRFS research
Author(s): Marielle Dubbeling and Joy Carey, RUAF Foundation
Note: The document benefitted from expert inputs and FAO consultation3.
Project: RUAF CityFoodTools project/ FAO Food for the Cities Programme
Introduction to the joint programme
This tool is part of the City Region Food Systems (CRFS) toolkit to assess and plan sustainable
city region food systems. The toolkit has been developed by FAO, RUAF Foundation and Wilfrid
Laurier University with the financial support of the German Federal Ministry of Food and
Agriculture and the Daniel and Nina Carasso Foundation.
Link to programme website and toolbox
http://www.fao.org/in-action/food-for-cities-programme/overview/what-we-do/en/
http://www.fao.org/in-action/food-for-cities-programme/toolkit/introduction/en/
http://www.ruaf.org/projects/developing-tools-mapping-and-assessing-sustainable-city-
region-food-systems-cityfoodtools
Tool summary:
Tool description:
3 The following people participated in the FAO experts consultation: Guido Santini, Makiko Taguchi, Michela
Carucci, Louison Lancon, Jia Ni, Yota Nicolarea, Carlo Cafiero, Erdgin Mane, Anne Kepple, Jorge Fonseca, Warren
Lee, Camelia Bucatariu, Cecilia Marocchino, Vito Cistulli, Stefania Amato, Emily Mattheisen, Florence Egal,
Sudarshana Fernando and Alison Blay Palmer.
Brief description This tool provides a selection of 44 of the most common areas for research identified by the CRFS project cities.
Expected outcome Research areas identified
Expected Output Collection of information and data for the CRFS Scan
Scale of application City region
Expertise required Data enumeration, interview skills
Examples of application
Kitwe and Lusaka (Zambia), Utrecht (The Netherlands), Toronto (Canada), Colombo (Sri Lanka), Quito (Ecuador) and Medellin (Colombia)
Year of development 2016

City Region Food System Toolkit Assessing and planning sustainable city region food systems
157
This table has been developed following the CRFS Data Framework provided earlier in the
toolkit. Based on CRFS project city’s feedback and review of the data framework done during
an Expert Meeting organised in Rome (April 2016) it sets out 44 areas of investigation that aim
to cover 20 key sustainable city region characteristics and desired changes or “direction o of
travel” in working towards more sustainable and resilient city region food systems,. These
areas for research and their analysis can thus be used to:
(1) assess the current status of a city region food system (CRFS Scan)
(2) collect more in-depth information on specific key issues or gaps (CRFS assessment).
Each city will need to compare the list to their own existing list of key issues (results of CRFS
Scan). In doing so, each city will want to focus on specific areas and not try to cover everything.
For example city A might want to focus specifically on processing and retail if they are
important bottlenecks in that city region or offer important opportunities to implement
change. City B may want to focus on quality and flows of specific natural resources that may
be under threat or provide most opportunities for improvements and efficiencies. City C may
want to focus on food safety and food waste aspects. Or the cities may wish to focus on
specific types of food products, consumer groups or on specific geographical areas in their city
e.g. low-income groups or most disadvantaged areas.
Of course it should be noted that the extent to which local organisations/researchers in cities
can collect/analyse corresponding data is largely dependent on data availability (secondary
and primary data) and on the complexity of data collection. Challenges will include: agreeing
on what to measure; finding inexpensive ways to collect data and gain insights into what it
means; engaging decision/policy makers or budget holders in prioritising this work; and
aligning this work with available resources: money, time, expertise, commitment.
Given the time and resource limitations of our specific project, we do not aim for collection
of robust scientific data for different areas of research unless these are more readily available),
but rather advocate a rapid appraisal approach based on multi-stakeholder consultations and
interviews and case studies.

City Region Food System Toolkit Assessing and planning sustainable city region food systems
158
Common set of desired changes and areas of research for sustainable city region food systems
Dimensions of sustainability
Social sustainability and equity
Economic sustainability
Urban-rural integration
Environmental sustainability
Food governance Vulnerability and resilience
Overarching objectives
Improve health and well-being and increase access and right to food and nutrition.
Increase local economic growth and generate decent jobs and income.
Support a localized food production and supply system
Improve protection and management of ecosystems and environmental resources
Improve horizontal and vertical governance and planning
Reduce vulnerability and increase resilience
Possible language to help communicate to policy makers/ a wider community
Nourish communities Create good food jobs
Grow an edible city Design a low-carbon & nature-friendly city region
Build inclusive decision-making
Build a resilient city region
Outcomes: Key desired direction of travel changes
All rural and urban residents have access to sufficient, nutritious, safe, healthy, appropriate and affordable food.
A vibrant and sustainable regional food economy that retains the ‘local food dollar’.
Local food production capacity is optimised
Agro-ecological diversity is protected and promoted.
Food system policies and strategies exist and are integrated into other policies, planning processes and programme design
There is increased capacity to deal with shocks that impact on the food system (economic, climate change, disaster)
Areas of research Trends in food consumption and expenditure for different types of consumers in the city region (including vulnerable groups)
Economic value of local food sold in the city region (can be measured for different market types eg farmers markets, public sector food procurement etc)
Product volumes and diversity imported (from outside the city region) compared with product volumes from the city region
Agricultural practices: Area in the city region under i) organic or agro-ecological agriculture; ii) under or conventional production; iii) under specific production practices
City regional food system planning is happening and supported
Extent to which risk reduction and climate adaptation/mitigation measures for food production, transport and distribution are put in place/existence of a disaster risk reduction management plan in

City Region Food System Toolkit Assessing and planning sustainable city region food systems
159
the city region
Incidence of food-related diseases
Number of businesses and jobs in the city region food system
Total surface areas (current and potentially available currently unfarmed) of urban and peri-urban and rural agriculture land within the city region
Presence of regulations and systems for transparency and traceability (information the consumer has about the way food is grown, processed and sold; labelling schemes)
Regional and local development framework documents and plans reflect sustainable food system concerns and values
Extent to which food concerns are integrated into disaster risk reduction, climate change and emergency plans
Extent to which processing retail and catering (including public food procurement) provide safe and nutritious food
Diversity in food provisioning (consumption) sources for the city region i.e. how many sources of food production the city region has (city region, national, international etc)
Presence and enforcement of food safety regulations
Analysis guidance Analysis: Extent to which food is accessible, affordable, safe; extent to which diets are sufficiently nutritious; extent to which diets are environmentally sustainable (eg animal proteins, seasonality,
Analysis: Extent to which there are opportunities to create jobs in the food system & retain more of the ‘local food dollar’
Analysis: Extent to which sustainable city region production capacity is fulfilled & can be increased
Analysis: Extent to which policy and consumer demand could increase organic and agro-ecological production practices
Analysis: Opportunities to integrate food into more policies, strategies and plans
Analysis: Assessment of the current vulnerabilities and areas for improvements

City Region Food System Toolkit Assessing and planning sustainable city region food systems
160
highly processed etc); levels of access by vulnerable groups
Key desired direction of travel changes
The city region food system supports a visible local food culture and sense of identity.
Fair and decent (formal and informal) jobs and income opportunities for small-scale producers, workers and businesses are supported throughout the food system
Flows of food, nutrients, energy and other resources connect across urban and rural areas
Urban and natural ecosystems are well managed.
Participatory governance structures are cross-jurisdictional, cross-sectorial and multi-stakeholder
The agricultural resource base is protected and lessens dependence on distant food supply sources.
Areas of research Number of food businesses throughout the food system actively sourcing food produced/processed in the city region
Sanitation, health and safety conditions and risks with regards to all workers in the city region food system
Volumes of x disposed or recycled in the city region food system (x = food, water, organic waste, energy: select as appropriate)
Status (quality & contamination) of natural resources (water, land, forest, biodiversity)
Presence and type of multi-stakeholder food policy and planning structures (e.g food policy councils; food partnerships; food boards; food coalitions)
Policies, regulations and support for and preservation of agricultural land; use of open space/ zoning etc. relevant for the city region
Presence of policy and instruments to promote local food
Levels of employment, income, wages in city region food businesses (including production)
Presence and extent of implementation of natural resource policy and protection regulations
Form and frequency of cross-jurisdictional and cross-sectoral collaboration (between various tiers and departments of local governments, towns and cities) in food plans, policies, programmes and
Codes/regulations that allow/promote urban and peri-urban/city region food production
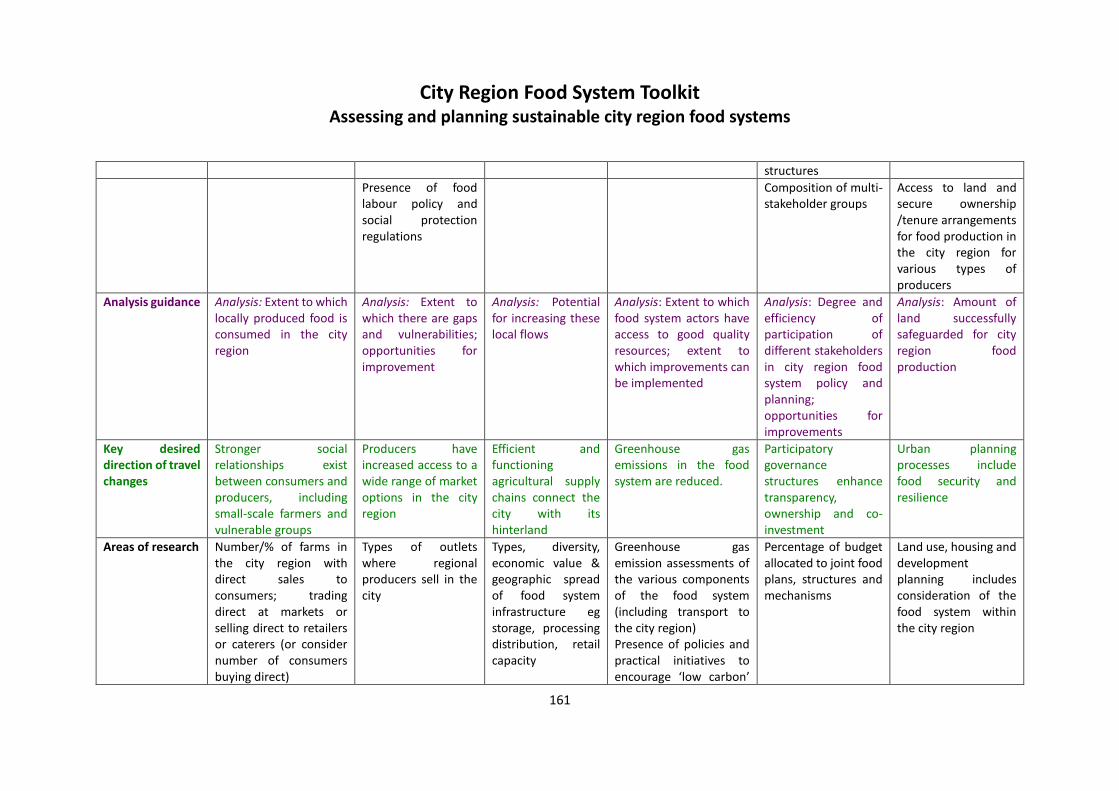
City Region Food System Toolkit Assessing and planning sustainable city region food systems
161
structures
Presence of food labour policy and social protection regulations
Composition of multi-stakeholder groups
Access to land and secure ownership /tenure arrangements for food production in the city region for various types of producers
Analysis guidance Analysis: Extent to which locally produced food is consumed in the city region
Analysis: Extent to which there are gaps and vulnerabilities; opportunities for improvement
Analysis: Potential for increasing these local flows
Analysis: Extent to which food system actors have access to good quality resources; extent to which improvements can be implemented
Analysis: Degree and efficiency of participation of different stakeholders in city region food system policy and planning; opportunities for improvements
Analysis: Amount of land successfully safeguarded for city region food production
Key desired direction of travel changes
Stronger social relationships exist between consumers and producers, including small-scale farmers and vulnerable groups
Producers have increased access to a wide range of market options in the city region
Efficient and functioning agricultural supply chains connect the city with its hinterland
Greenhouse gas emissions in the food system are reduced.
Participatory governance structures enhance transparency, ownership and co-investment
Urban planning processes include food security and resilience
Areas of research Number/% of farms in the city region with direct sales to consumers; trading direct at markets or selling direct to retailers or caterers (or consider number of consumers buying direct)
Types of outlets where regional producers sell in the city
Types, diversity, economic value & geographic spread of food system infrastructure eg storage, processing distribution, retail capacity
Greenhouse gas emission assessments of the various components of the food system (including transport to the city region) Presence of policies and practical initiatives to encourage ‘low carbon’
Percentage of budget allocated to joint food plans, structures and mechanisms
Land use, housing and development planning includes consideration of the food system within the city region

City Region Food System Toolkit Assessing and planning sustainable city region food systems
162
food systems
Types and economic value of different city region marketing channels
Presence of local and regional food hubs and shorter value chains
Extent to which food governance is embedded in wider local governance
Vulnerability assessment of all city region food system infrastructure to climate and disaster risks (including households)
Presence of wider communication and public awareness campaigns
Percentage of self- reliance for the city region in consumption of food (by weight for specific product/prioritised food basket/total nutritional requirements or total consumption)
Analysis guidance Analysis: Extent to which locally produced food is consumed in the city region
Analysis: Potential for increased local sales
Analysis: Identify gaps, vulnerability (eg to market shifts, climate change, disaster risks etc) and potential for improvements and investment
Analysis: Opportunities for improvements
Analysis: Information flows, participation gaps, capacity gaps, potential for improvements
Analysis: Assessment of the current vulnerabilities and areas for improvements
Key desired direction of travel changes
Consumers are well equipped with knowledge and skills on healthy food and diets
Food loss and waste is reduced (and re-used) throughout the food system.
Areas of research Presence of and access Total volume and

City Region Food System Toolkit Assessing and planning sustainable city region food systems
163
to food education services (cooking classes, nutrition education)
percentage of food lost & wasted along the food chain in the city region
Availability and accessibility of Urban agriculture/community gardens to all residents within the city region; especially of low-income
Analysis guidance Analysis: Extent of participation, gaps and opportunities of improvement
Analysis: Extent to which the city region is implementing the food waste priority ladder and where improvements can be made; assessment of the economic or nutritional value of the food wasted.

City Region Food System Toolkit Assessing and planning sustainable city region food systems
164
Tool/Example:
Critical Review of Actual Policies, Norms and Regulations bearing on City Region Food Systems
Author(s): Marielle Dubbeling, RUAF Foundation Project: RUAF CityFoodTools project Introduction to the joint programme This tool is part of the City Region Food Systems (CRFS) toolkit to assess and plan sustainable city region food systems. The toolkit has been developed by FAO, RUAF Foundation and Wilfrid Laurier University with the financial support of the German Federal Ministry of Food and Agriculture and the Daniel and Nina Carasso Foundation. Link to programme website and toolbox http://www.fao.org/in-action/food-for-cities-programme/overview/what-we-do/en/ http://www.fao.org/in-action/food-for-cities-programme/toolkit/introduction/en/ http://www.ruaf.org/projects/developing-tools-mapping-and-assessing-sustainable-city-region-food-systems-cityfoodtools
Tool summary:
Tool description: As part of the CRFS Scan and in order to answer the questions ‘What policies influence the CRFS? And, what role and power do the city’s decision-makers and key stakeholders have in shaping a more sustainable/resilient food system that serves the city and the city region?‘, a review of existing institutional, policy, legal and planning frameworks needs to be conducted.
Brief description A critical policy review will help to understand how actual policies and programmes influence the performance of the CRFS , how the CRFS can contribute to other (sectoral) policies and programmes, and what policy gaps need to be addressed to improve the sustainability and resilience of the CRFS.
Expected outcome Good understanding of the current legal and planning framework in which CRFS activities take place, of policy gaps and policy opportunities
Expected Output A critical policy review
Scale of application City, regional and national policies bearing on the CRFS
Expertise required for application
Policy analysis
Examples of application
Quito (Ecuador), Colombo (Sri Lanka)
Year of development 2015
References -

City Region Food System Toolkit Assessing and planning sustainable city region food systems
165
This includes an investigation on policies, instruments and programmes at city, regional and national level in areas of public health, social justice, food security, environment, agriculture, economic, socio-cultural, land use and city development plans, etc. Specific areas of investigation include analysis of policies and programmes directly dealing with different aspects of the CRFS: food production; processing and manufacturing; wholesale and distribution; marketing, catering and retail; food consumption; food and organic waste management.
1. What do we mean by “critical policy analysis” and why we do it?
As part of a City Region Food System (CRFS) Assessment we will implement a critical analysis of existing policies, norms and regulations bearing on different aspects of the CRFS. Such critical analysis of the policy context is needed, in order to develop a good understanding of the current legal and planning framework in which CRFS activities take place. The analysis includes policy documents, bylaws, ordinances, regulations, etcetera, that deal directly with CRFS activities (such as food production, processing or retail) as well as other policies and regulations that have a strong influence on the CRFS (e.g. land use plans and zoning, health regulations, marketing regulations, food policies etcetera).
Such a review of existing policies and regulations is helpful in order to:
o Identify what are local and other relevant governments (national, provincial) current main policy goals and priorities. How could the CRFS contribute to them?
o Identify what are the actual policies, norms and regulations and urban development and zoning plans that effect (the CRFS. How successful and effective are these policies and instruments to date (do they have the intended effects?; if not why not?)
o Specifically: understand what are land use planning and preservation/ zoning regulations at municipal and national level? How is land ownership organised? Rules and regulations for sale of land? Use of government owned land?
o Analyse if there are there any inconsistencies between the various sectors regarding their views on and support to the CRFS (e.g. public health or environmental management policies) or between policies at different levels (e.g. local versus national)? How can potential inconsistencies be harmonized, what are opportunities to integrate the CRFS better into these sector policies?
o Identify which existing policy measures did or did not work well (effectiveness, enforcement costs etcetera) or are outdated or unnecessary restrictive (municipal by-laws, ordinances, zoning regulations etc.).
o What are the needs and possibilities to improve the effectiveness of existing policies or to promote the development of new policies and plans on CRFS; and what is their relevance for certain categories of the population (e.g. women, small-scale producers)?
o What opportunities exist to integrate CRFS better into the various sector policies and/or to harmonize better their support for CRFS?

City Region Food System Toolkit Assessing and planning sustainable city region food systems
166
o Identify what are current decision-making structures of relevance for the CRFS?
2. How to implement the critical analysis?
2.1. Preparations
Meetings are organised with all persons that will be involved in this activity in order:
o to familiarize them with critical policy analysis (why, what, when, how), o to define the methodology to be applied and instruments to be used, o to define what product(s) have to be developed as a result of the policy analysis, o work planning: who will do what when how/means, o how to coordinate /monitor these activities.
The meeting(s) should result in a methodological document that should describe: main concepts, methodology, instruments used, operational plan/time schedule/commitments, products to be produced.
2.2. Inventory of relevant policy documents, strategic plans and regulations
By reviewing available information from reliable sources (literature, past and on-going projects, CRFS stakeholders), “brainstorming” in the team and interviews with key informants from local and national government (Agriculture, Health, Environment, Economic Development, Social Development, Town and Land use Planning, ..) and other relevant stakeholders (NGOs, research, private sector) a list of all relevant policy documents is developed.
We might subdivide the list in:
a. Municipal or National Strategies, Plans, Bye-laws, Ordinances etcetera that deal primarily with CRFS activities (food production, processing, storage, retail, consumption and waste management)
b. But also other sectoral bye-laws and ordinances (Public Health, Environmental Management, Housing, etcetera), the City Land Use Zoning Plan, the Strategic City Development Plan, and National legislation (Local Government Act, Public Health Act, Urban Planning or Land Act, Water Act, Housing Act, Agriculture Act, etcetera) that contain norms and regulations that are of direct relevance for the CRFS.
Please note that policies are not just “laws” but also Development Plans and Strategies, tax and economic incentive regulations, spatial plans, etcetera.
The list of policy documents should include at least the following information:
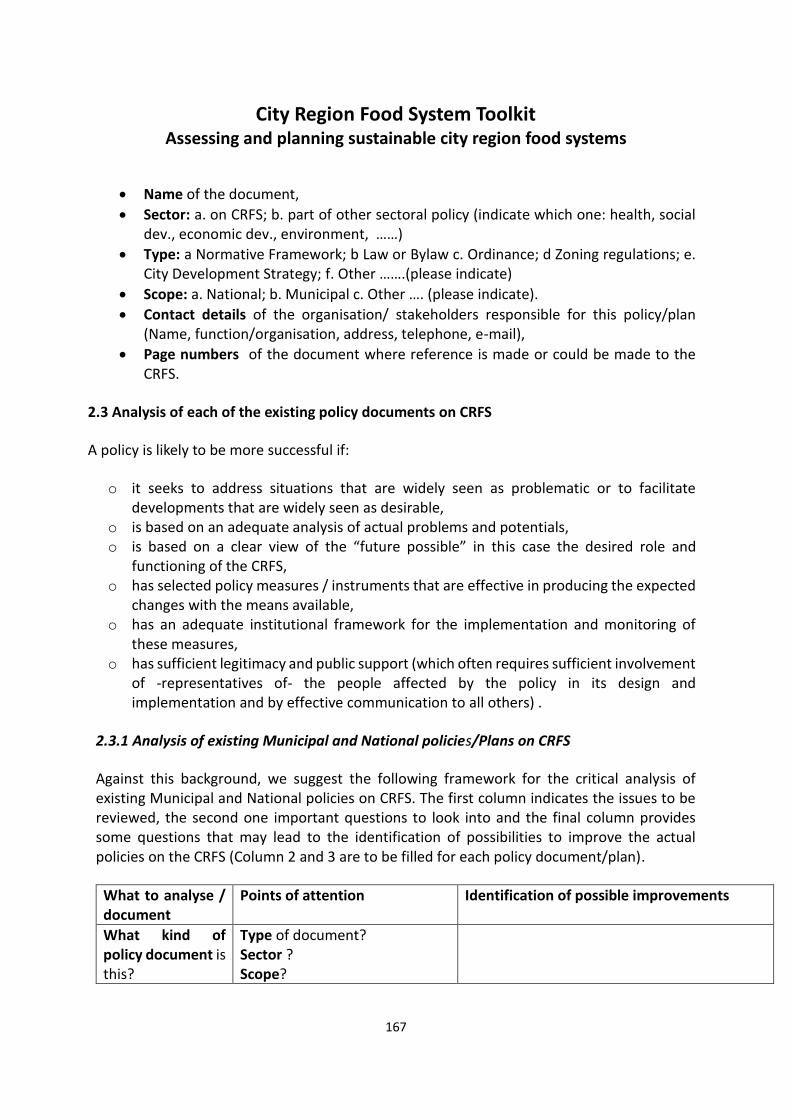
City Region Food System Toolkit Assessing and planning sustainable city region food systems
167
Name of the document,
Sector: a. on CRFS; b. part of other sectoral policy (indicate which one: health, social dev., economic dev., environment, ……)
Type: a Normative Framework; b Law or Bylaw c. Ordinance; d Zoning regulations; e. City Development Strategy; f. Other …….(please indicate)
Scope: a. National; b. Municipal c. Other …. (please indicate).
Contact details of the organisation/ stakeholders responsible for this policy/plan (Name, function/organisation, address, telephone, e-mail),
Page numbers of the document where reference is made or could be made to the CRFS.
2.3 Analysis of each of the existing policy documents on CRFS
A policy is likely to be more successful if:
o it seeks to address situations that are widely seen as problematic or to facilitate developments that are widely seen as desirable,
o is based on an adequate analysis of actual problems and potentials, o is based on a clear view of the “future possible” in this case the desired role and
functioning of the CRFS, o has selected policy measures / instruments that are effective in producing the expected
changes with the means available, o has an adequate institutional framework for the implementation and monitoring of
these measures, o has sufficient legitimacy and public support (which often requires sufficient involvement
of -representatives of- the people affected by the policy in its design and implementation and by effective communication to all others) .
2.3.1 Analysis of existing Municipal and National policies/Plans on CRFS
Against this background, we suggest the following framework for the critical analysis of existing Municipal and National policies on CRFS. The first column indicates the issues to be reviewed, the second one important questions to look into and the final column provides some questions that may lead to the identification of possibilities to improve the actual policies on the CRFS (Column 2 and 3 are to be filled for each policy document/plan).
What to analyse / document
Points of attention Identification of possible improvements
What kind of policy document is this?
Type of document? Sector ? Scope?

City Region Food System Toolkit Assessing and planning sustainable city region food systems
168
(see the classification given below the table)
Policy justification (background)
- How was the policy formulated; who were involved? - Is the situation analysed in an integrated way or from one specific view point (e.g. health, or environment, or social) - Are both problems and potentials negative and positive impacts been reviewed?
- Could the relevancy of this policy for specific categories of the population -and/or its legitimacy and popular support- be improved by taking other interests and viewpoints into account (farmers, poor, women, other sectors, private enterprise, etcetera)? - Could the policy design be improved by improving the actual biased situation analysis through adding other viewpoints and impact areas?
Vision / Objectives / expected results of the policy
- Do the objectives indicate a clear vision regarding the desired development of the CRFS (the functions one expects the CRFS to play in the realisation of municipal or national strategic development plans/sector policies and the kind of developments in the CRFS that will be supported or conditioned/restricted. -What type of CRFS is promoted? - Are the objectives well defining the expected results in given time periods - Are the target groups for this policy well defined?
- Could the policy be improved by clarifying the city’s vision on the future development of the CRFS and the desired role/functions it should fulfil? - Could the policy be improved by a better formulation of the objectives or by a better definition of the target groups (inclusion of others, more specific ?
Selected policy measures and instruments to realise these objectives
-What policy measures/instruments are applied? - Is an effective mix of policy measures / instruments applied (economic incentives, educational measures, legal measures, planning measures; each instrument is having its specific effects and restrictions) - Do the policy measures taken have a scientific basis?
- Is it realistic to expect that the objectives/expected results will be realized with the actual policy measures? - What alternative policy measures could be applied the effectiveness of the policy be improved by adding other types of policy measures /instruments (or replacing existing ones by others)? - What adaptations of existing and inclusion of additional measures could be made to enhance gender sensitivity of the policy?

City Region Food System Toolkit Assessing and planning sustainable city region food systems
169
- Are specific interests of vulnerable groups taken into account and measures taken to ensure active participation of these groups?
- Check whether certain measures are not based on false assumptions regarding certain impacts of the CRFS and are not unnecessary restrictive or over optimistic regarding the expected effects of certain policy measures. - Collect research data and information on successful experiences on this issue elsewhere, which may form a good basis for design of more effective policy measures. - What improvements could be made to enhance their relevance/benefits of the policy for vulnerable groups and enhancing gender and social equity?
The institutional framework for the operationalisation, implementation and monitoring of the policy
- Does the policy define which organisation will lead and coordinate the operational planning and implementation of the various policy measures and have coordination and monitoring mechanisms been defined? - Have the roles (contributions and responsibilities) of other actors involved in the implementation been defined? -Do the earmarked organisations have the required capacities to implement the policy?
- What improvements could be made in the institutional framework in order to facilitate its implementation and effectiveness? - What can be done to further enhance the availability and quality of required human resources?
The financial resources made available to implement the policy
- Has been defined which sources of financing will be applied and to what levels/year to implement, coordinate and monitor the various projects and enforce the new laws and ordinances?
- What improvements could be made in the financing of the policy to enhance its effectivity and/or efficiency?
It is recommended to organise a meeting with persons responsible for the implementation of these policies/plans and representatives of the various identified key stakeholders in the CRFS and discuss the following questions:

City Region Food System Toolkit Assessing and planning sustainable city region food systems
170
o What results have been achieved so far? o What policy measures worked well and which ones less so. Why? o What problems have been encountered up to date and with what effects? What has
been tried to tackle these problems and with what results? o Which recent innovative projects and experiences have been undertaken that can be
used as sources to improve existing policy strategies and instruments? o What changes in the policy are proposed by whom and why? What is the likelihood of
success of the proposed changes?
2.3.2 Analysis of consistency between various policies regarding the CRFS
Next to specific Municipal and National policies on the CRFS (contained in a specific policy document, bye-laws, ordinances) other Municipal and national policies may include policy measures and regulations of direct influence on the CRFS.
So we would like to know:
a. What measures and regulations of relevance for the CRFS are contained in other Municipal Policies and national policies and legislation (e.g. on Public Health, Environmental and Wastes Management, Social Development, Economic development, on Physical Town Planning, Land Use Development and Zoning on Gender, etcetera)
b. What restrictions or opportunities for the development of the CRFS do these measures and regulations imply? What can be done to make optimal use of these opportunities? To what extent the restrictions are based on scientific data or are unnecessary restrictive? What can be done to get these adapted?
c. To what extend such other policies are consistent with the existing Municipal and National policies/plans (if any) on the CRFS? What can be done to harmonize the various policies of influence on the CRFS?
Please document the answers to these questions.
2.3.3 Putting and validating analysis and proposals together with other stakeholders
Once all relevant policy documents are collected and the answers to the questions above have been documented, the team can proceed with a comprehensive analysis to identify:
o The extent to which and how CRFS activities are currently mentioned/integrated in the different municipal/national policies/plans?
o The constraints/possibilities these offers for promotion of (a more sustainable and resilient) CRFS? How to overcome constraints? How to make use of the possibilities?

City Region Food System Toolkit Assessing and planning sustainable city region food systems
171
o Other texts/ sections/statements that influence (positively or negatively) the possibility for further developing the CRFS? How to overcome constraints or make use of possibilities?
o Possibilities for integrating CRFS activities in the policy documents/plans.
The following table for analysis and proposals could be used:
Name of policy document
Current mention of CRFS
Constraints/possibilities of existing statements for promotion of the CRFS and proposed solutions/strategies
Other statements/text that positively/negatively influence the CRFS and proposed solutions/strategies
Possibilities for integrating CRFS activities in the policy documents/plans
Indicate text; pages or sections
Indicate text/ pages or sections
Provide specific proposals for new text/statements and where to integrate them
2.4 Defining a lobbying strategy
Results of the analysis will be shared with the relevant stakeholders involved in the CRFS multi-stakeholder Task Force. A lobbying strategy can be developed in the Task Force to promote integration of CRFS activities in the various policy documents/ plans. To do so the following questions will have to answered:
What changes in the policy/plan are proposed?
What is the likelihood of success of the proposed changes?
What process should be followed to implement these changes? Steps to be taken? Stakeholders to be involved? Critical time-lines?
Which lobbying strategies should be put in place, by whom and when?
2.5 Final analysis and reporting

City Region Food System Toolkit Assessing and planning sustainable city region food systems
172
The results on the analysis and definition of a lobbying strategy will be combined and integrated in a report on the policy scan. The report should include the analysis of existing policies and documents as well as the proposed lobbying strategy.

City Region Food System Toolkit Assessing and planning sustainable city region food systems
173
CRFS Assessment

City Region Food System Toolkit Assessing and planning sustainable city region food systems
174
Tool/Example:
Design CRFS assessment and data collection
Author(s): FAO Project: FAO Food for the Cities Introduction to the joint programme This tool is part of the City Region Food Systems (CRFS) toolkit to assess and plan sustainable city region food systems. The toolkit has been developed by FAO, RUAF Foundation and Wilfrid Laurier University with the financial support of the German Federal Ministry of Food and Agriculture and the Daniel and Nina Carasso Foundation. Link to programme website and toolbox http://www.fao.org/in-action/food-for-cities-programme/overview/what-we-do/en/ http://www.fao.org/in-action/food-for-cities-programme/toolkit/introduction/en/ http://www.ruaf.org/projects/developing-tools-mapping-and-assessing-sustainable-city-region-food-systems-cityfoodtools Tool summary:
Tool description: Once the different priority areas are defined, the assessment phase can be designed. This tool gives an idea on the different ways in which the assessment and data collection phase can be shaped. The elements to be defined are: research questions or sub-thematics to focus on, related indicators to characterize, appropriate primary data survey tool or secondary data sources. In case of surveys, the type of tool and respondents need to be identified. Kitwe, Colombo and Lusaka used different approaches to design this phase. Colombo and Kitwe used specific indicators (from the indicator framework, available here) as a basis to identify the type of information to collect, to then select the most appropriate data collection tool, if needed, based on secondary information yet available. Lusaka used indicators to monitor progress and give a clearer idea on the achievement of a specific research question.
Brief description This tool presents how the data collection phase was designed in Lusaka, Kitwe (Zambia) and Colombo (Sri Lanka). It shows in what way the indicator framework was used, and how different data collection tools were selected for area of interest.
Expected outcome Areas of investigation and data collection tools for CRFS assessment phase.
Expected Output Identification of areas of investigation and data collection tools.
Scale of application City region (municipal, district, province)
Expertise required for application
Examples of application
Colombo (Sri Lanka), Kitwe and Lusaka (Zambia)
Year of development 2016
References -

City Region Food System Toolkit Assessing and planning sustainable city region food systems
175
Examples of application Colombo (Sri Lanka)
Identification of relevant indicators In Colombo, five broad priority areas of the study were selected based on the stakeholder consultation session. Namely, food security, nutrition and safety, Food waste and loss, Value Chain management, climate change and natural resource management and cross city comparison. Once the priority areas are selected, multiple expert panel discussions and stakeholder review meetings were conducted to identify the suitable indicators and decide the prioritized food items to be studies for each priority area covering certain number of sub pillars with in the priority area. When selecting the indicators, multiple criteria were taken into consideration, such as applicability of local context, availability of data sources, accessibility for primary and secondary data, and inherent cost, time and other resource constraints.

City Region Food System Toolkit Assessing and planning sustainable city region food systems
176
Mechanism adapted to decide the final list of indicators for the phase II of the Colombo CRFS
Identification of data collection tool For each indicator, rapid literature review was conducted in order to identify if primary data collection was needed. The type of survey tool to use for each indicator was then identified based on the nature of the measure.
Dissemination of findings of the 1st Phase of the Colombo CRFS to stakeholders
Selected Five Priority areas of the 2nd phase including cross-city comparison
Discussion on possible thematic/priority areas for the 2nd phase of the Colombo CRFS
# 3 Panel discussions with research team and experts to finalize the
indicators
Final version of the list of selected indicators for Five Priority areas of the 2nd phase including cross-city comparison

City Region Food System Toolkit Assessing and planning sustainable city region food systems
177
Quantitative
Qualitative
Individual
Group
Get the Next indicator
No
Yes
Selected indicator
Indicators of each priority area
Is there direct
secondary data source?
Secondary sources needed Indicators
Primary Data sources needed indicators
Qualitative or Quantitative
measure?
Survey
Individual/institutional
perspective or collective/groupp perspective
Interviews Focused Group Interview
Secondary data sources

City Region Food System Toolkit Assessing and planning sustainable city region food systems
178
Logical design of the data sources for collecting data
Selected indicators and associated collection tools
Indicators where secondary data available
Food security , Nutrition and Safety Indicator Secondary data source Data available at
I152 Consumer knowledge on health diets MoH, Family health bureau Colombo District Level I140 Affordability of health/ nutritious food choices
HIES Colombo District Level
I46 Extent to available agricultural land in city region used
District DS development officers Colombo District Level
158 Map of the city to show levels of deprivation or income level
DCS, Sevenatha Colombo City Level
I149 food consumption patterns (processed and fast food, fruit and vegetables
HIES, officers at DS Colombo District Level
I147 Total food requirements for the city region MoH, Nutrition division Colombo District Level I62 Food basket price monitoring in the city region Colombo consumer price index,
DCS Colombo District Level
I150 household Dietary Diversity scores MRI- Dr. Renuka Jayathissa Director nutria
Colombo City Level
I72 usage level of clean water in food processing Court cases from CMC Colombo City Level I136 Informal food sector monitoring CMC- Dr Subash Colombo City Level I111 sanitation, health and safety employment conditions risk for workers in food retail and catering
Qualitative data- Dr. Subash
I159 Number of food outbreaks/ food related diseases in city
District data, food outbreaks CMC
Colombo City Level
I178 Food safety & human health MoH, MRI, ITI, city analysis, government analysis, CAA
Colombo City Level
Food losses and Food Waste Indicator Secondary data sources I15 Post-harvest losses during food production MoA, DoA-WP, DoA Colombo District Level I62 Post-harvest losses during food storage and processing
Volume, economic value Colombo District Level
I188 Total volume and percentage of food wasted SWM dep CMC Colombo City Level I190 Total organic waste and wastewater volumes produced
CMC Colombo City Level
I182 cases of Wasted food used for consumption Cases- Kala market Colombo City Level I183 cases of wasted food further processed Cases- Kala market Colombo City Level I185 Job/ revenue creation in food and organic waste management
CMC Colombo City Level
I186 Total food and organic waste management labour income
CMC Colombo City Level
I189 Volumes of wasted food Landfills CMC Colombo City Level I191 Volumes of organic waste recycled CMC Colombo City Level I197 Existence of and support for managing food and organic waste
Janathaksan Colombo City Level
I198 food solid waste management Abans environmental service Colombo City Level Value Chain Management
Indicator Secondary data sources I2 Availability of local products MoA-WP Colombo District Level I12 Number of urban agriculture producers MoA-WP Colombo District Level I83 Number, type and geographic spread of distribution points
Supermarkets, CWEY Colombo City Level

City Region Food System Toolkit Assessing and planning sustainable city region food systems
179
I73 Carbon foot prints city region Carbon consultants, IFC project Colombo District Level I137 Diversity in food retail and catering Restaurant ( CMC) Colombo City Level I9 Average food price different CAA, HARTI Colombo District Level I148 Consumer food prices for different food products
CAA Colombo District Level
Climate Change and Natural Resource Management Indicator Secondary data sources I19 Surface area in city region MoL Colombo City Level I21 Total surface areas of urban, peri urban and rural
MoL, UDA, MoA-WP Colombo District Level
I24 Quantity of agricultural land DoA Colombo City Level I46 Available agricultural and public land used for growing food
UDA Colombo City Level
I38 Land use and development plan WPC- Min.of Agri. & Env. Colombo City Level I25 Soil degradation of lands MoA, CEA Colombo District Level I31 water quality and pollution Marine resources CCD, MEPA Colombo District Level I29 Carbon foot print DoA, HART, CARPE, CCS
Estimation Colombo District Level
I30 Water foot print MoL, Harti, MoA, CARPE Colombo District Level I32 Status of natural biodiversity in the city region MoE, Dept. of forestry, CEA Colombo District Level I53 Vulnerability of food production to climate & disaster risk
DRM- Hazard maps for flooding and droughts
Other Districts Level
I171 Supplying safe food in emergency or natural disaster
DMC unit in GA, Agrarian service dpt.
Other Districts Level
I181 Vulnerability of food consumption to climate & disaster risk
CCS, DMC, MoA-WP Colombo District Level
I209 extent to which risk reduction and climate adaptation
MoA, CCS, CDM Colombo District Level
Indicators where primary data collection needed and related appropriate tool
Food security , Nutrition and Safety Indicator Primary Data collection method
I152 consumer Knowledge on healthy diet Consumer survey (Knowledge) I161 consumer awareness of environmental impact of consumption Consumer survey (Awareness)
School survey/focused group discussion I149 food consumption patterns (processed and fast food, fruit and vegetables
Consumer Survey (consumption)
I150 household Dietary Diversity scores Consumer survey (dietary diversity) I1 product volumes coming to city region Gate survey at Pettah market I72 usage level of clean water in food processing Business Owners’ Survey I111 employee sanitation, health and safety Employee survey or interviews
Food losses and Food Waste Indicator Primary Data collection method I70 food waste production-business level Business owner’s survey I60 food waste production- consumer/household Consumer survey ( food waste) I96 food waste production- whole sale and distribution Business owner’s survey I124 food waste production- retail and catering Business owner’s survey I182 cases of Wasted food used for consumption Case study-Observation and interview I183 cases of wasted food further processed Case study-Observation and interview I187 economic value of food thrown away Business owners’ survey I193 economic value of the energy produced Energy business owners’ interview I199 share of waste food reuse and shared with needy Business owners’ survey I200 extent of use of compost for food production Farmers’ survey I201 increase of employment/income sources in food waste Interviews/FGD 1210 increase of employment/income sources in food waste Interviews/FGD

City Region Food System Toolkit Assessing and planning sustainable city region food systems
180
Value Chain Management Indicator Primary Data collection method 190 no of food sellers selling local foods originated in city region Business Owners’ survey/ interview I119 type of food categories produced in city region Business owners’ survey/interviews 1184 sources of food produced in city region Business owners’ survey/interviews
Climate Change and Natural Resource Management Indicator Primary Data collection method I38 land use and development planning Interviews with experts 129 carbon foot print Interviews with experts 161 consumer awareness about environmental effect Consumer survey (awareness) 1209 extent to which risk reduction and climate adaptation Interviews with experts
Indicators for Policy, Institutional, and Stakeholder Analysis (secondary and primary data needed)
Food Security and Nutrition
i36. Policies, regulations, and support for and preservation of agricultural land; use of open space/ zoning etc. relevant for the city region i37. Codes/regulations that allow/promote Urban and peri-urban/city region food production i133. Policies that require labelling of food origin / food miles etc. in the city region i134. Policies that support healthy food retail e.g. not allowed to locate fast food outlets near schools; support for fruit and veg shops etc. i163. Urban/city region food security policies, projects, programmes and targets i164. Presence of food assistance and subsidy programmes/cash assistance for different vulnerable groups in the city region i165.Preseence of structures responsible for health and nutrition in the city region i170. Presence of regulations and systems for transparency and traceability (information the consumer has about the way food is grown, processed and sold; labelling schemes)
Food Safety i42.Regulations for sustainable use of agri-chemicals and regular farm inspections within the city region i76. Presence of policies or regulations promoting healthier ingredients / reduction of key ingredients like salt in food processing in the city region i77. Compliance with food safety regulations and regular inspections related to food storage and processing in the city region i103. Compliance by city region food wholesale and distribution with food safety regulations and regular inspections i132. Policies around street food catering and markets e.g. licenses, food safety & hygiene, infrastructure support in the city region i166. Health and food security regulations and level of application in the city region/Structures for sanitary inspection and notification of health and food security concerns/non-appliance i168. Policies, codes and regulations that restrict fast food consumption in the city region
Food Waste i194. Policy and programmes on food waste reduction programs, such as improved post-harvest and storage programmes; consumer education and private sector programmes and incentives etc. in the city region i195 Policy on food waste recovery programs, such as community composting, food banks, and food scrap processing facilities in the city region i196. Policies and programmes on waste disposal, recycle, composting programmes/initiatives in city region
Value Chain Management i35. Food import and trade regulations bearing on city region food production i75. Presence of policies that encourage city region food storage/processing, such as flexible food regulation and certification policies, and industrial land use planning. i101. Presence of policies that safeguard city region wholesale and distribution, such as industrial land use planning, protection i102. Food whole sale distribution regulations bearing on the city region i129. Nature of public and institutional food procurement policy bearing on city region food production/processing/retail (preference for city region food?) i170. Presence of regulations and systems for transparency and traceability (information the consumer has about the

City Region Food System Toolkit Assessing and planning sustainable city region food systems
181
way food is grown, processed and sold; labelling schemes) i202. Presence of action plans/ goals or targets for city region food production and consumption i206. Degree of recognition of rural-urban linkages in city region food policies, structures and plans i207. City regional food system planning is happening and supported
Lusaka (Zambia) In Lusaka, Zambia, different research questions were identified for each of the priority areas. Then, for each research question, the local team identified the activities to be undertaken, making here a difference between review secondary data or collect primary data. A set of indicators were then identified for each research question. It is used as a way to evaluate and monitor rather than guide the CRFS assessment phase.

City Region Food System Toolkit Assessing and planning sustainable city region food systems
182
Identified prioroties for the city region
Key research questions Main activities Methods of data collection and
analysis Indicators
1.0 Sustainable production, resilience of production systems
1.1 Who feeds the city region?
(a) Assess food production in the categories of urban and peri-urban areas
Questionnaire, interviews, Focus group discussion and observation, document analysis
1.2 Where does the food come from that is consumed in the city region?
(a) Quantify and locate farmers and farming systems
Questionnaire, interviews, Focus group discussion and observation, document analysis
i11. Number of producers in city region (for different products) and their farm size operations
i45. Diversity in food provisioning (consumption) sources for the city region i.e. how many sources of food production the city region has (city region, national, international etc)
(b) Map main production areas of key commodities
Questionnaire, interviews, Focus group discussion and observation, document analysis
i1. Product volumes and diversity imported (from outside the city region) compared with product volumes from the city region
i19. Surface (or percentage) area in city region per type of crop/product
1.3 How much food is produced locally in the city region?
(a) Map and Quantify Crop and livestock types & yields.
Questionnaire, interviews, Focus group discussion and observation, document analysis
i19. Surface (or percentage) area in city region per type of crop/product
i1. Product volumes and diversity imported (from outside the city region) compared with product volumes from the city region
i21. Total surface areas (current and potentially available currently unfarmed) of urban and peri-urban and rural agriculture land within the city region
i22. Amount of land protected for agriculture/livestock within the city region
i5. Access to land and secure ownership /tenure arrangements for food production in the city region for various types of producers
1.4 Where are inputs and resources needed for city region food production sourced from?
(a) Assess access to inputs (pesticides, fertilizers, seeds, farming implements)
Questionnaire, interviews, Focus group discussion and observation, document analysis
No indicator
1.5 Is there land available for agricultural purposes in the city region?
(a) Review existing legal framework on land accessibility and availability
Document analysis
i21. Total surface areas (current and potentially available currently unfarmed) of urban and peri-urban and rural agriculture land within the city region
i46. Extent to which available agricultural and public/open land in the city region is used for growing food
1.6 What is the potential production capacity of the
Collect existing land use datasets for all the districts
i1. Product volumes and diversity imported (from outside the city region) compared with product volumes from the city region

City Region Food System Toolkit Assessing and planning sustainable city region food systems
183
city region to feed its populations?
defining the CRFS : land use; map, agricultural land use map, mapping of the production areas of the key commodities
Questionnaire, interviews, Focus group discussion and observation, document analysis
i21. Total surface areas (current and potentially available currently unfarmed) of urban and peri-urban and rural agriculture land within the city region
i46. Extent to which available agricultural and public/open land in the city region is used for growing food
1.7 What is the capacity of the CRFS to provide sufficient agricultural diversification?
Assess agricultural practices: Such as Land preparation techniques; Land maintenance between seasons; Crop rotation and mixed cropping; Crop Insurance, Irrigation and water sources
Questionnaire, interviews, Focus group discussion and observation, document analysis
i20. Agricultural practices (Area in the city region under organic/conservation agriculture/conventional production or under specific production practices)
1.8 What are the key practices that contribute to unsustainable production?
(a)Review data and studies on quality of natural resources (forest, soil and water).
Document analysis, interviews with key informants
i20. Agricultural practices (Area in the city region under organic/conservation agriculture/conventional production or under specific production practices)
i25.Soil degradation (loss of chemical and physical soil fertility) of lands with the city region
i31. Water quality and pollution surface/ground water and marine resources (for coastal cities) in the city region
(b) Assess implications of climate shocks affecting farmers
Document analysis, interviews with key informants
i53. Vulnerability of city region food production to climate and disaster risks
1.9 What is the effect of population growth on food production & the environment?
Assess the relationship between population growth, food production and the environment
Document analysis, interviews with key informants
1.10 Is the city region able to feed itself in times of crises
Assess implications of climate shocks on farming
Questionnaires, FGDs, interviews, document analysis
i209. Extent to which risk reduction and climate adaptation/mitigation measures for food production, transport and distribution are put in place/existence of a disaster risk reduction management plan in the city region
i171. Extent to which provision is made for supplying safe food in case of emergency or natural disaster
2.0 Food processing, supply and distribution system
2.1 Is there adequate supply and distribution of infrastructures along the
Map supply and distribution infrastructures along the value chains: roads, storage facilities, processing and
Questionnaires, FGDs, interviews, and observation
i54. Type, number and geographic spread of food storage/processing/manufacturing businesses in the city region
i83. Number, type and geographic spread of food wholesale/distribution points in the city region (for different products)

City Region Food System Toolkit Assessing and planning sustainable city region food systems
184
value chains? (roads, storage facilities etc)
manufacturing plants, wholesale markets, food retail markets (supermarkets, informal markets, etc.)
i109. Type, number and geographic location/spread of different food retail outlets in the city region
i110. Type, number and geographic location/spread of different food catering outlets in the city region
i65. Levels of infrastructure and equipment provision for improved businesses efficiency in city region food storage/processing
i92. Infrastructure needs for improved city region wholesale and distribution businesses efficiency
i121.Infrastructure needs for city region food i) retail and ii) catering businesses (e.g. market stalls, clean water etc.)
2.2 Who are the main stakeholders involved in the processing, supply and distribution system?
Map and quantify stakeholders/actors involved at every stage of each of the main commodities’ value chain
Questionnaire, interviews, FGDs , document analysis, observation, and mapping
No indicators
2.3 How are food losses and waste handled throughout the value chain?
Estimate food losses and waste from major markets, transports and logistics and from households as well as food management).
Questionnaire, interviews, FGDs , document analysis, observation, and mapping
i188. Total volume and percentage of food wasted along the food chain in the city region
i96. Food waste production/losses (volumes/share/economic value) and management in city region wholesale and distribution
i.124 Food waste production (volumes/share/economic value) and management in city region food i) retail and ii) catering
i160. Food waste production (volumes/share/economic value) and management at the level of consumers in the city region
i191.Volumes/percentage of organic waste in the city region i) recycled; ii) dumped in landfill or otherwise disposed; iii) used in city region agriculture (specify for different forms of management)
2.4 Who supplies the food to businesses/markets that sell food to the consumers?
Map and quantify stakeholders/actors involved at every stage of each of the main commodities’ value chain;
Questionnaire, interviews, FGDs , document analysis, observation, and mapping
i54. Type, number and geographic spread of food storage/processing/manufacturing businesses in the city region
i83. Number, type and geographic spread of food wholesale/distribution points in the city region (for different products)
i109. Type, number and geographic location/spread of different food retail outlets in the city region
i110. Type, number and geographic location/spread of different food catering outlets in the city region
i79. Diversity in provisioning sources for food storage/processing industry in the city region
i84 Sources of food products that are sold wholesale or distributed in the city region.
i117. Total number of city region retail and catering outlets buying directly from farms in the city region
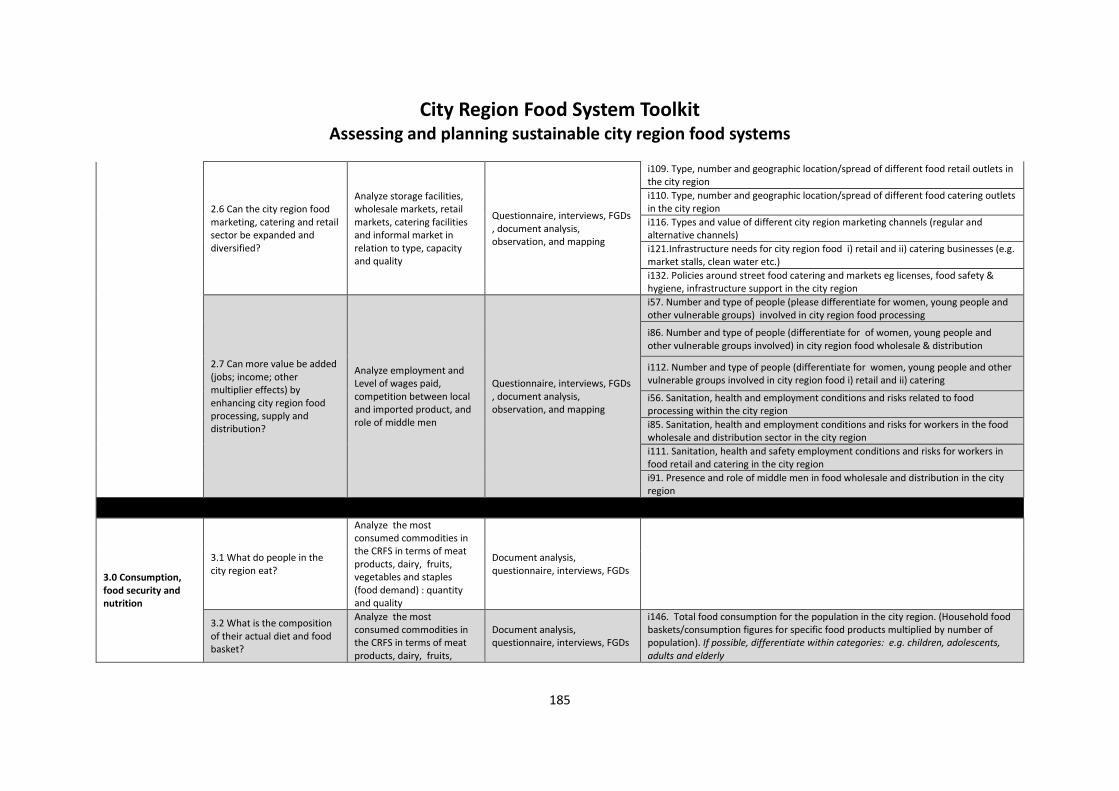
City Region Food System Toolkit Assessing and planning sustainable city region food systems
185
2.6 Can the city region food marketing, catering and retail sector be expanded and diversified?
Analyze storage facilities, wholesale markets, retail markets, catering facilities and informal market in relation to type, capacity and quality
Questionnaire, interviews, FGDs , document analysis, observation, and mapping
i109. Type, number and geographic location/spread of different food retail outlets in the city region
i110. Type, number and geographic location/spread of different food catering outlets in the city region
i116. Types and value of different city region marketing channels (regular and alternative channels)
i121.Infrastructure needs for city region food i) retail and ii) catering businesses (e.g. market stalls, clean water etc.)
i132. Policies around street food catering and markets eg licenses, food safety & hygiene, infrastructure support in the city region
2.7 Can more value be added (jobs; income; other multiplier effects) by enhancing city region food processing, supply and distribution?
Analyze employment and Level of wages paid, competition between local and imported product, and role of middle men
Questionnaire, interviews, FGDs , document analysis, observation, and mapping
i57. Number and type of people (please differentiate for women, young people and other vulnerable groups) involved in city region food processing
i86. Number and type of people (differentiate for of women, young people and other vulnerable groups involved) in city region food wholesale & distribution
i112. Number and type of people (differentiate for women, young people and other vulnerable groups involved in city region food i) retail and ii) catering
i56. Sanitation, health and employment conditions and risks related to food processing within the city region
i85. Sanitation, health and employment conditions and risks for workers in the food wholesale and distribution sector in the city region
i111. Sanitation, health and safety employment conditions and risks for workers in food retail and catering in the city region
i91. Presence and role of middle men in food wholesale and distribution in the city region
3.0 Consumption, food security and nutrition
3.1 What do people in the city region eat?
Analyze the most consumed commodities in the CRFS in terms of meat products, dairy, fruits, vegetables and staples (food demand) : quantity and quality
Document analysis, questionnaire, interviews, FGDs
3.2 What is the composition of their actual diet and food basket?
Analyze the most consumed commodities in the CRFS in terms of meat products, dairy, fruits,
Document analysis, questionnaire, interviews, FGDs
i146. Total food consumption for the population in the city region. (Household food baskets/consumption figures for specific food products multiplied by number of population). If possible, differentiate within categories: e.g. children, adolescents, adults and elderly

City Region Food System Toolkit Assessing and planning sustainable city region food systems
186
vegetables and staples (food demand) : quantity and quality
i149. Trends in/patterns of food consumption and expenditures for different types of consumers in the city region(e.g. consumption of consumer processed and fast food consumption; fruit and vegetable intake)
3.3 What are the different diets existing by social, economic and cultural groups?
Analyze what people consume by social, economic, and cultural groups
Questionnaire, interviews, FGDs
i149. Trends in/patterns of food consumption and expenditures for different types of consumers in the city region(e.g. consumption of consumer processed and fast food consumption; fruit and vegetable intake)
i146. Total food consumption for the population in the city region. (Household food baskets/consumption figures for specific food products multiplied by number of population). If possible, differentiate within categories: e.g. children, adolescents, adults and elderly
3.4 What is the nutritional and food security status of the CRFS’s dwellers?
Review existing information and collect data on malnutrition and food insecurity
Questionnaire, interviews, FGDs
i150. Number and percentage of food insecure HH in the city region/Dietary diversity scores for different types of consumers in the city region (Note dietary diversity scores will give information on specific food intake including fruits and vegetables/proteins/ calories etc)
i151. Nutritional status and rate of diet related diseases (malnutrition/Obesity/ others) for different income groups and age classes in the city region/ for rural-urban areas (Note this can be further specified if data area available in terms of: -Percentage of stunting in children -Percentage of people overweight or malnourished in specific age classes; etc.)
3.5 What are the drivers of food insecurity and malnutrition?
Investigate causes of food insecurity and malnutrition
Questionnaire, interviews, FGDs , and observation
Not possible to assess/monitor with indicators
3.6 What is the spatial correlation between food insecurity and physical/economic access to food?
Analyze Spatial analysis to correlate food insecurity and access to food retail.
Document analysis, mapping
i158. Map of the city to show levels of deprivation or income levels for different types of consumers across different areas in the city region
i150. Number and percentage of food insecure HH in the city region/Dietary diversity scores for different types of consumers in the city region (Note dietary diversity scores will give information on specific food intake including fruits and vegetables/proteins/ calories etc)
i151. Nutritional status and rate of diet related diseases (malnutrition/Obesity/ others) for different income groups and age classes in the city region/ for rural-urban areas (Note this can be further specified if data area available in terms of: -Percentage of stunting in children -Percentage of people overweight or malnourished in specific age classes; etc.)
i162. Food basket price monitoring in the city region
3.7 How can city region food security, availability, safety, appropriateness, utilization
Assess quality and diversity of the food available; Assess knowledge and awareness
Questionnaire, interviews, FGDs , and observation
i177. Food quality: Extent to which low income residents have access to/can afford local, safe, nutritious/healthy food in different areas in the city region (Note: using data from dietary diversity scores and food intake indications can be given on specific food intake and deficiencies)

City Region Food System Toolkit Assessing and planning sustainable city region food systems
187
and transparency be enhanced?
on sustainable and healthy diets.
i153. Food choice: percentage of city region population (per wealth class; children) eating more than 5 fruits and vegetables a day/ Average intake of fruits and vegetables for different types of consumers
i167. Existence and support for public health and nutrition education efforts in the city region
i152. Consumer knowledge on healthy diets (for different consumer groups in the city region)
i161. Consumer awareness of environmental impacts of their consumption; city regional food; healthy food; safe food

City Region Food System Toolkit Assessing and planning sustainable city region food systems
188
Kitwe (Zambia)
In Kitwe, Zambia, a total of 32 indicators were identified to drive the CRFS assessment phase
within the 3 identified priority areas: Agricultural Production, Food Processing and
Distribution, and Environment and Natural Resources Degradation. Data collection tools and
secondary data sources were then identified for each indicator, associated with specific
questions to ask to get the relevant information or data. Indicators were used here to drive
and give direction to the assessment phase.

City Region Food System Toolkit Assessing and planning sustainable city region food systems
189
Priority area Areas of
work Indicators Survey tool Target/source Questions to be asked (refers to survey questionnaires)
1. Agricultural production: land availability, access and tenure; competition between urban development and agriculture; production and productivity issues (including retail but outside Kitwe district)
Diversity of Opportunities for Food Production
i1. Product volumes and diversity imported (from outside the city region) compared with product volumes from the city region
Key informant interviews
CSO/Chamber of Commerce/MoA
i1a. Names of vegetables, fruits, livestock & dairy commodities imported (name_________________; up to 20 answers)
i1b. Quantity of each vegetable, fruit, livestock & dairy commodity that is imported (name______________quantity___________; up to 20 answers)
i1g. Names of livestock products imported (name_______________quantity_________________; up to 10 answers)
Survey questionnaires
Producers (Farmers / poultry / livestock)/Households
1a. Enumerator id
1b. Date
1c. District
1d. Village
1e. Farmblock
1f. Type of housing: open area_ironsheet_brickhouse_thatch_temporal
1g. Total number of people in household
1h. Total children 0-5 years
1i. Total children 6-17 years
1j. Total adults 18-55 years
1k. Total adults 56-65 years
1l. Total elderly above 66
1m. Gender HH
1n. Provider of household income (i.e. male %, female %)
1o. Education attainment (i.e. none, primary, secondary, college, university)
1p. How many of 6-17 year children are in school or finished school
1q. How long has household been in this area?
1r. Where did your household come from? (i.e. same area_other settlement/neighbourhood_rural area outside city_nearest city_other distant city)
1s. What is the main source of household income?

City Region Food System Toolkit Assessing and planning sustainable city region food systems
190
1t. Why did household move into this area? (i.e. bought farmland_conflict/insecurity_drought_employment_assistance_pension_redundancy_lived here_other)
1u. Main source of drinking water (i.e. piped private_piped communal_protected well_unprotected well_borehole_purchase water_bottled water_other)
1v. Type of toilet facility used by household (i.e. simple pit latrine_ventilated latrine_flush toilet_no toilet_other)
1w. Where is your waste disposed of? (i.e. garbage dump_disposal service_roadside_burning_other)
1x. Which type of cooking fuel do you use? (i.e. charcoal_firewood_grass_cowdung_paraffin_gas_solar_other)
i2. Number/type of farms in the city region that use locally grown or other (organic/ecological/ fair-trade) product labels
Survey questionnaires
Producers (Farmers / poultry / livestock)
i2a. Number of farms using locally grown or other products labes (organic/ecological/fair-trade)
i2b. Type of farms using locally grown or other products labes (organic/ecological/fair-trade)(Text)
Key informant interviews
Councils / MoA / ZLA / Forestry / ZEMA / ZNFU / Water & Sewerage
i2a. Number of farms using locally grown or other products labes (organic/ecological/fair-trade)
i2b. Type of farms using locally grown or other products labes (organic/ecological/fair-trade) (text)
i4. Number/% of farms in the city region with direct sales to consumers; trading direct at markets or selling direct to retailers or caterers
Survey questionnaires
Producers (Farmers / poultry / livestock)
i4a. Number or % of farms with direct sales to consumers/do you sell directly to consumers(yes/no)
i4b. Number or % of farms trading direct at markets/do you trade directly at markets (yes/no)
i4c. Number or % of farms selling direct to retailers/do you sell direct to retailes (yes/no)
Key informant interviews
Councils / MoA / ZLA / Forestry / ZEMA / ZNFU / Water & Sewerage
i4a. Number or % of farms with direct sales to consumers
i4b. Number or % of farms trading direct at markets
i4c. Number or % of farms selling direct to retailers
Social Conditions for Food Producers
i5. Access to land and secure ownership /tenure arrangements for food production in the city region for various types of producers
Survey questionnaires
Producers (Farmers / poultry / livestock)
i5a. Do you have access to land which you are using (yes/no)
i5b. Who owns the land that you use (self/cooperative/rented/other/unknown)
i6. Number and type/characteristics of people (differentiate for women, young people and other
Key informant interviews
Councils / MoA / ZLA / Forestry / ZEMA / ZNFU / Water & Sewerage
i6a. Number of women involved in city region food production
i6b. Number young people involved in city region food production
i6c. Number other vulnerable groups involved in city region food production

City Region Food System Toolkit Assessing and planning sustainable city region food systems
191
vulnerable groups) involved in city region food production
i7. Number of children under age (child labour) employed in city region food production
Key informant interviews
Councils / MoA / ZLA / Forestry / ZEMA / ZNFU / Water & Sewerage
i7a. Number of children employed in input supply for food production in city region
i7b. Number of children employed in farm activities for food production in city region
Economic Value of Food Production Sector in the City Region
i9. Average food price data for different food products/commodities (value of city region food production vs. total value of food imported) Note: if possible compare farm gate and retail prices for selected commodities.
Survey questionnaires
Producers (Farmers / poultry / livestock)
i9a. Average farmgate price for commodity (name____________number(price)_______)
i9w. Average farmgate price for imported commodity:
i10. Number (or percentage) of farms (farm types) in the city region (economic vitality) for different food products
Survey questionnaires
Producers (Farmers / poultry / livestock)
i10a. Number or percentage of farm types that produce specific commodities
i10c. What is the size of farm that produce particular commodity (commodity____________size in acres_______)
Key informant interviews
CSO/Chamber of Commerce/MoA
i10a. Number or percentage of farm types that produce each commodity (number)
i10c. What is the size of farms that produce each commodity (number in acres)
Key informant interviews
Councils / MoA / ZLA / Forestry / ZEMA / ZNFU / Water & Sewerage
i10a. Number or percentage of farm types that produce each commodity
i10c. What is the size of farms that produce each commodity (number in acres)
Status of Natural Resource Management
i21. Total surface areas (current and potentially available currently unfarmed) of urban and peri-urban and rural agriculture land within the city region
Key informant interviews
Councils / MoA / ZLA / Forestry / ZEMA / ZNFU / Water & Sewerage
i21a. Total surface areas currently unfarmed of urban and peri-urban and rural agriculture land within the region (number in acres)
i21b. Total surface areas currently unfarmed of peri-urban land within the region (number in acres)
i21c. Total surface areas currently unfarmed rural agriculture land within the region (number in acres)
i21d. Total surface areas potentially available currently unfarmed of urban land within the region (number in acres)
i21e. Total surface areas potentially available currently unfarmed peri-urban land within the region (number in acres)
i21d. Total surface areas potentially available currently unfarmed rural agriculture land within the region (number in acres)
i32. Status of natural biodiversity in the city region
Key informant interviews
Councils / MoA / ZLA / Forestry / ZEMA / ZNFU / Water & Sewerage
i32a. What is the status of natural biodiversity in the city region (intact/degraded/unknown)
i32b. What drives the change in the status of natural biodiversity in the city region (farming/mining/settlements/

City Region Food System Toolkit Assessing and planning sustainable city region food systems
192
i32c. Who manages the natural biodiversity in the city region (text)
Policy and documents analysis
Councils/MoA/KDLA/Forestry/ZEMA/ZNFU/Water&Sewarage
i32a. What is the status of natural biodiversity in the city region (intact/degraded/unknown)
i32b. What drives the change in the status of natural biodiversity in the city region (farming/mining/settlements/
i37. Codes/regulations that allows/promote urban and periurban/city region food production
Policy and documents analysis
Councils/MoA/KDLA/Forestry/ZEMA/ZNFU/Water&Sewarage
i37a. National policies that allow/promote urban and peri-urban food production (paper)
i37b. Local or regional policies that allow/promote urban and peri-urban food production (paper)
i37c. National legislations/laws that allow/promote urban and peri-urban food production (paper)
i37d. Local or regional legislations/laws that allow/promote urban and peri-urban food production (paper)
Levels of Vulnerability and Conditions for Increasing Resilience
i44. Percentage of self- reliance (for the city region) in consumption of food by weight for specific product/prioritised food basket/total nutritional requirements or total consumption (possibly transform this also in food expenditures using average food price data)
Survey questionnaires
Producers (Farmers / poultry / livestock)
i44a. Percentage of commodity produced and consumed within the region out of total available (name1_____________% consumed within________)
Key informant interviews
Councils / MoA / ZLA / Forestry / ZEMA / ZNFU / Water & Sewerage
i44a. Percentage of commodity produced and consumed within the region out of total available
i47. Availability and accessibility of Urban agriculture/community gardens to all residents within the city region; especially of low-income
Survey questionnaires
Producers (Farmers / poultry / livestock)
i47a. How much land is available of urban agriculture/community gardens to all residents within the city region for low-income groups (in acres)
i47b. How accessible is land available of urban agriculture/community gardens to all residents within the city region for low-income groups (Available/Unavailable/Available but inadequate/Unknown)
Key informant interviews
Councils / MoA / ZLA / Forestry / ZEMA / ZNFU / Water & Sewerage
i47a. How much land is available of urban agriculture/community gardens to all residents within the city region for low-income groups (number or %)
i47b. How accessible is land available of urban agriculture/community gardens to all residents within the city region for low-income groups (accessible/inaccessible/unknown)
i49. Potential for increase in decent employment and income opportunities (multiplier effect) in city region food production and input supply
Key informant interviews
CSO/Chamber of Commerce/MoA
i49a. What is the potential for increase in decent employment (multiplier effect) in food production and input supply (number in % increase)
i49b. What is the potential for increase in income opportunities (multiplier effect) in food production and input supply (number in % increase)
Key informant interviews
i49a. What is the potential for increase in decent employment (multiplier effect) in food production and input supply (% increase)

City Region Food System Toolkit Assessing and planning sustainable city region food systems
193
Councils / MoA / ZLA / Forestry / ZEMA / ZNFU / Water & Sewerage
i49b. What is the potential for increase in income opportunities (multiplier effect) in food production and input supply (% increase)
i50. Extent to which production practices favour efficient use of abiotic resources (land/soil; water; nutrients)
Survey questionnaires
Producers (Farmers / poultry / livestock)
i50a. Extent to which production practices favour efficient use of land (High/medium/low/unknown)
i50b. Extent to which production practices favour efficient use of water (High/medium/low/unknown)
i50c. Extent to which production practices favour efficient use of soil fertility/nutrients (High/medium/low/unknown)
Key informant interviews
Councils / MoA / ZLA / Forestry / ZEMA / ZNFU / Water & Sewerage
i50a. Extent to which production practices favour efficient use of land (high/medium/low/unknown)
i50b. Extent to which production practices favour efficient use of water (high/medium/low/unknown)
i50c. Extent to which production practices favour efficient use of soil fertility/nutrients (high/medium/low/unknown)
i52. Degree to which livestock feed is produced within the city region (% of self-reliance in fodder production)
Survey questionnaires
Producers (Farmers / poultry / livestock)
i52a. Where is feed for livestock type obtained/bought from? (name of feed___________source___________)
i52b. How much does a kilogram of feed category cost? (name of feed_______________price/Kg________)
i521a. Mention commodities that are produced on the facility (text - up to 20 answers)
i521b. Where do you obtain/purchase your seed for each of the commodity? (text - up to 20 answers)
i521c. How much does (a Kg or packet of 500g) seed cost for each commodity? (name________________cost/Kg___________; 20 answers)
i521d. What fertilisers do you use for each of the crops you produce? (name___________fertiliser_____________; 15 answers)
i521e. Where do you obtain/purchase your fertiliser from? (text - up to 15 answers)
i521f. How much does a kilogram or 50 Kg bag of fertiliser cost? (fertiliser_________________cost/50Kg______________; up to 5 answers)
i521g. Where do you obtain your farm equipment from? (equipment______________source__________________; up to 10 answers)
i521h. What is the total cost of equipment required to produce each commodity that you produce? (commodity_____________equipment cost___________; up to 20 answers)
Key informant interviews
Councils / MoA / ZLA / Forestry / ZEMA / ZNFU / Water & Sewerage
i52a. Where is feed for livestock type obtained/bought from? (name of feed___________source___________)
i52b. How much does a kilogram of feed category cost? (name of feed_______________price/Kg________)
i521a. Mention commodities that are produced on the facility (text - up to 20 answers)

City Region Food System Toolkit Assessing and planning sustainable city region food systems
194
i521b. Where do you obtain/purchase your seed for each of the commodity? (text - up to 20 answers)
i521c. How much does (a Kg or packet of 500g) seed cost for each commodity? (name________________cost/Kg___________; 20 answers)
i521d. What fertilisers do you use for each of the crops you produce? (name___________fertiliser_____________; 15 answers)
i521e. Where do you obtain/purchase your fertiliser from? (text - up to 15 answers)
i521f1. How much does a kilogram or 50 Kg bag of top dressing fertiliser cost? (fertiliser_________________cost/50Kg______________; up to 5 answers)
i521f2. How much does a kilogram or 50 Kg bag of basal fertiliser cost? (fertiliser_________________cost/50Kg______________; up to 5 answers)
i521g. Where do you obtain your farm equipment from? (equipment______________source__________________; up to 10 answers)
i521h. What is the total cost of equipment required to produce each commodity that you produce? (commodity_____________equipment cost___________; up to 20 answers)
2. Food processing, supply and distribution system (including consumption & nutrition but outside Kitwe district)
Number and diversity of food processing businesses
i54. Type, number and geographic spread of food storage/processing/manufacturing businesses in the city region
Policy and documents analysis
CSO / MoH / Council
i54i. Number and type of commodity storage businesses in the city region (key informants-sec data)
i54ii. Geographic spread of commodity storage businesses in the city region (mapping of location: georeferencing)
Economic Value of Food Production Sector in the City Region
i9. Average food price data for different food products/commodities (value of city region food production vs. total value of food imported) Note: if possible compare farm gate and retail prices for selected commodities.
Survey questionnaires
Marketeers / Traders i9b. Average retail (market) price for locally produced commodity (commodity_________________market price__________; up to 20 answers)
Presence and Impact of Related Policy
I77. Compliance with food safety regulations and regular inspections related to food storage and processing in the city region
Key informant interviews
CSO / Chamber of Commerce / MoA / MoH / Councils
I77a. Compliance with food safety regulations related to food storage in the city region (high/medium/low/unknown)
I77b. Compliance with food safety regulations related to food processing in the city region (high/medium/low/unknown)
I77c. Compliance with regular inspections of food storage facilities in the city region (high/medium/low/unknown)
I77d. Compliance with regular inspections of food processing facilities in the city region (high/medium/low/unknown)
i177. Food quality: Extent to which low income residents
CSO / MoH / Council i77i. Compliance with food safety regulations related to food storage in the household (high/medium/low/unknown)

City Region Food System Toolkit Assessing and planning sustainable city region food systems
195
have access to/can afford local, safe, nutritious/healthy food in different areas in the city region (Note: using data from dietary diversity scores and food intake indications can be given on specific food intake and deficiencies) (food security)
Policy and documents analysis
i77ii. Are there regular inspections of food storage facilities in the household (daily/weekly/month/biannual/annual/none)
i77iii. Compliance with regular inspections of food storage facilities in the household (yes/no)
i132. Policies around street food catering and merkets eg license, food safety and hygiene, infrastructure support in the city region
Policy and documents analysis
CSO/CHAMBER OF COMMERCE/MoA/MoH/COUNCILS
i132a. Policies governing street food catering in the city region in terms of licences (paper - policy review)
i132b. Policies governing street food catering in terms of food safety & hygiene in the city region (paper - policy review)
i132c. Policies governing street food catering in terms of infrastructure support in the city region (paper - policy review)
i132d. Policies governing street food markets in the city region in terms of licences (paper - policy review)
i132e. Policies governing street food markets in terms of food safety & hygiene in the city region (paper - policy review)
i132f. Policies governing street food markts in terms of infrastructure support in the city region (paper - policy review)
Levels of Vulnerability and Conditions for
i81. Potential for increase in decent employment and income opportunities (multiplier effect) in city region food wholesale and distribution
Key informant interviews
CSO / Chamber of Commerce / MoA / MoH / Councils
i81a. Potential for increase in decent employment opportunities (multiplier effect) in city region food storage (high/medium/low/unknown)
i81b. Potential for increase in income opportunities (multiplier effect) in city region food storage (high/medium/low/unknown)
i81c. Potential for increase in decent employment opportunities (multiplier effect) in city region food processing and manufacturing (high/medium/low/unknown)

City Region Food System Toolkit Assessing and planning sustainable city region food systems
196
Increasing Resilience
i81d. Potential for increase in income opportunities (multiplier effect) in city region food processing and manufacturing
i137. Diversity in food retail and catering in the city region (for selected food products)
Policy and documents analysis
CSO / MoH / Council
i137i. Number and type of vegetable retail and catering in the city region
i137ii. Number and type of beef retail and catering in the city region
i137iii. Number and type of fish retail and catering in the city region
i137iv. Number and type of fruit retail and catering in the city region
i137v. Number and type of fruit products retail and catering in the city region
i137vi. Number and type of milk and milk products (cheese) retail and catering in the city region
i137vii. Number and type of poultry products retail and catering in the city region
Diversity of Opportunities for Food Wholesaler and Distribution Businesses
i83. Number, type and geographic spread of food wholesale/distribution points in the city region (for different products)
Key informant interviews
CSO / Chamber of Commerce / MoA / MoH / Councils
i83a. Number and type of wholesale and distribution points in the city region for each commodity (category_____________number___________; up to 5 answers)
i83b. Number and type of commodity wholesale points in the city region (category_____________number___________; up to 5 answers)
i83c. Number and type of commodity distribution points in the city region(category_____________number___________; up to 5 answers)
i83d. Geographic spread of of commodity wholesale and distribution points in the city region (mapping of location: georeferencing)
Survey questionnaires
Marketeers / Traders
i83a. Number and type of wholesale and distribution points in the city region for each commodity (category_____________number______________; up to 5 answers)
i83b. Number and type of commodity wholesale points in the city region (category_____________number______________; up to 5 answers)
i83c. Number and type of commodity distribution points in the city region (category_____________number______________; up to 5 answers)
i83d. Geographic spread of of commodity wholesale and distribution points in the city region (mapping of location: georeferencing)
Economic Conditions for Food Wholesale and Distribution Workers
i92. Infrastructure needs for improved city region wholesale and distribution businesses efficiency
Key informant interviews
CSO / Chamber of Commerce / MoA / MoH / Councils
i92e. State of existing wholesale and distribution infrastructure (i.e. excellent, good, poor, not existing, unknown)
Survey questionnaires
Producers (farmers / poultry / livestock)
i92a. Infrastructure needs for improved city region wholesale businesses efficiency (i.e. high, medium, low, unknown)
i92b. Infrastructure needs for improved city region distribution businesses efficiency (i.e. high, medium, low, unknown)
i92c. Infrastructure needs for improved city region wholesale and distribution businesses efficiency (i.e. high, medium, low, unknown)

City Region Food System Toolkit Assessing and planning sustainable city region food systems
197
i92d. Infrastructure needs related improvement to existing wholesale and distribution businesses or new (i.e. existing, new, uncertain)
i92e. State of existing wholesale and distribution infrastructure (i.e. excellent, good, poor, not existing, unknown)
i92f. Geographic spread of roads, storage, wholesale & distribution infrastructure (for mapping)
Survey questionnaires
Marketeers / Traders i92e. State of existing wholesale and distribution infrastructure (i.e. excellent, good, poor, not existing, unknown)
Levels of Vulnerability and Conditions for Increasing Resilience
i104. Transport efficiency: Current and potential use of food transport and storage in city region with low energy use / more optimised distribution – reduction of transport distance and emissions
Key informant interviews
CSO / Chamber of Commerce / MoA / MoH / Councils
i104a. Current use of food transport in city region with low energy use (high/medium/low/unknown)
i104b. Potential use of food transport in city region with low energy use (high/medium/low/unknown)
i104c. Current use of food transport in city region with more optimised distribution – reduction of transport distance and emissions (high/medium/low/unknown)
i104d. Potential use of food transport in city region with more optimised distribution – reduction of transport distance and emissions (high/medium/low/unknown)
i104e. Current use of food storage in city region with low energy use (high/medium/low/unknown)
i104f. Potential use of food storage in city region with low energy use (high/medium/low/unknown)
i104g. Current use of food storage in city region with more optimised distribution – reduction of transport distance and emissions (high/medium/low/unknown)
i104h. Potential use of food storage in city region with more optimised distribution – reduction of transport distance and emissions (high/medium/low/unknown)
Survey questionnaires
Marketeers / Traders
i104a. Current use of food transport in city region with low energy use (high/medium/low/unknown)
i104b. Potential use of food transport in city region with low energy use (high/medium/low/unknown)
i104c. Current use of food transport in city region with more optimised distribution – reduction of transport distance and emissions (high/medium/low/unknown)
i104d. Potential use of food transport in city region with more optimised distribution – reduction of transport distance and emissions (high/medium/low/unknown)
i104e. Current use of food storage in city region with low energy use (high/medium/low/unknown)
i104f. Potential use of food storage in city region with low energy use (high/medium/low/unknown)
i104g. Current use of food storage in city region with more optimised distribution – reduction of transport distance and emissions (high/medium/low/unknown)

City Region Food System Toolkit Assessing and planning sustainable city region food systems
198
i104h. Potential use of food storage in city region with more optimised distribution – reduction of transport distance and emissions (high/medium/low/unknown)
i107. Potential for increase in decent employment and income opportunities (multiplier effect) in city region food wholesale and distribution
Key informant interviews
CSO / Chamber of Commerce / MoA / MoH / Councils
i107a. Potential for increase in decent employment opportunities (multiplier effect) in city region food wholesale and distribution (% increase)
i107b. Potential for increase in decent employment opportunities (multiplier effect) in city region food wholesale (% increase)
i107c. Potential for increase in decent employment opportunities (multiplier effect) in city region food distribution (% increase)
i107d. Potential for increase in income opportunities (multiplier effect) in city region food wholesale and distribution (% increase)
i107e. Potential for increase in income opportunities (multiplier effect) in city region food wholesale (% increase)
i107f. Potential for increase in income opportunities (multiplier effect) in city region food distribution (% increase)
i144. Availability of local and traditional crops and products for residents from different wealth classes in different areas of the city region
Survey questionnaires
Households
i144a. Availability of local and traditional crops for residents from the low cost class in the city region (yearly, seasonally, none, unknown)
i144b. Availability of local and traditional crops for residents from the medium cost class in the city region (yearly, seasonally, none, unknown)
i144c. Availability of local and traditional crops for residents from the high cost class in the city region (yearly, seasonally, none, unknown)
i144d. Availability of local and traditional agro-products for residents from the low cost class in the city region (yearly, seasonally, none, unknown)
i144e. Availability of local and traditional agro-products for residents from the medium cost class in the city region (yearly, seasonally, none, unknown)
i144f. Availability of local and traditional agro-products for residents from the high cost class in the city region (yearly, seasonally, none, unknown)
i177. Food quality: Extent to which low income residents have access to/can afford local, safe, nutritious/healthy food in different areas in the city region (Note: using data from dietary diversity scores and food intake indications can be given on specific food intake and deficiencies) (food security)
Survey questionnaires
Households
I77a. Compliance with food safety regulations related to food storage in the household (high/medium/low/unknown)
I77b. Are there regular inspections of food storage facilities in the household (daily/weekly/month/biannual/annual/none)
I77c. Compliance with regular inspections of food storage facilities in the household (yes/no)
Diversity of Opportunitie
i147. Total food/nutritional requirements for the
Key informant interviews
MoH i147a. Total monthly beef/pork/chicken requirements for children under 5 in the household

City Region Food System Toolkit Assessing and planning sustainable city region food systems
199
s for Consumers to Eat Well
population in the city region. (Household food nutrition requirements multiplied by number of city region population). May be specified for specific food products If possible, differentiate within categories. e.g. children, adolescents, adults and elderly
i147b. Total monthly beef/pork/chicken requirements for adolescents in the household
i147c. Total monthly beef/pork/chicken requirements for adults in the household
i147d. Total monthly beef/pork/chicken requirements for the elderly in the household
i147i. Total monthly eggs requirements for children under 5 in the household
i147j. Total monthly eggs requirements for adolescents in the household
i147k. Total monthly eggs requirements for adults in the household
i147l. Total monthly eggs requirements for children under 5 in the household
i147m. Total monthly eggs requirements for elderly in the household
i147n. Total monthly milk requirements for adolescents in the household
i147o. Total monthly milk requirements for children under 5 in the household
i147p. Total monthly milk requirements for adults in the household
i147q. Total monthly milk requirements for elderly in the household
i147r. Total monthly vegetable requirements for children under 5 in the household
i147s. Total monthly vegetable requirements for adolescents in the household
i147t. Total monthly vegetable requirements for adults in the household
i147u. Total monthly vegetable requirements for elderly in the household
i147v. Total monthly fruit requirements for children under 5 in the household
i147w. Total monthly fruit requirements for adolescents in the household
i147x. Total monthly fruit requirements for adults in the household
i147y. Total monthly fruit requirements for elderly in the household
i147z. Total monthly fish requirements for children under 5 in the household
i147za. Total monthly fish requirements for adolescents in the household
i147zb. Total monthly fish requirements for adults in the household
i147zc. Total monthly fish requirements for elderly in the household
Survey questionnaires
Households i147a1. Total beef consumption in last 24 hours for children under 5 in the household (number in Kg for household)

City Region Food System Toolkit Assessing and planning sustainable city region food systems
200
i147b. Total beef consumption in last 24 hours for adolescents in the household (number in Kg for household)
i147c. Total beef consumption in last 24 hours for adults in the household (number in Kg for household)
i147d. Total beef consumption in last 24 hours for the elderly in the household (number in Kg for household)
i147e. Total fish consumption in last 24 hours in the household (number in Kg for household)
i147e1. Total fish consumption in last 24 hours for children under 5 in the household (number in Kg for household)
i147f. Total fish consumption in last 24 hours for adolescents in the household (number in Kg for household)
i147g. Total fish consumption in last 24 hours for adults in the household (number in Kg for household)
i147h. Total fish consumption in last 24 hours for elderly in the household (number in Kg for household)
i147i. Total eggs consumption in last 24 hours in the household (number of eggs for household)
i147i1. Total eggs consumption in last 24 hours for children under 5 in the household (number of eggs for household)
i147j. Total eggs consumption in last 24 hours for adolescents in the household (number of eggs for household)
i147k. Total eggs consumption in last 24 hours for adults in the household (number of eggs for household)
i147l. Total eggs consumption in last 24 hours for children under 5 in the household (number of eggs for household)
i147m. Total eggs consumption in last 24 hours for elderly in the household (number of eggs for household)
i147n. Total milk consumption in last 24 hours in the household (number of 500 ml packet)
i147n1. Total milk consumption in last 24 hours for adolescents in the household (number of 500 ml packet)
i147o. Total milk consumption in last 24 hours for children under 5 in the household (number of 500 ml packet)
i147p. Total milk consumption in last 24 hours for adults in the household (number of 500 ml packet)
i147q. Total milk consumption in last 24 hours for elderly in the household (number of 500 ml packet)

City Region Food System Toolkit Assessing and planning sustainable city region food systems
201
i147r. Total vegetable consumption in last 24 hours in the household (number of bundles)
i147r1. Total vegetable consumption in last 24 hours for children under 5 in the household (number of bundles)
i147s. Total vegetable consumption in last 24 hours for adolescents in the household (number of bundles)
i147t. Total vegetable consumption in last 24 hours for adults in the household (number of bundles)
i147u. Total vegetable consumption in last 24 hours for elderly in the household (number of bundles)
i147v. Total fruit consumption in last 24 hours in the household (name of fruit_________number eaten_______)
i147v1. Total fruit consumption in last 24 hours for children under 5 in the household (name of fruit_________number eaten_______)
i147w. Total fruit consumption in last 24 hours for adolescents in the household (name of fruit_________number eaten_______)
i147x. Total fruit consumption in last 24 hours for adults in the household (name of fruit_________number eaten_______)
i147y. Total fruit consumption in last 24 hours for elderly in the household (name of fruit_________number eaten_______)
i147z. Total chicken consumption in last 24 hours in the household (number of chickens)
i147za1. Total chicken consumption in last 24 hours for children under 5 in the household (number of chickens)
i147zb. Total chicken consumption in last 24 hours for adolescents in the household (number of chickens)
i147zc. Total chicken consumption in last 24 hours for adults in the household (number of chickens)
i147zd. Total chicken consumption in last 24 hours for elderly in the household (number of chickens)
Policy and documents analysis
CSO / MoH / Council
i147i. Total vegetable consumption in the Copperbelt Province
i147ii. Total beef consumption in the Copperbelt Provice
i147iii. Total bananas & mangoes consumption in the Copperbelt Province
i147iv. Total fish consumption in the Copperbelt Province
i147v. Total chickens consumption in the Copperbelt Province
i147vi. Total eggs consumption in the Copperbelt Province
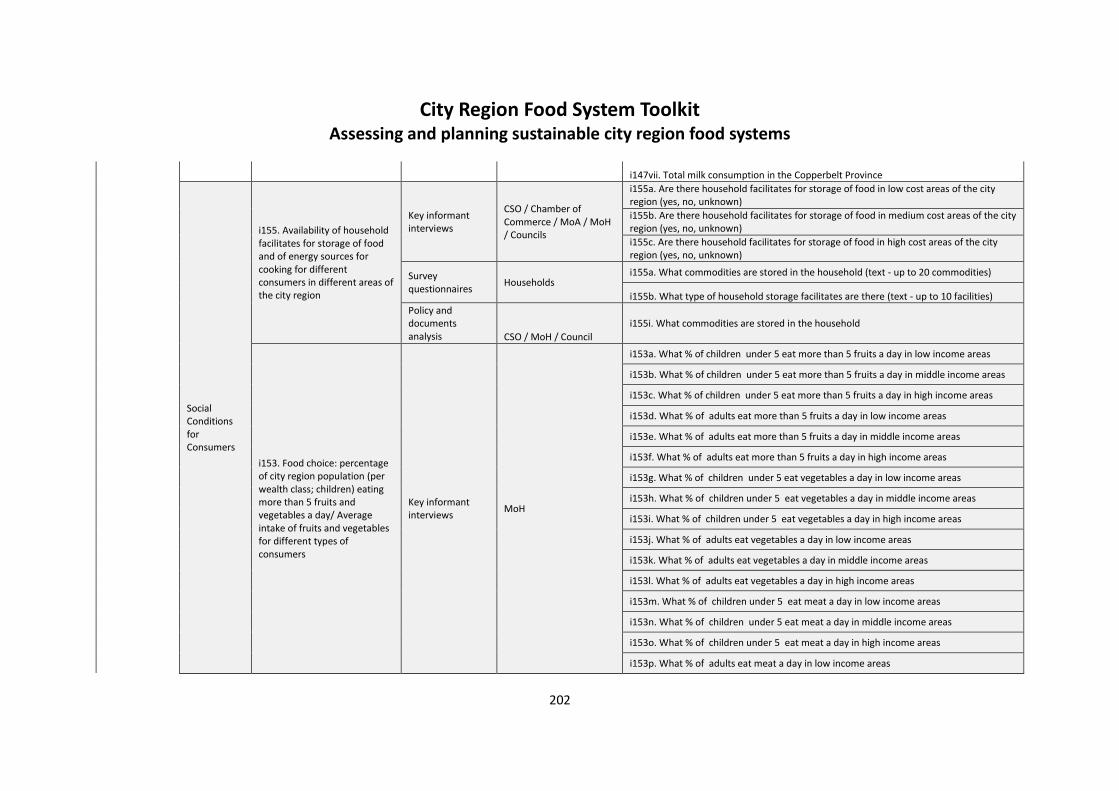
City Region Food System Toolkit Assessing and planning sustainable city region food systems
202
i147vii. Total milk consumption in the Copperbelt Province
Social Conditions for Consumers
i155. Availability of household facilitates for storage of food and of energy sources for cooking for different consumers in different areas of the city region
Key informant interviews
CSO / Chamber of Commerce / MoA / MoH / Councils
i155a. Are there household facilitates for storage of food in low cost areas of the city region (yes, no, unknown)
i155b. Are there household facilitates for storage of food in medium cost areas of the city region (yes, no, unknown)
i155c. Are there household facilitates for storage of food in high cost areas of the city region (yes, no, unknown)
Survey questionnaires
Households i155a. What commodities are stored in the household (text - up to 20 commodities)
i155b. What type of household storage facilitates are there (text - up to 10 facilities)
Policy and documents analysis CSO / MoH / Council
i155i. What commodities are stored in the household
i153. Food choice: percentage of city region population (per wealth class; children) eating more than 5 fruits and vegetables a day/ Average intake of fruits and vegetables for different types of consumers
Key informant interviews
MoH
i153a. What % of children under 5 eat more than 5 fruits a day in low income areas
i153b. What % of children under 5 eat more than 5 fruits a day in middle income areas
i153c. What % of children under 5 eat more than 5 fruits a day in high income areas
i153d. What % of adults eat more than 5 fruits a day in low income areas
i153e. What % of adults eat more than 5 fruits a day in middle income areas
i153f. What % of adults eat more than 5 fruits a day in high income areas
i153g. What % of children under 5 eat vegetables a day in low income areas
i153h. What % of children under 5 eat vegetables a day in middle income areas
i153i. What % of children under 5 eat vegetables a day in high income areas
i153j. What % of adults eat vegetables a day in low income areas
i153k. What % of adults eat vegetables a day in middle income areas
i153l. What % of adults eat vegetables a day in high income areas
i153m. What % of children under 5 eat meat a day in low income areas
i153n. What % of children under 5 eat meat a day in middle income areas
i153o. What % of children under 5 eat meat a day in high income areas
i153p. What % of adults eat meat a day in low income areas

City Region Food System Toolkit Assessing and planning sustainable city region food systems
203
i153q. What % of adults eat vegetables a day in middle income areas
i153r. What % of adults eat vegetables a day in high income areas
Survey questionnaires
Households
i153a. How many children eat more than 5 fruits a day in low income areas (name of fruit_________number eaten_______)
i153b. How many children eat more than 5 fruits a day in middle income areas (name of fruit_________number eaten_______)
i153c. How many children eat more than 5 fruits a day in high income areas (name of fruit_________number eaten_______)
i153d. How many adults eat more than 5 fruits a day in low income areas (name of fruit_________number eaten_______)
i153e. How many adults eat more than 5 fruits a day in middle income areas (name of fruit_________number eaten_______)
i153f. How many adults eat more than 5 fruits a day in high income areas (name of fruit_________number eaten_______)
i153g. How many children eat vegetables a day in low income areas (number of bundles)
i153h. How many children eat vegetables a day in middle income areas (number of bundles)
i153i. How many children eat vegetables a day in high income areas (number of bundles)
i153j. How many adults eat vegetables a day in low income areas (number of bundles)
i153k. How many adults eat vegetables a day in middle income areas (number of bundles)
i153l. How many adults eat vegetables a day in high income areas (number of bundles)
Presence and Impact of Related Policy
i169. Presence of consumer skills/training cooking programmes (e.g. how to cook from scratch; this also implies knowledge regarding preparation and cultural role )
Key informant interviews
CSO / Chamber of Commerce / MoA / MoH / Councils
i169a. Are there local training programs in cooking or food preparation (yes, no, unknown)
Key informant interviews
CopWaste / Water & Sewerage / NATMAZ / Traders / Marketers
i169a. Are there local training programs in cooking or food preparation (yes, no, unknown)
Policy and documents analysis CSO / MoH / Council
i169i. Are there local training programs in cooking or food preparation (yes, no, unknown)
Survey questionnaires
Households i169a. Are there local training programs in cooking or food preparation (yes, no, unknown)

City Region Food System Toolkit Assessing and planning sustainable city region food systems
204
i169b. Is your household able to properly cook vegetables (yes, no, somehow, never been attempted)
i169c. Is your household able to properly cook beef (yes, no, somehow, never been attempted)
i169d. Is your household able to properly cook pork (yes, no, somehow, never been attempted)
i169e. Is your household able to properly cook eggs (yes, no, somehow, never been attempted)
i169f. How are the cooking skills at household level acquired (formal training; self taught; learnt from home)
Status of Food Waste Management Approaches
i182. Volumes of wasted food used directly for human consumption e.g. by food banks/soup kitchens in the city region
Key informant interviews
CSO / Chamber of Commerce / MoA / MoH / Councils
i182a. What is the quantity of wasted food from markets (number in tons or %)
i182b. What is the quantity of wasted food from processing (number in tons or %)
i182c. What is the quantity of wasted food from retail & catering (number in tons or %)
i182d. What is the quantity of wasted food from household consumption (number in tons or %)
Key informant interviews
CopWaste / Water & Sewerage / NATMAZ / Traders / Marketers
i182a. What is the quantity of wasted food from markets (number in tons or %)
i182b. What is the quantity of wasted food from processing (number in tons or %)
i182c. What is the quantity of wasted food from retail & catering (number in tons or %)
i182d. What is the quantity of wasted food from household consumption (number in tons or %)
Survey questionnaires
Households i182d. What is the quantity of wasted food from household consumption (quantity in Kg or %)
3. Status of environment and natural resources degradation
Status of Natural Resource Management
i28. Pressure on water resources within the city region/ Water use (limitations) and competition: agricultural water withdrawal/renewable water resources
Key informant interviews
CopWaste / Councils / Water & Sewerage / MoA, / ZNFU / Water Affairs
i28a. Piped water use (limitations) in production in urban areas: agricultural water withdrawal/renewable water resources (high, low, unknown)
i28b. Piped water use (limitations) in production in peri-urban areas: agricultural water withdrawal/renewable water resources (high, low, unknown)
i28c. Limitations for piped water use in urban areas: agricultural water withdrawal/renewable water resources (Hours/week_____________; Hours/day____________)
i28d. Limitations for piped water use in peri-urban areas: agricultural water withdrawal/renewable water resources (Hours/week; Hours/day)
i28e. Sources of non-piped water use in food production in urban areas: agricultural water withdrawal/renewable water resources (dug wells away from garden; dug wells within garden; boreholes; stream/river; rainfed, sewer water)

City Region Food System Toolkit Assessing and planning sustainable city region food systems
205
i28f. Sources of non-piped water use in food production in peri-urban areas: agricultural water withdrawal/renewable water resources (dug wells away from garden; dug wells within garden; boreholes; stream/river; rainfed; sewer water)
i28g. Sources of non-piped water use in food production in rural areas: agricultural water withdrawal/renewable water resources (dug wells away from garden; dug wells within garden; boreholes; stream/river; rainfed; sewer water)
i28h. Cost of piped water use in food production in urban areas: agricultural water withdrawal/renewable water resources (number)
i28i. Cost of piped water use in food production in peri-urban areas: agricultural water withdrawal/renewable water resources (number)
i32. Status of natural biodiversity in the city region
Key informant interviews
MoA / Forestry / ZNFU / ZLA / ZEMA / Councils
i32a. What is the status of natural biodiversity in the city region (intact/degraded/unknown)
i32b. What drives the change in the status of natural biodiversity in the city region (text)
i32c. Who manages the natural biodiversity in the city region (text)
i32d. Do NR legislation and policies support sustainable agriculture practices? (No/Yes)
Policy and document analysis
MOA/FORESTRY/ZNFU/ZLA/ZEMA/COUNCILS
i32a. What is the status of natural biodiversity in the city region (intact/degraded/unknown)
i32b. What drives the change in the status of natural biodiversity in the city region (text)
i32c. Who manages the natural biodiversity in the city region (text)
i32d. Do NR legislation and policies support sustainable agriculture practices? (FGD)
i36. Policies, regulations and support for the preservation of agricultural land; use of open space/zoning etc. relevant for the city region
Policy and document analysis
COPWASTE/COUNCILS/WATER&SEWARAGE/MOA/ZNFU/WATER AFFAIRS
i36a. Policies and regulations for use of open space/ zoning etc. relevant for the city region (Note: Amount of land successfully safeguarded for city region food production) (paper/policy review)
i36b. Non-policy support (CSO, institutions, for a etc) for use of open space/ zoning etc. relevant for the city region (Note: Amount of land successfully safeguarded for city region food production) (paper/policy review)
i36c. Policies and regulations for preservation of agricultural land relevant for the city region (Note: Amount of land successfully safeguarded for city region food production) (paper/policy review)
i36d. Non-policy support (CSO, institutions, for a etc) for preservation of agricultural land relevant for the city region (Note: Amount of land successfully safeguarded for city region food production)(paper/policy review)

City Region Food System Toolkit Assessing and planning sustainable city region food systems
206
Tool/Example:
Questionnaire surveys for primary data collection
Author(s): FAO Project: FAO Food for the Cities Introduction to the joint programme This tool is part of the City Region Food Systems (CRFS) toolkit to assess and plan sustainable city region food systems. The toolkit has been developed by FAO, RUAF Foundation and Wilfrid Laurier University with the financial support of the German Federal Ministry of Food and Agriculture and the Daniel and Nina Carasso Foundation. Link to programme website and toolbox http://www.fao.org/in-action/food-for-cities-programme/overview/what-we-do/en/ http://www.fao.org/in-action/food-for-cities-programme/toolkit/introduction/en/ http://www.ruaf.org/projects/developing-tools-mapping-and-assessing-sustainable-city-region-food-systems-cityfoodtools Tool summary:
Tool description: To assess the CRFS and characterize specific indicators, quantitative data can be collected through questionnaire surveys. Questionnaires can include structures and semi-structures questions. Questionnaire surveys allow researchers to obtain statistically significant data on certain areas of investigation. Different sampling methods can be used, based on the type of information needed. This type of tool is often used to get data on:
Production – Farmers’ survey
Consumption – Households’ survey
Food flows – Businesses’ survey, market gate survey
Brief description This tool aims at collecting primary data to generate figures and trends to assess specific components of the CRFS. This was used in Kitwe (Zambia), and Colombo (Sri Lanka), to assess production, consumption and food supply aspects.
Expected outcome Collection of primary data.
Expected Output Data sets
Scale of application City region (municipal, district, province)
Expertise required for application
Examples of application
Kitwe (Zambia), Colombo (Sri Lanka).
Year of development 2016
References -
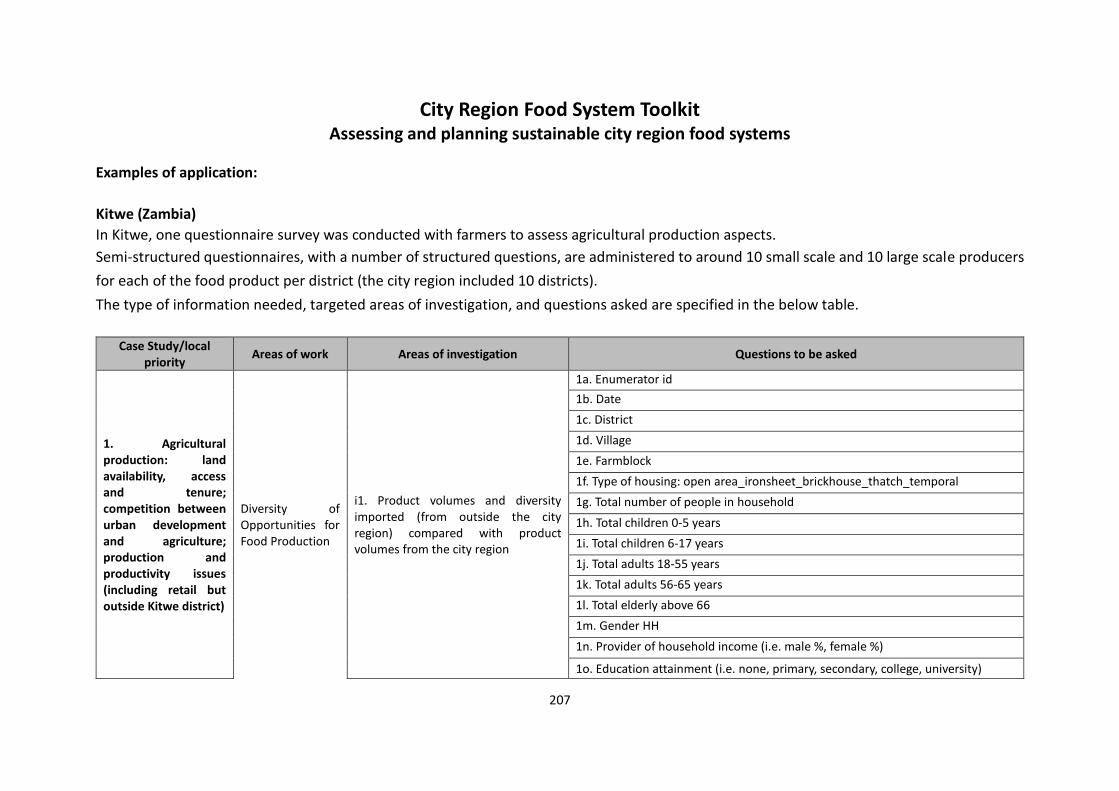
City Region Food System Toolkit Assessing and planning sustainable city region food systems
207
Examples of application:
Kitwe (Zambia)
In Kitwe, one questionnaire survey was conducted with farmers to assess agricultural production aspects.
Semi-structured questionnaires, with a number of structured questions, are administered to around 10 small scale and 10 large scale producers
for each of the food product per district (the city region included 10 districts).
The type of information needed, targeted areas of investigation, and questions asked are specified in the below table.
Case Study/local priority
Areas of work Areas of investigation Questions to be asked
1. Agricultural production: land availability, access and tenure; competition between urban development and agriculture; production and productivity issues (including retail but outside Kitwe district)
Diversity of Opportunities for Food Production
i1. Product volumes and diversity imported (from outside the city region) compared with product volumes from the city region
1a. Enumerator id
1b. Date
1c. District
1d. Village
1e. Farmblock
1f. Type of housing: open area_ironsheet_brickhouse_thatch_temporal
1g. Total number of people in household
1h. Total children 0-5 years
1i. Total children 6-17 years
1j. Total adults 18-55 years
1k. Total adults 56-65 years
1l. Total elderly above 66
1m. Gender HH
1n. Provider of household income (i.e. male %, female %)
1o. Education attainment (i.e. none, primary, secondary, college, university)

City Region Food System Toolkit Assessing and planning sustainable city region food systems
208
1p. How many of 6-17 year children are in school or finished school
1q. How long has household been in this area?
1r. Where did your household come from? (i.e. same area_other settlement/neighbourhood_rural area outside city_nearest city_other distant city)
1s. What is the main source of household income?
1t. Why did household move into this area? (i.e. bought farmland_conflict/insecurity_drought_employment_assistance_pension_redundancy_lived here_other)
1u. Main source of drinking water (i.e. piped private_piped communal_protected well_unprotected well_borehole_purchase water_bottled water_other)
1v. Type of toilet facility used by household (i.e. simple pit latrine_ventilated latrine_flush toilet_no toilet_other)
1w. Where is your waste disposed of? (i.e. garbage dump_disposal service_roadside_burning_other)
1x. Which type of cooking fuel do you use? (i.e. charcoal_firewood_grass_cowdung_paraffin_gas_solar_other)
i2. Number/type of farms in the city region that use locally grown or other (organic/ecological/ fair-trade) product labels
i2a. Number of farms using locally grown or other products labes (organic/ecological/fair-trade)
i2b. Type of farms using locally grown or other products labes (organic/ecological/fair-trade)(Text)
i4. Number/% of farms in the city region with direct sales to consumers; trading direct at markets or selling direct to retailers or caterers
i4a. Number or % of farms with direct sales to consumers/do you sell directly to consumers(yes/no)
i4b. Number or % of farms trading direct at markets/do you trade directly at markets (yes/no)
i4c. Number or % of farms selling direct to retailers/do you sell direct to retailes (yes/no)
Social Conditions for Food Producers
i5. Access to land and secure ownership /tenure arrangements for food production in the city region for various types of producers
i5a. Do you have access to land which you are using (yes/no)
i5b. Who owns the land that you use (self/cooperative/rented/other/unknown)
Economic Value of i9. Average food price data for i9a. Average farmgate price for commodity

City Region Food System Toolkit Assessing and planning sustainable city region food systems
209
Food Production Sector in the City Region
different food products/commodities (value of city region food production vs. total value of food imported) Note: if possible compare farm gate and retail prices for selected commodities.
(name____________number(price)_______)
i9w. Average farmgate price for imported commodity:
i10. Number (or percentage) of farms (farm types) in the city region (economic vitality) for different food products
i10a. Number or percentage of farm types that produce specific commodities
i10c. What is the size of farm that produce particular commodity (commodity____________size in acres_______)
Levels of Vulnerability and Conditions for Increasing Resilience
i44. Percentage of self- reliance (for the city region) in consumption of food by weight for specific product/prioritised food basket/total nutritional requirements or total consumption (possibly transform this also in food expenditures using average food price data)
i44a. Percentage of commodity produced and consumed within the region out of total available (name1_____________% consumed within________)
i47. Availability and accessibility of Urban agriculture/community gardens to all residents within the city region; especially of low-income
i47a. How much land is available of urban agriculture/community gardens to all residents within the city region for low-income groups (in acres)
i47b. How accessible is land available of urban agriculture/community gardens to all residents within the city region for low-income groups (Available/Unavailable/Available but inadequate/Unknown)
i50. Extent to which production practices favour efficient use of abiotic resources (land/soil; water; nutrients)
i50a. Extent to which production practices favour efficient use of land (High/medium/low/unknown)
i50b. Extent to which production practices favour efficient use of water (High/medium/low/unknown)
i50c. Extent to which production practices favour efficient use of soil fertility/nutrients (High/medium/low/unknown)
i52. Degree to which livestock feed is produced within the city region (% of self-reliance in fodder production)
i52a. Where is feed for livestock type obtained/bought from? (name of feed___________source___________)
i52b. How much does a kilogram of feed category cost? (name of feed_______________price/Kg________)

City Region Food System Toolkit Assessing and planning sustainable city region food systems
210
i521a. Mention commodities that are produced on the facility (text - up to 20 answers)
i521b. Where do you obtain/purchase your seed for each of the commodity? (text - up to 20 answers)
i521c. How much does (a Kg or packet of 500g) seed cost for each commodity? (name________________cost/Kg___________; 20 answers)
i521d. What fertilisers do you use for each of the crops you produce? (name___________fertiliser_____________; 15 answers)
i521e. Where do you obtain/purchase your fertiliser from? (text - up to 15 answers)
i521f. How much does a kilogram or 50 Kg bag of fertiliser cost? (fertiliser_________________cost/50Kg______________; up to 5 answers)
i521g. Where do you obtain your farm equipment from? (equipment______________source__________________; up to 10 answers)
i521h. What is the total cost of equipment required to produce each commodity that you produce? (commodity_____________equipment cost___________; up to 20 answers)
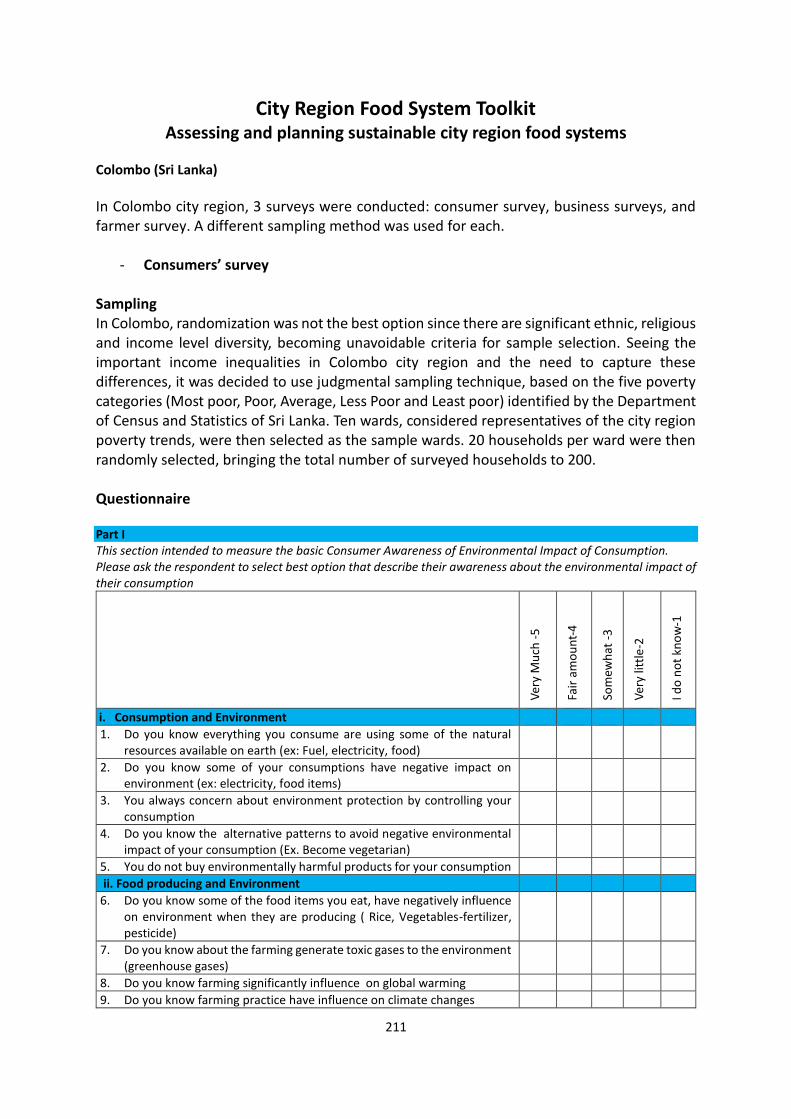
City Region Food System Toolkit Assessing and planning sustainable city region food systems
211
Colombo (Sri Lanka)
In Colombo city region, 3 surveys were conducted: consumer survey, business surveys, and farmer survey. A different sampling method was used for each.
- Consumers’ survey Sampling In Colombo, randomization was not the best option since there are significant ethnic, religious and income level diversity, becoming unavoidable criteria for sample selection. Seeing the important income inequalities in Colombo city region and the need to capture these differences, it was decided to use judgmental sampling technique, based on the five poverty categories (Most poor, Poor, Average, Less Poor and Least poor) identified by the Department of Census and Statistics of Sri Lanka. Ten wards, considered representatives of the city region poverty trends, were then selected as the sample wards. 20 households per ward were then randomly selected, bringing the total number of surveyed households to 200. Questionnaire Part I This section intended to measure the basic Consumer Awareness of Environmental Impact of Consumption. Please ask the respondent to select best option that describe their awareness about the environmental impact of their consumption
Ver
y M
uch
-5
Fair
am
ou
nt-
4
Som
ewh
at -
3
Ver
y lit
tle
-2
I do
no
t kn
ow
-1
i. Consumption and Environment
1. Do you know everything you consume are using some of the natural resources available on earth (ex: Fuel, electricity, food)
2. Do you know some of your consumptions have negative impact on environment (ex: electricity, food items)
3. You always concern about environment protection by controlling your consumption
4. Do you know the alternative patterns to avoid negative environmental impact of your consumption (Ex. Become vegetarian)
5. You do not buy environmentally harmful products for your consumption
ii. Food producing and Environment
6. Do you know some of the food items you eat, have negatively influence on environment when they are producing ( Rice, Vegetables-fertilizer, pesticide)
7. Do you know about the farming generate toxic gases to the environment (greenhouse gases)
8. Do you know farming significantly influence on global warming
9. Do you know farming practice have influence on climate changes

City Region Food System Toolkit Assessing and planning sustainable city region food systems
212
10. Do you know meat production have negative impact on carbon footprint
iii. Food processing and Environment
11. Do you know food preparation/processing practices have negative impact on environment (Gas/Solid waste/ Waste Water)
12. Do you know burning of charcoal/gas during cooking at home might have negative impact on environment?
13. Do you know plastic/polithine are not good for environment
14. Do you use plastic/polithine bags when you go for marketing
15. You know packages of food items may harmful to the environment
iv. Food waste and Environment
16. Do you know food waste at your house have been serious environmental problem to the city
17. Do you know burning of waste create some toxic gases
18. Do you know that government is promoting to generate compost from food waste at household
19. Do you know the environmental importance of sorting your waste before dumping
20. You are trying to sort solid waste before dumping to collector
v. Organic farming and Environment
21. Are you familiar with the terms “organic food” and “organic agriculture”?
22. Can you list 3 or more activities prohibited in organic farming and food processing? (ask it)
23. Can you list 3 or more things farmers or processors have to do to qualify as organic? (ask it)
24. Do you know the overall impact of organic agriculture on environment
25. Do you know the overall impact of organic agriculture on human health
26. Do you know the overall impact of organic agriculture on farm economics
27. Do you know the overall impact of organic agriculture on people and communities
vi. Organic food consumption
Ver
y M
uch
Fair
am
ou
nt
Som
ewh
at
Ver
y lit
tle
No
/I d
o n
ot
28. Do you consume organic food?
29. You always search for organic foods
30. There are places to buy organic food in your area
31. You consume organic food because of your health concerns
32. You consume organic food because of your concern for environment
33. I cannot eat without having organic foods
34. You want to eat vegetarian food
vii. Potential threats of avoiding environmentally friendly food

City Region Food System Toolkit Assessing and planning sustainable city region food systems
213
What is the level of your agreement with following statements on organic foods
Stro
ngl
y ag
ree
Agr
ee
No
idea
Dis
agre
e
Stro
ngl
y d
isag
ree
35. Price is too high
36. Not available in the market
37. Do not exactly know they are organic
38. Quality is not good
39. Can’t store for long time
40. Taste of organic food is not good
Part II This section intended to measure the Consumer Awareness of Healthy diet and their food consumption patterns A: Please ask the respondent about their basic physiological characteristics. (If the respondent do not know the answer please write (DNK))
41. What is your age:
42. What is your weight
43. What is your height
44. You Gender
45. At the present time are you a. trying to lose weight, b. trying to gain weight or c. Not trying to change your weight?
46. Do you have any non-communicable diseases?
47. Are there any medically prohibited food items for you?
B. Please ask the respondent to select best option that describe their awareness about the health concerns in food consumption
Stro
ngl
y ag
ree
Agr
ee
Dis
agre
e
Stro
ngl
y d
isag
ree
No
idea
/n
ever
Appraisal of one’s own diet
48. Overall what I usually eat is very healthy
49. I have idea about what is good and what is bad for my health
50. I try my best to get healthy diet every time
51. I have good control on my diet
Attitudes to healthy eating
52. I always think of the calories in what I eat
53. I think health foods are only bought by extremists*

City Region Food System Toolkit Assessing and planning sustainable city region food systems
214
54. I think fast food is a junk
55. I should do a lot more about my health*
56. I consider my diet to be very healthy
57. I am eating more healthy food than I have in the past
58. I wouldn't let my children eat junk food
59. I get a lot of pleasure out of food*
60. I like to treat myself to foods that are not good for me*
How Serious the potential Barriers to have a healthy food lifestyle
Ver
y se
rio
us
Seri
ou
s
Neg
ligib
le
Ver
y N
eglig
ible
Do
no
t kn
ow
61. Other health problems I have
62. Cost
63. Lack of will power
64. Can't be bothered/ time limitations/no option
65. Other responsibilities/ caring/child care
66. Difficulty to access to facilities/ healthier choices
67. Family influence/ family choices
68. Eating habits/eating the wrong foods Source: Adapted from Kath Roberts and Katie Marvin (2011) Knowledge and attitudes towards healthy eating and physical activity: what the data tell us. National Obesity Observatory.UK
C: Please ask the respondent to select best duration option that describe their food patterns
All
7 d
ays
6 d
ays
4-5
day
s
3-2
day
s
1 d
ay
No
t at
all
69. How many days your family prepare food at home during last week for
i. Breakfast
ii. Lunch
iii. Dinner
70. How many days you eat prepared food last week for
i. Breakfast
ii. Lunch
iii. Dinner
71. How many days you skipped taking foods last week for
i. Breakfast
ii. Lunch
iii. Dinner
72. How many days of last week you drink milk/milk powder
73. How many days of last week you eat vegetables
74. How many days of last week you eat fish/meat
75. How many days of last week you eat eggs
D: Please ask the respondent to select best option that describe their food cost per week
Less than
Rs.201-400
Rs.401-600
Rs.601-800
Rs.801-1000
More than

City Region Food System Toolkit Assessing and planning sustainable city region food systems
215
Rs.200 Rs1000
76. How much you spent to prepare homemade family meal during last week
i. Breakfast
ii. Lunch
iii. Dinner
77. How much you spent to purchase prepared food for family meal during last week
i. Breakfast
ii. Lunch
iii. Dinner
78. How much you spent to purchase fruits during last week
E: Please ask the respondent to select best option that describe the access to foods
79. Where you live? GN division:
80. On average how many members are at your house get main
meals from you
Adult: Children:
81. What is the nearest place you regularly buy food items?
i. Vegetable market /pola ii. Fish stall iii. Meat stall iv. Grocery shops v. Super markets
82. How far it is from your house i. Less than 5 min walk ii. Less than 10 min walk iii. Less than 15 min walk iv. Less than 20 min walk v. Need to travel by bus/vehicle
83. How do you get to the locations where you get your food? 1. Own vehicle 2. Walk 3. Three wheeler 4. Bike 5. Bus/Public transportation
84. How would you rate the quality of the fresh food sold in your local grocery store? (1=WORST, 5=BEST)
85. i. Fruits
ii. Vegetables iii. Meats/Protein iv. Breads v. Dairy
1 1 1 1 1
2 2 2 2 2
3 3 3 3 3
4 4 4 4 4
5 5 5 5 5
NA NA NA NA NA
86. What are the main problems in getting the foods you need?
Co
st
of
Foo
d
Tim
e fo
r
sho
pp
ing
Dis
tan
ce t
o
the
sto
re
Qu
alit
y o
f
foo
d
Safe
ty
Oth
er

City Region Food System Toolkit Assessing and planning sustainable city region food systems
216
All
7 d
ays
6 d
ays
4-5
day
s
3-2
day
s
1 d
ay
No
t at
all
87. How often you purchase food items per week
88. How many days You have easy access to food at your neighborhood
i. Vegetable market /pola
ii. Fish stall
iii. Meat stall
iv. Grocery shops
v. Super markets
89. How many days you have easy access to prepared food in your neighborhood
i. Hotels and restaurants
ii. Mobile food stores
iii. Bike riders
iv. Household prepared food Source: Adapted from HKHC Louisville partnership (2010) Neighborhood Food Access Survey. Available at http://www.healthykidshealthycommunities.org/resources/neighborhood-food-access-survey
Part III This section intended to measure the Household Dietary patterns and Diversity. [Food Categories] A. Cereals G. Fish and seafood B. Root and tubers H. Pulses/legumes/nuts C. Vegetables I. Milk and milk products D. Fruits J. Oil/fats E. Meat, poultry, offal K. Sugar/honey F. Eggs L. Miscellaneous Read the list of foods. Place a one in the box if anyone in the household ate the food in question, place a zero in the box if no one in the household ate the food.
Category Food, if eaten Yesterday Yes/No
Avg. Days per week
A. Cereals: Any [INSERT ANY LOCAL FOODS, E.G. UGALI, NSHIMA], bread, rice noodles, biscuits, or any other foods made from millet, sorghum, maize, rice, wheat, or [INSERT ANY OTHER LOCALLY AVAILABLE GRAIN]?
B. Root and tubers: Any potatoes, yams, manioc, cassava or any other foods made from roots or tubers?
C. Vegetables: Any Vegetables
D. Fruits: Any fruits?
E. Meat, Poultry, offal: Any beef, pork, lamb, goat, rabbit wild game, chicken, duck, or other birds, liver, kidney, heart, or other organ meats?
F. Eggs: Any eggs?

City Region Food System Toolkit Assessing and planning sustainable city region food systems
217
G. Fish and Seafood: Any fresh or dried fish or shellfish?
H. Pulses/legumes/nuts: Any foods made from beans, peas, lentils, or nuts?
I. Milk and Milk products: Any cheese, yogurt, milk or other milk products?
J. Oil/Fats: Any foods made with oil, fat, or butter?
H. sugar/honey: Any sugar or honey?
K. Miscellaneous: Any other foods, such as condiments, coffee, tea?
Total score Source: Anne Swindale and Paula Bilinsky (2006) Household Dietary Diversity Score (HDDS) for Measurement of Household Food Access: Indicator Guide-Version 2. FANTA. Washington DC.
Part IV This section intended to assess the Household solid waste management practices.
90. Please describe how your household stores the garbage from your house. (Interviewer: Do not provide the choices, but select the choice below that best fits the respondent’s description) 1 Closed Container, please describe: 2 Open Container, please describe: 3 Plastic bags 4 Pile in the yard 5 Other, specify: 6 Don’t Know 91. Please describe how your household gets rid of the following types of garbage from your house. (Interviewer: Select the choice below that best fits the respondent’s description. Include any additional comments made by the respondent in the space provide)
Types of Garbage
Bu
rn
Bu
ry
Dump
Gar
bag
e
Tru
ck
Rec
ycle
Reu
se
Co
mp
ost
Oth
er
(Sp
ecif
y)
River/ Gully
In yard
On road
EHO Dump site
1 2 3 4 5 6 7 8 9 10 11
Food waste
Yard trimmings
Paper/cardboard
Plastic
Metals
Glass Source: Adapted from
i. Willi Haas, Edgar Hertwich, Klaus Hubacek, Katarina Korytarova, Michael Ornetzeder, Helga Weisz (2005) THE ENVIRONMENTAL IMPACTS OF CONSUMPTION: Research Methods and Driving Forces. Industrial Ecology Programme . Norway
ii. Jennie I. Macdiarmid*, Flora Douglas, Jonina Campbell (2016) Eating like there's no tomorrow: Public awareness of the environmental impact of food and reluctance to eat less meat as part of a sustainable diet. Vol 96. Appetite.
iii. E&E Consultants (2013) Perspectives of dietary habits and Carbon footprint consumer awareness: A survey of current literature towards sustainable consumption. Available at http://www.ee-consultant.fr/IMG/pdf/summary_Robin-Pompey.pdf

City Region Food System Toolkit Assessing and planning sustainable city region food systems
218
- Business Survey
Since Colombo city is the commercial hub and main distribution centre for all the food products, supply chain nodes like wholesellers, commission agents, distributors, retailers and prepared food suppliers of different scales needed to be considered. Data were collected by the owners or the responsible managers of the business, and one or two employees from each entity. Sampling Time and logistical constraints limited the study to a maximum of 100 sample units. Since there is remarkable diversity in businesses as large, medium, small and micro level in Colombo city, proportionate random sampling technique was an ideal sample technique for the business survey. According to the sample selection method different types of business entities would be selected to the sample based on their relative proportion among all the entities. Questionnaire
Section I
1. Nature of the business (select based on customer segments the business in mainly catering )
i. Whole sale ii. Retail iii. Restaurant iv. Commission agent v. Other ……………….
2. Size of the business (use judgment by observing stock, sales volume and number of employees)
i. Large ii. Medium iii. Small iv. Micro
3. Location (please write the region)
4. Product categories i. Vegetable ii. Rice iii.fish iv.meat v.. Other food items vi. Imported foods vii.Prepared food viii.Other
5. Where the products are coming from
i. If local what are the main locations ii. If imported what are the countries
6. From whom your purchase products i. Farmers ii. Whole sellers iii. Agents iv. Importers v. Distributors vi. Agencies vii. other

City Region Food System Toolkit Assessing and planning sustainable city region food systems
219
Section II
Alw
ays
If n
eed
ed
som
etim
es
Rar
ely
Nev
er
7. Do you clean the product before you sell them
8. Stall is cleaned by you/employee or third party
9. Food are checked for quality
10. Best storage facilities are provided to store food ietms
11. Do you use water to clean the products
12. Do you have access to clean water source
13. What is your main water source Tap Tube well Well Lake Other
14. Your last month water bill Rs.
15. Your last month electricity bill Rs.
16. Do you have trade license 1. Yes 2. No
Alw
ays
Mo
stly
som
etim
es
Rar
ely
Nev
er
17. Do you have food waste in your business
18. You are throwing away some of the products
19. Do you sell food waste at low price?
20. You are facing financial loss because of waste
21. Do you grade the product based on the quality?
22. Have you try to avoid waste in business
23. What are the actions taken
24. Employees are educated to avoid waste
25. How much waste generate in your business as percentage of all goods last week
Less than 5%
5-10% 11-15%
16-20%
More than 20%
26. How much money you lost due to waste last week No loss Rs. 1000 or less
Rs. 5000 or less
Rs. 10,000 or less
Rs. 20,000 or less
Alw
ays
Mo
stly
som
etim
es
Rar
ely
Nev
er
27. Have you try to give waste products to needy
28. Do people come to you look for waste food
29. Do you give near expiry items with discount

City Region Food System Toolkit Assessing and planning sustainable city region food systems
220
30. You never let food to be thrown away
31. weather changes influence on your business
32. bad weather influence on food waste in your business
33. price is sensitive to weather condition in production area
34. price is sensitive to weather condition in Colombo
35. employed are given accommodation
36. Employees were given sanitation facilities
37. Employees were checked for their medical history
38. Safety and security measures for employee safety considered
39. Employees were given uniforms

City Region Food System Toolkit Assessing and planning sustainable city region food systems
221
- Farmers’ Survey
Sampling There are specifically selected food items for the study: Rice, fish, coconut, Carrot, Brinjol, papaya and Banana. There are multiple large scale and small scales farms in all over the country and there are specific places who are reputed for particular food item. The researchers located such places where largest volume of harvest comes to Colombo city region. There is no exact register to get list of farmers those who cultivate the specific food item. Since none of these populations are finite, it was difficult to select random sample for the surveys. Therefore snowball sampling technique was used to get minimum of 30 respondents for each food item to get indicative data about the unknown properties of the value chain. Questionnaire
i. Location:
ii. crop
iii. Extent
iv. Selling mode a. Direct for farm b. direct at pola c. agent d. collector e. economic centre f. retailers g. super markets h. other
v. Current price level
Behavior intention
1. Why you involved in farming a. Commercial b. Consumption
2. Are there any differences between your farm now and your farm when you were a kid?
a. A lot b. Somewhat c. Nothing d. Negligible e. Not at all
3. What are the fertilizers you mainly use? [ is that compost of not] a. Chemical b. Organic
4. If not compost, what are the major brands or names of the fertilizer using?
i. ii iii.
5. Why you use that? [ if not compost ask How about using Compost?] a. Yield is high b. Cost is low c. Easy to use d. Easy to buy e. Known for long time f. other
Perception about organic farming/compost usage
6. Have you consider about organic farming? i. Yes ii. No
7. i. Have you tried compost? 8. [Depending on answer ask why? What are the reasons?
i. Yes ii. No a. b. c.
9. What do you think about compost? what are the benefits a. cheap

City Region Food System Toolkit Assessing and planning sustainable city region food systems
222
b. easy to buy c. high yield d. eco friendly e. f g
10. If you use only once or twice, what are the reasons you give up compost?
a. b. c. d. e. f.
11. Awareness about compost plants
12. Do you know garbage can be convert to compost? 1. Yes 2 No
13. Have you try composting? Why? 1. Yes 2 No
14. Do you know about the compost plants available in your neighborhood?
1.yes 2 No
15. Is that anyone educate you about compost plant and their compost? 1. Yes 2 No
16. Supply chain of compost
17. What are the places you can buy fertilizers? Do they have compost? a. b. c.
18. Is there anyone selling compost in your area? [ ask the places] 1 yes 2 No
19. Have you buy compost from them?When? How much? 1 yes 2 No b. c.
20. Price
21. What do you think about compost price? Is that expensive? 1. Very cheap 2. Cheap 3. Normal 4. Highe very high
22. What is the best price you like to pay for 25 Kg of compost? Rs.
23. Place
24. Do you know the places to buy quality compost? [ ask him names and places]
1 yes 2 No
25. How convenient to buy and transport compost in your area? 1. Very difficult 2. Difficult 3. Neutral 4. Easy 5. Very easy
26. Promotion
27. Is there any promotional campaigns going on to promote compost usage? If yes
1 yes 2 No
28. What kind of programs are they? a.

City Region Food System Toolkit Assessing and planning sustainable city region food systems
223
b. c.
29. Product
30. According to your experience which fertilizer is easy to use? Compost or chemicals
1. Chemicals 2. Compost
31. What are the practical problems faced by you to go for compost as fertilizer [cross question to verify]
a. c. c. e. f.
32. If you are going to use compost in your farming in future, what are the things you mainly require?
a. b. c. d.
33. Food Loss
34. How much extent of harvest destroyed due to various reasons Kg: As percentage:
35. If there is significant loss, what are the reasons? a b c d
36. What are the actions can be taken to reduce the loss a. b. c. d
37. Value chain
38. How you sell your products? What is the process? a. b. c. d .e
39. Why you prefer this method? a. b. c e.
40. What is the price you received for 1 Kg of your product last time you sell?
Rs.
41. Are you satisfy with current supply chain? i. Very low ii. Low iii. Neutral iv. High v. Very high
42. Any idea of finding new supply chain? 1. Yes 2. No
43. Climate changes
44. Did you feel significant weather changes in the area during last 5 years?
i. Very low

City Region Food System Toolkit Assessing and planning sustainable city region food systems
224
i. Rain patterns, ii. Temperature…
ii. Low iii. Neutral iv. High v. Very high
i. Very low ii. Low iii. Neutral iv. High v. Very high
45. How it effect on your farming practices? Positive or negative effect? i. Very low ii. Low iii. Neutral iv. High v. Very high
ii. Is there changes in harvest last three years? i. No ii. Somewhat iii. Large extent iv. Very large extent
iii. What are the action you have taken to overcome the weather problem
a. b. c. d.
iv. Livelihood
1. How is the life in recent months? Income, cost of living impact i. Very bad ii. Bad iii. Neutral iv. Good v. Very good
2. Are you happy with farming? you want to continue i. Very bad
ii. Bad
iii. Neutral
iv. Good
v. Very good
3. What are the happiest movements of being farmer?
4. What are the expected changes need to happen for better life?
Source: Adapted from a survey of household solid waste management in otukpo 2011: a case study of residents around wesley high school otukpo, benue, Nigeria

City Region Food System Toolkit Assessing and planning sustainable city region food systems
225
Tool/Example:
Focus group discussions
Author(s): FAO Project: FAO Food for the Cities Introduction to the joint programme This tool is part of the City Region Food Systems (CRFS) toolkit to assess and plan sustainable city region food systems. The toolkit has been developed by FAO, RUAF Foundation and Wilfrid Laurier University with the financial support of the German Federal Ministry of Food and Agriculture and the Daniel and Nina Carasso Foundation. Link to programme website and toolbox http://www.fao.org/in-action/food-for-cities-programme/overview/what-we-do/en/ http://www.fao.org/in-action/food-for-cities-programme/toolkit/introduction/en/ http://www.ruaf.org/projects/developing-tools-mapping-and-assessing-sustainable-city-region-food-systems-cityfoodtools Tool summary:
Tool description: A focus group discussion (FGD) is qualitative data collection tool. It gathers actors from similar experiences to discuss a specific topic of interest. The group of participants is guided by a moderator (or group facilitator) who introduces topics for discussion and helps the group to participate in a lively discussion. FGD relies on allowing the participants to agree or disagree with each other, providing an insight on the range of opinion and ideas, inconsistencies and variation that exists in a particular community in terms of priorities, experiences and practices. FGDs can be used to explore the meanings of survey findings that cannot be explained statistically, or to collect from scratch different ideas and opinion of various stakeholders on a specific topic. In the CRFS Programme, the focus group discussion (FGD) gathered actors from different Ministries, private sector and civil society groups to gather qualitative information on local CRFS priorities. FGD were also organized with farmers, separating women, men and
Brief description A focus group discussion (FGD) is qualitative data collection tool. It was used in Kitwe and Lusaka (Zambia), to identify local priorities and collect data on food production and consumption patterns.
Expected outcome Collection of qualitative primary data.
Expected Output Qualitative data and variety of opinion on particular topic.
Scale of application City region (municipal, district, province)
Expertise required for application
Agronomy/nutrition/value chain/policy depending on the topic discussed. Facilitation skills.
Examples of application
Kitwe and Lusaka (Zambia)
Year of development 2016
References -

City Region Food System Toolkit Assessing and planning sustainable city region food systems
226
youth, to get qualitative data on specific components of the food system. Examples of application Kitwe (Zambia) Three focus group discussions were held, for the 3 different local priorities: agricultural production, food consumption and nutrition, status of environment and natural resources degradation. Terms of reference The maximum discussion time was 1 hour using the question checklist provided under each thematic area (case study). Each case study was handled by a facilitator and recorder in a breakaway. Each group constituted a maximum of 15 respondents due to the diverse of the topics being discussed. The minutes of the FDGs supplemented the findings from the primary data collection and review of policies, strategies and other documentation. Discussion guide and targeted audience
Case Study #1: Agricultural Production: land availability, access and tenure; competition between urban development and agriculture; production and productivity issues
Discussion topics
Land availability for agricultural purposes in the city region.
Difficulties are faced in land acquisition by farmers.
Land distribution by gender.
Effect of competition between urban developments and other land uses (e.g.
mining), and agricultural land on food production and smallholder livelihoods.
Who feeds the city region.
Sources of the food that is consumed in the city region.
Ability of the city region to feed itself in times of crises- floods, droughts, and
animal/plant disease.
Target
Councils (Ndola, Mufulira, Chingola, Masaiti, Kitwe)
Ministry of Agriculture
Civil Society (ZLA, ZNFU, WVI)
Forestry Dept
Fisheries Dept
Ministry of Lands
Chamber of Commerce
1x Livestock & livestock products producer (Golden Lay/Zambeef).

City Region Food System Toolkit Assessing and planning sustainable city region food systems
227
Case Study #2: Food consumption and nutrition at City Region level
Discussion topics
Causes and drivers of food insecurity and malnutrition.
Physical access to the markets for the dwellers.
Where do people buy their food (vegetables, meat, fish, milk, eggs, fruits: bananas/mangoes/oranges).
Affordability of food (vegetables, meat, fish, milk, eggs, fruits: bananas/mangoes/oranges).
Quality and diversity of the food available.
Seasonal availability of diverse food item (vegetables, meat, fish, milk, eggs, fruits: bananas/mangoes/oranges).
Quality of food in terms of safety and nutritional value (vegetables, meat, fish, milk, eggs, fruits: bananas/mangoes/oranges).
Knowledge and awareness on sustainable and healthy diets. Target
Community Development/Social Welfare dept.
Ministry of Health
WVI
ZNFU
Marketeer representative (NATMAZ)
Councils (Ndola, Mufulira, Chingola, Masaiti, Kitwe)
Livestock & livestock products producers (Golden Lay/Zambeef)
Fisheries dept.
Ministry of Agriculture
Case Study #3: Status of environment and natural resources degradation Discussion topics
Implications of unsustainable practices and other activities (e.g. mining; unsustainable agriculture) on main natural resources, soil, water and forests, and on food production.
NR legislation support to agriculture practices.
Existing state of the environment and natural resources (land, water, air, forests, biodiversity).
Effect of population growth on food production & the environment. Target
Water utility (CopWaste, Nkana Water, Mulonga Water, etc)
Water Board/Affairs
Forestry dept.
ZEMA
ZLA (i.e. KDLA)

City Region Food System Toolkit Assessing and planning sustainable city region food systems
228
Councils (Ndola, Mufulira, Chingola, Masaiti, Kitwe)
Livestock & livestock products producers (Golden Lay/Zambeef/agro-Trader)
Fisheries dept.
Ministry of Agriculture
Lands
Mining company Lusaka (Zambia) Three series of focus group discussions were held, for the 3 different local priorities: agricultural production (farmers and farmers organizations), food supply/processing/distribution (businesses), and consumption and food security (consumers). Terms of reference For each of the 3 priorities, three FGD comprising twelve (12) members were organized and conducted. To take care of gender, one FGD comprised only males and the other comprised females. The last FGD was with youth (age from 18 years to 25 years). Discussion guides
#1: Agricultural production
Let’s start by stating whether land for food production can be accessed and the steps involved in accessing it.
List the various avenues of accessing land form food productions.- probe into customary versus titled land, size of land holdings.
Let’s also list the categories of vegetables, meat, fish and fruits in your community. (Probe to include community-level organizations not just industry.)
Where is the food produced in this community sold? What is your level of involvement with the local food system? (Probe- e.g. sold in Lusaka, at local outlets or in open air markets.)
What types of production methods do you use (Probe for crop rotations, organic, use of fertilizers and pesticides).
Do you think that farm workers whether family labour or hired labour adhere to occupational safety (probe to include protective clothing, disposal of chemical containers, availability of toilets/change rooms at farm)
Do you think there is that the level of food waste is at acceptable levels? How are products that have gone to waste handled?
Are farmers in this area aware of climate change ( Probe use of CSA practices e.g. conservation farming, water harvesting)
What changes can you suggest that would improve the sustainability of the local food production system?
#2: Food supply, processing and distribution
Let’s start by listing where the food consumed in Lusaka CRFS comes from?

City Region Food System Toolkit Assessing and planning sustainable city region food systems
229
Let’s also list all the local food producers, processors, and distributors in the community. (Probe to include community-level organizations not just industry.)
What is your involvement with the local food system? (Probe for selling food through it, buying food through it, providing financial or other organizational support.)
What types of resources exist to help make locally produced food available to the community?(Probe for direct marketing outlets [such as farmers’ markets, roadside stands, pick-your-owns] and contract sales to local food stores, restaurants, schools, colleges, hospitals, or prisons and CSA programs.)
Do you think there is local government support for community efforts such as farmers’ markets, community-supported agriculture, community gardens, etc.? By this I mean political and economic support?
What is the role of the middle men in the food chain?
How are food losses and waste handled throughout the value chain?
What are the major barriers to making the community food system as successful as possible?
What changes can you suggest that would improve the local food system?
#3: Consumption, food security and nutrition
Let’s start by listing the most consumed commodities in the CRFS in terms of meat products, dairy, fruits, vegetables and staples (food demand)?
What is the nutritional and food security status of the CRFS’s dwellers?
What are the different diets existing by social, economic and cultural groups?
What are the drivers for food insecurity and malnutrition?
Can they access food produced in the city region and where?
How can city region food security, availability, safety, appropriateness, utilization and transparency be enhanced?

City Region Food System Toolkit Assessing and planning sustainable city region food systems
230
Tool/Example:
Key informant interviews
Author(s): FAO Project: FAO Food for the Cities programme Introduction to the joint programme This tool is part of the City Region Food Systems (CRFS) toolkit to assess and plan sustainable city region food systems. The toolkit has been developed by FAO, RUAF Foundation and Wilfrid Laurier University with the financial support of the German Federal Ministry of Food and Agriculture and the Daniel and Nina Carasso Foundation. Link to programme website and toolbox http://www.fao.org/in-action/food-for-cities-programme/overview/what-we-do/en/ http://www.fao.org/in-action/food-for-cities-programme/toolkit/introduction/en/ http://www.ruaf.org/projects/developing-tools-mapping-and-assessing-sustainable-city-region-food-systems-cityfoodtools Tool summary:
Tool description: To assess the CRFS and specific indicators, different tools can be used to collect data: questionnaire surveys (quantitative data), focus group discussions and key informant interviews (qualitative data). Key informant interviews, such as focus group discussions, can be used to complement questionnaire survey, get indications and trends on specific topics, when resources and time are not available to conduct a more extensive questionnaire survey, or when the information cannot be characterized by quantitative data.
Brief description This tool helps to obtain non-statistically significant data on a particular topic/component of the food system without conducting a comprehensive quantitative data collection study.
Expected outcome Data collection
Expected Output Qualitative data on particular topic
Scale of application Project level
Expertise required for application
Statistics, agronomy/nutrition/value chain/policy depending on the person interviewed
Examples of application
Kitwe and Lusaka (Zambia); Colombo (Sri Lanka)
Year of development
References -

City Region Food System Toolkit Assessing and planning sustainable city region food systems
231
Examples of application
Kitwe
In Kitwe, key informant interviews were conducted to complement the questionnaire surveys and focus group discussions. Interviews were
conducted to obtain information on the three local priorities identified: agricultural production, food processing supply and distribution system,
environment and natural resources. Interviews were conducted with key actors such as: Ministry of Agriculture (MoA), Ministry of Health (MoH),
city and district councils, farmers’ organizations, Central Statistical Office (CSO), Chamber of Commerce, etc.
The below table display the different interviews conducted for each needed information/area of investigation, and the associated questions
asked.
Case Study/local
priority Areas of work Areas of investigation Target/key informant Questions asked
1. Agricultural production: land availability, access and tenure; competition between urban development and agriculture; production and productivity issues (including retail but outside Kitwe district)
Diversity of Opportunities for Food Production
i1. Product volumes and diversity imported (from outside the city region) compared with product volumes from the city region
CSO/Chamber of Commerce/MoA
i1a. Names of vegetables, fruits, livestock & dairy commodities imported (name_________________; up to 20 answers)
i1b. Quantity of each vegetable, fruit, livestock & dairy commodity that is imported (name______________quantity___________; up to 20 answers)
i1g. Names of livestock products imported (name_______________quantity_________________; up to 10 answers)
i2. Number/type of farms in the city region that use locally grown or other (organic/ecological/ fair-trade) product labels
Councils / MoA / ZLA / Forestry / ZEMA / ZNFU / Water & Sewerage
i2a. Number of farms using locally grown or other products labes (organic/ecological/fair-trade)
i2b. Type of farms using locally grown or other products labes (organic/ecological/fair-trade) (text)
i4. Number/% of farms in the city region with direct sales to consumers; trading direct at markets or selling direct to retailers or caterers
Councils / MoA / ZLA / Forestry / ZEMA / ZNFU / Water & Sewerage
i4a. Number or % of farms with direct sales to consumers
i4b. Number or % of farms trading direct at markets
i4c. Number or % of farms selling direct to retailers
Social Conditions for i6. Number and type/characteristics Councils / MoA / ZLA / i6a. Number of women involved in city region food production

City Region Food System Toolkit Assessing and planning sustainable city region food systems
232
Food Producers of people (differentiate for women, young people and other vulnerable groups) involved in city region food production
Forestry / ZEMA / ZNFU / Water & Sewerage
i6b. Number young people involved in city region food production
i6c. Number other vulnerable groups involved in city region food production
i7. Number of children under age (child labour) employed in city region food production
Councils / MoA / ZLA / Forestry / ZEMA / ZNFU / Water & Sewerage
i7a. Number of children employed in input supply for food production in city region
i7b. Number of children employed in farm activities for food production in city region
Economic Value of Food Production Sector in the City Regio
i10. Number (or percentage) of farms (farm types) in the city region (economic vitality) for different food products
CSO/Chamber of Commerce/MoA
i10a. Number or percentage of farm types that produce each commodity (number)
i10c. What is the size of farms that produce each commodity (number in acres)
Councils / MoA / ZLA / Forestry / ZEMA / ZNFU / Water & Sewerage
i10a. Number or percentage of farm types that produce each commodity
i10c. What is the size of farms that produce each commodity (number in acres)
Status of Natural Resource Management
i21. Total surface areas (current and potentially available currently unfarmed) of urban and peri-urban and rural agriculture land within the city region
Councils / MoA / ZLA / Forestry / ZEMA / ZNFU / Water & Sewerage
i21a. Total surface areas currently unfarmed of urban and peri-urban and rural agriculture land within the region (number in acres)
i21b. Total surface areas currently unfarmed of peri-urban land within the region (number in acres)
i21c. Total surface areas currently unfarmed rural agriculture land within the region (number in acres)
i21d. Total surface areas potentially available currently unfarmed of urban land within the region (number in acres)
i21e. Total surface areas potentially available currently unfarmed peri-urban land within the region (number in acres)
i21d. Total surface areas potentially available currently unfarmed rural agriculture land within the region (number in acres)
i32. Status of natural biodiversity in the city region
Councils / MoA / ZLA / Forestry / ZEMA / ZNFU / Water & Sewerage
i32a. What is the status of natural biodiversity in the city region (intact/degraded/unknown)
i32b. What drives the change in the status of natural biodiversity in the city region (farming/mining/settlements/
i32c. Who manages the natural biodiversity in the city region (text)
Levels of Vulnerability and Conditions for Increasing Resilience
i44. Percentage of self- reliance (for the city region) in consumption of food by weight for specific product/prioritised food basket/total nutritional requirements or total consumption (possibly transform this also in food expenditures using average food
Councils / MoA / ZLA / Forestry / ZEMA / ZNFU / Water & Sewerage
i44a. Percentage of commodity produced and consumed within the region out of total available

City Region Food System Toolkit Assessing and planning sustainable city region food systems
233
price data)
i47. Availability and accessibility of Urban agriculture/community gardens to all residents within the city region; especially of low-income
Councils / MoA / ZLA / Forestry / ZEMA / ZNFU / Water & Sewerage
i47a. How much land is available of urban agriculture/community gardens to all residents within the city region for low-income groups (number or %)
i47b. How accessible is land available of urban agriculture/community gardens to all residents within the city region for low-income groups (accessible/inaccessible/unknown)
i49. Potential for increase in decent employment and income opportunities (multiplier effect) in city region food production and input supply
CSO/Chamber of Commerce/MoA
i49a. What is the potential for increase in decent employment (multiplier effect) in food production and input supply (number in % increase)
i49b. What is the potential for increase in income opportunities (multiplier effect) in food production and input supply (number in % increase)
Councils / MoA / ZLA / Forestry / ZEMA / ZNFU / Water & Sewerage
i49a. What is the potential for increase in decent employment (multiplier effect) in food production and input supply (% increase)
i49b. What is the potential for increase in income opportunities (multiplier effect) in food production and input supply (% increase)
i50. Extent to which production practices favour efficient use of abiotic resources (land/soil; water; nutrients)
Councils / MoA / ZLA / Forestry / ZEMA / ZNFU / Water & Sewerage
i50a. Extent to which production practices favour efficient use of land (high/medium/low/unknown)
i50b. Extent to which production practices favour efficient use of water (high/medium/low/unknown)
i50c. Extent to which production practices favour efficient use of soil fertility/nutrients (high/medium/low/unknown)
i52. Degree to which livestock feed is produced within the city region (% of self-reliance in fodder production)
Councils / MoA / ZLA / Forestry / ZEMA / ZNFU / Water & Sewerage
i52a. Where is feed for livestock type obtained/bought from? (name of feed___________source___________)
i52b. How much does a kilogram of feed category cost? (name of feed_______________price/Kg________)
i521a. Mention commodities that are produced on the facility (text - up to 20 answers)
i521b. Where do you obtain/purchase your seed for each of the commodity? (text - up to 20 answers)
i521c. How much does (a Kg or packet of 500g) seed cost for each commodity? (name________________cost/Kg___________; 20 answers)
i521d. What fertilisers do you use for each of the crops you produce? (name___________fertiliser_____________; 15 answers)
i521e. Where do you obtain/purchase your fertiliser from? (text - up to 15 answers)
i521f1. How much does a kilogram or 50 Kg bag of top dressing fertiliser cost? (fertiliser_________________cost/50Kg______________; up to 5 answers)
i521f2. How much does a kilogram or 50 Kg bag of basal fertiliser cost?

City Region Food System Toolkit Assessing and planning sustainable city region food systems
234
(fertiliser_________________cost/50Kg______________; up to 5 answers)
i521g. Where do you obtain your farm equipment from? (equipment______________source__________________; up to 10 answers)
i521h. What is the total cost of equipment required to produce each commodity that you produce? (commodity_____________equipment cost___________; up to 20 answers)
2. Food processing, supply and distribution system (including consumption & nutrition but outside Kitwe district)
Presence and Impact of Related Policy
I77. Compliance with food safety regulations and regular inspections related to food storage and processing in the city region
CSO / Chamber of Commerce / MoA / MoH / Councils
I77a. Compliance with food safety regulations related to food storage in the city region (high/medium/low/unknown)
I77b. Compliance with food safety regulations related to food processing in the city region (high/medium/low/unknown)
I77c. Compliance with regular inspections of food storage facilities in the city region (high/medium/low/unknown)
I77d. Compliance with regular inspections of food processing facilities in the city region (high/medium/low/unknown)
Levels of Vulnerability and Conditions for Increasing Resilience
i81. Potential for increase in decent employment and income opportunities (multiplier effect) in city region food wholesale and distribution
CSO / Chamber of Commerce / MoA / MoH / Councils
i81a. Potential for increase in decent employment opportunities (multiplier effect) in city region food storage (high/medium/low/unknown)
i81b. Potential for increase in income opportunities (multiplier effect) in city region food storage (high/medium/low/unknown)
i81c. Potential for increase in decent employment opportunities (multiplier effect) in city region food processing and manufacturing (high/medium/low/unknown)
i81d. Potential for increase in income opportunities (multiplier effect) in city region food processing and manufacturing
Diversity of Opportunities for Food Wholesaler and Distribution Businesses
i83. Number, type and geographic spread of food wholesale/distribution points in the city region (for different products)
CSO / Chamber of Commerce / MoA / MoH / Councils
i83a. Number and type of wholesale and distribution points in the city region for each commodity (category_____________number___________; up to 5 answers)
i83b. Number and type of commodity wholesale points in the city region (category_____________number___________; up to 5 answers)
i83c. Number and type of commodity distribution points in the city region(category_____________number___________; up to 5 answers)
i83d. Geographic spread of of commodity wholesale and distribution points in the city region (mapping of location: georeferencing)
Economic Conditions for Food Wholesale and Distribution Workers
i92. Infrastructure needs for improved city region wholesale and distribution businesses efficiency
CSO / Chamber of Commerce / MoA / MoH / Councils
i92e. State of existing wholesale and distribution infrastructure (i.e. excellent, good, poor, not existing, unknown)
Levels of Vulnerability and Conditions for Increasing Resilience
i104. Transport efficiency: Current and potential use of food transport and storage in city region with low energy use / more optimised distribution – reduction of transport distance and emissions
CSO / Chamber of Commerce / MoA / MoH / Councils
i104a. Current use of food transport in city region with low energy use (high/medium/low/unknown)
i104b. Potential use of food transport in city region with low energy use (high/medium/low/unknown)
i104c. Current use of food transport in city region with more optimised distribution – reduction of transport distance and emissions (high/medium/low/unknown)
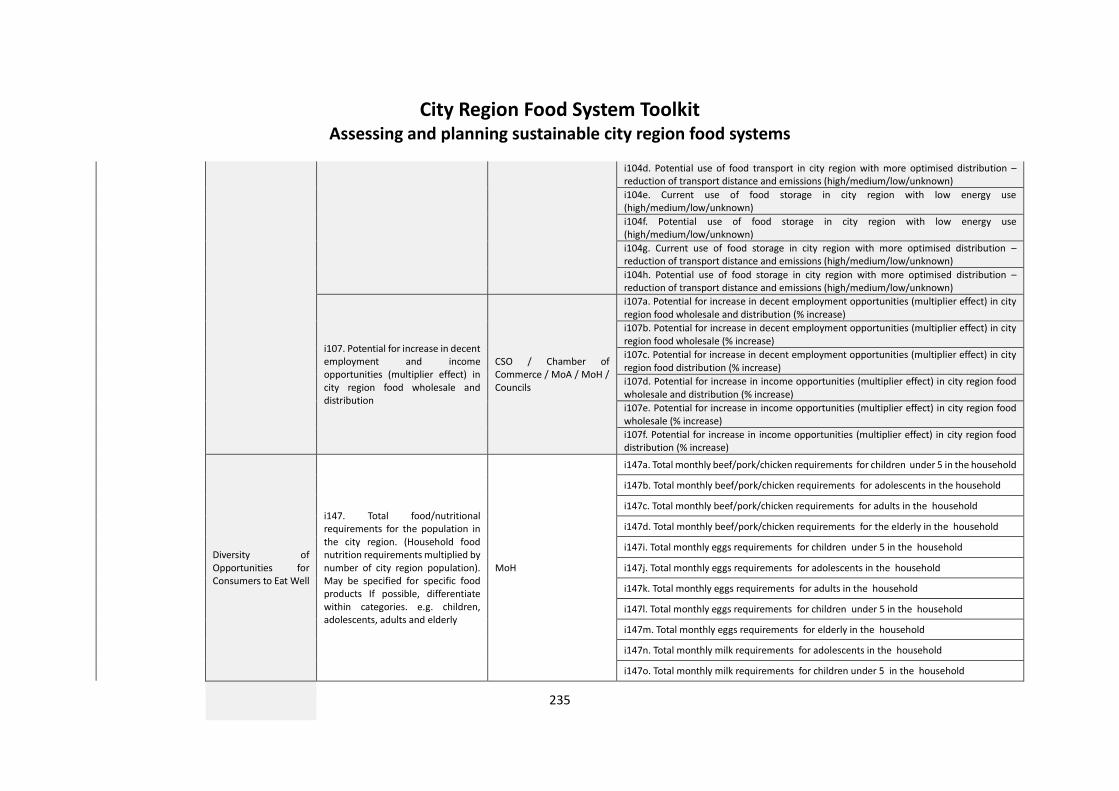
City Region Food System Toolkit Assessing and planning sustainable city region food systems
235
i104d. Potential use of food transport in city region with more optimised distribution – reduction of transport distance and emissions (high/medium/low/unknown)
i104e. Current use of food storage in city region with low energy use (high/medium/low/unknown)
i104f. Potential use of food storage in city region with low energy use (high/medium/low/unknown)
i104g. Current use of food storage in city region with more optimised distribution – reduction of transport distance and emissions (high/medium/low/unknown)
i104h. Potential use of food storage in city region with more optimised distribution – reduction of transport distance and emissions (high/medium/low/unknown)
i107. Potential for increase in decent employment and income opportunities (multiplier effect) in city region food wholesale and distribution
CSO / Chamber of Commerce / MoA / MoH / Councils
i107a. Potential for increase in decent employment opportunities (multiplier effect) in city region food wholesale and distribution (% increase)
i107b. Potential for increase in decent employment opportunities (multiplier effect) in city region food wholesale (% increase)
i107c. Potential for increase in decent employment opportunities (multiplier effect) in city region food distribution (% increase)
i107d. Potential for increase in income opportunities (multiplier effect) in city region food wholesale and distribution (% increase)
i107e. Potential for increase in income opportunities (multiplier effect) in city region food wholesale (% increase)
i107f. Potential for increase in income opportunities (multiplier effect) in city region food distribution (% increase)
Diversity of Opportunities for Consumers to Eat Well
i147. Total food/nutritional requirements for the population in the city region. (Household food nutrition requirements multiplied by number of city region population). May be specified for specific food products If possible, differentiate within categories. e.g. children, adolescents, adults and elderly
MoH
i147a. Total monthly beef/pork/chicken requirements for children under 5 in the household
i147b. Total monthly beef/pork/chicken requirements for adolescents in the household
i147c. Total monthly beef/pork/chicken requirements for adults in the household
i147d. Total monthly beef/pork/chicken requirements for the elderly in the household
i147i. Total monthly eggs requirements for children under 5 in the household
i147j. Total monthly eggs requirements for adolescents in the household
i147k. Total monthly eggs requirements for adults in the household
i147l. Total monthly eggs requirements for children under 5 in the household
i147m. Total monthly eggs requirements for elderly in the household
i147n. Total monthly milk requirements for adolescents in the household
i147o. Total monthly milk requirements for children under 5 in the household

City Region Food System Toolkit Assessing and planning sustainable city region food systems
236
i147p. Total monthly milk requirements for adults in the household
i147q. Total monthly milk requirements for elderly in the household
i147r. Total monthly vegetable requirements for children under 5 in the household
i147s. Total monthly vegetable requirements for adolescents in the household
i147t. Total monthly vegetable requirements for adults in the household
i147u. Total monthly vegetable requirements for elderly in the household
i147v. Total monthly fruit requirements for children under 5 in the household
i147w. Total monthly fruit requirements for adolescents in the household
i147x. Total monthly fruit requirements for adults in the household
i147y. Total monthly fruit requirements for elderly in the household
i147z. Total monthly fish requirements for children under 5 in the household
i147za. Total monthly fish requirements for adolescents in the household
i147zb. Total monthly fish requirements for adults in the household
i147zc. Total monthly fish requirements for elderly in the household
Social Conditions for Consumers
i155. Availability of household facilitates for storage of food and of energy sources for cooking for different consumers in different areas of the city region
CSO / Chamber of Commerce / MoA / MoH / Councils
i155a. Are there household facilitates for storage of food in low cost areas of the city region (yes, no, unknown)
i155b. Are there household facilitates for storage of food in medium cost areas of the city region (yes, no, unknown)
i155c. Are there household facilitates for storage of food in high cost areas of the city region (yes, no, unknown)
i153. Food choice: percentage of city region population (per wealth class; children) eating more than 5 fruits and vegetables a day/ Average intake of fruits and vegetables for different types of consumers
MoH
i153a. What % of children under 5 eat more than 5 fruits a day in low income areas
i153b. What % of children under 5 eat more than 5 fruits a day in middle income areas
i153c. What % of children under 5 eat more than 5 fruits a day in high income areas
i153d. What % of adults eat more than 5 fruits a day in low income areas
i153e. What % of adults eat more than 5 fruits a day in middle income areas
i153f. What % of adults eat more than 5 fruits a day in high income areas
i153g. What % of children under 5 eat vegetables a day in low income areas

City Region Food System Toolkit Assessing and planning sustainable city region food systems
237
i153h. What % of children under 5 eat vegetables a day in middle income areas
i153i. What % of children under 5 eat vegetables a day in high income areas
i153j. What % of adults eat vegetables a day in low income areas
i153k. What % of adults eat vegetables a day in middle income areas
i153l. What % of adults eat vegetables a day in high income areas
i153m. What % of children under 5 eat meat a day in low income areas
i153n. What % of children under 5 eat meat a day in middle income areas
i153o. What % of children under 5 eat meat a day in high income areas
i153p. What % of adults eat meat a day in low income areas
i153q. What % of adults eat vegetables a day in middle income areas
i153r. What % of adults eat vegetables a day in high income areas
Presence and Impact of Related Policy
i169. Presence of consumer skills/training cooking programmes (e.g. how to cook from scratch; this also implies knowledge regarding preparation and cultural role )
CSO / Chamber of Commerce / MoA / MoH / Councils
i169a. Are there local training programs in cooking or food preparation (yes, no, unknown)
CopWaste / Water & Sewerage / NATMAZ / Traders / Marketers
i169a. Are there local training programs in cooking or food preparation (yes, no, unknown)
Status of Food Waste Management Approaches
i182. Volumes of wasted food used directly for human consumption e.g. by food banks/soup kitchens in the city region
CSO / Chamber of Commerce / MoA / MoH / Councils
i182a. What is the quantity of wasted food from markets (number in tons or %)
i182b. What is the quantity of wasted food from processing (number in tons or %)
i182c. What is the quantity of wasted food from retail & catering (number in tons or %)
i182d. What is the quantity of wasted food from household consumption (number in tons or %)
CopWaste / Water & Sewerage / NATMAZ / Traders / Marketers
i182a. What is the quantity of wasted food from markets (number in tons or %)
i182b. What is the quantity of wasted food from processing (number in tons or %)
i182c. What is the quantity of wasted food from retail & catering (number in tons or %)
i182d. What is the quantity of wasted food from household consumption (number in tons or %)
3. Status of environment and
Status of Natural Resource
i28. Pressure on water resources within the city region/ Water use
CopWaste / Councils / Water & Sewerage / MoA,
i28a. Piped water use (limitations) in production in urban areas: agricultural water withdrawal/renewable water resources (high, low, unknown)

City Region Food System Toolkit Assessing and planning sustainable city region food systems
238
natural resources degradation
Management (limitations) and competition: agricultural water withdrawal/renewable water resources
/ ZNFU / Water Affairs i28b. Piped water use (limitations) in production in peri-urban areas: agricultural water withdrawal/renewable water resources (high, low, unknown)
i28c. Limitations for piped water use in urban areas: agricultural water withdrawal/renewable water resources (Hours/week_____________; Hours/day____________)
i28d. Limitations for piped water use in peri-urban areas: agricultural water withdrawal/renewable water resources (Hours/week; Hours/day)
i28e. Sources of non-piped water use in food production in urban areas: agricultural water withdrawal/renewable water resources (dug wells away from garden; dug wells within garden; boreholes; stream/river; rainfed, sewer water)
i28f. Sources of non-piped water use in food production in peri-urban areas: agricultural water withdrawal/renewable water resources (dug wells away from garden; dug wells within garden; boreholes; stream/river; rainfed; sewer water)
i28g. Sources of non-piped water use in food production in rural areas: agricultural water withdrawal/renewable water resources (dug wells away from garden; dug wells within garden; boreholes; stream/river; rainfed; sewer water)
i28h. Cost of piped water use in food production in urban areas: agricultural water withdrawal/renewable water resources (number)
i28i. Cost of piped water use in food production in peri-urban areas: agricultural water withdrawal/renewable water resources (number)
i32. Status of natural biodiversity in the city region
MoA / Forestry / ZNFU / ZLA / ZEMA / Councils
i32a. What is the status of natural biodiversity in the city region (intact/degraded/unknown)
i32b. What drives the change in the status of natural biodiversity in the city region (text)
i32c. Who manages the natural biodiversity in the city region (text)
i32d. Do NR legislation and policies support sustainable agriculture practices? (No/Yes)

City Region Food System Toolkit Assessing and planning sustainable city region food systems
239
Lusaka
Sustainable Production, Resilience of Production Systems
The aim here is to map and characterize production of key commodities (vegetables, fruits, beef, dairy, pork, fish and poultry). Specifically, it aims
at assessing constraints affecting productivity, production and access to markets of key products and the implication of farming practices on the
environment.
Different key informants’ interviews were conducted, to collect qualitative data on 7 thematic areas:
MAIN CATEGORY INTERVIEW GUIDING QUESTIONS SOURCE OF INFORMATION
1. Access to land and adequacy of food production
1. Where does the food consumed in Lusaka CRFS come from? 2. How much is produced locally in the city region? 3. What is the potential of the City Region to feed itself, can it produce enough food for itself? 4. Is land for there enough land for agricultural purposes (food production)? Is it easy to acquire land for agricultural purposes in the city region 5. To what extent does competition between urban development and other land uses e.g. residential affect production by farmers?
Ministry of Agriculture, Ministry of Lands, Zambia Land Alliance, Farmer Organizations, DACOs, Councils, NGOs Lead farmers
2. Type of products 1. What are the key products (vegetables, fruits, poultry, meats) are produced and consumed in city Region? 2. Who are the main producers of these products stated in 1? Who are the other stakeholders in production, marketing, distribution and retailing? 3. Can the city region attain agricultural diversification 4. Can the products be expanded and diversified?
Ministry of Agriculture, Farmer organisations, DACOs, and NGOs Lead Farmers
3. Food production methods 1. Where are inputs sourced from for the food production? 2. What type of inputs are used in crop production (e.g. fertilizers, pesticides, etc) 3. What type of supplements are used as animal feed? 4. Do the farmers use any form of soil conservation measures to protect their land(e.g. rotations, management of farm residues)
Lead Farmers, Ministry of Agriculture, Farmer Organizations, DACOs
4. Food distribution along value chain
1. Where do the farmers sell their produce? 2. Are there adequate selling points or outlets locally?
DACOs, wholesalers, retailers, processors, distributors, Cooperatives, MAL

City Region Food System Toolkit Assessing and planning sustainable city region food systems
240
3. Is there any value addition at the time of sale? 4. How would you compare the level of demand where the food is produced to that in Lusaka City? 5. What about transportation infrastructure to markets as well as input distribution-is it adequate?
5. Management of production waste
1. What kinds of waste are generated by most farmers in the City Region? 2. How is the production waste managed? 3. Do they use some of the waste in making compost/organic manure?
Councils, Lead Farmers, MAL, DACOs,
6. Occupational health and safety
1. Do farmers and their workers adhere to use of protective clothing? 2. Are they aware and do they implement safety measures in the disposal of expired chemicals and chemical containers? 3. What sanitation and hygiene measures are in place during production?
ZEMA, MAL, Farmer Organizations, DACOs
7. Resilience of production systems (climate change adaptation/mitigation, renewable energy
1. To what extent do policies and legislation support sustainable agriculture? 2. What is the effect of population growth on food production and environment? 3. Can the City Region be able to feed itself in times of disaster/crises (drought, floods, livestock disease outbreak? 4. What are the implications of unsustainable agricultural practices on soil, water, forests and water on food production? 5. What is the general overview of the impact of climate shocks on farming
MAL, FAO, CFU, Farmer Organizations, DACOs
Food Processing, Supply and Distribution System
The aim here is to characterize the value chain of the main perishable food commodities that are produced and consumed in Lusaka CRFS.
Specifically it aims at characterizing the flows of different commodities from the farm to the retail market and catering, and assessing issues of
economic and social sustainability economic efficiency, employment, inclusiveness, food waste and losses.
Different key informants’ interviews were conducted, to collect qualitative data on 7 thematic areas:
MAIN CATEGORY INTERVIEW GUIDING QUESTIONS SOURCE OF INFORMATION
1. Food flow for the main commodities
1. Where is the food consumed in Lusaka CRFS comes from? 2. what Commodities are produced and consumed 3. Who are the main stakeholders in production, marketing, distribution and retailing?
1. MoA, Ministry of Commerce, and CSO 2. CSO, farmer organisations, traders association, distributors, DACOs, LCC, CSO and NGOs.
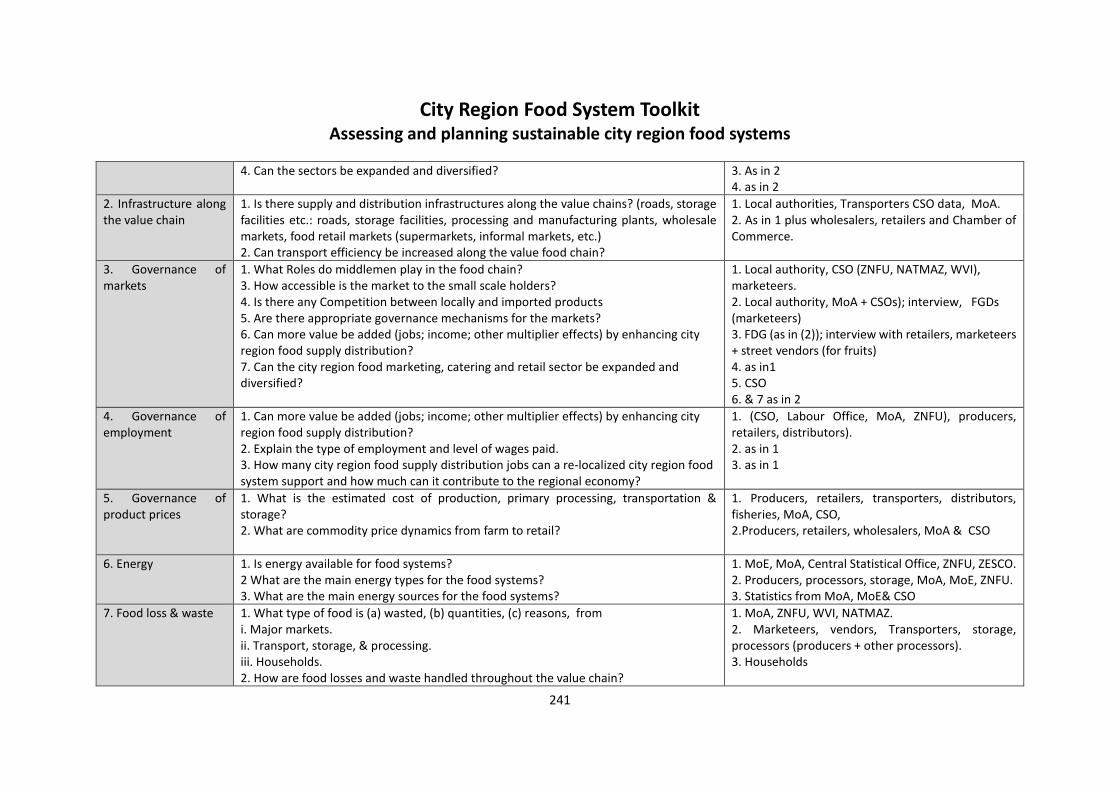
City Region Food System Toolkit Assessing and planning sustainable city region food systems
241
4. Can the sectors be expanded and diversified?
3. As in 2 4. as in 2
2. Infrastructure along the value chain
1. Is there supply and distribution infrastructures along the value chains? (roads, storage facilities etc.: roads, storage facilities, processing and manufacturing plants, wholesale markets, food retail markets (supermarkets, informal markets, etc.) 2. Can transport efficiency be increased along the value food chain?
1. Local authorities, Transporters CSO data, MoA. 2. As in 1 plus wholesalers, retailers and Chamber of Commerce.
3. Governance of markets
1. What Roles do middlemen play in the food chain? 3. How accessible is the market to the small scale holders? 4. Is there any Competition between locally and imported products 5. Are there appropriate governance mechanisms for the markets? 6. Can more value be added (jobs; income; other multiplier effects) by enhancing city region food supply distribution? 7. Can the city region food marketing, catering and retail sector be expanded and diversified?
1. Local authority, CSO (ZNFU, NATMAZ, WVI), marketeers. 2. Local authority, MoA + CSOs); interview, FGDs (marketeers) 3. FDG (as in (2)); interview with retailers, marketeers + street vendors (for fruits) 4. as in1 5. CSO 6. & 7 as in 2
4. Governance of employment
1. Can more value be added (jobs; income; other multiplier effects) by enhancing city region food supply distribution? 2. Explain the type of employment and level of wages paid. 3. How many city region food supply distribution jobs can a re-localized city region food system support and how much can it contribute to the regional economy?
1. (CSO, Labour Office, MoA, ZNFU), producers, retailers, distributors). 2. as in 1 3. as in 1
5. Governance of product prices
1. What is the estimated cost of production, primary processing, transportation & storage? 2. What are commodity price dynamics from farm to retail?
1. Producers, retailers, transporters, distributors, fisheries, MoA, CSO, 2.Producers, retailers, wholesalers, MoA & CSO
6. Energy 1. Is energy available for food systems? 2 What are the main energy types for the food systems? 3. What are the main energy sources for the food systems?
1. MoE, MoA, Central Statistical Office, ZNFU, ZESCO. 2. Producers, processors, storage, MoA, MoE, ZNFU. 3. Statistics from MoA, MoE& CSO
7. Food loss & waste 1. What type of food is (a) wasted, (b) quantities, (c) reasons, from i. Major markets. ii. Transport, storage, & processing. iii. Households. 2. How are food losses and waste handled throughout the value chain?
1. MoA, ZNFU, WVI, NATMAZ. 2. Marketeers, vendors, Transporters, storage, processors (producers + other processors). 3. Households

City Region Food System Toolkit Assessing and planning sustainable city region food systems
242
3. Is food safety adhered to during handling?
Consumption, Food Security and Nutrition
The aim is to (i) demonstrate link between the CRFS objectives and the individual organization or institutional missions; (ii) review of policies,
programmes that relate to food availability, access, consumption food security and nutrition in the City region.
Different key informants’ interviews were conducted, to collect qualitative data on 4 thematic areas:
Theme Key Questions Key Participants
1. Consumption 1) What do people in the city region eat? 2) Are there any preferences between local and non –regional foods? 3) What are the different diets existing by social, economic and cultural groups? 4) What are the different sources of the food consumed? 5) Are there any preferences between local and non –regional foods? 6) How can city region food security, availability, safety, appropriateness, utilization and
transparency be enhanced?
City and District Council Officials. National Food and Nutrition Commission (NFNC), JCTR MoH, MCDSS, MACO, MLF
2. Nutrition and Food safety
1) What is the extent of obesity and how is it being managed? 2) What are the common food related diseases risks? 3) What polices, codes are there to manage consumption of fast foods? 4) What is the nutritional and food security status of the different CRFS’s dwellers? 5) What are the drivers of food insecurity, and malnutrition?
National Food and Nutrition Commission (NFNC), MoH, JCTR

City Region Food System Toolkit Assessing and planning sustainable city region food systems
243
3. Governance 1) Has Food System Planning been integrated in urban planning and city policy making? 2) What is the spatial correlation between food insecurity and physical/economic access
to food? 3) What policies are there to manage malnutrition, food insecurity for the vulnerable
groups- the existing food safety nets? 4) How effective are food safety regulations? 5) Degree of recognition of rural- urban linkages in food policies and plans.
City and District Council Officials. MoH, MCDSS, MACO, MLF, Market Organization, MLNR
4. Environment and Food waste
1) What is extent of food wastage? 2) How is waste managed? 3) What is the awareness of sustainable diets?
Retail chains (Spar, Pick and Pay and Gamestores. Market Organization

City Region Food System Toolkit Assessing and planning sustainable city region food systems
244
Colombo Some of the data required for qualitative indicators needed to be collected from key informants in various institutions and markets. These indicators require more depth reasoning for the available quantitative evidences, which need to conduct in-depth interviews with the informants. The researchers conducted in-depth interviews to get relevant information from selected experts in the related fields. In-depth interviews were used when, because of geography, logistical issues, or the complex nature of the indicator topics to be explored, conducting focus groups or face-to-face interviews was either impractical or inappropriate. Interviews were conducted with various supply chain stakeholders, and employees from shops, restaurants and eating houses. Key informant Interview Guides
Supply chain members Apart from surveys, few supply chain members including farmers, whole sellers, and commission agents and retailers would interview to get their views on developing sustainable food system in Colombo.
i. Identification of the changes of farming in the locality over the years ii. What are the Impact of climate changes and their impact on their farming practices
iii. What are the problems/issues faced by them iv. What is possibility of reducing harmful practices that create food safety issues? v. What are the possible remedial actions against using harmful chemicals in food
system? vi. How they view their role in food system? Are they satisfied with what they do?
vii. What are the help/assistance needed by them to improve their productivity and efficiency?
viii. What would be the future/ next generation’s involvement in what they do?
Employees of shops/restaurants/eating houses In order to get information for employee sanitation, health and safety, employees of shops/restaurants/eating houses would be interviewed within the following broader framework.
i. Get to know the socio-demographics and Experience in food industry ii. Self-evaluation regarding the food safety maintenance in his/her shop/restaurant
iii. Assessment of sanitation facilities they are having, problems and how it effect on food processing
iv. What are the health and safety measures provided to them v. Whether owner is concern about the health and safety about the employees
vi. What are the needed improvement for provide healthy and safe food to customers

City Region Food System Toolkit Assessing and planning sustainable city region food systems
245
Tool/Example:
Medellin Food Flow Maps
Author(s): FAO-Colombia Project: FAO Food for the Cities programme Introduction to the joint programme This tool is part of the City Region Food Systems (CRFS) toolkit to assess and plan sustainable city region food systems. The toolkit has been developed by FAO, RUAF Foundation and Wilfrid Laurier University with the financial support of the German Federal Ministry of Food and Agriculture and the Daniel and Nina Carasso Foundation. Link to programme website and toolbox http://www.fao.org/in-action/food-for-cities-programme/overview/what-we-do/en/ http://www.fao.org/in-action/food-for-cities-programme/toolkit/introduction/en/ http://www.ruaf.org/projects/developing-tools-mapping-and-assessing-sustainable-city-region-food-systems-cityfoodtools Tool summary:
Tool description: Food flow maps were developed and used to better understand the actual status of food flows within the Medellín CRFS and for the development of proposals for improving food provisioning logistics. Each municipality in the city region assesses how much produce is entering and how much is leaving the municipal territory. By aggregating the figures for individual municipalities, a complete picture of the food flows within the territory of the province of Antioquia was obtained.
Brief description This tool visualises food flows maps in a GIS system Expected outcome Understanding of actual food flows and identification of gaps/opportunities for
improving food provisioning logistics
Expected Output Food flow maps
Scale of application City region
Expertise required for application
GIS mapping
Examples of application
Medellin (Colombia)
Year of development 2016
References
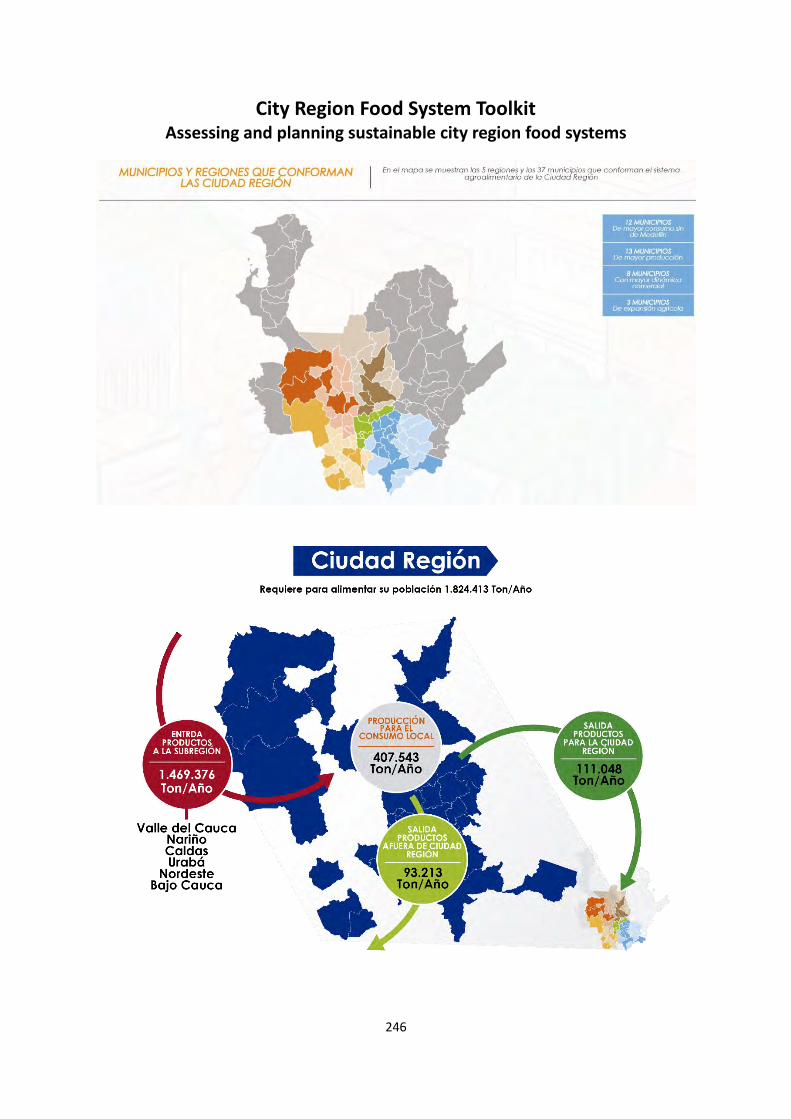
City Region Food System Toolkit Assessing and planning sustainable city region food systems
246

City Region Food System Toolkit Assessing and planning sustainable city region food systems
247

City Region Food System Toolkit Assessing and planning sustainable city region food systems
248

City Region Food System Toolkit Assessing and planning sustainable city region food systems
249
(Source: FAO Colombia-RUAF Sistemas Agroalimentarios Ciudad-Region)

City Region Food System Toolkit Assessing and planning sustainable city region food systems
250
Tool/Example:
Quito’s food supply system
Author(s): CONQUITO, Municipality of Quito (Ecuador) Project: RUAF CityFoodTools project Introduction to the joint programme This tool is part of the City Region Food Systems (CRFS) toolkit to assess and plan sustainable city region food systems. The toolkit has been developed by FAO, RUAF Foundation and Wilfrid Laurier University with the financial support of the German Federal Ministry of Food and Agriculture and the Daniel and Nina Carasso Foundation. Link to programme website and toolbox http://www.fao.org/in-action/food-for-cities-programme/overview/what-we-do/en/ http://www.fao.org/in-action/food-for-cities-programme/toolkit/introduction/en/ http://www.ruaf.org/projects/developing-tools-mapping-and-assessing-sustainable-city-region-food-systems-cityfoodtools Tool summary:
Tool description: The Province of Pichincha is identified as the most appropriate scale of the city region. The three rings in the image identify the degree of self-sufficiency consumption of food for the given territory (ring). It compares total food consumption (by weight) of the population in the given territory for specific products with actual production in that area. Consumption figures are based on household consumption data multiplied by population figures. Production data are based on data from agricultural census. The calculation does not account for any food imports or exports, nor for food losses and waste. The second ring was identified as the city region as it includes key production areas, major food processing industry and allows for cross-jurisdictional planning coordination between the city of Quito, surrounding municipalities and the Province.
Brief description This tool identifies the degree of self-sufficiency consumption of food for different given territories around Quito
Expected outcome Contribution to defining city region boundaries
Expected Output Visualisation of the Quito city region and its level of food consumption self- sufficiency
Scale of application City region
Expertise required for application
GIS skills
Examples of application
Quito (Ecuador)
Year of development 2017
References http://www.ruaf.org/sites/default/files/Brief_Quitov4final.pdf

City Region Food System Toolkit Assessing and planning sustainable city region food systems
251
(Source: CONQUITO, 2017)

City Region Food System Toolkit Assessing and planning sustainable city region food systems
252
Tool/Example:
Utrecht Stakeholder Engagement-Video
Author(s): Food Smart Cities for Development Project: Food Smart Cities for Development Introduction to the joint programme This tool is part of the City Region Food Systems (CRFS) toolkit to assess and plan sustainable city region food systems. The toolkit has been developed by FAO, RUAF Foundation and Wilfrid Laurier University with the financial support of the German Federal Ministry of Food and Agriculture and the Daniel and Nina Carasso Foundation. Link to programme website and toolbox http://www.fao.org/in-action/food-for-cities-programme/overview/what-we-do/en/ http://www.fao.org/in-action/food-for-cities-programme/toolkit/introduction/en/ http://www.ruaf.org/projects/developing-tools-mapping-and-assessing-sustainable-city-region-food-systems-cityfoodtools Tool summary:
Tool description: Stakeholder consultation and network development played an important role in the CRFS assessment in Utrecht. One of the main aims was to renew existing networks with local stakeholders and to establish new network relations with civil society and private sector that so far had been less strongly involved in local food policy processes. Relevant government,
Brief description This video gives an impression of the stakeholder and networking building processes that were set in motion as part of the Utrecht CRFS assessment.
Expected outcome Collection of further information on the key CRFS data gaps and priority issues from different stakeholders, and engagement of stakeholders in preparation of further policy support and planning processes
Expected Output Stakeholder consultations
Scale of application City region
Expertise required for application
Examples of application
Utrecht (The Netherlands)
Year of development 2016
References More information on the “Food Smart Cities for Development” project and stakeholder events organised in the city of Utrecht can be found here:
http://www.milanurbanfoodpolicypact.org/utrecht/# http://www.milanurbanfoodpolicypact.org/2016/07/08/activities-in-utrecht/

City Region Food System Toolkit Assessing and planning sustainable city region food systems
253
civil society and private sector initiatives that could be built on or expanded were identified, as well as new data and information sources. The stakeholder meetings were jointly organised for the European Union-funded “Food Smart Cities for Development” project in which the city of Utrecht participated with 10 other cities across Europe. This video gives a sense of the stakeholder and network processes that were set in motion.
https://www.youtube.com/watch?v=AcTVAKK9Swg

City Region Food System Toolkit Assessing and planning sustainable city region food systems
254
Tool/Example:
Stakeholder Engagement “Diner Pensant”
Author(s): Henk Renting, RUAF Foundation; Juan Zuluaga (FAO) Project: RUAF CityFoodTools project; FAO Food for the Cities programme Introduction to the joint programme This tool is part of the City Region Food Systems (CRFS) toolkit to assess and plan sustainable city region food systems. The toolkit has been developed by FAO, RUAF Foundation and Wilfrid Laurier University with the financial support of the German Federal Ministry of Food and Agriculture and the Daniel and Nina Carasso Foundation. Link to programme website and toolbox http://www.fao.org/in-action/food-for-cities-programme/overview/what-we-do/en/ http://www.fao.org/in-action/food-for-cities-programme/toolkit/introduction/en/ http://www.ruaf.org/projects/developing-tools-mapping-and-assessing-sustainable-city-region-food-systems-cityfoodtools Tool summary:
Tool description: In Medellín and Utrecht a “diner pensant” (“almuerzo sentipensante” in Spanish) was used to engage local stakeholder groups in the development of training and educational activities for strengthening the CRFS. During a “diner pensant” stakeholder discussion is facilitated in an informal dinner setting, and different tastes of dishes are the starting point for discussions. For example “sweet” corresponds to achievements, “salt” or “bitter” to challenges and ambitions, “acid” to obstacles and bottlenecks, and “umami” to the gains that can be reached through cooperation and joint initiatives. The tool is especially useful for topics and situations where differences of interest, opinions or even tensions exist. Creating an informal dinner setting and sharing may open new perspectives for stakeholder collaboration.
Brief description This tool allows for stakeholder engagement and discussions facilitated in an informal dinner setting. It provides the Terms of Reference for the event.
Expected outcome Stakeholder engagement
Expected Output -
Scale of application City region
Expertise required for application
Cooking skills
Examples of application
Medellin (Colombia), Utrecht (The Netherlands)
Year of development 2016
References -

City Region Food System Toolkit Assessing and planning sustainable city region food systems
255
Examples of application
Medellin, Colombia
La educacio n como herramienta para fortalecer sistemas alimentarios territoriales
Conversatorio
ORGANIZACIÓN DE LAS NACIONES UNIDAS PARA LA AGRICULTURA Y LA
ALIMEENTACION (FAO)
RUAF FOUNDATION
UNIVERSIDAD DE ANTIOQUIA
Marzo 10 2017 Casa Olano Universidad de Antioquia
Medellín Colombia
Primer momento: convocación al almuerzo sentipensante Tiempo: 20 minutos
En el salón Juan Zuluaga (FAO) y Henk Renting (RUAF) presentan el encuentro, los objetivos, puntos mínimos de partida y la ruta metodológica a seguir (momentos del encuentro). Breve presentación de cada participante: nombre y organización de la que viene (solamente). Luego se ampliará la información en la tertulia y el almuerzo. OBJETIVO DEL ENCUENTRO
Generar sinergias y alianzas entre diferentes ofertas de educación/capacitación fortaleciendo sistemas alimentarios territoriales desde un enfoque de agroecología, comunidades rurales y agricultura campesina
Explorar y si es posible ponernos de acuerdo sobre criterios comunes y puntos mínimos con respecto a enfoque de educación/formación
Explorar las bases y generar ideas para propuestas conjuntas de colaboración y financiación, entre otras hacia la agenda posconflicto

City Region Food System Toolkit Assessing and planning sustainable city region food systems
256
PUNTOS MÍNIMOS DE PARTIDA CON RESPECTO AL ENFOQUE Formación tiene que estar contextualizada: el objetivo es fortalecer y relacionar a
procesos locales en comunidades. Objetivo de apoyar a agricultura familiar y campesina. Enfocado en modelos de producción sostenibles, es decir agricultura limpia y
agroecológica Espacio para coproducción de conocimiento y procesos innovadores. Más allá de la idea
unidireccional de transmisión de conocimientos. Diálogo de saberes. Reforzar tejidos social, liderazgo, capacidades y asociatividad en zonas rurales. METODOLOGIA Y DINAMICA
"Almuerzo sentipensante" Dejarse sorprender Disponerse a sentipensar
Primer momento: convocación al almuerzo sentipensante
Segundo momento: el alimento pasa por los sentidos
Tercer Momento: sentipensar alimentándonos
Cuarto momento: cosechar ideas nutritivas
Segundo momento: El alimento pasa por los sentidos Tiempo: 30 minutos: 10 minutos para los sentidos + 20 minutos para compartir impresiones y significado del alimento
En mesas tenemos elementos, todos relacionados con los alimentos, Las y los participantes se acomodan en 4 mesas. Hay una persona animadora en cada mesa. Todos con los ojos cerrados, la persona animadora pasa los alimentos para oler, luego para tocar, luego pasa la grabación y después destapa los alimentos a la vista. El olor: guayabas y mangos (ojos cerrados) El tacto: Una guanábana, una chirimoya, arroz, lentejas (ojos cerrados) El sonido: grabación de manos picando plátanos, carne fritándose, manos amasando y
salando carne molida; licuadora, jugo que se pasa de la licuadora a la jarra, platos lavándose
La vista: cesta con frutas, alimento preparado o un cultivo o una fotografía bien provocativa
Comentan sobre las sensaciones: decir una palabra, una impresión, una frase. Ejemplo: alegría, temor, rechazo, etc. Cuál es “el sentido (o significado) del alimento”: una palabra que lo englobe, cada participante la escribe. Animadores: Sonia Irene Cárdenas y Henk Renting Animadores en las mesas: Juan Zuluaga, Hernán Porras, Sonia Irene Cárdenas, Henk Renting
Tercer momento: sentipensar alimentándonos Tiempo: 2 horas

City Region Food System Toolkit Assessing and planning sustainable city region food systems
257
¿CUAL PUEDE SER UN CAMINO CONJUNTO? Intercambiar y documentar experiencias. ¿Qué funciona y cuales son factores de éxito? ¿Cómo escalar las buenas experiencias existentes? Animador: Henk Renting El gusto: Presentación de experiencias y conversación (por organización o iniciativa), según los 5 diferentes sabores
SABORES ALIMENTOS CONVERSACION
1 Dulce: primera entrada
Mangos dulces y miel de abejas Qué hacemos bien, logros
2 Amargo: segunda entrada
Ensalada de rúcula con miel Qué podríamos mejorar, retos
3 Salado y picante: platos principales
Sopa: arracacha con tortilla Seco: posta sudada o muchacho relleno, papas criollas, rabanitos con limón y miel Agua con jengibre
Qué nos inspira, oportunidades
4 Ácido: sobremesa
Jugo de maracuyá endulzado con miel o panela
Qué no nos sale bien, tensiones y conflictos
5 Umami: postre Queso curado y duce de guayaba en panela. El queso lo trae Henk de Holanda
El sabor más complejo, cómo podemos colaborar
Animadores: Sonia Irene Cárdenas: presentación de los sabores y alimentos Henk Renting: tertuliante
Cuarto momento: cosechar ideas nutritivas Tiempo: 1 hora
Ideas en qué podíamos colaborar ¿Cómo generar sinergias entre diferentes iniciativas y niveles (escuelas campesinas,
bachillerato, diplomados, licenciaturas)? ¿Cómo llegar con una oferta conjunta a las instituciones? Animadores: Henk Renting y Juan Zuluaga
Materiales: 25 copias con objetivos del encuentro, puntos de partida y enfoque, y metodología (versión para imprimir a participantes en página siguiente) 25 marcadores 1 Cinta de enmascarar
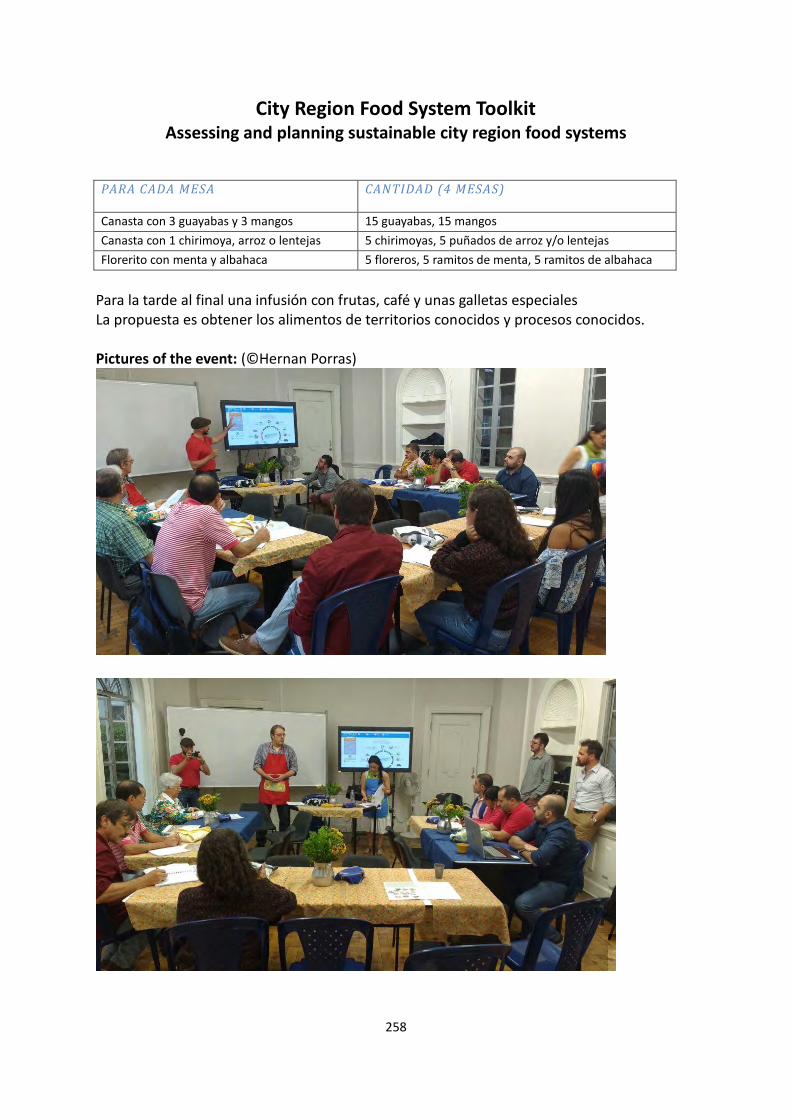
City Region Food System Toolkit Assessing and planning sustainable city region food systems
258
PARA CADA MESA CANTIDAD (4 MESAS)
Canasta con 3 guayabas y 3 mangos 15 guayabas, 15 mangos
Canasta con 1 chirimoya, arroz o lentejas 5 chirimoyas, 5 puñados de arroz y/o lentejas
Florerito con menta y albahaca 5 floreros, 5 ramitos de menta, 5 ramitos de albahaca
Para la tarde al final una infusión con frutas, café y unas galletas especiales La propuesta es obtener los alimentos de territorios conocidos y procesos conocidos. Pictures of the event: (©Hernan Porras)

City Region Food System Toolkit Assessing and planning sustainable city region food systems
259
Utrecht, The Netherlands
Stakeholder meeting: “Diner pensant” about regional food sales in the city: How do you get more local food to more consumers? Date: August 23rd 2016, 14.30 – 17.30 Location: POp Westplein, Utrecht Goals: 1. Explore if there is a need for a joint food agenda. If so, what are common concerns and ideas? 2. Brainstorm on what joint steps can be taken –among different stakeholders- to increase the availability of local and regional food in the city of Utrecht and the surrounding area. 3. Promote mutual communication and collaboration amongst different stakeholders engaged in the regional and local food market in Utrecht and the surrounding area. Background: The "why more local food?" question does not have to be answered. The participants are already engaged and working in this area. Their various reasons for engagement: healthier citizens, green political agenda; environmental education; better producer prices; circular (local) economy; sustainable, beautiful landscapes. This is our starting point and possibly our joint motivation. Target audience: Providers and intermediaries in bringing local food products to consumers. Entrepreneurs and support organisations working on a local food system. Approach: “Diner pensant”, a round table conversation with tasty snacks and drinks. There is a host, a chef cook and about 15 guests. The host (Henk Renting) steers the conversation, asks questions, reflects, but mainly invites the guests to talk and express themselves. The “diner pensant” is designed on the basis of 5 themes and stimulating questions for debate. The chef cook (Serge Calon) is at the table and serves a dish (based on the 5 basic flavours) to the guests. Each dish has relevance to a specific topic. For each topic, one of the guests will act as moderator: he/she will present the theme and provide inspiration for the discussion, for example by sharing examples from his own work. Expected results: Expected results of the “diner pensant” include sharing of knowledge and experience and the emergence of new insights or ideas. In addition, participants get a chance to get to know each other in a different way and strengthen their relationships. The discussions may lead to follow-up questions and desired actions. Invitees: Lekker Utregs, Rechtstreex, Willem & Drees, Local2Local, Cooperative Boerenhart, Green Heart Cooperation, Supermarket, Farmers Market, YFM, Bionext, Vegetable Bag, VOKO. Organisation: City of Utrecht / Food Smart Cities for Development, LEADER, Serge Calon, RUAF Foundation CRFS assessment project.
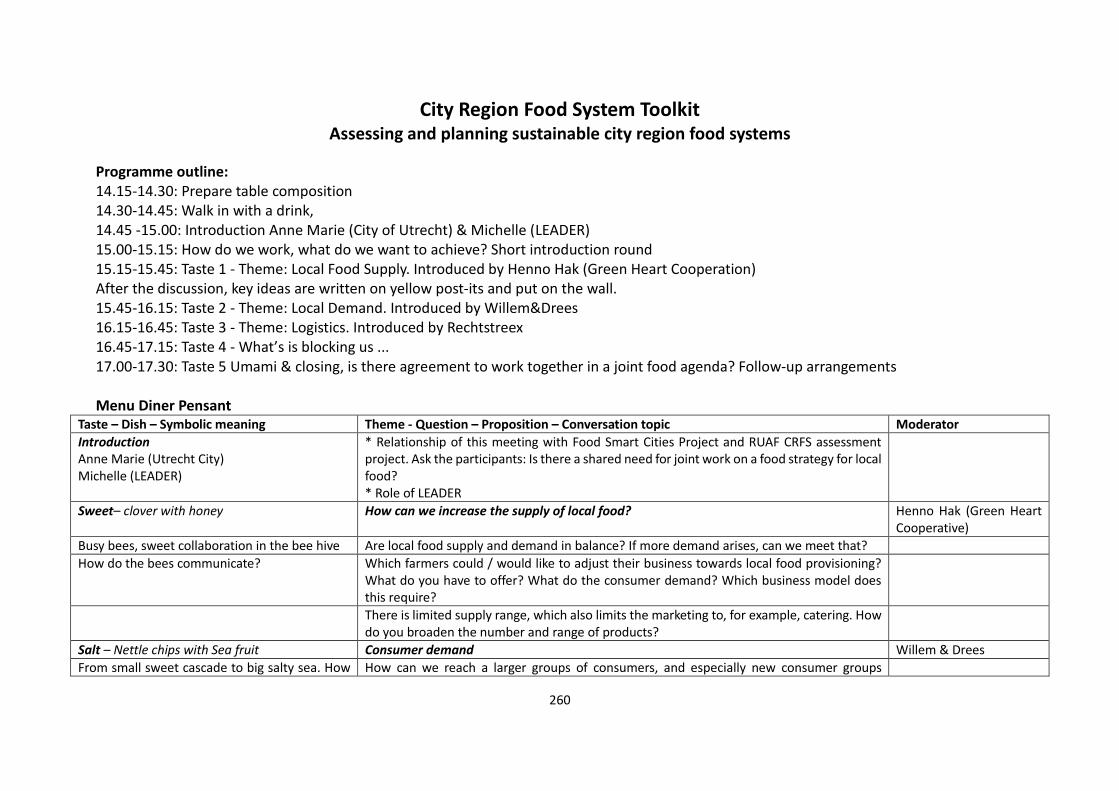
City Region Food System Toolkit Assessing and planning sustainable city region food systems
260
Programme outline: 14.15-14.30: Prepare table composition 14.30-14.45: Walk in with a drink, 14.45 -15.00: Introduction Anne Marie (City of Utrecht) & Michelle (LEADER) 15.00-15.15: How do we work, what do we want to achieve? Short introduction round 15.15-15.45: Taste 1 - Theme: Local Food Supply. Introduced by Henno Hak (Green Heart Cooperation) After the discussion, key ideas are written on yellow post-its and put on the wall. 15.45-16.15: Taste 2 - Theme: Local Demand. Introduced by Willem&Drees 16.15-16.45: Taste 3 - Theme: Logistics. Introduced by Rechtstreex 16.45-17.15: Taste 4 - What’s is blocking us ... 17.00-17.30: Taste 5 Umami & closing, is there agreement to work together in a joint food agenda? Follow-up arrangements Menu Diner Pensant
Taste – Dish – Symbolic meaning Theme - Question – Proposition – Conversation topic Moderator
Introduction Anne Marie (Utrecht City) Michelle (LEADER)
* Relationship of this meeting with Food Smart Cities Project and RUAF CRFS assessment project. Ask the participants: Is there a shared need for joint work on a food strategy for local food? * Role of LEADER
Sweet– clover with honey How can we increase the supply of local food? Henno Hak (Green Heart Cooperative)
Busy bees, sweet collaboration in the bee hive Are local food supply and demand in balance? If more demand arises, can we meet that?
How do the bees communicate? Which farmers could / would like to adjust their business towards local food provisioning? What do you have to offer? What do the consumer demand? Which business model does this require?
There is limited supply range, which also limits the marketing to, for example, catering. How do you broaden the number and range of products?
Salt – Nettle chips with Sea fruit Consumer demand Willem & Drees
From small sweet cascade to big salty sea. How How can we reach a larger groups of consumers, and especially new consumer groups

City Region Food System Toolkit Assessing and planning sustainable city region food systems
261
Taste – Dish – Symbolic meaning Theme - Question – Proposition – Conversation topic Moderator
do we create a larger market? beyond the traditional groups of “green consumers of sustainable and local products”?
Raw nettle is not pleasant to eat. How can we prepare nettle so that it does not sting anymore?
How do you reach specific target groups? For example people suffering from overweight or obesity?
How do you reach the mass population?
Bitter – Bitter field salad (rucola) with sweet dressing, bread with herb butter
Distribution Rechtstreex
How to balance bitter and sweet? How can cooperation on logistics for local and regional products in the Utrecht city region be improved?
Some providers run the same provision routes to the same customers (e.g. catering): can this not be done in a smarter way? Where is the limit between healthy competition, and where does it make sense to cooperate?
Is there a shortage of storage capacity in the city?
Acid – A lemon juice (first without; later with sugar)
What's in our way? And what are the solutions? All
Summary: What are the obstacles, the clashes, the policy obstructions, the competitive struggles, the restrictions on market demand or supply?
We recognise obstacles, but then proceed to identify a potential solution for each obstacle!
Umami – Old cheese Is there a common agenda? Harvest of the yellow post-it notes Henk
The final taste, a new taste. Surprising new insights have been shared and tastes tasted. Now time for some pepper: Action!
Serge / Henk

City Region Food System Toolkit Assessing and planning sustainable city region food systems
262
Tool/Example:
Agri-food Processing Clusters Map
Author(s): Government of Ontario4 Project: RUAF – Wilfrid Laurier CityFoodTools Introduction to the joint programme This tool is part of the City Region Food Systems (CRFS) toolkit to assess and plan sustainable city region food systems. The toolkit has been developed by FAO, RUAF Foundation and Wilfrid Laurier University with the financial support of the German Federal Ministry of Food and Agriculture and the Daniel and Nina Carasso Foundation. Link to programme website and toolbox http://www.fao.org/in-action/food-for-cities-programme/overview/what-we-do/en/ http://www.fao.org/in-action/food-for-cities-programme/toolkit/introduction/en/ http://www.ruaf.org/projects/developing-tools-mapping-and-assessing-sustainable-city-region-food-systems-cityfoodtools Tool summary:
Tool description: The ‘Agri-food processing business cluster in southern Ontario’ map an example of how to display places where processing firms group together. Population density and access to transportation corridors influence the location of these businesses.
4 From the ‘A Global Hub for Food Processing: Agri-Food Asset Map’ Retrieved from
http://www.ontla.on.ca/library/repository/mon/25007/311349.pdf
Brief description The ‘Agri-food processing business cluster in southern Ontario’ map an example of how to display places where processing firms group together.
Expected outcome Improved understanding of where food processing businesses have agglomerated and where resources are concentrated or missing.
Expected Output Map depicting the concentration of food processing businesses.
Scale of application Project level
Expertise required for application
Project management
Examples of application
Toronto and Greater Golden Horseshoe
Year of development 2015
References -

City Region Food System Toolkit Assessing and planning sustainable city region food systems
263
(Source: Government of Ontario)

City Region Food System Toolkit Assessing and planning sustainable city region food systems
264
Tool/Example:
Availability of Essential Numbers
Author(s): Sally Miller, Toronto CRFS Project Coordinator Project: RUAF – Wilfrid Laurier CityFoodTools Introduction to the joint programme This tool is part of the City Region Food Systems (CRFS) toolkit to assess and plan sustainable city region food systems. The toolkit has been developed by FAO, RUAF Foundation and Wilfrid Laurier University with the financial support of the German Federal Ministry of Food and Agriculture and the Daniel and Nina Carasso Foundation. Link to programme website and toolbox http://www.fao.org/in-action/food-for-cities-programme/overview/what-we-do/en/ http://www.fao.org/in-action/food-for-cities-programme/toolkit/introduction/en/ http://www.ruaf.org/projects/developing-tools-mapping-and-assessing-sustainable-city-region-food-systems-cityfoodtools Tool summary:
Tool description: To guide data collection, a CRFS Data Framework was been developed, following the key research questions asked as part of the CRFS scan. It uses a whole food system approach and covers the areas of food production, processing, wholesale and distribution, retail and catering, consumption and waste. It also considers different sustainability dimensions of the CRFS. It gives an extensive overview of relevant data for each of these areas that may help respond to the key questions that help characterising the CRFS. Its aim is not to collect
Brief description This table is an example of how data can be summarized based on the Toronto CRFS project.
Expected outcome More comprehensive understanding of the available data collected along the food chain for sustainability.
Expected Output Table that summarizes available data for a CRFS project.
Scale of application Project level
Expertise required for application
Project management
Examples of application
Toronto and Greater Golden Horseshoe
Year of development 2015
References -

City Region Food System Toolkit Assessing and planning sustainable city region food systems
265
information on all data listed. It rather provides guidance on what data to possibly look for, where to find that data and the type of surveys that could be used to collect information through interviews with key stakeholders to help fill data gaps. Once secondary data sources had been identified the Toronto Research Coordinator developed the ‘GGH_Toronto_PreliminaryEssentialNumbers’ table to assess the availability of data on indicators of relevance for the CRFS characterisation. The table is colour-coded to identify: 1. Indicators with no clear data sources; 2. Indicators with one or more data sources; 3. Critical indicators with one or more data sources; 4. Critical indicators with no data sources; and, 5. Essential (base) numbers. The table below provides an example from Toronto where a comprehensive data set was also used to develop the ‘Availability of Essential Numbers’ table.
Availability of Essential Numbers
Legend 1. Indicator with no clear data source 2. Indicator with one or more data source or public information 3. Indicator that is critical with one or more data sources 4. Indicator that is critical and has no data source
5. Essential (base) numbers **
AGRICULTURE/ FOOD PRODUCTION
** Number of farmers practicing sustainable, organic, IPM, no till, holistic management and other alternative methods
** Number of urban agriculture production sites and volumes
** Volume of food produced
** Farm operator age
** Farm size
** Levels of farm employment/ income/ wages/ off-farm income (number of farms by income category); include migrant workers
** Multiplier impacts of agriculture economy
** Number of food production related jobs
** Property values in agriculture areas (access to capital)
** Carbon footprint of food production (DSF measurement)
** Soil fertility
** Total area of agricultural land
** Total area of urban agriculture land
** Water use or waste in agriculture (DSF measurement))
Water use
** Energy consumption, including oil
** Greenhouse gas emissions

City Region Food System Toolkit Assessing and planning sustainable city region food systems
266
** Solid waste, wood waste, food waste
** Growth rates as pressures on land prices
** Number of farms owning land
** Number/ % of rental farmland
** Import and trade regulations
** Land use regulations
** Support levels for different types of agriculture PROCESSING
** Type, number and geographic spread of food storage/processing/manufacturing in the city region
** Amount of locally produced product that is processed/ stored/ manufactured locally
** Amount of redundant trade in processed product (same product exported and imported)
** Number of food processing related jobs and businesses per 100 000 population
** Total production in city region of value-added product by product category
** Carbon footprint of sectors
** Energy consumption, including oil
** Greenhouse gas emissions (in manufacturing and related transportation)
** Transportation impacts
** Water use; waste water production (amount and management); “water footprint”
** Food quality and safety for consumers
** Number of workers in different processing businesses for selected food categories (e.g. number employed in meat processing; in fish processing etc.)
** Wage levels
** Government support programs for value-added processing (local markets or export)
** Policies for worker safety in sector
** Presence of policies that encourage local processing, such as flexible food regulation and certification policies, and industrial land use planning.
** Scale-appropriate processing regulations WHOLESALE
** Geographic spread of distributors
** Number of wholesale/ distribution points
** Number of food distribution/ wholesale related jobs and businesses per 100,000 population
** Food waste production (volumes/share) and management
** Carbon foot prints food processing and manufacturing
** Emissions from transportation associated with distribution
** Level of wages paid and wage trends over period of time
** Number of workers for different wholesale and distribution points for selected food categories (egg fruit & veg; meat; dairy wholesale/distribution)
** Trade agreements, including provisions against promoting local over imports
** CFIA regulations and practices
** Food safety regulations RETAIL
** Extent of food deserts and food swamps
** Type, number and geographic location/spread of different food retail outlets in the city region
** Type, number and geographic location/spread of different catering/ restaurant outlets in the city region

City Region Food System Toolkit Assessing and planning sustainable city region food systems
267
** Number of food retail related jobs and businesses per 100,000 population
** Number of catering related jobs and businesses per 100 000 population
** Food waste production (volumes/share) and management in i) retail and ii) catering
** Carbon and water foot prints in food retail and catering
** Number and type of public and institutional food procurement policies
** Number of farm supply initiatives to school/farm to institution/ farm to restaurant programs; type and number of school feeding programs
** Policies around street food catering and markets (e.g. licenses, food safety & hygiene, infrastructure support)
** Policies that require labeling of food origin / food miles etc.
** Policies that support healthy food retail e.g. not allowed to locate fast food outlets near schools; support for fruit and veg shops etc.
** Wage levels for workers CONSUMPTION
** Consumption of key foods per capita
** Total healthy food requirements for the city population.
** Amount of produce and number of households served by food banks
** Availability and accessibility of charity food to those in need
** Consumer processed and fast food consumption
** Number of food banks/ soup kitchens
** HH/local income (including government/institutional) spent on food
** Map of the city to show levels of deprivation or income levels across different neighbourhoods
** Distance from HH to store with health (local) food (per wealth class) or access to healthy/local food stores within 500 m/ 1km
** Food security/ insecurity levels
** Nutritional status and rate of diet related diseases (malnutrition/Obesity/ others) for different income groups/ for rural-urban areas
** Relative consumption of food categories (dairy, meat, etc.)
** Existence and support for public health and nutrition education efforts WASTE
** Food waste production (volumes/share) and management
** Waste by supply chain link
** Economic value of food that is thrown away (from supermarkets; wholesale markets etc.)
** Job/revenue creation in waste management per 100.000 population
** Greenhouse gas emissions
** Impact on watershed
** Impact on air pollution DEMOCRATIC ENGAGEMENT
** Degree of citizen and stakeholder participation in these structures
** Food charters
** Food policy councils, regional alliances, local food networks
** Access and consultation with people and stakeholders for environmental planning
** Programs for new entrants to agriculture, including vulnerable groups
** Programs to support and protect farmworkers, and provide access to the full spectrum of Canadian worker supports

City Region Food System Toolkit Assessing and planning sustainable city region food systems
268
EDUCATION
** Consumer education for healthy food shopping, basic cooking, etc.
** Consumer education on farm sector practices and issues
** Number of community-based training venues (e.g. FoodShare SNP, catering/ kitchen programs)
** Number of formal training venues (e.g., George Brown, Conestoga food)
** Subsidized food safety trainings by sector
** Trainings available for specific sectors
** Availability of training for sustainable or alternative forms (organic farming, co-ops, etc.)
** Consumer education on environmental issues related to food

City Region Food System Toolkit Assessing and planning sustainable city region food systems
269
Tool/Example:
Key Food System Data
Author(s): Sally Miller, Toronto CRFS Project Coordinator Project: RUAF – Wilfrid Laurier CityFoodTools Introduction to the joint programme This tool is part of the City Region Food Systems (CRFS) toolkit to assess and plan sustainable city region food systems. The toolkit has been developed by FAO, RUAF Foundation and Wilfrid Laurier University with the financial support of the German Federal Ministry of Food and Agriculture and the Daniel and Nina Carasso Foundation. Link to programme website and toolbox http://www.fao.org/in-action/food-for-cities-programme/overview/what-we-do/en/ http://www.fao.org/in-action/food-for-cities-programme/toolkit/introduction/en/ http://www.ruaf.org/projects/developing-tools-mapping-and-assessing-sustainable-city-region-food-systems-cityfoodtools
Tool summary:
Tool description: This diagramme depicts key economic, social and environmental data for points along the food supply chain from agriculture and food production through processing, distribution and food marketing to consumption and waste management. It specifies links including partnerships, family ties and contracts as well as resilience considerations including climate change, water quality and pollution. There is also a map of the study area inserted into the diagram. Together, these describe the Greater Golden Horseshoe CRFS. The diagramme provides an example of how to summarize and display data gathered for a CRFS.
Brief description This diagramme depicts key economic, social and environmental data for points along the food supply chain from agriculture and food production through processing, distribution and food marketing to consumption and waste management.
Expected outcome This graphic provides a visual overview of available data on the Greater Golden Horseshoe food system. In one view it immediately shows the extent and importance of the CRFS in various (economic) sectors.
Expected output The diagramme provides an example of how to summarize and display data gathered for a CRFS.
Scale of application Project level
Expertise required for application
Project management
Examples of application
Toronto and Greater Golden Horseshoe
Year of development 2015
References -
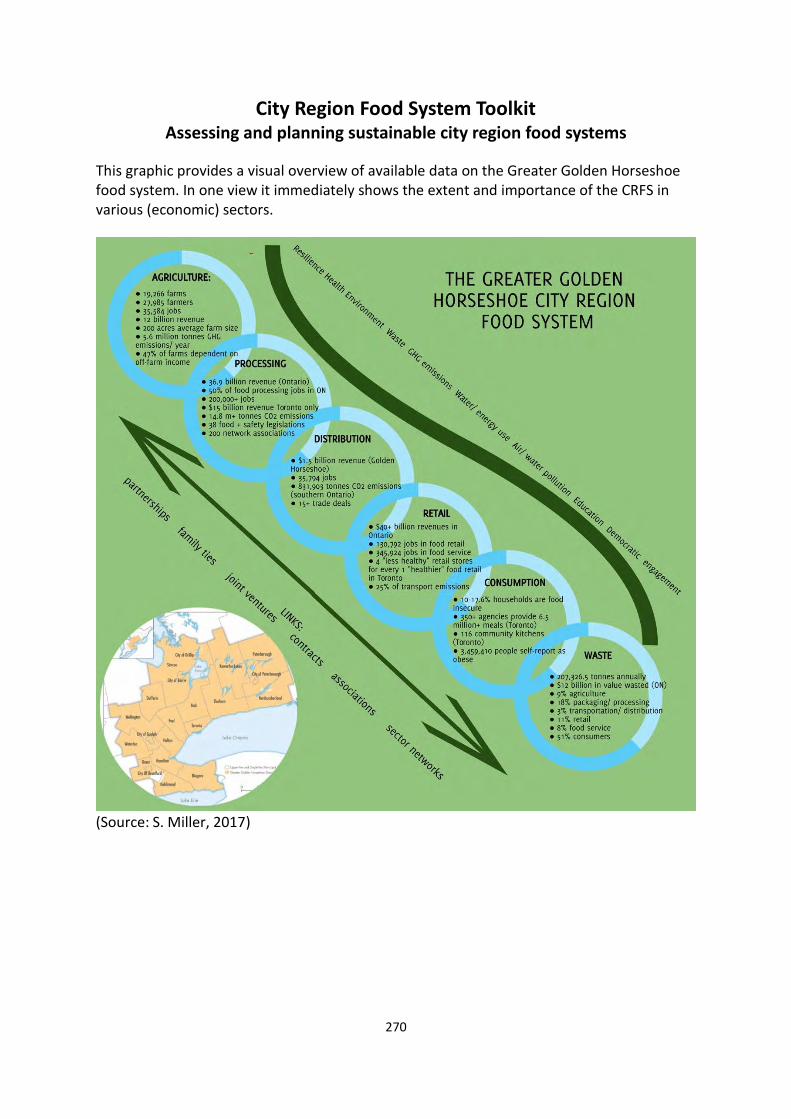
City Region Food System Toolkit Assessing and planning sustainable city region food systems
270
This graphic provides a visual overview of available data on the Greater Golden Horseshoe food system. In one view it immediately shows the extent and importance of the CRFS in various (economic) sectors.
(Source: S. Miller, 2017)

City Region Food System Toolkit Assessing and planning sustainable city region food systems
271
Tool/Example:
Top Food Flow Data and Graphics
Author(s): Sally Miller, Toronto CRFS Project Coordinator Project: RUAF – Wilfrid Laurier CityFoodTools Introduction to the joint programme This tool is part of the City Region Food Systems (CRFS) toolkit to assess and plan sustainable city region food systems. The toolkit has been developed by FAO, RUAF Foundation and Wilfrid Laurier University with the financial support of the German Federal Ministry of Food and Agriculture and the Daniel and Nina Carasso Foundation. Link to programme website and toolbox http://www.fao.org/in-action/food-for-cities-programme/overview/what-we-do/en/ http://www.fao.org/in-action/food-for-cities-programme/toolkit/introduction/en/ http://www.ruaf.org/projects/developing-tools-mapping-and-assessing-sustainable-city-region-food-systems-cityfoodtools
Tool summary:
Tool description: This file provides examples of the raw data and related tables as diagrams that were created for the Greater Golden Horseshoe (GGH) food flow analysis. Data are provided for carrots, apples, potatoes, chicken, eggs and beef in one worksheet. This data is provided for each of the regions within the GGH CRFS. In addition, bar graphs and pie charts are available. Improved understanding about the flow of foods within in a CRFS with the potential to improve rural-urban linkages.
Brief description This file provides examples of the raw data and related tables as diagrams that were created for the Greater Golden Horseshoe (GGH) food flow analysis for carrots, apples, potatoes, eggs and beef.
Expected outcome Improved understanding about the flow of foods within in a CRFS with the potential to improve rural-urban linkages.
Expected Output Diagrams and tables for the food flow analysis in a CRFS.
Scale of application Project level
Expertise required for application
Project management
Examples of application
Toronto and Greater Golden Horseshoe
Year of development 2015
References -

City Region Food System Toolkit Assessing and planning sustainable city region food systems
272
-
50,000,000
100,000,000
150,000,000
200,000,000
250,000,000
300,000,000
Carrots
Apples
Potatoes
Chicken
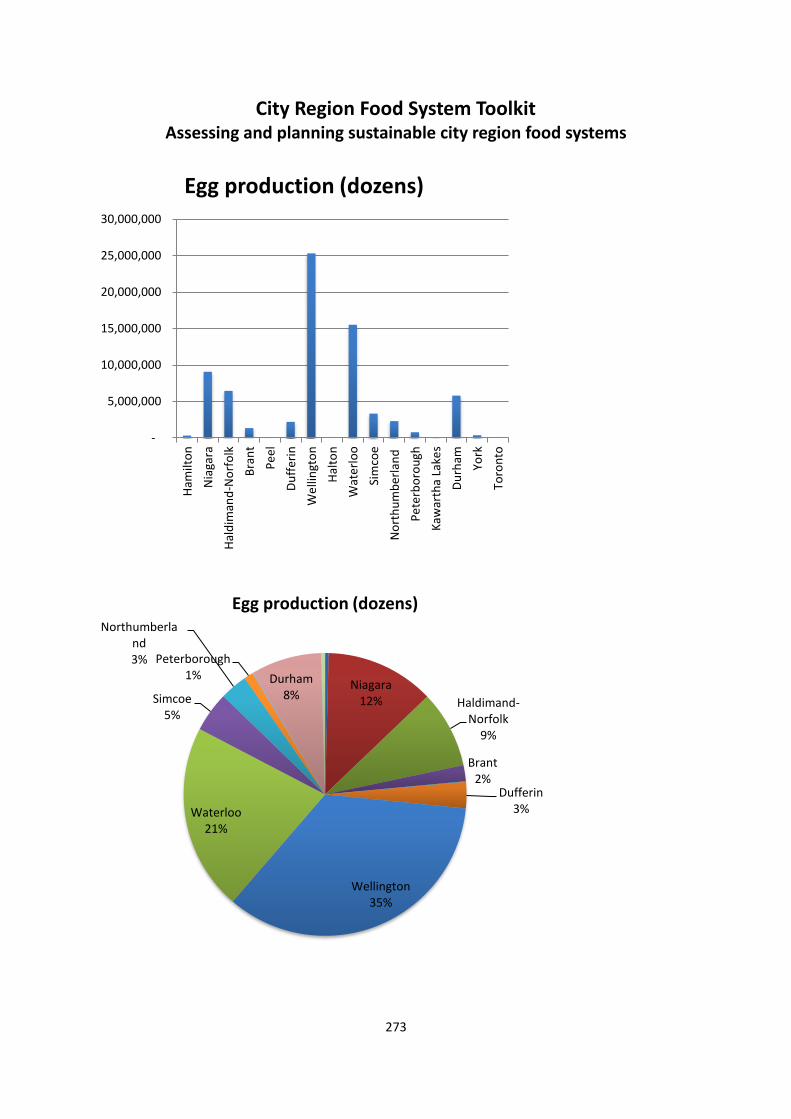
City Region Food System Toolkit Assessing and planning sustainable city region food systems
273
-
5,000,000
10,000,000
15,000,000
20,000,000
25,000,000
30,000,000
Ham
ilto
n
Nia
gara
Hal
dim
and
-No
rfo
lk
Bra
nt
Pe
el
Du
ffer
in
We
llin
gto
n
Hal
ton
Wat
erlo
o
Sim
coe
No
rth
um
ber
lan
d
Pe
terb
oro
ugh
Kaw
arth
a La
kes
Du
rham
York
Toro
nto
Egg production (dozens)
Niagara12% Haldimand-
Norfolk9%
Brant2%
Dufferin3%
Wellington35%
Waterloo21%
Simcoe5%
Northumberland 3% Peterborough
1% Durham8%
Egg production (dozens)

City Region Food System Toolkit Assessing and planning sustainable city region food systems
274
-
5,000,000
10,000,000
15,000,000
20,000,000
25,000,000
30,000,000
35,000,000
40,000,000
Beef production (lbs)
-
10,000,000
20,000,000
30,000,000
40,000,000
50,000,000
60,000,000
Chicken production
Chicken production

City Region Food System Toolkit Assessing and planning sustainable city region food systems
275
Hamilton7%
Niagara9%
Haldimand-Norfolk
33%
Brant2%
Peel4%
Dufferin0%
Wellington2%
Halton4%
Waterloo2%
Simcoe5%
Northumberland 13%
Peterborough0%
Kawartha Lakes0%
Durham15%
York3%
Toronto0%
Apple production (marketed lbs.)
Hamilton5%
Haldimand-Norfolk
11%
Brant15%
Waterloo2%
Simcoe66%
Durham1%
Toronto0%
Potato production (marketed lbs.)

City Region Food System Toolkit Assessing and planning sustainable city region food systems
276
Haldimand-Norfolk
6%
Waterloo1%
Simcoe47%
Durham1%
York45%
Carrot production (marketed lbs.)

City Region Food System Toolkit Assessing and planning sustainable city region food systems
277
21.3
88.7
59.4
11.7
5
5.2
108.9
3.6
34.9
14.8
5.9
8.7
3
19
4.9
0 20 40 60 80 100 120
Hamilton
Niagara
Haldimand-Norfolk
Brant
Peel
Dufferin
Wellington
Halton
Waterloo
Simcoe
Northumberland
Peterborough
Kawartha Lakes
Durham
York
Toronto
Value of chicken production (2012; million of dollars)
Hamilton5%
Niagara22%
Haldimand-Norfolk
15%
Brant3%Peel
1%Dufferin
1%
Wellington28%
Halton1%
Waterloo9%
Simcoe4%
Northumberland 2%
Peterborough2%
Kawartha Lakes1% Durham
5%
York1%
Toronto0%
Chicken production by county
Hamilton
Niagara
Haldimand-Norfolk
Brant
Peel
Dufferin
Wellington
Halton
Waterloo
Simcoe
Northumberland
Peterborough

City Region Food System Toolkit Assessing and planning sustainable city region food systems
278
(1,000,000,000)
(500,000,000)
-
500,000,000
1,000,000,000
1,500,000,000
Production
Consumption
Difference

City Region Food System Toolkit Assessing and planning sustainable city region food systems
279
16%
11%
73%
Apple marketing channels
Processing into Juice
Processing into Non-Juice
Fresh Market
Brant5%
Haldimand6%
Hamilton-Wentworth
3%Niagara
3% Norfolk1%
Dufferin3%
Halton0%Peel
3%
Simcoe6%
Waterloo17%
Wellington30%
Durham8%
Northumberland6%
Peterborough4%
Kawartha Lakes4%
York2%
Toronto0%
Milk production 2011 kilolitres
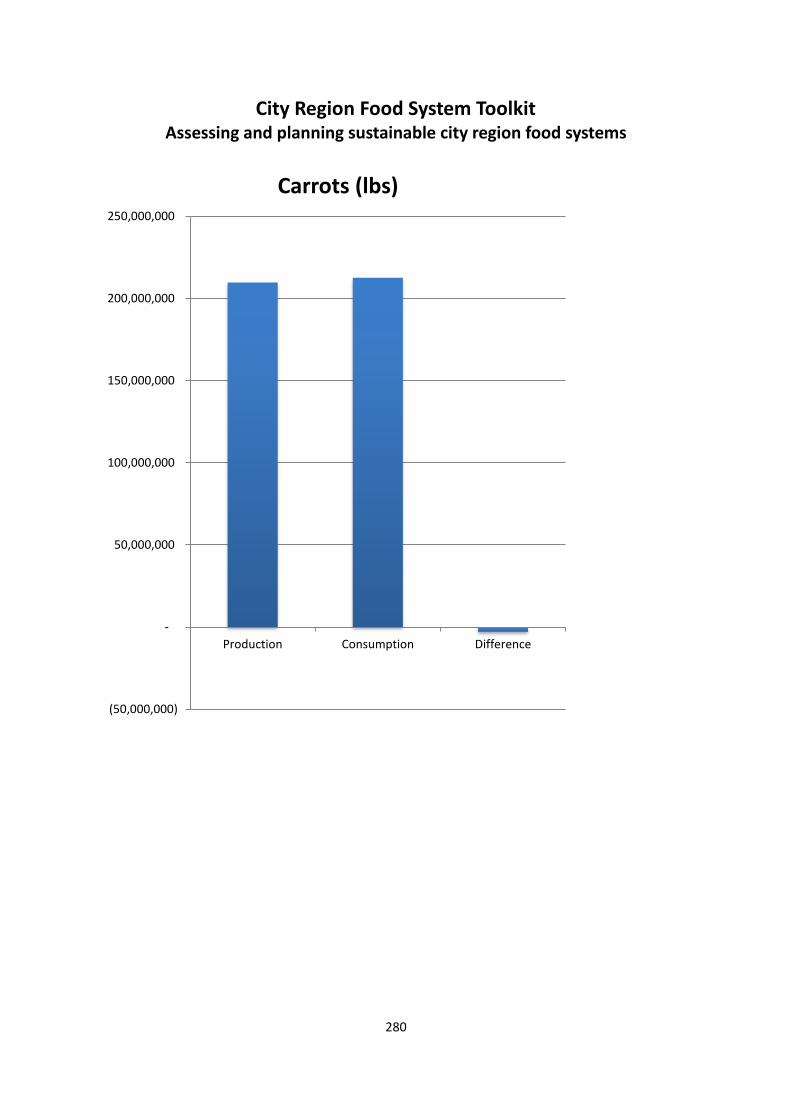
City Region Food System Toolkit Assessing and planning sustainable city region food systems
280
(50,000,000)
-
50,000,000
100,000,000
150,000,000
200,000,000
250,000,000
Production Consumption Difference
Carrots (lbs)

City Region Food System Toolkit Assessing and planning sustainable city region food systems
281
(400,000,000)
(300,000,000)
(200,000,000)
(100,000,000)
-
100,000,000
200,000,000
300,000,000
400,000,000
500,000,000
Production Consumption Difference
Apples (lbs)

City Region Food System Toolkit Assessing and planning sustainable city region food systems
282
(1,000,000,000)
(500,000,000)
-
500,000,000
1,000,000,000
1,500,000,000
Production Consumption Difference
Potatoes (lbs)

City Region Food System Toolkit Assessing and planning sustainable city region food systems
283
(150,000,000)
(100,000,000)
(50,000,000)
-
50,000,000
100,000,000
150,000,000
200,000,000
250,000,000
300,000,000
350,000,000
Production Consumption Difference
Chicken (kg)

City Region Food System Toolkit Assessing and planning sustainable city region food systems
284
(600,000,000)
(400,000,000)
(200,000,000)
-
200,000,000
400,000,000
600,000,000
Production Consumption Difference
Eggs (dozens)
Eggs (dozens)

City Region Food System Toolkit Assessing and planning sustainable city region food systems
285
(300,000,000)
(200,000,000)
(100,000,000)
-
100,000,000
200,000,000
300,000,000
400,000,000
500,000,000
600,000,000
Production Consumption Difference
Beef (lbs)
Beef (lbs)

City Region Food System Toolkit Assessing and planning sustainable city region food systems
286
Tool/Example:
Sampling guidelines
Author(s): Marielle Dubbeling and Joy Carey (RUAF Foundation), Jane Battersby, University of Cape Town (South Africa) Project: RUAF CityFoodTools project/FAO Food for the Cities Programme Introduction to the joint programme This tool is part of the City Region Food Systems (CRFS) toolkit to assess and plan sustainable city region food systems. The toolkit has been developed by FAO, RUAF Foundation and Wilfrid Laurier University with the financial support of the German Federal Ministry of Food and Agriculture and the Daniel and Nina Carasso Foundation. Link to programme website and toolbox http://www.fao.org/in-action/food-for-cities-programme/overview/what-we-do/en/ http://www.fao.org/in-action/food-for-cities-programme/toolkit/introduction/en/ http://www.ruaf.org/projects/developing-tools-mapping-and-assessing-sustainable-city-region-food-systems-cityfoodtools Tool summary:
Tool description: To assess the CRFS and specific indicators, quantitative data can be collected through questionnaire surveys. This tool provides practical sampling guidelines that can be used for selecting government/institutional, household and food business survey respondents. These sampling guidelines were developed by the authors for a World Bank programme on Urban Food Metrics, but are also applicable to a CRFS assessment.
Brief description This tool provides practical sampling guidelines that can be used for selecting government, household and food business survey respondents.
Expected outcome Collection of quantitative data through questionnaire surveys
Expected Output Selection of survey respondents
Scale of application
City region
Expertise required for application
Understanding of the local context and policy processes
Examples of application
Kitwe and Lusaka (Zambia)
Year of development
2017

City Region Food System Toolkit Assessing and planning sustainable city region food systems
287
Sampling guidelines Government and institutions: Stakeholder identification will be needed for government and institutional surveys. Governance and organisational interviews will have to done on a basis of purposive sampling. Statistical significance is not something that makes sense here, it is an entirely different sampling rationale. Government representatives to be interviewed should be selected from all spheres of government that are responsible for the food system related activities in the municipal area and city region/local area. These may include municipal governments, metropolitan governments, district offices, provincial or national government. Institutional respondents similarly should include organisations both working in the city and in the local region/area. Key government sectors and institutions to engage may include:
Government (local, provincial, national)
Institutions (public, NGOs, private) Note that private food sector business is targeted through food business surveys, so they are not included here.
-Food (security) agencies and programmes -Agriculture (and cooperatives) -Commerce and trade/markets -Social (support) programmes -Labour and social security -Economic development/business support -Public health/ food safety -Environment/sanitation -Climate change/disasters -Energy and water management -City planning/Land planning -Statistics office -Bureau of standards -Procurement office
-Agriculture and farmer support organisations -Educational/training institutes -Universities and research organisations -Food business support organisations -Financing organisations engaged in food system or business financing -Social care (hospitals, care centres) -NGOs working on food system programmes -International organisations like ILO (food business, labour), FAO etc. -Organisations working on waste management/alternative energy -Climate change
For a comprehensive response, it is recommended to interview in a first round at least 10 governmental representatives and 10 organisational representatives. These first interviews will help identify additional key respondents (if any) to consult. Note that the government and institutional survey as outlined in the Research Guidance document has been designed to be relevant to all types of government departments and organisations but not all questions are relevant to all government programmes and organisations. A follow-up focus group dialogue with the interviewed and additional key government and institutional respondents is suggested as a useful further step in the process. Households: Statistical representative sampling is very hard, given the extreme weakness of local scale statistics, particularly at the sub-urban scale. More generally, it is important to note, that the statistical data on many cities is poor, and so drawing a robust sample frame is

City Region Food System Toolkit Assessing and planning sustainable city region food systems
288
extremely difficult. This is why we propose an area based sample that allows taking a geographically defined area, based on a set of agreed characteristics5. For selection of households, and applying a poverty lens, it is crucial to include low-income neighbourhoods where further random sampling can be done to select the final interviewees from low income households. Local or national categorisations of low income, middle and high income households (based on monthly income data) can be used. It is suggested to include at least 2 different low-income neighbourhoods in the city to allow for spatial variation (for larger cities, this number may need to be increased). Once geographical areas are selected, household number estimates can be deducted from the latest aerial photos, followed by an interval sample based on this. Household representativity can be ensured by using a sample frame of 10% of the total number of households. No control with other income groups is applied if the objective of the assessment is to understand and improve food accessibility, availability and nutrition of urban poor groups (targeted research). If cities have already pre-identified and targeted specific neighbourhoods for food system interventions (for example based on already existing data on food insecurity, malnutrition or healthy food access), the surveys can be applied for these neighbourhoods only to support definition of specific interventions in those areas. If this is done, the research or project team needs to be very clear about why these particular neighbourhoods were selected and note that they are not representative of the wider city. If the research aims to provide an overview of the entire city, a larger number of neighbourhoods and a variety of different income groups will have to be included. Food businesses: Again, in applying a poverty lens, household interviews need to be implemented before the food business surveys, in order to be able to map and identify food business that specifically serve low-income households. Locations where low income households procure and purchase their food will thus identify which food businesses minimally to select to ensure a pro-poor / low income focus. It is suggested that within this pre-identified sample, at least 10% of food businesses are further randomly selected for the food business interviews. It should be noted that these food businesses are not necessarily located in the same low income areas where low income households live, as they may procure their food sources from other neighbourhoods, central markets or peri-urban producers directly. In addition to businesses identified in the household interviews, interviews should be done with a broader group of food businesses. This requires to do a census of businesses and sample out of that. In order to get a good overview of food business diversity and variety, and 5 ‘One of the most common challenges is to measure the size, location, characteristics, and movement of urban populations’. 'A combination of ground-based and satellite tools can help understand rapidly evolving and complex urban settings. These will be extremely useful to estimate population numbers and to define the most appropriate sampling design, including the identification of vulnerable neighbourhoods in urban settings.’ (Adapting to an Urban World Phase II (2017) Assessment Design in Urban Areas – Expert Consultations). This study suggest the above approach for area-based household sampling.

City Region Food System Toolkit Assessing and planning sustainable city region food systems
289
of performance and needs of different food businesses along the entire food value chain, purposive sampling from different business categories is required:
1. Urban and peri-urban food production 2. Processing 3. Wholesale & distribution 4. Retail 5. Catering 6. Organic and food waste management/ re use.
The number of businesses in each category may need to reflect the relative size of the sector if that information is available. If not then it may be simpler to interview equal numbers in each sector. Business types within these above categories will vary from country to country. Therefore before starting the survey work, for each of the six business categories, a list of main business types needs to be developed. For example, within retail we can distinguish supermarkets, kiosks, street vendors/ itinerant vendors, house shops etc. An adapted local typology needs to be developed and used during the surveys These locally specific sub-categories of business types should also be used in deciding which types of businesses to interview. Another angle in sampling could be geographic spread, if that information is available.

City Region Food System Toolkit Assessing and planning sustainable city region food systems
290
Policy support and planning

City Region Food System Toolkit Assessing and planning sustainable city region food systems
291
Tool/Example:
Thematic mapping of CRFS
Author(s): FAO Project: FAO Food for the Cities programme Introduction to the joint programme This tool is part of the City Region Food Systems (CRFS) toolkit to assess and plan sustainable city region food systems. The toolkit has been developed by FAO, RUAF Foundation and Wilfrid Laurier University with the financial support of the German Federal Ministry of Food and Agriculture and the Daniel and Nina Carasso Foundation. Link to programme website and toolbox http://www.fao.org/in-action/food-for-cities-programme/overview/what-we-do/en/ http://www.fao.org/in-action/food-for-cities-programme/toolkit/introduction/en/ http://www.ruaf.org/projects/developing-tools-mapping-and-assessing-sustainable-city-region-food-systems-cityfoodtools Tool summary:
Tool description: This tools helps policy makers understanding how the CRFS is spatially and geographically characterized. The data collected in the assessments are georeferenced and mapped for planners to better visualise and understand the CRFS and its spatial distribution and dynamics. Maps are used to represent:
the production areas of the main commodities;
the location of the retail and wholesale markets;
distance to markets;
the transportation network;
the spread of food insecurity and poverty in the city region, possibly crossed with other criteria such as location of markets and urban agriculture areas in the city
food flows of the main commodities;
Brief description This tool provides better visualization and understanding of CRFS and its spatial distribution and dynamics to policy makers.
Expected outcome CRFS mapping
Expected Output Maps
Scale of application Project level
Expertise required for application
GIS, spatial data management
Examples of application
Kitwe and Lusaka (Zambia); Colombo (Sri Lanka)
Year of development
References -

City Region Food System Toolkit Assessing and planning sustainable city region food systems
292
land use change.
Examples of application
Lusaka
Spread of agricultural household and main commodities produced in the CRFS: (Source: FAO)
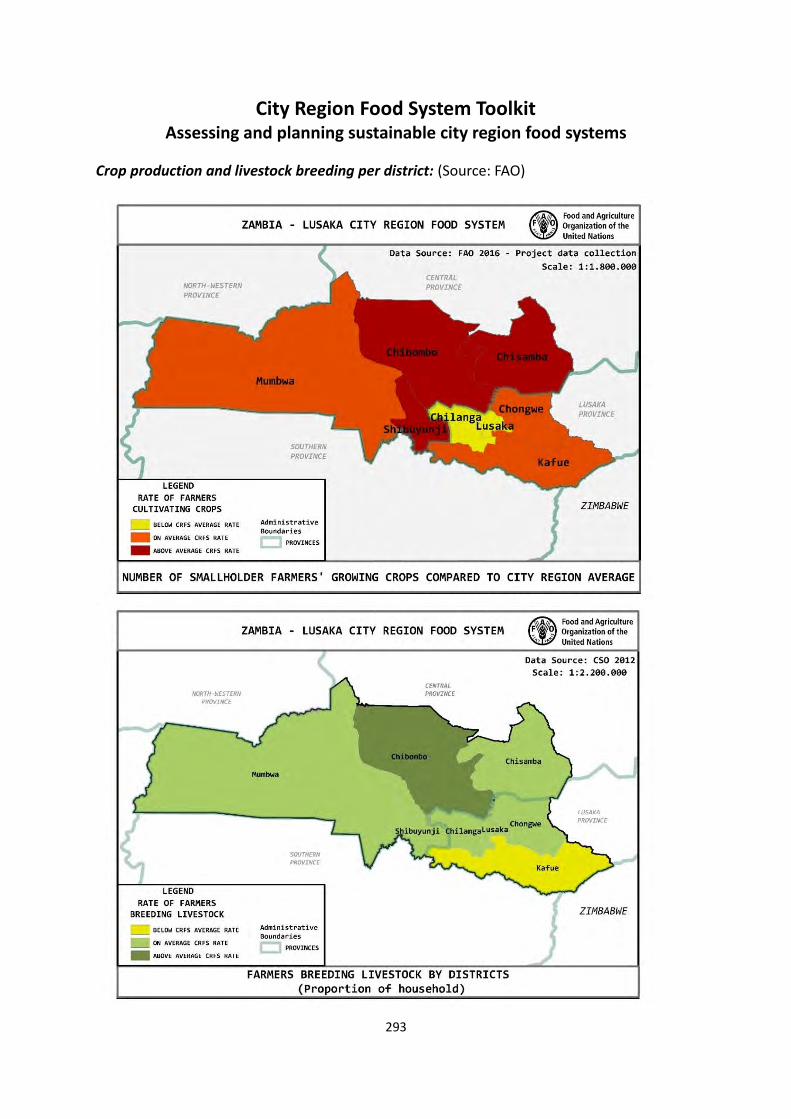
City Region Food System Toolkit Assessing and planning sustainable city region food systems
293
Crop production and livestock breeding per district: (Source: FAO)

City Region Food System Toolkit Assessing and planning sustainable city region food systems
294
Kitwe
Average distance to markets – vegetables : (Source: FAO)
Sources and market places for key commodities:
Tomatoes (Source: Lusaka CRFS Workshop 2015)

City Region Food System Toolkit Assessing and planning sustainable city region food systems
295
Rape (Source: Lusaka CRFS Workshop 2015)
Onion (Source: Lusaka CRFS Workshop 2015)

City Region Food System Toolkit Assessing and planning sustainable city region food systems
296
Change Detection /Impact of Urbanization on Agriculture Land (Source: Lusaka CRFS
Workshop 2015)
Colombo
Food flows mapping (Source: IWMI)

City Region Food System Toolkit Assessing and planning sustainable city region food systems
297
Vulnerability to climate related effects (Source: IWMI)

City Region Food System Toolkit Assessing and planning sustainable city region food systems
298
Tool/Example:
Working group meetings for strategy/action plan identification and design process
Author(s): FAO Project: FAO Food for the Cities programme Introduction to the joint programme This tool is part of the City Region Food Systems (CRFS) toolkit to assess and plan sustainable city region food systems. The toolkit has been developed by FAO, RUAF Foundation and Wilfrid Laurier University with the financial support of the German Federal Ministry of Food and Agriculture and the Daniel and Nina Carasso Foundation. Link to programme website and toolbox http://www.fao.org/in-action/food-for-cities-programme/overview/what-we-do/en/ http://www.fao.org/in-action/food-for-cities-programme/toolkit/introduction/en/
http://www.ruaf.org/projects/developing-tools-mapping-and-assessing-sustainable-city-region-food-systems-cityfoodtools Tool summary:
Tool description: After identifying the main challenges within the city region food system, different working groups can be formed to develop strategies and action plans based on the key priority areas and the results of the CRFS assessment. The thematic working groups are formed by key local stakeholders for different institutions to explore the critical needs, define necessary policy intervention and provide the guidance to the project team in formulating specific action plans. The working groups evolved from and build on earlier multi-stakeholder dialogue and
Brief description By involving a broad range of stakeholders around thematic areas, working groups’ meeting help building identifying key strategies and design actions plans based on the results of the CRFS assessment.
Expected outcome Strategies and action plan identification
Expected Output Strategies identified for each key priority, and action plans established
Scale of application Project level
Expertise required for application
Depending on the local priorities identified
Approximate required time for application
It is important to realize with the working groups a sufficiently intensive rhythm for further development of the Agenda/Strategy/Action Plan. The working group can meet 3 to 4 times, during a period of max 3 months. Each working group discussion should last at least 2 hours.
Examples of application
Kitwe and Lusaka (Zambia); Colombo (Sri Lanka)
References -

City Region Food System Toolkit Assessing and planning sustainable city region food systems
299
meetings organised in the previous phases. The working groups are constituted by representatives of key stakeholder groups and institutions that are most involved or experienced in the issues to be discussed, and that can play a role in implementing the related strategies. Examples of application
Terms of reference and rationale for the working groups
The working groups are constituted by representatives of key stakeholder groups and institutions that are most involved or experienced in the issues to be discussed, and that can play a role in implementing the related strategies. Identification of institutional frameworks, coordination mechanisms, time line and funding sources On the basis of the results of the CRFS assessment, the working group members support the identification of key policy areas and entry points and eventually support development of action plans or concepts for policies. In particular, the working groups contribute to:
1) Help in building a more permanent local food system network of key actors and broad
inter-sectoral alliances;
2) Bridge the communication gap(s) between various stakeholders and help in promoting
a broader understanding of the local food system components and governance;
3) Collaborate with other initiatives or groups to create synergies in this area of work;
4) Provide advice on:
The existing food governance and policy mechanisms where strategies and action
plans can be hosted;
The type and role of the various actors that should be involved in the further
operationalization and implementation of the Agenda/Strategy/Action Plan;
The mechanisms that will be applied to coordinate the operationalization and
implementation process;
An estimated time-line for implementation of the developed strategies or action
plans;
A rough estimate of the budget and other resources (human resources, specialized
equipment or institutional capabilities) needed for the operationalization and
implementation and available sources and mechanisms of financing (municipal
budget lines, institutional budgets, public-private cooperation, payments by the
beneficiaries, available project funds etc.) and who will be responsible for the
management thereof;
Potential sources and mobilization strategies of funding to implement the action
plans

City Region Food System Toolkit Assessing and planning sustainable city region food systems
300
5) Contribute to drafting of the necessary strategies and action plans for resolving and/or
alleviating the Project’s identified CRFS challenges; and
6) Facilitate the uptake of research results into the local policy and institutional
programmes and processes (including national policy and institutional programmes
and processes, where necessary/applicable).
Time frame and operational arrangements The Working Group functioning and process last approximately 3-4 months. The working groups are required to meet on regular basis, tentatively once a month, to review and advice on the progress of the development of strategies and action plans.
Lusaka (Zambia): Terms of reference for the first working groups’ meeting
Key Tasks 1. Identification & Selection of Challenges
2. Prioritization of challenges
3. Identification of Strategies to address Prioritized Challenges
Strategies for only 2 top prioritized challenges
4. Implementation of identified Strategies
Implementation of Strategies for the only 2 prioritized challenges (as in
point 3 above)
Key Questions for the Tasks
a. Identification & Selection of Challenges
1) What are the main challenges from the Studies (Case Study Presentations and
Briefs)?
i. Be as specific/concrete as possible!
b. Prioritization of challenges
1) From the identified main challenges (listed from Qtn A.1), what in your view are
the two (2) main ones to prioritize?
c. Identification of Strategies/Remedial measures to address Prioritized two (2)
Challenges
1) Is/are there already any policy(cies) or action(s) taken to tackle this issue?
i). If yes, is it or are they working and how could it/they be fostered?
ii). if not working, why?

City Region Food System Toolkit Assessing and planning sustainable city region food systems
301
2) Is/are there any other new/additional strategy(ies) that could be put in place
to tackle this issue?
3) What would be the impact of the selected strategies on the issue and the whole
food system, in general?
d. Implementation of identified Strategies
1) Who (Institution & Officer/Dept.) should lead implementation of these
strategies and who else (Institution & Officer/Dept.) should be involved?
2) Is/are there any existing policy framework(s) or initiative(s) in which the
strategy(ies) could fit?
3) How to operationalize the implementation process: i.e. timeframe & budget
(costs and sources of funding).

City Region Food System Toolkit Assessing and planning sustainable city region food systems
302
Note: To be done/written on Flip Chart Group Thematic Area:_______________________________________________
Key drivers and figures: Challenge:
Identification of strategies: Policies/legislation/actions already in place, working or not:
New identified strategies:
Impact of these new strategies or strengthening of existing frameworks:
Implementation of the strategies: Who to lead and who to be involved:
Existing processes or policy framework:
Action plan: (timeline, budget, funding sources)

City Region Food System Toolkit Assessing and planning sustainable city region food systems
303
Tool/Example:
Scenario building
Author(s): Marielle Dubbeling, RUAF Foundation; Sally Miller, Toronto and Fernando Sudharshana (Colombo) Project: RUAF CityFoodTools project/FAO Food for the Cities Programme Introduction to the joint programme This tool is part of the City Region Food Systems (CRFS) toolkit to assess and plan sustainable city region food systems. The toolkit has been developed by FAO, RUAF Foundation and Wilfrid Laurier University with the financial support of the German Federal Ministry of Food and Agriculture and the Daniel and Nina Carasso Foundation. Link to programme website and toolbox http://www.fao.org/in-action/food-for-cities-programme/overview/what-we-do/en/ http://www.fao.org/in-action/food-for-cities-programme/toolkit/introduction/en/
http://www.ruaf.org/projects/developing-tools-mapping-and-assessing-sustainable-city-region-food-systems-cityfoodtools Tool summary:
Brief description Scenarios can be used as tools to guide decision making. Different possible future strategies/options -e.g. scenarios- to implement the vision for a more sustainable and resilient CRFS are developed in participation with decision makers and other local stakeholders and can be used to (1) Better understand drivers/challenges underlying the vision; (2) Help identify key issues for policy intervention and (3) Support action planning.
Expected outcome More data/evidence on specific policy recommendations and interventions based on scenario development and analysis
Expected Output Policy scenario analysis
Scale of application City region
Expertise required for application
Scenario building
Examples of application
Toronto, Colombo
Year of development 2017
References -

City Region Food System Toolkit Assessing and planning sustainable city region food systems
304
Tool description:
(1) Scenario development. Option 1. Scenarios can be developed for better understanding main future drivers/challenges. What is the prognosis/forecast for specific expected developments (e.g. climate change, resource degradation, food production and imports, legal/institutional changes) and how will these influence the city region food system and needed interventions to guarantee its future sustainability and resilience? For example, as in Colombo, food safety and hygiene (food control) are a key part of the vision for a more sustainable and resilient CRFS. How will however expected climate change affect food safety and hygiene in different parts of the chain (by increasing specific stresses or disruptions)? How will expected increase in food imports affect food control issues? How will expected increase in amounts of food waste affect food safety and hygiene? How might an increased shift to private sector control of food safety standards affect food safety and hygiene and call for new/changed government roles? A set of scenarios for main challenges and drivers can be developed to depict a variety of the most challenging potential future disruptions, stressors or critical developments, with the principal aim of testing the current and future resilience of the CRFS in a specific area and thereby investigating which potential future policy measures will be necessary to increase its resilience. In other words, and for the given example, the key question for policy level discussions should be “What changes are needed to food safety and hygiene related policies, practices and behaviours, not only to meet current gaps and weaknesses, but also to be able to guarantee future performance and sustainability”. Scenarios can be used to explore different possible future changes/ trends and disruptors to generate insight and design alternative actions for different potential risks and opportunities.

City Region Food System Toolkit Assessing and planning sustainable city region food systems
305
(Source: Toronto Public Health)
(2) Scenario development. Option 2. Scenarios can also be developed be developed to asses what happens if we do nothing or what would likely impacts be of a specific intervention? Using scenarios in this way at this stage is especially helpful to (further) convince policy makers of needed action. For defining such scenarios the following questions need to be asked:
1. What are the priority areas the city(region) needs to engage in to promote and support the realisation of the CRFS vision? The identified weaknesses/threats/strengths or opportunities for developing a more sustainable and resilient CRFS - as identified in the CRFS Scan and Assessment- should be taken into account in this reflection.
2. Do we have data on what the situation would look like in 5 years’ time (in specific areas) if we do nothing? If not, can we estimate impacts by developing one or more scenarios?
3. Or if we would implement a specific strategy or intervention: what would the likely impacts be?
For example: a city region wants to preserve its local/regional food production in the peri-urban areas (part of the vision). The following scenario can be developed to illustrate food production losses if nothing is done: If the city would grow by X% in the coming 5 years, according to current urbanisation trends, this would results in Y% loss of its agricultural land. Having such impact figures can motivate action for containing urban sprawl.
Expected
level of ch
ange/d
isrup
tion
Time
S1
S2
S3
Present Future
2017 2030
Different scenarios

City Region Food System Toolkit Assessing and planning sustainable city region food systems
306
Another example may be the need to address high climate vulnerability of the CRFS, for example in relation to droughts, as documented in the CRFS assessment. If enhancing climate resilience is one of the elements of the vision, a scenario could be calculated which will provide data on estimated food production reductions in the coming 5 years if current climate projections continue and no further action is taken. A scenario to calculate likely impacts of a specific intervention can be developed to for example calculate how much food (or specific products like vegetables) can be produced by using all potentially available land in the city region. If this shows that for example 10% of all fresh vegetable needs can be produced in the city region this might be a convincing figure for decision makers to take action. A further example may be the interest to use local procurement funding for local/regional food production. From the CRFS Assessment we know how much local procurement funding is available (institutional, school, hospitals) that is currently spent on food. A scenario can be drawn up for a specific % of that budget to be destined in future to food that could be locally/regionally grown. If this is done what increased volume of local/regional production could be procured? How much (new) jobs would then be created?
(3) Scenario development. Option 3. Based on the common vision and identification of key issues and areas for action, scenarios may further be used to get more insight in the relevance of possible actions in order to be able to compare costs/benefits of different strategies or action: what will be the impact and cost-benefit of developing specific actions/strategies? This will help choosing what policy option/strategy would be best and most feasible. This is done by developing and comparing different scenarios (often scenarios are compared to the current situation/trend and to each other) with regards to their expected impacts and their cost-benefits. One example is that in response to climate vulnerability (identified as a key threat to the CRFS) it is proposed to make more wastewater available to regional producers. We know from the CRFS Assessment that currently only 10% of available wastewater is used for food growing. With projected increase in temperatures, water needs for maintaining current levels of food production will increase to Y liters in 5 years (zero scenario). If an additional wastewater plant would be installed (scenario/strategy 1) or if Z% more of the current available wastewater (scenario/strategy 2 ) is made available to famers, this would supply A or B% of their needs. Comparing costs and benefits for scenario 1 and 2 and impacts will help decision making in what strategy to propose.

City Region Food System Toolkit Assessing and planning sustainable city region food systems
307
A second example is that the CRFS vision seeks to reduce the GHG emissions of the current food system. We know from the CRFS Assessment results that people currently eat a given amount of fruits, vegetables, meats and other products. Meat production contributes to X GHG emissions. If one meat-free day/week is introduced in the diet this would reduce meat consumption by y% and reduce GHG emissions by Z% (scenario 1 tackling consumption). A second scenario can be drawn up for increasing organic waste recycling or reducing food waste and emission reductions (scenario 2 tackling waste management). Again comparison of impacts and cost/benefits will help decide what strategies/actions to focus on. For defining such scenarios the following questions need to be asked:
1. What are possible proposed strategies/actions/interventions corresponding to the different key issues identified (and that will respond to the identified weaknesses/threats/strengths/opportunities)?
2. What is the likely impact/ cost-benefit of each of these strategies/actions/interventions? Note that in reality, various strategy options will usually be seen to overlap with and complement each other and may be combined in different ways. What is required for an effective CRFS strategy/agenda is the coordinated use of a range of strategies/interventions, rather than a choice of one single strategy. Do we have data available on the impact /cost-benefit or can we formulate simple scenarios to get these data?
Using scenarios in this way is dependent on baseline date being available for specific CRFS outcomes. For example data on the actual consumption patterns of (specific groups) of the urban population. Or data on the actual volumes of wastewater generated and re-used for food production; or the actual GHG emissions related to specific food chains. When CRFS outcomes/impact changes are calculated by means of scenarios, different strategies/interventions (e.g. installing another wastewater plant or putting in infrastructure to bring water from the current plan to the farmers) and their costs/benefits can thus be compared. Note again that even without a costs/benefit analysis, policy making can be influenced by showing what impacts a specific scenario would have (e.g. one meat free/day a week would save emissions equal to those of 100,000 households. Examples from Colombo and Toronto below illustrate how scenarios have been used in their respective CRFS projects.

City Region Food System Toolkit Assessing and planning sustainable city region food systems
308
Scenario building as part of policy analysis Colombo In the Colombo CRFS project food safety and hygiene was identified as a key concern and issue for improved food system planning and policy making. Different possible future changes/trends were identified (see above Scenario development option 1). In a focus group discussion, stakeholders were asked to assess the potential importance/significance of such trends: with 0” meaning not at all significant, “5” meaning very significant and “3” meaning moderately significant. See one example below:
(Source: IWMI)
Secondly, the “severity” of such changes in the coming 10 years were assessed (taking into account both the extent of the changes as well as ongoing and planned interventions in these areas that would already respond to specific changes). In the case of the Colombo city region for example incipient and planned changes in administrative boundaries and responsibilities would likely have important effects on the institutional and legal food safety and hygiene framework (Scenario 1). The key challenge in this scenario is to ensure food safety and hygiene in a changing and more complex governing environment in 2030 with highly fragmented and geographically dispersed food chains. Also expected innovations and new research on food handling are expected to largely influence food safety and hygiene incidences and frameworks in the future (see image below). For example, foreign investments in hospitality, food and beverage industries are expected to increase, each adhering to the food safety standards of the country of origin. There are also new emerging food retail business models which use online ordering of food directly from producers and deliver them to end consumers; currently such business models are not covered by the existing food safety laws and regulations in Sri Lanka.
0.0
1.0
2.0
3.0
4.0
5.0
1. Changes inadminstrative boundries
2. Rapid increase ofimported food and
beverages
3. Emergence of intereston internationalstandards and…
4. Emergence of nationaland international private
sector involvement
5. Emergence of newbusiness models in food
industry
6. Innovations and R&Don food would make
changes in food industry
7. Increasing trend onfood safety and hygiene
violations

City Region Food System Toolkit Assessing and planning sustainable city region food systems
309
Given current limited resources in food safety and hygiene administrations, ensuring food safety and hygiene will in this context (Scenario 2) be a larger challenge in the future and already require attention. Therefore the key challenge in this scenario is to ensure food safety and hygiene by 2030 in a highly globalising and modernising food supply chain in Sri Lanka.
(Source: IWMI)
Assessment of economic drivers/changes (for example widening of economic disparities among income groups and expected dietary changes as a result of urbanisation) led to formulation of additional scenarios where vulnerable groups would meet food demands based on low-cost and lower-quality diets and by buying food in specific market segments (for example street foods). The key challenge for this scenario would be to safeguard food safety of vulnerable consumer groups and addressing lifestyle-related problems affecting their health. Overall 12 scenarios were developed with regards to (1) Future overall trends (amongst others increased public awareness on food safety); (2) Future trends in food policy and governance mechanisms (i.e. changes in administrative boundaries; innovations in food research and business models); (3) Future trends with regards to economic drivers (i.e. economic disparities, resource depletion) ; (4) Future trends with regards to social drivers (i.e. increasing population, changes in lifestyle); (5) Future changes in technology drivers (i.e. increased use of
0.0
1.0
2.0
3.0
4.0
5.0
2020 2025 2030
1. Changes in adminstrative boundries2. Rapid increase of imported food and beverages3. Emergence of interest on international standards and certifications4. Emergence of national and international private sector involvement5. Emergence of new business models in food industry6. Innovations and R&D on food would make changes in food industry7. Increasing trend on food safety and hygiene violations

City Region Food System Toolkit Assessing and planning sustainable city region food systems
310
biotechnology and GMOs, but also increased use of ICTs) and (6) Future trends in environmental drivers (i.e. specific climate changes). Taking into account scenarios with highest expected future impacts, a set of policy recommendations was formulated, varying from proposed institutional changes (for example in the composition of the Food Control Administration) to legal and regulatory changes (e.g. accounting for future impacts of climate change on food safety in food control regulations; need for food control regulations for upcoming online food stores) to other policy interventions (educational efforts amongst others). Scenario building and action planning Toronto CRFS The Toronto CRFS assessment identified eight key policy recommendations (see box below). Of these eight recommendations, three recommendations were identified (in 2017) as underway at a national level (national food policy, guaranteed income and labour policies). Institutional procurement was also deemed to be underway through different institutions in the region as well as in recent projects. Policy recommendations from Toronto CRFS Assessment
#1 Develop and support for transition to mid-scale infrastructure (regional processing, distribution, marketing)
#2 Establish financial resources that support a range of scales and stages
#3 Establish scale-appropriate regulations and feasibility assessments for mid-scale infrastructure like regional food hubs
#4 Increase research and educational opportunities directed at regional agriculture and regional infrastructure needs linked to shorter supply chains
#5 Provide sufficient social assistance, through a guaranteed income or other measures, to ensure that everyone can afford to eat healthy food
#6 Establish a national food policy and a national school food policy
#7 Ensure widespread formalization and implementation of public procurement policies for local food (with percentages and budgets to meet policy goals)
#8 Revise the labour practices, government support and subsidy programs to ensure the necessary skilled labour for all food system areas with tenure security and fair compensation for work
The Toronto CRFS assessment found that regionalisation of food systems requires the rebuilding of scale-appropriate (small and midscale) processing, storage, distribution, etc. Despite the high agricultural productivity of the area (the Greater Golden Horseshoe), opportunities for regional processing have dropped significantly: producers must send raw ingredients abroad for processing, weakening the overall food system as the higher manufacturing margins go to other regions or countries. A 2016 online asset map database for the agri-food sector in the Toronto city region shows a significant gap in fruit and vegetable preserving and meat product manufacturing.

City Region Food System Toolkit Assessing and planning sustainable city region food systems
311
Explorations of why regional producers continue to focus on mass market and export, despite dwindling returns, showed that part of the problem is lack of appropriate scale infrastructure, including lack of knowledge about how to access regional markets, whom to contact, and how to manage local distribution cost effectively. The rise of food hubs may remedy this challenge, particularly if the food hubs feature processing capacity as well as distribution (by comparison, the food hubs that have risen rapidly with USDA support in Canada are mostly focused on regional aggregation and distribution). The Toronto CRFS Task Force therefore recommended to focus on mid-scale infrastructure development, drawing on the first four recommendations. The activities recommended encompass physical infrastructure (food hubs, mid-scale processing facilities, mid-scale transportation solutions) as well as “soft” infrastructure such as financial initiatives and education to expand regional food system engagement for producers and consumers. New mid-scale infrastructure was also thoughts to increase the security of workplace opportunities, as regional food hubs, farm-based value-added activities, and diverse marketing strategies are more likely to have full-time and/ or year-round positions. Mid-scale operations can have higher quality jobs, not necessarily in terms of pay, but in terms of supportive workplaces, opportunity for advancement, and a broad set of responsibilities that can bring a job out of the realm of routine. Co-ops, collectives and many family run businesses offer an opportunity for democratic functions (consulting with workers, providing for innovation by individuals) that large corporations cannot afford. Mid-scale infrastructure for agri-food systems would include policies, regulations and regional/ municipal plans that facilitate and incubate food hubs, mid-scale processing, regional distribution, and diverse food and farm activities. Infrastructural challenges include the barriers to small and mid-scale processing (for instance, regulatory, tax and capital barriers). New regulations may allow more on-farm processing, improving the landscape for farmers who primarily produce but may do light processing to create higher margin value-added products. Tax rules need to be reviewed, as on-farm processing can result in the much higher industrial tax rate, even if it is a small percentage of the operation. The Toronto CRFS research team conducted focus groups and discussions with a focus on these topics. Three scenarios (see Scenario development, Option 3) for food hub development were explored, including 1) Aggregation and distribution food hubs 2) Combination food hubs with aggregation, distribution and scale-appropriate processing and 3) Food access food hubs (aggregation and distribution to community organisations and others providing food to low income and marginalised groups). The first scenario focused on policy considerations and interventions for both processing and distribution and included producers and entrepreneurs as target users. The services identified are grouped into two categories with the first including aggregation, storage, marketing and distribution and the second including processing, product testing, market research, food

City Region Food System Toolkit Assessing and planning sustainable city region food systems
312
safety compliance and business training. Under the heading of design there were six categories identified, including sustainable building, resource recycling and energy, structure and ownership, public land, demonstration sites, and mixed urban zoning and permitting. Operations included revenue, number of jobs, in-kind capital, in-kind work and product criteria. Marketing as the last category covers local food dimensions including consumers, restaurants, delivery enterprises, supermarkets, farmers’ markets and procurement projects. Drivers linking target users and services included convenience/ access, percentage of harvested product and price. Moving from services to design, drivers considered were environmental value, urban centre access, capital availability and municipal support. Going from design to operations, the drivers were economic benefit, social capital access and food politic values. Finally, drivers from operations to markets included demographics, public procurement policies and market information.
(Source: S. Miller, 2017)
The second scenario, distribution, was a pared down version of the first scenario that also included processing. Under targets only producers were named. For services only the first tier as aggregation, storage, marketing and distribution were included. Design only included resource recycling and energy, structure and ownership, and mixed urban zoning and permitting. Operations also included revenue, number of jobs, and product criteria. Under

City Region Food System Toolkit Assessing and planning sustainable city region food systems
313
markets the required supports were identical, except farmers’ markets were not on this list. In addition, the distribution scenario included product planning and agricultural training under services and volume was a consideration on the operations side. Drivers are also very similar between the first two scenarios. The differences of note are between services and design wherein the distribution scenario specifies zoning and permits as one aspect of the more general municipal support identified in Scenario 1. While the drivers from operations to markets are the same, between design and operations, Scenario 2 agricultural networks but not the more general social capital access.
(Source: S. Miller, 2017)

City Region Food System Toolkit Assessing and planning sustainable city region food systems
314
Scenario 3, food access approaches the food system from the pull side of the food systems and so is different from the first two scenarios. The target users identified fell into two categories: consolidators and producers/ distributors, with services included as aggregation, brokering, marketing and market research, and customer training. The drivers between these two dimensions included convenience/access, volume and long term contracts. Under the heading of design, only structure/ownership and accessibility to community were raised, with the driving forces moving to operations as public benefit, food values including whether the food is health and fresh, and partnerships. Operational considerations were identical to Scenario 1, while market considerations differed as community food agencies, food banks, community kitchens, healthy corner stores, grab and go food at public transit hubs and finally local food procurement projects. The drivers between operations and markets included demographics, public procurement policies, price and community food networks. As would be anticipated under Scenario 3, there were very strong social justice and equity considerations as part of food access.
(Source: S. Miller, 2017)
Scenarios were developed using an action planning template as outlined below. These tables can also be used by stakeholders to further develop a detailed plan, address challenges and risks, and identify stakeholders and resources.

City Region Food System Toolkit Assessing and planning sustainable city region food systems
315
(Source: S. Miller, 2017)
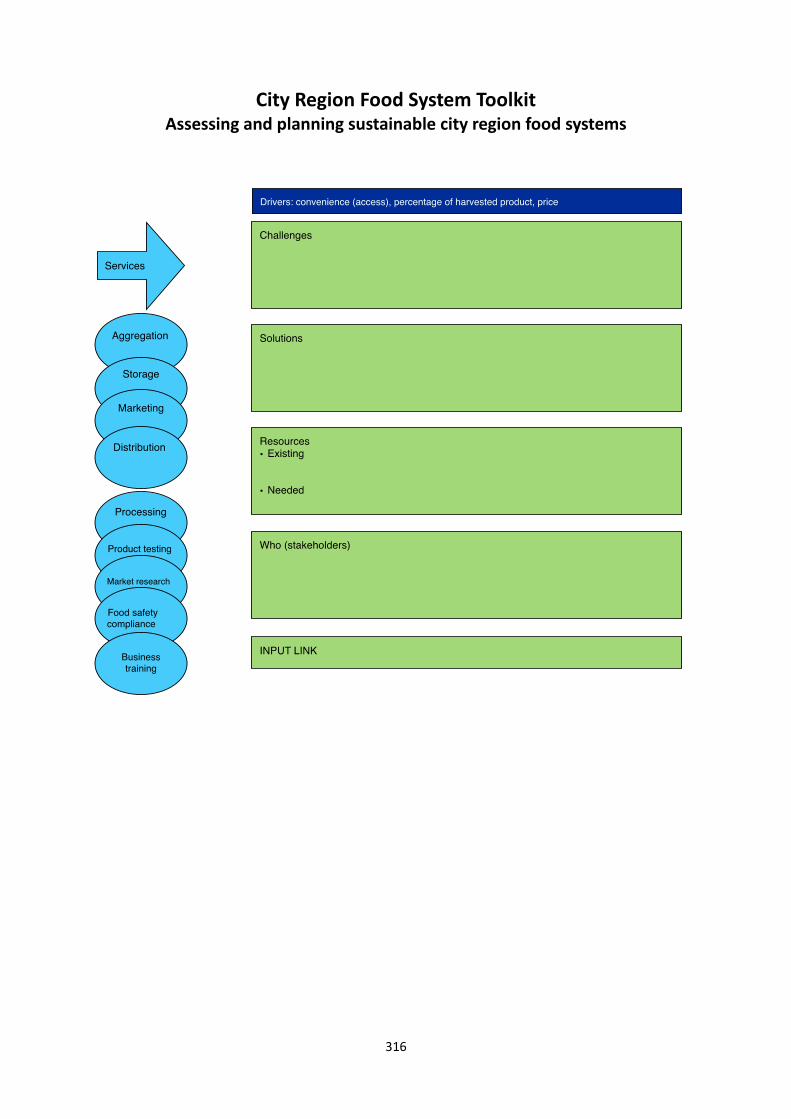
City Region Food System Toolkit Assessing and planning sustainable city region food systems
316

City Region Food System Toolkit Assessing and planning sustainable city region food systems
317

City Region Food System Toolkit Assessing and planning sustainable city region food systems
318

City Region Food System Toolkit Assessing and planning sustainable city region food systems
319

I9255EN/1/05.18
ISBN 978-92-5-130525-6
9 7 8 9 2 5 1 3 0 5 2 5 6