city ofraleigh,north carolina
TRANSCRIPT

C I T Y O F R A L E I G H , N O R T H C A R O L I N A
C O M P R E H E N S I V E A N N U A L F I N A N C I A L R E P O RT
F O R T H E F I S C A L Y E A R E N D E D J U N E 3 0 , 2 0 0 8


PR E PA R E D B Y TH E FI N A N C E DE PA RT M E N T
PE R RY E. JA M E S, III , CH I E F FI N A N C I A L OF F I C E R
C I T Y O F R A L E I G H , N O R T H C A R O L I N A
C O M P R E H E N S I V E A N N U A L F I N A N C I A L R E P O RT
F O R T H E F I S C A L Y E A R E N D E D J U N E 3 0 , 2 0 0 8

CITY OF RALEIGH
2008
TA
BL
EO
FC
ON
TE
NT
S
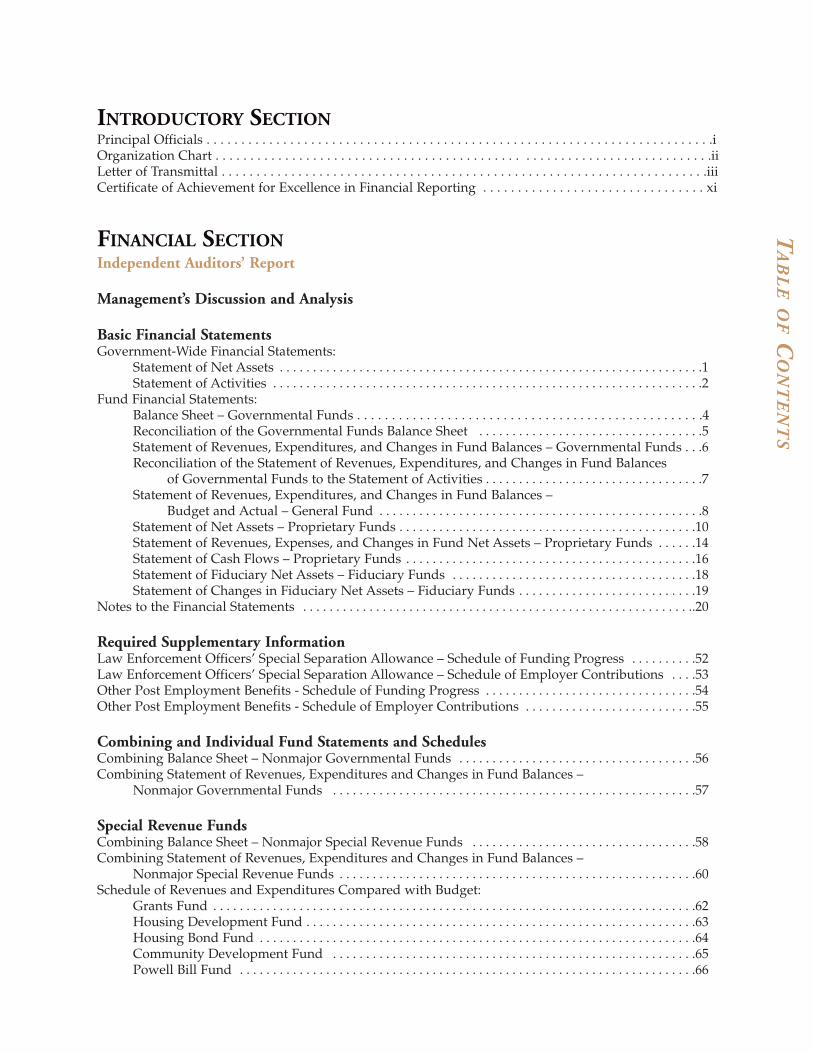
INTRODUCTORY SECTIONPrincipal Officials . . . . . . . . . . . . . . . . . . . . . . . . . . . . . . . . . . . . . . . . . . . . . . . . . . . . . . . . . . . . . . . . . . . . . . . . .i Organization Chart . . . . . . . . . . . . . . . . . . . . . . . . . . . . . . . . . . . . . . . . . . . . . . . . . . . . . . . . . . . . . . . . . . . . . . .iiLetter of Transmittal . . . . . . . . . . . . . . . . . . . . . . . . . . . . . . . . . . . . . . . . . . . . . . . . . . . . . . . . . . . . . . . . . . . . . .iii Certificate of Achievement for Excellence in Financial Reporting . . . . . . . . . . . . . . . . . . . . . . . . . . . . . . . . xi
FINANCIAL SECTIONIndependent Auditors’ Report
Management’s Discussion and Analysis
Basic Financial StatementsGovernment-Wide Financial Statements:
Statement of Net Assets . . . . . . . . . . . . . . . . . . . . . . . . . . . . . . . . . . . . . . . . . . . . . . . . . . . . . . . . . . . . . . . .1 Statement of Activities . . . . . . . . . . . . . . . . . . . . . . . . . . . . . . . . . . . . . . . . . . . . . . . . . . . . . . . . . . . . . . . . .2
Fund Financial Statements: Balance Sheet – Governmental Funds . . . . . . . . . . . . . . . . . . . . . . . . . . . . . . . . . . . . . . . . . . . . . . . . . .4 Reconciliation of the Governmental Funds Balance Sheet . . . . . . . . . . . . . . . . . . . . . . . . . . . . . . . . . .5 Statement of Revenues, Expenditures, and Changes in Fund Balances – Governmental Funds . . .6 Reconciliation of the Statement of Revenues, Expenditures, and Changes in Fund Balances
of Governmental Funds to the Statement of Activities . . . . . . . . . . . . . . . . . . . . . . . . . . . . . . . . .7 Statement of Revenues, Expenditures, and Changes in Fund Balances –
Budget and Actual – General Fund . . . . . . . . . . . . . . . . . . . . . . . . . . . . . . . . . . . . . . . . . . . . . . . . .8 Statement of Net Assets – Proprietary Funds . . . . . . . . . . . . . . . . . . . . . . . . . . . . . . . . . . . . . . . . . . . . .10 Statement of Revenues, Expenses, and Changes in Fund Net Assets – Proprietary Funds . . . . . .14 Statement of Cash Flows – Proprietary Funds . . . . . . . . . . . . . . . . . . . . . . . . . . . . . . . . . . . . . . . . . . . .16Statement of Fiduciary Net Assets – Fiduciary Funds . . . . . . . . . . . . . . . . . . . . . . . . . . . . . . . . . . . . .18Statement of Changes in Fiduciary Net Assets – Fiduciary Funds . . . . . . . . . . . . . . . . . . . . . . . . . . .19
Notes to the Financial Statements . . . . . . . . . . . . . . . . . . . . . . . . . . . . . . . . . . . . . . . . . . . . . . . . . . . . . . . . . . ..20
Required Supplementary InformationLaw Enforcement Officers’ Special Separation Allowance – Schedule of Funding Progress . . . . . . . . . .52Law Enforcement Officers’ Special Separation Allowance – Schedule of Employer Contributions . . . .53Other Post Employment Benefits - Schedule of Funding Progress . . . . . . . . . . . . . . . . . . . . . . . . . . . . . . . .54Other Post Employment Benefits - Schedule of Employer Contributions . . . . . . . . . . . . . . . . . . . . . . . . . .55
Combining and Individual Fund Statements and SchedulesCombining Balance Sheet – Nonmajor Governmental Funds . . . . . . . . . . . . . . . . . . . . . . . . . . . . . . . . . . . .56Combining Statement of Revenues, Expenditures and Changes in Fund Balances –
Nonmajor Governmental Funds . . . . . . . . . . . . . . . . . . . . . . . . . . . . . . . . . . . . . . . . . . . . . . . . . . . . . . .57
Special Revenue FundsCombining Balance Sheet – Nonmajor Special Revenue Funds . . . . . . . . . . . . . . . . . . . . . . . . . . . . . . . . . .58Combining Statement of Revenues, Expenditures and Changes in Fund Balances –
Nonmajor Special Revenue Funds . . . . . . . . . . . . . . . . . . . . . . . . . . . . . . . . . . . . . . . . . . . . . . . . . . . . . .60Schedule of Revenues and Expenditures Compared with Budget:
Grants Fund . . . . . . . . . . . . . . . . . . . . . . . . . . . . . . . . . . . . . . . . . . . . . . . . . . . . . . . . . . . . . . . . . . . . . . . . .62Housing Development Fund . . . . . . . . . . . . . . . . . . . . . . . . . . . . . . . . . . . . . . . . . . . . . . . . . . . . . . . . . . .63Housing Bond Fund . . . . . . . . . . . . . . . . . . . . . . . . . . . . . . . . . . . . . . . . . . . . . . . . . . . . . . . . . . . . . . . . . .64Community Development Fund . . . . . . . . . . . . . . . . . . . . . . . . . . . . . . . . . . . . . . . . . . . . . . . . . . . . . . .65Powell Bill Fund . . . . . . . . . . . . . . . . . . . . . . . . . . . . . . . . . . . . . . . . . . . . . . . . . . . . . . . . . . . . . . . . . . . . .66
TA
BL
EO
FC
ON
TE
NT
S
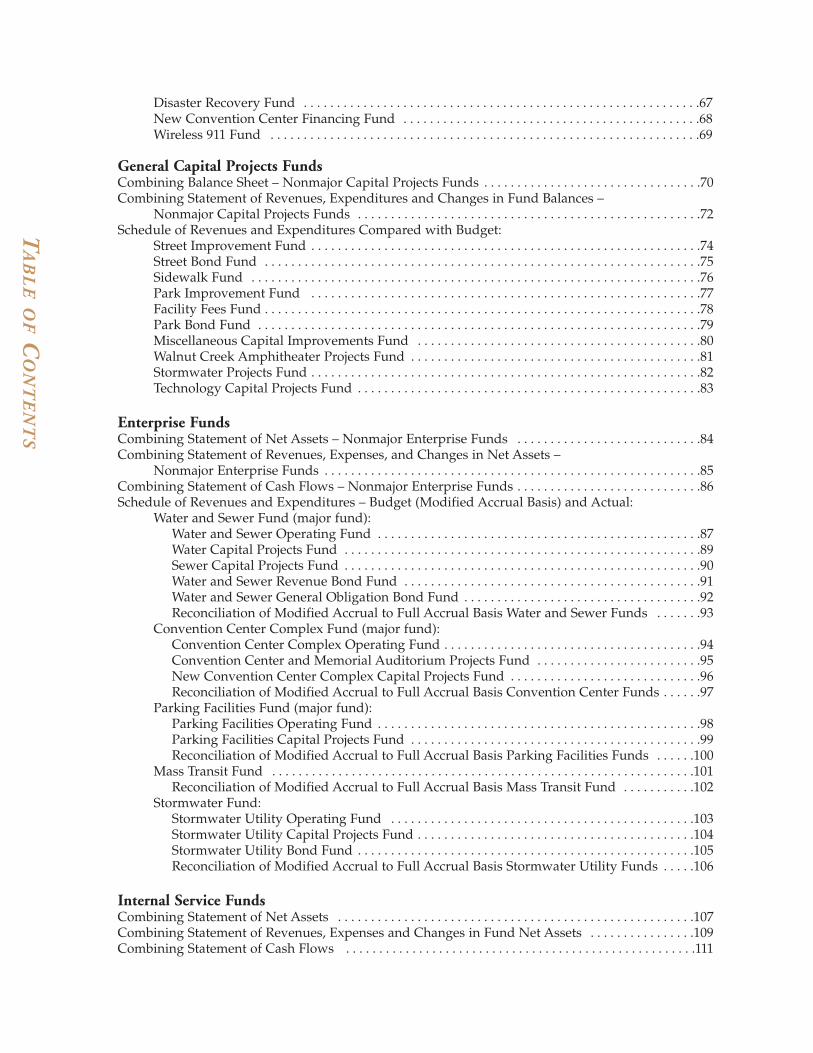
Disaster Recovery Fund . . . . . . . . . . . . . . . . . . . . . . . . . . . . . . . . . . . . . . . . . . . . . . . . . . . . . . . . . . . .67New Convention Center Financing Fund . . . . . . . . . . . . . . . . . . . . . . . . . . . . . . . . . . . . . . . . . . . . .68Wireless 911 Fund . . . . . . . . . . . . . . . . . . . . . . . . . . . . . . . . . . . . . . . . . . . . . . . . . . . . . . . . . . . . . . . . .69
General Capital Projects FundsCombining Balance Sheet – Nonmajor Capital Projects Funds . . . . . . . . . . . . . . . . . . . . . . . . . . . . . . . . .70 Combining Statement of Revenues, Expenditures and Changes in Fund Balances –
Nonmajor Capital Projects Funds . . . . . . . . . . . . . . . . . . . . . . . . . . . . . . . . . . . . . . . . . . . . . . . . . . . .72Schedule of Revenues and Expenditures Compared with Budget:
Street Improvement Fund . . . . . . . . . . . . . . . . . . . . . . . . . . . . . . . . . . . . . . . . . . . . . . . . . . . . . . . . . . .74Street Bond Fund . . . . . . . . . . . . . . . . . . . . . . . . . . . . . . . . . . . . . . . . . . . . . . . . . . . . . . . . . . . . . . . . . .75Sidewalk Fund . . . . . . . . . . . . . . . . . . . . . . . . . . . . . . . . . . . . . . . . . . . . . . . . . . . . . . . . . . . . . . . . . . . .76Park Improvement Fund . . . . . . . . . . . . . . . . . . . . . . . . . . . . . . . . . . . . . . . . . . . . . . . . . . . . . . . . . . .77Facility Fees Fund . . . . . . . . . . . . . . . . . . . . . . . . . . . . . . . . . . . . . . . . . . . . . . . . . . . . . . . . . . . . . . . . . .78Park Bond Fund . . . . . . . . . . . . . . . . . . . . . . . . . . . . . . . . . . . . . . . . . . . . . . . . . . . . . . . . . . . . . . . . . . .79Miscellaneous Capital Improvements Fund . . . . . . . . . . . . . . . . . . . . . . . . . . . . . . . . . . . . . . . . . . .80Walnut Creek Amphitheater Projects Fund . . . . . . . . . . . . . . . . . . . . . . . . . . . . . . . . . . . . . . . . . . . .81Stormwater Projects Fund . . . . . . . . . . . . . . . . . . . . . . . . . . . . . . . . . . . . . . . . . . . . . . . . . . . . . . . . . . .82Technology Capital Projects Fund . . . . . . . . . . . . . . . . . . . . . . . . . . . . . . . . . . . . . . . . . . . . . . . . . . . .83
Enterprise FundsCombining Statement of Net Assets – Nonmajor Enterprise Funds . . . . . . . . . . . . . . . . . . . . . . . . . . . .84Combining Statement of Revenues, Expenses, and Changes in Net Assets –
Nonmajor Enterprise Funds . . . . . . . . . . . . . . . . . . . . . . . . . . . . . . . . . . . . . . . . . . . . . . . . . . . . . . . . .85Combining Statement of Cash Flows – Nonmajor Enterprise Funds . . . . . . . . . . . . . . . . . . . . . . . . . . . .86Schedule of Revenues and Expenditures – Budget (Modified Accrual Basis) and Actual:
Water and Sewer Fund (major fund):Water and Sewer Operating Fund . . . . . . . . . . . . . . . . . . . . . . . . . . . . . . . . . . . . . . . . . . . . . . . . .87Water Capital Projects Fund . . . . . . . . . . . . . . . . . . . . . . . . . . . . . . . . . . . . . . . . . . . . . . . . . . . . . .89 Sewer Capital Projects Fund . . . . . . . . . . . . . . . . . . . . . . . . . . . . . . . . . . . . . . . . . . . . . . . . . . . . . .90Water and Sewer Revenue Bond Fund . . . . . . . . . . . . . . . . . . . . . . . . . . . . . . . . . . . . . . . . . . . . .91Water and Sewer General Obligation Bond Fund . . . . . . . . . . . . . . . . . . . . . . . . . . . . . . . . . . . .92Reconciliation of Modified Accrual to Full Accrual Basis Water and Sewer Funds . . . . . . .93
Convention Center Complex Fund (major fund): Convention Center Complex Operating Fund . . . . . . . . . . . . . . . . . . . . . . . . . . . . . . . . . . . . . . .94Convention Center and Memorial Auditorium Projects Fund . . . . . . . . . . . . . . . . . . . . . . . . .95New Convention Center Complex Capital Projects Fund . . . . . . . . . . . . . . . . . . . . . . . . . . . . .96Reconciliation of Modified Accrual to Full Accrual Basis Convention Center Funds . . . . . .97
Parking Facilities Fund (major fund): Parking Facilities Operating Fund . . . . . . . . . . . . . . . . . . . . . . . . . . . . . . . . . . . . . . . . . . . . . . . . .98 Parking Facilities Capital Projects Fund . . . . . . . . . . . . . . . . . . . . . . . . . . . . . . . . . . . . . . . . . . . .99Reconciliation of Modified Accrual to Full Accrual Basis Parking Facilities Funds . . . . . .100
Mass Transit Fund . . . . . . . . . . . . . . . . . . . . . . . . . . . . . . . . . . . . . . . . . . . . . . . . . . . . . . . . . . . . . . . .101Reconciliation of Modified Accrual to Full Accrual Basis Mass Transit Fund . . . . . . . . . . .102
Stormwater Fund:Stormwater Utility Operating Fund . . . . . . . . . . . . . . . . . . . . . . . . . . . . . . . . . . . . . . . . . . . . . .103Stormwater Utility Capital Projects Fund . . . . . . . . . . . . . . . . . . . . . . . . . . . . . . . . . . . . . . . . . .104Stormwater Utility Bond Fund . . . . . . . . . . . . . . . . . . . . . . . . . . . . . . . . . . . . . . . . . . . . . . . . . . .105Reconciliation of Modified Accrual to Full Accrual Basis Stormwater Utility Funds . . . . .106
Internal Service FundsCombining Statement of Net Assets . . . . . . . . . . . . . . . . . . . . . . . . . . . . . . . . . . . . . . . . . . . . . . . . . . . . . .107Combining Statement of Revenues, Expenses and Changes in Fund Net Assets . . . . . . . . . . . . . . . .109Combining Statement of Cash Flows . . . . . . . . . . . . . . . . . . . . . . . . . . . . . . . . . . . . . . . . . . . . . . . . . . . . .111
TA
BL
EO
FC
ON
TE
NT
S
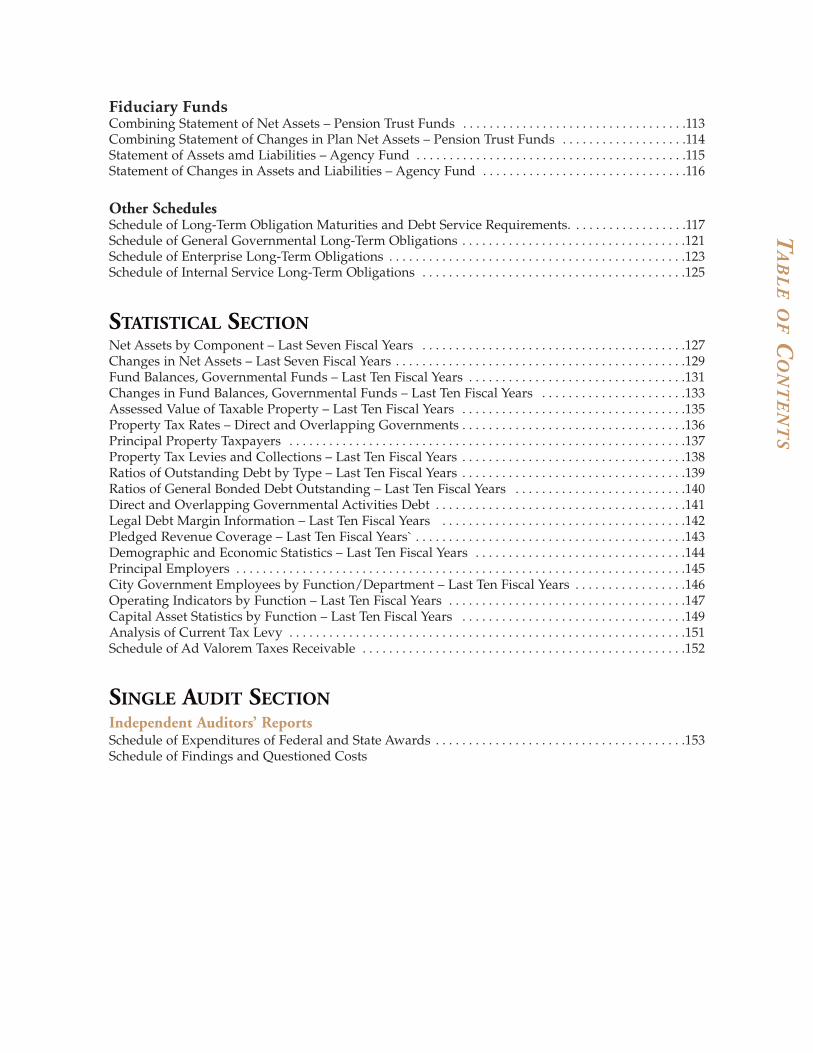
Fiduciary FundsCombining Statement of Net Assets – Pension Trust Funds . . . . . . . . . . . . . . . . . . . . . . . . . . . . . . . . . .113Combining Statement of Changes in Plan Net Assets – Pension Trust Funds . . . . . . . . . . . . . . . . . . .114Statement of Assets amd Liabilities – Agency Fund . . . . . . . . . . . . . . . . . . . . . . . . . . . . . . . . . . . . . . . . .115Statement of Changes in Assets and Liabilities – Agency Fund . . . . . . . . . . . . . . . . . . . . . . . . . . . . . . .116
Other SchedulesSchedule of Long-Term Obligation Maturities and Debt Service Requirements. . . . . . . . . . . . . . . . . .117Schedule of General Governmental Long-Term Obligations . . . . . . . . . . . . . . . . . . . . . . . . . . . . . . . . . .121Schedule of Enterprise Long-Term Obligations . . . . . . . . . . . . . . . . . . . . . . . . . . . . . . . . . . . . . . . . . . . . .123Schedule of Internal Service Long-Term Obligations . . . . . . . . . . . . . . . . . . . . . . . . . . . . . . . . . . . . . . . .125
STATISTICAL SECTIONNet Assets by Component – Last Seven Fiscal Years . . . . . . . . . . . . . . . . . . . . . . . . . . . . . . . . . . . . . . . .127 Changes in Net Assets – Last Seven Fiscal Years . . . . . . . . . . . . . . . . . . . . . . . . . . . . . . . . . . . . . . . . . . . .129Fund Balances, Governmental Funds – Last Ten Fiscal Years . . . . . . . . . . . . . . . . . . . . . . . . . . . . . . . . .131Changes in Fund Balances, Governmental Funds – Last Ten Fiscal Years . . . . . . . . . . . . . . . . . . . . . .133 Assessed Value of Taxable Property – Last Ten Fiscal Years . . . . . . . . . . . . . . . . . . . . . . . . . . . . . . . . . .135Property Tax Rates – Direct and Overlapping Governments . . . . . . . . . . . . . . . . . . . . . . . . . . . . . . . . . .136 Principal Property Taxpayers . . . . . . . . . . . . . . . . . . . . . . . . . . . . . . . . . . . . . . . . . . . . . . . . . . . . . . . . . . . .137 Property Tax Levies and Collections – Last Ten Fiscal Years . . . . . . . . . . . . . . . . . . . . . . . . . . . . . . . . . .138Ratios of Outstanding Debt by Type – Last Ten Fiscal Years . . . . . . . . . . . . . . . . . . . . . . . . . . . . . . . . . .139Ratios of General Bonded Debt Outstanding – Last Ten Fiscal Years . . . . . . . . . . . . . . . . . . . . . . . . . .140 Direct and Overlapping Governmental Activities Debt . . . . . . . . . . . . . . . . . . . . . . . . . . . . . . . . . . . . . .141Legal Debt Margin Information – Last Ten Fiscal Years . . . . . . . . . . . . . . . . . . . . . . . . . . . . . . . . . . . . .142Pledged Revenue Coverage – Last Ten Fiscal Years` . . . . . . . . . . . . . . . . . . . . . . . . . . . . . . . . . . . . . . . . .143 Demographic and Economic Statistics – Last Ten Fiscal Years . . . . . . . . . . . . . . . . . . . . . . . . . . . . . . . .144 Principal Employers . . . . . . . . . . . . . . . . . . . . . . . . . . . . . . . . . . . . . . . . . . . . . . . . . . . . . . . . . . . . . . . . . . . .145 City Government Employees by Function/Department – Last Ten Fiscal Years . . . . . . . . . . . . . . . . .146 Operating Indicators by Function – Last Ten Fiscal Years . . . . . . . . . . . . . . . . . . . . . . . . . . . . . . . . . . . .147Capital Asset Statistics by Function – Last Ten Fiscal Years . . . . . . . . . . . . . . . . . . . . . . . . . . . . . . . . . .149Analysis of Current Tax Levy . . . . . . . . . . . . . . . . . . . . . . . . . . . . . . . . . . . . . . . . . . . . . . . . . . . . . . . . . . . .151Schedule of Ad Valorem Taxes Receivable . . . . . . . . . . . . . . . . . . . . . . . . . . . . . . . . . . . . . . . . . . . . . . . . .152
SINGLE AUDIT SECTIONIndependent Auditors’ ReportsSchedule of Expenditures of Federal and State Awards . . . . . . . . . . . . . . . . . . . . . . . . . . . . . . . . . . . . . .153Schedule of Findings and Questioned Costs

CITY OF RALEIGH
2008

IN
TR
OD
UC
TO
RY
SE
CT
ION
IN T RO D U C TO RY SE C T I O N


INT
RO
DU
CT
OR
YS
EC
TIO
N
J. Russell Allen
CITY MANAGER
Lawrence E. Wray
ASSISTANT CITY MANAGER
Julian B. Prosser, Jr.
ASSISTANT CITY MANAGER
Daniel A. Howe
ASSISTANT CITY MANAGER
Thomas A. McCormick, Jr.
CITY ATTORNEY
Gail G. Smith
CITY CLERK
Perry E. James, III
CHIEF FINANCIAL OFFICER
CITY ADMINISTRATIVE, LEGAL AND FINANCIAL STAFF
J. Russell AllenCity Manager
Perry E. James. IIIChief Financial Officer
RALEIGH CITY COUNCIL - 2007-2008
i
First row: James P. West, Nancy McFarlane, Mary-Ann Baldwin, Charles C. Meeker Second row: Russ Stephenson, Rodger Koopman Third row: Thomas Crowder, Philip R. Isley
Charles C. Meeker - MAYOR
James P. West - MAYOR PROTEM, DISTRICT C
Nancy McFarlane - DISTRICT A
Rodger Koopman - DISTRICT B
Thomas Crowder - DISTRICT D
Philip R. Isley - DISTRICT E
Mary-Ann Baldwin - AT LARGE
Russ Stephenson - AT LARGE
INT
RO
DU
CT
OR
YS
EC
TIO
N
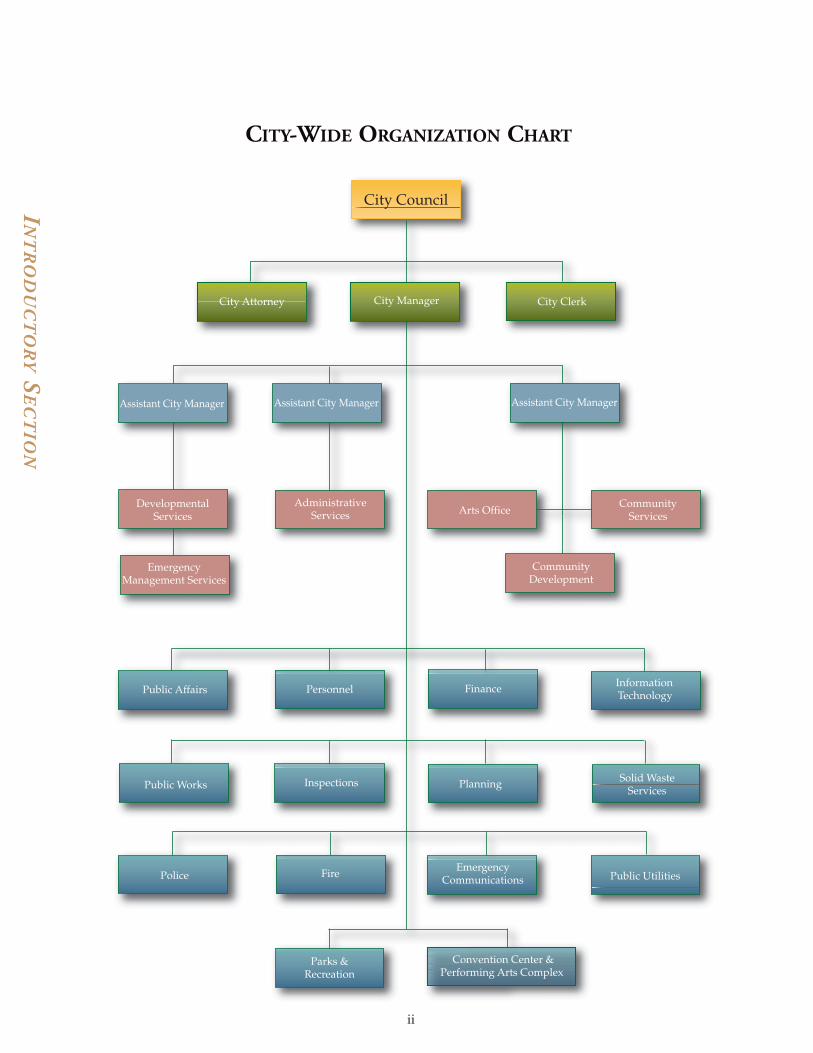
CITY-WIDE ORGANIZATION CHART
City Council
City Attorney City Manager City Clerk
Public Affairs Finance InformationTechnology
Convention Center &Performing Arts Complex
AdministrativeServices
Assistant City Manager
DevelopmentalServices
Assistant City ManagerAssistant City Manager
Inspections
Public UtilitiesEmergency
CommunicationsFire
EmergencyManagement Services
Arts Office
CommunityDevelopment
CommunityServices
Personnel
Public Works Planning Solid WasteServices
Police
Parks &Recreation
ii
INT
RO
DU
CT
OR
YS
EC
TIO
N
iii
TO THE HONORABLE MAYOR AND MEMBERS OF THE CITY COUNCIL
AND CITIZENS OF THE CITY OF RALEIGH, NORTH CAROLINA
t is our pleasure to submit the Comprehensive Annual Financial Report of the City ofRaleigh, North Carolina for the fiscal year ended June 30, 2008. State law requires that allgeneral-purpose local governments annually publish a complete set of financial statements.The financial statements must be presented in conformity with generally accepted
accounting principles (GAAP) and audited in accordance with generally accepted auditing standardsby a firm of licensed certified public accountants. This report complies with these requirements.
The Comprehensive Annual Financial Report consist of management’s representations concerning thefinances of the City. Consequently, management assumes full responsibility for the completeness andreliability of all of the information presented in this report. To provide a reasonable basis for makingthese representations, management of the City has established a comprehensive internal controlframework that is designed both to protect City assets from loss, theft, or misuse and to compilesufficient reliable information for the preparation of the City’s financial statements in conformity withGAAP. Because the cost of the internal controls should not outweigh their benefits, the City’scomprehensive framework of internal controls has been designed to provide reasonable rather thanabsolute assurance that the financial statements will be free from material misstatement. Asmanagement, we assert that, to the best of our knowledge and belief, this financial report is completeand reliable in all material respects.
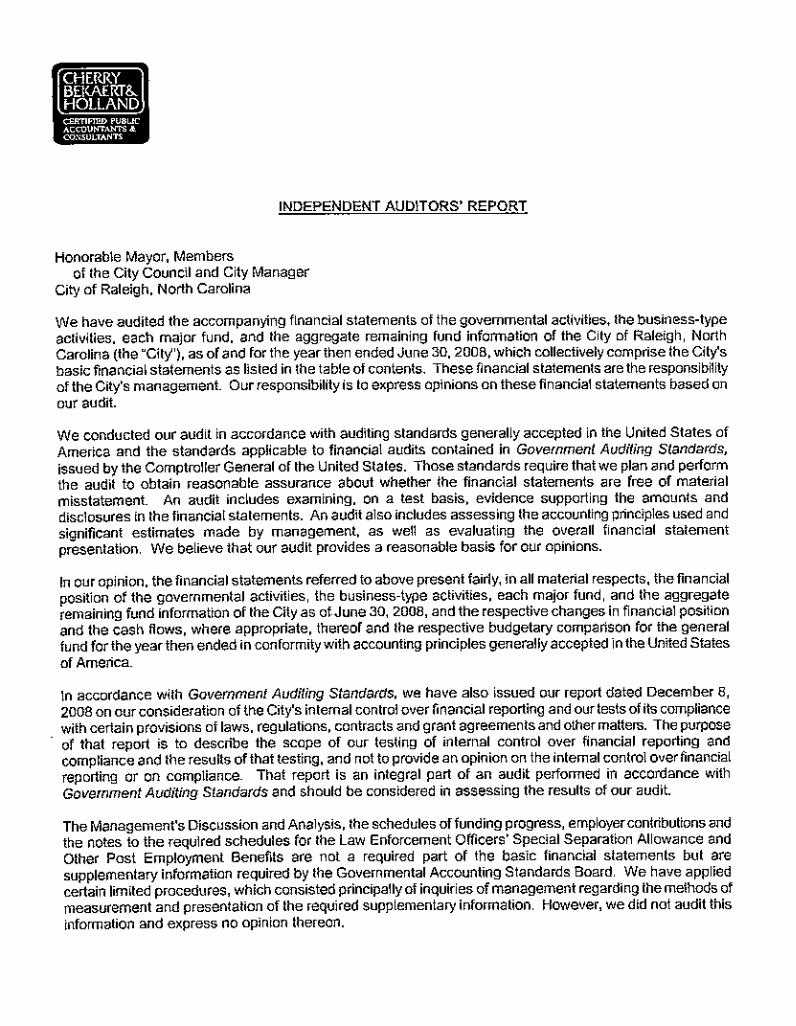
The City’s financial statements have been audited by Cherry, Bekaert & Holland, LLP, a firm oflicensed certified public accountants. The goal of the independent audit is to provide reasonableassurance that the financial statements of the City for the fiscal year ended June 30, 2008, are free ofmaterial misstatement. The independent auditor concluded, based upon the audit, that the City’sfinancial statements for the fiscal year ended June 30, 2008 are fairly presented in conformity withGAAP. The independent auditor’s report is presented as the first component of the financial sectionof this report.
The independent audit of the financial statements of the City was part of a broader, federal and statemandated “Single Audit” designed to meet the special needs of grantor agencies. The standardsgoverning Single Audit engagements require the independent auditor to report not only on the fairpresentation of the financial statements, but also on the audited government’s internal controls andcompliance with legal requirements, with special emphasis on internal controls and legalrequirements involving the administration of federal and state awards. These auditor reports areavailable in the Single Audit section of this report.
GAAP require that management provide a narrative introduction, overview, and analysis toaccompany the basic financial statements in the form of Management’s Discussion and Analysis(MD&A). This letter of transmittal is designed to complement MD&A and should be read inconjunction with it. The City’s MD&A can be found immediately following the report of theindependent auditors.
December 8, 2008
222 WEST HARGETT STREET • P.O. BOX 590 • RALEIGH, NORTH CAROLINA 27602
I

iv
INT
RO
DU
CT
OR
YS
EC
TIO
N
PROFILE OF CITY OF RALEIGH
aleigh is situated in the heart of the State of North Carolina, in a section called thePiedmont region, 150 miles from the Atlantic Ocean and 190 miles from the GreatSmoky Mountains. The City, the county seat of Wake County and the capital of NorthCarolina, covers an
area of more than 140 squaremiles and has an estimatedpopulation of 380,173. The Cityforms one point of the ResearchTriangle Park developed in 1959for industrial, governmental andscientific research, with ChapelHill and Durham at the other twopoints. The City is located in ametropolitan area consisting ofWake, Durham, Orange, Franklin,Chatham and Johnston counties.The population for this area isestimated to be 1,488,000 and, inMarch 2008, the U.S. CensusBureau called this area the thirdfastest growing metro in thenation.
The North Carolina General Assembly purchased land for the original site of the City for thespecific purpose of being the Capital of North Carolina. The City was established in 1792 by anact of the General Assembly and has utilized a council-manager form of government since 1947.The Mayor and two Council members are elected at-large, and the remaining five Councilmembers are elected from five districts within the City. The Mayor and Council members servetwo-year terms and all have an equal vote. The City Council sets policies, enacts ordinances andappoints the City Manager. The City Manager administers the daily operations and programs ofthe City through the department heads, other staff members and employees.
The City provides the full range of governmental services, including police and fire protection,street construction and maintenance, a comprehensive solid waste program, water and sanitarysewer services, parks, recreation and cultural services, a variety of transportation and publicworks programs, and other traditional support activities. Extended planning on the city’sinfrastructure needs occurs on an ongoing basis resulting in the present infrastructure being inexcellent condition.
The City is empowered to levy a property tax on both real and personal properties located withinits boundaries. It is also empowered by state statute to extend its corporate limits by annexation,which occurs periodically when deemed appropriate by the governing council.
The Annual Budget serves as the foundation of the City’s financial planning and control. The CityCouncil is required to hold public hearings on the proposed budget and to adopt a final budget nolater than June 30, the close of the City’s fiscal year. The appropriated budget is prepared by fund,function (e.g., public safety), and department (e.g., police). Department heads, for transfers up to$10,000, or the City Manager, for transfers above $10,000 up to $50,000, may approve transfers ofappropriations within a fund. Transfers greater than $50,000 and transfers of appropriationsbetween funds require approval of the City Council.
290,000
300,000
310,000
320,000
330,000
340,000
350,000
360,000
370,000
380,000
2004 2005 2006 2007 2008
328,
880 34
2,19
4 353,
604 36
7,99
5
380,
173
390,000
Five-Year Population Growth
R
v
INT
RO
DU
CT
OR
YS
EC
TIO
N
ECONOMIC CONDITIONS AND OUTLOOK
he information presented in the financial statements is perhaps best understood whenit is considered from the broader perspective of the specific environment within which theCity operates.
Raleigh is consistently recognized by independent sources as one of the best metropolitanareas for jobs in the U.S. In a recent report, Forbes Magazine noted “…The city has lowunemployment, strong income and job growth and high incomes… yet it still maintains a relativelylow cost of living…” Raleigh is one of the fastest growing areas in the country and is rated one ofthe top 10 cities for relocation in the U.S. and in the top 50 cities in the country in population. Notwithstanding current economic conditions, a good business environment, top universities, andoutstanding health care facilities are some of the attributes that attract people to the area. The mildclimate, diverse work force and proximity to Research Triangle Park, a nationally recognized centerfor research and light manufacturing adjacent to the City, combine to make the City a great place tolive. The City has experienced significant growth in population, land area and commercial activityfor a number of years. As the Capital of the State, the City derives its economic profile from adiverse combination of business and employment centers, including State government, highereducation, light manufacturing and retail trade. The City is the home of the principal executive,judicial and regulatory offices of State government, as well as six public and private institutions ofhigher education, including North Carolina State University, the largest university in North Carolina.
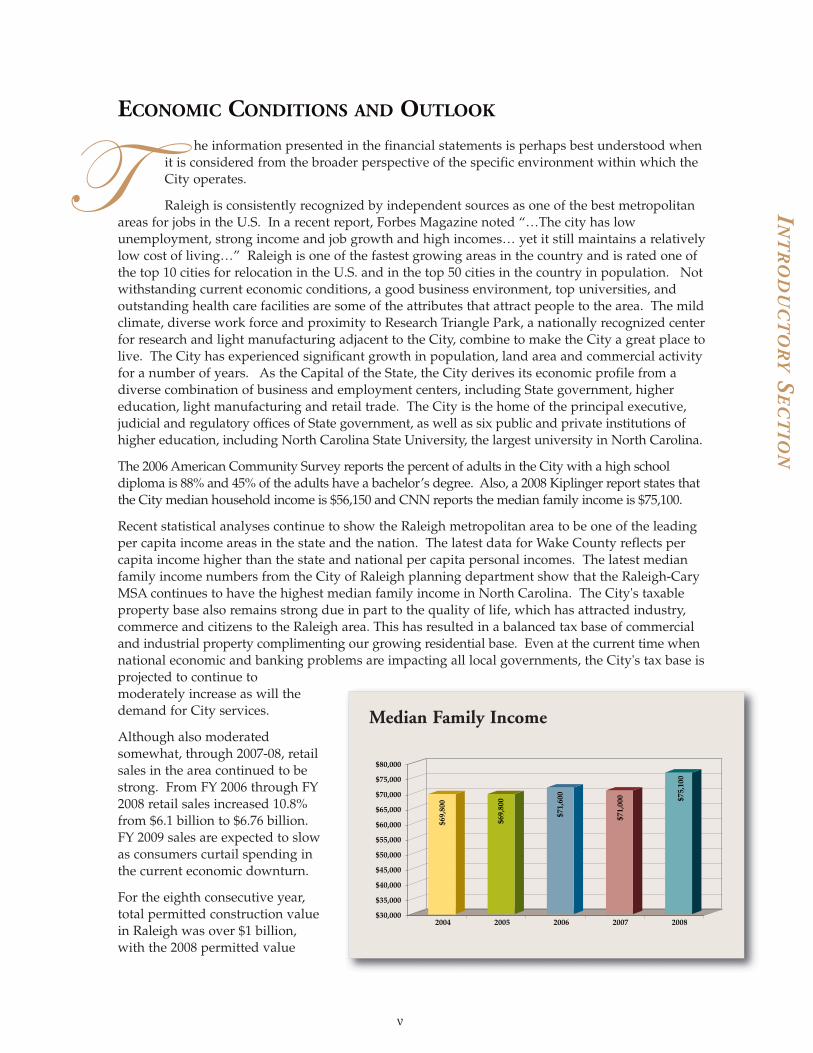
The 2006 American Community Survey reports the percent of adults in the City with a high schooldiploma is 88% and 45% of the adults have a bachelor’s degree. Also, a 2008 Kiplinger report states thatthe City median household income is $56,150 and CNN reports the median family income is $75,100.
Recent statistical analyses continue to show the Raleigh metropolitan area to be one of the leadingper capita income areas in the state and the nation. The latest data for Wake County reflects percapita income higher than the state and national per capita personal incomes. The latest medianfamily income numbers from the City of Raleigh planning department show that the Raleigh-CaryMSA continues to have the highest median family income in North Carolina. The City's taxableproperty base also remains strong due in part to the quality of life, which has attracted industry,commerce and citizens to the Raleigh area. This has resulted in a balanced tax base of commercialand industrial property complimenting our growing residential base. Even at the current time whennational economic and banking problems are impacting all local governments, the City's tax base isprojected to continue tomoderately increase as will thedemand for City services.
Although also moderatedsomewhat, through 2007-08, retailsales in the area continued to bestrong. From FY 2006 through FY2008 retail sales increased 10.8%from $6.1 billion to $6.76 billion.FY 2009 sales are expected to slowas consumers curtail spending inthe current economic downturn.
For the eighth consecutive year,total permitted construction valuein Raleigh was over $1 billion,with the 2008 permitted value
$30,000
$35,000
$40,000
$45,000
$50,000
$55,000
$60,000
$65,000
$70,000
$75,000
$80,000
2004 2005 2006 2007 2008
$69,
800
$69,
800
$71,
600
$71,
000 $7
5,10
0
Median Family Income
T
INT
RO
DU
CT
OR
YS
EC
TIO
N
vi
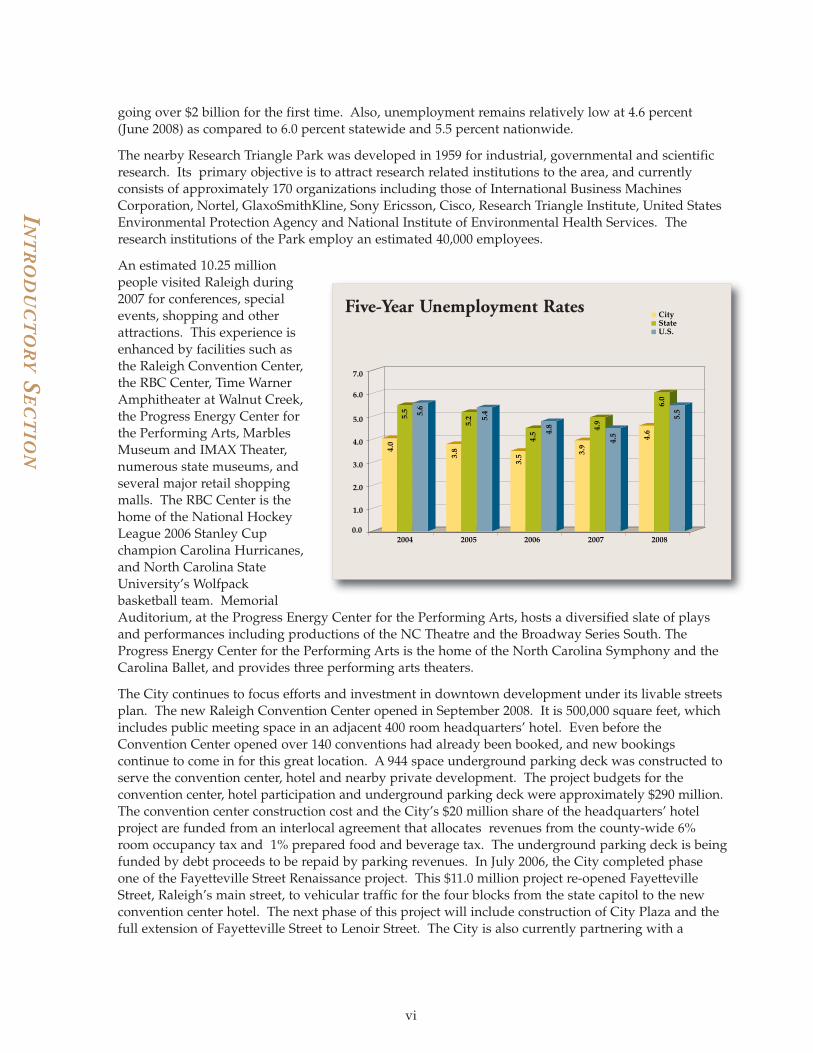
going over $2 billion for the first time. Also, unemployment remains relatively low at 4.6 percent (June 2008) as compared to 6.0 percent statewide and 5.5 percent nationwide.
The nearby Research Triangle Park was developed in 1959 for industrial, governmental and scientificresearch. Its primary objective is to attract research related institutions to the area, and currentlyconsists of approximately 170 organizations including those of International Business MachinesCorporation, Nortel, GlaxoSmithKline, Sony Ericsson, Cisco, Research Triangle Institute, United StatesEnvironmental Protection Agency and National Institute of Environmental Health Services. Theresearch institutions of the Park employ an estimated 40,000 employees.
An estimated 10.25 millionpeople visited Raleigh during2007 for conferences, specialevents, shopping and otherattractions. This experience isenhanced by facilities such asthe Raleigh Convention Center,the RBC Center, Time WarnerAmphitheater at Walnut Creek,the Progress Energy Center forthe Performing Arts, MarblesMuseum and IMAX Theater,numerous state museums, andseveral major retail shoppingmalls. The RBC Center is thehome of the National HockeyLeague 2006 Stanley Cupchampion Carolina Hurricanes,and North Carolina StateUniversity’s Wolfpackbasketball team. MemorialAuditorium, at the Progress Energy Center for the Performing Arts, hosts a diversified slate of playsand performances including productions of the NC Theatre and the Broadway Series South. TheProgress Energy Center for the Performing Arts is the home of the North Carolina Symphony and theCarolina Ballet, and provides three performing arts theaters.
The City continues to focus efforts and investment in downtown development under its livable streetsplan. The new Raleigh Convention Center opened in September 2008. It is 500,000 square feet, whichincludes public meeting space in an adjacent 400 room headquarters’ hotel. Even before theConvention Center opened over 140 conventions had already been booked, and new bookingscontinue to come in for this great location. A 944 space underground parking deck was constructed toserve the convention center, hotel and nearby private development. The project budgets for theconvention center, hotel participation and underground parking deck were approximately $290 million.The convention center construction cost and the City’s $20 million share of the headquarters’ hotelproject are funded from an interlocal agreement that allocates revenues from the county-wide 6%room occupancy tax and 1% prepared food and beverage tax. The underground parking deck is beingfunded by debt proceeds to be repaid by parking revenues. In July 2006, the City completed phaseone of the Fayetteville Street Renaissance project. This $11.0 million project re-opened FayettevilleStreet, Raleigh’s main street, to vehicular traffic for the four blocks from the state capitol to the newconvention center hotel. The next phase of this project will include construction of City Plaza and thefull extension of Fayetteville Street to Lenoir Street. The City is also currently partnering with a
CityStateU.S.
1.0
2.0
3.0
4.0
5.0
6.0
7.0
2004 2005 2006 2007 20080.0
4.0
5.5 5.6
3.8
5.2 5.
4
3.5
4.5 4.
8
4.5
3.9
4.9
4.6
6.0
5.5
Five-Year Unemployment Rates

INT
RO
DU
CT
OR
YS
EC
TIO
N
vii
private development group to do a long-term capital lease of an underground parking deck under aplanned adjoining mixed use complex. It is expected that these major projects will continue to becatalysts in attracting new, private development to downtown Raleigh, such as the $100 million, 32-story corporate headquarters building for RBC Centura Bank, that was recently constructed onFayetteville Street and opened in October 2008.
In addition to the new commercial development, construction has recently been completed, or is inprocess, on several major housing developments in the downtown area with additional developmentin the planning stage. Approximately 2,515 new residential units are planned to be completed byDecember 2008. Over7,000 housing units(includes for sale, forlease, historic districtsingle family, seniorhousing, affordablehousing and studenthousing) are pro jected tobe within or adjacent tothe downtown businessimprovement district byDecember 2008. Some ofthese projects have beendelayed as a result of thecurrent economicconditions.
Current economicconditions will likely slowgrowth in the tax base andour largest revenue source,property taxes. Sales tax,our second largest revenuesource, is also unfavorablyimpacted by reducedconsumer spendingresulting from thedeclining economy;however, the localeconomy has, thus far,fared better than theoverall national economy.The city’s stableemployment andpopulation base willbenefit Raleigh’s efforts toweather the currentdownturn. MSNBCranked Raleigh as #2 in aNovember, 2008 listing ofcities being able to weatherthe current fiscal crisis.
$25
$26
$27
$28
$29
$30
$31
$32
$33
$34
$35
$36
2004 2005 2006 2007 2008
$29.
4 $30.
7
$32.
2 $33.
6
$35.
1
Bil
lion
s
Five-Year Assessed Values
-$200
$400
$600$800
$1,000$1,200
$1,400
$1,600$1,800
$2,000$2,200
$2,400
$2,600
2004 2005 2006 2007 2008
$1,
244
$1,
385 $
1,69
5
$1,
820
$ 2
,376
Mil
lion
s
Construction ActivityValue of Building Permits - Commercial and Residential
INT
RO
DU
CT
OR
YS
EC
TIO
N
viii
LONG-TERM FINANCIAL PLANNING
he City seeks to consistently maintain a strong financial position as evidenced by itsAAA/Aaa ratings from the 3 major credit rating agencies. This objective requires regularlong-term planning of operating and capital requirements for its major general govern -ment and enterprise programs. In doing so, the City relies on key financial policies and
procedures for dealing with future events in financially responsible ways.
Annually the City adopts a 10-year Capital Improvement Program (CIP) that looks ahead toproject and plan for capital needs. Phase I encompasses the first 5 years of the CIP and addressesboth project needs and financial strategy for this period. Phase II of the program, spanning thesecond 5-year period, includes longer range projects identified as necessary for the continuation ofexisting service levels to the citizens of the City.
Phase I of the CIP spans fiscal years 2007-08 through 2011-12. The major areas included in Phase Iare transportation, public utilities, parks, housing, stormwater utility, the Neuse Basin environ -mental program, and general public improvements. The public utilities and transportationprograms represent the largest portions of the CIP due to the strong growth of our area and thelarge amount of utility and transportation needs.
A key financial goal of the City for many years has been the maintenance of a 14% undesignatedfund balance level in the General Fund. In addition, the City has desired to appropriate aconsistent level of fund balance each year resulting from positive budget variances. These goalsare met in the fiscal year 2008 results that are built into the 2008-09 operating budgets. A numberof financial models are also used in the budget process and provide a means of projecting long-term resource requirements. These include a debt model, a parking fund model, a cash flowmodel, rate sensitivity analyses and financing proformas. Other practices followed are designed toavoid the meeting of recurring expense needs with one-time revenue resources and to ensure anongoing mix of pay-as-you-go funding of capital needs with long-term debt.
MAJOR INITIATIVES
For the Year 2007-08
The City’s Annual Budget for 2007-08, inclusive of operating and capital programs, grew by 8.5percent from the prior year. The property tax rate remained at $.435 per $100 of assessed value,and tax revenues were projected to grow at 5%. Sales tax growth was projected at 6.4%. Waterand sewer rates were increased 9% in order to adequately maintain both parity debt covenants andthe City’s fund balance goals for the utilities operating fund. Other revenue adjustments includeda second increment of a Council approved plan to increase facility fee rates, and a full implemen-tation of the revenue indexing program in development services. Cost increases to existingoperations included employee compensation, health insurance, other post employment benefits, anew after-school parks program, fuel costs and initial phases of an enterprise resource planningsystem.
Ongoing City growth, as well as new capital facilities, also required appropriate investments innew personnel resources and other operating costs that were associated with those needs.
Capital improvement budgets in 2007-08 included the programming of remaining capitalexpenditures associated with the 2003 Parks Bond, the 2005 Transportation and Housing Bonds,and a significant amount of general capital projects including $284 million for the Clarence E.Lightner Public Safety Center and various remote operating facilities. Other key capital projectsbudgeted focused on transportation, stormwater, water and sewer utility infrastructure, andaffordable housing.
T
INT
RO
DU
CT
OR
YS
EC
TIO
N
ix
For the Future
The fiscal year 2008-09 Annual Budget was adopted by the City Council on June 23, 2008. Thecombined capital and operating budget for the fiscal year beginning July 1, 2008 totals $644,755,290,representing a 15.7% increase from the FY 2007-08 Annual Budget. Based on property revaluation,a revenue neutral tax was calculated, then increased by 4.18 cents to a property tax rate of $.3735 per$100 of assessed value to cover General Fund operations and capital projects debt service. Waterand sewer rates were increased 15% to maintain ongoing operations and capital investment goals.
Other major revenue components of the 2008-09 operating budget include increased facility feesestimated to bring in an annual amount of $4.2 million, a $400 increase in the nutrient reduction feeand the continuation of a revenue indexing program in development services. The 2008-09operating budget funds the continuation of current operations and provides additional funding and staffing for various needs associated with the City’s growth, expansion of facilities and newprograms. Including approved changes at mid-year, a total of 147 new positions are authorized.Of this total, 79 are in the General Fund, 24 in Public Utilities and 44 in other funds.
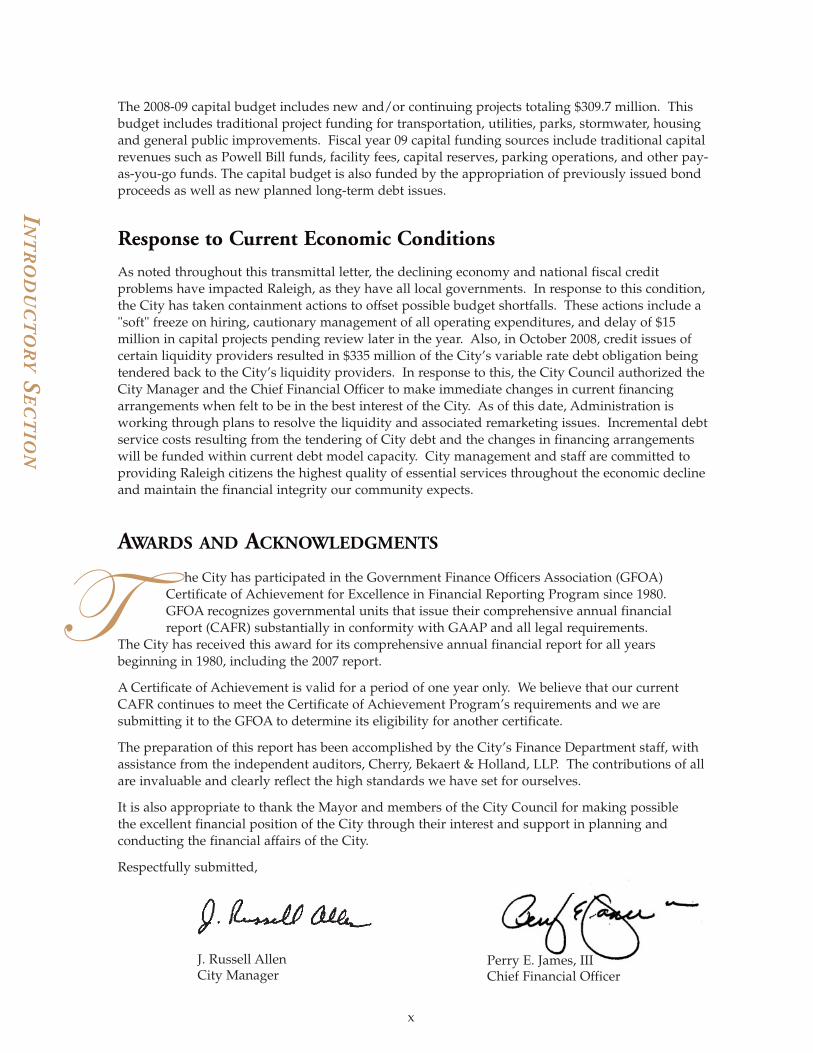
14.6%
11.5%
8.2%
Public safety - $134.6 mCapital debt service - $81.2 mPublic utilities - $75.5 mLeisure services - $63.9 mCapital improvements - $46.0 mPublic works & public transit - $44.7 mCommunity development services - $34.9 m
Solid waste services - $22.7 mInformation technology - $13.2 mFinancial management - $10.9 m
1.9%
4.1%5.3%
6.3%24.2%
General government and external agencies - $29.5 m
2.4%
13.5%
8.0%
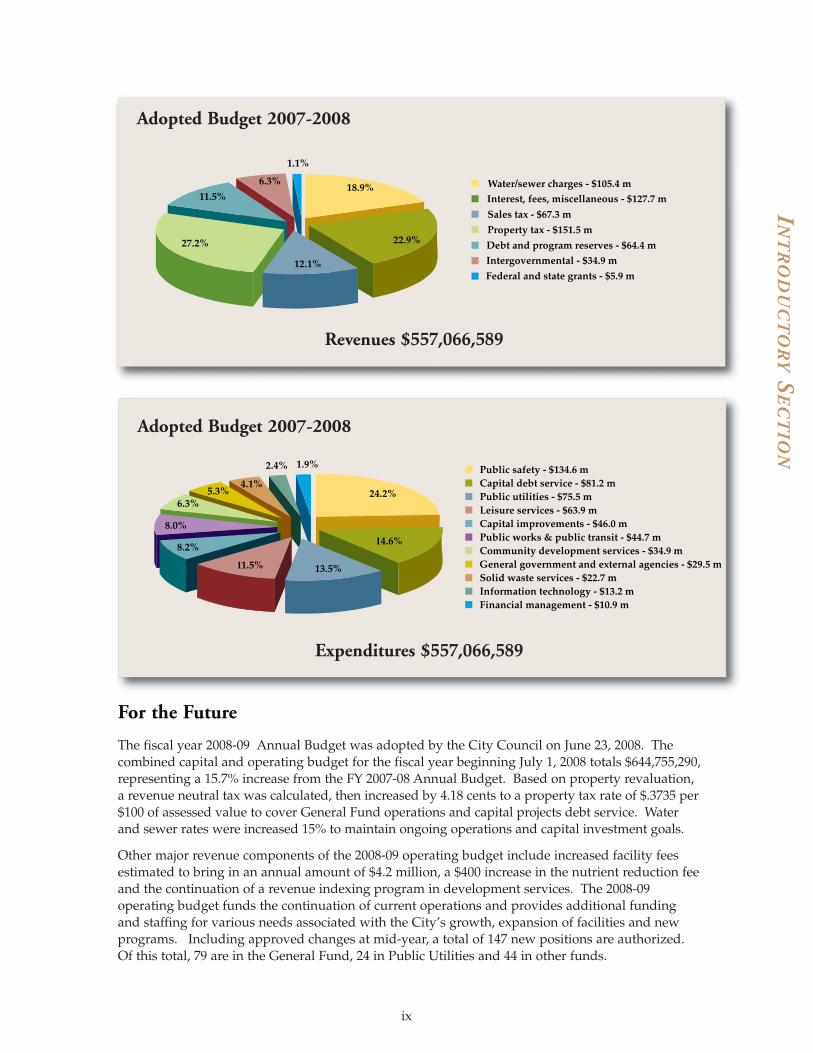
Sales tax - $67.3 m
Property tax - $151.5 m27.2%
12.1%
22.9%
18.9%6.3%
11.5% Interest, fees, miscellaneous - $127.7 m
Debt and program reserves - $64.4 m
Intergovernmental - $34.9 m
1.1%
Federal and state grants - $5.9 m
Water/sewer charges - $105.4 m
Expenditures $557,066,589
Revenues $557,066,589
Adopted Budget 2007-2008
Adopted Budget 2007-2008
The 2008-09 capital budget includes new and/or continuing projects totaling $309.7 million. Thisbudget includes traditional project funding for transportation, utilities, parks, stormwater, housingand general public improvements. Fiscal year 09 capital funding sources include traditional capitalrevenues such as Powell Bill funds, facility fees, capital reserves, parking operations, and other pay-as-you-go funds. The capital budget is also funded by the appropriation of previously issued bondproceeds as well as new planned long-term debt issues.
Response to Current Economic Conditions
As noted throughout this transmittal letter, the declining economy and national fiscal creditproblems have impacted Raleigh, as they have all local governments. In response to this condition,the City has taken containment actions to offset possible budget shortfalls. These actions include a"soft" freeze on hiring, cautionary management of all operating expenditures, and delay of $15million in capital projects pending review later in the year. Also, in October 2008, credit issues ofcertain liquidity providers resulted in $335 million of the City’s variable rate debt obligation beingtendered back to the City’s liquidity providers. In response to this, the City Council authorized theCity Manager and the Chief Financial Officer to make immediate changes in current financingarrangements when felt to be in the best interest of the City. As of this date, Administration isworking through plans to resolve the liquidity and associated remarketing issues. Incremental debtservice costs resulting from the tendering of City debt and the changes in financing arrangementswill be funded within current debt model capacity. City management and staff are committed toproviding Raleigh citizens the highest quality of essential services throughout the economic declineand maintain the financial integrity our community expects.
AWARDS AND ACKNOWLEDGMENTS
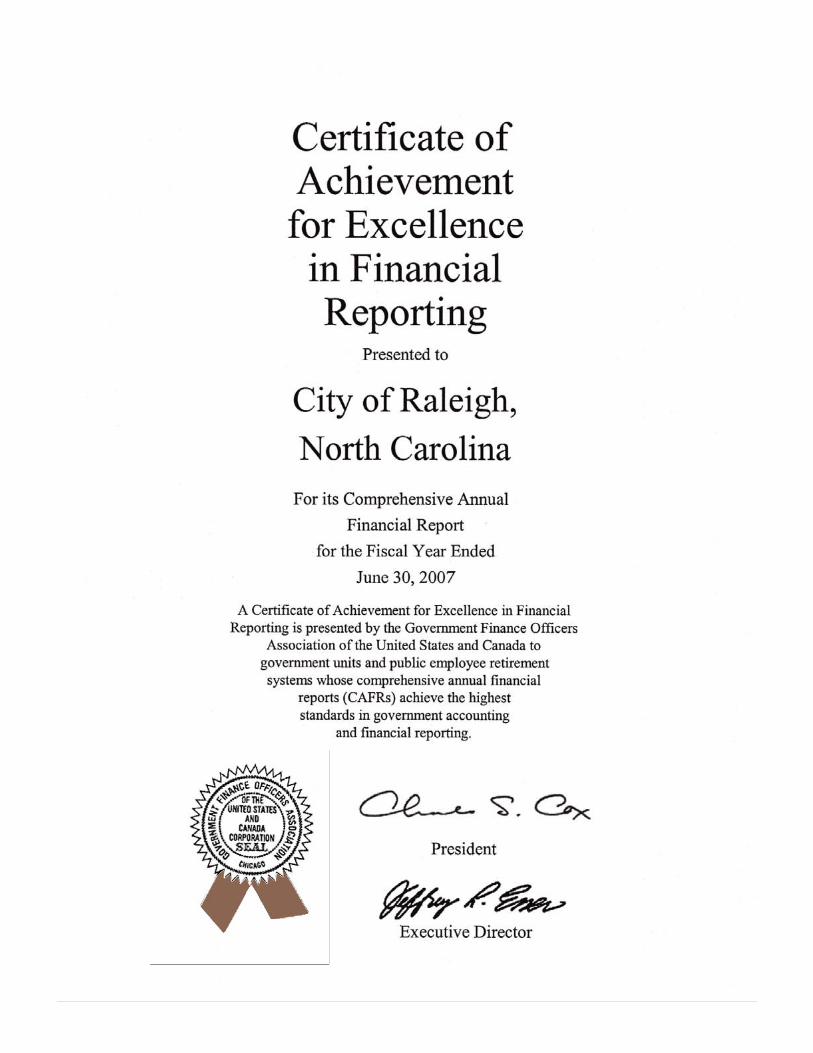
he City has participated in the Government Finance Officers Association (GFOA)Certificate of Achievement for Excellence in Financial Reporting Program since 1980. GFOA recognizes governmental units that issue their comprehensive annual financial report (CAFR) substantially in conformity with GAAP and all legal requirements.
The City has received this award for its comprehensive annual financial report for all yearsbeginning in 1980, including the 2007 report.
A Certificate of Achievement is valid for a period of one year only. We believe that our currentCAFR continues to meet the Certificate of Achievement Program’s requirements and we aresubmitting it to the GFOA to determine its eligibility for another certificate.
The preparation of this report has been accomplished by the City’s Finance Department staff, withassistance from the independent auditors, Cherry, Bekaert & Holland, LLP. The contributions of allare invaluable and clearly reflect the high standards we have set for ourselves.
It is also appropriate to thank the Mayor and members of the City Council for making possible the excellent financial position of the City through their interest and support in planning andconducting the financial affairs of the City.
Respectfully submitted,
INT
RO
DU
CT
OR
YS
EC
TIO
N
J. Russell AllenCity Manager
x
Perry E. James, IIIChief Financial Officer
T

CITY OF RALEIGH
2008

FIN
AN
CIA
LS
EC
TIO
N
FI N A N C I A L SE C T I O N


MANAGEMENT’S DISCUSSION AND ANALYSIS
As management of the City of Raleigh (the City), we offer readers of the City’s financial statementsthis narrative overview and analysis of the financial activities of the City for the fiscal year endedJune 30, 2008. Please read it in conjunction with the transmittal letter at the front of this report andthe City’s financial statements, which follow this section.
FINANCIAL HIGHLIGHTS
• The assets of the City of Raleigh exceeded its liabilities at the close of the most recent fiscal yearby $1.56 billion (net assets). This amount is a $78.5 million increase from last year. Of thisamount, $251.5 million (unrestricted net assets) may be used to meet the government’s ongoingobligations to citizens and creditors.
• As of the close of the current fiscal year, the City’s governmental funds reported combinedending fund balances of $335.9 million. Of this total amount, 76.5% or $257.1 million, is available for spending at the government’s discretion (unreserved fund balance). A large part of this amount is either designated or appropriated for continuing activities of the City.
• At the end of the current fiscal year, unreserved fund balance for the general fund was $92.8million or 32.1% of total general fund expenditures. Of that amount, $56.2 million isundesignated and represents a traditional fund balance reserve maintained for emergencies,liquidity and overall financial strength.
• The City’s total long-term obligations increased by a net of $180.1 million during the currentfiscal year. The issuance of new debt ($220.9 million) exceeded principal repayments ($43.1million) by $177.8 million. Other long-term obligations (earned vacation pay and landfillpostclosure care) increased by $2.8 million.
• The City issued $150.0 million in water and sewer revenue bonds for utility projects.
• The City issued $28.930 million in certificates of participation for the following capitalprojects: continuation of the Fayetteville Street renaissance project ($6.280 million), a solidwaste transfer station ($7.885 million), and continuation of an underground parking garage($14.765 million).
• The City extended and/or entered into master financing agreements in order to purchaseland for a new public works operations center ($10,114,000), and design and development of an enterprise resource planning (ERP) system ($30 million).
• The City also entered into an installment purchase obligation of $1,850,000 to purchase land for a utilities operations facility.
• The City of Raleigh maintained its AAA/Aaa bond rating from all three major rating agencies.
• On a government-wide basis for governmental activities, the City had expenses net of programrevenues of $223.0 million, which were $63.7 million less than the general revenues of $286.7million.
• On a government-wide basis for business-type activities, the City had expenses net of programrevenues of $7.2 million, which were $10.6 million less than general revenues of $17.8 million.
MD&A - 1
MA
NA
GE
ME
NT’S
DIS
CU
SS
ION
AN
DA
NA
LY
SIS
CITY OF RALEIGH
2008

OVERVIEW OF THE FINANCIAL STATEMENTS
These basic financial statements consist of two sections: introductory and financial. As Figure A-1shows, the financial section has three components – management’s discussion and analysis (thissection), the basic financial statements and required supplementary information. The basic financialstatements include two kinds of statements that present different views of the City:
• The first two statements are government-wide financial statements that provide both long-termand short-term information about the City’s overall financial status.
• The remaining statements are fund financial statements that focus on individual parts of the Citygovernment, reporting the City’s operations in more detail than the government-wide statements,as follows:
• The governmental funds statements tell how general government services like public safetyand solid waste, for example, were financed in the short-term as well as what remains forfuture spending.
• Proprietary fund statements offer short and long-term financial information about theactivities the government operates like businesses, such as the water and sewer system, theconvention center, and parking enterprise.
• Fiduciary fund statements provide information about the financial relationships – like theretirement plan for the City’s employees – in which the City acts solely as a trustee or agentfor the benefit of others to whom the resources in question belong.
Figure A-1: Components of the Financial SectionCity of Raleigh Basic Financial Statements
Government-wideFinancialStatements
FundFinancialStatements
Notes To TheFinancialStatements
BasicFinancial
Statements
RequiredSupplementary
Information
Management’sDiscussion
and Analysis
Summary Detail
MD&A - 2
MA
NA
GE
ME
NT’S
DIS
CU
SS
ION
AN
DA
NA
LY
SIS
CITY OF RALEIGH
2008
MD&A - 3
The financial statements also include notes that explain some of the information in the financialstatements and provide more detailed data. The statements are followed by a section of requiredsupplementary information that further explains and supports the information in the financialstatements. Figure A-1 shows how the required parts of this annual report are arranged andrelate to one another. The remainder of this overview section of management’s discussion andanalysis explains the structure and contents of each of the statements.
Government-wide financial statements. The government-wide financial statements aredesigned to provide the reader with a broad overview of the City’s finances, similar in format to afinancial statement of a private-sector business. The government-wide statements provide shortand long-term information about the City’s financial status as a whole.
The statement of net assets presents information on all of the City’s assets and liabilities, with thedifference between the two reported as net assets. This statement combines and consolidatesgovernmental fund’s current financial resources (short-term spendable resources) with capitalassets and long-term obligations. Over time, increases and decreases in net assets may serve as a useful indicator of whether the financial position of the City of Raleigh is improving ordeteriorating.
The statement of activities presents information showing how the City’s net assets changed duringthe most recent fiscal year. All changes in net assets are reported as soon as the underlying eventgiving rise to the change occurs, regardless of the timing of related cash flows. Thus, revenues andexpenses are reported in this statement for some items that will only result in cash flows in futurefiscal periods (e.g., uncollected taxes and earned but unused vacation leave).
Both of the government-wide financial statements distinguish functions of the City that areprincipally supported by taxes and intergovernmental revenues (governmental activities) from otherfunctions that are intended to recover all or a significant portion of their costs through user feesand charges (business-type activities). This is intended to simplify and summarize the user’sanalysis of the cost of various governmental services and/or subsidy to various business-typeactivities. The governmental activities of the City include general government, communitydevelopment, public safety, solid waste services, leisure services, and economic developmentprograms. The business-type activities of the City include water and sewer, convention centercomplex fund, parking facilities, mass transit and stormwater management.
The government-wide financial statements include the Walnut Creek Financing AssistanceCorporation (WCFAC, a blended component unit). The WCFAC, although legally separate, functionsfor all practical purposes as a department of the City, and therefore has been included as anintegral part of the primary government.
The government-wide financial statements can be found on pages 1 - 3 of this report.
Fund financial statements. Traditional users of governmental fund financial statements willfind the fund financial statements presentation more familiar. However, the focus is on majorfunds, rather than the individual fund types. The fund financial statements provide a moredetailed look at the City’s most significant activities.
A fund is a grouping of related accounts that is used to maintain control over resources that havebeen segregated for specific activities or objectives. The City of Raleigh, like all othergovernmental entities in North Carolina, uses fund accounting to ensure and demonstratecompliance with finance-related legal requirements, such as the general statutes or the City’sbudget ordinance. All of the funds of the City can be divided into three categories: governmentalfunds, proprietary funds, and fiduciary funds.
MA
NA
GE
ME
NT’S
DIS
CU
SS
ION
AN
DA
NA
LY
SIS
CITY OF RALEIGH
2008

MD&A - 4
Governmental funds. Governmental funds are used to account for essentially the same functionsreported as governmental activities in the government-wide financial statements. However, unlike thegovernment-wide financial statements, governmental fund financial statements focus on near-terminflows and outflows of spendable resources, as well as on balances of spendable resources available atthe end of the fiscal year. Such information may be useful in evaluating a government’s near-termfinancing requirements.
Because the focus of governmental funds is narrower than that of the government-wide financialstatements, it is useful to compare the information presented for governmental funds with similarinformation presented for governmental activities in the government-wide financial statements. By doing so, readers may better understand the long-term impact of the government’s near-termfinancing decisions. Both the governmental fund balance sheet and the governmental fundstatement of revenues, expenditures, and changes in fund balances provide a reconciliation tofacilitate this comparison between governmental funds and governmental activities.
The City maintains nineteen individual governmental funds. Information is presented separately in the governmental fund balance sheet and in the governmental fund statement of revenues,expenditures, and changes in fund balance for the general fund which is considered to be a majorfund. Data from the other eighteen governmental funds are combined into a single, aggregatedpresentation. Individual fund data for each of these nonmajor governmental funds is provided in the form of combining statements elsewhere in this report.
The City adopts an annual appropriated budget for its general fund. A budgetary comparisonstatement has been provided for the general fund to demonstrate compliance with this budget.
The basic governmental fund financial statements can be found on pages 4 - 9 of this report.
Proprietary funds. The City of Raleigh maintains two different types of proprietary funds.Enterprise funds are used to report the same functions presented as business-type activities in thegovernment-wide financial statements. The City uses enterprise funds to account for its water andsewer, convention center and performing arts (referred to as convention center) operations, parkingfacilities, mass transit and stormwater management operations. Internal service funds are anaccounting device used to accumulate and allocate costs internally among the City’s variousfunctions. The City of Raleigh uses internal service funds to account for its print services, riskmanagement, employee’s health benefits, governmental and public utilities equipment replacementand vehicle fleet services funds. All of these services predominantly benefit governmental functionsexcept for the public utilities equipment replacement fund, which predominantly benefits business-type functions. These services have been included within their respective predominant activities inthe government-wide financial statements.
Proprietary funds provide the same type of information as the government-wide financialstatements, only in more detail. The proprietary fund financial statements provide separateinformation for the three major enterprise funds, the water and sewer fund, the convention centerfund and the parking facilities fund. Conversely, the nonmajor enterprise funds and all internalservice funds are combined into single, aggregated presentations in the proprietary fund financialstatements. Individual fund data for the nonmajor enterprise funds and the internal service funds is provided in the form of combining statements elsewhere in this report.
The basic proprietary fund financial statements can be found on pages 10 - 17 of this report.
Fiduciary funds. Fiduciary funds are used to account for resources held for the benefit of partiesoutside the government. Fiduciary funds are not reflected in the government-wide financialstatement because the resources of those funds are not available to support the City’s own programs.The accounting used for fiduciary funds is much like that used for proprietary funds.
The basic fiduciary fund financial statements can be found on pages 18 - 19 of this report.
MA
NA
GE
ME
NT’S
DIS
CU
SS
ION
AN
DA
NA
LY
SIS
2008CITY OF RALEIGH

MD&A - 5
Notes to the financial statements. The notes provide additional information that is essentialto a full understanding of the data provided in the government-wide and fund financial statements.The notes to the financial statements can be found on pages 20 - 51 of this report.
Other Information. In addition to the basic financial statements and accompanying notes, thisreport also presents certain required supplementary information concerning the City of Raleigh’sprogress in funding its obligation to provide pension benefits to its law enforcement officers andother post employment benefits. Required supplementary information can be found on pages 52 - 55 of this report.
The combining statements referred to earlier in connection with nonmajor governmental funds,nonmajor enterprise funds and internal service funds are presented immediately following therequired supplementary information on pensions. Combining and individual fund statements andschedules can be found on pages 56 - 112 of this report.
GOVERNMENT-WIDE FINANCIAL ANALYSIS
As noted earlier, net assets may serve over time as a useful indicator of a government’s financialposition. In the case of the City of Raleigh, assets exceeded liabilities by $1.56 billion at the close ofthe most recent fiscal year.
By far the largest portion of the City of Raleigh’s net assets ($1.19 billion or 76.3 percent) reflects itsinvestment in capital assets (e.g., land, buildings, machinery, and equipment); less any related debtused to acquire those assets that is still outstanding. The City of Raleigh uses these capital assets toprovide services to citizens; consequently these assets are not available for future spending.Although the City of Raleigh’s investment in its capital assets is reported net of related debt, itshould be noted that the resources needed to repay this debt must be provided from other sources,since the capital assets themselves cannot be used to liquidate these liabilities.
The following table reflects the condensed Statement of Net Assets.
Table 1: City of Raleigh’s Net Assets (in millions of dollars)
An additional portion of the City’s net assets ($113.3 million or 7.3 percent) represents resources thatare subject to external restrictions on how they may be used. The remaining balance of unrestrictednet assets ($251.5 million or 16.1 percent) may be used to meet the government’s ongoing obligationsto citizens and creditors.
MA
NA
GE
ME
NT’S
DIS
CU
SS
ION
AN
DA
NA
LY
SIS
2008
2007 2008 2007 2008 2007 2008
433.5$ 454.6$ 510.1$ 517.6$ 943.6$ $ 639.5 681.1 1,106.8 1,300.6 1,746.3
1,073.0 1,135.7 1,616.9 1,818.2 2,689.9 2,953.9
264.2 297.8 786.9 933.4 1,051.1 69.8 67.6 88.1 95.3 157.9 162.9
334.0 365.4 875.0 1,028.7 1,209.0 1,394.1
462.3 493.8 662.1 701.2 1,124.4 1,195.0120.4 113.3 - - 120.4 113.3156.3 163.2 79.8 88.3 236.1 251.5739.0$ 770.3$ 741.9$ 789.5$ 1,480.9$ $
Governmentalactivities
Business-typeactivities Total
1,981.7
1,231.2
1,559.8
Current and other assetsCapital assets
Total assets
Long-term debt outstandingOther liabilities Total liabilities
Invested in capital assets, net of related debt
Restricted Unrestricted
Total net assets
972.2
CITY OF RALEIGH
MD&A - 6
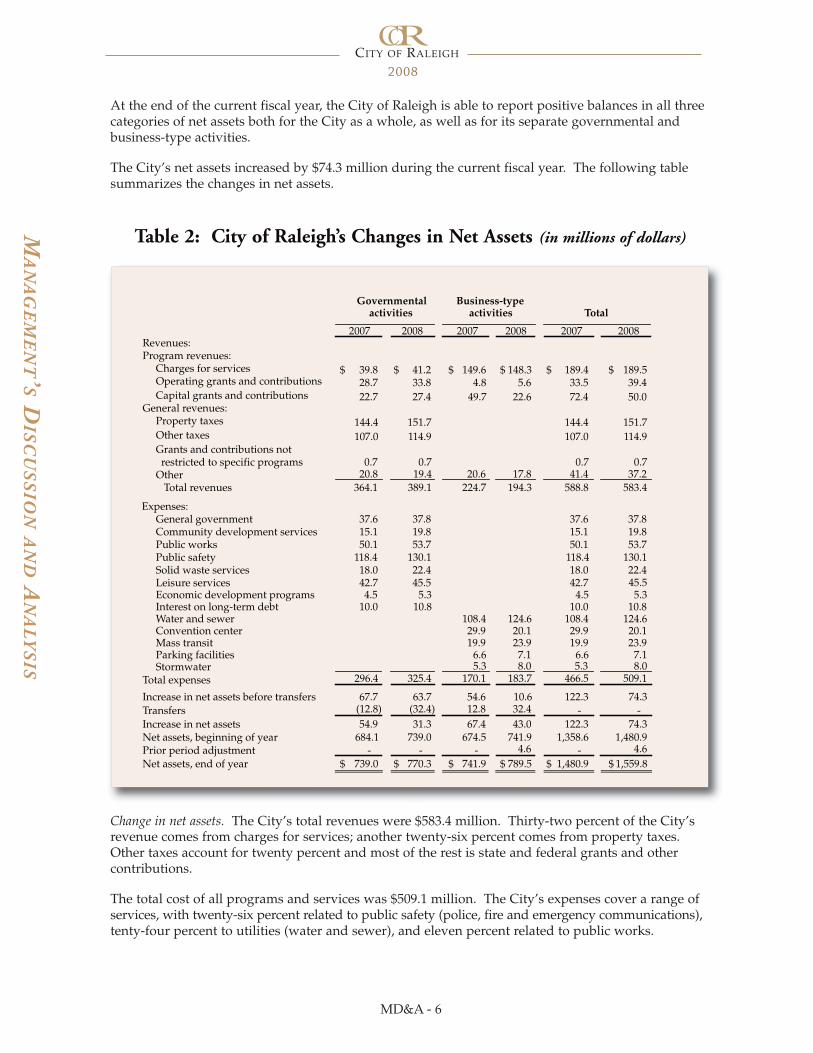
At the end of the current fiscal year, the City of Raleigh is able to report positive balances in all threecategories of net assets both for the City as a whole, as well as for its separate governmental andbusiness-type activities.
The City’s net assets increased by $74.3 million during the current fiscal year. The following tablesummarizes the changes in net assets.
Table 2: City of Raleigh’s Changes in Net Assets (in millions of dollars)
Change in net assets. The City’s total revenues were $583.4 million. Thirty-two percent of the City’srevenue comes from charges for services; another twenty-six percent comes from property taxes.Other taxes account for twenty percent and most of the rest is state and federal grants and othercontributions.
The total cost of all programs and services was $509.1 million. The City’s expenses cover a range ofservices, with twenty-six percent related to public safety (police, fire and emergency communications),tenty-four percent to utilities (water and sewer), and eleven percent related to public works.
MA
NA
GE
ME
NT’S
DIS
CU
SS
ION
AN
DA
NA
LY
SIS
2008CITY OF RALEIGH
2007 2008 2007 2008 2007 2008
39.8$ 41.2$ 149.6$ 148.3$ 189.4$ 189.5$28.7 33.8 4.8 5.6 33.5 39.422.7 27.4 49.7 22.6 72.4 50.0
144.4 151.7 144.4 151.7107.0 114.9 107.0 114.9
0.7 0.7 0.7 0.720.8 19.4 20.6 17.8 41.4 37.2
364.1 389.1 224.7 194.3 588.8 583.4
37.6 37.8 37.6 37.815.1 19.8 15.1 19.850.1 53.7 50.1 53.7
118.4 130.1 118.4 130.118.0 22.4 18.0 22.442.7 45.5 42.7 45.54.5 5.3 4.5 5.3
10.0 10.8 10.0 10.8108.4 124.6 108.4 124.629.9 20.1 29.9 20.119.9 23.9 19.9 23.9
6.6 7.1 6.6 7.15.3 8.0 5.3 8.0
296.4 325.4 170.1 183.7 466.5 509.1
67.7 63.7 54.6 10.6 122.3 74.3(12.8) (32.4) 12.8 32.4 - -54.9 31.3 67.4 43.0 122.3 74.3
684.1 739.0 674.5 741.9 1,358.6 1,480.9 - - - 4.6 - 4.6
739.0$ 770.3$ 741.9$ 789.5$ 1,480.9$ 1,559.8$
Revenues:Program revenues: Charges for services Operating grants and contributions Capital grants and contributionsGeneral revenues: Property taxes Other taxes Grants and contributions not restricted to specific programs Other Total revenues
Expenses: General government Community development services Public works Public safety Solid waste services Leisure services Economic development programs Interest on long-term debt Water and sewer Convention center Mass transit Parking facilities StormwaterTotal expenses
Increase in net assets before transfersTransfersIncrease in net assets Net assets, beginning of yearPrior period adjustmentNet assets, end of year
TotalGovernmental Business-type
activities activities

MD&A - 7
GOVERNMENTAL ACTIVITIES
Revenues for the City’s governmental activities were $389.1 million, while total expenses were $325.4 million. The increase in net assets for governmental activities (after transfers of $32.4 million)was $31.3 million in 2008.
General economic growth in the City resulted in increased property tax revenues of $7.3 millionfrom $144.4 million to $151.7 million. Property taxes represent 39.0% of total governmentalrevenues. Other taxes, which accounted for 29.5% of total governmental revenues, increased $7.9 million from 2007.
Table 3 presents the cost of each of the City’s four largest governmental activities programs – publicsafety, public works, leisure services, and general government – as well as each program’s net cost(total cost less fees generated by the activities and intergovernmental aid). The net cost shows thefinancial support provided by the City’s taxpayers for these functions.
Table 3: Net Cost of City of Raleigh Governmental Programs (in millions of dollars)
MA
NA
GE
ME
NT’S
DIS
CU
SS
ION
AN
DA
NA
LY
SIS
2008
Charges for services $41.19 m
Property taxes $151.69 m
Other taxes $114.95 m
Operating grants and
Capital grants andcontributions $27.41 m
All other $20.19 m
10.58%5.19% 7.04%
contributions $33.79 m
8.68%
38.98%29.53%
Revenues by Source - Governmental Activities
CITY OF RALEIGH
2007 2008 2007 2008 Public safety 118.4$ 130.1$ (115.1)$ (122.2)$ Public works 50.1 53.7 (18.6) (16.2) Leisure services 42.7 45.5 (20.1) (19.9) General government 37.6 37.8 (36.3) (36.8)
Total Cost of Services Net Cost of Services

MD&A - 8
The reported results for the fiscal year for the governmental activities show that:
• The cost of all governmental activities this year was $325.4 million. This cost was incurred inorder to provide basic municipal services to the citizens of Raleigh. These services include, butare not limited to: police, fire, solid waste services, parks and recreation, streets maintenance,inspections, planning and others.
• The amount that our taxpayers paid for these activities through property taxes was $151.7 million.
• Those who directly benefited from service-fee based programs paid $41.2 million in charges for services.
• Other governments and organizations subsidized certain programs with grants andcontributions totaling $61.2 million. These grants and contributions include annexations ofstreets and sidewalks ($18.3 million), operating support from various federal and stateagencies ($21.2 million), interlocal support from Wake County for debt service on theconvention center construction project ($13.1 million), and other facility fees and developers’participation ($8.6 million).
• The City received $286.7 million in general revenues from taxes and other revenues such asinterest and unrestricted grants, which was used to pay for the $223.0 million net cost ofgovernmental activities.
• The City’s four largest governmental programs – public safety (40.0%), public works (16.5%),leisure services (14.0%), and general government (11.6%) represent 82.1% – of the totalgovernmental activities.
MA
NA
GE
ME
NT’S
DIS
CU
SS
ION
AN
DA
NA
LY
SIS
2008CITY OF RALEIGH
Expenses
-
20
40
60
80
100
120
140
$ GeneralGovernment
CommunityDevelopment
Services
Publicworks
PublicSafety
Solid WasteServices
LeisureServices
EconomicDevelopment
Programs
Interest onLong-Term
Debt
Program Revenues
Mil
lion
s
$ 37
.80
$ 1.
00
$ 19
.82
$ 13
.55
$ 53
.69
$ 37
.50
$ 13
0.1
$ 7.
83
$ 22
.38
$ 15
.87
$ 45
.53
$ 25
.61
$ 5.
33
$ 1.
04 $ 10
.77
Expenses and Program Revenues - Governmental Activities
MD&A - 9
BUSINESS-TYPE ACTIVITIES
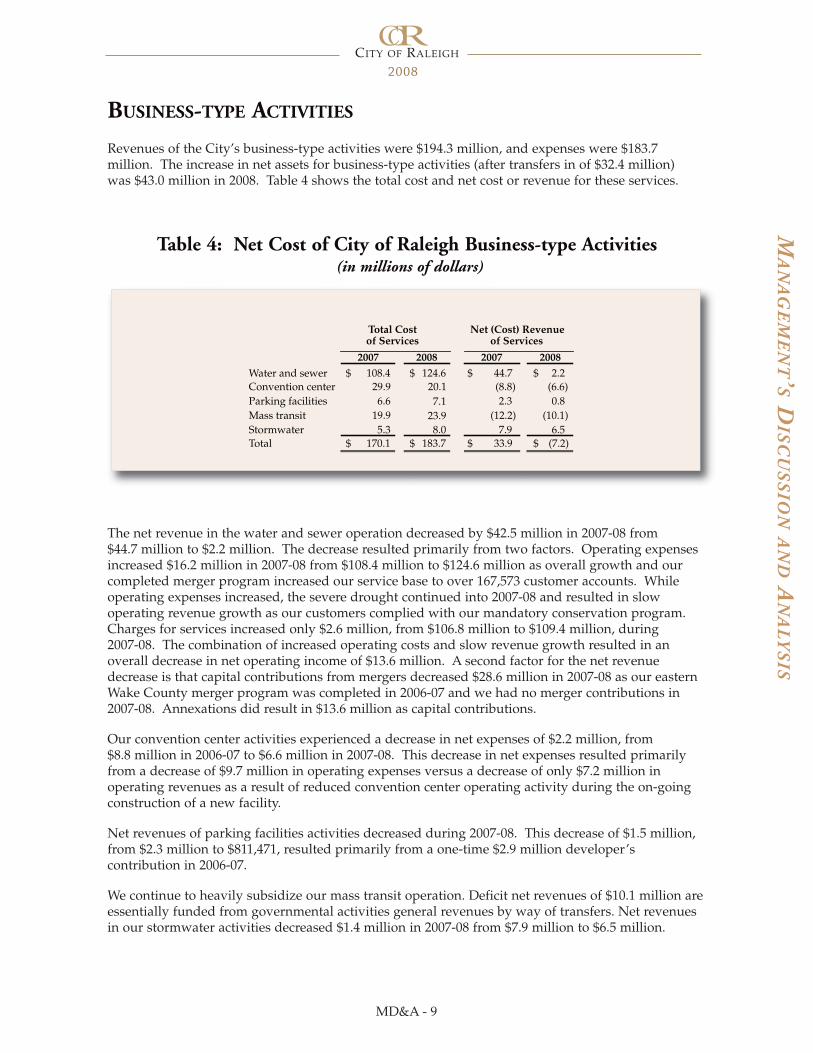
Revenues of the City’s business-type activities were $194.3 million, and expenses were $183.7million. The increase in net assets for business-type activities (after transfers in of $32.4 million) was $43.0 million in 2008. Table 4 shows the total cost and net cost or revenue for these services.
Table 4: Net Cost of City of Raleigh Business-type Activities (in millions of dollars)
The net revenue in the water and sewer operation decreased by $42.5 million in 2007-08 from $44.7 million to $2.2 million. The decrease resulted primarily from two factors. Operating expensesincreased $16.2 million in 2007-08 from $108.4 million to $124.6 million as overall growth and ourcompleted merger program increased our service base to over 167,573 customer accounts. Whileoperating expenses increased, the severe drought continued into 2007-08 and resulted in slowoperating revenue growth as our customers complied with our mandatory conservation program.Charges for services increased only $2.6 million, from $106.8 million to $109.4 million, during 2007-08. The combination of increased operating costs and slow revenue growth resulted in anoverall decrease in net operating income of $13.6 million. A second factor for the net revenuedecrease is that capital contributions from mergers decreased $28.6 million in 2007-08 as our easternWake County merger program was completed in 2006-07 and we had no merger contributions in2007-08. Annexations did result in $13.6 million as capital contributions.
Our convention center activities experienced a decrease in net expenses of $2.2 million, from $8.8 million in 2006-07 to $6.6 million in 2007-08. This decrease in net expenses resulted primarilyfrom a decrease of $9.7 million in operating expenses versus a decrease of only $7.2 million inoperating revenues as a result of reduced convention center operating activity during the on-goingconstruction of a new facility.
Net revenues of parking facilities activities decreased during 2007-08. This decrease of $1.5 million,from $2.3 million to $811,471, resulted primarily from a one-time $2.9 million developer’scontribution in 2006-07.
We continue to heavily subsidize our mass transit operation. Deficit net revenues of $10.1 million areessentially funded from governmental activities general revenues by way of transfers. Net revenuesin our stormwater activities decreased $1.4 million in 2007-08 from $7.9 million to $6.5 million.
MA
NA
GE
ME
NT’S
DIS
CU
SS
ION
AN
DA
NA
LY
SIS
2008
2007 2008 2007 2008
Water and sewer 108.4$ 124.6$ 44.7$ 2.2$Convention center 29.9 20.1 (8.8) (6.6)Parking facilities 6.6 2.3 0.8Mass transit 19.9 (12.2) (10.1)Stormwater 5.3 8.0 7.9 6.5Total 170.1$ 183.7$ 33.9$ (7.2)$
of ServicesNet (Cost) Revenue
of ServicesTotal Cost
7.123.9
CITY OF RALEIGH

MD&A - 10
MA
NA
GE
ME
NT’S
DIS
CU
SS
ION
AN
DA
NA
LY
SIS
2008CITY OF RALEIGH
Unrestrictedinvestmentearnings
Water andsewer
Conventioncenter
Mass transit Parkingfacilities
Stormwater-
20
40
60
80
100
120
140
$
Mil
lion
s
ExpensesProgram Revenues
$ 17
.77
$ 12
4.61
$ 12
6.82
$ 20
.10
$ 13
.52 $ 23
.90
$ 13
.74
$ 7.
15
$ 7.
96
$ 7.
95 $ 14
.49
Expenses and Program Revenues - Business-type Activities
76.34%2.86%
11.65%
9.15%
All other $17.77 m
Operating grants andcontributions $5.56 m
Capital grants andcontributions $22.63 m
Charges for services $148.30 m
Revenues by Source - Business-type Activities

MD&A - 11
FINANCIAL ANALYSIS OF THE CITY’S FUNDS
As noted earlier, the City of Raleigh uses fund accounting to ensure and demonstrate compliancewith finance-related legal requirements.
Governmental funds. The focus of the City’s governmental funds is to provide information onnear-term inflows, outflows, and balances of spendable resources. Such information is useful inassessing the City’s financing requirements. In particular, unreserved fund balance may serve as auseful measure of a government’s net resources available for spending at the end of the fiscal year.
As of the end of the fiscal year, the City of Raleigh’s governmental funds reported combined endingfund balances of $335.9 million, an increase of $21.8 million in comparison with the prior year.Approximately 76.5% of this total amount ($257.1 million) constitutes unreserved fund balance, whichis available for spending at the government’s discretion. The remainder of fund balance is reservedto indicate that it is not available for new spending because it has already been committed toliquidate contracts and purchase orders of the prior period ($7.8 million), reserved for inventories($1.7 million), reserved by state statute ($34.8 million), reserved for the new convention center project ($32.4 million), or reserved for emergency communications equipment ($2.1 million).
The general fund is the chief operating fund of the City. At the end of the current fiscal year,unreserved fund balance of the general fund was $92.8 million, while total fund balance was $137.1 million. As a measure of the general fund’s liquidity, it may be useful to compare bothunreserved fund balance and total fund balance to total fund expenditures. Unreserved fund balance represents 32.2 percent of total general fund expenditures, while total fund balancerepresents 47.6 percent of that same amount, amounts generally consistent with the prior year.
The North Carolina Local Government Commission strongly recommends that local governmentsmaintain an undesignated fund balance of at least 8% of general fund expenditures. The City’spolicy is to maintain an undesignated fund balance of at least 14% of the succeeding year’sexpenditure budget. Undesignated fund balance is a sub classification of unreserved fund balanceafter consideration for management’s policy designations. The City’s designations of unreservedfund balance total $36.6 million as specified on page 25 of the notes to the financial statements. This includes $22.5 million appropriated for 2008-09. The remaining unreserved fund balance of $56.2 million is undesignated and represents 14% of the 2008-09 general fund expenditure budget.
The fund balance of the City’s general fund increased by $10.6 million during the current fiscal year.Key factors in this increase are as follows:
● Overall revenues increased $17.4 million in 2007-08. Specifically, property taxes increased $7.3 million reflecting tax base growth consistent with prior years. Local sales tax increased$3.1 million, and all other revenues increased in total by $7.0 million.
● Overall expenditures increased $20.0 million in 2007-08.
● The resulting change in revenues over expenditures for 2007-08 was a decrease of $2.6 million,from $31.8 million in 2006-07 to $29.2 million in 2007-08.
● Net other financing uses decreased $1.2 million in 2007-08 from $19.7 million to $18.5 million.
Proprietary funds. The City of Raleigh’s proprietary funds provide the same type of informationfound in the government-wide financial statements, but in more detail. The major enterprise fundsare the water and sewer, convention center and parking facilities funds.
MA
NA
GE
ME
NT’S
DIS
CU
SS
ION
AN
DA
NA
LY
SIS
2008CITY OF RALEIGH

MD&A - 12
Net assets of the water and sewer fund at the end of the year amounted to $628.6 million. The netassets of the water and sewer fund increased by $12.8 million in 2007-08 versus a $59.2 millionincrease in 2006-07. This $46.4 million decrease is attributable to a $17.7 million decrease inoperating income and a $29.0 million decrease in capital contributions. Operating income decreasedin 2007-08 due to slow revenue growth resulting from consumption constrictions due to the severedrought. Capital contributions decreased as our eastern Wake County merger program wascompleted in 2006-07; we had no merger contributions in 2007-08. Convention center net assetsincreased $14.4 million, before application of a $4.0 million prior period accounting error adjustment.The net assets increase is primarily due to an increase in net transfers in of $15.6 million, of which$13.1 million was interlocal tax support from Wake County for construction of a new facility. Parkingfacilities fund net assets increased $3.5 million as a result of $2.6 million in operating income, netnon-operating expense of $1.1 million, and net transfers in of $2.0 million.
GENERAL FUND BUDGETARY HIGHLIGHTS
Differences between the original budget and the final amended budget resulted in appropriationsincreasing $15.0 million during 2007-08. Increases in expenditure budgets ($10.9 million) andtransfers to other funds budgets ($6.3 million) exceeded increases in revenue and transfers fromother funds budgets ($2.2 million), thus resulting in the $15.0 million increase in the budget fromfund balance appropriated. The final positive budget variance was $41.1 million. This overallpositive variance resulted as follows:
• Revenues $2.4 million positive, primarily from local sales tax ($3.0 million positive),intergovernmental revenues ($2.5 million positive), and inspection fees, licenses, and otherrevenues ($3.8 million positive). These positive variances offset the $6.9 million negativevariance from ad valorem taxes, interest on investments, and other fees.
• Expenditures $37.6 million positive, pervasively across the board as all individual expenditurefunctions and departments had positive budget variances.
• Other financing net uses $1.0 million positive, from budgeted transfers to other funds thatwere not made.
CAPITAL ASSET AND DEBT ADMINISTRATION
Capital assets. The City of Raleigh’s investment in capital assets for its governmental andbusiness type activities as of June 30, 2008, amounts to $1.98 billion (net of accumulateddepreciation). This investment in capital assets includes land, buildings and machinery, streets andsidewalks, equipment, furniture and fixtures, and improvements. The total increase in the City’sinvestment in capital assets for the current fiscal year, $235.4 million, was 13.5 percent (a 6.5 percentincrease for governmental activities and a 17.5 percent increase for business-type activities).
Major capital asset investments during the fiscal year included the following:
• Land additions of $28.9 million were made during the year. Major tracts were obtained forfuture construction of both utilities and public works remote operations facilities.
• Construction began and/or was completed for a variety of street projects, parks andgreenways, and fire stations. Total construction was $51.4 million. Construction in progressfor these activities was $19.7 million as of June 30, 2008.
• Construction began and/or was completed on additional facilities for the water and seweroperations. Total construction was $127.3 million. Construction in progress for these activitieswas $83.5 million as of June 30, 2008.
MA
NA
GE
ME
NT’S
DIS
CU
SS
ION
AN
DA
NA
LY
SIS
2008CITY OF RALEIGH

MD&A - 13
• Equipment acquisitions added $19.6 million to the City’s rolling stock inventory, including $5.4 million in new buses.
• Total construction in progress for the on-going convention center project at June 30, 2008 was$215.7 million, including $68.8 million added during 2007-08.
• Total construction in progress on the on-going underground parking deck project adjacent tothe new convention center was $46.8 million at June 30, 2008, including $11.1 million addedduring 2007-08.
• On-going investment in stormwater management ($4.3 million) projects continued during2007-08.
• Annexations added $18.3 million to streets and $13.6 million to water and sewer systems.
Additional information on the City’s capital assets can be found on pages 28 - 30 of the notes to thefinancial statements of this report.
Long-term debt. In October 2007, the City sold $28.930 million in certificates of participation tofinance a solid waste transfer station ($7.885 million), the on-going construction of an undergroundparking deck ($14.765 million), and continuation of the Fayetteville Street renaissance project ($6.280 million). The COPS mature incrementally between 2009 and 2032 and bear rates rangingfrom 4.25% to 5.00% for a true interest cost of 4.573601%. This issue was rated AA+ by S&P, AA byFitch, and Aa2 by Moody’s.
Also in October 2007, the City entered into an installment financing agreement in the amount of$1,850,000 for the purchase of property for the future site of a utilities operation center. This noterequires two installment payments of $925,000 plus 5% interest over 2008 and 2009.
In December 2007, the City drew $10,114,000 against an existing master financing agreement for thepurchase of 36 acres of land to be used as the site of a new public works operation facility.Installment payments are due semi-annually beginning June 2008 through December 2017. The loancarries a fixed interest rate of 3.718%.
In June 2008, the City issued $150 million in variable rate water/sewer revenue bonds. The bondswere issued in connection with a 2006 swap agreement which effectively fixes the City’s interest rateat 4.163%. The bonds mature serially between 2011 and 2035 with a true interest cost of 4.667037%.The issue was rated Aa1/VMIG1 by Moody’s, AAA/A-1+ by S&P, and AAA/F1+ by Fitch.
MA
NA
GE
ME
NT’S
DIS
CU
SS
ION
AN
DA
NA
LY
SIS
2008
2007 2008 2007 2008 2007 2008115,706$ 139,448$ 64,634$ 69,862$ 180,340$ 209,310$ 54,120 53,192 76,361 78,298 130,481 131,490
- - 579,319 647,725 579,319 647,725340,518 347,051 - - 340,518 347,051
- - 44,397 43,036 44,397 43,036- - 8,381 11,697 8,381 11,697
26,720 27,180 15,437 15,948 42,157 43,128700 563 26 25 726 588
83,142 93,965 63,305 83,293 146,447 177,25818,567 19,658 254,932 350,718 273,499 370,376
639,473$ 681,057$ 1,106,792$ 1,300,602$ 1,746,265$ 1,981,659$
TotalGovernmental
activitiesBusiness-type
activities
LandBuildings and machineryWater and sewer systemsStreets and sidewalksParking decksBusesEquipmentFurniture and fixturesImprovementsConstruction in progress
Total
Table 5: City of Raleigh’s Capital Assets(net of accumulated depreciation – stated in thousands)
CITY OF RALEIGH

MD&A - 14
Also in June 2008, the City entered into a $30 million installment financing agreement to finance thedesign, development and implementation of an enterprise resource planning (ERP) system. Loanpayments are due monthly beginning July 2008 through June 2018 with a fixed interest rate of 3.47%.
At the end of the current fiscal year, the City had total general obligation debt outstanding of $185.4 million. The remainder of the City’s debt represents revenue bonds ($560.2 million) andinstallment financing agreements ($448.7 million – notes, COPS, etc.) secured solely by specifiedrevenue sources and property. The City’s total liability for bonded debt and other installmentfinancing agreements increased by $177.8 million (17.5%) during 2007-08 as new debt issues of $220.9 million exceeded principal repayments of $43.1 million.
The City has other long-term obligations for earned but unused vacation pay due its employees($18.5 million) and landfill postclosure care costs ($6.3 million). These obligations increased $2.5 million from 2007 balances.
Table 6: City of Raleigh’s Long-Term Debt (stated in thousands)
Subsequent to FY08 year-end, in August 2008, the City sold taxable variable rate certificates ofparticipation totaling $14,015,000 to finance the purchase of a downtown parking deck constructed inconjunction with other downtown development. The COPS mature annually beginning August 2009through August 2023 with a true interest cost of 4.479830% based on variable rate terms at closing.The issues was rated AA-/A-1+ by Standard and Poor’s.
Also during FY09, in November 2008, the City issued $33.5 million in certificates of participation asan interim financing of initial costs of two major public improvement projects: a new public safetycenter and new public works operations facilities. The COPS were issued for one year withrepayments of $34.505 million due in November 2009. After closing costs and premium proceeds,the true interest cost is 1.553151%.
State statues limit the amount of general obligation debt a governmental entity may issue to 8percent of the total assessed value of taxable property. The current debt limitation for the City is $2.8 billion, which is significantly in excess of the City’s outstanding net debt of $824.0 million.
Raleigh continues to benefit from outstanding credit ratings as evidenced by the aforementionedplacements, earning the highest general obligation credit ratings and excellent revenue bond andCOPS ratings from all three major rating agencies. However, conditions in the financial marketssubsequent to year-end have impacted the City’s variable rate debt issues for its business-typeactivities. Credit issues of the City’s liquidity providers and remarketing agents have caused $336million of these debt issues to be tendered back to the City’s liquidity banks. Under terms of thestand-by purchase agreements, the City pays a set interest rate for 90 days, currently 5.0%. As of thedate of this letter, $99 million of this total has again been either remarketed or has been purchased bythe remarketing institution. For the remaining $237 million, the City is in the process of makingadditional changes in its liquidity providers and remarketing firms that will be effective before theend of the 90-day periods when a required acceleration of the debt payments would otherwise occur.
MA
NA
GE
ME
NT’S
DIS
CU
SS
ION
AN
DA
NA
LY
SIS
2008CITY OF RALEIGH
2007 2008 2007 2008 2007 2008
General obligation bonds 183,219$ 170,030$ 18,916$ 15,405$ 202,135$ 185,435$
Revenue bonds - - 415,540 560,240 415,540 560,240
Installment financing agreements 60,272 104,398 338,086 344,335 398,358 448,733
Total 243,491$ 274,428$ 772,542$ 919,980$ 1,016,033$ 1,194,408$
Totalactivities activitiesGovernmental Business-type

MD&A - 15
MA
NA
GE
ME
NT’S
DIS
CU
SS
ION
AN
DA
NA
LY
SIS
2008
These actions are intended to allow normal remarketing of the debt issues going forward. Whileweekly reset rates on the City’s variable rate issues have experienced significant variation duringthis period, ranging from a low of 1.7% to a high of 8.0%, rates have currently returned to the lowerend of this range. All additional projected costs are expected to be covered within the City’s overalldebt model capacity.
The City’s two interest rate swaps have mitigated the impact of these conditions. However, also as aresult of these changes in financial 7markets, the credit ratings of the City’s swap counterpartieshave been downgraded.
Additional information on the City of Raleigh’s Raleigh’s long-term debt can be found in the notesto the financial statements on pages 33 – 42 of this report.
ECONOMIC FACTORS AND NEXT YEAR’S BUDGET
Significant factors considered in preparing the City’s budget for the 2008-09 fiscal year were:
Based on property revaluation, a revenue neutral property tax rate was calculated, then adjustedupward by 4.18 cents for an adopted budget property tax rate of $.3735 per $100 assessed valuation.The adopted budget projects property tax revenue at $178.5 million. This is an increase of $27.0million, or 17%, from 2007-08 and funds both operating needs and new major capital projects.
Sales tax is the City’s second largest general revenue source. Sales tax has historically beenpositively impacted by good economic conditions in our area. Reduced consumer spendingresulting from the declining economy will impact sales tax revenues. The 2008-09 budget for salestax projects sales tax revenues of $73.2 million, an increase of $2.8 million, or 4.0%, over the actualrevenue for 2007-08. In response to the current economic conditions, we are closely monitoring salestax revenues and revised projections and, if necessary, we will adjust our budget accordingly.
Other major general revenue enhancements approved in the 2008-09 budget are increased facilityfees projected to bring in an additional $4.2 million, and the continuation of a revenue indexingprogram for development service fees. Reduced development levels will likely impact both of theserevenue sources.
The overall growth in general revenues supports the continuation of current operations andprovides funding associated with growth, expansion of facilities and new programs. Major facilities,such as the new convention center and several new parks and recreation facilities, require additionalstaffing in 2008-09.
As we recover from the 2007-2008 drought, consumption restrictions have eased and more normalgrowth is occurring in our water and sewer utility system revenues. Our eastern Wake Countymerger program is complete and we now service over 167,000 customer accounts in Raleigh and sixsurrounding towns. For 2008-09, water and sewer rates were raised 15% consistent with the utilitysystem’s financing plan for operations and capital investment. The 2008-09 budget includes $122.1million in water and sewer operating revenues, representing a $16.3 million (15%) increase over2007-08. Our immediate five-year capital improvement program (2008-09 through 2012-13) forutilities includes $544.9 million of capital investment to upgrade, expand and improve water andsewer facilities. It is anticipated that this capital program will be funded from operating revenues,capital reserves and interest income ($121 million); and from revenue bonds ($423.9 million).
The other five major areas of our five-year capital improvement program include transportation($218.4 million), parks ($126.4 million), stormwater ($50.8 million), housing ($19.5 million), andgeneral public improvements ($499.7 million). In addition to ongoing roads, parks and stormwaterprojects, major new facilities planned within the capital improvement program are a new publicsafety center ($226.1 million) and four remote operations facilities for streets, parks, solid waste andother public works maintenance operations ($189.6 million). It is anticipated that these majorfacilities will be funded from debt issues, specifically certificates of participation.
CITY OF RALEIGH
MD&A - 16
As a result of these and other factors, the 2008-09 budget was adopted with an overall combinedoperating and capital budget of $644.8 million. This represents a 15.7% increase over the $557.1 million 2007-08 budget. The budget includes 147 new positions to support continued growth in service population, with 28 positions going to police and fire, 24 positions going toutilities, 37 going to the convention center, and 58 positions going to other general servicesdepartments.
Ongoing downtown development. The City continues to focus new investment in revitalizingdowntown. Construction was completed in September 2008 on three major projects that have beenunderway since 2005. The grand opening of the new 500,000 square foot convention center was heldSeptember 5, 2008. The first convention event was held during the opening week and events arealready booked through 2023. By all counts, the new facility is receiving favorable reviews fromcustomers and the community. Also, in September, a 400 room headquarters’ hotel opened, again tofavorable reviews. The hotel is adjacent to the convention center and includes public meeting spacefunded by the convention center project budget. In October 2008, a 944 space underground parkingdeck, constructed to serve both the convention center and the hotel, was also opened. The projectbudgets for the convention center, the hotel participation, and the underground parking deck total$290 million. Another key downtown development project is the ongoing re-opening and renovationof Fayetteville Street. This project was begun in 2005 for the purpose of re-opening the City’s mainstreet for the five blocks between the State Capitol on the north end and the Progress Energy Centerfor the Performing Arts on the south end. The final $16.3 million phase of the project is currentlyunderway with construction of the public plaza site ongoing on the south end of the street. Thepublic funding of these four projects has resulted in over $2.5 billion in private investment inplanned, current, and completed projects since 2002. Notable among these are new corporateheadquarter facilities for both Progress Energy and RBC Centura Bank. Although the currenteconomic conditions have delayed some projects, major projects continue to move forward such as a two-tower mixed-use complex on the site of the old convention center, several large residentialprojects and a twenty-story retail, residential, hotel facility two blocks west of the State Capitolacross from City Hall.
Impact of and Response to Current Economic Conditions. The declining economy andnational fiscal credit problems have impacted Raleigh, as it has all local governments. As noted onpage 14, credit issues of certain liquidity providers resulted in $336 million of the City’s variable ratedebt issues being tendered back to the City’s liquidity providers. In response to this, City Councilauthorized the City Manager and the Chief Financial Officer to make immediate changes in currentfinancing arrangements when felt to be in the best interest of the City. Currently, City staff haveeither resolved or are in the process of resolving the liquidity and associated remarketing issues.Also, in response to the current economic downturn, the City has taken cost containment actions tooffset possible budget shortfalls. These actions include a “soft” freeze on hiring, cautionarymanagement of all operating expenses, and delay of $15 million in capital projects pending reviewlater in the year. City management and staff are committed to continued delivery of the highestquality of essential services throughout the economic downturn and maintaining the financialintegrity our citizens expect.
REQUESTS FOR INFORMATION
This financial report is designed to provide a general overview of the City of Raleigh’s finances forall those with an interest in the government’s finances. Questions concerning any of the informationprovided in this report or requests for additional financial information should be addressed to the:
Office of the Chief Financial OfficerCity of RaleighPO Box 590, Raleigh, North Carolina 27602(919) 996-3215
MA
NA
GE
ME
NT’S
DIS
CU
SS
ION
AN
DA
NA
LY
SIS
CITY OF RALEIGH
2008
CITY OF RALEIGH
2008
BASIC FINANCIAL STATEMENTS
The Basic Financial Statements provide a dual perspective summary overview of the financialposition and operating results of the government as a whole (government-wide financialstatements) and of all funds (fund financial statements). They also serve as a condensedintroduction to the more detailed statements and schedules that follow.

CITY OF RALEIGH
2008

STATEMENT OF NET ASSETSJune 30, 2008
Governmental Business-typeActivities Activities Total
ASSETSCash and cash equivalents 280,769,627$ 110,242,244$ 391,011,871$Taxes receivable, net of allowance
for uncollectibles of $7,451,974 2,344,589 - 2,344,589Assessments receivable, net of allowance
for uncollectibles of $154,417 1,386,449 1,547,460 2,933,909Customer receivables, net of allowance
for uncollectibles of $4,408,258 1,398,683 17,139,001 18,537,684Due from other governmental agencies 4,862,013 808,067 5,670,080Accrued interest receivable 3,539,375 2,701,378 6,240,753Other receivables and assets 6,998,138 5,495,053 12,493,191Sales tax receivable 22,555,398 6,131,863 28,687,261Internal balances 2,443,581 (2,443,581) -Inventories 2,561,948 5,428,273 7,990,221Deferred charges 80,239 2,930,581 3,010,820Loans receivable 48,554,640 - 48,554,640Cash and cash equivalents/investments -
restricted deposits and bond proceeds 75,923,968 367,590,033 443,514,001Net pension assets 1,257,665 - 1,257,665Capital assets:
Land and construction in progress 159,105,329 420,579,871 579,685,200Other capital assets, net of depreciation 521,952,511 880,023,942 1,401,976,453
Total assets 1,135,734,153 1,818,174,185 2,953,908,338
LIABILITIESAccounts payable 16,607,089 44,987,660 61,594,749Arbitrage rebate payable - 522,761 522,761Accrued salaries and employee payroll taxes 4,829,080 778,651 5,607,731Employee taxes and related withholdings 864,208 - 864,208Accrued interest payable 2,688,515 11,171,605 13,860,120Rehabilitation loans escrow 1,251,288 - 1,251,288Reimbursable facility fees 4,417,318 - 4,417,318Claims payable and other liabilities 35,300,154 11,438 35,311,592Deferred contributions from other funds - 1,520,967 1,520,967Unearned revenue 1,680,556 237,652 1,918,208Escrow and other deposits payable from
restricted assets - 36,046,139 36,046,139Long-term liabilities:
Due within one year 36,861,196 22,135,348 58,996,544Due in more than one year 260,889,526 911,252,875 1,172,142,401
Total liabilities 365,388,930 1,028,665,096 1,394,054,026
NET ASSETS
Invested in capital assets, net of related debt 493,737,748 701,221,143 1,194,958,891Restricted for:
Capital projects 64,147,645 - 64,147,645Community development projects 49,190,040 - 49,190,040
Unrestricted 163,269,790 88,287,946 251,557,736Total net assets 770,345,223$ 789,509,089$ 1,559,854,312$
The notes to the financial statements are an integral part of this statement.
1

Program RevenuesOperating Capital
Charges for Grants and Grants andFunctions/Programs Expenses Services Contributions Contributions
Governmental activities:General government 37,800,565$ 782,466$ 215,766$ -$ Community development services 19,826,719 9,635,030 3,917,767 - Public works 53,691,555 2,058,072 11,884,753 23,554,284 Public safety 130,066,923 3,304,302 3,035,296 1,492,804 Solid waste services 22,383,488 15,867,877 - - Leisure services 45,530,317 8,500,717 14,740,223 2,371,403 Economic development programs 5,329,001 1,040,725 - - Interest on long-term debt 10,771,672 - - -
Total governmental activities 325,400,240 41,189,189 33,793,805 27,418,491
Business-type activities:Water and sewer 124,612,840 109,384,412 - 17,432,137 Convention center 20,099,998 13,517,742 - - Mass transit 23,895,387 3,215,393 5,560,373 4,968,780 Parking facilities 7,149,092 7,960,563 - - Stormwater 7,950,641 14,267,724 - 226,520
Total business-type activities 183,707,958 148,345,834 5,560,373 22,627,437 Total City of Raleigh 509,108,198$ 189,535,023$ 39,354,178$ 50,045,928$
General revenues:Taxes:
Property taxes, levied for general purposeLocal sales taxFranchise taxOther taxesPrivilege license tax
Grants and contributions not restricted to specific programsUnrestricted investment earningsMiscellaneous
TransfersTotal general revenues and transfers
Change in net assets
Net assets - beginning
Prior period adjustment (Note 1.D.8, page 25)Net assets - ending
The notes to the financial statements are an integral part of this statement.
For the Fiscal Year Ended June 30, 2008 STATEMENT OF ACTIVITIES
2
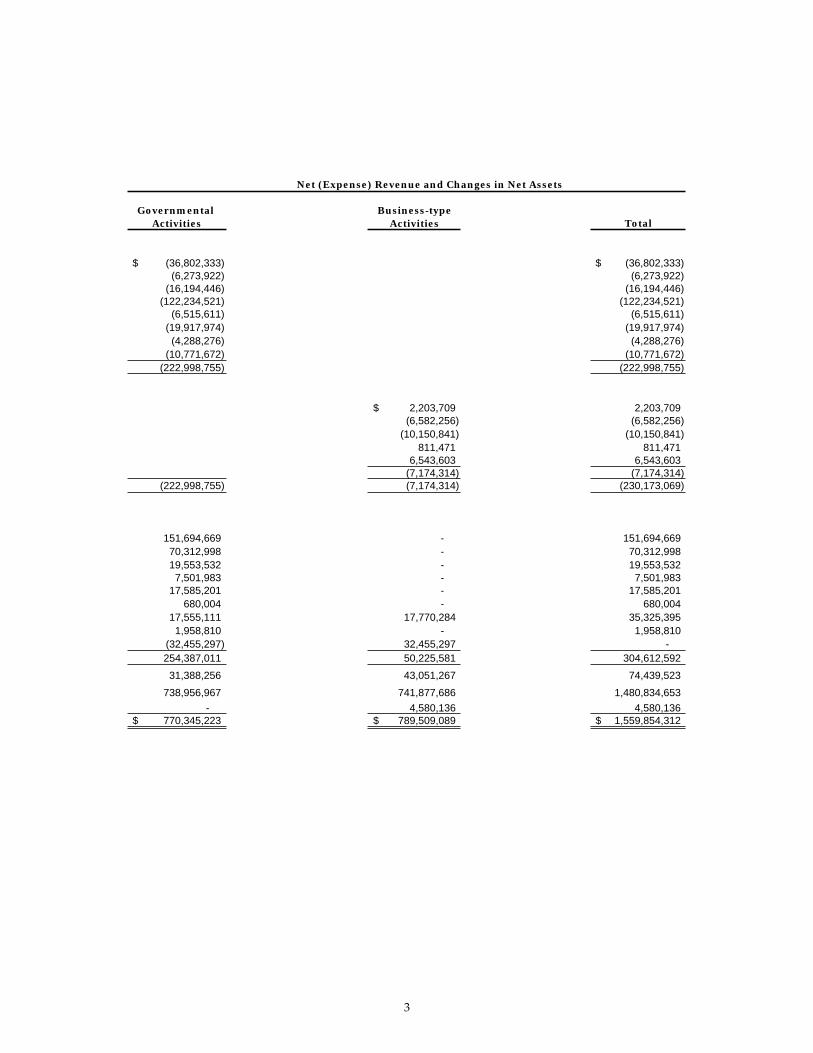
Net (Expense) Revenue and Changes in Net Assets
Governmental Business-typeActivities Activities Total
(36,802,333)$ (36,802,333)$ (6,273,922) (6,273,922)
(16,194,446) (16,194,446) (122,234,521) (122,234,521)
(6,515,611) (6,515,611) (19,917,974) (19,917,974) (4,288,276) (4,288,276)
(10,771,672) (10,771,672) (222,998,755) (222,998,755)
2,203,709$ 2,203,709 (6,582,256) (6,582,256)
(10,150,841) (10,150,841) 811,471 811,471
6,543,603 6,543,603 (7,174,314) (7,174,314)
(222,998,755) (7,174,314) (230,173,069)
151,694,669 - 151,694,669 70,312,998 - 70,312,998 19,553,532 - 19,553,532 7,501,983 - 7,501,983
17,585,201 - 17,585,201 680,004 - 680,004
17,555,111 17,770,284 35,325,395 1,958,810 - 1,958,810
(32,455,297) 32,455,297 - 254,387,011 50,225,581 304,612,592 31,388,256 43,051,267 74,439,523
738,956,967 741,877,686 1,480,834,653 - 4,580,136 4,580,136
770,345,223$ 789,509,089$ 1,559,854,312$
3
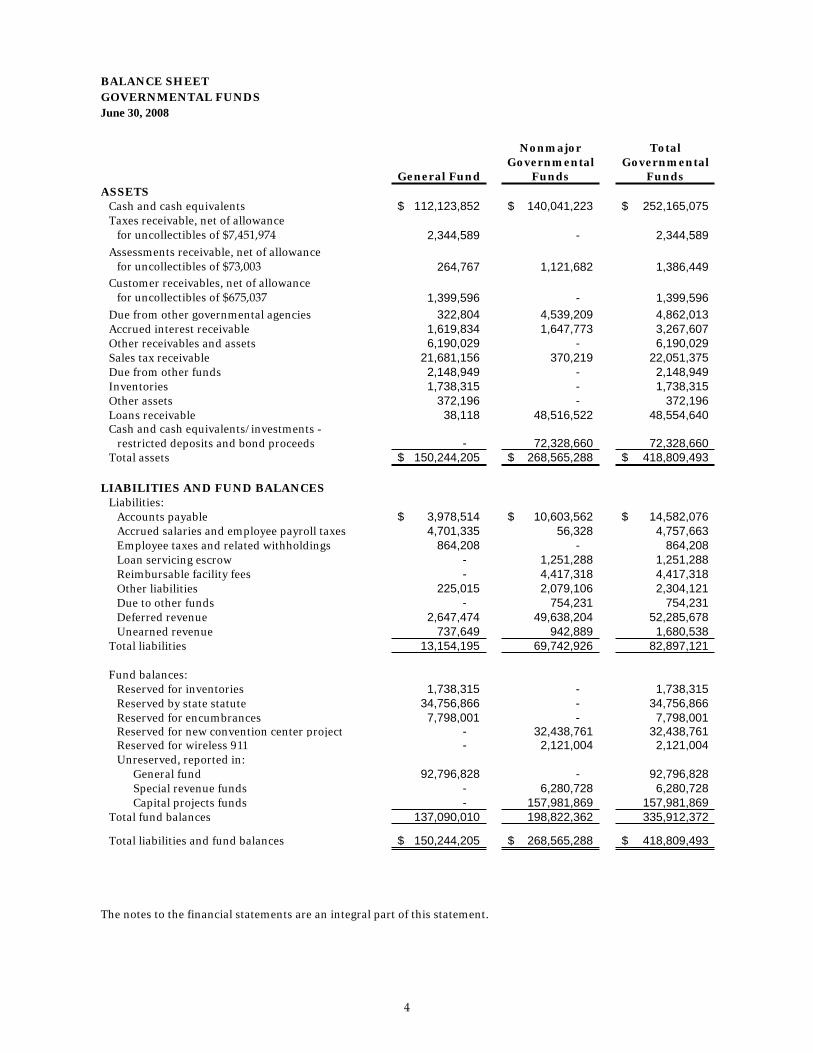
BALANCE SHEETGOVERNMENTAL FUNDSJune 30, 2008
Nonmajor TotalGovernmental Governmental
General Fund Funds FundsASSETS
Cash and cash equivalents 112,123,852$ 140,041,223$ 252,165,075$ Taxes receivable, net of allowance
for uncollectibles of $7,451,974 2,344,589 - 2,344,589 Assessments receivable, net of allowance
for uncollectibles of $73,003 264,767 1,121,682 1,386,449 Customer receivables, net of allowance
for uncollectibles of $675,037 1,399,596 - 1,399,596 Due from other governmental agencies 322,804 4,539,209 4,862,013 Accrued interest receivable 1,619,834 1,647,773 3,267,607 Other receivables and assets 6,190,029 - 6,190,029 Sales tax receivable 21,681,156 370,219 22,051,375 Due from other funds 2,148,949 - 2,148,949 Inventories 1,738,315 - 1,738,315 Other assets 372,196 - 372,196 Loans receivable 38,118 48,516,522 48,554,640 Cash and cash equivalents/investments - restricted deposits and bond proceeds - 72,328,660 72,328,660 Total assets 150,244,205$ 268,565,288$ 418,809,493$
LIABILITIES AND FUND BALANCESLiabilities:
Accounts payable 3,978,514$ 10,603,562$ 14,582,076$ Accrued salaries and employee payroll taxes 4,701,335 56,328 4,757,663 Employee taxes and related withholdings 864,208 - 864,208 Loan servicing escrow - 1,251,288 1,251,288 Reimbursable facility fees - 4,417,318 4,417,318 Other liabilities 225,015 2,079,106 2,304,121 Due to other funds - 754,231 754,231 Deferred revenue 2,647,474 49,638,204 52,285,678 Unearned revenue 737,649 942,889 1,680,538
Total liabilities 13,154,195 69,742,926 82,897,121
Fund balances:Reserved for inventories 1,738,315 - 1,738,315 Reserved by state statute 34,756,866 - 34,756,866 Reserved for encumbrances 7,798,001 - 7,798,001 Reserved for new convention center project - 32,438,761 32,438,761 Reserved for wireless 911 - 2,121,004 2,121,004Unreserved, reported in:
General fund 92,796,828 - 92,796,828 Special revenue funds - 6,280,728 6,280,728 Capital projects funds - 157,981,869 157,981,869
Total fund balances 137,090,010 198,822,362 335,912,372
Total liabilities and fund balances 150,244,205$ 268,565,288$ 418,809,493$
The notes to the financial statements are an integral part of this statement.
4

Total fund balances for governmental funds 335,912,372$
Total net assets reported for governmental activities in the statement of net assets is different because:
657,045,233
1,257,665
80,239
3,007,434
3,731,038
48,554,640
(279,243,398)
Net assets of governmental activities 770,345,223$
The notes to the financial statements are an integral part of this statement.
Deferred issuance costs are reported as expenditures in the funds because currentfinancial resources are used. In the governmental activities issuance costs arerecorded as a long-term asset and amortized over the life of the debt.
Capital assets used in governmental activities are not financial resources and,therefore, are not reported in the funds. (Land and construction in progress -$159,105,329; capital assets being depreciated, net - $497,939,904).
The net pension assets resulting from contributions in excess of annual requiredcontributions are not financial resources and therefore are not reported in the funds.
RECONCILIATION OF THE BALANCE SHEET OF GOVERNMENTAL FUNDS TO THE
STATEMENT OF NET ASSETSJune 30, 2008
Internal service funds are used by management to charge the costs of certainactivities, such as print services, risk management, health benefits, equipmentreplacement and central garage to individual funds. The assets and liabilities ofcertain internal service funds are included in governmental activities in thestatement of net assets.
Taxes receivable - $2,344,589, and assessments receivable - $1,386,449 will becollected after year-end, but are not available soon enough to pay for the currentperiod's expenditures and therefore are reported as deferred revenue in the funds.
Some liabilities, including bonds payable, are not due and payable in the currentperiod and therefore are not reported in the funds. (General obligation bonds-$170,647,905 - net of deferred refunding and issuance premium, notes payable -
$83,894,768; earned vacation pay - $15,824,114; landfill postclosure costs - $6,273,435;
and accrued interest payable - $2,603,176).
Loans receivable - $48,554,640, a long-term asset, is not available to pay for currentexpenditures and, therefore is deferred in the funds.
5

AND CHANGES IN FUND BALANCESGOVERNMENTAL FUNDSFor the Fiscal Year Ended June 30, 2008
Nonmajor TotalGovernmental Governmental
General Fund Funds FundsREVENUESAd valorem taxes 151,300,907$ -$ 151,300,907$ Intergovernmental 27,165,040 34,334,515 61,499,555 Developer participation - 127,544 127,544 Assessments - 732,873 732,873 Local sales tax 70,312,998 - 70,312,998 Licenses 17,585,201 - 17,585,201 Interest on investments 6,528,277 9,453,410 15,981,687 Inspection fees 10,917,601 - 10,917,601 Highway maintenance refunds 985,975 - 985,975 Facility fees - 5,637,987 5,637,987 Other fees and charges 29,657,540 - 29,657,540 Rents - 310,230 310,230 Program income - 2,881,111 2,881,111 Other revenues 2,497,910 1,107,160 3,605,070 Miscellaneous other - 1,076,470 1,076,470 Total revenues 316,951,449 55,661,300 372,612,749
EXPENDITURESCurrent:
General government 37,560,120 231,929 37,792,049 Community development services 17,442,042 7,386,268 24,828,310 Public works 19,866,475 1,705,562 21,572,037 Public safety 126,083,594 4,392,883 130,476,477 Solid waste services 21,657,724 - 21,657,724 Leisure services 39,393,478 178,746 39,572,224 Economic development programs - 5,329,000 5,329,000
Capital outlay - 65,633,876 65,633,876 Debt service:
Principal 15,966,793 - 15,966,793 Interest 9,492,700 - 9,492,700 Bond issue costs 306,909 - 306,909
Total expenditures 287,769,835 84,858,264 372,628,099 Excess (deficiency) of revenues
over (under) expenditures 29,181,614 (29,196,964) (15,350)
OTHER FINANCING SOURCES (USES)Transfers in 8,362,138 14,368,377 22,730,515 Transfers out (26,938,792) (28,280,090) (55,218,882) Notes issued - 54,279,000 54,279,000 Total other financing sources (uses) (18,576,654) 40,367,287 21,790,633
Net change in fund balances 10,604,960 11,170,323 21,775,283 Fund balance - beginning 126,485,050 187,652,039 314,137,089 Fund balance - ending 137,090,010$ 198,822,362$ 335,912,372$
The notes to the financial statements are an integral part of this statement.
STATEMENT OF REVENUES, EXPENDITURES
6
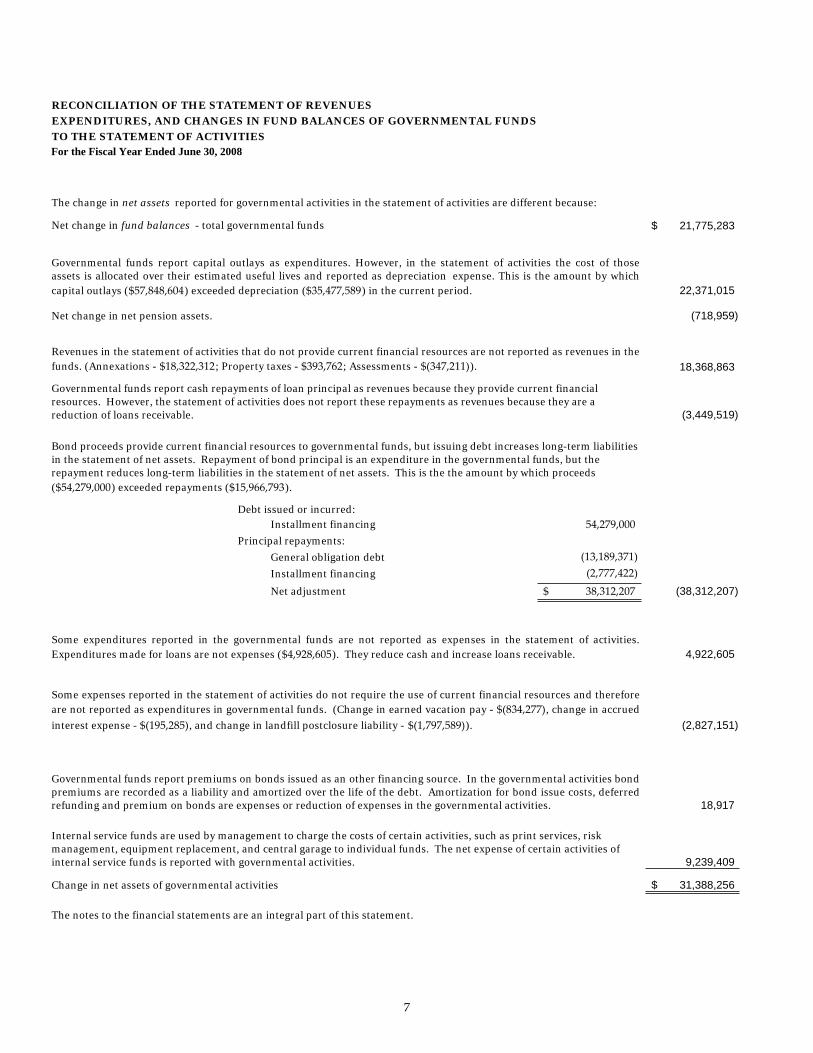
Net change in fund balances - total governmental funds 21,775,283$
22,371,015
(718,959)
18,368,863
(3,449,519)
Debt issued or incurred:Installment financing 54,279,000
Principal repayments:
General obligation debt (13,189,371)Installment financing (2,777,422)Net adjustment 38,312,207$ (38,312,207)
4,922,605
(2,827,151)
18,917
9,239,409
Change in net assets of governmental activities 31,388,256$
The notes to the financial statements are an integral part of this statement.
Governmental funds report premiums on bonds issued as an other financing source. In the governmental activities bondpremiums are recorded as a liability and amortized over the life of the debt. Amortization for bond issue costs, deferredrefunding and premium on bonds are expenses or reduction of expenses in the governmental activities.
Governmental funds report capital outlays as expenditures. However, in the statement of activities the cost of thoseassets is allocated over their estimated useful lives and reported as depreciation expense. This is the amount by whichcapital outlays ($57,848,604) exceeded depreciation ($35,477,589) in the current period.
Revenues in the statement of activities that do not provide current financial resources are not reported as revenues in thefunds. (Annexations - $18,322,312; Property taxes - $393,762; Assessments - $(347,211)).
Governmental funds report cash repayments of loan principal as revenues because they provide current financial resources. However, the statement of activities does not report these repayments as revenues because they are a reduction of loans receivable.
Internal service funds are used by management to charge the costs of certain activities, such as print services, risk management, equipment replacement, and central garage to individual funds. The net expense of certain activities of internal service funds is reported with governmental activities.
Bond proceeds provide current financial resources to governmental funds, but issuing debt increases long-term liabilities in the statement of net assets. Repayment of bond principal is an expenditure in the governmental funds, but the repayment reduces long-term liabilities in the statement of net assets. This is the the amount by which proceeds ($54,279,000) exceeded repayments ($15,966,793).
Some expenditures reported in the governmental funds are not reported as expenses in the statement of activities.Expenditures made for loans are not expenses ($4,928,605). They reduce cash and increase loans receivable.
Some expenses reported in the statement of activities do not require the use of current financial resources and thereforeare not reported as expenditures in governmental funds. (Change in earned vacation pay - $(834,277), change in accrued
interest expense - $(195,285), and change in landfill postclosure liability - $(1,797,589)).
RECONCILIATION OF THE STATEMENT OF REVENUES
EXPENDITURES, AND CHANGES IN FUND BALANCES OF GOVERNMENTAL FUNDS
Net change in net pension assets.
TO THE STATEMENT OF ACTIVITIESFor the Fiscal Year Ended June 30, 2008
The change in net assets reported for governmental activities in the statement of activities are different because:
7
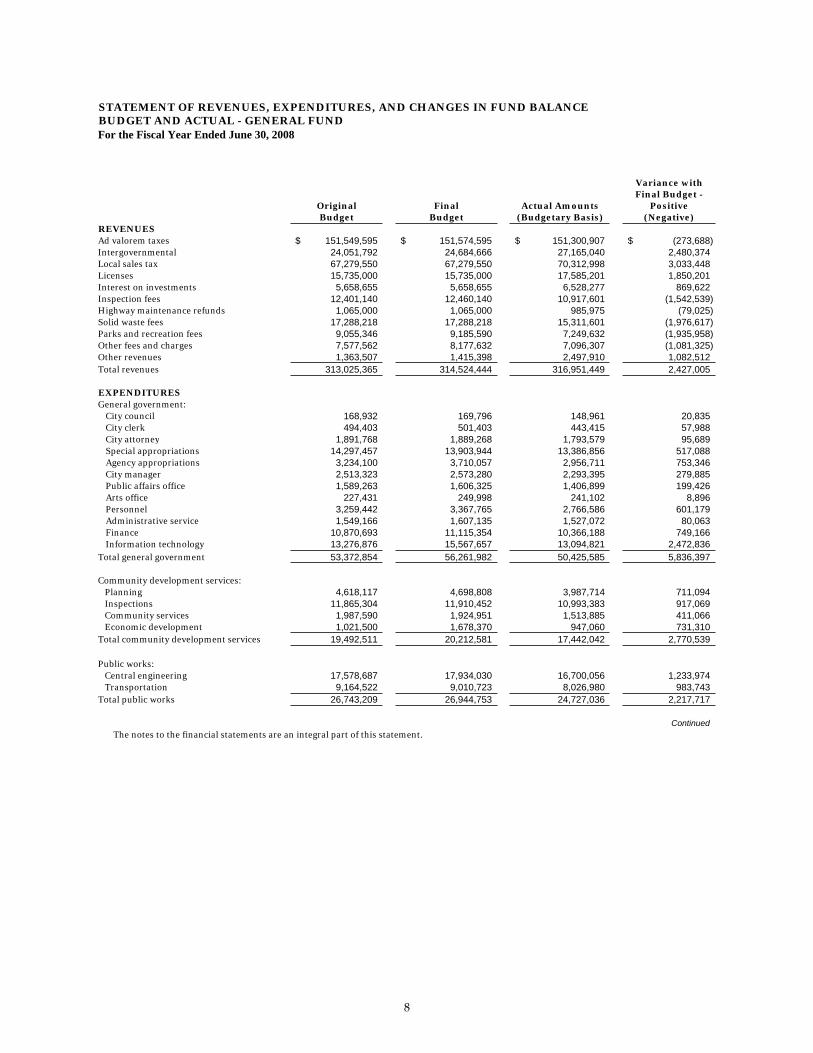
STATEMENT OF REVENUES, EXPENDITURES, AND CHANGES IN FUND BALANCE
OriginalBudget
FinalBudget
Actual Amounts (Budgetary Basis)
Variance with Final Budget -
Positive(Negative)
REVENUESAd valorem taxes 151,549,595$ 151,574,595$ 151,300,907$ (273,688)$ Intergovernmental 24,051,792 24,684,666 27,165,040 2,480,374 Local sales tax 67,279,550 67,279,550 70,312,998 3,033,448 Licenses 15,735,000 15,735,000 17,585,201 1,850,201 Interest on investments 5,658,655 5,658,655 6,528,277 869,622 Inspection fees 12,401,140 12,460,140 10,917,601 (1,542,539) Highway maintenance refunds 1,065,000 1,065,000 985,975 (79,025) Solid waste fees 17,288,218 17,288,218 15,311,601 (1,976,617) Parks and recreation fees 9,055,346 9,185,590 7,249,632 (1,935,958) Other fees and charges 7,577,562 8,177,632 7,096,307 (1,081,325) Other revenues 1,363,507 1,415,398 2,497,910 1,082,512 Total revenues 313,025,365 314,524,444 316,951,449 2,427,005
EXPENDITURESGeneral government:
City council 168,932 169,796 148,961 20,835 City clerk 494,403 501,403 443,415 57,988 City attorney 1,891,768 1,889,268 1,793,579 95,689 Special appropriations 14,297,457 13,903,944 13,386,856 517,088 Agency appropriations 3,234,100 3,710,057 2,956,711 753,346 City manager 2,513,323 2,573,280 2,293,395 279,885 Public affairs office 1,589,263 1,606,325 1,406,899 199,426 Arts office 227,431 249,998 241,102 8,896 Personnel 3,259,442 3,367,765 2,766,586 601,179 Administrative service 1,549,166 1,607,135 1,527,072 80,063 Finance 10,870,693 11,115,354 10,366,188 749,166 Information technology 13,276,876 15,567,657 13,094,821 2,472,836
Total general government 53,372,854 56,261,982 50,425,585 5,836,397
Community development services: Planning 4,618,117 4,698,808 3,987,714 711,094 Inspections 11,865,304 11,910,452 10,993,383 917,069 Community services 1,987,590 1,924,951 1,513,885 411,066 Economic development 1,021,500 1,678,370 947,060 731,310 Total community development services 19,492,511 20,212,581 17,442,042 2,770,539
Public works: Central engineering 17,578,687 17,934,030 16,700,056 1,233,974 Transportation 9,164,522 9,010,723 8,026,980 983,743 Total public works 26,743,209 26,944,753 24,727,036 2,217,717
ContinuedThe notes to the financial statements are an integral part of this statement.
BUDGET AND ACTUAL - GENERAL FUNDFor the Fiscal Year Ended June 30, 2008
8
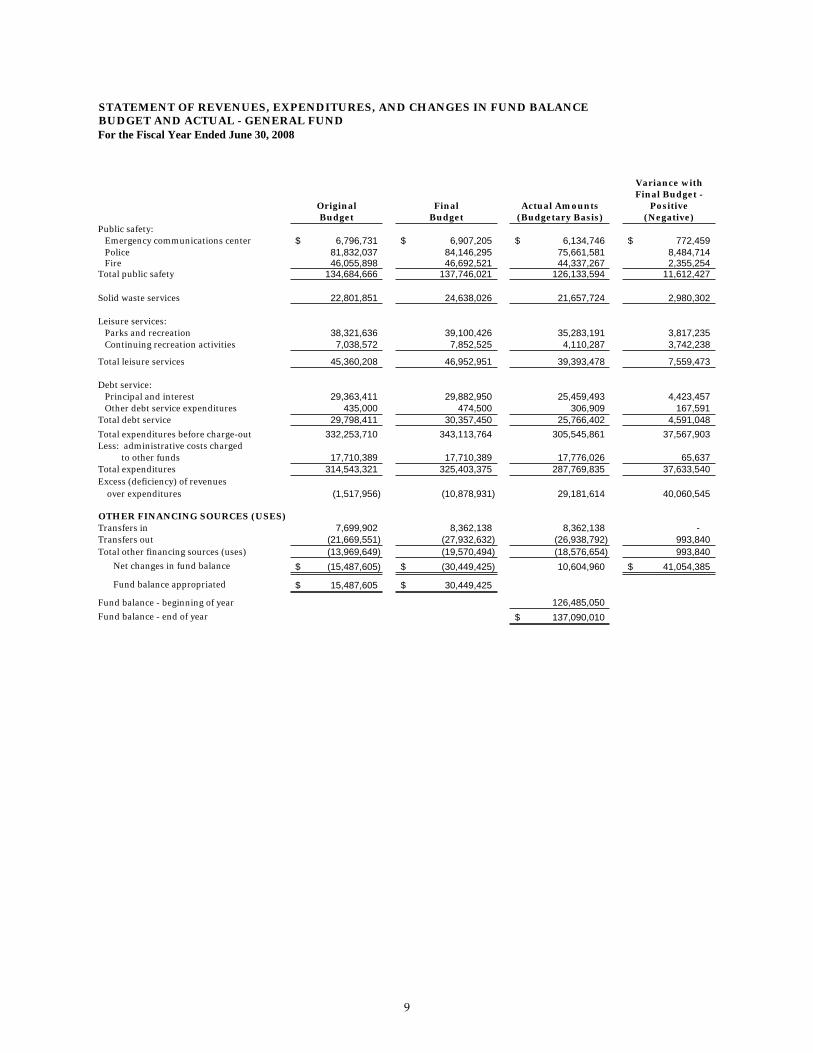
STATEMENT OF REVENUES, EXPENDITURES, AND CHANGES IN FUND BALANCE
OriginalBudget
FinalBudget
Actual Amounts (Budgetary Basis)
Variance with Final Budget -
Positive(Negative)
BUDGET AND ACTUAL - GENERAL FUNDFor the Fiscal Year Ended June 30, 2008
Public safety: Emergency communications center 6,796,731$ 6,907,205$ 6,134,746$ 772,459$ Police 81,832,037 84,146,295 75,661,581 8,484,714 Fire 46,055,898 46,692,521 44,337,267 2,355,254Total public safety 134,684,666 137,746,021 126,133,594 11,612,427
Solid waste services 22,801,851 24,638,026 21,657,724 2,980,302
Leisure services: Parks and recreation 38,321,636 39,100,426 35,283,191 3,817,235 Continuing recreation activities 7,038,572 7,852,525 4,110,287 3,742,238
Total leisure services 45,360,208 46,952,951 39,393,478 7,559,473
Debt service: Principal and interest 29,363,411 29,882,950 25,459,493 4,423,457 Other debt service expenditures 435,000 474,500 306,909 167,591 Total debt service 29,798,411 30,357,450 25,766,402 4,591,048 Total expenditures before charge-out 332,253,710 343,113,764 305,545,861 37,567,903 Less: administrative costs charged
to other funds 17,710,389 17,710,389 17,776,026 65,637 Total expenditures 314,543,321 325,403,375 287,769,835 37,633,540 Excess (deficiency) of revenues over expenditures (1,517,956) (10,878,931) 29,181,614 40,060,545
OTHER FINANCING SOURCES (USES)Transfers in 7,699,902 8,362,138 8,362,138 - Transfers out (21,669,551) (27,932,632) (26,938,792) 993,840 Total other financing sources (uses) (13,969,649) (19,570,494) (18,576,654) 993,840
Net changes in fund balance (15,487,605)$ (30,449,425)$ 10,604,960 41,054,385$
Fund balance appropriated 15,487,605$ 30,449,425$
Fund balance - beginning of year 126,485,050 Fund balance - end of year 137,090,010$
9

STATEMENT OF NET ASSETSPROPRIETARY FUNDSJune 30, 2008
Convention ParkingWater and Center FacilitiesSewer Fund Fund Fund
ASSETSCurrent assets:
Cash and cash equivalents 54,358,905$ 20,330,326$ 1,406,590$Customer receivables, net of allowance
for uncollectibles of $3,733,221 15,607,322 - 514,035Assessments receivable, net of allowance
for uncollectibles of $81,414 1,547,460 - -Due from other governmental agencies - - -Accrued interest receivable 2,003,721 246,041 15,969Other receivables and assets 115,027 487,180 4,892,846Sales tax receivable 4,741,754 1,047,837 179,283Due from other funds - - 500,000Inventories 5,014,284 - -Insurance deposit - - -Deferred charges 909,035 1,677,614 343,932
Total current assets 84,297,508 23,788,998 7,852,655
Noncurrent assets:Restricted cash and cash equivalents 323,945,905 25,706,542 10,919,938 Capital assets:
Land and improvements 36,842,464 23,978,826 8,050,998Construction in progress 83,551,729 215,689,014 46,921,806 Water and sewer systems 842,978,396 - -Buildings and machinery 84,681,973 27,022,903 -Parking decks - - 57,890,473 Buses - - -Equipment 17,933,795 525,567 331,002Furniture and fixtures 62,873 370,296 -Improvements 71,638,171 25,907,367 487,664
Less accumulated depreciation (241,272,412) (21,263,261) (15,376,405) Total noncurrent assets 1,220,362,894 297,937,254 109,225,476 Total assets 1,304,660,402 321,726,252 117,078,131
The notes to the financial statements are an integral part of this statement.
Enterprise Funds
10
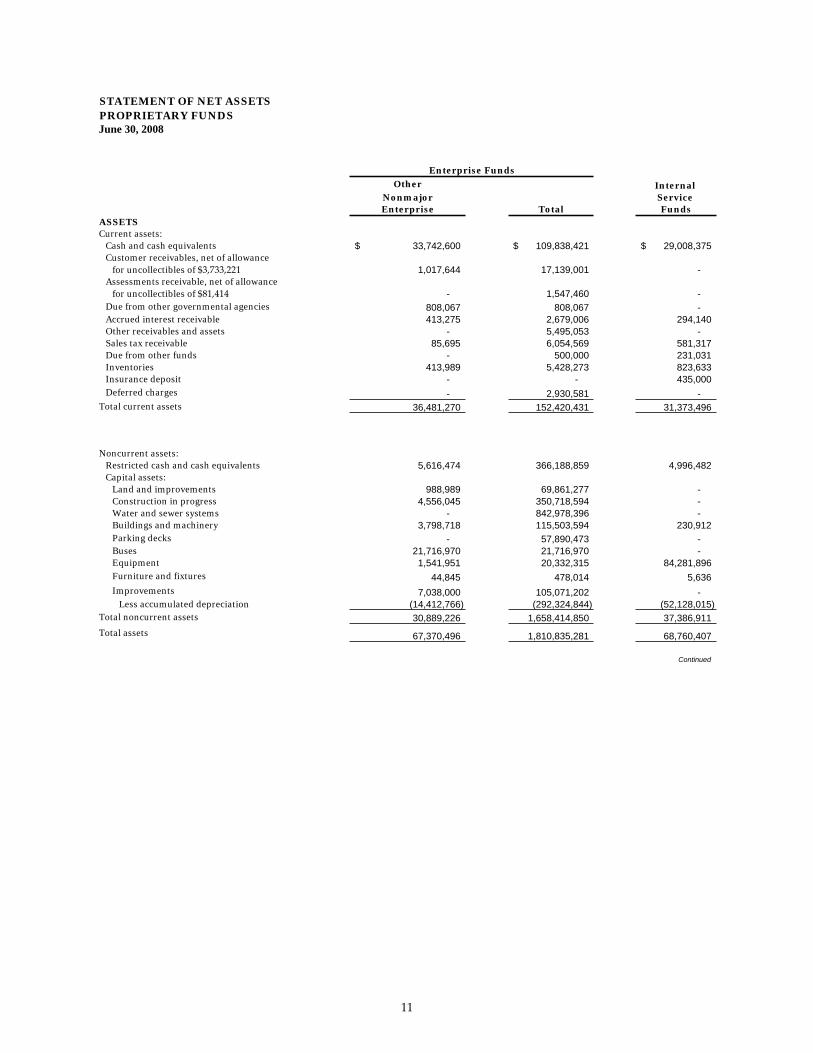
STATEMENT OF NET ASSETSPROPRIETARY FUNDSJune 30, 2008
ASSETSCurrent assets:
Cash and cash equivalentsCustomer receivables, net of allowance
for uncollectibles of $3,733,221Assessments receivable, net of allowance
for uncollectibles of $81,414Due from other governmental agenciesAccrued interest receivableOther receivables and assetsSales tax receivableDue from other fundsInventoriesInsurance depositDeferred charges
Total current assets
Noncurrent assets:Restricted cash and cash equivalentsCapital assets:
Land and improvementsConstruction in progressWater and sewer systemsBuildings and machineryParking decksBusesEquipmentFurniture and fixtures
ImprovementsLess accumulated depreciation
Total noncurrent assets
Total assets
Other InternalNonmajor Service Enterprise Total Funds
33,742,600$ 109,838,421$ 29,008,375$
1,017,644 17,139,001 -
- 1,547,460 - 808,067 808,067 - 413,275 2,679,006 294,140
- 5,495,053 - 85,695 6,054,569 581,317
- 500,000 231,031 413,989 5,428,273 823,633
- - 435,000 - 2,930,581 -
36,481,270 152,420,431 31,373,496
5,616,474 366,188,859 4,996,482
988,989 69,861,277 - 4,556,045 350,718,594 -
- 842,978,396 - 3,798,718 115,503,594 230,912
- 57,890,473 - 21,716,970 21,716,970 -
1,541,951 20,332,315 84,281,896 44,845 478,014 5,636
7,038,000 105,071,202 - (14,412,766) (292,324,844) (52,128,015) 30,889,226 1,658,414,850 37,386,911
67,370,496 1,810,835,281 68,760,407
Continued
Enterprise Funds
11

STATEMENT OF NET ASSETSPROPRIETARY FUNDSJune 30, 2008
Convention ParkingWater and Center FacilitiesSewer Fund Fund Fund
Enterprise Funds
LIABILITIESCurrent liabilities:
Accounts payable 23,772,947$ 15,740,920$ 3,405,524$Arbitrage rebate payable 479,318 - 10,152Accrued salaries and employee payroll taxes 583,000 108,101 13,567Accrued interest payable 6,806,766 3,432,563 912,258Claims payable and other liabilities - - -Deferred contributions from other funds - - -Due to other funds - 1,170,252 -Unearned revenue 150,812 29,288 57,552Bonds, notes and loans payable 7,650,249 - 665,000Unamortized premium (discount) 924,695 - 30,381Deferred refunding - bonds payable (388,099) - -Contracts and other notes payable 7,019,588 - 2,440,000Deferred refunding - contracts payable - - (42,158)
Total current liabilities 46,999,276 20,481,124 7,492,276
Noncurrent liabilities:Bonds, notes and loans payable 578,100,230 243,425,000 4,430,000Unamortized premium (discount) 13,828,598 - 496,098Deferred refunding - bonds payable (3,833,321) - -Contracts and other notes payable 8,767,040 - 61,085,000 Deferred refunding - contracts payable - - (83,929)Escrow and other deposits payable from restricted assets 30,429,665 - -Earned vacation pay 1,761,758 427,891 36,015
Total noncurrent liabilities 629,053,970 243,852,891 65,963,184 Total liabilities 676,053,246 264,334,015 73,455,460
NET ASSETSInvested in capital assets, net of related debt 577,864,248 54,512,254 40,205,084 Unrestricted 50,742,908 2,879,983 3,417,587Total net assets 628,607,156$ 57,392,237$ 43,622,671$
The notes to the financial statements are an integral part of this statement.
12
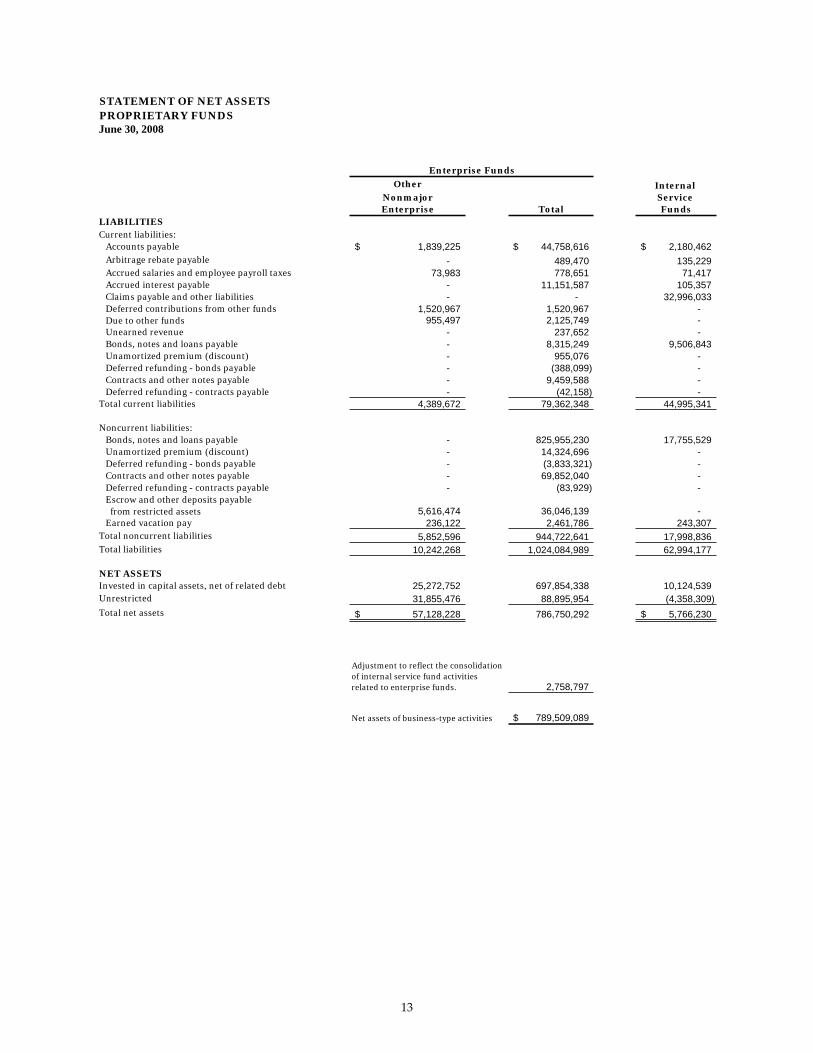
STATEMENT OF NET ASSETSPROPRIETARY FUNDSJune 30, 2008
LIABILITIESCurrent liabilities:
Accounts payableArbitrage rebate payableAccrued salaries and employee payroll taxesAccrued interest payableClaims payable and other liabilitiesDeferred contributions from other fundsDue to other fundsUnearned revenueBonds, notes and loans payableUnamortized premium (discount)Deferred refunding - bonds payableContracts and other notes payableDeferred refunding - contracts payable
Total current liabilities
Noncurrent liabilities:Bonds, notes and loans payableUnamortized premium (discount)Deferred refunding - bonds payableContracts and other notes payableDeferred refunding - contracts payableEscrow and other deposits payable from restricted assetsEarned vacation pay
Total noncurrent liabilitiesTotal liabilities
NET ASSETSInvested in capital assets, net of related debtUnrestricted
Total net assets
Other InternalNonmajor Service Enterprise Total Funds
Enterprise Funds
1,839,225$ 44,758,616$ 2,180,462$ - 489,470 135,229
73,983 778,651 71,417 - 11,151,587 105,357 - - 32,996,033
1,520,967 1,520,967 - 955,497 2,125,749 -
- 237,652 - - 8,315,249 9,506,843 - 955,076 - - (388,099) - - 9,459,588 - - (42,158) -
4,389,672 79,362,348 44,995,341
- 825,955,230 17,755,529 - 14,324,696 - - (3,833,321) - - 69,852,040 - - (83,929) -
5,616,474 36,046,139 - 236,122 2,461,786 243,307
5,852,596 944,722,641 17,998,836 10,242,268 1,024,084,989 62,994,177
25,272,752 697,854,338 10,124,539 31,855,476 88,895,954 (4,358,309) 57,128,228$ 786,750,292 5,766,230$
2,758,797
789,509,089$ Net assets of business-type activities
Adjustment to reflect the consolidation of internal service fund activities related to enterprise funds.
13

PROPRIETARY FUNDSFor the Fiscal Year Ended June 30, 2008
ConventionWater and CenterSewer Fund Fund
Operating revenuesUser charges 101,325,416$ 12,955,402$ Charges for services - internal - - Other 6,714,420 288,000 Total operating revenues 108,039,836 13,243,402
Operating expensesAdministration 4,336,028 - Other facility operating costs - 15,164,679 Water supply and treatment 23,800,396 - Sewer system and treatment 21,478,056 - Warehousing, maintenance and construction 17,957,295 - Other services 5,988,784 - Non-departmental charges 8,775,263 - Management contract charges - - Claims - - Premiums - - Depreciation 25,189,403 1,921,681 Other - - Total operating expenses 107,525,225 17,086,360
Operating income (loss) 514,611 (3,842,958)
Nonoperating revenue (expense)Interest on investments 12,445,954 2,720,961 Subsidy income - federal and state - - Other revenues 1,344,576 274,340 Interest expense (16,841,391) (2,779,776) Miscellaneous expense (1,651,225) (407,096) Total nonoperating revenue (expense) (4,702,086) (191,571)
Income (loss) before contributions,transfers and special item (4,187,475) (4,034,529)
Capital contributions 17,432,137 - Transfers in - 21,066,889 Transfers out (470,380) (2,561,307)
Change in net assets 12,774,282 14,471,053
Total net assets - beginning of year, as previously reported 615,832,874 38,910,415
Prior period adjustment (note 1.d.8, page 25) - 4,010,769
Total net assets - end of year 628,607,156$ 57,392,237$
The notes to the financial statements are an integral part of this statement.
STATEMENT OF REVENUES, EXPENSES, AND CHANGES IN FUND NET ASSETS
Enterprise Funds
14
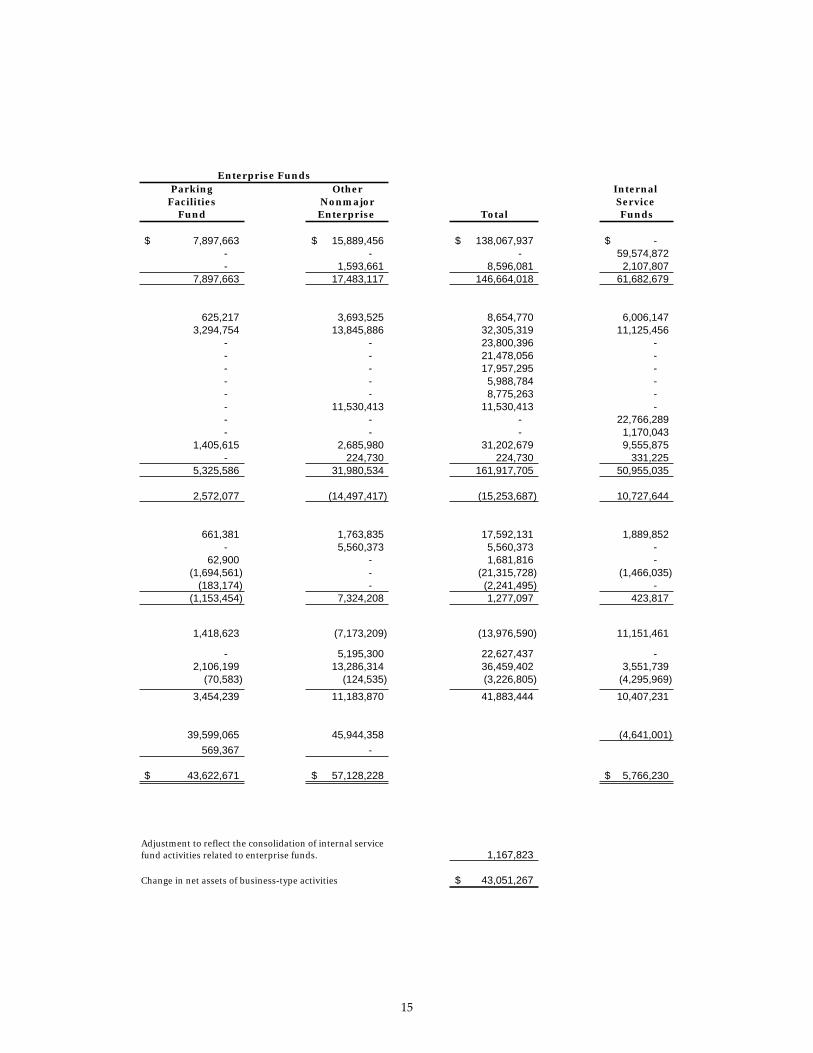
Parking Other Internal Facilities Nonmajor Service
Fund Enterprise Total Funds
7,897,663$ 15,889,456$ 138,067,937$ -$ - - - 59,574,872- 1,593,661 8,596,081 2,107,807
7,897,663 17,483,117 146,664,018 61,682,679
625,217 3,693,525 8,654,770 6,006,147 3,294,754 13,845,886 32,305,319 11,125,456
- - 23,800,396 - - - 21,478,056 - - - 17,957,295 - - - 5,988,784 - - - 8,775,263 - - 11,530,413 11,530,413 - - - - 22,766,289- - - 1,170,043
1,405,615 2,685,980 31,202,679 9,555,875 - 224,730 224,730 331,225
5,325,586 31,980,534 161,917,705 50,955,035
2,572,077 (14,497,417) (15,253,687) 10,727,644
661,381 1,763,835 17,592,131 1,889,852 - 5,560,373 5,560,373 -
62,900 - 1,681,816 - (1,694,561) - (21,315,728) (1,466,035)
(183,174) - (2,241,495) - (1,153,454) 7,324,208 1,277,097 423,817
1,418,623 (7,173,209) (13,976,590) 11,151,461
- 5,195,300 22,627,437 - 2,106,199 13,286,314 36,459,402 3,551,739
(70,583) (124,535) (3,226,805) (4,295,969)3,454,239 11,183,870 41,883,444 10,407,231
39,599,065 45,944,358 (4,641,001)569,367 -
43,622,671$ 57,128,228$ 5,766,230$
1,167,823
43,051,267$ Change in net assets of business-type activities
Enterprise Funds
Adjustment to reflect the consolidation of internal service fund activities related to enterprise funds.
15
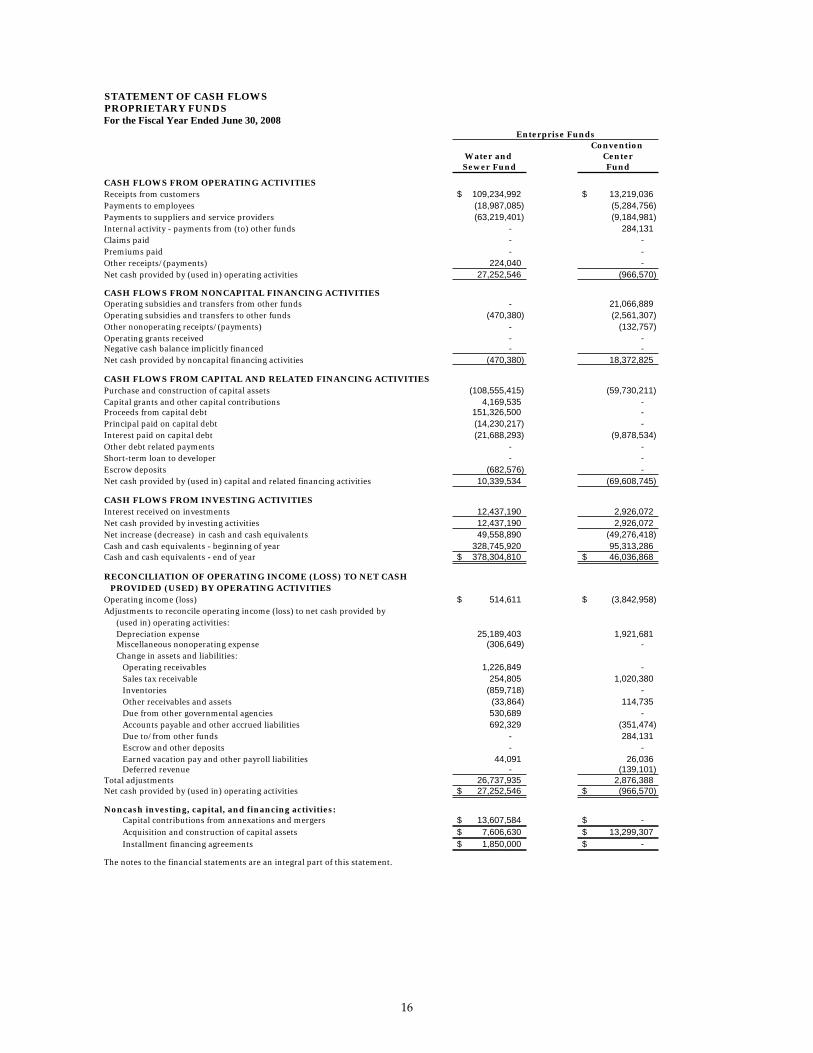
STATEMENT OF CASH FLOWSPROPRIETARY FUNDSFor the Fiscal Year Ended June 30, 2008
ConventionWater and CenterSewer Fund Fund
CASH FLOWS FROM OPERATING ACTIVITIESReceipts from customers 109,234,992$ 13,219,036$ Payments to employees (18,987,085) (5,284,756) Payments to suppliers and service providers (63,219,401) (9,184,981) Internal activity - payments from (to) other funds - 284,131 Claims paid - - Premiums paid - - Other receipts/(payments) 224,040 - Net cash provided by (used in) operating activities 27,252,546 (966,570)
CASH FLOWS FROM NONCAPITAL FINANCING ACTIVITIESOperating subsidies and transfers from other funds - 21,066,889 Operating subsidies and transfers to other funds (470,380) (2,561,307) Other nonoperating receipts/(payments) - (132,757) Operating grants received - - Negative cash balance implicitly financed - - Net cash provided by noncapital financing activities (470,380) 18,372,825
CASH FLOWS FROM CAPITAL AND RELATED FINANCING ACTIVITIESPurchase and construction of capital assets (108,555,415) (59,730,211) Capital grants and other capital contributions 4,169,535 - Proceeds from capital debt 151,326,500 - Principal paid on capital debt (14,230,217) - Interest paid on capital debt (21,688,293) (9,878,534) Other debt related payments - - Short-term loan to developer - - Escrow deposits (682,576) - Net cash provided by (used in) capital and related financing activities 10,339,534 (69,608,745)
CASH FLOWS FROM INVESTING ACTIVITIESInterest received on investments 12,437,190 2,926,072 Net cash provided by investing activities 12,437,190 2,926,072 Net increase (decrease) in cash and cash equivalents 49,558,890 (49,276,418) Cash and cash equivalents - beginning of year 328,745,920 95,313,286 Cash and cash equivalents - end of year 378,304,810$ 46,036,868$
RECONCILIATION OF OPERATING INCOME (LOSS) TO NET CASHPROVIDED (USED) BY OPERATING ACTIVITIES
Operating income (loss) 514,611$ (3,842,958)$ Adjustments to reconcile operating income (loss) to net cash provided by
(used in) operating activities:Depreciation expense 25,189,403 1,921,681 Miscellaneous nonoperating expense (306,649) - Change in assets and liabilities:
Operating receivables 1,226,849 - Sales tax receivable 254,805 1,020,380 Inventories (859,718) - Other receivables and assets (33,864) 114,735 Due from other governmental agencies 530,689 - Accounts payable and other accrued liabilities 692,329 (351,474) Due to/from other funds - 284,131 Escrow and other deposits - - Earned vacation pay and other payroll liabilities 44,091 26,036 Deferred revenue - (139,101)
Total adjustments 26,737,935 2,876,388 Net cash provided by (used in) operating activities 27,252,546$ (966,570)$
Noncash investing, capital, and financing activities:Capital contributions from annexations and mergers 13,607,584$ -$ Acquisition and construction of capital assets 7,606,630$ 13,299,307$ Installment financing agreements 1,850,000$ -$
The notes to the financial statements are an integral part of this statement.
Enterprise Funds
16

Enterprise FundsParking Other Internal
Facilities Nonmajor ServiceFund Enterprise Total Funds
7,699,029$ 16,533,229$ 146,686,286$ 59,575,785$ (624,651) (3,574,125) (28,470,617) (3,451,275)
(3,071,818) (24,932,460) (100,408,660) (13,267,765) 375,000 - 659,131.00 -
- - - (27,068,534) - - - (1,170,043) - 785,273 1,009,313 2,392,268
4,377,560 (11,188,083) 19,475,453 17,010,436
2,106,199 12,928,085 36,101,173 3,551,739 (70,583) (124,535) (3,226,805) (3,000,000) 62,900 - (69,857) -
- 2,528,303 2,528,303 - - - - (103,759)
2,098,516 15,331,853 35,332,814 447,980
(11,090,293) (9,405,277) (188,781,196) (10,911,618) - 8,516,495 12,686,030 -
14,765,000 - 166,091,500 - (2,819,066) - (17,049,283) (9,506,843) (2,675,552) - (34,242,379) (1,528,109)
(183,176) - (183,176) - (4,750,000) - (4,750,000) -
- 1,699,602 1,017,026 - (6,753,087) 810,820 (65,211,478) (21,946,570)
661,936 1,508,593 17,533,791 1,684,194 661,936 1,508,593 17,533,791 1,684,194 384,925 6,463,183 7,130,580 (2,803,960)
11,941,603 32,895,891 468,896,700 36,808,816 12,326,528$ 39,359,074$ 476,027,280$ 34,004,856$
2,572,077$ (14,497,417)$ (15,253,687)$ 10,727,644$
1,405,615 2,685,980 31,202,679 9,555,875 - - (306,649) -
(75,152) 60,115 1,211,812 913 173,140 116,087 1,564,412 469,813
- 24,531 (835,187) (29,475) (8,253) - 72,618 -
- - 530,689 - 52,063 371,952 764,870 (3,732,617)
375,000 - 659,131.00 - - 1,600 1,600 -
(1,701) 49,069 117,495 18,283 (115,229) - (254,330) -
1,805,483 3,309,334 34,729,140 6,282,792 4,377,560$ (11,188,083)$ 19,475,453$ 17,010,436$
-$ -$ 13,607,584$ -$ 3,345,035$ 668,408$ 24,919,380$ 531,616$
-$ -$ 1,850,000$ -$
17
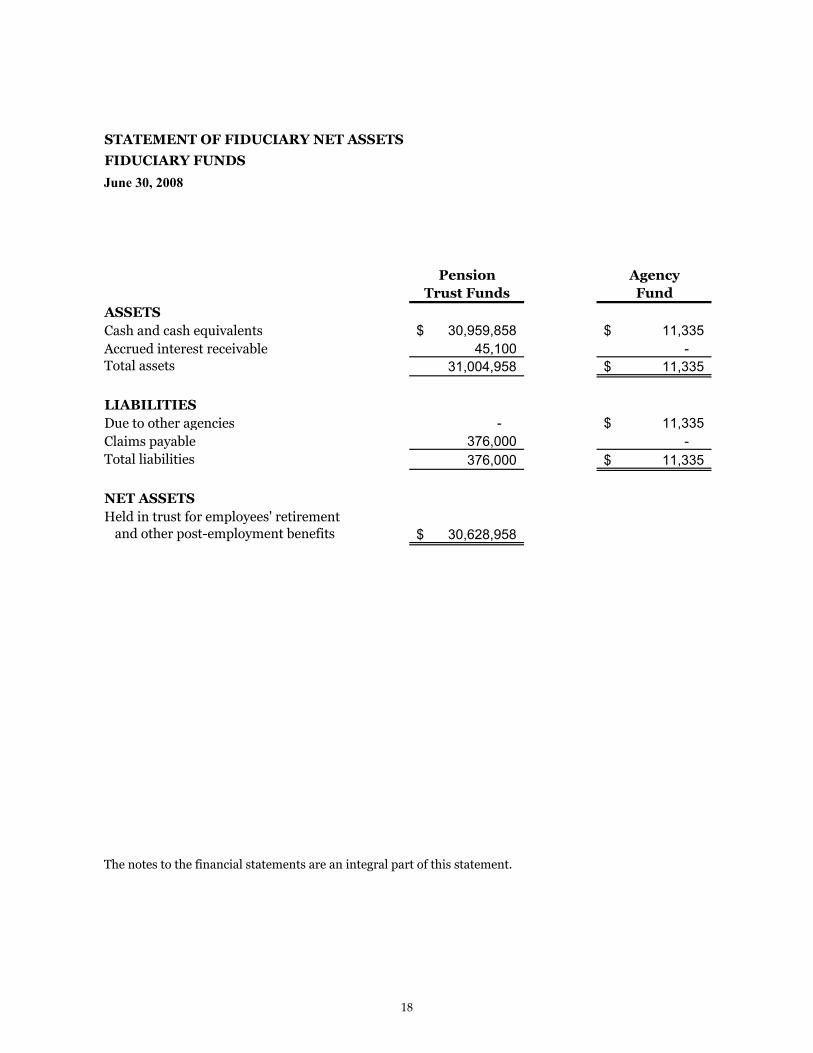
FIDUCIARY FUNDS
June 30, 2008
Pension AgencyTrust Funds Fund
ASSETSCash and cash equivalents 30,959,858$ 11,335$ Accrued interest receivable 45,100 - Total assets 31,004,958 11,335$
LIABILITIESDue to other agencies - 11,335$ Claims payable 376,000 - Total liabilities 376,000 11,335$
NET ASSETSHeld in trust for employees' retirement
and other post-employment benefits 30,628,958$
The notes to the financial statements are an integral part of this statement.
STATEMENT OF FIDUCIARY NET ASSETS
18

FIDUCIARY FUNDSFor the Fiscal Year Ended June 30, 2008
PensionTrust Funds
ADDITIONSContributions:
Employer contributions 13,408,391$ Retiree contributions 928,643
Total contributions 14,337,034
Investment earnings:Interest 1,836,792 Net increase in fair value of investments (3,271,720)
Total investment earnings (1,434,928) Less investment expense (35,101)
Net investment earnings (1,470,029) Total additions 12,867,005
DEDUCTIONSBenefits 10,402,382 Withdrawals and forfeitures 29,191 Total deductions 10,431,573
Change in net assets 2,435,432 Net assets - beginning of the year 28,193,526 Net assets - end of the year 30,628,958$
STATEMENT OF CHANGES IN FIDUCIARY NET ASSETS
The notes to the financial statements are an integral part of this statement.
19

20

21
22

23

24

25
26

:
27

28
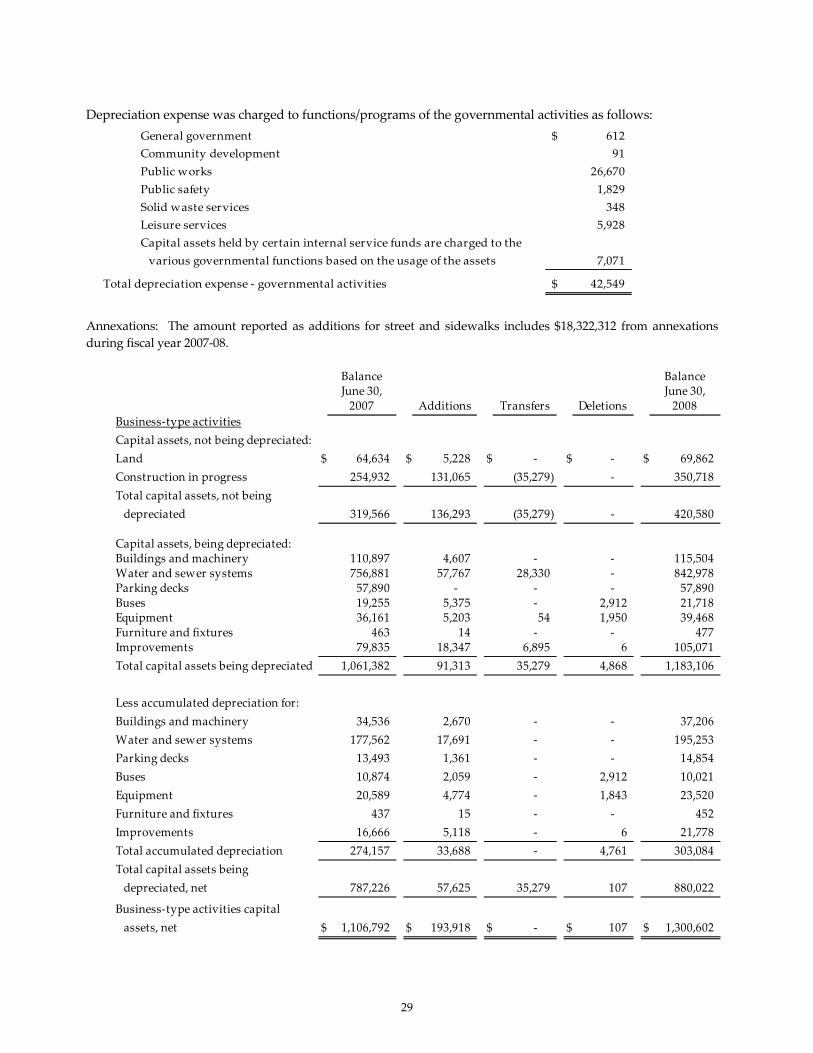
29

30

31
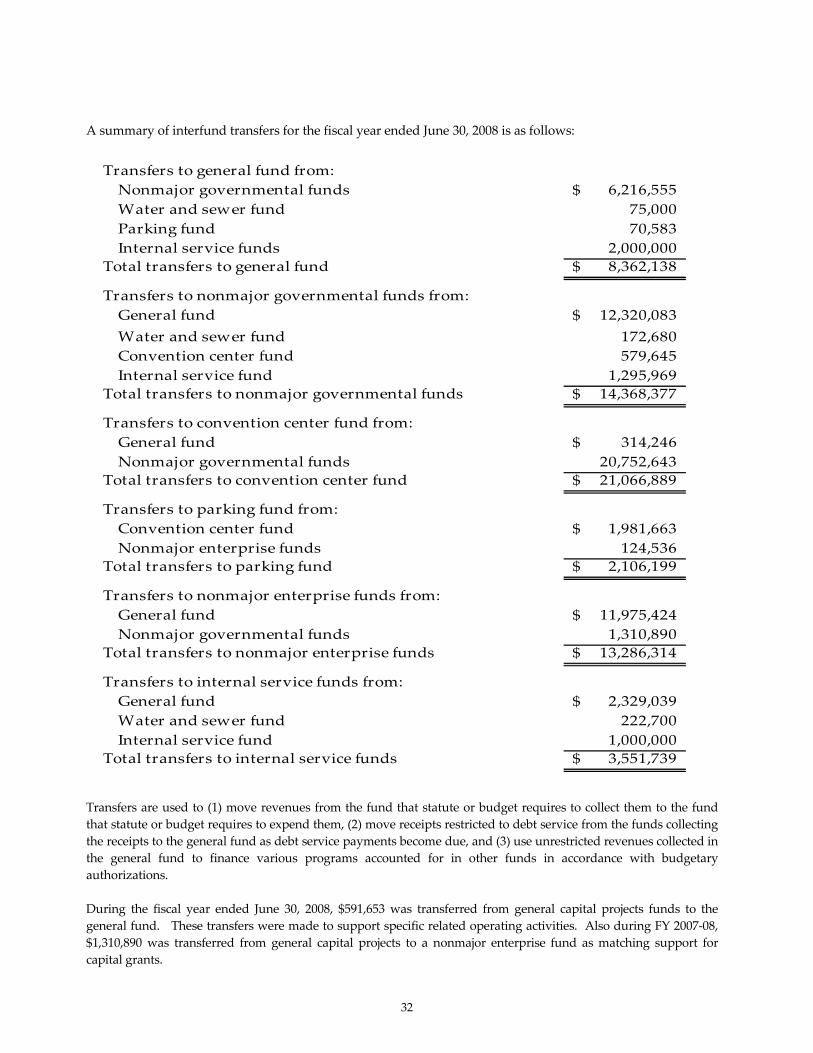
32

33
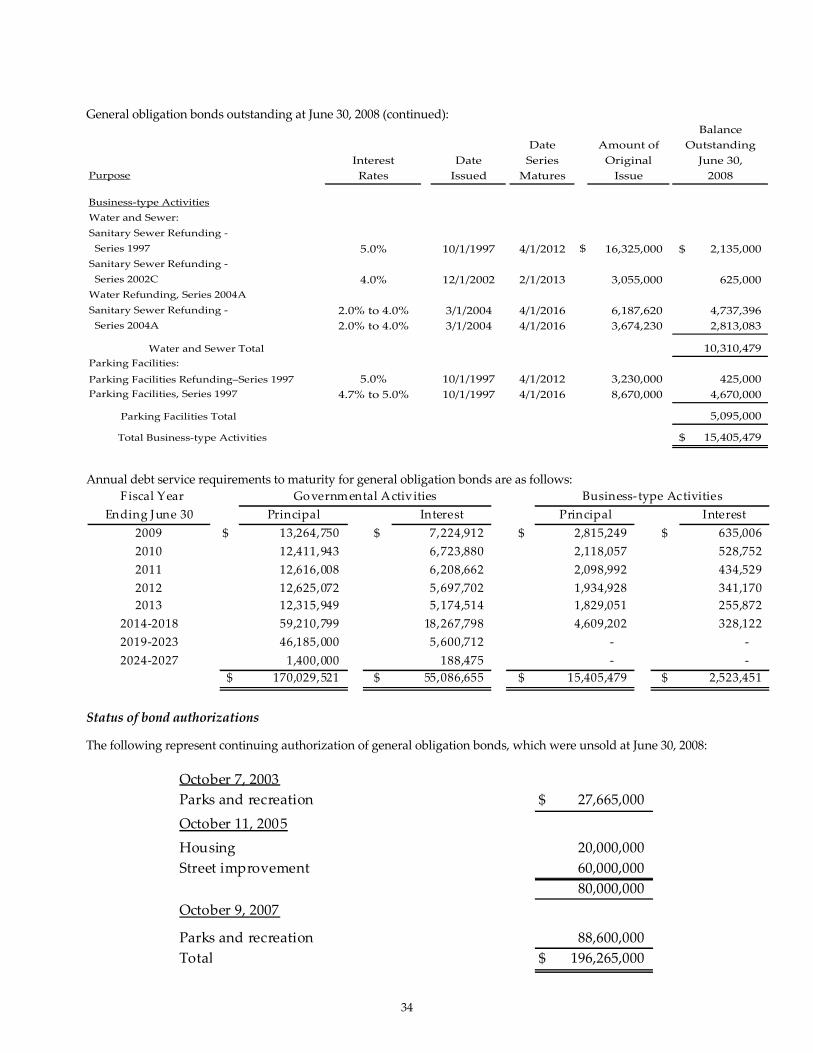
34

2013
35

36
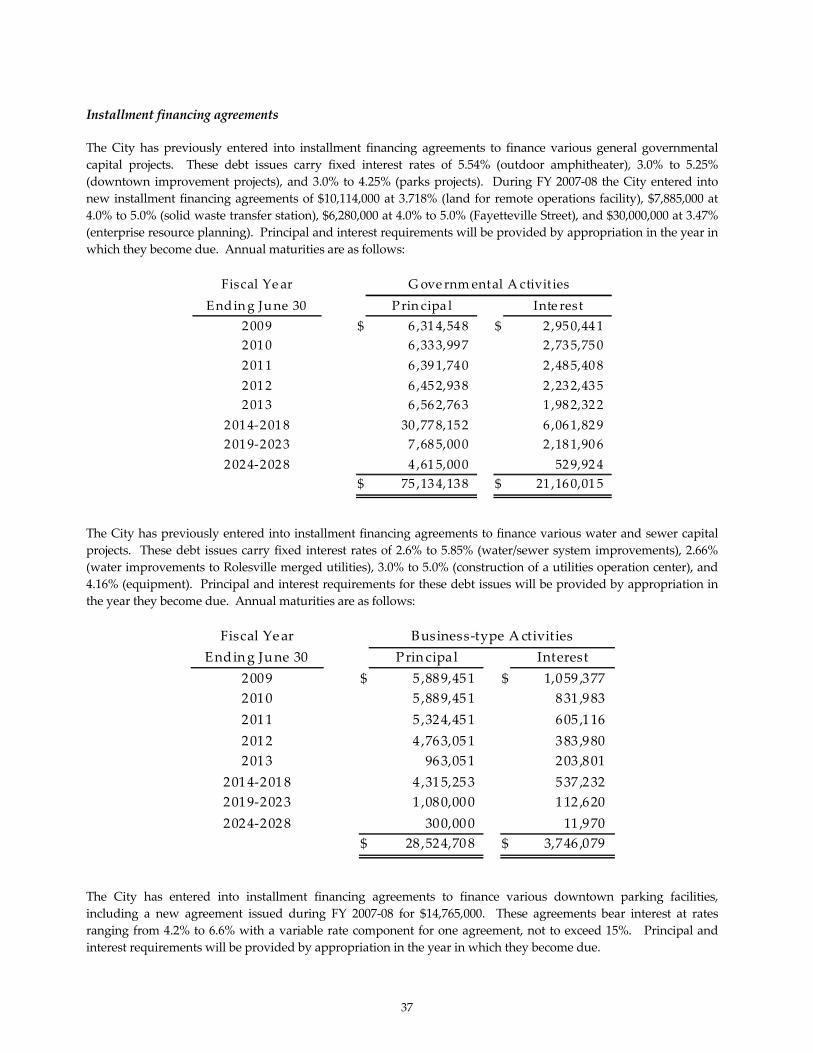
37

38

39

40

41

42

43

44

45
46

47

48

49

50
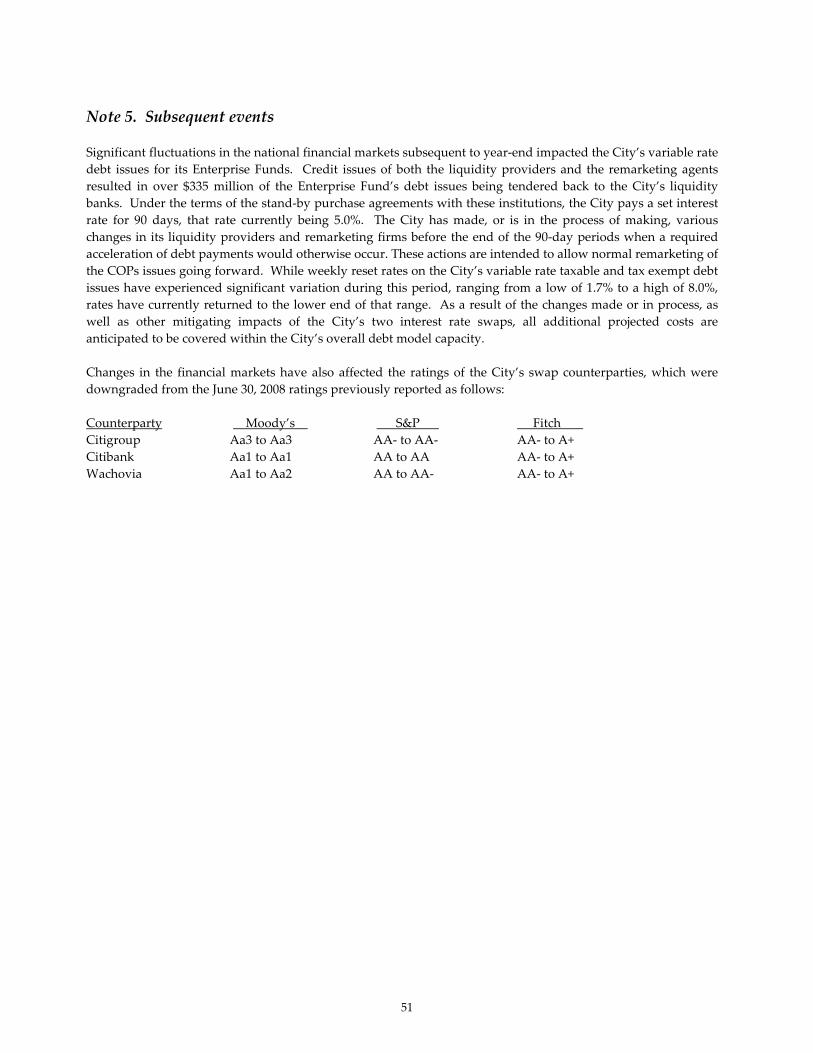
51

CITY OF RALEIGH
2008

CITY OF RALEIGH
2008
REQUIRED SUPPLEMENTARY INFORMATION

LAW ENFORCEMENT OFFICERS'SPECIAL SEPARATION ALLOWANCESCHEDULE OF FUNDING PROGRESS
ActuarialAccrued UAAL as a
Actuarial Liability (AAL) PercentageActuarial Value of Projected Unfunded Funded Covered of CoveredValuation Assets Unit Credit AAL (UAAL) Ratio Payroll Payroll
Date (a) (b) (b-a) (a/b) (c) [(b-a)/c]
2002* $ 4,146,793 $ 16,081,235 $ 11,934,442 25.8% $ 30,285,779 39.4%
2003* 4,220,540 16,914,130 12,693,590 24.9 31,666,230 40.1
2004* 4,186,220 18,067,520 13,881,300 23.2 34,675,457 40.0
2005* 3,445,835 16,629,292 13,183,457 20.7 35,627,409 37.02006* 3,341,952 18,104,374 14,762,422 18.5 36,919,192 39.92007* 3,212,204 20,637,390 17,425,186 15.6 38,040,517 45.8
Note:
52

LAW ENFORCEMENT OFFICERS'SPECIAL SEPARATION ALLOWANCESCHEDULE OF EMPLOYER CONTRIBUTIONS
Fiscal Year AnnualEnded Required Percentage
June 30 Contribution Contributed
2003 $ 1,411,280 118.2%2004 1,428,523 115.42005 1,509,766 65.52006 1,663,837 104.22007 1,498,641 123.62008 1,635,739 115.3
Notes to the Required Schedules:The information presented in the required supplementary schedules was determined as part of the actuarial valuations at the dates indicated. Additional information as of the latest actuarial valuation follows.
Valuation date
Actuarial cost method
Amortization method
Remaining amortization period
Asset valuation method
Actuarial assumptions: Investment rate of return
Projected salary increase
Includes inflation at
Cost of living adjustments
53
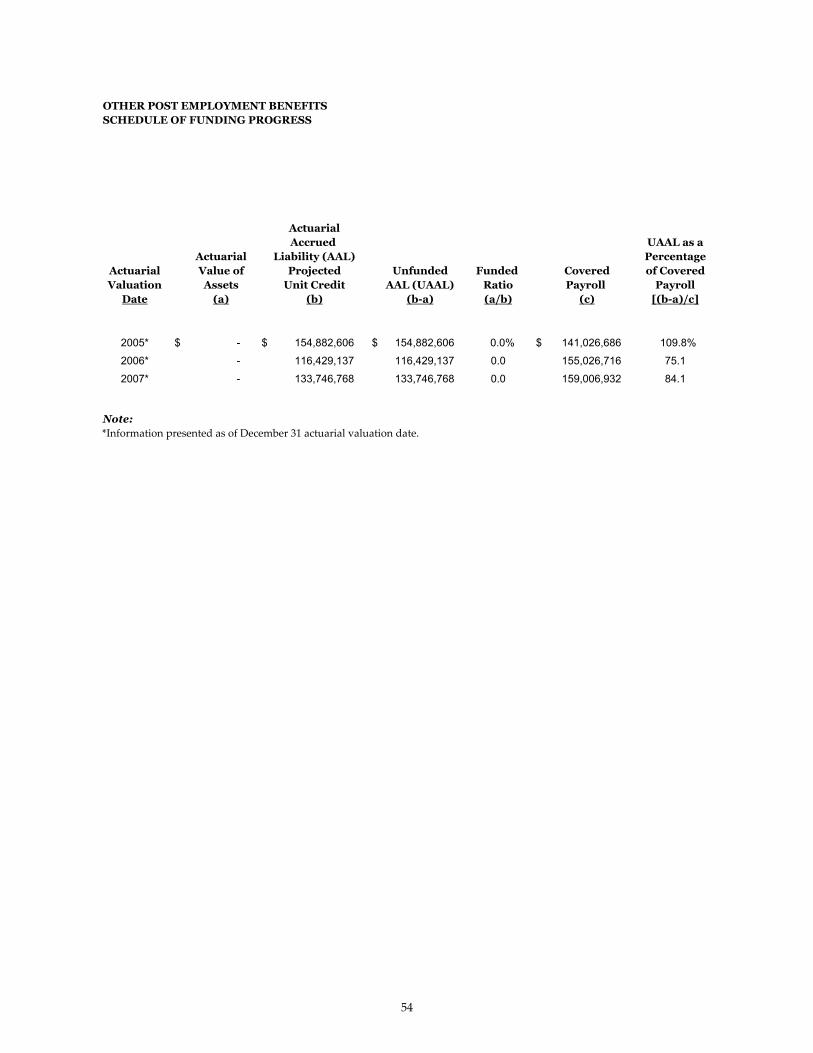
OTHER POST EMPLOYMENT BENEFITSSCHEDULE OF FUNDING PROGRESS
ActuarialAccrued UAAL as a
Actuarial Liability (AAL) PercentageActuarial Value of Projected Unfunded Funded Covered of CoveredValuation Assets Unit Credit AAL (UAAL) Ratio Payroll Payroll
Date (a) (b) (b-a) (a/b) (c) [(b-a)/c]
2005* $ - $ 154,882,606 $ 154,882,606 0.0% $ 141,026,686 109.8% 2006* - 116,429,137 116,429,137 0.0 155,026,716 75.1
2007* - 133,746,768 133,746,768 0.0 159,006,932 84.1
Note:
54

OTHER POST EMPLOYMENT BENEFITSSCHEDULE OF EMPLOYER CONTRIBUTIONS
Fiscal Year AnnualEnded Required Percentage
June 30 Contribution Contributed
2008 $ 9,669,155 89.4%
Notes to the Required Schedules:The information presented in the required supplementary schedules was determined as part of the actuarial valuations at the dates indicated. Additional information as of the latest actuarial valuation follows.
Valuation date
Actuarial cost method
Amortization method
Remaining amortization period
Asset valuation method
Actuarial assumptions: Investment rate of return
Medical cost trend rate Year of ultimate trend rate
Includes inflation at
Cost of living adjustments
55

CITY OF RALEIGH
2008
CITY OF RALEIGH
2008
CO
MB
IN
IN
GS
TA
TE
ME
NT
SA
ND
SC
HE
DU
LE
S
COMBINING AND INDIVIDUAL
FINANCIAL STATEMENTS AND SCHEDULES
The Combining and Individual Financial Statements and Schedules
reflect the detail level of presentation behind the basic financial
statements.
Included are the following:
1. Combining Statements - By Fund Type
2. Individual Fund Schedules with Comparisons to Budget
3. Other Schedules - Debt

CITY OF RALEIGH
2008
CITY OF RALEIGH
2008
NONMAJOR GOVERNMENTAL FUNDS
The Nonmajor Governmental Funds statements include the combining balance sheet andcombining statement of revenues, expenditures and changes in fund balance for nonmajorspecial revenue funds and nonmajor capital projects funds that comprise the othergovernmental funds column in the basic financial statements. The combining nonmajor special revenue funds statements and the combining nonmajor capital projects funds statements are detailed behind the special revenue funds and capital project funds dividers.

COMBINING BALANCE SHEETNONMAJOR GOVERNMENTAL FUNDSJune 30, 2008
Special Capital Total NonmajorRevenue Projects Governmental
Funds Funds Funds
ASSETSCash and cash equivalents 39,252,897$ 100,788,326$ 140,041,223$ Assessments receivable, net of allowance
for uncollectibles of - 1,121,682 1,121,682 Due from other governmental agencies 4,087,251 451,958 4,539,209 Accrued interest receivable 480,098 1,167,675 1,647,773 Sales tax receivable 38,736 331,483 370,219 Loans receivable 48,516,522 - 48,516,522 Cash and cash equivalents/investments - restricted deposits and bond proceeds 1,213,009 71,115,651 72,328,660 Total assets 93,588,513$ 174,976,775$ 268,565,288$
LIABILITIES AND FUND BALANCESLiabilities:
Accounts payable 1,226,762$ 9,376,800$ 10,603,562$ Accrued salaries and employee payroll taxes 56,328 - 56,328 Loan servicing escrow 1,251,288 - 1,251,288 Reimbursable facility fees - 4,417,318 4,417,318 Other liabilities - 2,079,106 2,079,106 Due to other funds 754,231 - 754,231 Deferred revenue 48,516,522 1,121,682 49,638,204 Unearned revenue 942,889 - 942,889
Total liabilities 52,748,020 16,994,906 69,742,926
Fund balances:Reserved for new convention center project 32,438,761 - 32,438,761 Reserved for wireless 911 2,121,004 - 2,121,004 Unreserved:
Designated for subsequent year's appropriation 4,612,467 143,225,178 147,837,645 Designated for specific purposes - 14,756,691 14,756,691 Undesignated 1,668,261 - 1,668,261
Total fund balances 40,840,493 157,981,869 198,822,362
Total liabilities and fund balances 93,588,513$ 174,976,775$ 268,565,288$
56

Special Capital Total NonmajorRevenue Projects Combining Governmental
Funds Funds Eliminations FundsREVENUESIntergovernmental 33,312,940$ 1,021,575$ -$ 34,334,515$ Developer participation - 127,544 - 127,544 Assessments - 732,873 - 732,873 Interest on investments 2,592,284 6,861,126 - 9,453,410 Facility fees - 5,637,987 - 5,637,987 Rents 310,230 - - 310,230 Program income 2,881,111 - - 2,881,111 Miscellaneous other 129,441 2,054,189 - 2,183,630 Total revenues 39,226,006 16,435,294 - 55,661,300
EXPENDITURES
General government 231,929 - - 231,929 Community development services 7,386,268 - - 7,386,268 Public works 1,175,520 530,042 - 1,705,562 Public safety 4,392,883 - - 4,392,883 Leisure services 178,746 - - 178,746 Economic development programs 5,329,000 - - 5,329,000 Capital outlay 910,055 64,723,821 - 65,633,876 Total expenditures 19,604,401 65,253,863 - 84,858,264
Excess (deficiency) of revenues over (under) expenditures 19,621,605 (48,818,569) - (29,196,964)
OTHER FINANCING SOURCES (USES)Transfers in 2,498,250 16,747,267 (4,877,140) 14,368,377 Transfers out (31,254,685) (1,902,545) 4,877,140 (28,280,090) Notes issued - 54,279,000 - 54,279,000 Total other financing sources (uses) (28,756,435) 69,123,722 - 40,367,287
Net change in fund balances (9,134,830) 20,305,153 - 11,170,323 Fund balance - beginning of year 49,975,323 137,676,716 - 187,652,039 Fund balance - ending of year 40,840,493$ 157,981,869$ -$ 198,822,362$
COMBINING STATEMENT OF REVENUES, EXPENDITURESAND CHANGES IN FUND BALANCESNONMAJOR GOVERNMENTAL FUNDSFor the Fiscal Year Ended June 30, 2008
57

CITY OF RALEIGH
2008
CITY OF RALEIGH
2008
SP
EC
IA
LR
EV
EN
UE
FU
ND
S
SPECIAL REVENUE FUNDS
The primary purpose of the Special Revenue Funds is to account for
the proceeds of designated revenue sources that are restricted by law or
administrative action for specific purposes. Revenue sources accounted
for through the City’s special revenue funds include Powell Bill funds,
housing development and bond funds, new convention center financing
funds, wireless 911 funds, and various grant revenues.

CITY OF RALEIGH
2008

CITY OF RALEIGH
2008
SPECIAL REVENUE FUNDS
GRANTS FUND (NONMAJOR FUND) - The Grants Fund accounts for activities to whichfederal, state, and other aid is contributed, with the exception of capital projects, federalcommunity development, and public transportation assistance. This fund centralizes allfunding sources for these activities and provides for full budgetary accountability.
HOUSING DEVELOPMENT FUND (NONMAJOR FUND) - The Housing Development Fund accounts for City housing development programs, which are funded from City general revenues.
HOUSING BOND FUND (NONMAJOR FUND) - The Housing Bond Fund accounts forCity housing development programs which are financed by general obligation bond issues.
COMMUNITY DEVELOPMENT FUND (NONMAJOR FUND) - The CommunityDevelopment Fund accounts for United States Department of Housing and UrbanDevelopment (HUD) grant proceeds allocated to the City for community developmentprograms.
POWELL BILL FUND (NONMAJOR FUND) - The Powell Bill Fund accounts for the receiptsand expenditures of the one cent sales tax on motor fuel, which is distributed to municipalitiesfor local street improvement and maintenance. Allocation of this state tax is on the basis oflocal street mileage and population data.
DISASTER RECOVERY FUND (NONMAJOR FUND) - The Disaster Recovery Fund accountsfor federal and state reimbursement for disaster recovery activities resulting from various naturaldisasters and the City’s flood mitigation program.
NEW CONVENTION CENTER FINANCING FUND (NONMAJOR FUND) - The NewConvention Center Financing Fund accounts for hotel and motel occupancy taxes collected bythe County and remitted to the City per an interlocal agreement to fund the financing of theNew Convention Center.
WIRELESS 911 FUND (NONMAJOR FUND) -The Wireless 911 Fund accounts for thewireless 911 funds remitted to the City from the County and used for qualified wireless 911 expenditures.
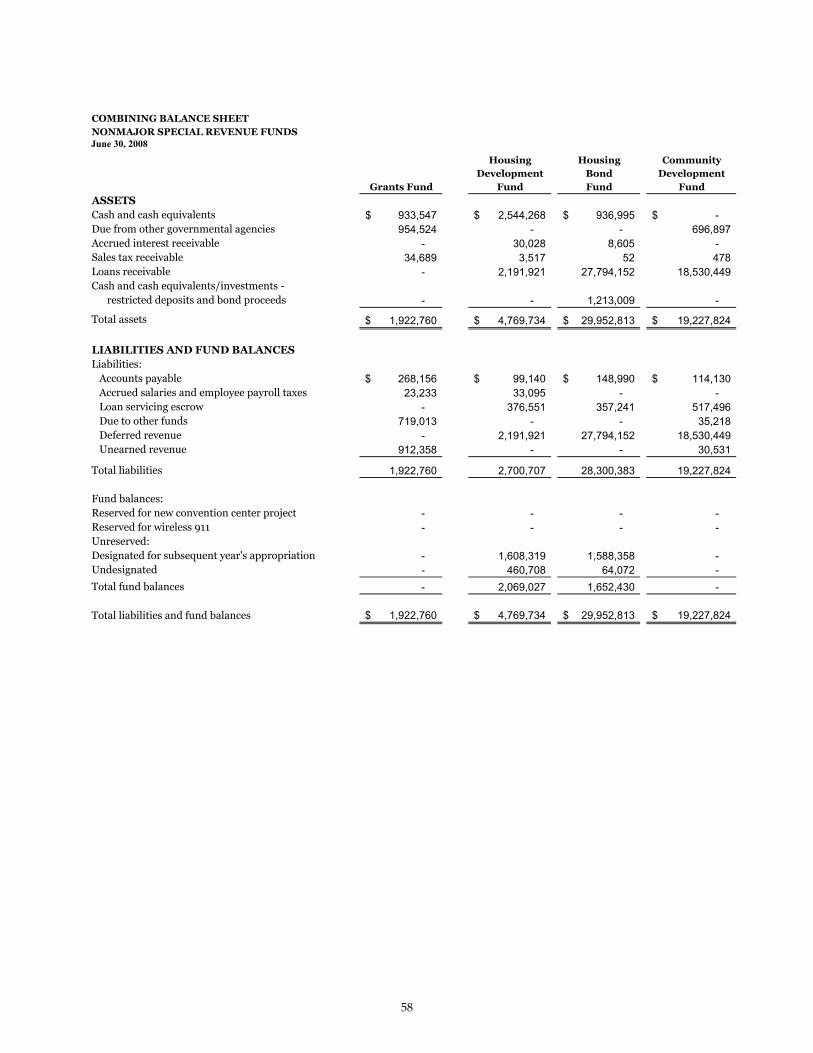
COMBINING BALANCE SHEETNONMAJOR SPECIAL REVENUE FUNDSJune 30, 2008
Housing Housing CommunityDevelopment Bond Development
Grants Fund Fund Fund Fund
ASSETSCash and cash equivalents 933,547$ 2,544,268$ 936,995$ -$ Due from other governmental agencies 954,524 - - 696,897 Accrued interest receivable - 30,028 8,605 - Sales tax receivable 34,689 3,517 52 478 Loans receivable - 2,191,921 27,794,152 18,530,449 Cash and cash equivalents/investments -
restricted deposits and bond proceeds - - 1,213,009 -
Total assets 1,922,760$ 4,769,734$ 29,952,813$ 19,227,824$
LIABILITIES AND FUND BALANCESLiabilities:
Accounts payable 268,156$ 99,140$ 148,990$ 114,130$ Accrued salaries and employee payroll taxes 23,233 33,095 - - Loan servicing escrow - 376,551 357,241 517,496 Due to other funds 719,013 - - 35,218 Deferred revenue - 2,191,921 27,794,152 18,530,449 Unearned revenue 912,358 - - 30,531
Total liabilities 1,922,760 2,700,707 28,300,383 19,227,824
Fund balances:Reserved for new convention center project - - - - Reserved for wireless 911 - - - - Unreserved:Designated for subsequent year's appropriation - 1,608,319 1,588,358 - Undesignated - 460,708 64,072 - Total fund balances - 2,069,027 1,652,430 -
Total liabilities and fund balances 1,922,760$ 4,769,734$ 29,952,813$ 19,227,824$
58

New Convention Total NonmajorPowell Disaster Center Financing Wireless 911 Special Revenue
Bill Fund Recovery Fund Fund Fund Funds
1,130,288$ 1,415,790$ 29,606,118$ 2,685,891$ 39,252,897$ - - 2,435,830 - 4,087,251
13,193 - 396,813 31,459 480,098 - - - - 38,736 - - - - 48,516,522
- - - - 1,213,009
1,143,481$ 1,415,790$ 32,438,761$ 2,717,350$ 93,588,513$
-$ -$ -$ 596,346$ 1,226,762$ - - - - 56,328 - - - - 1,251,288 - - - - 754,231 - - - - 48,516,522 - - - - 942,889
- - - 596,346 52,748,020
- - 32,438,761 - 32,438,761 - - - 2,121,004 2,121,004
- 1,415,790 - - 4,612,467 1,143,481 - - - 1,668,261 1,143,481 1,415,790 32,438,761 2,121,004 40,840,493
1,143,481$ 1,415,790$ 32,438,761$ 2,717,350$ 93,588,513$
59
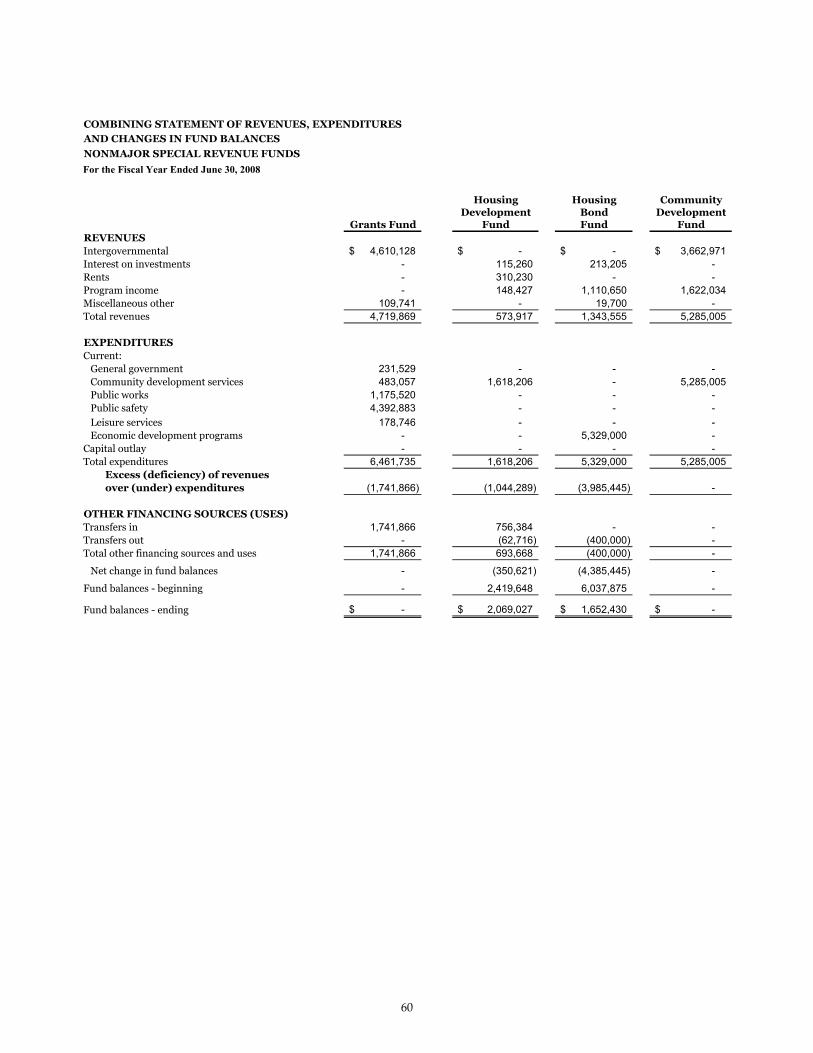
COMBINING STATEMENT OF REVENUES, EXPENDITURES
AND CHANGES IN FUND BALANCES
NONMAJOR SPECIAL REVENUE FUNDS
For the Fiscal Year Ended June 30, 2008
Housing Housing CommunityDevelopment Bond Development
Grants Fund Fund Fund FundREVENUESIntergovernmental 4,610,128$ -$ -$ 3,662,971$ Interest on investments - 115,260 213,205 - Rents - 310,230 - - Program income - 148,427 1,110,650 1,622,034 Miscellaneous other 109,741 - 19,700 - Total revenues 4,719,869 573,917 1,343,555 5,285,005
EXPENDITURESCurrent:
General government 231,529 - - - Community development services 483,057 1,618,206 - 5,285,005 Public works 1,175,520 - - - Public safety 4,392,883 - - - Leisure services 178,746 - - - Economic development programs - - 5,329,000 -
Capital outlay - - - - Total expenditures 6,461,735 1,618,206 5,329,000 5,285,005
Excess (deficiency) of revenuesover (under) expenditures (1,741,866) (1,044,289) (3,985,445) -
OTHER FINANCING SOURCES (USES)Transfers in 1,741,866 756,384 - - Transfers out - (62,716) (400,000) - Total other financing sources and uses 1,741,866 693,668 (400,000) -
Net change in fund balances - (350,621) (4,385,445) -
Fund balances - beginning - 2,419,648 6,037,875 -
Fund balances - ending -$ 2,069,027$ 1,652,430$ -$
60
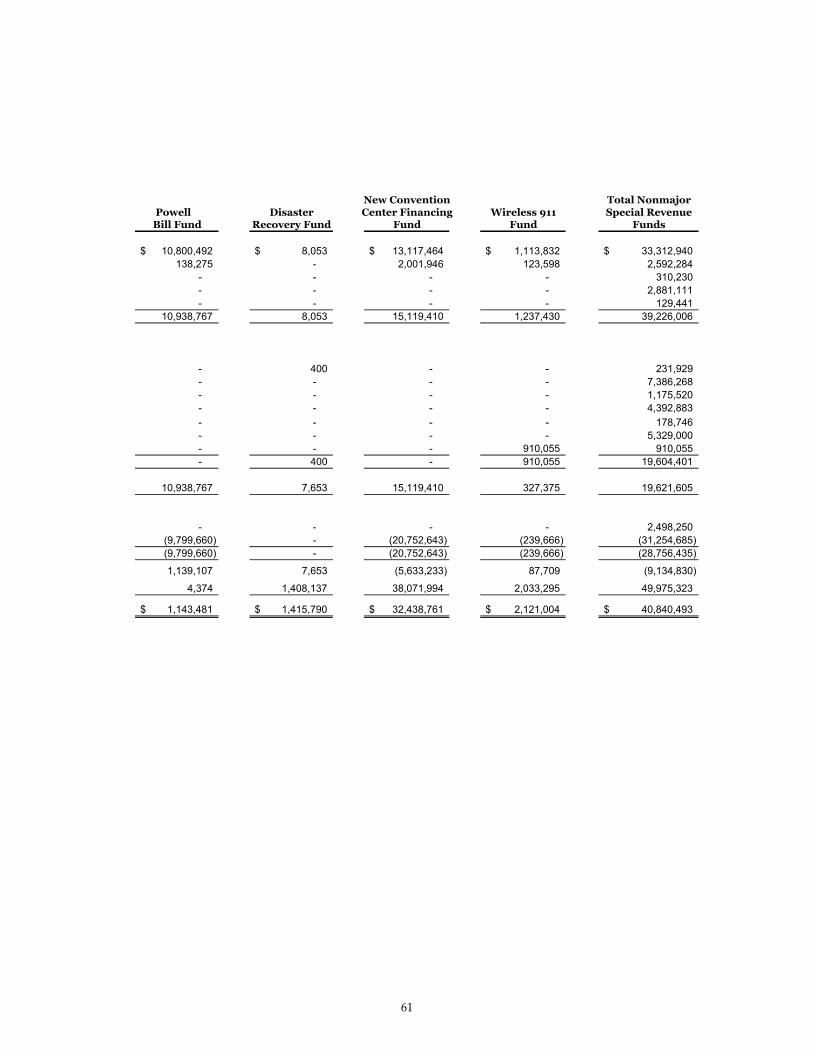
New Convention Total NonmajorPowell Disaster Center Financing Wireless 911 Special Revenue
Bill Fund Recovery Fund Fund Fund Funds
10,800,492$ 8,053$ 13,117,464$ 1,113,832$ 33,312,940$ 138,275 - 2,001,946 123,598 2,592,284
- - - - 310,230 - - - - 2,881,111 - - - - 129,441
10,938,767 8,053 15,119,410 1,237,430 39,226,006
- 400 - - 231,929 - - - - 7,386,268 - - - - 1,175,520 - - - - 4,392,883 - - - - 178,746 - - - - 5,329,000 - - - 910,055 910,055 - 400 - 910,055 19,604,401
10,938,767 7,653 15,119,410 327,375 19,621,605
- - - - 2,498,250 (9,799,660) - (20,752,643) (239,666) (31,254,685) (9,799,660) - (20,752,643) (239,666) (28,756,435)
1,139,107 7,653 (5,633,233) 87,709 (9,134,830)
4,374 1,408,137 38,071,994 2,033,295 49,975,323
1,143,481$ 1,415,790$ 32,438,761$ 2,121,004$ 40,840,493$
61

SCHEDULE OF REVENUES AND EXPENDITURESCOMPARED WITH BUDGETGRANTS FUNDFor the Fiscal Year Ended June 30, 2008
Actual OverPrior Current (Under)Years Year Total Budget Budget
REVENUESIntergovernmental:
U.S. Department of Transportation $ 1,106,395 $ 913,993 $ 2,020,388 $ 3,226,417 $ (1,206,029) Corporation for National and
Community Service - 316,601 316,601 320,881 (4,280) U.S. Forest Service - 3,504 3,504 15,856 (12,352) U.S. Department of Justice 142,813 254,604 397,417 534,579 (137,162) U.S. Environmental Protection Agency 296,360 210,277 506,637 1,400,000 (893,363) U.S. Department of Agriculture 7,480 - 7,480 9,802 (2,322) State of North Carolina 881,537 2,549,242 3,430,779 4,661,891 (1,231,112) Wake County 206,140 361,907 568,047 633,840 (65,793)
2,640,725 4,610,128 7,250,853 10,803,266 (3,552,413) Miscellaneous other 84,368 109,741 194,109 1,334,418 (1,140,309) Total revenues 2,725,093 4,719,869 7,444,962 12,137,684 (4,692,722)
OTHER FINANCING SOURCES
Transfers from:General fund 303,425 445,897 749,322 1,082,224 (332,902) Government equipment
replacement fund - 1,295,969 1,295,969 1,527,000 (231,031) Total other financing sources 303,425 1,741,866 2,045,291 2,609,224 (563,933)
Total revenues and other financing sources $ 3,028,518 $ 6,461,735 $ 9,490,253 $ 14,746,908 $ (5,256,655)
EXPENDITURESGeneral government $ 309,863 $ 231,529 $ 541,392 $ 1,473,270 $ (931,878) Community development services 2,258 483,057 485,315 495,785 (10,470) Public works 1,460,256 1,175,520 2,635,776 5,351,776 (2,716,000) Public safety 813,667 4,392,883 5,206,550 6,287,288 (1,080,738) Solid waste services 7,480 - 7,480 9,802 (2,322) Leisure services 434,994 178,746 613,740 1,128,987 (515,247) Total expenditures $ 3,028,518 $ 6,461,735 $ 9,490,253 $ 14,746,908 $ (5,256,655)
62
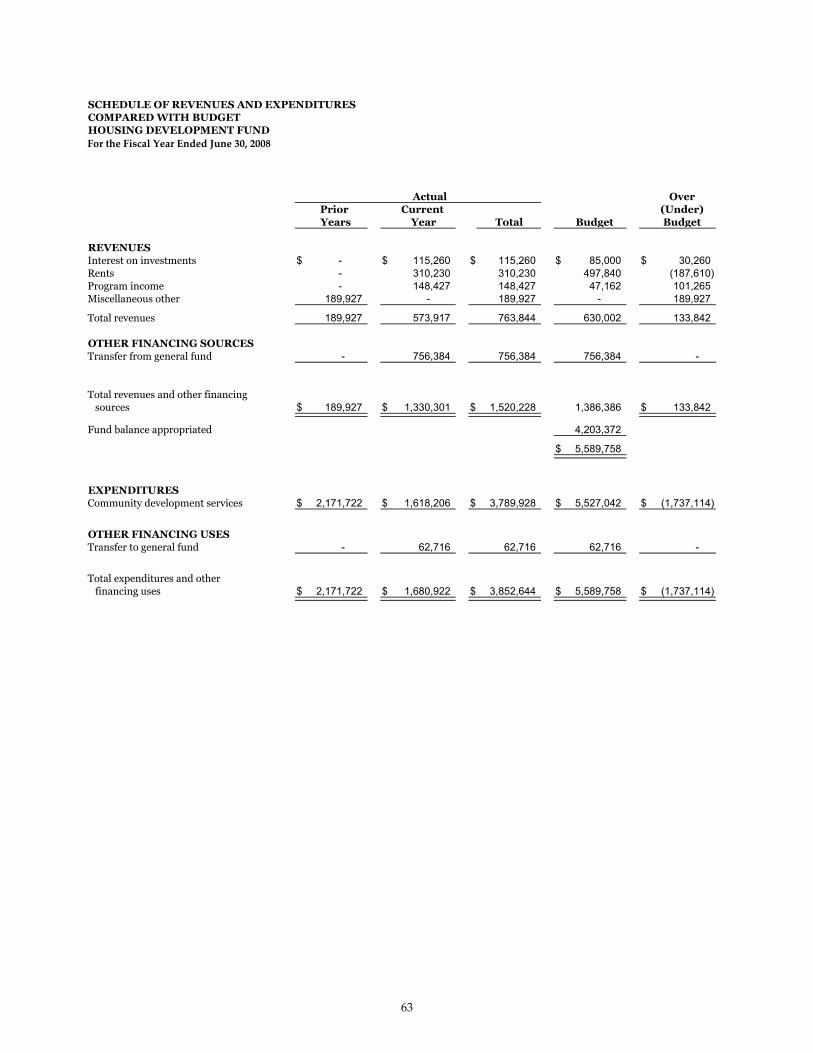
SCHEDULE OF REVENUES AND EXPENDITURESCOMPARED WITH BUDGETHOUSING DEVELOPMENT FUND
Actual OverPrior Current (Under)Years Year Total Budget Budget
REVENUESInterest on investments $ - $ 115,260 $ 115,260 $ 85,000 $ 30,260 Rents - 310,230 310,230 497,840 (187,610) Program income - 148,427 148,427 47,162 101,265 Miscellaneous other 189,927 - 189,927 - 189,927
Total revenues 189,927 573,917 763,844 630,002 133,842
OTHER FINANCING SOURCESTransfer from general fund - 756,384 756,384 756,384 -
Total revenues and other financing sources $ 189,927 $ 1,330,301 $ 1,520,228 1,386,386 $ 133,842
Fund balance appropriated 4,203,372
$ 5,589,758
EXPENDITURESCommunity development services $ 2,171,722 $ 1,618,206 $ 3,789,928 $ 5,527,042 $ (1,737,114)
OTHER FINANCING USESTransfer to general fund - 62,716 62,716 62,716 -
Total expenditures and other financing uses $ 2,171,722 $ 1,680,922 $ 3,852,644 $ 5,589,758 $ (1,737,114)
63

SCHEDULE OF REVENUES AND EXPENDITURESCOMPARED WITH BUDGETHOUSING BOND FUNDFor the Fiscal Year Ended June 30, 2008
Actual Over
Prior Current (Under)
Years Year Total Budget Budget
REVENUES
Interest on investments $ - $ 213,205 $ 213,205 $ - $ 213,205 Program income - 1,110,650 1,110,650 - 1,110,650 Miscellaneous other - 19,700 19,700 - 19,700 Total revenues - 1,343,555 1,343,555 - 1,343,555
OTHER FINANCING SOURCES
Bonds issued - - - 6,175,000 (6,175,000)
Total revenues and other
financing sources $ - $ 1,343,555 $ 1,343,555 6,175,000 $ (4,831,445)
Fund balance appropriated 8,254,135 $ 14,429,135
EXPENDITURES
Economic development
programs $ 3,436,777 $ 5,329,000 $ 8,765,777 $ 14,029,135 $ (5,263,358)
OTHER FINANCING USES
Transfer to general fund - 400,000 400,000 400,000 -
Total expenditures and other
financing uses $ 3,436,777 $ 5,729,000 $ 9,165,777 $ 14,429,135 $ (5,263,358)
64

SCHEDULE OF REVENUES AND EXPENDITURESCOMPARED WITH BUDGETCOMMUNITY DEVELOPMENT FUNDFor the Fiscal Year Ended June 30, 2008
Actual OverPrior Current (Under)Years Year Total Budget Budget
REVENUESIntergovernmental: US Department of HUD $ 2,666,038 $ 3,656,003 $ 6,322,041 $ 12,940,136 $ (6,618,095) State of North Carolina 76,000 6,968 82,968 152,000 (69,032)
Program income 2,680,468 1,622,034 4,302,502 4,495,307 (192,805)
Total revenues $ 5,422,506 $ 5,285,005 $ 10,707,511 $ 17,587,443 $ (6,879,932)
EXPENDITURESCommunity development services $ 5,422,506 $ 5,285,005 $ 10,707,511 $ 17,587,443 $ (6,879,932)
65
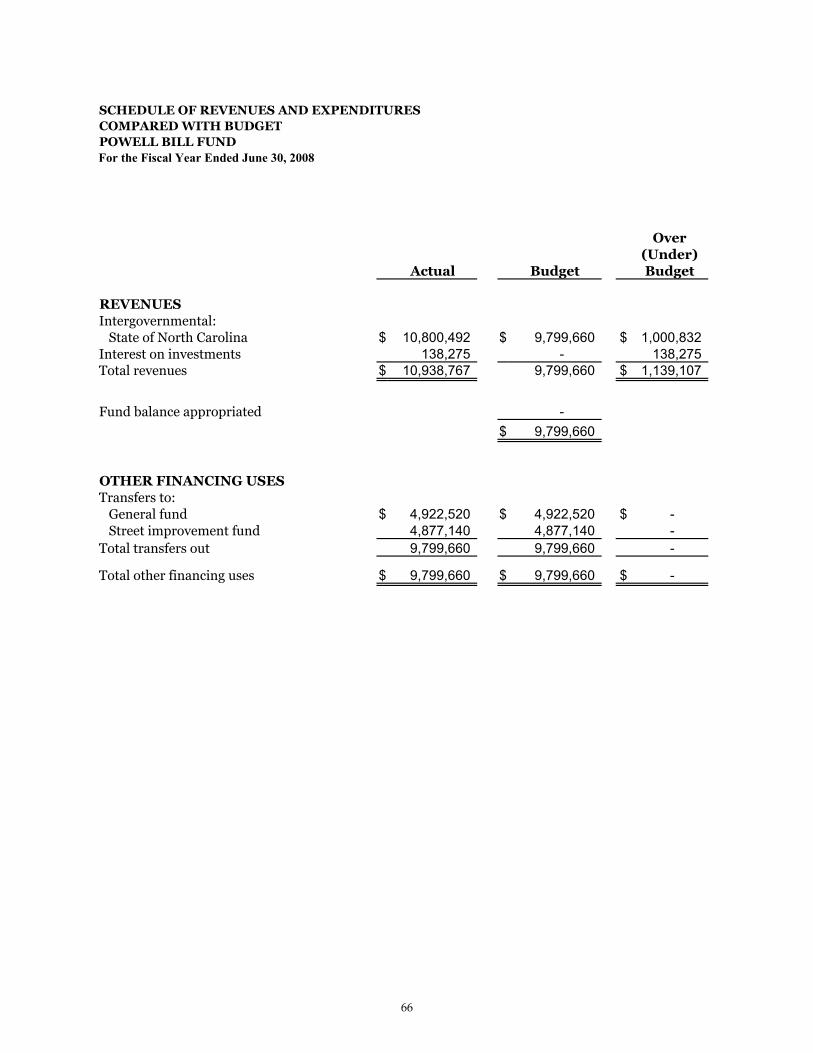
SCHEDULE OF REVENUES AND EXPENDITURESCOMPARED WITH BUDGETPOWELL BILL FUNDFor the Fiscal Year Ended June 30, 2008
Over(Under)
Actual Budget Budget
REVENUESIntergovernmental: State of North Carolina $ 10,800,492 $ 9,799,660 $ 1,000,832 Interest on investments 138,275 - 138,275 Total revenues $ 10,938,767 9,799,660 $ 1,139,107
Fund balance appropriated - $ 9,799,660
OTHER FINANCING USESTransfers to: General fund $ 4,922,520 $ 4,922,520 $ - Street improvement fund 4,877,140 4,877,140 - Total transfers out 9,799,660 9,799,660 -
Total other financing uses $ 9,799,660 $ 9,799,660 $ -
66
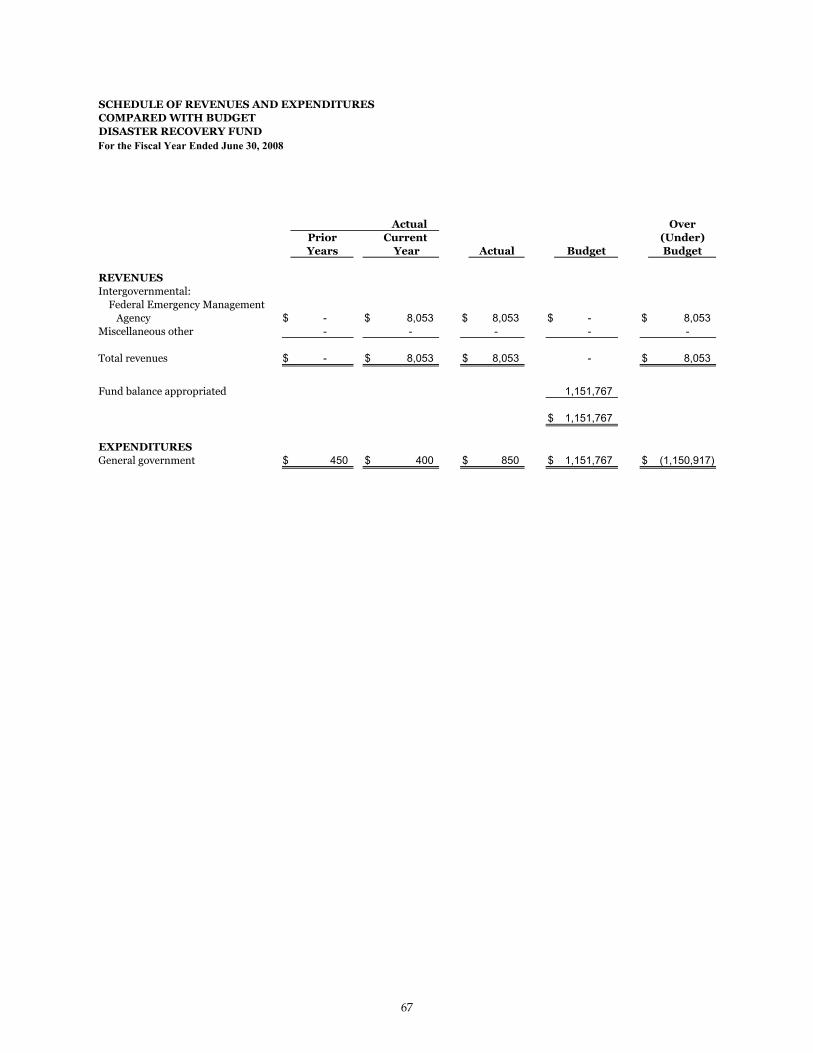
SCHEDULE OF REVENUES AND EXPENDITURESCOMPARED WITH BUDGETDISASTER RECOVERY FUNDFor the Fiscal Year Ended June 30, 2008
Actual OverPrior Current (Under)Years Year Actual Budget Budget
REVENUESIntergovernmental: Federal Emergency Management Agency $ - $ 8,053 $ 8,053 $ - $ 8,053 Miscellaneous other - - - - -
Total revenues $ - $ 8,053 $ 8,053 - $ 8,053
Fund balance appropriated 1,151,767
$ 1,151,767
EXPENDITURESGeneral government $ 450 $ 400 $ 850 $ 1,151,767 $ (1,150,917)
67

SCHEDULE OF REVENUES AND EXPENDITURESCOMPARED WITH BUDGETNEW CONVENTION CENTER FINANCING FUNDFor the Fiscal Year Ended June 30, 2008
Over(Under)
Actual Budget Budget
REVENUESIntergovernmental:
Wake County $ 13,117,464 $ 9,466,685 $ 3,650,779 Interest on investments 2,001,946 933,947 1,067,999
Total revenues $ 15,119,410 10,400,632 $ 4,718,778
Fund balance appropriated 16,400,000
$ 26,800,632
OTHER FINANCING USESReserve for future debt service $ - $ 6,047,989 $ (6,047,989) Transfers to:
Convention center complex operating fund 4,352,643 4,352,643 - New convention center capital projects fund 16,400,000 16,400,000 -
Total other financing uses $ 20,752,643 $ 26,800,632 $ (6,047,989)
68
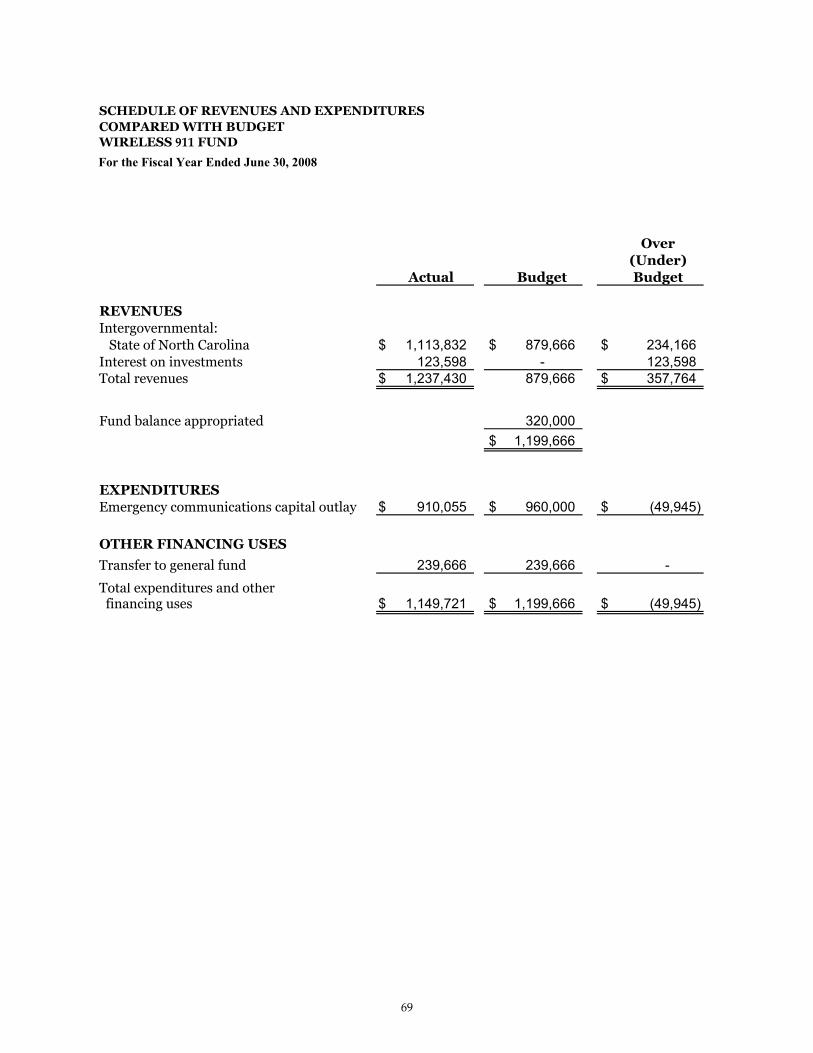
SCHEDULE OF REVENUES AND EXPENDITURESCOMPARED WITH BUDGETWIRELESS FUND
For the Fiscal Year Ended June 30, 2008
Over(Under)
Actual Budget Budget
REVENUESIntergovernmental: State of North Carolina $ 1,113,832 $ 879,666 $ 234,166 Interest on investments 123,598 - 123,598 Total revenues $ 1,237,430 879,666 $ 357,764
Fund balance appropriated 320,000 $ 1,199,666
EXPENDITURESEmergency communications capital outlay $ 910,055 $ 960,000 $ (49,945)
OTHER FINANCING USES
Transfer to general fund 239,666 239,666 - Total expenditures and other financing uses $ 1,149,721 $ 1,199,666 $ (49,945)
69

CITY OF RALEIGH
2008
CITY OF RALEIGH
2008
GE
NE
RA
LC
AP
IT
AL
PR
OJ
EC
TS
FU
ND
S
GENERAL CAPITAL PROJECTS FUNDS
The purpose of the General Capital Projects Funds is to account for
the financial resources segregated for the acquisition or construction of
major general capital assets and facilities. The budgets within these
funds are adopted for the life of the project. Under the project
accounting concept, project expenditures, and the revenues used to fund
them, are accumulated until the year the project is completed. General
projects accounted for within the general capital projects funds include
street projects, park improvements, technology projects and other
miscellaneous capital projects.

CITY OF RALEIGH
2008

CITY OF RALEIGH
2008
GENERAL CAPITAL PROJECTS FUNDS
STREET IMPROVEMENT FUND (NONMAJOR FUND) - The Street Improvement Fundaccounts for all street improvement programs to be financed from applicable street assessmentproceeds and other non-bond street improvement resources.
STREET BOND FUND (NONMAJOR FUND) - The Street Bond Fund accounts for the streetconstruction projects financed from the general obligation street bond issues.
SIDEWALK FUND (NONMAJOR FUND) - The Sidewalk Fund accounts for capital projectcosts for the construction of sidewalks within the City.
PARK IMPROVEMENT FUND (NONMAJOR FUND) - The Park Improvement Fund accountsfor transfers from the general fund and other revenues and allocations, and all project costs inthe construction of park improvements as well as park land and greenway acquisition.
FACILITY FEES FUND (NONMAJOR FUND) - The Facility Fees Fund accounts for facilityfees collected from developers to be expended for street and park capital purposes withindesignated zones in the City.
PARK BOND FUND (NONMAJOR FUND) - The Park Bond Fund accounts for all bondproceeds and capital project costs related to the construction of park improvements or parkland acquisition.
MISCELLANEOUS CAPITAL IMPROVEMENTS FUND (NONMAJOR FUND) - TheMiscellaneous Capital Improvements Fund accounts for all capital improvement costs notapplicable to other capital improvement programs. These improvements are financed from non-bond resources.
WALNUT CREEK AMPHITHEATER FUND (NONMAJOR FUND) - The Walnut CreekAmphitheater Fund accounts for capital projects costs of the Amphitheater financed by aportion of the Amphitheater rent.
STORMWATER PROJECTS FUND (NONMAJOR FUND) - The Stormwater Projects Fundaccounts for stormwater management and drainage projects. These projects are financed fromnon-bond resources.
TECHNOLOGY CAPITAL PROJECTS FUND (NONMAJOR FUND) – The TechnologyCapital Projects Fund accounts for long-term technology projects as recommended by theCity’s technology governance process. These projects are financed from general fund resources.

COMBINING BALANCE SHEET
June 30, 2008
Street ParkImprovement Street Bond Sidewalk Improvement
Fund Fund Fund Fund
ASSETSCash and cash equivalents 28,092,274$ 21,559,589$ 4,960,659$ 9,405,561$ Assessments receivable, net of allowance
for uncollectibles of 1,121,682 - - - Due from other governmental agencies 152,410 - 43,206 - Accrued interest receivable 334,441 229,786 57,745 113,121 Sales tax receivable 49,033 12,743 5,121 48,029 Cash and cash equivalents/investments - restricted deposits and bond proceeds - 8,122,155 - - Total assets 29,749,840$ 29,924,273$ 5,066,731$ 9,566,711$
LIABILITIES AND FUND BALANCESLiabilities:
Accounts payable 1,667,712$ 1,026,030$ 262,125$ 433,264$ Reimbursable facility fees - - - - Other liabilities 2,004,624 - - 44,719 Deferred revenue 1,121,682 - - -
Total liabilities 4,794,018 1,026,030 262,125 477,983
Fund balances:Unreserved:Designated for subsequent year's
appropriation 22,658,438 27,097,206 4,468,234 8,938,983 Designated for specific purposes 2,297,384 1,801,037 336,372 149,745 Undesignated - - - - Total fund balances 24,955,822 28,898,243 4,804,606 9,088,728 Total liabilities and fund balances 29,749,840$ 29,924,273$ 5,066,731$ 9,566,711$
NONMAJOR CAPITAL PROJECTS FUNDS
70
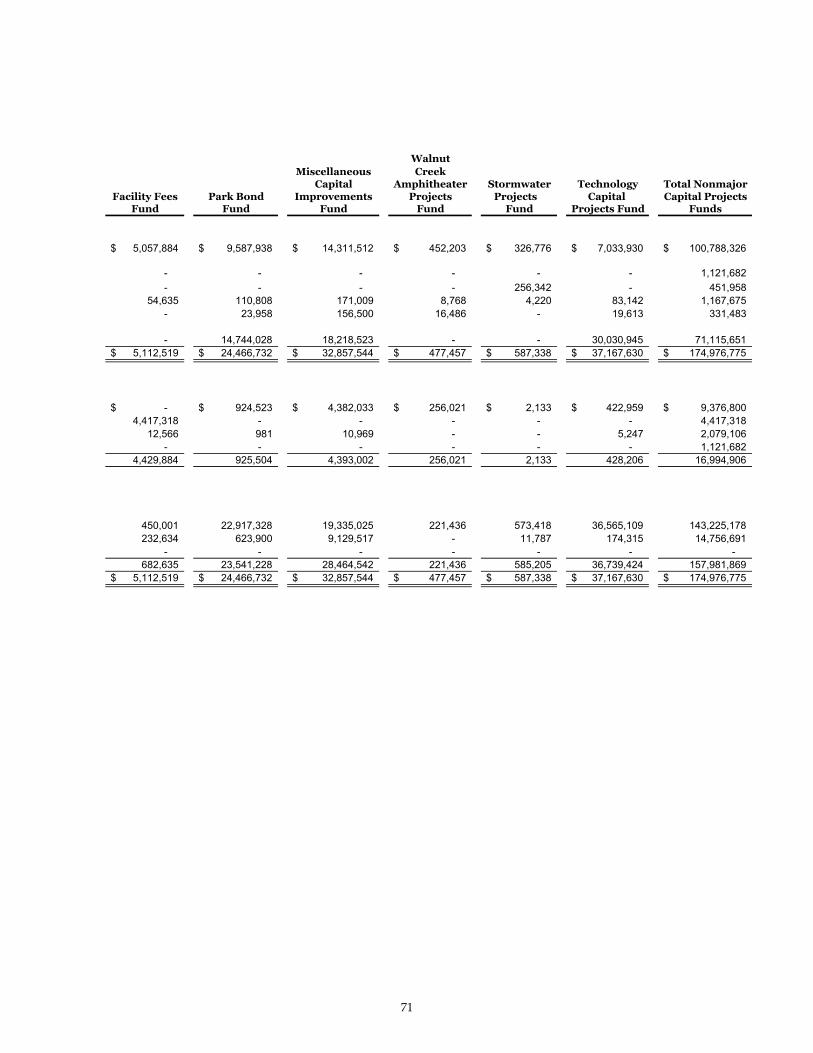
WalnutMiscellaneous Creek
Capital Amphitheater Stormwater Technology Total NonmajorFacility Fees Park Bond Improvements Projects Projects Capital Capital Projects
Fund Fund Fund Fund Fund Projects Fund Funds
5,057,884$ 9,587,938$ 14,311,512$ 452,203$ 326,776$ 7,033,930$ 100,788,326$
- - - - - - 1,121,682 - - - - 256,342 - 451,958
54,635 110,808 171,009 8,768 4,220 83,142 1,167,675 - 23,958 156,500 16,486 - 19,613 331,483
- 14,744,028 18,218,523 - - 30,030,945 71,115,651 5,112,519$ 24,466,732$ 32,857,544$ 477,457$ 587,338$ 37,167,630$ 174,976,775$
-$ 924,523$ 4,382,033$ 256,021$ 2,133$ 422,959$ 9,376,800$ 4,417,318 - - - - - 4,417,318
12,566 981 10,969 - - 5,247 2,079,106 - - - - - - 1,121,682
4,429,884 925,504 4,393,002 256,021 2,133 428,206 16,994,906
450,001 22,917,328 19,335,025 221,436 573,418 36,565,109 143,225,178 232,634 623,900 9,129,517 - 11,787 174,315 14,756,691
- - - - - - - 682,635 23,541,228 28,464,542 221,436 585,205 36,739,424 157,981,869
5,112,519$ 24,466,732$ 32,857,544$ 477,457$ 587,338$ 37,167,630$ 174,976,775$
71

COMBINING STATEMENT OF REVENUES, EXPENDITURES AND CHANGES IN FUND BALANCESNONMAJOR CAPITAL PROJECTS FUNDSFor the Fiscal Year Ended June 30, 2008
Street ParkImprovement Street Bond Sidewalk Improvement Facility Fees
Fund Fund Fund Fund FundREVENUESIntergovernmental 914,504$ -$ 43,206$ -$ -$ Developer participation 127,544 - - - - Assessments 638,415 - 94,458 - - Interest on investments 1,418,650 1,464,095 238,661 415,009 307,503 Facility Fees - - - - 5,637,987 Miscellaneous other 931,075 - 163,319 178,658 - Total revenues 4,030,188 1,464,095 539,644 593,667 5,945,490
EXPENDITURESPublic works 530,042 - - - - Public improvements:Street paving/sidewalk projects 8,895,830 7,574,484 379,219 - - Parks and recreation projects - - - 9,978,941 - Walnut creek amphitheater projects - - - - - Stormwater and drainage projects - - - - - Other public improvements - - - - - Technology capital projects - - - - -
Total expenditures 9,425,872 7,574,484 379,219 9,978,941 - Excess (deficiency) of revenues over (under) expenditures (5,395,684) (6,110,389) 160,425 (9,385,274) 5,945,490
OTHER FINANCING SOURCES (USES)Transfers in 8,677,875 3,632,858 543,800 3,609,312 - Transfers out (4,781,069) - (55,108) (416,527) (6,566,328) Notes issued - - - - - Total other financing sources and uses 3,896,806 3,632,858 488,692 3,192,785 (6,566,328) Net change in fund balances (1,498,878) (2,477,531) 649,117 (6,192,489) (620,838)
Fund balance - beginning of year 26,454,700 31,375,774 4,155,489 15,281,217 1,303,473 Fund balance - ending of year 24,955,822$ 28,898,243$ 4,804,606$ 9,088,728$ 682,635$
72

WalnutMiscellaneous Creek
Capital Amphitheater Stormwater Technology Total NonmajorPark Bond Improvements Projects Projects Capital Combining Capital Projects
Fund Fund Fund Fund Projects Fund Eliminations Funds
-$ 52,056$ -$ 11,809$ -$ -$ 1,021,575$ - - - - - - 127,544 - - - - - - 732,873
1,182,098 1,426,023 39,087 19,423 350,577 - 6,861,126 - - - - - - 5,637,987 - 595,137 186,000 - - - 2,054,189
1,182,098 2,073,216 225,087 31,232 350,577 - 16,435,294
- - - - - - 530,042
- - - - - - 16,849,533 5,723,880 - - - - - 15,702,821
- - 298,652 - - - 298,652 - - - 68,964 - - 68,964 - 29,887,145 - - - - 29,887,145 - - - - 1,916,706 - 1,916,706
5,723,880 29,887,145 298,652 68,964 1,916,706 - 65,253,863
(4,541,782) (27,813,929) (73,565) (37,732) (1,566,129) - (48,818,569)
401,000 7,465,035 - - 2,890,000 (10,472,613) 16,747,267 - (556,126) - - - 10,472,613 (1,902,545) - 24,279,000 - - 30,000,000 - 54,279,000
401,000 31,187,909 - - 32,890,000 - 69,123,722 (4,140,782) 3,373,980 (73,565) (37,732) 31,323,871 - 20,305,153 27,682,010 25,090,562 295,001 622,937 5,415,553 - 137,676,716 23,541,228$ 28,464,542$ 221,436$ 585,205$ 36,739,424$ -$ 157,981,869$
73

SCHEDULE OF REVENUES AND EXPENDITURESCOMPARED WITH BUDGETSTREET IMPROVEMENT FUNDFor the Fiscal Year Ended June 30, 2008
Actual OverPrior Current (Under)Years Year Total Budget Budget
REVENUESIntergovernmental: State of North Carolina $ 1,323,402 $ 914,504 $ 2,237,906 $ 35,283,500 $ (33,045,594) Developer participation 252,860 127,544 380,404 2,771,133 (2,390,729) Assessments - 638,415 638,415 800,000 (161,585) Interest on investments - 1,418,650 1,418,650 775,000 643,650 Miscellaneous other - 931,075 931,075 - 931,075
Total revenues 1,576,262 4,030,188 5,606,450 39,629,633 (34,023,183)
OTHER FINANCING SOURCESTransfers from: General fund - 142,747 142,747 142,747 - Powell bill fund - 4,877,140 4,877,140 4,877,140 - Sidewalk fund - 55,108 55,108 55,108 - Facility fees fund - 3,602,880 3,602,880 3,602,880 - Total other financing sources - 8,677,875 8,677,875 8,677,875 -
Total revenues and other financing sources $ 1,576,262 $ 12,708,063 $ 14,284,325 48,307,508 $ (34,023,183) Fund balance appropriated 50,702,111
$ 99,009,619
EXPENDITURESStreet projects $ 26,697,927 $ 8,895,830 $ 35,593,757 $ 93,664,508 $ (58,070,751)
OTHER FINANCING USESTransfers to: General fund - 10,000 10,000 10,000 - Street bond fund - 3,460,178 3,460,178 3,460,178 - Mass transit fund - 1,840,933 1,840,933 1,874,933 (34,000)
Total other financing uses - 5,311,111 5,311,111 5,345,111 (34,000)
Total expenditures and other financing uses $ 26,697,927 $ 14,206,941 $ 40,904,868 $ 99,009,619 $ (58,104,751)
74
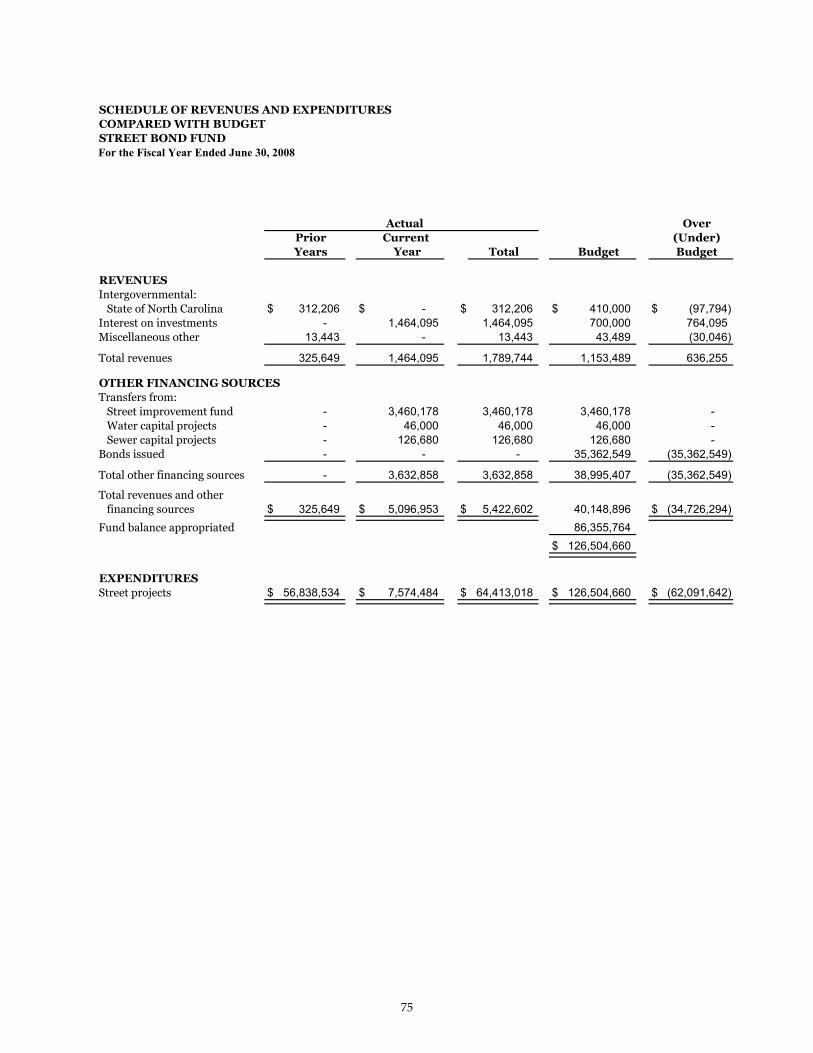
SCHEDULE OF REVENUES AND EXPENDITURESCOMPARED WITH BUDGETSTREET BOND FUNDFor the Fiscal Year Ended June 30, 2008
Actual OverPrior Current (Under)Years Year Total Budget Budget
REVENUESIntergovernmental: State of North Carolina $ 312,206 $ - $ 312,206 $ 410,000 $ (97,794) Interest on investments - 1,464,095 1,464,095 700,000 764,095 Miscellaneous other 13,443 - 13,443 43,489 (30,046)
Total revenues 325,649 1,464,095 1,789,744 1,153,489 636,255
OTHER FINANCING SOURCESTransfers from: Street improvement fund - 3,460,178 3,460,178 3,460,178 - Water capital projects - 46,000 46,000 46,000 - Sewer capital projects - 126,680 126,680 126,680 - Bonds issued - - - 35,362,549 (35,362,549)
Total other financing sources - 3,632,858 3,632,858 38,995,407 (35,362,549)
Total revenues and other financing sources $ 325,649 $ 5,096,953 $ 5,422,602 40,148,896 $ (34,726,294) Fund balance appropriated 86,355,764
$ 126,504,660
EXPENDITURESStreet projects $ 56,838,534 $ 7,574,484 $ 64,413,018 $ 126,504,660 $ (62,091,642)
75
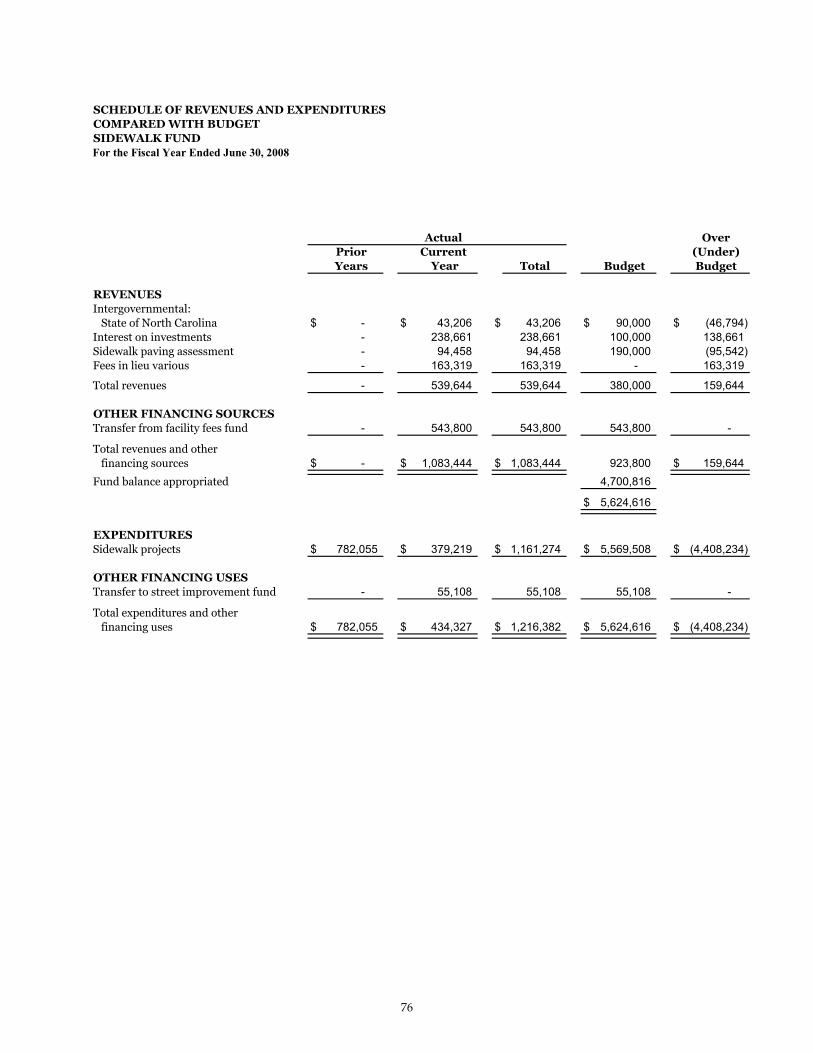
SCHEDULE OF REVENUES AND EXPENDITURESCOMPARED WITH BUDGETSIDEWALK FUNDFor the Fiscal Year Ended June 30, 2008
Actual OverPrior Current (Under)Years Year Total Budget Budget
REVENUESIntergovernmental: State of North Carolina $ - $ 43,206 $ 43,206 $ 90,000 $ (46,794) Interest on investments - 238,661 238,661 100,000 138,661 Sidewalk paving assessment - 94,458 94,458 190,000 (95,542) Fees in lieu various - 163,319 163,319 - 163,319
Total revenues - 539,644 539,644 380,000 159,644
OTHER FINANCING SOURCESTransfer from facility fees fund - 543,800 543,800 543,800 -
Total revenues and other financing sources $ - $ 1,083,444 $ 1,083,444 923,800 $ 159,644 Fund balance appropriated 4,700,816
$ 5,624,616
EXPENDITURESSidewalk projects $ 782,055 $ 379,219 $ 1,161,274 $ 5,569,508 $ (4,408,234)
OTHER FINANCING USESTransfer to street improvement fund - 55,108 55,108 55,108 -
Total expenditures and other financing uses $ 782,055 $ 434,327 $ 1,216,382 $ 5,624,616 $ (4,408,234)
76
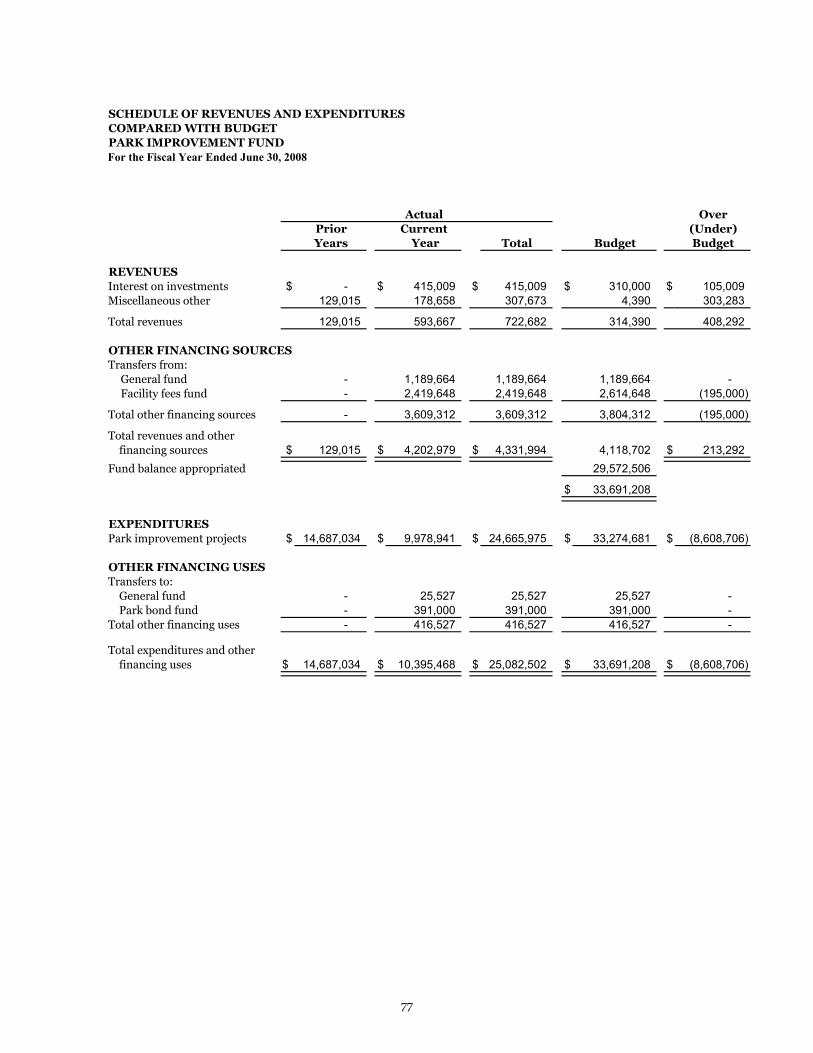
SCHEDULE OF REVENUES AND EXPENDITURESCOMPARED WITH BUDGETPARK IMPROVEMENT FUNDFor the Fiscal Year Ended June 30, 2008
Actual OverPrior Current (Under)Years Year Total Budget Budget
REVENUESInterest on investments $ - $ 415,009 $ 415,009 $ 310,000 $ 105,009 Miscellaneous other 129,015 178,658 307,673 4,390 303,283
Total revenues 129,015 593,667 722,682 314,390 408,292
OTHER FINANCING SOURCESTransfers from: General fund - 1,189,664 1,189,664 1,189,664 - Facility fees fund - 2,419,648 2,419,648 2,614,648 (195,000)
Total other financing sources - 3,609,312 3,609,312 3,804,312 (195,000)
Total revenues and other financing sources $ 129,015 $ 4,202,979 $ 4,331,994 4,118,702 $ 213,292 Fund balance appropriated 29,572,506
$ 33,691,208
EXPENDITURESPark improvement projects $ 14,687,034 $ 9,978,941 $ 24,665,975 $ 33,274,681 $ (8,608,706)
OTHER FINANCING USESTransfers to: General fund - 25,527 25,527 25,527 - Park bond fund - 391,000 391,000 391,000 - Total other financing uses - 416,527 416,527 416,527 -
Total expenditures and other financing uses $ 14,687,034 $ 10,395,468 $ 25,082,502 $ 33,691,208 $ (8,608,706)
77
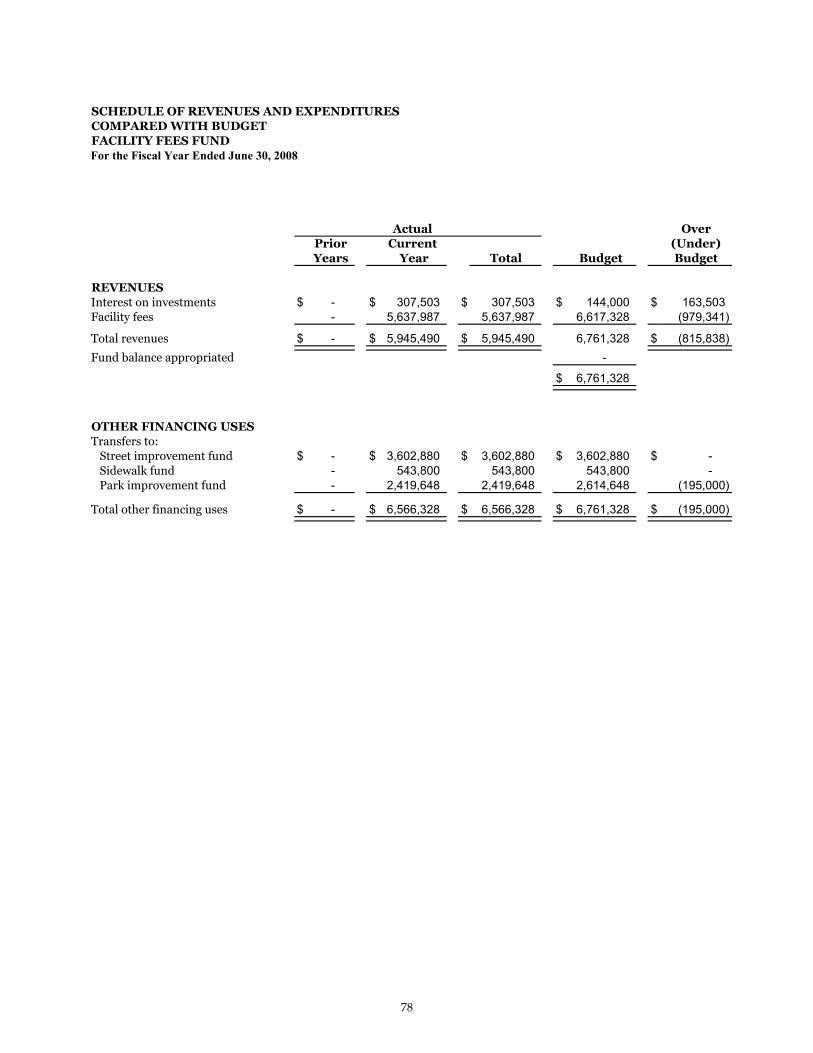
SCHEDULE OF REVENUES AND EXPENDITURESCOMPARED WITH BUDGETFACILITY FEES FUNDFor the Fiscal Year Ended June 30, 2008
Actual OverPrior Current (Under)Years Year Total Budget Budget
REVENUESInterest on investments $ - $ 307,503 $ 307,503 $ 144,000 $ 163,503 Facility fees - 5,637,987 5,637,987 6,617,328 (979,341)
Total revenues $ - $ 5,945,490 $ 5,945,490 6,761,328 $ (815,838) Fund balance appropriated -
$ 6,761,328
OTHER FINANCING USESTransfers to: Street improvement fund $ - $ 3,602,880 $ 3,602,880 $ 3,602,880 $ - Sidewalk fund - 543,800 543,800 543,800 - Park improvement fund - 2,419,648 2,419,648 2,614,648 (195,000)
Total other financing uses $ - $ 6,566,328 $ 6,566,328 $ 6,761,328 $ (195,000)
78

SCHEDULE OF REVENUES AND EXPENDITURESCOMPARED WITH BUDGETPARK BOND FUNDFor the Fiscal Year Ended June 30, 2008
Actual OverPrior Current (Under)Years Year Total Budget Budget
REVENUESIntergovernmental: State of North Carolina $ 20,000 $ - $ 20,000 $ 1,100,000 $ (1,080,000) Interest on investments - 1,182,098 1,182,098 700,000 482,098 Miscellaneous income 2,000 - 2,000 - 2,000 Total revenues 22,000 1,182,098 1,204,098 1,800,000 (595,902)
OTHER FINANCING SOURCESTransfers from: General fund - 10,000 10,000 10,000 - Park improvement fund 50,000 391,000 441,000 441,000 - Bonds issued - - - 15,769,034 (15,769,034)
Total other financing sources 50,000 401,000 451,000 16,220,034 (15,769,034)
Total revenues and other financing sources $ 72,000 $ 1,583,098 $ 1,655,098 18,020,034 $ (16,364,936)
Fund balance appropriated 44,017,768
$ 62,037,802
EXPENDITURES
Park projects $ 17,273,289 $ 5,723,880 $ 22,997,169 $ 62,037,802 $ (39,040,633)
79

SCHEDULE OF REVENUES AND EXPENDITURESCOMPARED WITH BUDGETMISCELLANEOUS CAPITAL IMPROVEMENTS FUNDFor the Fiscal Year Ended June 30, 2008
Actual OverPrior Current (Under)Years Year Total Budget Budget
REVENUESIntergovernmental: US Department of HUD $ - $ 52,056 $ 52,056 $ 173,968 $ (121,912) Interest on investments - 1,426,023 1,426,023 450,000 976,023 Miscellaneous income 455,819 595,137 1,050,956 6,522,920 (5,471,964)
Total revenues 455,819 2,073,216 2,529,035 7,146,888 (4,617,853)
OTHER FINANCING SOURCESTransfers from:
General fund - 6,885,391 6,885,391 6,885,391 - Convention center fund - 579,644 579,644 579,644 -
Certificates of participation issued - 14,165,000 14,165,000 14,165,000 - Notes issued - 10,114,000 10,114,000 10,114,000 -
Total other financing sources - 31,744,035 31,744,035 31,744,035 -
Total revenues and other financing sources $ 455,819 $ 33,817,251 $ 34,273,070 38,890,923 $ (4,617,853)
Fund balance appropriated 53,868,501
$ 92,759,424
EXPENDITURESMiscellaneous capital projects $ 31,386,204 $ 29,887,145 $ 61,273,349 $ 92,203,298 $ (30,929,949)
OTHER FINANCING USES
Transfer to general fund - 556,126 556,126 556,126 - Total expenditures and other financing uses $ 31,386,204 $ 30,443,271 $ 61,829,475 $ 92,759,424 $ (30,929,949)
80

SCHEDULE OF REVENUES AND EXPENDITURESCOMPARED WITH BUDGETWALNUT CREEK AMPHITHEATER PROJECTS FUNDFor the Fiscal Year Ended June 30, 2008
Actual OverPrior Current (Under)Years Year Total Budget Budget
REVENUES
Amphitheater rent $ - $ 186,000 $ 186,000 $ 368,000 $ (182,000) Interest on investments - 39,087 39,087 - 39,087 Total revenues $ - $ 225,087 $ 225,087 368,000 $ (142,913)
Fund balance appropriated 921,247
$ 1,289,247
EXPENDITURESAmphitheater capital projects $ 659,927 $ 298,652 $ 958,579 $ 1,289,247 $ (330,668)
81
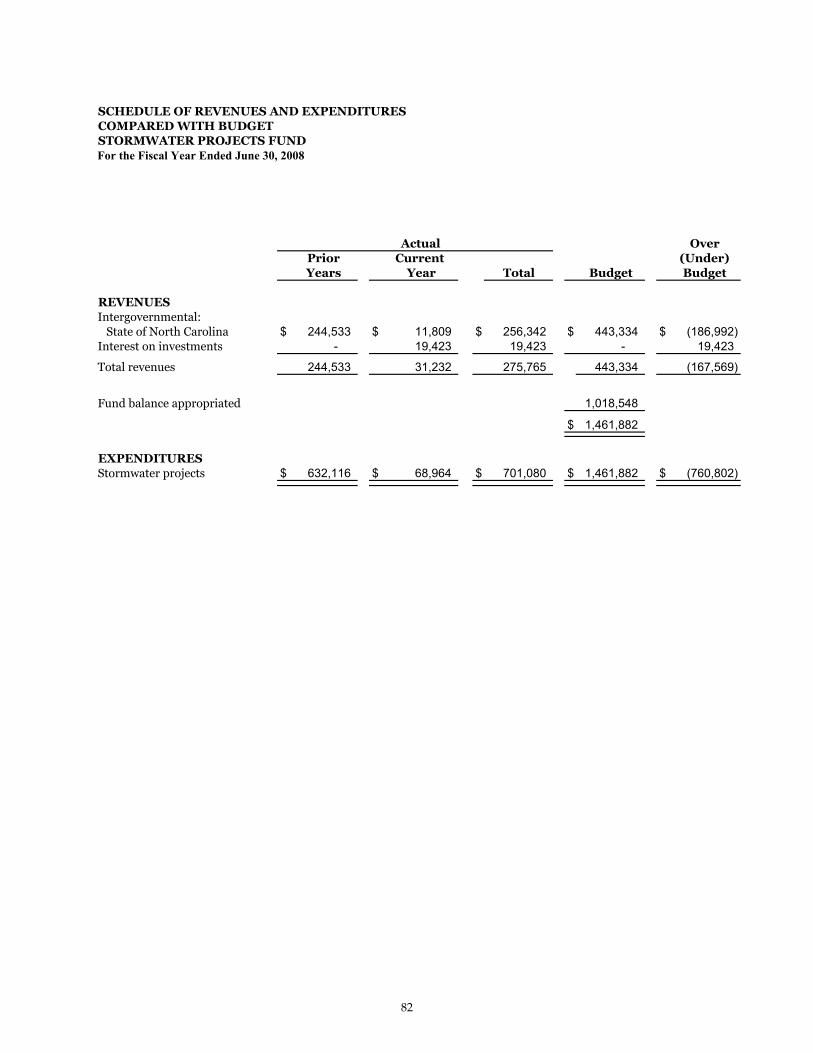
SCHEDULE OF REVENUES AND EXPENDITURESCOMPARED WITH BUDGETSTORMWATER PROJECTS FUNDFor the Fiscal Year Ended June 30, 2008
Actual OverPrior Current (Under)Years Year Total Budget Budget
REVENUESIntergovernmental: State of North Carolina $ 244,533 $ 11,809 $ 256,342 $ 443,334 $ (186,992) Interest on investments - 19,423 19,423 - 19,423
Total revenues 244,533 31,232 275,765 443,334 (167,569)
Fund balance appropriated 1,018,548
$ 1,461,882
EXPENDITURESStormwater projects $ 632,116 $ 68,964 $ 701,080 $ 1,461,882 $ (760,802)
82
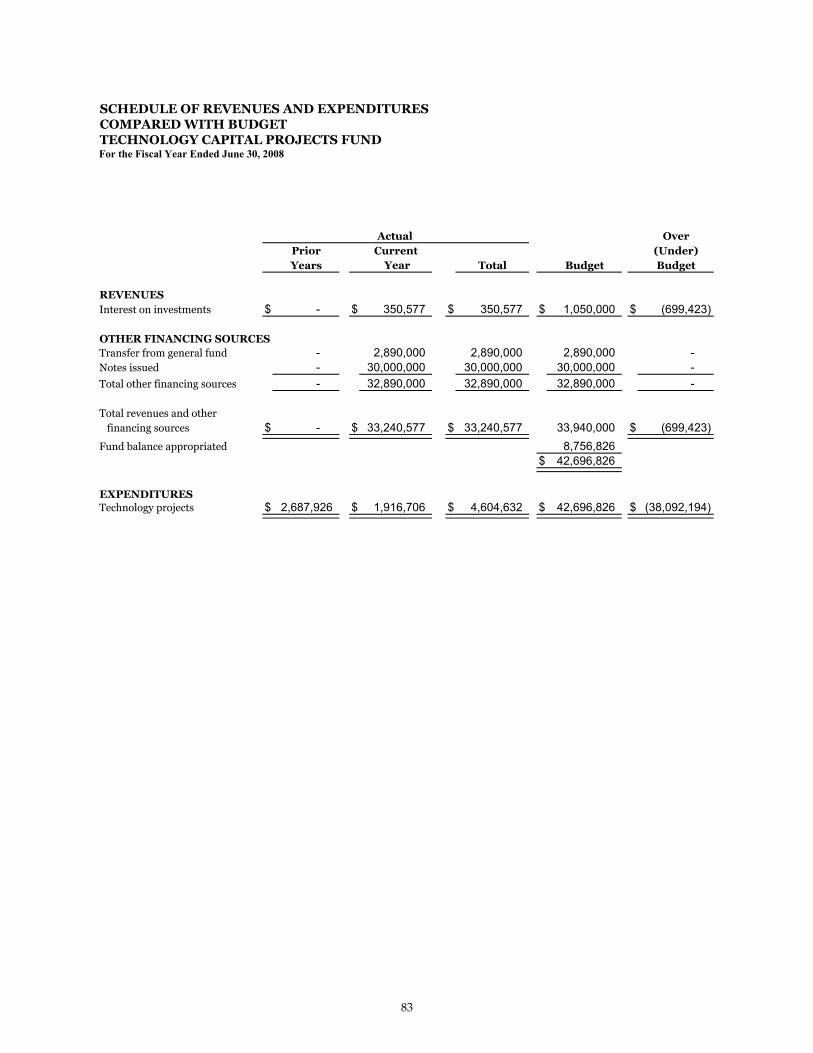
SCHEDULE OF REVENUES AND EXPENDITURESCOMPARED WITH BUDGETTECHNOLOGY CAPITAL PROJECTS FUNDFor the Fiscal Year Ended June 30, 2008
Actual OverPrior Current (Under)Years Year Total Budget Budget
REVENUESInterest on investments $ - $ 350,577 $ 350,577 $ 1,050,000 $ (699,423)
OTHER FINANCING SOURCESTransfer from general fund - 2,890,000 2,890,000 2,890,000 - Notes issued - 30,000,000 30,000,000 30,000,000 - Total other financing sources - 32,890,000 32,890,000 32,890,000 -
Total revenues and other financing sources $ - $ 33,240,577 $ 33,240,577 33,940,000 $ (699,423) Fund balance appropriated 8,756,826
$ 42,696,826
EXPENDITURESTechnology projects $ 2,687,926 $ 1,916,706 $ 4,604,632 $ 42,696,826 $ (38,092,194)
83

CITY OF RALEIGH
2008

CITY OF RALEIGH
2008
EN
TE
RP
RI
SE
FU
ND
S
ENTERPRISE FUNDS
Enterprise Funds are a subclassification of the proprietary fund types
and are used to account for operations:
(a) that are financed and operated in a manner similar to private
business enterprises – where the intent of the governing body
is that the costs of providing goods or services to the general
public be recovered through user charges; or,
(b) where the governing body has decided that periodic
determinations of revenues earned, expenses incurred, and/or
net income is appropriate for capital maintenance, public
policy, management control, accountability or other purposes.
The City’s enterprise fund operations include water and sewer utility,
convention center, parking facilities, mass transit and stormwater utility.
CITY OF RALEIGH
2008
ENTERPRISE FUNDS
WATER AND SEWER FUND (MAJOR FUND) - The Water and Sewer Fund accounts foroperating and capital costs associated with the City’s water and Sewer operations. This fundcombines the Water and Sewer Operating Fund, the Water Capital Projects Fund, the SewerCapital Projects Fund, the Water and Sewer Revenue Bond Fund and the Water and SewerGeneral Obligation Bond Fund.
CONVENTION CENTER COMPLEX FUND (MAJOR FUND) - The Convention CenterComplex fund accounts for the operating and capital costs at the City’s convention center andperforming arts complex. This fund combines the Convention Center Operating Fund, theConvention Center and Memorial Auditorium Projects Fund and the New Convention CenterComplex Capital Projects Fund.
PARKING FACILITIES FUND (MAJOR FUND) - The Parking Facilities Fund accounts for theparking fee charges and all operating costs associated with City-owned off-street and on-streetparking facilities. This fund combines the Parking Facilities Operating Fund and the ParkingFacilities Capital Projects Fund.
MASS TRANSIT FUND (NONMAJOR FUND) - The Mass Transit Fund accounts for the usercharges, fees, federal contributions and all operating costs associated with the operation of the transit system in the City. This fund also accounts for all capital projects financed by transitgrant proceeds.
STORMWATER UTILITY FUND (NONMAJOR FUND) – The Stormwater Utility Fundaccounts for operating and capital costs associated with the City’s stormwater managementprogram. This fund combines the Stormwater Utility Operating Fund, the Stormwater UtilityCapital Projects Fund, and the Stormwater Utility Bond Fund.

CITY OF RALEIGH
2008
NONMAJOR ENTERPRISE FUNDS COMBINING STATEMENTS
The Nonmajor Enterprise Funds combining statements include the combining statement of net assets, the combining statement of revenues, expenses, and changes in net assets, and thecombining statement of cash flows for nonmajor enterprise funds that comprise the otherenterprise funds column in the basic financial statements.

COMBINING STATEMENT OF NET ASSETS
NONMAJOR ENTERPRISE FUNDS
June 30, 2008
Total NonmajorMass Transit Stormwater Enterprise
Fund Utility Fund Funds
ASSETSCurrent assets:
Cash and cash equivalents 3,051,681$ 30,690,919$ 33,742,600$ Customer receivables, net of allowance
for uncollectibles of - 1,017,644 1,017,644 Due from other governmental agencies 734,547 73,520 808,067 Accrued interest receivable - 413,275 413,275 Sales tax receivable 51,938 33,757 85,695 Inventories 413,989 - 413,989
Total current assets 4,252,155 32,229,115 36,481,270
Noncurrent assets:Restricted cash and cash equivalents 45,330 5,571,144 5,616,474 Capital assets:
Land and improvements 988,989 - 988,989 Construction in progress - 4,556,045 4,556,045 Buildings and machinery 3,798,718 - 3,798,718 Buses 21,716,970 - 21,716,970 Equipment 1,260,823 281,128 1,541,951 Furniture and fixtures 44,845 - 44,845 Improvements 1,087,605 5,950,395 7,038,000
Less accumulated depreciation (13,773,430) (639,336) (14,412,766) Total noncurrent assets 15,169,850 15,719,376 30,889,226 Total assets 19,422,005 47,948,491 67,370,496
LIABILITIES
Current liabilities:Accounts payable 840,165 999,060 1,839,225 Accrued salaries and employee payroll taxes 10,626 63,357 73,983 Deferred contributions from other funds 1,520,967 - 1,520,967 Due to other funds 955,497 - 955,497
Total current liabilities 3,327,255 1,062,417 4,389,672
Noncurrent liabilities:Escrow and other deposits payable from restricted assets 45,330 5,571,144 5,616,474 Earned vacation pay 34,008 202,114 236,122
Total noncurrent liabilities 79,338 5,773,258 5,852,596 Total liabilities 3,406,593 6,835,675 10,242,268
NET ASSETSInvested in capital assets, net of related debt 15,124,520 10,148,232 25,272,752 Unrestricted 890,892 30,964,584 31,855,476 Total net assets 16,015,412$ 41,112,816$ 57,128,228$
84
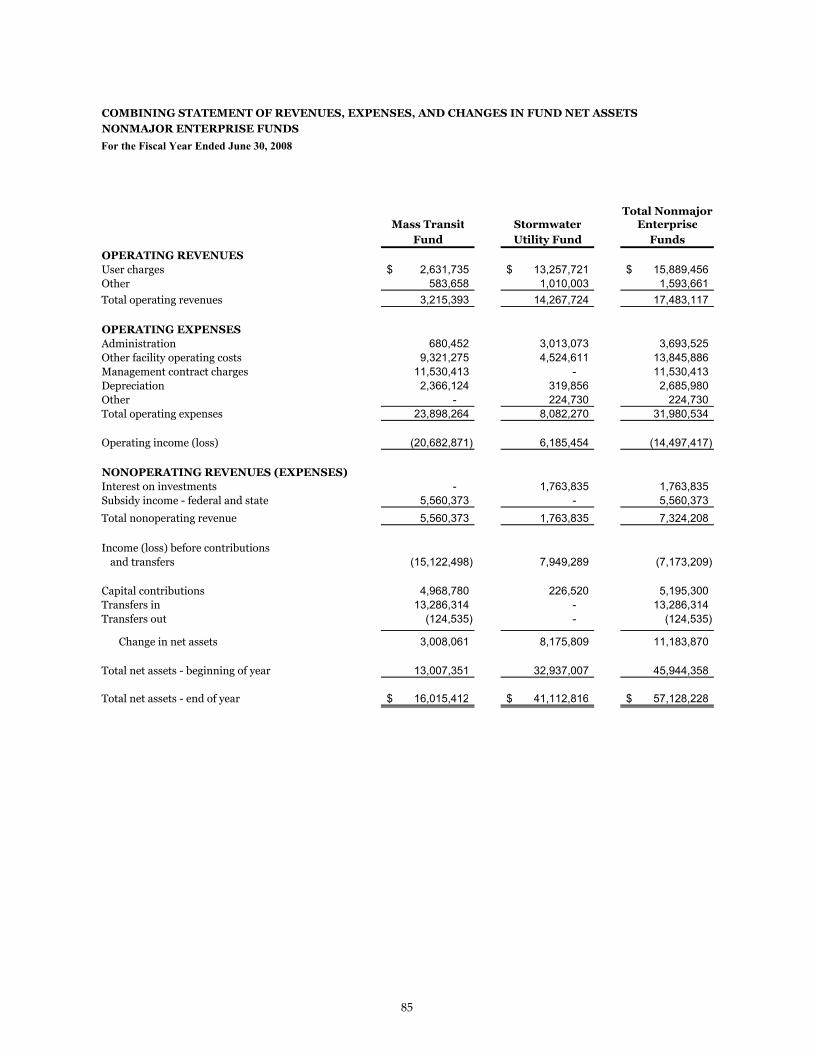
COMBINING STATEMENT OF REVENUES, EXPENSES, AND CHANGES IN FUND NET ASSETS
NONMAJOR ENTERPRISE FUNDS
For the Fiscal Year Ended June 30, 2008
Total NonmajorMass Transit Stormwater Enterprise
Fund Utility Fund Funds
OPERATING REVENUESUser charges 2,631,735$ 13,257,721$ 15,889,456$ Other 583,658 1,010,003 1,593,661 Total operating revenues 3,215,393 14,267,724 17,483,117
OPERATING EXPENSESAdministration 680,452 3,013,073 3,693,525 Other facility operating costs 9,321,275 4,524,611 13,845,886 Management contract charges 11,530,413 - 11,530,413 Depreciation 2,366,124 319,856 2,685,980 Other - 224,730 224,730 Total operating expenses 23,898,264 8,082,270 31,980,534
Operating income (loss) (20,682,871) 6,185,454 (14,497,417)
NONOPERATING REVENUES (EXPENSES)Interest on investments - 1,763,835 1,763,835 Subsidy income - federal and state 5,560,373 - 5,560,373 Total nonoperating revenue 5,560,373 1,763,835 7,324,208
Income (loss) before contributionsand transfers (15,122,498) 7,949,289 (7,173,209)
Capital contributions 4,968,780 226,520 5,195,300 Transfers in 13,286,314 - 13,286,314 Transfers out (124,535) - (124,535)
Change in net assets 3,008,061 8,175,809 11,183,870
Total net assets - beginning of year 13,007,351 32,937,007 45,944,358
Total net assets - end of year 16,015,412$ 41,112,816$ 57,128,228$
85

COMBINING STATEMENT OF CASH FLOWSNONMAJOR ENTERPRISE FUNDSFor the Fiscal Year Ended June 30, 2008
Total NonmajorMass Transit Stormwater Enterprise
Fund Utility Fund Funds
CASH FLOWS FROM OPERATING ACTIVITIES Receipts from customers 3,215,393$ 13,317,836$ 16,533,229$ Payments to employees (607,764) (2,966,361) (3,574,125) Payments to suppliers and service providers (20,593,065) (4,339,395) (24,932,460) Other receipts/(payments) - 785,273 785,273
Net cash provided by (used in) operating activities (17,985,436) 6,797,353 (11,188,083)
CASH FLOWS FROM NONCAPITAL FINANCING ACTIVITIES Operating subsidies and transfers from other funds 12,928,085 - 12,928,085 Operating subsidies and transfers to other funds (124,535) - (124,535) Operating grants received 2,528,303 - 2,528,303
Net cash provided by noncapital financing activities 15,331,853 - 15,331,853
CASH FLOWS FROM CAPITAL AND RELATED FINANCING ACTIVITIESPurchase and construction of capital assets (5,533,677) (3,871,600) (9,405,277) Capital grants and other capital contributions 8,363,495 153,000 8,516,495 Escrow deposits - 1,699,602 1,699,602
Net cash (used in) capital and related financing activities 2,829,818 (2,018,998) 810,820
CASH FLOWS FROM INVESTING ACTIVITIES Interest received on investments - 1,508,593 1,508,593 Net cash provided by investing activities - 1,508,593 1,508,593 Net increase in cash and cash equivalents/investments 176,235 6,286,948 6,463,183 Cash and cash equivalents/investments - beginning of year 2,920,776 29,975,115 32,895,891 Cash and cash equivalents/investments - end of year 3,097,011$ 36,262,063$ 39,359,074$
RECONCILIATION OF OPERATING LOSS TO NET CASH USED IN OPERATING ACTIVITIES Operating income (loss) (20,682,871)$ 6,185,454$ (14,497,417)$ Adjustments to reconcile operating income (loss)
to net cash used in operating activities:Depreciation expense 2,366,124 319,856 2,685,980 Change in assets and liabilities
Operating receivables - 60,115 60,115 Sales tax receivable 106,265 9,822 116,087 Inventories 24,531 - 24,531 Accounts payable and other accrued liabilities 196,558 175,394 371,952 Escrow and other deposits 1,600 - 1,600 Earned vacation pay and other payroll liabilities 2,357 46,712 49,069
Total adjustments 2,697,435 611,899 3,309,334 Net cash provided by (used in) operating activities (17,985,436)$ 6,797,353$ (11,188,083)$
NONCASH INVESTING, CAPITAL, AND FINANCING ACTIVITIES:
Acquisition and construction of capital assets -$ 668,408$ 668,408$
86

CITY OF RALEIGH
2008
SCHEDULE OF REVENUES AND EXPENDITURES –BUDGET (MODIFIED ACCRUAL BASIS) AND
ACTUAL ENTERPRISE FUNDS
The following schedules present the results of operations for all individual enterprise funds onthe modified accrual basis for comparison to the legally adopted budgets for each fund. ForGAAP purposes the individual funds are consolidated into the three funds shown in basicfinancial statements and the two funds shown in the preceding combining financial statements.A reconciliation of the modified accrual basis to the full accrual basis (per generally acceptedaccounting principles) follows each schedule or group of schedules.
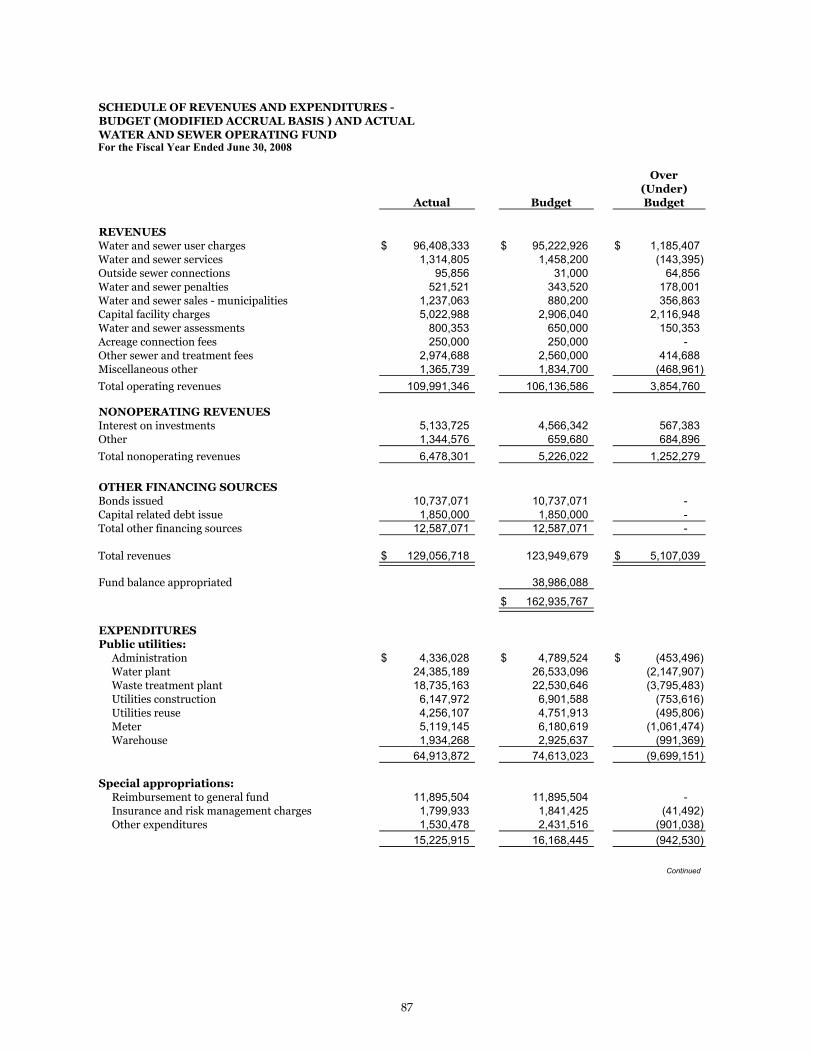
SCHEDULE OF REVENUES AND EXPENDITURES - BUDGET (MODIFIED ACCRUAL BASIS ) AND ACTUALWATER AND SEWER OPERATING FUNDFor the Fiscal Year Ended June 30, 2008
Over(Under)
Actual Budget Budget
REVENUESWater and sewer user charges $ 96,408,333 $ 95,222,926 $ 1,185,407 Water and sewer services 1,314,805 1,458,200 (143,395) Outside sewer connections 95,856 31,000 64,856 Water and sewer penalties 521,521 343,520 178,001 Water and sewer sales - municipalities 1,237,063 880,200 356,863 Capital facility charges 5,022,988 2,906,040 2,116,948 Water and sewer assessments 800,353 650,000 150,353 Acreage connection fees 250,000 250,000 - Other sewer and treatment fees 2,974,688 2,560,000 414,688 Miscellaneous other 1,365,739 1,834,700 (468,961) Total operating revenues 109,991,346 106,136,586 3,854,760
NONOPERATING REVENUESInterest on investments 5,133,725 4,566,342 567,383 Other 1,344,576 659,680 684,896 Total nonoperating revenues 6,478,301 5,226,022 1,252,279
OTHER FINANCING SOURCESBonds issued 10,737,071 10,737,071 - Capital related debt issue 1,850,000 1,850,000 - Total other financing sources 12,587,071 12,587,071 -
Total revenues $ 129,056,718 123,949,679 $ 5,107,039
Fund balance appropriated 38,986,088
$ 162,935,767
EXPENDITURESPublic utilities: Administration $ 4,336,028 $ 4,789,524 $ (453,496) Water plant 24,385,189 26,533,096 (2,147,907) Waste treatment plant 18,735,163 22,530,646 (3,795,483) Utilities construction 6,147,972 6,901,588 (753,616) Utilities reuse 4,256,107 4,751,913 (495,806) Meter 5,119,145 6,180,619 (1,061,474) Warehouse 1,934,268 2,925,637 (991,369)
64,913,872 74,613,023 (9,699,151)
Special appropriations: Reimbursement to general fund 11,895,504 11,895,504 - Insurance and risk management charges 1,799,933 1,841,425 (41,492) Other expenditures 1,530,478 2,431,516 (901,038)
15,225,915 16,168,445 (942,530)
Continued
87

SCHEDULE OF REVENUES AND EXPENDITURES - BUDGET (MODIFIED ACCRUAL BASIS ) AND ACTUALWATER AND SEWER OPERATING FUNDFor the Fiscal Year Ended June 30, 2008
Over(Under)
Actual Budget Budget
EXPENDITURES (CONTINUED)Debt service: General obligations bonds: Principal $ 2,830,629 $ 2,830,629 $ - Interest 495,618 495,619 (1) Revenue bonds: Principal 5,300,000 5,300,000 - Interest 19,907,186 19,907,186 - Installment financing agreement 7,181,290 7,181,292 (2) Other installment obligations 6,223 10,000 (3,777) Other expenditures 3,176,413 13,983,023 (10,806,610)
38,897,359 49,707,749 (10,810,390)
OTHER EXPENDITURESRefunds and other 60,550 80,600 (20,050) Capital outlay - installment note obligation 1,850,000 1,850,000 -
1,910,550 1,930,600 (20,050)
Total expenditures 120,947,696 142,419,817 (21,472,121)
OTHER FINANCING USESTransfers to:
General fund 75,000 75,000 - Water capital projects fund 3,850,000 3,850,000 - Sewer capital projects fund 4,700,000 4,700,000 - Water and sewer revenue bond fund 11,668,250 11,668,250 - Public utilities equipment replacement fund 222,700 222,700 -
Total other financing uses 20,515,950 20,515,950 -
Total expenditures and other financing uses $ 141,463,646 $ 162,935,767 $ (21,472,121)
88
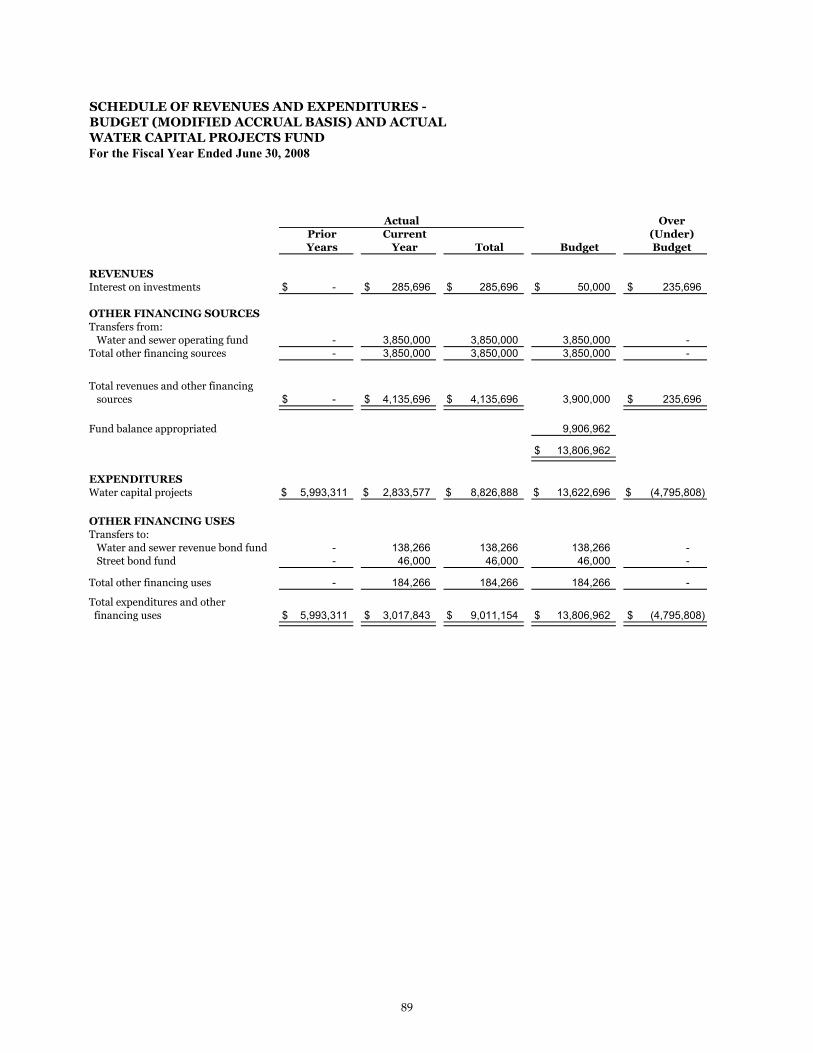
SCHEDULE OF REVENUES AND EXPENDITURES -BUDGET (MODIFIED ACCRUAL BASIS) AND ACTUALWATER CAPITAL PROJECTS FUNDFor the Fiscal Year Ended June 30, 2008
OverPrior Current (Under)Years Year Total Budget Budget
REVENUESInterest on investments $ - $ 285,696 $ 285,696 $ 50,000 $ 235,696
OTHER FINANCING SOURCESTransfers from: Water and sewer operating fund - 3,850,000 3,850,000 3,850,000 - Total other financing sources - 3,850,000 3,850,000 3,850,000 -
Total revenues and other financing sources $ - $ 4,135,696 $ 4,135,696 3,900,000 $ 235,696
Fund balance appropriated 9,906,962
$ 13,806,962
EXPENDITURESWater capital projects $ 5,993,311 $ 2,833,577 $ 8,826,888 $ 13,622,696 $ (4,795,808)
OTHER FINANCING USESTransfers to: Water and sewer revenue bond fund - 138,266 138,266 138,266 - Street bond fund - 46,000 46,000 46,000 -
Total other financing uses - 184,266 184,266 184,266 -
Total expenditures and other financing uses $ 5,993,311 $ 3,017,843 $ 9,011,154 $ 13,806,962 $ (4,795,808)
Actual
89
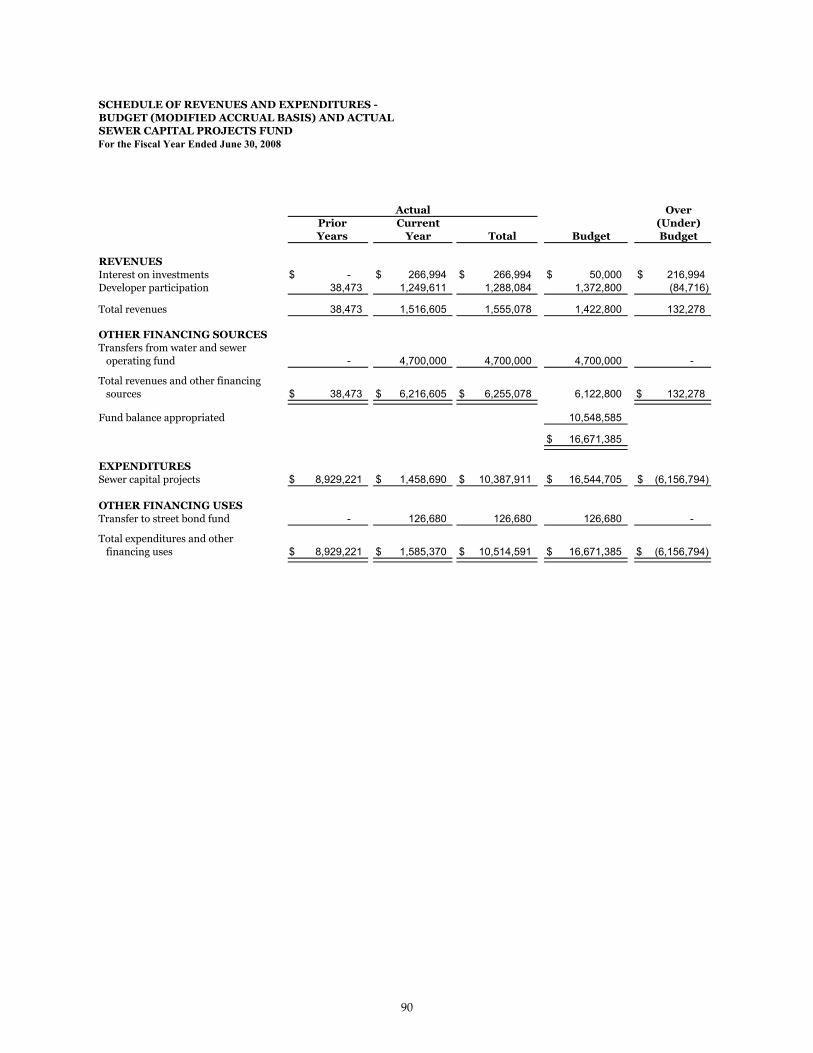
SCHEDULE OF REVENUES AND EXPENDITURES -BUDGET (MODIFIED ACCRUAL BASIS) AND ACTUALSEWER CAPITAL PROJECTS FUNDFor the Fiscal Year Ended June 30, 2008
OverPrior Current (Under)Years Year Total Budget Budget
REVENUESInterest on investments $ - $ 266,994 $ 266,994 $ 50,000 $ 216,994 Developer participation 38,473 1,249,611 1,288,084 1,372,800 (84,716)
Total revenues 38,473 1,516,605 1,555,078 1,422,800 132,278
OTHER FINANCING SOURCESTransfers from water and sewer operating fund - 4,700,000 4,700,000 4,700,000 -
Total revenues and other financing sources $ 38,473 $ 6,216,605 $ 6,255,078 6,122,800 $ 132,278
Fund balance appropriated 10,548,585
$ 16,671,385
EXPENDITURESSewer capital projects $ 8,929,221 $ 1,458,690 $ 10,387,911 $ 16,544,705 $ (6,156,794)
OTHER FINANCING USESTransfer to street bond fund - 126,680 126,680 126,680 -
Total expenditures and other financing uses $ 8,929,221 $ 1,585,370 $ 10,514,591 $ 16,671,385 $ (6,156,794)
Actual
90
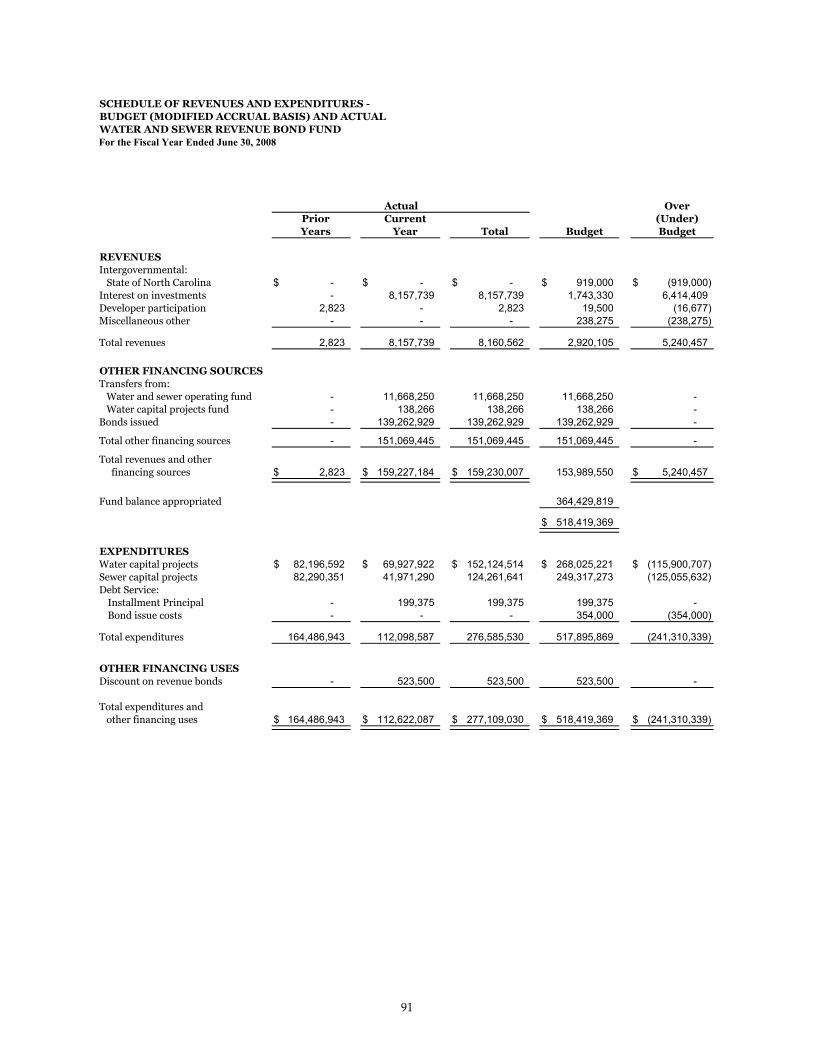
SCHEDULE OF REVENUES AND EXPENDITURES -BUDGET (MODIFIED ACCRUAL BASIS) AND ACTUALWATER AND SEWER REVENUE BOND FUNDFor the Fiscal Year Ended June 30, 2008
OverPrior Current (Under)Years Year Total Budget Budget
REVENUESIntergovernmental: State of North Carolina $ - $ - $ - $ 919,000 $ (919,000) Interest on investments - 8,157,739 8,157,739 1,743,330 6,414,409 Developer participation 2,823 - 2,823 19,500 (16,677) Miscellaneous other - - - 238,275 (238,275)
Total revenues 2,823 8,157,739 8,160,562 2,920,105 5,240,457
OTHER FINANCING SOURCESTransfers from: Water and sewer operating fund - 11,668,250 11,668,250 11,668,250 - Water capital projects fund - 138,266 138,266 138,266 - Bonds issued - 139,262,929 139,262,929 139,262,929 -
Total other financing sources - 151,069,445 151,069,445 151,069,445 -
Total revenues and other financing sources $ 2,823 $ 159,227,184 $ 159,230,007 153,989,550 $ 5,240,457
Fund balance appropriated 364,429,819
$ 518,419,369
EXPENDITURESWater capital projects $ 82,196,592 $ 69,927,922 $ 152,124,514 $ 268,025,221 $ (115,900,707) Sewer capital projects 82,290,351 41,971,290 124,261,641 249,317,273 (125,055,632) Debt Service:
Installment Principal - 199,375 199,375 199,375 - Bond issue costs - - - 354,000 (354,000)
Total expenditures 164,486,943 112,098,587 276,585,530 517,895,869 (241,310,339)
OTHER FINANCING USESDiscount on revenue bonds - 523,500 523,500 523,500 -
Total expenditures and other financing uses $ 164,486,943 $ 112,622,087 $ 277,109,030 $ 518,419,369 $ (241,310,339)
Actual
91
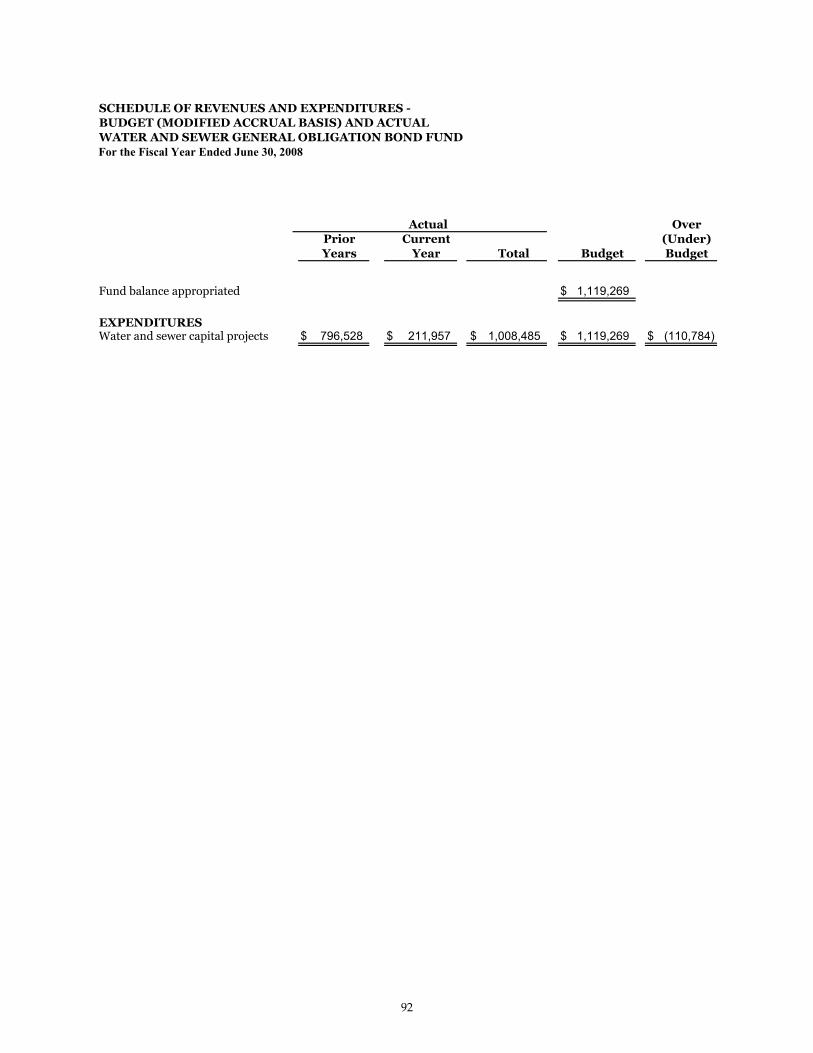
SCHEDULE OF REVENUES AND EXPENDITURES -BUDGET (MODIFIED ACCRUAL BASIS) AND ACTUALWATER AND SEWER GENERAL OBLIGATION BOND FUNDFor the Fiscal Year Ended June 30, 2008
OverPrior Current (Under)Years Year Total Budget Budget
Fund balance appropriated $ 1,119,269
EXPENDITURESWater and sewer capital projects $ 796,528 $ 211,957 $ 1,008,485 $ 1,119,269 $ (110,784)
Actual
92
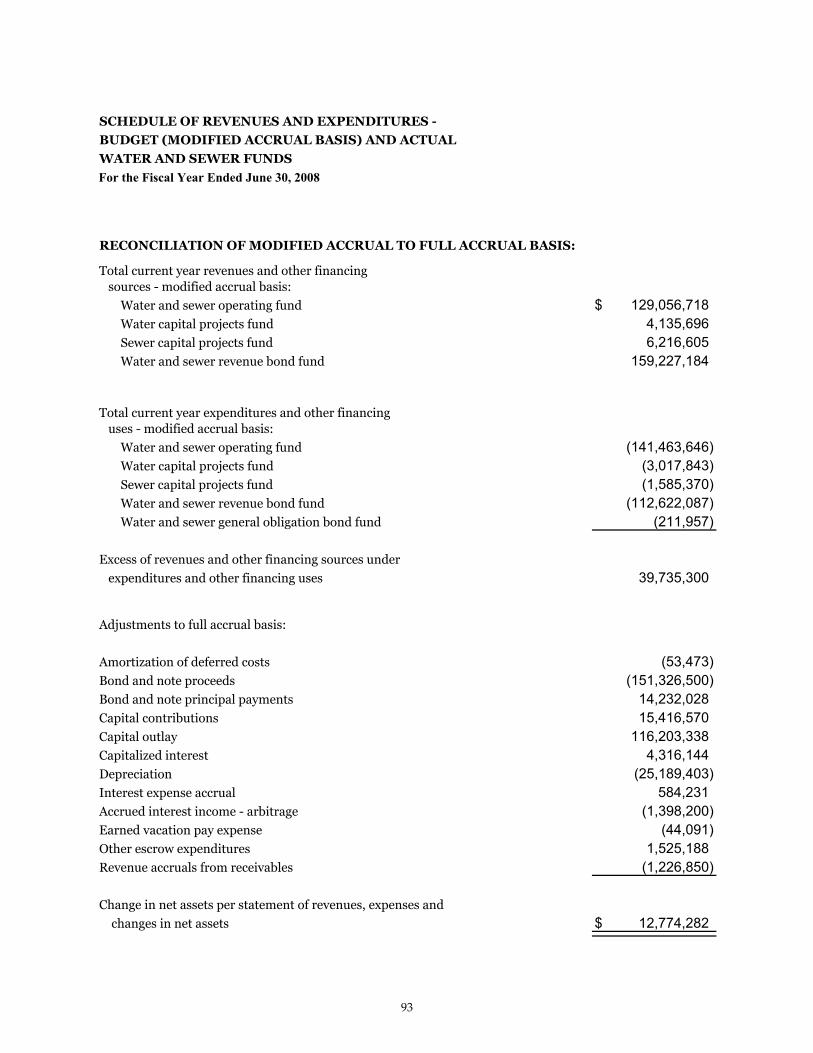
SCHEDULE OF REVENUES AND EXPENDITURES -
BUDGET (MODIFIED ACCRUAL BASIS) AND ACTUAL
WATER AND SEWER FUNDS
For the Fiscal Year Ended June 30, 2008
RECONCILIATION OF MODIFIED ACCRUAL TO FULL ACCRUAL BASIS:
Total current year revenues and other financing sources - modified accrual basis:
Water and sewer operating fund $ 129,056,718 Water capital projects fund 4,135,696 Sewer capital projects fund 6,216,605 Water and sewer revenue bond fund 159,227,184
Total current year expenditures and other financing uses - modified accrual basis:
Water and sewer operating fund (141,463,646) Water capital projects fund (3,017,843) Sewer capital projects fund (1,585,370) Water and sewer revenue bond fund (112,622,087) Water and sewer general obligation bond fund (211,957)
Excess of revenues and other financing sources under
expenditures and other financing uses 39,735,300
Adjustments to full accrual basis:
Amortization of deferred costs (53,473) Bond and note proceeds (151,326,500) Bond and note principal payments 14,232,028 Capital contributions 15,416,570 Capital outlay 116,203,338 Capitalized interest 4,316,144 Depreciation (25,189,403) Interest expense accrual 584,231 Accrued interest income - arbitrage (1,398,200) Earned vacation pay expense (44,091) Other escrow expenditures 1,525,188 Revenue accruals from receivables (1,226,850)
Change in net assets per statement of revenues, expenses and
changes in net assets $ 12,774,282
93
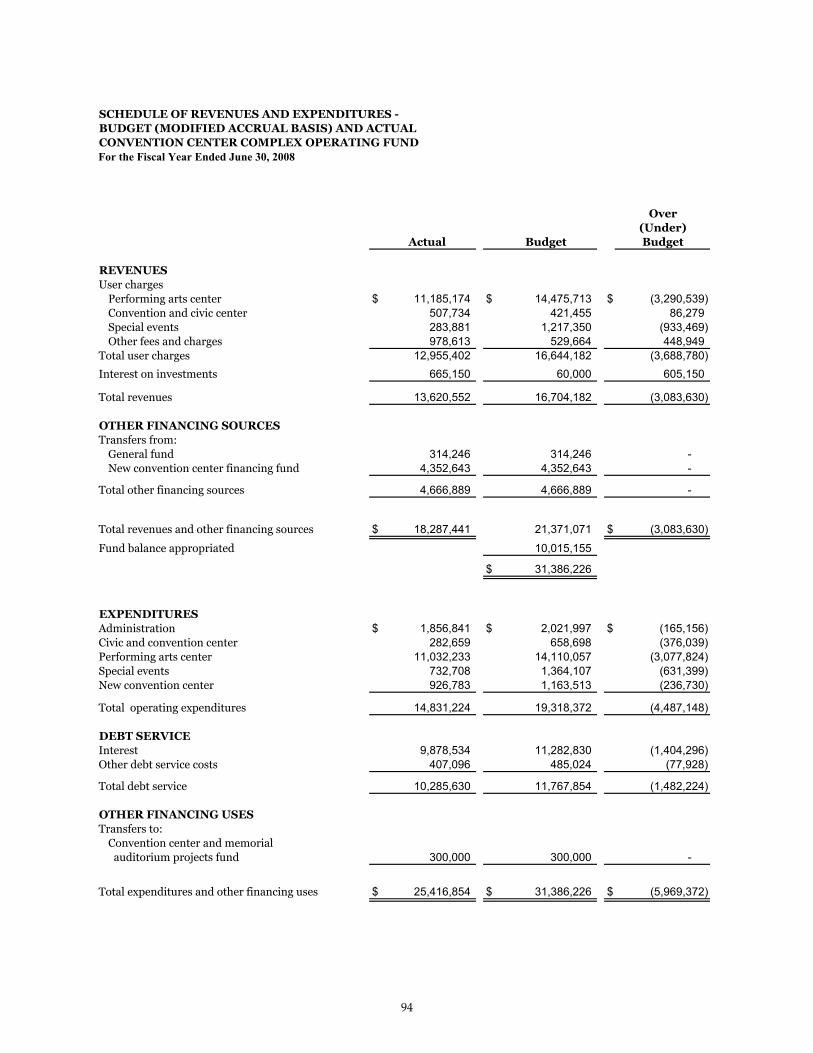
SCHEDULE OF REVENUES AND EXPENDITURES -BUDGET (MODIFIED ACCRUAL BASIS) AND ACTUALCONVENTION CENTER COMPLEX OPERATING FUNDFor the Fiscal Year Ended June 30, 2008
Over(Under)
Actual Budget Budget
REVENUESUser charges
Performing arts center $ 11,185,174 $ 14,475,713 $ (3,290,539) Convention and civic center 507,734 421,455 86,279 Special events 283,881 1,217,350 (933,469) Other fees and charges 978,613 529,664 448,949
Total user charges 12,955,402 16,644,182 (3,688,780) Interest on investments 665,150 60,000 605,150
Total revenues 13,620,552 16,704,182 (3,083,630)
OTHER FINANCING SOURCESTransfers from:
General fund 314,246 314,246 - New convention center financing fund 4,352,643 4,352,643 -
Total other financing sources 4,666,889 4,666,889 -
Total revenues and other financing sources $ 18,287,441 21,371,071 $ (3,083,630)
Fund balance appropriated 10,015,155
$ 31,386,226
EXPENDITURESAdministration $ 1,856,841 $ 2,021,997 $ (165,156)Civic and convention center 282,659 658,698 (376,039)Performing arts center 11,032,233 14,110,057 (3,077,824)Special events 732,708 1,364,107 (631,399)New convention center 926,783 1,163,513 (236,730)
Total operating expenditures 14,831,224 19,318,372 (4,487,148)
DEBT SERVICEInterest 9,878,534 11,282,830 (1,404,296) Other debt service costs 407,096 485,024 (77,928)
Total debt service 10,285,630 11,767,854 (1,482,224)
OTHER FINANCING USESTransfers to:
Convention center and memorial auditorium projects fund 300,000 300,000 -
Total expenditures and other financing uses $ 25,416,854 $ 31,386,226 $ (5,969,372)
94

SCHEDULE OF REVENUES AND EXPENDITURES -BUDGET (MODIFIED ACCRUAL BASIS) AND ACTUALCONVENTION CENTER AND MEMORIAL AUDITORIUM PROJECTS FUNDFor the Fiscal Year Ended June 30, 2008
Actual OverPrior Current (Under)Years Year Total Budget Budget
REVENUESInterest on investments $ - $ 27,980 $ 27,980 $ - $ 27,980 Performing arts center donations - 288,000 288,000 38,000 250,000
Total revenues - 315,980 315,980 38,000 277,980
OTHER FINANCING SOURCESTransfer from convention center
operating fund - 300,000 300,000 300,000 -
Total revenues and otherfinancing sources $ - $ 615,980 $ 615,980 338,000 $ 277,980
Fund balance appropriated 451,187
$ 789,187
EXPENDITURESConvention center and memorial
auditorium projects $ - $ 248,914 $ 248,914 $ 789,187 $ (540,273)
95

SCHEDULE OF REVENUES AND EXPENDITURES -BUDGET (MODIFIED ACCRUAL BASIS) AND ACTUALNEW CONVENTION CENTER COMPLEX CAPITAL PROJECTS FUNDFor the Fiscal Year Ended June 30, 2008
Actual OverPrior Current (Under)Years Year Total Budget Budget
REVENUESInterest on investments $ 13,652,215 $ 2,027,831 $ 15,680,046 $ 13,000,000 $ 2,680,046 Miscellaneous revenue 463,536 274,340 737,876 5,909,201 (5,171,325)
Total revenues 14,115,751 2,302,171 16,417,922 18,909,201 (2,491,279)
OTHER FINANCING SOURCES
Transfers from:General fund 27,000 - 27,000 27,000 - Park improvement fund 15,000 - 15,000 15,000 - Water and sewer operating fund 105,590 - 105,590 105,590 - Water capital projects fund 287,000 - 287,000 287,000 - Sewer capital projects fund 268,260 - 268,260 268,260 - New convention center financing fund - 16,400,000 16,400,000 16,400,000 -
Certificates of participation issued 206,270,588 - 206,270,588 210,000,000 (3,729,412)
Total revenues and otherfinancing sources $ 221,089,189 $ 18,702,171 $ 239,791,360 $ 246,012,051 $ (6,220,691)
EXPENDITURESNew convention center project $ 153,782,634 $ 61,663,615 $ 215,446,249 $ 241,948,431 $ (26,502,182)
OTHER FINANCING USESTransfer to:
Miscellaneous capital projects fund - 579,644 579,644 579,644 - Parking facilities capital projects fund 1,502,313 1,981,663 3,483,976 3,483,976 -
Total expenditures and otherfinancing uses $ 155,284,947 $ 64,224,922 $ 219,509,869 $ 246,012,051 $ (26,502,182)
96

SCHEDULE OF REVENUES AND EXPENDITURES -BUDGET (MODIFIED ACCRUAL BASIS) AND ACTUALCONVENTION CENTER FUNDSFor the Fiscal Year Ended June 30, 2008
RECONCILIATION OF MODIFIED ACCRUAL BASIS TO FULL ACCRUAL BASIS:
Total current year revenues and other financing sources - modified accrual basis
(Convention center complex operating fund) $ 18,287,441
Total current year expenditures and other financing uses - modified accrual basis
(Convention center complex operating fund) (25,416,854)
Total current year revenues and other financing sources - modified accrual basis
(Convention center and memorial auditorium projects fund) 615,980
Total current year expenditures and other financing uses - modified accrual basis
(Convention center and memorial auditorium projects fund) (248,914) Total current year revenues and other financing sources - modified accrual basis
(New convention center capital projects fund) 18,702,171
Total current year expenditures and other financing uses - modified accrual basis
(New convention center capital projects fund) (64,224,922)
Deficiency of revenues and other financing sources under expenditures and other financing uses (52,285,098)
Adjustments to full accrual basis:
Depreciation (1,921,681) Capital outlay 61,605,110 Accrued interest expense (9,509) Capitalized interest 7,175,372 Amortization of deferred issue costs (67,105) Vacation expense (26,036)
Change in net assets per statement of revenues, expenses and changes in fund net assets $ 14,471,053
97

SCHEDULE OF REVENUES AND EXPENDITURES -BUDGET (MODIFIED ACCRUAL BASIS) AND ACTUALPARKING FACILITIES OPERATING FUNDFor the Fiscal Year Ended June 30, 2008
Over(Under)
Actual Budget Budget
REVENUESParking fees $ 7,897,663 $ 6,500,346 $ 1,397,317 Interest on investments 266,986 218,423 48,563
Total revenues 8,164,649 6,718,769 1,445,880
OTHER FINANCING SOURCESTransfers from:
Mass transit 124,535 124,535 - Parking capital projects 1,342,000 1,342,000 -
Total other financing sources 1,466,535 1,466,535 -
Total revenues and other financing sources $ 9,631,184 8,185,304 $ 1,445,880
Fund balance appropriated 7,807,273
$ 15,992,577
EXPENDITURESOperating expenditures $ 3,261,576 $ 3,877,258 $ (615,682)
DEBT SERVICEBond principal 680,000 680,000 - Bond interest 279,100 279,100 - Note principal 2,139,066 2,139,066 - Note interest 2,396,452 3,254,287 (857,835) Other debt service expenditures 183,174 277,283 (94,109)
Total debt service 5,677,792 6,629,736 (951,944)
OTHER FINANCING USESTransfer to:
General fund 70,583 70,583 - Parking facilities capital projects fund 665,000 665,000 -
Short term loan to developer 4,750,000 4,750,000 - Total other financing uses 5,485,583 5,485,583 -
Total expenditures and other financing uses $ 14,424,951 $ 15,992,577 $ (1,567,626)
98

SCHEDULE OF REVENUES AND EXPENDITURES -BUDGET (MODIFIED ACCRUAL BASIS) AND ACTUALPARKING FACILITIES CAPITAL PROJECTS FUNDFor the Fiscal Year Ended June 30, 2008
Actual OverPrior Current (Under)Years Year Total Budget Budget
REVENUESInterest on investments $ 1,510,730 $ 377,127 $ 1,887,857 $ 1,300,000 $ 587,857 Developer participation 2,962,964 - 2,962,964 3,180,350 (217,386) Miscellaneous income - 62,900 62,900 488,119 (425,219)
Total revenues 4,473,694 440,027 4,913,721 4,968,469 (54,748)
OTHER FINANCING SOURCESTransfers from:
Parking facilities operating fund - 665,000 665,000 665,000 - New convention center capital projects fund 1,252,313 1,981,663 3,233,976 3,233,976 -
Certifications of participation issued 24,767,421 14,765,000 39,532,421 63,714,000 (24,181,579)
Total other financing sources 26,019,734 17,411,663 43,431,397 67,612,976 (24,181,579)
Total revenues and otherfinancing sources $ 30,493,428 $ 17,851,690 $ 48,345,118 72,581,445 $ (24,236,327)
Fund balance appropriated 4,575,066
$ 77,156,511
EXPENDITURESParking facilities capital projects $ 35,877,668 $ 10,304,730 $ 46,182,398 $ 75,814,511 $ (29,632,113)
OTHER FINANCING USESTransfers to:
Parking facilities operating fund - 1,342,000 1,342,000 1,342,000 -
Total expenditures $ 35,877,668 $ 11,646,730 $ 47,524,398 $ 77,156,511 $ (29,632,113)
99

SCHEDULE OF REVENUES AND EXPENDITURES -BUDGET (MODIFIED ACCRUAL BASIS) AND ACTUALPARKING FACILITIES FUNDSFor the Fiscal Year Ended June 30, 2008
RECONCILIATION OF MODIFIED ACCRUAL BASIS TO FULL ACCRUAL BASIS:
Total current year revenues and other financing sources - modified accrual basis
(Parking facilities operating fund) $ 9,631,184
Total current year expenditures and other financing uses - modified accrual basis
(Parking facilities operating fund) (14,424,951)
Total current year revenues and other financing sources - modified accrual basis
(Parking facilities capital projects fund) 17,851,690
Total current year expenditures and other financing uses - modified accrual basis
(Parking facilities capital projects fund) (11,646,730)
Excess of revenues and other financing sources over expenditures and other financing uses 1,411,193
Adjustments to full accrual basis:
Depreciation (1,405,615) Capital outlay 9,644,636 Accrued interest expense (574,738) Capitalized interest 1,602,012 Amortization of premiums, deferred refunding and deferred issue costs (46,283) Certificates of participation proceeds (14,765,000) Bond principal 680,000 Note principal 2,139,066 Accrued interest income - arbitrage 17,267 Short-term loan to developer 4,750,000 Vacation expense 1,701
Change in net assets per statement of revenues, expenses and changes in net assets $ 3,454,239
100
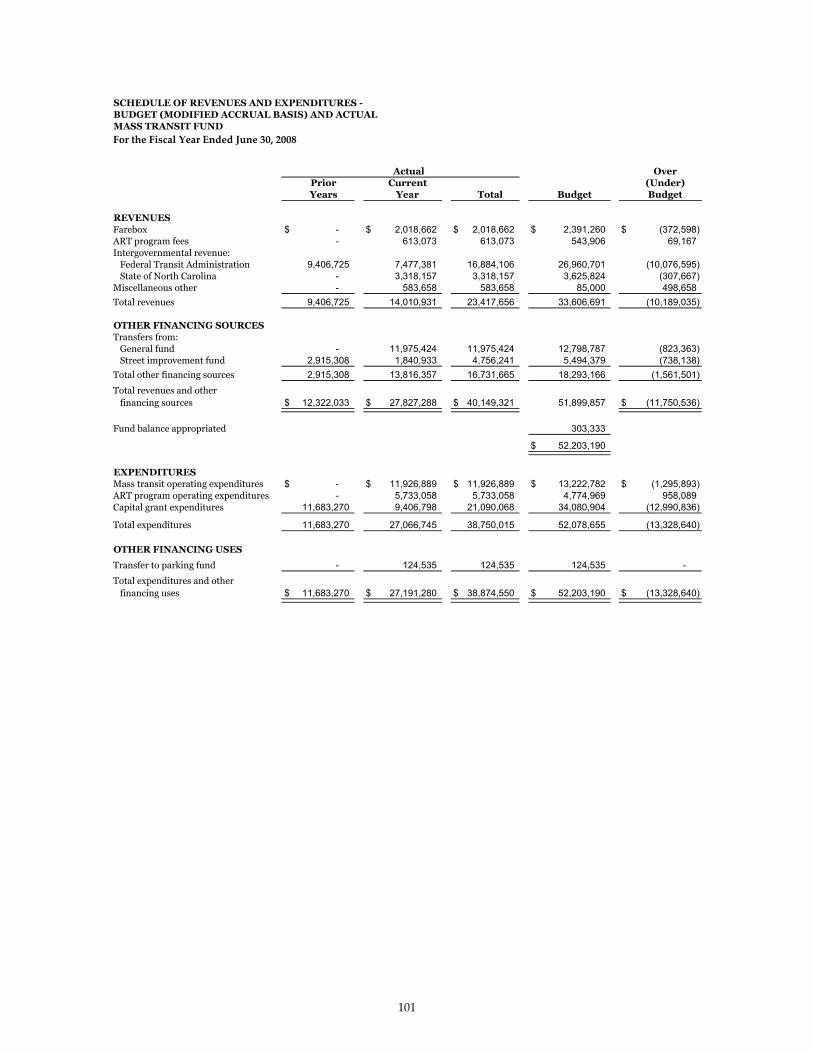
SCHEDULE OF REVENUES AND EXPENDITURES - BUDGET (MODIFIED ACCRUAL BASIS) AND ACTUALMASS TRANSIT FUND
Actual OverPrior Current (Under)Years Year Total Budget Budget
REVENUESFarebox $ - $ 2,018,662 $ 2,018,662 $ 2,391,260 $ (372,598) ART program fees - 613,073 613,073 543,906 69,167 Intergovernmental revenue: Federal Transit Administration 9,406,725 7,477,381 16,884,106 26,960,701 (10,076,595) State of North Carolina - 3,318,157 3,318,157 3,625,824 (307,667) Miscellaneous other - 583,658 583,658 85,000 498,658 Total revenues 9,406,725 14,010,931 23,417,656 33,606,691 (10,189,035)
OTHER FINANCING SOURCESTransfers from: General fund - 11,975,424 11,975,424 12,798,787 (823,363) Street improvement fund 2,915,308 1,840,933 4,756,241 5,494,379 (738,138) Total other financing sources 2,915,308 13,816,357 16,731,665 18,293,166 (1,561,501) Total revenues and other financing sources $ 12,322,033 $ 27,827,288 $ 40,149,321 51,899,857 $ (11,750,536)
Fund balance appropriated 303,333
$ 52,203,190
EXPENDITURESMass transit operating expenditures $ - $ 11,926,889 $ 11,926,889 $ 13,222,782 $ (1,295,893) ART program operating expenditures - 5,733,058 5,733,058 4,774,969 958,089 Capital grant expenditures 11,683,270 9,406,798 21,090,068 34,080,904 (12,990,836)
Total expenditures 11,683,270 27,066,745 38,750,015 52,078,655 (13,328,640)
OTHER FINANCING USES
Transfer to parking fund - 124,535 124,535 124,535 - Total expenditures and other financing uses $ 11,683,270 $ 27,191,280 $ 38,874,550 $ 52,203,190 $ (13,328,640)
101
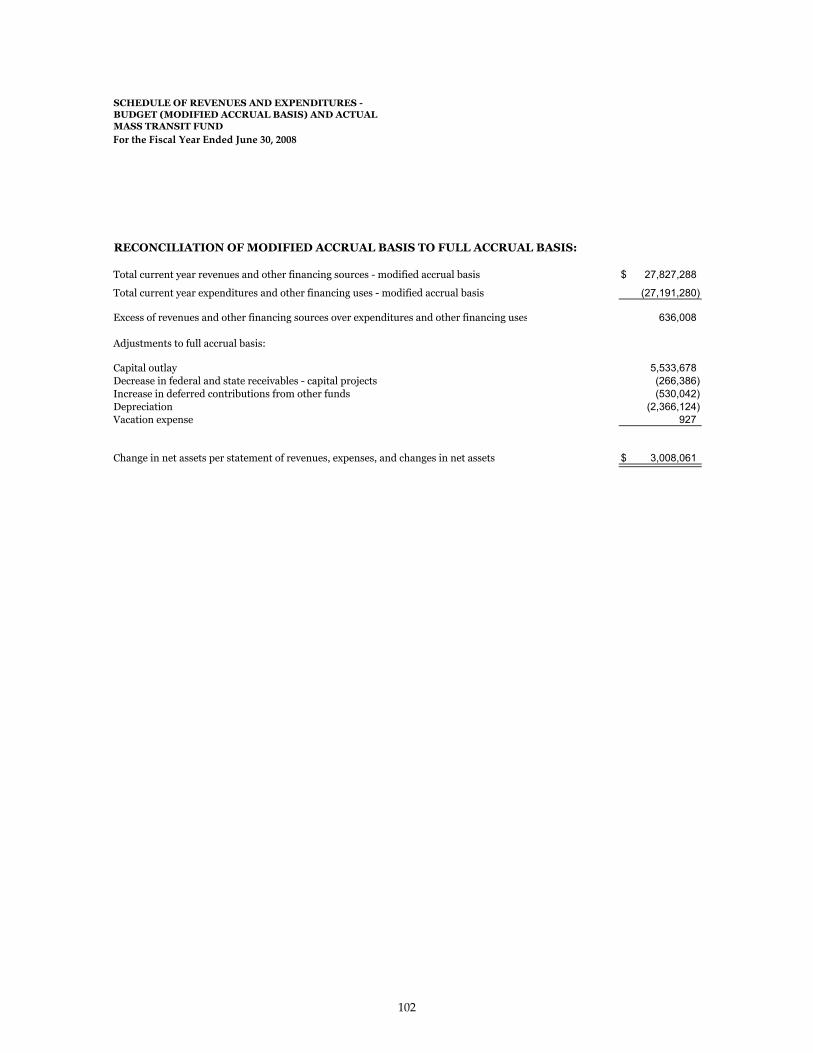
SCHEDULE OF REVENUES AND EXPENDITURES - BUDGET (MODIFIED ACCRUAL BASIS) AND ACTUALMASS TRANSIT FUND
RECONCILIATION OF MODIFIED ACCRUAL BASIS TO FULL ACCRUAL BASIS:
Total current year revenues and other financing sources - modified accrual basis $ 27,827,288
Total current year expenditures and other financing uses - modified accrual basis (27,191,280)
Excess of revenues and other financing sources over expenditures and other financing uses 636,008
Adjustments to full accrual basis:
Capital outlay 5,533,678 Decrease in federal and state receivables - capital projects (266,386) Increase in deferred contributions from other funds (530,042) Depreciation (2,366,124) Vacation expense 927
Change in net assets per statement of revenues, expenses, and changes in net assets $ 3,008,061
102

SCHEDULE OF REVENUES AND EXPENDITURES - BUDGET (MODIFIED ACCRUAL BASIS) AND ACTUALSTORMWATER UTILITY OPERATING FUNDFor the Fiscal Year Ended June 30, 2008
Actual OverCurrent (Under)
Year Budget Budget
REVENUESUser charges $ 13,317,835 $ 13,866,175 $ (548,340) Interest on investments 688,590 411,977 276,613 Miscellaneous other 967,130 1,455,832 (488,702)
Total revenues $ 14,973,555 15,733,984 $ (760,429)
Fund balance appropriated 149,243
$ 15,883,227
EXPENDITURESOperating expenditures $ 7,709,041 $ 9,565,927 $ (1,856,886)
OTHER FINANCING USESTransfer to stormwater utility
capital projects fund 6,317,300 6,317,300 -
Total expenditures and other financing uses $ 14,026,341 $ 15,883,227 $ (1,856,886)
103

SCHEDULE OF REVENUES AND EXPENDITURES -BUDGET (MODIFIED ACCRUAL BASIS) AND ACTUALSTORMWATER UTILITY CAPITAL PROJECTS FUNDFor the Fiscal Year Ended June 30, 2008
Actual OverPrior Current (Under)Years Year Total Budget Budget
REVENUESInterest on investments $ - $ 1,075,245 $ 1,075,245 $ - $ 1,075,245 Intergovernmental:
U.S. EPA - 200,230 200,230 362,000 (161,770) State of North Carolina - 26,290 26,290 1,433,000 (1,406,710)
Miscellaneous other 14,809 42,873 57,682 80,900 (23,218)
Total revenues 14,809 1,344,638 1,359,447 1,875,900 (516,453)
OTHER FINANCING SOURCESTransfers from:
Stormwater utility operating fund - 6,317,300 6,317,300 6,317,300 -
Total other financing sources - 6,317,300 6,317,300 6,317,300 -
Total revenues and other financing sources $ 14,809 $ 7,661,938 $ 7,676,747 8,193,200 $ (516,453)
Fund balance appropriated 26,508,350
$ 34,701,550
EXPENDITURESStormwater capital projects $ 6,501,346 $ 4,348,412 $ 10,849,758 $ 34,701,550 $ (23,851,792)
104

SCHEDULE OF REVENUES AND EXPENDITURES -BUDGET (MODIFIED ACCRUAL BASIS) AND ACTUALSTORMWATER UTILITY BOND FUNDFor the Fiscal Year Ended June 30, 2008
Actual OverPrior Current (Under)Years Year Total Budget Budget
OTHER FINANCING SOURCESBonds Issued $ - $ - $ - $ 24,220,000 $ (24,220,000)
EXPENDITURESStormwater capital projects $ - $ 161,740 $ 161,740 $ 24,220,000 $ (24,058,260)
105

SCHEDULE OF REVENUES AND EXPENDITURES - BUDGET (MODIFIED ACCRUAL BASIS) AND ACTUALSTORMWATER UTILITY FUNDSFor the Fiscal Year Ended June 30, 2008
RECONCILIATION OF MODIFIED ACCRUAL BASIS TO FULL ACCRUAL BASIS:
Total current year revenues and other financing sources - modified accrual basis
(Stormwater utility operating fund) $ 14,973,555
Total current year expenditures and other financing sources - modified accrual basis
(Stormwater utility operating fund) (14,026,341)
Total current year revenues and other financing sources - modified accrual basis
(Stormwater utility capital projects fund) 7,661,938
Total current year expenditures and other financing sources - modified accrual basis
(Stormwater utility capital projects fund) (4,348,412)
Total current year revenues and other financing sources - modified accrual basis
(Stormwater utility bond fund) -
Total current year expenditures and other financing sources - modified accrual basis
(Stormwater utility bond fund) (161,740)
Excess of revenues and other financing sources over expenditures and other financing uses 4,099,000
Adjustments to full accrual basis:
Capital outlay 4,485,396
Depreciation (319,856)
Revenue accruals from receivables (60,114)
Earned vacation pay (28,617)
Change in net assets per statement of revenues, expenses, and changes in net assets $ 8,175,809
106

CITY OF RALEIGH
2008
CITY OF RALEIGH
2008
IN
TE
RN
AL
SE
RV
IC
EF
UN
DS
INTERNAL SERVICE FUNDS
Internal Service Funds are used to account for centralized services
provided on a cost-reimbursement basis. The City maintains six internal
service funds for its print shop, risk management, health benefit,
equipment replacement programs, and central garage operation.

CITY OF RALEIGH
2008

CITY OF RALEIGH
2008
INTERNAL SERVICE FUNDS
PRINT SERVICES FUND - The Print Services Fund accounts for the operations of the City’sprint shop.
RISK MANAGEMENT FUND - The Risk Management Fund accounts for risk managementactivities of the City, including premiums, claims expenses and loss reserves.
EMPLOYEES' HEALTH BENEFITS FUND - The Employees' Health Benefits Fund accountsfor the City and employees contributions to a medical trust and its related costs, includingclaims and operating expenses.
GOVERNMENTAL EQUIPMENT REPLACEMENT FUND - The Governmental EquipmentReplacement Fund accounts for the activities related to managing the equipment replacementprogram for governmental activities.
PUBLIC UTILITIES EQUIPMENT REPLACEMENT FUND - The Public Utilities EquipmentReplacement Fund accounts for the activities related to managing the City’s equipmentreplacement program for the City’s public utilities.
VEHICLE FLEET SERVICES FUND – The Vehicle Fleet Services Fund accounts for theactivities related to the City’s central garage operation.
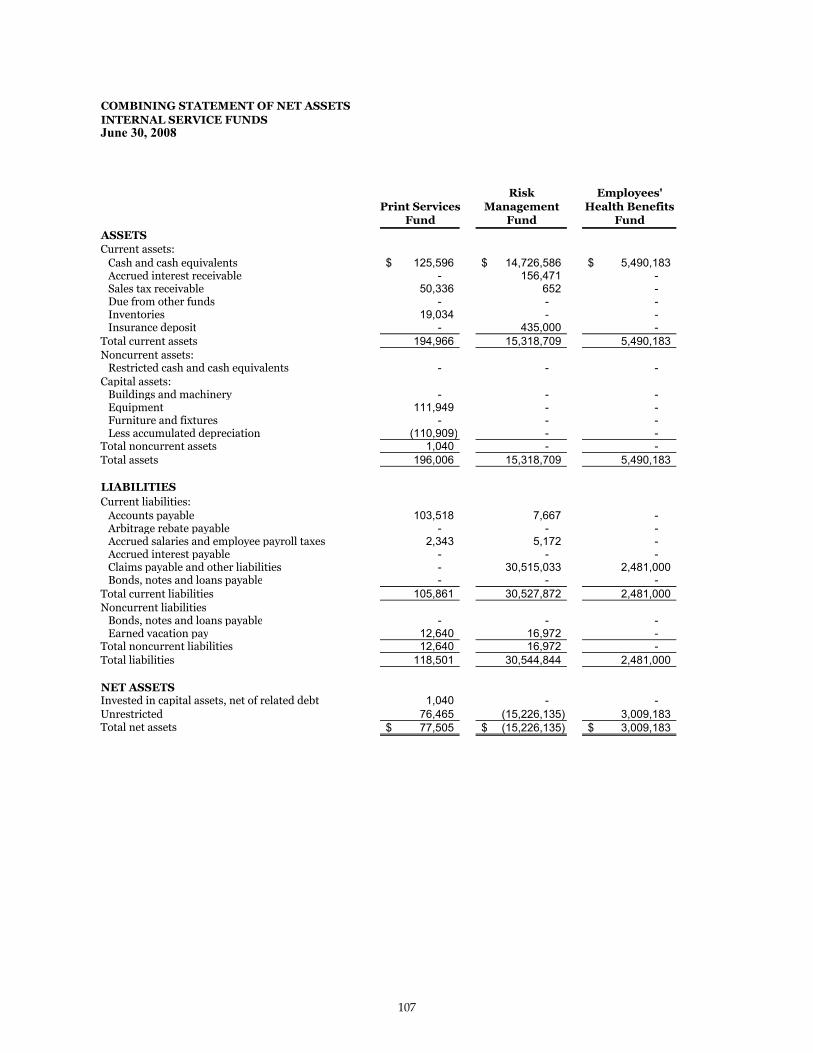
INTERNAL SERVICE FUNDSJune 30, 2008
Risk Employees'Print Services Management Health Benefits
Fund Fund FundASSETSCurrent assets:
Cash and cash equivalents 125,596$ 14,726,586$ 5,490,183$ Accrued interest receivable - 156,471 - Sales tax receivable 50,336 652 - Due from other funds - - - Inventories 19,034 - - Insurance deposit - 435,000 -
Total current assets 194,966 15,318,709 5,490,183 Noncurrent assets:
Restricted cash and cash equivalents - - - Capital assets:
Buildings and machinery - - - Equipment 111,949 - - Furniture and fixtures - - - Less accumulated depreciation (110,909) - -
Total noncurrent assets 1,040 - - Total assets 196,006 15,318,709 5,490,183
LIABILITIESCurrent liabilities:
Accounts payable 103,518 7,667 - Arbitrage rebate payable - - - Accrued salaries and employee payroll taxes 2,343 5,172 - Accrued interest payable - - - Claims payable and other liabilities - 30,515,033 2,481,000 Bonds, notes and loans payable - - -
Total current liabilities 105,861 30,527,872 2,481,000 Noncurrent liabilities
Bonds, notes and loans payable - - - Earned vacation pay 12,640 16,972 -
Total noncurrent liabilities 12,640 16,972 - Total liabilities 118,501 30,544,844 2,481,000
NET ASSETSInvested in capital assets, net of related debt 1,040 - - Unrestricted 76,465 (15,226,135) 3,009,183 Total net assets 77,505$ (15,226,135)$ 3,009,183$
COMBINING STATEMENT OF NET ASSETS
107
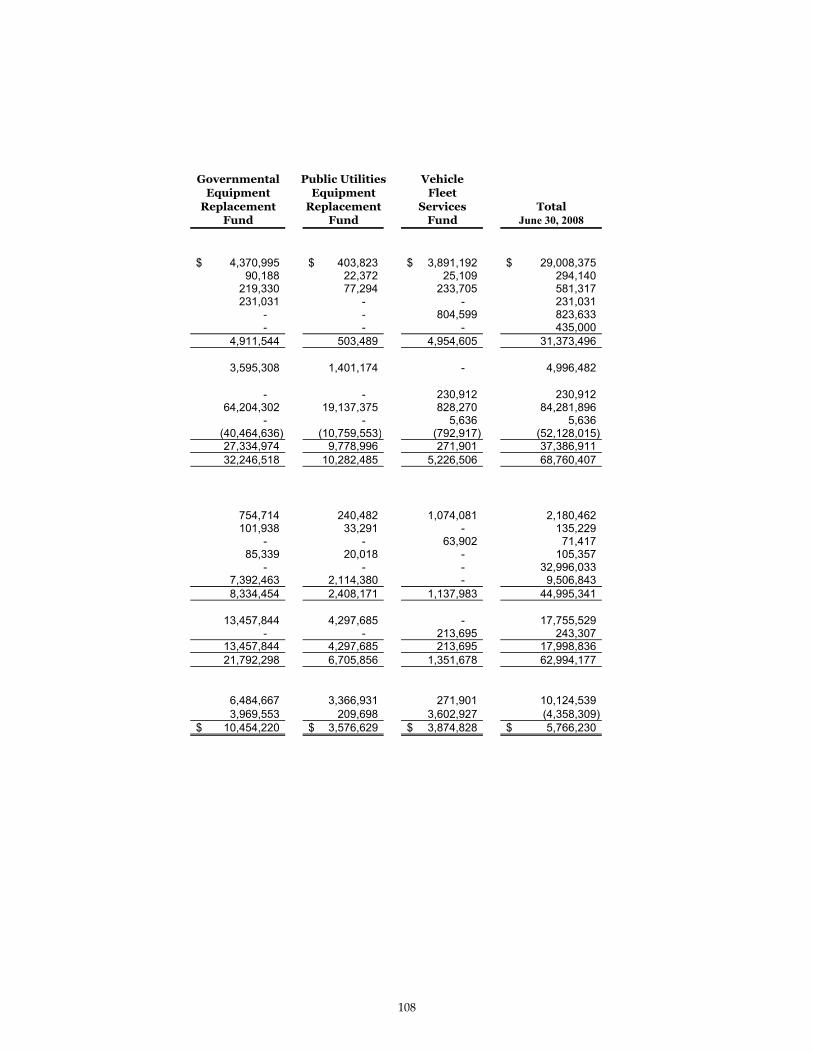
Governmental Public Utilities VehicleEquipment Equipment Fleet
Replacement Replacement Services TotalFund Fund Fund June 30, 2008
4,370,995$ 403,823$ 3,891,192$ 29,008,375$ 90,188 22,372 25,109 294,140
219,330 77,294 233,705 581,317 231,031 - - 231,031
- - 804,599 823,633 - - - 435,000
4,911,544 503,489 4,954,605 31,373,496
3,595,308 1,401,174 - 4,996,482
- - 230,912 230,912 64,204,302 19,137,375 828,270 84,281,896
- - 5,636 5,636 (40,464,636) (10,759,553) (792,917) (52,128,015) 27,334,974 9,778,996 271,901 37,386,911 32,246,518 10,282,485 5,226,506 68,760,407
754,714 240,482 1,074,081 2,180,462 101,938 33,291 - 135,229
- - 63,902 71,417 85,339 20,018 - 105,357
- - - 32,996,033 7,392,463 2,114,380 - 9,506,843 8,334,454 2,408,171 1,137,983 44,995,341
13,457,844 4,297,685 - 17,755,529 - - 213,695 243,307
13,457,844 4,297,685 213,695 17,998,836 21,792,298 6,705,856 1,351,678 62,994,177
6,484,667 3,366,931 271,901 10,124,539 3,969,553 209,698 3,602,927 (4,358,309)
10,454,220$ 3,576,629$ 3,874,828$ 5,766,230$
108
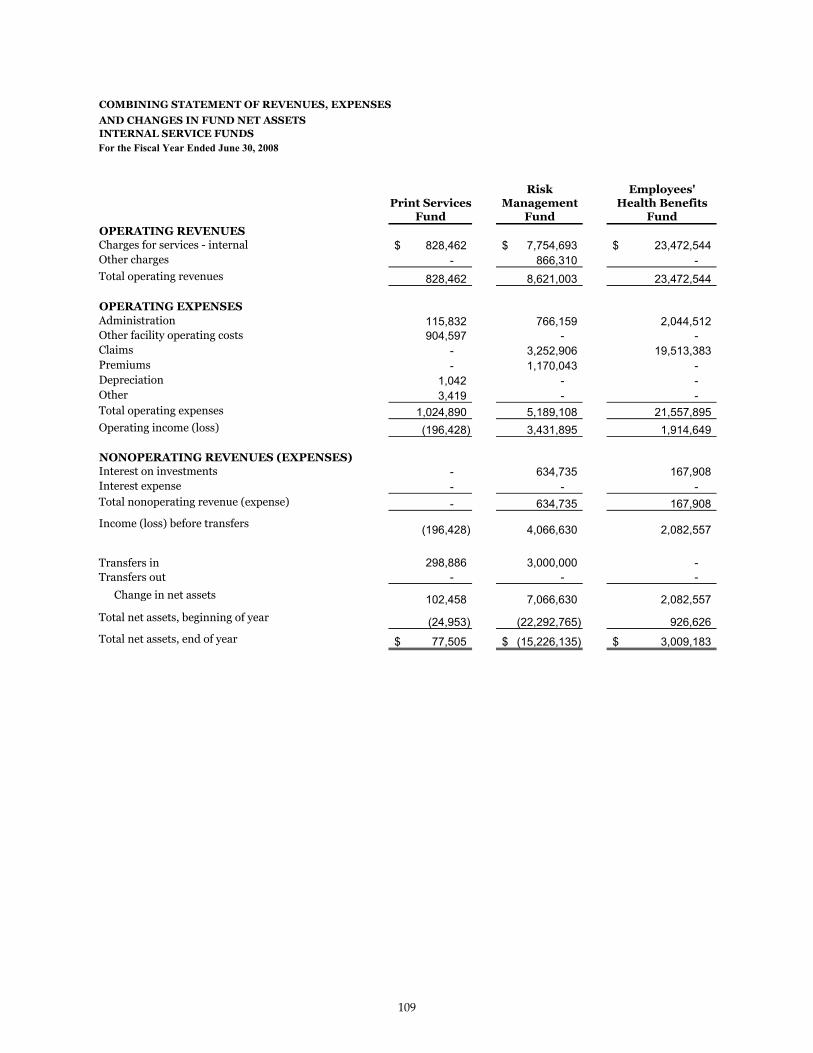
AND CHANGES IN FUND NET ASSETSINTERNAL SERVICE FUNDSFor the Fiscal Year Ended June 30, 2008
Risk Employees'Print Services Management Health Benefits
Fund Fund FundOPERATING REVENUESCharges for services - internal 828,462$ 7,754,693$ 23,472,544$ Other charges - 866,310 - Total operating revenues 828,462 8,621,003 23,472,544
OPERATING EXPENSESAdministration 115,832 766,159 2,044,512 Other facility operating costs 904,597 - - Claims - 3,252,906 19,513,383 Premiums - 1,170,043 - Depreciation 1,042 - - Other 3,419 - - Total operating expenses 1,024,890 5,189,108 21,557,895 Operating income (loss) (196,428) 3,431,895 1,914,649
NONOPERATING REVENUES (EXPENSES)Interest on investments - 634,735 167,908 Interest expense - - - Total nonoperating revenue (expense) - 634,735 167,908
Income (loss) before transfers (196,428) 4,066,630 2,082,557
Transfers in 298,886 3,000,000 - Transfers out - - -
Change in net assets 102,458 7,066,630 2,082,557 Total net assets, beginning of year (24,953) (22,292,765) 926,626 Total net assets, end of year 77,505$ (15,226,135)$ 3,009,183$
COMBINING STATEMENT OF REVENUES, EXPENSES
109

Governmental Public Utilities VehicleEquipment Equipment Fleet
Replacement Replacement ServicesFund Fund Fund Total
10,484,096$ 2,734,989$ 14,300,088$ 59,574,872$ 1,033,202 196,667 11,628 2,107,807
11,517,298 2,931,656 14,311,716 61,682,679
- - 3,079,644 6,006,147 - - 10,220,859 11,125,456 - - - 22,766,289 - - - 1,170,043
7,039,552 2,484,457 30,824 9,555,875 304,164 23,642 - 331,225
7,343,716 2,508,099 13,331,327 50,955,035 4,173,582 423,557 980,389 10,727,644
800,494 178,153 108,562 1,889,852 (1,123,385) (342,650) - (1,466,035)
(322,891) (164,497) 108,562 423,817
3,850,691 259,060 1,088,951 11,151,461
30,153 222,700 - 3,551,739 (3,295,969) (1,000,000) - (4,295,969)
584,875 (518,240) 1,088,951 10,407,231
9,869,345 4,094,869 2,785,877 (4,641,001)
10,454,220$ 3,576,629$ 3,874,828$ 5,766,230$
110
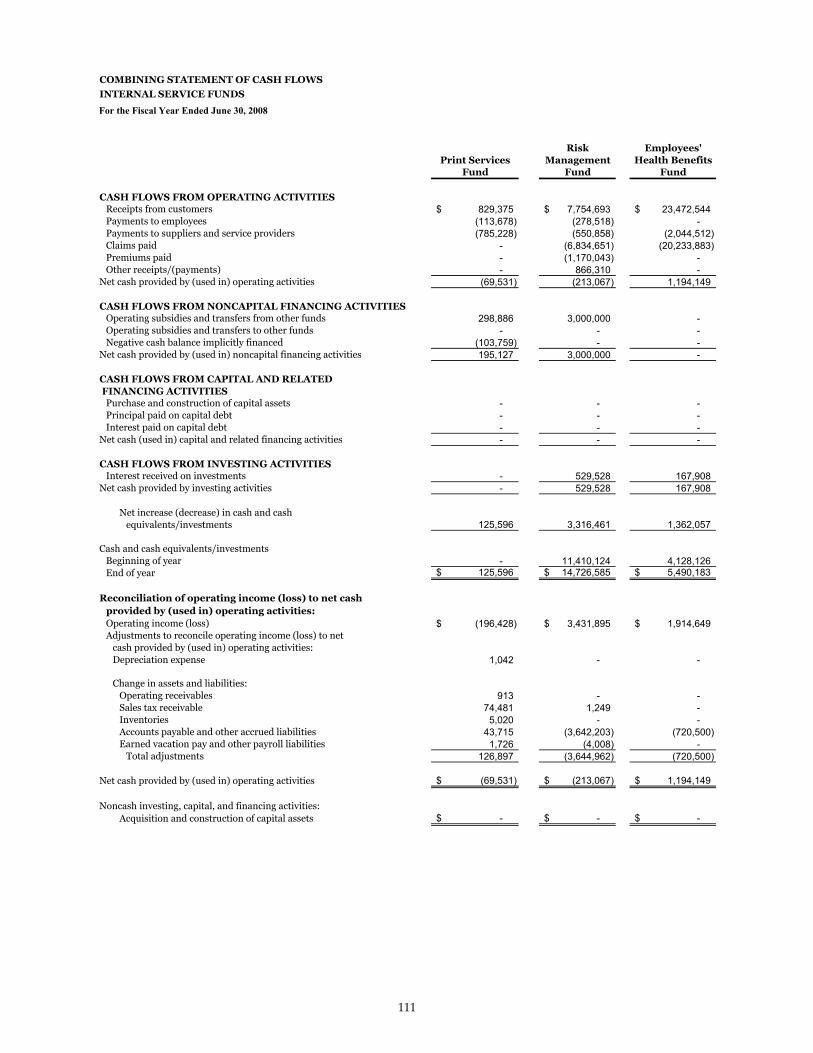
INTERNAL SERVICE FUNDS
For the Fiscal Year Ended June 30, 2008
Risk Employees'Print Services Management Health Benefits
Fund Fund Fund
CASH FLOWS FROM OPERATING ACTIVITIESReceipts from customers 829,375$ 7,754,693$ 23,472,544$ Payments to employees (113,678) (278,518) - Payments to suppliers and service providers (785,228) (550,858) (2,044,512) Claims paid - (6,834,651) (20,233,883) Premiums paid - (1,170,043) - Other receipts/(payments) - 866,310 -
Net cash provided by (used in) operating activities (69,531) (213,067) 1,194,149
CASH FLOWS FROM NONCAPITAL FINANCING ACTIVITIESOperating subsidies and transfers from other funds 298,886 3,000,000 - Operating subsidies and transfers to other funds - - - Negative cash balance implicitly financed (103,759) - -
Net cash provided by (used in) noncapital financing activities 195,127 3,000,000 -
CASH FLOWS FROM CAPITAL AND RELATED FINANCING ACTIVITIES
Purchase and construction of capital assets - - - Principal paid on capital debt - - - Interest paid on capital debt - - -
Net cash (used in) capital and related financing activities - - -
CASH FLOWS FROM INVESTING ACTIVITIESInterest received on investments - 529,528 167,908
Net cash provided by investing activities - 529,528 167,908
Net increase (decrease) in cash and cashequivalents/investments 125,596 3,316,461 1,362,057
Cash and cash equivalents/investmentsBeginning of year - 11,410,124 4,128,126 End of year 125,596$ 14,726,585$ 5,490,183$
Reconciliation of operating income (loss) to net cashprovided by (used in) operating activities:Operating income (loss) (196,428)$ 3,431,895$ 1,914,649$ Adjustments to reconcile operating income (loss) to net
cash provided by (used in) operating activities:Depreciation expense 1,042 - -
Change in assets and liabilities:Operating receivables 913 - - Sales tax receivable 74,481 1,249 - Inventories 5,020 - - Accounts payable and other accrued liabilities 43,715 (3,642,203) (720,500) Earned vacation pay and other payroll liabilities 1,726 (4,008) -
Total adjustments 126,897 (3,644,962) (720,500)
Net cash provided by (used in) operating activities (69,531)$ (213,067)$ 1,194,149$
Noncash investing, capital, and financing activities:Acquisition and construction of capital assets -$ -$ -$
COMBINING STATEMENT OF CASH FLOWS
111
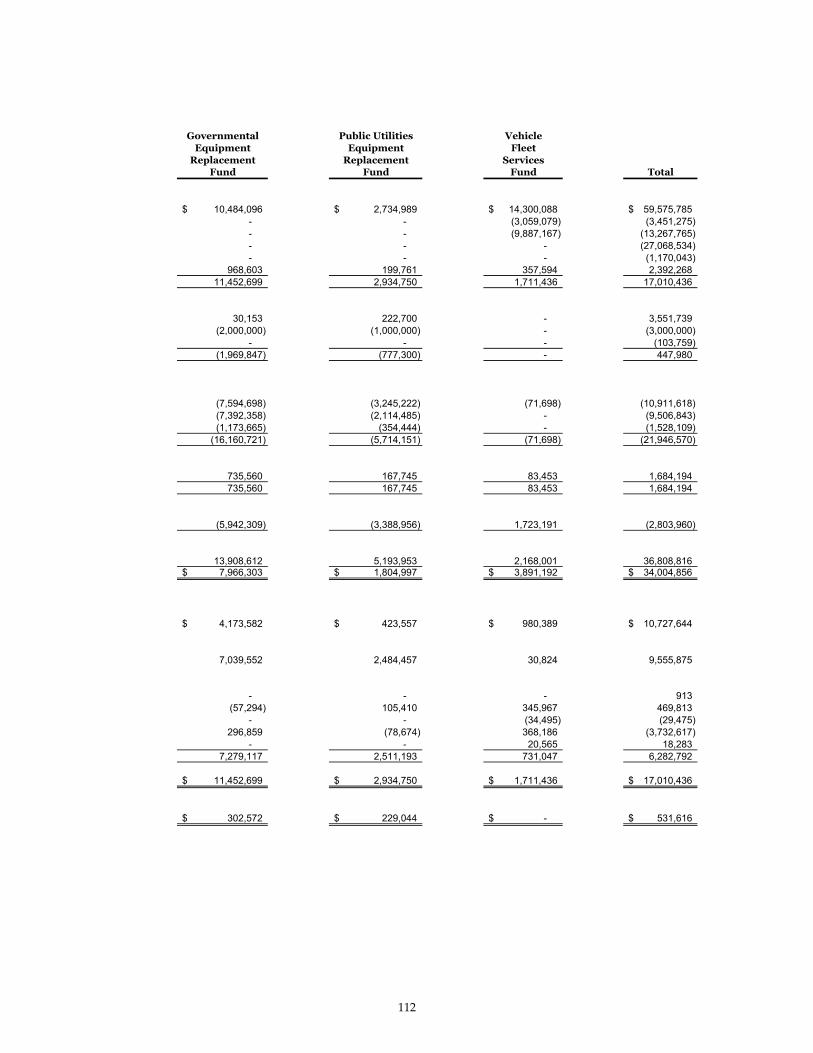
Governmental Public Utilities VehicleEquipment Equipment Fleet
Replacement Replacement ServicesFund Fund Fund Total
10,484,096$ 2,734,989$ 14,300,088$ 59,575,785$
- - (3,059,079) (3,451,275) - - (9,887,167) (13,267,765) - - - (27,068,534) - - - (1,170,043)
968,603 199,761 357,594 2,392,268 11,452,699 2,934,750 1,711,436 17,010,436
30,153 222,700 - 3,551,739 (2,000,000) (1,000,000) - (3,000,000)
- - - (103,759) (1,969,847) (777,300) - 447,980
(7,594,698) (3,245,222) (71,698) (10,911,618) (7,392,358) (2,114,485) - (9,506,843) (1,173,665) (354,444) - (1,528,109)
(16,160,721) (5,714,151) (71,698) (21,946,570)
735,560 167,745 83,453 1,684,194 735,560 167,745 83,453 1,684,194
(5,942,309) (3,388,956) 1,723,191 (2,803,960)
13,908,612 5,193,953 2,168,001 36,808,816 7,966,303$ 1,804,997$ 3,891,192$ 34,004,856$
4,173,582$ 423,557$ 980,389$ 10,727,644$
7,039,552 2,484,457 30,824 9,555,875
- - - 913 (57,294) 105,410 345,967 469,813
- - (34,495) (29,475) 296,859 (78,674) 368,186 (3,732,617)
- - 20,565 18,283 7,279,117 2,511,193 731,047 6,282,792
11,452,699$ 2,934,750$ 1,711,436$ 17,010,436$
302,572$ 229,044$ -$ 531,616$
112

CITY OF RALEIGH
2008
CITY OF RALEIGH
2008
FI
DU
CI
AR
YF
UN
DS
FIDUCIARY FUNDS
The Fiduciary Funds are used to account for resources received and
held by the City as the trustee or for which the City acts as agent. These
funds are expended or invested in accordance with agreements or
applicable prescribed procedures.
The City’s fiduciary funds include three pension trust funds and one
agency fund which account for activities of the City’s general
supplemental retirement plan, the law enforcement officers’ special
separation allowance, other post employment benefits, and the MEAC
Tournament Steering Committee.

CITY OF RALEIGH
2008
CITY OF RALEIGH
2008
FIDUCIARY FUNDS
Pension Trust Funds:
SUPPLEMENTAL MONEY PURCHASE PENSION PLAN FUND - The Supplemental MoneyPurchase Pension Plan Fund accounts for the City’s contributions to the City of RaleighMoney Purchase Pension Plan, a Section 401a plan established to provide supplementalretirement benefits to eligible general government employees. Plan assets are held by the Citythrough a third party in a fiduciary capacity.
LAW ENFORCEMENT OFFICERS’ SPECIAL SEPARATION ALLOWANCE FUND - The LawEnforcement Officers’ Special Separation Allowance Fund accounts for the City’s contributionsto a defined benefit plan provided to City law enforcement officers. The City is administratorof the plan and holds all plan assets.
OTHER POST EMPLOYMENT BENEFITS FUND - The Other Post Employment BenefitsFund accounts for the City's contributions and retirees' contributions to health, life insurance,and medicare supplement benefits provided to eligible retirees.
Agency Fund:
MEAC FUND - This fund accounts for the fundraising and promotional activities of theMEAC Basketball Tournament Steering Committee.
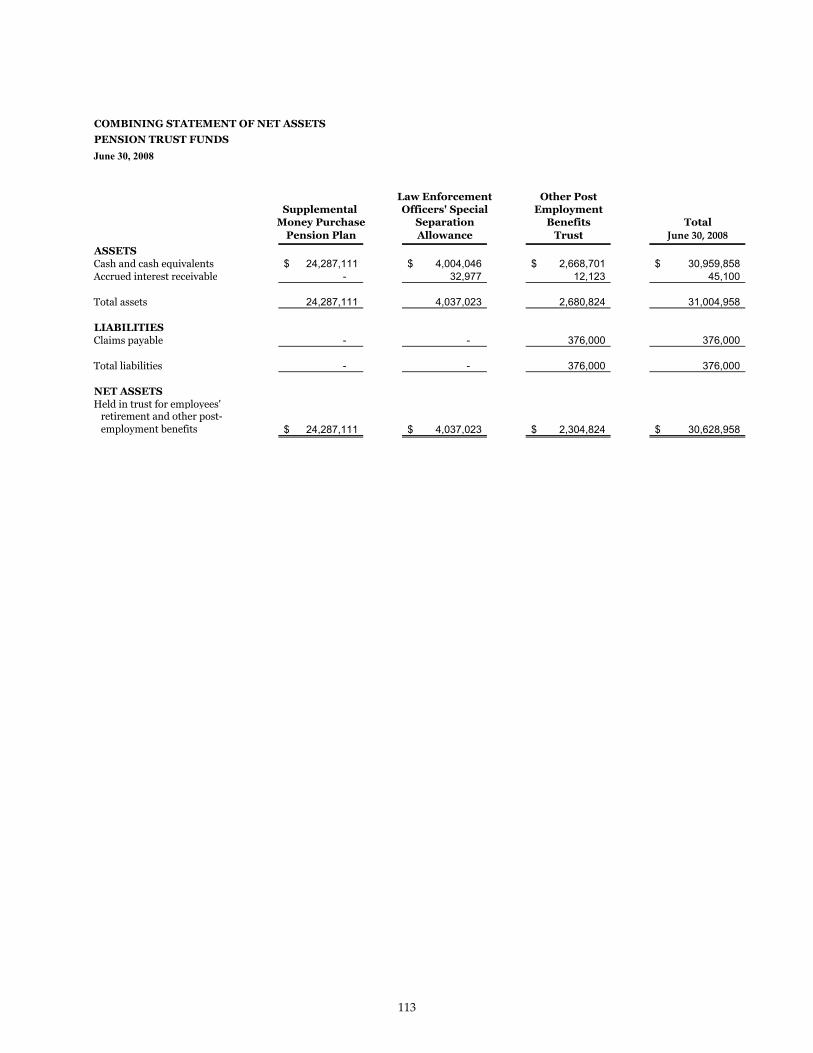
PENSION TRUST FUNDS
June 30, 2008
Law Enforcement Other PostSupplemental Officers' Special Employment
Money Purchase Separation Benefits TotalPension Plan Allowance Trust
ASSETSCash and cash equivalents 24,287,111$ 4,004,046$ 2,668,701$ 30,959,858$ Accrued interest receivable - 32,977 12,123 45,100
Total assets 24,287,111 4,037,023 2,680,824 31,004,958
LIABILITIES Claims payable - - 376,000 376,000
Total liabilities - - 376,000 376,000
NET ASSETSHeld in trust for employees'
retirement and other post-employment benefits 24,287,111$ 4,037,023$ 2,304,824$ 30,628,958$
COMBINING STATEMENT OF NET ASSETS
113
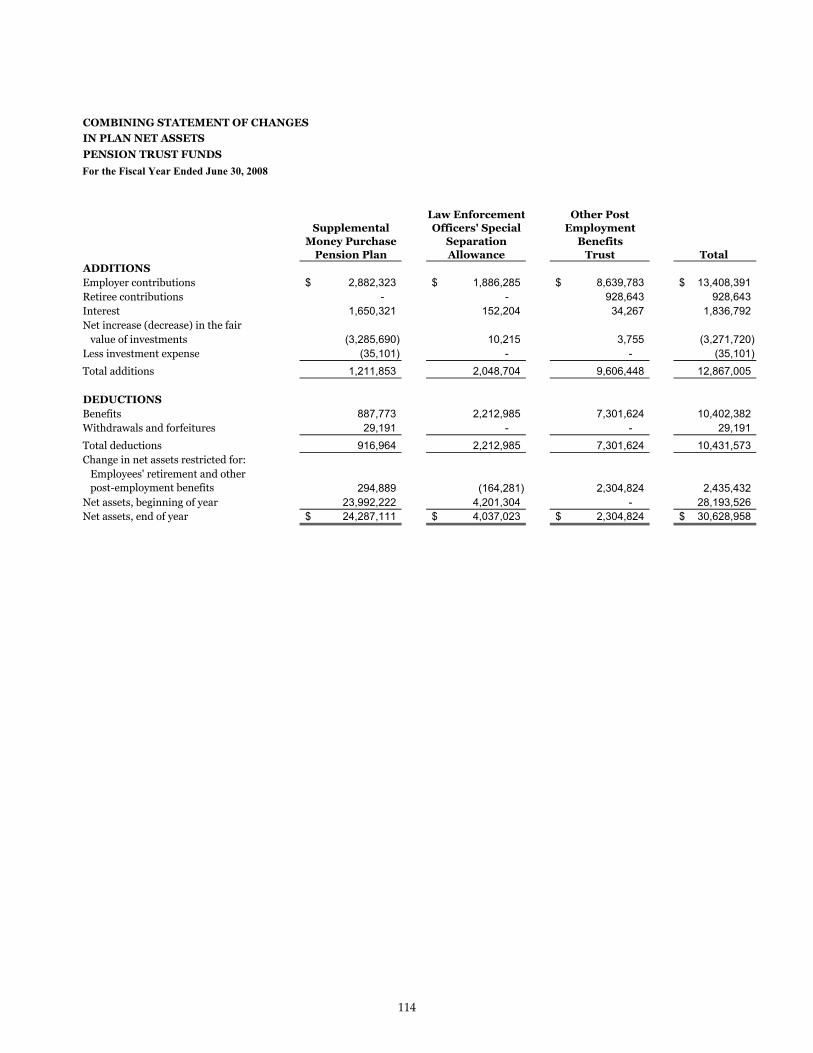
IN PLAN NET ASSETS
PENSION TRUST FUNDS
Law Enforcement Other PostSupplemental Officers' Special Employment
Money Purchase Separation BenefitsPension Plan Allowance Trust Total
ADDITIONSEmployer contributions 2,882,323$ 1,886,285$ 8,639,783$ 13,408,391$ Retiree contributions - - 928,643 928,643 Interest 1,650,321 152,204 34,267 1,836,792 Net increase (decrease) in the fair
value of investments (3,285,690) 10,215 3,755 (3,271,720) Less investment expense (35,101) - - (35,101) Total additions 1,211,853 2,048,704 9,606,448 12,867,005
DEDUCTIONSBenefits 887,773 2,212,985 7,301,624 10,402,382 Withdrawals and forfeitures 29,191 - - 29,191 Total deductions 916,964 2,212,985 7,301,624 10,431,573 Change in net assets restricted for:
Employees' retirement and otherpost-employment benefits 294,889 (164,281) 2,304,824 2,435,432
Net assets, beginning of year 23,992,222 4,201,304 - 28,193,526 Net assets, end of year 24,287,111$ 4,037,023$ 2,304,824$ 30,628,958$
COMBINING STATEMENT OF CHANGES
For the Fiscal Year Ended June 30, 2008
114

MEAC Fund
Assets
Cash and cash equivalents 11,335$
Total assets 11,335$
Liabilities
Due to other agencies 11,335$
Total liabilities 11,335$
115
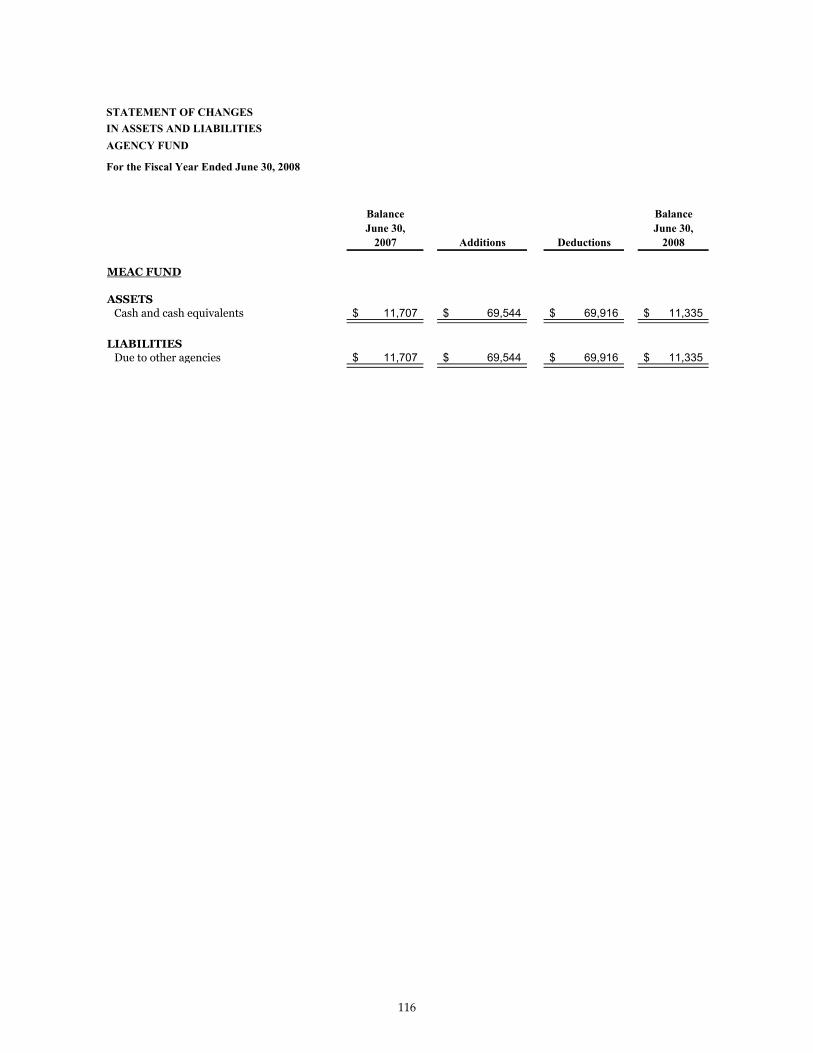
IN ASSETS AND LIABILITIESAGENCY FUND
Balance BalanceJune 30, June 30,
2007 Additions Deductions 2008
MEAC FUND
ASSETSCash and cash equivalents 11,707$ 69,544$ 69,916$ 11,335$
LIABILITIESDue to other agencies 11,707$ 69,544$ 69,916$ 11,335$
For the Fiscal Year Ended June 30, 2008
STATEMENT OF CHANGES
116

CITY OF RALEIGH
2008

CITY OF RALEIGH
2008
OT
HE
RS
CH
ED
UL
ES
OTHER SCHEDULES
The Other Schedules represent various financial schedules of the City.
Included are a schedule of long-term obligation maturities covering all
fund types and detailed schedules of general, enterprise, and internal
service long-term obligations.
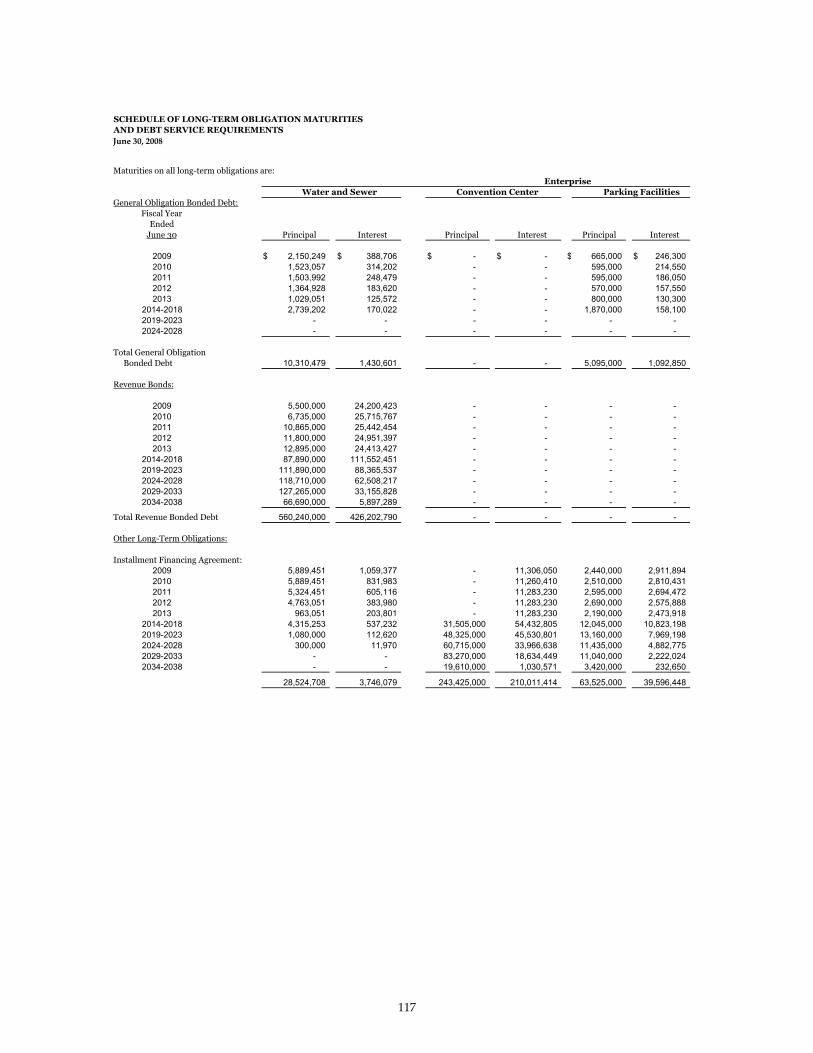
SCHEDULE OF LONG-TERM OBLIGATION MATURITIESAND DEBT SERVICE REQUIREMENTS
Maturities on all long-term obligations are:
Water and Sewer Parking FacilitiesGeneral Obligation Bonded Debt:
Fiscal YearEnded
June 30 Principal Interest Principal Interest Principal Interest
2009 $ 2,150,249 $ 388,706 $ - $ - $ 665,000 $ 246,300 2010 1,523,057 314,202 - - 595,000 214,550 2011 1,503,992 248,479 - - 595,000 186,050 2012 1,364,928 183,620 - - 570,000 157,550 2013 1,029,051 125,572 - - 800,000 130,300
2014-2018 2,739,202 170,022 - - 1,870,000 158,100 2019-2023 - - - - - - 2024-2028 - - - - - -
Total General Obligation Bonded Debt 10,310,479 1,430,601 - - 5,095,000 1,092,850
Revenue Bonds:
2009 5,500,000 24,200,423 - - - - 2010 6,735,000 25,715,767 - - - - 2011 10,865,000 25,442,454 - - - - 2012 11,800,000 24,951,397 - - - - 2013 12,895,000 24,413,427 - - - -
2014-2018 87,890,000 111,552,451 - - - - 2019-2023 111,890,000 88,365,537 - - - - 2024-2028 118,710,000 62,508,217 - - - - 2029-2033 127,265,000 33,155,828 - - - - 2034-2038 66,690,000 5,897,289 - - - -
Total Revenue Bonded Debt 560,240,000 426,202,790 - - - -
Other Long-Term Obligations:
Installment Financing Agreement:2009 5,889,451 1,059,377 - 11,306,050 2,440,000 2,911,894 2010 5,889,451 831,983 - 11,260,410 2,510,000 2,810,431 2011 5,324,451 605,116 - 11,283,230 2,595,000 2,694,472 2012 4,763,051 383,980 - 11,283,230 2,690,000 2,575,888 2013 963,051 203,801 - 11,283,230 2,190,000 2,473,918
2014-2018 4,315,253 537,232 31,505,000 54,432,805 12,045,000 10,823,198 2019-2023 1,080,000 112,620 48,325,000 45,530,801 13,160,000 7,969,198 2024-2028 300,000 11,970 60,715,000 33,966,638 11,435,000 4,882,775 2029-2033 - - 83,270,000 18,634,449 11,040,000 2,222,024 2034-2038 - - 19,610,000 1,030,571 3,420,000 232,650
28,524,708 3,746,079 243,425,000 210,011,414 63,525,000 39,596,448
EnterpriseConvention Center
117
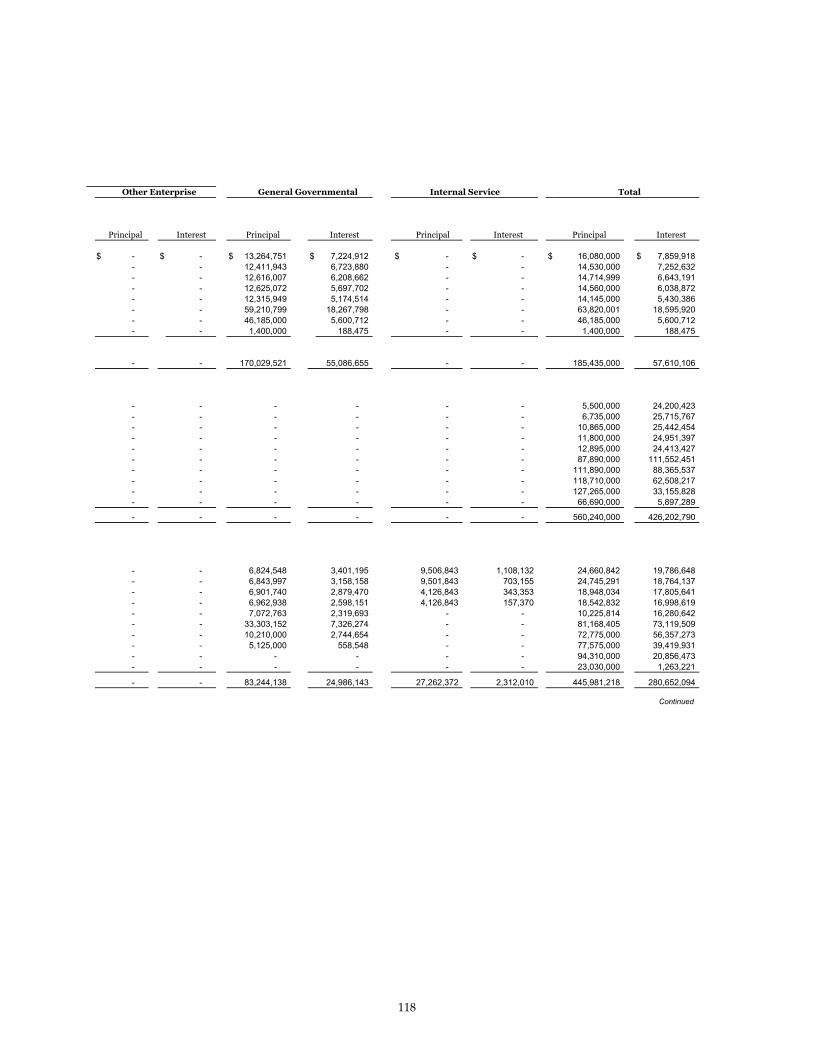
General Governmental Total
Principal Interest Principal Interest Principal Interest Principal Interest
$ - $ - $ 13,264,751 $ 7,224,912 $ - $ - $ 16,080,000 $ 7,859,918 - - 12,411,943 6,723,880 - - 14,530,000 7,252,632 - - 12,616,007 6,208,662 - - 14,714,999 6,643,191 - - 12,625,072 5,697,702 - - 14,560,000 6,038,872 - - 12,315,949 5,174,514 - - 14,145,000 5,430,386 - - 59,210,799 18,267,798 - - 63,820,001 18,595,920 - - 46,185,000 5,600,712 - - 46,185,000 5,600,712 - - 1,400,000 188,475 - - 1,400,000 188,475
- - 170,029,521 55,086,655 - - 185,435,000 57,610,106
- - - - - - 5,500,000 24,200,423 - - - - - - 6,735,000 25,715,767 - - - - - - 10,865,000 25,442,454 - - - - - - 11,800,000 24,951,397 - - - - - - 12,895,000 24,413,427 - - - - - - 87,890,000 111,552,451 - - - - - - 111,890,000 88,365,537 - - - - - - 118,710,000 62,508,217 - - - - - - 127,265,000 33,155,828 - - - - - - 66,690,000 5,897,289
- - - - - - 560,240,000 426,202,790
- - 6,824,548 3,401,195 9,506,843 1,108,132 24,660,842 19,786,648 - - 6,843,997 3,158,158 9,501,843 703,155 24,745,291 18,764,137 - - 6,901,740 2,879,470 4,126,843 343,353 18,948,034 17,805,641 - - 6,962,938 2,598,151 4,126,843 157,370 18,542,832 16,998,619 - - 7,072,763 2,319,693 - - 10,225,814 16,280,642 - - 33,303,152 7,326,274 - - 81,168,405 73,119,509 - - 10,210,000 2,744,654 - - 72,775,000 56,357,273 - - 5,125,000 558,548 - - 77,575,000 39,419,931 - - - - - - 94,310,000 20,856,473 - - - - - - 23,030,000 1,263,221
- - 83,244,138 24,986,143 27,262,372 2,312,010 445,981,218 280,652,094
Continued
Internal ServiceOther Enterprise
118

SCHEDULE OF LONG-TERM OBLIGATION MATURITIESAND DEBT SERVICE REQUIREMENTS
Maturities on all long-term obligations are:
Water and Sewer Parking Facilities Enterprise
Convention CenterOther Long-Term Obligations:
Continued: Principal Interest Principal Interest Principal Interest
Other Installment Obligations:2009 $ 199,375 $ - $ - $ - $ - $ - 2010 1,124,375 92,500 - - - - 2011 1,124,375 46,250 - - - - 2012 - - - - - - 2013 - - - - - -
2014-2018 - - - - - -
2,448,125 138,750 - - - -
Other:Reimbursement Contracts 13,796 - - - - - Earned Vacation Pay 1,761,758 - 427,891 - 36,015 - Landfill Postclosure Costs - - - - - -
1,775,554 - 427,891 - 36,015 -
Total Other Long-Term Obligations 32,748,387 3,884,829 243,852,891 210,011,414 63,561,015 39,596,448
Total Long-Term Obligations $ 603,298,866 $ 431,518,220 $ 243,852,891 $ 210,011,414 $ 68,656,015 $ 40,689,298
Notes: Interest to be paid in future periods not determinable in advance.
Interest not applicable.
119
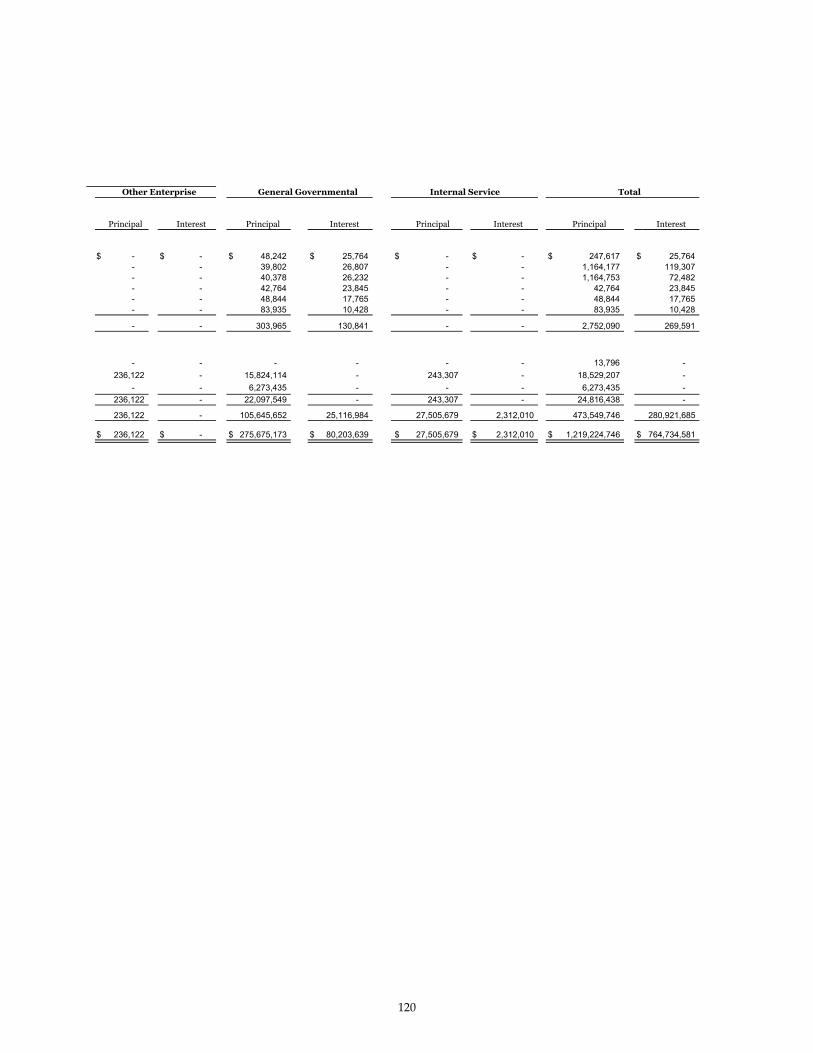
General Governmental TotalInternal ServiceOther Enterprise
Principal Interest Principal Interest Principal Interest Principal Interest
$ - $ - $ 48,242 $ 25,764 $ - $ - $ 247,617 $ 25,764 - - 39,802 26,807 - - 1,164,177 119,307 - - 40,378 26,232 - - 1,164,753 72,482 - - 42,764 23,845 - - 42,764 23,845 - - 48,844 17,765 - - 48,844 17,765 - - 83,935 10,428 - - 83,935 10,428
- - 303,965 130,841 - - 2,752,090 269,591
- - - - - - 13,796 - 236,122 - 15,824,114 - 243,307 - 18,529,207 -
- - 6,273,435 - - - 6,273,435 - 236,122 - 22,097,549 - 243,307 - 24,816,438 -
236,122 - 105,645,652 25,116,984 27,505,679 2,312,010 473,549,746 280,921,685
$ 236,122 $ - $ 275,675,173 $ 80,203,639 $ 27,505,679 $ 2,312,010 $ 1,219,224,746 $ 764,734,581
120

SCHEDULE OF GENERAL GOVERNMENTAL LONG-TERM OBLIGATIONSFor the Fiscal Year Ended June 30, 2008
Date Principal IssuedInterest of Balance During
Description Rate Issue June 30, 2007 Year
GENERAL OBLIGATIONBONDS PAYABLE
Housing, Series 1994B Taxable 7.90 - 8.00 09/01/94 $ 1,025,000 $ - Housing, Series 1996 5.40 - 5.75 06/01/96 1,035,000 - Public Improvement Refunding, Series 1997 5.00 10/01/97 4,840,000 - Housing, Series 1997 6.70 10/01/97 2,570,000 - G. O. Refunding, Series 1998 4.00 - 4.20 12/01/98 3,055,000 - Street Improvement, Series1998 4.30 - 4.40 12/01/98 14,400,000 - Public Improvement, Series 2002 4.00 - 5.00 06/01/02 8,200,000 - Public Improvement, Series 2002A 3.25 - 4.50 12/01/02 2,500,000 - Public Improvement, Series 2002B 3.25 - 4.50 12/01/02 38,100,000 - Public Improvement Refunding, Series 2002C 4.00 12/01/02 4,985,000 - Public Improvement, Series 2004 2.00 - 4.00 03/01/04 13,650,000 - Public Improvement Refunding, Series 2004A 2.00 - 4.00 03/01/04 15,068,892 - Housing, Series 2004B 3.25 - 4.375 03/01/04 5,905,000 - Housing Refunding, Series 2004B 3.25 - 4.00 03/01/04 1,500,000 - Street Improvement, Series2005A 3.50 - 5.00 08/01/05 10,300,000 - Public Improvement, Series 2005B 3.50 - 5.00 08/01/05 49,085,000 - Housing, Series 2007 4.95 - 5.40 03/01/07 7,000,000 - Total General Obligation Bonded Debt 183,218,892 -
OTHER GENERAL GOVERNMENTAL LONG-TERM OBLIGATIONS
Installment Financing Agreement 31,678,944 54,279,000Other Installment Obligations 350,695 16,887 Earned Vacation Pay 14,989,837 9,975,760 Landfill closure and Postclosure Costs 4,475,846 1,930,410
Total Other General Governmental Long-Term Obligations 51,495,322 66,202,057Total General Governmental Long-Term Obligations $ 234,714,214 $ 66,202,057
Note:
(1) The amount of vacation pay to be paid in any fiscal year cannot be determined. The total amount of accrued vacation
pay outstanding at any point in time is not expected to materially increase or decrease from the amount shown.
121

PrincipalBalance
Principal Interest June 30, 2008 Principal Interest Total
$ 325,000 $ 81,350 $ 700,000 $ 325,000 $ 55,675 $ 380,675 115,000 58,132 920,000 115,000 51,922 166,922
1,915,000 242,000 2,925,000 1,150,000 146,250 1,296,250 150,000 172,190 2,420,000 200,000 162,140 362,140 855,000 123,250 2,200,000 845,000 89,050 934,050 950,000 625,150 13,450,000 1,500,000 584,300 2,084,300 300,000 378,950 7,900,000 300,000 366,950 666,950 100,000 102,500 2,400,000 125,000 99,250 224,250
1,225,000 1,563,688 36,875,000 2,075,000 1,523,875 3,598,875 1,960,000 199,400 3,025,000 1,530,000 121,000 1,651,000
450,000 493,500 13,200,000 450,000 484,500 934,500 1,794,371 487,642 13,274,521 1,749,751 451,755 2,201,506
180,000 238,201 5,725,000 505,000 232,351 737,351 720,000 52,332 780,000 245,000 28,932 273,932 300,000 441,438 10,000,000 300,000 430,938 730,938
1,500,000 2,104,300 47,585,000 1,500,000 2,051,800 3,551,800 350,000 361,550 6,650,000 350,000 344,225 694,225
13,189,371 7,725,573 170,029,521 13,264,751 7,224,913 20,489,664
2,713,806 1,700,491 83,244,138 6,824,548 3,401,195 10,225,74363,617 24,881 303,965 48,242 25,764 74,006
9,141,483 - 15,824,114 - (1) - - 132,821 - 6,273,435 - - -
12,051,727 1,725,372 105,645,652 6,872,790 3,426,959 10,299,749$ 25,241,098 $ 9,450,945 $ 275,675,173 $ 20,137,541 $ 10,651,872 $ 30,789,413
Due Fiscal 2008-2009Payments During Fiscal 2007-2008
122
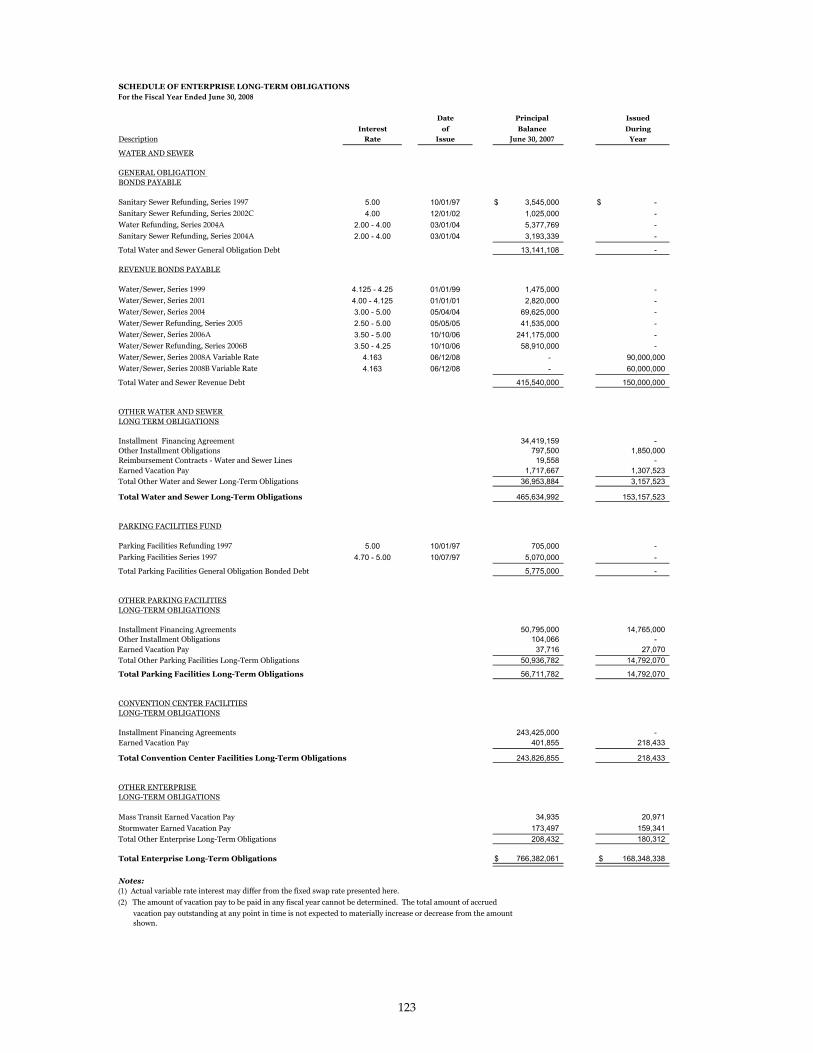
SCHEDULE OF ENTERPRISE LONG-TERM OBLIGATIONS
Date Principal Issued
Interest of Balance During
Description Rate Issue Year
WATER AND SEWER
GENERAL OBLIGATION BONDS PAYABLE
Sanitary Sewer Refunding, Series 5.00 10/01/97 $ 3,545,000 $ - Sanitary Sewer Refunding, Series 4.00 12/01/02 1,025,000 - Water Refunding, Series 2.00 - 4.00 03/01/04 5,377,769 - Sanitary Sewer Refunding, Series 2.00 - 4.00 03/01/04 3,193,339 -
Total Water and Sewer General Obligation Debt 13,141,108 -
REVENUE BONDS PAYABLE
Water/Sewer, Series 4.125 - 4.25 01/01/99 1,475,000 - Water/Sewer, Series 4.00 - 4.125 01/01/01 2,820,000 - Water/Sewer, Series 3.00 - 5.00 05/04/04 69,625,000 - Water/Sewer Refunding, Series 2.50 - 5.00 05/05/05 41,535,000 - Water/Sewer, Series 3.50 - 5.00 10/10/06 241,175,000 - Water/Sewer Refunding, Series 3.50 - 4.25 10/10/06 58,910,000 - Water/Sewer, Series Variable Rate 4.163 06/12/08 - 90,000,000 Water/Sewer, Series Variable Rate 4.163 06/12/08 - 60,000,000
Total Water and Sewer Revenue Debt 415,540,000 150,000,000
OTHER WATER AND SEWER LONG TERM OBLIGATIONS
Installment Financing Agreement 34,419,159 - Other Installment Obligations 797,500 1,850,000 Reimbursement Contracts - Water and Sewer Lines 19,558 - Earned Vacation Pay 1,717,667 1,307,523 Total Other Water and Sewer Long-Term Obligations 36,953,884 3,157,523
Total Water and Sewer Long-Term Obligations 465,634,992 153,157,523
PARKING FACILITIES FUND
Parking Facilities Refunding 5.00 10/01/97 705,000 - Parking Facilities Series 4.70 - 5.00 10/07/97 5,070,000 -
Total Parking Facilities General Obligation Bonded Debt 5,775,000 -
OTHER PARKING FACILITIESLONG-TERM OBLIGATIONS
Installment Financing Agreements 50,795,000 14,765,000 Other Installment Obligations 104,066 - Earned Vacation Pay 37,716 27,070 Total Other Parking Facilities Long-Term Obligations 50,936,782 14,792,070
Total Parking Facilities Long-Term Obligations 56,711,782 14,792,070
CONVENTION CENTER FACILITIESLONG-TERM OBLIGATIONS
Installment Financing Agreements 243,425,000 - Earned Vacation Pay 401,855 218,433
Total Convention Center Facilities Long-Term Obligations 243,826,855 218,433
OTHER ENTERPRISE LONG-TERM OBLIGATIONS
Mass Transit Earned Vacation Pay 34,935 20,971 Stormwater Earned Vacation Pay 173,497 159,341 Total Other Enterprise Long-Term Obligations 208,432 180,312
Total Enterprise Long-Term Obligations $ 766,382,061 $ 168,348,338
Notes: Actual variable rate interest may differ from the fixed swap rate presented here.
The amount of vacation pay to be paid in any fiscal year cannot be determined. The total amount of accrued
vacation pay outstanding at any point in time is not expected to materially increase or decrease from the amount shown.
123
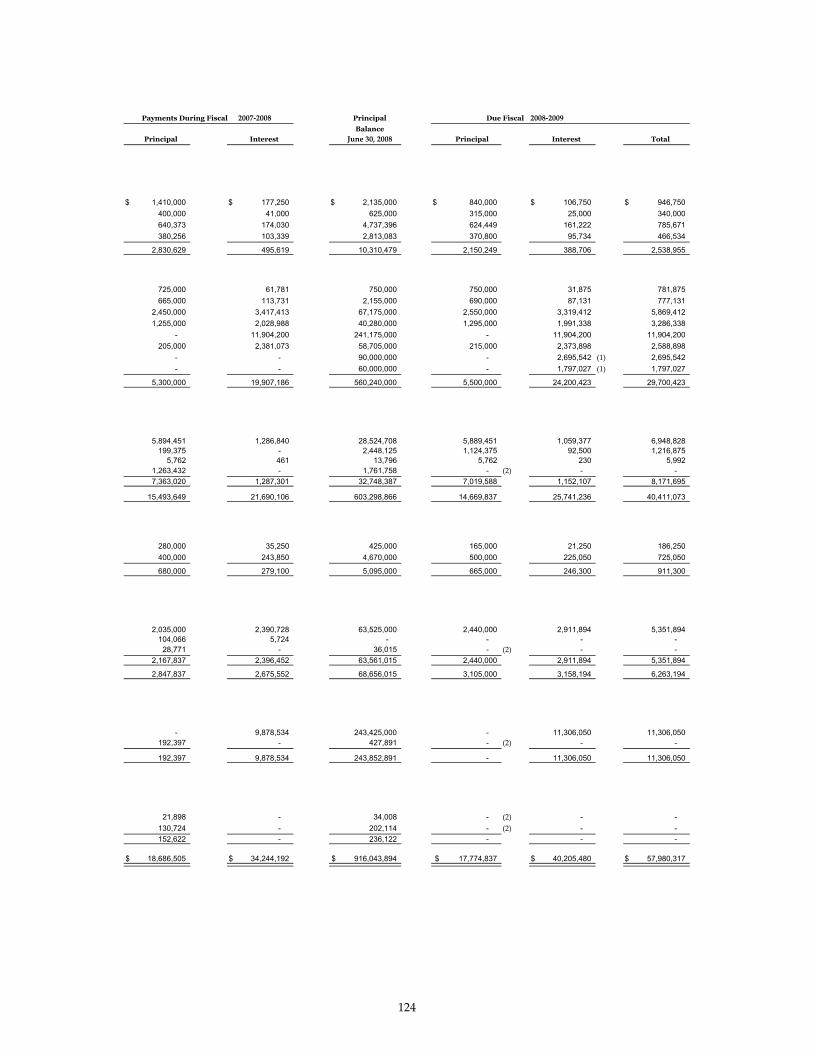
Payments During Fiscal Principal Due Fiscal
Balance
Principal Interest Principal Interest Total
$ 1,410,000 $ 177,250 $ 2,135,000 $ 840,000 $ 106,750 $ 946,750 400,000 41,000 625,000 315,000 25,000 340,000 640,373 174,030 4,737,396 624,449 161,222 785,671 380,256 103,339 2,813,083 370,800 95,734 466,534
2,830,629 495,619 10,310,479 2,150,249 388,706 2,538,955
725,000 61,781 750,000 750,000 31,875 781,875 665,000 113,731 2,155,000 690,000 87,131 777,131
2,450,000 3,417,413 67,175,000 2,550,000 3,319,412 5,869,412 1,255,000 2,028,988 40,280,000 1,295,000 1,991,338 3,286,338
- 11,904,200 241,175,000 - 11,904,200 11,904,200 205,000 2,381,073 58,705,000 215,000 2,373,898 2,588,898
- - 90,000,000 - 2,695,542 2,695,542 - - 60,000,000 - 1,797,027 1,797,027
5,300,000 19,907,186 560,240,000 5,500,000 24,200,423 29,700,423
5,894,451 1,286,840 28,524,708 5,889,451 1,059,377 6,948,828 199,375 - 2,448,125 1,124,375 92,500 1,216,875
5,762 461 13,796 5,762 230 5,992 1,263,432 - 1,761,758 - - - 7,363,020 1,287,301 32,748,387 7,019,588 1,152,107 8,171,695
15,493,649 21,690,106 603,298,866 14,669,837 25,741,236 40,411,073
280,000 35,250 425,000 165,000 21,250 186,250 400,000 243,850 4,670,000 500,000 225,050 725,050
680,000 279,100 5,095,000 665,000 246,300 911,300
2,035,000 2,390,728 63,525,000 2,440,000 2,911,894 5,351,894 104,066 5,724 - - - -
28,771 - 36,015 - - - 2,167,837 2,396,452 63,561,015 2,440,000 2,911,894 5,351,894
2,847,837 2,675,552 68,656,015 3,105,000 3,158,194 6,263,194
- 9,878,534 243,425,000 - 11,306,050 11,306,050 192,397 - 427,891 - - -
192,397 9,878,534 243,852,891 - 11,306,050 11,306,050
21,898 - 34,008 - - - 130,724 - 202,114 - - - 152,622 - 236,122 - - -
$ 18,686,505 $ 34,244,192 $ 916,043,894 $ 17,774,837 $ 40,205,480 $ 57,980,317
124

SCHEDULE OF INTERNAL SERVICE LONG-TERM OBLIGATIONS
Date
Interest ofDescription Rate Issue
EQUIPMENT INTERNAL SERVICE LONG-TERM OBLIGATIONS PAYABLE
CERTIFICATES OF PARTICIPATION
Equipment Acquisition Project, Series 3.00 - 5.00 10/26/05 $ 16,135,000 $ - Equipment Acquisition Project, Schedule 4.16 06/28/07 16,134,215 - Equipment Acquisition Project, Schedule 4.16 0628/07 4,500,000 -
Total Certificates of Participation 36,769,215 -
OTHER INTERNAL SERVICE
LONG-TERM OBLIGATIONS
Earned Vacation Pay - Print Shop 10,914 8,265 Earned Vacation Pay - Risk Management 21,778 14,350 Earned Vacation Pay - Vehicle Fleet Services 207,864 144,803 Total Other Internal Service Long-Term Obligations 240,556 167,418 Total Internal Service Long-Term Obligations $ 37,009,771 $ 167,418
Note:
The amount of vacation pay to be paid in any fiscal year cannot be determined.
Principal
Balance
Issued
DuringYear
125

Payments During Fiscal Due Fiscal
$ 5,380,000 $ 669,725 $ 10,755,000 $ 5,380,000 $ 421,425 $ 5,801,425 3,226,843 671,183 12,907,372 3,226,843 536,947 3,763,790
900,000 187,200 3,600,000 900,000 149,760 1,049,760
9,506,843 1,528,108 27,262,372 9,506,843 1,108,132 10,614,975
6,539 - 12,640 - - - 19,156 - 16,972 - - -
138,972 - 213,695 - - - 164,667 - 243,307 - - -
$ 9,671,510 $ 1,528,108 $ 27,505,679 $ 9,506,843 $ 1,108,132 $ 10,614,975
Interest Total
Principal
BalancePrincipalPrincipal Interest
126

CITY OF RALEIGH
2008

ST
AT
IST
ICA
LS
EC
TIO
N
STAT I S T I C A L SE C T I O N
The Statistical Section presents detailed informationon financial trends, revenue capacity, debt capacity,demographic and economic information, and operatinginformation as a context for understanding what theinformation in the financial statements, note disclosures,and required supplementary information says about theCity's overall financial health.


CITY OF RALEIGH
2008
STATISTICAL SCHEDULES

NET ASSETS BY COMPONENTLAST SEVEN FISCAL YEARS
Governmental activitiesInvested in capital assets, net of related debt 434,696$ 449,699$ Restricted 44,397 46,376 Unrestricted 143,001 128,885
Total governmental activities net assets 622,094 624,960
Business-type activitiesInvested in capital assets, net of related debt 404,642 417,486 Restricted - - Unrestricted 84,119 88,157
Total business-type activities net assets 488,761 505,643
Total governmentInvested in capital assets, net of related debt 839,338 867,185 Restricted 44,397 46,376 Unrestricted 227,120 217,042
Total government net assets 1,110,855$ 1,130,603$
Note:
The City began to report government-wide accrual information with the implementation of GASB Statement in fiscal year
Fiscal Year
127

463,753$ 440,349$ 455,991$ 462,286$ 493,738$ 65,539 76,234 96,224 120,362 113,337
123,379 131,575 131,896 156,309 163,270652,671 648,158 684,111 738,957 770,345
435,295 514,326 584,402 662,101 701,221 - - - - -
68,243 75,199 90,117 79,776 88,288 503,538 589,525 674,519 741,877 789,509
899,048 954,675 1,040,393 1,124,387 1,194,959 65,539 76,234 96,224 120,362 113,337
191,622 206,774 222,013 236,085 251,558 1,156,209$ 1,237,683$ 1,358,630$ 1,480,834$ 1,559,854$
Fiscal Year
128
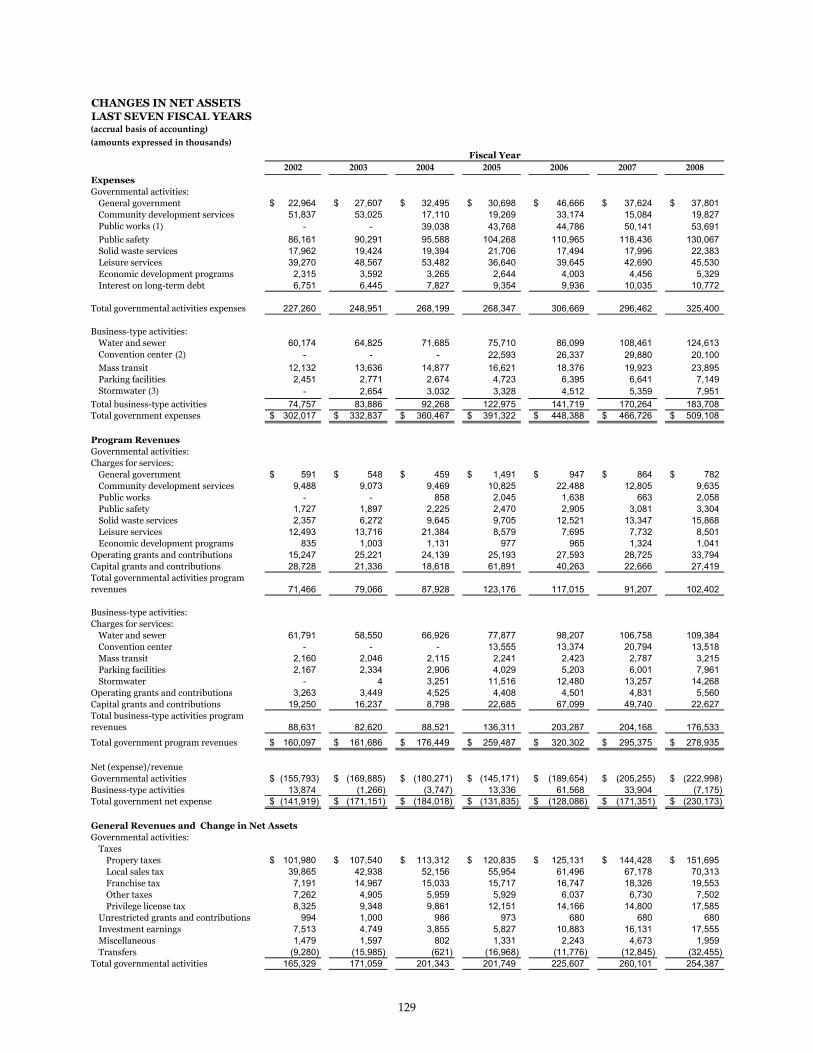
CHANGES IN NET ASSETSLAST SEVEN FISCAL YEARS
ExpensesGovernmental activities:
General government 22,964$ 27,607$ 32,495$ 30,698$ 46,666$ 37,624$ 37,801$ Community development services 51,837 53,025 17,110 19,269 33,174 15,084 19,827 Public works - - 39,038 43,768 44,786 50,141 53,691 Public safety 86,161 90,291 95,588 104,268 110,965 118,436 130,067 Solid waste services 17,962 19,424 19,394 21,706 17,494 17,996 22,383 Leisure services 39,270 48,567 53,482 36,640 39,645 42,690 45,530 Economic development programs 2,315 3,592 3,265 2,644 4,003 4,456 5,329 Interest on long-term debt 6,751 6,445 7,827 9,354 9,936 10,035 10,772
Total governmental activities expenses 227,260 248,951 268,199 268,347 306,669 296,462 325,400
Business-type activities:Water and sewer 60,174 64,825 71,685 75,710 86,099 108,461 124,613 Convention center - - - 22,593 26,337 29,880 20,100 Mass transit 12,132 13,636 14,877 16,621 18,376 19,923 23,895 Parking facilities 2,451 2,771 2,674 4,723 6,395 6,641 7,149 Stormwater - 2,654 3,032 3,328 4,512 5,359 7,951
Total business-type activities 74,757 83,886 92,268 122,975 141,719 170,264 183,708 Total government expenses 302,017$ 332,837$ 360,467$ 391,322$ 448,388$ 466,726$ 509,108$
Program RevenuesGovernmental activities:Charges for services:
General government 591$ 548$ 459$ 1,491$ 947$ 864$ 782$ Community development services 9,488 9,073 9,469 10,825 22,488 12,805 9,635 Public works - - 858 2,045 1,638 663 2,058 Public safety 1,727 1,897 2,225 2,470 2,905 3,081 3,304 Solid waste services 2,357 6,272 9,645 9,705 12,521 13,347 15,868 Leisure services 12,493 13,716 21,384 8,579 7,695 7,732 8,501 Economic development programs 835 1,003 1,131 977 965 1,324 1,041
Operating grants and contributions 15,247 25,221 24,139 25,193 27,593 28,725 33,794 Capital grants and contributions 28,728 21,336 18,618 61,891 40,263 22,666 27,419 Total governmental activities program revenues 71,466 79,066 87,928 123,176 117,015 91,207 102,402
Business-type activities:Charges for services:
Water and sewer 61,791 58,550 66,926 77,877 98,207 106,758 109,384 Convention center - - - 13,555 13,374 20,794 13,518 Mass transit 2,160 2,046 2,115 2,241 2,423 2,787 3,215 Parking facilities 2,167 2,334 2,906 4,029 5,203 6,001 7,961 Stormwater - 4 3,251 11,516 12,480 13,257 14,268
Operating grants and contributions 3,263 3,449 4,525 4,408 4,501 4,831 5,560 Capital grants and contributions 19,250 16,237 8,798 22,685 67,099 49,740 22,627 Total business-type activities program revenues 88,631 82,620 88,521 136,311 203,287 204,168 176,533
Total government program revenues 160,097$ 161,686$ 176,449$ 259,487$ 320,302$ 295,375$ 278,935$
Net (expense)/revenueGovernmental activities (155,793)$ (169,885)$ (180,271)$ (145,171)$ (189,654)$ (205,255)$ (222,998)$ Business-type activities 13,874 (1,266) (3,747) 13,336 61,568 33,904 (7,175) Total government net expense (141,919)$ (171,151)$ (184,018)$ (131,835)$ (128,086)$ (171,351)$ (230,173)$
General Revenues and Change in Net AssetsGovernmental activities:
TaxesPropery taxes 101,980$ 107,540$ 113,312$ 120,835$ 125,131$ 144,428$ 151,695$ Local sales tax 39,865 42,938 52,156 55,954 61,496 67,178 70,313 Franchise tax 7,191 14,967 15,033 15,717 16,747 18,326 19,553 Other taxes 7,262 4,905 5,959 5,929 6,037 6,730 7,502 Privilege license tax 8,325 9,348 9,861 12,151 14,166 14,800 17,585
Unrestricted grants and contributions 994 1,000 986 973 680 680 680 Investment earnings 7,513 4,749 3,855 5,827 10,883 16,131 17,555 Miscellaneous 1,479 1,597 802 1,331 2,243 4,673 1,959 Transfers (9,280) (15,985) (621) (16,968) (11,776) (12,845) (32,455)
Total governmental activities 165,329 171,059 201,343 201,749 225,607 260,101 254,387
Fiscal Year
129

CHANGES IN NET ASSETSLAST SEVEN FISCAL YEARS
Fiscal Year
Business-type activities:Investment earnings 4,103$ 2,161$ 1,021$ 7,089$ 11,650$ 20,609$ 17,770$ Transfers 9,280 15,986 621 16,968 11,776 12,845 32,455
Special item, loss on capital asset impairment - - - (12,498) - - - Total business-type activities 13,383 18,147 1,642 11,559 23,426 33,454 50,225 Total government general revenues 178,712$ 189,206$ 202,985$ 213,308$ 249,033$ 293,555$ 304,612$
Change in Net AssetsGovernmental activities 9,537$ 1,174$ 21,072$ 56,578$ 35,953$ 54,846$ 31,389$ Business-type activities 27,257 16,881 (2,105) 24,895 84,994 67,358 43,051
Total government change in net assets 36,794$ 18,055$ 18,967$ 81,473$ 120,947$ 122,204$ 74,440$
Notes:The City began to report government-wide accrual information with the implementation of GASB Statement in FY .
The public works function was established during FY . Prior to , the public works divisons were part of the community
development services function.
The City began reporting the convention center operations as an enterprise fund effective FY Prior to that, the operations
were included as part of the City's general fund.
The City began stormwater operations in FY .
130
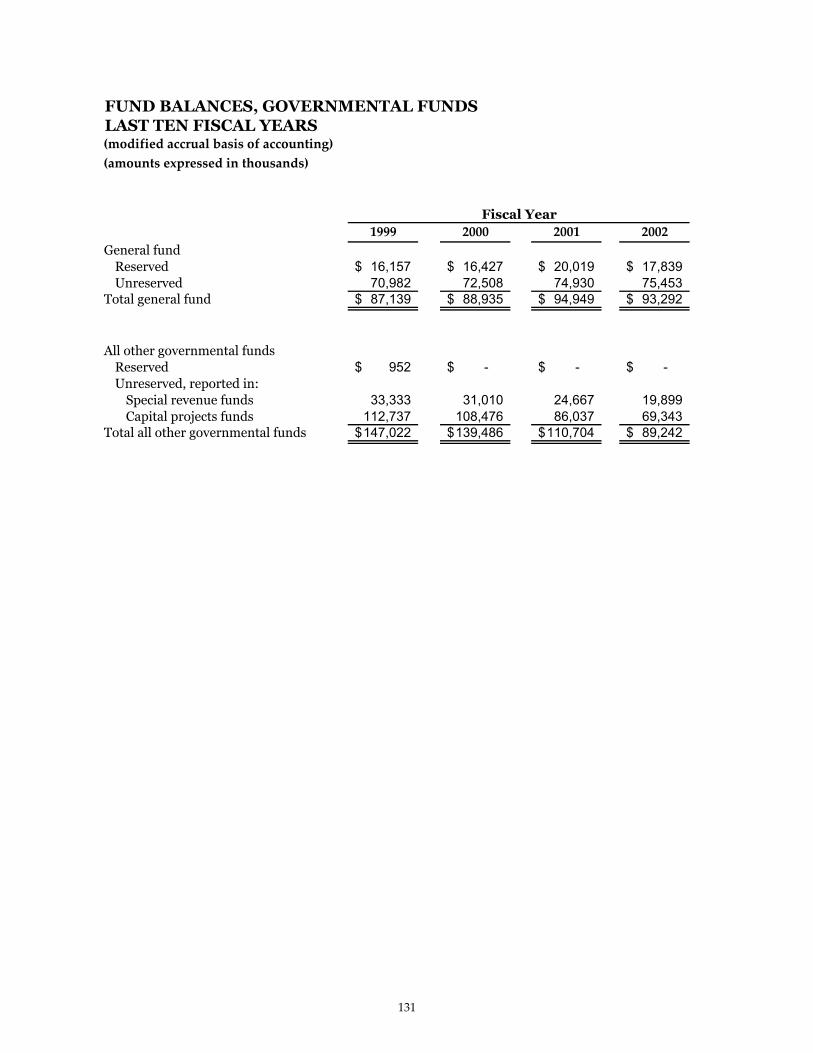
FUND BALANCES, GOVERNMENTAL FUNDSLAST TEN FISCAL YEARS
General fundReserved 16,157$ 16,427$ 20,019$ 17,839$ Unreserved 70,982 72,508 74,930 75,453
Total general fund 87,139$ 88,935$ 94,949$ 93,292$
All other governmental fundsReserved 952$ -$ -$ -$ Unreserved, reported in:
Special revenue funds 33,333 31,010 24,667 19,899 Capital projects funds 112,737 108,476 86,037 69,343
Total all other governmental funds 147,022$ 139,486$ 110,704$ 89,242$
Fiscal Year
131
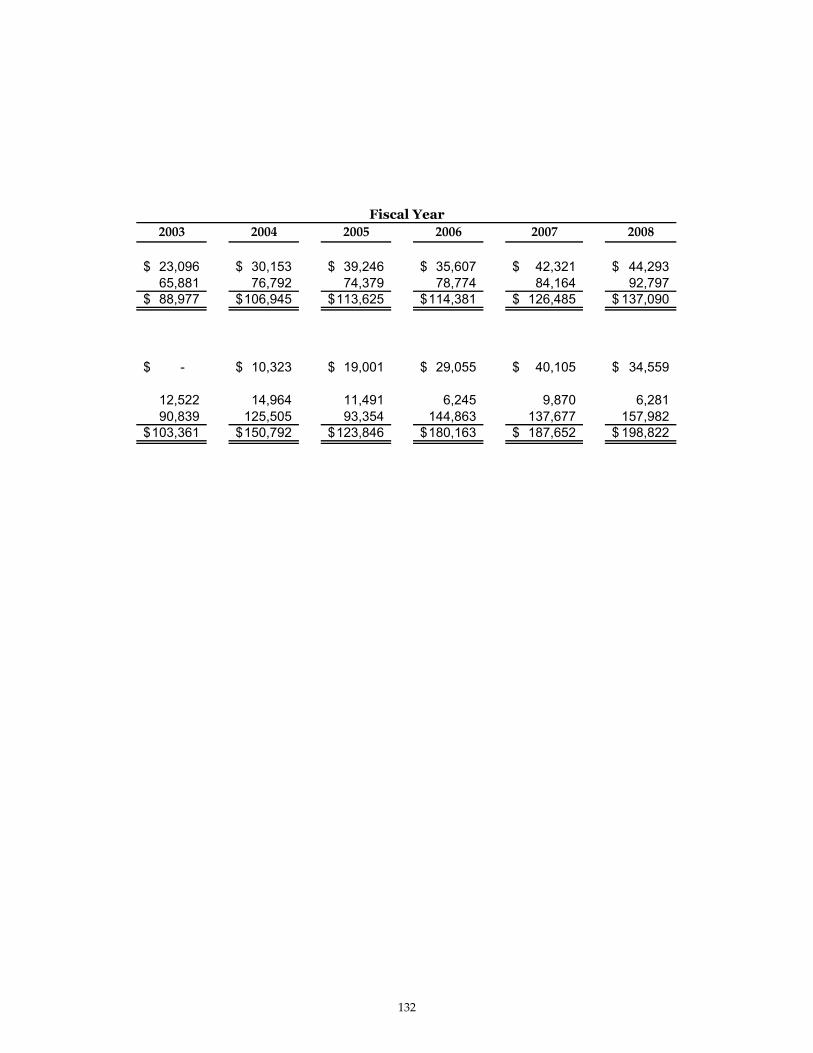
23,096$ 30,153$ 39,246$ 35,607$ 42,321$ 44,293$ 65,881 76,792 74,379 78,774 84,164 92,797 88,977$ 106,945$ 113,625$ 114,381$ 126,485$ 137,090$
-$ 10,323$ 19,001$ 29,055$ 40,105$ 34,559$
12,522 14,964 11,491 6,245 9,870 6,281 90,839 125,505 93,354 144,863 137,677 157,982
103,361$ 150,792$ 123,846$ 180,163$ 187,652$ 198,822$
Fiscal Year
132

CHANGES IN FUND BALANCES, GOVERNMENTAL FUNDSLAST TEN FISCAL YEARS
RevenuesAd valorem taxes 83,734$ 88,301$ 96,360$ 102,134$ 107,415$ Intergovernmental 35,433 47,111 42,861 30,314 46,177 Developer participation 284 2,038 279 650 305 Assessments - - 403 371 494 Local sales tax 39,304 40,599 42,522 39,865 42,938 Licenses 6,902 7,188 7,924 8,325 9,347 Interest on investments 11,555 13,292 14,598 6,932 4,417 Inspections 6,465 6,862 7,750 7,114 8,274 Highway maintenance refunds 719 797 748 1,048 627 Facility fees 4,291 4,194 5,717 3,427 3,586 Other fees and charges 16,589 18,318 18,031 18,422 21,866 Rents 257 313 336 344 238 Program income - - - 2,293 2,397 Other revenues 11,319 19,870 9,806 5,125 1,947 Miscellaneous - - - - 4,639
Total revenues 216,852 248,883 247,335 226,364 254,667
ExpendituresGeneral government 39,472 24,566 27,199 28,528 30,547 Community development services 26,312 43,927 39,993 37,531 40,791 Public works - - - - - Public safety 51,791 70,353 78,845 84,400 91,498 Solid waste services 13,052 14,824 16,547 17,337 19,852 Leisure services 22,593 27,339 29,339 31,979 41,683 Economic development programs 3,875 2,924 3,130 2,315 3,593 Other expenditures 7,721 1,207 600 186 72 Capital outlay 37,991 48,299 55,889 45,233 37,948 Debt service
Principal 7,890 11,494 9,996 16,115 10,889 Interest 5,980 6,805 6,275 - 5,680 Capital leases, including interest 2,569 - - - - Other debt service charges 136 - 59 169 265
Total expenditures 219,382 251,738 267,872 263,793 282,818 Less: Administrative costs charged
to water and sewer (5,260) (5,580) (6,414) (7,060) (8,902) Total expenditures 214,122 246,158 261,458 256,733 273,916
Other financing sources (uses)Transfers in 25,483 27,145 29,534 29,472 16,102 Transfers out (31,363) (35,565) (38,077) (34,479) (32,967) Proceeds from borrowing 27,323 769 8 9,804 45,919 Proceeds from refunding 6,740 - - - 15,380 Payments to escrow agent (6,740) - - - (15,380) Sale of capital assets - - - 2,452 -
Total other financing sources (uses) 21,443 (7,651) (8,535) 7,249 29,054
Net change in fund balances 24,173$ (4,926)$ (22,658)$ (23,120)$ 9,805$
Debt service as a percentage of noncapital expenditures 7.87% 9.25% 7.92% 7.64% 7.00%
Capital outlay component of ratio calculation included as follows:
- capital outlay expenditure line item as per above
- capital outlay as per reconciliation of statement of revenues, expenditures, and changes in
fund balances of governental funds to the statement of activities
Fiscal Year
133
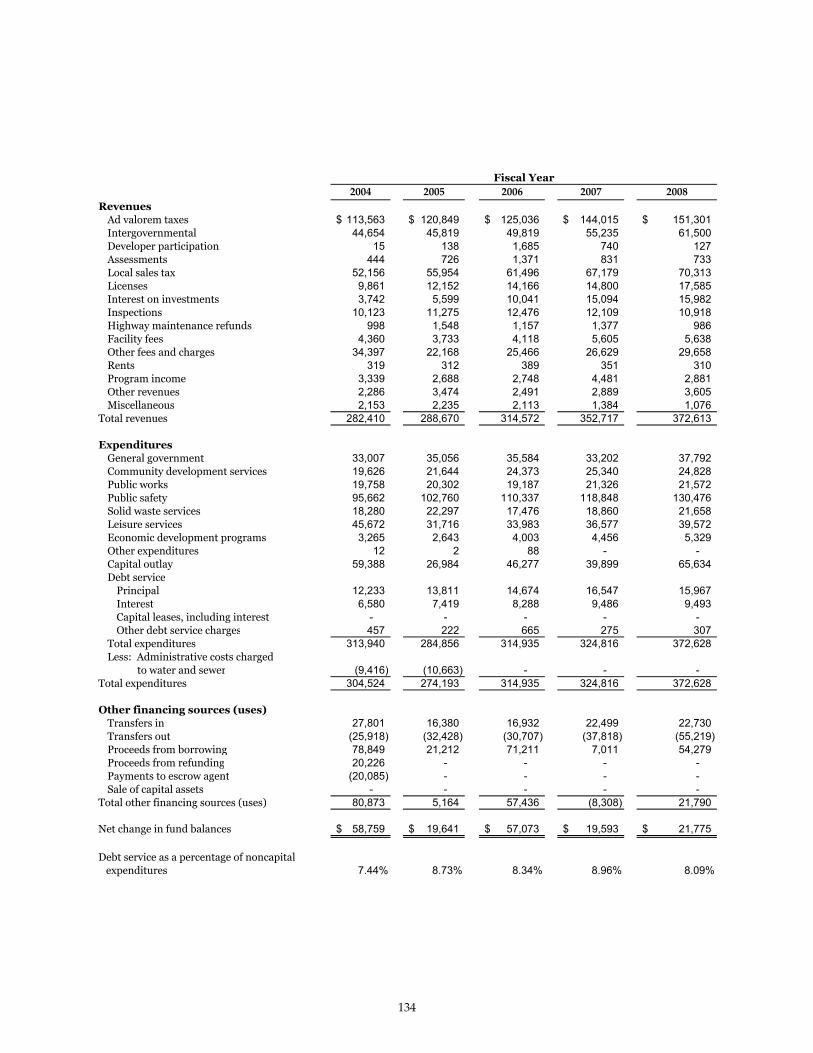
RevenuesAd valorem taxesIntergovernmentalDeveloper participationAssessmentsLocal sales taxLicensesInterest on investmentsInspectionsHighway maintenance refundsFacility feesOther fees and chargesRentsProgram incomeOther revenuesMiscellaneous
Total revenues
ExpendituresGeneral governmentCommunity development servicesPublic worksPublic safetySolid waste servicesLeisure servicesEconomic development programsOther expendituresCapital outlay Debt service
PrincipalInterestCapital leases, including interestOther debt service charges
Total expendituresLess: Administrative costs charged
to water and sewerTotal expenditures
Other financing sources (uses)Transfers inTransfers outProceeds from borrowingProceeds from refundingPayments to escrow agentSale of capital assets
Total other financing sources (uses)
Net change in fund balances
Debt service as a percentage of noncapital expenditures
113,563$ 120,849$ 125,036$ 144,015$ 151,301$ 44,654 45,819 49,819 55,235 61,500
15 138 1,685 740 127444 726 1,371 831 733
52,156 55,954 61,496 67,179 70,313 9,861 12,152 14,166 14,800 17,585 3,742 5,599 10,041 15,094 15,982
10,123 11,275 12,476 12,109 10,918 998 1,548 1,157 1,377 986
4,360 3,733 4,118 5,605 5,638 34,397 22,168 25,466 26,629 29,658
319 312 389 351 310 3,339 2,688 2,748 4,481 2,881 2,286 3,474 2,491 2,889 3,605 2,153 2,235 2,113 1,384 1,076
282,410 288,670 314,572 352,717 372,613
33,007 35,056 35,584 33,202 37,792 19,626 21,644 24,373 25,340 24,828 19,758 20,302 19,187 21,326 21,572 95,662 102,760 110,337 118,848 130,476 18,280 22,297 17,476 18,860 21,658 45,672 31,716 33,983 36,577 39,572 3,265 2,643 4,003 4,456 5,329
12 2 88 - - 59,388 26,984 46,277 39,899 65,634
12,233 13,811 14,674 16,547 15,967 6,580 7,419 8,288 9,486 9,493
- - - - - 457 222 665 275 307
313,940 284,856 314,935 324,816 372,628
(9,416) (10,663) - - - 304,524 274,193 314,935 324,816 372,628
27,801 16,380 16,932 22,499 22,730 (25,918) (32,428) (30,707) (37,818) (55,219) 78,849 21,212 71,211 7,011 54,279 20,226 - - - -
(20,085) - - - - - - - - -
80,873 5,164 57,436 (8,308) 21,790
58,759$ 19,641$ 57,073$ 19,593$ 21,775$
7.44% 8.73% 8.34% 8.96% 8.09%
Fiscal Year
134
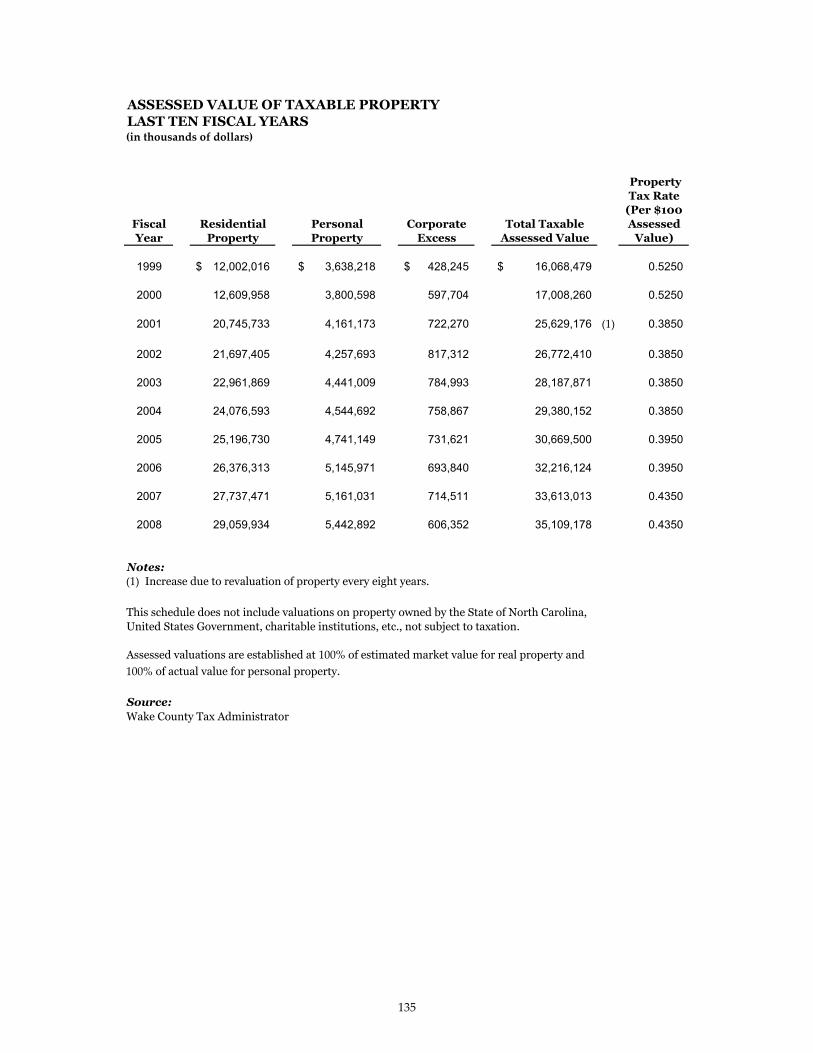
ASSESSED VALUE OF TAXABLE PROPERTYLAST TEN FISCAL YEARS
Fiscal Year
Residential Property
Personal Property
Corporate Excess
Total Taxable Assessed Value
Property Tax Rate
(Per $100 Assessed
Value)
1999 12,002,016$ 3,638,218$ 428,245$ 16,068,479$ 0.5250
2000 12,609,958 3,800,598 597,704 17,008,260 0.5250
2001 20,745,733 4,161,173 722,270 25,629,176 0.3850
2002 21,697,405 4,257,693 817,312 26,772,410 0.3850
2003 22,961,869 4,441,009 784,993 28,187,871 0.3850
2004 24,076,593 4,544,692 758,867 29,380,152 0.3850
2005 25,196,730 4,741,149 731,621 30,669,500 0.3950
2006 26,376,313 5,145,971 693,840 32,216,124 0.3950
2007 27,737,471 5,161,031 714,511 33,613,013 0.4350
2008 29,059,934 5,442,892 606,352 35,109,178 0.4350
Notes: Increase due to revaluation of property every eight years.
This schedule does not include valuations on property owned by the State of North Carolina,United States Government, charitable institutions, etc., not subject to taxation.
Assessed valuations are established at of estimated market value for real property and
of actual value for personal property.
Source: Wake County Tax Administrator
135
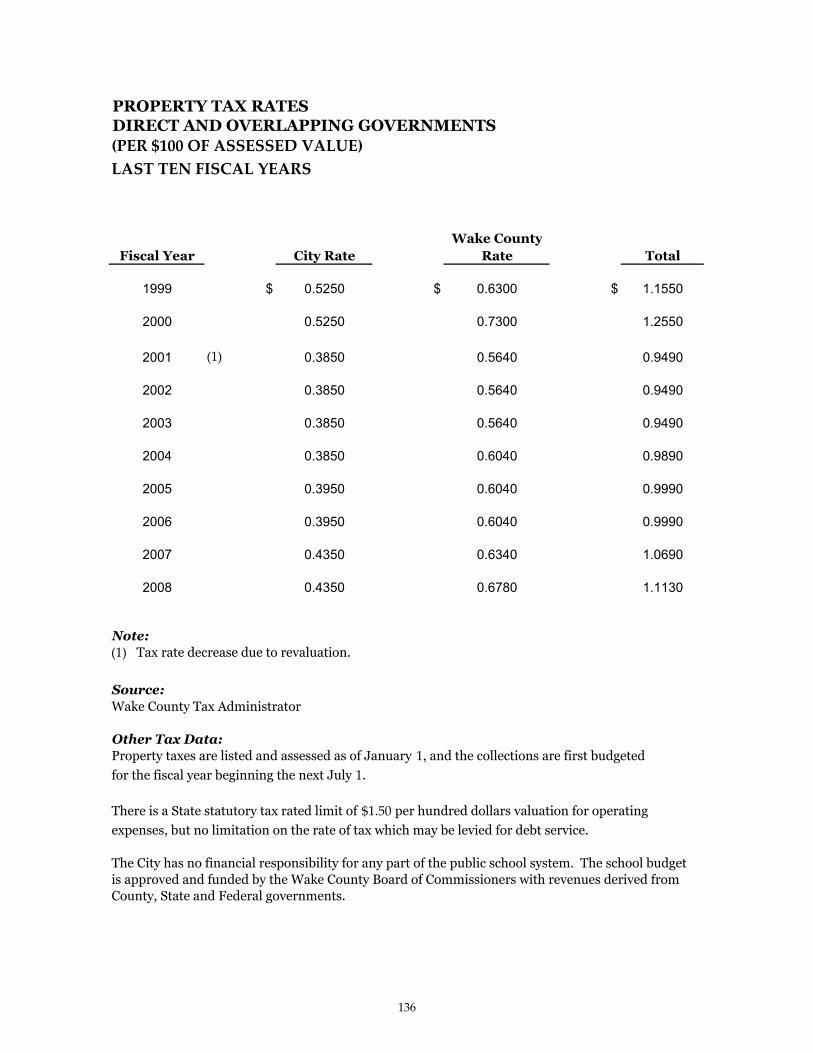
PROPERTY TAX RATESDIRECT AND OVERLAPPING GOVERNMENTS
Wake CountyFiscal Year City Rate Rate Total
1999 $ 0.5250 $ 0.6300 $ 1.1550
2000 0.5250 0.7300 1.2550
2001 0.3850 0.5640 0.9490
2002 0.3850 0.5640 0.9490
2003 0.3850 0.5640 0.9490
2004 0.3850 0.6040 0.9890
2005 0.3950 0.6040 0.9990
2006 0.3950 0.6040 0.9990
2007 0.4350 0.6340 1.0690
2008 0.4350 0.6780 1.1130
Note: Tax rate decrease due to revaluation.
Source: Wake County Tax Administrator
Other Tax Data:Property taxes are listed and assessed as of January , and the collections are first budgeted
for the fiscal year beginning the next July .
There is a State statutory tax rated limit of per hundred dollars valuation for operating
expenses, but no limitation on the rate of tax which may be levied for debt service.
The City has no financial responsibility for any part of the public school system. The school budgetis approved and funded by the Wake County Board of Commissioners with revenues derived fromCounty, State and Federal governments.
136
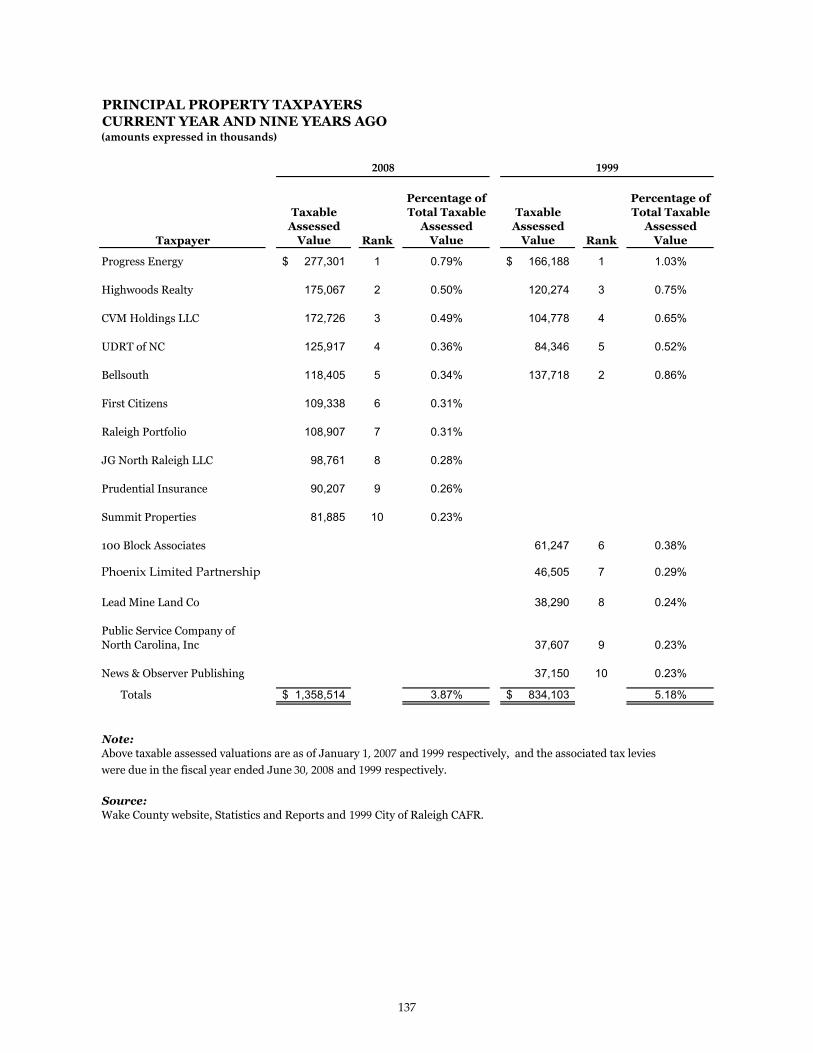
PRINCIPAL PROPERTY TAXPAYERSCURRENT YEAR AND NINE YEARS AGO
Taxpayer
Taxable Assessed
Value Rank
Percentage of Total Taxable
Assessed Value
Taxable Assessed
Value Rank
Percentage of Total Taxable
Assessed Value
Progress Energy 277,301$ 1 0.79% 166,188$ 1 1.03%
Highwoods Realty 175,067 2 0.50% 120,274 3 0.75%
CVM Holdings LLC 172,726 3 0.49% 104,778 4 0.65%
UDRT of NC 125,917 4 0.36% 84,346 5 0.52%
Bellsouth 118,405 5 0.34% 137,718 2 0.86%
First Citizens 109,338 6 0.31%
Raleigh Portfolio 108,907 7 0.31%
JG North Raleigh LLC 98,761 8 0.28%
Prudential Insurance 90,207 9 0.26%
Summit Properties 81,885 10 0.23%
100 Block Associates 61,247 6 0.38%
46,505 7 0.29%
Lead Mine Land Co 38,290 8 0.24%
Public Service Company of North Carolina, Inc 37,607 9 0.23%
News & Observer Publishing 37,150 10 0.23%
Totals 1,358,514$ 3.87% 834,103$ 5.18%
Note:Above taxable assessed valuations are as of January and respectively, and the associated tax levies
were due in the fiscal year ended June and respectively.
Source:Wake County website, Statistics and Reports and City of Raleigh CAFR.
137
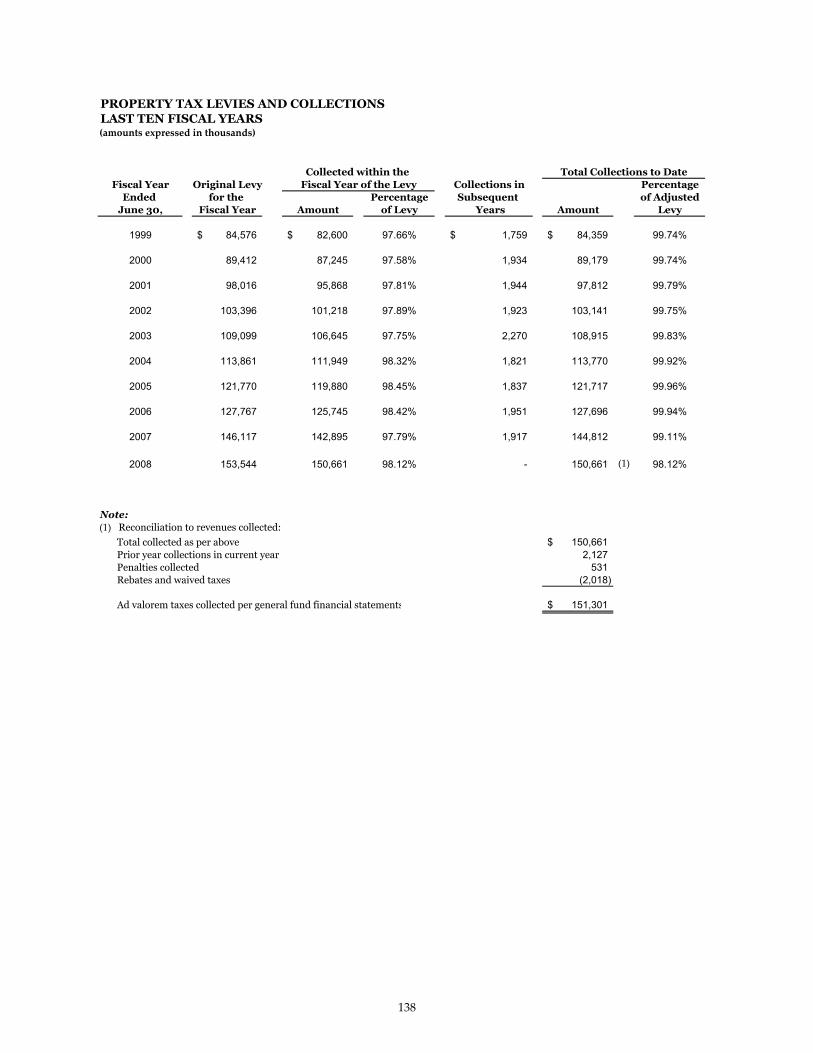
PROPERTY TAX LEVIES AND COLLECTIONSLAST TEN FISCAL YEARS
Fiscal Year Original Levy Collections in PercentageEnded for the Percentage Subsequent of Adjusted
June 30, Fiscal Year Amount of Levy Years Amount Levy
1999 84,576$ 82,600$ 97.66% 1,759$ 84,359$ 99.74%
2000 89,412 87,245 97.58% 1,934 89,179 99.74%
2001 98,016 95,868 97.81% 1,944 97,812 99.79%
2002 103,396 101,218 97.89% 1,923 103,141 99.75%
2003 109,099 106,645 97.75% 2,270 108,915 99.83%
2004 113,861 111,949 98.32% 1,821 113,770 99.92%
2005 121,770 119,880 98.45% 1,837 121,717 99.96%
2006 127,767 125,745 98.42% 1,951 127,696 99.94%
2007 146,117 142,895 97.79% 1,917 144,812 99.11%
2008 153,544 150,661 98.12% - 150,661 98.12%
Note: Reconciliation to revenues collected:
Total collected as per above 150,661$ Prior year collections in current year 2,127 Penalties collected 531 Rebates and waived taxes (2,018)
Ad valorem taxes collected per general fund financial statements 151,301$
Fiscal Year of the LevyCollected within the Total Collections to Date
138
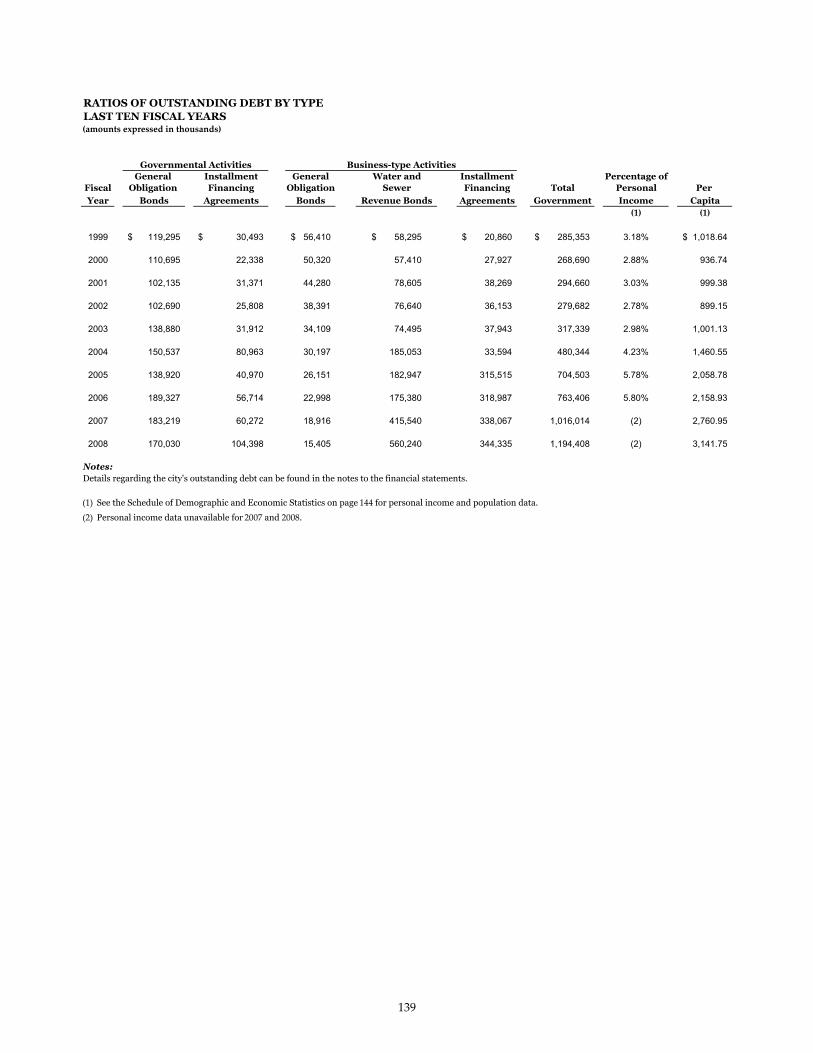
RATIOS OF OUTSTANDING DEBT BY TYPELAST TEN FISCAL YEARS
General Installment General Water and Installment Percentage of Fiscal Obligation Financing Obligation Sewer Financing Total Personal Per
Year Bonds Agreements Bonds Revenue Bonds Agreements Government Income Capita
1999 119,295$ 30,493$ 56,410$ 58,295$ 20,860$ 285,353$ 3.18% 1,018.64$
2000 110,695 22,338 50,320 57,410 27,927 268,690 2.88% 936.74
2001 102,135 31,371 44,280 78,605 38,269 294,660 3.03% 999.38
2002 102,690 25,808 38,391 76,640 36,153 279,682 2.78% 899.15
2003 138,880 31,912 34,109 74,495 37,943 317,339 2.98% 1,001.13
2004 150,537 80,963 30,197 185,053 33,594 480,344 4.23% 1,460.55
2005 138,920 40,970 26,151 182,947 315,515 704,503 5.78% 2,058.78
2006 189,327 56,714 22,998 175,380 318,987 763,406 5.80% 2,158.93
2007 183,219 60,272 18,916 415,540 338,067 1,016,014 (2) 2,760.95
2008 170,030 104,398 15,405 560,240 344,335 1,194,408 (2) 3,141.75
Notes: Details regarding the city's outstanding debt can be found in the notes to the financial statements.
See the Schedule of Demographic and Economic Statistics on page for personal income and population data.
Personal income data unavailable for and .
Business-type ActivitiesGovernmental Activities
139

RATIOS OF GENERAL BONDED DEBT OUTSTANDINGLAST TEN FISCAL YEARS
Percentage General Net Actual Taxable
Fiscal Bonded Bonded Value ofYear Debt Debt Property Gross Net
1999 175,705$ 161,511$ 1.09% 627$ 577$
2000 161,015 148,659 0.95% 561 518
2001 146,415 135,390 0.57% 497 459
2002 142,040 132,374 0.53% 457 426
2003 173,820 165,324 0.62% 548 522
2004 182,795 174,787 0.62% 556 531
2005 166,890 159,550 0.54% 488 466
2006 212,325 204,883 0.66% 600 579
2007 202,135 194,600 0.60% 549 529
2008 185,435 178,953 0.53% 488 471
Notes:
Details regarding the city's outstanding debt can be found in the notes to the financial statements.
Total includes all general obligation bonded debt.
Represents gross bonded debt less allowable statutory deductions.
See Assessed Value of Taxable Property schedule on page for property value data.
See Demographic and Economic Statistics schedule on page for population data.
Per CapitaBonded Debt
140

DIRECT AND OVERLAPPING GOVERNMENTAL ACTIVITIES DEBTAs of June 30, 2008
Percentage City'sBonded Applicable Share of
Debt to City Debt
274,427$ 100.00% 274,427$
1,434,595 42.24% 605,973
1,709,022$ 880,400$
Notes:
This total includes all governmental activities debt.
Overlapping debt does not include the debt of the Special Airport Tax District of Durham and
Wake Counties as these bonds are payable by the Airport Authority out of airport revenues.
This total includes of Wake County School Bonds.
Percentage of direct and overlapping debt is based on assessed valuation of the
City of Raleigh as compared to the assessed valuation of
Wake County
141
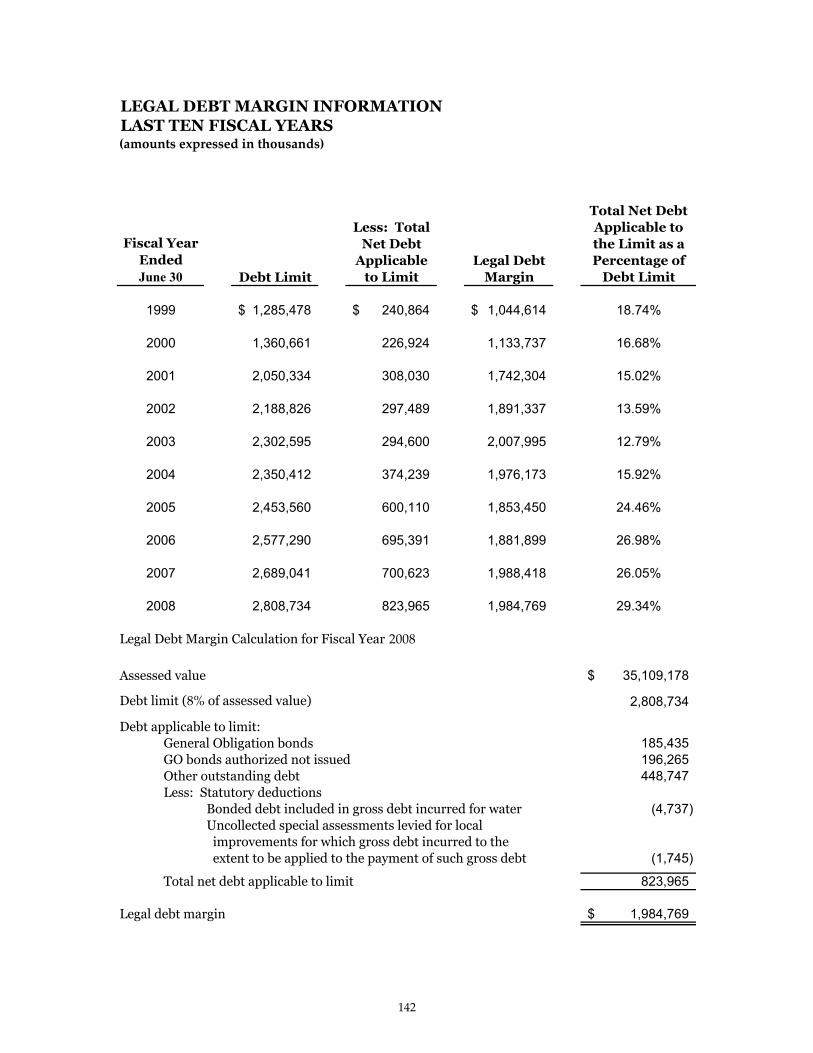
LEGAL DEBT MARGIN INFORMATIONLAST TEN FISCAL YEARS
Fiscal Year Ended June 30 Debt Limit
Less: Total Net Debt
Applicable to Limit
Legal Debt Margin
Total Net Debt Applicable to the Limit as a Percentage of
Debt Limit
1999 1,285,478$ 240,864$ 1,044,614$ 18.74%
2000 1,360,661 226,924 1,133,737 16.68%
2001 2,050,334 308,030 1,742,304 15.02%
2002 2,188,826 297,489 1,891,337 13.59%
2003 2,302,595 294,600 2,007,995 12.79%
2004 2,350,412 374,239 1,976,173 15.92%
2005 2,453,560 600,110 1,853,450 24.46%
2006 2,577,290 695,391 1,881,899 26.98%
2007 2,689,041 700,623 1,988,418 26.05%
2008 2,808,734 823,965 1,984,769 29.34%
Legal Debt Margin Calculation for Fiscal Year
Assessed value 35,109,178$
Debt limit ( of assessed value) 2,808,734
Debt applicable to limit:General Obligation bonds 185,435 GO bonds authorized not issued 196,265 Other outstanding debt 448,747 Less: Statutory deductions
Bonded debt included in gross debt incurred for water (4,737) Uncollected special assessments levied for local improvements for which gross debt incurred to the extent to be applied to the payment of such gross debt (1,745)
Total net debt applicable to limit 823,965
Legal debt margin 1,984,769$
142

PLEDGED REVENUE COVERAGELAST TEN FISCAL YEARS
Fiscal of PY Net Revenue Debt Service Requirements ( and )
Year Gross Unrestricted Operating Available for Net RequiredEnded Revenues Net Assets Expenses Debt Service Principal Interest Total Coverage With Coverage
Parity Debt Service Coverage
1999 $ 51,092,288 $ $ 28,833,598 $ 22,258,690 $ 1,105,000 $ 2,113,547 $ 3,218,547 6.92 1.25
2000 53,442,428 32,760,930 20,681,498 1,135,000 3,232,702 4,367,702 4.74 1.25
2001 57,337,535 36,870,339 20,467,196 1,725,000 3,012,533 4,737,533 4.32 1.25
2002 63,911,622 42,112,440 21,799,182 2,215,000 4,140,667 6,355,667 3.43 1.25
2003 59,832,587 46,909,635 12,922,952 2,395,000 3,874,439 6,269,439 2.06 1.25
2004 67,830,623 9,598,225 51,521,220 16,309,403 2,485,000 3,709,006 6,194,006 2.63 4.18 1.20
2005 79,603,480 8,103,566 52,518,696 27,084,784 2,575,000 3,664,485 6,239,485 4.34 5.64 1.20
2006 101,932,480 5,213,204 61,868,891 40,063,589 3,005,000 8,425,141 11,430,141 3.50 3.96 1.20
2007 114,131,631 11,026,707 72,070,084 42,061,547 5,465,000 12,900,522 18,365,522 2.29 2.89 1.20
2008 114,843,830 10,619,640 83,986,923 30,856,907 5,550,000 8,123,779 13,673,779 2.26 3.03 1.20
All Water and Sewer Debt Service Coverage
1999 $ 51,092,288 $ 28,833,598 $ 22,258,690 $ 6,455,000 $ 4,758,353 $ 11,213,353 1.99 1.00
2000 53,442,428 32,760,930 20,681,498 6,408,051 5,656,737 12,064,788 1.71 1.00
2001 57,337,535 36,870,339 20,467,196 7,093,051 5,279,894 12,372,945 1.65 1.00
2002 63,911,622 42,112,440 21,799,182 7,378,051 6,364,756 13,742,807 1.59 1.00
2003 59,832,587 46,909,635 12,922,952 7,165,851 5,682,828 12,848,679 1.01 1.00
2004 67,830,623 51,521,220 16,309,403 6,974,451 5,165,065 12,139,516 1.34 1.00
2005 79,603,480 52,518,696 27,084,784 7,139,537 4,968,531 12,108,068 2.24 1.00
2006 101,932,480 61,868,891 40,063,589 7,687,724 9,551,078 17,238,802 2.32 1.00
2007 114,131,631 72,070,084 42,061,547 10,051,834 13,877,155 23,928,989 1.76 1.00
2008 114,843,830 83,986,923 30,856,907 9,655,080 8,935,545 18,590,625 1.66 1.00
Notes:
The City issued water and sewer revenue bonds December , January , January , May , October .
Water and sewer user charges and other utiltiy revenues are pledged revenues; operating expenses are exclusive of depreciation and interest expense.
Parity debt service includes interest and principal of revenue bonds and certain State loans.
All water and sewer debt service includes interest and principal of revenue bonds, State loans, and water and sewer general obligation bonds.
The City entered into the First Amendatory Trust Agreement dated April . The first amendment provides that of Water and Sewer
unrestricted net assets as of the last day of the preceding fiscal year be added to gross revenues in computing the net revenue available for debt service. The required coverage for parity indebtedness was also decreased to from
Coverage Ratios
143

DEMOGRAPHIC AND ECONOMIC STATISTICSLAST TEN FISCAL YEARS
Personal PerIncome Capita School
Fiscal (expressed in Personal Enrollment Unemployment Year Population thousands) Income ADM Rate %
1999 280,132 8,979,351 32,054 92,566 1.5
2000 286,834 9,332,718 32,537 94,295 1.6
2001 294,843 9,729,229 32,998 97,348 3.1
2002 311,053 10,044,835 33,293 101,967 5.5
2003 316,979 10,659,053 33,627 107,448 5.2
2004 328,880 11,345,702 34,498 112,158 4.0
2005 342,194 12,190,319 35,624 117,986 4.3
2006 353,604 13,161,494 37,221 120,381 3.5
2007 367,995 Unavailable Unavailable 124,474 3.9
2008 380,173 Unavailable Unavailable 133,228 4.8
Sources: City of Raleigh Planning Department
U.S. Department of Commerce, Bureau of Economic Analysis.
Per capita income for the Raleigh-Cary MSA. Data for and are unavailable.
North Carolina Department of Public Instruction, Statistical Research and Data Center.
ADM = Average daily membership - (final ADM). Includes thirteen charter schools. North Carolina Employment Security Commission.
Estimated percentage of unemployment in Wake County.
144
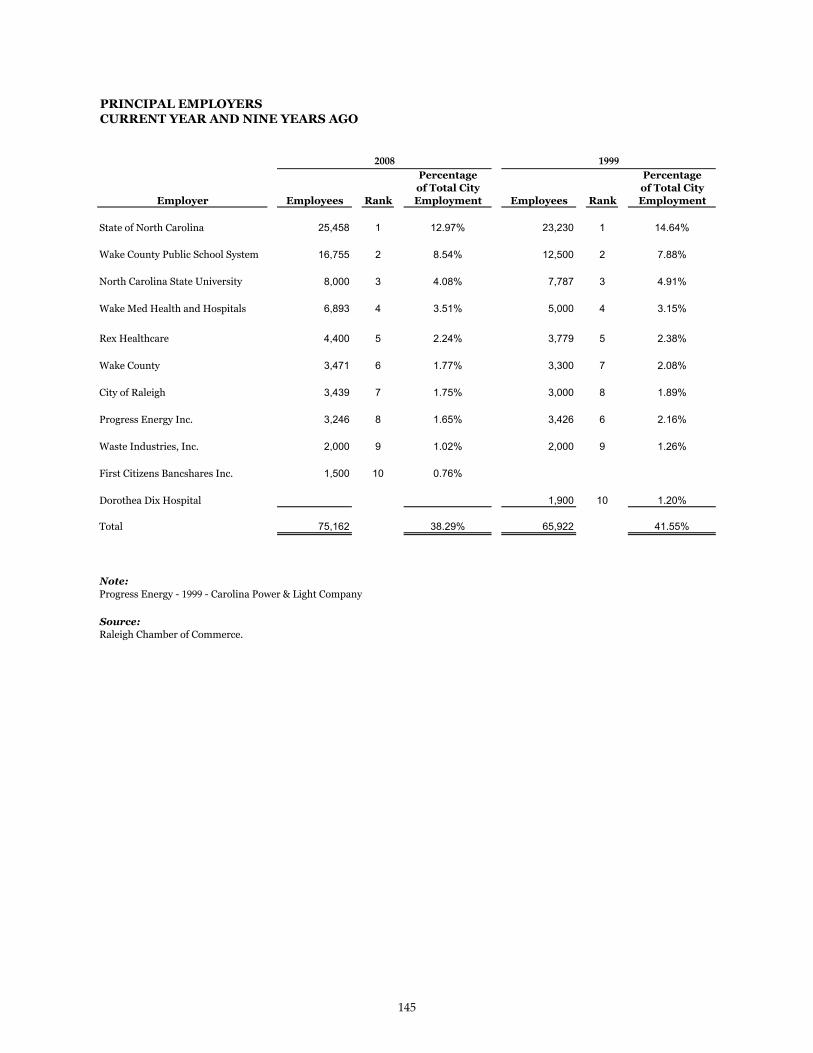
PRINCIPAL EMPLOYERSCURRENT YEAR AND NINE YEARS AGO
Percentage Percentageof Total City of Total City
Employer Employees Rank Employment Employees Rank Employment
State of North Carolina 25,458 1 12.97% 23,230 1 14.64%
Wake County Public School System 16,755 2 8.54% 12,500 2 7.88%
North Carolina State University 8,000 3 4.08% 7,787 3 4.91%
Wake Med Health and Hospitals 6,893 4 3.51% 5,000 4 3.15%
Rex Healthcare 4,400 5 2.24% 3,779 5 2.38%
Wake County 3,471 6 1.77% 3,300 7 2.08%
City of Raleigh 3,439 7 1.75% 3,000 8 1.89%
Progress Energy Inc. 3,246 8 1.65% 3,426 6 2.16%
Waste Industries, Inc. 2,000 9 1.02% 2,000 9 1.26%
First Citizens Bancshares Inc. 1,500 10 0.76%
Dorothea Dix Hospital 1,900 10 1.20%
Total 75,162 38.29% 65,922 41.55%
Note:Progress Energy - - Carolina Power & Light Company
Source:Raleigh Chamber of Commerce.
145
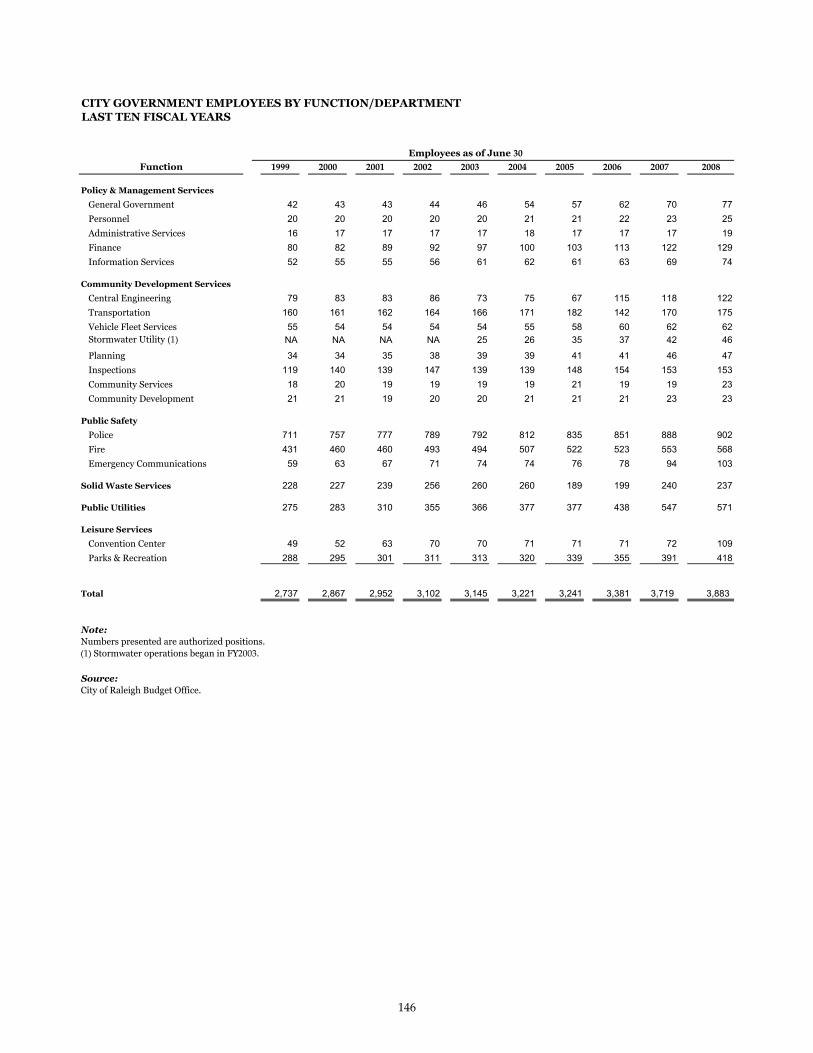
CITY GOVERNMENT EMPLOYEES BY FUNCTION/DEPARTMENTLAST TEN FISCAL YEARS
Function
Policy & Management Services
General Government 42 43 43 44 46 54 57 62 70 77Personnel 20 20 20 20 20 21 21 22 23 25Administrative Services 16 17 17 17 17 18 17 17 17 19Finance 80 82 89 92 97 100 103 113 122 129Information Services 52 55 55 56 61 62 61 63 69 74
Community Development Services
Central Engineering 79 83 83 86 73 75 67 115 118 122Transportation 160 161 162 164 166 171 182 142 170 175Vehicle Fleet Services 55 54 54 54 54 55 58 60 62 62Stormwater Utility NA NA NA NA 25 26 35 37 42 46
Planning 34 34 35 38 39 39 41 41 46 47Inspections 119 140 139 147 139 139 148 154 153 153Community Services 18 20 19 19 19 19 21 19 19 23Community Development 21 21 19 20 20 21 21 21 23 23
Public Safety
Police 711 757 777 789 792 812 835 851 888 902Fire 431 460 460 493 494 507 522 523 553 568Emergency Communications 59 63 67 71 74 74 76 78 94 103
Solid Waste Services 228 227 239 256 260 260 189 199 240 237
Public Utilities 275 283 310 355 366 377 377 438 547 571
Leisure Services
Convention Center 49 52 63 70 70 71 71 71 72 109Parks & Recreation 288 295 301 311 313 320 339 355 391 418
Total 2,737 2,867 2,952 3,102 3,145 3,221 3,241 3,381 3,719 3,883
Note:Numbers presented are authorized positions.
Stormwater operations began in FY .
Source:City of Raleigh Budget Office.
Employees as of June
146
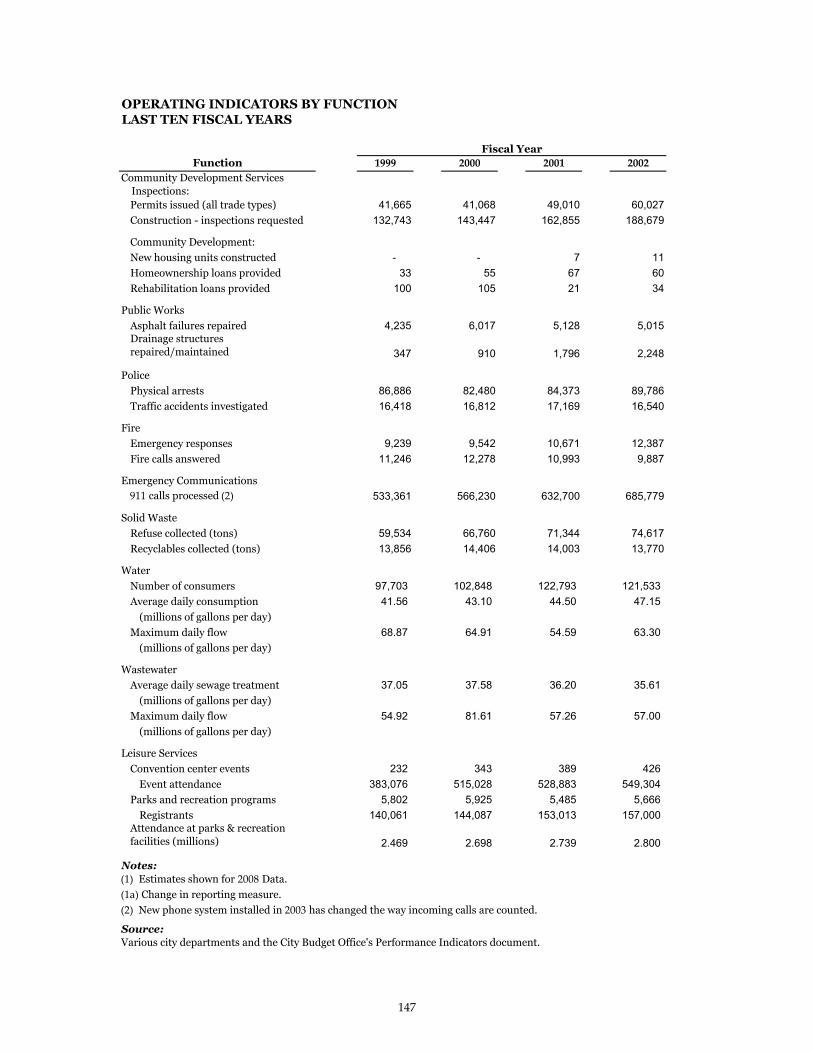
OPERATING INDICATORS BY FUNCTIONLAST TEN FISCAL YEARS
FunctionCommunity Development Services Inspections:
Permits issued (all trade types) 41,665 41,068 49,010 60,027Construction - inspections requested 132,743 143,447 162,855 188,679
Community Development:
New housing units constructed - - 7 11Homeownership loans provided 33 55 67 60Rehabilitation loans provided 100 105 21 34
Public Works
Asphalt failures repaired 4,235 6,017 5,128 5,015Drainage structures repaired/maintained 347 910 1,796 2,248
Police
Physical arrests 86,886 82,480 84,373 89,786Traffic accidents investigated 16,418 16,812 17,169 16,540
Fire
Emergency responses 9,239 9,542 10,671 12,387Fire calls answered 11,246 12,278 10,993 9,887
Emergency Communications calls processed 533,361 566,230 632,700 685,779
Solid Waste
Refuse collected (tons) 59,534 66,760 71,344 74,617Recyclables collected (tons) 13,856 14,406 14,003 13,770
Water
Number of consumers 97,703 102,848 122,793 121,533Average daily consumption 41.56 43.10 44.50 47.15
(millions of gallons per day)
Maximum daily flow 68.87 64.91 54.59 63.30(millions of gallons per day)
Wastewater
Average daily sewage treatment 37.05 37.58 36.20 35.61(millions of gallons per day)
Maximum daily flow 54.92 81.61 57.26 57.00(millions of gallons per day)
Leisure Services
Convention center events 232 343 389 426Event attendance 383,076 515,028 528,883 549,304
Parks and recreation programs 5,802 5,925 5,485 5,666Registrants 140,061 144,087 153,013 157,000
Attendance at parks & recreation facilities (millions) 2.469 2.698 2.739 2.800
Notes:Estimates shown for Data.
Change in reporting measure.
New phone system installed in has changed the way incoming calls are counted.
Source:Various city departments and the City Budget Office's Performance Indicators document.
Fiscal Year
147

59,401 60,027 63,000 47,862 67,493 63,000121,034 160,000 162,000 132,539 126,695 135,000
2 32 17 28 34 698 61 38 51 85 58
19 42 47 29 45 45
7,597 7,228 7,222 7,300 4,860 7,000
740 931 1,000 1,030 Unavailable 1,000
89,534 99,684 118,098 87,929 134,405 113,40816,787 17,344 18,005 18,551 19,257 19,487
13,500 15,159 17,244 21,249 20,063 21,00010,500 11,383 8,530 1,539 1,582 1,900
623,738 497,119 464,728 483,921 502,492 540,871
73,837 77,301 80,400 83,600 84,538 87,07414,069 14,428 15,719 16,872 18,808 20,312
126,285 131,312 137,330 158,007 169,324 174,51742.43 54.00 47.69 48.80 50.20 50.70
60.70 67.40 68.00 69.20 72.20 77.00
45.68 44.01 46.45 45.24 44.80 42.00
73.41 68.00 72.18 98.05 75.00 65.00
480 518 571 570 634 635582,896 593,693 661,968 559,989 654,152 661,306
7,485 7,195 6,977 8,302 10,334 10,905149,205 125,771 134,798 134,850 120,419 127,000
3.328 3.019 3.127 3.400 3.900 3.900
Fiscal Year
148

CAPITAL ASSET STATISTICS BY FUNCTIONLAST TEN FISCAL YEARS
Function
Public safetyPolice stations 3 3 3 5Fire stations 21 23 23 24
Highways and streetsStreets (miles) 969 989 1,028 1,068Streetlights 23,056 23,654 24,619 29,345Signalized intersections 461 461 470 473
Leisure servicesNumber of major parks 56 59 59 58Parks acreage 6,778 7,541 7,310 7,437Aquatic facilities 8 8 8 8Community centers (staffed 54 58 59 58 and unstaffed)
WaterWater mains (miles) 1,064 1,089 1,102 1,320
SewersSanitary sewers (miles) 1,349 1,378 1,392 1,424
Note:Capital asset indicators are not available for the general government function.
Source:Various city departments.
Fiscal Year
149
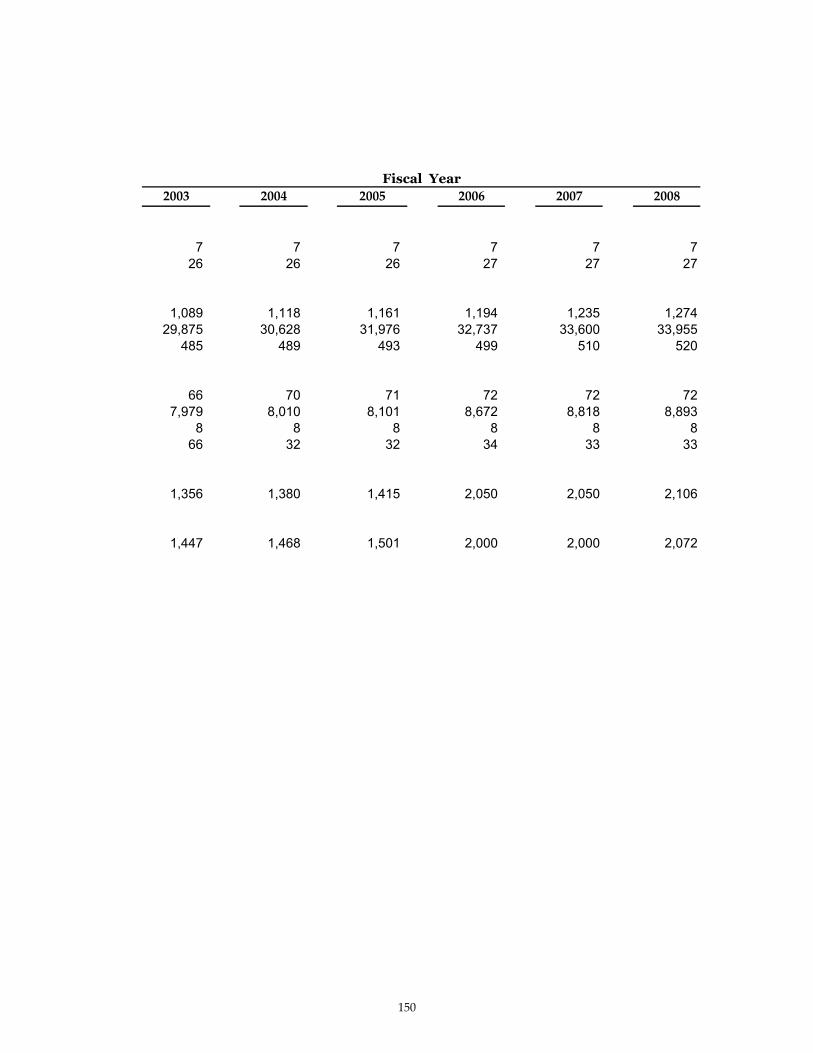
7 7 7 7 7 726 26 26 27 27 27
1,089 1,118 1,161 1,194 1,235 1,27429,875 30,628 31,976 32,737 33,600 33,955
485 489 493 499 510 520
66 70 71 72 72 727,979 8,010 8,101 8,672 8,818 8,893
8 8 8 8 8 866 32 32 34 33 33
1,356 1,380 1,415 2,050 2,050 2,106
1,447 1,468 1,501 2,000 2,000 2,072
Fiscal Year
150

ANALYSIS OF CURRENT TAX LEVYCITY - WIDE LEVY
June
Total LevyProperty
ExcludingCity - Wide Registered Registered
Property Total Motor MotorValuation Rate Levy Vehicles Vehicles
Original Levy: Property taxed at current 146,673,048.00 year's rate $ 33,701,143,484 $ .4350 $ 146,673,048 $ 137,729,616 $ 8,943,432 Registered motor vehicles taxed at prior year's rate 1,202,926,585 .4350 5,315,861 - 5,315,861
34,904,070,069 151,988,909 137,729,616 14,259,293
Discoveries: Prior years' taxes 205,108,551 776,815 771,507 5,308
Total property valuation $ 35,109,178,620
Deferred and waived 450,989 450,989 - Penalty 327,067 327,067 - Rebates (1,251,488) (999,361) (252,127)
Net levy 152,292,292 138,279,818 14,012,474
Uncollected taxes at June (2,883,259) (842,511) (2,040,748)
Current year's taxes collected $ 149,409,033 $ 137,437,307 $ 11,971,726
Current levy collection percentage 98.11% 99.39% 85.44%
150,660,521.00 150,660,521.00
Note: - Taxes levied on discovered properties of prior periods at tax rates applicable to those periods.
151
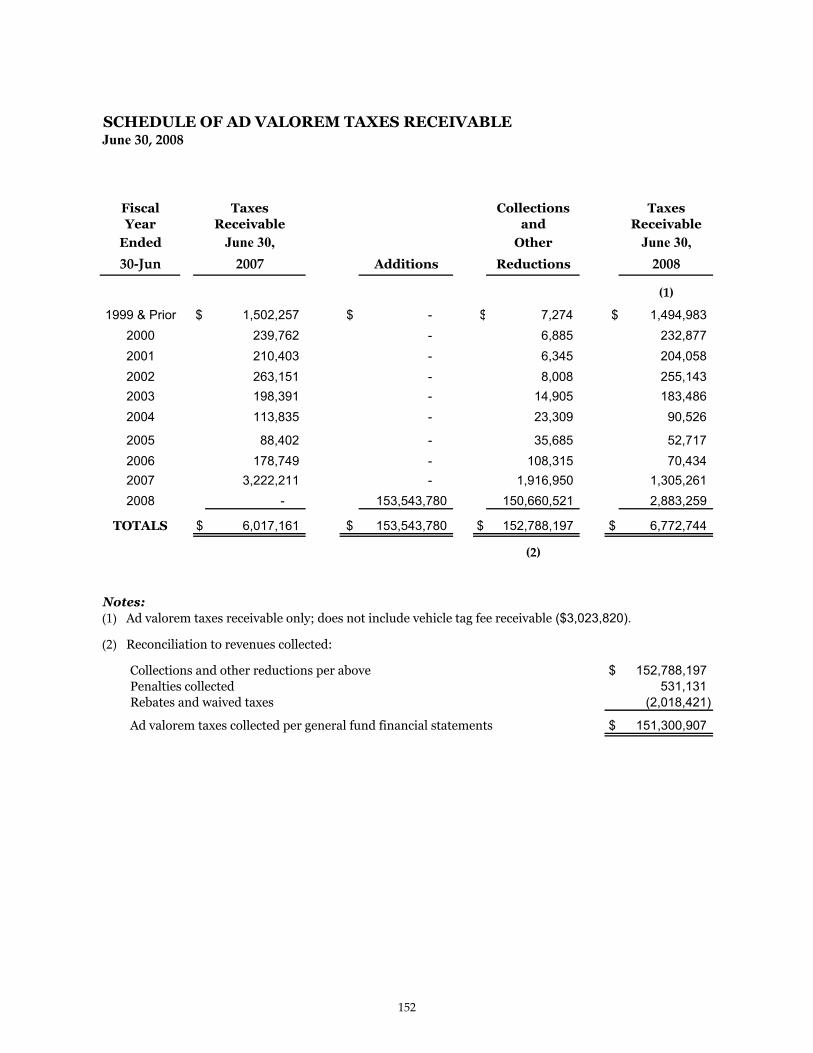
SCHEDULE OF AD VALOREM TAXES RECEIVABLEJune
Fiscal Taxes Collections TaxesYear Receivable and Receivable
Ended Other June 30,Additions Reductions
1999 & Prior $ 1,502,257 $ - $ 7,274 $ 1,494,983 2000 239,762 - 6,885 232,877 2001 210,403 - 6,345 204,058 2002 263,151 - 8,008 255,143 2003 198,391 - 14,905 183,486 2004 113,835 - 23,309 90,526
2005 88,402 - 35,685 52,717 2006 178,749 - 108,315 70,434 2007 3,222,211 - 1,916,950 1,305,261 2008 - 153,543,780 150,660,521 2,883,259
TOTALS $ 6,017,161 $ 153,543,780 $ 152,788,197 $ 6,772,744
Notes: Ad valorem taxes receivable only; does not include vehicle tag fee receivable ($3,023,820).
Reconciliation to revenues collected:
Collections and other reductions per above $ 152,788,197 Penalties collected 531,131 Rebates and waived taxes (2,018,421) Ad valorem taxes collected per general fund financial statements $ 151,300,907
June 30,
152

CITY OF RALEIGH
2008
SIN
GL
EA
UD
ITS
EC
TIO
N
SI N G L E AU D I T SE C T I O N
The Single Audit Section contains schedules, exhibitsand auditor reports reflecting federal, state, and otherparticipation in various projects and programs of theCity as required by OMB Circular A-133 and theNorth Carolina Single Audit Implementation Act.


CITY OF RALEIGH
2008
SINGLE AUDIT SCHEDULES
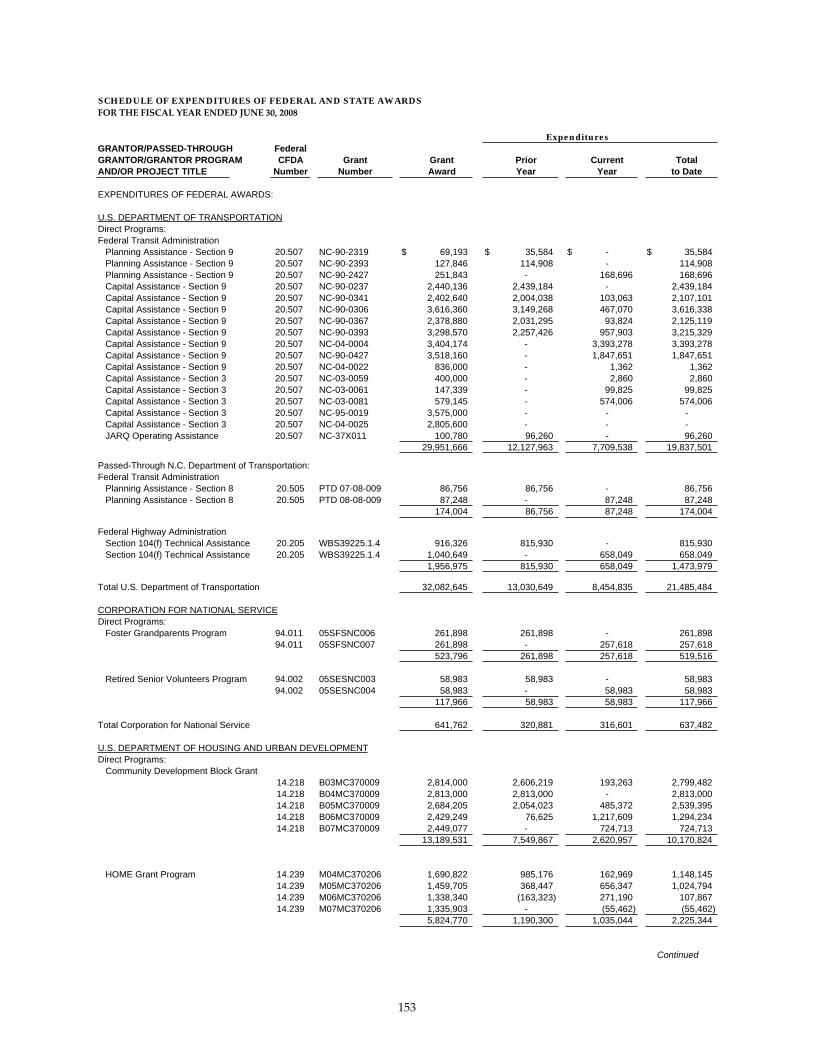
SCHEDULE OF EXPENDITURES OF FEDERAL AND STATE AWARDSFOR THE FISCAL YEAR ENDED JUNE 30, 2008
ExpendituresGRANTOR/PASSED-THROUGH FederalGRANTOR/GRANTOR PROGRAM CFDA Grant Grant Prior Current TotalAND/OR PROJECT TITLE Number Number Award Year Year to Date
EXPENDITURES OF FEDERAL AWARDS:
U.S. DEPARTMENT OF TRANSPORTATIONDirect Programs:Federal Transit Administration Planning Assistance - Section 9 20.507 NC-90-2319 $ 69,193 $ 35,584 $ - $ 35,584 Planning Assistance - Section 9 20.507 NC-90-2393 127,846 114,908 - 114,908 Planning Assistance - Section 9 20.507 NC-90-2427 251,843 - 168,696 168,696 Capital Assistance - Section 9 20.507 NC-90-0237 2,440,136 2,439,184 - 2,439,184 Capital Assistance - Section 9 20.507 NC-90-0341 2,402,640 2,004,038 103,063 2,107,101 Capital Assistance - Section 9 20.507 NC-90-0306 3,616,360 3,149,268 467,070 3,616,338 Capital Assistance - Section 9 20.507 NC-90-0367 2,378,880 2,031,295 93,824 2,125,119 Capital Assistance - Section 9 20.507 NC-90-0393 3,298,570 2,257,426 957,903 3,215,329 Capital Assistance - Section 9 20.507 NC-04-0004 3,404,174 - 3,393,278 3,393,278 Capital Assistance - Section 9 20.507 NC-90-0427 3,518,160 - 1,847,651 1,847,651 Capital Assistance - Section 9 20.507 NC-04-0022 836,000 - 1,362 1,362 Capital Assistance - Section 3 20.507 NC-03-0059 400,000 - 2,860 2,860 Capital Assistance - Section 3 20.507 NC-03-0061 147,339 - 99,825 99,825 Capital Assistance - Section 3 20.507 NC-03-0081 579,145 - 574,006 574,006 Capital Assistance - Section 3 20.507 NC-95-0019 3,575,000 - - - Capital Assistance - Section 3 20.507 NC-04-0025 2,805,600 - - - JARQ Operating Assistance 20.507 NC-37X011 100,780 96,260 - 96,260
29,951,666 12,127,963 7,709,538 19,837,501
Passed-Through N.C. Department of Transportation:Federal Transit Administration Planning Assistance - Section 8 20.505 PTD 07-08-009 86,756 86,756 - 86,756 Planning Assistance - Section 8 20.505 PTD 08-08-009 87,248 - 87,248 87,248
174,004 86,756 87,248 174,004
Federal Highway Administration Section 104(f) Technical Assistance 20.205 WBS39225.1.4 916,326 815,930 - 815,930 Section 104(f) Technical Assistance 20.205 WBS39225.1.4 1,040,649 - 658,049 658,049
1,956,975 815,930 658,049 1,473,979
Total U.S. Department of Transportation 32,082,645 13,030,649 8,454,835 21,485,484
CORPORATION FOR NATIONAL SERVICEDirect Programs: Foster Grandparents Program 94.011 05SFSNC006 261,898 261,898 - 261,898
94.011 05SFSNC007 261,898 - 257,618 257,618523,796 261,898 257,618 519,516
Retired Senior Volunteers Program 94.002 05SESNC003 58,983 58,983 - 58,98394.002 05SESNC004 58,983 - 58,983 58,983
117,966 58,983 58,983 117,966
Total Corporation for National Service 641,762 320,881 316,601 637,482
U.S. DEPARTMENT OF HOUSING AND URBAN DEVELOPMENTDirect Programs: Community Development Block Grant
14.218 B03MC370009 2,814,000 2,606,219 193,263 2,799,48214.218 B04MC370009 2,813,000 2,813,000 - 2,813,00014.218 B05MC370009 2,684,205 2,054,023 485,372 2,539,39514.218 B06MC370009 2,429,249 76,625 1,217,609 1,294,23414.218 B07MC370009 2,449,077 - 724,713 724,713
13,189,531 7,549,867 2,620,957 10,170,824
HOME Grant Program 14.239 M04MC370206 1,690,822 985,176 162,969 1,148,14514.239 M05MC370206 1,459,705 368,447 656,347 1,024,79414.239 M06MC370206 1,338,340 (163,323) 271,190 107,86714.239 M07MC370206 1,335,903 - (55,462) (55,462)
5,824,770 1,190,300 1,035,044 2,225,344
Continued
153

SCHEDULE OF EXPENDITURES OF FEDERAL AND STATE AWARDSFOR THE FISCAL YEAR ENDED JUNE 30, 2008
ExpendituresGRANTOR/PASSED-THROUGH FederalGRANTOR/GRANTOR PROGRAM CFDA Grant Grant Prior Current TotalAND/OR PROJECT TITLE Number Number Award Year Year to Date
U.S. DEPARTMENT OF HOUSING AND URBAN DEVELOPMENT (continued)
EDI Special Project - Fayetteville Street B04SPNC0572 $ 173,968 $ - $ 52,056 $ 52,056
Passed-Through N.C. Housing Finance Agency FAF HUD Funds Job Training N/A 151,000 76,000 6,968 82,968
Total U.S. Department of Housing and Urban Development 19,339,269 8,816,167 3,715,025 12,531,192
U.S. DEPARTMENT OF JUSTICEDirect Programs: Cops Secure Our Schools 16.710 05CKWX0571 22,087 - 22,087 22,087
Weed & Seed Program 16.595 01WSQX60061 225,000 142,813 64,785 207,598 Weed & Seed Program 16.595 01WSQX70079 200,000 - 105,222 105,222
425,000 142,813 170,007 312,820
2007 Bullet Proof Vest Grant N/A 62,510 - 62,510 62,5102008 Bullet Proof Vest Grant N/A 24,982 - - -
87,492 - 62,510 62,510
Total U.S. Department of Justice 534,579 142,813 254,604 397,417
ENVIRONMENTAL PROTECTION AGENCYDirect Programs: Brownfields Assessment Grant 66.818 BF964167040 400,000 262,268 71,007 333,275 Brownfields Revolving Loans Program 66.811 BL-974320901 1,000,000 34,093 139,268 173,361
1,400,000 296,361 210,275 506,636Passed-Through NCDENR Section 319(h) Fletcher Park EW06010 328,000 - 200,230 200,230 Section 319(h) Bio-retention treatment facility EW06012 34,000 - - -
362,000 - 200,230 200,230
Total Environmental Protection Agency 1,762,000 296,361 410,505 706,866
U.S. DEPARTMENT OF AGRICULTURE Direct Programs: Solid Waste Services WHIP Grant 10.914 72453232162 9,802 7,480 - 7,480
Passed-Through N.C. Department of Environment and Natural Resources: USFS - "Raleigh Neighborwoods" '10.664 ATB2000-16 5,856 - 3,504 3,504 USFS - "Raleigh Neighborwoods" 10.664 10,000 - - -
15,856 - 3,504 3,504
Total U.S. Department of Agriculture 25,658 7,480 3,504 10,984
Total Expenditures of Federal Awards $ 54,385,913 $ 22,614,351 $ 13,155,074 $ 35,769,425
Continued
154

SCHEDULE OF EXPENDITURES OF FEDERAL AND STATE AWARDSFOR THE FISCAL YEAR ENDED JUNE 30, 2008
ExpendituresGRANTOR/PASSED-THROUGH FederalGRANTOR/GRANTOR PROGRAM CFDA Grant Grant Prior Current TotalAND/OR PROJECT TITLE Number Number Award Year Year to Date
EXPENDITURES OF STATE AWARDS:
N. C. DEPARTMENT OF TRANSPORTATION Public Transportation Planning Assistance PTD 02-09-007 $ 24,095 $ 23,947 $ - $ 23,947 Public Transportation Planning Assistance PTD 03-09-319 8,649 4,448 - 4,448 Public Transportation Planning Assistance PTD 04-09-007 21,075 12,357 - 12,357 Public Transportation Planning Assistance PTD 05-09-007 15,569 6,977 - 6,977 Public Transportation Planning Assistance PTD 06-09-007 10,189 7,145 - 7,145 Public Transportation Planning Assistance PTD 07-09-393 15,981 7,749 (3) 7,746 Public Transportation Planning Assistance PTD 08-09-427 31,480 - 21,087 21,087 Public Transportation Planning Assistance PTD 06-08-009 10,637 10,637 - 10,637 Public Transportation Planning Assistance PTD 07-08-009 10,844 10,844 - 10,844 Public Transportation Planning Assistance PTD 08-08-009 10,906 - 10,906 10,906 Public Transportation Capital Assistance PTD 98-09-007 146,457 129,628 - 129,628 Public Transportation Capital Assistance PTD 99-09-004 166,817 166,698 - 166,698 Public Transportation Capital Assistance PTD 00-09-007 640,829 639,491 - 639,491 Public Transportation Capital Assistance PTD 01-09-007 69,387 64,154 - 64,154 Public Transportation Capital Assistance PTD 02-09-007 364,360 316,838 47,522 364,360 Public Transportation Capital Assistance NC-04-0004 425,589 - 424,160 424,160 Public Transportation Capital Assistance NC-03-0059 50,000 - 358 358 Public Transportation Capital Assistance NC-03-0061 18,417 - 12,478 12,478 Public Transportation Capital Assistance NC-03-0081 72,393 - 71,751 71,751 Public Transportation Capital Assistance 344,578 - - - Public Transportation Capital Assistance 350,700 - - - Public Transportation Maintenance Assistance Program - Operating 08SM013 2,432,043 - 2,432,043 2,432,043 Bicycle Plan Update WBS37309.1.1 90,000 - 43,206 43,206 Traffic Signal Uprade WBS35247.5.6 337,500 337,500 - 337,500 City-wide Traffice Signal Upgrade C-4923 21,000,000 985,902 914,504 1,900,406 Morgan Street Two Way Traffic B-2655 110,000 - - - Falls of Neuse Widening U-4901 13,836,000 - - - Duraleigh Road at U.S. 70 9.8022058 150,000 150,000 - 150,000 House Creek Greenway - Phase I E-4929 200,000 20,000 - 20,000 House Creek Greenway - Phase 2 E-4979 400,000 - - - Stonybrook Drive Bridge Design - 443,334 244,533 11,809 256,342 GHSP Research Speed and Traffic - 94,711 83,975 - 83,975 GHSP Research Speed and Traffic - 54,595 49,960 3,441 53,401 GHSP School Zone Speed Enforcement - 35,525 - 34,003 34,003 GHSP School Zone Speed Enforcement - 18,439 - 18,008 18,008 Neuse River Greenway Grant E-4829 500,000 296,113 168,036 464,149 Neuse River Greenway Grant EB-4829 393,571 - - - Powell Bill WBS32570 10,800,492 - 10,800,492 10,800,492
Total N. C. Department of Transportation 53,705,162 3,568,896 15,013,801 18,582,697
N. C. DEPARTMENT OF CRIME CONTROLAND PUBLIC SAFETY Fire Equipment Grant 4702-53692006 192,857 68,481 124,321 192,802 Fire Equipment Grant - 251,571 - - - USAR Base Equipment 4702-53692010 745,000 290,015 58,579 348,594 USAR Swift Water Rescue SRT/USAR060 19,800 - 7,450 7,450 800 MGHZ Radio Grant 4702-52692010 2,000,000 - 2,000,000 2,000,000 Gang/Gun Suppression 092-1-06-001-A 71,368 55,715 15,537 71,252 Polic 2 Police Technology - 72,281 - 68,434 68,434 PSN LE Gang Training - 17,000 - 17,000 17,000
Total N. C. Department of Crime Controland Public Safety 3,369,877 414,211 2,291,321 2,705,532
Continued
155

SCHEDULE OF EXPENDITURES OF FEDERAL AND STATE AWARDSFOR THE FISCAL YEAR ENDED JUNE 30, 2008
ExpendituresGRANTOR/PASSED-THROUGH FederalGRANTOR/GRANTOR PROGRAM CFDA Grant Grant Prior Current TotalAND/OR PROJECT TITLE Number Number Award Year Year to Date
N. C. DEPARTMENT OF ENVIRONMENTAND NATURAL RESOURCES NCCWMT Upper Longview Restoration 2007-415 $ 323,000 $ - $ 26,290 $ 26,290 NCCWMT Fletcher Park Retention Pond 2007-714 250,000 - - - NCCWMT Pigeon House Branch Stream 2007-714 860,000 - - - NCCWMT Reuse Line Constructions N/A 919,000 - - - PARTF - Walnut Creek Interpretive Center 2006-487 500,000 - - - Soil Erosion Engineering Program L04002 2,244 903 - 903 ABC Recycling 000753 10,800 - 2,439 2,439
Total N. C. Department of Environmentand Natural Resources 2,865,044 903 28,729 29,632
Total Expenditures of State Awards $ 59,940,083 $ 3,984,010 $ 17,333,851 $ 21,317,861
EXPENDITURES OF OTHER AWARDS:
WAKE COUNTY Open Space Program $ 200,000 $ 138,881 $ - $ 138,881 Transportation - EDTAP 14,000 - 17,999 17,999 Board of Alcohol Control 20,000 14,775 - 14,775 Barwell Road Park Cardio Center 1,600 - 1,600 1,600 JAG - Criminal Nuisance Abatement 150,260 - 150,150 150,150 JAG - Violent Crime Supression 99,765 24,810 72,640 97,450
485,625 178,466 242,389 420,855
TRIANGLE J COUNCIL OF GOVERNMENTS Alternate Fuel Grant 21,420 13,503 (6,635) 6,868
Total Expenditures of Other Awards $ 507,045 $ 191,969 $ 235,754 $ 427,723
Total Expenditures - All Awards $ 114,833,041 $ 26,790,330 $ 30,724,679 $ 57,515,009
Notes: The Schedule of Expenditures of Federal and State Awards is prepared on the modified accrual basis of accounting. The information in this schedule is presented in accordance with the requirements of OMB Circular A-133, Audits of States, Local Governments, and Non-Profit Organizations and the State Single Audit Implementation Act. Therefore, some amounts presented in this schedule may differ from amounts presented in, or used in the preparation of the basic financial statements.
Powell Bill expenditures as reported above represent eligible expenditures reported to the North Carolina Department of Transportation for the fiscal year ending June 30, 2008. The City is required to report annually to the North Carolina Department of Transportation on the accumulated unexpended Powell Bill funds. Unexpended Powell Bill funds are accounted for and maintained within various City funds. The total unexpended balance on-hand at June 30, 2008 is $-0-.
Negative current year expenditures represent adjustments to previously reported balances for grant projects completed during FY08.
156

CITY OF RALEIGH
2008


CREDITS:CAFR DESIGN ~ SALLY JOHNS DESIGN • MARKETING COMMUNICATIONS
PRINTING ~ JOSEPH C. WOODARD COMPANY

OFFICE OF THE CITY MANAGERCITY OF RALEIGH
POST OFFICE BOX 590RALEIGH, NORTH CAROLINA 27602
919-996-3070
OFFICE OF THE CHIEF FINANCIAL OFFICERCITY OF RALEIGH
POST OFFICE BOX 590RALEIGH, NORTH CAROLINA 27602
919-996-3215
WWW.RALEIGHNC.GOV