city of virginia beach community for a lifetime - vbgov.com · city of virginia beach community for...
TRANSCRIPT
City of Virginia BeachCommunity for a Lifetime
CITY OF VIRGINIA BEACH
ADOPTED BIENNIAL RESOURCE MANAGEMENT PLAN
FISCAL YEARS 2008-09 AND 2009-10
SECOND YEAR AMENDMENTS

COMMUNITY FOR A LIFETIME
City of Virginia Beach Biennial Resource Management Plan
Fiscal Years 2008-09 and 2009-10
Adopted Second Year Amendments
The Government Finance Officers Association of the United States and Canada (GFOA) presented a Distinguished Budget Presentation Award to the City of Virginia Beach, Virginia for its biennial budget for the fiscal year beginning July 1, 2008 and completing June 30, 2010. In order to receive this award, a governmental unit must publish a budget document that meets program criteria as a policy document, as an operations guide, as a financial plan, and as a communications device.

Acknowledgments… The Department of Management Services thanks the many individuals and departments who assisted in preparing this document. Particular thanks go to: the joint City/Schools Print Shop for their assistance with document production; the Management Leadership Team and City Council for their important contributions to priority setting; City Department Directors; participating appointed and elected officials; the Media and Communications Group who assisted with budget communication; and Sue Curcio from Media and Communications Group, who designed the document cover. Their efforts were greatly appreciated. Special thanks go to my staff for their willingness to work through the changes, issues, and problems creatively, with cheerfulness and unsurpassed competence:
Management Services Staff - Luis Asercion, Ron Berkebile, David Bradley, Crystal Brown, Kevin Chatellier, Meredith Ching, Kathy Cooper, Jane Doucette, Monica Dudek, Paul Harris, Lee Hedberg, Stacy Hershberger, Jonathan Hobbs, Beth Kavanaugh, Twila Leavitt, Jeannie Lyons, Michael Maher, Barry Shockley, Linda Stephenson, and Rebecca Taylor-Schmidt
Sincerely,
Catheryn R. Whitesell, Director Department of Management Services

Table of Contents
Fiscal Year 2009-10 i Executive Summary
City Organization and Information ................................................................................................ 1 City Manager’s Message for the Adopted Biennial Resource Management Plan ...................... 2 City Manager’s Message for the Revised Biennial Resource Management Plan ....................... 5 Schedule of Workshops and Public Hearings ............................................................................ 13 Operating Budget Summaries City and Schools Revenue Summary ........................................................................................................ 1 - 1 Projection of General Fund Balances ........................................................................................................ 1 - 2 Calculation of Undesignated General Fund Balance Reserve .................................................................... 1 - 2 Changes in Undesignated Fund Balances ................................................................................................. 1 - 3 Revised FY 2009-10 Selected Taxes/Fees for Virginia Beach and Other Localities .................................... 1 - 4 City and Schools Expenditure Summary .................................................................................................... 1 - 4 Expenditures for FY 2009-10 ..................................................................................................................... 1 - 5 FY 2009-10 Revised Expenditure Summary .............................................................................................. 1 - 6 Major FY 2009-10 Biennial Budget Revisions ............................................................................................ 1 - 7 Compensation ......................................................................................................................................... 1 - 19 Measuring Results .................................................................................................................................. 1 - 20 Economic Vitality ..................................................................................................................................... 1 - 21 Family and Youth Opportunities .............................................................................................................. 1 - 22 Quality Physical Environment .................................................................................................................. 1 - 23 Cultural and Recreational Opportunities .................................................................................................. 1 - 24 Quality Education and Lifelong Learning ................................................................................................. 1 - 25 Safe Community ..................................................................................................................................... 1 - 26 Quality Organization ................................................................................................................................ 1 - 27 Capital Improvement Program Summaries Sources of Funding ................................................................................................................................... 2 - 1 Summary of Project Estimates .................................................................................................................. 2 - 1 Functional Allocation of Resources ............................................................................................................ 2 - 2 Capital Improvement Project by Type ........................................................................................................ 2 - 2 Total Capital Investment FY 2007-08......................................................................................................... 2 - 3 FY 2009-10 Biennial Capital Improvement Program Revisions .................................................................. 2 - 4 Ordinances Budget Ordinance for the Fiscal Year Beginning July 1, 2009 and Ending June 30, 2010 .......................... 3 - 1 An Ordinance Establishing the Tax Levy on Real Estate for Fiscal Year 2010... ................................... …3 - 14 An Ordinance Establishing the Tax Levy on Personal Property and Machinery and Tools for the Calendar Year 2010 ......................................................................................................... 3 - 16 An Ordinance to Authorize the City Manager to Submit an Annual Funding Plan to the U.S. Department of Housing and Urban Development................................................................. 3 - 19 An Ordinance to Appropriate $8,800,000 from the School Reserve Special Revenue Fund to the City’s FY 2008-09 General Fund Operating Budget……………………………………………………3 - 20 An Ordinance to Declare $9,000,000 of Funding Within the Sandbridge Tax Increment Financing District as Surplus Funds in the FY 2008-09 Operating Budget ................................................... 3 - 21 An Ordinance to Temporarily Suspend the Transition Area Special Revenue Fund .................................. 3 - 22 An Ordinance to Revise the FY 2010/FY 2014 Capital Improvement Program ......................................... 3 - 23 An Ordinance Authorizing the Issuance of General Obligation Public Improvement Bonds of the City of Virginia Beach, Virginia, in the Maximum Amount of $62,900,000 for Various Public Facilities and General Improvements .......................................................................................... 3 - 33 An Ordinance Authorizing the Issuance of Water and Sewer System Revenue Bonds of the City of Virginia Beach, Virginia, in the Maximum Amount of $17,000,000 .................................... 3 - 34
Table of Contents
Fiscal Year 2009-10 ii Executive Summary
Reference Dedication of Local Revenues ................................................................................................................... 4 - 1 Real Estate Tax Rate History: FY 1982-83 through FY 2009-10 ................................................................ 4 - 2 Options to Balance the Operating Budget .................................................................................................. 4 - 4 Summary of Proposed Fee Adjustments ................................................................................................... 4 - 5 Additions and Reductions of Positions for FY 2009-10 .............................................................................. 4 - 6 A Resolution to Address Public Safety Pay Compression Disparities ......................................................... 4 - 9 Entry Level Police, Fire and Sheriff Salary Survey ................................................................................... 4 - 11 Demographic Information ........................................................................................................................ 4 - 12 Relationship of the Operating Budget to the Capital Improvement Program ............................................. 4 - 14 FY 2009-10 Revised Revenue Summary ................................................................................................. 4 - 15 FY 2009-10 Revised Personnel Summary ............................................................................................... 4 - 16 FY 2009-10 Revised Interfund Transfer Summary ................................................................................... 4 - 17 CIP Means of Financing Summary .......................................................................................................... 4 - 20 CIP Project Estimates Summary ............................................................................................................. 4 - 21 CIP Computation of Bonding Limits ......................................................................................................... 4 - 22 CIP Estimated Debt Service Costs of General Improvement Debt ........................................................... 4 - 23 CIP Estimated Debt Service Costs of Water and Sewer Bond Issues ...................................................... 4 - 24 CIP Completed Project Listing ................................................................................................................. 4 - 25 CIP Deleted Project Listing...................................................................................................................... 4 - 27 CIP Requested But Not Funded Project Listing ....................................................................................... 4 - 28

Fiscal Year 2009-10 1 Executive Summary
City Organization and Information The City of Virginia Beach adopted its first Charter on February 28, 1962; it was ratified by the State Legislature to be effective on January 1, 1963, thereby incorporating the City. In its Charter, the City established a Council/Manager form of government, in which an elected City Council establishes policy and the resulting programs are carried out by an appointed City Manager. City Council Members: City Council Appointees: Mayor William D. Sessoms, Jr. City Manager – James K. Spore Louis R. Jones, Vice-Mayor, District 4 – Bayside City Attorney – Mark Stiles Glenn R. Davis, District 3 – Rose Hall City Real Estate Assessor – Jerald Banagan Bill R. DeSteph, At – Large City Clerk – Ruth Hodges Fraser Harry E. Diezel, District 2 – Kempsville City Auditor – Lyndon Remias Robert Dyer, District 1 – Centerville Barbara M. Henley, District 7 – Princess Anne John E. Uhrin, District 6 – Beach Ron A. Villanueva, At – Large Rosemary Wilson, At – Large James L. Wood, District 5 – Lynnhaven
Operating Structure
Key Statistics Total Square Miles of Land 248.3 Total Square Miles of Water 58.5 Population Estimate (July 2008) 431,451 Number of Registered Voters
(January 2009) 288,924
Number of Homes/Residences 168,113
Citizens
City Auditor City Attorney City Clerk City ManagerCity Assessor
Deputy City Manager
Human ResourcesHuman ServicesParks and RecreationPublic LibrariesPublic HealthOffice of Volunteer
ResourcesMedia and Communication
GroupOrganization Development
Office
Communications and Information Technology
FinanceManagement ServicesPublic WorksPublic Utilities
AgricultureConvention and Visitor
BureauEconomic DevelopmentPlanning & Community
DevelopmentMuseumsHousing & Neighborhood
PreservationOffice of Cultural Affairs
PoliceFireEmergency Medical
ServicesEmergency
Communications & Citizen Services
Deputy City Manager
Deputy City Manager
Constitutional OfficersCity TreasurerCommissioner of the RevenueClerk of the Circuit CourtSheriffCommonwealth Attorney
State AgenciesCourtsGeneral RegistrarMagistrateJuvenile Probation
School Operating UnitsInstructionAdministration, Attendance
and HealthPupil TransportationOperations and
Maintenance
School Board
School Superintendent
City Council
Fiscal Year 2009-10 2 Executive Summary
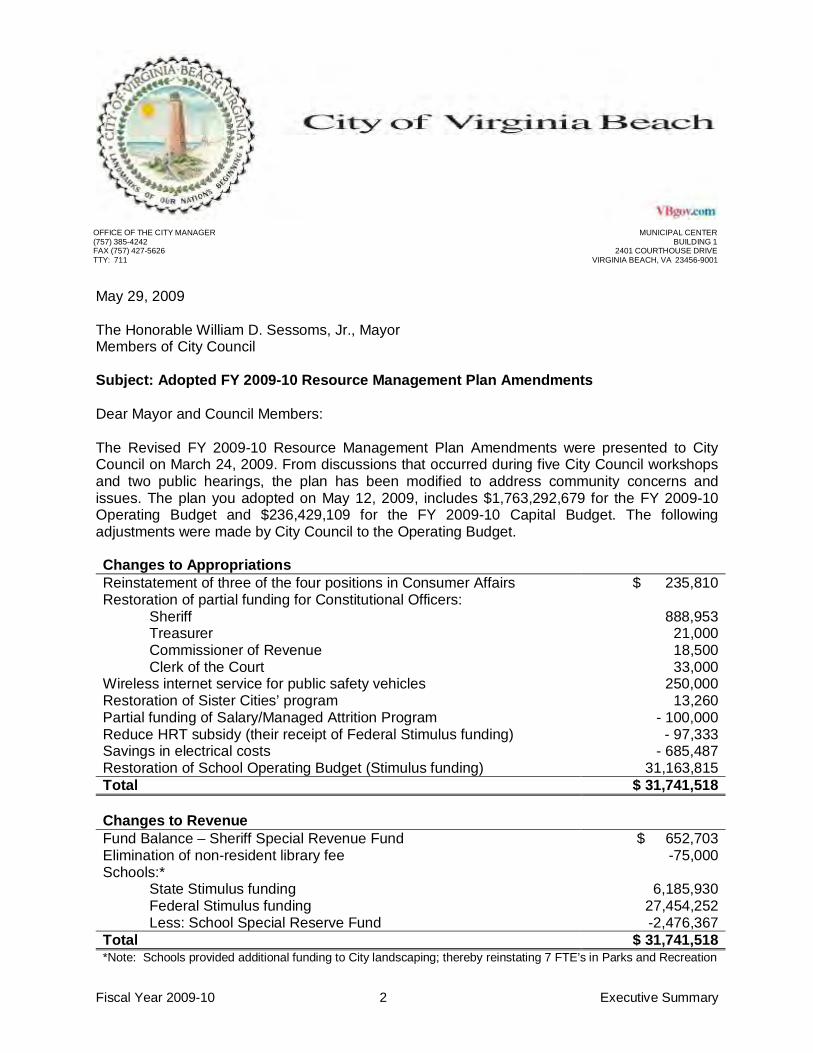
Date May 29, 2009 The Honorable William D. Sessoms, Jr., Mayor Members of City Council Subject: Adopted FY 2009-10 Resource Management Plan Amendments Dear Mayor and Council Members: The Revised FY 2009-10 Resource Management Plan Amendments were presented to City Council on March 24, 2009. From discussions that occurred during five City Council workshops and two public hearings, the plan has been modified to address community concerns and issues. The plan you adopted on May 12, 2009, includes $1,763,292,679 for the FY 2009-10 Operating Budget and $236,429,109 for the FY 2009-10 Capital Budget. The following adjustments were made by City Council to the Operating Budget. Changes to Appropriations Reinstatement of three of the four positions in Consumer Affairs $ 235,810 Restoration of partial funding for Constitutional Officers:
Sheriff Treasurer Commissioner of Revenue Clerk of the Court
888,953
21,000 18,500 33,000
Wireless internet service for public safety vehicles 250,000 Restoration of Sister Cities’ program 13,260 Partial funding of Salary/Managed Attrition Program - 100,000 Reduce HRT subsidy (their receipt of Federal Stimulus funding) - 97,333 Savings in electrical costs - 685,487 Restoration of School Operating Budget (Stimulus funding) 31,163,815 Total $ 31,741,518 Changes to Revenue Fund Balance – Sheriff Special Revenue Fund $ 652,703 Elimination of non-resident library fee -75,000 Schools:*
State Stimulus funding Federal Stimulus funding Less: School Special Reserve Fund
6,185,930
27,454,252 -2,476,367
Total $ 31,741,518 *Note: Schools provided additional funding to City landscaping; thereby reinstating 7 FTE’s in Parks and Recreation
OFFICE OF THE CITY MANAGER (757) 385-4242 FAX (757) 427-5626 TTY: 711
MUNICIPAL CENTER BUILDING 1
2401 COURTHOUSE DRIVE VIRGINIA BEACH, VA 23456-9001

Fiscal Year 2009-10 3 Executive Summary
Categories
FY 2008-09 Adjusted Budget
FY 2009-10 Proposed Budget
FY 2009-10 Adopted Budget
City Operations $ 731,640,600 $ 727,743,667 $ 728,321,370 City Debt Service 100,027,282 102,225,759 102,225,759 City Pay-As-You-Go 56,078,423 54,884,677 54,884,677 Total City 887,746,305 884,854,103 885,431,806 School Operation 822,429,375 800,621,168 833,677,199 School Debt Service 41,154,429 44,183,674 44,183,674 City Manager Adjustment - 1,892,216 - Schools Pay-As-You-Go 13,936,308 - - Total Schools 877,520,112 846,697,058 877,860,873 Total Operating Budget $ 1,765,266,417 $ 1,731,551,161 $ 1,763,292,679
Two major changes were made to the Capital Budget: Additions: Norfolk Southern Right-of-Way Acquisition $ 10,000,000 Kellam High School Replacement Project 10,300,000 Total $ 20,300,000 Offsetting Amounts: General Fund – Fund Balance $ 10,000,000 State Stimulus funding 15,936,308 State Lottery funding 3,900,000 Less: School Special Reserve Fund -9,536,308 Total $ 20,300,000
Type of Financing FY 2008-09
Amended CIP FY 2009-10
Proposed CIP FY 2009-10
Adopted CIP Schools $ 73,471,916 $ 52,369,308 $ 62,669,308 Roadways 53,078,655 56,303,747 66,303,747 Buildings 19,580,289 16,778,606 16,778,606 Parks and Recreation 10,438,358 10,325,175 10,325,175 Utilities 39,349,131 46,526,159 46,526,159 Coastal 8,563,402 7,690,938 7,690,938 Economic and Tourism Development 21,458,649 20,880,578 20,880,578 Communications & Information Technology 24,802,977 5,254,598 5,254,598 Total Capital Improvement Program $ 250,743,377 $ 216,129,109 $ 236,429,109 City Council also addressed issues that were expressed at the public hearings including: Animal Control Shelter – Already included in the budget is enhanced vaccination services and the addition of an Animal Shelter Manager position. Funding is included in the FY 2009-10 Capital Budget to complete the necessary design work necessary to move this project to construction in FY 2010-11. During the City Council’s reconciliation discussion, Council members expressed concerns over the rising cost of this facility driven in part by supporter expectations and State requirements. City Council expressed an interest in working with staff to design and construct a reasonably priced facility that will be an improvement over the old shelter.

Fiscal Year 2009-10 4 Executive Summary
Union Kempsville Museum – The Department of Museums will operate the facility and is looking forward to providing unique programming for this facility. The department is reallocating existing staff and resources among the historic homes to accomplish this task along with increasing their use of volunteers. Fire Education Program – At reconciliation City Council members wanted assurances that staff would be able to sustain this program through a combination of remaining staff and an enhanced reliance on volunteers. City Council requested a staff briefing prior to the beginning of the new fiscal year. Burton Station Water and Sewer Initiative – As part of the Strategic Growth Area initiative, staff will begin design in FY 2009-10 for extending water and sewer services into the Burton Station neighborhood with funding for construction in FY 2010-11. We believe the approved Resource Management Plan successfully balanced the need for increased demand for services, while reducing the tax burden on Virginia Beach residents during these difficult economic times. With this Resource Management Plan serving as part of the foundation, we remain steadfast in our goal of making Virginia Beach a “Community for a Lifetime” for our citizens.
Fiscal Year 2009-10 5 Executive Summary
March 24, 2009 The Honorable William D. Sessoms, Jr., Mayor Members of City Council Subject: Revised FY 2009-10 Resource Management Plan Amendments Dear Mayor and Council Members: As we update the adopted FY 2009-10 Operating Budget, the national, state, and local economies are at major economic crossroads. Many economists indicate that the current recession is the most severe since the Great Depression, and many believe the economy has not yet reached bottom. Recent news indicating the national unemployment rate is currently at 8.1% - its highest rate in more than 25 years - seems to offer credibility to their grim predictions. Only one time in the history of the City of Virginia Beach has a Proposed Budget included a decrease in revenue: the Budget in FY 1991-92 dropped 1.7% from the previous fiscal year. Our projected revenue decrease from FY 2008-09 is 1.9%, which is the highest decrease in City history. When compared to the original FY 2009-10 Operating Budget adopted last May, the decrease is 3.8%. Still, even with the continuing drumbeat of bad news, I believe a silver lining exists. For years, our City Council has understood the importance of financial sustainability. Our fiscal decisions have not only focused on the current fiscal year, but we continually look towards the future. The ultimate reward for our policy of fiscal sustainability is our ability to weather these difficult times, and our stewardship is recognized with the AAA bond rating our City currently maintains. Preparing the Budget in an uncertain economic environment creates a challenging paradox. On one hand, we need to continue efforts to streamline our government and ensure that we reduce the tax burden on families who may be experiencing similar financial difficulties. On the other hand, increased governmental services will be requested by many of these same families. Unlike the private sector, the demand for our services will not decline - they continue to increase. Some families may need our Department of Human Services to provide counseling services or apply for financial assistance if their jobs are lost. They may use our libraries to research jobs and fill out applications; they may need lower cost opportunities for family fun such as parks and recreation centers. They may take an adult education class through our School System to learn a new trade. If an unfortunate situation occurs, our Police, Fire, and Emergency Medical Services professionals will be there to provide their unparalleled and oftentimes heroic services to a family in need.
OFFICE OF THE CITY MANAGER (757) 385-4242 FAX (757) 427-5626 TTY: 711
MUNICIPAL CENTER BUILDING 1
2401 COURTHOUSE DRIVE VIRGINIA BEACH, VA 23456-9001

Fiscal Year 2009-10 6 Executive Summary
Previous City Council decisions, like securing our long-term water future through the Lake Gaston water supply project, creating jobs and living opportunities through the Town Center project, and building enhanced tourist amenities like the Convention Center, the Verizon Amphitheater and the Virginia Aquarium, are part of the strong foundation that our City is built upon. These decisions were based on a collective City Council vision that focused on the future of the City and not just the next fiscal year. Balancing this year’s Budget has been more difficult than any our City has encountered before, not just because of declining revenues. We need to balance the increasing demand for our services with the decreasing capacity of our community to pay for the services. We need to balance our ability to address the immediate revenue shortfall with a long-term fiscal strategy of economic growth and financial stabilization meeting City Council’s long-term goals. Engaging City Council Earlier in the Process Knowing that preparing this Operating Budget would be incredibly difficult, we engaged your guidance earlier than in previous Budgets. As far back as November 2008, City and School’s staff provided an overview of the financial environment over the next five years. On January 13 of this year, David Bradley provided an overview of how Virginia Beach compares to the five largest cities in Hampton Roads. Generally, the presentation concluded that Virginia Beach is the lowest-cost provider of quality services in the region and that we have the lowest overall tax rates in the region. The presentation did note that we still charge less than other cities in fees and charges for services as a proportion of overall revenue. On January 27, Catheryn Whitesell summarized the projections of several of our revenue streams and offered options (labeled A through S) for a total of 19 possible alternatives for balancing the Budget. These alternatives included changing dedicated revenue sources for a year, eliminating the proposed 2.5% salary increase, and raising certain tax rates (these alternatives are summarized in the Reference on page 4 - 4). This Proposed Budget and Capital Improvement Program used many of these options. On February 9 and 10, the Constitutional Officers, City Council appointees, as well as the Department Directors presented rankings of their City programs to City Council. City Council agreed with the rankings or in some cases reprioritized the rankings to reflect the community’s goals. Again, this information and discussion was instrumental in the development of this Budget and Capital Improvement Program. Operating Budget As we developed the Operating Budget, we were guided by the following strategies: (1) minimize the impact on service delivery and programs; (2) maintain the City’s strong financial position; (3) protect the future viability of the City’s economy; (4) balance the deficit across departments, employees, taxpayers, and revenue dedications; and (5) to be mindful of long-term infrastructure needs in the Capital Improvement Program. As mentioned previously, the estimated revenue decrease of 1.9% as compared to FY 2008-09 is the largest in the City’s history. Because we use a Biennial Budget, we need to bring the second year budget, FY 2009-10, down by 3.8% to meet anticipated revenues. The following table summarizes the Revised Operating Budget:

Fiscal Year 2009-10 7 Executive Summary
Categories
FY 2008-09 Adjusted Budget
FY 2009-10 Approved
Budget FY 2009-10
Revised Budget
Percentage
Change City Operations $ 731,640,600 $ 740,542,531 $ 727,743,667 City Debt Service 100,027,282 104,263,203 102,225,759 City Pay-As-You-Go 56,078,423 66,566,123 54,884,677 Total City 887,746,305 911,371,857 884,854,103 - 2.9% School Operations 822,429,375 830,114,677 800,621,168 School Debt Service 41,154,429 43,831,667 44,183,674 City Manager Adjustment - - 1,892,216 Schools Pay-As-You-Go 13,936,308 13,936,308 - Total Schools 877,520,112 887,882,652 846,697,058 - 4.6% Total Operating Budget $1,765,266,417 $1,799,254,509 $1,731,551,161 -3.8%
The City’s portion of the total Budget is decreasing by 2.9% as compared to the Approved FY 2009-10 Budget, while the School’s Budget is decreasing by 4.6%. Included in the School’s Budget is a $1.9 million adjustment that reflects a slight change in revenue projections from the City/School Revenue Sharing Formula that was not appropriated by the School Board due to the fact that information was available late in their budget process. As the table below illustrates, when the Federal stimulus funding and unallocated State funding that has not been appropriated by the Schools is added to the School’s FY 2009-10 Revised Budget it would actually grow by 1%. At the time of preparing this letter, the Schools are not sure if this funding will be restricted by use, which means it could be restricted to special programs or the Capital Improvement Program. If this funding can be applied to the School’s Operating Budget, it will allow Schools to maintain their current Budget with a slight increase as compared to the approved FY 2009-10 Operating Budget. Since this funding may not be recurring, the School Board will have to determine the appropriate allocation of funding between their Operating Budget and Capital Improvement Program.
Categories
FY 2008-09 Adjusted Budget
FY 2009-10 Approved
Budget
FY 2009-10 Revised Budget
Percentage
Change Schools Total Budget $877,520,112 $887,882,652 $846,697,058 Unallocated State School Funding - - 1,225,069 Unallocated Federal School Funding - - 48,616,827 Total Schools Capacity $877,520,112 $887,882,652 $896,538,954 +1.0%
Unfortunately, the City will not receive the same impact from the Federal stimulus funding or the State Budget. Since the School System may be able to meet many of its current objectives due to the increased stimulus package and declining enrollment, we are recommending that the City Council approve returning $8.8 million of the School System’s FY 2008 Reversion funding to the City to avoid significant reductions in City services at a time of increasing demand and to shore up our road maintenance program. I also am recommending that the City Council direct the City/School Revenue Sharing Formula Committee to work over the next twelve months to benchmark the Revenue Sharing Formula to student enrollment or other service demand indicators with a goal of completing this work by January 31, 2010, in time for budget discussions about FY 2011. To allow the Schools more flexibility in addressing their changing fiscal environment, we are recommending that the City allocate School funding in one lump-sum amount rather than the previous allocation based on categories. The School’s Budget is addressed in more detail on page ten.

Fiscal Year 2009-10 8 Executive Summary
As was previously mentioned, we used several of the options outlined to City Council on January 27th. The following is a summary of the options in the update to the FY 2009-10 Operating Budget: • Option A - Moved GASB45 annual required contribution towards retiree health care liablity
to the Health Insurance Fund (the Schools also moved their $2.9 million share). This saved the City’s General Fund $4 million; however, without a permanent shift in how this obligation is financed, this must be viewed as a one-time strategy.
• Option B - Changing dedicated funding sources: In addition to using $8.8 million of school
reversion funding noted above, the Tourism Growth and Investment Fund (TGIF) and the Major Projects Fund (pays the debt service for the Convention Center, Sandler Center, and additional Marine Science Museum parking) will each provide $1 million to the General Fund in FY 2009-10. The Agricultural Reserve Program (ARP) will contribute $4 million to the General Fund. Based on current projections, this will not have an adverse impact on the fiscal viability of these funds; however again, this is a one-time strategy. We are also recommending the elimination of the dedication of real estate tax growth to transition area infrastructure.
• Option C - Eliminate the proposed 2.5% pay raise for all employees (Schools also did not
provide a pay raise) - to be discussed in more detail later. This saved the City $8.8 million and the School System $17.8 million.
• Option F - Reduce pay-as-you-go financing to the CIP by $10 million and replace with fund
balance. The $10 million pay-as-you-go will be returned to the General Fund. The School Board used $13.9 million of reversion funds to replace Formula revenues in their Capital Improvement Program. We believe that our strong financial position allows us to make this decision and still adhere to our fund balance targets. In addition, $4 million of the $8.8 million in School Reversion funding will be used to provide funding to road maintenance. This use of fund balance in the CIP is not sustainable long term.
• Option L - Reduced travel and training expenditures by 10% across the board. This saved
over $200,000. • Option S - Reduce lower priority programs and services. Unfortunately, we will not be able
to provide all services at the level of years past. In many instances, we used the ranking list from your February 9th and 10th workshops as a guide in making reductions. Overall, there are 54.65 FTE’s less than the FY 2009-10 Operating Budget approved by City Council in May of 2008.
More detail will be provided later in the document, but some of the reductions include: closing the Municipal Reference Library at the Municipal Center and moving its remaining function to the Meyera E. Oberndorf Central Library; eliminating City Page and Beach Magazine; eliminating Consumer Affairs (only two other cities in the Commonwealth have this service), citizens will use the State office for their consumer related issues; reducing Community Organization Grants by 50%; reducing tuition reimbursement by 50%; eliminating the Transition Area Program due to declining real estate values in that area of the City; and reducing employee recognition programs. Obviously, some of these recommendations are short-term (i.e., substituting pay-as-you-go with fund balance); however, our strong past and current fiscal strategies have put us in a position to
Fiscal Year 2009-10 9 Executive Summary
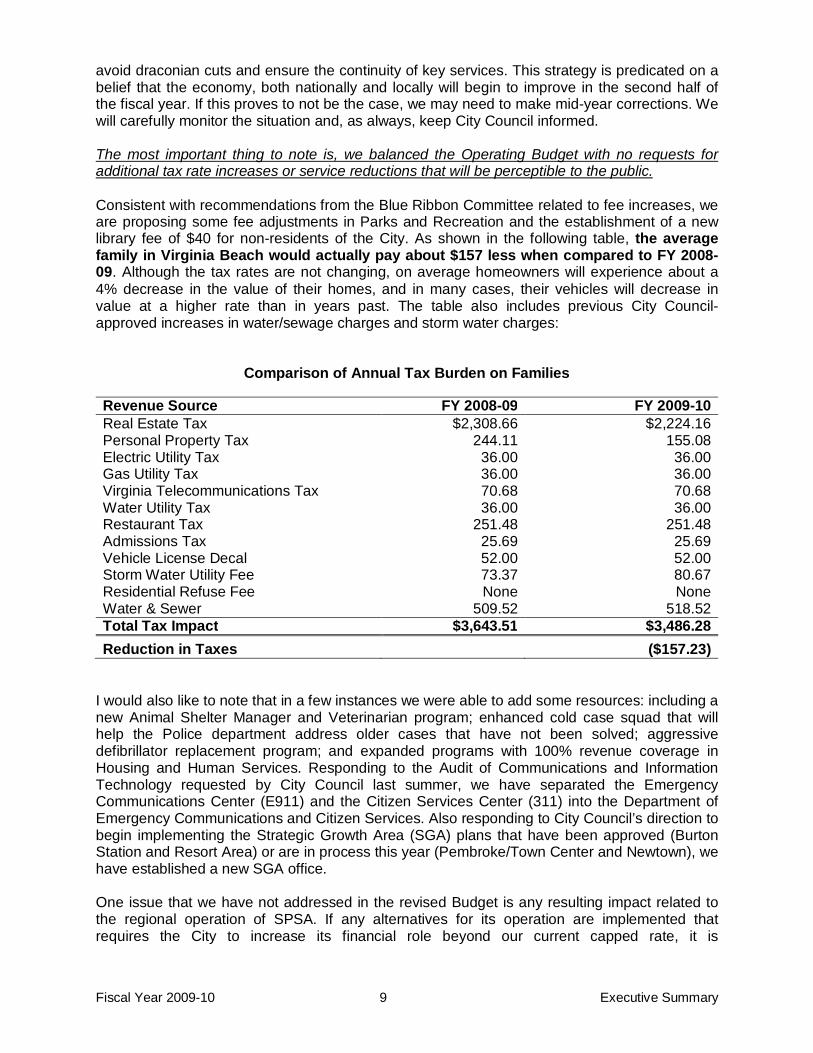
avoid draconian cuts and ensure the continuity of key services. This strategy is predicated on a belief that the economy, both nationally and locally will begin to improve in the second half of the fiscal year. If this proves to not be the case, we may need to make mid-year corrections. We will carefully monitor the situation and, as always, keep City Council informed. The most important thing to note is, we balanced the Operating Budget with no requests for additional tax rate increases or service reductions that will be perceptible to the public. Consistent with recommendations from the Blue Ribbon Committee related to fee increases, we are proposing some fee adjustments in Parks and Recreation and the establishment of a new library fee of $40 for non-residents of the City. As shown in the following table, the average family in Virginia Beach would actually pay about $157 less when compared to FY 2008-09. Although the tax rates are not changing, on average homeowners will experience about a 4% decrease in the value of their homes, and in many cases, their vehicles will decrease in value at a higher rate than in years past. The table also includes previous City Council- approved increases in water/sewage charges and storm water charges:
Comparison of Annual Tax Burden on Families
Revenue Source FY 2008-09 FY 2009-10 Real Estate Tax $2,308.66 $2,224.16 Personal Property Tax 244.11 155.08 Electric Utility Tax 36.00 36.00 Gas Utility Tax 36.00 36.00 Virginia Telecommunications Tax 70.68 70.68 Water Utility Tax 36.00 36.00 Restaurant Tax 251.48 251.48 Admissions Tax 25.69 25.69 Vehicle License Decal 52.00 52.00 Storm Water Utility Fee 73.37 80.67 Residential Refuse Fee None None Water & Sewer 509.52 518.52 Total Tax Impact $3,643.51 $3,486.28 Reduction in Taxes ($157.23)
I would also like to note that in a few instances we were able to add some resources: including a new Animal Shelter Manager and Veterinarian program; enhanced cold case squad that will help the Police department address older cases that have not been solved; aggressive defibrillator replacement program; and expanded programs with 100% revenue coverage in Housing and Human Services. Responding to the Audit of Communications and Information Technology requested by City Council last summer, we have separated the Emergency Communications Center (E911) and the Citizen Services Center (311) into the Department of Emergency Communications and Citizen Services. Also responding to City Council’s direction to begin implementing the Strategic Growth Area (SGA) plans that have been approved (Burton Station and Resort Area) or are in process this year (Pembroke/Town Center and Newtown), we have established a new SGA office. One issue that we have not addressed in the revised Budget is any resulting impact related to the regional operation of SPSA. If any alternatives for its operation are implemented that requires the City to increase its financial role beyond our current capped rate, it is

Fiscal Year 2009-10 10 Executive Summary
recommended that City Council consider the implementation of a garbage fee, which would require a lead time of about eight months to have a billing system in place to bill residents. The estimate for the pre-work needed to accomplish this is $250,000 and is not included in this budget. Compensation I would like to address employee compensation and the reduction in positions in more detail. We solicited input on two occasions last fall from employees representing multiple departments. They were asked what is important to them in the area of compensation. They indicated that their top three issues related to City benefits and pay are: (1) health care contribution for plan participants; (2) retirement – fully paid by the City; and (3) no employee layoffs. I am pleased to report that the Budget is able to support all three issues. The revised Budget maintains its financial contribution to employee health care ($5,400 per full-time employee) at a time when many employers are cutting back on their contributions. We will also maintain our contribution to employee retirement costs. The Budget, while reducing positions, does not lay off a single employee. Of the 54.65 net positions being eliminated, approximately half are filled. These employees will be transitioned to other jobs, and no employee will be laid off from their employment with the City. As discussed earlier, no pay increases for City or School employees are included in the revised Operating Budget for FY 2009-10. This will be the first year since FY 1991-92 where City employees will not receive a pay raise. In some cases, our dedicated employees will be asked do more with less due to increasing demand for services. Not providing a well deserved pay increase is not the ideal solution. However, I believe it is very important that we maintain current compensation levels and do not increase employees’ financial hardship. As a result, we do not propose furloughs or any other reduction in overall compensation. Schools While we propose an $8.8 million reduction to the Schools Reserve Fund, their Operating Budget is funded at the level approved by the School Board. In order to balance the FY 2009-10 Budget, the School Board cut or modified several programs and services. Some of the major changes include the reduction of 55.3 positions (mostly through attrition), elimination of cost of living and step increases for employees, elimination of the Galaxy after-school program at the Tri-Campus, the return of the division’s four year-round schools to a traditional schedule, the delay of the planned expansion of the Advancement Via Individual Determination (AVID) program, saving energy through reducing temperatures in buildings, using existing textbooks in many instances, and modification of the behind-the-wheel component of driver’s education by employing paraprofessionals instead of certified teachers and increasing tuition for these classes to recover costs. Like the City, the School Board replaced pay-as-you-go financing for capital projects with funding from the School Special Reserve Fund. Loss of State construction funding and lottery proceeds may delay some School construction projects if the system cannot replace these funds with Federal stimulus funding. Additionally, like the City, the School’s contribution to the GASB 45 liability will be funded by the Health Care Reserve Fund. As stated on page seven, when the School Board adopted its Budget on March 3rd, Board Members were aware of additional funding that, due to timing and limited information, could not be included in the School’s updated FY 2009-2010 Budget. This funding is comprised of $1.9 million of City Revenue Sharing Formula funds, $1.2 million in additional State funding, and $48.6 million in Federal stimulus funding. It is the School Board’s intent to allocate this funding and notify the City Council before the City Council reconciles the Budget and Capital Improvement Program on May 5th.

Fiscal Year 2009-10 11 Executive Summary
Capital Improvement Program Declining State revenues will take a particular toll on the Schools and Roadway programs. The State has reduced School construction funding and retained lottery funding instead of providing it to the localities, which has an impact on the School’s Capital Improvement Program. The State has totally eliminated roadway construction funding, and that change will have a significant impact on our local transportation network. The Capital Improvement Program for the Virginia Beach School System is reduced by $82.7 million over the next five years. The plan includes no State lottery or construction funds and no pay-as-you-go financing over the first three years. The projects most significantly impacted by these funding decreases are the replacement of Kellam High School and Princess Anne Middle School and the John B. Dey Elementary School Modernization project. It is possible that these projects could receive a portion of the unallocated Federal stimulus funds received by the School System. While the City is applying for Federal stimulus (the American Recover and Reinvestment Act of 2009) funding to offset the total elimination of State roadway construction funding, we have only been notified of $10.6 million to be used for the Witchduck I project (capital project #2-931). Because of budgetary reductions at the State level, VDOT funding for the Urban Construction Initiative (UCI) program has been totally eliminated for the period FY 2009-10 through FY 2013-14. This results in a loss of the remaining $13 million in funding directly appropriated by the City for roadway projects and the loss of $37.5 million in legacy funding provided by VDOT. As a result, construction schedules for Witchduck Road – Phase II and Nimmo Parkway – Phase V-A will be delayed at least three years. Other projects delayed beyond FY 2014 include Elbow Road – Phase II, Laskin Road – Phase II, and Indian River Road – Phase VII. Funding was transferred from these projects to ensure that higher City Council priority projects could continue to be funded and remain on schedule. Overall, the remaining sections of the Capital Budget for FY 2009-10 did not change dramatically for the six-year plan adopted by City Council last May. The following provides a summary of the revised CIP.
Capital Budget Overview (FY 2009-10 Only)
Approved
FY 2009-10 Revised
FY 2009-10 Schools $ 63,023,302 $ 52,369,308 Roadways 41,770,615 56,303,747 Buildings 15,617,797 16,778,606 Parks and Recreation 10,234,173 10,325,175 Utilities 45,916,159 46,526,159 Coastal 7,690,938 7,690,938 Economic and Tourism Development 20,120,578 20,880,578 Communications and Information Technology 5,308,760 5,254,598
Total CIP $ 209,682,322 $ 216,129,109 In a few instances, we are adding some funding: (1) as a follow-up to the briefing on March 3 regarding the Roadway Reconstruction/Resurfacing Program, we are able to add $4 million in repaving and reconstruction funding to the Roadways CIP; (2) additional funding is also added to two roadway projects, Laskin Road Gateway – Phase IA, to address revised costs and $10.6 million from Federal stimulus for Witchduck Road - Phase I; (3) funding of $150,000 ($100,000) from the Aquarium Foundation will be available for the Aquarium/Owls Creek Master Plan; (4)

Fiscal Year 2009-10 12 Executive Summary
due to the elimination of operating costs associated with the Sportsplex and US Field Hockey, we created a project for a renewal and replacement program for both facilities; and (5) $200,000 (using ARP Fund Balance) will help initiate a historic acquisition revolving fund. Closing Thoughts We predicated the underlying assumptions of this Budget on the economy making a slow recovery beginning around January 2010. This projection is consistent with recent information provided by the Federal Reserve Board and non-partisan organizations like Kiplinger. It also is consistent with the thoughts of local economists that we brought together, along with leaders from other Hampton Roads cities, to discuss economic trends impacting our communities. Obviously, any analysis of the current economy will require constant diligence on the part of our staff to ensure that we monitor revenues closely. We believe it will be increasingly difficult to forecast trends beyond the succeeding budget year, so we are proposing several changes to our fiscal policies. First, we are proposing the elimination of the Biennial Budget. When the taskforce recommended the use of a Biennial Budget system, they noted that it would only prove effective if the economy and revenue streams remained relatively stable. The significant changes we are experiencing in the second year of the biennium is making it extremely difficult to manage the Budget in an effective manner. This change will allow us to fully concentrate on any new issues that confront the City each year; however, as in the past, we will use the Five Year Forecast as an important component of looking beyond the next fiscal year. Second, I have also asked staff to develop a financial strategy document based on City Council guidance to serve as a foundation for future decisions related to the funding of key services and Capital Improvement Projects. A key component of the strategy will be a review of our debt indicators. We are also proposing the elimination of the real estate above base level requirement report that was originally proposed by former Councilmember Schmidt. This analysis was intended to show how the City proposed to use additional real estate tax revenues gained solely from rising home values. Given the poor state of the real estate market this analysis will yield little benefit over the next several years. And finally, we want to build upon the February work of City Council and the Departments to jointly prioritize programs and services so that we focus resources on services that are important to the City Council and the community. In closing, I am as optimistic about the future of Virginia Beach as I have ever been. Your steadfast vision has positioned the City to be a leader in our region during the economic recovery. As you review the proposed update to the FY 2009-10 Operating Budget, I would encourage you to stay true to your goals, to look not only at the next fiscal year, but also the impact of your collective resource decisions on the next 5, 10, and 15 years. Those decisions will truly determine our destiny as a Community for a Lifetime. In the meantime, this revised Budget draws upon increased operating efficiencies throughout the entire organization, unprecedented collaboration with Schools, reliance upon our solid financial performance and subsequent reserves to close the $103 million Budget gap ($48 million City and $55 million Schools) without compromising services to the community or increasing tax rates. As you review the proposed update to the FY 2009-10 Operating Budget, we stand ready to provide additional information and respond to your questions.

Fiscal Year 2009-10 13 Executive Summary
Schedule of Workshops and Public Hearings
Date/Time Event Location Tuesday, March 24th @ 6:00 PM
Presentation of the Proposed FY 2008-09 and FY 2009-10 Biennial Resource Management Plan Second Year Amendments
Council Chambers
Tuesday, April 7th
Council Workshop Council Conference Room
Tuesday, April 14th
Council Workshop Council Conference Room
Thursday, April 16th @ 6:00 PM
Public Hearing Green Run High School Auditorium
Tuesday, April 21st
Council Workshop Council Conference Room
Tuesday, April 28th
Council Workshop Council Conference Room
Tuesday, April 28th @ 6:00 PM
Public Hearing Council Chambers
Tuesday, May 5th
Reconciliation Workshop Council Conference Room
Tuesday, May 12th @ 6:00 PM
Public Hearing and Adoption of the FY 2008-09 and FY 2009-10 Biennial Resource Management Plan Second Year Amendments
Council Chambers

Table of Contents Operating Budget Summaries
City and Schools Revenue Summary ............................................................................................... 1 - 1 Projection of General Fund Balance ................................................................................................. 1 - 2 Calculation of Undesignated General Fund Balance Reserve ........................................................... 1 - 2 Changes in Undesignated Fund Balances ........................................................................................ 1 - 3 Revised FY 2009-10 Selected Taxes/Fees for Virginia Beach and Other Localities .......................... 1 - 4 City and School’s Expenditure Summary .......................................................................................... 1 - 4 Expenditures for FY 2009-10 ........................................................................................................... 1 - 5 FY 2009-10 Revised Expenditure Summary ..................................................................................... 1 - 6 Major FY 2009-10 Biennial Budget Revisions ................................................................................... 1 - 7 Compensation ............................................................................................................................... 1 - 19 Measuring Results ......................................................................................................................... 1 - 20 Economic Vitality ........................................................................................................................... 1 - 21 Family and Youth Opportunities ..................................................................................................... 1 - 22 Quality Physical Environment ......................................................................................................... 1 - 23 Cultural and Recreational Opportunities ......................................................................................... 1 - 24 Quality Education and Lifelong Learning ........................................................................................ 1 - 25 Safe Community ............................................................................................................................ 1 - 26 Quality Organization ...................................................................................................................... 1 - 27
Fiscal Year 2009-10 1 - 1 Operating Budget Summaries
Operating Budget
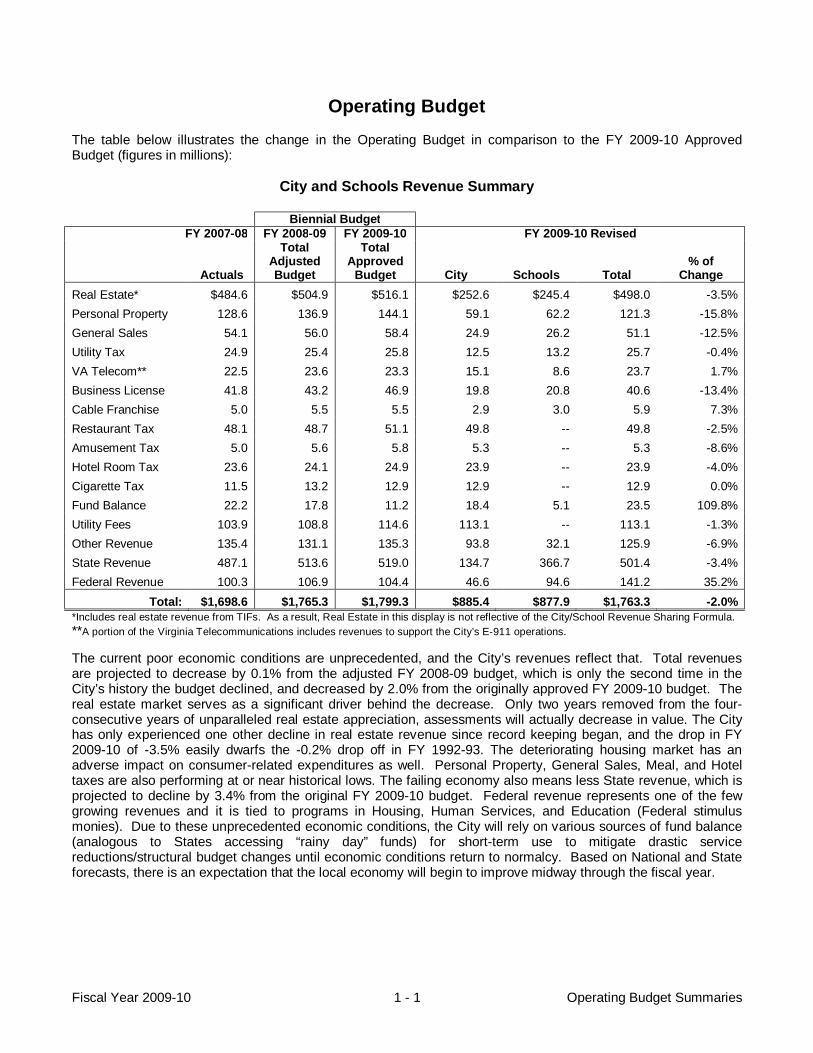
The table below illustrates the change in the Operating Budget in comparison to the FY 2009-10 Approved Budget (figures in millions):
City and Schools Revenue Summary
Biennial Budget FY 2007-08 FY 2008-09 FY 2009-10 FY 2009-10 Revised
Actuals
Total Adjusted Budget
Total Approved
Budget
City
Schools
Total
% of
Change Real Estate* $484.6 $504.9 $516.1 $252.6 $245.4 $498.0 -3.5% Personal Property 128.6 136.9 144.1 59.1 62.2 121.3 -15.8% General Sales 54.1 56.0 58.4 24.9 26.2 51.1 -12.5% Utility Tax 24.9 25.4 25.8 12.5 13.2 25.7 -0.4% VA Telecom** 22.5 23.6 23.3 15.1 8.6 23.7 1.7% Business License 41.8 43.2 46.9 19.8 20.8 40.6 -13.4% Cable Franchise 5.0 5.5 5.5 2.9 3.0 5.9 7.3% Restaurant Tax 48.1 48.7 51.1 49.8 -- 49.8 -2.5% Amusement Tax 5.0 5.6 5.8 5.3 -- 5.3 -8.6% Hotel Room Tax 23.6 24.1 24.9 23.9 -- 23.9 -4.0% Cigarette Tax 11.5 13.2 12.9 12.9 -- 12.9 0.0% Fund Balance 22.2 17.8 11.2 18.4 5.1 23.5 109.8% Utility Fees 103.9 108.8 114.6 113.1 -- 113.1 -1.3% Other Revenue 135.4 131.1 135.3 93.8 32.1 125.9 -6.9% State Revenue 487.1 513.6 519.0 134.7 366.7 501.4 -3.4% Federal Revenue 100.3 106.9 104.4 46.6 94.6 141.2 35.2%
Total: $1,698.6 $1,765.3 $1,799.3 $885.4 $877.9 $1,763.3 -2.0% *Includes real estate revenue from TIFs. As a result, Real Estate in this display is not reflective of the City/School Revenue Sharing Formula. **A portion of the Virginia Telecommunications includes revenues to support the City’s E-911 operations. The current poor economic conditions are unprecedented, and the City’s revenues reflect that. Total revenues are projected to decrease by 0.1% from the adjusted FY 2008-09 budget, which is only the second time in the City’s history the budget declined, and decreased by 2.0% from the originally approved FY 2009-10 budget. The real estate market serves as a significant driver behind the decrease. Only two years removed from the four-consecutive years of unparalleled real estate appreciation, assessments will actually decrease in value. The City has only experienced one other decline in real estate revenue since record keeping began, and the drop in FY 2009-10 of -3.5% easily dwarfs the -0.2% drop off in FY 1992-93. The deteriorating housing market has an adverse impact on consumer-related expenditures as well. Personal Property, General Sales, Meal, and Hotel taxes are also performing at or near historical lows. The failing economy also means less State revenue, which is projected to decline by 3.4% from the original FY 2009-10 budget. Federal revenue represents one of the few growing revenues and it is tied to programs in Housing, Human Services, and Education (Federal stimulus monies). Due to these unprecedented economic conditions, the City will rely on various sources of fund balance (analogous to States accessing “rainy day” funds) for short-term use to mitigate drastic service reductions/structural budget changes until economic conditions return to normalcy. Based on National and State forecasts, there is an expectation that the local economy will begin to improve midway through the fiscal year.

Fiscal Year 2009-10 1 - 2 Operating Budget Summaries
With the continued economic slowdown, the City of Virginia Beach has continued to take prudent measures to meet our fiscal responsibilities. Departments were asked to cut their already austere budgets. The City’s General Fund Balance projection for the current fiscal year 2009, shown below indicates that the City will have approximately 8.53% of Undesignated Fund Balance as compared to FY 2009-10 revenues. The City’s policy is 8 to 12% of next year’s revenue with a goal of 10%.
Projection of General Fund Balance Beginning Fund Balance at July 1, 2008 (CAFR)
$ 193,065,041
Add: Revenues: • FY 2008-09 General Fund Revenues-Revised Estimate • School Reserves • Surplus from Sandbridge TIF
$1,042,602,518 8,800,000
9,000,000
1,060,402,518 Total Fund Balance and Revenues
$1,253,467,559
Less: Anticipated FY 2008-09 Expenditures: • Operating Expenditures • School Operations* • Other Transfers • SPSA Forbearance Cost
$ 499,740,144 339,239,378 257,133,705 11,200,000
1,107,313,227
Total Projected Fund Balance at June 30, 2009
$ 146,154,332
Less: Anticipated Uses of Fund Balance: • Loans, Advances, and Prepaids • Encumbrances • General Fund Use for Future Programs • School’s Share of Reduced Funding Formula Revenues • General Fund Operations • Norfolk Southern Right-of-Way • FY 2009-10 Capital Budget
$ 11,300,000 5,700,000 6,949,371
- 5,650,087 4,800,000
10,000,000 23,912,998
57,012,282
Total Estimated Undesignated Fund Balance at June 30, 2009
$ 89,142,050
Calculation of Undesignated General Fund Balance Reserve Projected FY 2009-10 General Fund Revenues $1,044,777,284
Undesignated Fund Balance as a Percentage of FY 2009-10 Revenues 8.53% * Reflects full transfer to Schools
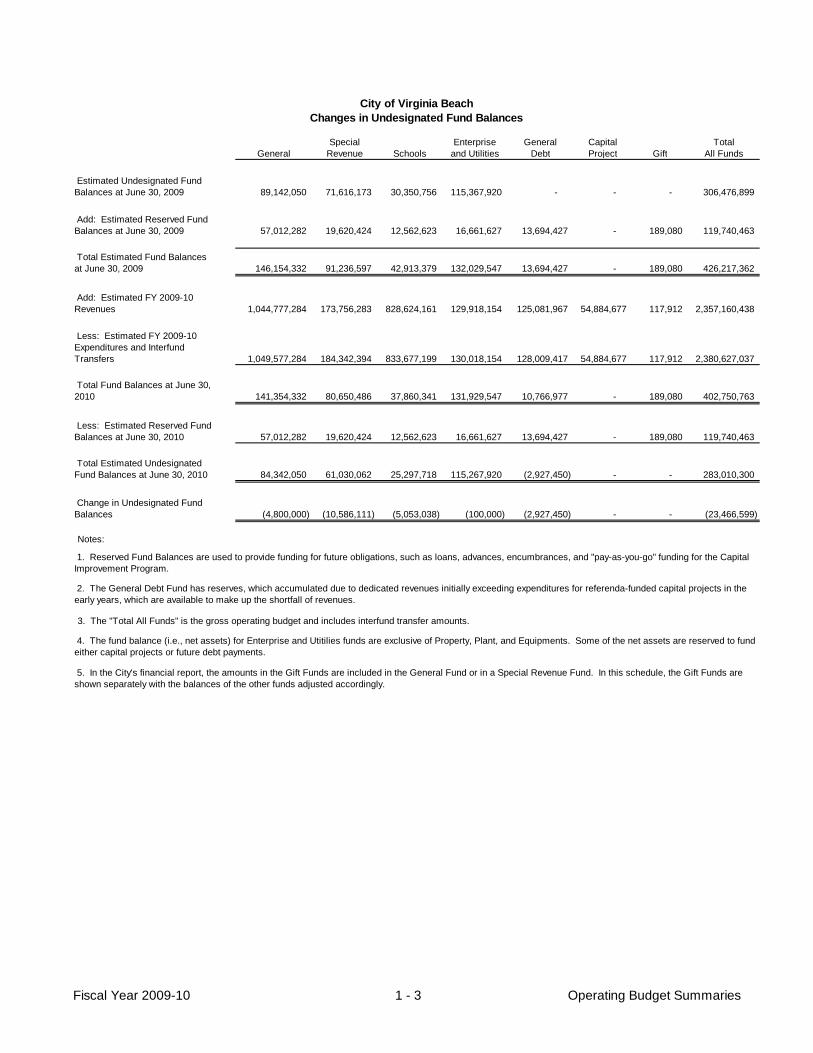
Special Enterprise General Capital TotalGeneral Revenue Schools and Utilities Debt Project Gift All Funds
89,142,050 71,616,173 30,350,756 115,367,920 - - - 306,476,899
57,012,282 19,620,424 12,562,623 16,661,627 13,694,427 - 189,080 119,740,463
146,154,332 91,236,597 42,913,379 132,029,547 13,694,427 - 189,080 426,217,362
1,044,777,284 173,756,283 828,624,161 129,918,154 125,081,967 54,884,677 117,912 2,357,160,438
1,049,577,284 184,342,394 833,677,199 130,018,154 128,009,417 54,884,677 117,912 2,380,627,037
141,354,332 80,650,486 37,860,341 131,929,547 10,766,977 - 189,080 402,750,763
57,012,282 19,620,424 12,562,623 16,661,627 13,694,427 - 189,080 119,740,463
84,342,050 61,030,062 25,297,718 115,267,920 (2,927,450) - - 283,010,300
(4,800,000) (10,586,111) (5,053,038) (100,000) (2,927,450) - - (23,466,599)
Notes:
3. The "Total All Funds" is the gross operating budget and includes interfund transfer amounts.
City of Virginia BeachChanges in Undesignated Fund Balances
1. Reserved Fund Balances are used to provide funding for future obligations, such as loans, advances, encumbrances, and "pay-as-you-go" funding for the Capital Improvement Program.
2. The General Debt Fund has reserves, which accumulated due to dedicated revenues initially exceeding expenditures for referenda-funded capital projects in the early years, which are available to make up the shortfall of revenues.
Less: Estimated FY 2009-10 Expenditures and Interfund Transfers
Change in Undesignated Fund Balances
Less: Estimated Reserved Fund Balances at June 30, 2010
Total Estimated Undesignated Fund Balances at June 30, 2010
Add: Estimated Reserved Fund Balances at June 30, 2009
5. In the City's financial report, the amounts in the Gift Funds are included in the General Fund or in a Special Revenue Fund. In this schedule, the Gift Funds are shown separately with the balances of the other funds adjusted accordingly.
Total Estimated Fund Balances at June 30, 2009
Estimated Undesignated Fund Balances at June 30, 2009
Add: Estimated FY 2009-10 Revenues
Total Fund Balances at June 30, 2010
4. The fund balance (i.e., net assets) for Enterprise and Utitilies funds are exclusive of Property, Plant, and Equipments. Some of the net assets are reserved to fund either capital projects or future debt payments.
Fiscal Year 2009-10 1 - 3 Operating Budget Summaries
Fiscal Year 2009-10 1 - 4 Operating Budget Summaries
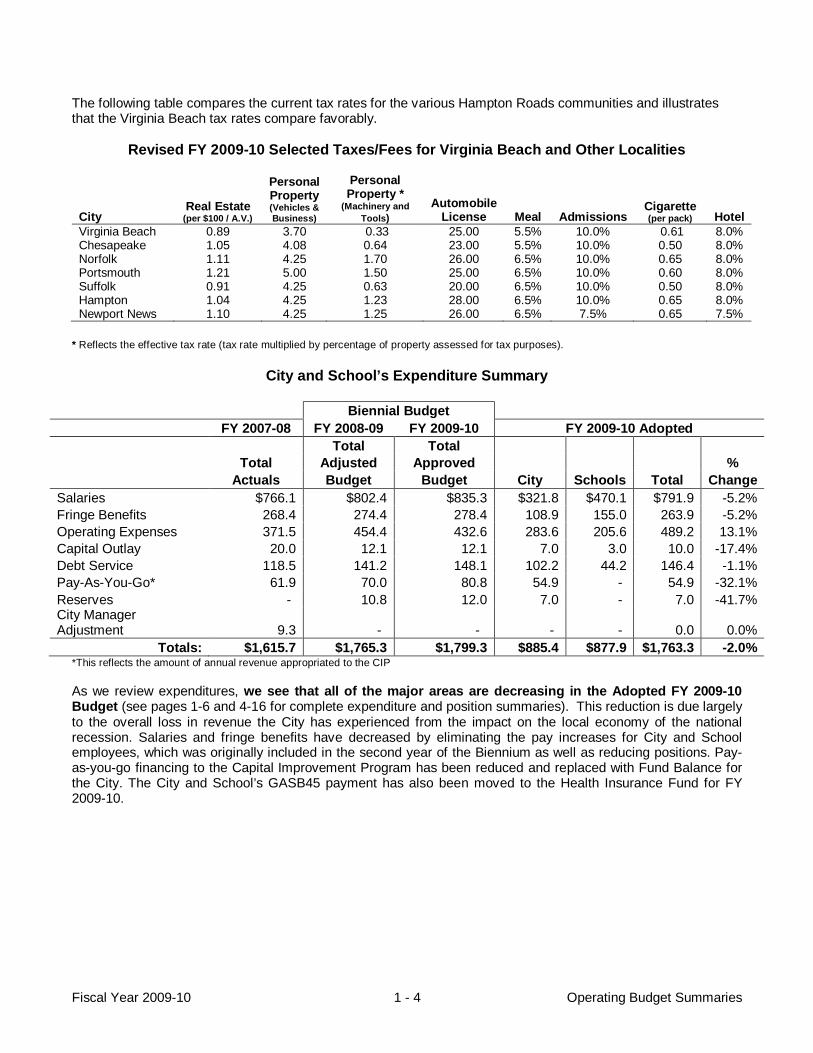
The following table compares the current tax rates for the various Hampton Roads communities and illustrates that the Virginia Beach tax rates compare favorably.
Revised FY 2009-10 Selected Taxes/Fees for Virginia Beach and Other Localities
City Real Estate
(per $100 / A.V.)
Personal Property (Vehicles & Business)
Personal Property *
(Machinery and Tools)
Automobile License Meal
Admissions
Cigarette (per pack) Hotel
Virginia Beach 0.89 3.70 0.33 25.00 5.5% 10.0% 0.61 8.0% Chesapeake 1.05 4.08 0.64 23.00 5.5% 10.0% 0.50 8.0% Norfolk 1.11 4.25 1.70 26.00 6.5% 10.0% 0.65 8.0% Portsmouth 1.21 5.00 1.50 25.00 6.5% 10.0% 0.60 8.0% Suffolk 0.91 4.25 0.63 20.00 6.5% 10.0% 0.50 8.0% Hampton 1.04 4.25 1.23 28.00 6.5% 10.0% 0.65 8.0% Newport News 1.10 4.25 1.25 26.00 6.5% 7.5% 0.65 7.5%
* Reflects the effective tax rate (tax rate multiplied by percentage of property assessed for tax purposes).
City and School’s Expenditure Summary
Biennial Budget FY 2007-08 FY 2008-09 FY 2009-10 FY 2009-10 Adopted Total Total Total Adjusted Approved % Actuals Budget Budget City Schools Total Change Salaries $766.1 $802.4 $835.3 $321.8 $470.1 $791.9 -5.2% Fringe Benefits 268.4 274.4 278.4 108.9 155.0 263.9 -5.2% Operating Expenses 371.5 454.4 432.6 283.6 205.6 489.2 13.1% Capital Outlay 20.0 12.1 12.1 7.0 3.0 10.0 -17.4% Debt Service 118.5 141.2 148.1 102.2 44.2 146.4 -1.1% Pay-As-You-Go* 61.9 70.0 80.8 54.9 - 54.9 -32.1% Reserves - 10.8 12.0 7.0 - 7.0 -41.7% City Manager Adjustment 9.3 - - - - 0.0 0.0%
Totals: $1,615.7 $1,765.3 $1,799.3 $885.4 $877.9 $1,763.3 -2.0% *This reflects the amount of annual revenue appropriated to the CIP As we review expenditures, we see that all of the major areas are decreasing in the Adopted FY 2009-10 Budget (see pages 1-6 and 4-16 for complete expenditure and position summaries). This reduction is due largely to the overall loss in revenue the City has experienced from the impact on the local economy of the national recession. Salaries and fringe benefits have decreased by eliminating the pay increases for City and School employees, which was originally included in the second year of the Biennium as well as reducing positions. Pay-as-you-go financing to the Capital Improvement Program has been reduced and replaced with Fund Balance for the City. The City and School’s GASB45 payment has also been moved to the Health Insurance Fund for FY 2009-10.

Fiscal Year 2009-10 1 - 5 Operating Budget Summaries
The pie graph chart below, illustrates the breakdown of the $1.76 billion budget by major service areas. As can be seen, 49.8% goes to education and the next largest amount goes to Public Safety and Public Works respectively. The national financial crisis and negative growth in major revenue streams has meant a net reduction of over 99.95 positions for both City and Schools (see pages 4-6 for a full list of position additions and reductions).
Expenditures for FY 2009-10
General Government5.6%
Parks & Rec/Libraries/
Museums4.0%
Public Safety11.3%
Convention & Economic
1.6%
City Debt Service5.8%
Education (includes Schools Debt
Service)49.8%
Family & Youth8.1%
City Capital Projects3.1%
Public Works/Public Utilities9.5%
Financial1.2%

FY 2008-09 FY 2009-10 FY 2009-10FY 2007-08 Adjusted Approved % Total %
Actuals Budget Budget Change Adopted Change
Agriculture 916,773 1,042,014 1,009,032 -3.2% 1,019,961 1.1%Capital Projects 49,742,528 56,078,423 66,566,123 18.7% 54,884,677 -17.5%City Auditor 539,256 541,393 545,068 0.7% 576,573 5.8%City Manager 3,625,131 3,619,081 3,702,821 2.3% 3,069,307 -17.1%City Real Estate Assessor 2,826,568 3,142,332 3,213,787 2.3% 3,133,422 -2.5%City Treasurer 5,037,415 5,193,384 5,257,326 1.2% 5,186,382 -1.3%Commissioner of the Revenue 3,885,346 3,929,241 4,008,111 2.0% 3,942,320 -1.6%Commonwealth's Attorney 7,262,036 8,010,576 8,097,827 1.1% 7,887,501 -2.6%Communications and Information Technology 17,974,187 20,564,191 20,953,619 1.9% 21,903,513 4.5%Convention and Visitor Bureau 23,677,507 24,840,363 25,512,972 2.7% 24,886,332 -2.5%Courts and Courts' Support 6,210,180 6,733,320 6,820,291 1.3% 6,759,424 -0.9%Debt Service 78,243,682 100,027,282 104,263,203 4.2% 102,225,759 -2.0%Economic Development 3,000,115 4,137,535 4,149,992 0.3% 3,856,775 -7.1%Education 816,755,773 877,520,112 887,882,652 1.2% 877,860,873 -1.1%Emergency Communications and 10,197,546 10,579,505 10,813,072 2.2% 9,168,294 -15.2% Citizen ServicesEmergency Medical Services 7,165,538 7,301,342 7,475,968 2.4% 7,552,217 1.0%FY 2008 Outstanding Encumbrances 8,069,023 0 0 0.0% 0 0.0%Finance 4,805,180 4,420,631 4,546,228 2.8% 5,022,497 10.5%Fire 42,241,859 43,308,729 44,446,717 2.6% 43,252,979 -2.7%General Registrar 1,354,019 1,379,042 1,271,821 -7.8% 1,264,732 -0.6%Health 3,232,255 3,399,228 3,498,846 2.9% 3,453,359 -1.3%Housing and Neighborhood Preservation 22,161,397 22,938,865 21,254,956 -7.3% 25,613,824 20.5%Human Resources 4,395,298 4,636,972 4,736,383 2.1% 4,536,071 -4.2%Human Services 89,908,112 111,415,624 115,431,495 3.6% 114,232,805 -1.0%Law 3,719,805 3,894,926 3,985,293 2.3% 3,875,841 -2.7%Legislative 1,184,519 1,209,226 1,227,505 1.5% 1,213,268 -1.2%Library 15,963,313 16,873,619 17,232,219 2.1% 16,904,665 -1.9%Management Services 3,677,867 4,164,595 4,010,821 -3.7% 4,034,514 0.6%Museums 7,814,897 9,173,990 9,784,824 6.7% 9,631,189 -1.6%Non-Departmental 35,115,129 31,185,201 32,554,778 4.4% 31,830,370 -2.2%Parks and Recreation 39,715,598 42,983,859 43,823,805 2.0% 42,497,222 -3.0%Planning and Community Development 13,242,919 14,005,331 14,193,992 1.3% 13,948,469 -1.7%Police 86,695,598 87,605,689 89,417,705 2.1% 87,716,784 -1.9%Public Utilities 66,411,552 68,464,336 70,009,890 2.3% 68,837,653 -1.7%Public Works 94,273,782 97,016,660 98,167,633 1.2% 98,349,569 0.2%Reserve for Contingencies 0 15,630,979 11,976,527 -23.4% 6,969,217 -41.8%Future C.I.P. Commitments 0 11,529,372 11,587,914 0.5% 10,200,140 -12.0%Sheriff and Corrections 34,671,966 36,769,449 35,823,293 -2.6% 35,994,181 0.5%
TOTAL EXPENDITURES 1,615,713,669 1,765,266,417 1,799,254,509 1.9% 1,763,292,679 -2.0%
City of Virginia Beach, VirginiaFiscal Year 2009-10 Revised Expenditure Summary
Department Name
Fiscal Year 2009-10 1 - 6 Operating Budget Summaries
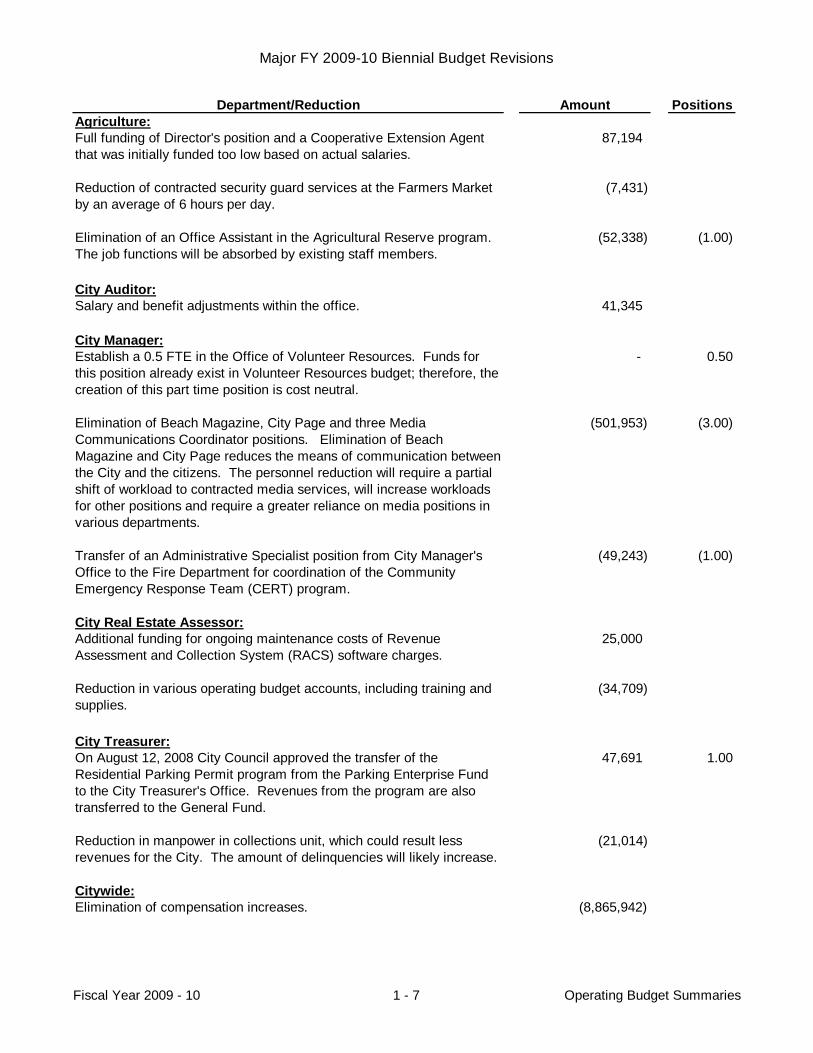
Major FY 2009-10 Biennial Budget Revisions
Department/Reduction Amount PositionsAgriculture:Full funding of Director's position and a Cooperative Extension Agent that was initially funded too low based on actual salaries.
87,194
Reduction of contracted security guard services at the Farmers Market by an average of 6 hours per day.
(7,431)
Elimination of an Office Assistant in the Agricultural Reserve program. The job functions will be absorbed by existing staff members.
(52,338) (1.00)
City Auditor:Salary and benefit adjustments within the office. 41,345
City Manager:Establish a 0.5 FTE in the Office of Volunteer Resources. Funds for this position already exist in Volunteer Resources budget; therefore, the creation of this part time position is cost neutral.
- 0.50
Elimination of Beach Magazine, City Page and three Media Communications Coordinator positions. Elimination of Beach Magazine and City Page reduces the means of communication between the City and the citizens. The personnel reduction will require a partial shift of workload to contracted media services, will increase workloads for other positions and require a greater reliance on media positions in various departments.
(501,953) (3.00)
Transfer of an Administrative Specialist position from City Manager's Office to the Fire Department for coordination of the Community Emergency Response Team (CERT) program.
(49,243) (1.00)
City Real Estate Assessor:Additional funding for ongoing maintenance costs of Revenue Assessment and Collection System (RACS) software charges.
25,000
Reduction in various operating budget accounts, including training and supplies.
(34,709)
City Treasurer:On August 12, 2008 City Council approved the transfer of the Residential Parking Permit program from the Parking Enterprise Fund to the City Treasurer's Office. Revenues from the program are also transferred to the General Fund.
47,691 1.00
Reduction in manpower in collections unit, which could result less revenues for the City. The amount of delinquencies will likely increase.
(21,014)
Citywide:Elimination of compensation increases. (8,865,942)
Fiscal Year 2009 - 10 1 - 7 Operating Budget Summaries

Major FY 2009-10 Biennial Budget Revisions
Department/Reduction Amount PositionsCitywide (continued):Reduction in Virginia Retirement System (VRS) Life Insurance costs due to a slightly lower rate approved as a part of the State's budget.
(77,020)
Move the City's portion of the GASB45 liability to the Health Insurance Fund, which has sufficient fund balance to cover the City and School's portion.
(4,000,000)
10% Reduction to all training and travel budgets. (220,498)
Suspension of Transition Area Special Revenue Fund. (748,977)
Reduction in capital projects pay-as-you-go funding, including substitution of fund balance of the General Fund ($10 million); Schools ($13.9 million); Water and Sewer ($0.5 million); reduction in dedicated funding for Parks and Recreation ($0.8 million); Storm Water Utility ($0.3 million).
(25,617,754)
Transfer from Major Projects and General Fund to the Central Business TIF - South.
500,000
Increased funding for electrical charges and fuel in a dedicated reserve. 1,000,000
Reduction in Debt Service for ARP and Water and Sewer. (1,685,437)
Reduction in Reserve for Contingencies, primarily Sandbridge and Town Center TIFs, Agriculture Reserve program, and Tourism Growth Investment Fund (TGIF).
(2,992,084)
Commissioner of the Revenue:Additional funding for postal services based on previous levels of usage and additonal part-time Account Clerk for the DMV Select unit (100% supported by fee revenue).
37,500 0.44
Reduction in part-time manpower, necessitating permanent staff to process State income. This will slow the processing of other office functions, possibly affecting customer service levels.
(18,903)
Commonwealth's Attorney:Two full-time positions (Attorney and Victim Witness Caseworker) approved by Council in mid-year FY 2008-09 added from an expired grant.
135,792 2.00
Reduction of services in Consumer Affairs Office including the elimination of one full-time position. The department ranked this program farthest from its mission. This service is offered by the State and Virginia Beach is one of a few communities that provided local services. The impact of not funding this service may be that citizens could experience delays in addressing complaints.
(96,000) (1.00)
Fiscal Year 2009 - 10 1 - 8 Operating Budget Summaries
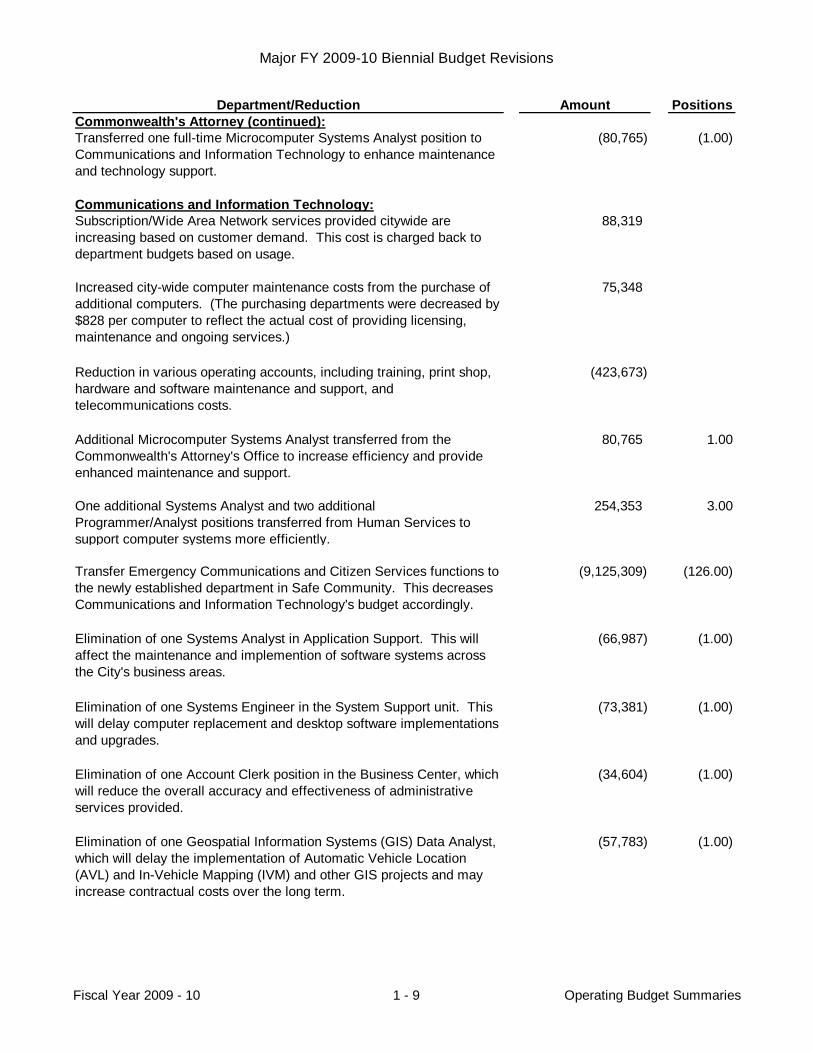
Major FY 2009-10 Biennial Budget Revisions
Department/Reduction Amount PositionsCommonwealth's Attorney (continued):Transferred one full-time Microcomputer Systems Analyst position to Communications and Information Technology to enhance maintenance and technology support.
(80,765) (1.00)
Communications and Information Technology:Subscription/Wide Area Network services provided citywide are increasing based on customer demand. This cost is charged back to department budgets based on usage.
88,319
Increased city-wide computer maintenance costs from the purchase of additional computers. (The purchasing departments were decreased by $828 per computer to reflect the actual cost of providing licensing, maintenance and ongoing services.)
75,348
Reduction in various operating accounts, including training, print shop, hardware and software maintenance and support, and telecommunications costs.
(423,673)
Additional Microcomputer Systems Analyst transferred from the Commonwealth's Attorney's Office to increase efficiency and provide enhanced maintenance and support.
80,765 1.00
One additional Systems Analyst and two additional Programmer/Analyst positions transferred from Human Services to support computer systems more efficiently.
254,353 3.00
Transfer Emergency Communications and Citizen Services functions to the newly established department in Safe Community. This decreases Communications and Information Technology's budget accordingly.
(9,125,309) (126.00)
Elimination of one Systems Analyst in Application Support. This will affect the maintenance and implemention of software systems across the City's business areas.
(66,987) (1.00)
Elimination of one Systems Engineer in the System Support unit. This will delay computer replacement and desktop software implementations and upgrades.
(73,381) (1.00)
Elimination of one Account Clerk position in the Business Center, which will reduce the overall accuracy and effectiveness of administrative services provided.
(34,604) (1.00)
Elimination of one Geospatial Information Systems (GIS) Data Analyst, which will delay the implementation of Automatic Vehicle Location (AVL) and In-Vehicle Mapping (IVM) and other GIS projects and may increase contractual costs over the long term.
(57,783) (1.00)
Fiscal Year 2009 - 10 1 - 9 Operating Budget Summaries

Major FY 2009-10 Biennial Budget Revisions
Department/Reduction Amount PositionsCommunications and Information Technology (continued):Increased contracted manpower for the Business Center to improve efficiencies.
15,259
Convention and Visitor Bureau:Reduction in operating and maintenance accounts in the Virginia Beach Convention Center budget to reflect current convention-related revenues.
(356,635) (1.82)
On August 12, 2008 City Council approved the transfer of the Residential Parking Permit program from the Parking Enterprise Fund to the City Treasurer's Office. Revenues from the program were also transferred to the General Fund.
(47,691) (1.00)
Elimination of Event Supervisor and Stagehand positions with the workload absorbed within existing staff.
(127,368) (2.00)
Increased funding for the Neptune Festival ($50,000) resulting in a total of $250,000.
50,000
Courts and Courts' Support:Clerk of the Circuit Court: City operating budget reduction in contracted manpower with the workload absorbed within existing staff.
(33,831)
Economic Development:Funding for the Strategic Growth Area Plan is being moved from the Operating Budget to the Capital Improvement Program.
(500,000)
Reduction in operating accounts, including travel, minority business intiatives, and advertising.
(28,979)
Elimination of Administrative Specialist position, which will result in the elimination of research within the department.
(74,382) (1.00)
Additional funding for Town Center Special Service District Parking Operations (100% funded by SSD revenue).
301,347
Additional funding for the Central Business District TIF (100% funded by TIF-generated revenues).
300,000
Fiscal Year 2009 - 10 1 - 10 Operating Budget Summaries
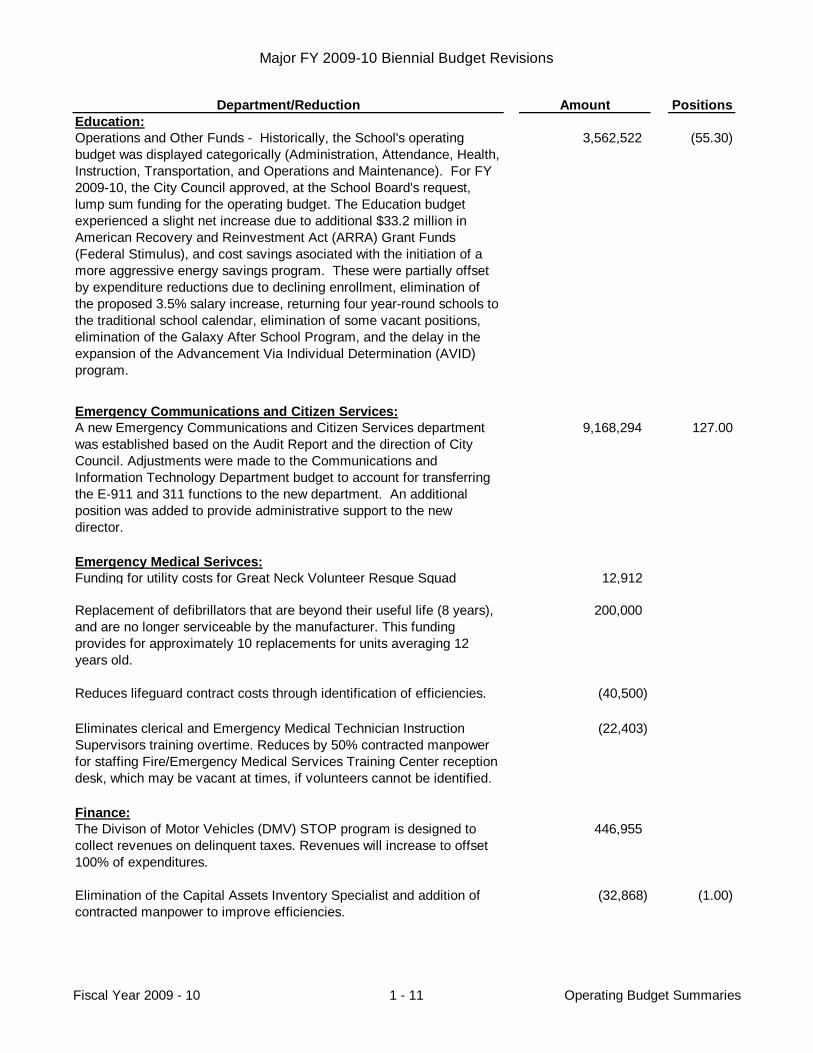
Major FY 2009-10 Biennial Budget Revisions
Department/Reduction Amount PositionsEducation:Operations and Other Funds - Historically, the School's operating budget was displayed categorically (Administration, Attendance, Health, Instruction, Transportation, and Operations and Maintenance). For FY 2009-10, the City Council approved, at the School Board's request, lump sum funding for the operating budget. The Education budget experienced a slight net increase due to additional $33.2 million in American Recovery and Reinvestment Act (ARRA) Grant Funds (Federal Stimulus), and cost savings asociated with the initiation of a more aggressive energy savings program. These were partially offset by expenditure reductions due to declining enrollment, elimination of the proposed 3.5% salary increase, returning four year-round schools to the traditional school calendar, elimination of some vacant positions, elimination of the Galaxy After School Program, and the delay in the expansion of the Advancement Via Individual Determination (AVID) program.
3,562,522 (55.30)
Emergency Communications and Citizen Services:A new Emergency Communications and Citizen Services department was established based on the Audit Report and the direction of City Council. Adjustments were made to the Communications and Information Technology Department budget to account for transferring the E-911 and 311 functions to the new department. An additional position was added to provide administrative support to the new director.
9,168,294 127.00
Emergency Medical Serivces:Funding for utility costs for Great Neck Volunteer Resque Squad 12,912
Replacement of defibrillators that are beyond their useful life (8 years), and are no longer serviceable by the manufacturer. This funding provides for approximately 10 replacements for units averaging 12 years old.
200,000
Reduces lifeguard contract costs through identification of efficiencies. (40,500)
Eliminates clerical and Emergency Medical Technician Instruction Supervisors training overtime. Reduces by 50% contracted manpower for staffing Fire/Emergency Medical Services Training Center reception desk, which may be vacant at times, if volunteers cannot be identified.
(22,403)
Finance:The Divison of Motor Vehicles (DMV) STOP program is designed to collect revenues on delinquent taxes. Revenues will increase to offset 100% of expenditures.
446,955
Elimination of the Capital Assets Inventory Specialist and addition of contracted manpower to improve efficiencies.
(32,868) (1.00)
Fiscal Year 2009 - 10 1 - 11 Operating Budget Summaries
Major FY 2009-10 Biennial Budget Revisions
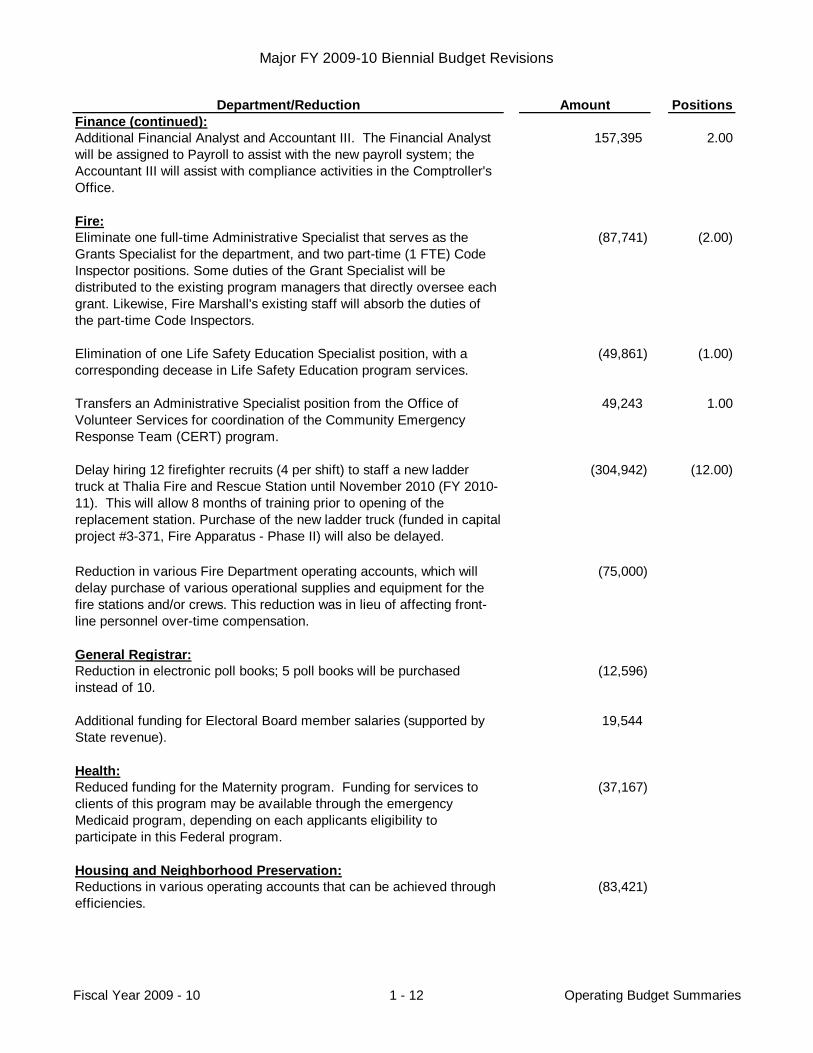
Department/Reduction Amount PositionsFinance (continued):Additional Financial Analyst and Accountant III. The Financial Analyst will be assigned to Payroll to assist with the new payroll system; the Accountant III will assist with compliance activities in the Comptroller's Office.
157,395 2.00
Fire:Eliminate one full-time Administrative Specialist that serves as the Grants Specialist for the department, and two part-time (1 FTE) Code Inspector positions. Some duties of the Grant Specialist will be distributed to the existing program managers that directly oversee each grant. Likewise, Fire Marshall's existing staff will absorb the duties of the part-time Code Inspectors.
(87,741) (2.00)
Elimination of one Life Safety Education Specialist position, with a corresponding decease in Life Safety Education program services.
(49,861) (1.00)
Transfers an Administrative Specialist position from the Office of Volunteer Services for coordination of the Community Emergency Response Team (CERT) program.
49,243 1.00
Delay hiring 12 firefighter recruits (4 per shift) to staff a new ladder truck at Thalia Fire and Rescue Station until November 2010 (FY 2010-11). This will allow 8 months of training prior to opening of the replacement station. Purchase of the new ladder truck (funded in capital project #3-371, Fire Apparatus - Phase II) will also be delayed.
(304,942) (12.00)
Reduction in various Fire Department operating accounts, which will delay purchase of various operational supplies and equipment for the fire stations and/or crews. This reduction was in lieu of affecting front-line personnel over-time compensation.
(75,000)
General Registrar:Reduction in electronic poll books; 5 poll books will be purchased instead of 10.
(12,596)
Additional funding for Electoral Board member salaries (supported by State revenue).
19,544
Health:Reduced funding for the Maternity program. Funding for services to clients of this program may be available through the emergency Medicaid program, depending on each applicants eligibility to participate in this Federal program.
(37,167)
Housing and Neighborhood Preservation:Reductions in various operating accounts that can be achieved through efficiencies.
(83,421)
Fiscal Year 2009 - 10 1 - 12 Operating Budget Summaries

Major FY 2009-10 Biennial Budget Revisions
Department/Reduction Amount PositionsHousing and Neighborhood Preservation (continued):Decreases in estimated revenue from loans and fees earned from Community Development Block Grant funds due to decreased housing activity.
(36,250)
Increased estimated revenue from the HOME program funds for additional housing assistance.
50,000
Increased estimated revenue from Federal Section 8 revenue due to additional federal funding for rental housing assistance Housing Choice Voucher program.
4,614,966
Reduced administrative support and analysis that will be absorbed to the extent possible within existing staff.
(77,385) (1.00)
Human Resources:Reduced Occupational Safety Manager position to entry level. (26,000)
Reduced funding in training, print shop, postal services and e-learning. (17,428)
Elimination of HR Analyst in Staffing and Compensation Services, which will shift work to other staff members.
(55,948) (1.00)
Human Services:Elimination of the State and Local Hospitalization program. The General Assembly eliminated this program to cover indigent hospitalization, which required local matching funds.
(100,470)
Elimination of grant-funded positions including one full-time Accountant position and part-time (2.0 FTE) Social Worker positions. There were corresponding revenue reductions. Service impacts are not anticipated as these were not filled positions.
(66,988) (3.00)
Elimination of an Operations Coordinator, Office Assistant, part-time Counselors and supplies at the Juvenile Detention Center.
(292,881) (5.73)
Elimination of Quality Assurance Clinician, Administrative Assistant and Mental Retardation Assistant positions.
(134,710) (3.00)
Reduction in Emergency Support for Mental Retardation Clients - This will reduce the funds available to provide short term supports to individuals on our waiting list for Medicaid waiver services. This will impact consumers in need of supported residential, day support and employment services.
(68,187)
Shifting one Systems Analyst and two Programmer/Analysts to ComIT. (254,353) (3.00)
Reduction in Contractual Services and Software Maintenance Expenses in the Administrative division which will freeze software enhancements for reporting tools.
(47,367)
Fiscal Year 2009 - 10 1 - 13 Operating Budget Summaries

Major FY 2009-10 Biennial Budget Revisions
Department/Reduction Amount PositionsHuman Services (continued):Reduction of Contractual Mental Health Services and Medical Supplies in Mental Health and Substance Abuse division - Reduction of 780 contracted psychiatric therapy hours provided to 40 seriously mentally ill individuals. Reduction of medical supplies and prevention training that will impact 60 consumers with Mental Health and Substance Abuse disabilities. This will also increase the potential for longer waiting lists.
(97,700)
Reduction in Contractual Services for the Social Services division which affects City supplements for in-home companion services to the elderly. Current income eligibility requirements is 60% of the State median income. Services to 29 elderly residents will be terminated in order to bring expenditures back in line with State allocations.
(136,124)
Additional Child Care, Foster Care & Adoption Services (100% offset by State revenue).
601,143
Mandated Outpatient Treatment (100% offset by State revenue). 397,790 6.05
Mental Health Child & Youth Services (100% offset by State revenue). 75,000
Jail Diversion program (100% offset by State revenue). 147,000
Law:Salary and benefit adjustments within the office. (22,217)
Library:The Municipal Reference Library is being relocated to Central Library. Savings will be realized with little or no disruption in service delivery.
(164,000) (2.00)
Ready to Learn program - Program was inadvertently not included in the second year of the biennium FY 2009-10 budget.
28,968
Collection Management - This will replace funding for books and other library materials that have been reduced over the past two fiscal years.
75,000
Increased bandwidth to remote library internal network computers. Staff has experienced reduced productivity from the lack of bandwidth at each of the remote sites. The increase will be offset by revenue generated from the E-Rate program.
29,370
Management Services:Elimination of one Administrative Specialist position. New software and realignment of duties will allow the office to maintain services.
(65,556) (1.00)
Emergency Medical Services building lease was added by City Council during FY 2008-09. This lease is also needed for FY 2009-10.
156,556
Fiscal Year 2009 - 10 1 - 14 Operating Budget Summaries

Major FY 2009-10 Biennial Budget Revisions
Department/Reduction Amount PositionsManagement Services (continued):Eliminate the Citywide My Idea Works program. This eliminates the coordination of city-wide employee suggestions, while maintaining departmental suggestion programs. This program was ranked farthest from the core mission of the department.
(13,260)
Museums:Additional Veterinary Technician position to perform certain medical procedures on the Aquarium animals by City staff and will reduce the reliance on contractual veterinary services.
37,100 1.00
Reduction of various operating accounts. (11,039)
Increase in minimum wage based on Federal law. This increase is effective July 2009.
3,617
Reduction of an Educator position at the Lynnhaven House. (49,861) (1.00)
Non-Departmental:Reduction in original budgeted cost of retiree health care based on current trends in expenditures and decreased number of new retirees.
(150,000)
Reduction in original budgeted cost of Elderly and Disabled Tax Relief due to declining real estate assessments.
(350,000)
Appropriates the remaining fund balance for Arts and Humanities Commission from closed out Special Revenue Fund.
37,237
Additional funding for Contemporary Arts Center Utility grant. 18,650
Reduction in Sandler Center catering contract. (12,000)
Reduction in education support staff costs from the Virginia Arts Festival to plan and execute educational programming. Existing staff will be utilized.
(17,792)
50% reduction in Tuition Reimbursement program. Given rising tuition costs, this will mean lower reimbursements to employees for classes and fewer employees will be able to participate in the program. This program was ranked lower by the department.
(218,484)
Elimination of Peer Recognition and Class Act Awards for employees; limited Employee Service Awards program (recognition of longevity with the City). This program was ranked lower by the department.
(60,000)
50% reduction in Community Organization Grant-Incentives program. Due to reduced number of grant applications, no adverse service impact is expected for FY 2009-10. This program was ranked lower by the department.
(169,672)
Fiscal Year 2009 - 10 1 - 15 Operating Budget Summaries

Major FY 2009-10 Biennial Budget Revisions
Department/Reduction Amount PositionsNon-Departmental (continued):Creation of a Stragetic Growth Area Office to address the coordination and implementation of the various SGA plans.
194,650 2.00
Parks and Recreation:Elimination of coordination of the Boy's Baseball program due to duplication of services with private leagues.
(23,155)
Minor reductions in various operating accounts for Landscape Services. (80,451)
Reduction, through reclassifying, in part-time recreation positions that can be achieved through efficiencies.
(73,415) (2.09)
Funding for part-time positions impacted by Federal increase in minimum wage that is effective July 2009.
36,873
Elimination of Sportsplex Operating Budget due to private management contact for operations.
(346,607) (2.00)
Reduction of positions to entry level. (54,920)
Planning and Community Development:Increased funding to Hampton Roads Transit the Tourism Growth Investment Fund (TGIF). There are no new services being provided; this increase is the result of union contract pay raises, reduction in State funding, and Virginia Beach fare box revenues being down.
136,009
Reduced funding for the Zoning Board of Appeals. The Zoning Board of Appeals meets fewer times throughout the years, as a result, fewer supplies and materials are needed.
(6,014)
Elimination of one Planning Aide and one Code Inspector position. A decrease in work demand related in the decline in home construction will allow for the responsibilities of these positions to be absorbed by other employees.
(114,787) (2.00)
Reduced funding for media advertisements, print shop charges, and postal services resulting from more efficient operational processes.
(48,845)
Police:Funding for a new Animal Care Shelter Manager position, which was added by City Council in FY 2008-09. This position is going to manage and oversee the care of animals and operations of the animal control shelter.
91,591 1.00
Contractual funding for veterinary services to provide medical treatment to shelter animals and administer animal inoculations.
130,000
Fiscal Year 2009 - 10 1 - 16 Operating Budget Summaries

Major FY 2009-10 Biennial Budget Revisions
Department/Reduction Amount PositionsPolice (continued):Funding of two part-time positions ( FTE) for a Cold Case Squad, responsible for reopening, reviewing and pursuing the City's unsolved cases. The City currently has 1 full-time Cold Case Detective.
44,290 1.00
Elimination of one Public Safety Analyst and one Office Assistant. The loss of these positions will cause workload increases for some other employees; however, the Police Department has a strategy to reorganize and shift these work responsibilities to the appropriate positions.
(129,669) (2.00)
Reduce funding due to the postponed hiring of 3 vacant sworn positions in the Police Department. These positions are not being cut; however, they are to remain unfilled in the upcoming fiscal year. These are 3 of the current 25 vacancies in the Police Department. The Police Department has operated with as many as 70 vacancies in the past.
(262,682)
Reduction to various operating supplies accounts. (100,000)
Public Utilities:Reduction in Lake Gaston power costs - Electrical costs did not increase at the rate that was originally anticipated.
(200,000)
Reduction in Water Services contract - The biennial rate was lower than the original estimate.
(350,000)
Reduction in Rolling Stock Reserve - Vehicle replacements budgeted in a reserve were reduced to reflect lower revenue estimates.
(303,000)
Reduction in Energy/Fuel Reserve - The stabilization of fuel prices enabled a reduction in this reserve.
(46,338)
Public Works:Transfer of seven positions in the Mosquito Control operation from the General Fund to the Storm Water Utility Fund. This will be paid for within the SWU Fund by reducing the transfer from the Fund to capital project #7-067, Primary System Infrastructure Improvements.
(290,000)
Elimination of a Survey Aide II position in the Public Works/Surveys. (42,784) (1.00)
Additional computer licensing and maintenance for the INFOR Project Management System.
22,500
Continuation of a pilot Boardwalk Recycling program. This program is being funded in the Tourism Growth and Investment Fund (TGIF).
50,000
Reduced funding for heating oil. With the continuation of energy conservation controls being implemented within HVAC systems, it is anticipated that energy efficiencies will enable heating needs to continue to be met.
(30,000)
Fiscal Year 2009 - 10 1 - 17 Operating Budget Summaries

Major FY 2009-10 Biennial Budget Revisions
Department/Reduction Amount PositionsPublic Works (continued):Reduced funding for contracted custodial services. The custodial staff will maintain current levels of cleaning services; however, time spent on specialized cleanings such as routine carpet maintenance, floor buffing, polishing, and stripping may be reduced.
(20,000)
Reduction of funding for Waste Management overtime. The overtime budget for Waste Collection is based on the number of holidays that need to be worked, with an average cost of around $30,000 per day.
(74,395)
Reduction of funding for contracted manpower in Beach Operations. Summer contract workforce will be reduced by six contract positions and cause trash collection crews to remain on the resort beach approximately one hour longer. Trash at the residential beaches will be collected every other day during the summer season.
(38,000)
Reduction in funding for contracted manpower in Engineering. These funds are used to supplement customer service and administrative support functions. Reducing the funds could delay the processing of documents.
(20,000)
Elimination of a Waste Management Operator II position. With the decline in usage of yard debris trailers as a result of an increase in fees charged for that service, this position can be eliminated.
(41,331) (1.00)
Elimination of an Engineer position. This will reduce in-house capability to perform computer traffic analyses and studies or to verify the appropriateness of such studies performed by others, and the review of development plans and Capital Improvemtent Program plans will require more time as there will be fewer staff to perform those reviews.
(80,437) (1.00)
Elimination of an Engineer position. This will result in the loss of in-house cost estimating services; elimination of a consolidated approach to obtaining and tracking regional transportation funding and curtailing of proactive management of developing viable candidate City transportation projects for regional funding.
(112,537) (1.00)
Elimination of the Traffic Management Center Supervisor position. The full implementation of the Traffic Management Center has been delayed lessening the need for this position.
(90,228) (1.00)
Elimination of a Painter position. This will reduce the output of the Paint Shop by approximately 124,000 square feet per year, resulting in an increase in the backlog of work.
(57,272) (1.00)
Additional funding for a rolling stock equipment for the waste disposal site. It is anticipated that the cost of the equipment will be reimbursed by Southeastern Public Service Authority.
510,000
Increased funding for electrical charges and fuel. 1,314,513
Fiscal Year 2009 - 10 1 - 18 Operating Budget Summaries

Fiscal Year 2009-10 1 - 19 Operating Budget Summaries
Compensation Given the unprecedented economic conditions and corresponding decline in revenues, the City is unable to provide pay raises to employees. This will represent only the second time in the last eighteen years in which the City was unable to fund salary increases. The Schools also will not provide pay raises to teachers and other employees. The City will not, however, layoff any employee. Of the 44.65 City FTEs eliminated, and any filled positions will be transitioned to other vacant positions. Declining real estate assessments will mean lower taxes for employees that own a home. The declining Personal Property tax base will also mean more tax relief. Lastly, the low inflationary environment and tax cuts ($400 for individuals and $800 for married couple families) passed by Congress and signed by the President will benefit employees as well as all residents. Though not a direct compensation cost for employees, it is worth noting that the City pays on behalf of each full time employee’s retirement (16.48%), life insurance (0.79%), and $5,400 for health care. Also included is $4 million for the FY 2009-10 payment for GASB45 requirements.

Fiscal Year 2009-10 Operating Budget Summaries 1 - 20
Measuring Results Evaluating the performance of any organization has intuitive appeal, and performance measurement has long been a staple of the public and private sectors. There are many ways to measure or evaluate the performance of a local government, and Virginia Beach has been proactive and thorough in its efforts to measure and monitor the performance of our government since 1972. The City uses three types of measures in order to track the City’s performance. Community indicators, which are the broadest type, are measures that assess
the overall condition of the City. These measures are influenced by not only the City of Virginia Beach, but also the State and Federal Government, non-profit organizations, and private service providers. Community indicators can, and often do, impact organizational measures and performance measures. Organizational measures are used to assess performance at the organizational level. These measures are used to gauge the overall “health” of the municipal government organization. Performance measures provide detail about the delivery of a specific City program or service. For comparative purposes, the City tracks each of the three types of performance data each year. This data is used to monitor and evaluate the progress of the community, the organization, and each program and service as conditions change. Due to the broad scope of community indicators, these indicators may reflect trends and issues beyond the influence or control of a local government. In these cases, the indicators convey educational information about the quality of life and trends in our City. The City also uses each of the three types of measures to compare service levels and costs with other communities when comparable data is available. Monitoring performance data is also crucial in determining progress in achieving the goals set by City Council. The City Council’s goals are to:
Create a Financially Sustainable City Providing Excellent Services
Grow the Economy
Improve Transportation Systems
Revitalize Neighborhoods and Plan for the Future
Be a Competitive, First Class Resort for Residents, Businesses, and Tourists City programs are grouped into common “business areas” which relate to one or more of these goals. For example, the departments supporting economic vitality work to “grow the economy”, while the departments supporting quality physical environment work to “improve transportation systems” among other programs. These business areas are designed to foster a closer working relationship within the City organization, while focusing efforts on attainment of the City Council’s goals. For each business area community indicators, a comparison of selected community indicators, and key departmental performance measures related to the business area are provided.
Organizational Indicators
Departmental Performance
Measures
Community Indicators
The City of Virginia Beach Performance Measurement
System
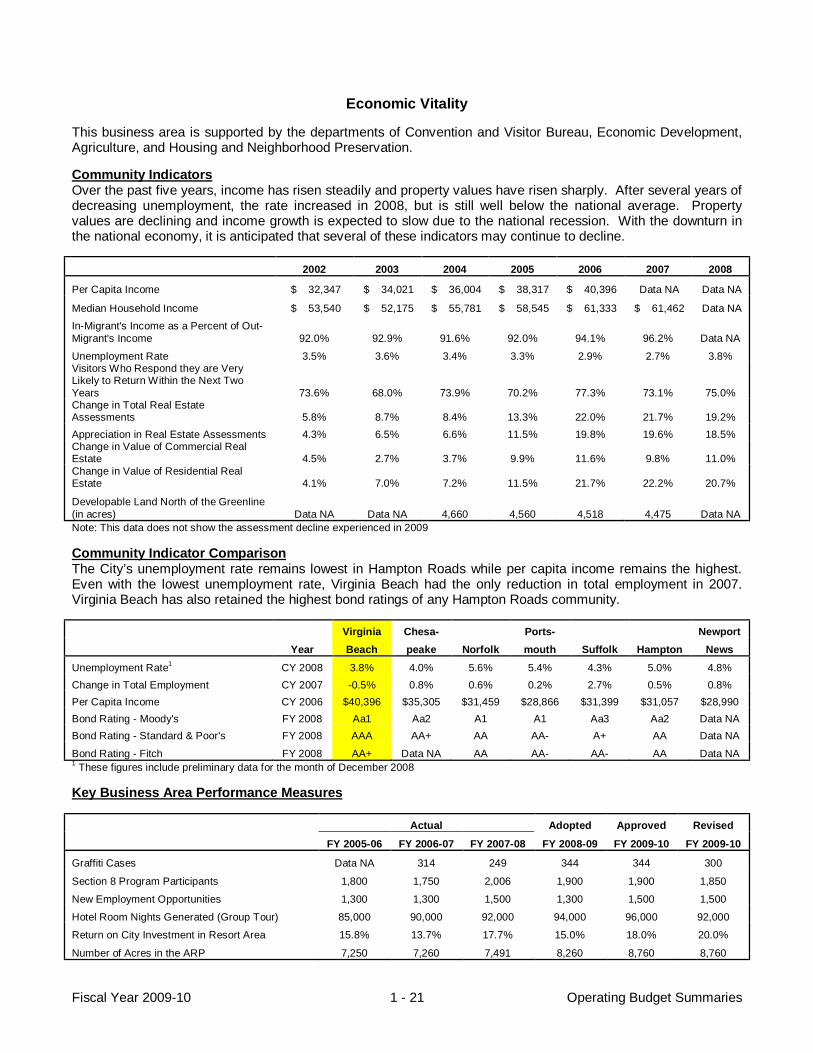
Fiscal Year 2009-10 Operating Budget Summaries 1 - 21
Economic Vitality This business area is supported by the departments of Convention and Visitor Bureau, Economic Development, Agriculture, and Housing and Neighborhood Preservation. Community Indicators Over the past five years, income has risen steadily and property values have risen sharply. After several years of decreasing unemployment, the rate increased in 2008, but is still well below the national average. Property values are declining and income growth is expected to slow due to the national recession. With the downturn in the national economy, it is anticipated that several of these indicators may continue to decline. 2002 2003 2004 2005 2006 2007 2008
Per Capita Income $ 32,347 $ 34,021 $ 36,004 $ 38,317 $ 40,396 Data NA Data NA
Median Household Income $ 53,540 $ 52,175 $ 55,781 $ 58,545 $ 61,333 $ 61,462 Data NA
In-Migrant's Income as a Percent of Out-Migrant's Income 92.0% 92.9% 91.6% 92.0% 94.1% 96.2% Data NA
Unemployment Rate 3.5% 3.6% 3.4% 3.3% 2.9% 2.7% 3.8% Visitors Who Respond they are Very Likely to Return Within the Next Two Years 73.6% 68.0% 73.9% 70.2% 77.3% 73.1% 75.0% Change in Total Real Estate Assessments 5.8% 8.7% 8.4% 13.3% 22.0% 21.7% 19.2% Appreciation in Real Estate Assessments 4.3% 6.5% 6.6% 11.5% 19.8% 19.6% 18.5% Change in Value of Commercial Real Estate 4.5% 2.7% 3.7% 9.9% 11.6% 9.8% 11.0% Change in Value of Residential Real Estate 4.1% 7.0% 7.2% 11.5% 21.7% 22.2% 20.7%
Developable Land North of the Greenline (in acres) Data NA Data NA 4,660 4,560 4,518 4,475 Data NA Note: This data does not show the assessment decline experienced in 2009 Community Indicator Comparison The City’s unemployment rate remains lowest in Hampton Roads while per capita income remains the highest. Even with the lowest unemployment rate, Virginia Beach had the only reduction in total employment in 2007. Virginia Beach has also retained the highest bond ratings of any Hampton Roads community.
Virginia Chesa- Ports- Newport Year Beach peake Norfolk mouth Suffolk Hampton News Unemployment Rate1 CY 2008 3.8% 4.0% 5.6% 5.4% 4.3% 5.0% 4.8% Change in Total Employment CY 2007 -0.5% 0.8% 0.6% 0.2% 2.7% 0.5% 0.8% Per Capita Income CY 2006 $40,396 $35,305 $31,459 $28,866 $31,399 $31,057 $28,990 Bond Rating - Moody's FY 2008 Aa1 Aa2 A1 A1 Aa3 Aa2 Data NA Bond Rating - Standard & Poor's FY 2008 AAA AA+ AA AA- A+ AA Data NA
Bond Rating - Fitch FY 2008 AA+ Data NA AA AA- AA- AA Data NA 1 These figures include preliminary data for the month of December 2008 Key Business Area Performance Measures
Actual Adopted Approved Revised FY 2005-06 FY 2006-07 FY 2007-08 FY 2008-09 FY 2009-10 FY 2009-10
Graffiti Cases Data NA 314 249 344 344 300
Section 8 Program Participants 1,800 1,750 2,006 1,900 1,900 1,850
New Employment Opportunities 1,300 1,300 1,500 1,300 1,500 1,500
Hotel Room Nights Generated (Group Tour) 85,000 90,000 92,000 94,000 96,000 92,000
Return on City Investment in Resort Area 15.8% 13.7% 17.7% 15.0% 18.0% 20.0%
Number of Acres in the ARP 7,250 7,260 7,491 8,260 8,760 8,760
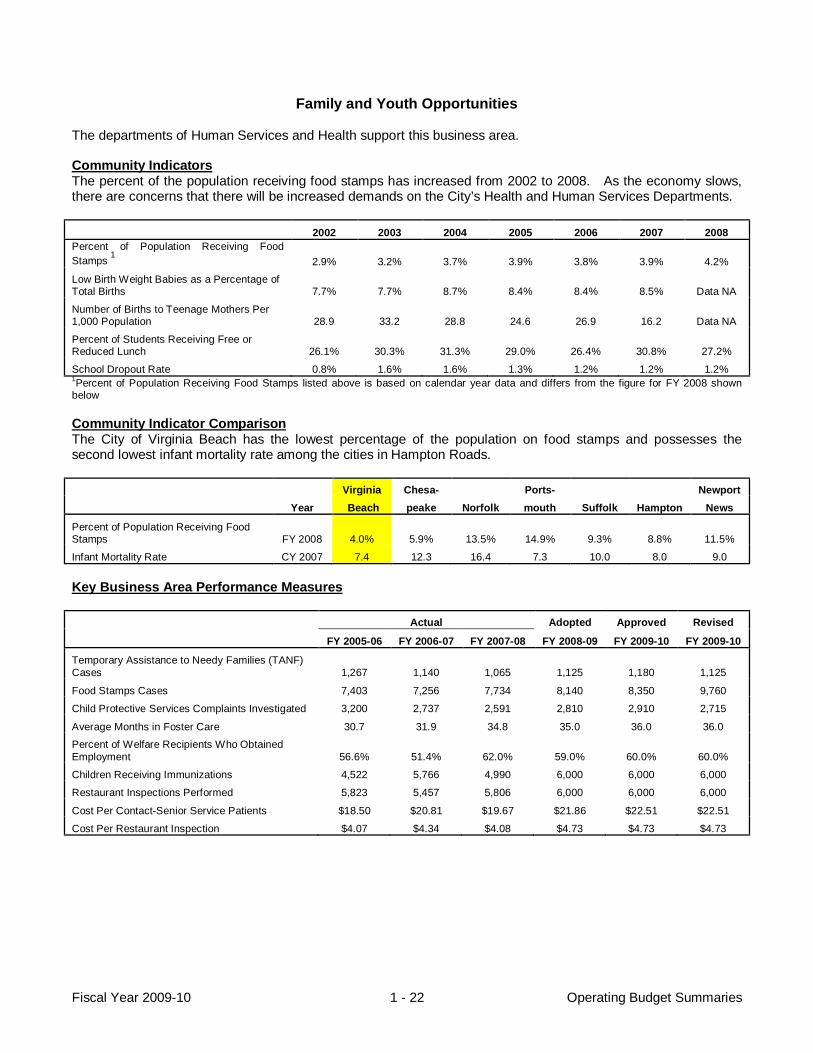
Fiscal Year 2009-10 Operating Budget Summaries 1 - 22
Family and Youth Opportunities The departments of Human Services and Health support this business area. Community Indicators The percent of the population receiving food stamps has increased from 2002 to 2008. As the economy slows, there are concerns that there will be increased demands on the City’s Health and Human Services Departments. 2002 2003 2004 2005 2006 2007 2008 Percent of Population Receiving Food Stamps 1
2.9% 3.2% 3.7% 3.9% 3.8% 3.9% 4.2%
Low Birth Weight Babies as a Percentage of Total Births 7.7% 7.7% 8.7% 8.4% 8.4% 8.5% Data NA
Number of Births to Teenage Mothers Per 1,000 Population 28.9 33.2 28.8 24.6 26.9 16.2 Data NA
Percent of Students Receiving Free or Reduced Lunch 26.1% 30.3% 31.3% 29.0% 26.4% 30.8% 27.2%
School Dropout Rate 0.8% 1.6% 1.6% 1.3% 1.2% 1.2% 1.2% 1Percent of Population Receiving Food Stamps listed above is based on calendar year data and differs from the figure for FY 2008 shown below Community Indicator Comparison The City of Virginia Beach has the lowest percentage of the population on food stamps and possesses the second lowest infant mortality rate among the cities in Hampton Roads.
Virginia Chesa- Ports- Newport
Year Beach peake Norfolk mouth Suffolk Hampton News
Percent of Population Receiving Food Stamps FY 2008 4.0% 5.9% 13.5% 14.9% 9.3% 8.8% 11.5%
Infant Mortality Rate CY 2007 7.4 12.3 16.4 7.3 10.0 8.0 9.0
Key Business Area Performance Measures Actual Adopted Approved Revised
FY 2005-06 FY 2006-07 FY 2007-08 FY 2008-09 FY 2009-10 FY 2009-10
Temporary Assistance to Needy Families (TANF) Cases 1,267 1,140 1,065 1,125 1,180 1,125
Food Stamps Cases 7,403 7,256 7,734 8,140 8,350 9,760
Child Protective Services Complaints Investigated 3,200 2,737 2,591 2,810 2,910 2,715
Average Months in Foster Care 30.7 31.9 34.8 35.0 36.0 36.0
Percent of Welfare Recipients Who Obtained Employment 56.6% 51.4% 62.0% 59.0% 60.0% 60.0%
Children Receiving Immunizations 4,522 5,766 4,990 6,000 6,000 6,000
Restaurant Inspections Performed 5,823 5,457 5,806 6,000 6,000 6,000
Cost Per Contact-Senior Service Patients $18.50 $20.81 $19.67 $21.86 $22.51 $22.51
Cost Per Restaurant Inspection $4.07 $4.34 $4.08 $4.73 $4.73 $4.73

Fiscal Year 2009-10 Operating Budget Summaries 1 - 23
Quality Physical Environment The departments of Planning and Community Development, Public Works, and Public Utilities support this business area. Community Indicators The continued reduction of state funds for road and transportation projects is having adverse impacts on the City’s transportation infrastructure. Residential recycling was impacted significantly in FY 2007-08 with the closure of SPSA’s yard waste recycling facility. On a positive note, the amount of open space in the City per 1,000 population has remained steady with the slight population increase that occurred in 2008.
2002 2003 2004 2005 2006 2007 2008
Citizen Satisfaction with Appearance Data NA 1 89.2% Data NA 1 91.4% Data NA 1 95.6% Data NA 1
Open Space Acreage Per 1,000 Population 12.86 13.42 13.52 13.73 14.14 15.54 15.54
Percent of Roads in the Two Lowest Grades for Transportation Efficiency Data NA2 Data NA2 Data NA2 Data NA2 18.0% 18.2% 18.8%
Percent of Street System Meeting Minimum Physical Condition Rating Data NA2 Data NA2 Data NA2 Data NA2 79.0% 74.0% 73.0%
Mass Transit Ridership (in millions) 1.915 1.745 1.997 2.005 2.034 2.020 2.004 Percent of Residential Waste Stream Recycled 32.0% 31.0% 31.0% 31.0% 32.0% 33.0% 17.0%
Visitor's Perception of City's Appearance3 1.43 1.51 1.50 1.56 1.60 1.56 1.51 1 Based on responses to Citizen Survey, survey not conducted in these fiscal year’s 2 New measures, data for prior years is not available 3 Based on 4 point scale, 1 = extremely visually appealing, 2 = quite visually appealing, 3 = slightly visually appealing, 4 = not at all visually appealing Key Business Area Performance Measures Actual Adopted Approved Revised FY 2005-06 FY 2006-07 FY 2007-08 FY 2008-09 FY 2009-10 FY 2009-10 Waste Collections Made to Residential Customers 6,448,000 6,405,152 6,424,236 6,474,000 6,500,000 6,500,000
Tons of Waste Recycled 39,195 39,587 40,305 39,587 39,983 38,000
Roadway Resurfacing Cycle 24.1 Years 20.6 Years 30.0 Years 20.6 Years 21.7 Years 22.0 Years
Water Quality Samples Taken 2,750 2,700 2,700 2,700 2,700 1,847
Linear Feet of Sanitary Sewer Pipe Rehabilitated, Replaced, or Repaired 16,500 33,195 40,000 43,000 46,000 46,000.0
Sanitary Sewer System Defects Per 1,000 Miles of Main 710 550 550 550 550 525
On-Time Arrival of Sanitary Sewer Crew-Within 2 Hours of Call 95.0% 95.0% 95.0% 95.0% 95.0% 94.9%
Sanitary Sewer Overflows Reported Per 100 Miles of Main 6.8 4.8 4.3 4.1 3.9 3.9
Water Meters Replaced 5,765 7,000 7,000 7,000 7,000 7,000
Building Permits Issued 42,572 50,708 40,743 47,400 47,400 30,000
Zoning Inspections Performed 33,059 32,988 21,940 27,500 27,500 27,500

Fiscal Year 2009-10 Operating Budget Summaries 1 - 24
Cultural & Recreational Opportunities The departments of Museums, Parks and Recreation and Cultural Affairs office support this business area. Community Indicators After declining for six straight years, recreation center attendance is increased in 2008 while attendance at the City’s museums and historic home sites grew for the fourth year in a row. 2002 2003 2004 2005 2006 2007 2008
Citizen Satisfaction with Museums, Aquarium, & Cultural Arts Activities Data NA 1 94.2% Data NA 1 93.8% Data NA 1 94.0% Data NA 1
Citizen Satisfaction with Recreation Centers Data NA 1 95.6% Data NA 1 94.0% Data NA 1 96.8% Data NA 1
Park Attendance 2,061,186 2,353,710 2,355,298 2,513,179 2,817,724 3,713,490 2,961,012
Recreation Center Attendance 1,763,658 1,731,538 1,720,727 1,703,088 1,609,047 1,575,539 1,636,823
Attendance at Historic Homes/Museums/IMAX Theater Data NA Data NA Data NA 780,728 826,828 836,707 830,000
Number of Open Space Acres Acquired 22.0 5.2 112.4 18.0 99.8 5.6 19.9
Percentage of Population with Recreation Facility Cards 11.0% 11.2% 11.4% 10.0% 10.0% 9.7% 9.6% 1 Based on responses to Citizen Survey, survey not conducted in these fiscal year’s Community Indicator Comparison Virginia Beach provides the highest ratio of full service recreation center space, but has the second lowest amount of park acreage per capita. Virginia Chesa- Ports- Newport Year Beach peake Norfolk mouth Suffolk Hampton News Square Feet of Full Service City Recreation Center Space Per 10,000 Population FY 2007 8,939 0 318 0 0 2,057 4,384
Acres of Parkland Per 10,000 Population FY 2008 40.2 94.3 24.9 41.2 147.1 124.1 496.1 Key Business Area Performance Measures
Actual Adopted Approved Revised
FY 2005-06 FY 2006-07 FY 2007-08 FY 2008-09 FY 2009-10 FY 2009-10
School Visits at Historic Homes 12,344 11,935 9,853 11,200 11,200 11,200
Student Visits to the Aquarium 55,239 46,347 39,992 60,000 65,000 65,000
Visitors to the IMAX Theater 194,985 179,860 144,771 198,000 215,000 215,000
Visitors to the Virginia Aquarium 620,299 643,091 577,356 660,000 715,000 715,000
IMAX Theater Revenue $1,033,816 $1,016,932 $770,627 $1,042,550 $1,119,690 $1,119,690
Virginia Aquarium Revenue $5,806,657 $6,043,288 $5,371,930 $7,327,000 $7,803,642 $7,803,642
Arts and Cultural Grants Awarded 40 36 36 34 34 34
Event Days at the Sandler Center 0 0 296 317 326 326
Mowing Cycles for Divided Roadways 24.5 15.3 17.4 18.0 18.0 18.0
Park Visits 2,817,724 3,713,490 2,961,012 3,370,784 3,471,908 3,000,000
Satisfaction with Parks 92.8% 92.8% 95.0% 95.0% 95.0% 95.0%

Fiscal Year 2009-10 Operating Budget Summaries 1 - 25
Quality Education and Lifelong Learning This business area is supported by the Schools and the Library Department. Community Indicators With education a top priority of the City, most of these indicators are performing well but are relatively level. However, on-line services through the library increased significantly during FY 2007-08. 2002 2003 2004 2005 2006 2007 2008
Percentage of Public Elementary Schools Fully Accredited 56.3% 78.2% 98.2% 100.0% 100.0% 100.0% 100.0%
Percentage of Public Middle Schools Fully Accredited 26.7% 93.3% 93.3% 100.0% 100.0% 100.0% 100.0%
Percentage of Public High Schools Fully Accredited 58.3% 84.6% 84.6% 100.0% 100.0% 100.0% 100.0%
High School Graduates Who Plan to Continue their Education 85.4% 83.6% 82.1% 84.4% 84.4% 84.9% 83.7%
Percent of Adults Over Age 25 that Have an Undergraduate Degree 30.3% 30.5% 33.5% 31.0% 31.0% 32.4% Data NA
Percent of Adults Over Age 25 that Have a Graduate Degree 9.4% 10.2% 11.6% 10.0% 11.0% 11.0% Data NA
Elementary School Attendance Rate 96.0% 95.5% 95.9% 95.9% 96.0% 95.9% 96.2%
High School Graduation Rate 77.7% 80.3% 81.5% 82.5% 82.7% 82.7% 83.0%
Library Visitation - In Person 1,327,869 1,367,785 1,538,178 1,572,800 1,622,871 1,798,632 1,998,324
Library Visitation - Virtual 268,905 314,614 403,602 477,055 466,482 538,103 1,111,638 Number of High School Industry Certifications Data NA Data NA 1,238 1,795 2,032 3,130 4,081 Community Indicator Comparison Virginia Beach has the second highest pass rate for the English Reading Standards of Learning test. Residents are also utilizing library materials at a high rate, while the books per capita are relatively low due to the libraries aggressive collection management program. Virginia Chesa- Ports- Newport Year Beach peake Norfolk mouth Suffolk Hampton News
Library Book Circulation Per Capita FY 2007 6.2 8.9 3.6 3.8 3.0 4.2 3.8
Library Books Per Capita FY 2007 2.1 3.3 2.7 3.7 2.8 2.0 2.3 Percentage of 5th Graders Who Passed the English Reading Standards of Learning FY 2008 92% 94% 87% 86% 88% 84% 86% Key Business Area Performance Measures Actual Adopted Approved Revised
FY 2005-06 FY 2006-07 FY 2007-08 FY 2008-09 FY 2009-10 FY 2009-10
Drop Out Rate 1.2% 1.2% 1.2% 1.0% 1.0% 1.0%
Student Enrollment 73,448 71,721 70,682 69,771 69,118 68,807 Percentage of Students Enrolled in Gifted Program 11.0% 11.9% 12.1% 12.0% 12.0% 12.0%
Mean Math Scores 505 504 510 500 500 500
Mean Verbal Scores 497 496 500 500 500 500
Ready to Learn Pre-School Attendance 1,996 1,038 34,363 17,000 18,000 34,500
Library Program Attendance 80,556 73,072 85,841 72,387 75,514 79,355
Circulation and In-Library Use 5,684,000 5,877,000 6,279,652 5,601,000 6,117,000 7,473,302

Fiscal Year 2009-10 Operating Budget Summaries 1 - 26
Safe Community This business area includes Police, Fire, Emergency Medical Services, Courts, the Commonwealth’s Attorney’s Office, and Sheriff and Corrections. Community Indicators The violent crime rate has dropped over the past two years and Virginia Beach continues to be the safest City of its size in the Country. In spite of this fact, the perception of neighborhood safety has declined in recent years, while the perception of safety by public school students has risen over the same period of time. 2002 2003 2004 2005 2006 2007 2008
Percent of Residents Who Believe their Neighborhood is Safe Data NA 1 96.4% Data NA 1 94.8% Data NA 1 92.8% Data NA 1
Violent Crimes Per 1,000 Population 2.3 2.3 2.3 2.8 2.9 2.6 2.4
Perception of Safety in Public Schools by 5th Grade Students 2 79.7% 79.5% 82.2% 81.8% 83.2% 92.8% 93.5%
Perception of Safety in Public Schools by 8th Grade Students 54.0% 54.4% 52.6% 52.8% 50.8% 67.1% 68.7%
Perception of Safety in Public Schools by 12th Grade Students 69.2% 65.8% 66.0% 65.8% 68.9% 87.4% 82.1% 1 Based on responses to Citizen Survey, survey not conducted in these fiscal year’s 2 Prior to 2006-07, students in grades 4, 7, and 11 rated their level of agreement on a five-point scale to the item “I feel safe and secure at school.” The percentages reported in the table reflect the percentage of students Agreeing or Strongly Agreeing to the item. Beginning in 2006-07, students in grades 5, 8, and 12 rated their level of agreement on a four-point scale to the item “This school provides a safe and orderly place for students to learn.” The percentages reported in the table reflect the percentage of students Agreeing or Strongly Agreeing. Community Indicator Comparison Virginia Beach has the lowest overall crime rate, violent crime rate, and Property crime rate in Hampton Roads. Virginia Chesa- Ports- Newport Year Beach peake Norfolk mouth Suffolk Hampton News
Violent Crime Rate CY 2007 2.6 4.6 8.2 8.3 4.1 3.6 6.8
Property Crime Rate CY 2007 29.9 34.3 49.1 52.5 31.2 35.0 41.6
Average Daily Jail Population FY 2007 1,544 1,072 1,757 573 Data NA 480 678 Key Business Area Performance Measures Actual Adopted Approved Revised FY 2005-06 FY 2006-07 FY 2007-08 FY 2008-09 FY 2009-10 FY 2009-10
Cost Per Inmate Per Day $56.97 $57.24 $60.48 $60.14 $61.64 $63.93
Response Time for Emergency Police Calls 6.3 6.5 6.3 6.4 6.4 6.4
Clearance Rate for Violent Crimes 51.5% 54.2% 57.8% 55.0% 55.0% 55.0%
Arson Incidents 163 158 165 170 170 170
Clearance Rate for Arson Cases 59.0% 23.0% 21.5% 20.0% 20.0% 20.0%
Percentage of Time 9 Ambulances are Staffed 85.0% 84.0% 86.0% 80.0% 80.0% 88.0%
Children Placed in Less Secure Detention 240 254 233 255 255 255
General District Criminal Cases Tried Per Judge 3,365 3,319 3,476 3,659 3,732 3,732
Processes Conducted by Magistrates 43,264 43,751 43,055 37,157 38,272 38,272
Complaints Handled by City Consumer Affairs Office 905 620 391 500 550 550
Conviction Rate for Domestic Violence 67.0% 64.0% 78.0% 65.0% 65.0% 70.0%
Conviction Rate for Violent Felonies 97.0% 97.0% 97.0% 95.0% 95.0% 97.0%

Fiscal Year 2009-10 Operating Budget Summaries 1 - 27
Quality Organization The Quality Organization business area is supported by the departments of City Council, City Clerk, City Manager, City Attorney, Finance, Human Resources, City Treasurer (elected official), Commissioner of the Revenue (elected official), City Real Estate Assessor, General Registrar, Management Services, Communications and Information Technology, and Office of the City Auditor. Community Indicators As a percentage of per capita income, the cost of delivering government services remained relatively flat from 2002 to 2006. 2002 2003 2004 2005 2006 2007 2008
Citizen Satisfaction with Services Data NA 1 93.2% Data NA 1 92.6% Data NA 1 93.4% Data NA 1
Value of Volunteer Service (in millions) $15.9 $16.6 $16.3 $16.4 $14.1 $14.5 $13.2
Per Capita Government Expenditures as a Percent of Per Capita Income 6.7% 6.6% 6.9% 6.8% 6.8% Data NA Data NA
Number of Full-Time Equivalent Employees Per 1,000 Population 14.4 14.5 17.4 15.2 15.8 16.0 16.2 1 Based on responses to Citizen Survey, survey not conducted in these fiscal year’s Community Indicator Comparison Virginia Beach has the lowest total government expenditures per capita and the second lowest debt per capita in the Hampton Roads area. Virginia Chesa- Ports- Newport Year Beach peake Norfolk mouth Suffolk Hampton News Total Government Expenditures Per Capita FY 2008 $3,036.09 $3,199.03 $3,445.04 $3,428.70 $3,037.87 $3,229.39 $3,383.23
Real Estate Assessment to Actual Property Sales Ratio CY 2006 63.1% 95.6% 70.5% 79.9% 87.0% 81.0% 70.1%
Voter Turnout Rate Nov-08 70.2% 74.8% 71.2% 75.9% 74.9% 74.7% 69.7%
Municipal Debt Per Capita FY 2008 $2,249.00 $3,341.43 $4,398.00 $4,111.67 $4,044.65 $2,292.69 $4,902.62 Key Business Area Performance Measures Actual Adopted Approved Revised FY 2005-06 FY 2006-07 FY 2007-08 FY 2008-09 FY 2009-10 FY 2009-10
Leased Space (in square feet) 250,146 257,646 257,646 272,646 272,646 317,650 Percentage of Capital Program Funded by Cash 53.3% 58.2% 59.3% 58.2% 55.7% 59.7%
Citizens Who Feel Safe in their Neighborhood Data NA 92.8% Data NA 95.0% Data NA Data NA
Cost Per Hour for In-House Attorney Services $97 $106 $115 $108 $108 $118 Citizen Complaints to Human Rights Commission 32 23 20 25 30 20
Qualified Employees Hired Within 60 Days 65.0% 70.0% 61.0% 65.0% 70.0% 65.0%
Registered Voters 261,000 264,537 267,576 280,000 275,000 280,000
Civil Insurance Claims Against the City 1,125 1,450 898 1,450 1,450 810
Workman's Compensation Claims Filed 1,325 1,325 1,207 1,325 1,325 1,150
Calls Received by 911 239,419 227,788 231,676 285,000 285,000 285,000 Priority 1 Calls Processed in 120 Seconds or Less 79.0% 81.0% 84.0% 85.0% 85.0% 85.0%
Business License Audits 3,000 1,879 2,200 2,500 3,000 2,000
Yield on City Investments 4.0% 5.1% 4.3% 4.3% 4.3% 1.1%
Real Estate Parcels Assessed Per Appraiser 8,659 9,000 8,659 5,990 5,990 7,900
Value of Volunteer Hours $14.1 Million $14.5 Million $13.2 Million $17.1 Million $17.1 Million $15.0 Million
Table of Contents Capital Improvement Program Summaries
Sources of Funding ...................................................................................................................................... 2 - 1 Summary of Project Estimates ..................................................................................................................... 2 - 1 Functional Allocation of Resources .............................................................................................................. 2 - 2 Capital Improvement Project by Type ........................................................................................................... 2 - 2 Total Capital Investment FY 2007-08 ........................................................................................................... 2 - 3 FY 2009-10 Biennial Capital Improvement Program Revisions ..................................................................... 2 - 4
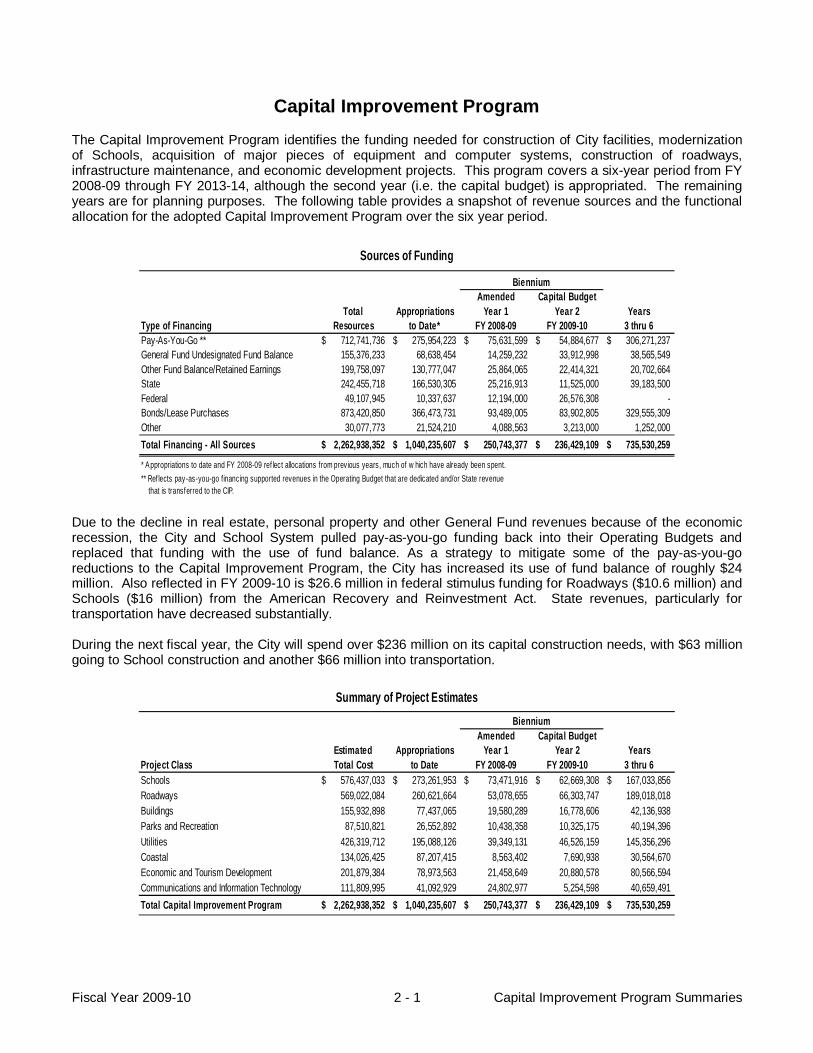
Fiscal Year 2009-10 2 - 1 Capital Improvement Program Summaries
Capital Improvement Program The Capital Improvement Program identifies the funding needed for construction of City facilities, modernization of Schools, acquisition of major pieces of equipment and computer systems, construction of roadways, infrastructure maintenance, and economic development projects. This program covers a six-year period from FY 2008-09 through FY 2013-14, although the second year (i.e. the capital budget) is appropriated. The remaining years are for planning purposes. The following table provides a snapshot of revenue sources and the functional allocation for the adopted Capital Improvement Program over the six year period. Due to the decline in real estate, personal property and other General Fund revenues because of the economic recession, the City and School System pulled pay-as-you-go funding back into their Operating Budgets and replaced that funding with the use of fund balance. As a strategy to mitigate some of the pay-as-you-go reductions to the Capital Improvement Program, the City has increased its use of fund balance of roughly $24 million. Also reflected in FY 2009-10 is $26.6 million in federal stimulus funding for Roadways ($10.6 million) and Schools ($16 million) from the American Recovery and Reinvestment Act. State revenues, particularly for transportation have decreased substantially. During the next fiscal year, the City will spend over $236 million on its capital construction needs, with $63 million going to School construction and another $66 million into transportation.
BienniumAmended Capital Budget
Total Appropriations Year 1 Year 2 YearsType of Financing Resources to Date* FY 2008-09 FY 2009-10 3 thru 6Pay-As-You-Go ** 712,741,736$ 275,954,223$ 75,631,599$ 54,884,677$ 306,271,237$ General Fund Undesignated Fund Balance 155,376,233 68,638,454 14,259,232 33,912,998 38,565,549 Other Fund Balance/Retained Earnings 199,758,097 130,777,047 25,864,065 22,414,321 20,702,664 State 242,455,718 166,530,305 25,216,913 11,525,000 39,183,500 Federal 49,107,945 10,337,637 12,194,000 26,576,308 - Bonds/Lease Purchases 873,420,850 366,473,731 93,489,005 83,902,805 329,555,309 Other 30,077,773 21,524,210 4,088,563 3,213,000 1,252,000 Total Financing - All Sources 2,262,938,352$ 1,040,235,607$ 250,743,377$ 236,429,109$ 735,530,259$
* Appropriations to date and FY 2008-09 ref lect allocations from previous years, much of w hich have already been spent.** Ref lects pay-as-you-go financing supported revenues in the Operating Budget that are dedicated and/or State revenue
that is transferred to the CIP.
Sources of Funding
BienniumAmended Capital Budget
Estimated Appropriations Year 1 Year 2 YearsProject Class Total Cost to Date FY 2008-09 FY 2009-10 3 thru 6Schools 576,437,033$ 273,261,953$ 73,471,916$ 62,669,308$ 167,033,856$ Roadways 569,022,084 260,621,664 53,078,655 66,303,747 189,018,018 Buildings 155,932,898 77,437,065 19,580,289 16,778,606 42,136,938 Parks and Recreation 87,510,821 26,552,892 10,438,358 10,325,175 40,194,396 Utilities 426,319,712 195,088,126 39,349,131 46,526,159 145,356,296 Coastal 134,026,425 87,207,415 8,563,402 7,690,938 30,564,670 Economic and Tourism Development 201,879,384 78,973,563 21,458,649 20,880,578 80,566,594 Communications and Information Technology 111,809,995 41,092,929 24,802,977 5,254,598 40,659,491 Total Capital Improvement Program 2,262,938,352$ 1,040,235,607$ 250,743,377$ 236,429,109$ 735,530,259$
Summary of Project Estimates

Fiscal Year 2009-10 2 - 2 Capital Improvement Program Summaries
The graph below shows the percentage of funding allocated to the various functional areas for the amended second year (FY 2009-10) of the Capital Improvement Program. Combined, Roadways and Schools receive about 55% of the funding. Over the Capital Improvement Program, projects that focus on the rehabilitation, renewal, and replacement of current City assets represent an investment of roughly $935 million from FY 2008-09 through FY 2013-14. The following graph illustrates the distribution of capital improvement projects by type for FY 2009-10. As depicted in the graph, the primary focus of the Capital Improvement Program continues to be maintaining, updating, renovating and replacing aging infrastructure; the renovation, replacement and expansion categories alone represent roughly 79% of the total funding. However, the reduced revenue from both the stressed economy
Schools, 26.51%
Roadways, 28.04%
Buildings, 7.10%
Parks and Recreation,
4.37%
Utilities, 19.68%
Coastal, 3.25%
Econom ic and Tourism
Developm ent, 8.83%
Comm unications and Inform ation
Technology, 2.22%
Functional Allocation of Resources
Expansion, 27.1%
Equipment, 1.2%
New Facility, 17.4% Other, 2.2%
Renovation/Rehabilitation,
39.5%
Replacement, 11.9%
Study/Design, 0.7%
Capital Improvement Project by Type
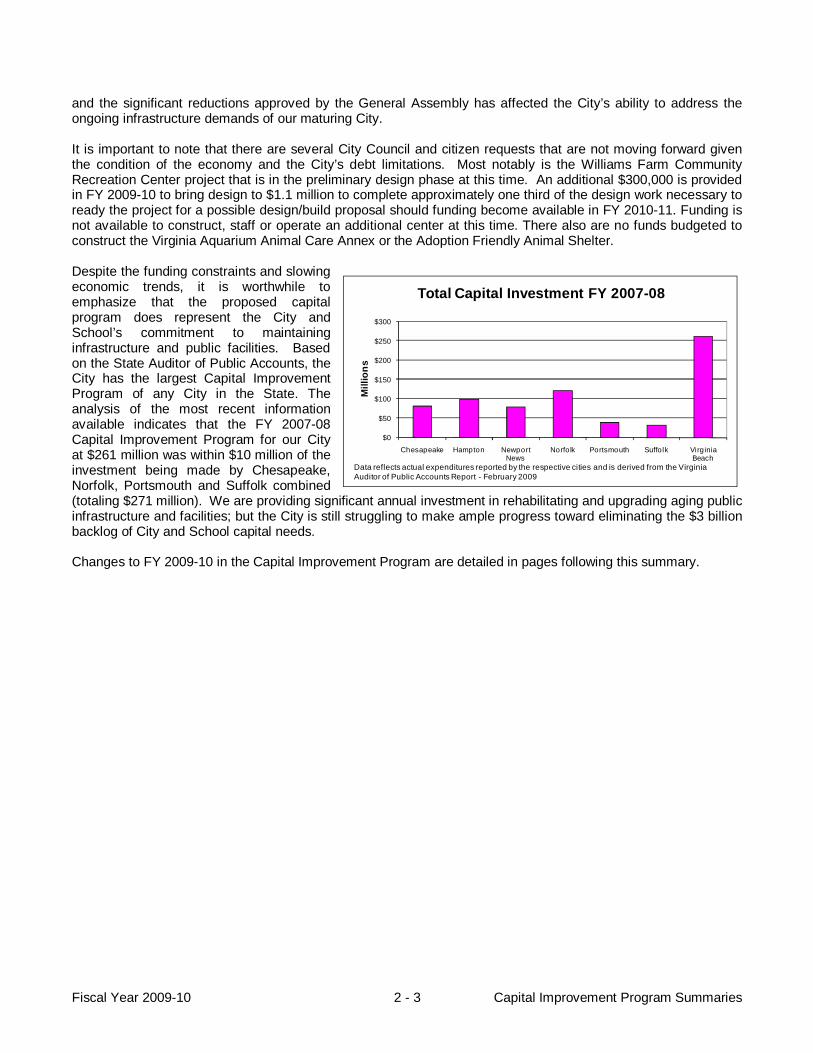
Fiscal Year 2009-10 2 - 3 Capital Improvement Program Summaries
and the significant reductions approved by the General Assembly has affected the City’s ability to address the ongoing infrastructure demands of our maturing City. It is important to note that there are several City Council and citizen requests that are not moving forward given the condition of the economy and the City’s debt limitations. Most notably is the Williams Farm Community Recreation Center project that is in the preliminary design phase at this time. An additional $300,000 is provided in FY 2009-10 to bring design to $1.1 million to complete approximately one third of the design work necessary to ready the project for a possible design/build proposal should funding become available in FY 2010-11. Funding is not available to construct, staff or operate an additional center at this time. There also are no funds budgeted to construct the Virginia Aquarium Animal Care Annex or the Adoption Friendly Animal Shelter. Despite the funding constraints and slowing economic trends, it is worthwhile to emphasize that the proposed capital program does represent the City and School’s commitment to maintaining infrastructure and public facilities. Based on the State Auditor of Public Accounts, the City has the largest Capital Improvement Program of any City in the State. The analysis of the most recent information available indicates that the FY 2007-08 Capital Improvement Program for our City at $261 million was within $10 million of the investment being made by Chesapeake, Norfolk, Portsmouth and Suffolk combined (totaling $271 million). We are providing significant annual investment in rehabilitating and upgrading aging public infrastructure and facilities; but the City is still struggling to make ample progress toward eliminating the $3 billion backlog of City and School capital needs. Changes to FY 2009-10 in the Capital Improvement Program are detailed in pages following this summary.
$0
$50
$100
$150
$200
$250
$300
Chesapeake Hampton Newport News
Norfolk Portsmouth Suffolk Virginia Beach
Mill
ions
Total Capital Investment FY 2007-08
Data reflects actual expenditures reported by the respective cities and is derived from the Virginia Auditor of Public Accounts Report - February 2009

FY 2009-10 Biennial Capital Improvement Program Revisions
Business Area/Project Number and Name/Change Amount ($)
Economic VitalityEconomic and Tourism Development9.058 Rudee Inlet Connector Walk 260,000 This project will construct a concrete walkway at Rudee Loop to connect the boardwalk to the marina and is funded by the Tourism Growth Investment Fund.
9.081 Strategic Growth Area Program 500,000 The increase reflects a transfer of $500,000 from the Economic Development Department's operating budget to this capital project to provide an annual funding level of $3.5 million.
Total Economic Vitality 760,000
Safe CommunityBuildings3.133 Fire Training Center Improvements - Phase III 2,028,599 Includes appropriation of the remaining fund balance from the Fire Programs Fund that was closed out in FY 2008-09. These State funds would be used for improvements to the Fire and Emergency Medical Services (EMS) training facility located at 927 South Birdneck Road to accommodate the rapidly growing numbers of members needing didactic and practical training.
3.371 Fire Apparatus - Phase II (1,317,448)Delays purchase and funding for the Fire ladder truck for the Thalia Fire and Rescue Station to FY 2010-11. Also there is a delay in hiring the 12 Firefighter Recruits for the ladder truck.
Communications and Information Technology3.086 CIT - EMS - Handheld Field Reporting This project funds an interface reporting system form EMS between the City's Dispatching system and area hospitals.
450,000
Total Safe Community 1,161,151
Quality Physical EnvironmentRoadways2.021 Rural Road ImprovementsThis proiect received the fund balance from the Transition Area Special Revenue Fund to enhance the schedule to upgrade substandard rural roads in the City. The Transition Area Special Revenue Fund is proposed to be eliminated.
296,121
2.025 Witchduck Road - Phase IIThis project transferred funds to higher priority roadway projects. (2,168,000)
2.031 Street ReconstructionThis project received funding from General Fund fund balance to expand the schedule of street reconstruction.
2,000,000
2.048 Princess Anne Road/Kempsville Road Intersection ImprovementsThis project lost $1.1 million in State funding and $7.5 million was transferred to other roadway projects in FY 2009-10. Lost funding was restored by transfers of prior years' funding from other projects.
(8,622,013)
Fiscal Year 2009-10 2 - 4 Captial Improvement Progam Summaries

FY 2009-10 Biennial Capital Improvement Program Revisions
Business Area/Project Number and Name/Change Amount ($)
Quality Physical EnvironmentRoadways (continued)2.089 Southeastern Parkway and Greenbelt (Partial)This project transferred funding to Laskin Road Gateway - Phase I-A (#2.143) to advance the schedule of the Laskin Road Gateway project.
(1,000,000)
2.121 Nimmo Parkway - Phase V-AThis project transferred funds to higher priority roadway projects and is delayed beyond FY 2013-14.
(393,789)
2.129 Pavement Maintenance Program Phase IIThis project received funding from General Fund fund balance to expand the pavement maintenance schedule.
2,000,000
2.143 Laskin Road Gateway - Phase I-AThis project received funding from Southeastern Parkway and Greenbelt (Partial) (#2.089) and from retained earnings in the Water and Sewer Fund to advance the project's schedule.
5,054,900
2.157 Lynnhaven Parkway - Phase IXAdditional funding was provided by transfers from other roadway projects. Right-of-way costs are higher than originally anticipated.
3,000,000
2.173 Norfolk Southern Right-of-Way AcquisitionThis project provides for the City's portion of funding for the acquisition of the Norfolk Southern right-of-way by the City. It is anticipated that the remaining funding will be provided by the State ($20 million) and HRT ($5 million). The existing right-of-way corridor is variable in width from 66 feet to 90 feet and extends a total distance of approximately 11 miles.
10,000,000
2.305 Princess Anne Road - Phase IVThis project received funding in transfers from other roadway projects to cover the cost of higher than anticipated right-of-way costs.
10,006,800
2.931 Witchduck Road - Phase IFunding was transferred from this project to 3 other projects: $900,000 to Beach Garden Park - Kilborne Court and Holly Road Improvements (#7.049), $300,000 to Williams Farm Community Recreation Center Design (#4.072), and $300,000 to CIT - City Human Resources/Payroll System (#3.280). This project also lost $1.9 million in State funding and transferred $2.9 million to other roadway projects, but received $10.6 million in funding through the American Recovery and Reinvestment Act (federal stimulus funding).
4,359,113
Water and Sewer5.601 First Colonial Road/Virginia Beach Boulevard Intersection Improvements (110,000)This decrease reflects the reallocation of funds from the Water Utility project at First Colonial Road and Virginia Beach Boulevard to the Auxiliary Power Program for Sewer Pump Stations.
6.601 First Colonial Road/Virginia Beach Boulevard Intersection Improvements (170,000)This decrease reflects the reallocation of funds from the Sewer Utility project at First Colonial Road and Virginia Beach Boulevard to the Auxiliary Power Program for Sewer Pump Stations.
Fiscal Year 2009-10 2 - 5 Captial Improvement Progam Summaries
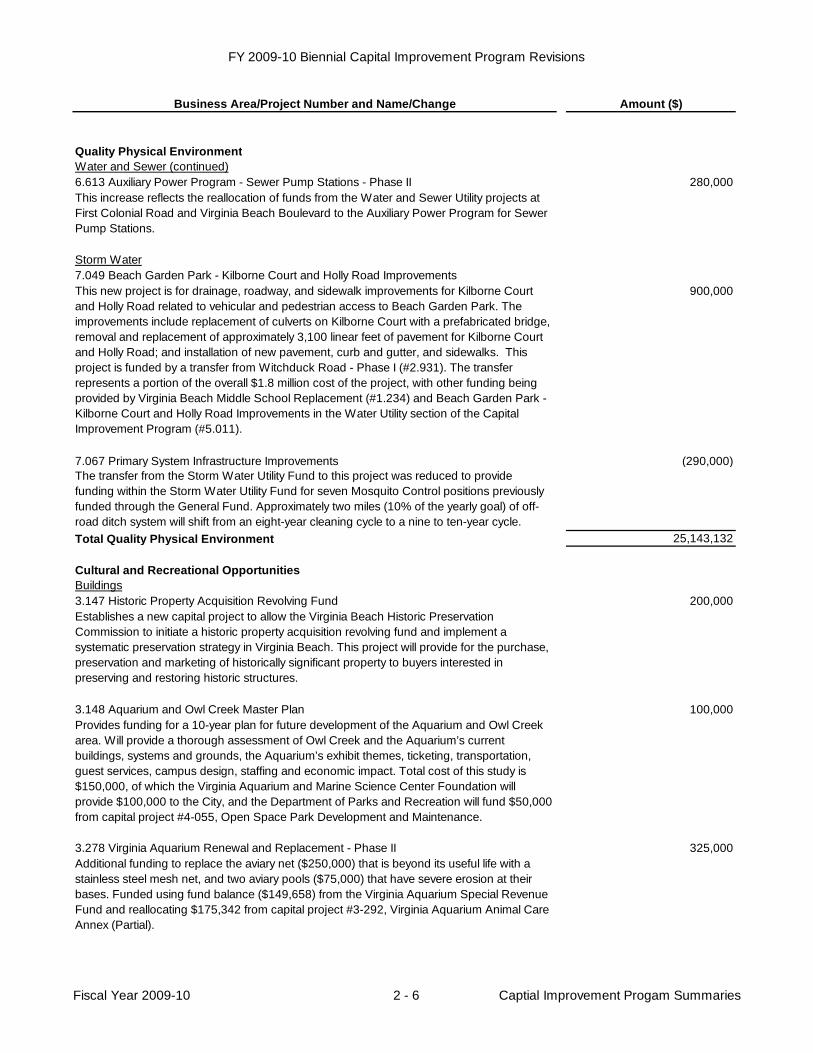
FY 2009-10 Biennial Capital Improvement Program Revisions
Business Area/Project Number and Name/Change Amount ($)
Quality Physical EnvironmentWater and Sewer (continued)6.613 Auxiliary Power Program - Sewer Pump Stations - Phase II 280,000 This increase reflects the reallocation of funds from the Water and Sewer Utility projects at First Colonial Road and Virginia Beach Boulevard to the Auxiliary Power Program for Sewer Pump Stations.
Storm Water7.049 Beach Garden Park - Kilborne Court and Holly Road ImprovementsThis new project is for drainage, roadway, and sidewalk improvements for Kilborne Court and Holly Road related to vehicular and pedestrian access to Beach Garden Park. The improvements include replacement of culverts on Kilborne Court with a prefabricated bridge, removal and replacement of approximately 3,100 linear feet of pavement for Kilborne Court and Holly Road; and installation of new pavement, curb and gutter, and sidewalks. This project is funded by a transfer from Witchduck Road - Phase I (#2.931). The transfer represents a portion of the overall $1.8 million cost of the project, with other funding being provided by Virginia Beach Middle School Replacement (#1.234) and Beach Garden Park - Kilborne Court and Holly Road Improvements in the Water Utility section of the Capital Improvement Program (#5.011).
900,000
7.067 Primary System Infrastructure Improvements (290,000)The transfer from the Storm Water Utility Fund to this project was reduced to provide funding within the Storm Water Utility Fund for seven Mosquito Control positions previously funded through the General Fund. Approximately two miles (10% of the yearly goal) of off-road ditch system will shift from an eight-year cleaning cycle to a nine to ten-year cycle.Total Quality Physical Environment 25,143,132
Cultural and Recreational OpportunitiesBuildings3.147 Historic Property Acquisition Revolving Fund 200,000 Establishes a new capital project to allow the Virginia Beach Historic Preservation Commission to initiate a historic property acquisition revolving fund and implement a systematic preservation strategy in Virginia Beach. This project will provide for the purchase, preservation and marketing of historically significant property to buyers interested in preserving and restoring historic structures.
3.148 Aquarium and Owl Creek Master Plan 100,000 Provides funding for a 10-year plan for future development of the Aquarium and Owl Creek area. Will provide a thorough assessment of Owl Creek and the Aquarium’s current buildings, systems and grounds, the Aquarium’s exhibit themes, ticketing, transportation, guest services, campus design, staffing and economic impact. Total cost of this study is $150,000, of which the Virginia Aquarium and Marine Science Center Foundation will provide $100,000 to the City, and the Department of Parks and Recreation will fund $50,000 from capital project #4-055, Open Space Park Development and Maintenance.
3.278 Virginia Aquarium Renewal and Replacement - Phase II 325,000 Additional funding to replace the aviary net ($250,000) that is beyond its useful life with a stainless steel mesh net, and two aviary pools ($75,000) that have severe erosion at their bases. Funded using fund balance ($149,658) from the Virginia Aquarium Special Revenue Fund and reallocating $175,342 from capital project #3-292, Virginia Aquarium Animal Care Annex (Partial).
Fiscal Year 2009-10 2 - 6 Captial Improvement Progam Summaries
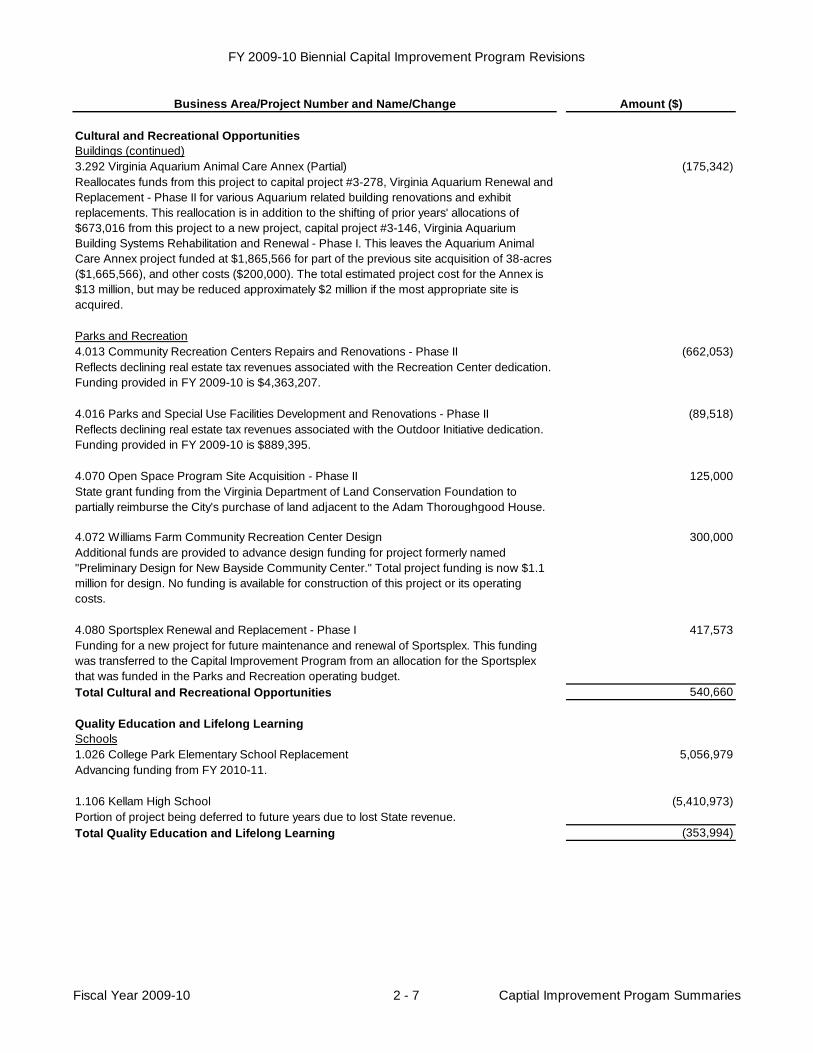
FY 2009-10 Biennial Capital Improvement Program Revisions
Business Area/Project Number and Name/Change Amount ($)
Cultural and Recreational Opportunities Buildings (continued)3.292 Virginia Aquarium Animal Care Annex (Partial) (175,342)Reallocates funds from this project to capital project #3-278, Virginia Aquarium Renewal and Replacement - Phase II for various Aquarium related building renovations and exhibit replacements. This reallocation is in addition to the shifting of prior years' allocations of $673,016 from this project to a new project, capital project #3-146, Virginia Aquarium Building Systems Rehabilitation and Renewal - Phase I. This leaves the Aquarium Animal Care Annex project funded at $1,865,566 for part of the previous site acquisition of 38-acres ($1,665,566), and other costs ($200,000). The total estimated project cost for the Annex is $13 million, but may be reduced approximately $2 million if the most appropriate site is acquired.
Parks and Recreation4.013 Community Recreation Centers Repairs and Renovations - Phase II (662,053)Reflects declining real estate tax revenues associated with the Recreation Center dedication. Funding provided in FY 2009-10 is $4,363,207.
4.016 Parks and Special Use Facilities Development and Renovations - Phase II (89,518)Reflects declining real estate tax revenues associated with the Outdoor Initiative dedication. Funding provided in FY 2009-10 is $889,395.
4.070 Open Space Program Site Acquisition - Phase II 125,000 State grant funding from the Virginia Department of Land Conservation Foundation to partially reimburse the City's purchase of land adjacent to the Adam Thoroughgood House.
4.072 Williams Farm Community Recreation Center Design 300,000 Additional funds are provided to advance design funding for project formerly named "Preliminary Design for New Bayside Community Center." Total project funding is now $1.1 million for design. No funding is available for construction of this project or its operating costs.
4.080 Sportsplex Renewal and Replacement - Phase I 417,573 Funding for a new project for future maintenance and renewal of Sportsplex. This funding was transferred to the Capital Improvement Program from an allocation for the Sportsplex that was funded in the Parks and Recreation operating budget.Total Cultural and Recreational Opportunities 540,660
Quality Education and Lifelong LearningSchools1.026 College Park Elementary School Replacement 5,056,979 Advancing funding from FY 2010-11.
1.106 Kellam High School (5,410,973)Portion of project being deferred to future years due to lost State revenue.Total Quality Education and Lifelong Learning (353,994)
Fiscal Year 2009-10 2 - 7 Captial Improvement Progam Summaries
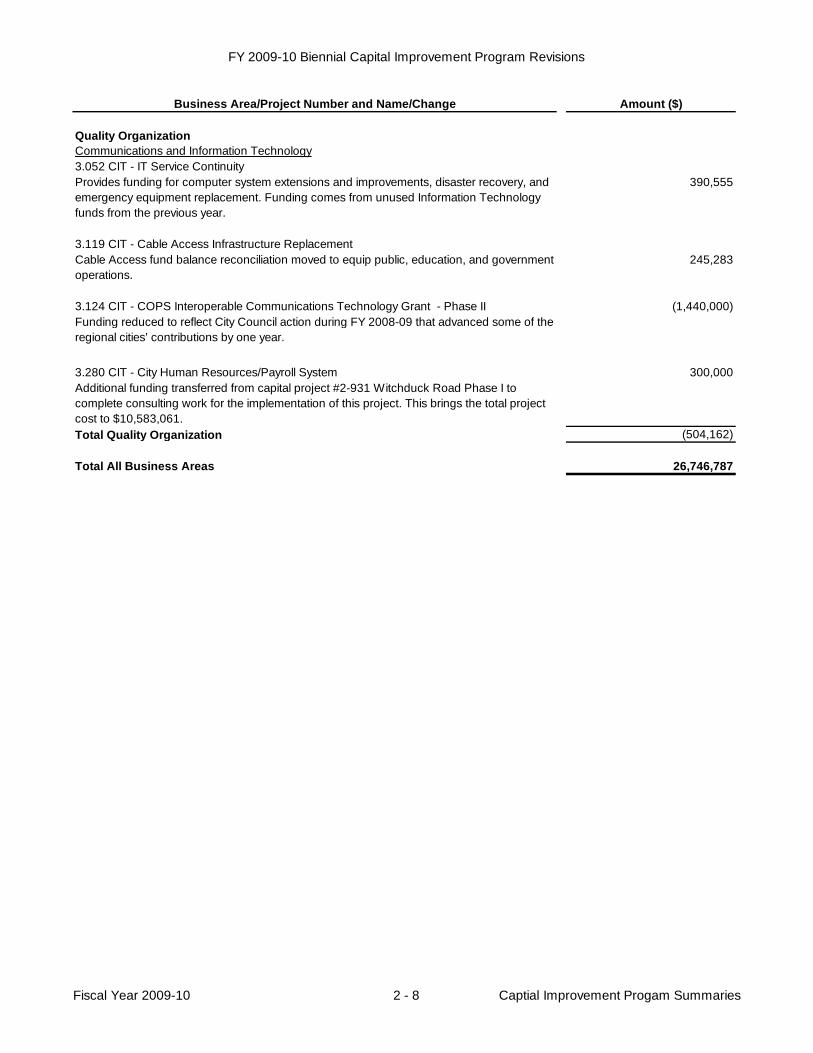
FY 2009-10 Biennial Capital Improvement Program Revisions
Business Area/Project Number and Name/Change Amount ($)
Quality OrganizationCommunications and Information Technology3.052 CIT - IT Service ContinuityProvides funding for computer system extensions and improvements, disaster recovery, and emergency equipment replacement. Funding comes from unused Information Technology funds from the previous year.
390,555
3.119 CIT - Cable Access Infrastructure ReplacementCable Access fund balance reconciliation moved to equip public, education, and government operations.
245,283
3.124 CIT - COPS Interoperable Communications Technology Grant - Phase II (1,440,000)Funding reduced to reflect City Council action during FY 2008-09 that advanced some of the regional cities’ contributions by one year.
3.280 CIT - City Human Resources/Payroll System 300,000 Additional funding transferred from capital project #2-931 Witchduck Road Phase I to complete consulting work for the implementation of this project. This brings the total project cost to $10,583,061. Total Quality Organization (504,162)
Total All Business Areas 26,746,787
Fiscal Year 2009-10 2 - 8 Captial Improvement Progam Summaries

Table of Contents Operating Budget Ordinances
Budget Ordinance for the Fiscal Year Beginning July 1, 2009 and Ending June 30, 2010 .......................... 3 - 1 An Ordinance Establishing the Tax Levy on Real Estate for Fiscal Year 2010 ......................................... 3 - 14 An Ordinance Establishing the Tax Levy on Personal Property and Machinery and Tools for the Calendar Year 2010 ........................................................................................................ 3 - 16 An Ordinance to Authorize the City Manager to Submit an Annual Funding Plan to the U.S. Department of Housing and Urban Development ................................................................ 3 - 19 An Ordinance to Transfer $8,800,000 from the School Reserve Special Revenue Fund to the City’s FY 2008-09 General Fund Operating Budget .................................................................... 3 - 20 An Ordinance to Declare $9,000,000 of Funding Within the Sandbridge Tax Increment Financing District as Surplus Funds in the FY 2008-09 Operating Budget ................................................... 3 - 21 An Ordinance to Temporarily Suspend the Transition Area Special Revenue Fund ................................ 3 - 22
Capital Improvement Program Ordinances
An Ordinance to Revise the FY 2010/FY 2014 Capital Improvement Program ......................................... 3 - 23 An Ordinance Authorizing the Issuance of General Obligation Public Improvement Bonds of the City of Virginia Beach, Virginia, in the Maximum Amount of $62,900,000 for Various Public Facilities and General Improvements .......................................................................................... 3 - 33
An Ordinance Authorizing the Issuance of Water and Sewer System Revenue Bonds of the City of
Virginia Beach, Virginia, in the Maximum Amount of $17,000,000 ............................................... 3 - 34
Note: The ordinances listed below were included in the proposed document but were not adopted on May 12, 2009. The Resolution regarding the biennial process was deferred to June 9, 2009 by consent. The Ordinance to change the City Code was deferred indefinitely by consent.
A Resolution to Adopt the Budget Through an Annual Rather Than Biennial Process An Ordinance to Eliminate Section 2-186.1 of the City Code of the City of Virginia Beach, Virginia
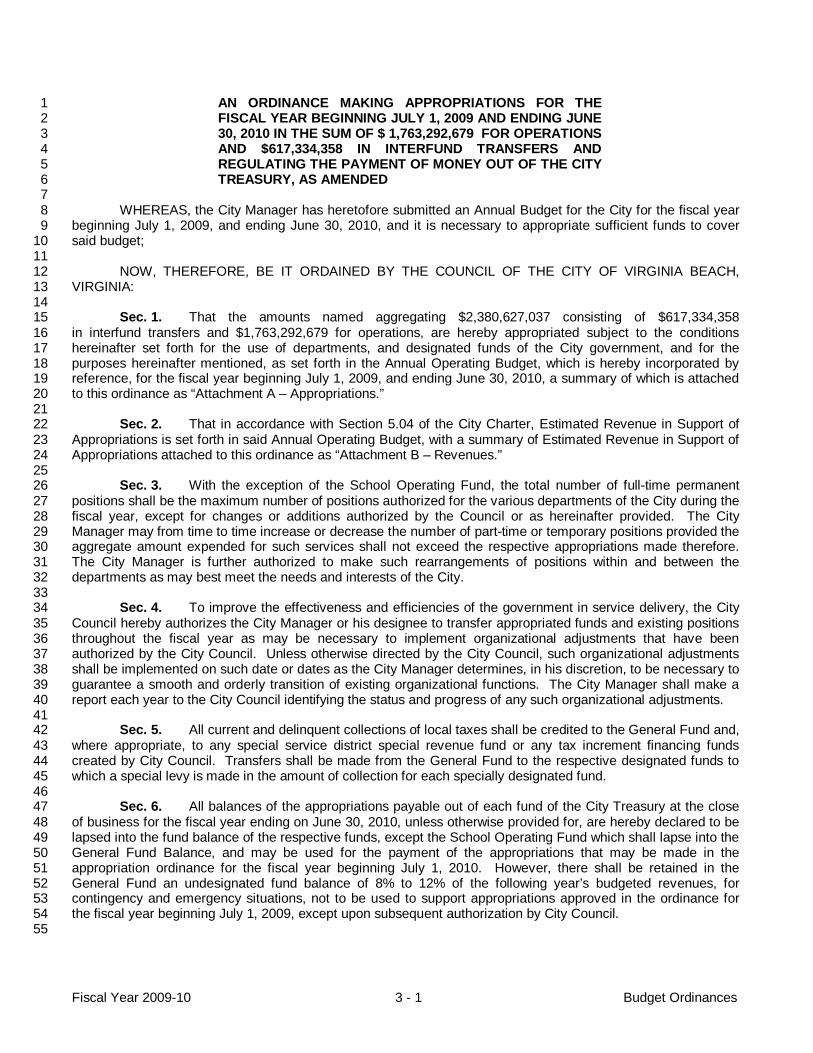
Fiscal Year 2009-10 3 - 1 Budget Ordinances
AN ORDINANCE MAKING APPROPRIATIONS FOR THE 1 FISCAL YEAR BEGINNING JULY 1, 2009 AND ENDING JUNE 2 30, 2010 IN THE SUM OF $ 1,763,292,679 FOR OPERATIONS 3 AND $617,334,358 IN INTERFUND TRANSFERS AND 4 REGULATING THE PAYMENT OF MONEY OUT OF THE CITY 5 TREASURY, AS AMENDED 6
7 WHEREAS, the City Manager has heretofore submitted an Annual Budget for the City for the fiscal year 8
beginning July 1, 2009, and ending June 30, 2010, and it is necessary to appropriate sufficient funds to cover 9 said budget; 10
11 NOW, THEREFORE, BE IT ORDAINED BY THE COUNCIL OF THE CITY OF VIRGINIA BEACH, 12
VIRGINIA: 13 14
Sec. 1. That the amounts named aggregating $2,380,627,037 consisting of $617,334,358 15 in interfund transfers and $1,763,292,679 for operations, are hereby appropriated subject to the conditions 16 hereinafter set forth for the use of departments, and designated funds of the City government, and for the 17 purposes hereinafter mentioned, as set forth in the Annual Operating Budget, which is hereby incorporated by 18 reference, for the fiscal year beginning July 1, 2009, and ending June 30, 2010, a summary of which is attached 19 to this ordinance as “Attachment A – Appropriations.” 20 21
Sec. 2. That in accordance with Section 5.04 of the City Charter, Estimated Revenue in Support of 22 Appropriations is set forth in said Annual Operating Budget, with a summary of Estimated Revenue in Support of 23 Appropriations attached to this ordinance as “Attachment B – Revenues.” 24 25
Sec. 3. With the exception of the School Operating Fund, the total number of full-time permanent 26 positions shall be the maximum number of positions authorized for the various departments of the City during the 27 fiscal year, except for changes or additions authorized by the Council or as hereinafter provided. The City 28 Manager may from time to time increase or decrease the number of part-time or temporary positions provided the 29 aggregate amount expended for such services shall not exceed the respective appropriations made therefore. 30 The City Manager is further authorized to make such rearrangements of positions within and between the 31 departments as may best meet the needs and interests of the City. 32 33
Sec. 4. To improve the effectiveness and efficiencies of the government in service delivery, the City 34 Council hereby authorizes the City Manager or his designee to transfer appropriated funds and existing positions 35 throughout the fiscal year as may be necessary to implement organizational adjustments that have been 36 authorized by the City Council. Unless otherwise directed by the City Council, such organizational adjustments 37 shall be implemented on such date or dates as the City Manager determines, in his discretion, to be necessary to 38 guarantee a smooth and orderly transition of existing organizational functions. The City Manager shall make a 39 report each year to the City Council identifying the status and progress of any such organizational adjustments. 40 41
Sec. 5. All current and delinquent collections of local taxes shall be credited to the General Fund and, 42 where appropriate, to any special service district special revenue fund or any tax increment financing funds 43 created by City Council. Transfers shall be made from the General Fund to the respective designated funds to 44 which a special levy is made in the amount of collection for each specially designated fund. 45 46
Sec. 6. All balances of the appropriations payable out of each fund of the City Treasury at the close 47 of business for the fiscal year ending on June 30, 2010, unless otherwise provided for, are hereby declared to be 48 lapsed into the fund balance of the respective funds, except the School Operating Fund which shall lapse into the 49 General Fund Balance, and may be used for the payment of the appropriations that may be made in the 50 appropriation ordinance for the fiscal year beginning July 1, 2010. However, there shall be retained in the 51 General Fund an undesignated fund balance of 8% to 12% of the following year’s budgeted revenues, for 52 contingency and emergency situations, not to be used to support appropriations approved in the ordinance for 53 the fiscal year beginning July 1, 2009, except upon subsequent authorization by City Council. 54 55
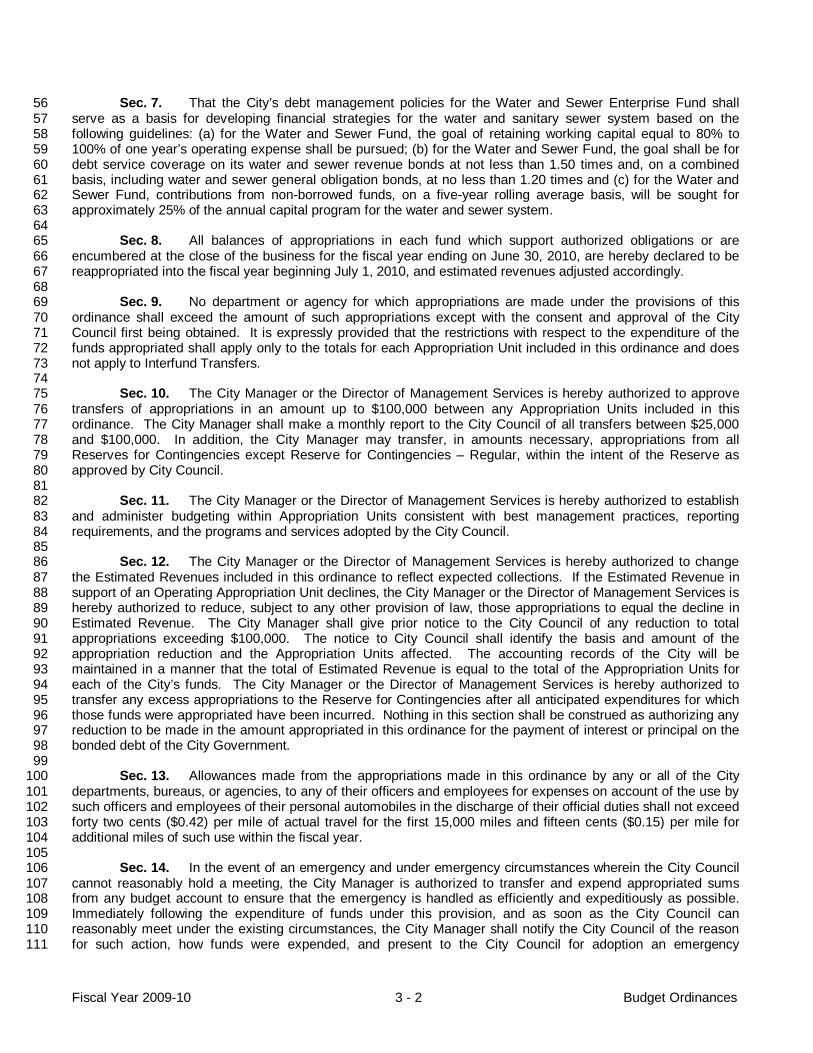
Fiscal Year 2009-10 3 - 2 Budget Ordinances
Sec. 7. That the City’s debt management policies for the Water and Sewer Enterprise Fund shall 56 serve as a basis for developing financial strategies for the water and sanitary sewer system based on the 57 following guidelines: (a) for the Water and Sewer Fund, the goal of retaining working capital equal to 80% to 58 100% of one year’s operating expense shall be pursued; (b) for the Water and Sewer Fund, the goal shall be for 59 debt service coverage on its water and sewer revenue bonds at not less than 1.50 times and, on a combined 60 basis, including water and sewer general obligation bonds, at no less than 1.20 times and (c) for the Water and 61 Sewer Fund, contributions from non-borrowed funds, on a five-year rolling average basis, will be sought for 62 approximately 25% of the annual capital program for the water and sewer system. 63 64
Sec. 8. All balances of appropriations in each fund which support authorized obligations or are 65 encumbered at the close of the business for the fiscal year ending on June 30, 2010, are hereby declared to be 66 reappropriated into the fiscal year beginning July 1, 2010, and estimated revenues adjusted accordingly. 67 68
Sec. 9. No department or agency for which appropriations are made under the provisions of this 69 ordinance shall exceed the amount of such appropriations except with the consent and approval of the City 70 Council first being obtained. It is expressly provided that the restrictions with respect to the expenditure of the 71 funds appropriated shall apply only to the totals for each Appropriation Unit included in this ordinance and does 72 not apply to Interfund Transfers. 73 74
Sec. 10. The City Manager or the Director of Management Services is hereby authorized to approve 75 transfers of appropriations in an amount up to $100,000 between any Appropriation Units included in this 76 ordinance. The City Manager shall make a monthly report to the City Council of all transfers between $25,000 77 and $100,000. In addition, the City Manager may transfer, in amounts necessary, appropriations from all 78 Reserves for Contingencies except Reserve for Contingencies – Regular, within the intent of the Reserve as 79 approved by City Council. 80 81
Sec. 11. The City Manager or the Director of Management Services is hereby authorized to establish 82 and administer budgeting within Appropriation Units consistent with best management practices, reporting 83 requirements, and the programs and services adopted by the City Council. 84 85
Sec. 12. The City Manager or the Director of Management Services is hereby authorized to change 86 the Estimated Revenues included in this ordinance to reflect expected collections. If the Estimated Revenue in 87 support of an Operating Appropriation Unit declines, the City Manager or the Director of Management Services is 88 hereby authorized to reduce, subject to any other provision of law, those appropriations to equal the decline in 89 Estimated Revenue. The City Manager shall give prior notice to the City Council of any reduction to total 90 appropriations exceeding $100,000. The notice to City Council shall identify the basis and amount of the 91 appropriation reduction and the Appropriation Units affected. The accounting records of the City will be 92 maintained in a manner that the total of Estimated Revenue is equal to the total of the Appropriation Units for 93 each of the City’s funds. The City Manager or the Director of Management Services is hereby authorized to 94 transfer any excess appropriations to the Reserve for Contingencies after all anticipated expenditures for which 95 those funds were appropriated have been incurred. Nothing in this section shall be construed as authorizing any 96 reduction to be made in the amount appropriated in this ordinance for the payment of interest or principal on the 97 bonded debt of the City Government. 98 99
Sec. 13. Allowances made from the appropriations made in this ordinance by any or all of the City 100 departments, bureaus, or agencies, to any of their officers and employees for expenses on account of the use by 101 such officers and employees of their personal automobiles in the discharge of their official duties shall not exceed 102 forty two cents ($0.42) per mile of actual travel for the first 15,000 miles and fifteen cents ($0.15) per mile for 103 additional miles of such use within the fiscal year. 104 105
Sec. 14. In the event of an emergency and under emergency circumstances wherein the City Council 106 cannot reasonably hold a meeting, the City Manager is authorized to transfer and expend appropriated sums 107 from any budget account to ensure that the emergency is handled as efficiently and expeditiously as possible. 108 Immediately following the expenditure of funds under this provision, and as soon as the City Council can 109 reasonably meet under the existing circumstances, the City Manager shall notify the City Council of the reason 110 for such action, how funds were expended, and present to the City Council for adoption an emergency 111

Fiscal Year 2009-10 3 - 3 Budget Ordinances
appropriations ordinance that sets forth what measures are required to ensure that funds are forthwith restored to 112 the appropriate accounts and that the budget is balanced at the end of the fiscal year in which the emergency 113 expenditures occurred. 114
115 An emergency is defined for the purposes of this provision as an event that could not have been 116
reasonably foreseen at the time of the adoption of the budget, and in which (i) an immediate threat to the public 117 health, safety or welfare is involved, such as clean-up after a hurricane, and/or (ii) immediate action is required to 118 protect or preserve public properties. 119
120 Sec. 15. All travel expense accounts shall be submitted on forms approved by the Director of Finance 121
and according to regulations approved by the City Council. Each account shall show the dates expenses were 122 incurred or paid; number of miles traveled; method of travel; hotel expenses; meals; and incidental expenses. 123 The Director of Finance is specifically directed to withhold the issuance of checks in the event expense accounts 124 are submitted for “lump-sum” amounts. 125 126
Sec. 16. Violation of this ordinance may result in disciplinary action by the City Manager against the 127 person or persons responsible for the management of the Appropriation Unit in which the violation occurred. 128
129 Sec. 17. Funds in the amount of $366,814 are hereby appropriated to the School Health Insurance 130
Internal Service Fund from the fund balance of the Health Insurance Trust Fund. This change allows the Health 131 Insurance Trust Fund to be removed from the accounting records. The Health Insurance Trust Fund originally 132 included the premiums for City employees’ health insurance before these premiums were consolidated with 133 School employees’ health insurance premiums in the School Health Insurance Internal Service Fund. 134
135 Sec. 18. The City Manager and School Board are authorized to expend funds related to the City and 136
School’s GASB45 liability in the School Health Insurance Internal Service Fund. 137 138
Sec. 17 19. This ordinance shall be effective on July 1, 2009. 139 140
Sec. 18 20. If any part of this ordinance is for any reason declared to be unconstitutional or invalid, such 141 decision shall not affect the validity of the remaining parts of this ordinance. 142 143
Adopted by the Council of the City of Virginia Beach, Virginia, on this the 12th day of May, 2009. 144 145 Requires an affirmative vote by a majority of all the members of City Council.146

City of Virginia Beach, VirginiaFiscal Year 2009-10 Budget Ordinance
Attachment A - AppropriationsFY 2009-10
Adopted
002 General FundAgriculture 860,134Benefits Administration 824,814Board of Equalization 19,130Circuit Court 998,897City Attorney 3,875,841City Auditor 576,573City Clerk 626,129City Manager 3,069,307City Real Estate Assessor 3,114,292City Treasurer 5,186,382Clerk of the Circuit Court 2,788,828Commissioner of the Revenue 3,942,320Commonwealth's Attorney 7,424,710Communications and Information Technology 21,903,513Community Organization Grants 525,662Convention and Visitor Bureau 9,939,621Cultural Activities 2,512,233Director of Finance 5,022,497Economic Development 2,045,444Emergency Communications and Citizen Services 9,168,294Emergency Medical Services 7,228,263Employee Special Benefits 4,656,199Fire 42,642,222General District Court 320,995General Registrar 1,264,732Health 3,453,359Housing and Neighborhood Preservation 1,750,830Human Resources 4,536,071Human Services 112,146,368Independent Financial Services 153,878Juvenile Probation 2,357,474Juvenile and Domestic Relations District Court 162,320Library 16,675,646Magistrates 130,910Management Services 4,034,514Mass Transit Operations 2,907,059Municipal Council 587,139Museums 9,600,189Parks and Recreation 13,691,224Planning and Community Development 10,145,290Police 87,645,513Public Works 84,616,871Regional Participation 2,071,573Reserve for Contingencies 2,752,750Revenue Reimbursements 15,928,947Strategic Growth Area 194,650Transfer to Other Funds 530,329,643Vehicle Replacements 3,111,914Wetlands Board of Virginia Beach 14,331Zoning Board of Appeals 41,789
Fund 002 Appropriation Totals 1,049,577,284Education
* Education 833,677,199Education Appropriation Totals 833,677,199
*This provides lump-sum funding for Education.
Fiscal Year 2009-10 3 - 4 Budget Ordinances

City of Virginia Beach, VirginiaFiscal Year 2009-10 Budget Ordinance
Attachment A - AppropriationsFY 2009-10
Adopted
130 Law Library FundLibrary (Law Library) 223,307Reserve for Contingencies 5,300Transfers to Other Funds 60,000
Fund 130 Appropriation Totals 288,607
142 DEA Seized Property Special Revenue FundCommonwealth's Attorney 160,000
Fund 142 Appropriation Totals 160,000
147 Federal Sectional 8 Program Special Revenue FundHousing and Neighborhood Preservation (Section 8 Housing) 1,742,664Housing and Neighborhood Preservation (Section 8) 16,081,642
Fund 147 Appropriation Totals 17,824,306
149 Sheriff's Department Special Revenue FundSheriff and Corrections 35,325,573
Fund 149 Appropriation Totals 35,325,573
150 Inmate Services Special Revenue FundReserve for Contingencies 1,551Sheriff and Corrections (Inmate Services) 668,608Transfer to Other Funds 274,551
Fund 150 Appropriation Totals 944,710
151 Parks and Recreation Special Revenue FundParks and Recreation 25,727,995Public Works 2,694,270Reserve for Contingencies 83,502
Fund 151 Appropriation Totals 28,505,767
152 Tourism Growth Investment FundConvention and Visitor Bureau (TGIF) 3,284,763Cultural Affairs (TGIF) 50,500Parks and Recreation (TGIF) 33,210Planning and Community Development (TGIF) 590,000Public Works (TGIF) 835,161Transfer to Other Funds 14,381,277
Fund 152 Appropriation Totals 19,174,911
157 Sandbridge Special Service District Special Revenue FundTransfer to Other Funds 3,336,076
Fund 157 Appropriation Totals 3,336,076
158 EMS State Four-for-Life Special Revenue FundTransfer to Other Funds 854
Fund 158 Appropriation Totals 854
161 Agriculture Reserve Program Special Revenue FundAgriculture (Agricultural Reserve Program) 159,827Future C.I.P. Commitments 700,140Transfer to Other Funds 7,034,647
Fund 161 Appropriation Totals 7,894,614
Fiscal Year 2009-10 3 - 5 Budget Ordinances

City of Virginia Beach, VirginiaFiscal Year 2009-10 Budget Ordinance
Attachment A - AppropriationsFY 2009-10
Adopted
163 Tourism Advertising Program Special Revenue FundConvention and Visitor Bureau (Tourism Advertising) 9,992,642Transfer to Other Funds 56,838
Fund 163 Appropriation Totals 10,049,480
165 Lynnhaven Mall Tax Increment Financing FundReserve for Contingencies 103,527Tax Increment Financing 2,050,000
Fund 165 Appropriation Totals 2,153,527
166 Sandbridge Tax Increment Financing FundFuture C.I.P. Commitments 9,000,000Transfer to Other Funds 868,924
Fund 166 Appropriation Totals 9,868,924
167 Arts and Humanities Commission Special Revenue FundTransfer to Other Funds 37,237
Fund 167 Appropriation Totals 37,237
169 Central Business District - South TIF (Town Center) FundFuture C.I.P. Commitments 500,000Reserve for Contingencies 119,880Transfer to Other Funds 5,681,054
Fund 169 Appropriation Totals 6,300,934
172 Open Space Special Revenue FundParks and Recreation (Open Space) 406,402Public Works (Open Space) 15,300Transfer to Other Funds 4,898,134
Fund 172 Appropriation Totals 5,319,836
173 Major Projects Special Revenue FundTransfer to Other Funds 22,051,701
Fund 173 Appropriation Totals 22,051,701174 Town Center Special Tax District
Reserve for Contingencies 283,564Town Center Special Tax District 1,873,331
Fund 174 Appropriation Totals 2,156,895
175 Golf Course Special Revenue FundParks and Recreation (Golf Courses) 2,486,191Reserve for Contingencies 59,043Transfer to Other Funds 289,550
Fund 175 Appropriation Totals 2,834,784
180 Community Development Special Revenue FundCommunity Development Block Grants 1,395,723Housing and Neighborhood Preservation 1,290,743Reserve for Contingencies 741Transfer to Other Funds 128,104
Fund 180 Appropriation Totals 2,815,311
181 CD Loan and Grant FundCommunity Development Block Loan and Grants 746,336
Fund 181 Appropriation Totals 746,336
Fiscal Year 2009-10 3 - 6 Budget Ordinances

City of Virginia Beach, VirginiaFiscal Year 2009-10 Budget Ordinance
Attachment A - AppropriationsFY 2009-10
Adopted
182 Federal Housing Assistance Grant FundFederal HOME Grants 1,528,449
Fund 182 Appropriation Totals 1,528,449
183 Grants Consolidated FundCommonwealth's Attorney Grants 302,791Emergency Medical Services Grants 323,954Fire (Fire Programs) 610,757Housing and Neighborhood Grants 1,077,437Human Services 1,317,960Police (Uniform Patrol Grant) 71,271Public Works Grants 15,000Reserve for Contingencies 104,915Social Services Grants 768,477Transfer to Other Funds 400,000
Fund 183 Appropriation Totals 4,992,562
187 Marine Science Museum Grants FundMuseum Grants 31,000
Fund 187 Appropriation Totals 31,000241 Water and Sewer Fund
Debt Service 16,389,014Public Utilities 68,837,653Reserve for Contingencies 3,281,998Transfer to Other Funds 13,985,245
Fund 241 Appropriation Totals 102,493,910
253 Parking Enterprise FundConvention and Visitor Bureau (Parking) 1,669,306Reserve for Contingencies 11,669Transfer to Other Funds 866,776
Fund 253 Appropriation Totals 2,547,751
255 Storm Water Utility Enterprise FundDebt Service 2,011,002Public Works (Storm Water Operations) 10,150,967Reserve for Contingencies 160,777Transfer to Other Funds 12,653,747
Fund 255 Appropriation Totals 24,976,493
302 General Debt FundDebt Service 128,009,417
Fund 302 Appropriation Totals 128,009,417
540 General Government Capital Projects FundBuildings Capital Projects 3,234,536Coastal Capital Projects 6,214,818Communications and Information Technology Projects 3,016,000Economic and Tourism Development Capital Projects 5,880,578Parks and Recreation Capital Projects 9,900,175Roadways Capital Projects 8,336,291
Fund 540 Appropriation Totals 36,582,398
541 Water and Sewer Capital Projects FundWater and Sewer Capital Projects 7,500,000
Fund 541 Appropriation Totals 7,500,000
Fiscal Year 2009-10 3 - 7 Budget Ordinances

City of Virginia Beach, VirginiaFiscal Year 2009-10 Budget Ordinance
Attachment A - AppropriationsFY 2009-10
Adopted
555 Storm Water Capital Projects FundStorm Water Capital Projects 10,802,279
Fund 555 Appropriation Totals 10,802,279
908 City Beautification FundParks and Recreation 20,400
Fund 908 Appropriation Totals 20,400
909 Library Gift FundLibrary Gift 5,712
Fund 909 Appropriation Totals 5,712911 Parks and Recreation Gift Fund
Parks and Recreation (Gift Fund) 91,800Fund 911 Appropriation Totals 91,800
Total Appropriations for all Funds 2,380,627,037Less Interfund Transfers 617,334,358
Net Appropriations Totals 1,763,292,679
Fiscal Year 2009-10 3 - 8 Budget Ordinances

City of Virginia Beach, VirginiaFiscal Year 2009-10 Budget Ordinance
Attachment B - RevenuesFY 2009-10
Adopted
002 General FundRevenue from Local Sources
General Property Taxes 599,594,310Other Local Taxes 255,516,845Permits, Privilege Fees, and Regulatory Licenses 4,329,835Fines and Forfeitures 7,942,961From the Use of Money and Property 9,824,843Charges for Services 16,768,366Miscellaneous Revenue 4,557,551
Revenue from the CommonwealthOther Sources from the Commonwealth 107,006,368
Revenue from the Federal Government 23,033,419Transfers from Other Funds 16,202,786Specific Fund Reserves 4,800,000
Fund 002 Revenue Totals 1,049,577,284
EducationRevenue from Local Sources
From the Use of Money and Property 995,000Charges for Services 19,607,171Miscellaneous Revenue 11,487,901
Revenue from the CommonwealthState Shared Sales Tax 72,941,384Other Sources from the Commonwealth 293,751,478
Revenue from the Federal Government 94,633,121Transfers from Other Funds 335,208,106Specific Fund Reserves 5,053,038
Education Revenue Totals 833,677,199
130 Law Library FundRevenue from Local Sources
From the Use of Money and Property 7,087Charges for Services 281,520
Fund 130 Revenue Totals 288,607
142 DEA Seized Property Special Revenue FundRevenue from the Commonwealth
Other Sources from the Commonwealth 160,000Fund 142 Revenue Totals 160,000
147 Federal Sectional 8 Program Special Revenue FundRevenue from Local Sources
Miscellaneous Revenue 24,000Revenue from the Federal Government 17,702,204Transfer from Other Funds 98,102
Fund 147 Revenue Totals 17,824,306
149 Sheriff's Department Special Revenue FundRevenue from Local Sources
Charges for Services 2,288,255Miscellaneous Revenue 37,960
Revenue from the CommonwealthOther Sources from the Commonwealth 19,381,205
Revenue from the Federal Government 321,200Transfer from Other Funds 12,644,250Specific Fund Reserves 652,703
Fiscal Year 2009-10 3 - 9 Budget Ordinances

City of Virginia Beach, VirginiaFiscal Year 2009-10 Budget Ordinance
Attachment B - RevenuesFY 2009-10
Adopted
Fund 149 Revenue Totals 35,325,573150 Inmate Services Special Revenue Fund
Revenue from Local SourcesFrom the Use of Money and Property 15,000Charges for Services 929,710
Fund 150 Revenue Totals 944,710
151 Parks and Recreation Special Revenue FundRevenue from Local Sources
From the Use of Money and Property 1,084,782Charges for Services 10,979,797Miscellaneous Revenue 37,000
Revenue from the Federal Government 1,000Transfer from Other Funds 16,403,188
Fund 151 Revenue Totals 28,505,767
152 Tourism Growth Investment FundRevenue from Local Sources
Permits, Privilege Fees, and Regulatory Licenses 72,091Fines and Forfeitures 583,278From the Use of Money and Property 523,040
Transfer from Other Funds 17,208,652Specific Fund Reserves 787,850
Fund 152 Revenue Totals 19,174,911
157 Sandbridge Special Service District Special Revenue FundRevenue from Local Sources
General Property Taxes 755,302Other Local Taxes 863,538From the Use of Money and Property 80,680
Transfer from Other Funds 1,589,432Specific Fund Reserves 47,124
Fund 157 Revenue Totals 3,336,076
158 EMS State Four-for-Life Special Revenue FundSpecific Fund Reserves 854
Fund 158 Revenue Totals 854
161 Agriculture Reserve Program Special Revenue FundTransfer from Other Funds 4,824,373Specific Fund Reserves 3,070,241
Fund 161 Revenue Totals 7,894,614
163 Tourism Advertising Program Special Revenue FundRevenue from Local Sources
From the Use of Money and Property 48,442Charges for Services 306,950Miscellaneous Revenue 40,000
Transfer from Other Funds 9,443,263Specific Fund Reserves 210,825
Fund 163 Revenue Totals 10,049,480
165 Lynnhaven Mall Tax Increment Financing FundRevenue from Local Sources
General Property Taxes 2,153,527Fund 165 Revenue Totals 2,153,527
Fiscal Year 2009-10 3 - 10 Budget Ordinances
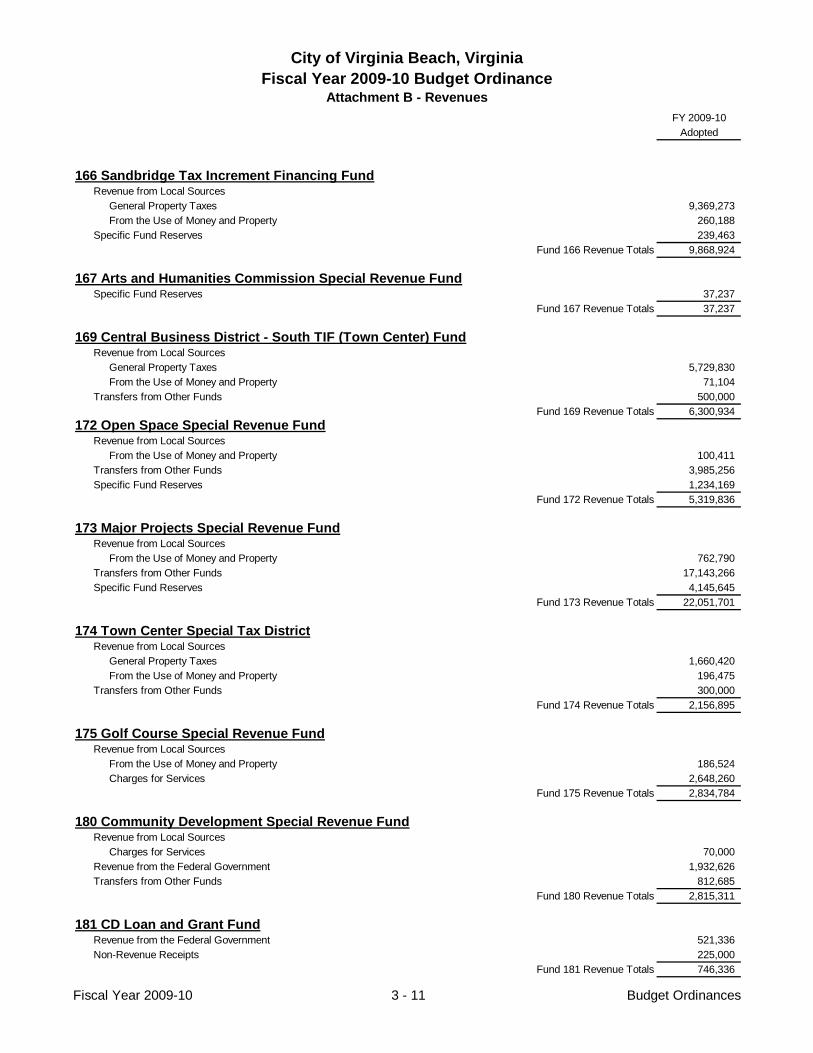
City of Virginia Beach, VirginiaFiscal Year 2009-10 Budget Ordinance
Attachment B - RevenuesFY 2009-10
Adopted
166 Sandbridge Tax Increment Financing FundRevenue from Local Sources
General Property Taxes 9,369,273From the Use of Money and Property 260,188
Specific Fund Reserves 239,463Fund 166 Revenue Totals 9,868,924
167 Arts and Humanities Commission Special Revenue FundSpecific Fund Reserves 37,237
Fund 167 Revenue Totals 37,237
169 Central Business District - South TIF (Town Center) FundRevenue from Local Sources
General Property Taxes 5,729,830From the Use of Money and Property 71,104
Transfers from Other Funds 500,000Fund 169 Revenue Totals 6,300,934
172 Open Space Special Revenue FundRevenue from Local Sources
From the Use of Money and Property 100,411Transfers from Other Funds 3,985,256Specific Fund Reserves 1,234,169
Fund 172 Revenue Totals 5,319,836
173 Major Projects Special Revenue FundRevenue from Local Sources
From the Use of Money and Property 762,790Transfers from Other Funds 17,143,266Specific Fund Reserves 4,145,645
Fund 173 Revenue Totals 22,051,701
174 Town Center Special Tax DistrictRevenue from Local Sources
General Property Taxes 1,660,420From the Use of Money and Property 196,475
Transfers from Other Funds 300,000Fund 174 Revenue Totals 2,156,895
175 Golf Course Special Revenue FundRevenue from Local Sources
From the Use of Money and Property 186,524Charges for Services 2,648,260
Fund 175 Revenue Totals 2,834,784
180 Community Development Special Revenue FundRevenue from Local Sources
Charges for Services 70,000Revenue from the Federal Government 1,932,626Transfers from Other Funds 812,685
Fund 180 Revenue Totals 2,815,311
181 CD Loan and Grant FundRevenue from the Federal Government 521,336Non-Revenue Receipts 225,000
Fund 181 Revenue Totals 746,336
Fiscal Year 2009-10 3 - 11 Budget Ordinances

City of Virginia Beach, VirginiaFiscal Year 2009-10 Budget Ordinance
Attachment B - RevenuesFY 2009-10
Adopted
182 Federal Housing Assistance Grant FundRevenue from the Federal Government 1,403,449Non-Revenue Receipts 125,000
Fund 182 Revenue Totals 1,528,449183 Grants Consolidated Fund
Revenue from Local SourcesCharges for Services 65,000
Revenue from the CommonwealthOther Sources from the Commonwealth 2,852,503
Revenue from the Federal Government 1,665,602Transfers from Other Funds 409,457
Fund 183 Revenue Totals 4,992,562
187 Marine Science Museum Grants FundRevenue from the Federal Government 31,000
Fund 187 Revenue Totals 31,000
241 Water and Sewer FundRevenue from Local Sources
From the Use of Money and Property 2,177,974Charges for Services 96,377,637Miscellaneous Revenue 259,373
Non-Revenue Receipts 3,314,693Transfers from Other Funds 264,233Specific Fund Reserves 100,000
Fund 241 Revenue Totals 102,493,910
253 Parking Enterprise FundRevenue from Local Sources
From the Use of Money and Property 87,000Charges for Services 2,201,948
Transfers from Other Funds 258,803Fund 253 Revenue Totals 2,547,751
255 Storm Water Utility Enterprise FundRevenue from Local Sources
From the Use of Money and Property 160,000Charges for Services 19,337,715
Revenue from the CommonwealthOther Sources from the Commonwealth 5,406,916
Transfers from Other Funds 71,862Fund 255 Revenue Totals 24,976,493
302 General Debt FundTransfers from Other Funds 125,081,967Specific Fund Reserves 2,927,450
Fund 302 Revenue Totals 128,009,417
540 General Government Capital Projects FundTransfers from Other Funds 36,582,398
Fund 540 Revenue Totals 36,582,398
541 Water and Sewer Capital Projects FundTransfers from Other Funds 7,500,000
Fund 541 Revenue Totals 7,500,000
Fiscal Year 2009-10 3 - 12 Budget Ordinances

City of Virginia Beach, VirginiaFiscal Year 2009-10 Budget Ordinance
Attachment B - RevenuesFY 2009-10
Adopted
555 Storm Water Capital Projects FundTransfers from Other Funds 10,802,279
Fund 555 Revenue Totals 10,802,279
908 City Beautification FundRevenue from Local Sources
Miscellaneous Revenue 20,400Fund 908 Revenue Totals 20,400
909 Library Gift FundRevenue from Local Sources
Miscellaneous Revenue 5,712Fund 909 Revenue Totals 5,712
911 Parks and Recreation Gift FundRevenue from Local Sources
Miscellaneous Revenue 91,800Fund 911 Revenue Totals 91,800
Revenue Sources Totals 2,380,627,037Less Interfund Transfers 617,334,358
Net Revenue Totals 1,763,292,679
Fiscal Year 2009-10 3 - 13 Budget Ordinances
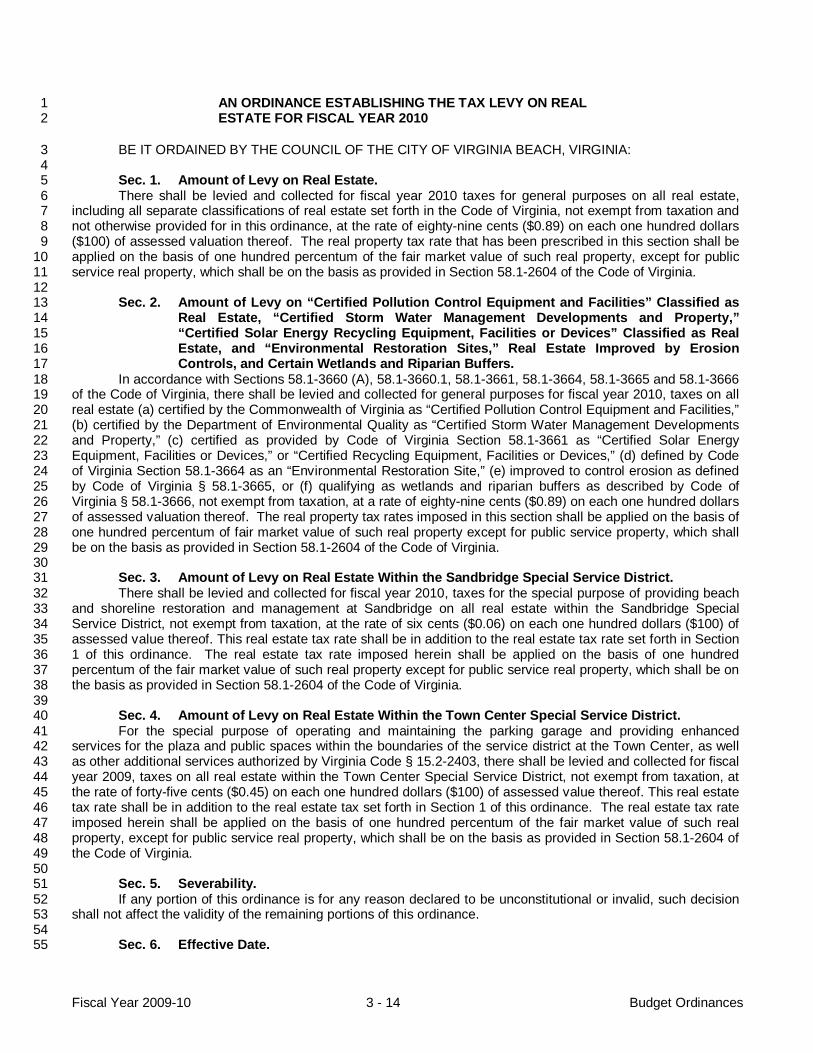
Fiscal Year 2009-10 3 - 14 Budget Ordinances
AN ORDINANCE ESTABLISHING THE TAX LEVY ON REAL 1 ESTATE FOR FISCAL YEAR 2010 2
BE IT ORDAINED BY THE COUNCIL OF THE CITY OF VIRGINIA BEACH, VIRGINIA: 3 4 Sec. 1. Amount of Levy on Real Estate. 5 There shall be levied and collected for fiscal year 2010 taxes for general purposes on all real estate, 6
including all separate classifications of real estate set forth in the Code of Virginia, not exempt from taxation and 7 not otherwise provided for in this ordinance, at the rate of eighty-nine cents ($0.89) on each one hundred dollars 8 ($100) of assessed valuation thereof. The real property tax rate that has been prescribed in this section shall be 9 applied on the basis of one hundred percentum of the fair market value of such real property, except for public 10 service real property, which shall be on the basis as provided in Section 58.1-2604 of the Code of Virginia. 11 12
Sec. 2. Amount of Levy on “Certified Pollution Control Equipment and Facilities” Classified as 13 Real Estate, “Certified Storm Water Management Developments and Property,” 14 “Certified Solar Energy Recycling Equipment, Facilities or Devices” Classified as Real 15 Estate, and “Environmental Restoration Sites,” Real Estate Improved by Erosion 16 Controls, and Certain Wetlands and Riparian Buffers. 17
In accordance with Sections 58.1-3660 (A), 58.1-3660.1, 58.1-3661, 58.1-3664, 58.1-3665 and 58.1-3666 18 of the Code of Virginia, there shall be levied and collected for general purposes for fiscal year 2010, taxes on all 19 real estate (a) certified by the Commonwealth of Virginia as “Certified Pollution Control Equipment and Facilities,” 20 (b) certified by the Department of Environmental Quality as “Certified Storm Water Management Developments 21 and Property,” (c) certified as provided by Code of Virginia Section 58.1-3661 as “Certified Solar Energy 22 Equipment, Facilities or Devices,” or “Certified Recycling Equipment, Facilities or Devices,” (d) defined by Code 23 of Virginia Section 58.1-3664 as an “Environmental Restoration Site,” (e) improved to control erosion as defined 24 by Code of Virginia § 58.1-3665, or (f) qualifying as wetlands and riparian buffers as described by Code of 25 Virginia § 58.1-3666, not exempt from taxation, at a rate of eighty-nine cents ($0.89) on each one hundred dollars 26 of assessed valuation thereof. The real property tax rates imposed in this section shall be applied on the basis of 27 one hundred percentum of fair market value of such real property except for public service property, which shall 28 be on the basis as provided in Section 58.1-2604 of the Code of Virginia. 29
30 Sec. 3. Amount of Levy on Real Estate Within the Sandbridge Special Service District. 31 There shall be levied and collected for fiscal year 2010, taxes for the special purpose of providing beach 32
and shoreline restoration and management at Sandbridge on all real estate within the Sandbridge Special 33 Service District, not exempt from taxation, at the rate of six cents ($0.06) on each one hundred dollars ($100) of 34 assessed value thereof. This real estate tax rate shall be in addition to the real estate tax rate set forth in Section 35 1 of this ordinance. The real estate tax rate imposed herein shall be applied on the basis of one hundred 36 percentum of the fair market value of such real property except for public service real property, which shall be on 37 the basis as provided in Section 58.1-2604 of the Code of Virginia. 38
39 Sec. 4. Amount of Levy on Real Estate Within the Town Center Special Service District. 40 For the special purpose of operating and maintaining the parking garage and providing enhanced 41
services for the plaza and public spaces within the boundaries of the service district at the Town Center, as well 42 as other additional services authorized by Virginia Code § 15.2-2403, there shall be levied and collected for fiscal 43 year 2009, taxes on all real estate within the Town Center Special Service District, not exempt from taxation, at 44 the rate of forty-five cents ($0.45) on each one hundred dollars ($100) of assessed value thereof. This real estate 45 tax rate shall be in addition to the real estate tax set forth in Section 1 of this ordinance. The real estate tax rate 46 imposed herein shall be applied on the basis of one hundred percentum of the fair market value of such real 47 property, except for public service real property, which shall be on the basis as provided in Section 58.1-2604 of 48 the Code of Virginia. 49
50 Sec. 5. Severability. 51 If any portion of this ordinance is for any reason declared to be unconstitutional or invalid, such decision 52
shall not affect the validity of the remaining portions of this ordinance. 53 54 Sec. 6. Effective Date. 55

Fiscal Year 2009-10 3 - 15 Budget Ordinances
The effective date of this ordinance shall be July 1, 2009. 56 57 Adopted by the City Council of the City of Virginia Beach, Virginia on this 12th day of May, 2009. 58 59 Requires an affirmative vote by a majority of all the members of City Council. 60
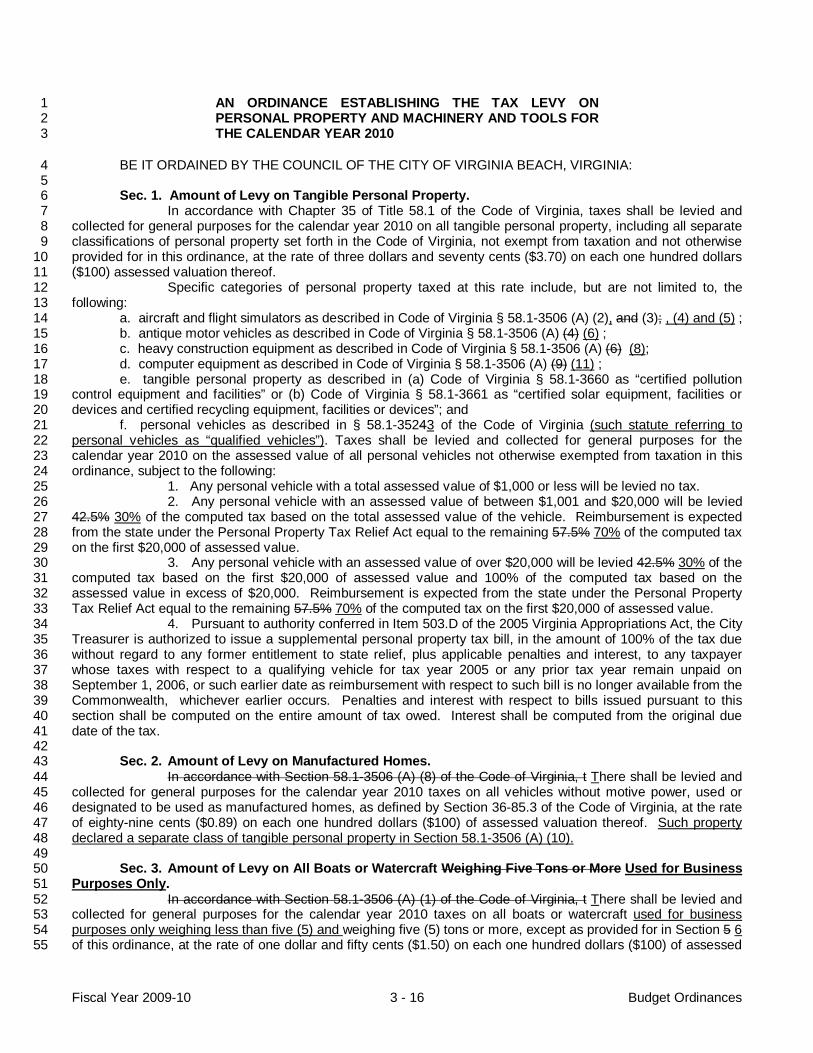
Fiscal Year 2009-10 3 - 16 Budget Ordinances
AN ORDINANCE ESTABLISHING THE TAX LEVY ON 1 PERSONAL PROPERTY AND MACHINERY AND TOOLS FOR 2 THE CALENDAR YEAR 2010 3
BE IT ORDAINED BY THE COUNCIL OF THE CITY OF VIRGINIA BEACH, VIRGINIA: 4 5 Sec. 1. Amount of Levy on Tangible Personal Property. 6 In accordance with Chapter 35 of Title 58.1 of the Code of Virginia, taxes shall be levied and 7 collected for general purposes for the calendar year 2010 on all tangible personal property, including all separate 8 classifications of personal property set forth in the Code of Virginia, not exempt from taxation and not otherwise 9 provided for in this ordinance, at the rate of three dollars and seventy cents ($3.70) on each one hundred dollars 10 ($100) assessed valuation thereof. 11 Specific categories of personal property taxed at this rate include, but are not limited to, the 12 following: 13
a. aircraft and flight simulators as described in Code of Virginia § 58.1-3506 (A) (2), and (3); , (4) and (5) ; 14 b. antique motor vehicles as described in Code of Virginia § 58.1-3506 (A) (4) (6) ; 15 c. heavy construction equipment as described in Code of Virginia § 58.1-3506 (A) (6) (8); 16 d. computer equipment as described in Code of Virginia § 58.1-3506 (A) (9) (11) ; 17
e. tangible personal property as described in (a) Code of Virginia § 58.1-3660 as “certified pollution 18 control equipment and facilities” or (b) Code of Virginia § 58.1-3661 as “certified solar equipment, facilities or 19 devices and certified recycling equipment, facilities or devices”; and 20 f. personal vehicles as described in § 58.1-35243 of the Code of Virginia (such statute referring to 21 personal vehicles as “qualified vehicles”). Taxes shall be levied and collected for general purposes for the 22 calendar year 2010 on the assessed value of all personal vehicles not otherwise exempted from taxation in this 23 ordinance, subject to the following: 24
1. Any personal vehicle with a total assessed value of $1,000 or less will be levied no tax. 25 2. Any personal vehicle with an assessed value of between $1,001 and $20,000 will be levied 26 42.5% 30% of the computed tax based on the total assessed value of the vehicle. Reimbursement is expected 27 from the state under the Personal Property Tax Relief Act equal to the remaining 57.5% 70% of the computed tax 28 on the first $20,000 of assessed value. 29 3. Any personal vehicle with an assessed value of over $20,000 will be levied 42.5% 30% of the 30 computed tax based on the first $20,000 of assessed value and 100% of the computed tax based on the 31 assessed value in excess of $20,000. Reimbursement is expected from the state under the Personal Property 32 Tax Relief Act equal to the remaining 57.5% 70% of the computed tax on the first $20,000 of assessed value. 33 4. Pursuant to authority conferred in Item 503.D of the 2005 Virginia Appropriations Act, the City 34 Treasurer is authorized to issue a supplemental personal property tax bill, in the amount of 100% of the tax due 35 without regard to any former entitlement to state relief, plus applicable penalties and interest, to any taxpayer 36 whose taxes with respect to a qualifying vehicle for tax year 2005 or any prior tax year remain unpaid on 37 September 1, 2006, or such earlier date as reimbursement with respect to such bill is no longer available from the 38 Commonwealth, whichever earlier occurs. Penalties and interest with respect to bills issued pursuant to this 39 section shall be computed on the entire amount of tax owed. Interest shall be computed from the original due 40 date of the tax. 41
42 Sec. 2. Amount of Levy on Manufactured Homes. 43 In accordance with Section 58.1-3506 (A) (8) of the Code of Virginia, t There shall be levied and 44 collected for general purposes for the calendar year 2010 taxes on all vehicles without motive power, used or 45 designated to be used as manufactured homes, as defined by Section 36-85.3 of the Code of Virginia, at the rate 46 of eighty-nine cents ($0.89) on each one hundred dollars ($100) of assessed valuation thereof. Such property 47 declared a separate class of tangible personal property in Section 58.1-3506 (A) (10). 48 49 Sec. 3. Amount of Levy on All Boats or Watercraft Weighing Five Tons or More Used for Business 50 Purposes Only. 51 In accordance with Section 58.1-3506 (A) (1) of the Code of Virginia, t There shall be levied and 52 collected for general purposes for the calendar year 2010 taxes on all boats or watercraft used for business 53 purposes only weighing less than five (5) and weighing five (5) tons or more, except as provided for in Section 5 6 54 of this ordinance, at the rate of one dollar and fifty cents ($1.50) on each one hundred dollars ($100) of assessed 55

Fiscal Year 2009-10 3 - 17 Budget Ordinances
valuation thereof. Such property declared a separate class of tangible personal property in Sections 58.1-3506 56 (A) (35) and (A) (36). 57 58 Sec. 4. Amount of Levy on All Boats or Watercraft Not Used Solely for Business Purposes. 59 There shall be levied and collected for general purposes for the calendar year 2010 taxes on all 60 boats or watercraft not used solely for business purposes weighing less than five (5) tons, and weighing five (5) 61 tons or more, except as provided for in Section 6 of this ordinance, at the rate of one dollar and fifty cents ($1.50) 62 on each one hundred dollars ($100) of assessed valuation thereof. Such property declared a separate class of 63 tangible personal property in Sections 58.1-3506 (A) (1) (a) and (A) (1) (b). 64 65 Sec. 4 5. Amount of Levy on Machinery and Tools. 66 In accordance with Section 58.1-3507 of the Code of Virginia, there shall be levied and collected 67 for general purposes for the calendar year 2010 taxes on machinery and tools, including machinery and tools 68 used directly in the harvesting of forest products or semiconductor manufacturing, not exempt from taxation, at 69 the rate of one dollar ($1.00) on each one hundred dollars ($100) of assessed valuation thereof. As provided by 70 Code of Virginia § 58.1-3506 (B) , the following personal property shall also be taxed at the rate of machinery and 71 tools: 72 a. all tangible personal property used in research and development businesses, as described in Code of 73 Virginia § 58.1-3506 (A) (5) (7); 74 b. generating or cogenerating equipment, as described in Code of Virginia § 58.1-3506 (A) (7) 75 (9); and 76 c. all motor vehicles, trailers and semitrailers with a gross vehicle weight of 10,000 pounds or more used 77
to transport property for hire by a motor carrier engaged in interstate commerce, as described in 78 Code of Virginia § 58.1-3506 (A) (23) (25). 79
80 Sec. 5 6. Amount of Levy on Privately Owned Pleasure Boats and Watercraft Used for Recreational 81
Purposes Only. 82 In accordance with Sections 58.1-3506 (A) (26), and (A) (27) of the Code of Virginia, t There shall 83 be levied and collected for general purposes for the calendar year 2010 taxes on all privately owned pleasure 84 boats and watercraft used for recreational purposes only, at the rate of one millionth of one cent ($.000001) on 85 each one hundred dollars ($100) of assessed valuation thereof. Such property declared a separate class of 86 tangible personal property in Sections 58.1-3506 (A) (12), (A) (28), and (A) (29). 87 88 Sec. 6 7. Amount of Levy on Privately Owned Camping Trailers, Privately Owned Travel Trailers, 89 and Motor Homes Used for Recreational Purposes Only, and Privately Owned Horse Trailers. 90
In accordance with Sections 58.1-3506 (A) (28) of the Code of Virginia, t There shall be levied 91 and collected for general purposes for the calendar year 2010 taxes at the rate of one dollar and fifty cents 92 ($1.50) on each one hundred dollars ($100) of assessed valuation thereof on the following property: (a) all 93 privately owned camping trailers and motor homes as defined in Section 46.2-100 of the Code of Virginia and 94 privately owned travel trailers as defined in Code of Virginia § 46.2-1900, that are used for recreational purposes 95 only; and (b) privately owned trailers as defined in § 46.2-100 of the Code of Virginia that are designed and used 96 for the transportation of horses, except those trailers described in subdivision (A) (11) of § 58.1-3505 of the Code 97 of Virginia. Such property declared a separate class of tangible personal property in Sections 58.1-3506 (A) (18) 98 and (A) (30). 99 100 Sec. 7 8. Amount of Levy on One Motor Vehicle Owned and Regularly Used by a Disabled Veteran. 101
In accordance with Section 58.1-3506 (A) (17) of the Code of Virginia, t There shall be a reduced 102 tax, levied and collected for general purposes for the calendar year 2010 at the rate of one dollar and fifty cents 103 ($1.50) on each one hundred dollars ($100) of assessed valuation, on one (1) motor vehicle owned and regularly 104 used by a veteran who has either lost, or lost the use of, one or both legs, or an arm or a hand, or who is blind, or 105 who is permanently and totally disabled as certified by the Department of Veterans’ Affairs. Any motor vehicles in 106 addition to the one (1) so taxed shall not qualify for the taxation at the rate established herein, and shall be taxed 107 at the rate or rates applicable to that class of property. To qualify, the veteran shall provide a written statement to 108 the Commissioner of the Revenue from the Department of Veterans’ Affairs that the veteran has been so 109 designated or classified by the Department of Veterans’ Affairs as to meet the requirements of Section 58.1-3506 110

Fiscal Year 2009-10 3 - 18 Budget Ordinances
(A) (17) (19), and that his or her disability is service connected. Such property declared a separate class of 111 tangible personal property in Section 58.1-3506 (A) (19). 112 113 Sec. 8 9. Amount of Levy on a Motor Vehicle Owned and Used Primarily by or for Someone at 114 Least Sixty-Five Years of Age or Anyone Found to be Permanently and Totally Disabled. 115 a. In accordance with Sections 58.1-3506.1 et seq. of the Code of Virginia, there shall be a reduced tax, 116 levied and collected for general purposes for calendar year 2010, at the rate of three dollars ($3.00) on each one 117 hundred dollars ($100.00) of assessed valuation, on one (1) automobile or pickup truck owned and used primarily 118 by or for anyone at least sixty-five years of age or anyone found to be permanently and totally disabled, as 119 defined in Section 58.1-3506.3 of the Code of Virginia, subject to the following conditions: 120 1. The total combined income received, excluding the first $7,500 of income, from all sources 121 during calendar year 2009 by the owner of the motor vehicle shall not exceed twenty-two thousand dollars 122 ($22,000). 123 2. The owner’s net financial worth, including the present value of all equitable interests, as of 124 December 31 of calendar year 2009, excluding the value of the principal residence and the land, not exceeding 125 one (1) acre, upon which it is situated, shall not exceed seventy thousand dollars ($70,000). 126 3. All income and net worth limitations shall be computed by aggregating the income and assets, 127 as the case may be, of a husband and wife who reside in the same dwelling and shall be applied to any owner of 128 the motor vehicle who seeks the benefit of the preferential tax rate permitted under this ordinance, irrespective of 129 how such motor vehicle may be titled. 130 b. Any such motor vehicle owned by a husband and wife may qualify if either spouse is sixty-five or over 131 or if either spouse is permanently and totally disabled, and the conditions set forth in subsection (a) have been 132 satisfied. 133
134 Sec. 9 10. Assessed Value Determination. 135 In accordance with Section 58.1-3103 of the Code of Virginia, personal property mentioned in the 136 above sections shall be assessed at actual fair market value, to be determined by the Commissioner of the 137 Revenue for the City of Virginia Beach. 138 139
Sec. 10 11. Severability. 140 If any portion of this ordinance is for any reason declared to be unconstitutional or invalid, such 141 decision shall not affect the validity of the remaining portions of this ordinance. 142 143
Sec. 11 12. Effective Date. 144 This ordinance shall be effective January 1, 2010. 145 146 Adopted by the Council of the City of Virginia Beach, Virginia, on this 12th day of May, 2009. 147 148 Requires an affirmative vote by a majority of all of the members of City Council. 149

Fiscal Year 2009-10 3 - 19 Budget Ordinances
AN ORDINANCE TO AUTHORIZE THE CITY MANAGER TO 1 SUBMIT AN ANNUAL FUNDING PLAN TO THE U.S. 2 DEPARTMENT OF HOUSING AND URBAN DEVELOPMENT 3
WHEREAS, the United States Congress has established legislation designated as the Housing and 4 Community Development Act of 1974 that sets forth the development of viable urban communities as a national 5 goal; 6
7 WHEREAS, there is federal assistance available for the support of Community Development and Housing 8 activities directed toward specific objectives, such as eliminating deteriorated conditions in low and moderate 9 income neighborhoods that are detrimental to the public health, safety, and welfare, as well as improving the 10 City’s housing stock and community services, along with other related activities; and 11 12 WHEREAS, as a prerequisite to receiving the above-referenced federal assistance, the City of Virginia 13 Beach has developed an Annual Funding Plan for submission to the Department of Housing and Urban 14 Development and has created the necessary mechanisms for its implementation in compliance with federal and 15 local directives; 16 17 NOW, THEREFORE, BE IT ORDAINED BY THE COUNCIL OF THE CITY OF VIRGINIA BEACH, 18 VIRGINIA: 19 That the City Manager is hereby authorized and directed, as the executive and administrative head of the 20 City, to submit the City’s FY 2010 Annual Funding Plan (the “Plan”) and amendments thereto, along with 21 understandings and assurances contained therein and such additional information as may be required, to the 22 Department of Housing and Urban Development to permit the review, approval, and funding of the Plan. 23 24 Adopted by the Council of the City of Virginia Beach, Virginia, on this 12th day of May, 2009.25

Fiscal Year 2009-10 3 - 20 Budget Ordinances
AN ORDINANCE TO TRANSFER $8,800,000 FROM THE 1 SCHOOL RESERVE SPECIAL REVENUE FUND TO THE 2 CITY’S FY 2008-09 GENERAL FUND OPERATING BUDGET 3
WHEREAS, on May 6, 2003, the City Council established the Special Revenue Fund – School Reserve; 4 5 WHEREAS, due to unprecedented poor economic conditions, various sources of fund balance are 6
available for short-term use to mitigate structural budget changes until economic conditions return to normalcy; 7 and 8
9 WHEREAS, the School Reserve Special Revenue Fund has sufficient funds and $8,800,000 is available 10 to address community needs. 11 12 NOW, THEREFORE, BE IT ORDAINED BY THE CITY COUNCIL OF THE CITY OF VIRGINIA BEACH, 13 VIRGINIA: 14
15 That $ 8,800,000 from the School Reserve Special Revenue Fund is hereby transferred to the City’s FY 16 2008-09 General Fund Operating Budget. 17 18 BE IT FURTHER ORDAINED: That this ordinance shall be effective on June 30, 2009. 19 20 Adopted by the City Council of the City of Virginia Beach, Virginia, on this 12th day of May, 2009. 21

Fiscal Year 2009-10 3 - 21 Budget Ordinances
AN ORDINANCE TO DECLARE $ 9,000,000 OF FUNDING 1 WITHIN THE SANDBRIDGE TAX INCREMENT FINANCING 2 DISTRICT AS SURPLUS FUNDS IN THE FY 2008-09 3 OPERATING BUDGET 4
WHEREAS, the Sandbridge Tax Increment Financing District (Sandbridge TIF) and the Sandbridge 5 Special Service District (Sandbridge SSD), were established to provide a funding source for beach and shoreline 6 restoration and management at Sandbridge; 7
8 WHEREAS, an analysis of the Sandbridge TIF and the Sandbridge SSD occurs annually to ensure that 9 funding is adequate for long-term beach and shoreline restoration and management along Sandbridge; 10 11 WHEREAS, current projections indicate that the Sandbridge TIF and Sandbridge SSD have sufficient 12 funding to meet long-term obligations for beach and shoreline restoration and management; 13 14 WHEREAS, projections also indicate that the funding available exceeds the long-term obligations of the 15 project; and 16 17 WHEREAS, $ 9,000,000 is available as an unencumbered appropriation in the FY 2008-09 Sandbridge 18 TIF Reserve for Future Commitments. 19 20 NOW, THEREFORE, BE IT ORDAINED BY THE CITY COUNCIL OF THE CITY OF VIRGINIA BEACH, 21 VIRGINIA: 22
(1) That $ 9,000,000 of funding within the Sandbridge TIF is hereby declared to be in excess of the 23 long-term obligations for beach and shoreline restoration and management and is hereby declared 24 surplus. 25
(2) That $ 9,000,000 is hereby transferred within the FY 2008-09 Operating Budget from the 26 Sandbridge TIF to the General Fund – Unappropriated Real Estate Tax Revenues. 27
28 BE IT FURTHER ORDAINED: That this ordinance shall be effective on June 30, 2009. 29 30 Adopted by the City Council of the City of Virginia Beach, Virginia, on this 12th day of May, 2009. 31
1

Fiscal Year 2009-10 3 - 22 Budget Ordinances
AN ORDINANCE TO TEMPORARILY SUSPEND THE TRANSITION 1 AREA SPECIAL REVENUE FUND2
WHEREAS, as a result of City Council accepting and approving the report of the Virginia Beach 3 Transition Area Technical Advisory Committee, staff subsequently established a Transition Area Special Revenue 4 Fund to earmark revenues generated within the Transition Area for future roadway projects; 5
6 WHEREAS, due to the lack of construction activity in the transition area, a minimal amount of revenue 7
has been generated; 8 9 WHEREAS, due to poor economic conditions the State has significantly reduced Virginia Department of 10
Transportation funding to our City; and 11 12 WHEREAS, the Capital Budget for FY 2009-10 appropriates $296,121 of the FY 2007-08 Fund Balance 13
of the Transition Area Special Revenue Fund to Capital Project #2-021 Rural Road Improvements; and 14 15 WHEREAS, staff recommends prioritizing and funding roadway needs overall rather than separately 16
within the Transition Area. 17 18 NOW THEREFORE, BE IT ORDAINED BY THE COUNCIL OF THE CITY OF VIRGINIA BEACH, 19
VIRGINIA THAT: 20 21 (1) The Transition Area Special Revenue Fund is suspended; and 22 (2) Staff will provide City Council with alternatives to address infrastructure needs associated with further 23
development in the Transition Area. 24 25
BE IT FURTHER ORDAINED: That the effective date of this ordinance shall be May 12, 2009. 26 27 Adopted by the Council of the City of Virginia Beach, Virginia, on this 12th day of May, 2009.28

Fiscal Year 2009-10 3 - 23 CIP Ordinances
AN ORDINANCE TO REVISE THE FY 2010/FY 2014 CAPITAL 1 IMPROVEMENT PROGRAM AND TO APPROPRIATE 2 $236,429,109 FOR THE FY 2010 CAPITAL BUDGET SUBJECT 3 TO FUNDS BEING PROVIDED FROM VARIOUS SOURCES 4 SET FORTH HEREIN 5
WHEREAS, the City Manager, on March 24, 2009, presented to City Council the Capital Improvement 6 Program for fiscal years 2010 through 2014; 7
8 WHEREAS, City Council held public hearings on the program to provide for public comment; 9 10 WHEREAS, based on public comment, City Council has determined the need for certain projects in the 11
Capital Improvement Program; and 12 13 WHEREAS, it is necessary to appropriate funds for both existing projects and projects beginning in the 14
2010 fiscal year, as set forth in said Capital Improvement Program. 15 16 NOW, THEREFORE, BE IT ORDAINED BY THE COUNCIL OF THE CITY OF VIRGINIA BEACH, 17
VIRGINIA: 18 19 Section 1. That the Capital Improvement Program, as modified, for the construction of, or addition to, 20
capital facilities identified for fiscal years 2010 through 2014 is hereby adopted, and the projects listed therein 21 are hereby approved as capital projects. 22
23 Section 2. That the projects shall be financed from funds to be appropriated periodically by City Council, 24
and until funds are so provided, the projects are for planning purposes only and may be deleted, altered, or 25 rescheduled in any manner at any time by City Council. 26
27 Section 3. That funds in the amounts aggregating $236,429,109 for capital projects in the Capital 28
Budget for the 2010 fiscal year, as set forth in said Capital Improvement Program, are hereby appropriated, by 29 project and subject to the conditions set forth herein. The amount of funding for individual projects is set forth 30 in “Attachment A – Capital Budget Appropriations,” a copy of which is attached hereto. 31
32 Section 4. That in accordance with Section 2-196 of the City Code, financing sources in support of the 33
Capital Budget for the 2010 fiscal year as set forth in said Capital Improvement Program are attached to this 34 ordinance as “Attachment B – Financing Sources.” 35
36 Section 5. That capital project funds appropriated in prior fiscal years are to be adjusted in accordance 37
with said Capital Improvement Program and reallocated as identified in “Attachment C – Transfers,” a copy of 38 which is attached hereto. 39
40 Section 6. That additional appropriations, the addition of capital projects, and changes in project scope 41
shall not be initiated except with the consent and approval of the City Council first being obtained, and an 42 appropriation for a project in the Capital Improvement Program shall continue in force until the purpose for 43 which it was made has been accomplished or abandoned. 44
45 Section 7. That all contracts awarded for approved and appropriated capital projects, exclusive of 46
school projects, must be certified as to the availability of funds by the Director of Finance prior to the initiation 47 of work on the contract. 48
49 Section 8. That subject to any applicable restriction of law or of any bonds or bond issue, the City 50
Manager or the Director of Management Services is authorized to approve transfers of appropriations in an 51 amount up to $100,000 between capital projects as may best meet the needs of the City. The City Manager 52 shall make a monthly report to the City Council of all transfers between $25,000 and $100,000. The City 53 Manager or the Director of Management Services is hereby authorized to establish and administer the 54
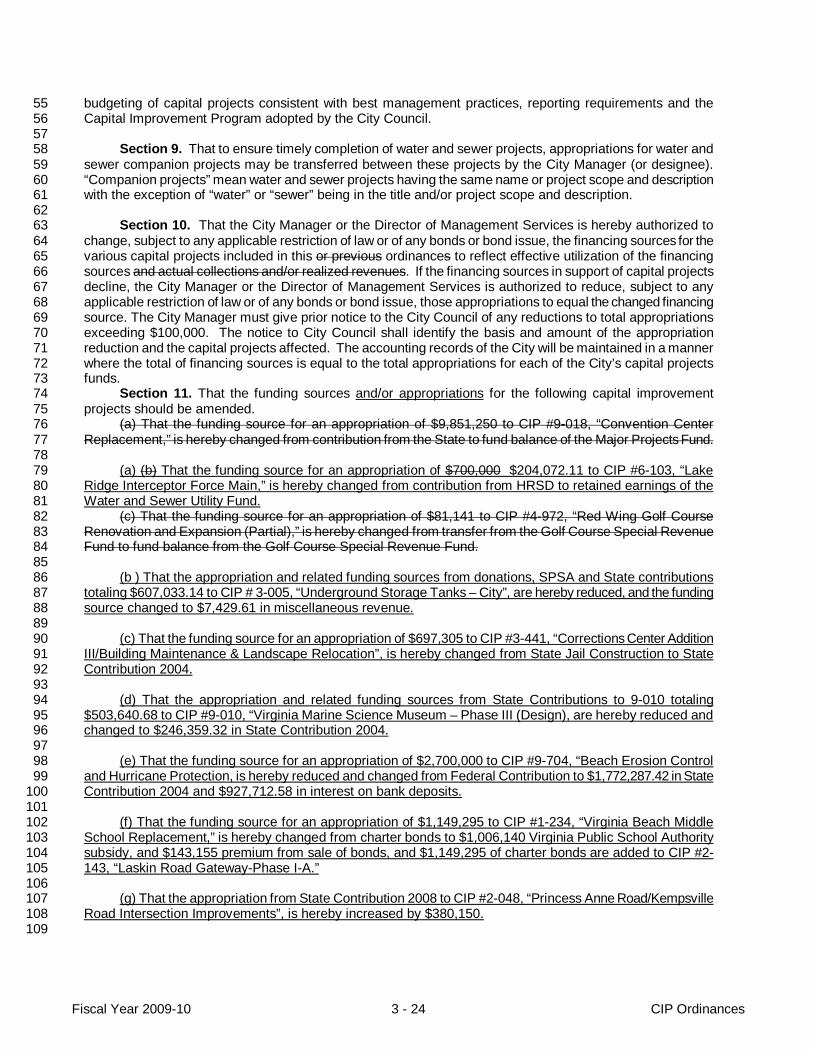
Fiscal Year 2009-10 3 - 24 CIP Ordinances
budgeting of capital projects consistent with best management practices, reporting requirements and the 55 Capital Improvement Program adopted by the City Council. 56
57 Section 9. That to ensure timely completion of water and sewer projects, appropriations for water and 58
sewer companion projects may be transferred between these projects by the City Manager (or designee). 59 “Companion projects” mean water and sewer projects having the same name or project scope and description 60 with the exception of “water” or “sewer” being in the title and/or project scope and description. 61
62 Section 10. That the City Manager or the Director of Management Services is hereby authorized to 63
change, subject to any applicable restriction of law or of any bonds or bond issue, the financing sources for the 64 various capital projects included in this or previous ordinances to reflect effective utilization of the financing 65 sources and actual collections and/or realized revenues. If the financing sources in support of capital projects 66 decline, the City Manager or the Director of Management Services is authorized to reduce, subject to any 67 applicable restriction of law or of any bonds or bond issue, those appropriations to equal the changed financing 68 source. The City Manager must give prior notice to the City Council of any reductions to total appropriations 69 exceeding $100,000. The notice to City Council shall identify the basis and amount of the appropriation 70 reduction and the capital projects affected. The accounting records of the City will be maintained in a manner 71 where the total of financing sources is equal to the total appropriations for each of the City’s capital projects 72 funds. 73
Section 11. That the funding sources and/or appropriations for the following capital improvement 74 projects should be amended. 75
(a) That the funding source for an appropriation of $9,851,250 to CIP #9-018, “Convention Center 76 Replacement,” is hereby changed from contribution from the State to fund balance of the Major Projects Fund. 77
78 (a) (b) That the funding source for an appropriation of $700,000 $204,072.11 to CIP #6-103, “Lake 79
Ridge Interceptor Force Main,” is hereby changed from contribution from HRSD to retained earnings of the 80 Water and Sewer Utility Fund. 81
(c) That the funding source for an appropriation of $81,141 to CIP #4-972, “Red Wing Golf Course 82 Renovation and Expansion (Partial),” is hereby changed from transfer from the Golf Course Special Revenue 83 Fund to fund balance from the Golf Course Special Revenue Fund. 84
85 (b ) That the appropriation and related funding sources from donations, SPSA and State contributions 86
totaling $607,033.14 to CIP # 3-005, “Underground Storage Tanks – City”, are hereby reduced, and the funding 87 source changed to $7,429.61 in miscellaneous revenue. 88
89 (c) That the funding source for an appropriation of $697,305 to CIP #3-441, “Corrections Center Addition 90
III/Building Maintenance & Landscape Relocation”, is hereby changed from State Jail Construction to State 91 Contribution 2004. 92
93 (d) That the appropriation and related funding sources from State Contributions to 9-010 totaling 94
$503,640.68 to CIP #9-010, “Virginia Marine Science Museum – Phase III (Design), are hereby reduced and 95 changed to $246,359.32 in State Contribution 2004. 96
97 (e) That the funding source for an appropriation of $2,700,000 to CIP #9-704, “Beach Erosion Control 98
and Hurricane Protection, is hereby reduced and changed from Federal Contribution to $1,772,287.42 in State 99 Contribution 2004 and $927,712.58 in interest on bank deposits. 100
101 (f) That the funding source for an appropriation of $1,149,295 to CIP #1-234, “Virginia Beach Middle 102
School Replacement,” is hereby changed from charter bonds to $1,006,140 Virginia Public School Authority 103 subsidy, and $143,155 premium from sale of bonds, and $1,149,295 of charter bonds are added to CIP #2-104 143, “Laskin Road Gateway-Phase I-A.” 105
106 (g) That the appropriation from State Contribution 2008 to CIP #2-048, “Princess Anne Road/Kempsville 107
Road Intersection Improvements”, is hereby increased by $380,150. 108 109

Fiscal Year 2009-10 3 - 25 CIP Ordinances
(h) That the appropriation from State Contribution 2009 to CIP #2-048, “Princess Anne Road/Kempsville 110 Road Intersection Improvements”, is hereby increased by $2,331,557. 111
112 Section 12. That the Capital Improvement Program debt management policies contained and included 113
in the Resource Management Plan document shall be the policy guidelines of the City, and the City Manager 114 shall annually report on the status of those guidelines and the projected impact of the proposed Capital 115 Improvement Program on those guidelines, such information to be included in the Resource Management Plan 116 submittal. The City Manager may propose modifications to those policies and guidelines through the Resource 117 Management Plan. 118
119 Section 13. That subject to the appropriation of sufficient funds within a capital project, the acquisition of 120
real property necessary for the project is authorized by means of voluntary negotiation with willing sellers. 121 122 Section 14. That violation of this ordinance shall result in the City Manager taking disciplinary action 123
against the person or persons responsible for the capital project in which the violation occurred. 124 125 Section 15. That if any portion of this ordinance is for any reason declared to be unconstitutional or 126
invalid, such decision shall not affect the validity of the remaining portions of this ordinance. 127 128 Section 16. That this ordinance shall be in effect from the date of its adoption; however, appropriations 129
for the FY 2010 Capital Budget shall be effective on July 1, 2009. 130 131 Adopted by the City Council of the City of Virginia Beach, Virginia on this 12th day of May, 2009.132

Attachment A - Capital Budget Appropriations
Project AppropriationsNumber Projects FY 2009-10
Economic Vitality
Economic and Tourism Development9.058 Rudee Inlet Connector Walk 260,000$ 9.060 Oceana & Interfacility Traffic Area Conformity & Acquisition 15,000,0009.081 Strategic Growth Area Program 3,500,0009.141 Economic Development Investment Program (On-Going) 2,120,578
Total Economic and Tourism Development Projects 20,880,578$
Total Economic Vitality Projects 20,880,578$
Safe Community
Buildings3.054 Animal Control & K-9 Unit Replacements 2,616,600$ 3.133 Fire Training Center Improvements - Phase III 2,428,5993.365 Fire Facility Rehabilitation and Renewal - Phase II 731,7473.371 Fire Apparatus - Phase II 1,326,278
Total Building Projects 7,103,224$
Communications and Information Technology3.086 CIT - EMS - Handheld Field Reporting (Partial) 450,000$ 3.094 CIT - Police - Telestaff T&M Module 539,7603.142 CIT - Communications Infrastructure Replacement - Phase II 2,716,000
Total Communications and Information Technology Projects 3,705,760$
Total Safe Community Projects 10,808,984$
Quality Physical Environment
Roadways2.021 Rural Road Improvements 396,121$ 2.031 Street Reconstruction 2,150,0002.048 Princess Anne Road/Kempsville Road Intersection Improvement (First Cities) 4,137,7082.052 Traffic Signal Rehabilitation 100,0002.072 First Colonial Road/Virginia Beach Boulevard Intersection Improvement 1,133,0002.089 Southeastern Parkway & Greenbelt (Partial) 98,3842.118 Shore Drive Corridor Improvements - Phase IV 1,200,0002.129 Pavement Maintenance Program Phase II 10,028,3052.143 Laskin Road Gateway - Phase I-A 8,854,9002.157 Lynnhaven Parkway - Phase IX (VDOT) 3,000,0002.160 City Wide Street Lighting Improvements - Phase II 60,0002.173 Norfolk Southern Right-of-Way Acquisition 10,000,0002.263 Major Bridge Rehabilitation 660,0002.268 Wetlands Mitigation Banking 50,0002.300 Traffic Safety Improvements - Phase III 1,158,3802.305 Princess Anne Road- Phase IV (VDOT) 11,129,8362.931 Witchduck Road - Phase I ( First Cities Project) 12,147,113
Total Roadways Projects 66,303,747$
Fiscal Year 2009-10 3 - 26 CIP Ordinances

Attachment A - Capital Budget Appropriations
Project AppropriationsNumber Projects FY 2009-10
Quality Physical Environment
Buildings3.359 Building Modernizations, Renewals and Replacements (Partial) 100,000$ 3.366 Various Buildings HVAC Rehabilitation and Renewal - Phase II 1,345,3343.367 Various Buildings Rehabilitation and Renewal - Phase II 3,830,3903.368 Various Site Acquisitions 2,000,000
Total Buildings Projects 7,275,724$
Water Utility5.084 System Expansion Cost Participation Agreements - Phase II 50,000$ 5.086 Comprehensive Water Master Planning - Phase V 200,0005.167 Water Tank Upgrade Program - Phase III 100,0005.302 Potable Wells Evaluation Program - Phase II 275,0005.303 Water Quality Program - Phase III 100,0005.404 Computerized Mapping & Infrastructure Management - Phase II 50,0005.405 Customer Information System Version Migration 600,0005.501 Water Pumping Station and Tank Upgrade Program-Phase I 203,0005.602 Princess Anne Road/Kempsville Road Intersection Improvements 740,0005.708 Resort Area Neighborhood Revitalization 100,0005.801 Various Water Infrastructure Maintenance Program- Phase II 50,0005.802 Utility Crossings Condition Assessment 50,0005.804 Water Line Extension, Replacement and Rehabilitation Program 50,0005.805 Water System Aging Infrastructure Program - Phase I 200,0005.806 Backflow Prevention & Cross-Connection Control Pgm -Phase II 100,0005.944 Princess Anne Road Water Improvements Phase IV (VDOT) 2,700,0005.951 Water Tap Installation Program 185,0005.952 Water Pump Station Flow Monitoring and Data Storage 210,0005.967 Water Resources Investigation & Planning - Phase I 100,000
Total Water Utility Projects 6,063,000$
Sewer Utility6.019 Resort Area Neighborhood Revitalization 800,000$ 6.031 Sewer Appurtenances Evaluation & Improvements 50,0006.041 Pump Station Modifications - Phase V 6,000,0006.061 Comprehensive Emergency Response & Planning - Phase II 50,0006.070 Infiltration, Inflow, & Rehabilitation - Phase V 6,500,0006.085 Sanitary Sewer Aging Infrastructrue Program - Phase II 400,0006.089 Comprehensive Sewer Master Planning - Phase IV 500,0006.106 Various Roadway/Storm Water Coordination - Phase V 100,0006.148 System Expansion Cost Participation Agreements - Phase II 100,0006.149 Princess Anne Sewer Force Main Phase IV (VDOT) 210,0006.203 Lotus Gardens Sewer Improvements - 51% Program 25,0006.404 Computerized Mapping & Infrastructure Management - Phase II 50,0006.405 Customer Information System Version Migration 600,0006.411 CIT - Service Area Master Planning & Info. System (SAMPIS) 50,0006.451 Engineering Services - Various Projects 50,0006.502 Private Sanitary Sewer Pump Station Abandonment Program 300,0006.505 Princess Anne Plaza Rehabilitation - Phase II 1,300,0006.506 Sanitary Sewer System Revitalization Program - Phase I 3,000,0006.602 Princess Anne Road/Kempsville Road Intersection Improvements 550,0006.603 Witchduck Road - Phase I Sewer Improvements 350,0006.612 Pump Station Wet Well Revitalization 700,000
Fiscal Year 2009-10 3 - 27 CIP Ordinances

Attachment A - Capital Budget Appropriations
Project AppropriationsNumber Projects FY 2009-10
Quality Physical Environment
Sewer Utility (Continued)6.613 Auxiliary Power Program - Sewer Pump Stations - Phase II 680,0006.801 Various Sewer Infrastructure Maintenance Support - Phase II 50,000$ 6.802 Utility Crossings Condition Assessment Program 50,0006.804 Sanitary Sewer Regulatory Compliance Program - Phase I 4,522,0006.951 Sewer Tap Installation Program 435,0006.952 Sewer Pump Station Flow Monitoring and Data Storage 1,015,0006.973 Sanitary Sewer Capacity Program - Phase I 500,000
Total Sewer Utility Projects 28,937,000$
Storm Water Utility7.004 Storm Water Infrastructure Rehabilitation 2,789,700$ 7.005 North Lake Holly Watershed 1,837,5007.016 South Lake Holly Watershed 1,000,0007.049 Beach Garden Park - Kilborne Court & Holly Road Improvements 900,0007.063 Neighborhood Storm Water Infrastructure Improvements 400,0007.067 Primary System Infrastructure Improvements 810,0007.091 Residential Drainage Cost Participation Program 50,0007.152 Lake Management 536,2807.153 Lynnhaven Watershed Restoration 522,6357.183 Storm Water Quality Enhancements 2,680,044
Total Storm Water Utility Projects 11,526,159$
Coastal8.002 Beach Profile Monitoring Program 25,000$ 8.003 Landfill #2 Phase I Closure 687,5368.004 Various Minor Dredging Projects 50,0008.007 Rudee Inlet Outer Channel Maintenance Dredging 270,0008.008 Beach Replenishment 1,476,1208.023 Sandbridge Beach Access Improvements & Sand Management 225,0008.110 Eastern Branch Lynnhaven River Dredging 517,2828.282 Sandbridge Beach Restoration 3,980,0008.830 Rudee Inlet Federal Dredging 460,000
Total Coastal Projects 7,690,938$
Total Quality Physical Environment Projects 127,796,568$
Cultural and Recreational Opportunities
Buildings3.103 Heritage Building - Maintenance Program 150,000$ 3.147 Historic Property Acquisition Revolving Fund 200,0003.148 Aquarium/Owl Creek Master Plan 100,0003.278 Virginia Aquarium Renewal and Replacement - Phase II 325,0003.292 Virginia Aquarium Animal Care Annex (Partial) 124,658
899,658$
Parks and Recreation4.013 Community Rec Centers Repairs and Renovations - Phase II 4,363,207$ 4.016 Parks & Special Use Facilities Development & Renovation - Phase II 889,3954.017 Golf Courses Equipment & Infrastructure - Phase II 200,000
Fiscal Year 2009-10 3 - 28 CIP Ordinances
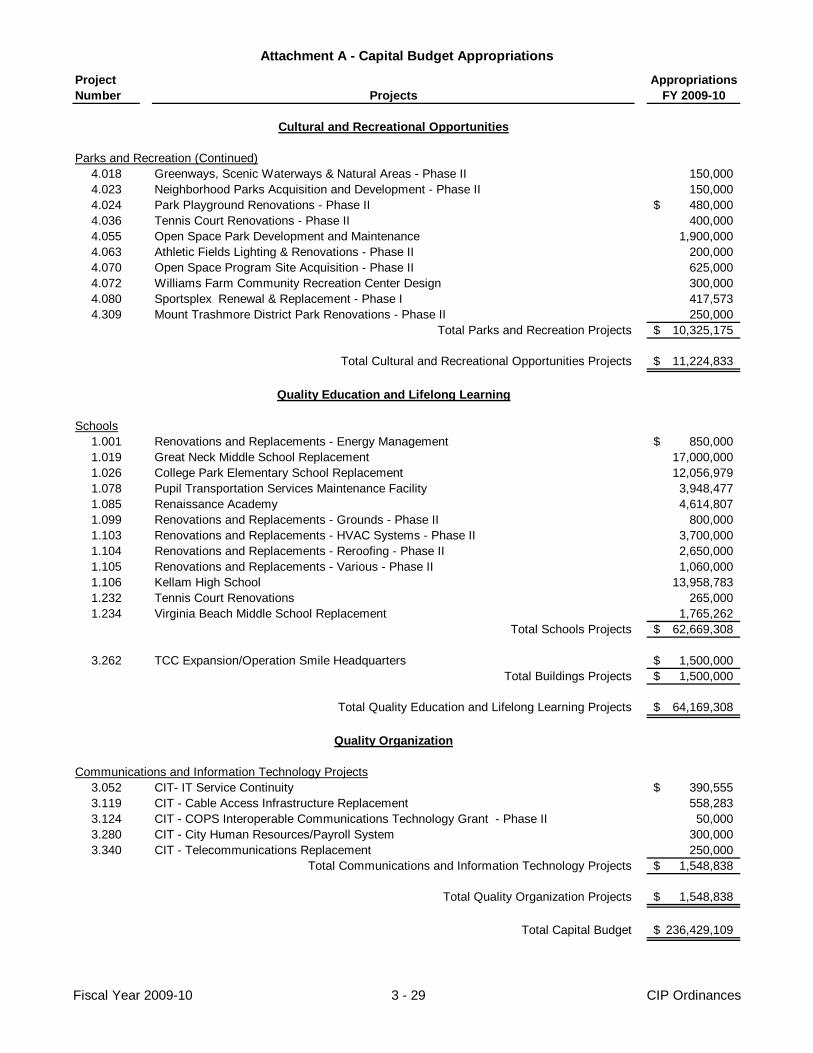
Attachment A - Capital Budget Appropriations
Project AppropriationsNumber Projects FY 2009-10
Cultural and Recreational Opportunities
Parks and Recreation (Continued)4.018 Greenways, Scenic Waterways & Natural Areas - Phase II 150,0004.023 Neighborhood Parks Acquisition and Development - Phase II 150,0004.024 Park Playground Renovations - Phase II 480,000$ 4.036 Tennis Court Renovations - Phase II 400,0004.055 Open Space Park Development and Maintenance 1,900,0004.063 Athletic Fields Lighting & Renovations - Phase II 200,0004.070 Open Space Program Site Acquisition - Phase II 625,0004.072 Williams Farm Community Recreation Center Design 300,0004.080 Sportsplex Renewal & Replacement - Phase I 417,5734.309 Mount Trashmore District Park Renovations - Phase II 250,000
Total Parks and Recreation Projects 10,325,175$
Total Cultural and Recreational Opportunities Projects 11,224,833$
Quality Education and Lifelong Learning
Schools1.001 Renovations and Replacements - Energy Management 850,000$ 1.019 Great Neck Middle School Replacement 17,000,0001.026 College Park Elementary School Replacement 12,056,9791.078 Pupil Transportation Services Maintenance Facility 3,948,4771.085 Renaissance Academy 4,614,8071.099 Renovations and Replacements - Grounds - Phase II 800,0001.103 Renovations and Replacements - HVAC Systems - Phase II 3,700,0001.104 Renovations and Replacements - Reroofing - Phase II 2,650,0001.105 Renovations and Replacements - Various - Phase II 1,060,0001.106 Kellam High School 13,958,7831.232 Tennis Court Renovations 265,0001.234 Virginia Beach Middle School Replacement 1,765,262
Total Schools Projects 62,669,308$
3.262 TCC Expansion/Operation Smile Headquarters 1,500,000$ Total Buildings Projects 1,500,000$
Total Quality Education and Lifelong Learning Projects 64,169,308$
Quality Organization
Communications and Information Technology Projects3.052 CIT- IT Service Continuity 390,555$ 3.119 CIT - Cable Access Infrastructure Replacement 558,2833.124 CIT - COPS Interoperable Communications Technology Grant - Phase II 50,0003.280 CIT - City Human Resources/Payroll System 300,0003.340 CIT - Telecommunications Replacement 250,000
Total Communications and Information Technology Projects 1,548,838$
Total Quality Organization Projects 1,548,838$
Total Capital Budget 236,429,109$
Fiscal Year 2009-10 3 - 29 CIP Ordinances

Attachment B - Financing SourcesCapital Budget
Financing Sources FY 2009-10
Federal Contribution 26,576,308$
Franchise Fees 313,000
Fund Balance - General Fund 33,912,998
Fund Balance - Other 3,459,421
Fund Balance - School Reserve Fund 4,400,000
General Appropriations 37,008,518
General Obligation Bonds 66,902,805
Interest Income - Schools Capital Projects 2,500,000
Other Localities 50,000
Private Contribution 100,000
Retained Earnings - Water and Sewer 14,554,900
State Contribution 11,525,000
Storm Water Utility Fund 10,626,159
Water and Sewer Bonds 17,000,000
Water and Sewer Fund 7,500,000Total Financing Sources 236,429,109$
Fiscal Year 2009-10 3 - 30 CIP Ordinances
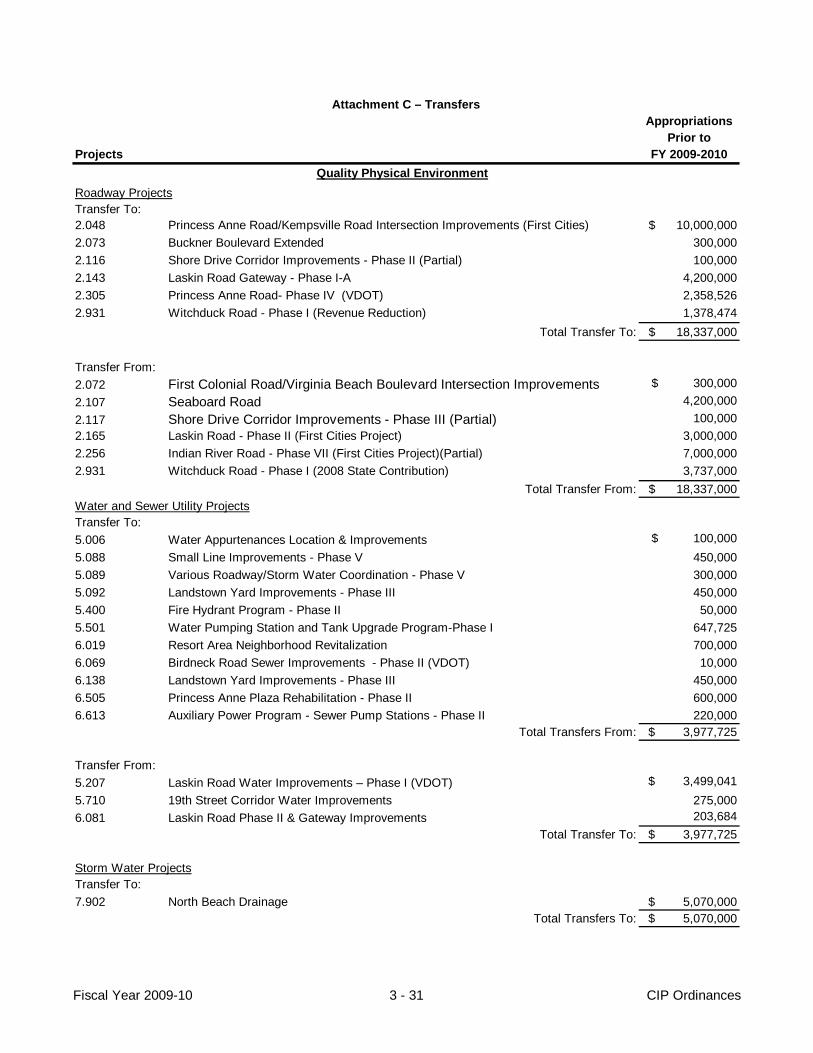
AppropriationsPrior to
FY 2009-2010
Attachment C – Transfers
ProjectsQuality Physical Environment
Transfer To:2.048 Princess Anne Road/Kempsville Road Intersection Improvements (First Cities) $ 10,000,000 2.073 Buckner Boulevard Extended 300,0002.116 Shore Drive Corridor Improvements - Phase II (Partial) 100,0002.143 Laskin Road Gateway - Phase I-A 4,200,0002.305 Princess Anne Road- Phase IV (VDOT) 2,358,5262.931 Witchduck Road - Phase I (Revenue Reduction) 1,378,474
Total Transfer To: $ 18,337,000
Transfer From:2.072 First Colonial Road/Virginia Beach Boulevard Intersection Improvements $ 300,000 2.107 Seaboard Road 4,200,0002.117 Shore Drive Corridor Improvements - Phase III (Partial) 100,0002.165 Laskin Road - Phase II (First Cities Project) 3,000,0002.256 Indian River Road - Phase VII (First Cities Project)(Partial) 7,000,0002.931 Witchduck Road - Phase I (2008 State Contribution) 3,737,000
Total Transfer From: $ 18,337,000
Transfer To:5.006 Water Appurtenances Location & Improvements $ 100,000 5.088 Small Line Improvements - Phase V 450,0005.089 Various Roadway/Storm Water Coordination - Phase V 300,0005.092 Landstown Yard Improvements - Phase III 450,0005.400 Fire Hydrant Program - Phase II 50,0005.501 Water Pumping Station and Tank Upgrade Program-Phase I 647,7256.019 Resort Area Neighborhood Revitalization 700,0006.069 Birdneck Road Sewer Improvements - Phase II (VDOT) 10,0006.138 Landstown Yard Improvements - Phase III 450,0006.505 Princess Anne Plaza Rehabilitation - Phase II 600,0006.613 Auxiliary Power Program - Sewer Pump Stations - Phase II 220,000
Total Transfers From: $ 3,977,725
Transfer From:5.207 Laskin Road Water Improvements – Phase I (VDOT) $ 3,499,041 5.710 19th Street Corridor Water Improvements 275,0006.081 Laskin Road Phase II & Gateway Improvements 203,684
Total Transfer To: $ 3,977,725
Transfer To:7.902 North Beach Drainage $ 5,070,000
Total Transfers To: $ 5,070,000
Roadway Projects
Water and Sewer Utility Projects
Storm Water Projects
Fiscal Year 2009-10 3 - 31 CIP Ordinances
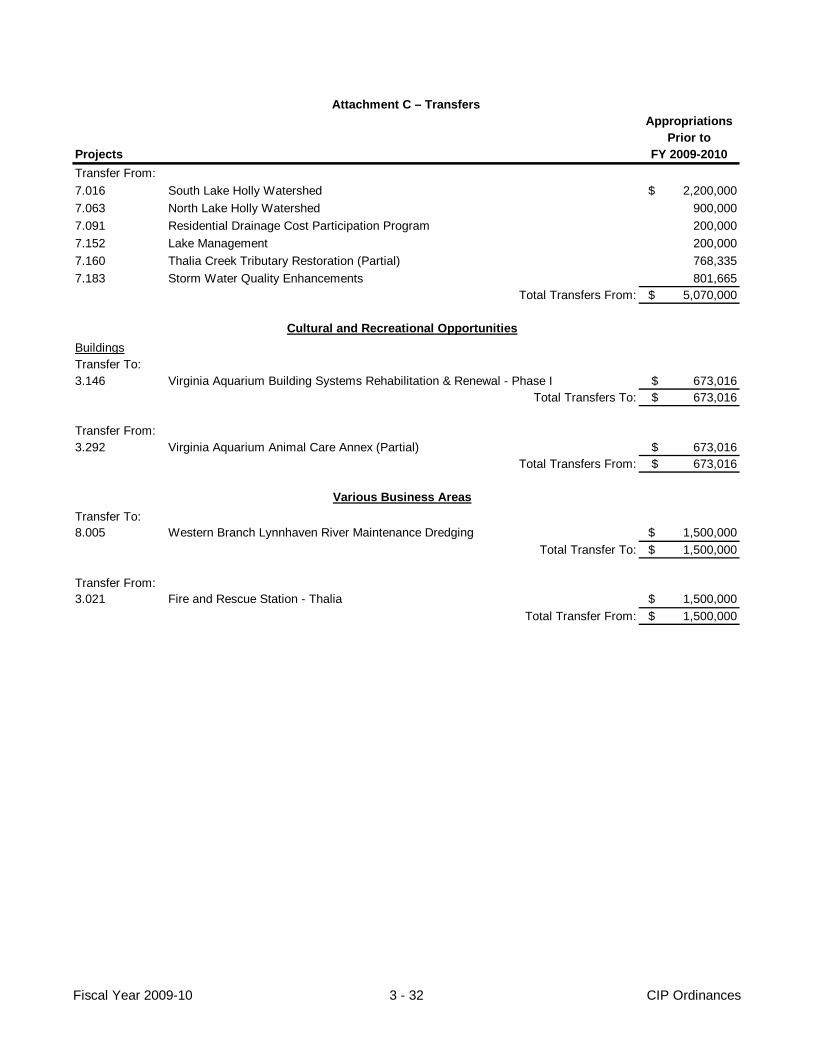
AppropriationsPrior to
FY 2009-2010
Attachment C – Transfers
ProjectsTransfer From:7.016 South Lake Holly Watershed $ 2,200,000 7.063 North Lake Holly Watershed 900,0007.091 Residential Drainage Cost Participation Program 200,0007.152 Lake Management 200,0007.160 Thalia Creek Tributary Restoration (Partial) 768,3357.183 Storm Water Quality Enhancements 801,665
Total Transfers From: $ 5,070,000
Cultural and Recreational OpportunitiesBuildingsTransfer To:3.146 Virginia Aquarium Building Systems Rehabilitation & Renewal - Phase I $ 673,016
Total Transfers To: $ 673,016
Transfer From:3.292 Virginia Aquarium Animal Care Annex (Partial) $ 673,016
Total Transfers From: $ 673,016
Various Business AreasTransfer To:8.005 Western Branch Lynnhaven River Maintenance Dredging $ 1,500,000
Total Transfer To: $ 1,500,000
Transfer From:3.021 Fire and Rescue Station - Thalia $ 1,500,000
Total Transfer From: $ 1,500,000
Fiscal Year 2009-10 3 - 32 CIP Ordinances
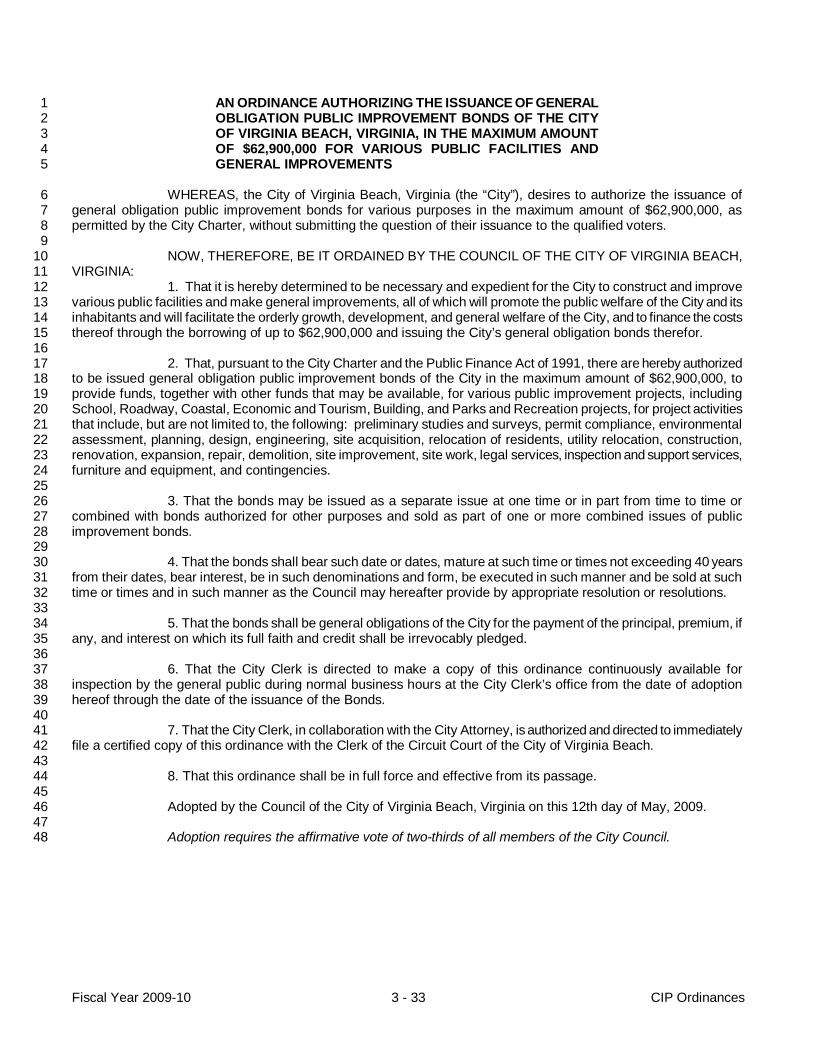
Fiscal Year 2009-10 3 - 33 CIP Ordinances
AN ORDINANCE AUTHORIZING THE ISSUANCE OF GENERAL 1 OBLIGATION PUBLIC IMPROVEMENT BONDS OF THE CITY 2 OF VIRGINIA BEACH, VIRGINIA, IN THE MAXIMUM AMOUNT 3 OF $62,900,000 FOR VARIOUS PUBLIC FACILITIES AND 4 GENERAL IMPROVEMENTS 5
WHEREAS, the City of Virginia Beach, Virginia (the “City”), desires to authorize the issuance of 6
general obligation public improvement bonds for various purposes in the maximum amount of $62,900,000, as 7 permitted by the City Charter, without submitting the question of their issuance to the qualified voters. 8
9 NOW, THEREFORE, BE IT ORDAINED BY THE COUNCIL OF THE CITY OF VIRGINIA BEACH, 10
VIRGINIA: 11 1. That it is hereby determined to be necessary and expedient for the City to construct and improve 12
various public facilities and make general improvements, all of which will promote the public welfare of the City and its 13 inhabitants and will facilitate the orderly growth, development, and general welfare of the City, and to finance the costs 14 thereof through the borrowing of up to $62,900,000 and issuing the City’s general obligation bonds therefor. 15
16 2. That, pursuant to the City Charter and the Public Finance Act of 1991, there are hereby authorized 17
to be issued general obligation public improvement bonds of the City in the maximum amount of $62,900,000, to 18 provide funds, together with other funds that may be available, for various public improvement projects, including 19 School, Roadway, Coastal, Economic and Tourism, Building, and Parks and Recreation projects, for project activities 20 that include, but are not limited to, the following: preliminary studies and surveys, permit compliance, environmental 21 assessment, planning, design, engineering, site acquisition, relocation of residents, utility relocation, construction, 22 renovation, expansion, repair, demolition, site improvement, site work, legal services, inspection and support services, 23 furniture and equipment, and contingencies. 24
25 3. That the bonds may be issued as a separate issue at one time or in part from time to time or 26
combined with bonds authorized for other purposes and sold as part of one or more combined issues of public 27 improvement bonds. 28
29 4. That the bonds shall bear such date or dates, mature at such time or times not exceeding 40 years 30
from their dates, bear interest, be in such denominations and form, be executed in such manner and be sold at such 31 time or times and in such manner as the Council may hereafter provide by appropriate resolution or resolutions. 32
33 5. That the bonds shall be general obligations of the City for the payment of the principal, premium, if 34
any, and interest on which its full faith and credit shall be irrevocably pledged. 35 36 6. That the City Clerk is directed to make a copy of this ordinance continuously available for 37
inspection by the general public during normal business hours at the City Clerk’s office from the date of adoption 38 hereof through the date of the issuance of the Bonds. 39
40 7. That the City Clerk, in collaboration with the City Attorney, is authorized and directed to immediately 41
file a certified copy of this ordinance with the Clerk of the Circuit Court of the City of Virginia Beach. 42 43 8. That this ordinance shall be in full force and effective from its passage. 44 45 Adopted by the Council of the City of Virginia Beach, Virginia on this 12th day of May, 2009. 46 47 Adoption requires the affirmative vote of two-thirds of all members of the City Council. 48

Fiscal Year 2009-10 3 - 34 CIP Ordinances
AN ORDINANCE AUTHORIZING THE ISSUANCE OF WATER AND 1 SEWER SYSTEM REVENUE BONDS OF THE CITY OF VIRGINIA 2 BEACH, VIRGINIA, IN THE MAXIMUM AMOUNT OF $17,000,0003
WHEREAS, the City of Virginia Beach, Virginia (the “City”), desires to authorize the issuance of water and 4 sewer system revenue bonds in the maximum amount of $17,000,000 for financing improvements and expansions to 5 the City’s water and sewer system (the “System”), as permitted by the City Charter without submitting the question of 6 their issuance to the qualified voters. 7
8 NOW, THEREFORE, BE IT ORDAINED BY THE COUNCIL OF THE CITY OF VIRGINIA BEACH, VIRGINIA: 9 10 1. That it is hereby determined to be necessary and expedient for the City to continue its program of 11 improving and extending the System, which will promote the public welfare of the City and its inhabitants and will 12 facilitate the orderly growth, development, and general welfare of the City, and to finance the costs thereof through the 13 borrowing of $17,000,000 and issuing the City’s revenue bonds therefore. 14 15 2. That pursuant to the City Charter and the Public Finance Act of 1991, there are hereby authorized to be 16 issued water and sewer system revenue bonds of the City in the maximum amount of $17,000,000 to provide funds, 17 together with other available funds, for financing the costs of improvements and expansions to the System. 18 19 3. That the bonds shall bear such date or dates, mature at such time or times not exceeding 40 years from 20 their dates, bear interest, be in such denominations and form, be executed in such manner and be sold at such time or 21 times and in such manner as the Council may hereafter provide by appropriate resolution or resolutions. 22 23 4. That the System is an undertaking from which the City may derive a revenue. The bonds shall be limited 24 obligations of the City, payable as to principal, premium, if any, and interest solely from the revenues derived by the 25 City from the System, and shall not be included within the otherwise authorized indebtedness of the City. The bonds 26 shall not be deemed to create or constitute an indebtedness of, or a pledge of the faith and credit of, the 27 Commonwealth of Virginia or of any country, city, town, or other political subdivision of the Commonwealth, including 28 the City. The issuance of the bonds and the undertaking of the covenants, conditions, and agreements to be 29 contained in resolutions to be adopted or agreements to be entered into hereafter shall not directly, indirectly, or 30 contingently obligate the Commonwealth, the City, or any other political subdivision of the Commonwealth to levy and 31 collect any taxes whatsoever or make any appropriation therefore, except from the revenues pledged to the payment 32 of the principal of and premium, if any, and interest on the bonds. 33 34 5. That such resolutions to be adopted and agreements to be entered into hereafter authorizing the issuance 35 of the bonds and providing the details thereof shall contain appropriate covenants requiring the City to fix, charge, and 36 collect such rates, fees, and other charges for the use of and the services furnished by the System and to revise the 37 same from time to time and as often as shall be necessary so as to produce sufficient net revenues to pay principal of 38 and premium, if any, and interest on the bonds as the same become due and to provide a margin of safety therefor. 39 Such resolutions and agreements shall also include such additional covenants, agreements, and other terms as are 40 customary for the protection of the holders of water and sewer revenue obligations. 41 42 6. That the City Clerk is directed to make a copy of this ordinance continuously available for inspection by the 43 general public during normal business hours at the City Clerk’s office from the date of adoption hereof through the 44 date of the issuance of the bonds. 45 46 7. That the City Clerk, in collaboration with the City Attorney, is authorized and directed to immediately file a 47 certified copy of this ordinance with the Circuit Court of the City of Virginia Beach. 48 49
8. That this ordinance shall be in full force and effect from its passage. 50 51
Adopted by the Council of the City of Virginia Beach, Virginia on this 12th day of May, 2009. 52 53
Requires an affirmative vote by a majority of all the members of the City Council. 54

Table of Contents Reference
Dedication of Local Revenues ..........................................................................................................4 - 1
Real Estate Tax Rate History: FY 1982-83 through FY 2009-10 .......................................................4 - 2
Options to Balance the Operating Budget .........................................................................................4 - 4
Summary of Proposed Fee Adjustments ..........................................................................................4 - 5
Additions and Reductions of Positions for FY 2009-10 .....................................................................4 - 6
A Resolution to Address Public Safety Pay Compression Disparities ................................................4 - 9
Entry Level Police, Fire and Sheriff Salary Survey ..........................................................................4 - 11
Demographic Information ...............................................................................................................4 - 12
Relationship of the Operating Budget to the Capital Improvement Program ....................................4 - 14
FY 2009-10 Revised Revenue Summary ........................................................................................4 - 15
FY 2009-10 Revised Personnel Summary ......................................................................................4 - 16
FY 2009-10 Revised Interfund Transfer Summary ..........................................................................4 - 17
CIP Means of Financing Summary .................................................................................................4 - 20
CIP Project Estimates Summary ....................................................................................................4 - 21
CIP Computation of Bonding Limits ................................................................................................4 - 22
CIP Estimated Debt Service Costs of General Improvement Debt ..................................................4 - 23
CIP Estimated Debt Service Costs of Water and Sewer Bond Issues .............................................4 - 24
CIP Completed Project Listing ........................................................................................................4 - 25
CIP Deleted Project Listing.............................................................................................................4 - 27
CIP Requested But Not Funded Project Listing ..............................................................................4 - 28

Fiscal Year 2009-10 4 - 1 Reference
Dedication of Local Revenues
Real Estate$497,989,682
(rate = .89 cents)
Utility Taxes$49,393,006
General Sales$51,129,941
Personal Property$121,272,980(rate = $3.70)
Business License$40,556,906
Cable Franchise$5,873,378
Schools$245,378,842
(51.3%)
Schools$62,213,038
(51.3%)
Sandbridge Special Services District
$755,302(additional rate of .06 cents)
Lynnhaven Mall TIF$2,153,527
Sandbridge TIF$9,369,273
Town Center TIF$5,729,830
Recreation Centers$18,632,799(3.476 cents)
Agriculture Reserve Program$4,824,373(.09 cents)
Schools$20,805,693
(51.3%)
Schools$21,755,077
(51.3%)
Schools$26,229,660
(51.3%)
Beach Events$1,354,871
(0.5 %)
Schools$3,013,043
(51.3%)
Hotel$23,891,018
(local rate = 8%)
Amusement$5,300,732(rate = 10%)
Cigarette$12,935,527
(local rate = .61 cents a pack)
Automobile Licenses$9,050,812
Economic Development Investment Program
$2,120,578(.10 cents)
Tourism Growth InvestmentFund (TGIF)$5,300,732
(100%)
Major Projects$6,774,356
(2.5%)
Tourism Growth InvestmentFund (TGIF)$5,419,485
(2%)
Major Projects$1,060,289(.05 cents)
Outdoor Initiative$2,519,395(.47 cents)
Tourism AdvertisingProgram (TAP)
$2,709,742(1%)
Major Projects$4,240,586
(80% of TGIF’s Amusement Revenues)
Bank net Capital$1,538,731
City Tax on Deeds$5,919,512
Restaurant Meals$49,829,621
(local rate = 5.5%)
Tourism Growth InvestmentFund (TGIF)$4,528,700
(0.5 %)
Major Projects$5,072,144
(0.56%)
Open Space$3,985,256
(0.44%)
Tourism AdvertisingProgram (TAP)
$4,528,700(0.5 %)
Town Center Special Service District
$1,660,420(additional rate of .45 cents)
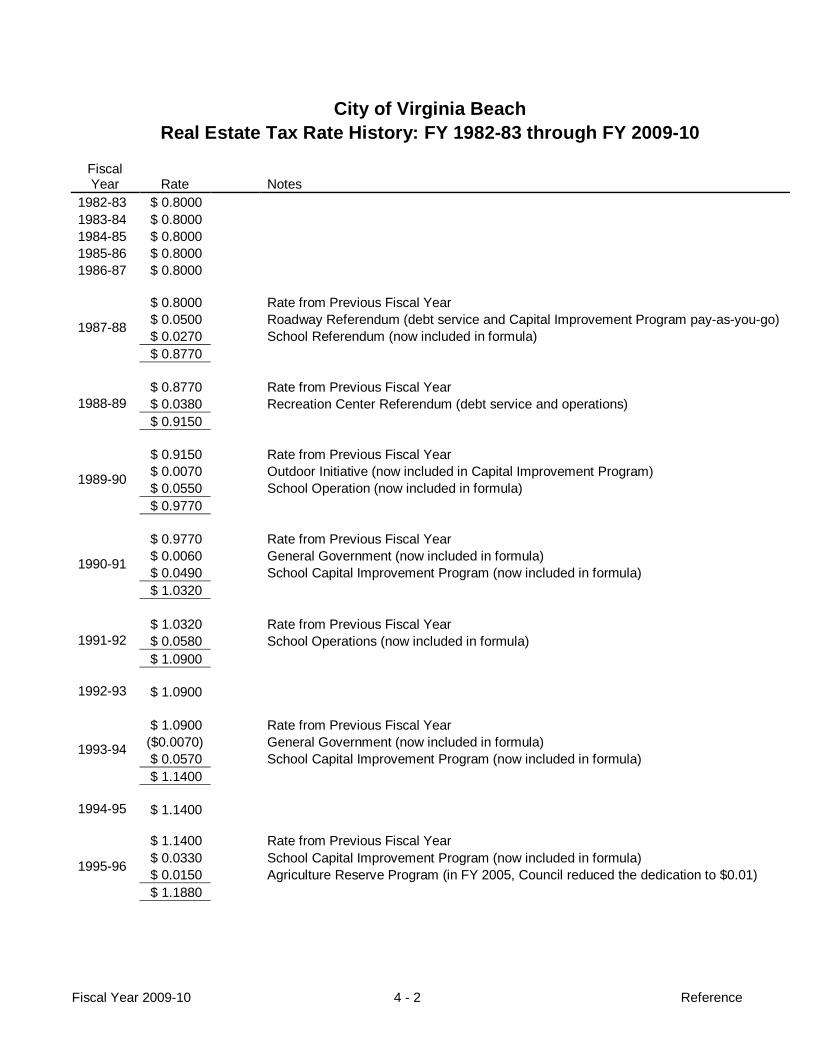
Fiscal Year 2009-10 4 - 2 Reference
City of Virginia Beach Real Estate Tax Rate History: FY 1982-83 through FY 2009-10
Fiscal Year Rate Notes
1982-83 $ 0.8000 1983-84 $ 0.8000 1984-85 $ 0.8000 1985-86 $ 0.8000 1986-87 $ 0.8000
1987-88
$ 0.8000 Rate from Previous Fiscal Year $ 0.0500 Roadway Referendum (debt service and Capital Improvement Program pay-as-you-go) $ 0.0270 School Referendum (now included in formula) $ 0.8770
1988-89 $ 0.8770 Rate from Previous Fiscal Year $ 0.0380 Recreation Center Referendum (debt service and operations) $ 0.9150
1989-90
$ 0.9150 Rate from Previous Fiscal Year $ 0.0070 Outdoor Initiative (now included in Capital Improvement Program) $ 0.0550 School Operation (now included in formula) $ 0.9770
1990-91
$ 0.9770 Rate from Previous Fiscal Year $ 0.0060 General Government (now included in formula) $ 0.0490 School Capital Improvement Program (now included in formula) $ 1.0320
1991-92 $ 1.0320 Rate from Previous Fiscal Year $ 0.0580 School Operations (now included in formula) $ 1.0900
1992-93 $ 1.0900
1993-94
$ 1.0900 Rate from Previous Fiscal Year ($0.0070) General Government (now included in formula) $ 0.0570 School Capital Improvement Program (now included in formula) $ 1.1400
1994-95 $ 1.1400
1995-96
$ 1.1400 Rate from Previous Fiscal Year $ 0.0330 School Capital Improvement Program (now included in formula) $ 0.0150 Agriculture Reserve Program (in FY 2005, Council reduced the dedication to $0.01) $ 1.1880

Fiscal Year 2009-10 4 - 3 Reference
City of Virginia Beach Real Estate Tax Rate History: FY 1982-83 through FY 2009-10
Fiscal Year Rate Notes
1996-97 $ 1.1880 Rate from Previous Fiscal Year $ 0.0320 School Operating Budget (now included in formula) $ 1.2200
1997-98 $ 1.2200 1998-99 $ 1.2200 1999-00 $ 1.2200 2000-01 $ 1.2200 2001-02 $ 1.2200 2002-03 $ 1.2200 2003-04 $ 1.2200
2004-05 $ 1.2200 Rate from Previous Fiscal Year ($0.0236) Tax relief due to 1/4 cent increase in sales tax $ 1.1964
2005-06 $1.1964 Rate from Previous Fiscal Year ($17.25) Tax relief due to rising real estate appreciation $1.0239
2006-07 $1.0239 Rate from Previous Fiscal Year ($0.0300) Tax relief due to rising real estate appreciation $0.99
2007-08 $0.99 Rate from Previous Fiscal Year ($0.1000) Tax relief due to rising real estate appreciation $0.89
2008-09 $0.89 2009-10 $0.89

Fiscal Year 2009-10 4 - 4 Reference
Options to Balance the Operating Budget Used
Yes No
þ Option A • Move all of the GASB45 payment (Retiree Health Care Liability) to Health Insurance Fund.
þ Option B • Change City Council dedicated revenues for one year and review for appropriate funding levels with
the next Biennial Budget.
þ Option C • Eliminate the proposed 2.5% pay raise for all employees.
ý Option D • Unpaid Furloughs – Each full-time employee would have to take an unpaid day sometime during the
12 months.
ý Option E • Eliminate salary supplements for Constitutional Officer State positions.
þ Option F • Reduce pay-as-you-go financing to the Capital Improvement Program and replace with fund balance.
ý Option G • Defer all or a portion of the FY 2009 bond sale (occurs in the spring).
ý Option H • Across-the-board reductions.
ý Option I
• Reduce all operating accounts by 1%.
ý Option J • Defer vehicle replacement for one year.
ý Option K • Maintain City Council’s policy of not replacing or supplanting State funding reductions.
þ Option L • Reduce travel and training accounts.
ý Option M • Reduce contracted manpower.
ý Option N
• Raise real estate tax by 1¢.
ý Option O • Raise personal property tax on vehicles by 10¢.
ý Option P • Institute a monthly garbage fee.
ý Option Q
• Budget for attrition (assume some level of position turnover for each department).
þ Option R • Increase City reliance on existing fees by 1% thereby recouping more program/service costs through
fees.
þ Option S • Review program and service rankings for possible reductions/eliminations.

Fiscal Year 2009-10 4 - 5 Reference
Summary of Proposed Fee Adjustments
Department Old Fee New Fee Notes Parks & Recreation
• Athletics
$100 Half Day $150 Full Day
$125 Half Day $175 Full Day
Reservation of tournament quality fields at Princess Anne Athletic Complex and City View Park
• Parks & Natural
Areas $50 Half Day $100 Full Day
$60 Half Day $120 Full Day
Shelter reservations
• Recreation Centers
$65 $85 Surfing program fee
• Recreation Centers
$18 Reduced Fee $30 Full Fee $60 Business Fee
$21 Reduced Fee $35 Full Fee $69 Business Fee
Room rentals hourly rates at six recreation centers
• Recreation Centers
$15 Community Service $20 Exclusive Use $30 Business
$17 Community Service $23 Exclusive Use $35 Business
Pool lap lane hourly rentals at six recreation centers
• Recreation Centers
$150 Half Day Rehearsal $225 All Day Rehearsal $300 Performance
$173 Half Day Rehearsal $259 All Day Rehearsal $345 Performance
Kempsville theater rental rates
• Recreation Centers
$50 Community Service $75 Exclusive Use $100 Business
$58 Community Service $86 Exclusive Use $115 Business
Gym hourly rentals at six recreation centers
• Recreation Centers
$75 Community Service $86 Exclusive Use $90 Business
$100 Community Service $115 Exclusive Use $120 Business
Gym hourly rentals prior to 11:00 am on Sunday
• Therapeutic Recreation
$50 $59 Weekly charge for All Star and Champions camps

Additions and Reductions of Positions for FY 2009-10
Fiscal Year 2009-10 4 - 6 Reference
The chart below indicates the overall change in City positions (both additions and reductions) in FY 2009-10 as a result of the current budget.
Department FTE Additions FTE Reductions Net Change from
FY 2009-10 Agriculture • Office Assistant (1 FTE) (1.00 FTE) City Manager • Office Assistant
(.5 FTE) • Media & Communications
Coordinator (3 FTE) • Administrative Specialist I
(1 FTE Transferred to Fire Department)
(3.50 FTE)
City Treasurer • Clerk Typist:
Transferred from Convention and Visitors Bureau (1 FTE)
1.00 FTE
Commissioner of the Revenue
• Account Clerk (.44 FTE)
0.44 FTE
Communications and Information Technology (ComIT)
• System Analyst II: Transferred from Human Services (1 FTE)
• Program Analyst II: Transferred from Human Services (2 FTE)
• Transferred from Emergency Communications Due to Department Reorganization (6 FTE)
• Microcomputer System Analyst: Transferred from Commonwealth’s Attorney (1 FTE)
• Systems Analyst I (1 FTE) • GIS Data Analyst (1 FTE) • Systems Engineer I (1 FTE) • Account Clerk I (1 FTE)
6.00 FTE
Commonwealth’s Attorney
• Assistant Commonwealth’s Attorney (1 FTE)
• Victim Witness Caseworker (1 FTE)
• Consumer Protection Officer (1 FTE)
• Microcomputer System Analyst: Transferred to ComIT (1 FTE)
0.00 FTE
Convention & Visitors Bureau
• Events Supervisor (1 FTE) • Stagehand (1 FTE) • Clerk Typist: Transferred to City
Treasurer (1 FTE) • Custodial I (1.82 FTE)
(4.82 FTE)
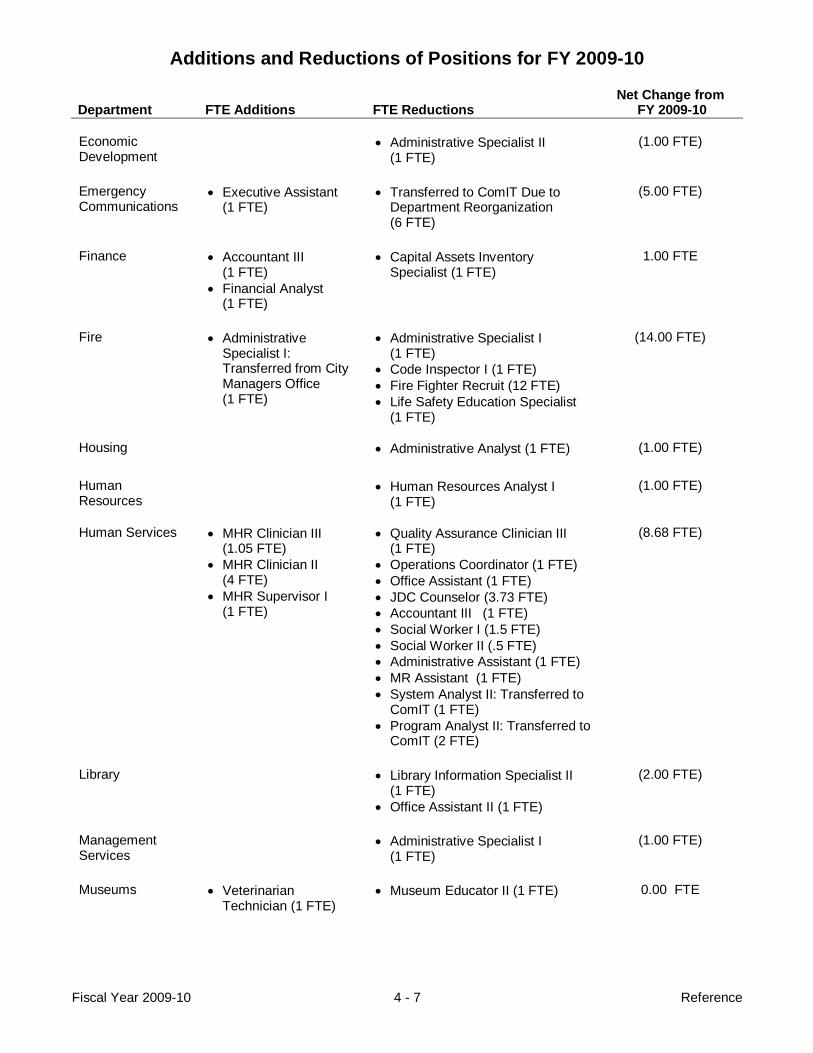
Additions and Reductions of Positions for FY 2009-10
Fiscal Year 2009-10 4 - 7 Reference
Department FTE Additions FTE Reductions Net Change from
FY 2009-10 Economic Development
• Administrative Specialist II (1 FTE)
(1.00 FTE)
Emergency Communications
• Executive Assistant (1 FTE)
• Transferred to ComIT Due to Department Reorganization (6 FTE)
(5.00 FTE)
Finance • Accountant III
(1 FTE) • Financial Analyst
(1 FTE)
• Capital Assets Inventory Specialist (1 FTE)
1.00 FTE
Fire • Administrative
Specialist I: Transferred from City Managers Office (1 FTE)
• Administrative Specialist I (1 FTE)
• Code Inspector I (1 FTE) • Fire Fighter Recruit (12 FTE) • Life Safety Education Specialist
(1 FTE)
(14.00 FTE)
Housing • Administrative Analyst (1 FTE) (1.00 FTE) Human Resources
• Human Resources Analyst I (1 FTE)
(1.00 FTE)
Human Services • MHR Clinician III
(1.05 FTE) • MHR Clinician II
(4 FTE) • MHR Supervisor I
(1 FTE)
• Quality Assurance Clinician III (1 FTE)
• Operations Coordinator (1 FTE) • Office Assistant (1 FTE) • JDC Counselor (3.73 FTE) • Accountant III (1 FTE) • Social Worker I (1.5 FTE) • Social Worker II (.5 FTE) • Administrative Assistant (1 FTE) • MR Assistant (1 FTE) • System Analyst II: Transferred to
ComIT (1 FTE) • Program Analyst II: Transferred to
ComIT (2 FTE)
(8.68 FTE)
Library • Library Information Specialist II
(1 FTE) • Office Assistant II (1 FTE)
(2.00 FTE)
Management Services
• Administrative Specialist I (1 FTE)
(1.00 FTE)
Museums
• Veterinarian Technician (1 FTE)
• Museum Educator II (1 FTE) 0.00 FTE
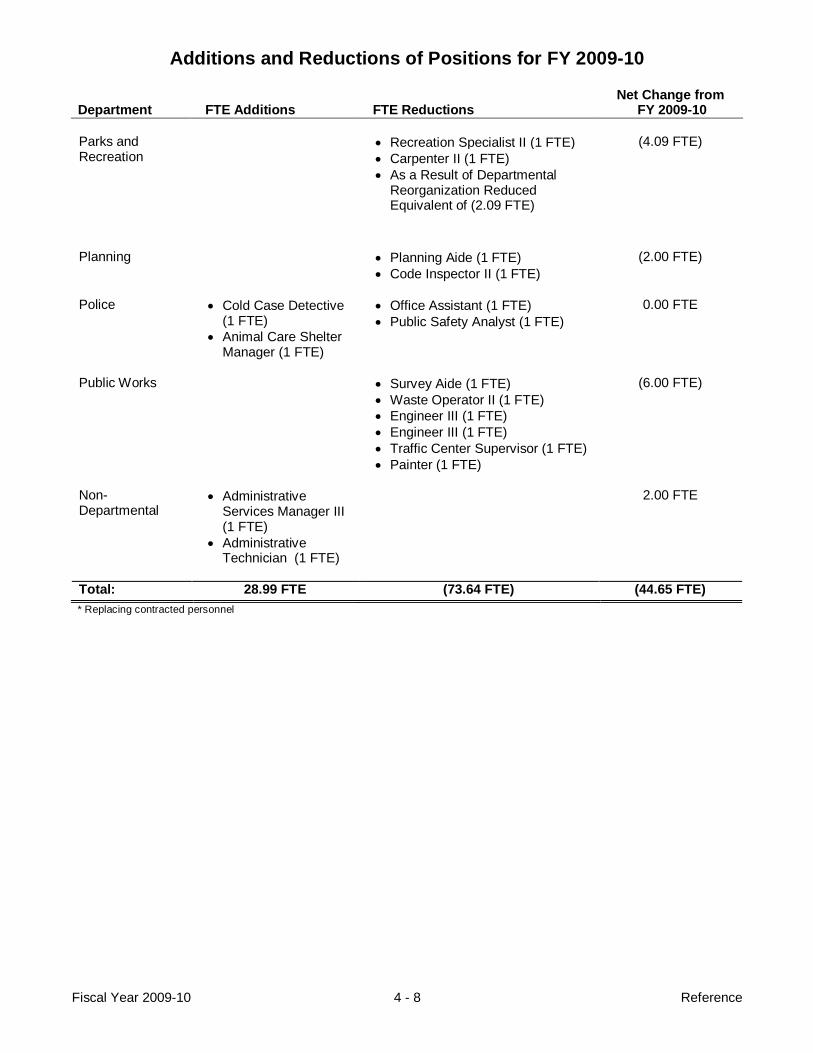
Additions and Reductions of Positions for FY 2009-10
Fiscal Year 2009-10 4 - 8 Reference
Department FTE Additions FTE Reductions Net Change from
FY 2009-10 Parks and Recreation
• Recreation Specialist II (1 FTE) • Carpenter II (1 FTE) • As a Result of Departmental
Reorganization Reduced Equivalent of (2.09 FTE)
(4.09 FTE)
Planning • Planning Aide (1 FTE)
• Code Inspector II (1 FTE) (2.00 FTE)
Police • Cold Case Detective
(1 FTE) • Animal Care Shelter
Manager (1 FTE)
• Office Assistant (1 FTE) • Public Safety Analyst (1 FTE)
0.00 FTE
Public Works • Survey Aide (1 FTE)
• Waste Operator II (1 FTE) • Engineer III (1 FTE) • Engineer III (1 FTE) • Traffic Center Supervisor (1 FTE) • Painter (1 FTE)
(6.00 FTE)
Non-Departmental
• Administrative Services Manager III (1 FTE)
• Administrative Technician (1 FTE)
2.00 FTE
Total: 28.99 FTE (73.64 FTE) (44.65 FTE)
* Replacing contracted personnel

Fiscal Year 2009-10 4 - 9 Reference
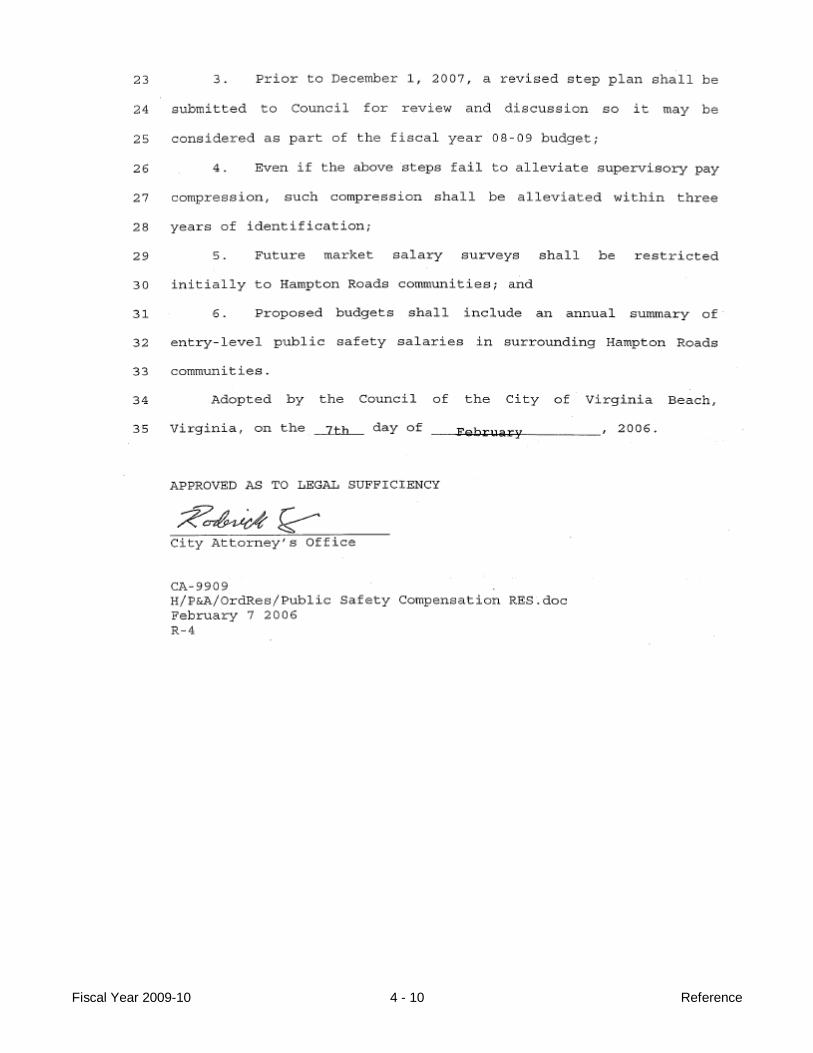
Fiscal Year 2009-10 4 - 10 Reference

Locality Min Mid Max Title Min Mid Max Title
Virginia Beach 36,995 45,319 53,643 Police Officer Recruit 38,868 47,614 56,359 Police Officer
Chesapeake 37,494 46,278 55,061 Police Officer Trainee 39,182 48,361 57,540 Police Officer
Hampton 36,500 39,238 41,975 Police Public Safety Recruit 38,550 50,738 62,925 Police Patrol Officer
Newport News 36,000 37,175 38,350 Police Officer Recruit 38,000 40,150 42,300 Police Officer
Norfolk 36,500 36,500 36,500 Police Officer Recruit 39,390 48,928 58,466 Police Officer
Portsmouth 31,411 41,620 51,828 Police Officer Trainee 32,983 43,702 54,420 Police Officer
Suffolk 35,083 43,854 52,625 Police Officer I 36,722 45,903 55,083 Police Officer II
Locality Min Mid Max Title Min Mid Max Title
Virginia Beach 36,995 45,319 53,643 Firefighter Recruit 38,868 47,614 56,359 Firefighter
Chesapeake 37,494 46,278 55,061 Firefighter Trainee 39,182 48,361 57,540 Firefighter/EMT
Hampton 36,500 39,238 41,975 Firefighter Recruit 38,550 50,738 62,925 Firefighter
Newport News 36,000 37,175 38,350 Firefighter/Medic Recruit No Match*
Norfolk 35,195 35,195 35,195 Firefighter Recruit 36,743 46,327 55,911 Firefighter/EMT - Enhanced
Portsmouth 31,411 41,620 51,828 Firefighter Trainee 32,983 43,702 54,420 Firefighter
Suffolk 35,083 43,854 52,625 Firefighter I 36,722 45,903 55,083 Firefighter II
Locality Min Mid Max Title Min Mid Max Title
Virginia Beach 35,213 Deputy Sheriff 36,621 43,136 51,058
Deputy Sheriff (minimum reflects 4% merit after 15 months)
Chesapeake 37,494 46,278 55,061 Deputy Sheriff Trainee 39,182 48,361 57,540 Deputy Sheriff
Hampton 31,434 Deputy Sheriff 34,263
Deputy Sheriff (minimum reflects 9% increase to base salary after 13 months)
Newport News 30,970 Deputy I 32,210 41,248 50,285 Deputy II
Norfolk No Recruit Level 30,792 39,575 48,358 Deputy Sheriff
Portsmouth 28,234 Deputy Sheriff 33,144 40,603 52,973
Deputy Sheriff (minimum reflects 9.7% regrade and $2,171 supplement at the end of first year and completion of the academy - NOTE: proposal to cut the $2,171 July 2009)
Suffolk No Recruit Level 35,083 43,854 52,625 Deputy Sheriff
Note: No match*. Newport News Fire Academy graduates are required to attain EMT-Intermediate certification. Virginia Beach and Norfolk Fire Academy graduates are required to attain EMT-Enhanced. EMT-Enhanced is a lower level than Intermediate. Virginia Beach compensates Fire employees with EMT-Intermediate certification two pay ranges above the Firefighter level (Firefighter/Medic). Virginia Beach Firefighter/Medic is a better match to Newport News' Firefighter.
Entry Level Police, Fire and Sheriff Salary SurveyAs of December 18, 2008
Police Officer Recruit Police Officer
Chesapeake and Newport News are the only jurisdictions that reported a separate trainee or recruit title for deputies while in training. Chesapeake’strainee is assigned to a pay range, though they are promoted to Deputy Sheriff before they reach the pay range maximum (similar to our Police OfficerRecruit). Newport News has a flat salary for the Deputy I that is used for deputies in training.
Virginia Beach, Hampton, and Portsmouth do not have a separate trainee title. However, these cities provide a specific percentage pay increase uponcompletion of training, and use this percentage increase as the reported minimum for the Deputy Sheriff upon completion of training. The midpointshown for the First Level Deputy is based on the minimum and maximum assigned to the title.
Deputy Sheriff Recruit
Firefighter Recruit Firefighter
First Level Deputy Sheriff
Fiscal Year 2009-10 4 - 11 Reference

Demographic Information
Fiscal Year 2009-10 4 - 12 Reference
The table below highlights available information from the last three Censuses for Virginia Beach as well as the Census’ 2006 American Community Survey: Demographic Characteristic 1980 1990 2000 2005-07* Sex: Male 50.8% 50.8% 49.5% 48.9% Female 49.2% 49.2% 50.5% 51.1% Age: Below 18 30.7% 28.0% 27.5% 26.0% 65+ 4.5% 5.9% 8.4% 9.8% Peak Earning Years (Age 35 to 54) 23.1% 24.9% 30.5% 31.1% Median Age 26.9 28.9 32.7 35.2 Dependency Population (Under 18 and 65+) 35.2% 33.9% 35.9% 35.8% Race: White 86.5% 80.5% 71.4% 70.3% Black/African American 10.0% 13.9% 19.0% 19.5% American Indian/Alaskan .2% .4% .4% .2% Asian/Hawaiian/Pacific 2.5% 4.3% 5.0% 5.5% Other Race .7% .9% 1.5% 1.3% Two or More Races** N/A N/A 2.7% 3.2% Hispanic*** 2.0% 3.1% 4.2% 5.4% Households: Family Household 79.2% 75.4% 71.8% 69.5% Married Couple Family 66.6% 62.9% 55.7% 52.2% Female Householder 10.3% 9.5% 12.4% 13.4% Non-Family Household 20.9% 24.6% 28.2% 30.5% Households with Children under 18 N/A 44.8% 42.1% 38.3% Housing Occupancy: Owner 64.2% 62.5% 65.6% 68.6% Renter 35.8% 37.5% 34.4% 31.4% Average Household Size 2.97 2.82 2.70 2.62 Average Family Size 3.35 3.21 3.21 3.12 Migration: % Who Lived in Virginia Beach 5 Years Ago 56.0% 59.9% 70.1% N/A Marital Status: Single, Never Married 26.5% 24.7% 25.5% 28.3% Married 61.0% 58.4% 57.1% 53.0% Separated 3.0% 5.4% 3.2% 2.5% Widowed 4.0% 4.0% 4.7% 5.1% Divorced 5.5% 7.6% 9.5% 11.1% Median Household Income $20,203 $36,271 $48,705 $62,477 Median Family Income $21,809 $39,112 $53,242 $71,012 Poverty: Persons 8.9% 5.9% 6.5% 7.0% Families 7.7% 4.3% 5.1% 5.2% Children Under 18 13.0% 7.6% 8.6% 10.4% 65+ 10.3% 8.0% 4.7% 4.9% Female Householder 38.9% 20.2% 18.9% 19.1% With Children 45.8% 26.5% 23.1% 25.5%
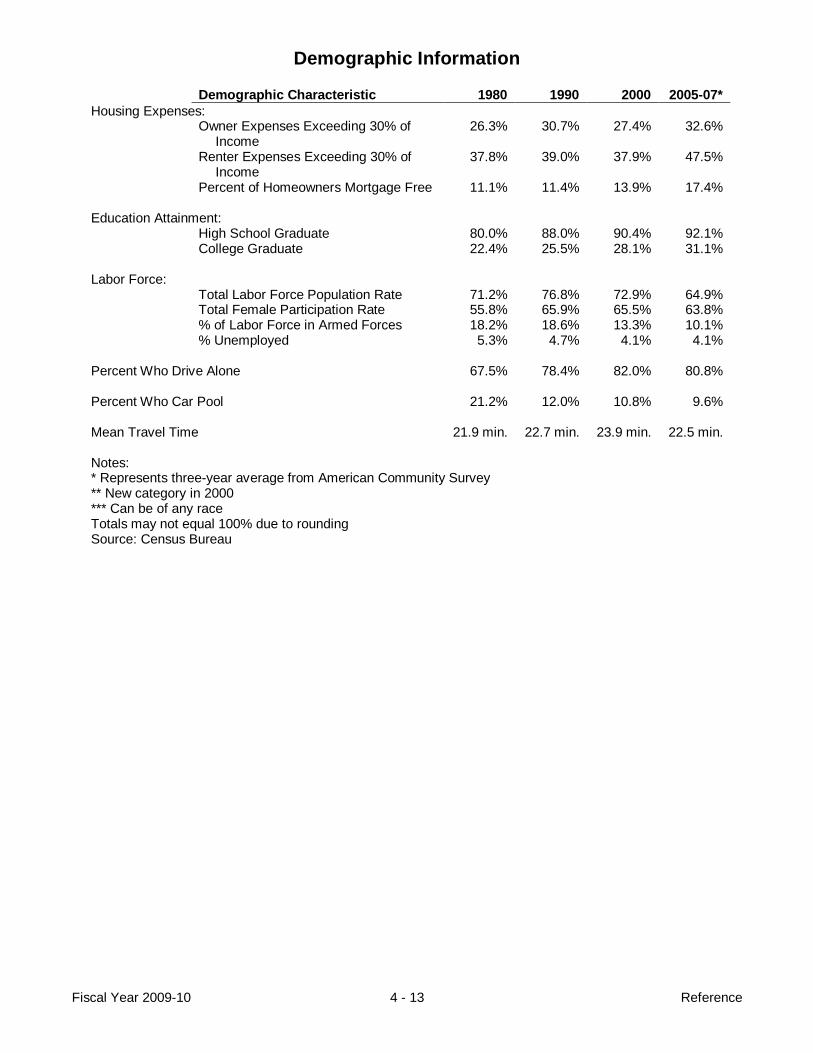
Demographic Information
Fiscal Year 2009-10 4 - 13 Reference
Demographic Characteristic 1980 1990 2000 2005-07* Housing Expenses: Owner Expenses Exceeding 30% of
Income 26.3% 30.7% 27.4% 32.6%
Renter Expenses Exceeding 30% of Income
37.8% 39.0% 37.9% 47.5%
Percent of Homeowners Mortgage Free 11.1% 11.4% 13.9% 17.4% Education Attainment: High School Graduate 80.0% 88.0% 90.4% 92.1% College Graduate 22.4% 25.5% 28.1% 31.1% Labor Force: Total Labor Force Population Rate 71.2% 76.8% 72.9% 64.9% Total Female Participation Rate 55.8% 65.9% 65.5% 63.8% % of Labor Force in Armed Forces 18.2% 18.6% 13.3% 10.1% % Unemployed 5.3% 4.7% 4.1% 4.1% Percent Who Drive Alone 67.5% 78.4% 82.0% 80.8% Percent Who Car Pool 21.2% 12.0% 10.8% 9.6% Mean Travel Time 21.9 min. 22.7 min. 23.9 min. 22.5 min. Notes: * Represents three-year average from American Community Survey ** New category in 2000 *** Can be of any race Totals may not equal 100% due to rounding Source: Census Bureau

Fiscal Year 2009-10 4 - 14 Reference
City of Virginia Beach Relationship of the Operating Budget to the Capital Improvement Program
As this graphic illustrates, there is a close linkage between the Operating Budget and Capital Improvement Program. Decisions made in one affect the other. For example, if we decide to open a new Fire Station, we also must plan for hiring new firefighters. Likewise, if we expand recreational programs in the Operating Budget we often must construct new facilities.
Cost of Bonds (Debt Service)
New Operating Costs
Pay-as-you-go Financing
New/Expanded Services or New Mandates
Ending Balance Use
Ope
ratin
g B
udge
tC
apitalIm
provement
Program

FY 2008-09 FY 2009-10 FY 2009-10FY 2007-08 Adjusted Approved % Total %
Actuals Budget Budget Change Adopted Change
Revenue Source SummaryRevenue from Local Sources
General Property Taxes Real Estate - Current 484,576,717 504,911,497 516,100,198 2.2% 497,989,682 -3.5%
Personal Property - Current 128,584,076 136,919,364 144,145,986 5.3% 121,272,980 -15.9%Total General Property Taxes 613,160,793 641,830,861 660,246,184 2.9% 619,262,662 -6.2%
Other Local TaxesGeneral Sales Tax 54,071,427 56,040,158 58,408,216 4.2% 51,129,941 -12.5%Utility Tax 47,362,442 49,045,450 49,011,945 -0.1% 49,393,006 0.8%Business License 41,801,546 43,180,830 46,888,062 8.6% 40,556,906 -13.5%Other Taxes 16,138,136 16,143,498 15,888,078 -1.6% 14,292,820 -10.0%Automobile License 8,945,576 8,960,647 9,050,812 1.0% 9,050,812 0.0%Cigarette Tax 11,503,774 13,199,518 12,935,527 -2.0% 12,935,527 0.0%Amusement Tax 5,020,312 5,597,076 5,839,435 4.3% 5,300,732 -9.2%Hotel Room Tax 23,623,107 24,133,253 24,868,324 3.0% 23,891,018 -3.9%Restaurant Tax 48,069,618 48,745,131 51,132,960 4.9% 49,829,621 -2.5%
Total Other Local Taxes 256,535,938 265,045,561 274,023,359 3.4% 256,380,383 -6.4%
Other Local RevenuePermits, Privilege Fees, and Regulatory 5,143,300 5,854,200 5,759,573 -1.6% 4,401,926 -23.6%Fines and Forfeitures 6,128,859 7,950,911 7,926,582 -0.3% 8,526,239 7.6%From the Use of Money and Property 27,453,499 18,770,010 23,566,573 25.6% 16,581,340 -29.6%Charges for Services 157,507,373 167,986,391 173,770,694 3.4% 171,862,329 -1.1%Miscellaneous Revenue 13,838,397 15,017,690 14,881,074 -0.9% 16,561,697 11.3%
Total Other Local Revenue 210,071,428 215,579,202 225,904,496 4.8% 217,933,531 -3.5%
Total Revenue from Local Sources 1,079,768,159 1,122,455,624 1,160,174,039 3.4% 1,093,576,576 -5.7%
Revenue from the CommonwealthState Shared Sales Tax 72,904,963 75,934,465 79,779,642 5.1% 72,941,384 -8.6%Other Sources from the Commonwealth 414,223,820 437,698,784 439,212,874 0.3% 428,398,470 -2.5%
Total Revenue from the Commonwealth 487,128,783 513,633,249 518,992,516 1.0% 501,339,854 -3.4%
Revenue from the Federal Government 100,264,458 106,910,488 104,449,113 -2.3% 141,244,957 35.2%Non-Revenue Receipts 9,201,565 4,478,456 4,489,693 0.3% 3,664,693 -18.4%
Total Revenue 1,676,362,965 1,747,477,817 1,788,105,361 2.3% 1,739,826,080 -2.7%
Fund Reserves SummarySpecific Fund Reserves 22,187,282 17,788,600 11,149,148 -37.3% 23,466,599 110.5%
Total Fund Reserves 22,187,282 17,788,600 11,149,148 -37.3% 23,466,599 110.5%
TOTAL FINANCING REQUIRED 1,698,550,247 1,765,266,417 1,799,254,509 1.9% 1,763,292,679 -2.0%
City of Virginia Beach, VirginiaFiscal Year 2009-10 Revised Revenue Summary
Fiscal Year 2009-10 4 - 15 Reference

FY 2008-09 FY 2009-10 FY 2009-10FY 2007-08 Adjusted Approved % Total %
Actuals Budget Budget Change Adopted Change
Agriculture 15.00 14.00 14.00 0.0% 13.00 -7.1%City Manager 32.63 29.90 29.70 -0.7% 26.20 -11.8%City Auditor 6.00 6.24 6.00 -3.8% 6.00 0.0%City Real Estate Assessor 35.35 38.35 38.35 0.0% 38.35 0.0%City Treasurer 77.41 76.68 75.68 -1.3% 76.68 1.3%Commissioner of the Revenue 62.63 63.61 63.61 0.0% 64.05 0.7%Commonwealth's Attorney 91.90 93.40 91.40 -2.1% 91.40 0.0%Communications and Information Technology 177.80 181.80 181.80 0.0% 187.80 3.3%Convention and Visitor Bureau 136.73 134.73 135.73 0.7% 130.91 -3.6%Courts and Courts' Support 76.00 76.00 76.00 0.0% 76.00 0.0%Economic Development 17.00 17.00 17.00 0.0% 16.00 -5.9%Emergency Communications and 132.00 132.00 132.00 0.0% 127.00 -3.8% Citizen ServicesEmergency Medical Services 56.50 56.50 56.50 0.0% 56.50 0.0%Finance 63.00 57.00 57.00 0.0% 58.00 1.8%Fire 469.66 469.84 481.84 2.6% 467.84 -2.9%General Registrar 12.03 12.03 12.03 0.0% 12.03 0.0%Health 11.19 11.07 11.07 0.0% 11.07 0.0%Housing and Neighborhood Preservation 69.00 69.00 69.00 0.0% 68.00 -1.4%Human Resources 58.13 54.13 54.13 0.0% 53.13 -1.8%Human Services 1,075.57 1,085.14 1,082.59 -0.2% 1,073.91 -0.8%Law 43.00 43.00 43.00 0.0% 43.00 0.0%Legislative 18.00 18.00 18.00 0.0% 18.00 0.0%Library 264.86 262.85 262.85 0.0% 260.85 -0.8%Management Services 22.00 21.00 21.00 0.0% 20.00 -4.8%Museums 152.43 151.81 151.43 -0.3% 151.43 0.0%Non-Departmental 5.00 3.00 3.00 0.0% 5.00 66.7%Parks and Recreation 872.72 875.15 876.25 0.1% 872.16 -0.5%Planning and Community Development 127.00 125.00 125.00 0.0% 123.00 -1.6%Police 1,015.02 1,006.86 1,005.86 -0.1% 1,005.86 0.0%Public Utilities 399.50 401.50 404.50 0.7% 404.50 0.0%Public Works 873.38 877.38 877.38 0.0% 871.38 -0.7%Sheriff and Corrections 523.37 524.37 524.37 0.0% 524.37 0.0%
Total City Positions 6,991.81 6,988.34 6,998.07 0.1% 6,953.42 -0.6%
Education 10,541.87 10,519.47 10,447.17 -0.7% 10,391.87 -0.5%
TotalsTotal City Full-Time Positions 6,306.00 6,305.00 6,312.00 0.1% 6,279.00 -0.5%Total City Part-Time Positions 674.81 672.34 675.07 0.4% 663.42 -1.7%Total City Council Members 11.00 11.00 11.00 0.0% 11.00 0.0%Total School Positions 10,541.87 10,519.47 10,447.17 -0.7% 10,391.87 -0.5%
TOTAL POSITIONS 17,533.68 17,507.81 17,445.24 -0.4% 17,345.29 -0.6%
City of Virginia Beach, VirginiaFiscal Year 2009-10 Revised Personnel Summary
Department Name
Fiscal Year 2009-10 4 - 16 Reference

City of Virginia Beach, VirginiaFiscal Year 2009-10 Revised Interfund Transfer Summary
FY 2008-09 FY 2009-10 FY 2009-10FY 2007-08 Adjusted Approved Total
Actuals Budget Budget Adopted
Transfers from one fund to another occur to initiate the following actions:*Reimburse a fund for expenses that occurred for another fund.*Record the transfer of revenue from one fund to assist in the operation of another fund.
002 General Fund161 Agriculture Reserve Program Special Revenue Fund 4,632,889 4,891,598 4,995,790 4,824,373169 Central Business District - South TIF (Town Center) Fund 0 0 0 222,222180 Community Development Special Revenue Fund 899,288 899,240 916,632 812,685147 Federal Section 8 Program Special Revenue Fund 314,064 256,606 258,834 98,102302 General Debt Fund 79,250,545 84,552,057 86,951,922 86,987,406540 General Government Capital Projects Fund 29,510,154 33,423,191 40,444,964 29,117,398183 Grants Consolidated Fund 332,790 371,106 393,637 408,603150 Inmate Services Special Revenue Fund 5,825 2,421 5,069 0130 Law Library Fund 137,515 0 0 0173 Major Projects Special Revenue Fund 12,734,639 12,902,144 13,344,901 12,906,789172 Open Space Special Revenue Fund 3,836,653 3,898,497 4,089,523 3,985,256151 Parks and Recreation Special Revenue Fund 15,949,290 16,566,366 17,345,216 16,403,188157 Sandbridge Special Service District Special Revenue Fund 80,971 73,120 74,582 74,582460 School General Revenue Capital Projects Fund 12,108,658 13,936,308 13,936,308 0099 School Instructional Technology Special Revenue Fund 1,437,129 0 0 0115 School Operating Fund 306,342,658 339,239,378 348,453,570 335,208,106149 Sheriff's Department Special Revenue Fund 13,145,265 12,956,975 12,869,445 12,394,250555 Storm Water Capital Projects Fund 0 0 0 176,120255 Storm Water Utility Enterprise Fund 56,371 57,498 58,648 58,648163 Tourism Advertising Program Special Revenue Fund 9,156,038 9,351,323 9,683,912 9,443,263152 Tourism Growth Investment Fund 16,804,380 17,696,611 18,394,294 17,208,652176 Transition Area Special Revenue Fund 146,658 467,391 748,977 0
Total Transfers from Fund 002 506,881,780 551,541,830 572,966,224 530,329,643
130 Law Library Fund002 General Fund 60,000 60,000 60,000 60,000
Total Transfers from Fund 130 60,000 60,000 60,000 60,000
142 DEA Seized Property Special Revenue Fund002 General Fund 47,919 0 0 0
Total Transfers from Fund 134 47,919 0 0 0
150 Inmate Services Special Revenue Fund002 General Fund 24,551 24,551 24,551 24,551149 Sheriff's Department Special Revenue Fund 250,000 250,000 250,000 250,000
Total Transfers from Fund 150 274,551 274,551 274,551 274,551
151 Parks and Recreation Special Revenue Fund157 Sandbridge Special Service District Special Revenue Fund 3,322 0 0 0
Total Transfers from Fund 151 3,322 0 0 0
152 Tourism Growth Investment Fund302 General Debt Fund 5,793,840 6,297,781 6,073,758 6,073,758002 General Fund 2,027,775 2,000,000 2,000,000 3,050,000540 General Government Capital Projects Fund 1,100,000 250,000 0 260,000173 Major Projects Special Revenue Fund 3,710,705 4,473,632 4,667,519 4,236,477253 Parking Enterprise Fund 258,803 258,803 258,803 258,803157 Sandbridge Special Service District Special Revenue Fund 841,661 457,032 489,025 489,025255 Storm Water Utility Enterprise Fund 12,455 12,829 13,214 13,214
Total Transfers from Fund 152 13,745,239 13,750,077 13,502,319 14,381,277
Fiscal Year 2009-10 4 - 17 Reference

City of Virginia Beach, VirginiaFiscal Year 2009-10 Revised Interfund Transfer Summary
FY 2008-09 FY 2009-10 FY 2009-10FY 2007-08 Adjusted Approved Total
Actuals Budget Budget Adopted
157 Sandbridge Special Service District Special Revenue Fund540 General Government Capital Projects Fund 2,904,786 3,460,626 3,336,076 3,336,076
Total Transfers from Fund 157 2,904,786 3,460,626 3,336,076 3,336,076
158 EMS State Four-for-Life Special Revenue Fund183 Grants Consolidated Fund 0 0 0 854
Total Transfers from Fund 158 0 0 0 854
161 Agriculture Reserve Program Special Revenue Fund302 General Debt Fund 2,203,820 3,528,635 3,912,068 3,034,647002 General Fund 2,523,218 0 0 4,000,000
Total Transfers from Fund 161 4,727,038 3,528,635 3,912,068 7,034,647
163 Tourism Advertising Program Special Revenue Fund002 General Fund 55,724 55,724 56,838 56,838
Total Transfers from Fund 163 55,724 55,724 56,838 56,838
166 Sandbridge Tax Increment Financing Fund540 General Government Capital Projects Fund 0 744,374 868,924 868,924
Total Transfers from Fund 166 0 744,374 868,924 868,924
167 Arts and Humanities Commission Special Revenue Fund002 General Fund 0 0 0 37,237
Total Transfers from Fund 167 0 0 0 37,237
169 Central Business District - South TIF (Town Center) Fund302 General Debt Fund 3,033,870 5,296,567 5,381,054 5,381,054174 Town Center Special Service District 0 0 0 300,000
Total Transfers from Fund 169 3,033,870 5,296,567 5,381,054 5,681,054
172 Open Space Special Revenue Fund302 General Debt Fund 2,135,575 2,518,029 2,498,134 2,498,134540 General Government Capital Projects Fund 2,050,000 2,400,000 2,400,000 2,400,000
Total Transfers from Fund 172 4,185,575 4,918,029 4,898,134 4,898,134
173 Major Projects Special Revenue Fund169 Central Business District - South TIF (Town Center) Fund 0 0 0 277,778302 General Debt Fund 17,248,659 19,858,456 19,778,057 19,778,057002 General Fund 18,574 0 0 1,000,000157 Sandbridge Special Service District Special Revenue Fund 861,835 905,333 995,866 995,866
Total Transfers from Fund 173 18,129,068 20,763,789 20,773,923 22,051,701
175 Golf Course Special Revenue Fund002 General Fund 0 89,550 89,550 89,550540 General Government Capital Projects Fund 200,000 200,000 200,000 200,000
Total Transfers from Fund 175 200,000 289,550 289,550 289,550
180 Community Development Special Revenue Fund002 General Fund 125,592 125,592 128,104 128,104
Total Transfers from Fund 180 125,592 125,592 128,104 128,104
Fiscal Year 2009-10 4 - 18 Reference

City of Virginia Beach, VirginiaFiscal Year 2009-10 Revised Interfund Transfer Summary
FY 2008-09 FY 2009-10 FY 2009-10FY 2007-08 Adjusted Approved Total
Actuals Budget Budget Adopted
183 Grants Consolidated Fund540 General Government Capital Projects Fund 0 400,000 400,000 400,000
Total Transfers from Fund 185 0 400,000 400,000 400,000
241 Water and Sewer Fund002 General Fund 5,249,363 6,331,732 6,467,857 6,485,245541 Water and Sewer Capital Projects Fund 6,250,000 7,000,000 8,000,000 7,500,000
Total Transfers from Fund 241 11,499,363 13,331,732 14,467,857 13,985,245
253 Parking Enterprise Fund302 General Debt Fund 725,625 725,900 724,687 724,687002 General Fund 80,526 111,134 94,439 112,130157 Sandbridge Special Service District Special Revenue Fund 28,239 29,086 29,959 29,959
Total Transfers from Fund 253 834,390 866,120 849,085 866,776
255 Storm Water Utility Enterprise Fund302 General Debt Fund 662,042 632,501 604,224 604,224002 General Fund 492,701 1,137,443 1,159,131 1,159,131555 Storm Water Capital Projects Fund 7,727,588 8,200,232 10,916,159 10,626,159241 Water and Sewer Fund 249,065 256,537 264,233 264,233
Total Transfers from Fund 255 9,131,396 10,226,713 12,943,747 12,653,747
TOTAL APPROPRIATIONS FOR ALL FUNDS 575,839,613 629,633,909 655,108,454 617,334,358
Fiscal Year 2009-10 4 - 19 Reference
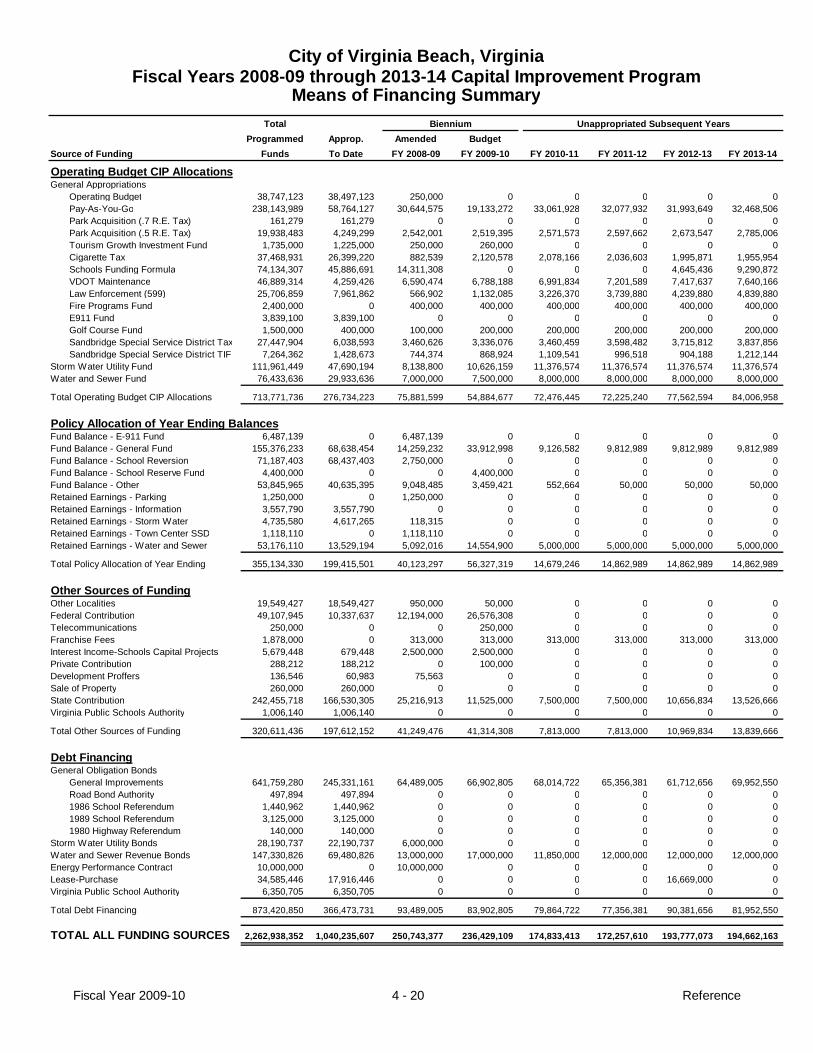
Total BienniumProgrammed Approp. Amended Budget
Funds To Date FY 2008-09 FY 2009-10 FY 2010-11 FY 2011-12 FY 2012-13 FY 2013-14
Operating Budget CIP AllocationsGeneral Appropriations
Operating Budget 38,747,123 38,497,123 250,000 0 0 0 0 0 Pay-As-You-Go 238,143,989 58,764,127 30,644,575 19,133,272 33,061,928 32,077,932 31,993,649 32,468,506
Park Acquisition (.7 R.E. Tax) 161,279 161,279 0 0 0 0 0 0Park Acquisition (.5 R.E. Tax) 19,938,483 4,249,299 2,542,001 2,519,395 2,571,573 2,597,662 2,673,547 2,785,006Tourism Growth Investment Fund 1,735,000 1,225,000 250,000 260,000 0 0 0 0Cigarette Tax 37,468,931 26,399,220 882,539 2,120,578 2,078,166 2,036,603 1,995,871 1,955,954Schools Funding Formula 74,134,307 45,886,691 14,311,308 0 0 0 4,645,436 9,290,872VDOT Maintenance 46,889,314 4,259,426 6,590,474 6,788,188 6,991,834 7,201,589 7,417,637 7,640,166Law Enforcement (599) 25,706,859 7,961,862 566,902 1,132,085 3,226,370 3,739,880 4,239,880 4,839,880Fire Programs Fund 2,400,000 0 400,000 400,000 400,000 400,000 400,000 400,000E911 Fund 3,839,100 3,839,100 0 0 0 0 0 0Golf Course Fund 1,500,000 400,000 100,000 200,000 200,000 200,000 200,000 200,000Sandbridge Special Service District Tax 27,447,904 6,038,593 3,460,626 3,336,076 3,460,459 3,598,482 3,715,812 3,837,856Sandbridge Special Service District TIF 7,264,362 1,428,673 744,374 868,924 1,109,541 996,518 904,188 1,212,144
Storm Water Utility Fund 111,961,449 47,690,194 8,138,800 10,626,159 11,376,574 11,376,574 11,376,574 11,376,574Water and Sewer Fund 76,433,636 29,933,636 7,000,000 7,500,000 8,000,000 8,000,000 8,000,000 8,000,000
Total Operating Budget CIP Allocations 713,771,736 276,734,223 75,881,599 54,884,677 72,476,445 72,225,240 77,562,594 84,006,958
Policy Allocation of Year Ending BalancesFund Balance - E-911 Fund 6,487,139 0 6,487,139 0 0 0 0 0Fund Balance - General Fund 155,376,233 68,638,454 14,259,232 33,912,998 9,126,582 9,812,989 9,812,989 9,812,989Fund Balance - School Reversion 71,187,403 68,437,403 2,750,000 0 0 0 0 0Fund Balance - School Reserve Fund 4,400,000 0 0 4,400,000 0 0 0 0Fund Balance - Other 53,845,965 40,635,395 9,048,485 3,459,421 552,664 50,000 50,000 50,000Retained Earnings - Parking 1,250,000 0 1,250,000 0 0 0 0 0Retained Earnings - Information 3,557,790 3,557,790 0 0 0 0 0 0Retained Earnings - Storm Water 4,735,580 4,617,265 118,315 0 0 0 0 0Retained Earnings - Town Center SSD 1,118,110 0 1,118,110 0 0 0 0 0Retained Earnings - Water and Sewer 53,176,110 13,529,194 5,092,016 14,554,900 5,000,000 5,000,000 5,000,000 5,000,000
Total Policy Allocation of Year Ending 355,134,330 199,415,501 40,123,297 56,327,319 14,679,246 14,862,989 14,862,989 14,862,989
Other Sources of FundingOther Localities 19,549,427 18,549,427 950,000 50,000 0 0 0 0Federal Contribution 49,107,945 10,337,637 12,194,000 26,576,308 0 0 0 0Telecommunications 250,000 0 0 250,000 0 0 0 0Franchise Fees 1,878,000 0 313,000 313,000 313,000 313,000 313,000 313,000Interest Income-Schools Capital Projects 5,679,448 679,448 2,500,000 2,500,000 0 0 0 0Private Contribution 288,212 188,212 0 100,000 0 0 0 0Development Proffers 136,546 60,983 75,563 0 0 0 0 0Sale of Property 260,000 260,000 0 0 0 0 0 0State Contribution 242,455,718 166,530,305 25,216,913 11,525,000 7,500,000 7,500,000 10,656,834 13,526,666Virginia Public Schools Authority 1,006,140 1,006,140 0 0 0 0 0 0
Total Other Sources of Funding 320,611,436 197,612,152 41,249,476 41,314,308 7,813,000 7,813,000 10,969,834 13,839,666
Debt FinancingGeneral Obligation Bonds
General Improvements 641,759,280 245,331,161 64,489,005 66,902,805 68,014,722 65,356,381 61,712,656 69,952,550Road Bond Authority 497,894 497,894 0 0 0 0 0 01986 School Referendum 1,440,962 1,440,962 0 0 0 0 0 01989 School Referendum 3,125,000 3,125,000 0 0 0 0 0 01980 Highway Referendum 140,000 140,000 0 0 0 0 0 0
Storm Water Utility Bonds 28,190,737 22,190,737 6,000,000 0 0 0 0 0Water and Sewer Revenue Bonds 147,330,826 69,480,826 13,000,000 17,000,000 11,850,000 12,000,000 12,000,000 12,000,000Energy Performance Contract 10,000,000 0 10,000,000 0 0 0 0 0Lease-Purchase 34,585,446 17,916,446 0 0 0 0 16,669,000 0Virginia Public School Authority 6,350,705 6,350,705 0 0 0 0 0 0
Total Debt Financing 873,420,850 366,473,731 93,489,005 83,902,805 79,864,722 77,356,381 90,381,656 81,952,550
TOTAL ALL FUNDING SOURCES 2,262,938,352 1,040,235,607 250,743,377 236,429,109 174,833,413 172,257,610 193,777,073 194,662,163
Source of Funding
Unappropriated Subsequent Years
City of Virginia Beach, VirginiaFiscal Years 2008-09 through 2013-14 Capital Improvement Program
Means of Financing Summary
Fiscal Year 2009-10 4 - 20 Reference
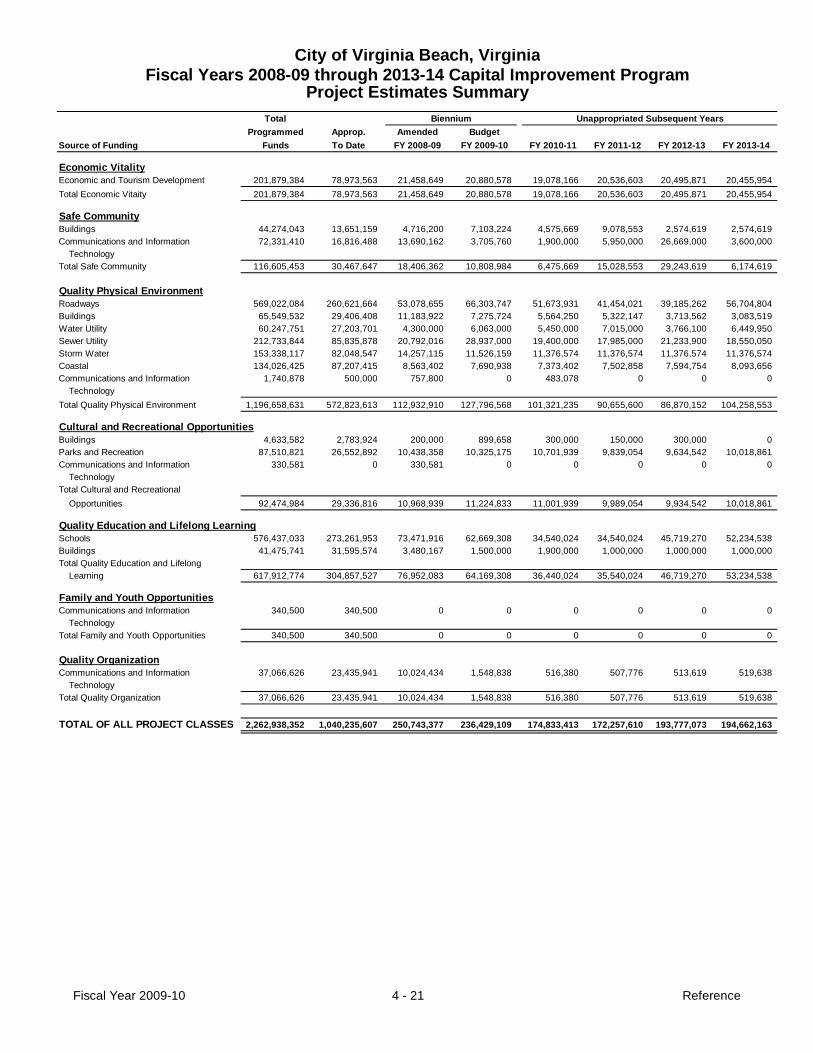
Total BienniumProgrammed Approp. Amended Budget
Funds To Date FY 2008-09 FY 2009-10 FY 2010-11 FY 2011-12 FY 2012-13 FY 2013-14
Economic VitalityEconomic and Tourism Development 201,879,384 78,973,563 21,458,649 20,880,578 19,078,166 20,536,603 20,495,871 20,455,954Total Economic Vitaity 201,879,384 78,973,563 21,458,649 20,880,578 19,078,166 20,536,603 20,495,871 20,455,954
Safe CommunityBuildings 44,274,043 13,651,159 4,716,200 7,103,224 4,575,669 9,078,553 2,574,619 2,574,619Communications and Information 72,331,410 16,816,488 13,690,162 3,705,760 1,900,000 5,950,000 26,669,000 3,600,000 TechnologyTotal Safe Community 116,605,453 30,467,647 18,406,362 10,808,984 6,475,669 15,028,553 29,243,619 6,174,619
Quality Physical EnvironmentRoadways 569,022,084 260,621,664 53,078,655 66,303,747 51,673,931 41,454,021 39,185,262 56,704,804Buildings 65,549,532 29,406,408 11,183,922 7,275,724 5,564,250 5,322,147 3,713,562 3,083,519Water Utility 60,247,751 27,203,701 4,300,000 6,063,000 5,450,000 7,015,000 3,766,100 6,449,950Sewer Utility 212,733,844 85,835,878 20,792,016 28,937,000 19,400,000 17,985,000 21,233,900 18,550,050Storm Water 153,338,117 82,048,547 14,257,115 11,526,159 11,376,574 11,376,574 11,376,574 11,376,574Coastal 134,026,425 87,207,415 8,563,402 7,690,938 7,373,402 7,502,858 7,594,754 8,093,656Communications and Information 1,740,878 500,000 757,800 0 483,078 0 0 0 TechnologyTotal Quality Physical Environment 1,196,658,631 572,823,613 112,932,910 127,796,568 101,321,235 90,655,600 86,870,152 104,258,553
Cultural and Recreational OpportunitiesBuildings 4,633,582 2,783,924 200,000 899,658 300,000 150,000 300,000 0Parks and Recreation 87,510,821 26,552,892 10,438,358 10,325,175 10,701,939 9,839,054 9,634,542 10,018,861Communications and Information 330,581 0 330,581 0 0 0 0 0 TechnologyTotal Cultural and Recreational Opportunities 92,474,984 29,336,816 10,968,939 11,224,833 11,001,939 9,989,054 9,934,542 10,018,861
Quality Education and Lifelong LearningSchools 576,437,033 273,261,953 73,471,916 62,669,308 34,540,024 34,540,024 45,719,270 52,234,538Buildings 41,475,741 31,595,574 3,480,167 1,500,000 1,900,000 1,000,000 1,000,000 1,000,000Total Quality Education and Lifelong Learning 617,912,774 304,857,527 76,952,083 64,169,308 36,440,024 35,540,024 46,719,270 53,234,538
Family and Youth OpportunitiesCommunications and Information 340,500 340,500 0 0 0 0 0 0 TechnologyTotal Family and Youth Opportunities 340,500 340,500 0 0 0 0 0 0
Quality OrganizationCommunications and Information 37,066,626 23,435,941 10,024,434 1,548,838 516,380 507,776 513,619 519,638 TechnologyTotal Quality Organization 37,066,626 23,435,941 10,024,434 1,548,838 516,380 507,776 513,619 519,638
TOTAL OF ALL PROJECT CLASSES 2,262,938,352 1,040,235,607 250,743,377 236,429,109 174,833,413 172,257,610 193,777,073 194,662,163
Source of Funding
City of Virginia Beach, VirginiaFiscal Years 2008-09 through 2013-14 Capital Improvement Program
Project Estimates SummaryUnappropriated Subsequent Years
Fiscal Year 2009-10 4 - 21 Reference

BienniumYear 1 Year 2 Year 3 Year 4 Year 5 Year 6
FY 2008-09 FY 2009-10 FY 2010-11 FY 2011-12 FY 2012-13 FY 2013-14 Total
ADDITIONAL ANNUAL BONDING LIMITS 10,000,000 10,000,000 10,000,000 10,000,000 10,000,000 10,000,000 60,000,000
Add:CALENDAR YEAR PRINCIPAL RETIREMENT
PRIOR BOND ISSUES AS OF (June 30, 2008) 58,728,108 52,656,529 54,200,952 48,061,826 45,708,407 41,031,086 300,386,908
NEW BOND ISSUES Amount Rate
2008 Bonds (Nov. 2008) 6,350,705 4.16% 0 287,963 288,773 293,342 293,836 293,900 1,457,8142009 Bonds (Spring 2009) 66,400,000 5.50% 0 0 3,320,000 3,320,000 3,320,000 3,320,000 13,280,0002010 Bonds (Spring 2010) 75,400,000 5.50% 0 0 0 3,770,000 3,770,000 3,770,000 11,310,0002011 Bonds (Spring 2011) 74,500,000 5.50% 0 0 0 0 3,725,000 3,725,000 7,450,0002012 Bonds (Spring 2012) 66,700,000 5.50% 0 0 0 0 0 3,335,000 3,335,0002013 Bonds (Spring 2013) 63,500,000 5.50% 0 0 0 0 0 0 0
TOTAL ESTIMATED PRINCIPAL RETIREMENT 58,728,108 52,944,492 57,809,725 55,445,168 56,817,243 55,474,986 337,219,722
TOTAL BONDING LIMITS 68,728,108 62,944,492 67,809,725 65,445,168 66,817,243 65,474,986 397,219,722
TOTAL BONDING LIMITS - ROUNDED 68,700,000 62,900,000 67,800,000 65,400,000 66,800,000 65,400,000 397,000,000
CHARTER BONDS ALLOCATED 64,489,005 66,902,805 68,014,722 65,356,381 61,712,656 69,952,550 396,428,119
TOTAL ANNUAL UNALLOCATED BOND AUTHORITY 4,210,995 (4,002,805) (214,722) 43,619 5,087,344 (4,552,550) 571,881
PRIOR YEAR UNALLOCATED BOND AUTHORITY 366,009 0 0 0 0 0 366,009
CUMULATIVE UNALLOCATED BOND AUTHORITY 4,577,004 574,199 359,477 403,096 5,490,440 937,890
Note: Retirement of bonds assumes the issuance of bonds with 20-year, level principal retirement with the principal payments starting one year from the date ofissue. Annual bond limits are on a calendar basis. The fiscal year (FY) identified in the heading represents the period in which they are traditionally appropriated.
Bond Issues
City of Virginia Beach, VirginiaFiscal Years 2008-09 through 2013-14 Capital Improvement Program
Computation of Bonding Limits
Fiscal Year 2009-10 4 - 22 Reference
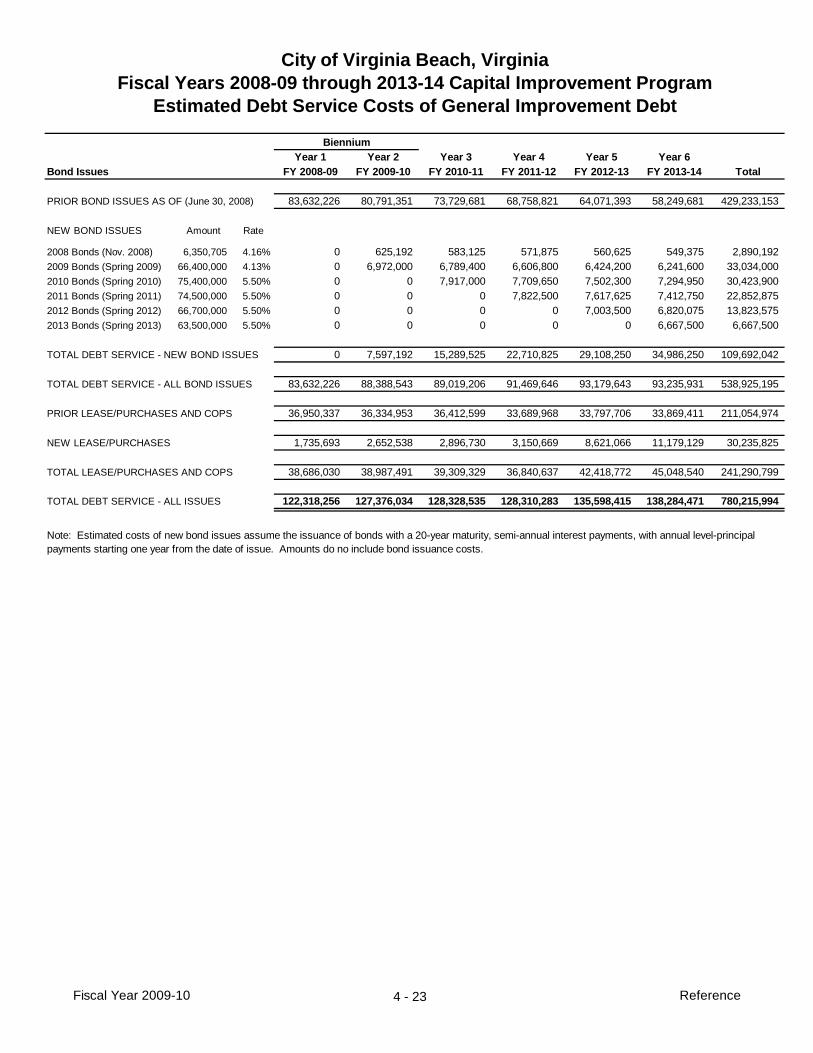
BienniumYear 1 Year 2 Year 3 Year 4 Year 5 Year 6
FY 2008-09 FY 2009-10 FY 2010-11 FY 2011-12 FY 2012-13 FY 2013-14 Total
PRIOR BOND ISSUES AS OF (June 30, 2008) 83,632,226 80,791,351 73,729,681 68,758,821 64,071,393 58,249,681 429,233,153
NEW BOND ISSUES Amount Rate
2008 Bonds (Nov. 2008) 6,350,705 4.16% 0 625,192 583,125 571,875 560,625 549,375 2,890,1922009 Bonds (Spring 2009) 66,400,000 4.13% 0 6,972,000 6,789,400 6,606,800 6,424,200 6,241,600 33,034,0002010 Bonds (Spring 2010) 75,400,000 5.50% 0 0 7,917,000 7,709,650 7,502,300 7,294,950 30,423,9002011 Bonds (Spring 2011) 74,500,000 5.50% 0 0 0 7,822,500 7,617,625 7,412,750 22,852,8752012 Bonds (Spring 2012) 66,700,000 5.50% 0 0 0 0 7,003,500 6,820,075 13,823,5752013 Bonds (Spring 2013) 63,500,000 5.50% 0 0 0 0 0 6,667,500 6,667,500
TOTAL DEBT SERVICE - NEW BOND ISSUES 0 7,597,192 15,289,525 22,710,825 29,108,250 34,986,250 109,692,042
TOTAL DEBT SERVICE - ALL BOND ISSUES 83,632,226 88,388,543 89,019,206 91,469,646 93,179,643 93,235,931 538,925,195
PRIOR LEASE/PURCHASES AND COPS 36,950,337 36,334,953 36,412,599 33,689,968 33,797,706 33,869,411 211,054,974
NEW LEASE/PURCHASES 1,735,693 2,652,538 2,896,730 3,150,669 8,621,066 11,179,129 30,235,825
TOTAL LEASE/PURCHASES AND COPS 38,686,030 38,987,491 39,309,329 36,840,637 42,418,772 45,048,540 241,290,799
TOTAL DEBT SERVICE - ALL ISSUES 122,318,256 127,376,034 128,328,535 128,310,283 135,598,415 138,284,471 780,215,994
Note: Estimated costs of new bond issues assume the issuance of bonds with a 20-year maturity, semi-annual interest payments, with annual level-principal payments starting one year from the date of issue. Amounts do no include bond issuance costs.
City of Virginia Beach, VirginiaFiscal Years 2008-09 through 2013-14 Capital Improvement Program
Estimated Debt Service Costs of General Improvement Debt
Bond Issues
Fiscal Year 2009-10 4 - 23 Reference

BienniumYear 1 Year 2 Year 3 Year 4 Year 5 Year 6
FY 2008-09 FY 2009-10 FY 2010-11 FY 2011-12 FY 2012-13 FY 2013-14 Total
PRIOR BOND ISSUES AS OF (June 30, 2008) 10,636,325 10,719,740 10,582,259 10,587,766 10,556,278 10,624,616 63,706,984
NEW BOND ISSUES Amount Rate
2010 Bonds (Fall 2009) 30,000,000 5.50% 0 825,000 2,220,352 2,219,465 2,218,529 2,217,542 9,700,8882012 Bonds (Fall 2011) 30,000,000 5.50% 0 0 0 825,000 2,220,352 2,219,465 5,264,8172014 Bonds (Fall 2013) 30,000,000 5.50% 0 0 0 0 0 825,000 825,000TOTAL ESTIMATED PRINCIPAL RETIREMENT 0 825,000 2,220,352 3,044,465 4,438,881 5,262,007 15,790,705
TOTAL DEBT SERVICE - WATER AND SEWER BONDS 10,636,325 11,544,740 12,802,611 13,632,231 14,995,159 15,886,623 79,497,689
Note: Estimated costs assume the issuance of bonds with a 25-year maturity, semi-annual interest payments, with annual level-debt payments. Amounts do not include bond issuance costs or debt reserves.
City of Virginia Beach, VirginiaFiscal Years 2008-09 through 2013-14 Capital Improvement Program
Estimated Debt Service Costs of Water and Sewer Bond Issues
Bond Issues
Fiscal Year 2009-10 4 - 24 Reference

FY 2009-10 Biennial Capital Improvement ProgramCompleted Project Listing
Projects by Business Area Amount
Cultural & Recreational OpportunitiesBuildings3.073 Colonial Education Center Construction & Land Acquisition $ 1,095,100 This project provides for the acquisition of two parcels (4401 & 4409 Wishart Road) adjacent to theLynnhaven House including the Colonial Education Center, completion of sitework, construction ofexhibits, and other improvements to the Lynnhaven House.
3.322 Virginia Aquarium Original Exhibit Gallery Renovation 21,840,188 The project will renovate the Aquarium's original exhibit gallery, reconfigure the main lobby andAquarium store, upgrade and renovate the original restroom areas, and add a family restroom. Therenovation will convert existing exhibits into new live animal habitats, interactive scientific exhibits, a livecoral aquarium, and add a new 120,000-gallon Red Sea aquarium as the highlight of the renovation.
Communications and Information Technology3.089 CIT - P&R - Field Enabling HW for Hansen End Users 260,821 To provide access to the Hansen application and City standard applications (Outlook, Beachnet, Citypolicies, Word, Excel, etc.), the hardware and software requested in this project will be deployed in theLandscape Management Division. This project would disperse workstations and semi-rugged laptops.Some laptops will be equipped with a wireless capability enabling real time reporting. Others will be usedin a store forward capacity. They will be synchronized with office applications.
Total Cultural & Recreational Opportunities $ 23,196,109
Economic VitalityEconomic and Tourism Development9.016 Town Center Infrastructure $ 8,684,829 This project provides part of the Infrastructure costs and site acquisition for Phases I, II, and III for theTown Center project. Infrastructure will include streets, streetscapes, traffic signals, turn lanes, a plazawith a fountain, landscaping, other supporting infrastructure, and public plaza. Negotiations for public-private agreements for Phase IV of construction are underway. Streetscape improvements and utilityrelocation are required infrastructure around Block 2 for Phase IV.
Total Economic Vitality $ 8,684,829
Quality OrganizationCommunications and Information Technology3.077 CIT - Data Center Sustainability and Risk Reduction $ 250,000 This CIT will examine potential Building 2 Data Center facility improvements. In conjunction with a FY2007-08 environmental study, a strategic and tactical plan will be developed to identify neededreplacement/modification costs and timelines. It will provide immediate, 5 year, and 10 yearrecommendations.
3.078 CIT - GIS Web Infrastructure Upgrade 150,000 The project's purpose is to replace core GIS e-mapping Web service with a GIS Web mapping platform.It includes providing required training and services. This will allow citizens, businesses, and visitors CityGIS access via the Internet; moreover it will facilitate internal City user accessibility.
Total Quality Organization $ 400,000
Fiscal Year 2009-10 4 - 25 Reference

FY 2009-10 Biennial Capital Improvement ProgramCompleted Project Listing
Projects by Business Area Amount
Quality Physical EnvironmentBuildings3.144 Municipal Center Parking - Courts $ 325,000 This project will provide a parking lot containing approximately 116 parking spaces at the corner ofGeorge Mason Drive and Nimmo Parkway to serve the Judicial Center.
Sewer Utility6.081 Laskin Road Phase II & Gateway Improvements 1,086,735 This project provides funding to improve existing gravity sewer facilities on Laskin Road from OrioleDrive to Atlantic Avenue. Approximately, 5,760 feet of 8 inches to 24 inches gravity sewer lines will betelevised to identify deficiencies in the system. Approximately 5,170 feet of gravity sanitary sewer will bereplaced or lined.
Storm Water7.031 Kempsville Greens GC Community Stormwater Bank Stabilization 740,000 Eleven lakes totaling approximately 16 acres are located on the Kempsville Greens Municipal GolfCourse. The area of the lakes that provide for Storm Water Management of the surrounding communityis approximately 4 acres. The lakes also provide for Storm Water Management for the golf course, forirrigation of the golf course, and served as "borrow" sites for the development of the golf course.
Total Quality Physical Environment $ 2,151,735
Safe CommunityBuildings3.058 EMS Great Neck Rescue Station Site Improvements $ 750,000 This project provides up to $750,000 to reimburse for site improvement costs for a new Rescue Stationto be built on City property on Bayne Drive (Great Neck Rescue Station) that will be conveyed at nocharge to the Rescue Squad. The station will be owned by the Virginia Beach Volunteeer Rescue Squadand constructed by them.
3.229 Police Training Facility 4,960,000 This project is for the construction of various public safety training and support facilities at the CreedsPolice Training facility. Improvements include re-constructing an existing vehicle driving track;construction of a new 5,000 square feet administration building; expansion of the existing simulationtraining building area and various site improvements.
3.299 Sheriff's Workforce/Release Facility-Design & Site Selection 600,000 This project would fund the preliminary design and site selection of a facility to house work releaseinmates as well as provide a facility for the Sheriff's Workforce to work out of. This project would includeprogramming, design, site selection and other needs to relocate both the workforce from its temporarylocation and work release from leased space. This project does not include site acquisition.
Total Safe Community $ 6,310,000
Total All Business Areas $ 40,742,673
Fiscal Year 2009-10 4 - 26 Reference
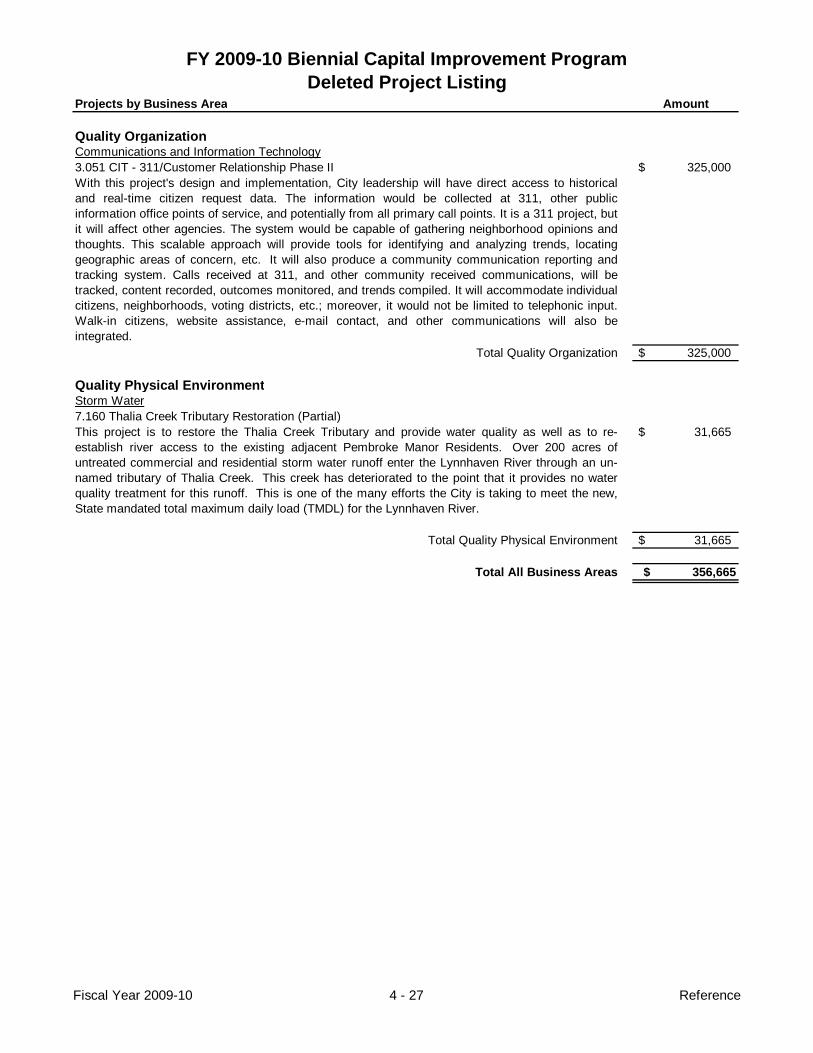
FY 2009-10 Biennial Capital Improvement ProgramDeleted Project Listing
Projects by Business Area Amount
Quality OrganizationCommunications and Information Technology3.051 CIT - 311/Customer Relationship Phase II $ 325,000 With this project's design and implementation, City leadership will have direct access to historicaland real-time citizen request data. The information would be collected at 311, other publicinformation office points of service, and potentially from all primary call points. It is a 311 project, butit will affect other agencies. The system would be capable of gathering neighborhood opinions andthoughts. This scalable approach will provide tools for identifying and analyzing trends, locatinggeographic areas of concern, etc. It will also produce a community communication reporting andtracking system. Calls received at 311, and other community received communications, will betracked, content recorded, outcomes monitored, and trends compiled. It will accommodate individualcitizens, neighborhoods, voting districts, etc.; moreover, it would not be limited to telephonic input.Walk-in citizens, website assistance, e-mail contact, and other communications will also beintegrated.
Total Quality Organization $ 325,000
Quality Physical EnvironmentStorm Water7.160 Thalia Creek Tributary Restoration (Partial)This project is to restore the Thalia Creek Tributary and provide water quality as well as to re-establish river access to the existing adjacent Pembroke Manor Residents. Over 200 acres ofuntreated commercial and residential storm water runoff enter the Lynnhaven River through an un-named tributary of Thalia Creek. This creek has deteriorated to the point that it provides no waterquality treatment for this runoff. This is one of the many efforts the City is taking to meet the new,State mandated total maximum daily load (TMDL) for the Lynnhaven River.
$ 31,665
Total Quality Physical Environment $ 31,665
Total All Business Areas $ 356,665
Fiscal Year 2009-10 4 - 27 Reference

FY 2009-10 Biennial Capital Improvement ProgramRequested But Not Funded Project Listing
Projects by Business Area Estimated Cost
Cultural & Recreational OpportunitiesParks and Recreation4.071 Williams Farm Community Recreation Center $ 30,300,000 The Williams Farm Community Recreation Center is proposed to be a 71,000 square foot community recreation center including, gyms; multi-purpose recreation pool; indoor track, classrooms; fitness facilities; administrative office; outdoor recreation court; and, an outdoor skate park. In addition the project includes pedestrian and bicycle infrastructure improvements in a two mile radius of the facility to ensure safe and convenient access for pedestrians and bicyclists. The center is to be located on approximately 15 acres of City property known as Williams Farm and is adjacent to three elementary schools, the Williams Farm Park and Bayside Middle School. The project preliminary design and space programming has been the result of approximately one year study and community involvement process which developed and recommended the design for the project. The project is planned to be designed and developed through a design build process. The preliminary design for the project is included in the “Williams Farm Community Recreation Center Design – Parks and Recreation capital project #4-072”.
Total Cultural & Recreational Opportunities $ 30,300,000
Economic VitalityEconomic and Tourism Development9.035 Town Center Pedestrian Bridge $ 3,550,000 This project provides design and construction funds for a pedestrian walkway from the Pembroke Mall to the Town Center.
Total Economic Vitality $ 3,550,000
Quality Education and Lifelong LearningBuildings3.145 Records Center Shelving Expansion & Restroom Addition $ 85,763 This project provides additional storage to the City's Records Management Center on Leroy Driveusing a second level of shelving that will accommodate an additional 4,230 boxes. Also, this projectwould construct a restroom at the Records Center for staff.
Total Quality Education and Lifelong Learning $ 85,763
Quality OrganizationCommunications and Information Technology3.149 CIT - Museums - Virginia Aquarium Ticketing System $ 250,000 This project would fund an analysis and would lead to implementation of a new ticketing system.Potential use could also include historic homes.
Total Quality Organization $ 250,000
Quality Physical EnvironmentWater5.710 19th Street Corridor Water Improvements $ 275,000 This project provides funding for design and construction of approximately 500 feet of 24" water mainalong 19th Street. Construction will be coordinated with Economic Vitality capital project #9-036.
Total Quality Physical Environment $ 275,000
Total All Business Areas $ 34,460,763
Fiscal Year 2009-10 4 - 28 Reference