city of universitv park-texas 1 .a-€¦ · · 2015-01-29i city of universitv park-texas 1 .a- @...
TRANSCRIPT

i City of Universitv Park-Texas 1 .A- @ &!A rd a
-@77 bt:d 1' i.
Comprehensive ~ n n i l l
theyear Ended September 30,20D

CITY OF UNIVERSITY PARK, TEXAS
COMPREHENSIVE ANNUAL FINANCIAL REPORT
For the Year Ended September 30, 2012
Issued by
Department of Finance

Comprehensive Annual Financial Report
For the Fiscal Year Ended September 30, 2012
TABLE OF CONTENTS
Page
INTRODUCTORY SECTION
Letter of Transmittal i-iii
GFOA Certificate of Achievement v
Map of University Park and Dallas County Area vi
Organization Chart vii
Principal Officials viii
FINANCIAL SECTION
Independent Auditor's Report 1-2
Management's Discussion and Analysis 4-16
Basic Financial Statements:
Government-wide Financial Statements
Statement of Net Assets 18
Statement of Activities 19
Fund Financial Statements:
Balance Sheet - Governmental Funds 20
Reconciliation of the Governmental Fund Balance Sheet to the Statement of Net Assets 21
Statement of Revenues, Expenditures, and Changes in Fund Balances - Governmental Funds 22
Reconciliation of the Statement of Revenues, Expenditures, and Changes in
Fund Balances of Governmental Funds to the Statement of Activities 23
Statement of Net Assets - Proprietary Funds 24
Statement of Revenues, Expenses, and Changes in Fund Net Assets - Proprietary Funds 25
Statement of Cash Flows - Proprietary Funds 26
` Statement of Fiduciary Net Assets 27
Statement of Changes in Fiduciary Net Assets 28
Notes to Financial Statements 29-54
Required Supplementary Information:
Texas Municipal Retirement System Schedule of Funding Progress 56
University Park Firemen's Relief and Retirement Fund Schedule of Funding Progress 57
Retiree Health Care Plan 58
Budgetary Comparison Schedule - General Fund 59
Notes to Required Supplementary Information 60
Other Supplementary Information:
Combining and Individual Fund Statements and Schedules:
Combining Balance Sheet - Nonmajor Governmental Funds 64
Combining Statement of Revenues, Expenditures, and Changes in Fund Balances -
Nonmajor Governmental Funds 65
Combining Statement of Net Assets - Internal Service Funds 68
Combining Statement of Revenues, Expenses, and Changes in Fund Net Assets -
Internal Service Funds 69
Combining Statement of Cash Flows - Internal Service Funds 70
CITY OF UNIVERSITY PARK, TEXAS

STATISTICAL SECTION (Unaudited)
Net Assets by Component 73
Changes in Net Assets 74-75
Fund Balances, Governmental Funds 76
Changes in Fund Balances, Governmental Funds 77
Assessed Value and Actual Value of Taxable Property 78
Direct and Overlapping Property Tax Rates 79
Principal Property Tax Payers 80
Property Tax Levies and Collections 81
Ratio of Outstanding Debt 82
Ratio of Net General Bonded Debt Outstanding 83
Direct and Overlapping Governmental Activities Debt 84
Pledged-Revenue Coverage 85
Legal Debt Margin Information 86
Demograhic and Economic Statistics 87
Principal Employers 88
Full-Time Equivalent City Government Employees 89
Operating Indicators by Function/Program 90
Capital Asset Statistics by Function/Program 91


iv

v

vi

vii

viii
First Term Professional
Official and Title Elected Expires Background
Richard W. Davis, Mayor 2010 2014 Lawyer
Robert H. Clark, Mayor Pro Tempore 2008 2014 Architect
Robert Begert, Council Member 2010 2014 Lawyer
Thomas Stewart, Council Member 2010 2014 General Contractor
Dawn Moore, Council Member 2012 2014 Lawyer
Name Year Appointed
Robert Livingston City Manager 1991
Robert L. Dillard, III City Attorney 1987
James P. Barklow, Jr. Municipal Judge 1987
Kent R. Austin Director of Finance 1997
Thomas W. Tvardzik Controller 2002
CITY OF UNIVERSITY PARK, TEXAS
Elected Officials
Appointed Officials
Position
Financial Advisor
First Southwest Company, Dallas, Texas
Certified Public Accountants
Weaver and Tidwell, L.L.P., Dallas, Texas
Bond Counsel
McCall, Parkhurst & Horton, Dallas, Texas

1
INDEPENDENT AUDITOR’S REPORT
Honorable Mayor and Members of the City Council of the City of University Park University Park, Texas We have audited the accompanying financial statements of the governmental activities, business-type activities, the discretely presented components units, each major fund, and the aggregate remaining fund information of the City of University Park (the City) as of and for the year ended September 30, 2012, which collectively comprise the City’s basic financial statements as listed in the table of contents. These financial statements are the responsibility of the City's administration. Our responsibility is to express an opinion on these basic financial statements based on our audit. We conducted our audit in accordance with auditing standards generally accepted in the United States of America. Those standards require that we plan and perform the audit to obtain reasonable assurance about whether the basic financial statements are free of material misstatement. An audit includes examining, on a test basis, evidence supporting the amounts and disclosures in the basic financial statements. An audit also includes assessing the accounting principles used and significant estimates made by management, as well as evaluating the overall financial statement presentation. We believe that our audit provides a reasonable basis for our opinion. In our opinion, the financial statements referred to above present fairly, in all material respects, the respective financial position of the governmental activities, business-type activities, the discretely presented components units, each major fund, and the aggregate remaining fund information of the City as of September 30, 2012, and the respective changes in financial position and, where applicable, the cash flows thereof for the year then ended in conformity with accounting principles generally accepted in the United States of America. Accounting principles generally accepted in the United States of America require Management’s Discussion and Analysis, Texas Municipal Retirement System Schedule of Funding Progress, the University Park Firefighters’ Relief and Retirement Fund Schedule of Funding Progress, Retiree Health Care Plan, and the Budgetary Comparison Schedule for the General Fund be presented to supplement the basic financial statements. Such information, although not a part of the basic financial statements, is required by the Governmental Accounting Standards Board, who considers it to be an essential part of financial reporting for placing the basic financial statements in an appropriate operational, economic, or historical context. We have applied certain limited procedures to the required supplementary information in accordance with auditing standards generally accepted in the United States of America, which consisted of inquiries of management about the methods of preparing the information and comparing the information for consistency with management’s responses to our inquiries, the basic financial statements, and other knowledge we obtained during our audit of the basic financial statements. We do not express an opinion or provide any assurance on the information because the limited procedures do not provide us with sufficient evidence to express an opinion or provide any assurance.

City of University Park Page 2
2
Our audit was conducted for the purpose of forming opinions on the financial statements that collectively comprise the City’s basic financial statements. The introductory section, combining and individual fund financial statements and schedules, the statistical section, and the other supplementary information as listed in the table of contents are presented for purposes of additional analysis and are not a required part of the financial statements. The combining and individual fund financial statements and schedules and the other supplementary information are the responsibility of management and were derived from and relate directly to the underlying accounting and other records used to prepare the financial statements. The information has been subjected to the auditing procedures applied in the audit of the financial statements and certain additional procedures, including comparing and reconciling such information directly to the underlying accounting and other records used to prepare the financial statements or to the financial statements themselves, and other additional procedures in accordance with auditing standards generally accepted in the United States of America. In our opinion, the information is fairly stated in all material respects in relation to the financial statements as a whole. The introductory and statistical sections have not been subjected to the auditing procedures applied in the audit of the basic financial statements and, accordingly, we do not express an opinion or provide any assurance on them.
WEAVER AND TIDWELL, L.L.P. Dallas, Texas April 1, 2013

3
MANAGEMENT’S DISCUSSION AND ANALYSIS

4

CITY OF UNIVERSITY PARK, TEXAS Management’s Discussion and Analysis (MD&A)
September 30, 2012
5
Introduction
As management of the City of University Park, we offer readers of these financial statements this narrative overview and analysis of the City’s financial activities for the fiscal year ended September 30, 2012. We encourage readers to consider the information presented here in conjunction with additional information that we have furnished in our letter of transmittal, which can be found on pages 1-3 of this report.
Financial Highlights
The assets of the City exceeded its liabilities at the close of the most recent fiscal year by
$164,442,855 (net assets). Of this amount, $52,445,925 (unrestricted net assets) may be used to meet the government's ongoing obligations to citizens and creditors.
The government's total net assets increased by $3,119,293, a 2% rise over the prior year.
At the close of the 2012 fiscal year, the City’s governmental funds reported combined ending fund balances of $38,917,010, an increase of $774,568 compared with the prior year. Of the total amount, all but $502,835 is available for spending at the government's discretion (spendable fund balance).
At the end of the 2012 fiscal year, spendable fund balance for the general fund was $27,589,304, or 101 percent of total general fund expenditures (including transfers out). Of the $27,589,304, however, $20,750,202 is designated for other purposes, namely: Emergency Reserve $2,500,000; SMU PILOT (payment in lieu of taxes) $2,375,000; and SMU Land Sale Reserve $15,875,202. The remaining unassigned fund balance is $6,194,370.
The City remains free of external debt, having retired its outstanding bonds in 2002. Overview of the Financial Statements This discussion and analysis serves as an introduction to the City of University Park’s basic financial statements, which have three components: 1) government-wide financial statements, 2) fund financial statements, and 3) notes to the financial statements. This report also contains other supplementary information in addition to the basic financial statements themselves. Government-wide financial statements. The government-wide financial statements provide readers with a broad overview of the City of University Park’s finances, in a manner similar to a private-sector business. The statement of net assets presents information on all of the City’s assets and liabilities, with the difference between the two reported as net assets. Over time, increases or decreases in net assets may serve as a useful indicator of whether the financial position of the City is improving or deteriorating. The statement of activities presents information showing how the government's net assets changed during the most recent fiscal year. All changes in net assets are reported as soon as the underlying event giving rise to the change occurs, regardless of the timing of related cash flows. Thus, revenues and expenses are reported in this statement for some items that will only result in cash flows in future fiscal periods (e.g., uncollected taxes and earned but unused vacation leave). Both of the government-wide financial statements distinguish functions of the City of University Park that are principally supported by taxes and intergovernmental revenues (governmental activities) from other functions that are intended to recover all or most of their costs through user fees and charges (business-type activities). The City’s governmental activities include general government,

CITY OF UNIVERSITY PARK, TEXAS Management’s Discussion and Analysis (MD&A)
September 30, 2012
6
public safety, streets and traffic control, and parks. Business-type activities of the City include water distribution, wastewater collection, and solid waste collection. The government-wide financial statements include not only the City of University Park itself (known as the primary government), but also a legally separate higher education authority and a legally separate private, non-profit foundation for which the City is financially accountable. Financial information for these component units is reported separately from the financial information presented for the primary government itself. The University Park Civic Foundation although also legally separate, functions for all practical purposes as a department of the City of University Park, and therefore has been included as an integral part of the primary government. The government-wide financial statements can be found immediately following the MD&A in this report. Fund financial statements. A fund is a grouping of related accounts that is used to maintain control over resources that have been segregated for specific activities or objectives. The City of University Park, like other state and local governments, uses fund accounting to ensure and demonstrate compliance with finance-related legal requirements. All of the funds of the City can be divided into three categories: governmental funds, proprietary funds, and fiduciary funds. Governmental funds. Governmental funds are used to account for essentially the same functions reported as governmental activities in the government-wide financial statements. However, unlike the government-wide financial statements, governmental fund financial statements focus on near-term inflows and outflows of spendable resources as well as on balances of spendable resources available at the end of the fiscal year. Such information may be useful in evaluating a government's near-term financing requirements. Because the focus of governmental funds is narrower than that of the government-wide financial statements, it is useful to compare the information presented for governmental funds with similar information presented for governmental activities in the government-wide financial statements. By doing so, readers may better understand the long-term impact of the government's near-term financing decisions. Both the governmental fund balance sheet and the governmental fund statement of revenues, expenditures, and changes in fund balances provide a reconciliation to facilitate this comparison between governmental funds and governmental activities. The City of University Park maintains nine individual governmental funds, five of which were established during FY2012. Information is presented separately in the governmental funds balance sheet and in the governmental funds statement of revenues, expenditures, and changes in fund balances for the General Fund and the two Capital Projects Funds (one for the City’s capital improvements program, and a new one for construction finish-out of the new University Park Public Library), which are considered to be major funds. Individual fund data for the nonmajor gov-ernmental funds (University Park Civic Foundation, Court Security , Court Technology, Police Training/Education, Police Forfeiture, and Fire Training/Education) is provided in the form of combining statements elsewhere in this report. The City of University Park adopts an annual appropriated budget for its General Fund. A budgetary comparison statement has been provided for the General Fund to demonstrate compliance with this budget. The basic governmental fund financial statements can be found in this report following the government-wide financial statements. Proprietary funds. The City maintains two different types of proprietary funds. Enterprise funds are used to report the same functions presented as business-type activities in the government-wide financial statements. The City uses enterprise funds to account for its water and sewer operations and its solid waste operation. Internal service funds are an accounting device used to accumulate
CITY OF UNIVERSITY PARK, TEXAS Management’s Discussion and Analysis (MD&A)
September 30, 2012
7
and allocate costs internally among the City’s various functions. University Park uses internal service funds to account for its fleet of vehicles and self-insurance program. Because both of these services predominantly benefit governmental rather than business-type functions, they have been included within governmental activities in the government-wide financial statements. Proprietary funds provide the same type of information as the government -wide financial statements, only in more detail. The proprietary fund financial statements provide separate information for the water and sewer operations and solid waste operations, both of which are considered to be major funds of the City. The basic proprietary fund financial statements can be found in this report following the basic governmental fund financial statements. Fiduciary funds. Fiduciary funds are used to account for resources held for the benefit of parties outside the government. Fiduciary funds are not reflected in the government-wide financial statement because the resources of those funds are not available to support the City’s own programs. The accounting used for fiduciary funds is much like that used for proprietary funds. The basic fiduciary fund financial statements can be found in this report following the Proprietary Funds Combining Statement of Cash Flows. Notes to the financial statements. The notes provide additional information that is essential to a full understanding of the government-wide and fund financial statements. The notes can be found in this report following the Fiduciary Funds Statement of Changes in Fiduciary Net Assets. Other information. In addition to the basic financial statements and accompanying notes, this report also presents certain required supplementary information concerning the City’s progress in funding its obligation to provide pension benefits to its employees and certain budgetary information. Required supplementary information can be found following the notes section. The combining statements referred to earlier in connection with nonmajor governmental funds and internal service funds are presented immediately following the required supplementary information. Government-wide Financial Analysis As noted earlier, net assets may serve over time as a useful indicator of a government's financial position. For the City of University Park, assets exceeded liabilities by $164,442,855 as of September 30, 2012. The largest portion of the City’s net assets ($111,996,920, or 68 percent) reflects its investment in capital assets (e.g., land, buildings, improvements, and machinery and equipment), less any debt used to acquire those assets that is still outstanding. The City uses these capital assets to provide services to citizens; consequently, these assets are not available for future spending. The City has retired all outstanding debt and currently funds its capital assets on a pay-as-you-go basis.

CITY OF UNIVERSITY PARK, TEXAS Management’s Discussion and Analysis (MD&A)
September 30, 2012
8
CITY OF UNIVERSITY PARK’S NET ASSETS
The City has no restricted net assets. Unrestricted net assets may be used to meet the gov-ernment's ongoing obligations to citizens and creditors. At the end of fiscal 2012, the City is able to report positive balances in each category of net assets. The same situation was true last year. Analysis of the City’s Operations – The following table provides a summary of the City’s operations for the year ended September 30, 2012. Governmental activities increased the City’s net assets by $1,940,325 in 2012, and business-type activities by $1,178,967.
CITY OF UNIVERSITY PARK’S CHANGES IN NET ASSETS
Governmental activities. An improving economy and building permit revenues from large SMU projects helped boost net assets from governmental activities $1,940,326 in 2012. University Park’s landlocked, built-out status and predominantly residential tax base make it
2012 2011 Change 2012 2011 Change 2012 2011
Revenues:
Program Revenues:
Charges for services 5,775,817$ 5,259,447$ 516,370$ 16,484,538$ 17,337,711$ (853,173)$ 22,260,355$ 22,597,158$
General revenues
Property tax 15,484,579 15,928,388 (443,809) - - - 15,484,579 15,928,388
Sales tax 3,395,645 3,584,805 (189,160) - - - 3,395,645 3,584,805
Franchise fees 2,094,494 2,207,303 (112,809) - - - 2,094,494 2,207,303
Interest 188,888 208,533 (19,645) 3,241 2,738 503 192,129 211,271
Other 90,026 502,174 (412,148) 75,997 - 75,997 166,023 502,174
Contribution 32 34 (2) - - - 32 34
Donations 12,276 33,596 (21,320) - - - 12,276 33,596
Gain on sale of capital assets - - - - - - - -
Total revenues 27,041,757 27,724,280 (682,523) 16,563,776 17,340,449 (776,673) 43,605,533 45,064,729
Expenses:
General Government 4,643,566 3,405,642 1,237,924 - - - 4,643,566 3,405,642
Public Safety 12,198,719 12,173,113 25,606 - - - 12,198,719 12,173,113
Streets 1,829,907 1,755,084 74,823 - - - 1,829,907 1,755,084
Parks 3,418,159 3,330,332 87,827 - - - 3,418,159 3,330,332
Public Works 2,658,904 2,691,034 (32,130) - - - 2,658,904 2,691,034
Utilities - - - 13,146,550 12,795,748 350,802 13,146,550 12,795,748
Sanitation - - - 2,590,435 2,622,334 (31,899) 2,590,435 2,622,334
Total Expenses 24,749,255 23,355,205 1,394,050 15,736,985 15,418,082 318,903 40,486,240 38,773,287
Increase in net assets before transfers 2,292,502 4,369,075 (2,076,573) 826,791 1,922,367 (1,095,576) 3,119,293 6,291,442
Transfers (352,176) (352,176) - 352,176 352,176 - - -
Increase/(decrease) in net assets 1,940,326 4,016,899 (2,076,573) 1,178,967 2,274,543 (1,095,576) 3,119,293 6,291,442
Net Assets -- beginning 104,661,882 100,644,983$ 4,016,899 56,661,680 54,387,137 2,274,543 161,323,562 155,032,120
Net Assets -- ending 106,602,208$ 104,661,882$ 1,940,326$ 57,840,647$ 56,661,680$ 1,178,967$ 164,442,855$ 161,323,562$
Governmental activities Business-type activities Total
2012 2011 2012 2011 2012 2011
Current and other assets 49,189,102 $ 48,909,946 $
10,561,746 $ 11,034,128 $
59,750,848 $ 59,944,074 $
Capital assets 62,312,988
60,538,038 49,683,932
47,970,899 111,996,920 $
108,508,937 $
Total Assets 111,502,090 109,447,984
60,245,678 59,005,027
171,747,768 168,453,011
Current liabilities 1,541,825
1,664,782 1,875,260
1,824,655 3,417,085 $
3,489,437 $
Long-term liabilities 3,358,057 3,121,320
529,771 518,692
3,887,828 $ 3,640,012 $
Total Liabilities 4,899,882
4,786,102 2,405,031
2,343,347 7,304,913
7,129,449
Net Assets: Invested in capital assets 62,312,988
60,538,038 49,683,932
47,970,899 111,996,920 $
108,508,937 $
Unrestricted 44,289,220 44,123,844
8,156,715 8,690,781
52,445,935 $ 52,814,625 $
Total Net Assets 106,602,208 $
104,661,882 $ 57,840,647 $
56,661,680 $ 164,442,855 $
161,323,562 $
Governmental activities Business-type activities Total

CITY OF UNIVERSITY PARK, TEXAS Management’s Discussion and Analysis (MD&A)
September 30, 2012
9
reliant on property tax revenues. Any improvement in non-tax revenues or opportunity to restrain expenditures is welcome and relieves the reliance on the property tax. Below are notable governmental activities during the fiscal year:
Construction finish-out began on the future 17,500 square foot University Park Public Library. The $2,500,000 project is the result of a unique arrangement and will provide University Park with its first City library. In exchange for abandoning specific street rights-of-way to the owner of a new five-story “Class A” office building, the City received ownership of the building’s second floor (and meeting room space on the third) and a $50 per square foot finish-out allowance. In June 2012 the University Park City Council authorized the use of the $1,274,954 restricted Byrd Estate fund balance for the library project, and a separate Library Construction Fund was established to account for the project’s funding and expenditures. Project expenditures totaled $337,246 by the end of FY2012, with project expenditures expected to conclude by April 2013. The library itself opened in January 2013, with the City’s new Library Department beginning operations October 1, 2012, in an interim site.
As expected, building permit revenue from the SMU Sophomore Commons project boosted General Fund revenues. Of the $3,071,757 building permit revenue within the $5,775,817, “Charges for Services” category, fully $1,369,337 results from the Sophomore Commons project.
Homebuilding and non-SMU activity generated permit revenue of $1,139,152, comparable with $1,150,860 in FY2011.
The multi-year decline in interest earnings continued, falling from $208,533 in FY2011 to $160,677 in FY2012, a 23% drop. The target federal funds rate remained at 0-0.25% for the entire fiscal year. This rate correlates closely with local government investment pool and three-month T-bill rates. The City’s annual weighted average portfolio yield mirrored the earnings slide, falling from 0.465% to 0.388%. For the quarter ending September 30, 2012, the average portfolio yield was just 0.399%.
Sales tax and mixed beverage tax revenue decreased 5%, from $3,584,805 in FY2011 to $3,395,645 in FY2012. Of the FY2011 total, $313,553 results from sales tax recoveries. These recoveries represent amounts from sales within University Park that were wrongly remitted to surrounding cities but then recovered. The FY2011 catch-up payment and an FY2012 decline in mixed beverage tax, contributed to the comparative decrease.
Direct alarm revenue grew 3%, from $799,884 in FY2011 to $821,433 in FY2012. After many years of double-digit growth, direct alarm subscribership appears to be reaching a plateau, or at least a period of slower growth. Administered by the City’s Police Department, the program continues to enjoy popularity and success in the community. The additional revenue helps fund the Department’s communications operations, which includes the dispatchers who answer alarm calls from subscribers as well as 9-1-1 calls.
General governmental capital project expenditures during FY2012 totaled $2,708,222, versus $2,269,321 in FY2011. Major projects included: including: street asphalt overlay program, $814,265; Westwick pavement/drainage, $542,769; curb & gutter replacement, $293,193; and University Blvd. medians, $200,899.

CITY OF UNIVERSITY PARK, TEXAS Management’s Discussion and Analysis (MD&A)
September 30, 2012
10
Revenues by Source – Governmental Activities
Expense and Program Revenues – Governmental Activities
Charges for services21%
Contributions, donations, other0.4%
Interest1%
Franchise fees8%
Property taxes57%
Sales tax13%
$-
$2,000,000
$4,000,000
$6,000,000
$8,000,000
$10,000,000
$12,000,000
$14,000,000
General Government Public Safety Streets Parks Public Works
Expenses
Program revenues

CITY OF UNIVERSITY PARK, TEXAS Management’s Discussion and Analysis (MD&A)
September 30, 2012
11
Business-type activities. Net assets from business-type activities increased $1,178,967 in FY2012, compared with $2,274,543 in FY2011. FY2012 business-type activity highlights include:
Business-type capital project expenditures totaled $3,328,080, comparable to FY2011’s $3,593,599. The largest single project for the year was the Tulane/Bryn Mawr-Caruth (the names of the streets bounding the project) “mile per year” alley pavement and underground water and sewer lines replacement project, which totaled $2,270,417. Another major undertaking was the completion of the mile per year alley and utility replacement around Auburndale and Key streets ($851,407 in FY2012). A list of additional business-type projects is found in the “Construction in Progress” note in the Notes section of this document.
More typical summer temperatures and rainfall, unlike the record-breaking summer heat in 2011, resulted in a 10% decline in water consumption from 2.15 billion to 1.94 billion gallons. Water sales similarly declined 10%, from $9,469,989 to $8,566,050. The Dallas County Park Cities Municipal Utility District, University Park’s water provider, raised its wholesale rate just 0.7%, from $2.0142 to $2.0281 per thousand gallons. Wastewater treatment provider Dallas Water Utilities lowered its rate 5.6%.
Depreciation expense rose 13% to $1,644,727. In FY2012, $7,738,419 in capital projects became depreciable, versus $3,951,570 in FY2011.
As the charts below demonstrate, charges for services are nearly the sole revenue source for business-type activities. This is consistent with the nature of proprietary funds, which are designed to recover their costs through user fees rather than general revenues. Water and Sewer Fund revenues are driven by water consumption, which in turn is driven by weather and consumer habits. Sanitation revenues, by contrast, only increase noticeably when the City raises rates. Revenues by Source – Business-Type Activities
Charges for Services 99.5%
Interest and Other 0.5%

CITY OF UNIVERSITY PARK, TEXAS Management’s Discussion and Analysis (MD&A)
September 30, 2012
12
Expenses and Revenues – Business-Type Activities
Financial Analysis of the Government’s Funds As noted earlier, the City of University Park uses fund accounting to ensure and demonstrate compliance with finance-related legal requirements. This section will discuss major developments within the City’s governmental funds and proprietary funds. Governmental funds. The focus of the City’s governmental funds is to provide information on near-term inflows, outflows, and balances of spendable resources. Such information is useful in assessing the City’s financing requirements. FY2012 is the second year in which the City’s financial statements are presented in conformity with GASB Statement No. 54, “Fund Balance Reporting and Governmental Fund Type Definitions.” This statement changed the presentation of the fund balance section of governmental funds. Instead of classifying amounts as reserved or unreserved and designated or undesignated, the Statement uses the following categories:
Nonspendable fund balance—amounts that are not in a spendable form (such as inventory) or are required to be maintained intact (such as the corpus of an endowment fund)
Restricted fund balance—amounts constrained to specific purposes by their providers (such as grantors, bondholders, and higher levels of government), through constitutional provisions, or by enabling legislation
$-
$2,000,000
$4,000,000
$6,000,000
$8,000,000
$10,000,000
$12,000,000
$14,000,000
$16,000,000
Utilities Sanitation
Expenses
Program revenues

CITY OF UNIVERSITY PARK, TEXAS Management’s Discussion and Analysis (MD&A)
September 30, 2012
13
Committed fund balance—amounts constrained to specific purposes by a government itself, using its highest level of decision-making authority; to be reported as committed, amounts cannot be used for any other purpose unless the government takes the same highest-level action to remove or change the constraint
Assigned fund balance—amounts a government intends to use for a specific purpose; intent can be expressed by the governing body or by an official or body to which the governing body delegates the authority
Unassigned fund balance—amounts that are available for any purpose; these amounts are reported only in the general fund.
In particular, unassigned fund balance may serve as a useful measure of a government's net resources available for spending at the end of the fiscal year. As of the end of FY2012, the City’s nine governmental funds –the General Fund, two Capital Projects Funds, Police Forfeiture Fund, University Park Civic Foundation, and five new special revenue funds -- reported combined ending fund balances of $38,917,010, an increase of $774,568 compared to the prior year. Of the total, only $502,835, which represents fuel and supplies inventories, is not spendable. In June 2012 the City Council approved transfer of the City’s only restricted fund balance, the $1,274,954 Byrd Estate, to the Library Construction Fund (reported in the Capital Projects Fund column). The $20,750,202 reported as “Committed” is governed by resolutions the City Council approved in 2009. Committed funds cannot be expended without affirmative City Council action. The $11,469,603 in “Assigned” funds represents encumbrances (open purchase orders) and money intended for capital projects. Finally, the “Unassigned” balance of $6,194,370 meets and exceeds the City’s stated fund balance policy minimum, which is equal to 30 days of budgeted operating expenditures ($2,227,007). Fund balance in the Capital Projects Funds increased $836,945 during fiscal 2012 to a total of $11,300,120. The increase resulted from the transfer in of $1,274,954 from the Byrd Estate restricted fund balance for the new library. During FY2012, $337,245 was expended on the project. Fund balance for the University Park Civic Foundation (UPCF), reported as a non-major special revenue fund, decreased $6,423. The FY2012 UPCF statements report nine months instead of twelve, the result of changing the Foundation's fiscal year to match the City’s fiscal year. During the year the Foundation received donations totaling $12,276. Expenditure activities included one semester of the City employee children’s scholarship program ($12,000) and parks renovations ($6,708). The scholarship program made awards ranging from $500 to $1,000 per semester to 17 students attending college in Texas (15), Michigan (1), and Missouri (1). Proprietary funds. The City’s proprietary fund statements provide the same type of information found in the government-wide financial statements, but in more detail. Total net assets of the Water and Sewer Fund at the end of the year amounted to $49,386,126, and those for the Sanitation Fund totaled $1,552,156. Thanks to positive water sales, the Water and Sewer Fund gained $854,761, while steady operating costs contributed to the $295,433 gain for the Sanitation Fund. General Fund Budgetary Highlights. Two budget amendments during the fiscal year increased the expenditure budget by $766,958. As is the practice, the purpose of the first amendment was to bring forward open encumbrances (purchase orders) from FY2011. By adding their amount to the adopted FY2012 budget, purchases may be completed without exceeding the approved budget.

CITY OF UNIVERSITY PARK, TEXAS Management’s Discussion and Analysis (MD&A)
September 30, 2012
14
The second budget amendment, approved in September 2012, provided funding for a series of small scale items in the Community Development, Engineering, and Facilities Maintenance departments. As noted earlier, the fiscal year ended with the General Fund spendable, unassigned balance above the City’s established minimum level: $6,194,370 versus $2,227,007. In early FY2013, the City Council approved $7,644,732 in encumbrances carried forward from FY2012. Budget variances in the General Fund. Revenue totals in two General Fund categories varied significantly from the final budget:
Permits and licenses revenue finished the year 108% ahead of its $1,537,000 budget, totaling $3,192,446. As discussed earlier, of these amounts, building permit fees comprised $1,400,000 budget and $3,071,757 actual revenue. The variance results from the large projects on the SMU campus, such as the Sophomore Commons, parking garage, and dining hall, and from City management’s intentional practice of budgeting for less than expected permit revenues. This practice helps prevent future budgets from becoming dependent on nonrecurring revenue events.
“Other” revenue finished the year at 38% of its $1,185,077 budget, totaling $445,947. The Other revenue category is highly variable from year to year. For example, in FY2011, Other revenue totaled $2,280,049, versus its budget of $1,425,735, thanks to SMU’s purchase of City street rights of way for $1,282,884 and other transactions.. During FY2012 no major transactions occurred to boost the category’s revenue total.
Among General Fund expenditures, only the Streets category had a negative variance. Expenditures totaled $1,780,280, a $29,939 (1.7%) overage from the amended $1,750,341 budget. Capital assets. The City’s investment in capital assets for its governmental and business type activities as of September 30, 2012, amounts to $111,996,919 (net of accumulated depreciation). This investment in capital assets includes land, buildings, improvements, machinery and equipment, infrastructure, and construction in progress. Capital assets increased by $3,487,984, led by business-type improvements (the completion of two large mile-per-year utility replacement projects). Governmental improvements included completion of the $1,117,445 asphalt overlay program and $618,790 fire training tower.
CAPITAL ASSETS AT YEAR-END NET OF ACCUMULATED DEPRECIATION
Additional information on the City’s capital assets can be found in Note “E” in the Notes section of this report.
2012 2011 2012 2011 2012 2011
Land 7,041,359$ 7,041,359$ 108,758$ 108,758$ 7,150,117$ 7,150,117$
Construction in progress 1,341,276 2,030,008 2,559,483 6,969,822 3,900,759 8,999,830
Buildings 14,507,282 14,928,684 - - 14,507,282 14,928,684
Improvements 23,186,597 20,974,738 46,782,762 40,664,076 69,969,359 61,638,814
Equipment 6,301,228 5,306,221 232,930 228,241 6,534,158 5,534,462
Infrastructure 9,935,244 10,257,028 - - 9,935,244 10,257,028
Total Capital Assets 62,312,986$ 60,538,038$ 49,683,933$ 47,970,897$ 111,996,919$ 108,508,935$
Governmental activities Business-type activities Totals

CITY OF UNIVERSITY PARK, TEXAS Management’s Discussion and Analysis (MD&A)
September 30, 2012
15
Long-term debt. At the end of fiscal year 2012, the City of University Park had no bonded debt outstanding. In June 2002 the City made its final debt service payment on the Series 1993 General Obligation Refunding Bonds. The City has no plans to issue new debt. Economic Factors and Next Year's Budgets and Rates For FY2013, the following economic factors are noteworthy:
After annual declines of 2.4% and 4.5%, the appraised value of the City’s taxable base increased, by just 0.35%, thanks to new construction. Existing property values declined very slightly--the average appraised value of a single-family home in University Park fell $476, from $1,093,015 to $1,092,539 before exemptions. The FY2013 budget maintained the same property tax rate, $0.27845 per $100, as In FY2012 and FY2011. Early indications suggest that property values will rise slightly in University Park in 2013.
The new University Park Public Library became a City department on October 1, 2012. The University Park Friends of the Library, a non-profit organization that formerly operated the public library, have pledged to contribute $300,000 of the Library’s $600,000 annual budget.
Retail water rates for FY2013 were unchanged, although a mid-year rate change is anticipated upon conclusion of a formal water and sewer rate study.
The George W. Bush Presidential Center, located in the southeast corner of the city adjacent to the SMU campus, is scheduled to open in April 2013.
In preparing its fiscal year 2013 budget, City officials once again avoided significant new expenditures and looked for ways to tighten existing ones. A 3% pay raise was included in the budget, as were three new full-time positions for the new Library. Requests for Information This financial report is designed to provide a general overview of the City of University Park’s finances for all those with an interest in the government's finances. Readers having questions about any of the information in this report or needing additional information should contact Controller, City of University Park, 3800 University Blvd., University Park, TX 75205, call 214-987-5326, or email [email protected].
(This area intentionally left blank.)

16

17
BASIC FINANCIAL STATEMENTS

18
CITY OF UNIVERSITY PARK, TEXASStatement of Net Assets
September 30, 2012
Primary Government Component Units
Governmental
Activities
Business-type
ActivitiesTotal
Southwest
Higher
Education
Authority
Texas
Higher
Education
Authority
ASSETS
Cash and cash equivalents 19,228,937$ 422,765$ 19,651,702$ 279,803$ 68,130$
Investments 32,064,171 1,000,708 33,064,879 - -
Receivables 1,887,049 2,761,766 4,648,815 - -
Due from component unit 68,130 - 68,130 - -
Prepaids - 664,221 664,221 - -
Internal balances (5,337,640) 5,337,640 - - -
Inventory 502,835 - 502,835 - -
Restricted cash - 374,646 374,646 - -
Net pension asset - TMRS 775,620 - 775,620 - -
Capital assets
Land 7,041,359 108,758 7,150,117 - -
Construction in progress 1,341,276 2,559,483 3,900,759 - -
Buildings 17,548,780 54,594 17,603,374 - -
Improvements other than buildings 29,438,494 78,164,132 107,602,626 - -
Machinery and equipment 16,021,280 508,314 16,529,594 - -
Infrastructure 12,870,590 - 12,870,590 - -
Accumulated depreciation (21,948,791) (31,711,349) (53,660,140) - -
Total assets 111,502,090 60,245,678 171,747,768 279,803 68,130
LIABILITIES
Accounts payable 602,147 409,337 1,011,484 - -
Accrued liabilities 865,819 447,056 1,312,875 - -
Customer deposits/other 73,859 374,646 448,505 - -
Deferred gain - 644,221 644,221 - -
Due to primary government - - - - 68,130
Net pension obligation - FRRF 945,744 - 945,744 - -
Net OPEB obligation 218,615 - 218,615 - -
Compensated absences:
Due within one year 901,162 212,349 1,113,511 - -
Due beyond one year 1,292,536 317,422 1,609,958 - -
Total liabilities 4,899,882 2,405,031 7,304,913 - 68,130
NET ASSETS
Invested in capital assets 62,312,988 49,683,932 111,996,920 - -
Unrestricted 44,289,220 8,156,715 52,445,935 279,803 -
Total net assets 106,602,208$ 57,840,647$ 164,442,855$ 279,803$ -$
The notes to the financial statements are an integral part of this statement.

19
CITY OF UNIVERSITY PARK, TEXASStatement of Activities
For the Year Ended September 30, 2012
Net (Expenses) Revenues and Changes in Net Assets
Primary Government Component Units
Program Revenues Southwest Higher Texas Higher
Charges for Governmental Business-type Education Education
Functions/Programs: Expenses Services Activities Activities Total Authority Authority
Primary government:
Governmental activities:
General Government 4,643,566$ 29,132$ (4,614,434)$ -$ (4,614,434)$ -$ -$
Public Safety 12,198,719 2,284,805 (9,913,914) - (9,913,914) - -
Streets 1,829,907 - (1,829,907) - (1,829,907) - -
Parks 3,418,159 348,478 (3,069,681) - (3,069,681) - -
Public Works 2,658,904 3,113,402 454,498 - 454,498 - -
Total governmental activities 24,749,255 5,775,817 (18,973,438) - (18,973,438) - -
Business-type activities:
Utilities 13,146,550 13,655,917 - 509,367 509,367 - -
Sanitation 2,590,435 2,828,621 - 238,186 238,186 - -
Total business-type activities 15,736,985 16,484,538 - 747,553 747,553 - -
Total primary government 40,486,240$ 22,260,355$ (18,973,438) 747,553 (18,225,885) - -
Component units:
Southwest Higher Education Authority -$ -$ - - - - -
Texas Higher Education Authority - - - - - - -
Total component units -$ -$ - - - - -
General revenues:
Property tax 15,484,579 - 15,484,579 - -
Sales tax 3,395,645 - 3,395,645 - -
Franchise taxes 2,094,494 - 2,094,494 - -
Interest 188,888 3,241 192,129 337 32
Other 90,026 75,997 166,023 - -
Contribution 32 - 32 - (32)
Donations 12,276 - 12,276 - -
Transfers (352,176) 352,176 - - -
Total general revenues and other 20,913,764 431,414 21,345,178 337 -
Changes in net assets 1,940,326 1,178,967 3,119,293 337 -
Net assets - beginning 104,661,882 56,661,680 161,323,562 279,466 -
Net assets - ending 106,602,208$ 57,840,647$ 164,442,855$ 279,803$ -$
The notes to the financial statements are an integral part of this statement.

20
CITY OF UNIVERSITY PARK, TEXASBalance Sheet
Governmental Funds
September 30, 2012
Other Total
Governmental Governmental
General Capital Projects Funds Funds
ASSETS
Cash and cash equivalents 15,052,692$ 2,839,215$ 32,443$ 17,924,350$
Investments 24,405,926 3,486,055 - 27,891,981
Receivables
Ad valorem tax (net of allowance of $100,000) 114,328 - - 114,328
Sales tax 631,340 - - 631,340
Franchise 507,928 - - 507,928
Accrued interest 25,676 2,216 - 27,892
Other 591,257 - - 591,257
Due from other funds 10,913,683 4,972,634 172,842 16,059,159
Due from component unit 68,130 - - 68,130
Inventory 502,835 - - 502,835
Total assets 52,813,795$ 11,300,120$ 205,285$ 64,319,200$
LIABILITIES AND FUND BALANCES
Liabilities:
Accounts payable 429,305$ 125,608$ -$ 554,913$
Accrued liabilities 673,520 4,127 - 677,647
Customer deposits/other 73,859 - - 73,859
Deferred revenue 389,356 - - 389,356
Due to other funds 23,155,616 538,162 12,637 23,706,415
Total liabilities 24,721,656 667,897 12,637 25,402,190
Fund Balances:
Nonspendable 502,835 - - 502,835
Spendable
Committed to:
SMU Land Sale 15,875,202 - - 15,875,202
Emergency expenditures 2,500,000 - - 2,500,000
SMU PILOT 2,375,000 - - 2,375,000
Assigned to:
General Government 417,269 10,632,223 1,228 11,050,720
Public Works 188,747 - - 188,747
Public Safety 15,464 - 168,875 184,339
Parks 17,360 - 22,545 39,905
Streets 5,892 - - 5,892
Unassigned 6,194,370 - - 6,194,370
Total fund balances 28,092,139 10,632,223 192,648 38,917,010
Total liabilities and fund balances 52,813,795$ 11,300,120$ 205,285$ 64,319,200$
The notes to the financial statements are an integral part of this statement.

21
CITY OF UNIVERSITY PARK, TEXAS
Reconciliation of the Governmental Fund Balance Sheet to the Statement of Net Assets
September 30, 2012
Total fund balances - governmental funds 38,917,010$
Amounts reported for governmental activities in the statement of net assets are different because:
Capital assets used in governmental activities are not financial resources and, therefore, are not
reported in the funds. 58,169,818
Certain receivables will be collected this year, but are not available to pay for the current period's
expenditures and are, therefore, deferred in the funds. 321,226
All equity remaining in the Texas Higher Education Authority will eventually become property of
the government, however, since that amount is not yet available, it is deferred in the funds. 68,130
This amount is the net pension asset (TMRS) recorded at the government wide level, not
recorded in the funds. 775,620
This amount is the net other post-employment benefits obligation recorded at the government
wide level, not recorded in the funds. (218,615)
This amount is the net pension obligation (FRRF) recorded at the government wide level, not
recorded in the funds. (945,744)
The long term portion of compensated absences is not due and payable in the current period and
therefore is not reported in the funds. (1,939,270)
Internal service funds are used by management to charge the costs of various services to
individual funds. The governmental portion of the assets and liabilities of the internal service
funds are included in governmental activities in the statement of net assets. 11,454,033
Total net assets - governmental activities 106,602,208$
The notes to the financial statements are an integral part of this statement.
22
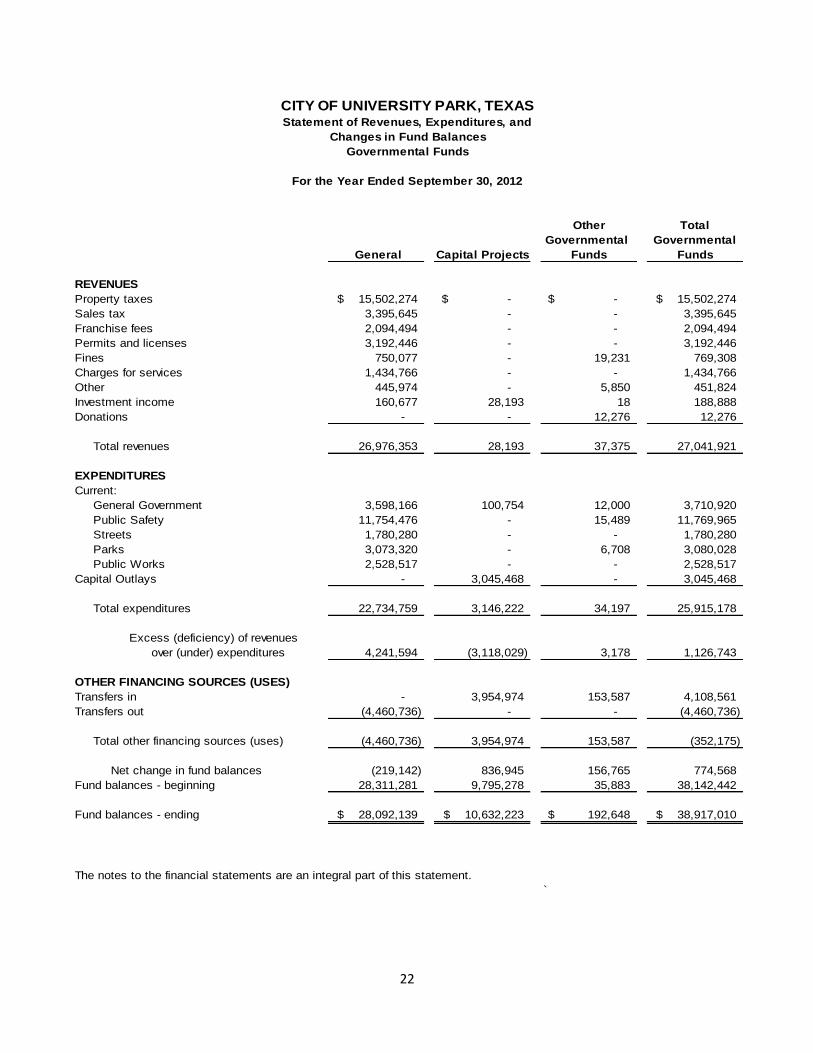
CITY OF UNIVERSITY PARK, TEXASStatement of Revenues, Expenditures, and
Changes in Fund Balances
Governmental Funds
For the Year Ended September 30, 2012
Other Total
Governmental Governmental
General Capital Projects Funds Funds
REVENUES
Property taxes 15,502,274$ -$ -$ 15,502,274$
Sales tax 3,395,645 - - 3,395,645
Franchise fees 2,094,494 - - 2,094,494
Permits and licenses 3,192,446 - - 3,192,446
Fines 750,077 - 19,231 769,308
Charges for services 1,434,766 - - 1,434,766
Other 445,974 - 5,850 451,824
Investment income 160,677 28,193 18 188,888
Donations - - 12,276 12,276
Total revenues 26,976,353 28,193 37,375 27,041,921
EXPENDITURES
Current:
General Government 3,598,166 100,754 12,000 3,710,920
Public Safety 11,754,476 - 15,489 11,769,965
Streets 1,780,280 - - 1,780,280
Parks 3,073,320 - 6,708 3,080,028
Public Works 2,528,517 - - 2,528,517
Capital Outlays - 3,045,468 - 3,045,468
Total expenditures 22,734,759 3,146,222 34,197 25,915,178
Excess (deficiency) of revenues
over (under) expenditures 4,241,594 (3,118,029) 3,178 1,126,743
OTHER FINANCING SOURCES (USES)
Transfers in - 3,954,974 153,587 4,108,561
Transfers out (4,460,736) - - (4,460,736)
Total other financing sources (uses) (4,460,736) 3,954,974 153,587 (352,175)
Net change in fund balances (219,142) 836,945 156,765 774,568
Fund balances - beginning 28,311,281 9,795,278 35,883 38,142,442
Fund balances - ending 28,092,139$ 10,632,223$ 192,648$ 38,917,010$
The notes to the financial statements are an integral part of this statement.
`

23
Amounts reported for governmental activities in the statement of activities are different because:
Net change in fund balances - total governmental funds 774,568$
Capital Expenditures 3,223,953
Depreciation Expense (2,164,917)
Net book value of retired assets (8,740) 1,050,296
10,986
This amount is the net TMRS pension asset recorded at the government level, not
recorded in the funds. 352,238
This amount is the net other post employment benefits obligation recorded at the
government wide level, not recorded in the funds. (72,672)
(142,308)
32
(14,053)
(18,761)
Change in net assets of governmental activities 1,940,326$
The notes to the financial statements are an integral part of this statement.
CITY OF UNIVERSITY PARK, TEXASReconciliation of the Statement of Revenues,
Expenditures, and Changes in Fund Balances of
Governmental Funds to the Statement of Activities
This amount is the net FRRF pension obligation recorded at the government wide level, not
recorded in the funds.
For the Year Ended September 30, 2012
Governmental funds report capital outlays as expenditures. However, in the statement of activities
the cost of those assets is allocated over their estimated useful lives and reported as depreciation
expense. This is the amount by which capital outlays exceeded depreciation in the current period,
exclusive of the capital asset activity of internal service funds.
Expenditures in the statement of activities that do not consume current financial resources are not
reported as expenditures in the funds.
This amount is the change in the long-term portion of compensated absences, and as such, it is
not reported in the funds.
Internal service funds are used by management to charge the costs of vehicle service, repair and
replacement and various insurance services to individual funds. The net revenue of certain
activities of internal service funds is reported with governmental activities.
Texas Higher Education Authority contributions in the statement of activities that do not provide
current financial resources are not reported as contribution revenue in the funds.

24
CITY OF UNIVERSITY PARK, TEXASStatement of Net Assets
Proprietary Funds
September 30, 2012
Business-type Activities - Enterprise Funds Governmental
Activities -
Water and Internal
Sewer Sanitation Total Service Funds
ASSETS
Current assets
Cash and cash equivalents 42,491$ 380,274$ 422,765$ 1,304,587$
Investments 1,000,708 - 1,000,708 4,172,190
Receivables (net of allowance) 2,331,195 430,571 2,761,766 14,304
Due from other funds 11,394,321 3,121,491 14,515,812 12,035,577
Prepaids - 45,808 45,808 -
Total current assets 14,768,715 3,978,144 18,746,859 17,526,658
Non-current assets
Prepaids - 618,413 618,413 -
Restricted cash 374,646 - 374,646 -
Capital assets:
Land 108,758 - 108,758 -
Buildings 54,594 - 54,594 -
Improvements other than buildings 78,164,132 - 78,164,132 -
Machinery and equipment 283,352 224,962 508,314 9,673,964
Construction in progress 2,559,483 - 2,559,483 -
Less accumulated depreciation (31,610,283) (101,066) (31,711,349) (5,530,793)
Total capital assets (net of accumulated depreciation) 49,560,036 123,896 49,683,932 4,143,171
Total non-current assets 49,934,682 742,309 50,676,991 4,143,171
Total assets 64,703,397 4,720,453 69,423,850 21,669,829
LIABILITIES
Current liabilities
Accounts payable 401,370 7,967 409,337 47,235
Accrued liabilities 368,899 78,157 447,056 330,844
Deferred gain - 45,808 45,808 -
Accrued compensated absences 106,367 105,982 212,349 45,128
Due to other funds 13,887,811 2,192,726 16,080,537 2,823,596
Total current liabiilities 14,764,447 2,430,640 17,195,087 3,246,803
Non-current liabilities
Deferred gain - 598,413 598,413 -
Customer deposits - payable from restricted cash 374,646 - 374,646 -
Accrued compensated absences 178,178 139,244 317,422 66,628
Total non-current liabilities 552,824 737,657 1,290,481 66,628
Total liabilities 15,317,271 3,168,297 18,485,568 3,313,431
NET ASSETS
Invested in capital assets 49,560,036 123,896 49,683,932 4,143,171
Unrestricted (173,910) 1,428,260 1,254,350 14,213,227
Total net assets 49,386,126$ 1,552,156$ 50,938,282 18,356,398$
Adjustment to reflect the consolidation of internal service fund activities related to enterprise funds. 6,902,365
Net assets of business-type activities 57,840,647$
The notes to the financial statements are an integral part of this statement.

25
CITY OF UNIVERSITY PARK, TEXASStatement of Revenues, Expenses, and
Changes in Fund Net Assets
Proprietary Funds
For the Year Ended September 30, 2012
Business-type Activities - Enterprise Funds Governmental
Activities -
Water and Internal
Sewer Sanitation Total Service Funds
Operating revenues
Charges for sales and services:
Water sales 8,566,050$ -$ 8,566,050$ -$
Sewer 4,651,837 - 4,651,837 -
Refuse collection - 2,400,874 2,400,874 -
Yard waste bags - 58,999 58,999 -
Recycling - 368,748 368,748 -
Stormwater 438,030 - 438,030 -
Charges for service - - - 1,496,275
Premiums - - - 2,954,249
Other revenue 2,820 73,177 75,997 322
Total operating revenues 13,658,737 2,901,798 16,560,535 4,450,846
Operating expenses
Personal services 2,408,737 1,822,843 4,231,580 836,890
Contractual and other services 8,179,822 612,407 8,792,229 143,707
Depreciation 1,639,883 4,844 1,644,727 573,581
Supplies and other 330,515 166,707 497,222 18,023
Administrative and fiscal services 600,000 - 600,000 643,937
Claims paid and change in estimate - - - 2,387,356
Total operating expenses 13,158,957 2,606,801 15,765,758 4,603,494
Operating income (loss) 499,780 294,997 794,777 (152,648)
Nonoperating revenues
Investment income 2,805 436 3,241 26,618
Gain on sale of capital assets - - - 136,042
Income before transfers 502,585 295,433 798,018 10,012
Transfers from other funds 352,176 - 352,176 -
Change in net assets 854,761 295,433 1,150,194 10,012
Total net assets - Beginning 48,531,365 1,256,723 18,346,386
Total net assets - Ending 49,386,126$ 1,552,156$ 18,356,398$
Adjustment to reflect the consolidation of internal service fund activities related to enterprise funds 28,773
Change in net assets of business-type activities 1,178,967$
The notes to the financial statements are an integral part of this statement.

26
CITY OF UNIVERSITY PARK, TEXASStatement of Cash Flows
Proprietary Funds
For the Year ended September 30, 2012
Business-type Activities - Enterprise Funds Governmental
Activities -
Water and Internal
Sewer Sanitation Total Service Funds
CASH FLOWS FROM OPERATING ACTIVITIES
Receipts from customers and users 13,988,783$ 2,908,486$ 16,897,269$ 4,442,046$
Payments from (to) other funds 423,617 (302,611) 121,006 1,825,256
Payments to suppliers (9,049,544) (754,890) (9,804,434) (3,072,830)
Payments to employees (2,369,494) (1,850,985) (4,220,479) (826,379)
Net cash provided by operating activities 2,993,362 - 2,993,362 2,368,093
CASH FLOWS FROM CAPITAL AND RELATED FINANCING
ACTIVITIES
Acquisition of capital assets (3,357,760) - (3,357,760) (1,330,732)
Transfers from other funds 352,176 - 352,176 -
Proceeds from sale of capital assets - - - 168,538
Net cash (used in) capital and related financing activities (3,005,584) - (3,005,584) (1,162,194)
CASH FLOWS FROM INVESTING ACTIVITIES
Purchase of investment securities (1,000,000) - (1,000,000) (4,164,847)
Proceeds from the sale and maturities of
investment securities 997,521 - 997,521 2,157,929
Interest on investments 3,805 436 4,241 18,115
Net cash provided by (used in) investing activities 1,326 436 1,762 (1,988,803)
Net increase (decrease) in cash and cash equivalents (10,896) 436 (10,460) (782,904)
Cash and cash equivalents, beginning of year 53,387 379,838 433,225 2,087,491
Cash and cash equivalents, end of year 42,491$ 380,274$ 422,765$ 1,304,587$
Reconciliation of operating income (loss) to net cash
provided by (used in) operating activities:
Operating income (loss) 499,780$ 294,997$ 794,777$ (152,648)$
Adjustments to reconcile operating income
to net cash provided by operating activities:
Depreciation expense 1,639,883 4,844 1,644,727 573,581
(Increase) decrease in due from other funds (3,466,306) (703,442) (4,169,748) 1,008,293
Increase in deposit on insurance claims - - - (1,957)
Decrease in accounts receivable 330,893 6,688 337,581 -
Decrease in prepaid expenses - 45,808 45,808 -
(Increase) in interest receivable (847) - (847) (6,843)
(Decrease) increase in accrued liabilities 100,036 (3,918) 96,118 130,704
(Decrease) in deferred gain - (45,808) (45,808) -
Increase in due to other funds 3,889,923 400,831 4,290,754 816,963
Total adjustments 2,493,582 (294,997) 2,198,585 2,520,741
Net cash provided by operating activities 2,993,362$ -$ 2,993,362$ 2,368,093$
NON-CASH INVESTING ACTIVITIES
Change in the fair value of investments 1,479$ -$ 1,479$ 2,015,421$
The notes to the financial statements are an integral part of this statement.

27
CITY OF UNIVERSITY PARK, TEXAS
Statement of Fiduciary Net Assets
Fiduciary Funds
September 30, 2012
Firefighters
Relief and
Retirement Fund
ASSETS
Cash and cash equivalents 186,685$
Receivables 3
Investment Funds, at fair value:
Small/MidCap Equity 757,513
Large Cap Equity 924,407
Global and Emerging Markets Equity 1,865,934
AllCap Growth Equity 931,702
Real Estate Investment Trust 263,369
Income Opportunity 1,044,102
Fixed income 2,234,265
High Yield 237,191
Total investments 8,258,483
Total assets 8,445,171
LIABILITIES
Due to other funds -
NET ASSETS
Assets held in trust for pension benefits, pool
participants, and other purposes 8,445,171$
The notes to the financial statements are an integral part of this statement.

28
CITY OF UNIVERSITY PARK, TEXASStatement of Changes in Fiduciary Net Assets
Fiduciary Funds
For the Year Ended September 30, 2012
Firefighters
Relief and
Retirement Fund
ADDITIONS
Contributions:
City 459,409$
Employee 417,040
Total contributions 876,449
Investment earnings:
Interest income 240,113
Realized gain on investments 147,855
Unrealized gain on investments 1,002,245
Total investment earnings 1,390,213
Total additions 2,266,662
DEDUCTIONS
Pension benefit payments 1,274,731
Administrative expenses 82,956
Total deductions 1,357,687
Change in net assets 908,975
Net assets - Beginning 7,536,196
Net assets - Ending 8,445,171$
The notes to the financial statements are an integral part of this statement.

CITY OF UNIVERSITY PARK, TEXAS Notes to Financial Statements
September 30, 2012
29
I. SUMMARY OF SIGNIFICANT ACCOUNTING POLICIES The accounting and reporting policies of the City of University Park (the City) relating to the funds included in the accompanying financial statements conform to the generally accepted accounting principles applicable to local governments. The following represent the more significant accounting and reporting policies and practices used by the City. A. Reporting entity The City was incorporated April 17, 1924, to operate as a general law city. Until 1989, a three-member Board of Commissioners served as the elected governing body. On November 9, 1989, University Park voters approved a Home Rule Charter, and the governing body for the City became the five-member City Council. The City is regulated by the Code of State Statutes of the State of Texas and is authorized to perform the following services: public safety (police and fire), public works, planning, building inspection, sanitation, water and sewer utilities, and general administrative services. The accompanying financial statements present the government and its component units, entities for which the government is considered financially accountable. The blended component unit, although a legally separate entity, is in substance part of the government's operations. Each discretely presented component unit is reported in a separate column in the government-wide financial statements (see note below for description) to emphasize that it is legally separate from the government. Blended component unit. The University Park Civic Foundation, Inc. (“the Foundation”) is a tax-exempt, non-profit corporation established in 1987 to promote public safety as well as charitable, scientific, literary and educational activities. The Foundation was created to make monetary contributions to the City for the general public purpose of assisting the City in undertaking any lawful civic endeavor. Although the Foundation’s Board of Directors appoints its own successors, by practice the Board has always been comprised of three University Park City Council members. The City’s Director of Finance also serves as the Foundation’s Assistant Secretary/Assistant Treasurer. The Foundation is reported as a special revenue fund in the City of University Park’s financial statements and does not issue separate audited financial statements. Previous financial results were presented on a December 31 fiscal year-end basis. However, during fiscal 2012 the Board of Directors changed the fiscal year-end to match that of the City. Therefore, current year Foundation financial data is presented as of the nine-month period ended September 30, 2012. Discretely presented component units. Created with assistance from the City in 1985, the Texas Higher Education Authority, Inc. (“THEA”) provides low-interest construction loans to private higher education institutions. The City Council appoints all Board members of THEA, and may remove them at will. Upon dissolution, THEA’s net worth will revert to the City of University Park. THEA’s operating and capital expenditures, including debt service, were financed entirely by its bond issues. Subsequent to the mandatory redemption of all outstanding bonds in December of 2003, substantially all of THEA’s remaining net worth was transferred to the City. A nominal amount was retained by THEA, should it wish to reissue debt at some time in the future. THEA is reported as an enterprise fund and has a December 31 fiscal year-end. THEA is comprised of a single fund. Separate financial statements are not prepared. A second discretely presented component unit, the Southwest Higher Education Authority, Inc. (“SWHEA”), issues tax-exempt debt solely for the benefit of Southern Methodist University. Sponsored by the City, SWHEA was incorporated in 1983. The City Council appoints all Board members of SWHEA and may remove them at will. SWHEA pays the City a fee of $15,000 for each bond issuance up to $50 million, a fee of $20,000 for an issue from $50 to $100 million, and a fee of $25,000 for an issue over $100 million. As of September 30, 2012, SWHEA had issued seven series of bonds with an aggregate outstanding principal amount payable of $397,745,000. These bonds are considered conduit debt of

CITY OF UNIVERSITY PARK, TEXAS Notes to Financial Statements
September 30, 2012
30
SWHEA and are reported in the financial statements of Southern Methodist University. SWHEA is reported as an enterprise fund and has a December 31 fiscal year-end. SWHEA is comprised of a single fund. Separate financial statements of SWHEA are not prepared. B. Government-wide and fund financial statements The government-wide financial statements (i.e., the statement of net assets and the statement of activities) report information on all of the non-fiduciary activities of the City and its component units. For the most part, the effect of interfund activity has been removed from these statements. Governmental activities, which normally are supported by taxes and intergovernmental revenues, are reported separately from business-type activities, which rely to a significant extent on fees and charges for support. Likewise, the primary government is reported separately from the discretely presented component units for which the primary government is financially accountable. The statement of activities demonstrates the degree to which the direct expenses of a given function are offset by program revenues. Direct expenses are those that are clearly identifiable with a specific function or segment. Program revenues include 1) charges to customers or applicants who purchase, use, or directly benefit from goods, services, or privileges provided by a given function or segment and 2) contributions that are restricted to meeting the operational or capital requirements of a particular function or segment. Taxes, fees, interest and other items not properly included among program revenues are reported instead as general revenues. Separate financial statements are provided for governmental funds, proprietary funds, and fiduciary funds, even though the latter are excluded from the government-wide financial statements. Major individual governmental funds and major individual enterprise funds are reported as separate columns in the fund financial statements. C. Measurement focus, basis of accounting, and financial statement presentation The government-wide financial statements are reported using the economic resources measurement focus and the accrual basis of accounting, as are the proprietary fund and fiduciary fund financial statements. Revenues are recorded when earned and expenses are recorded when a liability is incurred, regardless of the timing of related cash flows. Ad valorem taxes are recognized as revenues in the year for which they are levied. Governmental fund financial statements are reported using the current financial resources measurement focus and the modified accrual basis of accounting. Revenues are recognized as soon as they are both measurable and available. Revenues are considered to be available when they are collectible within the current period or soon enough thereafter to pay liabilities of the current period. For this purpose, the government considers revenues to be available if they are collected within 60 days of the end of the current fiscal period. Expenditures generally are recorded when a liability is incurred, as under accrual accounting. However, expenditures related to compensated absences, claims, and judgments are recorded only when payment is due. Ad valorem taxes, sales taxes, franchise fees, and interest associated with the current fiscal period are all considered to be susceptible to accrual and so have been recognized as revenues of the current fiscal period. All other revenue items are considered to be measurable and available only when cash is received by the government.

CITY OF UNIVERSITY PARK, TEXAS Notes to Financial Statements
September 30, 2012
31
The City reports the following major governmental funds: General Fund - Accounts for the ordinary operations of the City financed from taxes and other general revenues. It is used to account for all financial resources except those required to be accounted for in another fund by law or contractual agreement. Capital Projects Fund - Accounts for the acquisition of capital assets or the construction of major capital projects not being financed by proprietary funds. The City reports the following major proprietary funds: The Water and Sewer Fund is used to account for the provision of water and sewer services to the residents of the City. The Sanitation Fund accounts for the provision of sanitation services to the residents of the City. The City reports the following additional funds: Nonmajor governmental funds:
University Park Civic Foundation - Accounts for the proceeds of donations to and activities of the University Park Civic Foundation. Court Security – Accounts for the collection and use of the Municipal Court security fee charged to defendants in accordance with state law. Court Technology – Accounts for the collection and use of the Municipal Court technology fee charged to defendants in accordance with state law. Police Training and Education – Accounts for the use of monies received for police training and education purposes. Police Forfeiture - Accounts for awards of monies by the courts to the Police Department. The administration of this fund is legally restricted to the police, and the resources are to be used for police activity. Fire Training and Education – Accounts for the use of monies received for fire department training and education.
Internal Service Funds:
The Equipment Services Fund accounts for the costs associated with the acquisition and maintenance of specific equipment through the rental of it to other departments. The Comprehensive Self-Insurance Fund accounts for the costs associated with the general liability, property and casualty, workers’ compensation, and employee health self-insurance program established by the City.
Firemen’s Relief and Retirement (Pension Trust) Fund – Accounted for in essentially the same manner as the proprietary fund types, the net assets of the fund are restricted for the Firefighters’ Relief and Retirement.

CITY OF UNIVERSITY PARK, TEXAS Notes to Financial Statements
September 30, 2012
32
Private-sector standards of accounting and financial reporting issued prior to December 1, 1989, are generally followed in both the government-wide and proprietary fund financial statements to the extent that those standards do not conflict with or contradict guidance of the Governmental Accounting Standards Board. Governments also have the option of following subsequent private-sector guidance for their enterprise funds, subject to this same limitation. The City has elected not to follow subsequent private-sector guidance. As a general rule, the effect of interfund activity has been eliminated from the government-wide financial statements. Exceptions to this general rule are charges between the government’s water and sewer functions and various other functions of the government. Elimination of these charges would distort the direct costs and program revenues reported for the various functions concerned. Amounts reported as program revenues generally include charges to customers or applicants for goods, services, or privileges provided. Franchise fees, interest earnings, donations and contributions are reported as general revenues rather than as program revenues. Likewise, general revenues include all taxes. Proprietary funds distinguish operating revenues and expenses from non-operating items. Operating revenues and expenses generally result from providing goods or services in connection with a proprietary fund's principal ongoing operations. The principal operating revenues of the government's water, sewer and sanitation enterprise funds and of the equipment and self-insurance internal service funds are charges to customers for sales or service. Operating expenses for enterprise funds and internal service funds include the cost of sales and services, administrative expenses, and depreciation on capital assets. All revenues and expenses not meeting this definition are reported as non-operating revenues and expenses. Governmental fund balances are presented in accordance with Governmental Accounting Standards Board (GASB) Statement 54, Fund Balance Reporting and Governmental Fund Type Definitions. This statement establishes fund balance classifications that comprise a hierarchy based primarily on the extent to which a government is bound to observe constraints imposed upon the use of the resources reported in governmental funds. Fund balance classifications, under GASB 54, are Nonspendable, Restricted, Committed, Assigned and Unassigned. These classifications reflect not only the nature of the funds, but also provide clarity to the level of restriction placed upon fund balance. Fund balance can have different levels of restraint, such as external versus internal compliance requirements. Unassigned fund balance is the residual classification within the General Fund. The General Fund should be the only fund that reports a positive unassigned fund balance. In all other governmental funds, an unassigned balance is limited to negative residual fund balance. For further details of the various fund balance classifications refer to Note I.D.9.
D. Assets, liabilities, and net assets or equity
1. Deposits and investments The City's cash and cash equivalents are considered to be cash on hand, demand deposits, and short-term investments with original maturities of three months or less from the date of acquisition. The City uses a pooled cash approach, in which only one fund (the General Fund) has a “cash” account for making investment transactions. Obligations with maturities of one year or less when purchased are reported at their amortized cost, while investments with maturities greater than one year are reported at fair value. Nonparticipating investment contracts, generally certificates of deposit, are reported at cost. Interest income is allocated to the individual funds based on the funds’ proportion of the pooled investments.
CITY OF UNIVERSITY PARK, TEXAS Notes to Financial Statements
September 30, 2012
33
The City’s investment policy permits investments in U.S. Treasury and agency obligations, municipal securities, certificates of deposit, local government investment pools, certain money market mutual funds, and repurchase agreements. The investment policy is reviewed and approved annually by the Finance Advisory Committee and the City Council and includes all City funds except the Firefighters’ Relief and Retirement Fund, which has its own investment policy that is reviewed and approved by the Fund’s Board of Trustees. All City investments are held by the City’s agent in the City’s name and are executed on a “delivery versus payment” basis, in which payment for a security is not released until the security is delivered to the agent.
2. Receivables and payables All outstanding balances between funds are reported as "due to/from other funds.” Any residual balances outstanding between the governmental activities and business-type activities are reported in the government-wide financial statements as "internal balances." All trade and property tax receivables are shown net of an allowance for uncollectible amounts. Trade accounts receivable over 365 days old are the basis for the trade accounts receivable allowance for uncollectible amounts. Property taxes are levied as of October 1st on property values assessed as of the prior January 1st. They are considered past due 120 days after the respective tax billing date, at which time an enforceable lien attaches.
3. Inventories and prepaid items Inventories are valued at a weighted average cost. In accordance with the consumption method of accounting, inventories of governmental funds are recorded as expenditures when consumed rather than when purchased. Certain payments to vendors reflect costs applicable to future accounting periods and are recorded as prepaid items in both the government-wide and fund financial statements.
4. Restricted assets The City classifies customer deposits in proprietary funds as restricted.
5. Interfund transactions Reimbursements between funds are recorded as expenditures or expenses in the reimbursing fund and reductions of expenditure or expense in the reimbursed fund. All legally authorized transfers are included in the results of operations of both governmental and proprietary funds. The City’s internal service funds – Equipment Services and Comprehensive Self-Insurance -- record charges for services as operating revenues. The respective user funds record the related operating expenses or expenditures, as appropriate. Nonrecurring or non-routine transfers of equity between funds – for example, the transfer of residual balances of discontinued funds to other funds – are accounted for as transfers. Transactions that occur between the primary government and the component units are classified as “due from/to the primary government/component unit.”

CITY OF UNIVERSITY PARK, TEXAS Notes to Financial Statements
September 30, 2012
34
6. Capital assets
Capital assets, which include land, buildings, improvements, infrastructure (e.g., roads, bridges, sidewalks, and similar items), and equipment, are reported in the applicable governmental or business-type activities columns in the government-wide financial statements. Capital assets are defined by the city as either assets with an individual cost of more than $5,000 or capital projects exceeding $50,000, with an estimated useful life in excess of two years. Such assets are recorded at historical cost or estimated historical cost if purchased or constructed. Donated capital assets are recorded at estimated fair market value at the date of donation. The costs of normal maintenance and repairs that do not add to the value of the asset or materially extend its life are not capitalized. The City’s capital assets are depreciated using the straight-line method over the following estimated useful lives:
Assets Years
Buildings 40
Improvements 20-30
Infrastructure 40
Equipment: 5-20
7. Compensated absences
It is City policy to permit employees to accumulate certain limited vacation and sick pay benefits. The equivalent of two years of earned but unused vacation earnings may be accumulated and carried over from year to year. Any vacation leave in excess of this amount is lost. Upon termination in good standing, employees are paid for unused vacation. Employees are able to accumulate unlimited sick leave while employed. However, a maximum of 90 days accumulated sick leave will be paid out upon retirement. Any unused sick leave above this amount is forfeited. A liability has been recognized for the portion of vacation and accumulated sick leave benefits estimated payable in both the following year and upon retirement for all employees. The retirement of this liability is paid from the General Fund, Enterprise Funds, or Internal Service Funds based upon the assignment of the employee at termination.
8. Long-term obligations Other than the portion of compensated absences estimated payable after September 30, 2012, there are no other long-term obligations of the City.
9. Fund balance In accordance with GASB 54, the City classifies governmental fund balances as follows: Nonspendable – Includes fund balance amounts that cannot be spent either because they are not in a spendable form, or because of legal or contractual requirements.

CITY OF UNIVERSITY PARK, TEXAS Notes to Financial Statements
September 30, 2012
35
Spendable Fund Balance
Restricted – Includes fund balance amounts that can only be spent for the particular purpose stipulated by external resource providers either contractually, constitutionally or through enabling legislation. Committed – Includes fund balance amounts that can only be used for the specific purposes determined by formal action of the government’s highest level of decision-making authority. Commitments may be modified or rescinded only by the government taking the same formal action that imposed the constraint originally. In the City of University Park, fund balance is committed by resolution of the City Council. Assigned – Includes amounts intended to be used by the government for specific purposes. For this purpose, intent may be expressed by the governing body or by an official or body to which the governing body has delegated such authority. In practice, actions resulting in the assignment of fund balance may be taken by department directors. In governmental funds other than the general fund, assigned fund balance represents the amount that is not restricted or committed. This indicates that resources in other governmental funds are, at a minimum, intended to be used for the purpose of that fund. Unassigned – Includes the residual positive fund balance within the General Fund and includes all amounts not contained in any of the above classifications. Unassigned fund balance is available for any valid governmental purpose and may include negative balances for any governmental fund in which expenditures exceed the amount restricted, committed, or assigned for those specific purposes. In accordance with City Financial Management Policies, “it is the goal of the City to achieve and maintain an unassigned fund balance in the General Fund equal to at least 30 days of expenditures to mitigate financial risk that can occur from unforeseen revenue fluctuations, significant unanticipated expenditures and natural disasters.”
When multiple categories of fund balance are available for expenditure, the City will first spend the most restricted category of funds before spending the next most restricted category with available funds. Normally, this will result in the use of committed, then assigned, and lastly, unassigned fund balance when expenditures are made, with the exception of the emergency reserve established by the City Council. Under normal circumstances, the City would first elect to utilize unassigned fund balance before considering the use of its emergency funds. Although established by ordinance in 1976 and again in 1980, the City Council re-authorized the maintenance of a $2,500,000 emergency reserve during fiscal 2011 through the adoption of Resolution 11-08. The emergency reserve “shall be available for expenditure upon authorization of the City Council for emergency relief of economic or natural disaster or other urgent purpose for which the Council sees fit.”

CITY OF UNIVERSITY PARK, TEXAS Notes to Financial Statements
September 30, 2012
36
The following is an explanation of the fund balance classifications, other than those assigned, as presented on the Governmental Funds Balance Sheet: Nonspendable - The portion of fund balance indicating items (such as inventory) that are not in spendable form. Restricted – There are no restricted items in fund balance. Committed –
SMU Land Sale - Committed by City Council resolution to remain invested in General Fund providing interest earnings until such time as recommendations for use are made by special review committee. Emergency expenditures – Committed by City Council resolution for emergency expenditures. May be added as necessary to future budgets by supplemental appropriations action. SMU PILOT (Payment In Lieu Of Taxes) – Committed by City Council resolution to remain invested in perpetuity, providing interest earnings to the General Fund.
E. Implementation of New Accounting Principles
The GASB has issued the following pronouncements that will become effective in future years.
Statement No. 63, “Financial Reporting of Deferred Outflows of Resources, Deferred Inflows of
Resources, and Net Position” will standardize the presentation of deferred outflows of resources and
deferred inflows of resources and their effect on a government’s net position.
Statement No. 65 “Items Previously Reported as Assets and Liabilities” will require certain items that were
previously reported as assets and liabilities to be reclassified as deferred outflows of resources or
deferred inflows of resources. Additionally, certain items that were previously reported as assets and
liabilities will be recognized as outflows of resources or inflows of resources.
Statement No. 68, “Accounting and Financial Reporting for Pensions-an amendment of GASB Statement
No. 27” changes the focus of pension accounting from whether employers are responsibly funding their
plan over time to a point-in-time liability that is reflected in the employer’s financial statements for any
actuarially unfunded portion of pension benefits earned to date.
These statements will become effective for the City in fiscal year 2013, 2014 and 2015, respectively.
Management has not yet determined the effect of these statements on the financial statements.
II. STEWARDSHIP, COMPLIANCE, AND ACCOUNTABILITY
A. Budgetary information Annual budgets are adopted on a basis consistent with generally accepted accounting principles. All annual appropriations lapse at fiscal year end. The appropriated budget is prepared by fund and department. The City’s department heads may make transfers of appropriations within a department. Transfers of appropriations between departments require the approval of the city manager.

CITY OF UNIVERSITY PARK, TEXAS Notes to Financial Statements
September 30, 2012
37
Encumbrance accounting is employed in governmental funds. Encumbrances outstanding at year end are reported as assignements of fund balance and do not constitute expenditures or liabilities because the commitments will be re-appropriated and honored during the subsequent year.
B. Excess of expenditures over appropriations For the year ended September 30, 2012, expenditures exceeded appropriations in the Finance, Library, Pool and Street departments (the legal level of budgetary control) of the General Fund by $61,690. The over-expenditure in these departments was offset by lower than anticipated spending in other departments within the General Fund. III. DETAILED NOTES ON ALL FUNDS
A. Deposits
1. Cash At September 30, 2012, the carrying amount of the City’s bank deposits was $1,967,286 and the bank balance was $823,655. The City’s bank deposits at year-end were entirely covered by federal depository insurance or by pledged collateral held by the City’s agent in the City’s name. Cash on hand equaled $1,550. Restricted cash totaled $374,646.
2. Cash equivalents The City participates in three investment pools. They include:
TexPool, a State of Texas-sponsored state investment pool composed of U.S. government obligations, repurchase agreements, and money market mutual funds; and
TexSTAR (Texas Short Term Asset Reserve Program), a local government investment pool composed of U.S. government obligations, fully collateralized repurchase and reverse repurchase agreements, and no-load money market mutual funds; and
TexasTERM (including TexasDAILY) a local government investment pool offering fixed rate, fixed term investments, composed of U.S. government obligations, fully collateralized repurchase agreements, certificates of deposit issued by FDIC insured state and national banks doing business in Texas and AAA rated no-load money market mutual funds.
All of the pools operate in a manner consistent with the SEC’s Rule 2(a)7 of the Investment Corporation Act of 1940. The pools use amortized cost rather than fair value to report net assets to compute share prices. Accordingly, the fair value of the position in the pools is the same as the value of the pool shares. As of September 30, 2012, the City held the following deposits in pooled funds:
Pool:
Weighted Average
Maturity
(in Days)
Credit Rating
(Standard &
Poor’s)
TexPool $ 12,495,816 41 AAAm
TexSTAR 2,636,013 45 AAAm
TexasDAILY 2,927,233 59 AAAm
$ 18,059,062

CITY OF UNIVERSITY PARK, TEXAS Notes to Financial Statements
September 30, 2012
38
At December 31, 2012, cash and cash equivalents of SWHEA was comprised of $49,469 of bank deposits and $230,334 in TexSTAR. Cash and cash equivalents of THEA was comprised solely of $68,130 of bank deposits.
B. Investments As of September 30, 2012, the City held the following investments:
Investment Type
Fair Value
Weighted Average Maturity
(in Days)
U.S. Agencies $ 20,053,320 1,033
Certificates of Deposit 13,011,559 241
Total fair value $ 33,064,879
Investments weighted average maturity 722
Combined (pooled funds and investments)
weighted average maturity
465
Interest rate risk – In accordance with its annually adopted investment policy, the City manages its exposure to declines in fair value by limiting the combined weighted average maturity of its portfolio to no more than 548 days, while employing a “buy and hold” strategy. For purposes of the calculation, the combined weighted average also includes pooled fund deposits, which from a city investment perspective have a weighted average maturity of one day. Credit risk – The investments reported above meet the criteria specified in the City’s investment policy relative to those specific types of instruments.
1. Obligations of the United States or its agents and instrumentalities with a maturity not to exceed five (5) years from the date of purchase issued by, guaranteed by, or for which the credit of any of the following Federal Agencies and Instrumentalities is pledged for payment: Federal National Mortgage Association (FNMA), Federal Home Loan Bank (FHLB), Federal Home Loan Mortgage Corporation (FHLMC), and Federal Farm Credit Bank (FFCB). Each of the City’s purchased investments were rated at least AA+ by Standard and Poors. 2. Certificates of Deposit issued by a depository institution with a main office or branch in Texas that are guaranteed or insured by the Federal Deposit Insurance Corporation (FDIC), or secured by obligations or unconditional guarantees of the United States or its agencies and instrumentalities, the State of Texas or its agencies, or obligations of states, agencies, counties, cities and other political subdivisions of any state having been rated as to investment quality by a nationally recognized investment firm not less than “A” or its equivalent.
Concentration of credit risk – It is the policy of the City to avoid a concentration of assets in a specific maturity, a specific issue, or a specific class of securities. The applicable limits on the City’s current investments are: U.S. Treasuries (100%), U.S. Agencies (60%), Certificates of Deposit (30%), and Local Government Investment Pools (50%). The actual percentages of these deposits and investments at September 30, 2012 are 0%, 39%, 26%, and 35%, respectively. Custodial credit risk of investments – For an investment, this is the risk that, in the event of the failure of the counterparty, the City will not be able to recover the value of its investments or collateral securities that are in the possession of an outside party. It is the policy of the City to mitigate this risk by contracting

CITY OF UNIVERSITY PARK, TEXAS Notes to Financial Statements
September 30, 2012
39
with third-party banks for the safekeeping of securities either owned by the City as part of its investment portfolio or held as collateral to secure certificates of deposit or repurchase agreements. Settlement of all investment transactions are on a delivery versus payment basis, and all securities are held by the third party custodian in the name of the City. The Pension Trust Fund (Firefighters’ Relief and Retirement Fund) investment policy permits investments in common and preferred stock, equity and bond mutual funds, real estate investment trusts, corporate obligation bonds, and U.S. government obligations. Pension Trust Fund investments are held by a custodian in the Fund’s name. The Pension Trust Fund investments are uninsured and unregistered and are held by a third party, not in the City’s name. Both SWHEA and THEA may purchase investments as authorized by their investment policies, as approved by their Board of Directors. These investments include but are not limited to direct obligations of and obligations guaranteed by the United States and certain U.S. Government agencies, bank demand deposits, and interest bearing bank time deposits with a maturity of one year or less which are secured by pledges of government securities or are issued by banks rated Aa or AA by Moody’s Investors Service, Inc. or Standard & Poor’s Corporation, respectively. Repurchase agreements entered into must have a defined termination date, be secured by a pledge of U.S. Government obligations, be held in THEA’s name and deposited with a third party and be placed through a securities dealer or a financial institution doing business in Texas. Money market mutual funds are authorized investments if they are regulated by the SEC, have a dollar-weighted average stated maturity of 90 days or less and include in their investment objective the maintenance of a stable net asset value of $1 for each share. THEA does not invest in any state or local government investment pools.
C. Receivables
Receivables as of year-end for the City’s individual major, non-major, and internal service funds in the aggregate, including the applicable allowances for uncollectible accounts, are as follows:
General
Capital
Projects
Water and
Sewer Sanitation
Internal
Service Total
Receivables:
Ad Valorem tax 214,328$ -$ -$ -$ -$ 214,328$
Sales Tax 631,340 - - - - 631,340
Franchise 507,928 - - - - 507,928
Customers 793,202 - 2,165,617 443,071 - 3,401,890
Interest 25,676 2,216 847 - 9,304 38,043
Other 191,800 - 217,731 - 5,000 414,531
Gross Receivables 2,364,274 2,216 2,384,195 443,071 14,304 5,208,060
Less: Allowance for
Uncollectibles (493,745) - (53,000) (12,500) - (559,245)
Net Total Receivables 1,870,529$ 2,216$ 2,331,195$ 430,571$ 14,304$ 4,648,815$
Ad Valorem (Property) taxes attach as an enforceable lien on property as of January 1. The tax is levied each October 1 on the assessed value listed as of the prior January 1 for all real and business personal property located in the City. Assessed values are established at 100% of estimated market value and certified by the Dallas County Appraisal District. The assessed value of real and personal property on the tax roll as of January 1, 2011, was $8,149,526,370. The taxable value (assessed value less exemptions) upon which the fiscal 2012 levy was based was $5,568,088,524. The City is permitted by Article XI, Section 5 of the State of Texas Constitution to levy taxes up to $2.50 per $100 of assessed valuation for general governmental services, including the payment of principal and interest on general obligation long-term debt. The City Charter does not provide for a debt limit. The tax

CITY OF UNIVERSITY PARK, TEXAS Notes to Financial Statements
September 30, 2012
40
rate for the year ended September 30, 2012, was $0.27845 per $100, all of which was allocated to the general government. Taxes are due October 1, the levy date. Full payment can be made prior to the following January 31 to avoid penalty and interest charges. Current tax collections for the year ended September 30, 2012, were 99% of the tax levy. Property taxes levied for 2012 have been recorded as receivables, net of estimated uncollectible amounts. The net receivables collected during 2012 and those considered “available” at September 30, 2012 (i.e., property taxes collected within 60 days of year-end) have been recognized as revenues in 2012. The remaining receivables have been reflected as deferred revenue in the fund statements. In Texas, countywide central appraisal districts are required to assess all property within the appraisal district at 100% of its appraised value and are prohibited from applying any assessment ratios. The value of property within the appraisal district must be reviewed every four years; however, the City may, at its own expense, require annual reviews of appraised values. The City may challenge appraised values established by the appraisal district through various appeals and, if necessary, legal action. Under this legislation, the City continues to set tax rates on City property. However, if the effective tax rate, excluding tax rates for bonds and other contractual obligations, adjusted for new improvements, exceeds the rate for the previous year by more than 8%, qualified voters of the City may petition for an election to determine whether to limit the tax rate to no more than 8% above the tax rate of the previous year. This legislation provides that, if approved by the qualified voters in the City, both the appraisal and collection functions may be placed with the appraisal district. In addition, the City may obtain approval from its governing body to place these functions with the appraisal district.
D. Prepaid expenses In 1997, the City exchanged land with an original value of $20,000 for a reduction in landfill tipping fees for the next 28 years with the City of Garland. The present value of the tipping fees is reflected in the financial statements as a prepaid expense and deferred gain in the Sanitation Fund.
(This area intentionally left blank.)

CITY OF UNIVERSITY PARK, TEXAS Notes to Financial Statements
September 30, 2012
41
E. Capital assets Capital asset activity for the year ended September 30, 2012 was as follows:
Beginning
Balance Additions
Retirement /
Sale Transfers Ending Balance
Governmental activities:
Capital assets, not being depreciated:
Land 7,041,359$ -$ -$ -$ 7,041,359
Construction in progress 2,030,008 3,045,468 - (3,734,200) 1,341,276
Capital assets, being depreciated
Buildings 17,528,809 19,971 - - 17,548,780
Improvements 26,245,545 - (23,152) 3,216,101 29,438,494
Equipment 14,781,699 1,489,245 (767,763) 518,099 16,021,280
Infrastructure 12,870,590 - - - 12,870,590
Total Capital Assets 80,498,010 4,554,684 (790,915) - 84,261,779
Less accumulated depreciation for:
Buildings (2,600,125) (441,373) - - (3,041,498)
Improvements (5,270,807) (1,004,242) 23,152 - (6,251,897)
Equipment (9,475,478) (971,101) 726,527 - (9,720,052)
Infrastructure (2,613,562) (321,784) - - (2,935,346)
Total accumulated depreciation (19,959,972) (2,738,500) 749,679 - (21,948,793)
Governmental activities capital assets, net 60,538,038$ 1,816,184$ (41,236)$ -$ 62,312,986
Beginning
Balance Additions
Retirement /
Sale Transfers Ending Balance
Business-type activities:
Capital assets, not being depreciated:
Land 108,758$ -$ -$ -$ 108,758
Construction in progress 6,969,822 3,328,080 - (7,738,419) 2,559,483
Capital assets, being depreciated
Buildings 54,594 - - - 54,594
Improvements 70,447,795 - (22,081) 7,738,419 78,164,133
Equipment 478,632 29,682 - - 508,314
Total Capital Assets 78,059,601 3,357,762 (22,081) - 81,395,282
Less accumulated depreciation for: -
Buildings (54,594) - - - (54,594)
Improvements (29,783,720) (1,619,732) 22,081 - (31,381,371)
Equipment (250,388) (24,996) - - (275,384)
Total accumulated depreciation (30,088,702) (1,644,728) 22,081 - (31,711,349)
Business -type activities capital assets, net 47,970,899$ 1,713,034$ -$ -$ 49,683,933$

CITY OF UNIVERSITY PARK, TEXAS Notes to Financial Statements
September 30, 2012
42
Depreciation expense was charged to the functional areas of the primary government as follows:
Governmental activities:
General Government $ 1,580,718
1.189.228 Public Safety 511,208
Public Works 181,218
Parks 366,755
Streets 98,601
Total depreciation expense – Governmental activities $ 2,738,500
Business-type activities:
Water and Sewer $ 1,639,884
1,167,100 Sanitation 4,844
Total depreciation expense – Business-type activities $ 1,644,728
(This area intentionally left blank.)

CITY OF UNIVERSITY PARK, TEXAS Notes to Financial Statements
September 30, 2012
43
The government has active construction projects as of September 30, 2012. The projects include drainage and sewerage improvements, utility improvements, park improvements and renovations as well as on-going “mile-per-year” (MPY) projects. Construction in progress at September 30, 2012, is as follows:
Estimated
total cost
Balance at
9/30/2011
Expended in
2012
Transferred
or expensed
Balance at
9/30/2012
Estimated
future
expenditures
Governmental Projects
Enterprise GIS system upgrades 134,036 12,016 - - 12,016 122,020
Court software replacement 93,675 93,675 - 93,675 - -
Finance/UB software upgrade--NWS Dot.NET 314,221 314,221 - 314,221 - -
Community Development software replacement 250,000 - 116,983 - 116,983 133,017
City website enhancement/upgrade 220,000 28,021 76,248 - 104,269 115,731
Microsoft Exchange email upgrade 70,000 43,752 18,365 - 62,117 7,883
Network Security Upgrades 75,000 - 72,352 72,352 - 2,648
Peek Center Dispatch Equipment Replacement 50,000 - 15,632 - 15,632 34,368
Park Decorative and Security Lighting 60,000 - 23,978 - 23,978 36,022
University Blvd. medians (combined with 24100) 263,011 62,112 200,899 263,011 - -
Germany Park South 402,000 - 23,152 23,152 - -
Curtis Park Bridge Reconstruction 57,699 2,344 55,355 57,699 - -
Walt Humann Park 52,844 52,844 - 52,844 - -
Barns-Dublin-Douglas medians upgrade 160,000 7,198 108,565 - 115,763 44,237
McFarlin Median Upgrade 300,000 - 10,901 - 10,901 289,099
Peek Service Center Landscape 15,000 - 5,014 - 5,014 9,986
Williams Park improvements 105,000 2,970 89,376 92,346 - -
Goar Park Brook Improvements 210,000 - 4,000 - 4,000 206,000
Fire training tower renovation 618,790 613,790 5,000 618,790 - -
Microwave radio path/tower relocation 120,739 3,628 117,111 120,739 - -
Public safety software upgrade-OSSI/Firehouse 476,483 282,077 83,412 - 365,489 110,994
Asphalt overlay program 2011-12 1,117,445 303,180 814,265 1,117,445 - -
Curb & gutter replacement 2007-08 2,796,562 - 293,193 293,193 - -
Hillcrest-Daniel intersection 53,000 7,709 172 - 7,881 45,119
Old Peek Center 151,124 - 5,932 - 5,932 145,192
Westwick pavement/drainage 576,882 34,113 542,769 576,882 - -
University-Boedeker pavement 1,969,417 119,007 24,348 - 143,355 1,826,062
Lovers/Baltimore traffic signal 132,000 9,500 1,200 - 10,700 121,300
High water alert flashers 37,851 37,851 - 37,851 - -
Library Finish Out 2,500,000 - 337,246 - 337,246 2,162,754
Total $ 13,382,779 $ 2,030,008 $ 3,045,468 $ 3,734,200 $ 1,341,276 $ 5,412,432
Business-type Projects
Hillcrest Ave 12" Water Line 15,581$ 15,581$ -$ 15,581$ -$ -$
MPY 4000 Hanover/Purdue & other alleys 6,500 - 6,500 6,500 - -
MPY Tulane/Bryn Mawr-Caruth 3,090,000 104,651 2,270,417 - 2,375,068 714,932
MPY 4400 San Carlos/Potomac & Other Alleys 1,461,000 151,345 (27,624) - 123,721 1,337,279
MPY Auburndale/Key 1,550,000 613,686 851,407 1,465,093 -
MPY Douglas sewer main-Emerson to Lovers 1,430,000 - 46,819 - 46,819 1,383,181
Fondren water tank renovation 904,841 796,998 107,843 904,841 - -
Booster pump station 4,404,804 4,356,536 48,268 4,404,804 - -
Wastewater metering stations 80,348 69,773 10,575 80,348 - -
Emergency water interconnect 861,252 861,252 - 861,252 - -
HP-UP Shared Sanitary Sewer 150,000 - 13,875 - 13,875 136,125
Total 13,954,326$ 6,969,822$ 3,328,080$ 7,738,419$ 2,559,483$ 3,571,517$

CITY OF UNIVERSITY PARK, TEXAS Notes to Financial Statements
September 30, 2012
44
F. Interfund receivables, payables and transfers Individual interfund receivable and payable balances at September 30, 2012, were as follows: Receivable Fund Payable Fund
General Water and Sewer 10,082,285$
Sanitation 4,433
Equipment Services 802,650
Self-Insurance 11,678
Police Training and Education 12,637
Water and Sewer General 10,851,261
Capital Projects 543,060
Sanitation General 2,804,955
Water and Sewer 316,536
Capital Projects General 1,714,843
Water and Sewer 1,267,001
Self-Insurance 1,990,790
Self-Insurance General 7,611,605
Water and Sewer 360,295
Sanitation 403,744
Equipment Services 18,478
Equip Service General 110
Capital Projects (4,898)
Water and Sewer 1,861,694
Sanitation 1,784,549
Court Security General 47,846
Court Technology General 79,983
Police Training and Education General 34,449
Fire Training and Education General 10,540
UP Civic Foundation General 24
Total 42,610,548$
All interfund balances at year-end result from the recording of cash in the general fund, and the time lag between the dates that (1) interfund goods and services are provided or reimbursable expenditures occur, (2) transactions are recorded in the accounting system, and (3) payments between funds are made. The balances noted above may be settled, offset, or reduced in the coming year through cash or other investment asset transfers.

CITY OF UNIVERSITY PARK, TEXAS Notes to Financial Statements
September 30, 2012
45
Government interfund transfers during the year ended September 30, 2012, were as follows: Transfer From: Transfer To:
Capital Projects Water and Sewer Special Revenue Total
General Fund 3,954,974$ 352,175$ 153,587$ 4,460,736$
Interfund transfers are reported in the governmental and proprietary funds financial statements. In the government-wide statements, interfund transfers are eliminated within the governmental and business-type activities columns as appropriate. Interfund transfers are used to move unrestricted revenues collected in the general fund to finance various capital projects in accordance with budgetary authorizations. Authorized transfers are also made to fund the identifiable governmental-type costs of capital projects within the Water and Sewer fund. In the year ended September 30, 2012, the City transferred a total of $153,587 to establish the Court Security, Court Technology, Police Training and Education and Fire Training and Education special revenue funds. These funds were created in order to account for receipts and expenditures in accordance with various externally imposed restrictions.
G. Due to/from primary government and component units:
Receivable Entity Payable Entity Amount
Primary Government – General Fund Component Unit – Texas Higher Education Authority $ 68,130
The year-end balance between the City and THEA represents the amount payable to the City upon the complete cessation of THEA’s operations. Like THEA, SWHEA also has a December 31 year end. At September 30, there were no interfund receivables or payables between SWHEA and the City’s General fund.
H. Long-term debt
Beginning
Balance
Additions
Deductions
Ending Balance
Due Within One
Year
Governmental Activities:
Compensated Absences $ 2,171,941 $ 170,308 $ (148,551) $ 2,193,698 $ 901,162
Business-Type Activities
Compensated Absences $ 518,692 $ 23,005 $ (11,926) $ 529,771 $ 212,349
I. Component units
The Statement of Net Assets and Statement of Activities for both component units are presented on the face of the government-wide financial statements. Cash flow information for both SWHEA and THEA is as follows:
SWHEA THEA
Cash Flows from Investing Activities:
Interest on Investments $ 337 $ 32
Net cash provided by investing activities 337 32
Net increase in cash and cash equivalents 337 32
Beginning cash and cash equivalents 279,466 68,098
Ending cash and cash equivalents $ 279,803 $ 68,130

CITY OF UNIVERSITY PARK, TEXAS Notes to Financial Statements
September 30, 2012
46
IV. OTHER INFORMATION
A. Risk management and self-insurance The City maintains a comprehensive self-insurance plan. The self-insurance plan encompasses workers’ compensation benefits, fire, law enforcement, auto fleet, computer hardware and software, other property, public officials’ liability and general liability coverage. The Texas Municipal League Inter-Governmental Risk Pool, a public entity risk pool operating as a common risk management and insurance program, coinsures with the City for individual claim retention levels and corresponding policy limits. The limits and corresponding deductibles are as follows:
Limit Deductible
General Liability 5,000,000 100,000
Law Enforcement Liability 5,000,000 100,000
Error and Omissions Liability 10,000,000 100,000
Automobile Liability 5,000,000 100,000
Automobile Physical Damage Actual Cash Value 10,000/25,000
Real and Personal Property Replacement Value 25,000
Flood and Earthquake Replacement Value 25,000
Mobile Equipment Actual Cash Value 500
Worker’s Compensation - 150,000
All claims and maximums are calculated for a plan year ending each September 30. Settled claims have not exceeded this commercial coverage in any of the past three fiscal years. In January 2000, the City expanded its self-insurance program to include employee health coverage. The program is configured as a Preferred Provider Organization (PPO) using an outside PPO provider network. A third-party insurance company coinsures with the City for claims administration and individual claim retention levels, with policy limits set at $75,000 per occurrence and an aggregate stop loss of $2,468,070 per year. Premium payments are treated as operating revenues of the Comprehensive Self-Insurance Internal Service Fund and operating expenditures/expenses of the participating funds. Included in accrued liabilities are the provisions for claims reported and claims incurred but not reported (collectively, unpaid claims liability). The provision for claims reported is determined by estimating the amount that will ultimately be paid to each claimant. The provision for claims incurred but not reported is estimated based on City experience since the inception of the program. Unpaid claims liability of $305,532 is included in the accrued liabilities of the Comprehensive Self-Insurance Internal Service Fund.

CITY OF UNIVERSITY PARK, TEXAS Notes to Financial Statements
September 30, 2012
47
Changes in the balances of unpaid claims liabilities during 2012 and 2011 were as follows:
2012 2011
Unpaid claims, beginning of year $ 229,080 $ 456,690
Current year claims (including IBNRs) and change in estimate 2,387,356 2,016,278
Claim Payments (2,310,904) (2,243,888)
Unpaid claims, end of year $ 305,532 $ 229,080
B. Commitments and contingencies
1. Water and Sewer Contracts
The City’s water supply is derived from Dallas County/Park Cities Municipal Utility District (“the MUD”) under a twenty-year contract dated March 2, 2004, at an agreed upon rate that is adjusted annually. The 2012 rate for treated water was $2.0281 per 1,000 gallons. The MUD was originally created to serve (and continues to serve) only the cities of University Park and Highland Park. It has its own treatment and storage facilities and obtains its water from Lake Grapevine, in which it has rights to the first 50,000 acre-feet of stored water. During fiscal year 2012, the cost of water purchased under this contract was approximately $4,520,913. On November 5, 1973, the City entered into a 20-year contract for sewage disposal with the City of Dallas. In 1984, the contract with the City of Dallas was extended to February 22, 2014. Under the terms of the contract, Dallas is paid a monthly fee based on average winter month usage. During fiscal 2012, the cost of sewage disposal under this contract was approximately $2,404,039 at a rate of $2.0608 per 1,000 gallons.
2. Contingencies The City is involved in various claims and litigation arising in the ordinary course of operations, none of which, in the opinion of City officials, will have a material effect on the City’s financial position.
C. Deferred compensation plan The City offers its employees a choice of two deferred compensation plans created in accordance with Internal Revenue Code Section 457. The employees have a choice of participating in the Nationwide Retirement Solutions (formerly the Public Employees Benefit Services Corporation or, PEBSCO) plan and/or the International City Management Association Retirement Corporation (ICMA-RC) plan. All amounts of compensation under these plans are placed into investment pools administered by Nationwide and ICMA-RC, respectively. The plans, available to all regular employees, permit deferral of up to $17,000 of compensation ($22,500 for those over 50) in 2012. The deferred compensation is not available to employees until termination, retirement, death, or unforeseeable emergency. All amounts of compensation deferred under these plans, all property and rights purchased with those amounts, and all income attributable to those amounts, property or rights are held in trust by a third party for the exclusive benefit of the participants and their beneficiaries. As a result, the deferred compensation investments are not included in the City’s financial statements.

CITY OF UNIVERSITY PARK, TEXAS Notes to Financial Statements
September 30, 2012
48
D. Retirement plans
1. Texas Municipal Retirement System (TMRS) Plan Description: The City provides pension benefits for all of its eligible employees (except for the City’s fire personnel covered under the FRRF Plan, below) through a non-traditional, joint contributory, hybrid defined benefit plan in the state-wide Texas Municipal Retirement System (TMRS), an agent multiple-employer public employee retirement system. The plan provisions that have been adopted by the City are within the options available in the governing state statutes of TMRS. TMRS issues a publicly available comprehensive annual financial report that includes financial statements and required supplementary information (RSI) for TMRS; the report also provides detailed explanations of the contributions, benefits and actuarial methods and assumptions used by the System. This report is available on TMRS’ website at www.TMRS.com. The plan provisions are adopted by the governing body of the City, within the options available in the state statutes governing TMRS. Plan provisions for the City were as follows:
Contributions: Under the state law governing TMRS, the contribution rate for each city is determined annually by the actuary, using the Projected Unit Credit actuarial cost method. This rate consists of the normal cost contribution rate and the prior service cost contribution rate, which is calculated to be a level percent of payroll from year to year. The normal cost contribution rate finances the portion of an active member’s projected benefit allocated annually; the prior service contribution rate amortizes the unfunded (overfunded) actuarial liability (asset) over the applicable period for that city. Both the normal cost and the prior service contributions include recognition of the projected impact of annually repeating benefits, such as Updated Service Credits and Annuity Increases. The City contributes to the TMRS Plan at the actuarially determined rate. Both the employees and the City make contributions monthly, with the allocation of the City contribution based upon the department to which the employee is assigned. Since the City needs to know its contribution rate in advance for budgetary purposes, there is a one-year delay between the actuarial valuation that serves as the basis for the rate and the calendar year when the rate goes into effect. During fiscal 2012 the City contributed an average rate of 10.9675% to the Plan, which is in excess of the GAAP actuarially required contribution. The City contributed the excess voluntarily and is under no obligation to do so in the future.
Plan Year 2011 Plan Year 2012
Employee deposit rate 7.0 % 7.0 %
Matching ratio (city to employee) 2 to 1 2 to 1
Years required for vesting 10 10
Service retirement eligibility (expressed as
age/years of service)
60/10, 0/20
60/10, 0/20
Updated Service Credit 0% 0%
Annuity Increase (to retirees) 0 % of CPI 0 % of CPI

CITY OF UNIVERSITY PARK, TEXAS Notes to Financial Statements
September 30, 2012
49
The annual pension cost and net pension asset are as follows:
Fiscal 2012
Annual Required Contribution (ARC) $ 1,221,298
Interest on Net Pension Obligation (29,637)
Adjustment to the ARC (28,842)
Annual Pension Cost (APC) 1,162,819
Contributions Made (1,515,057)
Increase in net pension asset (352,238)
Net pension Obligation/(Asset), beginning of year (423,382)
Net pension Obligation/(Asset), end of year $ (775,620)
Three-Year Trend Information
Fiscal
Year
Ending
Annual
Pension
Cost (APC)
Actual
Contribution
Made
Percentage
Of APC
Contributed
Net
Pension
(Obligation)
Asset
2010 1,714,784 1,865,679 109% 270,944
2011 1,737,351 1,889,789 109% 423,382
2012 1,162,819 1,515,057 130% 775,620
The required contribution rates for fiscal year 2012 were determined as part of the December 31, 2009 and 2010 actuarial valuations. Additional information as of the latest actuarial valuation, December 31, 2011, also follows:
12/31/2009 12/31/2010 12/31/2011
Actuarial Cost Method Projected Unit Credit Projected Unit Credit Projected Unit Credit
Amortization Method Level Percent of
Payroll
Level Percent of
Payroll
Level Percent of
Payroll
Amortization Period 22.9 years; closed
period
22.7 years; closed
period
25.2 years; closed
period
Amortization Period for new
Gains/Losses
25 years
25 years
25 years
Asset Valuation Method 10-year Smoothed
Market
10-year Smoothed
Market
10-year Smoothed
Market
Actuarial Assumptions:
Investment Rate of Return* 7.5% 7.0% 7.0%
Projected Salary Increases* Varies by age and
service
Varies by age and
service
Varies by age and
service
* Includes inflation at 3.0% 3.0% 3.0%
Cost-of-Living adjustments 0.0% 0.0% 0.0%

CITY OF UNIVERSITY PARK, TEXAS Notes to Financial Statements
September 30, 2012
50
Funding Status and Funding Progress The funded status as of December 31, 2011, the most recent actuarial valuation date, is presented as follows:
Actuarial
Valuation Date
Actuarial Value
of Assets
Actuarial
Accrued
Liability (AAL)
Funded Ratio
Unfunded AAL
(UAAL)
Covered
Payroll
UAAL as a %
of Covered
Payroll
(1) (2) (3) (4) (5) (6)
(1) / (2) (2) – (1) (4) / (5)
12/31/2011 $68,455,936 $66,362,789 103.2% $(2,093,147) $13,691,204 (15.3)%
Actuarial valuations involves estimates of the value of reported amounts and assumptions about the probability of events far into the future. Actuarially determined amounts are subject to continual revision as actual results are compared to past expectations and new estimates are made about the future. Actuarial calculations are based on the benefits provided under the terms of the substantive plan in effect at the time of each valuation, and reflect a long-term perspective. Consistent with that perspective, actuarial methods and assumptions used include techniques that are designed to reduce short-term volatility in actuarial accrued liabilities and the actuarial value of assets. The schedule of funding progress, presented as Required Supplementary Information following the notes to the financial statements, presents multi-year trend information about whether the actuarial value of the plan assets is increasing or decreasing over time, relative to the actuarial accrued liability of benefits.
2. Firemen’s Relief and Retirement Fund (FRRF) Plan Description: The Board of Trustees is the administrator of the University Park Firemen’s Relief and Retirement Fund, a single-employer defined benefit pension plan. The plan is an independent entity for financial reporting purposes. The City of University Park, Texas is the only contributing employer. Firefighters in the University Park Fire Department are covered by the FRRF and also contribute to the plan. The FRRF does not yet issue separate financial statements. The plan covers current and former fire fighters of the City of University Park, Texas as well as certain beneficiaries of former firefighters. The plan is open to new entrants. The types of employees covered, as well as the plan membership as of December 31, 2010, (the most recent biennial actuarial valuation) are as follows:
Calendar 2010
Retirees and beneficiaries receiving benefits 38
Terminated employees entitled to but not yet receiving benefits 2
Active employees:
Fully vested 7
Partially vested active employees 2
Nonvested 26
Total employees covered by Plan 75

CITY OF UNIVERSITY PARK, TEXAS Notes to Financial Statements
September 30, 2012
51
Benefits: The FRRF provides service retirement, early retirement, disability, death and termination benefits. These benefits fully vest after 20 years of credited service with a partially vested benefit with 19 years of service. Employees may retire at age 50 with 20 years of service. The Plan effective January 1, 2002 provides for a monthly service retirement benefit, payable in a Joint and Two-Thirds to Spouse form of annuity. The monthly benefit equals 60% of the Highest 60-Month Average Salary plus $80.00 per month for each year of service in excess of 20 years. A firefighter has the option to participate in a Retroactive Deferred Option Plan (RETRO DROP) which will provide a lump sum benefit and a reduced annuity upon termination of employment. Firefighters must be at least age 53 with 23 years of service at the selected RETRO DROP benefit calculation date (which is prior to the date of employment termination). There is no provision for automatic postretirement benefit increases. The Fund has the authority to provide, and has periodically provided for, ad hoc postretirement benefit increases. The benefit provisions of this plan are authorized by the Texas Local Fire Fighters’ Retirement Act (TLFFRA). TLFFRA provides the authority and procedure to amend benefit provisions. Contributions: The contribution provisions of this plan are authorized by TLFFRA. TLFFRA provides the authority and procedure to change the amount of contributions determined as a percentage of pay by each firefighter. While the contributions made are not actuarially determined, state law requires that each plan of benefits adopted by the Fund must be approved by an eligible actuary. The actuary certifies that the contribution commitment by the firefighters and the City provides an adequate financing arrangement. Using the entry age actuarial cost method, the Plan’s normal cost contribution rate is determined as a percentage of payroll. The excess of the total contribution rate over the normal cost rate is used to amortize the Plan’s unfunded actuarial accrued liability, and the number of years needed to amortize the plan’s unfunded actuarial accrued liability is determined using a level percentage of payroll method. The costs of administering the plan are paid from the Fund. The funding policy of the FRRF requires contributions of 10% of pay by the members through September 2009. For the period from October 2009 through September 2010, members will contribute 12% of total pay. For the period from October 2010 through September 2011, members will contribute 14% of total pay. For the period from October 2011 through September 2012 members were scheduled to contribute 15% of total pay; however the 2011 increase was extended by one year, by vote of the membership. This resulted in a firefighter contribution rate of 14% during fiscal 2012. In accordance with current TLFFRA statutes, the City is required to make contributions to the FRRF at the same rate paid by the firefighters, or 12%, whichever is less. The City has traditionally contributed to the FRRF at the same rate it contributes to TMRS, which has always resulted in a rate in excess of statutory requirements. On July 1, 2008, the City FRRF contribution rate was set at 15.54% of payroll, to compensate the FRRF for the loss of contributions related to incoming fire department personnel who opted to join the TMRS Plan in accordance with TLFFRA provisions. The City will continue to contribute 15.54% of total pay through September 2013. After September 2013, or such later date that the member contribution rate equals or exceeds that of the City, fund members and the City will contribute at equal, actuarially determined rates, which will pay the

CITY OF UNIVERSITY PARK, TEXAS Notes to Financial Statements
September 30, 2012
52
normal cost and amortize the unfunded actuarial accrued liability over a period not to exceed 30 years. However, in accordance with the plan funding policy neither the member rate (nor the City rate) may exceed 16% of pay. The first such actuarially determined rate will be made in connection with the December 31, 2012 valuation. The rate so determined will apply to the two-year period beginning 21 months after the valuation date. Contribution increases are contingent upon the fire fighters’ receiving at least a 2% cost-of-living pay increase immediately prior to the contribution increase. Annual Pension Cost: The plan has actuarial valuations performed every two years. The most recent valuation was performed as of December 31, 2010, and was used to determine the Annual Required Contribution (ARC) for the fiscal year ending September 30, 2012. The annual pension cost and net pension obligation are as follows:
Fiscal 2012
Annual Required Contribution (ARC) $ 588,526
Interest on NPO (at 8%) 64,275
ARC Adjustment (47,423)
Annual Pension Cost 603,378
City Contribution (461,070)
Change in NPO 142,308
Net Pension Obligation, beginning of period 803,436
Net Pension Obligation, end of period $ 945,744
Three-Year Trend Information:
Fiscal year Ending
Annual
Pension Cost
City
Contribution
Percent of APC
Contributed
Net
Pension
Obligation
2010 574,152 446,874 78% 668,651
2011 602,670 467,885 78% 803,436
2012 603,378 461,070 76% 945,744
General Actuarial Assumptions:
Valuation date 12/31/10
Actuarial cost method Entry Age Normal Actuarial Cost
Amortization method Level percent of payroll, open
period
Amortization period for ARC 30 years
Remaining amortization period 40.6 years
Asset valuation method Market value, 5-year smoothing
Investment rate of return 8.0%, compounded annually
Projected salary increases 4.0%, plus promotion and longevity
Cost-of-living adjustments None
Payroll increases 4.0%, compounded annually
As of December 31, 2010, the most recent actuarial valuation date, the plan was 50.7% funded. The actuarial accrued liability for benefits was $17,779,730, and the actuarial value of assets was $9,008,704, resulting in an unfunded actuarial accrued liability (UAAL) of $8,771,026. The covered payroll (annual

CITY OF UNIVERSITY PARK, TEXAS Notes to Financial Statements
September 30, 2012
53
payroll of active employees covered by the plan) was $2,889,532, and the ratio of the UAAL to the covered payroll was 303.5% The schedule of funding progress, presented as Required Supplementary Information following the notes to the financial statements, presents multi-year trend information about whether the actuarial value of the plan assets is increasing or decreasing over time, relative to the actuarial accrued liability of benefits.
F. Retiree Health Care Plan Plan Description The City of University Park offers certain health care benefits to retired employees through a single-employer defined benefit plan (the “Plan”). Permanent full-time employees of the City of University Park are eligible to participate in the Plan upon retirement. They may remain members of the Plan until they reach the age of 65 or otherwise become eligible for Medicare benefits. Members must pay 100% of the retiree health care premium. Members become eligible to participate in the Plan upon normal service retirement, or if they meet the Disability Retirement provisions of TMRS or FRRF, whichever applies, and draw disability retirement benefits from TMRS or FRRF, whichever applies. Members terminating their employment before normal service retirement conditions are not eligible for retiree health care. The City of University Park does not provide subsidized retiree vision or dental coverage. The Plan does not issue separate financial statements. All payments received or made on behalf of the Plan are done so through the Comprehensive Self-Insurance Fund. Current retirees contribute to the Plan an amount approximating the blended premium for active and retired participants. This amount is determined annually by an Employee Benefits Committee, under the direction of the City Council. Retiree contribution rates for fiscal 2011 range from $8,000 to $13,500 per year, depending on coverage levels. Annual OPEB Cost and Net OPEB Obligation The City’s annual other postemployment benefit (OPEB) cost is calculated based on the annual required contribution of the employer (ARC), an amount actuarially determined in accordance with the parameters of GASB Statement 45. The ARC represents a level of funding that, if paid on an ongoing basis, is projected to cover normal cost each year and amortize any unfunded actuarial liabilities over a period not to exceed thirty years. Beginning with fiscal 2009, the ARC has been calculated assuming “pay-as-you-go” (PAYGO) funding. In 2009, the first year GASB Statement 45 was adopted, the annual OPEB cost was equal to the ARC. Actual claims and certain other costs paid on behalf of retirees may be treated as employer contributions in relation to the ARC and act to reduce the Net OPEB Obligation. The following table shows the components of the City’s annual OPEB cost for the year, the amount actually contributed to the OPEB Plan, and the changes in the City’s Net OPEB Obligation.
Fiscal 2012
Annual Required Contribution (ARC) under PAYGO funding $ 59,572
Interest on Net OPEB Obligation (at 4.5%) 6,567
ARC Adjustment (6,084)
Annual OPEB Cost 60,055
Contributions made 12,617
Change in OPEB Obligation 72,672
Net OPEB Obligation, beginning of the year 145,943
Net OPEB Obligation, end of year $ 218,615

CITY OF UNIVERSITY PARK, TEXAS Notes to Financial Statements
September 30, 2012
54
Contributions made (as presented above) include offsetting retiree premium payments, which were in excess of employer costs. This resulted in a net increase in the OPEB Obligation for the year. Three-Year Trend Information:
Fiscal
Year
Ending
Annual
OPEB Cost
Actual
Contribution
Made
Percentage
Annual OPEB
Cost
Contributed
Net
OPEB
Obligation
2010 $ 48,728 $ 59,287 122% $ 16,385
2011 59,626 (69,932) (117%) 145,943
2012 60,055 (12,617) (21%) 218,615
Funded Status As of December 31, 2010, the most recent actuarial valuation date, the present value of all benefits expected to be paid to current OPEB Plan members was $1,020,804. The actuarial accrued liability, which is the portion of the $1,020,804 attributable to service accrued by OPEB Plan members as of December 31, 2010 is $654,401. As of December 31, 2010 there are $0 in valuation assets to offset the liabilities of the plan, resulting in an unfunded accrued actuarial liability of $654,401 and a 0% funded ratio. The covered payroll (annual payroll of active employees covered by the plan) was $16,288,708, and the ratio of the UAAL to the covered payroll was 4%. Actuarial Methods and Assumptions Projections of benefits for financial reporting purposes are based on the substantive plan (the plan as understood by the employer and the plan members) and include the types of benefits provided at the time of each valuation and the historical pattern of sharing the benefit costs between the employer and plan members. The actuarial methods and assumptions used include techniques that are designed to reduce the effects of short-term volatility in actuarial accrued liabilities and the actuarial value of assets, consistent with the long-term perspective of the calculations. In the December 2010 actuarial valuation, the Projected Unit Credit, level Percent of Payroll actuarial cost method was used to calculate the ARC. The actuarial assumptions include a 4.5% investment rate of return, compounded annually net after investment expenses. The assumed real rate of return is the rate of return in excess of general price inflation, which was assumed to be 3% per year. Considering other assumptions used in the valuation, the 4.5% nominal rate translates to a real net return of 1.5% a year. The payroll growth rate for funding the Unfunded Actuarial Accrued Liabilities was assumed to be 3% per year. The annual healthcare cost increase was 10% for 2008, decreasing by ½% per year, until reaching an ultimate rate of 4.5% in 2019. The unfunded actuarial liability is amortized over a closed 30-year period, which is the maximum time period permitted by Governmental Accounting Standards Board Statements No. 43 and No. 45. The schedule of funding progress, presented as Required Supplementary Information following the notes to the financial statements, presents multi-year trend information about whether the actuarial value of the plan assets is increasing or decreasing over time, relative to the actuarial accrued liability of benefits.

55
REQUIRED SUPPLEMENTARY INFORMATION

56
CITY OF UNIVERSITY PARK, TEXAS
Required Supplementary Information
Texas Municipal Retirement System
Schedule of Funding Progress (Unaudited)
Actuarial UAAL as a
Actuarial Accrued Unfunded Percentage of
Actuarial Value of Liability Funded AAL Covered Covered
Valuation Assets (AAL) ratio (UAAL) Payroll Payroll
Date (a) (b) (a/b) (b - a) (c) ((b - a)/c)
12/31/2006 33,147,932$ 42,455,169$ 78.1% 9,307,237$ 11,385,193$ 81.7%
12/31/2007 35,355,395 42,561,905 83.1% 7,206,510 11,889,237 60.6%
12/31/2008 37,658,489 45,803,913 82.2% 8,145,424 13,437,942 60.6%
12/31/2009 40,945,370 48,868,246 83.8% 7,922,876 13,072,461 60.6%
12/31/2010 63,484,063 63,505,074 100.0% 21,011 13,399,176 0.2%
12/31/2011 68,455,936 66,362,789 103.2% (2,093,147) 13,691,204 -15.3%
Schedule of Employer Contributions (Unaudited)
Fiscal Annual
Year Required Contribution Percent
Ended Contribution Made Contributed
9/30/2007 1,769,296$ 1,769,296$ 100%
9/30/2008 1,865,848 1,865,848 100%
9/30/2009 1,711,355 1,831,404 107%
9/30/2010 1,731,906 1,865,679 108%
9/30/2011 1,776,501 1,889,789 106%
9/30/2012 1,221,298 1,515,057 124%

57
CITY OF UNIVERSITY PARK, TEXAS
Required Supplementary Information
University Park Firefighters' Relief and Retirement Fund
Schedule of Funding Progress (Unaudited)
Actuarial UAAL as a
Actuarial accrued Unfunded Annual percentage of
Actuarial value of liability AAL Funded covered covered
valuation assets (AAL) (UAAL) ratio payroll payroll
date (a) (b) (b - a) (a/b) (c) ((b - a)/c)
12/31/2006 8,298,911$ 14,262,290$ 5,963,379$ 58.2% 2,674,018$ 223.0%
12/31/2007 8,298,911.0 14,262,290 5,963,379 58.2% 2,674,018 223.0%
12/31/2008 * 7,711,346 16,670,415 8,959,069 46.3% 2,966,070 302.1%
12/31/2009 7,711,346 16,670,415 8,959,069 46.3% 2,966,070 302.1%
12/31/2010 9,008,704 17,779,730 8,771,026 50.7% 2,889,532 303.5%
12/31/2011 9,008,704 17,779,730 8,771,026 50.7% 2,889,532 303.5%
* - A change in the provider of actuarial services was made. Economic and demographic assumptions were revised.
Schedule of Contributions (Unaudited)
Fiscal Annual
Year Required Contribution Percent
Ended Contribution Made Contributed
9/30/2007 491,313$ 401,481$ 82%
9/30/2008 505,229 417,495 83%
9/30/2009 538,770 444,785 83%
9/30/2010 562,797 446,874 79%
9/30/2011 588,645 467,885 79%
9/30/2012 586,526 461,070 79%
..

58
CITY OF UNIVERSITY PARK, TEXAS
Required Supplementary Information
Retiree Health Care Plan
Schedule of Funding Progress (Unaudited)
Actuarial UAAL as a
Actuarial accrued Unfunded Annual percentage of
Actuarial value of liability AAL Funded covered covered
valuation assets (AAL) (UAAL) ratio payroll payroll
date (a) (b) (b - a) (a/b) (c) ((b - a)/c)
6/30/2008 - 537,462$ 537,462$ 0.0% 14,001,820$ 3.8%
12/31/2010 - 654,401 654,401 0.0% 16,288,708 4.0%
There were no actuarial valuations prior to June 30, 2008.
Schedule of Employer Contributions (Unaudited)
Fiscal Annual
Year Required Contribution Percent
Ended Contribution Made Contributed
9/30/2009 48,630$ 21,686$ 45%
9/30/2010 48,630 59,287 122%
9/30/2011 59,572 (69,932) -117%
9/30/2012 59,572 (12,617) -21%
..

59
CITY OF UNIVERSITY PARK, TEXASBudgetary Comparison Schedule
General Fund
For the Year Ended September 30, 2012
Variance with
Budgeted Amounts Final Budget
Original Final Actual Amounts Positive (Negative)
Budgetary fund balance, October 1 28,311,281$ 28,311,281$ 28,311,281$ -$
Resources (inflows)
Property taxes 15,713,842 15,713,842 15,502,274 (211,568)
Sales tax 3,286,851 3,286,851 3,395,645 108,794
Franchise fees 1,910,000 1,910,000 2,094,494 184,494
Permits and licenses 1,537,000 1,537,000 3,192,446 1,655,446
Fines 531,000 531,000 750,077 219,077
Charges for services 1,729,730 1,729,730 1,434,766 (294,964)
Other 1,185,077 1,185,077 445,974 (739,103)
Investment income 265,000 265,000 160,677 (104,323)
Amounts available for appropriation 54,469,781 54,469,781 55,287,634 817,853
Charges to appropriations (outflows)
General Government 3,762,543 3,810,431 3,598,166 212,265
Public Safety 11,858,984 11,957,729 11,754,476 203,253
Streets 1,756,234 1,750,341 1,780,280 (29,939)
Parks 3,104,093 3,118,973 3,073,320 45,653
Public Works 2,610,045 2,613,812 2,528,517 85,295
Transfers 3,032,187 3,032,187 4,460,736 (1,428,549)
Total charges to appropriations 26,124,086 26,283,473 27,195,495 (912,022)
Budgetary fund balance, September 30 28,345,695$ 28,186,308$ 28,092,139$ (94,169)$
See notes to required supplementary information.

CITY OF UNIVERSITY PARK, TEXAS Notes to Required Supplementary Information
September 30, 2012
60
Budgetary Information
The City uses the following process to legally adopt the General Fund annual budget as reflected in the
financial statements:
1. Before September 1, the City Manager submits to the City Council a proposed operating budget for
the fiscal year commencing October 1. The operating budget includes proposed expenditures and the
means of financing them.
2. Public hearings are conducted to obtain tax - and ratepayer opinion. Public notice is given as required
by State law.
3. Before October 1, the City Council legally enacts the budget through passage of an ordinance.
The City Manager is authorized to transfer budgeted amounts between departments (functions); however,
any amendments that increase a fund’s total expenditures must be approved by the City Council after
appropriate public notice and citizen participation.
Management exercises control over budgeted expenditures by sub-function (i.e., department or division),
as presented in the accompanying financial statements. Unused appropriations lapse at the end of each
fiscal year.
Formal budgetary integration is employed as a planning device for the General Fund. The City adopts an
annual operating budget that is prepared on a modified accrual basis consistent with generally accepted
accounting principles.

61
OTHER SUPPLEMENTARY INFORMATION

62

63
COMBINING FINANCIAL STATEMENTS
Nonmajor Governmental Funds
Special revenue funds are used to account for specific revenue sources that are restricted or committed
to expenditure for specified purposes.
University Park Civic Foundation – This fund is used to account for private donations and contributions
to the City. Donations may be made for a specific project or specifically restricted for use in charitable,
scientific, literary, educational, and public safety programs.
Court Security - This fund is used to account for the receipt and expenditure of the Municipal Court
Building Security Fee that is charged to defendants in accordance with state law. Money in the fund may
be used only to finance security personnel or to finance items which are used for the purpose of providing
security services for buildings housing a municipal court.
Court Technology - This fund is used to account for the receipt and expenditure of the Municipal Court
Technology Fee that is charged to defendants in accordance with state law. Money in the fund may be
used only to finance the purchase of or to maintain technological enhancements for a municipal court.
Police Training and Education - This fund is used to account for the receipt and expenditure of monies
received from various agencies specifically for police trainng and education purposes.
Police Forfeiture Fund – This fund is used to account for funds awarded by the court to the Police
Department. The expenditure of these funds is legally restricted for use in police activities.
Fire Training and Education - This fund is used to account for the receipt and expenditure of monies
received from various agencies specifically for fire personnel trainng and education purposes.

64
CITY OF UNIVERSITY PARK, TEXASCombining Balance Sheet
Nonmajor Governmental Funds
September 30, 2012
Special Revenue Funds
University Park Police Training Fire Training
Civic Foundation Court Security Court Technology and Education Police Forfeiture and Education Total
ASSETS
Cash and cash equivalents 23,749$ -$ -$ -$ 8,694$ -$ 32,443$
Due from other funds 24 47,846 79,983 34,449 - 10,540 172,842
Total assets 23,773$ 47,846$ 79,983$ 34,449$ 8,694$ 10,540$ 205,285$
LIABILITIES
Due to other funds -$ -$ -$ 12,637$ -$ -$ 12,637$
Total liabilities - - - 12,637 - - 12,637
FUND BALANCES
Assigned to:
General Government 1,228$ -$ -$ -$ -$ -$ 1,228$
Public Safety - 47,846 79,983 21,812 8,694 10,540 168,875
Parks 22,545 - - - - - 22,545
Unassigned - - - - - - -
Total fund balances 23,773 47,846 79,983 21,812 8,694 10,540 192,648
Total liabilities and fund balances 23,773$ 47,846$ 79,983$ 34,449$ 8,694$ 10,540$ 205,285$

65
CITY OF UNIVERSITY PARK, TEXASCombining Statement of Revenues, Expenditures, and
Changes in Fund Balances
Nonmajor Governmental Funds
For the Year Ended September 30, 2012
University Park Police Training Fire Training
Civic Foundation Court Security Court Technology and Education Police Forfeiture and Education Total
REVENUES
Investment income 9$ -$ -$ -$ 9$ -$ 18$
Fines - 8,268 10,963 - - - 19,231
Donations 12,276 - - - - - 12,276
Other - - - - 5,850 - 5,850
Total revenues 12,285 8,268 10,963 - 5,859 - 37,375
EXPENDITURES
Parks 6,708 - - - - - 6,708
Scholarships 12,000 - - - - - 12,000
General Government - - - - - - -
Public Safety - - - 12,637 2,852 - 15,489
Total expenditures 18,708 - - 12,637 2,852 - 34,197
Excess (deficiency) of revenues
over (under) expenditures (6,423) 8,268 10,963 (12,637) 3,007 - 3,178
OTHER FINANCING SOURCES
Transfers in - 39,578 69,020 34,449 - 10,540 153,587
Total other financing sources - 39,578 69,020 34,449 - 10,540 153,587
Net change in fund balances (6,423) 47,846 79,983 21,812 3,007 10,540 156,765
Fund balances - beginning 30,196 - - - 5,687 - 35,883
Fund balances - ending 23,773$ 47,846$ 79,983$ 21,812$ 8,694$ 10,540$ 192,648$
Special Revenue Funds

66

67
COMBINING FINANCIAL STATEMENTS
Internal Service Funds
The Internal Service Funds account for the services provided by one department to other departments of
the City on a cost reimbursement basis. The following is a description of the City’s Internal Service
Funds.
Equipment Services Fund - accounts for the costs of materials, supplies and the acquisition and
maintenance of specific equipment used exclusively by other departments of the City.
Comprehensive Self-Insurance Fund - accounts for the costs associated with the general liability,
property and casualty, medical and worker’s compensation self-insurance program established by the
City.

68
CITY OF UNIVERSITY PARK, TEXASCombining Statement of Net Assets
Internal Service Funds
September 30, 2012
Equipment Comprehensive
services self-insurance Total
ASSETS
Current assets:
Cash and cash equivalents 1,101,686$ 202,901$ 1,304,587$
Investments 2,166,775 2,005,415 4,172,190
Receivables 5,415 8,889 14,304
Due from other funds 3,641,455 8,394,122 12,035,577
Total current assets 6,915,331 10,611,327 17,526,658
Non-current assets:
Capital assets
Machinery and equipment 9,673,964 - 9,673,964
Accumulated depreciation (5,530,793) - (5,530,793)
Total non-current assets 4,143,171 - 4,143,171
Total assets 11,058,502 10,611,327 21,669,829
LIABILITIES
Current liabilities:
Accounts payable 41,012 6,223 47,235
Accrued liabilities 25,312 305,532 330,844
Accrued compensated absences 45,128 - 45,128
Due to other funds 821,128 2,002,468 2,823,596
Total current liabilities 932,580 2,314,223 3,246,803
Non-current liabilities:
Accrued compensated absences 66,628 - 66,628
Total non-current liabilities 66,628 - 66,628
Total liabilities 999,208 2,314,223 3,313,431
NET ASSETS
Invested in capital assets 4,143,171 - 4,143,171
Unrestricted 5,916,123 8,297,104 14,213,227
Total net assets 10,059,294$ 8,297,104$ 18,356,398$

69
CITY OF UNIVERSITY PARK, TEXASCombining Statement of Revenues, Expenses,
and Changes in Fund Net Assets
Internal Service Funds
For the Year Ended September 30, 2012
Equipment Comprehensive
services self-insurance Total
Operating revenues
Charges for service 1,496,275$ -$ 1,496,275$
Premiums - 2,954,249 2,954,249
Other income 322 - 322
Total operating revenues 1,496,597 2,954,249 4,450,846
Operating expenses
Claims paid and change in estimate - 2,387,356 2,387,356
Personal services 836,890 - 836,890
Administrative and fiscal services - 643,937 643,937
Depreciation 573,581 - 573,581
Supplies and other 18,023 - 18,023
Contractual and other services 84,930 58,777 143,707
Total operating expenses 1,513,424 3,090,070 4,603,494
Operating loss (16,827) (135,821) (152,648)
Nonoperating revenues
Investment income 11,149 15,469 26,618
Gain on sale of capital assets 136,042 - 136,042
Net Income (loss) 130,364 (120,352) 10,012
Total net assets - beginning 9,928,930 8,417,456 18,346,386
Total net assets - ending 10,059,294$ 8,297,104$ 18,356,398$

70
CITY OF UNIVERSITY PARK, TEXASCombining Statement of Cash Flows
Internal Service Funds
For the Year ended September 30, 2012
Equipment Comprehensive
services self-insurance Total
CASH FLOWS FROM OPERATING ACTIVITIES
Receipts from customers and users 1,493,643$ 2,948,403$ 4,442,046$
Payments from other funds 560,109 1,265,147 1,825,256
Payments to suppliers (65,059) (3,007,771) (3,072,830)
Payments to employees (826,379) - (826,379)
Net cash provided by operating activities 1,162,314 1,205,779 2,368,093
CASH FLOWS FROM CAPITAL AND RELATED FINANCING
ACTIVITIES
Acquisition of capital assets (1,330,732) - (1,330,732)
Proceeds from sale of capital assets 168,538 - 168,538
Net cash used in capital and related financing activities (1,162,194) - (1,162,194)
CASH FLOWS FROM INVESTING ACTIVITIES
Purchase of investment securities (2,164,847) (2,000,000) (4,164,847)
Proceeds from the sale and maturities of
investment securities 2,157,929 - 2,157,929
Interest on investments 8,061 10,054 18,115
Net cash provided by (used in) investing activities 1,143 (1,989,946) (1,988,803)
Net increase (decrease) in cash and cash equivalents 1,263 (784,167) (782,904)
Cash and cash equivalents, beginning of year 1,100,423 987,068 2,087,491
Cash and cash equivalents, end of year 1,101,686$ 202,901$ 1,304,587$
Reconciliation of operating income (loss) to net
cash provided by operating activities:
Operating income (loss) (16,827)$ (135,821)$ (152,648)$
Adjustments to reconcile operating income (loss)
to net cash provided by operating activities:
Depreciation expense 573,581 - 573,581
Decrease (increase) in due from other funds (245,281) 1,253,574 1,008,293
Increase in deposit on insurance claims - (1,957) (1,957)
Increase in interest receivable (2,954) (3,889) (6,843)
Increase in accrued liabilities 48,405 82,299 130,704
Increase in due to other funds 805,390 11,573 816,963
Total adjustments 1,179,141 1,341,600 2,520,741
Net cash provided by operating activities 1,162,314$ 1,205,779$ 2,368,093$
NON-CASH INVESTING ACTIVITIES
Change in the fair value of investments 10,006$ 2,005,415$ 2,015,421$

71

72
This part of the City of University Park 's comprehensive annual financial report presents detailed
information as a context for understanding what the information in the financial statements, note
disclosures, and required supplementary information says about the city's overall financial health.
CONTENTS Tables
Financial Trends 1-4
These schedules contain trend information to help the reader understand how the city's financial
performance and well-being have changed over time.
Revenue Capacity 5-8
These schedules contain information to help the reader assess the city's most significant local
revenue source, the property tax.
Debt Capacity 9-13
These schedules present information to help the reader assess the city's current levels of
outstanding debt (if any) and the city's ability to issue debt in the future.
Demographic and Economic Information 14-15
These schedules offer demographic and economic indicators to help the reader understand the
environment within which the city's financial activities take place.
Operating Information 16-18
These schedules contain service and infrastructure data to help the reader understand how the
information in the city's financial report relates to the services the city provides and the activities it
performs.
Sources: Unless otherwise noted, the information in these schedules is derived from the comprehensive
annual financial reports for the relevant year. The City implemented GASB-34 in fiscal 2003;
schedules presenting government-wide information include information beginning in that year.
STATISTICAL SECTION

73
CITY OF UNIVERSITY PARK, TEXAS Table 1
NET ASSETS BY COMPONENT
Last Ten Fiscal Years
(accrual basis of accounting)
(Unaudited)
2003 2004 2005 2006 2007 2008 2009 2010 2011 2012
Governmental activities:
Invested in capital assets 28,690,806$ 31,065,983$ 31,951,900$ 33,785,948$ 45,450,240$ 50,496,272$ 56,768,201$ 59,672,952$ 60,538,038$ 62,312,988$
Unrestricted 32,997,440 29,247,304 36,050,538 36,806,337 29,816,358 27,944,347 42,237,664 40,972,031 44,123,844 44,289,220
Total governmental activities net assets 61,688,246$ 60,313,287$ 68,002,438$ 70,592,285$ 75,266,598$ 78,440,619$ 99,005,865$ 100,644,983$ 104,661,882$ 106,602,208$
Business-type activities:
Invested in capital assets 26,994,790$ 29,222,727$ 33,877,386$ 38,360,267$ 39,965,081$ 39,024,619$ 44,386,134$ 45,828,561$ 47,970,897$ 49,683,932$
Unrestricted 14,897,507 16,146,478 12,003,158 11,792,463 11,155,204 12,244,408 8,610,182 8,558,576 8,690,783 8,156,715
Total business-type activities net assets 41,892,297$ 45,369,205$ 45,880,544$ 50,152,730$ 51,120,285$ 51,269,027$ 52,996,316$ 54,387,137$ 56,661,680$ 57,840,647$
Primary government:
Invested in capital assets 55,685,596$ 60,288,710$ 65,829,286$ 72,146,215$ 85,415,321$ 89,520,891$ 101,154,335$ 105,501,513$ 108,508,935$ 111,996,920$
Unrestricted 47,894,947 45,393,782 48,053,696 48,598,800 40,971,562 40,188,755 50,847,846 49,530,607 52,814,627 52,445,935
Total primary government net assets 103,580,543$ 105,682,492$ 113,882,982$ 120,745,015$ 126,386,883$ 129,709,646$ 152,002,181$ 155,032,120$ 161,323,562$ 164,442,855$
Source: Comprehensive Annual Financial Report
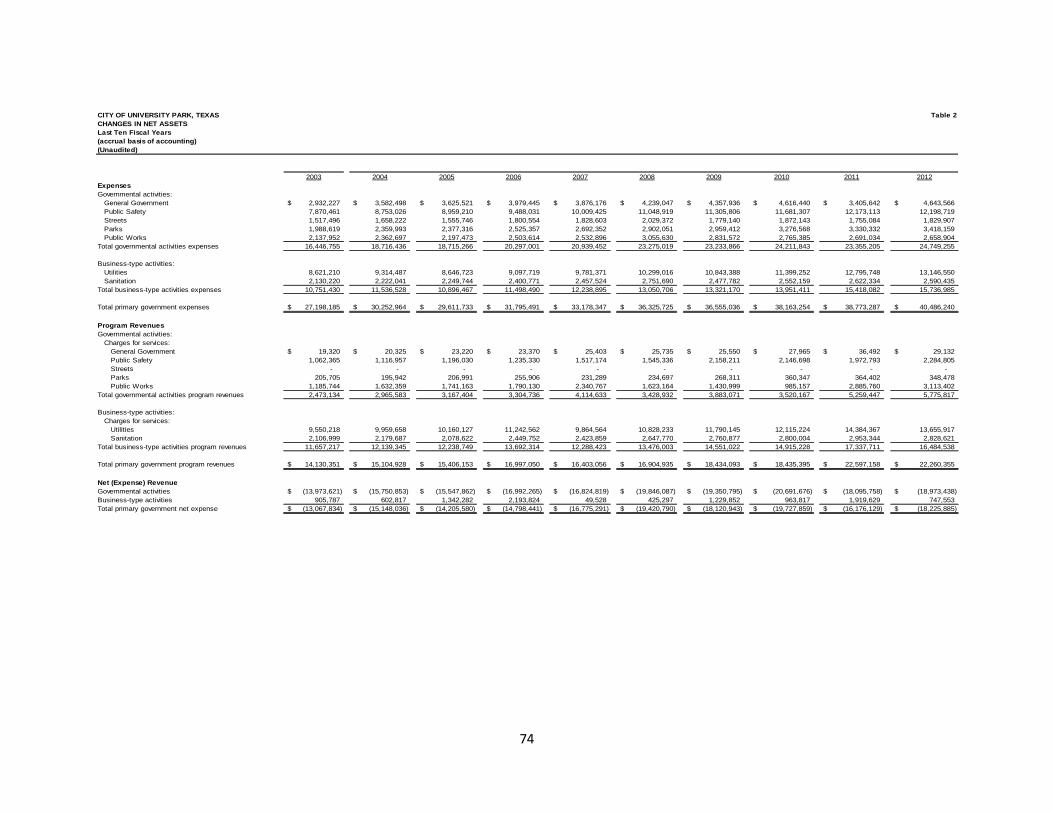
74
CITY OF UNIVERSITY PARK, TEXAS Table 2
CHANGES IN NET ASSETS
Last Ten Fiscal Years
(accrual basis of accounting)
(Unaudited)
2003 2004 2005 2006 2007 2008 2009 2010 2011 2012
Expenses
Governmental activities:
General Government 2,932,227$ 3,582,498$ 3,625,521$ 3,979,445$ 3,876,176$ 4,239,047$ 4,357,936$ 4,616,440$ 3,405,642$ 4,643,566$
Public Safety 7,870,461 8,753,026 8,959,210 9,488,031 10,009,425 11,048,919 11,305,806 11,681,307 12,173,113 12,198,719
Streets 1,517,496 1,658,222 1,555,746 1,800,554 1,828,603 2,029,372 1,779,140 1,872,143 1,755,084 1,829,907
Parks 1,988,619 2,359,993 2,377,316 2,525,357 2,692,352 2,902,051 2,959,412 3,276,568 3,330,332 3,418,159
Public Works 2,137,952 2,362,697 2,197,473 2,503,614 2,532,896 3,055,630 2,831,572 2,765,385 2,691,034 2,658,904
Total governmental activities expenses 16,446,755 18,716,436 18,715,266 20,297,001 20,939,452 23,275,019 23,233,866 24,211,843 23,355,205 24,749,255
Business-type activities:
Utilities 8,621,210 9,314,487 8,646,723 9,097,719 9,781,371 10,299,016 10,843,388 11,399,252 12,795,748 13,146,550
Sanitation 2,130,220 2,222,041 2,249,744 2,400,771 2,457,524 2,751,690 2,477,782 2,552,159 2,622,334 2,590,435
Total business-type activities expenses 10,751,430 11,536,528 10,896,467 11,498,490 12,238,895 13,050,706 13,321,170 13,951,411 15,418,082 15,736,985
Total primary government expenses 27,198,185$ 30,252,964$ 29,611,733$ 31,795,491$ 33,178,347$ 36,325,725$ 36,555,036$ 38,163,254$ 38,773,287$ 40,486,240$
Program Revenues
Governmental activities:
Charges for services:
General Government 19,320$ 20,325$ 23,220$ 23,370$ 25,403$ 25,735$ 25,550$ 27,965$ 36,492$ 29,132$
Public Safety 1,062,365 1,116,957 1,196,030 1,235,330 1,517,174 1,545,336 2,158,211 2,146,698 1,972,793 2,284,805
Streets - - - - - - - - - -
Parks 205,705 195,942 206,991 255,906 231,289 234,697 268,311 360,347 364,402 348,478
Public Works 1,185,744 1,632,359 1,741,163 1,790,130 2,340,767 1,623,164 1,430,999 985,157 2,885,760 3,113,402
Total governmental activities program revenues 2,473,134 2,965,583 3,167,404 3,304,736 4,114,633 3,428,932 3,883,071 3,520,167 5,259,447 5,775,817
Business-type activities:
Charges for services:
Utilities 9,550,218 9,959,658 10,160,127 11,242,562 9,864,564 10,828,233 11,790,145 12,115,224 14,384,367 13,655,917
Sanitation 2,106,999 2,179,687 2,078,622 2,449,752 2,423,859 2,647,770 2,760,877 2,800,004 2,953,344 2,828,621
Total business-type activities program revenues 11,657,217 12,139,345 12,238,749 13,692,314 12,288,423 13,476,003 14,551,022 14,915,228 17,337,711 16,484,538
Total primary government program revenues 14,130,351$ 15,104,928$ 15,406,153$ 16,997,050$ 16,403,056$ 16,904,935$ 18,434,093$ 18,435,395$ 22,597,158$ 22,260,355$
Net (Expense) Revenue
Governmental activities (13,973,621)$ (15,750,853)$ (15,547,862)$ (16,992,265)$ (16,824,819)$ (19,846,087)$ (19,350,795)$ (20,691,676)$ (18,095,758)$ (18,973,438)$
Business-type activities 905,787 602,817 1,342,282 2,193,824 49,528 425,297 1,229,852 963,817 1,919,629 747,553
Total primary government net expense (13,067,834)$ (15,148,036)$ (14,205,580)$ (14,798,441)$ (16,775,291)$ (19,420,790)$ (18,120,943)$ (19,727,859)$ (16,176,129)$ (18,225,885)$

75
General Revenues and Other Changes in Net Assets
Governmental Activities:
Taxes:
Ad valorem 11,840,118$ 12,307,610$ 12,840,481$ 13,406,362$ 13,837,528$ 14,724,370$ 15,399,326$ 15,918,098$ 15,928,388$ 15,484,579$
Sales tax 2,021,774 2,013,055 4,169,557 3,321,100 3,290,325 3,269,205 2,939,262 3,228,336 3,584,805 3,395,645
Franchise Fees 1,759,587 1,764,849 1,833,255 2,019,474 2,075,069 2,071,490 2,136,595 2,049,354 2,207,303 2,094,494
Investment earnings 570,340 449,881 926,817 1,962,738 2,218,786 1,455,605 414,462 369,718 208,533 188,888
Other 481,394 471,212 2,285,872 219,687 120,804 91,966 1,333,295 1,065,968 502,174 90,026
Contribution 42,029 76,191 1,664 2,746 2,821 1,026 34 34 34 32
Donations 41,271 27,385 14,135 43,925 11,520 34,614 240,640 51,462 33,596 12,276
Gain (loss) on sale of capital assets (255,826) 37,251 - 138,037 62,098 724,008 17,804,603 - - -
Transfers - (2,771,540) 1,165,232 (1,531,957) (341,916) 647,824 (352,176) (352,176) (352,176) (352,176)
Total governmental activities 16,500,687 14,375,894 23,237,013 19,582,112 21,277,035 23,020,108 39,916,041 22,330,794 22,112,657 20,913,764
Business-type activities:
Investment earnings 249,503 97,628 248,588 415,086 425,616 239,132 61,253 1,792 2,738 3,241
Other 94,816 4,923 85,701 75,913 124,203 115,979 88,826 73,036 - 75,997
Gain (loss) on sale of capital assets 7,415 - - 55,406 26,292 16,158 (4,818) - - -
Transfers - 2,771,540 (1,165,232) 1,531,957 341,916 (647,824) 352,176 352,176 352,176 352,176
Total business-type activities 351,734 2,874,091 (830,943) 2,078,362 918,027 (276,555) 497,437 427,004 354,914 431,414
Total Primary Government 16,852,421$ 17,249,985$ 22,406,070$ 21,660,474$ 22,195,062$ 22,743,553$ 40,413,478$ 22,757,798$ 22,467,571$ 21,345,178$
Change in Net Assets
Governmental activities 2,527,066$ (1,374,959)$ 7,689,151$ 2,589,847$ 4,452,216$ 3,174,021$ 20,565,246$ 1,639,118$ 4,016,899$ 1,940,326$
Business-type activities 1,257,521 3,476,908 511,339 4,272,186 967,555 148,742 1,727,289 1,390,821 2,274,543 1,178,967
Total Primary Government 3,784,587$ 2,101,949$ 8,200,490$ 6,862,033$ 5,419,771$ 3,322,763$ 22,292,535$ 3,029,939$ 6,291,442$ 3,119,293$
Source: Comprehensive Annual Financial Report

76
CITY OF UNIVERSITY PARK, TEXAS Table 3
FUND BALANCES, GOVERNMENTAL FUNDS
Last Ten Fiscal Years
(modified accrual basis of accounting)
(Unaudited)
2003 2004 2005 2006 2007 2008 2009 2010
General Fund
Reserved 981,184$ 679,591$ 964,899$ 980,093$ 1,029,841$ 1,322,841$ 1,195,862$ 940,083$
Unreserved 10,306,642 12,062,814 13,774,824 14,190,255 10,731,289 7,428,129 23,743,726 24,285,828
Total general fund 11,287,826$ 12,742,405$ 14,739,723$ 15,170,348$ 11,761,130$ 8,750,970$ 24,939,588$ 25,225,911$
All Other Governmental Funds
Reserved 283,291$ 1,952,987$ 918,802$ 413,448$ 6,777,509$ 7,588,765$ 3,451,470$ 1,459,551$
Unreserved, reported in:
Capital Projects fund 12,550,734 10,507,392 15,724,820 15,890,519 5,011,524 4,619,939 5,931,904 7,971,336
Special revenue funds 55,467 71,686 37,849 44,281 53,741 76,919 132,990 52,888
Total all other governmental funds 12,889,492$ 12,532,065$ 16,681,471$ 16,348,248$ 11,842,774$ 12,285,623$ 9,516,364$ 9,483,775$
Note: In fiscal year 2011, the City implemented GASB 54, which classifies fund balance as non-spendable, restricted, committed, assigned and unassigned. No previous years were restated.
2011 2012
General Fund
Nonspendable 447,942$ 502,835$
Spendable
Restricted 1,274,954 -
Committed 20,750,202 20,750,202
Assigned 711,397 644,732
Unassigned 5,126,786 6,194,370
Total General Fund 28,311,281$ 28,092,139$
All Other Governmental Funds
Nonspendable -$ -$
Spendable
Restricted - -
Committed - -
Assigned 9,831,161 10,824,871
Unassigned - -
Total all other governmental funds 9,831,161$ 10,824,871$
Source: Comprehensive Annual Financial Report

77
CITY OF UNIVERSITY PARK, TEXAS Table 4
CHANGES IN FUND BALANCES, GOVERNMENTAL FUNDS
Last Ten Fiscal Years
(modified accrual basis of accounting)
(Unaudited)
2003 2004 2005 2006 2007 2008 2009 2010 2011 2012
Revenues
Taxes:
Ad Valorem 11,693,344$ 12,212,128$ 12,711,530$ 13,319,850$ 13,966,786$ 14,697,483$ 15,397,077$ 15,942,896$ 15,942,729$ 15,502,274$
Sales 2,021,775 2,013,055 4,169,557 3,321,100 3,290,325 3,269,205 2,939,262 3,228,336 3,584,805 3,395,645
Franchise fees 1,759,587 1,764,849 1,833,255 2,019,474 2,075,069 2,071,490 2,136,595 2,049,354 2,207,303 2,094,494
Permits and licenses 1,576,552 2,058,006 2,148,237 2,152,435 2,818,039 2,062,834 1,572,127 1,071,690 2,973,785 3,192,446
Fines 649,616 726,583 764,608 866,616 1,025,511 1,074,478 524,952 529,704 460,329 769,308
Contribution - 3,709,409 - - - - - - - -
Charges for services - - - - - - 1,740,278 1,546,781 1,468,322 1,434,766
Other 729,090 655,024 2,474,961 566,448 436,362 1,111,861 1,360,856 1,424,116 2,329,790 451,824
Investment income 540,809 476,435 860,259 1,734,016 1,889,314 1,123,434 414,462 369,718 208,533 188,888
Donations 41,271 27,385 14,135 43,925 11,520 34,614 240,640 51,462 33,596 12,276
Total Revenues 19,012,044 23,642,874 24,976,542 24,023,864 25,512,926 25,445,399 26,326,249 26,214,057 29,209,192 27,041,921
Expenditures
General Government 2,519,278 2,843,088 3,081,681 3,396,628 3,333,909 3,623,013 3,711,731 3,726,579 3,908,128 3,710,920
Public Safety 7,645,671 8,171,033 8,774,288 9,336,480 10,210,581 10,910,732 11,492,897 11,612,306 11,792,300 11,769,965
Streets 1,517,400 1,604,930 1,554,987 1,763,650 1,834,321 2,004,345 1,807,372 1,872,562 1,737,530 1,780,280
Parks 2,055,236 2,260,805 2,351,241 2,488,178 2,771,357 2,886,318 2,935,266 3,101,504 3,105,560 3,080,028
Public Works 2,058,532 2,134,194 2,100,705 2,370,100 2,489,824 2,950,749 2,811,921 2,684,192 2,611,421 2,528,517
Capital Outlay 2,216,855 2,760,132 2,132,148 3,039,469 12,445,710 6,285,377 7,875,116 4,611,004 2,269,321 3,045,468
Total expenditures 18,012,972 19,774,182 19,995,050 22,394,505 33,085,702 28,660,534 30,634,303 27,608,147 25,424,260 25,915,178
Excess of revenues over (under) expenditures 999,072 3,868,692 4,981,492 1,629,359 (7,572,776) (3,215,135) (4,308,054) (1,394,090) 3,784,932 1,126,743
Other Financing Sources (Uses)
Transfers in 4,901,990 2,109,523 6,184,398 3,535,005 7,424,661 6,488,020 4,990,191 4,680,020 2,680,020 4,108,561
Transfers out (4,901,990) (4,881,063) (5,019,166) (5,066,962) (7,766,577) (5,840,196) (5,342,367) (3,032,196) (3,032,196) (4,460,736)
Proceeds from the sale of real estate - - - - - - 18,079,589 - - -
Total other financing sources (uses) - (2,771,540) 1,165,232 (1,531,957) (341,916) 647,824 17,727,413 1,647,824 (352,176) (352,175)
Net change in fund balances 999,072$ 1,097,152$ 6,146,724$ 97,402$ (7,914,692)$ (2,567,311)$ 13,419,359$ 253,734$ 3,432,756$ 774,568$
Source: Comprehensive Annual Financial Report

78
CITY OF UNIVERSITY PARK, TEXAS Table 5
ASSESSED VALUE AND ACTUAL VALUE OF TAXABLE PROPERTY
Last Ten Fiscal Years
(Unaudited)
Total
Business Less: Total Taxable Direct
Fiscal Personal Tax-Exempt Assessed Tax
Year Residential Commercial Property Property Value Rate
2003 4,277,957,770$ 504,628,060$ 69,259,570$ 1,273,664,294$ 3,578,181,106$ 0.3293$
2004 4,375,179,940 503,826,060 71,364,340 1,180,965,009 3,769,405,331 0.3260
2005 4,518,905,970 571,083,210 61,751,190 1,224,010,081 3,927,730,289 0.3254
2006 4,975,653,730 624,476,590 66,321,690 1,352,302,169 4,314,149,841 0.3096
2007 5,598,626,050 723,856,170 57,858,950 1,576,073,433 4,804,267,737 0.2927
2008 6,494,649,520 951,392,770 64,453,300 2,065,659,046 5,444,836,544 0.2684
2009 7,222,753,610 1,328,001,550 69,328,260 2,813,471,585 5,806,611,835 0.2655
2010 7,266,425,510 1,390,034,530 71,886,140 2,742,338,498 5,986,007,682 0.2655
2011 6,863,828,520 1,405,826,170 70,896,650 2,633,438,386 5,707,112,954 0.2785
2012 6,654,905,050 1,424,711,540 69,909,780 2,581,437,846 5,568,088,524 0.2785
Note: Property in the city is reassessed each year. Property is assessed at actual value; therefore, the assessed values
are equal to actual value. Tax rates are per $100 of assessed value.
Source: Dallas Central Appraisal District "Summary of the Certified Estimated Values Report".
Real Property

79
CITY OF UNIVERSITY PARK, TEXAS Table 6
DIRECT AND OVERLAPPING PROPERTY TAX RATES
(per $100 of assessed value)
Last Ten Fiscal Years
(Unaudited)
General Highland Park Parkland Dallas County
Fiscal Operating/ Obligation Total Independent Dallas Hospital Community
Year General Rate Debt Service Direct School District County District College District Total
2003 0.3293$ - 0.3293$ 1.6100$ 0.2015$ 0.2540$ 0.0600$ 2.4548$
2004 0.3260 - 0.3260 1.6100 0.2093 0.2540 0.0778 2.4771
2005 0.3254 - 0.3254 1.6100 0.2094 0.2540 0.0803 2.4791
2006 0.3096 - 0.3096 1.5300 0.2192 0.2540 0.0816 2.3944
2007 0.2927 - 0.2927 1.3557 0.2189 0.2540 0.0810 2.2023
2008 0.2684 - 0.2684 1.0367 0.2328 0.2540 0.0804 1.8723
2009 0.2655 - 0.2655 1.0900 0.2330 0.2540 0.0894 1.9319
2010 0.2655 - 0.2655 1.1100 0.2333 0.2740 0.0949 1.9777
2011 0.2785 - 0.2785 1.1150 0.2531 0.2710 0.0992 2.0168
2012 0.2785 - 0.2785 1.1342 0.2531 0.2710 0.0997 2.0365
Note: All outstanding debt of the City was extinguished in fiscal 2002.
Source: Dallas Central Appraisal District "Ad Valorem Tax Rates for Dallas County".
City Direct Rates Overlapping Rates

80
CITY OF UNIVERSITY PARK, TEXAS Table 7
PRINCIPAL PROPERTY TAX PAYERS
Current Year and Nine Years Ago
(Unaudited)
Percentage Percentage
of Total City of Total City
Taxable Taxable Taxable Taxable
Assessed Assessed Assessed Assessed
Taxpayer Value Rank Value Value Rank Value
Caruth Preston Road 45,194,400$ 1 0.81% 30,741,860$ 1 0.86%
Gerald J Ford 23,725,000 2 0.43% 8,017,944 8 0.22%
Southern Methodist University 23,555,676 3 0.42% 14,747,002 3 0.41%
Peruna Holdings Corp. 19,425,830 4 0.35% 22,257,387 2 0.62%
Cheatham Richard H & Tracy B 17,636,290 5 0.32%
Intercity Investments 16,137,200 6 0.29% 9,360,430 5 0.26%
Birmingham Wallace LP 15,470,000 7 0.28%
Carlson Clint D & Nancy P 14,664,310 8 0.26%
John C. and Debbie Tolleson 12,385,200 9 0.22% 7,720,936 10 0.22%
Finney Mary Clare 12,274,280 10 0.22%
Park Cities Village JV 13,588,850 4 0.38%
Rufus Porter 8,829,068 7 0.25%
Patrick & Suzanne McGee 8,904,464 6 0.25%
Allen and Linda Meyer 7,820,000 9 0.22%
200,468,186$ 3.60% 131,987,941$ 3.69%
Source: Dallas County Tax Office
2012 2003

81
CITY OF UNIVERSITY PARK, TEXAS Table 8
PROPERTY TAX LEVIES AND COLLECTIONS
Last Ten Fiscal Years
(Unaudited)
Taxes Levied Collections in
Fiscal for the Percentage Subsequent Percentage of
Year Fiscal Year Amount of Levy Years Amount Original Levy
2003 11,783,798$ 11,651,288$ 98.88% 72,625$ 11,723,913$ 99.49%
2004 12,288,775 12,146,631 98.84% 86,523 12,233,154 99.55%
2005 12,780,442 12,653,391 99.01% 68,814 12,722,205 99.54%
2006 13,359,331 13,220,374 98.96% 47,637 13,268,011 99.32%
2007 14,066,479 13,912,826 98.91% 72,023 13,984,849 99.42%
2008 14,614,559 14,474,167 99.04% 141,309 14,615,476 100.00%
2009 15,418,745 15,249,267 98.90% 76,273 15,325,540 99.40%
2010 15,893,856 15,739,894 99.03% 45,048 15,784,942 99.31%
2011 15,903,248 15,769,437 99.16% 38,641 15,808,078 99.40%
2012 15,507,883 15,384,088 99.20% - 15,384,088 99.20%
Source: Dallas County Tax Office
Collected within the
Fiscal Year of the Levy Total Collections to Date

82
CITY OF UNIVERSITY PARK, TEXAS Table 9
RATIO OF OUTSTANDING DEBT
Last Ten Fiscal Years
(Unaudited)
Percentage
Fiscal General Obligation of Personal Per
Year Refunding Bonds Income Capita
2003 - - -
2004 - - -
2005 - - -
2006 - - -
2007 - - -
2008 - - -
2009 - - -
2010 - - -
2011 - - -
2012 - - -
Note: All outstanding debt of the City was extinguished in fiscal 2002.

83
CITY OF UNIVERSITY PARK, TEXAS Table 10
RATIO OF NET GENERAL BONDED DEBT OUTSTANDING
Last Ten Fiscal Years
(Unaudited)
Percentage of
Actual Taxable
Fiscal General Obligation Less: Amount Available Value of Per
Year Refunding Bonds for Debt Service Net Bonded Debt Property Capita
2003 - - - - -
2004 - - - - -
2005 - - - - -
2006 - - - - -
2007 - - - - -
2008 - - - - -
2009 - - - - -
2010 - - - - -
2011 - - - - -
2012 - - - - -
Note: All outstanding debt of the City was extinguished in fiscal 2002.

84
CITY OF UNIVERSITY PARK, TEXAS Table 11
DIRECT AND OVERLAPPING GOVERNMENTAL ACTIVITIES DEBT
As of September 30, 2012
(Unaudited)
Estimated Estimated Share
Debt Percentage of Overlapping
Governmental Unit Outstanding Applicable Debt
Debt repaid with property taxes
Highland Park Independent School District 108,785,000$ 48.00% 52,216,800$
Dallas County 121,605,000 2.54% 3,088,767
Dallas County Community College District 374,265,000 2.54% 9,506,331
Dallas County Hospital District 705,000,000 2.54% 17,907,000
Dallas Independent School District 2,554,985,000 0.02% 510,997
Subtotal, overlapping debt 83,229,895
City of University Park direct debt -
Total direct and overlapping debt 83,229,895$
Source: First Southwest Company
Note: Overlapping governments are those that coincide, at least in part, with the geographic boundaries of the City. This schedule estimates
the portion of the outstanding debt of those overlapping governments that is borne by the residents and businesses of The City of University
Park. This process recognizes that, when considering the city's ability to issue and repay long-term debt, the entire debt burden borne by the
residents and businesses should be taken into account. However, this does not imply that every taxpayer is a resident, and therefore
responsible for repaying the debt of each overlapping government.
For debt repaid with property taxes, the percentage of overlapping debt applicable is estimated using taxable assessed property values.
Applicable percentages were estimated by determining the portion of another governmental unit's taxable assessed value that is within the city's
boundaries and dividing it by each unit's total taxable assessed value.

85
CITY OF UNIVERSITY PARK, TEXAS Table 12
PLEDGED-REVENUE COVERAGE
Last Ten Fiscal Years
(Unaudited)
The City of University Park has no non-general obligation, long-term debt.

86
CITY OF UNIVERSITY PARK, TEXAS Table 13
LEGAL DEBT MARGIN INFORMATION
Last Ten Fiscal Years
(Unaudited)
2003 2004 2005 2006 2007 2008 2009 2010 2011 2012
Tax Rate Limit 2.5000$ 2.5000$ 2.5000$ 2.5000$ 2.5000$ 2.5000$ 2.5000$ 2.5000$ 2.5000$ 2.5000$
Current Tax Rate 0.3293 0.3260 0.3254 0.3096 0.2927 0.2684 0.2655 0.2655 0.2785 0.2785
Available Tax Rate 2.1707$ 2.1740$ 2.1746$ 2.1904$ 2.2073$ 2.2316$ 2.2345$ 2.2345$ 2.2215$ 2.2215$
Note: The City Charter of the The City of University Park does not provide for a debt limit. Under provisions of Texas state law, the maximum tax rate
is limited to $2.50 per $100 assessed valuation.

87
CITY OF UNIVERSITY PARK, TEXAS Table 14
DEMOGRAPHIC AND ECONOMIC STATISTICS
Last Ten Calendar Years
(Unaudited)
Personal Per
Income Capita
Estimated (thousands Personal Median School Unemployment
Year Population of dollars) Income Age Enrollment Rate
2003 23,324 1,499,780$ 64,302$ 31.2 5,999 2.4%
2004 23,324 1,506,684 64,598 31.2 6,156 2.1%
2005 23,324 1,513,588 64,894 31.2 6,276 1.9%
2006 23,324 1,520,492 65,190 31.2 6,293 1.7%
2007 23,324 1,527,395 65,486 31.2 6,300 1.6%
2008 23,324 1,534,206 65,778 31.2 6,250 2.4%
2009 23,324 1,541,110 66,074 31.2 6,400 2.3%
2010 23,068 1,539,997 66,759 27.8 6,448 2.4%
2011 23,068 1,539,997 66,759 27.8 6,448 2.3%
2012 23,040 1,461,059 63,414 29.7 6,757 2.3%
Estimated population obtained from the North Central Texas Council of Governments, 2012 Population Estimates Report
Per Capita Personal Income calculated via interpolation of U.S. Census Bureau baseline data and 2011 USA.com data for University park.
Unemployment rates via City-Data.com for population 25 years of age or older.

88
CITY OF UNIVERSITY PARK, TEXAS Table 15
PRINCIPAL EMPLOYERS
Current Year
(Unaudited)
UNIVERSITY PARK
Employer Rank Employees
Percentage of
Total City
Employment
Southern Methodist University 1 2,500 25%
Highland Park ISD 2 760 8%
Martini Hospitality 3 500 5%
Fidelity Distributors Corp 4 250 2%
City of University Park 5 232 2%
Highland Park Presbyterian Church 6 135 1%
DALLAS COUNTY COLLIN COUNTY
Employer Rank Employees Employer Rank Employees
American Airlines/AMR 1 11,709 Hp Enterprise Svc Lic 1 10,000
Texas Instruments 2 9,800 Nortel Networks 2 6,000
UT Southwestern Medical Center 3 8,545 Bank of America Home Loans 3 4,646
Parkland Memorial Hospital 4 6,900 JC Penny Co 4 3,800
Medical City Dallas Hospital 5 6,000 Raytheon Corp 5 3,500
Baylor University Medical Center 6 5,500 University of Texas at Dallas 6 3,000
Children's Medical Center-Dallas 7 5,500 Raytheon Corp 7 3,500
Southwest Airlines 8 5,049 Medical Center of Plano 8 3,000
Texas Health Presbyterian Hospital 9 4,019 Frito-Lay Inc 9 2,500
AMR Corporation 10 4,000 GE Energy 10 2,300
Note: The City of University Park is primarily residential in nature, with a highly mobile workforce. Nestled between the north/south routes of the
Dallas North Tollway to the west, and North Central Expressway to the east, the majority of commuters are likely employed in either Dallas or Collin
County. Therefore, the major employers of those areas are presented along with the top 5 employers within the city limits. No comparative prior
period information is available. "Percentage of Total City Employment" was calculated using "employed civilian population 16 years and over", as
found in the 2000 U.S. Census, and therefore is not intended as an accurate portrayal of actual City employment.

89
CITY OF UNIVERSITY PARK, TEXAS
FULL-TIME EQUIVALENT CITY GOVERNMENT EMPLOYEES
BY FUNCTION/PROGRAM
Last Ten Fiscal Years
(Unaudited)
Function/Program 2003 2004 2005 2006 2007 2008 2009 2010 2011 2012
General Government
Administrative 4 4 5 5 5 5 5 5 5 5
Finance 8 8 8 8 8 8 7 7 7 6
Human Resources 2 2 2 2 2 2 2 2 2 2
Information Services 3 2 4 4 4 4 4 5 5 5
Facility Maintenance 4 4 4 4 4 4 3 3 3 2
Public Safety
Police
Officers 36 36 38 39 39 39 39 39 37 39
Civilians 10 11 10 10 11 11 9 11 12 10
Fire
Firefighters and officers 32 34 34 32 37 36 34 35 35 34
Civilians 3 3 3 4 1 1 1 1 1 1
Municipal Court 2 2 2 2 2 2 2 2 2 2
Parks 26 25 25 25 25 25 24 24 24 22
Public Works
Community Development 7 7 7 8 8 8 9 9 9 10
Engineering 8 8 8 7 7 7 6 6 6 6
Traffic 7 7 7 7 7 7 7 7 6 7
Streets 18 17 17 17 17 17 16 16 16 16
Utilities 29 31 30 31 31 31 32 32 31 28
Sanitation 26 26 26 25 26 27 26 26 25 26
Equipment Services 11 10 10 10 10 10 10 10 10 10
Capital Projects 1 1 1 0 0 1 1 1 1 1
Total 237 238 241 240 244 245 237 241 237 232
Source: City Human Resource Department.
Table 16

90
CITY OF UNIVERSITY PARK, TEXAS Table 17
OPERATING INDICATORS BY FUNCTION/PROGRAM
Last Ten Fiscal Years
(Unaudited)
Function/Program 2003 2004 2005 2006 2007 2008 2009 2010 2011 2012
Public Safety
Police
Parking tickets 4,999 4,670 4,324 5,548 5,863 5,783 5,481 4,927 5,277 8,426
Traffic violations 3,475 2,699 2,800 2,703 3,084 5,914 6,859 3,808 5,133 5,169
Accident calls 623 633 582 568 517 497 353 340 217 210
Total calls for service 16,928 17,437 17,161 16,888 17,616 17,336 16,907 19,946 25,835 25,756
Fire
Number of fire runs 1,260 1,431 1,258 1,193 1,286 1,333 1,250 1,340 1,185 1,227
Number of EMS runs 1,099 1,056 1,090 1,059 1,063 1,251 1,120 1,156 1,113 1,012
Inspections 601 559 586 324 337 478 528 685 725 791
Parks
Pool passes issued 3,240 2,998 2,913 2,960 2,758 2,755 2,635 3,480 3,422 3,186
Public Works
Building permits issued 2,166 2,792 2,795 3,033 3,117 2,634 2,078 2,203 2,597 2,792
Work orders completed 11,340 13,711 14,217 12,427 8,996 9,911 9,406 7,576 7,758 8,203
Sanitation
Waste hauled (tons) 16,023 16,634 16,212 15,209 15,035 14,012 15,508 17,219 15,022 15,295
Recycled materials (tons) 1,097 1,140 1,161 1,163 1,313 4,190 2,393 2,734 2,854 2,961
Utilities
Number of consumers 8,130 8,191 8,430 8,504 8,574 8,624 8,732 8,764 8,790 8,747
Average daily consumption 4,855 4,665 4,687 5,154 3,835 4,234 4,511 4,159 5,797 4,844
(thousands of gallons)
Sources: Various City Departments. Information for certain earlier years may be unavailable.

91
CITY OF UNIVERSITY PARK, TEXAS Table 18
CAPITAL ASSET STATISTICS BY FUNCTION/PROGRAM
Last Ten Fiscal Years
(Unaudited)
Function/Program 2003 2004 2005 2006 2007 2008 2009 2010 2011 2012
Public Safety
Police
Stations 1 1 1 1 1 1 1 1 1 1
Patrol Units 10 10 10 10 10 18 20 13 12 12
Motorcycle Units 1 1 1 1 0 0 1 1 0 0
Fire
Stations 1 1 1 1 1 1 1 1 1 1
Trucks 3 3 3 3 3 3 3 3 4 4
MICU 1 1 1 1 1 1 2 2 2 2
Parks
Parks (acres) 59 59 59 59 59 60 60 60 60 60
Parks (number of) 8 8 8 8 8 8 8 8 9 10
Playgrounds 5 6 7 7 8 9 9 9 8 8
Swimming Pools 1 1 1 1 1 1 1 2 2 2
Tennis Courts 6 6 6 6 6 12 12 12 12 12
Water
Water Mains (miles) 89.41 89.41 89.41 89.41 89.41 89.41 90.01 90.01 88 74
Fire Hydrants 443 486 495 498 498 498 505 515 520 469
Streets
Sreets (miles) 71.4 71.4 71.4 71.4 71.4 71.4 71.4 71.4 71.4 71.4
Sewer
Sanitary sewer lines (miles) 61 61 61 61 61 61 61 61 61 61
Storm sewer lines (miles) 16 16 16 16 16 16 16 16 16 16
Source: Various City Departments

92