city of santa monica california · city of santa monica california comprehensive annual financial...
TRANSCRIPT

COMPREHENSIVE ANNUAL FINANCIAL REPORT FOR THE YEAR ENDED JUNE 30, 2019
CITY OF SANTA MONICA CALIFORNIA

City of Santa Monica California
Comprehensive Annual Financial Report
Year ended June 30, 2019
Prepared by the Finance Department
Gigi Decavalles-Hughes Director of Finance/City Treasurer
Stephanie Manglaras Financial Operations Manager
Robert Garcia Supervising Accountant
Randy Chow Financial Reporting Administrator
Imelda De Leon Senior Grants Analyst
Amelia Dawson Accountant II
Jason Duvall Accountant II
Lisa Nakamine Accountant II
Faye Ruggera Accountant II
Jane Lim Accountant I
Swen Yang Accountant I
Brian Mondragon Executive Administrative Assistant

CITY OF SANTA MONICA, CALIFORNIA
Comprehensive Annual Financial Report For the fiscal year ended June 30, 2019
Table of Contents Page INTRODUCTORY SECTION
Letter of Transmittal .......................................................................................................................... i Officials of the City of Santa Monica ................................................................................................ xii Organizational Chart – City of Santa Monica ................................................................................... xiii GFOA Certificate of Achievement for Excellence in Financial Reporting ....................................... xiv
FINANCIAL SECTION
Independent Auditors’ Report ........................................................................................................... xv Management’s Discussion and Analysis (Required Supplementary Information) ............................ xix BASIC FINANCIAL STATEMENTS:
Government-Wide Financial Statements:
Statement of Net Position ............................................................................................................ 1 Statement of Activities ................................................................................................................ 2
Fund Financial Statements: Balance Sheet – Governmental Funds ........................................................................................ 4 Reconciliation of the Governmental Funds Balance Sheet to the Government-Wide
Statement of Net Position ........................................................................................................ 5 Statement of Revenues, Expenditures and Changes in Fund Balances –
Governmental Funds ................................................................................................................ 6 Reconciliation of the Governmental Funds Statement of Revenues, Expenditures and Changes in Fund Balances to the Government-Wide Statement of Activities ......................... 7 Statement of Net Position – Proprietary Funds ........................................................................... 10 Statement of Revenues, Expenses and Changes in Fund Net Position – Proprietary Funds ....... 11 Statement of Cash Flows – Proprietary Funds ............................................................................ 12 Statement of Fiduciary Net Position – Fiduciary Funds ............................................................. 16 Statement of Changes in Fiduciary Net Position – Fiduciary Fund ............................................ 17
Notes to Basic Financial Statements: Note 1 – Summary of Significant Accounting Policies ............................................................ 19 Note 2 – Compensated Absences .............................................................................................. 31 Note 3 – Reconciliation of Fund Balance Sheet/Statement of Net Position to Government-
Wide Financial Statements ......................................................................................... 32 Note 4 – Pollution Remediation ................................................................................................ 35 Note 5 – Cash and Investments ................................................................................................. 37 Note 6 – Notes Receivable ........................................................................................................ 45 Note 7 – Capital Assets ............................................................................................................. 53 Note 8 – Unearned Revenue and Deferred Inflows of Resources ............................................. 55 Note 9 – Long-Term Debt ......................................................................................................... 57 Note 10 – Fund Deficits .............................................................................................................. 62 Note 11 – Interfund Transactions ................................................................................................ 63 Note 12 – Restricted Net Position ............................................................................................... 66 Note 13 – Fund Balances ............................................................................................................ 68 Note 14 – Commitments and Contingencies ............................................................................... 72 Note 15 – Self-Insurance ............................................................................................................. 76

CITY OF SANTA MONICA, CALIFORNIA
Comprehensive Annual Financial Report For the fiscal year ended June 30, 2019
Table of Contents, Continued
Page Note 16 – Employee Benefit Programs ....................................................................................... 78 Note 17 – Successor Agency Trust Fund for Assets of Former Redevelopment Agency............ 97 Note 18 – Prior Period Adjustments ............................................................................................ 103 Note 19 – Special Items ............................................................................................................... 104 Note 20 – Related Parties ............................................................................................................. 105
REQUIRED SUPPLEMENTARY INFORMATION
Schedule of Revenues, Expenditures and Changes in Fund Balance – Budget and Actual – General Fund ............................................................................................................................... 107
Schedule of Revenues, Expenditures and Changes in Fund Balance – Budget and Actual – Low and Moderate Income Housing Asset Fund ........................................................................ 109
Note to Required Supplementary Information ................................................................................... 110 Schedules of Changes in the Net Pension Liability and Related Ratios ........................................... 111 Schedules of Contributions – Pension Plans...................................................................................... 114 Schedule of Changes in the Net OPEB Liability and Related Ratios ................................................ 117 Schedules of Contributions – OPEB .................................................................................................. 118
SUPPLEMENTARY INFORMATION NON-MAJOR FUNDS / OTHER FINANCIAL INFORMATION
Combining and Individual Fund Statements and Schedules: Combining Balance Sheet – Nonmajor Governmental Funds ........................................................ 121 Combining Statement of Revenues, Expenditures and Changes in Fund Balances –
Nonmajor Governmental Funds .................................................................................................. 124 Schedule of Revenues, Expenditures and Changes in Fund Balance (Deficit) – Budget and
Actual – Major and Nonmajor Governmental Funds – Special Revenue Funds:
Beach Recreation ..................................................................................................................... 127 Housing Authority ................................................................................................................... 128 Tenant Ownership Rights Charter Amendment (TORCA) ...................................................... 129 Citizens Option for Public Safety ............................................................................................ 130 Gas Tax ..................................................................................................................................... 131 Local Return ........................................................................................................................... 132 Clean Beaches and Ocean Parcel Tax ...................................................................................... 133 Community Development Block Grant (CDBG) ..................................................................... 134 Miscellaneous Grants ............................................................................................................... 135 South Coast Air Quality Management District (SCAQMD) ................................................... 136 Parks and Recreation .............................................................................................................. 137
Combining Statement of Net Position – Nonmajor Enterprise Funds ............................................ 140 Combining Statement of Revenues, Expenses and Changes in Fund Net Position –
Nonmajor Enterprise Funds ........................................................................................................ 141 Combining Statement of Cash Flows – Nonmajor Enterprise Funds ............................................. 142 Combining Statement of Net Position – Internal Service Funds .................................................... 146

CITY OF SANTA MONICA, CALIFORNIA
Comprehensive Annual Financial Report For the fiscal year ended June 30, 2019
Table of Contents, Continued
Page Combining Statement of Revenues, Expenses and Changes in Fund Net Position – Internal Service Funds ................................................................................................................ 147 Combining Statement of Cash Flows – Internal Service Funds ..................................................... 148 Combining Statement of Fiduciary Net Position – Agency Funds................................................. 150 Combining Statement of Changes in Fiduciary Assets and Liabilities – Agency Funds ............... 151 Table Page
STATISTICAL SECTION (Unaudited)
Financial Trends Information
Net Position by Component – Last Ten Fiscal Years ........................................................... 1 153 Changes in Net Position – Last Ten Fiscal Years ................................................................. 2 154 Fund Balance of Governmental Funds – Last Ten Fiscal Years .......................................... 3 157 Changes in Fund Balance of Governmental Funds – Last Ten Fiscal Years ........................ 4 158 General Fund Tax Revenues by Source – Last Ten Fiscal Years ......................................... 5 160 Revenue Capacity Information
Assessed Value and Actual Value of Taxable Property – Last Ten Fiscal Years ................ 6 161 Direct and Overlapping Property Tax Rates – Last Ten Fiscal Years .................................. 7 162 Principal Property Tax Payers – Current Fiscal Year and Nine Years Ago ......................... 8 163 Property Tax Levies and Collections – Last Ten Fiscal Years ............................................. 9 164 Taxable Transactions by Type of Business – Last Ten Calendar Years ............................... 10 165 Debt Capacity Information
Ratios of Outstanding Debt by Type – Last Ten Fiscal Years ............................................. 11 166 Ratios of General Bonded Debt – Last Ten Fiscal Years ..................................................... 12 167 Direct and Overlapping Governmental Activities Debt........................................................ 13 168 Computation of Legal Debt Margin – Last Ten Fiscal Years ............................................... 14 169 Wastewater Enterprise Revenue Bonds Coverage – Last Ten Fiscal Years ......................... 15 170 Demographic and Economic Information
Demographic and Economic Statistics – Last Ten Calendar Years ..................................... 16 171 Principal Employers – Current Year and Nine Years Ago ................................................... 17 172
Operating Information
Full-time Equivalent City Government Employees by Function/Program – Last Ten Fiscal Years ........................................................................................................ 18 173
Operating Indicators by Function/Program – Last Ten Fiscal Years ................................... 19 174 Capital Asset Statistics by Function/Program – Last Ten Fiscal Years ................................ 20 175

City of Santa Monica, California
Year Ended June 30, 2019
INTRODUCTORY SECTION

tel: 310 458-8281 ● fax: 310-394-0644
i
Finance Department 1717 Fourth Street, Suite 250 Santa Monica, CA 90401
December 16, 2019
Dear Honorable Mayor and Members of the City Council, City Manager, and Citizens of Santa Monica:
Attached is the Comprehensive Annual Financial Report (CAFR) for the City of Santa Monica (City) for
the fiscal year ended June 30, 2019 (FY 2018-19).
The CAFR has been prepared by Finance Department staff in conformance with the principles and
standards for financial reporting set forth by the Governmental Accounting Standards Board (GASB), the
authoritative body establishing U.S. generally accepted accounting principles for local governments.
Management assumes full responsibility for the completeness and reliability of the information contained
in this report, based upon a comprehensive framework of internal controls established for that purpose.
Because the cost of internal control should not exceed anticipated benefits, the objective is to provide
reasonable, rather than absolute, assurance that the financial statements are free of any material
misstatements.
The CAFR has been compiled in a manner designed to fairly set forth the financial positions and results
of operations of the City. The CAFR includes disclosures designed to enable the reader to gain an
understanding of the City’s financial affairs.
In accordance with generally accepted accounting principles, a narrative overview and analysis of the
basic financial statements in the form of Management’s Discussion and Analysis (MD&A) is provided
and can be found immediately following the independent auditors’ report. This letter of transmittal
complements the MD&A and should be read in conjunction with it.
Lance, Soll & Lunghard LLP has issued an unmodified opinion on the City of Santa Monica’s basic
financial statements for FY 2018-19. Their report is located at the front of the financial section of this
report.
PROFILE OF THE CITY OF SANTA MONICA
The City of Santa Monica, bordered by the City of Los Angeles on three sides and by the Pacific Ocean
on the west, encompasses an area slightly greater than eight square miles and serves a residential
population of 93,593 making it the 19th largest of the 88 cities in Los Angeles County.
The City of Santa Monica, incorporated in 1886, adopted its City Charter in 1945, and established a
council-manager form of government in 1947. Elections are held every two years for either three or four
Council members elected to serve four-year terms on the seven-member City Council. Elected Council
members select a Mayor and a Mayor Pro-Tempore to preside over Council meetings.

ii
The City Council (Council) appoints a City Manager, a City Attorney and a City Clerk. The City Manager,
responsible for supervising day-to-day operations of the City and for carrying out policies set by the
Council, appoints Department directors.
Santa Monica’s level and breadth of services surpass those of other cities of comparable size. The City
provides a full range of services, including police and fire protection, water and wastewater, street
maintenance, public landscaping, a regional transit system that serves 13.2 million riders each year,
parking, parks and recreation including 245 acres of beaches, five public libraries, planning, building and
safety, the iconic Santa Monica Pier, an airport, a cemetery, and a high level of support for social services,
cultural programs and public education. Elementary and secondary education is provided by the Santa
Monica Malibu Unified School District, and community college education is provided by the Santa
Monica Community College District. Court, health, and social services are provided by the County of
Los Angeles. Gas, electric and telephone services are provided by private utility companies. It is City
policy to use internal staff rather than contractors for core services, and as a result labor costs make up
nearly 70% of General Fund operating expenses.
Financial data for all funds through which services are provided by the City have been included in this
report based on the criteria adopted by GASB.
FINANCIAL CONDITION AND OUTLOOK
As a AAA rated city, Santa Monica has long relied on conservative fiscal assumptions to plan ahead with
two-year operating budgets, five-year capital plans and rolling five-year fiscal forecasts. Beginning in FY
2018-19, the long range forecast period was extended to ten years and the capital planning period will be
extended to ten years in FY 2019-20. Financial planning also takes the form of continuous review and
refinement of fiscal policies and forecasts, and an understanding of the initiatives being undertaken by the
entire organization. This responsible approach has provided residents with a scope and quality of
community services that stands out among California cities. It has also allowed Santa Monica to be a
pioneer in innovative approaches to community wellbeing and sustainability. It has ensured that our
workforce is competitively compensated, well-trained and well-equipped. Of course, the City’s financial
health is impacted in part by the national and State economic climates, therefore prudent planning includes
continuous assessments of these areas as well as local conditions.
Santa Monica currently enjoys a vibrant economy, but global trends such as artificial intelligence, user
options, and connectivity have the possibility to reshape how we work, live, shop and interact. To
understand how these changes or others may manifest, the City of Santa Monica has launched Santa
Monica 2050 – a strategy to evaluate and prepare the City for the future given the acceleration of
technology and the changes that come with innovation. As part of the strategy development, the City
recently convened local, regional, national, and international industry experts, academics, business
leaders, and public sector leaders to share insights and ideas on how technological advancements and
global trends might impact and manifest in Santa Monica and the greater Los Angeles Region. In the
coming months, the City will seek community participation in the development of the Santa Monica
2050 strategy. More information and updates on the progress of the evolving project can be found at
SantaMonica.gov/2050economy.
The U.S. economy continues to grow, and the pace of growth has accelerated over the last few quarters.
Economic growth as measured by gross domestic product (GDP) was positive in 2018 for the ninth
consecutive year, one of the longest economic recoveries on record, but overall a fairly moderate recovery
by historical standards. Economic growth has averaged just 2.3% annually during the post-recession
period. However, growth in some recent quarters has increased to the 3.0% range. Most economists are
projecting slower growth of less than 2.0% in 2020 and 2021 with some economists even projecting a

iii
recession (generally considered negative growth for two consecutive quarters) in late 2020 or 2021.
Unemployment has reached its lowest level in fifty years. The housing market has moderated and is
expected to continue this trend in the near future. Inflation on a national basis continues to be low. The
Federal Reserve after several years of increasing interest rates, has now begun to once again decrease the
key Federal Funds rate in an effort to combat a potential slowing of economic growth. The course of
interest rates is now uncertain over the next one to two years as the long-term policy impacts of the
administration in Washington, particularly in the areas of trade and tariffs, is still uncertain. Also, history
would indicate that the economy is likely to head into a recession sometime within the next few years.
The State is expected to grow modestly in the term. Job growth is expected to continue, but at a slower
pace than in recent years, and the housing market is expected to rebound slightly after slowing in
2019. After several years of strong increases, State revenue growth is expected to slow, particularly from
personal income taxes, and the risk of an overall economic slowdown have increased. Despite this
moderation, the Legislative Analyst Office’s (LAO) November 20, 2019 report on the State’s Fiscal
Outlook projects that the State will have surpluses through FY 2023-24 assuming no major new spending
commitments. However, the size of the surpluses is decreasing and under a recession scenario. While
the possibility of a recession in the next few years continues to pose significant risks to the State Budget,
the LAO’s analysis shows sufficient State reserves to weather the recession, again assuming no major
increases in new spending.
Santa Monica’s economy, while remaining relatively strong due in large part to its geographic location
and its diversified tax revenue base, has begun to show signs of moderation. General Fund revenue growth
has begun to slow after several years of strong increases. Also, as with the State and national economies,
the threat of a recession could significantly alter revenue projections. More information on some of the
City’s key revenue sources is provided below. Property values in the City remain the third highest in Los
Angeles County for a City with the 19th largest population. The FY 2018-19 assessed value increase was
7.6% after a 5.8% gain the previous year. Preliminary information from the Los Angeles County
Assessor’s Office indicates a FY 2019-20 increase of 6.7%. However, this number could change after all
exemptions are applied. Moderate annual average increases of 3.0-4.0% are projected over the ensuing
nine years.
Sales tax growth is expected to moderate going forward, reflecting a continued shift of sales to online
platforms. In 2010 and 2016, Santa Monica voters passed transaction and use tax measures, totaling 1%
overall. Both of these measures were accompanied by advisory measures that altogether recommended
that Council allocate half of the revenue for school purposes, a quarter to fund affordable housing, and a
quarter for general City services. This tax, which is assessed similarly to a sales tax, has no sunset. FY
2018-19 sales tax results were skewed upward due to the receipt of taxes that were due in the prior year.
The delay reflects transfer of administrative responsibility for tax collection from the State Board of
Equalization to the California Department of Tax and Fee Administration (CDTFA). Due to this anomaly,
City sales tax revenues are actually expected to decrease in FY 2019-20, then grow by slightly under 2%
in FY 2020-21.
Tourism provides a major stimulus to the local economy by creating jobs and producing revenues. Staff
estimates that approximately 18% of General Fund revenues are generated by the tourism industry.
However, this revenue source is also showing signs of moderation. Revenue from Transient Occupancy
Taxes was essentially flat in FY 2018-19 with the prior year after increasing at an average annual rate of
9.2% over the previous seven years. Revenues are expected to grow slightly over the forecast period, the
rate of increase is expected to be lower than in previous years. Revenues will be bolstered by a new hotel
that opened at the end of FY 2018-19.
Business License Taxes are expected to increase slightly (1.5%) in FY 2019-20 and then remain relatively
flat in FY 2020-21, reflecting the loss of several of the City’s largest taxpayers due to relocations, before

iv
resuming a moderate growth rate of about 1.5% annually. Utility Users Tax revenues are also expected to
remain flat over the next several years as revenues from telecommunication services continue to drop due
to non-taxed internet-enabled telecommunications services gaining ground over the more traditional
services that are currently taxed. Parking Facility Taxes are expected to grow by just under 2% per year
over the next several years. Interest rates, which fell to historically low levels over the last seven years,
significantly impacting the City’s investment income, increased the last two years. However, as noted
above, rates have fallen from recent highs and the future course of rates is uncertain due to potential
geopolitical and economic influences on the overall economy.
MANAGING FISCAL CHALLENGES
Despite the City’s diverse tax revenue base, all major sources of tax revenue are seeing slowing growth.
This comes at a time when pressure on expenditures is accelerating. The key challenges the City faces are
steep increases in pension costs over the next seven years as the effects of the California Public
Employees’ Retirement System (CalPERS) discount rate decrease from 7.5% to 7.0% impact pension
contribution rates starting in FY 2018-19, and continued increases in workers’ compensation costs and
healthcare costs, all of which are outpacing revenue growth. Even without an economic downturn in the
next two years, the City will face increasingly hard choices in the next budget cycle.
Overall, the City’s fiscal health continues to benefit from a number of cost saving measures approved by
Council and implemented since FY 2010-11. The Miscellaneous employee bargaining group approved a
second tier of reduced retirement benefits for new employees starting on or after July 1, 2012, and
Miscellaneous group employees continue to contribute a portion of their pension costs, while Public
Safety employee bargaining groups have approved annual incremental increases to their employee
pension contributions. Over the past eight years, Police and Fire sworn employees have increased their
contributions towards pensions to reach over 28% of the total pension cost for Classic CalPERS members
(those joining CalPERS before January 1, 2013), while Classic Miscellaneous employees are contributing
up to 28% of the pension cost. The passage of the Public Employee Pension Reform Act, or PEPRA, in
September 2012 is working to further control cost increases in the future, as new employees entering
CalPERS after January 1, 2013 are receiving reduced retirement benefits. To date, approximately 40% of
the City’s permanent workforce is receiving reduced pension benefits.
Another cost-saving measure is the series of payments made to CalPERS beyond the actuarially required
contribution. These additional discretionary payments reduce the City's net pension liability. In 2014,
after a series of pay downs funded from year-end savings, Council adopted a policy that, provided that
there are sufficient funds, the annual budget would include a minimum set-aside of $1.0 million in the
General Fund, and commensurate set-aside amounts in all other funds, to be used towards pay downs of
the CalPERS unfunded liability. Based on the availability of additional funds, staff would annually assess
the set-aside of additional CalPERS payments against other unfunded needs, and present the Council with
a recommendation. In June 2017, responding to the prospect of additional significant pension
contribution rate increases beginning in FY 2018-19, Council approved a $45 million pay down of the
City’s pension unfunded liability. From FY 2010-11 through June 30, 2019, the City made $78.8 million
in pay downs that have resulted in over $8.0 million in annual pension contribution savings.
In FY 2018-19, in light of continuing pension challenges, and following resident interest in the City’s plan
to manage pensions, the City Manager established an ad hoc Pension Advisory Committee (PAC) made
up of residents and City employees. The Committee’s purpose was to work with an independent actuary
to study the issue and develop recommendations for the City Manager to consider in the development of
the proposed budget. The PAC unanimously recommended an accelerated plan to pay down the City’s
current pension unfunded liability over 13 years, to conclude in 2032-33. It is projected that the
accelerated 13-year repayment will save more than $100 million in interest costs over 30 years ($41

v
million Present Value). This pay down plan has superseded the previous annual pay down plan described
above. The first accelerated payment in the amount of $9.3 million was made on October 31, 2019. With
the latest payment, the City has made a total of $88.1 million in pay downs beyond the annual required
contribution.
Yet another cost-saving measure is the City’s prepayment of its annual employer contributions to
CalPERS since FY 2007-08. The City continued this practice in FY 2018-19. Discounts received from
such prepayments are used for pay downs of the net pension liability.
Despite the mitigating steps taken by the City, CalPERS has made a number of changes to actuarial
assumptions that have increased contribution rates. In addition to the phase in of the half percent discount
rate decrease, CalPERS will also shorten the period over which future actuarial gains and losses are
amortized from 30 years to 20 years with the payments computed using a level dollar amount. In addition,
the new policy removes the 5-year ramp-up and ramp-down on unfunded actuarial liability bases
attributable to assumption changes and non-investment gains and losses, and removes the 5-year ramp-
down on investment gains and losses. These changes will apply to new unfunded liability bases and will
likely further increase contributions beginning in FY 2021-22.
During FY 2014-15, the City began to prefund its Other Postemployment Benefits (OPEB) obligation by
paying into an Internal Revenue Code Section 115 irrevocable trust administered through the California
Employees’ Retirement Benefit Trust (CERBT), an affiliate of CalPERS. The City is paying the
equivalent of its annual required OPEB contribution into the irrevocable trust. This has allowed the City
to benefit from a higher discount rate used in calculating its OPEB unfunded liability.
To counter the trend of health insurance cost increases, members from all of the City’s collective
bargaining groups contribute to health insurance premiums. Additionally, the City has negotiated a new
contract with a new insurance provider that will save over $500,000 in 2019, with fixed rates for the
following two years.
Risk Management is implementing and managing a variety of measures to help control workers’
compensation costs. The BBB has finished two years of a three-year pilot program in which claims
administration responsibilities for all BBB claims were transferred from the City’s in-house workers’
compensation unit to a private claims administrator; through June 30, 2019 BBB’s total program liabilities
were reduced from $7.44 million to $6 million. Risk Management’s comprehensive case management
program for the Police and Fire Departments has reduced the number of litigated workers’ compensation
claims from sworn personnel, thereby reducing medical expenses, temporary and permanent disability
expenses, and legal expenses. Risk Management is continuing its implementation of a citywide Functional
Evaluation Testing Program in which a certified functional evaluation testing vendor administers
functional tests to all candidates applying for physically demanding jobs at the City. This type of testing,
considered an industry best practice, has proven to reduce employee injuries and, over time, lower
workers’ compensation costs.
As fiscal challenges persist, it is important for the City to be strategic and transparent about how funds
are spent. The FY 2019-21 Adopted Biennial Budget marks the beginning of a six-year transition from
maintenance of effort budgeting to one based on our Framework Priorities and focusing on a government
that works better and costs less and includes the following elements:
• The Budget is built on a new Framework for a Sustainable City of Wellbeing (“Framework”). The
Framework organizes work around the achievement of seven major outcomes. Each outcome is
further broken into sub-outcomes, work streams that define specific areas of focus. Each of these
uses outcome metrics to assist in determining whether outcomes are achieved. For the first time
as part of the budget process, department work is mapped to and organized around the

vi
achievement of these outcomes. Over the next two years, these activities will each be measured
in terms of how they contribute to the outcome, and the resources they require, to determine their
value.
• A plan to proactively achieve the repayment of the City’s existing unfunded pension liability through an accelerated 13-year pay down of the unfunded liability, described above.
• A phased effort to close projected General Fund budget shortfalls beyond the term of the current budget, and reallocate limited resources to outcome areas that may require greater investment:
o In the FY 2019-21 Proposed Budget, a slate of budget reductions based on more streamlined and efficient practices. These changes come from reduced contract costs, staffing adjustments and the elimination of 28.0 full-time equivalent vacant positions. These reductions amount to $13.3 million in FY 2019-20 and an additional $4.0 million in FY 2020-21.
o Staff has identified more impactful program changes that may result in restructuring, discontinuation or shifting to another public, non-profit or private entity for service delivery. These will require additional analysis and outreach to determine feasibility, and impacts to the community, our partners, or specific vulnerable populations. These proposals will first be presented to a Budget Task Force appointed by the City Manager for this purpose. The Task Force is composed of eight community members and seven staff members. This group will review two sets of proposals: 1) proposed changes slated for analysis during the current year, to be incorporated in the FY 2020-21 Budget. A $1.5 million General Fund permanent reduction target for these changes has already been incorporated into the Proposed Budget Plan for FY 2020-21; and 2) proposed changes slated for analysis during FY 2020-21, to be incorporated into the FY 2021-25 budgets. These are anticipated to result in a $2.5 million permanent General Fund budget reduction.
o In addition, staff is working on additional restructuring and streamlining that is anticipated to ultimately yield $2 million in General Fund savings before the third biennial cycle.
THE DISSOLUTION OF REDEVELOPMENT
On June 27, 2012, the State Legislature passed and the Governor signed AB 1484, a measure clarifying
legislation related to the dissolution of redevelopment. On October 21, 2013, the Successor Agency
reached a settlement agreement with the Department of Finance (DOF) to pay $56.7 million as full
remittance of unobligated cash and cash-equivalent balances previously held by the Redevelopment
Agency (RDA) as identified in the Due Diligence Reviews. The settlement was paid in full on January
14, 2015. On January 16, 2015, the DOF issued a Finding of Completion to the Agency, allowing it to
apply for repayment of previously-denied City/Agency agreements, and starting the process for the
preparation of a Long Range Property Management Plan (LRPMP), which details disposition of the
various Successor Agency properties. The LRPMP was approved on December 29, 2015, and during the
course of FY 2015-16, the DOF approved the repayment of three City/Agency loans totaling
approximately $70 million. The remaining balance of $34.0 million will be received over the next three
years. The Successor Agency has received Final and Conclusive Determinations on all of its
indebtedness, ensuring that the DOF will continue to approve the use of tax increment funds for debt
service payments.
The most significant and lasting impacts of the dissolution of redevelopment are the loss of ongoing
funding for affordable housing rehabilitation and production in the City, and the suspension of the Civic
Center Joint Use Project with the Santa Monica-Malibu Unified School District and the rehabilitation of
the Civic Auditorium. However, the passage of Measures GS and GSH has established a regular, albeit

vii
decreased, revenue stream to fund affordable housing. In July 2018, the Oversight Board of the Successor
Agency transitioned from a local board to a County-wide Oversight Board. This County-wide Board is
responsible for reviewing, approving and submitting the Successor Agency’s Required Obligation
Payment Schedules to the State Department of Finance once a year. Because the Successor Agency has
received Final and Conclusive determinations on all debt payment schedules, the City does not expect
this change to have any significant financial or operational impact.
POLICIES, RESERVES AND TRANSPARENCY
An additional safeguard to the City’s fiscal sustainability lies in the General Fund’s economic uncertainty
reserve. The Council created this reserve in FY 2008-09 at $8.2 million and increased it in FY 2010-11
by $1.5 million to a total current balance of $9.7 million. The reserve is to be used as a buffer, if needed,
to allow the City to bring its budget into balance in a measured way, minimizing the impact to our
employees and residents to the greatest extent possible, in case of a shortfall. Corrective actions to date
have allowed the City to avoid the need to use any of the reserve.
The City ended the fiscal year with a positive operating balance and a General Fund fund balance of
$340.7 million which includes nonspendable, restricted, committed, assigned, and unassigned fund
balances, each with varying constraints that control how amounts can be spent.
The City has and continues to dedicate resources to ensuring its transparency to the public. The City
convened a new Audit Subcommittee in FY 2015-16. This Subcommittee is meeting a minimum of four
times per year to review the work and reports of the City's internal and external auditors and the progress
made on internal controls process improvements.
During FY 2018-19, the City Council adopted a Compensation Philosophy, which establishes a consistent
methodology for determining if the City’s processes to recruit and retain highly qualified staff continue
to be in line with the City’s overarching goal of being an “employer of choice” while continuing to be
fiscally responsible with a goal of this being evaluated every five years. It also adopted a
Fiscal Sustainability Philosophy and Guiding Principles to Handle Pension Liability.
In October 2018, the Council adopted a Performance Management Policy that institutionalizes the City’s
commitment to data-driven decision-making. The policy defines the City’s approach to developing,
establishing, monitoring, and reporting on outcomes, and establishes the commitment to use this outcome
data in resource allocation decisions.
On June 25, 2019, the Council adopted a Fiscal Sustainability Philosophy included in the City’s Fiscal
Policy. The philosophy commits the City to a long term view of financial planning that addresses
economic and fiscal risks to ensure the City lives within its means and has the resources to invest in its
infrastructure, facilities, equipment, training and workforce to preserve and enhance community
wellbeing.
The Council also adopted Principles for Pension Funding, as developed by the ad hoc Pension Advisory
Committee. These principles, incorporated in the City’s Fiscal Policy, set forth the plan to follow a 13-
year accelerated pay down of the pension unfunded liability, with an alternative timeline in case of
emergency.
The open data portal allows the public easy access to a growing database of information, in addition to
the Opengov application that allows users to view the City's budget from a number of perspectives.

viii
CITYWIDE BUDGET
The City of Santa Monica employs a two-year budget process. In year one of the biennial budget cycle,
the City Council formally adopts authorized appropriations for the first year of the two-year budget and
approves “planned” appropriations for the second fiscal year. In year two of the budget cycle, the City
Council considers revisions and formally adopts authorized appropriations for the second fiscal year.
Although the budget cycle covers a two-year period, the City Charter requires that the City Council adopt
an annual appropriations ordinance for each budget year.
The City's Capital Improvement Program (CIP) Budget, also a biennial budget, is adopted in the second
year of the operating biennial budget process. The CIP Budget includes a Five-Year Capital Improvement
Plan that will be extended to ten years in FY 2019-20.
In addition to this budget planning process, the City maintains budgetary controls to ensure compliance
with the annual appropriated budget approved by the City Council. The City Manager is authorized to
transfer budgeted amounts within departments by fund to meet the City’s needs. However, revisions that
alter the total budget or move amounts from one fund or department to another must be approved by the
City Council.
The City maintains an encumbrance accounting system as one technique of accomplishing budgetary
control. Purchase orders, contracts, and other commitments for the expenditure of money are secured in
order to reserve that portion of the applicable appropriation. Encumbrances outstanding at year-end are
reported as reservations of fund balance. Unencumbered amounts lapse at year-end and may be
appropriated as part of the following year’s budget.
On June 25, 2019, Council approved the FY 2019-21 Biennial Operating Budget, adopting the
FY 2019-20 proposed budget and approving the FY 2020-21 budget plan. Council also adopted the second
year of the FY 2018-20 Biennial Capital Improvement Program Budget. On November 12, 2019, Council
approved certain revisions to the FY 2019-20 Revised Budget that adjusted revenues, expenditures and
staffing.
The FY 2019-20 Adopted Budget includes $712.9 million in expenditures, net of reimbursements and
transfers, for all funds. This represents a decrease of 6.7% compared to the revised FY 2018-19 Budget,
primarily due to operating changes and capital projects that help achieve the outcome areas outlined in
the Framework for a Sustainable City of Wellbeing. Citywide revenues, net of reimbursements and
transfers, are estimated at $651.6 million, a decrease of $11.8 million or 1.8% below the FY 2018-19
estimated actual.
The General Fund operating budget for FY 2019-20, net of reimbursements and transfers, is
$395.0 million and the Capital Improvement Program adds an additional $25.5 million, for a total General
Fund budget of $420.5 million. Operating expenditures are anticipated to increase $15.0 million, or
3.9%, as compared to the revised budget for FY 2018-19. General Fund revenues for FY 2019-20 are
budgeted at $417.5 million, an increase of $11.1 million or 2.7% from the FY 2018-19 estimated actual
revenues.
The FY 2019-20 Budget reflects self-supporting funds in generally sound financial condition. The Water
and Wastewater Funds are making progress on numerous projects that will help achieve water self-
sufficiency by 2023, including the Arcadia Water Treatment Plant Expansion Project in the Water Fund
and the Sustainable Water Infrastructure Project (SWIP) in the Wastewater Fund. Additional funding is
required in the short term to complete capital projects, maintain operations and ensure that water and

ix
wastewater fund reserve levels remain healthy. To address the funds’ ability to meet these needs, a water
and wastewater rate study will be completed and presented to Council on January 28, 2020. The results
from the rate study will set water and sewer bill rates for calendar years 2020 to 2024. The rate study will
also evaluate the minimum fund reserve requirements.
Resource Recovery and Recycling (RRR) Fund will maintain a positive but decreasing fund balance until
FY 2025-26 as the global market for recyclable materials is expected to worsen due to the China Waste
Ban and RRR’s fund position is adversely impacted by the global domino effect. Staff will likely
recommend an increase to solid waste rates to respond to higher recycling costs, potentially new zero
waste programming in order to achieve the goal of “Zero Waste by 2030” as outlined in the Council-
approved Zero Waste Plan, and to ensure that the RRR Fund is self-sufficient.
The Big Blue Bus (BBB) Fund will maintain a positive fund balance over the next eight years. Despite
the challenges associated with the decline in county-wide ridership, the department remains committed to
making the necessary service improvements, investments and operational efficiencies to achieve greater
service delivery while maintaining a balanced budget. In alignment with the City’s Vision for zero-
emissions by 2030, BBB will introduce its first zero-emission battery electric bus (BEB) during the first
year of the biennial budget. BBB will take delivery of 19 BEBs in the second year of the biennial.
The Pier Fund is not able to sustain an adequate balance to cover both its operating costs and large capital
expenditures. It has been Council practice to subsidize the Pier as a public space, rather than create a loan
receivable to the General Fund. The Pier Fund has a projected operating structural deficit of $0.5 million
in FY 2021-22 due to anticipated decreases in lease revenues due to construction impacts of various
planned capital projects. The Pier Fund will require an operating subsidy from the General Fund in
FY 2021-23.
The Housing Authority Fund has a projected operating structural deficit of approximately $0.9 million to
$1.5 million annually throughout the forecast period. Operating subsidies are made from Successor
Agency residual receipts funds that are set aside for affordable housing in the Special Revenue Source
Fund.
MAJOR CAPITAL PROJECTS
The City Services Building project consists of constructing a 50,200 square foot office building annexed
to historic City Hall to house City staff and provide a one-stop hub to better serve the community. This
project is being built to obtain a full Living Building Certification. Due to this high environmental
standard associated with the design of the City Services Building, the Series 2017 Bonds carry the
designation of “Green Bonds” and fund the entire project budget. Debt service costs will ultimately be
offset by lease savings when City staff from various non-City-owned office spaces moves into the City
Services Building. Construction is 63% complete and scheduled to be completed in April 2020.
The Fire Station 1 project involves building a new 25,000 square foot facility at 1337-45 7th Street to
replace the existing 60-year station at a different location. Construction is 54% complete and scheduled
to be completed in early 2020. Additionally, the Fire Training Facility project will convert Fire Station 4
to a functional set of classrooms and offices for training purposes, creating a new training drill yard,
environmental burn building, and hydrant(s) structures. Lease revenue bonds were issued in Spring 2018
for these projects.
The City Yards Modernization project is a phased major renovation of the existing 14.7-acre facility
located at 2500 Michigan Avenue. The project will retrofit and address long standing functional and space
needs of the City’s corporation yards. The current facility accommodates more staff than originally

x
intended when it was built in the 1950s, and the buildings are beyond its useful life. The City Yards houses
a majority of Public Works’ field operations equipment and staff and site uses include resource recycling
and recovery, water and wastewater operations, fleet maintenance, shop buildings and fire training
space. While design costs and initital construction for this project were funded using General Fund
resources, the remaining construction will require bond financing in 2020. Construction is 8% complete
and scheduled to be completed in late December 2023.
The Sustainable Water Infrastructure Project (SWIP) improves drought resiliency, increases water supply,
and reduces stormwater discharges into the Santa Monica Bay. The project consists of three
elements. Element 1 is a modular reverse osmosis (RO) unit at the Santa Monica Urban Runoff Recycling
Facility (SMURRF) and new solar panels that will help offset the energy required for the new
RO. Element 2 is a below grade stormwater and sewer treatment facility with 1 million gallons per day
(MGD) capacity. Element 3 is a new stormwater harvesting tank with 1.5 million gallon (MG)
capacity. The project is scheduled to be completed in late 2022.
The North Beach Trail project includes improvements to the Ocean Front Walk north of the Pier and the
bike path north from Bay Street to the northern City limit to solve the circulation conflicts on the bike
path and identify options for either widening the bike path or creating a parallel pedestrian path where the
bike path is frequently utilized by non-cyclists. This project is in construction and is scheduled to be
completed in Winter 2020.
The Early Childhood Lab School, led by Santa Monica College in partnership with the City, will design
and construct an early childhood education center that will serve as a 'lab school' for Santa Monica College
students in the early childhood education department and will provide infant, toddler, pre-school services
for approximately 110 children. Construction should be complete and the facility open in August 2020.
The Bus Replacement project includes the purchase of 19 40-foot and 7 30-foot Gillig with near-zero
ultra-low emission CNG engines and 1 40-foot prototype battery electric bus. The 30-foot buses were
delivered in March 2018 and the 40-foot buses will begin arriving in Fall 2018. The prototype battery
electric bus is scheduled to be delivered in March 2019. Buses will be equipped with but not limited to,
bicycle racks, advanced fleet management system, and near-zero emission engines. Staff is developing a
plan to procure additional 40-foot battery electric buses by October 2019.
The Civic Center Multipurpose Sports Field Project constructs a new universally accessible sports field
complex originally incorporated into the Civic Center Specific Plan in 2005 and prioritized for design and
construction by the City Council in 2017. The design accommodates children and adults of all abilities,
including Santa Monica High School students from the campus across the street. The Civic Center
Multipurpose Sports Field Project will be built on a 3.5-acre site, which is currently the location of the
Civic Center Parking Lot, located at 1840 4th Street and adjacent to the Santa Monica Civic Auditorium.
Construction is 18% complete and the project will be completed in July 2020.
AWARDS
The Government Finance Officers Association of the United States and Canada (GFOA) awarded a
Certificate of Achievement for Excellence in Financial Reporting to the City of Santa Monica for its
CAFR for the fiscal year ended June 30, 2018. The Certificate of Achievement is a prestigious national
award, recognizing conformance with the highest standards for preparation of State and local government
financial reports. In order to be awarded a Certificate of Achievement, a government unit must publish
an easily readable and efficiently organized CAFR whose contents conform to program standards. This
report must satisfy both generally accepted accounting principles and applicable legal requirements.

xi
A Certificate of Achievement is valid for a period of one year only. The City of Santa Monica has received
a Certificate of Achievement for each of the last thirty-five years. We believe our current CAFR also
conforms to the Certificate of Achievement program requirements.
In keeping with past practice, a copy of this CAFR will be placed on file in the City libraries and the City
Clerk’s Office, and sent to City Council and Audit Subcommittee members, City management personnel,
bond rating agencies, and other agencies which have expressed an interest in the financial affairs of the
City. It is also available at www.smgov.net/finance.
ACKNOWLEDGEMENTS
The preparation and development of this report would not have been possible without the year-round work
of the Finance Department staff and their special efforts, working in conjunction with the City’s
independent auditors, to produce this report.
I would like to take this opportunity to compliment and thank the staff members of the City who were
associated with the preparation of this report. I would also like to thank the City Council for their
continued interest and support in planning and conducting the financial operations of the City in a
responsible and progressive manner.
Respectfully submitted,
Gigi Decavalles-Hughes
Director of Finance/City Treasurer

xii
OFFICIALS OF THE CITY OF SANTA MONICA
As of December 16, 2019
City Council
Kevin McKeown, Mayor
Terry O’Day, Mayor Pro Tempore
Gleam Davis
Sue Himmelrich
Ana Maria Jara
Greg Morena
Ted Winterer
Administration and Department Heads
City Manager Rick Cole
Assistant City Manager Katie Lichtig
Deputy City Manager Anuj Gupta
City Attorney Lane Dilg
City Clerk (Director of Records and Election Services) Denise Anderson-Warren
Director of Finance/City Treasurer Gigi Decavalles-Hughes
Director of Human Resources Lori Gentles
Chief Information Officer Joseph Cevetello
Chief of Police Cynthia Renaud
Fire Chief Bill Walker
Director of Planning and Community Development David Martin
City Librarian Patty Wong
Director of Community and Cultural Services Karen Ginsberg
Director of Transit Services Edward F. King
Director of Housing and Economic Development Andy Agle
Director of Public Works Susan Cline

ORGANIZATION OF THE CITY OF SANTA MONICA as of December 16, 2019
CITIZENS
CITY COUNCIL
Records & Election Services Denise Anderson-Warren
City Manager Rick Cole
City Attorney Lane Dilg
Deputy City Manager Anuj Gupta
Assistant City Manager Katie Lichtig
Fire Bill Walker
Police Cynthia Renaud
Community & Cultural Services
Karen Ginsberg
Big Blue Bus Edward F. King
Library Patty Wong
Finance Gigi Decavalles-Hughes
Housing & Economic Development
Andy Agle
Planning & Community Development David Martin
Human Resources Lori Gentles
Information Services Joseph Cevetello
Public Works Susan Cline
xiii

xiv

City of Santa Monica, California
Year Ended June 30, 2019
FINANCIAL SECTION

INDEPENDENT AUDITORS’ REPORT
To the Honorable Mayor and Members of the City Council City of Santa Monica, California
Report on the Financial Statements
We have audited the accompanying financial statements of the governmental activities, the business-type activities, each major fund, and the aggregate remaining fund information of City of Santa Monica, California, (the City) as of and for the year ended June 30, 2019, and the related notes to the financial statements, which collectively comprise the City’s basic financial statements as listed in the table of contents.
Management’s Responsibility for the Financial Statements
Management is responsible for the preparation and fair presentation of these financial statements in accordance with accounting principles generally accepted in the United States of America; this includes the design, implementation, and maintenance of internal control relevant to the preparation and fair presentation of financial statements that are free from material misstatement, whether due to fraud or error.
Auditors’ Responsibility
Our responsibility is to express opinions on these financial statements based on our audit. We conducted our audit in accordance with auditing standards generally accepted in the United States of America and the standards applicable to financial audits contained in Government Auditing Standards, issued by the Comptroller General of the United States. Those standards require that we plan and perform the audit to obtain reasonable assurance about whether the financial statements are free from material misstatement.
An audit involves performing procedures to obtain audit evidence about the amounts and disclosures in the financial statements. The procedures selected depend on the auditor’s judgment, including the assessment of the risks of material misstatement of the financial statements, whether due to fraud or error. In making those risk assessments, the auditor considers internal control relevant to the entity’s preparation and fair presentation of the financial statements in order to design audit procedures that are appropriate in the circumstances, but not for the purpose of expressing an opinion on the effectiveness of the entity’s internal control. Accordingly, we express no such opinion. An audit also includes evaluating the appropriateness of accounting policies used and the reasonableness of significant accounting estimates made by management, as well as evaluating the overall presentation of the financial statements.
We believe that the audit evidence we have obtained is sufficient and appropriate to provide a basis for our audit opinions.
203 N. Brea Blvd., Suite 203 Brea, CA 92821 Lance, Soll & Lunghard, LLP Phone: 714.672.0022
xv

To the Honorable Mayor and Members of the City Council City of Santa Monica, California
Opinions
In our opinion, the financial statements referred to above present fairly, in all material respects, the respective financial position of the governmental activities, the business-type activities, each major fund, and the aggregate remaining fund information of the City of Santa Monica, California, as of June 30, 2019, and the respective changes in financial position and, where applicable, cash flows thereof for the year then ended in accordance with accounting principles generally accepted in the United States of America.
Other Matters
Required Supplementary Information
Accounting principles generally accepted in the United States of America require that the management’s discussion and analysis, the schedule of revenues, expenditures, and changes in fund balance – budget and actual for the general fund and the low and moderate income housing assets fund, the schedule of changes in the net pension liability and related ratios, the schedule of contributions – pension plans, the schedule of changes in the net OPEB liability and related ratios and the schedule of contribution – OPEB be presented to supplement the basic financial statements. Such information, although not a part of the basic financial statements, is required by the Governmental Accounting Standards Board, who considers it to be an essential part of financial reporting for placing the basic financial statements in an appropriate operational, economic, or historical context. We have applied certain limited procedures to the required supplementary information in accordance with auditing standards generally accepted in the United States of America, which consisted of inquiries of management about the methods of preparing the information and comparing the information for consistency with management’s responses to our inquiries, the basic financial statements, and other knowledge we obtained during our audit of the basic financial statements. We do not express an opinion or provide any assurance on the information because the limited procedures do not provide us with sufficient evidence to express an opinion or provide any assurance.
Other Information
Our audit was conducted for the purpose of forming opinions on the financial statements that collectively comprise the City’s basic financial statements. The introductory section, combining and individual nonmajor fund financial statements and schedules and statistical section are presented for purposes of additional analysis and are not a required part of the basic financial statements.
The combining and individual nonmajor fund financial statements and schedules are the responsibility of management and were derived from and relate directly to the underlying accounting and other records used to prepare the basic financial statements. The information has been subjected to the auditing procedures applied in the audit of the basic financial statements and certain additional procedures, including comparing and reconciling such information directly to the underlying accounting and other records used to prepare the basic financial statements or to the basic financial statements themselves, and other additional procedures in accordance with auditing standards generally accepted in the United States of America. In our opinion, the combining and individual nonmajor fund financial statements and schedules are fairly stated, in all material respects in relation to the basic financial statements as a whole.
The introductory and statistical sections have not been subjected to the auditing procedures applied in the audit of the basic financial statements and, accordingly, we do not express an opinion or provide any assurance on them.
xvi

To the Honorable Mayor and Members of the City Council City of Santa Monica, California
Other Reporting Required by Government Auditing Standards
In accordance with Government Auditing Standards, we have also issued our report dated December 16, 2019 on our consideration of the City’s internal control over financial reporting and on our tests of its compliance with certain provisions of laws, regulations, contracts, and grant agreements and other matters. The purpose of that report is solely to describe the scope of our testing of internal control over financial reporting and compliance and the results of that testing, and not to provide an opinion on the effectiveness of the City’s internal control over financial reporting or on compliance. That report is an integral part of an audit performed in accordance with Government Auditing Standards in considering the City’s internal control over financial reporting and compliance.
Brea, California December 16, 2019
xvii

CITY OF SANTA MONICA, CALIFORNIA
Management’s Discussion and Analysis For the fiscal year ended June 30, 2019
(Unaudited)
As management of the City of Santa Monica, California (City), we offer readers of the City’s Comprehensive Annual Financial Report (CAFR) this narrative overview and analysis of the financial activities of the City for the fiscal year ended June 30, 2019. We encourage readers to consider the information presented here in conjunction with additional information that we have furnished in the City’s basic financial statements, which immediately follow this section, and the CAFR transmittal letter in the preceding Introductory Section.
FINANCIAL HIGHLIGHTS
• Total assets and deferred outflows of resources of the City exceeded its liabilities and deferredinflows of resources, also known as net position, by $1,602.1 million, as of June 30, 2019. Of thisamount, $1,183.4 million represents net investment in capital assets, $246.8 million represents netposition restricted for specific purposes, and $171.9 million represents unrestricted net position.Governmental activities and business-type activities reported unrestricted net positions of $14.7and 157.2 million which is a reduction of $39.7 and an increase of $20.8 million respectively. Thedecrease in governmental activities and increase in business-type activities unrestricted netposition is primarily due to a $34 million transfer from governmental activities to business-typeactivities to account for Olympic Wellfield pollution remediation activity in the business-typeactivities. $971.7 million represents net position for governmental activities and $630.4 millionrepresents net position for business-type activities.
• For the fiscal year ended June 30, 2019, the City’s total net position increased by $21.6 million,to $1,602.1 million at June 30, 2019 from $1,580.5 million at June 30, 2018 (as restated). Thisincrease was due to a decrease in governmental activities net position of $12.9 million and anincrease in business-type activities net position of $34.5 million during FY 2018-19.
• At the end of the current fiscal year, the City’s governmental funds reported total ending fundbalances of $641.6 million, compared to $698.5 million at the end of the prior fiscal year, whichis a decrease of $56.9 million or 8.1%.
• The General Fund reported an ending fund balance of $340.7 million as of June 30, 2019,compared to $435.8 million as of June 30, 2018, which represents a decrease of $95.1 million or21.8%. The main reasons for the overall decrease in fund balance are transfers out of $78.3 million and increased spending on capital projects such as the City Services Building, City YardsModernization and Fire Station 1.
• The City’s net capital assets increased by $40.1 million or 3.2% to $1,286.5 million as of June 30,2019 from $1,246.4 million as of June 30, 2018.
• The City’s long-term debt (excluding issuance premiums) decreased by $6.8 million or 4.0% to$164.3 million as of June 30, 2019 from $171.1 million as of June 30, 2018. The decrease is dueannual debt service payments made during FY 2018-19.
• The City’s net pension liability decreased from $466.8 million at June 30, 2018 to $447.8 millionat June 30, 2019; a decrease of $19.0 million or 4.1%. The decrease in the liability was primarilydue to the better than expected plan experience and investment returns.
xix

CITY OF SANTA MONICA, CALIFORNIA
Management’s Discussion and Analysis, Continued For the fiscal year ended June 30, 2019
(Unaudited)
OVERVIEW OF THE BASIC FINANCIAL STATEMENTS
This discussion and analysis is intended to serve as an introduction to the City’s basic financial statements. The City’s basic financial statements include three components: government-wide financial statements, fund financial statements, and notes to the basic financial statements.
Government-wide financial statements. The government-wide financial statements are designed to provide readers with a broad overview of the City’s finances, in a manner similar to statements of a private-sector business.
The statement of net position presents information on all of the City’s assets, deferred outflows of resources, liabilities and deferred inflows of resources, with the difference between the assets, deferred outflows of resources, liabilities and deferred inflow of resources reported as net position. Over time, increases or decreases in net position may serve as a useful indicator of whether the financial position of the City is improving or deteriorating.
The statement of activities presents information showing how the City’s net position changed during the most recent fiscal year. All changes in net position are reported as soon as the underlying event giving rise to the change occurs, regardless of the timing of related cash flows. Thus, revenues and expenses are reported in this statement for some items that will result in cash flows in future fiscal periods.
The government-wide financial statements distinguish functions of the City that are principally supported by taxes and intergovernmental revenues (governmental activities) from other functions that are intended to recover all or a significant portion of their costs through user fees and charges (business-type activities). The governmental activities of the City include general government, public safety (police and fire), general services, library, cultural and recreation and housing and community development. The business-type activities of the City include water, wastewater, stormwater, resource recovery and recycling, pier, airport, cemetery, Big Blue Bus, community broadband, and Parking Authority.
Component units are included in the basic financial statements and consist of legally separate entities for which the City is financially accountable and that have either the same governing board as the City or a governing board appointed by the City of Santa Monica City Council. The blended component units include the Santa Monica Public Financing Authority, the Parking Authority of the City of Santa Monica, the Housing Authority of the City of Santa Monica, and the Santa Monica Redevelopment Successor Agency.
The government-wide financial statements can be found on pages 1 and 2 of this report.
Fund financial statements. A fund is a grouping of related accounts that is used to maintain control over resources that have been segregated for specific activities or objectives. The City, like other state and local governments, uses fund accounting to ensure and demonstrate compliance with finance-related legal requirements. All the funds of the City can be divided into three categories: governmental funds, proprietary funds, and fiduciary funds.
Governmental funds. Governmental funds are used to account for essentially the same functions reported as governmental activities in the government-wide financial statements. However, unlike the government-wide financial statements, governmental fund financial statements focus on near-term inflows and outflows of spendable resources, as well as on balances of spendable resources available at
xx

CITY OF SANTA MONICA, CALIFORNIA
Management’s Discussion and Analysis, Continued For the fiscal year ended June 30, 2019
(Unaudited)
the end of the fiscal year. Such information may be useful in evaluating the City’s near-term financing requirements.
Because the focus of governmental funds is narrower than that of the government-wide financial statements, it is useful to compare the information presented for governmental funds with similar information presented for governmental activities in the government-wide financial statements. By doing so, readers may better understand the long-term impact of the City’s near-term financing decisions. Both the governmental funds balance sheet and the governmental funds statement of revenues, expenditures and changes in fund balances are accompanied by a reconciliation to the government-wide financial statements in order to facilitate this comparison between governmental funds and governmental activities.
The City maintains 19 individual governmental funds for financial reporting purposes. Information is presented separately in the governmental funds balance sheet and in the governmental funds statement of revenues, expenditures and changes in fund balances for the General, Special Revenue Source Fund, and Low and Moderate Income Housing Asset Fund which are considered to be major funds. Data for the other 16 governmental funds are combined into a single, aggregated presentation. Individual fund data for each of these nonmajor governmental funds is provided in the nonmajor funds supplementary information section of this report.
The City Council adopts an annual appropriated budget for its General Fund and twelve of the special revenue funds (no budget is adopted for the Rent Control Fund and Asset Seizure Fund) and one capital project fund. The City Council does not adopt budgets for the two permanent funds or the one debt service fund. A comparison schedule has been provided for the General Fund and Low and Moderate Income Housing Asset Fund in the required supplementary information to the basic financial statements.
The governmental funds financial statements can be found on pages 4 through 7 of this report.
Proprietary funds. Proprietary funds provide the same type of information as the government-wide financial statements, but in more detail. The proprietary fund financial statements provide separate information for water, wastewater, recycling, and bus operations, which are considered to be major funds of the City. The City maintains two different types of proprietary funds. Enterprise funds are used to report the same functions presented as business-type activities in the government-wide financial statements. Internal service funds are an accounting device used to accumulate and allocate costs internally among the City’s various functions. The City uses internal service funds to account for its vehicle operations, risk management program and information technology and communications operations. The vehicle operations and insurance services for bus operations primarily benefit business-type activities and are included within business-type activities in the government-wide financial statements. All other risk management functions, information technology and communication services primarily benefit governmental funds and are included within governmental activities in the government-wide financial statements. Individual fund data for the internal service funds is provided in the supplementary information section of this report.
The proprietary funds financial statements can be found at pages 10 through 13 of this report.
Fiduciary funds. Fiduciary funds consist of a private-purpose trust fund and agency funds. A private-purpose trust fund was created in 2012 and is used to pay enforceable obligations of the former Redevelopment Agency (Former Agency). Agency funds are used to account for resources held for the
xxi

CITY OF SANTA MONICA, CALIFORNIA
Management’s Discussion and Analysis, Continued For the fiscal year ended June 30, 2019
(Unaudited)
benefit of parties outside of the City. The fiduciary funds are not included in the government-wide financial statements because the resources are not available to support the City’s operations.
The fiduciary funds financial statements can be found on pages 16 through 17 of this report.
Notes to the basic financial statements. The notes to the basic financial statements provide additional information that is essential to a full understanding of the data provided in the government-wide and fund financial statements. The notes to the basic financial statements begin on page 19 of this report.
GOVERNMENT-WIDE FINANCIAL ANALYSIS
As noted earlier, net position may serve over time as a useful indicator of a government’s financial position. In the case of the City, assets and deferred outflows of resources exceeded liabilities and deferred inflows of resources by $1.6 billion at the close of the current fiscal year.
As shown on the next page, the largest portion of the City’s net position, $1.2 billion or 73.8%, reflects the City’s investment in capital assets less any related outstanding debt and associated deferred outflows of resources used to acquire those assets. The City uses these capital assets to provide services to citizens; consequently, these assets are not available for future spending. Although the City’s investment in its capital assets is reported net of related debt and associated deferred outflows/inflows of resources, it should be noted that resources needed to repay this debt must be provided from other sources, since the capital assets themselves cannot be used to liquidate liabilities.
An additional portion of the City’s net position, $246.8 million or 15.4%, represents resources that are subject to external restrictions on how they may be used. The remaining balance of unrestricted net position, $171.9 million or 10.2%, may be used to meet the City’s ongoing obligations to citizens and creditors and other basic operations depending on the City’s ability to readily realize liquid assets for use. At the end of the current fiscal year, the City reports positive balances in all three categories of net position for both governmental activities and business-type activities. Both activities had positive net position in the prior fiscal year. This category of unrestricted net position for governmental activities includes the City’s holdings in various notes receivable from developers totaling $37.3 million with maturity terms up to 55 years which are not expected to be repaid soon. As such, these assets cannot be expected to be available to meet any of the City’s current ongoing obligations. Instead, current obligations would need to be paid with currently held cash and investments or future revenues.
xxii

CITY OF SANTA MONICA, CALIFORNIA
Management’s Discussion and Analysis, Continued For the fiscal year ended June 30, 2019
(Unaudited)
A summary of the government-wide statement of net position follows:
6/30/19 6/30/18 6/30/19 6/30/18 6/30/19 6/30/18(restated) (restated)
Current and other assets 788.8$ 850.4 332.4 270.6 1,121.2 1,121.0 Capital assets 825.5 799.1 461.0 447.3 1,286.5 1,246.4
Total assets 1,614.3 1,649.5 793.4 717.9 2,407.7 2,367.4 Deferred outflows of resources 93.3 116.6 20.9 27.6 114.2 144.2
Current and other liabilities 69.0 66.8 39.3 30.9 108.3 97.7 Long-term liabilities 644.9 690.1 138.3 111.8 783.2 801.9
Total liabilities 713.9 756.9 177.6 142.7 891.5 899.6 Deferred inflows of resources 21.9 24.6 6.4 6.9 28.3 31.5 Net position:
Net investment in capital assets 730.1 720.8 453.3 437.6 1,183.4 1,158.4 Restricted 226.9 209.4 19.9 21.9 246.8 231.3 Unrestricted 14.7 54.4 157.2 136.4 171.9 190.8
Total net position 971.7$ 984.6 630.4 595.9 1,602.1 1,580.5
CITY OF SANTA MONICASummary of Net Position
(in millions)
Governmental activities Business-type activities Total
Total current and other assets increased $0.2 million or 0.1% from the prior fiscal year. Governmental activities decreased by $61.6 million and business-type activities increased by $61.8 million.
Total deferred outflows of resources decreased $30.0 million or 20.8% from the prior fiscal year. Governmental activities decreased by $23.3 million and business-type activities decreased by $6.7 million. GASB 68 requires that certain differences between expected and actual net liability components are reported on the Statement of Net Position as deferred outflows of resources the fiscal period they arise, and they are subsequently amortized. The amounts vary from year to year dependent on the difference between the expected and actual amounts. The decrease is primarily due to the amortization of these past deferred items.
Total current and other liabilities increased $10.6 million or 10.8% from the prior fiscal year. Governmental activities increased by $2.2 million and business-type activities increased by $8.4 million. This increase is primarily due to additional payables outstanding at year-end from large capital projects and other capital-related expenses.
Total long-term liabilities decreased $18.7 million or 2.3% from the prior fiscal year. The decrease in this category is primarily due to the $19.0 million decrease in the net pension liability.
xxiii

CITY OF SANTA MONICA, CALIFORNIA
Management’s Discussion and Analysis, Continued For the fiscal year ended June 30, 2019
(Unaudited)
A summary of the government-wide statement of changes in net position follows:
2018-19 2017-18 2018-19 2017-18 2018-19 2017-18RevenuesProgram revenues:
Charges for services 136.2$ 140.9 120.9 126.0 257.1 266.9 Operating grants and contributions 32.8 28.0 59.3 44.3 92.1 72.3 Capital grants and contributions 5.9 5.4 23.8 16.5 29.7 21.9
General revenues:Sales and use taxes 73.7 68.5 — — 73.7 68.5 Business license taxes 31.9 31.5 — — 31.9 31.5 Property taxes 62.6 56.9 — — 62.6 56.9 Transient occupancy taxes 60.8 60.6 — — 60.8 60.6 Utility users taxes 28.3 29.3 — — 28.3 29.3 Real property transfer taxes 9.8 8.2 — — 9.8 8.2 Parking facility taxes 12.7 11.6 — — 12.7 11.6 Other taxes 3.3 3.3 — — 3.3 3.3 Investment income 21.6 4.4 7.1 1.5 28.7 5.9 Other revenue 11.3 11.2 3.0 4.6 14.3 15.8
Total revenues 490.9 459.8 214.1 192.9 705.0 652.7 Expenses
General government 87.3 94.2 — — 87.3 94.2 Public safety 160.5 152.3 — — 160.5 152.3 General services 85.5 85.6 — — 85.5 85.6 Cultural and recreation services 73.3 73.8 — — 73.3 73.8 Library 15.0 14.8 — — 15.0 14.8 Housing and community
development 60.3 58.4 — — 60.3 58.4 Interest on long-term debt 6.2 4.4 — — 6.2 4.4 Water — — 23.5 25.7 23.5 25.7 Resource recovery and recycling — — 27.3 26.3 27.3 26.3 Community broadband — — 2.5 1.9 2.5 1.9 Pier — — 9.3 7.9 9.3 7.9 Wastewater — — 20.4 18.8 20.4 18.8 Airport — — 9.6 12.9 9.6 12.9 Stormwater management — — 0.4 0.4 0.4 0.4 Cemetery — — 1.8 2.1 1.8 2.1 Big Blue Bus — — 100.1 95.3 100.1 95.3 Parking Authority — — 0.4 0.2 0.4 0.2
Total expenses 488.1 483.5 195.3 191.5 683.4 675.0 Excess (deficiency) of revenues
over expenses before special items and transfers 2.8 (23.7) 18.8 1.4 21.6 (22.3)
Special items — 43.7 — 6.4 — 50.1 Transfers (15.7) 1.4 15.7 (1.4) — —
Change in net position (12.9) 21.4 34.5 6.4 21.6 27.8 Beginning net position, as restated 984.6 963.2 595.9 589.5 1,580.5 1,552.7 Ending net position 971.7$ 984.6 630.4 595.9 1,602.1 1,580.5
Governmental activities Business-type activities Total
CITY OF SANTA MONICASummary of Changes in Net Position
(in millions)
xxiv

CITY OF SANTA MONICA, CALIFORNIA
Management’s Discussion and Analysis, Continued For the fiscal year ended June 30, 2019
(Unaudited)
Charges for services27.8%
Operating grants and contributions
6.7%
Capital grants and contributions
1.2%Sales and use taxes15.0%
Business license taxes6.5%
Property taxes12.7%
Transient occupancy taxes
12.4%
Utility users taxes5.8%
Real property transfer taxes
2.0%
Parking facility taxes2.6%
Other taxes0.7%
Investment income4.4%
Other general revenues
2.2%
Sources of Revenue Governmental Activities
Governmental Activities. The City’s governmental activities net position decreased by $12.9 million, or 1.3%. Analysis of revenues and expenses are discussed below and on the following pages.
Revenue Sources: Governmental Activities. As shown in the chart below, the largest category of revenue for governmental activities is charges for services, which represents 27.8% of total governmental activities revenue. The category totaled $136.2 million in FY 2018-19, compared to $140.9 million in FY 2017-18, which is a decrease of $4.7 million or 3.3% due to a decrease in parking citations and interfund and billable services. The second largest category is sales and use taxes, which increased $5.2 million or 7.6% from the prior fiscal year due to a portion of FY 2017-18 sales and use taxes being paid in FY 2018-19 because of the shifting of the collection and payment function from the State Board of Equalization to the new Department of Tax and Fee Administration. The third largest category is property taxes, which represent 12.7% of total governmental activities revenue. Property taxes increased $5.7 million or 10% from the prior fiscal year. The increase was primarily due to continued strong increase in City assessed valuation.
xxv

CITY OF SANTA MONICA, CALIFORNIA
Management’s Discussion and Analysis, Continued For the fiscal year ended June 30, 2019
(Unaudited)
Functional Expenses: Governmental Activities. As displayed in the chart below, general government, public safety, general services, cultural and recreation, and housing and community development accounted for 95.6% of total governmental activities expenses.
Total governmental activities expenses increased $4.6 million or 1.0% from the prior fiscal year. The three categories with the largest variance from the prior year were general government, public safety, and housing and community development. General government expenses decreased $6.9 million or 7.3%. Public safety expenses increased $8.2 million or 5.4%. Housing and community development increased $1.9 million or 3.2%. The decrease in general government is primarily due to lower pension expense including the amortization of related deferred inflows/outflows. The increase in public safety expense was due to increased pension expense, mostly related to the amortization of deferred outflows in the police and fire safety pension plans, and also salaries and overtime in a response to the City’s changing crime environment. The increase in housing and community development was related to increases in housing vouchers, serial inebriate program and rent control expenses.
General government17.8%
Public safety32.9%General services
17.5%
Cultural and recreation
15.0%
Library3.1%
Housing and community
development12.4%
Interest on long-term debt1.3%
Functional ExpensesGovernmental Activities
xxvi

CITY OF SANTA MONICA, CALIFORNIA
Management’s Discussion and Analysis, Continued For the fiscal year ended June 30, 2019
(Unaudited)
Program Expenses: Governmental Activities. The following chart compares program revenues and expenses for governmental activities (excluding interest on long-term debt):
The comparison of direct expenses and program revenues identifies the extent to which each function is self-financing or draws from the general revenues of the City. A higher percentage of program revenues to direct expenses indicates that a function is generally self-financed through program revenues generated by activities within that function. In contrast, a lower percentage of program revenues to direct expenses indicates that a function is primarily financed through general revenues.
The function with the highest percentage of program revenues to direct expenses in FY 2018-19 is housing and community development, which had expenses of $60.3 million and program revenues of $47.0 million, which is a ratio of 77.9%. This high percentage indicates that most of the expenses in this category are financed by revenues generated by activities within the housing and community development category.
The function with the lowest percentage of program revenues to direct expenses in FY 2018-19 is the Library, which had expenses of $15.0 million and program revenues of $0.5 million, a ratio of 3.3%. This low percentage indicates that most of the expenses in this category are financed by the general revenues of the City.
$0$20$40$60$80
$100$120$140$160$180
Generalgovernment
Public safety General services Cultural andrecreationservices
Library Housing andcommunity
development
Expenses and Program RevenuesGovernmental Activities
(millions)
Expenses Revenues
xxvii

CITY OF SANTA MONICA, CALIFORNIA
Management’s Discussion and Analysis, Continued For the fiscal year ended June 30, 2019
(Unaudited)
Business-type Activities. The City’s business-type activities net position increased $34.5 million or 5.8% from the prior fiscal year as restated.
Revenue Sources: Business-type activities. The chart below displays the key sources of revenue for business-type activities as a percentage of total revenues. The top three sources of revenue for business-type activities are charges for services, operating grants and contributions, and capital grants and contributions. These three categories account for 95.3% of the total business-type activities revenues of $214.1million.
Charges for services56.5%
Capital grants and contributions
11.1%
Operating grants and contributions
27.7%
Other general revenues
1.4%
Investment income3.3%
Sources of Revenue Business-type Activities
xxviii

CITY OF SANTA MONICA, CALIFORNIA
Management’s Discussion and Analysis, Continued For the fiscal year ended June 30, 2019
(Unaudited)
Expenses: Business-type Activities. The chart below displays individual business-type activities as a percentage of total business-type activity expenses. The Big Blue Bus, Resource Recovery and Recycling, Water, and Wastewater activities accounted for 87.7% of total business-type activity expenses. Other business-type activities of the City include the Airport, Pier, Cemetery, Stormwater Management, Parking Authority, and Community Broadband.
Water12.0%
Resource Recovery and Recycling
14.0%
Pier4.8%
Wastewater10.4%
Airport4.9%
Stormwater Management
0.2%Cemetery
0.9%
Big Blue Bus51.3%
Parking Authority0.2%
Community Broadband
1.3%
Business-type Activities Expenses
xxix

CITY OF SANTA MONICA, CALIFORNIA
Management’s Discussion and Analysis, Continued For the fiscal year ended June 30, 2019
(Unaudited)
Program Revenues and Expenses: Business-type Activities. The following chart compares program revenues and expenses for business-type activities:
For discussion and analysis of key points of business-type activities, see the following section on the City’s major proprietary funds.
FINANCIAL ANALYSIS OF THE CITY'S MAJOR FUNDS
As noted earlier, the City uses fund accounting to demonstrate compliance with finance-related legal requirements.
Governmental funds. The focus of the City’s governmental funds is to provide information on near-term inflows, outflows, and balances of spendable resources. Such information is useful in assessing the City’s financial requirements.
The City’s governmental funds total fund balance decreased $57.0 million, or 8.1% from the prior fiscal year. The primary reasons for the decrease are discussed on the following pages.
General Fund
The General Fund is the chief operating fund of the City. Total fund balance in the General Fund decreased $95.1 million or 21.8% from the prior fiscal year.
$0
$20
$40
$60
$80
$100
Expenses and Program RevenuesBusiness-type Activities
(in millions)
Expenses Revenues
xxx

CITY OF SANTA MONICA, CALIFORNIA
Management’s Discussion and Analysis, Continued For the fiscal year ended June 30, 2019
(Unaudited)
Key factors in changes in revenues and expenditures from the prior year are as follows:
1. Total General Fund revenues increased $12.5 million or 3.1% from the prior fiscal year. Thelargest revenue source in the General Fund is sales and use taxes, which increased $5.2 millionor 7.6%. The second largest revenue source in the General Fund is property taxes, whichincreased $5.6 million or 9.8%. The third largest revenue source is transient occupancy taxes,which increased $0.2 million or 0.3%. Combined, these three categories represented 47.4% oftotal General Fund revenues for FY 2018-19. Sales and use taxes increased due to a portion ofFY2017-18 sales and use taxes being paid in FY 2018-19 due to the shifting of the collectionand payment function from the State Board of Equalization to the new Department of Tax andFee Administration. Property taxes increased primarily due to continued strong increases in Cityassessed valuation. Transient occupancy while increasing slightly, was below what wasanticipated due to a decline in tourism in the second half of the year as a result of geopoliticaland economic factors.
2. Total General Fund expenditures, excluding debt issuance costs, increased $38.0 million or9.4% from the prior fiscal year. This increase was due primarily to an increase in generalgovernment expenditures of $12.5 million or 14.0% and an increase in public safetyexpenditures of $23.8 million or 16.6%. These two expenditure categories represent the largestexpenditure categories of the General Fund which account for 61% of all General Fundexpenditures for FY 2018-19. General Government increased due to several large capitalprojects currently under construction including the City Services Building at $16.2 million, andCity Yards Modernization at $6.9 million. Public Safety increased due to the construction ofFire Station 1 at $13.5 million plus increases in pension expenditures of $3.0 million and salariesand wages of $4.9 million.
Additionally, the General Fund transferred $53.5 million to the Water fund in relation to theOlympic Wellfield remediation project.
Special Revenue Source Fund
Total fund balance in the Special Revenue Source Fund increased $25.4 million or 19.5% from the prior fiscal year primarily due to transfers in. Total revenues decreased $0.1 million or 0.9%. The decrease in revenues was due to the $1.2 million decrease in other revenue and a decrease in charges for services of $0.5 million, offset by a $1.6 million increase in investment income.
Net transfers in increased $4.8 million or 27.6%; net transfers out decreased $0.7 million or 33.3% in FY 2018-19. The increase in transfers in is primarily due to the increase in affordable housing transfers from the Parking Authority related to increased Successor Agency loan repayments.
Low and Moderate Income Housing Asset Fund
Total fund balance in the Low and Moderate Income Housing Asset Fund increased $3.5 million or 6.2% from the prior fiscal year. Total revenues and transfers in increased $1.4 million or 61% from the prior fiscal year. The biggest reason for the increase in fund balance is an increase in interfund transfers in from $2.0 million for FY 2017-18 to $3.1 million for FY 2018-19. Transfers in represent the Fund’s mandatory 20% share in the repayment of Successor Agency loans under SB107. The amount of the loan repayment is based on a formula primarily driven by property tax in the former redevelopment
xxxi

CITY OF SANTA MONICA, CALIFORNIA
Management’s Discussion and Analysis, Continued For the fiscal year ended June 30, 2019
(Unaudited)
project areas. The total loans repaid in FY2017-18 was $10.0 million versus $15.7 million in FY 2018-19.
Proprietary funds. The City’s proprietary funds provide the same type of information found in the government-wide financial statements but in more detail.
The total net position of all the City’s enterprise funds increased $33.3 million, or 5.9% from the prior fiscal year.
Water Fund
The total net position of the Water Fund increased $38.6 million, or 60.0% from the prior fiscal year. Revenues reflect a $1.0 million increase in water service charges primarily from a 9% water rate increase offset by a decrease in customer water usage. The primary reason for the increase is the transfer in of $53.5 million and a special item of $21.3 million from the General Fund, both related to the Water Fund assuming the pollution remediation obligation for the Olympic Wellfield contamination. Additionally, investment income increased by $2.0 million mostly due to market conditions at the current year end versus the prior year end.
Wastewater Fund
The total net position of the Wastewater Fund decreased $2.1 million, or 1.0% from the prior fiscal year. Contractual services increased by $2.2 million primarily due to increases in City of Los Angeles sewer disposal fees. The increase was partially due to a $1.1 million true up payment related to the City of Los Angeles reconciling the prior year’s fees.
Resource Recovery and Recycling Fund
The total net position of the Resource Recovery and Recycling Fund increased $0.8 million or 28.6%.
The increase was primarily related to investment income which increased $0.9 million due to differing market conditions at the end of FY 2018-19 and FY 2017-18. Additionally, the City’s cost of recycling increased due to the market for recyclable materials eroding.
Big Blue Bus Fund
The total net position of the Big Blue Bus Fund decreased $2.1 million, or 1% from the prior fiscal year. Operating expenses increased $2.6 million or 2.6% from the prior fiscal year primarily due to an increase in personnel expenses from hiring additional staff to reduce overtime and enhance service delivery; this was partially offset by a reduction in workers’ compensation insurance payments.
General Fund Budgetary Variances
Revenue Original Budget to Final Amended Budget. The final revenue budget of $407.6 million for the General Fund exceeded the original budget of $403.5 million by $4.1 million or 1.0%. Revenue budget changes are approved by the City Council. The primary components of the variance were sales and use taxes which increased $1 million or 1.4%, with an original budget of $69.1 million and a final budget of $70.1 million, due to a change in the timing of the payments from the State. A portion of FY2017-18 sales and use tax were not paid until FY 2018-19 due to the shifting of the collection and
xxxii

CITY OF SANTA MONICA, CALIFORNIA
Management’s Discussion and Analysis, Continued For the fiscal year ended June 30, 2019
(Unaudited)
payment function from the State Board of Equalization to the new Department of Tax and Fee Administration. Also, licenses and permits increased $1.8 million or 4.1%, with an original budget of $44.3 million and a final budget of $46.1 million, due to a rise in parking revenues from increased parking rates. The final budget for transit occupancy taxes, $61.9 million, was $1.3 million or 2.1% over the original budget of $60.6 million due to higher than expected room rental rates.
Revenue Final Amended Budget to Actuals. Actual General Fund revenues totaled $416.0 million, exceeding the final budget of $407.6 million, by $8.4 million. The primary components of the variance were sales and use taxes with actual revenues exceeding final budgeted amounts by $3.6 million or 5.1% due to the change in State agencies administering sales and use taxes and other taxes for which actual revenues exceeded the final budget by $3.0 million or 15.3%. This was primarily due to increases in documentary transfer tax and investment income. Investment income exceeded the final budgeted amount by $7.9 million or 106.8% due to mark to market adjustments.
Expenditure Original Budget to Final Amended Budget. The final General Fund expenditure budget is greater than the original budget by $197.9 million, or 45.9%. The increase is primarily due to the capital budgeting process. The original capital budget includes only amounts adopted by Council as part of the biennial capital budgeting process. However, large capital projects often span across numerous years and remaining capital budgets from previous fiscal periods are rolled over to the current fiscal year in order to complete those projects. Funds are reserved as Assigned Continuing Capital Projects to cover these costs. The final budget includes both newly adopted and rolled over amounts. Significant projects that were rolled over include Fire Station 1, City Yards Improvements and the City Services Building at $15.8 million, $39.3 million and $38.1 million, respectively.
Expenditure Final Amended Budget to Actuals. Actual expenditures (budgetary basis) for the General Fund totaled $559.2 million, while the final budget totaled $629.2 million, a variance of $70.0 million. Almost all of the variance is due to capital improvement expenditures, which had actual expenditures of $178.8 million, compared to the final budget of $239.6 million, a variance of $60.8 million. Many capital projects are constructed over numerous fiscal periods and the variance in this category is due to the timing between the establishment of the budget at the beginning of the project and actual capital improvement project spending. Unexpended capital budget will be reappropriated into FY 2019-20 to continue work on projects that have not yet been completed. Actual operating expenditures totaled $380.4 million, compared to the final budget of $389.6 million, which is a variance of $9.2 million or 2.4%. This small variance demonstrates accurate budgetary forecasting and prudent program management within spending limits.
CAPITAL ASSET AND DEBT ADMINISTRATION
Capital Assets. The City’s capital assets (net of accumulated depreciation) as of June 30, 2019 amounted to $1,286.5 million, an increase of $40.1 million from the prior fiscal year. The increase was primarily due to the continued construction of large projects such as Fire Station 1, the City Services Building and the City Yards Modernization.
This investment in a broad range of capital assets, including land, infrastructure, buildings and improvements, equipment, and construction in progress, is detailed as follows:
xxxiii

CITY OF SANTA MONICA, CALIFORNIA
Management’s Discussion and Analysis, Continued For the fiscal year ended June 30, 2019
(Unaudited)
6/30/19 6/30/18 6/30/19 6/30/18 6/30/19 6/30/18
Land 200.3$ 200.3 53.4 53.4 253.7 253.7 Land held under easement 72.2 72.2 — — 72.2 72.2 Construction in progress 72.1 48.8 17.7 5.8 89.8 54.6 Buildings 213.8 221.8 81.9 86.3 295.7 308.1 Improvements other than buildings 106.8 94.4 9.9 10.8 116.7 105.2 Machinery and equipment 24.1 18.0 90.1 83.0 114.2 101.0 Infrastructure 135.2 142.3 135.4 137.2 270.6 279.5 Utility systems 0.5 0.8 — — 0.5 0.8 Intangibles 0.5 0.5 72.6 70.8 73.1 71.3
Capital assets, net 825.5$ 799.1 461.0 447.3 1,286.5 1,246.4
CITY OF SANTA MONICACapital Assets (net of depreciation)
(in millions)
Governmental activities Business-type activities Total
Some of the City’s major capital asset events in FY 2018-19 were:
Governmental Activities:
1. Major projects included $16.2 million for the construction of the new City Services Building,$6.9 million for the design and construction for City Yards Modernization, $4.2 million for fireapparatus replacement and $13.5 million for the construction of Fire Station 1.
2. The amount in construction in progress increased as there are several major projects that have atargeted completion date of 2020 and beyond. These major projects include the new CityServices Building, Fire Station 1, and the City Yards Modernization, with ending balances asof June 30, 2019 of $34.1 million, $16.4 million, and $8.8 million, respectively.
Business-Type Activities:
1. Major projects included $11.9 million for the purchase of nineteen new buses in the Big BlueBus Fund and $4.5 million increase in intangibles for capital payments made to the City of LosAngeles for Santa Monica’s shared cost of the Amalgamated System in the Wastewater Fund.
2. The assets above are net of $15.4 million historical cost for the disposal of buses and othervehicles that met or exceeded their useful lives.
Additional information on the City’s capital assets can be found in note 7 to the basic financial statements.
As of June 30, 2019, the City had $71.0 million in construction commitments. For additional information on commitments see note 14.
xxxiv

CITY OF SANTA MONICA, CALIFORNIA
Management’s Discussion and Analysis, Continued For the fiscal year ended June 30, 2019
(Unaudited)
Long-term Debt. At the end of the current fiscal year, the City’s total long-term debt outstanding (excluding issuance premiums) was $164.3 million, a decrease from the prior year of $6.9 million or 4.0%, representing debt service payments for existing debt. This decrease was due to payments of $5.7 million in revenue bonds and $1.2 million in general obligation bonds.
6/30/19 6/30/18 6/30/19 6/30/18 6/30/19 6/30/18General obligation bonds
(backed by the City) 4.3$ 5.5 — — 4.3 5.5 Revenue bonds
(backed by specific tax, fee 152.1 155.6 6.8 9.0 158.9 164.6 and lease revenues)
Notes and loans 0.2 0.4 0.9 0.7 1.1 1.1 Total 156.6$ 161.5 7.7 9.7 164.3 171.2
CITY O F SANTA MO NICAO utstanding Debt
(in millions)
Governmental activities Business-type activities Total
The City of Santa Monica maintains a “AAA” rating from both Standard and Poor’s and Fitch, and a “Aaa” rating from Moody’s. There were no changes to any bond ratings during FY 2018-19.
Additional information on the City’s long-term debt can be found in note 9 to the basic financial statements.
ECONOMIC FACTORS AND BIENNIAL BUDGET
The City’s adopted General Fund budget for FY 2019-21 is the city’s first biennial budget to implement the performance-based budget built on a new framework for a Sustainable City of Wellbeing. The framework is the City’s strategic direction to achieve the desired outcomes. Management feels that there are adequate resources available to fund the proposed expenditures.
In preparing the budget for FY 2019-21, many factors were taken into consideration:
• The seven outcomes outlined in the Framework for Sustainable City of Wellbeing which includes:Connected and Engaged Community; Inclusive, Affordable, and Diverse Local Economy;Lifelong Opportunities for Personal Growth; Physical, Mental and Natural Environment; a SafePlace for All; and, Reliable, Effective, and Efficient Government.
• Commitment to eliminate the unfunded pension liability in 13 years through an accelerated 13-year pay-down.
• Budget reductions based on streamlined and efficient practices realigning programs and servicesto current industry standards, community usage and anticipated future needs.
• Investing in a 21st Century government including a new City Hall extension, new Fire Station andmodernized City Yards; in addition, developing a digital City Hall to deliver 24/7 responsiveness
xxxv

CITY OF SANTA MONICA, CALIFORNIA
Management’s Discussion and Analysis, Continued For the fiscal year ended June 30, 2019
(Unaudited)
to the community, creating work efficiencies and continuing excellent service and safety to the community.
• Keeping the neighborhoods safe by continuously deploying Police new hires to directly impactcrime and safety; and expanding ambassador services to Reed Park for a six-month pilot program.
• Restructuring Water Resources staffing to implement and maintain new and existing infrastructureand major support to water projects advancing the City’s efforts to achieve water self-sufficiencyby 2023.
• Extending and enhancing intensive initiatives to reduce Homelessness in the City; leveraging non-City resources and partnerships to support ongoing costs.
• Expanding the “Preserving Our Diversity (POD) pilot program which provides low-incomeseniors with cash-based financial assistance and care management from 22 households to a rangeof 200 to 400 households.
• Implementing innovative approaches for creating a model for effective public service in the 21st
Century, including managing and measuring performance; taking on ‘total workplace’ initiativesthat modernize the way the City conducts business – from increased automation and mobileworkspaces, to open and collaborative offices; making public services and information easilyaccessible and fostering two-way interaction and civic engagement.
CONTACTING THE CITY'S FINANCE DEPARTMENT
This management’s discussion and analysis is designed to provide citizens, taxpayers, customers, investors and creditors with a general overview of the City's finances and to demonstrate the City's accountability for the money it receives. If you have questions or need additional financial information, please visit the City of Santa Monica’s Finance Department website at www.smgov.net/finance or call (310) 458-8281.
xxxvi

City of Santa Monica, California
Year Ended June 30, 2019
BASIC FINANCIAL STATEMENTS

CITY OF SANTA MONICA, CALIFORNIAStatement of Net Position
June 30, 2019Governmental
ActivitiesBusiness-Type
Activities TotalASSETS
Cash and investments (note 5) $ 464,227,416 239,260,739 703,488,155Receivables (net of allowances for uncollectibles):
Accounts 15,648,599 12,635,491 28,284,090Interest 2,815,496 19,221,755 22,037,251Taxes 6,644,365 3,474 6,647,839Settlement - 7,340,000 7,340,000Notes (note 6) 169,515,958 - 169,515,958Other governments 3,082,358 6,971,500 10,053,858
Internal balances 10,193,934 (10,193,934) -Inventory - 3,314,087 3,314,087Deposits 61,785 - 61,785Prepaids 1,741,832 110,238 1,852,070Restricted cash and investments (note 5) 11,970,291 46,163,517 58,133,808Restricted cash and investments with fiscal agent (note 5) 95,109,814 120 95,109,934Notes receivable from Successor Agency 7,766,028 7,612,125 15,378,153Capital assets (note 7):
Capital assets not being depreciated:Land 200,323,024 53,380,750 253,703,774Land held under easement 72,237,823 - 72,237,823Construction in progress 72,054,574 17,730,616 89,785,190
Capital assets being depreciated:Buildings 340,429,097 148,326,983 488,756,080Improvements other than buildings 194,445,830 27,518,253 221,964,083Utility systems 1,742,913 - 1,742,913Machinery and equipment 57,163,244 223,341,385 280,504,629Infrastructure 376,441,741 240,517,854 616,959,595Intangibles 695,710 110,840,095 111,535,805Less accumulated depreciation (490,073,578) (360,676,938) (850,750,516)
Total capital assets, net 825,460,378 460,978,998 1,286,439,376TOTAL ASSETS 1,614,238,254 793,418,110 2,407,656,364
DEFERRED OUTFLOWS OF RESOURCESDeferred loss on refundings 68,021 190,666 258,687Deferred outflows from pensions (note 16) 89,531,071 20,057,526 109,588,597Deferred outflows from OPEB (note 16) 3,653,877 676,387 4,330,264
TOTAL DEFERRED OUTFLOWS OF RESOURCES 93,252,969 20,924,579 114,177,548
LIABILITIESAccounts payable 29,437,352 12,640,745 42,078,097Accrued liabilities 7,032,231 3,082,275 10,114,506Accrued interest payable 2,917,693 78,294 2,995,987Contracts payable (retained percentage) 2,091,359 629,400 2,720,759Unearned revenue (note 8) 26,301,690 3,935,403 30,237,093Deposits payable from restricted assets 1,194,316 18,975,489 20,169,805Long-term liabilities:
Compensated absences due within one year (note 2) 8,832,969 2,865,892 11,698,861Compensated absences due in more than one year (note 2) 4,777,646 740,319 5,517,965Claims payable due within one year (note 15) 16,691,082 3,840,574 20,531,656Claims payable due in more than one year (note 15) 46,718,005 3,255,173 49,973,178Loans and bonds payable due within one year (note 9) 4,955,000 2,525,130 7,480,130Loans and bonds payable due in more than one year (note 9) 166,858,662 5,405,431 172,264,093Pollution remediation obligation due within one year (note 4) 322,540 7,127,106 7,449,646Pollution remediation obligation due in more than one year (note 4) 2,332,867 30,559,095 32,891,962Net OPEB liability (note 16) 23,239,269 4,301,935 27,541,204Net pension liability (note 16) 370,207,482 77,627,092 447,834,574TOTAL LIABILITIES 713,910,163 177,589,353 891,499,516
DEFERRED INFLOWS OF RESOURCESDeferred gain on refunding 54,376 - 54,376Deferred inflows from pensions (note 16) 20,712,716 6,169,734 26,882,450Deferred inflows from OPEB (note 16) 1,095,063 202,714 1,297,777
TOTAL DEFERRED INFLOWS OF RESOURCES 21,862,155 6,372,448 28,234,603NET POSITION
Net investment in capital assets 730,135,331 453,239,103 1,183,374,434Restricted for (note 12):
Housing and community development 136,648,018 5,178,223 141,826,241Culture and recreation services 17,848,361 - 17,848,361Transportation 27,504,151 - 27,504,151Clean beaches and ocean parcel tax 9,503,360 - 9,503,360Debt service 5,048,924 2,298,946 7,347,870Miscellaneous 16,500,684 - 16,500,684Perpetual care - nonexpendable 13,813,783 - 13,813,783Rail reserve and Prop 1B - 12,447,859 12,447,859
Unrestricted 14,716,293 157,216,757 171,933,050TOTAL NET POSITION $ 971,718,905 630,380,888 1,602,099,793
See accompanying notes to basic financial statements. 1

CITY OF SANTA MONICA, CALIFORNIAStatement of Activities
For the fiscal year ended June 30, 2019
Program Revenues Net (Expense) Revenue and Change in Net Position
Functions/Programs ExpensesCharges for
ServicesOperating Grantsand Contributions
Capital Grantsand Contributions
GovernmentalActivities
Business-TypeActivities Total
Governmental Activities:General government $ 87,251,208 19,645,270 2,622,324 96,487 (64,887,127) - (64,887,127)Public safety 160,531,648 21,765,362 708,320 938,210 (137,119,756) - (137,119,756)General services 85,528,797 45,214,114 7,985,647 4,828,495 (27,500,541) - (27,500,541)Cultural and recreation services 73,315,694 23,412,204 198,857 - (49,704,633) - (49,704,633)Library 14,985,755 437,269 24,824 - (14,523,662) - (14,523,662)Housing and community development 60,314,000 25,710,747 21,295,055 - (13,308,198) - (13,308,198)Interest on long-term debt 6,187,333 - - - (6,187,333) - (6,187,333)
Total governmental activities 488,114,435 136,184,966 32,835,027 5,863,192 (313,231,250) - (313,231,250)Business-Type Activities:Water 23,490,062 26,851,412 18,040 - - 3,379,390 3,379,390Resource recovery and recycling 27,292,721 27,444,457 - - - 151,736 151,736Community broadband 2,519,298 2,489,716 - - - (29,582) (29,582)Pier 9,265,493 9,188,924 - - - (76,569) (76,569)Wastewater 20,423,956 19,626,512 - - - (797,444) (797,444)Airport 9,627,471 15,690,488 - - - 6,063,017 6,063,017Stormwater management 380,752 1,515,810 - - - 1,135,058 1,135,058Cemetery 1,805,703 1,730,351 - - - (75,352) (75,352)Big Blue Bus 100,093,505 16,313,026 59,321,394 23,851,525 - (607,560) (607,560)Parking authority 422,090 - - - - (422,090) (422,090)
Total business-type activities 195,321,051 120,850,696 59,339,434 23,851,525 - 8,720,604 8,720,604Total Primary Government $ 683,435,486 257,035,662 92,174,461 29,714,717 (313,231,250) 8,720,604 (304,510,646)
General revenues: Taxes:
Property 62,615,270 - 62,615,270Sales and use 73,709,191 - 73,709,191Transient occupancy 60,762,881 - 60,762,881Utility users 28,306,582 - 28,306,582Business license 31,947,056 - 31,947,056Parking facility 12,699,044 - 12,699,044Real property transfer 9,808,072 - 9,808,072Other 3,275,912 - 3,275,912
Other revenue 11,328,286 3,049,645 14,377,931 Investment income 21,569,426 7,051,704 28,621,130Transfers (15,670,477) 15,670,477 -Total general revenues and transfers 300,351,243 25,771,826 326,123,069Change in net position (12,880,007) 34,492,430 21,612,423
Net position at beginning of year, as restated (note 18) 984,598,912 595,888,458 1,580,487,370Net position at end of year $ 971,718,905 630,380,888 1,602,099,793
See accompanying notes to basic financial statements.
2

Major Governmental Fund Financial Statements
General Fund – To account for all financial resources necessary to carry out basic governmental activities of the City that are not accounted for in another fund. The General Fund supports essential City services such as police and fire protection, street maintenance, libraries, parks and open space management.
Special Revenue Source Fund (Capital Projects Fund Type) – To account for receipt and expenditure of monies restricted, committed or assigned for specific uses.
Low and Moderate Income Housing Asset Fund (Special Revenue Fund Type) – Under Senate Bill 341, housing assets transferred to the City’s Housing Successor Agency together with any funds generated from housing assets, shall be maintained in a separate Low and Moderate Income Housing Asset Fund. These funds can be used as previously allowed under the Low and Moderate Income Housing Fund established under Community Redevelopment Law, program monitoring and preserving the long-term affordability of units subject to affordability restrictions, homeless prevention and rapid rehousing services, and for the development of affordable housing for lower income households. Under SB107, 20% of all Successor Agency/City loan payments are distributed to this fund.
3

CITY OF SANTA MONICA, CALIFORNIABalance Sheet
Governmental FundsJune 30, 2019
Capital ProjectsFund
Special RevenueFund
General FundSpecial Revenue
Source Fund
Low andModerate
Income HousingAsset Fund
Nonmajorgovernmental
funds
Totalgovernmental
funds
ASSETSCash and investments (note 5) $ 267,538,714 80,186,067 7,242,797 39,335,270 394,302,848Restricted cash and investments (note 5) 404,113 - - 11,566,178 11,970,291Receivables (net, where applicable, of allowances for uncollectibles):
Accounts 13,236,612 2,507 - 2,294,958 15,534,077Notes (note 6) - 93,946,943 52,362,933 23,206,082 169,515,958Taxes 6,634,511 - - 9,854 6,644,365Interest 1,885,469 372,500 31,515 277,072 2,566,556Other governments - - - 3,082,358 3,082,358
Due from other funds (note 11) 3,320,119 - - - 3,320,119Deposits 58,528 - - 3,257 61,785Prepaids 1,680,473 - - 51,242 1,731,715Restricted cash and investments with fiscal agent (note 5) 76,373,131 - - 18,736,683 95,109,814Advances to other funds (note 11) 10,012,863 - - - 10,012,863Notes receivable Successor Agency (note 17) 7,766,028 - - - 7,766,028
Total assets $ 388,910,561 174,508,017 59,637,245 98,562,954 721,618,777
LIABILITIES, DEFERRED INFLOWS OF RESOURCES, ANDFUND BALANCES
LiabilitiesAccounts payable $ 25,663,456 162,342 254 2,025,052 27,851,104Accrued liabilities 6,656,858 26 - 278,747 6,935,631Contracts payable (retained percentage) 1,643,674 137,700 - 309,985 2,091,359Due to other funds (note 11) - - - 3,320,119 3,320,119Unearned revenue (note 8) 7,860,529 17,913,970 - 527,191 26,301,690Deposits payable 673,751 475,000 - 45,565 1,194,316Advances from other funds (note 11) - - - 4,263,891 4,263,891
Total liabilities 42,498,268 18,689,038 254 10,770,550 71,958,110
Deferred inflows of resources (note 8) 5,733,513 - - 2,368,820 8,102,333
Fund balances (note 13)Nonspendable 11,554,753 - - 13,864,136 25,418,889Restricted 69,975,839 75,064,003 59,636,991 75,131,084 279,807,917Committed 1,943,558 80,754,976 - - 82,698,534Assigned 182,199,922 - - - 182,199,922Unassigned 75,004,708 - - (3,571,636) 71,433,072
Total fund balances 340,678,780 155,818,979 59,636,991 85,423,584 641,558,334
Total liabilities, deferred inflows of resources, and fund balances $ 388,910,561 174,508,017 59,637,245 98,562,954 721,618,777
See accompanying notes to basic financial statements.
4

CITY OF SANTA MONICA, CALIFORNIAReconciliation of the Governmental Funds Balance Sheet to the
Government-Wide Statement of Net Position
June 30, 2019
Fund balances - total governmental funds 641,558,334$
Amounts reported for governmental activities in the statement of net position are different because (Note 3):
(1) Capital assets used in governmental activities are not current financial resources and, therefore, are not reported in the balance sheet. 825,221,846
(2) Pension deferrals from reporting under GASB 68 68,418,876
(3) OPEB deferrals from reporting under GASB 75 2,543,652
(4) Deferred gain on refunding of debt is not a current financial resource and, therefore, is not reported in the balance sheet. (54,376)
(5) Deferred loss on refundings of debt is not a current financial resource and, therefore, is not reported in the balance sheet. 68,021
(6) Long-term liabilities and accrued interest are not due and payable in the current period and therefore are not reported in the balance sheet. (581,935,131)
(7) Revenue earned, but unavailable to pay for current period expenditures, is reporting as deferred inflows in the balance sheet, but
recognized as revenue in the statement of activities. 8,102,333
(8) Internal service funds are used by management to charge the costs of vehicle management, information technology and
risk management to individual funds. The assets and liabilities of the information technology and risk management (excluding bus)
internal service funds are included in the governmental activities in the statement of net position. 7,795,350
Net position of governmental activities 971,718,905$
See accompanying notes to basic financial statements.
5

CITY OF SANTA MONICA, CALIFORNIAStatement of Revenues, Expenditures and Changes in Fund Balances
Governmental FundsFor the fiscal year ended June 30, 2019
Capital ProjectsFund
Special RevenueFund
General FundSpecial Revenue
Source Fund
Low andModerate
Income HousingAsset Fund
Nonmajorgovernmental
funds
Totalgovernmental
fundsRevenues:
Property taxes $ 62,615,270 - - - 62,615,270Sales and use taxes 73,709,191 - - - 73,709,191Transient occupancy taxes 60,762,881 - - - 60,762,881Utility user taxes 28,306,582 - - - 28,306,582Business license taxes 31,947,056 - - - 31,947,056Other taxes 22,576,476 - - 3,206,552 25,783,028Licenses and permits 44,987,628 - - 111,819 45,099,447Intergovernmental 1,860,596 - - 36,455,291 38,315,887Charges for services 45,279,116 948,558 - 19,619,987 65,847,661Fines and forfeitures 14,877,572 - - - 14,877,572Investment income 15,284,964 1,814,310 277,697 3,111,009 20,487,980Rental income 7,561,578 - - 1,425,366 8,986,944Other revenue 6,220,509 5,787,717 291,448 921,259 13,220,933
Total revenues 415,989,419 8,550,585 569,145 64,851,283 489,960,432Expenditures:
Current:General government 101,784,875 2,168,026 - 1,384,701 105,337,602Public safety 167,607,704 2,012 - 682,536 168,292,252General services 69,726,299 420,743 - 13,269,227 83,416,269Cultural and recreation services 59,371,679 945,506 - 11,181,864 71,499,049Library 13,628,409 - - 35,344 13,663,753Housing and community development 29,771,917 394,766 187,603 26,209,393 56,563,679
Debt service expenditures:Principal - - - 4,630,000 4,630,000Interest - - - 6,310,437 6,310,437Bond issuance costs 4,025 - - - 4,025
Total expenditures 441,894,908 3,931,053 187,603 63,703,502 509,717,066Excess (deficiency) of revenues over (under) expenditures (25,905,489) 4,619,532 381,542 1,147,781 (19,756,634)
Other financing sources (uses):Transfers in 9,082,615 22,199,396 3,133,730 12,164,756 46,580,497Transfers out (78,309,472) (1,435,774) - (4,040,071) (83,785,317)
Total other financing sources (uses) (69,226,857) 20,763,622 3,133,730 8,124,685 (37,204,820)
Net change in fund balances (95,132,346) 25,383,154 3,515,272 9,272,466 (56,961,454)Fund balances at beginning of year 435,811,126 130,435,825 56,121,719 76,151,118 698,519,788Fund balances at end of year $ 340,678,780 155,818,979 59,636,991 85,423,584 641,558,334
See accompanying notes to basic financial statements.
6

Net change in fund balances – total governmental funds $ (56,961,454)
Amounts reported for governmental activities in the statement of activities are different because:
Capital assets:
1) The acquisition of capital assets requires the use of current financial resources
but has no effect on net position. 55,835,209
2) The cost of capital assets is allocated over their estimated useful lives and reported
as depreciation expense in the statement of activities. (29,369,515)
3) The loss on disposal of capital assets is recorded as an expense in the statement of activities
but is not recorded in the fund statements. (26,235)
Measurement focus:
4) Change in accrued interest payable. (689,269)
5) Principal payments on long-term obligations use current financial resources
but have no effect on net position. 4,830,000
6) Bond premiums are recorded as other financing sources in the fund statements but are
amortized in the statement of activities. 847,647
7) Deferred gain and loss on refunding is amortized in the statement of activities. (35,274)
8) The increase in compensated absences liability does not use current financial resources but is recorded as an
increase in expense in the statement of activities. (276,567)
9) Interest income related to successor agency advances are recorded as revenue in the statement of activities
but are reported as deferred inflows of resources in the fund statements. 72,883
10) Interest income related to airport advances were previously recorded as revenue in the statement of activities
was recognized as income in the fund statements (72,053)
11) Interest income recorded as revenue in the fund statements in the current year but reported as interest income
in the prior year statement of activities (730,509)
12) Grant revenue previously recognized in the statement of activities is recorded as revenue in the fund
statements. (3,203,814)
13) Grant revenue earned but not yet available being recorded on the statement of activities that are not recorded on
the fund statements. 2,368,820
14) Pollution remediation expense activity was recorded in the fund statements and reduced the liability in the
statement of activities. 665,434
15) Pollution remediation liability was transferred from the governmental activities to the business type
activities. 21,327,312
16) Unavailable revenue has no impact on current financial resources but increases net position
in the statement of activities. 265,274
17) GASB 75 OPEB reporting timing differences. (370,455)
18) GASB 68 pension reporting timing differences. (4,553,313)
Internal service funds:
19) Certain internal service funds are used by management to charge the costs of
information technology and risk management to individual funds.
The net revenue/(expense) of certain internal service funds is reported with
governmental activities. (2,804,128)
Change in net position (statement of activities, governmental activities) $ (12,880,007)
See accompanying notes to basic financial statements.
CITY OF SANTA MONICA, CALIFORNIA
Reconciliation of the Governmental Funds Statement of Revenues, Expenditures and Changes in Fund Balances
to the Government-Wide Statement of Activities
For the fiscal year ended June 30, 2019
7

Proprietary Fund Financial Statements
Major Enterprise Funds are used to report any activity for which a fee is charged to external users for goods or services.
Water Fund – To account for revenues and expenses of providing water service to the citizens of the City.
Wastewater Fund – To account for revenues and expenses associated with maintaining the sanitary sewer systems within the City.
Resource Recovery and Recycling Fund – To account for revenues and expenses of operating the City's refuse collection, street sweeping and cleaning, and recycling programs.
Big Blue Bus Fund – To account for revenues and expenses related to operation of the City's municipal bus lines.
Internal Service Funds – To account for the financing of goods or services provided by one department or agency to other departments or agencies of the City or to other governments, on a cost-reimbursement basis.
8

CITY OF SANTA MONICA, CALIFORNIAStatement of Net Position
Proprietary FundsJune 30, 2019
Business-Type Activities - Enterprise Funds
Water Wastewater
ResourceRecovery and
Recycling Big Blue Bus
Nonmajorenterprise
funds
Totalenterprise
fundsTotal internalservice funds
ASSETSCurrent assets:
Cash and investments (note 5) $ 103,374,387 41,950,680 10,815,837 26,790,583 29,866,521 212,798,008 96,387,299Restricted cash and investments (note 5) 355,474 2,299,754 - 13,926,695 6,636,611 23,218,534 -Receivables (net, where applicable, of allowances for uncollectibles):
Accounts 3,878,831 2,616,943 3,527,217 1,686,646 780,666 12,490,303 259,710Notes receivable Successor Agency - - - - 7,352,725 7,352,725 -Interest 285,788 195,144 111,466 125,072 125,267 842,737 348,970Settlement 7,340,000 - - - - 7,340,000 -
Due from other governments - - - 6,971,500 3,474 6,974,974 -Inventory - - - 3,266,173 - 3,266,173 47,914Prepaids 48,277 16,554 2 18,813 26,385 110,031 10,312
Total current assets 115,282,757 47,079,075 14,454,522 52,785,482 44,791,649 274,393,485 97,054,205Noncurrent assets:
Restricted cash and investments (note 5) 1,428,792 4,506,039 17,010,272 - - 22,945,103 -Notes receivable Successor Agency noncurrent - - - - 259,400 259,400 -Accrued interest non current - - - - 18,278,988 18,278,988 -Capital assets (note 7):
Land 21,006 3,189,132 - 48,807,900 1,362,712 53,380,750 -Construction in progress 1,781,004 8,536,749 - 1,332,300 3,332,019 14,982,072 2,748,544Buildings 1,532,511 251,447 314,223 129,881,355 16,347,447 148,326,983 -Improvements other than buildings 1,015,098 297,592 99,731 13,967,895 12,137,937 27,518,253 -Machinery and equipment 3,778,029 1,649,296 246,078 176,077,592 1,326,612 183,077,607 41,795,468Infrastructure 53,573,310 158,822,132 - - 28,122,412 240,517,854 -Intangibles 3,575,000 107,265,095 - - - 110,840,095 -Less: accumulated depreciation (32,534,055) (105,388,734) (546,719) (166,728,888) (33,231,952) (338,430,348) (23,539,748)
Net capital assets 32,741,903 174,622,709 113,313 203,338,154 29,397,187 440,213,266 21,004,264Total noncurrent assets 34,170,695 179,128,748 17,123,585 203,338,154 47,935,575 481,696,757 21,004,264TOTAL ASSETS 149,453,452 226,207,823 31,578,107 256,123,636 92,727,224 756,090,242 118,058,469
DEFERRED OUTFLOWS OF RESOURCESDeferred loss on refunding - 190,666 - - - 190,666 -Deferred outflows from pensions 1,686,582 616,973 2,575,138 12,828,675 1,491,569 19,198,937 1,435,537Deferred outflows from OPEB 58,458 17,321 116,051 393,188 49,798 634,816 63,222
TOTAL DEFERRED OUTFLOWS OF RESOURCES 1,745,040 824,960 2,691,189 13,221,863 1,541,367 20,024,419 1,498,759LIABILITIES
Current liabilities:Accounts payable 2,098,690 3,734,260 1,403,950 3,222,070 1,315,062 11,774,032 2,452,960Accrued liabilities 181,339 60,952 269,433 2,333,299 171,804 3,016,827 162,048Contracts payable (retained percentage) 206,164 28,582 - 93,548 301,106 629,400 -Compensated absences due within one year (note 2) 252,498 74,431 359,655 1,832,177 219,455 2,738,216 210,845Claims payable due within one year (note 15) - - - - - - 20,531,656Unearned revenue (note 8) - - - 3,935,403 - 3,935,403 -Accrued interest payable - 75,563 - - 2,731 78,294 -Loans and bonds payable due within one year (note 9) - 2,210,000 - - 315,130 2,525,130 -Liabilities payable from restricted assets - deposits 355,474 - 17,010,272 47,975 1,561,768 18,975,489 -Pollution remediation obligation due within one year (note 4) 7,127,106 - - - - 7,127,106 -
Total current liabilities 10,221,271 6,183,788 19,043,310 11,464,472 3,887,056 50,799,897 23,357,509Long-term liabilities:
Compensated absences due in more than one year (note 2) 128,605 46,868 103,733 295,955 142,331 717,492 78,032Advances from other funds (note 11) - - - - 5,748,972 5,748,972 -Claims payable due in more than one year (note 15) - - - - - - 49,973,178Loans and bonds payable due in more than one year (note 9) - 5,405,431 - - - 5,405,431 -Pollution remediation obligation due in more than one year (note 4) 30,559,095 - - - - 30,559,095 -Net OPEB liability 371,806 110,165 738,104 2,500,741 316,723 4,037,539 402,102Net pension liability 6,527,447 2,387,821 9,966,355 49,649,828 5,772,709 74,304,160 5,555,849
Total long-term liabilities 37,586,953 7,950,285 10,808,192 52,446,524 11,980,735 120,772,689 56,009,161TOTAL LIABILITIES 47,808,224 14,134,073 29,851,502 63,910,996 15,867,791 171,572,586 79,366,670
DEFERRED INFLOWS OF RESOURCESDeferred inflows from pensions 518,796 189,781 792,118 3,946,123 458,812 5,905,630 441,573Deferred inflows from OPEB 17,520 5,191 34,781 117,838 14,925 190,255 18,948
TOTAL DEFERRED INFLOWS OF RESOURCES 536,316 194,972 826,899 4,063,961 473,737 6,095,885 460,521
NET POSITIONNet investment in capital assets 32,741,903 167,197,944 113,313 203,338,154 29,082,057 432,473,371 21,004,264Restricted for Rail Reserve and Prop 1B (note 12) - - - 12,447,859 - 12,447,859 -Restricted for housing - - - - 5,178,223 5,178,223 -Restricted for debt service - 2,298,946 - - - 2,298,946 -Unrestricted 70,112,049 43,206,848 3,477,582 (14,415,471) 43,666,783 146,047,791 18,725,773
TOTAL NET POSITION $ 102,853,952 212,703,738 3,590,895 201,370,542 77,927,063 598,446,190 39,730,037
Net position, business-type activities - internal service funds 36,379,660Net adjustment to reflect the allocation of the internal service funds net income (4,444,962)Net position of business-type activities $630,380,888
See accompanying notes to basic financial statements.9

CITY OF SANTA MONICA, CALIFORNIAStatement of Revenues, Expenses and Changes in Fund Net Position
Proprietary FundsFor the fiscal year ended June 30, 2019
Business-Type Activities - Enterprise Funds
Water Wastewater
ResourceRecovery and
Recycling Big Blue Bus
Nonmajorenterprise
funds
Totalenterprise
funds
Totalinternal
service funds
Operating revenuesCharges for services $ 26,851,412 19,626,512 27,444,457 14,069,316 29,616,436 117,608,133 46,419,817
Total operating revenues 26,851,412 19,626,512 27,444,457 14,069,316 29,616,436 117,608,133 46,419,817
Operating expensesPersonnel services 6,540,952 2,519,126 11,184,209 60,891,788 7,222,634 88,358,709 5,283,139Administrative indirect 1,563,307 717,765 1,225,155 4,723,037 1,846,166 10,075,430 1,225,131Contractual services 1,785,392 6,046,846 5,480,654 3,165,138 3,542,244 20,020,274 1,624,945Repairs and maintenance 1,225,342 1,290,672 2,204,693 1,054,955 1,296,171 7,071,833 2,096,463Materials and supplies 2,178,348 563,071 5,997,221 9,634,265 4,069,432 22,442,337 6,256,665Utilities 2,600,926 63,539 64,008 462,399 964,354 4,155,226 87,144Water purchases 4,005,039 - - - - 4,005,039 -Casualty property and liability costs 289,117 177,259 134,352 3,990,838 732,465 5,324,031 153,775Claims expense net of claims reserve adjustment - - - - - - 22,965,417Insurance and bonds - - - - - - 5,749,122Miscellaneous fees and costs 113,857 - 70 158,384 - 272,311 2,027,784Depreciation and amortization 1,316,634 6,988,763 7,986 17,479,077 2,068,768 27,861,228 3,462,807Other 1,507,360 1,588,125 798,909 211,509 1,675,323 5,781,226 440,666
Total operating expenses 23,126,274 19,955,166 27,097,257 101,771,390 23,417,557 195,367,644 51,373,058
Operating income (loss) 3,725,138 (328,654) 347,200 (87,702,074) 6,198,879 (77,759,511) (4,953,241)
Nonoperating revenues (expenses)Operating grants - - - 627,179 - 627,179 -Shared sales tax proceeds - - - 57,882,876 - 57,882,876 -Investment income 2,140,281 1,734,379 954,363 1,016,451 1,278,039 7,123,513 3,083,341Interest expense (1,994) (207,422) - - (49,638) (259,054) -Gain (loss) on disposal of capital assets - - (315,060) 59,881 - (255,179) 318,917Other nonoperating revenues 553,719 528,915 224,393 2,255,993 2,681,782 6,244,802 110,679
Total nonoperating revenues (expenses) net 2,692,006 2,055,872 863,696 61,842,380 3,910,183 71,364,137 3,512,937
Income (loss) before capital contributions,transfers and special items 6,417,144 1,727,218 1,210,896 (25,859,694) 10,109,062 (6,395,374) (1,440,304)
Capital contributions - - - 23,646,413 - 23,646,413 -Transfers in (note 11) 55,873,794 1,303,378 5,774 585,959 1,338,376 59,107,281 2,452,526Transfers out (note 11) (2,437,468) (882,069) (464,169) (462,563) (17,511,474) (21,757,743) (2,597,244)Special item (note 19) (21,327,312) - - - - (21,327,312) -
Change in net position 38,526,158 2,148,527 752,501 (2,089,885) (6,064,036) 33,273,265 (1,585,022)
Net position at beginning of year, as restated (note 18) 64,327,794 210,555,211 2,838,394 203,460,427 83,991,099 565,172,925 41,315,059
Net position at end of year $ 102,853,952 212,703,738 3,590,895 201,370,542 77,927,063 598,446,190 39,730,037
Change in net position $ 33,273,265Net adjustment to reflect the consolidation of internal service fund activities related to enterprise funds 1,219,165Change in net position of business-type activities $ 34,492,430
See accompanying notes to basic financial statements.
10

Business-type activities - Enterprise Funds
Water Wastewater
Resource Recovery
and Recycling
Big Blue
Bus
Nonmajor
enterprise
funds
Total
enterprise
funds
Total internal
service funds
Cash flows from operating activities: Cash received from customers 26,903,902$ 19,714,797 28,756,320 14,317,417 29,619,316 119,311,752 46,479,398 Cash payments for materials and services (6,892,366) (8,398,139) (15,826,821) (22,480,290) (14,496,056) (68,093,672) (19,218,856) Cash payments to employees for services (6,430,029) (2,492,420) (11,424,992) (58,287,392) (5,926,546) (84,561,379) (5,223,344) Cash paid for claims and related services — — — — — - (9,730,971) Other revenue received 553,719 528,915 224,393 2,255,993 2,681,782 6,244,802 110,679
Net cash provided by (used in) operating activities 14,135,226 9,353,153 1,728,900 (64,194,272) 11,878,496 (27,098,497) 12,416,906
Cash flows from noncapital financing activities: Sales tax proceeds — — — 59,740,737 — 59,740,737 — Repayment of advances to/(from) other funds — — — — (2,003,473) (2,003,473) — Repayment of promissory note — — — — 15,000,000 15,000,000 — Transfers in 48,533,794 1,303,378 5,774 585,959 1,338,376 51,767,281 2,452,526 Transfers out (2,437,468) (882,069) (464,169) (462,563) (17,511,474) (21,757,743) (2,597,244)
Net cash provided by noncapitalfinancing activities 46,096,326 421,309 (458,395) 59,864,133 (3,176,571) 102,746,802 (144,718)
Cash flows from capital and related financing activities: Capital contributions received — — — 30,938,117 — 30,938,117 — Acquisition and construction of capital assets (3,175,954) (11,734,409) — (15,560,311) (337,140) (30,807,814) (11,494,463) Proceeds from sale of capital assets — — 315,060 61,073 — 376,133 830,713 Reduction in long-term obligations — — — — (307,144) (307,144) — Interest paid on long-term obligations (1,994) (1,895,351) — — (52,300) (1,949,645) —
Net cash provided by (used in) capital and related financing activities (3,177,948) (13,629,760) 315,060 15,438,879 (696,584) (1,750,353) (10,663,750)
Cash flows from investing activities Investments income 2,006,369 1,712,934 941,941 1,011,239 1,022,185 6,694,668 3,042,228
Net cash provided by investing activities 2,006,369 1,712,934 941,941 1,011,239 1,022,185 6,694,668 3,042,228
Net increase (decrease) in cash andcash equivalents 59,059,973 (2,142,364) 2,527,506 12,119,979 9,027,526 80,592,620 4,650,666
Cash and cash equivalents at beginning of year 46,098,680 50,898,837 25,298,603 28,597,299 27,475,606 178,369,025 91,736,633
Cash and cash equivalents at end of year 105,158,653$ 48,756,473 27,826,109 40,717,278 36,503,132 258,961,645 96,387,299
Cash and investments 103,374,387$ 41,950,680 10,815,837 26,790,583 29,866,521 212,798,008 96,387,299 Restricted cash and investments 1,784,266 6,805,793 17,010,272 13,926,695 6,636,611 46,163,637 —
Total cash and cash equivalents 105,158,653$ 48,756,473 27,826,109 40,717,278 36,503,132 258,961,645 96,387,299
(Continued)
See accompanying notes to basic financial statements
CITY OF SANTA MONICA, CALIFORNIA
Statement of Cash Flows
Proprietary Funds
For the fiscal year ended June 30, 2019
11

Business-type activities - Enterprise Funds
Water Wastewater
Resource Recovery
and Recycling
Big Blue
Bus
Nonmajor
enterprise
funds
Total
enterprise
funds
Total internal
service funds
Reconciliation of operating income (loss) to net cash provided by (used in) operating activities: Operating income (loss) 3,725,138$ (328,654) 32,140 (87,702,074) 6,198,879 (78,074,571) (4,953,241)
Adjustments to reconcile operating income (loss) to net cash provided by (used in) operating activities:
Add depreciation 1,316,634 6,988,763 7,986 17,479,077 2,068,768 27,861,228 3,462,807 Other revenue received 553,719 528,915 224,393 2,255,993 2,681,782 6,244,802 110,679 Change in assets and liabilities and deferred outflows
and inflows of resources:(Increase) decrease in accounts receivable 13,110 88,285 (152,713) 143,647 48,766 141,095 3,847,064 Decrease in due from other governments — — — 1,249,075 — 1,249,075 — (Increase) decrease in prepaids (39,449) (7,726) (2) (4,400) 14,153 (37,424) (238) (Increase) in inventory — — — (167,858) — (167,858) (23,957) Increase (decrease) in accounts payable (348,835) 2,066,151 393,303 (179,933) (374,050) 1,556,636 467,034 Increase (decrease) in accrued liabilities 10,405 (12,897) 789 (29,727) 267 (31,163) 32,548 Increase (decrease) in contracts payable 61,118 (9,287) — 70,143 (10,004) 111,970 — Increase (decrease) in unearned revenue — — — 16,843 (9,591) 7,252 — Increase (decrease) in deposits payable from restricted assets 39,380 — 1,464,576 — (36,295) 1,467,661 — Increase (decrease) in compensated absences payable (19,167) (29,802) 4,954 111,229 12,342 79,556 (9,665) Increase in claims payable — — — — — — 9,446,963 Increase in pollution remediation obligation 8,703,488 — — — — 8,703,488 —
Net OPEB liability and related changes in deferred
outflows and inflows of resources (115,720) (22,917) (85,677) (415,104) 71,565 (567,853) (66,650) Net pension liability and related changes in deferredoutflows and inflows of resources 235,405 92,322 (160,849) 2,978,817 1,211,914 4,357,609 103,562
Total adjustments 10,410,088 9,681,807 1,696,760 23,507,802 5,679,617 50,976,074 17,370,147
Net cash provided by (used in)
operating activities 14,135,226$ 9,353,153 1,728,900 (64,194,272) 11,878,496 (27,098,497) 12,416,906
Schedule of non-cash capital and related financing activities:
Capital assets acquired through accounts payable 640,802$ 1,379,770 — 1,299,295 — 3,319,867 89,045
Gain/(Loss) on disposal of capital assets — — — 59,881 — 59,881 830,712
See accompanying notes to basic financial statements
Proprietary Funds
For the fiscal year ended June 30, 2019
CITY OF SANTA MONICA, CALIFORNIA
Statement of Cash Flows
12

Fiduciary Fund Financial Statements
Private-Purpose Trust Fund is fiduciary in nature and used to receive and distribute the Redevelopment Property Tax Trust Fund distributions and use them to extinguish enforceable obligations approved by the Successor Agency Oversight Board and the California Department of Finance. The Redevelopment Agency of the City of Santa Monica was dissolved on February 1, 2012.
Agency Funds are custodial in nature and used to receive and disburse funds for an entity/individual, which are not part of the City. The General Trust Fund and Street Light Fund account for assets held by the City in an agency capacity, such as fees collected on behalf of and remitted to other government agencies and payroll deductions remitted to various other agencies.
13

CITY OF SANTA MONICA, CALIFORNIAStatement of Fiduciary Net Position
Fiduciary FundsJune 30, 2019
Total Private-Purpose
Trust Fund
Total Agency Funds
ASSETS
Restricted cash (note 5) $ 20,156,779 4,533,225Restricted cash and investments with fiscal agent (note 5) 6,985,359 -Accounts receivable 4 74,473
Total assets 27,142,142 4,607,698
DEFERRED OUTFLOWS OF RESOURCESDeferred loss on refunding 1,652,766
- -
LIABILITIESAccounts payable and accrued liabilities - 4,607,698Long term liabilities:
14,127,746 -142,210,678 -
Loans and bonds payable, due within one year (note 17) Loans and bonds payable, due in more than one year (note 17) Accrued interest payable, due in more than one year 27,511,809 -
Total liabilities 183,850,233 4,607,698
NET POSITIONRestricted for the dissolution of the Former Redevelopment Agency $ (155,055,325)
See accompanying notes to basic financial statements.
14

CITY OF SANTA MONICA, CALIFORNIAStatement of Changes inFiduciary Net Position
Fiduciary FundFor the fiscal year ended June 30, 2019
Private-PurposeTrust Fund
Additions:Property tax distribution $ 30,191,330Investment income 45,179
Total additions 30,236,509
Deductions:Project expenses 253,201Interest expense 8,264,139
Total deductions 8,517,340
Change in net position 21,719,169
Net position at beginning of year (176,774,494)
Net position at end of year $ (155,055,325)
See accompanying notes to basic financial statements.
15

(1) SUMMARY OF SIGNIFICANT ACCOUNTING POLICIES
A. THE REPORTING ENTITY
The City of Santa Monica, California (City) was incorporated November 30, 1886. The City operatesunder a Council-Manager form of government and provides traditional municipal services as authorizedby its charter as well as various enterprise services. As required by accounting principles generallyaccepted in the United States of America (GAAP), the accompanying basic financial statements presentthe activities of the City and its component units. The component units discussed below are included inthe City’s reporting entity because of the significance of their operations or financial relationships withthe City.
As required by GAAP, these basic financial statements present the City and its component units, entitiesfor which the City is considered to be financially accountable. The following entities are reported as blended component units because they have substantively the same governing board as the primary government andthere is either a financial benefit or burden relationship between the City and the component unit or theCity’s management has operational responsibility for the component unit.
Blended component units, although legally separate entities are, in substance, part of the City’soperations and data from these units are combined with data of the City. Additional detailed informationand/or separately issued financial statements for these component units can be obtained from the City’sDirector of Finance.
The Parking Authority of the City of Santa Monica (Parking Authority) was established by the City in1950 for the acquisition or building of parking facilities owned by the City Parking Authority.
The Housing Authority of the City of Santa Monica (Housing Authority) was established by the City in1975 to address unsanitary and unsafe inhabited dwelling accommodations and the shortage ofaffordable safe and sanitary dwelling accommodations for persons with low incomes. Since January 1,1989, the Housing Authority has administered the Section 8 Housing Assistance Payments Programfunded by the United States Department of Housing and Urban Development on behalf of the City.
The Santa Monica Public Financing Authority (PFA) was established in 1995 for the purpose of assistingthe City in financing capital improvements, working capital, and liability or other projects.
The Successor Agency for the Redevelopment Agency of the City of Santa Monica (Successor Agency)was established on February 1, 2012 by resolution of City Council. The Successor Agency is primarilyresponsible for winding down the operations of the former Redevelopment Agency and makes paymentsand performs existing obligations of the former Redevelopment Agency. The Successor Agency is afiduciary component unit and is presented as a private-purpose trust fund.
The Santa Monica Arts Foundation promotes the arts by raising funds to finance art programs. On June8, 1990, the City Council merged the City’s Arts Commission with the Santa Monica Arts Foundation.While the Arts Foundation meets the requirements of being reported as a component unit of the City, the
16

operating results are immaterial to the City as a whole and therefore it is not included in the City’s basic financial statements. The Santa Monica Pier Corporation, originally named the Santa Monica Pier Restoration Corporation, is an organization created in 1984 as a nonprofit public benefit corporation. The Pier Corporation maintains and operates public educational and recreational programs and events at the Santa Monica Pier as part of a service agreement with the City. It also assists the City with public outreach on Santa Monica Pier related issues. The governing Board of the Corporation is appointed by the City of Santa Monica City Council for the benefit of the citizens of Santa Monica. The Pier Corporation is not presented in the basic financial statements because the economic resources received or held by the individual organization are not significant to the primary government. Separate financial statements for this organization can be obtained from the City’s Director of Finance.
B. BASIC FINANCIAL STATEMENTS
Basic financial statements consist of the following:
• Government-wide financial statements; • Fund financial statements; and • Notes to the basic financial statements.
The government-wide financial statements consist of the statement of net position and the statement of activities and report information on all of the non-fiduciary activities of the primary government and its component units. As a general rule, the effect of interfund activity has been eliminated from the government-wide financial statements. All internal balances in the statement of net position have been eliminated, with the exception of those representing balances between the governmental activities and the business-type activities, which are presented as internal balances and eliminated in the total government column. In the statement of activities, internal service fund transactions have been eliminated; however, those transactions between governmental and business-type activities have not been eliminated. Exceptions to this general rule are charges between the City’s Water Fund and various other functions of the government. Elimination of these charges would distort the direct costs and program revenues reported for the various functions concerned.
Both of the government-wide financial statements distinguish functions of the City that are principally supported by taxes and intergovernmental revenues (governmental activities) from other functions that are intended to recover all or a significant portion of their costs through user fees and charges (business- type activities). The governmental activities of the City include general government, public safety, general services, cultural and recreation services, library and housing and community development. The business-type activities of the City include water, wastewater, stormwater, resource recovery and recycling, pier, airport, cemetery, community broadband, Big Blue Bus, and parking authority. The statement of activities demonstrates the degree to which the direct and indirect expenses of a given function are offset by program revenues. Direct expenses are those that are clearly identifiable with a specific function or segment. Indirect expenses are allocated based on the annual cost allocation plan.
17

Program revenues include: 1) charges to customers or applicants who purchase, use, or directly benefit from goods, services, or privileges provided by a given function or segment, and 2) grants and contributions, including special assessments, which are restricted to meeting the operational or capital requirements of a particular function. Taxes and other items not properly included among program revenues are reported instead as general revenues.
Separate fund financial statements are provided for governmental funds, proprietary funds and fiduciary funds, even though the latter are excluded from the government-wide financial statements. Major individual governmental funds and major individual enterprise funds are reported as separate columns in the fund financial statements.
For the year ended June 30, 2019, the City implemented the provisions of Governmental Accounting Standards Board (GASB) Statement No. 88, Certain Disclosures Related to Debt, including Direct Borrowings and Direct Placements. GASB Statement No. 88 improves the information that is disclosed in notes to government financial statements related to debt, including direct borrowing and direct placements. It also clarifies which liabilities governments should include when disclosing information related to debt. Reference Note 9 for information on the City’s long- term liabilities.
C. MEASUREMENT FOCUS, BASIS OF ACCOUNTING AND FINANCIAL STATEMENTPRESENTATION
The government-wide financial statements are reported using the economic resources measurement focus and the accrual basis of accounting, as are the proprietary and fiduciary funds financial statements. Agency funds do not have a measurement focus but use the accrual basis of accounting. Revenues are recorded when earned and expenses are recorded when a liability is incurred, regardless of the timing of related cash flows.
Governmental funds financial statements are reported using the current financial resources measurement focus and the modified accrual basis of accounting. Revenues are recognized as soon as they are both measurable and available. Revenues are considered to be available when they are collectible within the current period or soon enough thereafter to pay liabilities of the current period. The City in general considers revenues available if they are collected within 60 days. Additionally, grants and similar items are recognized as receivables as soon as all eligibility requirements have been met and are recognized as revenue when amounts are considered available. Expenditures are recorded when the related fund liability is incurred, except for unmatured interest on general long-term debt, which is recognized when due, and certain compensated absences and claims and judgments, which are recognized when payment is due.
In governmental funds, property taxes, sales taxes, franchise taxes, licenses, interest, special assessments, charges for services and other miscellaneous revenue are all considered to be susceptible to accrual and have been recognized as revenue in the current fiscal period subject to availability. Entitlements and shared revenues are recorded at the time of receipt or earlier if susceptible to accrual criteria. Expenditure-driven grants are recognized as revenue when the qualifying expenditures have been incurred, all other eligibility requirements have been met and are recorded at the time of receipt or earlier, and susceptible to accrual criteria. All other revenue items are considered to be measurable and available only when cash is received by the government.
18

The accounts of the City are organized on the basis of funds. A fund is an independent fiscal and accounting entity with a self-balancing set of accounts. Fund accounting segregates funds according to their intended purpose and is used to aid management in demonstrating compliance with finance-related legal and contractual provisions. The minimum number of funds is maintained consistent with legal and managerial requirements.
The City reports the following major governmental funds:
The General Fund is the City’s primary operating fund. It accounts for all the financial resources and the legally authorized activities of the City, except those required to be accounted for in other specialized funds.
The Special Revenue Source Fund accounts for receipt and expenditure of monies restricted, committed or assigned for specific uses. Funding comes primarily from developer and other fees.
The Low and Moderate Income Housing Asset Fund under Senate Bill 341, requires that housing assets transferred to the City’s Housing Successor Agency, together with any funds generated from housing assets, be maintained in a separate Low and Moderate Income Housing Asset Fund. These funds can be used as previously allowed under the Low and Moderate Income Housing Fund established under Community Redevelopment Law, for program monitoring and preserving the long-term affordability of units subject to affordability restrictions, homeless prevention and rapid rehousing services, and the development of affordable housing for lower income households.
The City reports the following major enterprise funds:
The Water Fund accounts for the activities of the City’s water service to the citizens.
The Wastewater Fund accounts for the activities of maintaining the sanitary sewer system within the City.
The Resource Recovery and Recycling Fund accounts for the activities of the City’s refuse collection, street sweeping and cleaning, and recycling programs.
The Big Blue Bus Fund accounts for the activities of the City’s municipal bus lines.
Additionally, the City reports the following fund types:
Special Revenue Funds account for proceeds of specific revenue sources that are restricted or committed to expenditure for specified purposes other than debt service or capital projects.
Capital Projects Funds account for and report financial resources that are restricted, committed, or assigned to expenditure for capital outlays, including the acquisition or construction of capital facilities and other capital assets.
19

Debt Service Funds account for and report financial resources that are restricted to expenditures for principal and interest. Permanent Funds account for resources that are legally restricted to the extent that only earnings, not principal, may be used for purposes that support specific programs. Internal Service Funds account for vehicle operations, risk management, and information technology and communications operations that provide services to other departments of the City on a cost reimbursement basis. Fiduciary Funds consist of a Private-purpose Trust Fund and Agency funds. The Private-purpose Trust Fund is established by the City to succeed the former redevelopment agency. The City serves as a custodian for the assets of the dissolved redevelopment agency pending distribution to the Successor Agency’s creditors for enforceable obligations. Agency Funds account for assets held by the City as a trustee or as an agent for individuals or other government units. Agency funds are custodial in nature and do not involve measurement of results of operations. These funds account for assets held by the City in an agency capacity for development fees collected on behalf of the school district, various employee payroll deductions that will be remitted to various agencies and other assets held by the City in an agency capacity. Proprietary Funds distinguish operating revenues and expenses from nonoperating items. Operating revenues and expenses generally result from providing services and producing and delivering goods in connection with a proprietary fund's principal ongoing operations. The principal operating revenues of the proprietary funds are charges to customers for sales and services. Operating expenses for proprietary funds include the cost of sales and services, administrative expenses, and depreciation and amortization on capital assets. All revenues and expenses not meeting this definition are reported as nonoperating revenues and expenses.
D. ASSETS, LIABILITIES, DEFERRED OUTFLOWS/INFLOWS OF RESOURCES, NET POSITION OR FUND BALANCE
Cash and Investments
In order to maximize the flexibility of its investment program and to aid in cash budgeting, the City pools the cash of all funds, except for monies deposited with fiscal and escrow agents in accordance with related bond indentures and agreements. The cash and investments balance in each fund represents that fund's equity share of the City's cash and investment pool. As the City places no restrictions on the deposit or withdrawal of its equity from the pool by a particular fund, the pool operates like a demand deposit account for the participating funds.
Interest income earned on pooled cash and investments is allocated quarterly to the various funds based on the average month-end balances for the prior three months and is adjusted at year-end. Interest income on restricted cash and investments with fiscal agents is credited directly to the related fund.
20

The City's investments are carried at fair value, except for guaranteed investment contracts, which are carried at cost because they are not transferable and they have terms that are not affected by changes in market interest rates. The fair value of equity and debt securities is determined based on sales prices or bid-and-asked quotations from Securities and Exchange Commission (SEC) registered securities exchanges or National Association of Securities Dealers Automated Quotations (NASDAQ) dealers. Changes in fair value are allocated to each participating fund on an annual basis. The City's share of Local Agency Investment Fund (LAIF) is reported to the City on a quarterly basis. LAIF operates in accordance with laws and regulations of the State of California. LAIF is not reported at fair value.
For purposes of the statement of cash flows, the City has defined cash and cash equivalents to be equity in the City's cash and investment pool as well as petty cash.
Receivables and Payables
Activity between funds that are representative of lending/borrowing arrangements outstanding at the end of the fiscal year are referred to as interfund receivables/interfund payables, i.e., due to/due from other funds, the current portion of interfund loans or advances to/from other funds, the non-current portion of interfund loans. Any residual balances outstanding between the governmental activities and the business-type activities are reported in the government-wide financial statements as internal balances.
Advances between funds and notes receivables, as reported in the fund financial statements, are offset by nonspendable fund balance in the applicable governmental funds to indicate that they are not in spendable form and are not available for appropriation. However, if the use of the proceeds from the collection of those receivables is restricted, committed, or assigned, they will be included in the appropriate fund balance classification, rather than nonspendable fund balance. All trade receivables are shown net of an allowance for uncollectible accounts and estimated refunds due. As of June 30, 2019, the allowance for uncollectible accounts for governmental and business-type activities is $666,071 and $564,221 respectively.
Unbilled service receivables are accrued at year-end.
Property Taxes
Assessed property values are determined on an annual basis for the period July 1 to June 30 by the Los Angeles County Assessor as of the prior January 1. Article XIIIA of the State Constitution (Proposition 13, approved by voters in June 1978) limits the real property tax rate to 1% of the full market cash value plus rates imposed to fund indebtedness approved by the voters. Locally assessed property is appraised at the 1975-76 full cash value, the base year value, and is adjusted each year after 1975 by the change in the consumer price index, not to exceed an increase of 2%. Property is reappraised to current full value upon
21

either a change in ownership or new construction. If property values decline, the assessed value may be adjusted to reflect the lower value. Taxes are levied annually in September and become a lien on real property at January 1. Taxes are due November 1 and February 1 and are delinquent if not paid by December 10 and April 10, respectively, at which time applicable penalties and interest are assessed.
Inventory and Prepaid Items
All materials and supplies inventory is valued at cost using the average cost method. The costs of such inventories are recorded as expenditures/expenses when consumed rather than when purchased. Certain payments to vendors reflect costs applicable to future accounting periods and are recorded as prepaid items in both government-wide and fund financial statements. The cost of prepaid items are recorded as expenditures/expenses when consumed rather than when purchased.
Restricted Assets
Certain proceeds of the City's bonds, as well as certain resources set aside for their repayment, are classified as restricted assets on the statement of net position and balance sheet because they are maintained in separate bank accounts and their use is limited by applicable bond covenants. In the absence of specific statutory provisions governing the issuance of bonds, certificates or leases, these bond monies may be invested in accordance with the ordinance, resolutions or indentures specifying the types of investments its trustees or fiscal agents may make. These ordinances, resolutions and indentures are generally more restrictive than the City's general investment policy. In no instance have additional types of investments been authorized that are not permitted by the City's general investment policy. Restricted cash represents amounts restricted under agreements with grantors, trustees, developers, customers and lessees. Additionally, restricted cash in the Successor Agency is restricted by redevelopment dissolution legislation. Capital Assets
Capital assets, which include land, buildings and improvements, machinery and equipment, intangibles, utility systems and infrastructure assets (e.g., roads, sidewalks, curbs and gutters and similar items), are reported in the applicable governmental or business-type activities columns in the government-wide financial statements. Capital assets other than buildings, improvements, and infrastructure are defined by the City as assets with an initial individual cost of $50,000 or more and an estimated useful life of more than one year except for the Big Blue Bus Fund, which follows transit funding guidelines by capitalizing any capital expense which is funded by capital grant subsidies not related to bus repairs and maintenance. The City defines buildings, improvements other than buildings, and infrastructure as assets with an individual cost of $100,000 or more and an estimated useful life of more than one year. Such assets are recorded at historical cost. Donated capital assets are recorded at acquisition value at the date of donation and capital assets received in a service concession arrangement are reported at acquisition value. The cost
22

of normal maintenance and repairs that do not add to the value of the asset or materially extend assets lives are expensed when incurred. Major outlays for capital assets and improvements are capitalized as projects are constructed. Interest incurred, net of interest earned on unspent proceeds of tax-exempt borrowings, during the construction phase of capital assets of business-type and enterprise funds activities is included as part of the capitalized value of the assets constructed. Capital assets of the City are depreciated using a straight-line method, with a mid-year convention (only half a year’s depreciation is recorded in the first and last year of the asset) over the following estimated useful lives:
Assets Years Buildings 5 to 85 Improvements other than buildings 5 to 50 Infrastructure 15 to 75 Utility systems 20 to 100 Intangibles 20 to 100 Machinery and equipment 2 to 30
The City has elected not to capitalize its collection of artwork. GASB Statement No. 34 waives the requirement for artwork capitalization if the collection meets all the following conditions:
• The collection is held for reasons other than financial gain. • The collection is protected, kept unencumbered, cared for, and preserved. • The collection is subject to an organizational policy requiring that the proceeds from sales of
collection items be used to acquire other items for collections.
The City’s artwork collection meets the above criteria and therefore qualifies for the exemption from the capitalization requirement. The collection includes both permanent and portable artworks, artworks integrated into overall projects, murals, and stand-alone permanently installed paintings and sculptures, art integrated into the design of public works projects (not stand-alone), and a contemporary collection of almost 100 portable artworks, which are on display in public areas of City facilities. Lease Obligations
The City leases various assets under operating lease agreements.
Compensated Absences
It is the City's policy to permit employees to accumulate earned but unused vacation and sick leave benefits up to a maximum determined by bargaining unit agreements. Employees are paid 100% of their accumulated vacation when they terminate employment for any reason. All vacation is accrued when
23

incurred in the government-wide and proprietary fund financial statements. A liability is reported in the governmental funds only if they have matured, for example, as a result of employee resignations or retirements. Additionally, employees of the International Association of Sheet Metal, Air, Rail and Transportation Workers – Transportation Division are able to exchange unused sick days balances for equal dollars of medical insurance premiums. In order to qualify, the employee must have 10 years of service at retirement and at least 50 days of unused sick leave.
Long-Term Liabilities
In the government-wide financial statements, proprietary funds financial statements and private-purpose trust fund statements, long-term debt and other long-term obligations are reported as liabilities in the applicable governmental activities, business-type activities, or proprietary fund type statement of net position. Initial-issue bond premiums and discounts are deferred and amortized over the life of the bonds using the straight-line method. Offering costs are expensed when incurred. Bonds payable are reported net of the unamortized portion of applicable premium or discount. Deferred amounts on refunding are reported as deferred outflows or inflows of resources. Bond issuance costs, including underwriters' discount, are expensed when incurred. Amortization of bond premiums or discounts and deferred amounts on refunding are included in interest expense. In the governmental funds financial statements, bond premiums, discounts and issuance costs are recognized during the period issued. The face amount of debt issued is reported as other financing sources. Premiums received are reported as other financing sources, while discounts are reported as other financing uses. Issuance costs, whether or not withheld from the actual debt proceeds received, are reported as debt service expenditures. Interest and principal payments are reported as debt service expenditures. Deferred Outflows/Inflows of Resources In addition to assets, the statement of net position, governmental fund balance sheet, proprietary statement of net position, and statement of fiduciary net position will sometimes report a separate section for deferred outflows of resources. The deferred outflows of resources is a separate financial statement element that represents a consumption of net position or fund balance that applies to a future period(s) and so will not be recognized as an outflow of resources (expense/expenditure) until then. In addition to liabilities, the statement of net position and governmental fund balance sheet will sometimes report a separate section for deferred inflows of resources. The deferred inflows of resources is a separate financial statement element that represents an acquisition of net position or fund balance that applies to future period(s) and so will not be recognized as an inflow of resources (revenue) until that time. The City reports the following items as deferred outflows of resources:
• Deferred outflows from pensions • Deferred outflows from OPEB • Deferred loss on refundings
24

The City reports the following items as deferred inflows of resources: • Deferred inflows from pensions • Deferred inflows from OPEB • Deferred gain on refunding
Deferred outflows from pensions and OPEB include contributions made subsequent to the measurement date. Deferred outflows and inflows relating to pensions and OPEB are the result of differences between the expected and actual experience, changes in assumptions, and difference between projected and actual earnings on investments. See note 16 for a detailed discussion of deferred outflows and inflows related to pensions and OPEB. The deferred gain and loss on refunding is attributable to the unamortized portion of the gain or loss on refunding of debt. Finally, on the governmental funds balance sheet, when an asset is recorded but the revenue is not available, a deferred inflow of resources is reported for unavailable revenue until such time as the revenue becomes available.
Net Position and Fund Balance
In the government-wide financial statements and proprietary funds financial statements, net position is reported in three categories: net investment in capital assets, restricted net position and unrestricted net position. Net investment in capital assets represents capital assets less accumulated depreciation less outstanding principal of related debt. Net investment in capital assets does not include the unspent proceeds of capital debt or the related amount of debt, liabilities and deferred inflows related to those assets. Restricted net position represents assets restricted by parties outside of the City (such as creditors, grantors, contributors, laws and regulations of other governments, or law through constitutional provisions or enabling legislation) and includes unspent proceeds of bonds issued to acquire or construct capital assets and those unspent proceeds are offset by an equivalent amount of debt and deferred inflows to those assets. The nonexpendable portion of permanent funds is reported as a component of restricted net position. The City's other components of restricted net position are temporarily restricted (ultimately expendable) assets. All other components of net position are considered unrestricted. When both restricted and unrestricted resources are available for use, it is the City’s policy to use restricted resources first, and then use unrestricted resources as needed. As prescribed by GASB Statement No. 54, governmental funds report fund balance in classifications based primarily on the extent to which the City is bound to honor constraints on the specific purposes for which amounts in the funds can be spent based on the adopted City Council policy in the City’s most recently adopted budget. As of June 30, 2019, fund balances for governmental funds include nonspendable, restricted, committed, assigned and unassigned balances. In the fund financial statements, governmental funds report nonspendable fund balance for amounts that
25

cannot be spent because they are either not in spendable form or legally or contractually required to be maintained intact. Restricted fund balance represents amounts that are restricted for specific purposes when constraints placed on the use of resources are either externally imposed by creditors, grantors, contributors, or laws or regulations of other governments; or imposed by law through constitutional provisions or enabling legislation. Amounts that can only be used for specific purpose pursuant to constraints imposed by the government’s highest level of decision making authority, the City Council, are reported as committed fund balance. The City Council can create committed fund balance through ordinance, resolution or other council action that is equally binding. Ordinances make up the local laws of the City. An ordinance is a legislative act prescribing general rules of organization or conduct relating to the corporate affairs of the municipality. Council action shall be taken by ordinance when required by law, or where prescribed conduct may be enforced by penalty and represents the most binding constraint. Once adopted, ordinances become effective upon 30 days after publication, unless otherwise set forth. A resolution is an administrative act, which is a formal statement of policy concerning matters of special or temporary character. The adoption of a resolution by the City Council can also establish, modify, or rescind a fund balance commitment previously created by resolution. Assigned fund balance are amounts that are constrained by the government’s intent by the governing body itself or a body or official to which the governing body has delegated the authority to assign amounts to be used for specific purposes. The City Council, in the City’s most recently adopted budget, which included the fiscal policies contained in the fund balance policies, has delegated the authority to assign fund balances to the City Manager or their designee. Unassigned fund balance represents fund balance that has not been restricted, committed, or assigned to specific purposes within the general fund. Unassigned fund balance can also be used in other governmental funds where the fund balance is negative, because a negative amount should not be reported for restricted, committed or assigned in any fund. In circumstances when an expenditure is made for a purpose for which amounts are available in multiple fund balance classifications, fund balance is expended in the order of restricted, committed, assigned, and unassigned. Self-Insurance Program
The City has self-insurance programs to provide for general liability, bus and automobile liability, and workers' compensation claims. These activities are accounted for in self-insurance internal service funds. Premiums are charged to individual funds and are designed to cover current and future expenses. The City's Risk Manager oversees the self-insurance programs. It is his or her duty to ensure that programs are operated in accordance with City policies. The City’s Risk Manager also provides budget guidance and case reserves and claims analysis. It is the City's intent to maintain cash reserves in the self- insurance funds equal to or greater than estimated losses. Pensions For purposes of measuring the net pension liability and deferred outflows/inflows of resources related to pensions, and pension expense, information about the fiduciary net position of the City’s defined benefit retirement plans, Miscellaneous and Public Safety Police and Fire, of the California Employees’ Retirement System (“CalPERS”) and additions to/deductions from the Plans’ fiduciary net position have
26

been determined on the same basis as they are reported by CalPERS. For this purpose, benefit payments (including refunds of employee contributions) are recognized when due and payable in accordance with the benefit terms. Investments are reported at fair value. Other Postemployment Benefits (OPEB) For the purposes of measuring the net OPEB liability, the deferred inflows of resources related to OPEB, and the OPEB expense, information about the fiduciary net position of the City’s OPEB Plan and additions to/deductions from the OPEB Plan’s fiduciary net position have been determined using the same actuarial methods and assumptions. For this purpose, benefit payments are recognized when currently due and payable in accordance with the benefit terms. Investments are reported at fair value. Generally accepted accounting principles require that the reported results must pertain to liability and asset information within certain defined timeframes. For this report, the following timeframes are used: Valuation Date June 30, 2017 Measurement Date June 30, 2018 Measurement Period June 30, 2017 to June 30, 2018 Use of Estimates
The preparation of basic financial statements in conformance with GAAP requires management to make estimates and assumptions that affect the amounts reported in the basic financial statements and accompanying notes. Actual results may differ from those estimates.
27

(2) COMPENSATED ABSENCES City employees earn vacation leave at varying amounts based on length of service. All employees may accrue up to the amount earned for a three-year period. In the event of termination of employee, death, or retirement, employees (or their estates) are paid for unused vacation.
Balance atJuly 1, 2018 Additions Reductions
Balance atJune 30, 2019
Due withinone year
Due beyond one year
Governmental Activities 13,322,300$ 8,946,320 8,658,005 13,610,615 8,832,969 4,777,646 Business-type activities 3,548,068 2,862,655 2,804,512 3,606,211 2,865,892 740,319
Total 16,870,368 $ 11,808,975 11,462,517 17,216,826 11,698,861 5,517,965
(1) Compensated absences are predominately liquidated by General Fund resources.
28

(3) RECONCILIATION OF FUND BALANCE SHEET/STATEMENT OF NET POSITION TOGOVERNMENT-WIDE FINANCIAL STATEMENTS
Amounts reported for governmental activities in the government-wide statement of net position are different from those reported for governmental funds in the funds balance sheet. The following provides areconciliation of those differences:
Assets
Total governmental
fundsLong-term assets and liabilities (1)
Total governmental
activities internal service
funds (2)
O ther adjustments and eliminations
Statement of net position totals
Cash and investments 394,302,848$ — 69,924,568 — 464,227,416 Restricted cash and investments 11,970,291 — — — 11,970,291 Receivables (net, where applicable,
of allowances for uncollectibles):Accounts 15,534,077 — 114,522 — 15,648,599 Notes 169,515,958 — — — 169,515,958 Taxes 6,644,365 — — — 6,644,365 Interest 2,566,556 — 248,940 — 2,815,496 Other governments 3,082,358 — — — 3,082,358
Internal balances — — 4,444,962 5,748,972 10,193,934 Due from other funds 3,320,119 — — (3,320,119) — Deposits 61,785 — — — 61,785 Prepaids 1,731,715 — 10,117 — 1,741,832 Restricted cash and investments with fiscal agent 95,109,814 — — — 95,109,814 Advances to other funds 10,012,863 — — (10,012,863) — Notes Receivable Successor Agency 7,766,028 — — — 7,766,028 Capital assets, net — 825,221,846 238,532 — 825,460,378
Total assets 721,618,777 825,221,846 74,981,641 (7,584,010) 1,614,238,254
Deferred O utflows of ResourcesDeferred loss on refundings — 68,021 — — 68,021 Deferred outflows from pensions — 88,954,123 576,948 — 89,531,071 Deferred outflows from OPEB — 3,632,226 21,651 — 3,653,877
Total deferred outflow of resources — 92,654,370 598,599 — 93,252,969
Liabilities, Deferred Inflows of Resources and Fund Balances/Net PositionLiabilit ies:
Accounts payable 27,851,104 — 1,586,248 — 29,437,352 Accrued liabilit ies 6,935,631 — 96,600 — 7,032,231 Accrued interest payable — 2,917,693 — — 2,917,693 Contracts payable (retained percentage) 2,091,359 — — — 2,091,359 Due to other funds 3,320,119 — — (3,320,119) - Unearned revenue 26,301,690 — — — 26,301,690 Deposits payable from restricted assets 1,194,316 — — — 1,194,316 Advances from other funds 4,263,891 — — (4,263,891) - Compensated absences due within one year — 8,749,800 83,169 — 8,832,969 Compensated absences due in more than
one year — 4,722,441 55,205 — 4,777,646 Claims payable due within one year — — 16,691,082 — 16,691,082 Claims payable due in more than one year — — 46,718,005 — 46,718,005 Loans and bonds payable due within one year — 4,955,000 — — 4,955,000 Loans and bonds payable due in more than one year — 166,858,662 — — 166,858,662 Pollution remediation obligation due within one year — 322,540 — — 322,540 Pollution remediation obligation due in more than one year — 2,332,867 — — 2,332,867 Net OPEB liability — 23,101,563 137,706 — 23,239,269 Net pension liability — 367,974,565 2,232,917 — 370,207,482
Total liabilit ies 71,958,110 581,935,131 67,600,932 (7,584,010) 713,910,163
Deferred Inflows of ResourcesUnavailable revenue 8,102,333 — — (8,102,333) — Deferred gain on refunding — 54,376 — — 54,376 Deferred inflows from pensions — 20,535,247 177,469 — 20,712,716 Deferred inflows from OPEB — 1,088,574 6,489 — 1,095,063
Total deferred inflows of resources 8,102,333 21,678,197 183,958 (8,102,333) 21,862,155
Total fund balances/net position 641,558,334$ 314,262,888 7,795,350 8,102,333 971,718,905
29

1) Capital assets used in governmental activities are not current financial resourcesand, therefore, are not reported in the balance sheet. Capital assets of internalservice funds of $238,532 net of accumulated depreciation, are not included inthis amount. 1,314,002,266$ Less accumulated depreciation/amortization (488,780,420)
825,221,846$
Deferred outflows from pension 88,954,123 Deferred inflows from pension (20,535,247)
68,418,876$
Deferred outflows from OPEB 3,632,226 Deferred inflows from OPEB (1,088,574)
2,543,652$
General obligation bonds (4,340,000) Revenue bonds (152,100,000) Loans payable (200,000) Accrued interest on long-term debt (2,917,693) Unamortized premium on long-term debt (15,173,662) Employee compensated absences (13,472,241) Accrued pollution remediation costs (2,655,407) Accrued OPEB liability (23,101,563) Net pension liability (367,974,565)
Total long-term liabilities (581,935,131)$
2)
3,350,388$
4,444,962 7,795,350$
Long-term liabilities are not due and payable in the current period and, therefore,are not reported in the balance sheet.
Internal service funds are used by management to charge the costs ofinformation technology and communications operations, self-insurancecomprehensive, auto and workers' compensation to individual funds. The assetsand liabilities of these internal service funds are included in the governmentalactivities on the statement of net position.
Adjustments for Internal Service Funds are necessary to "close" those funds byrecording charges to and payments from business-type activities to completelycover the Internal Service Funds' costs for the year.
30

Amounts reported for business-type activities in the government-wide statement of net position are different from those reported for enterprise funds in the fund statement of net position. The following provides a reconciliation of those differences:
Total business- O therTotal type internal adjustments Statement of
enterprise service and net positionfunds funds (1) eliminations totals
Cash and investments $212,798,008 26,462,731 — 239,260,739 Receivables (net, where applicable, of allowances for uncollectibles):
Accounts 12,490,303 145,188 — 12,635,491 Interest 19,121,725 100,030 — 19,221,755 Taxes 3,474 — — 3,474 Notes receivable Successor Agency 7,612,125 — — 7,612,125 Settlement 7,340,000 — — 7,340,000
Due from other governments 6,971,500 — — 6,971,500 Internal balances — (4,444,962) (5,748,972) (10,193,934) Inventory 3,266,173 47,914 — 3,314,087 Prepaids 110,031 207 — 110,238 Restricted cash and investments 46,163,637 — — 46,163,637 Capital assets, net 440,213,266 20,765,732 — 460,978,998
Total assets 756,090,242 43,076,840 (5,748,972) 793,418,110
Deferred loss on refunding 190,666 — — 190,666 Deferred outflows from pensions 19,198,937 858,589 — 20,057,526 Deferred outflows from OPEB 634,816 41,571 — 676,387
Total deferred outflows of resources 20,024,419 900,160 — 20,924,579
Accounts payable 11,774,032 866,713 — 12,640,745 Accrued liabilit ies 3,016,827 65,448 — 3,082,275 Accrued interest payable 78,294 — — 78,294 Contracts payable (retained percentage) 629,400 — — 629,400 Internal balances 5,748,972 — (5,748,972) - Unearned revenue 3,935,403 — — 3,935,403 Liabilit ies payable from restricted assets 18,975,489 — — 18,975,489 Compensated absences due within one year 2,738,216 127,676 — 2,865,892 Compensated absences due in more than one year 717,492 22,827 — 740,319 Claims payable due within one year — 3,840,574 — 3,840,574 Claims payable due in more than one year — 3,255,173 — 3,255,173 Loans and bonds payable due within one year 2,525,130 — — 2,525,130 Loans and bonds payable due in more than one year 5,405,431 — — 5,405,431 Pollution remediation obligation due within one year 7,127,106 — — 7,127,106 Pollution remediation obligation due in more than one year 30,559,095 — — 30,559,095
Net OPEB liability 4,037,539 264,396 — 4,301,935
Net pension liability 74,304,160 3,322,932 — 77,627,092
Total liabilit ies 171,572,586 11,765,739 (5,748,972) 177,589,353
Deferred inflows from pensions 5,905,630 264,104 — 6,169,734 Deferred inflows from OPEB 190,255 12,459 — 202,714
Total deferred inflows of resources 6,095,885 276,563 — 6,372,448 $598,446,190 31,934,698 — 630,380,888
1)
36,379,660$
(4,444,962)$
Adjustment for Internal Service Funds are necessary to "close" those funds for charges to and payments from participating governmental-type activities to completely cover the Internal Service Funds' costs for the year.
Deferred Inflows of Resources
Assets
Liabilities
Deferred O utflows of Resources
Total Net Position
Internal service funds are used by management to charge the costs of vehicle management, information technology and risk management to individual funds. The assets and liabilit ies of the vehicle management and self-insurance bus internal service funds are included in business-type activities in the statement of net position.
31

(4) POLLUTION REMEDIATION
The City follows the guidance of GASB Statement No. 49, Accounting and Financial Reporting for Pollution Remediation Obligations, establishing accounting and financial reporting standards for pollution (including contamination) remediation obligations, which are obligations to address the current or potential detrimental effects of existing pollution by participating in pollution remediation activities such as site assessments and cleanups.
On December 1, 2006, the City amended a settlement agreement that it had entered into in 2003 with a consortium of oil companies in relation to methyl tertiary butyl ether (“MTBE”) contamination that had occurred at the City’s Charnock Well Field. The Charnock Well Field is used to supply drinking water to the City. The amended 2006 agreement called for the oil companies to pay the City $131.0 million in exchange for the City's agreement to treat to applicable drinking water standards any water produced from the Charnock Well Field, which contains MTBE, tertiary butyl alcohol (“TBA”) and related petroleum hydrocarbons. Prior to this amended 2006 agreement and under the terms of other settlement agreements with other companies, the City received an additional $122.1 million also related to MTBE contamination of the City's Charnock Well Field. Of this amount, $18.0 million was deposited into an escrow account specifically to be used for the design and building of a remediation plant. The account was to be replenished by the consortium of oil companies once exhausted until the remediation construction was complete. The City has received all the proceeds from each of these agreements, including the amended 2006 agreement. To meet its Charnock Well Field water treatment obligation, the City has constructed and is operating a water treatment remediation plant using the proceeds of the 2006 and the other earlier settlements. On November 13, 2009, the City entered into a settlement and release agreement with The Gillette Company (Gillette), guaranteed by The Procter & Gamble Company, in relation to groundwater contamination of the City’s Olympic Well Field. The Olympic Well Field is used to supply drinking water to the City. The agreement calls for Gillette to make payments to the City ranging from $150,000 to $11,183,175 annually, totaling $64.8 million over 30 years which included the City receiving title to property valued at $3.2 million. Under the agreement, the City has agreed to construct and operate facilities for treatment of certain contaminants and treat to applicable drinking water standards any water that it produces from the Olympic Well Field. At the end of FY 2016-17, the City had received cash payments of $42,895,400. During FY 2017-18, the City and Gillette agreed to modify their agreement whereby a lump sum payment of $10,415,000 was made by Gillette in exchange for a release from any and all future liabilities. On May 15, 2012, the City entered into a settlement and release agreement with The Boeing Company (Boeing) also in relation to groundwater contamination of the City’s Olympic Well Field. The agreement calls for Boeing to make payments to the City ranging from $150,000 to $5,000,000 annually over a ten-year period, totaling $39,500,000. On December 12, 2012, the agreement was modified with $21,000,000 being due from Boeing in January 2013 and payments of $3,670,000 being due from Boeing annually beginning in 2017 through 2021. The City received Boeing's payment of $21,000,000 on January 7, 2013. Under the agreement, the City has agreed to construct and operate facilities for treatment of certain contaminants and treat to applicable drinking water standards any water that it produces from the Olympic Well Field.
32

During the fiscal year, the City transferred the Olympic Well Field pollution remediation obligation of $32,337,312 and $11,010,000 settlement receivable from Boeing from the General Fund to the Water Fund and from the governmental activities to the business-type activities. This resulted in a special item in the Water Fund and a transfer from the governmental activities to the business-type activities of $21,327,312. Using the expected cash flow technique utilizing present value, the City has measured the potential water treatment liability under the agreements by the anticipated cost of construction/remediation/operating contracts, which include a contingency of 10% for unforeseen costs. Additionally, the City engages in an ongoing program of pollution remediation related to its various properties. Two such sites are currently undergoing remediation in the form of either soil or vaporous contaminant removal or containment. By State law these occurrences are required to be reported to California Department of Health Services. The balance of the pollution remediation liability is $2,655,407 in the governmental activities of which $322,540 is due within one year and $37,686,201 in the business-type activities, of which $7,127,106 is due within one year. These liabilities are reported in the business-type and governmental activities in the Statement of Net Position.
33

(5) CASH AND INVESTMENTS Cash and investments as of June 30, 2019 are classified in the accompanying financial statements as follows:
Statement of net position:Cash and investments 703,488,155$ Restricted cash and investments 58,133,808Restricted cash with fiscal agent 95,109,934
Fiduciary funds:Restricted cash and investments 24,690,004Restricted cash with fiscal agent 6,985,359
Total cash and investments 888,407,260$
Cash and investments as of June 30, 2019 consist of the following:
Cash on hand 26,037$ Deposits with financial institutions 51,003,280Investments 837,377,943
Total cash and investments 888,407,260$
All interest income legally accrues to the benefit of the General Fund in the absence of a legal provision to the contrary. Accordingly, accumulated interest income from the Special Revenue Source Fund in the amount of $1,553,011 has been included as interest income in the General Fund. Investments Authorized by the California Government Code and the City’s Investment Policy The table below identifies the investment types that are authorized for the City by the California Government Code and the City’s investment policy. The table also identifies certain provisions of the California Government Code (or the City’s investment policy, if more restrictive) that address interest rate risk and concentration of credit risk. This table does not address investments of debt proceeds held by bond trustees that are governed by the provisions of debt agreements of the City, rather than the general provisions of the California Government Code or the City’s investment policy. The table also does not address certain escrow accounts established for purposes such as construction project retention, which are governed by the specific escrow agreement(s).
Authorized *Maximum *Maximum Investment types by investment *Maximum percentage investment
authorized by state law policy maturity of portfolio in one issuer Local agency bonds Yes 5 years None None U.S. Treasury obligations Yes 5 years None None U.S. agency securities/obligations Yes 5 years None 50% Municipal Bonds Yes 5 years None None CA Local Agency obligations Yes 5 years None None Banker's acceptances Yes 180 days 10% 30%
34

Authorized *Maximum *Maximum Investment types by investment *Maximum percentage investment
authorized by state law policy maturity of portfolio in one issuer Commercial paper-Pooled funds Yes 270 days 40% 10% Commercial paper-Non-pooled funds Yes 270 days 25% 10% Negotiable certificates of deposit Yes 5 years 30% 10% CD/Deposit Placement services Yes 5 years 30% None Repurchase agreements Yes 1 year None None
Reverse repurchase agreements Yes 92 days 20% of base value
None
Corporate medium-term notes Yes 5 years 30% None Supranationals Yes 5 years 30% None Mutual funds Yes N/A 20% 10% Money market mutual funds Yes N/A 20% 10% Mortgage pass-through securities Yes 5 years 20% None Time deposits Yes 5 years None None Collateralized certificates of deposit Yes 5 years None None County pooled investment funds Yes N/A None None Local Agency Investment Fund (LAIF) Yes N/A None None JPA pools (other investment pools) Yes N/A None None * Based on state law requirements or investment policy requirements, whichever is more restrictive. Investments Authorized by Debt Agreements Investments of debt proceeds held by bond trustees are governed by provisions of the debt agreements, rather than the general provisions of the California Government Code or the City’s investment policy. However, in most cases, the bond agreements generally conform to the City’s policy. The table below identifies the investment types that are generally authorized for investments held by bond trustees. The table also identifies certain provisions of these debt agreements that address interest rate risk and concentration of credit risk. Maximum Maximum
Authorized Maximum percentage investment investment type maturity allowed in one issuer
U.S. Treasury obligations None None None Federal Housing Administration debentures None None None U.S. agency securities None None None Time deposits None None None Unsecured certificates of deposit 180 days None None Banker's acceptances 180 days None None State obligations None None None Repurchase agreements 1 year None None
35

Maximum Maximum Authorized Maximum percentage investment
investment type maturity allowed in one issuer Pre-refunded municipal obligations None None None Commercial paper 270 days None None Money market mutual funds None None None Investment contracts 30 years None None Investments Authorized by Actions of the City Council Cemetery and Mausoleum Perpetual Care funds are received from Woodlawn Cemetery users for the perpetual care of cemetery grounds and of the mausoleum. The funds are legally restricted to the extent that only earnings, and not principal, can be used for restricted perpetual care purposes. These funds represent the accumulation of unspent monies from non-government sources and are not considered by the City to constitute “surplus funds” of a local government. Accordingly, these funds are not considered by the City to be subject to the provisions of the California Government Code Section 53601 or the City’s investment policy. These funds have been invested per instructions of the City Council. The table below identifies the investment types generally authorized for these investments. Current City Council instructions limit the amount invested in equities to 60% of the total portfolio with the balance to be invested primarily in fixed income securities. The table also identifies certain provisions of these agreements that address interest rate risk and concentration of credit risk. Maximum Maximum
Authorized Maximum percentage investment investment type maturity allowed in one issuer
U.S. Treasury obligations None None None U.S. agency securities None None None Equities None 60% None Corporate bonds None None None Disclosures Relating to Interest Rate Risk Interest rate risk is the risk that changes in market interest rates will adversely affect the fair value of an investment. Generally, the longer the maturity of an investment, the greater the sensitivity of its fair value to changes in market interest rates. The fair value of callable securities is also sensitive to market changes in that if interest rates decrease between the time of purchase and the call dates, the likelihood that a bond will be called and reinvested at a lower interest rate increases. The City’s portfolio also includes certain callable structured investments for which the coupon interest rate changes if the investments are not called on or before certain pre-determined dates. The fair value of these investments, which primarily falls into the Federal agency security category, is also sensitive to market changes. One of the ways that the City manages its exposure to interest rate risk is by purchasing a combination of shorter term and longer term investments and by timing cash flows from maturities so that a portion of the portfolio is maturing or coming close to maturity as necessary to provide the cash flow and liquidity needed for operations.
36

Information about the sensitivity of the fair values of the City’s investments (including investments held by bond trustees and others) to market interest rate fluctuations is provided by the following table that shows the distribution of the City’s investments by maturity. For purposes of the schedule shown below, any callable securities are assumed to be held to maturity.
Investment type Amount12 Months
or Less13 to 24Months
25 to 60Months
More than60 Months N/A
Held by City:Federal agency securities 436,803,938$ 169,848,598 119,391,405 147,563,935 — — Corporate medium term notes 157,956,383 17,963,270 28,294,575 111,698,538 — — Municipal bonds 25,142,276 10,093,781 — 15,048,495 — — Commercial Paper 9,987,333 9,987,333 — — — — Supranationals 43,464,110 5,000,000 4,987,450 33,476,660 — — State investment pool 63,119,240 63,119,240 — — — —
Held by others:Treasury notes/bonds 7,391,377 4,094,139 824,553 1,505,995 966,690 — Federal agency securities 21,447,641 21,447,641 — — — — Corporate medium term notes 2,035,622 — — 1,370,027 665,595 — Common stock 7,975,736 — — — — 7,975,736 Money market funds 62,054,287 62,054,287 — — — —
Total 837,377,943$ 363,608,289 153,497,983 310,663,650 1,632,285 7,975,736
Remaining maturity (in months)
Investments with Fair Values Highly Sensitive to Interest Rate Fluctuations The City’s investments as of June 30, 2019 (including investments held by bond trustees) do not include any investments that are highly sensitive to interest rate fluctuations to a greater degree than already indicated in the information provided above. Disclosures Relating to Credit Risk Generally, credit risk is the risk that an issuer of an investment will not fulfill its obligation to the holder of the investment. This is measured by the assignment of a rating by a nationally recognized statistical rating organization. Presented below is the minimum rating required by (where applicable) the California Government Code, the City’s investment policy, or debt agreements, and the actual rating as of year-end for each investment type.
37

Minimumlegal
Investment type Amount rating** AAA/A+1 AA+ AA AA- A+ A A- BBB+ BBB BBB- Not rated
Held by City:Federal agency securities 436,803,938$ N / A — 417,097,809 — — — — — — — — 19,706,129 Corporate medium term notes 157,956,383 A 25,596,350 17,115,956 14,317,785 28,046,860 20,842,293 36,257,200 7,639,275 8,140,664 — — — Municipal bonds 25,142,276 N/A 2,466,366 2,011,500 8,906,980 11,757,430 — — — — — — — Commercial Paper 9,987,333 N/A 9,987,333 — — — — — — — — — — Supranationals 43,464,110 AA 43,464,110 — — — — — — — — — — State investmentpool 63,119,240 N / A — — — — — — — — — — 63,119,240
736,473,280 Held by others:
Treasury notes/bonds 7,391,377 N / A — 7,391,377 — — — — — — — — — Federal agency securities 21,447,641 N / A — 21,447,641 — — — — — — — — — Corporate medium term notes 2,035,622 N / A — — — — — — 139,710 387,314 694,368 814,230 — Common stock 7,975,736 — — — — — — — — — — 7,975,736 Money market funds 62,054,287 * 61,675,125 — — — — — — — — — 379,162
837,377,943$ 143,189,284 465,064,283 23,224,765 39,804,290 20,842,293 36,257,200 7,778,985 8,527,978 694,368 814,230 91,180,267
Actual ratings - Standard & Poor's
*Money market mutual funds must have the highest rating of at least two nationally recognized rating organizations or must have the investment advisor registered with the SEC with no less than 5 yrs. experience and have assets under management in excess of $500 million. The unrated money market fund amount is part of the Cemetery and Mausoleum Perpetual Care Funds and therefore is not subject to the minimum legal rating. However, it does meet the second criteria of no less than 5 year experience and have assets under management in excess of $500 million.** For purposes of categorization, the “minimum legal rating” applies to the entire rating category. For example, rating category “A” includes ratings of A+, A, and A-.
38

As of June 30, 2019. all investments were in compliance with State law and the City’s Investment Policy at the time of purchase. State law requires that any investment subject to a credit downgrade subsequent to the time of purchase shall be reviewed for possible sale within a reasonable amount of time after the downgrade.
The portfolio includes two Starbucks bonds with a fair market value of $8,140,664 as of June 30, 2019 that were downgraded by S&P from A to A- in November 2017 and further downgraded to BBB+ in June 2018. Staff reviewed the reason for the most recent downgrade as well as analyzed the financial status of the company over the remaining life of the bonds. The estimated probability of default of the bonds ranges is ranging from .002% to .07% depending on the maturity dates of the bonds. Weighing this very low risk of default against the fact that the City would realize a loss of approximately $0.1 million from selling the bonds at this time, the City concluded that holding the bonds is the appropriate course of action at this time. Concentration of Credit Risk In regards to limitations on the amount that can be invested in any one issuer, the City’s investment policy generally follows stipulations by the California Government Code. However, the City’s policy adds an additional stipulation that no more than 50% of the portfolio may be invested in a single issuer. Investments in any one issuer (other than U.S. Treasury securities, mutual funds, and external investment pools) that represent 5% or more of total City investments (excluding investments held by others) are as follows:
Issuer Investment type Reported amountFNMA (Fannie Mae) Federal agency securities 71,440,737$ 9.7 %Federal Farm Credit Bank Federal agency securities 47,929,800 6.5FHLMC (Freddie Mac) Federal agency securities 163,269,943 22.2Federal Home Loan Bank Federal agency securities 134,457,329 18.3
% of Investments
Custodial Credit Risk Custodial credit risk for deposits is the risk that, in the event of the failure of a depository financial institution, a government will not be able to recover its deposits or will not be able to recover collateral securities that are in the possession of an outside party. The custodial credit risk for investments is the risk that, in the event of the failure of the counterparty (e.g., broker-dealer) to a transaction, a government will not be able to recover the value of its investment or collateral securities that are in the possession of another party. The California Government Code and the City’s investment policy do not contain legal or policy requirements that would limit the exposure to custodial credit risk for deposits or investments, other than the following provision for deposits: The California Government Code requires that a financial institution secure deposits made by state or local governmental units by pledging securities in an undivided collateral pool held by a depository regulated under state law (unless so waived by the governmental unit). The market value of the pledged securities in the collateral pool must equal at least 110% of the total amount deposited by the public agencies. California law also allows financial institutions to secure City deposits by pledging first trust deed mortgage notes having a value of 150% of the secured public deposits. The collateral is held by the pledging financial institution’s trust department
39

and is considered held in the City’s name. The investments held by the City were not subject to custodial credit risk at June 30, 2019. As of June 30, 2019, no City investments were held by the same broker-dealer (counterparty) that was used by the City to buy the securities. For investments identified herein as held by bond trustee, the bond trustee, under direction of the City/ Redevelopment Successor Agency selects the investment under the terms of the applicable trust agreement, acquires the investment, and holds the investment on behalf of the applicable agency. Investment in State Investment Pool Both the City and the Successor Agency (SA) are voluntary participants in the Local Agency Investment Fund (LAIF) that is regulated by the California Government Code under the oversight of the Treasurer of the State of California. The fair value of City investments in this pool is reported in the accompanying financial statements at amounts based upon the City’s pro-rata share of the fair value provided by LAIF for the entire LAIF portfolio (in relation to the amortized cost of that portfolio). The balance available for withdrawal is based on the accounting records maintained by LAIF, which are recorded on an amortized cost basis. As of June 30, 2019, $63,118,394 was invested in the City’s account and $846 was invested in the SA account. The total amount invested by all public agencies in LAIF at that date was $24.6 billion. The LAIF is part of the State’s Pooled Money Investment Account (PMIA). As of June 30, 2019, the investments in the PMIA totaled $105.7 billion, nearly all of which is invested in non-derivative financial products. The weighted average of LAIF investments was 173 days as of June 30, 2019. LAIF is not rated. LAIF does not impose limits or restrictions on participant withdrawals, and the entire balance of the City's investment in the portfolio is available for withdrawal at any time. LAIF is not registered with the Securities and Exchange Commission. Deposits and withdrawals in LAIF are made on the basis of $1 and not fair value. Accordingly, the City's investment in this pool is measured on uncategorized inputs not defined as Level 1, 2, or 3.
40

Fair Value Hierarchy The City categorizes its fair value measurements within the fair value hierarchy established by generally accepted accounting principles. The hierarchy is based on the valuation inputs used to measure the fair value of the asset. Level 1 inputs are quoted prices in active markets for identical assets; Level 2 inputs are significant other observable inputs; Level 3 inputs are significant unobservable inputs. The City has the following recurring fair value measurements as of June 30, 2019:
Deposits and securities classified in Level 1 of the fair value hierarchy are valued using prices quoted in active markets for those securities. Federal Agency Securities, Municipal Bonds, Corporate Medium Term Notes, and Supranationals are classified in Level 2 of the fair value hierarchy and are valued using information provided by the firm FT Interactive Data using institutional bond quotes.
Totals 1 2 3 UncategorizedFederal agency securities 436,803,938$ — 436,803,938 — —
Corporate medium term notes 157,956,383 — 157,956,383 — —
Municipal bonds 25,142,276 — 25,142,276 — —
Supranationals 43,464,110 — 43,464,110 — —
Commercial Paper 9,987,333 — 9,987,333 — —
Local Agency Investment Fund 63,119,240 — — — 63,119,240 Held by Others:
Treasury notes/bonds 7,391,377 7,391,377 — — —
Federal agency securities 21,447,641 — 21,447,641 — —
Corporate medium term notes 2,035,622 — 2,035,622 — —
Common stock 7,975,736 7,975,736 — — —
Money market mutual funds 62,054,287 61,675,125 379,162 — —
Investments at Fair Value 837,377,943$ 77,042,238 697,216,465 — 63,119,240
LevelInvestment Type
41

(6) NOTES RECEIVABLE
Notes receivable related to governmental activities total $169,515,958 as follows:
Balance at Balance atJune 30, 2018 Transfers Increases Decreases June 30, 2019
Special Revenue Source FundCommunity Corporation of Santa Monica (a) 448,280$ - - - 448,280 Community Corporation of Santa Monica (b) 7,114,401 - - - 7,114,401 Community Corporation of Santa Monica (c) 4,420,698 - - - 4,420,698 FAME Santa Monica Senior Apartments (d) 7,416,347 - - - 7,416,347 Step Up (e) 2,029,437 - - - 2,029,437 Santa Monica Housing Partners (f) 19,400,000 - - - 19,400,000 Mountain View Mobile Home Park resident (g) 87,830 - - - 87,830 Community Corporation of Santa Monica (h) 3,350,000 - - - 3,350,000 Community Corporation of Santa Monica (i) 6,774,763 - - - 6,774,763 Community Corporation of Santa Monica (j) 5,280,138 - 4,178,147 - 9,458,285 Community Corporation of Santa Monica (k) - - 143,498 - 143,498 Community Corporation of Santa Monica (l) - - 5,912,737 - 5,912,737 Community Corporation of Santa Monica (m) - - 8,395,583 - 8,395,583 Community Corporation of Santa Monica (n) - - 11,995,084 - 11,995,084 EAH, Inc (o) - - 7,000,000 - 7,000,000 Total Special Revenue Source Fund 56,321,894 - 37,625,049 - 93,946,943
Low and Moderate Income Housing Asset FundCommunity Corporation of Santa Monica (p) 7,979,656 - - - 7,979,656 Community Corporation of Santa Monica (q) 2,738,277 - - - 2,738,277 Community Corporation of Santa Monica (r) 4,437,001 - - - 4,437,001 FAME Santa Monica Senior Apartments (s) 4,058,652 - - - 4,058,652 Step Up (t) 3,011,818 - - - 3,011,818 Community Corporation of Santa Monica (u) 4,234,506 - - - 4,234,506 Community Corporation of Santa Monica (v) 2,900,000 - - - 2,900,000 Community Corporation of Santa Monica (w) 5,408,035 - - - 5,408,035 Step Up (x) 5,870,000 - - - 5,870,000 Santa Monica Housing Partners (y) 5,684,455 - - - 5,684,455 Community Corporation of Santa Monica (z) 729,866 - - 44,128 685,738 EAH, Inc (aa) - - 5,354,795 - 5,354,795 Total Low and Moderate Income Housing Asset Fun 47,052,266 - 5,354,795 44,128 52,362,933
Other Nonmajor Governmental FundsOcean Park Community Center (bb) 400,000 - - - 400,000 Community Corporation of Santa Monica (cc) 6,345,807 - - - 6,345,807 Community Corporation of Santa Monica (dd) 841,600 - - - 841,600 Community Corporation of Santa Monica (ee) 1,691,965 - - - 1,691,965 Low- and moderate-income housing (DPRLP) (ff) 200,000 - - - 200,000 Low- and moderate-income housing (DPRLP) (ff) 200,000 - - - 200,000 Ocean Park Community Center (gg) 800,000 - - - 800,000 Step Up (hh) 1,300,000 - - - 1,300,000 Community Corporation of Santa Monica (ii) 669,456 - - - 669,456 Low- and moderate-income housing (jj) 719,619 - - - 719,619 MERL Program (kk) 6,010,493 - - 112,636 5,897,857 MERL Program (ll) 4,162,967 - - 23,189 4,139,778 Total nonmajor governmental funds 23,341,907 - - 135,825 23,206,082 Total notes receivable 126,716,067$ - 42,979,844 179,953 169,515,958
42

Special Revenue Source Fund a. A promissory note dated February 1, 2011 in the amount of $9,407,103 was executed with Community
Corporation of Santa Monica for an affordable housing project located at 2602 Broadway. This is a 55-year loan with an interest rate of 3% per annum. As of June 30, 2019, $448,280 had been disbursed to the borrower. See item “p” below for the amount disbursed from the Low and Moderate Income Housing Asset Fund.
b. A promissory note dated January 12, 2009 in the amount of $6,223,333 was executed with Community
Corporation of Santa Monica for an affordable housing project located at 430-508 Pico Boulevard. This was a 0% interest loan with the principal amount due and payable after a two-year deferral period. It was superseded by a new loan dated January 26, 2012, which increased the note to $10,947,475, changed the interest rate to 3% and the term to 55 years. As of June 30, 2019, $7,114,401 had been disbursed to the borrower. See item “q” below for amounts disbursed from Low and Moderate Income Housing Asset Fund.
c. A promissory note dated February 2, 2009 in the amount of $5,595,897 was executed with Community
Corporation of Santa Monica for an affordable housing project located at 2802 Pico Boulevard. This was a 0% interest loan with the principal amount due and payable after a two-year deferral period. It was superseded by a new loan dated November 29, 2011, which increased the note to $9,207,402, changed the interest rate to 3% and the term to 55 years. As of June 30, 2019, $4,420,698 had been disbursed to the borrower. See item “r” below for the amount disbursed from the Low and Moderate Income Housing Asset Fund.
d. A promissory note dated June 16, 2009 in the amount of $4,424,711 was executed with FAME Santa
Monica Senior Apartments, L.P. for an affordable housing project located at 1754 19th Street. This loan was superseded by a loan in the amount of $11,475,000 dated November 17, 2011. It is a 0% interest loan for 55 years. As of June 30, 2019, $7,416,347 had been disbursed to the borrower. See item “s” below for the amount disbursed from the Low and Moderate Income Housing Asset Fund.
e. A promissory note dated December 15, 2010 in the amount of $3,645,422 was executed with Step Up on
Second Street, Inc. for an affordable housing project at 520 Colorado Avenue. The loan is for the acquisition and predevelopment of the site. This loan was superseded by a loan in the amount of $5,041,255 dated January 25, 2012. It is a 3% interest loan for 55 years. As of June 30, 2019, $2,029,437 had been disbursed to the borrower. See item “t” below for the amount disbursed from the Low and Moderate Income Housing Asset Fund.
f. A promissory note dated December 8, 2011 in the amount of $19,400,000 was executed with Santa Monica
Housing Partners for the acquisition and predevelopment expenses for an affordable housing project located at 1725 Ocean Ave. This is a 0% interest loan with the principal amount due and payable after the 55-year anniversary of conversion to permanent financing. As of June 30, 2019, $19,400,000 had been
43

disbursed to the borrower. g. A shared appreciation promissory note dated October 18, 2012 in the amount of $87,830 was executed
with residents for a unit purchase in Mountain View Mobile Home Park at 1930 Stewart Street. This is a 55-year loan with a 0% interest rate. As of June 30, 2019, $87,830 had been loaned to the borrower.
h. A revised promissory note dated October 26, 2004 in the amount of $3,350,000 was executed with 1424
Broadway Apartments Limited Partnership, c/o Community Corporation of Santa Monica, for an affordable housing project located at 1424 Broadway/1512 15th Street. This is a 55-year loan with 3% interest rate per annum. Payments are to be made from residual receipts. As of June 30, 2019, $3,350,000 had been disbursed to the borrower. See item “v” below for the amount disbursed from the Low and Moderate Income Housing Asset Fund.
i. A revised promissory note dated March 9, 2005 in the amount of $6,774,763 was executed with Pacific
Court Limited Partnership, c/o Community Corporation of Santa Monica, for an affordable housing project located at 2209 Main Street. Forty-four low- and very low-income housing units were constructed on the site. This is a 55-year loan with 1% interest rate per annum. Payments are to be made from residual receipts. As of June 30, 2019, $6,774,763 had been disbursed to the borrower.
j. A revised promissory note dated March 12, 2019 in the amount of $10,570,940 was executed with
Community Corporation of Santa Monica for an affordable housing project located at 1820 & 1826 14th Street. This is a 0% interest loan with the principal amount due and payable after a two-year deferral period. As of June 30, 2019, $9,458,285 had been disbursed to the borrower.
k. A promissory note dated December 27, 2017 in the amount of $467,735 was executed with Community
Corporation of Santa Monica for an affordable housing project located at 1342 Berkeley Street. This is a 0% interest loan with a two-year term and option to extend for additional two and one-half years. Payments are deferred during loan term including any extensions. The loan is due and payable at the end of the loan term. As of June 30, 2019, $143,498 had been disbursed to the borrower.
l. A promissory note dated February 15, 2019 in the amount of $7,419,140 was executed with Community
Corporation of Santa Monica for an affordable housing project located at 2120 Lincoln Boulevard. This is 0% interest loan with a two-year term and option to extend for additional two and one-half years. Payments are deferred during loan term including any extensions. The loan is due and payable at the end of the loan term. As of June 30, 2019, $5,912,737 had been disbursed to the borrower.
m. A promissory note dated March 4, 2019 in the amount of $10,658,973 was executed with Community
Corporation of Santa Monica for an affordable housing project located at 1819 Pico Boulevard et al. This is a 0% interest loan with a two-year term and option to extend for additional two and one-half years. Payments are deferred during loan term including any extensions. The loan is due and payable at the end of the loan term. As of June 30, 2019, $8,395,583 had been disbursed to the borrower.
n. A promissory note dated May 7, 2019 in the amount of $14,098,131 was executed with Community
Corporation of Santa Monica for an affordable housing project located at 1834-48 14th Street. This is a
44

0% interest loan with a two-year term and option to extend for additional two and one-half years. Payments are deferred during loan term including any extensions. The loan is due and payable at the end of the loan term. As of June 30, 2019, $11,995,084 had been disbursed to the borrower.
o. A promissory note dated May 29, 2019 in the amount of $8,300,000 was executed with Laurel EAH NC,
LLC for the acquisition and predevelopment expenses for an affordable housing project located at 1413 Michigan Avenue. This is a 0% interest loan with a two-year term and option to extend for additional two and one-half years. Payments are deferred during loan term including any extensions. The loan is due and payable at the end of the loan term. As of June 30, 2019, $7,000,000 had been disbursed to the borrower.
Low and Moderate Income Housing Asset Fund p. A promissory note dated February 1, 2011 in the amount of $9,407,103 was executed with Community
Corporation of Santa Monica for an affordable housing project located at 2602 Broadway. This is a 55-year loan with an interest rate of 3% per annum. As of June 30, 2019, the outstanding balance is $7,979,656. See item “a” above for the amount disbursed from the Special Revenue Source Fund.
q. A promissory note dated January 12, 2009 in the amount of $6,223,333 was executed with Community
Corporation of Santa Monica for an affordable housing project located at 430-508 Pico Boulevard. This was a 0% interest loan with the principal amount due and payable after a two-year deferral period. It was superseded by a new loan dated January 26, 2012, which increased the note to $10,947,475, changed the interest rate to 3% and the term to 55 years. As of June 30, 2019, $2,738,277 had been disbursed to the borrower. See item “b” above for amounts disbursed from the Special Revenue Source Fund.
r. A promissory note dated February 2, 2009 in the amount of $5,595,897 was executed with Community
Corporation of Santa Monica for an affordable housing project located at 2802 Pico Boulevard. This was a 0% interest loan with the principal amount due and payable after a two-year deferral period. It was superseded by a new loan dated November 29, 2011, which increased the note to $9,207,402, changed the interest rate to 3% and the term to 55 years. As of June 30, 2019, the outstanding balance is $4,437,001. See item “c” above for the amount disbursed from the Special Revenue Source Fund.
s. A promissory note dated June 16, 2009 in the amount of $4,424,711 was executed with FAME Santa
Monica Senior Apartments, L.P. for an affordable housing project located at 1754 19th Street. This loan was superseded by a loan in the amount of $11,475,000 dated November 17, 2011. It is a 0% interest loan for 55 years. As of June 30, 2019, $4,058,652 had been disbursed to the borrower. See item “d” above for the amount disbursed from the Special Revenue Source Fund.
t. A promissory note dated December 15, 2010 in the amount of $3,645,422 was executed with Step Up on
Second Street, Inc. for an affordable housing project at 520 Colorado Avenue. The loan is for the acquisition and predevelopment of the site. This loan was superseded by a loan in the amount of $5,041,255 dated January 25, 2012. It is a 3% interest loan for 55 year. As of June 30, 2019, $3,011,818 had been disbursed to the borrower. See item “e” above for the amount disbursed from the Special Revenue Source Fund.
45

u. A promissory note dated July 24, 2006 in the amount of $4,234,506 was executed with The Tahiti, L.P.
c/o Community Corporation of Santa Monica for an affordable housing project located at 2411-2423 Centinela Avenue. The loan was for the construction of 36 affordable rental housing units. This is a 55-year loan with a simple interest rate of 3% per annum. Payments are to be made from residual receipts. As of June 30, 2019, $4,234,506 had been disbursed to the borrower.
v. A revised promissory note dated October 26, 2004 in the amount of $2,900,000 was executed with 1424
Broadway Apartments Limited Partnership, c/o Community Corporation of Santa Monica, for an affordable housing project located at 1424 Broadway/1512 15th Street. This is a 55-year loan with 3% interest rate per annum. Payments are to be made from residual receipts. As of June 30, 2019, $2,900,000 had been disbursed to the borrower. See item “h” above for the amount disbursed from the Special Revenue Source Fund.
w. Promissory notes dated October 26, 2004, October 26, 2004 and June 12, 2007 in the amount of
$4,458,035, $1,691,965 and $950,000, respectively for a total of $7,100,000 were executed with 26th and Santa Monica Family Housing Limited Partnership, c/o Community Corporation of Santa Monica, for an affordable housing project located at 1349 26th Street. Forty-four low- and very low-income housing units were constructed on the site. They are 55-year loans with 3% interest rate per annum. Payments are to be made from residual receipts. As of June 30, 2019, $5,408,035 had been disbursed to the borrower. See item “ee” below for the amount disbursed from the CDBG Fund.
x. Two promissory notes dated February 13, 2007, one in the amount of $5,870,000 and one for $1,300,000
for a total of $7,170,000 were executed with Step Up on Fifth, L.P. for an affordable housing project located at 1548 Fifth Street. These loans are for the acquisition and construction of the site. This is a 55-year loan with a simple interest rate of 5% per annum. Payments are to be made from residual receipts. As of June 30, 2019, $5,870,000 had been disbursed to the borrower. See item “hh” below for the amount disbursed from the Miscellaneous Grants Fund.
y. An amended promissory note dated February 22, 2008, in the amount of $5,207,314 and a promissory
note dated March 15, 2011 for $477,141 were executed with the Santa Monica Housing Partners, L.P. for the development of 20 units of affordable senior housing at 1458 14th Street. The loans represent land acquisition financing that achieves site control. These are 55-year loans with an interest rate of 3% per annum on the $5,207,314 loan and 4.36% on the $477,141 loan. As of June 30, 2019, the outstanding balance is $5,684,455.
z. A promissory note dated October 21, 1987 in the amount of $778,603 was executed with Community
Corporation of Santa Monica for affordable housing projects located at 504 Ashland, 518 Pier, 536 Ashland, 642 Marine, and 3005 Highland. The overall project is called Ocean Park 43 (OP43). This is a 40 year loan with an interest rate of 5% per annum. As of June 30, 2019, $685,738 had been disbursed to the borrower.
aa. A promissory note dated September 12, 2018 in the amount of $6,585,000 was executed with Magnolia
Villas EAH, LLC for the acquisition and predevelopment expenses for an affordable housing project
46

located at 1445-1453 10th Street. This is a 0% interest loan with a two-year term and option to extend for additional two and one-half years. Payments are deferred during loan term including any extensions. The loan is due and payable at the end of the loan term. As of June 30, 2019, $5,354,795 had been disbursed to the borrower.
Nonmajor Governmental Funds bb. A promissory note dated September 30, 2003 in the amount of $1,200,000 was executed with Ocean Park
Community Center for congregate housing and emergency shelter for very low-income use, located at 1751 Cloverfield Boulevard. This loan is for the acquisition and rehabilitation of the site. This is a 55-year loan with 5.98% interest rate per annum with a two-year deferral period. Payments are to be made from residual receipts. As of June 30, 2019, $400,000 had been disbursed to the borrower. This was disbursed from the TORCA Fund. See item “gg” below for the amount disbursed from the Miscellaneous Grants Fund.
cc. A revised promissory note dated February 8, 2006 in the amount of $6,745,807 was executed with
Community Corporation of Santa Monica for an affordable housing project located at 3021-3031 Santa Monica Boulevard. This loan was for the acquisition, predevelopment expenses and construction of low- and very low-income housing. This is a 3% interest loan with the principal amount due and payable February 8, 2061, 55-years from February 8, 2006. As of June 30, 2019, $6,345,807 had been disbursed to the borrower. This was disbursed from the TORCA Fund.
dd. A promissory note dated December 22, 1988 in the amount of $841,600 was executed with Community
Corporation of Santa Monica for low- and very low-income housing at 2020-2030 Cloverfield Boulevard. This is a 35-year loan with 10.44% interest rate per annum. As of June 30, 2019, $841,600 had been disbursed to the borrower. This was disbursed from the CDBG Fund.
ee. Promissory notes dated October 26, 2004, October 26, 2004 and June 12, 2007 in the amount of
$4,458,035, $1,691,965 and $950,000, respectively for a total of $7,100,000 were executed with 26th and Santa Monica Family Housing Limited Partnership, c/o Community Corporation of Santa Monica, for an affordable housing project located at 1349 26th Street. Forty-four low- and very low-income housing units are to be constructed on the site. They are 55-year loans with 3% interest rate per annum. Payments are to be made from residual receipts. As of June 30, 2019, $1,691,965 had been disbursed to the borrower. This was disbursed from the CDBG Fund. See item “w” above for the amount disbursed from the Low and Moderate Income Housing Asset Fund.
ff. Two promissory notes dated December 22, 1988 and December 29, 1989, for $200,000 each, one for 3
Vicente Terrace and one for 2020/30 Cloverfield Boulevard, were executed with the owners of certain rental properties. The first note was for five years at 3% interest per year, and could be renewed for five additional five-year terms as long as the rental properties are maintained for low-and moderate-income households. The first note was due December 22, 1993, and has been extended for the fifth time to December 22, 2018; the second note was due December 29, 1994, and has been extended to December 29, 2019 under the same interest rate and similar terms and conditions. The promissory notes are payable
47

in full upon sale or transfer of the property (whichever occurs first) or upon expiration of the term of the promissory notes. Upon payment to the City, proceeds must be paid to the State of California as repayment for two $200,000 State Department of Housing and Urban Development Deferred Payment Rehabilitation Loan Program (DPRLP) loans. There were no changes in the loan balances during the fiscal year ended June 30, 2019. These were disbursed from the Miscellaneous Grants Fund.
gg. A promissory note dated September 30, 2003 in the amount of $1,200,000 was executed with Ocean Park
Community Center for congregate housing and emergency shelter for very low-income use, located at 1751 Cloverfield Boulevard. This loan is for the acquisition and rehabilitation of the site. This is a 55-year loan with 5.98% interest rate per annum with a two-year deferral period. Payments are to be made from residual receipts. As of June 30, 2019, $800,000 had been disbursed to the borrower. This was disbursed from the Miscellaneous Grants Fund. See item “bb” above for the amount disbursed from the TORCA Fund.
hh. Two promissory notes dated February 13, 2007, one in the amount of $5,870,000 and one for $1,300,000
for a total of $7,170,000 were executed with Step Up on Fifth, L.P. for an affordable housing project located at 1548 Fifth Street. These loans are for the acquisition and construction of the site. This is a 55-year loan with a simple interest rate of 5% per annum. Payments are to be made from residual receipts. As of June 30, 2019, $1,300,000 had been disbursed to the borrower. This was disbursed from the Miscellaneous Grants Fund. See item “x” above for the amount disbursed from the Low and Moderate Income Housing Asset Fund.
ii. On October 22, 1998, the City executed a promissory note with Community Corporation of Santa Monica
for the construction of a twenty unit, large family, affordable housing complex located at 708 Pico Boulevard. $579,000 was funded from the City’s Pico Neighborhood Trust Fund but now known as CDBG Housing Trust Fund, while $221,000 is funded from the Community Development Block Grant (CDBG) Fund. This note is a 0% interest loan to be repaid from residual receipts of the project and is due on October 22, 2053. As of June 30, 2019, the outstanding balance is $669,456.
jj. These represent non-interest bearing, limited appreciation and shared appreciation loans made between
1991 and 2001 pursuant to Tenant Ownership Rights Charter Amendment (TORCA) Program guidelines to assist low- and moderate-income households to purchase their rental units. The loans are due the earlier of 20 years or 30 years as applicable or upon resale, transfer or default. As of June 30, 2019, the outstanding balances of such loans total $719,619.
kk. The January 17, 1994 Northridge Earthquake resulted in damaged multifamily residences in the City. To
facilitate repair of damaged multifamily residences, the U.S. Department of Housing and Urban Development awarded the City a total of $33,388,000 in emergency funds to finance the City's Multifamily Earthquake Repair Loan (MERL) Program. The funds were allocated as follows: $2,027,000 – HOME Program Emergency Supplemental Fund, $6,361,000 – HOME Program Presidential Contingency Fund, and $25,000,000 – CDBG Program Emergency Supplemental Fund. Loans were made between 1995 and 2001. As of June 30, 2019, the CDBG Program Emergency Supplemental Fund outstanding balance is $5,897,857. See item “ll” below for the amount disbursed from the Miscellaneous Grants Fund.
48

ll. The January 17, 1994 Northridge Earthquake resulted in damaged multifamily residences in the City. Tofacilitate repair of damaged multifamily residences, the U.S. Department of Housing and Urban Development awarded the City a total of $33,388,000 in emergency funds to finance the City's Multifamily Earthquake Repair Loan (MERL) Program. The funds were allocated as follows: $2,027,000 – HOME Program Emergency Supplemental Fund, $6,361,000 – HOME Program Presidential Contingency Fund, and $25,000,000 – CDBG Program Emergency Supplemental Fund. Loans were made between 1995 and 2001. As of June 30, 2019, the Miscellaneous Grants Fund outstanding balance is $4,139,778. See item “kk” above for the amount disbursed from the CDBG fund.
The following summarizes the total loan amount authorized, amount disbursed since inception of the loan program, the amounts repaid by the borrowers, and the loan balances:
Loan amount Loan amount Amounts Loan balance atFund authorized disbursed repaid/forgiven June 30, 2019
CDBG (kk) $ 21,739,088 21,727,929 15,830,072 5,897,857 Miscellaneous Grants (ll) 7,790,695 7,790,695 3,650,917 4,139,778 Total $ 29,529,783 29,518,624 19,480,989 10,037,635
Due to the length of the repayment plan and uncertainty of collection of housing loans, the City’s policy is not to record interest until received.
49

(7) CAPITAL ASSETS Capital assets activity for the primary government for fiscal year ended June 30, 2019 is as follows:
Balance atJuly 1, 2018 Increases Decreases Transfers
Balance atJune 30, 2019
Governmental activities:
Capital assets, not being depreciated:Land 200,323,024$ — — — 200,323,024 Land held under easement 72,237,823 — — — 72,237,823 Construction in progress 48,824,161 51,149,357 — (27,918,944) 72,054,574
Total capital assets, not being depreciated 321,385,008 51,149,357 — (27,918,944) 344,615,421
Capital assets, being depreciated:Buildings 340,429,097 — — — 340,429,097 Improvements other than buildings 172,223,443 1,140,524 — 21,081,863 194,445,830 Utility systems 1,742,913 — — — 1,742,913 Machinery and equipment 48,829,408 3,545,328 (328,033) 5,116,541 57,163,244 Infrastructure 374,721,201 — — 1,720,540 376,441,741 Intangibles 695,710 — — — 695,710
Total capital assets being depreciated 938,641,772 4,685,852 (328,033) 27,918,944 970,918,535
Less accumulated depreciation for:Buildings (118,641,750) (7,936,572) — — (126,578,322) Improvements other than buildings (77,870,668) (9,713,295) — — (87,583,963) Utility systems (918,184) (329,893) — — (1,248,077) Machinery and equipment (30,822,933) (2,594,111) 301,798 — (33,115,246) Infrastructure (232,486,768) (8,860,326) — — (241,347,094) Intangibles (159,435) (41,441) — — (200,876)
Total accumulated depreciation (460,899,738) (29,475,638) 301,798 — (490,073,578) Total capital assets, being depreciated, net 477,742,034 (24,789,786) (26,235) 27,918,944 480,844,957
Subtotal governmental activities 799,127,042 26,359,571 (26,235) — 825,460,378
Business-type activities:
Capital assets, not being depreciated:Land 53,380,750 — — — 53,380,750 Construction in progress 5,849,977 12,407,147 — (526,508) 17,730,616
Total capital assets, not being depreciated 59,230,727 12,407,147 — (526,508) 71,111,366
Capital assets, being depreciated:Buildings 147,870,482 — (7,513) 464,014 148,326,983 Improvements other than buildings 27,329,659 188,594 — — 27,518,253 Machinery and equipment 214,848,180 24,311,822 (15,881,111) 62,494 223,341,385 Infrastructure 236,232,527 4,285,327 — 240,517,854 Intangibles 106,321,795 4,518,300 — — 110,840,095
Total capital assets being depreciated 732,602,643 33,304,043 (15,888,624) 526,508 750,544,570
Less accumulated depreciation for:Buildings (61,584,770) (4,850,341) 7,513 — (66,427,598) Improvements other than buildings (16,510,029) (1,120,340) — — (17,630,369) Machinery and equipment (131,871,946) (16,419,316) 15,054,254 — (133,237,008) Infrastructure (99,047,235) (6,058,278) — — (105,105,513) Intangibles (35,506,813) (2,769,637) — — (38,276,450)
Total accumulated depreciation (344,520,793) (31,217,912) 15,061,767 — (360,676,938) Total capital assets, being depreciated, net 388,081,850 2,086,131 (826,857) 526,508 389,867,632 Subtotal business-type activities 447,312,577 14,493,278 (826,857) — 460,978,998
Total 1,246,439,619$ 40,852,849 (853,092) — 1,286,439,376
50

Depreciation and amortization expense was charged to functions/programs of the primary government as follows:
Governmental activities:
General government 605,024$ Public safety 3,592,762 General services 15,057,819 Cultural and recreation services 4,355,901 Library 1,297,035 Housing and community development 4,460,974 Capital assets held by the government's internal service funds are charged to the various functions based on their assets' usage 106,123
Total depreciation and amortization expense - governmental activities 29,475,638$
Business-type activities:Water 1,316,634$ Resource Recovery and Recycling 7,986 Broadband 10,459 Pier 1,311,965 Wastewater 6,988,763 Airport 361,161 Stormwater management 324,607 Cemetery 44,313 Big Blue Bus 17,479,077 Parking authority 16,263 Capital assets held by the government's internal service funds are charged to the various programs based on their assets' usage 3,356,684
Total depreciation and amortization expense - business-type activities 31,217,912$
The City’s infrastructure assets are recorded at historical cost and estimated historical cost in the government-wide statements as required by GASB Statement No. 34.
51

(8) UNEARNED REVENUE AND DEFERRED INFLOWS OF RESOURCES Governmental funds report deferred inflows of resources in connection with receivables for revenues that are not considered to be available to liquidate liabilities of the current period. Governmental and enterprise funds also report a liability in connection with resources that have been received as of year-end, but not yet earned (unearned revenue). The interest on advances reported in the General Fund represents interest on advances to the Successor Agency and the nonmajor enterprise funds and is recognized in the government-wide financial statements. This interest is earned and included in promissory note balances at year-end. GASB Statement No. 34 requires the City to recognize and present interfund activity between governmental and business-type funds on the government-wide financial statements. The components of unearned revenue are as follows:
Governmental funds:General Fund:
Unearned user fees 958,424$ Unearned rent 52,109 Business license tax 6,603,466 Unearned sponsorship fees 246,530
Total General Fund 7,860,529 Special Revenue Source Fund:
Civic Center Village advanced lease payments 17,913,970
Total Special Revenue Source Fund 17,913,970 Nonmajor governmental funds:
Grants received prior to meeting all eligibility requirements 59,449 Unearned user fees 467,742
Total nonmajor governmental funds: 527,191 Total governmental funds 26,301,690
Enterprise funds:Big Blue Bus Fund:
Unearned developer fees 185,000 Unearned advertising fees 94,256 Grant and other funds received prior to
meeting all eligibility requirements 3,656,147 Total Big Blue Bus Fund 3,935,403 Total enterprise funds 3,935,403 Total unearned revenue 30,237,093$
52

The components of deferred inflows of resources for unavailable revenue are as follows:
Fund financial statements
Recognized in government-
wide financials
Government-wide financial
statements
Governmental funds:
General Fund:
Interest on advances 5,468,239$ (5,468,239) —
User fees 265,274 (265,274) —
5,733,513 (5,733,513) — Total General Fund
Nonmajor governmental funds:Grants receivable 2,368,820 (2,368,820) —
Total Nonmajor governmental funds 2,368,820 (2,368,820) —
Total deferred inflows of resources 8,102,333$ (8,102,333) —
53

(9) LONG-TERM DEBT Changes in long-term debt: Long-term debt activity for the fiscal year ended June 30, 2019, was as follows:
Balance atJuly 1, 2018 Additions Reductions
Balance atJune 30, 2019
Due withinone year
Due beyond one year
Governmental Activities:Loans payable from direct borrowings 400,000 $ — 200,000 200,000 200,000 — Lease Revenue bonds 155,610,000 — 3,510,000 152,100,000 3,645,000 148,455,000 General obligation bonds 5,460,000 — 1,120,000 4,340,000 1,110,000 3,230,000 Plus deferred amounts:
For issuance premiums 16,021,308 — 847,646 15,173,662 — 15,173,662 Total loans and bonds payable 177,491,308 — 5,677,646 171,813,662 4,955,000 166,858,662
Business-type activities:Loans payable from direct borrowings 661,765 501,199 307,144 855,820 315,130 540,690 Revenue bonds 8,955,000 — 2,130,000 6,825,000 2,210,000 4,615,000 Plus deferred amounts:
For issuance premiums 349,636 — 99,895 249,741 — 249,741 Total loans and bonds payable 9,966,401 501,199 2,537,039 7,930,561 2,525,130 5,405,431 Total 187,457,709 $ 501,199 8,214,685 179,744,223 7,480,130 172,264,093
54

A summary of long-term debt outstanding at year-end is as follows:
Date of issue Original issue
Finalmaturity
dateInterest
rate Balance at
June 30, 2019 Governmental activities:
Lease Revenue bonds (1):Public Finance Authority 2011 (Series A) Nov 16, 2011 32,065,000$ June 1, 2031 4.00-5.00% 23,990,000$ Public Finance Authority Refunding 2011 (Series B) Nov 16, 2011 8,625,000 Dec 1, 2020 2.00-4.00% 2,035,000 Public Finance Authority Refunding 2015 Jul 9, 2015 26,360,000 July 1, 2033 3.00-5.00% 23,290,000 Public Finance Authority 2017 Sep 14, 2017 68,565,000 July 1, 2047 3.00-5.00% 68,565,000 Public Finance Authority 2018 Jun 6, 2018 34,220,000 July 1, 2048 3.625-5.000% 34,220,000
Subtotal lease revenue bonds - governmental activities 152,100,000
General obligation bonds (1):Main Library Improvements 2012 May 30, 2012 11,325,000 July 1, 2022 0.20-4.00% 4,340,000
Subtotal general obligation bonds - governmental activities 4,340,000
Loans payable from direct borrowings:State Dept. of Housing and Community Development loan (2) Dec 29, 1989 200,000 Dec 29, 2019 0.00% 200,000
Subtotal loans payable from direct borrowings200,000
Subtotal governmental activities 156,640,000
Business-type activities (3):Revenue bonds:
Hyperion Project Revenue Refunding 2012 May 30, 2012 8,955,000 Feb 1, 2022 2.00-4.00% 6,825,000 Subtotal revenue bonds - business-type activities 6,825,000
Loans payable from direct borrowings:State Water Resources Control
Board loan Jan 29, 1999 5,000,000 Feb 28, 2020 2.60% 315,130 State Water Resources Control
Board Construction Installment Sale Agreement Sep 21, 2017 56,885,903 June 11, 2050 1.80% 540,690 855,820
Subtotal business-type activities 7,680,820 Total 164,320,820$
(1) For construction of City facilities. (2) To fund promissory note receivable from the owner of certain rental property. (3) To fund capital contribution towards wastewater treatment facility.
Management believes it is in compliance with all debt covenants. See Note 17.
55

Annual debt service requirements to maturity are as follows:
Fiscal yearending
June 30, Principal Interest Principal Interest Principal Interest Principal Interest
2020 3,645,000$ 5,867,669 1,110,000 140,450 200,000 — 4,955,000 6,008,119 2021 3,815,000 6,485,563 1,095,000 101,825 — — 4,910,000 6,587,388 2022 3,505,000 6,309,763 1,075,000 63,900 — — 4,580,000 6,373,663 2023 5,095,000 6,096,763 1,060,000 21,200 — — 6,155,000 6,117,963 2024 5,355,000 5,837,763 — — — 5,355,000 5,837,763 2025-2029 30,740,000 25,224,951 — — — — 30,740,000 25,224,951 2030-2034 30,045,000 17,904,445 — — — — 30,045,000 17,904,445 2035-2039 19,515,000 12,963,988 — — — — 19,515,000 12,963,988 2040-2044 24,550,000 7,885,766 — — — — 24,550,000 7,885,766 2045-2049 25,835,000 2,226,797 — — — — 25,835,000 2,226,797
152,100,000$ 96,803,468 4,340,000 327,375 200,000 — 156,640,000 97,130,843
Fiscal yearending
June 30, Principal Interest Principal Interest Principal Interest
2020 2,210,000$ 181,350 315,130 8,193 2,525,130 189,543 2021 2,275,000 115,050 — — 2,275,000 115,050 2022 2,340,000 46,800 540,690 — 2,880,690 46,800
6,825,000$ 343,200 855,820 8,193 7,680,820 351,393
Governmental Activities
General obligation bonds
TotalRevenue bondsLoans payable from direct
borrowings
TotalLease Revenue bonds
Business-type activities
Loans payable from direct borrowings
56

The City’s outstanding balance of a construction installment sale agreement from direct borrowings related to business type activities of $540,690 contains a provision that if the agreement were terminated, the City would, upon demand, be required to pay the State Water Board an amount equal to Project Funds disbursed, accrued interest, penalty assessments and additional payments. The City’s outstanding bonds of $6,825,000 of Hyperion refunding bonds related to business type activities contain a provision in the indenture that in the event of default the majority of the bond holders can declare the principal balance plus any accrued interest be immediately payable. Pledged Revenue The City has a number of debt issues that involve the pledging of revenues. The amounts and terms of the remainder of these commitments and the purposes for which the proceeds of the debt issuances are utilized are indicated in the summary of long-term bonds and loans and notes outstanding at year-end presented in this note. For the current year, debt service payments as a percentage of the pledged gross revenue (net of certain expenses where so specified in debt covenants) are indicated in the table below. These percentages also approximate the relationship of debt service to pledged revenue for the remainder of the term of the commitment.
Annual amount of pledged
revenue (net of expenses, where
required)
Annual debt service
payments (of all debt secured by this revenue)
Debt service as a percentage of pledged revenue
Future amount of pledged revenue
Description of pledged revenue/debt:
Base rental payments
1,062,700$ 1,062,700$ 100% 2,117,300$
Public Finance Authority 2011 2,667,131 2,667,131 100% 32,020,500
Public Finance Authority Refunding 2015 2,047,194 2,047,194 100% 28,727,675
Public Finance Authority 2017 2,991,600 2,991,600 100% 121,290,300
Public Finance Authority 2018 1,662,331 1,662,331 100% 61,673,795
Library bond tax revenue
Main Library Improvements Refunding 2012 1,270,281 1,270,281 100% 3,476,050
Wastewater charges for services
Hyperion Project Revenue Refunding 2012 2,396,550 2,396,550 100% 7,168,200
Public Finance Authority Refunding 2011
Construction Installment Sale Agreement
On September 21, 2017, the City entered into a Construction Installment Sale agreement with the State Water Resources Control Board to fund certain water recycling and conservation projects. The original agreement provides funding in the amount of $56.9 million and is payable with interest at 1.8% over a period of 30 years with the first installment due after all disbursements have been paid and construction of the project has been completed. The City is in the process of executing a revised agreement with the State
57

to increase funding and extend the date for project completion. The City anticipates the revised agreement will be fully executed by January 2020. The City has drawn $540,960 on the loan as of June 30, 2019.
Defeasance In FY 2017-18, $3,535,000 par value of Public Financing Authority 2009 Lease Revenue Bonds were defeased. The total remaining principal balance of the bonds is $2,695,000 as of June 30, 2019.
58

(10) FUND DEFICITS Internal Service Funds A net deficit of $1,265,107 exists in the Self-Insurance Bus Fund due to the adverse development of new and existing claims. Management intends to eliminate the deficit over the next year through increased contributions to the Fund in FY 2019-20. Increased contributions in FY 2018-19 decreased the deficit by $444,107. A net deficit of $4,111,632 exists in the Self-Insurance General Liability Fund primarily due to the adverse development of new and existing claims. Management intends to eliminate the deficit over time through increased contributions to the Fund. A net deficit of $47,852 exists in the Self-Insurance Risk Management Admin Fund primarily due to the unfunded pension and OPEB liabilities. Management has taken action to reduce both of these liabilities by increased contributions towards the unfunded pension and OPEB liabilities.
59

(11) INTERFUND TRANSACTIONS The following tables summarize the due to/from other funds, interfund advances to/from, and transfers in/out as of and for the fiscal year ended June 30, 2019.
Advances to/from Advances to/from other funds at June 30, 2019 are as follows:
Advances to Advances from(receivable fund) (payable fund) Amount
General Fund Nonmajor governmental funds 4,263,891$ Nonmajor enterprise funds 5,748,972
Total General Fund 10,012,863 Total advances to/from 10,012,863$
Advances represent loans made to cover operating shortfalls or to provide financing resources for capital projects. These amounts are expected to be repaid in future years, subject to the various loan terms. Due from/to Balances due to/from other funds at June 30, 2019 are as follows:
Due From Due to(receivable fund) (payable fund) Amount
General Fund Nonmajor governmental funds 3,320,119$ Total due to/from 3,320,119$
Due to/from other funds are primarily short-term loans made to eliminate negative cash balances at year-end. These amounts are expected to be repaid in one year.
60

Transfers Transfers to/from other funds for the fiscal year ended June 30, 2019 are as follows:
Transfer in (receivable fund) Amount
General Fund Special Revenue Source Fund 1,098,463$ (1) Nonmajor governmental funds 2,359,015 (2) Water Fund 2,425,168 (3) Big Blue Bus Fund 462,563 (4) Wastewater Fund 882,069 (3) Resource Recovery and Recycling Fund 464,169 (5) Nonmajor enterprise funds 1,246,450 (6) Internal service funds 144,718 (7)
Total General Fund 9,082,615
Special Revenue Source Fund General Fund 10,199,396 (8)Nonmajor enterprise funds 12,000,000 (8)
Total Special Revenue Source Fund 22,199,396
Low/Moderate Housing Fund General Fund 133,730 (8)Nonmajor enterprise funds 3,000,000 (8)
Total Low/Moderate Housing Fund 3,133,730
Nonmajor governmental funds General Fund 11,761,086 (9)Special Revenue Source Fund 337,311 (10)
Nonmajor governmental funds 66,359 (10)Total nonmajor governmental funds 12,164,756
Water Fund General Fund 55,873,794 (11)Total Water Fund 55,873,794
Resource Recovery and Recycling Fund Nonmajor governmental funds 5,774 (5) Total Resource Recovery and Recycling Fund 5,774
Wastewater Fund General Fund 38,354 (12)Nonmajor enterprise funds 1,265,024 (13)
Total Wastewater Fund 1,303,378
Big Blue Bus Fund Nonmajor governmental funds 585,959 (14)Total Big Blue Bus Fund 585,959
Nonmajor enterprise funds General Fund 303,112 (15)Water Fund 12,300 (16)Nonmajor governmental funds 1,022,964 (17)
Total nonmajor enterprise funds 1,338,376
Internal service funds Internal service funds 2,452,526 (7)Total Internal service funds 2,452,526
Total transfers 108,140,304$
Transfer out(payable fund)
61

1) Transfer of monies to subsidize cultural arts, community recreation, inclusionary housing, affordable housing program,
transportation management expenditures and payments for property used in CityTV operations. 2) Transfer of monies to subsidize environmental, literacy, nutrition, housing, transportation and street program expenditures. 3) Transfer of monies to subsidize infrastructure improvements and environmental program expenditures. 4) Transfer of monies to subsidize finance, human resources, and transit mall maintenance expenditures. 5) Transfer of monies to subsidize environmental program expenditures. 6) Transfer of monies to subsidize infrastructure improvements, environmental, and economic development program
expenditures. 7) Transfer of monies to subsidize risk management program expenditures. 8) Transfer of monies to subsidize affordable housing program expenditures. 9) Transfer of monies for payment of debt service and to subsidize community recreation programs. 10) Transfer of monies to subsidize housing program expenditures. 11) Transfer of monies related to move of pollution remediation and to subsidize utility rates for low income families. 12) Transfer of monies to subsidize utility rates for low income families. 13) Transfer of monies to subsidize operating and maintenance expenditures associated with the Santa Monica Urban Runoff
Recycling Facility. 14) Transfer of monies to subsidize transportation program and infrastructure expenditures. 15) Transfer of monies to subsidize park development and the Twilight Concert Series. 16) Transfer of monies received from Metropolitan Water District Recycled Water Rebate program. 17) Transfer of monies to subsidize cemetery operation and maintenance expenditures and maintenance expenditures
associated with the Santa Monica Urban Runoff Recycling Facility.
62

(12) RESTRICTED NET POSITION In the government-wide financial statements and proprietary fund financial statements, restricted net position is reported when constraints on the use of resources are either externally imposed by creditors (such as through debt covenants), grantors, contributors, or laws or regulations or other governments, or imposed by law through constitutional provisions or enabling legislation. See note 1 for a detailed explanation of the City’s net position policies. Restricted net position for governmental activities at June 30, 2019 is as follows: Housing and community development
Low and moderate income housing funds 60,122,880$ Special revenue source funds 42,799,605 Tenant Ownership Rights Charter Amendment (TORCA) funds 14,244,100 Community Development Block Grant (CDBG) funds 9,338,980 Miscellaneous grant funds 8,555,727 Rent control funds 1,532,912 Housing authority funds 53,814
Total housing and community development 136,648,018
Culture and recreation servicesBeach recreation funds 11,048,667 Special revenue source funds 6,635,855 Parks and recreation funds 163,839
Total culture and recreation services 17,848,361
TransportationSpecial revenue source funds - traffic 2,629,816 Special revenue source funds - parking 1,188,185 Special revenue source funds - roads 803,532 Special revenue source funds - transit 9,890,019 Local return funds 10,738,853 Gas tax funds 2,253,746
Total transportation 27,504,151
Clean beaches and ocean parcel tax 9,503,360 Debt service 5,048,924 Miscellaneous 16,500,684 Perpetual care - nonexpendable 13,813,783 Total governmental restricted net position 226,867,281$
63

Restricted net position for business-type activities at June 30, 2019 is as follows:
Housing and community development - Low and moderate income housing funds 5,178,223$
Rail reserve 1,801,971 Prop 1B 10,645,888 Debt service 2,298,946 Total business-type restricted net position 19,925,028$
64

(13) FUND BALANCES In the fund financial statements fund balance is displayed in categories that describe the nature and extent of constraints on resources that the City is bound to observe. See note 1 for a detailed explanation of the City’s fund balance policies. Fund balance reported on the governmental funds balance sheet as of June 30, 2019 includes the following: Nonspendable fund balance Nonspendable fund balance includes amounts that are not in a spendable form, such as prepaid and advances to other funds, or are required to be maintained intact, such as funds held by the City associated with the perpetual care of the City's cemetery and mausoleum. Nonspendable fund balances are presented as a component of fund balances as follows:
General FundSpecial Revenue
Source Fund
Low and Moderate Income
Housing Asset Fund
Nonmajor governmental
funds
Total governmental
funds
Nonspendable
Prepaids 1,673,548$ — — 50,353 1,723,901
Advances 9,881,205 — — — 9,881,205
Perpetual care — — — 13,813,783 13,813,783
Total nonspendable 11,554,753$ — — 13,864,136 25,418,889
Restricted fund balance Restricted fund balance represents amounts that can only be spent for the specific purposes stipulated by either external resource providers or by enabling legislation that created the revenue source and restricted its use. These restrictions may be changed or lifted only with the consent of the resource providers. The largest component of restricted fund balance is affordable housing, which represents funds received from grants, taxes, and fees that are all dedicated to ensuring the affordability of housing in the City. The City Services Building project and the Fire Station 1 project represent the unspent portion of lease revenue bond proceeds that were issued to finance these large-scale capital projects. Other significant categories include transit, traffic, roads, and parking, which are all dedicated to improving the City’s transportation systems for its citizens and visitors. Another noteworthy category is cultural and recreation services, which includes funds restricted for beach recreation activities, the upgrade and/or expansion of parks and recreation facilities, and funds that support public art programs. Childcare programs are designed to assist eligible residents with childcare needs, as well as for the construction of new childcare facilities. Finally, debt service represents amounts held by trustees for the future repayment of outstanding City obligations.
65

Restricted fund balances are presented as a component of fund balances as follows:
General FundSpecial Revenue
Source Fund
Low and Moderate
Income Housing Asset Fund
Nonmajor governmental
funds
Total governmental
funds
Restricted
Affordable housing $ 485,889 42,799,605 59,636,991 33,443,201 136,365,686
City Services Building project 43,919,597 — — — 43,919,597
Fire Station 1 project 23,117,154 — — — 23,117,154
Childcare programs — 5,346,420 — — 5,346,420
Cultural and recreation services — 6,635,855 — 11,212,506 17,848,361
Clean beaches and ocean parcel tax — — — 9,503,360 9,503,360
Traffic — 2,629,816 — — 2,629,816
Parking — 1,188,185 — — 1,188,185
Roads — 803,532 — 2,253,746 3,057,278
Transit — 9,890,019 — 10,738,853 20,628,872
Overnight accommodations — 3,177,843 — — 3,177,843
Miscellaneous 2,453,199 2,592,728 — 2,930,494 7,976,421
Debt service — — — 5,048,924 5,048,924
Total restricted 69,975,839$ 75,064,003 59,636,991 75,131,084 279,807,917
Committed fund balance Committed fund balance represents amounts that can only be used for the specific purposes determined by a formal action of the City Council. Commitments may be changed or lifted only by the City Council taking the same formal action that originally imposed the constraint. The largest component of committed fund balance is affordable housing, which includes funds received from settlement proceeds, the sale of City-owned properties, funds received from the Successor Agency, and one quarter of the City’s Transaction and Use Tax revenue, which are committed to ensuring the affordability of housing in the City. Committed fund balances are presented as a component of fund balances as follows:
General FundSpecial Revenue
Source Fund
Low and Moderate
Income Housing Asset Fund
Nonmajor governmental
funds
Total governmental
funds
Committed
Affordable housing 1,943,558$ 80,754,976 — — 82,698,534
Total committed 1,943,558$ 80,754,976 — — 82,698,534
66

Assigned fund balance Assigned fund balance represents amounts intended to be used by the City for specific purposes expressed by the City Council or by an official to which the City Council has delegated the authority. The largest component of assigned fund balance is for the reappropriation of open contracts and purchase orders. The next largest components are the continuing capital projects and future projects, which represent funds that are dedicated to completing capital improvement and other projects throughout the City, including City Yards, the City Services Building, Fire Station 1 and the Civic Center Sports Field. Other funds are assigned for compensated absences, short-term homeless programs, paydown of unfunded pension liability, and other key initiatives required for the health and safety of the City and its assets. Assigned fund balances are presented as a component of fund balances as follows:
General FundSpecial Revenue
Source Fund
Low and Moderate
Income Housing Asset Fund
Nonmajor governmental
funds
Total governmental
funds
Assigned
Continuing capital projects 45,599,076$ — — — 45,599,076
Future projects 36,692,560 — — — 36,692,560
Short-term projects 9,444,413 — — — 9,444,413
Expenditure control budget account 2,208,957 — — — 2,208,957
Compensated absences 12,976,805 — — — 12,976,805
Unfunded liability paydown 4,600,000 — — — 4,600,000
Homeless programs 796,951 — — — 796,951
Reappropriations 65,984,861 — — — 65,984,861
Other purposes 3,896,299 — — — 3,896,299
Total assigned 182,199,922$ — — — 182,199,922 Unassigned fund balance Unassigned fund balance is the residual classification for the General Fund and includes all amounts not contained in other classifications. Other governmental funds may report negative unassigned fund balance if expenditures incurred for a specific purpose exceed the resources that are restricted, committed, or assigned to that purpose. This occurs when reimbursements are received after expenditures are incurred and the deficit will be eliminated as reimbursements for eligible grant expenditures are received from grantors. The largest component of unassigned fund balance is the emergency operating and capital contingency, which represents funds for emergency events and circumstances. Similarly, economic uncertainty represents funds for unforeseen changes in economic conditions. Both of these reserves are maintained to safeguard the credit rating and basic operations of the City in the event of an economic or natural emergency or disaster. The unrealized gain (loss) represents the portion of fund balance related to investments that is not available for appropriation. Negative unassigned fund balance for nonmajor governmental funds is due to the timing of expenditures being incurred prior to reimbursement from grant and other revenue sources. The deficits will be eliminated as future revenues are received.
67

Unassigned fund balances are presented as a component of fund balances as follows:
General FundSpecial Revenue
Source Fund
Low and Moderate Income
Housing Asset Fund
Nonmajor governmental
funds
Total governmental
funds
Unassigned
Operating and capital contingency 61,957,482$ — — — 61,957,482
Unrealized gain (loss) 347,226 — — — 347,226
Economic uncertainty 9,700,000 — — — 9,700,000
Other unassigned 3,000,000 — — (3,571,636) (571,636)
Total unassigned 75,004,708$ — — (3,571,636) 71,433,072
68

(14) COMMITMENTS AND CONTINGENCIES Litigation In the case of Pico Neighborhood Association, et al. v. City of Santa Monica, on February 13, 2019, the trial court issued its judgment in favor of plaintiffs and against the City of Santa Monica. The City appealed on February 22, 2019. On March 27, 2019, the appeals court granted the City’s writ, issuing an order confirming that the judgment would be stayed pending appeal. On May 6, 2019, the appeals court granted the City’s request for calendar preference, ordering that the appeal shall be conducted according to a schedule that allows the Court to issue a decision on or before July 10, 2020. If the court of appeals’ decision leaves the Plaintiffs prevailing parties, they would have the ability to recover reasonable attorneys’ fees and litigation expenses. Plaintiffs have filed in the trial court motions seeking approximately $22 million in attorneys’ fees and litigation expenses. The trial court has scheduled hearings on these motions to occur in September 2020, after the date on which the appeals court is expected to issue its decision. The City has reserved an amount it reasonably believes sufficient to cover any award of attorneys’ fees and expenses. Airport
On October 31, 2013, the City filed suit against the Federal Aviation Administration (FAA) regarding the City’s desire to cease aviation activity at the airport. In dispute was whether a reverter clause in an Instrument of Transfer from 1948 obligated the City to use the land as an airport in perpetuity and if the City attempted to change its use, the land would revert to the federal government. Additionally, the City accepted several federal grants to fund improvements at the Airport and outside aviation interests contended that the City’s grant obligations required the Airport to operate until 2023, instead of 2014, which was twenty years after the acceptance of the City's last federal grant, and this too resulted in a federal court lawsuit. On January 28, 2017, the City reached an agreement with the FAA which included the following:
• Closure of the Santa Monica Airport to all aeronautical use forever can occur after December 31, 2028 • Reduction of the operational runway length to 3,500 feet • U.S. Government acknowledgement that the City has the right to establish its own proprietary fixed
base operation services • Airport property released from all federal grant assurance obligations • Consent decree • Settles all legal disputes between the City and the federal government about the Airport
The City complete the shortening of the runway through markings and lights in FY 17-18, and completed the removal of runway and taxiway pavement rendered unnecessary by the shortening in FY 18-19. On November 18, 2019, the Federal Aviation Administration issued a Director’s Determination in Mark Smith, et al., v. City of Santa Monica, FAA Docket No. 16-16-02, an administrative action brought pursuant to 15 C.F.R. Part 16 against the City as sponsor of the Santa Monica City Airport. Among other things, the Director’s Determination finds that certain loans made by the City to the Airport were “insufficiently and improperly documented as such and fail to satisfy the requirements of loans” under the FAA’s Revenue Use
69
Policy. As a result, the Director’s Determination finds: “Improper interest payments charged to the Airport Fund made after February 5, 2010 totaling $454,292 and $383,173 and the principal overpayment of $188,873 must be credited back to the Airport Fund, plus interest from the date of the improper withdrawals or payments.” The Director’s Determination also requires the City to reduce the interest rate on other loans made by the City to the Airport to no more than “the rate which the City received for other investments” when the loans were issued. The City is determining whether to appeal the Director’s Determination. If the City does not appeal, the City’s General Fund has the ability to credit back the required amounts to the Airport Fund, and the City does not expect the required reduction in interest charged on the loans to have a material effect on General Fund revenues. Grants The City recognizes as revenue grant monies received as reimbursement for costs incurred in certain Federal and State programs it administers. Although the City’s Federal grant programs have been audited through June 30, 2018 in accordance with the Uniform Guidance requirements issued by the U.S. Office of Management and Budget, these programs may be subject to financial and compliance audits by the reimbursing agencies. The amount, if any, of expenditures, which may be disallowed by the granting agencies cannot be determined at this time, although the City expects such amounts, if any, to be immaterial. Construction Commitments The City has a number of construction projects currently underway. Purchase orders, contracts and other commitments for these projects are recorded in order to reserve the portion of the applicable appropriation and are segregated at year-end as an unavailable fund balance. Approximately $71.0 million will be payable upon future performance under these contracts. Other Commitments In 1999 the City entered into a thirty year agreement with the City of Los Angeles for the conveyance, treatment, and disposal of wastewater. The Amalgamated System Sewerage System Charge (ASSSC) from this agreement is based on the City of Los Angeles’ estimated costs and actual flows and strengths of wastewater in 2018-19. Per the City of Los Angeles, as of June 30, 2019 $7.38 million will be due under this agreement for fiscal year 2019-20. This agreement may be renegotiated by either party after the initial 10 years of the agreement. On June 29, 2018, the City transferred ownership of the Mountain View Mobile Home Park to the Caritas Corporation (Caritas), a 501(c)3 non-profit, for $1. As part of the terms of the sale, Caritas agreed to maintain affordability and resident protections and the City will provide a loan commitment up to $500,000 to cover operating expense overages for the next five years at $100,000 per year.
70

Encumbrances The City uses “encumbrances” to control expenditure commitments for the year. Encumbrances represent commitments related to contracts not yet performed and purchase orders not yet filled. Commitments for such expenditures are encumbered to reserve applicable appropriations. As of June 30, 2019 total encumbrances for the governmental funds are reported as follows:
Operating Lease Revenue/Expenses The City has entered into operating lease arrangements as lessor for property. The following schedule is an analysis of the City’s investment in property under operating leases by major classes as of June 30, 2019:
Land 102,952,014$ Buildings 34,890,734 Improvements other than buildings 4,811,845 Machinery and equipment 1,782,774 Infrastructure 8,213,438
152,650,805 Less: Accumulated depreciation (35,793,260)
Total 116,857,545$
General Fund 117,351,717$ Special Revenue Fund 799,589 Low and Moderate Income Housing Asset Fund — Nonmajor governmental funds 9,581,054
Total 127,732,360$
71

The following is a schedule of both future minimum lease rental revenue to be received by the City as lessor and lease payments to be made by the City as lessee under operating leases that have initial or remaining noncancelable lease terms in excess of one year as of June 30, 2019:
Fiscal year ending June 30 Rental revenue Lease payments
2020 17,115,232$ 2,284,706 2021 16,390,024 232,674 2022 15,171,792 20,385 2023 11,895,095 - 2024 11,263,063 - 2025 - 2029 36,139,853 - 2030 - 2034 16,530,238 - 2035 - 2039 8,879,263 - 2040 - 2044 6,919,241 - 2045 - 2049 5,421,600 - 2050 - 2054 4,490,634 - 2055 - 2059 4,490,634 - 2060 - 2064 4,490,634 - 2065 - 2069 1,842,659 - 2070 - 2074 960,000 - 2075 - 2079 672,000 - Total 162,671,962$ 2,537,765
The total long-term lease annual rental revenues and expenditures/expenses for the year ended June 30, 2019, were $17,230,868 and $2,284,706 respectively.
72

(15) SELF-INSURANCE The City is exposed to various risks of loss related to torts; theft of, damage to, and destruction of assets; errors and omissions; injuries to employees and others; and natural disasters. The City has chosen to establish risk financing internal service funds where assets are set aside for claim settlements associated with such risks of loss up to certain limits and has obtained excess liability coverage through the Authority for California Cities Excess Liability (ACCEL), a joint powers authority of twelve medium-size California municipalities. ACCEL is a member of the California State Association of Counties Excess Insurance Authority for the purpose of providing access to excess workers’ compensation coverage for major employee injury risks through a program of pooled self-insurance/re-insurance and insurance on a risk sharing basis.
The City retains self-insurance up to $1,000,000 for general liability, automobile liability, and bus operations liability. The ACCEL pool covers all general liability losses between $1,000,000 and $5,000,000, and purchases excess liability insurance to cover losses over $5,000,000 and up to $200,000,000. The City shares limits with two other cities within ACCEL to cover losses between $100,000,000 and $150,000,000 and one other city within ACCEL to cover losses over $150,000,000 to $200,000,000. The City retains self-insurance up to $750,000 for workers’ compensation. California State Association of Counties Excess Insurance Authority covers up to an additional $4,250,000 for workers’ compensation and arranges for excess of workers’ compensation over $5,000,000 and up to statutory limits. No claim settlements have exceeded insurance coverage in any of the past three years.
In order to provide funds to pay claims, ACCEL collects premiums from each member. The premiums paid are credited with investment income at the rate earning on the Authority’s investments. Based on ACCEL’s June 30, 2019 audited financial statements, the net reserves amounts related to the City were $3,091,193 (26% of ACCEL’s total net reserves and incurred but not reported). Total assets of ACCEL at June 30, 2019 were $47,057,137. ACCEL has no capital contributions.
The City’s unpaid claims liabilities are based on the results of actuarial studies. The unpaid claims liabilities are compiled by the Risk Manager of the City and include amounts for claims incurred but not reported as of year-end. Claims liabilities are calculated considering the effects of inflation, recent claim settlement trends including frequency and amount of payouts and other economic and social factors. Net present values of the unpaid claims liabilities are estimated for the year ended June 30, 2019, based on interest rates of 2.0% for general, automobile, and transit and 5.0% for workers’ compensation. Revenues of the risk management funds, together with funds to be provided in the future, are expected to provide adequate resources to meet liabilities as they come due. Non-incremental claims expenses have not been included as part of the liability for claims.
73

Changes in the liability for claims during the past two fiscal years for the self-insurance funds follow:
Fund (by fiscal year)Beginning of
year
Current-year claims and changes in estimates
Claims payments (net) End of year
Due within one year
June 30, 2018:Governmental activities:
General Liability and Automobile 9,635,579$ 6,191,837 (7,483,995) 8,343,421 3,868,093 Workers' Compensation 43,329,075 12,889,435 (9,742,278) 46,476,232 9,990,088
Total Governmental activities 52,964,654$ 19,081,272 (17,226,273) 54,819,653 13,858,181
Business-type activities:Bus 7,137,294$ 648,111 (1,547,187) 6,238,218 2,914,162
Total Business-type activities 7,137,294$ 648,111 (1,547,187) 6,238,218 2,914,162
June 30, 2019:Governmental activities:
General Liability and Automobile 8,343,421$ 6,017,447 (2,179,896) 12,180,972 5,627,694 Workers' Compensation 46,476,232 15,261,133 (10,509,250) 51,228,115 11,063,388
54,819,653$ 21,278,580 (12,689,146) 63,409,087 16,691,082
Business-type activities:Bus 6,238,218$ 1,198,740 (341,211) 7,095,747 3,840,574
Total Business-type activities 6,238,218$ 1,198,740 (341,211) 7,095,747 3,840,574
74

(16) EMPLOYEE BENEFIT PROGRAMS Santa Monica Public Employees’ Retirement Plan General Information about the Pension Plan The City’s defined benefit pension plan, Santa Monica Public Employees’ Retirement Plan (Plan) provides retirement and disability benefits, annual cost-of living adjustments, and death benefits to plan members and beneficiaries. The Plan is part of the Public Agency portion of the California Public Employees’ Retirement System (CalPERS), an agent multiple-employer plan administered by CalPERS, which acts as a common investment and administrative agent for participating public employers within the State of California. State statutes within the Public Employees’ Retirement Law establish a menu of benefit provisions as well as other requirements. The City selects optional benefit provisions from the benefit menu by contract with CalPERS and adopts those benefits through City resolution. CalPERS issues a separate comprehensive annual financial report available from the CalPERS Executive Office, 400 Q Street, Sacramento, California 95811.
Plan Description
All full-time employees of the City and part-time employees who have worked over 1,000 hours during a fiscal year are eligible to participate in either one of the Safety Plans (Police and Fire) or the Miscellaneous Plan (all others). The City is authorized by statute to establish and amend all plan provisions. Related benefits vest after five years of service. Upon five years of service, employees who retire are entitled to receive an annual retirement benefit according to the following Plan provision chart for each employee group:
Hire DatePrior to
July 1, 2012
Between July 1, 2012 and
December 31, 2012 On or after
January 1, 2013Benefit formula 2.70% @ 55 2.00% @ 55 2.00% @ 62Benefit vesting schedule 5 years service 5 years service 5 years serviceBenefits payments monthly for life monthly for life monthly for lifeRetirement age 50-55 50-62 52-67Monthly benefits, as a % of eligible compensation 2.0% to 2.7% 1.43% to 2.42% 1.00% to 2.50%Cost of living adjustment 2.00% 2.00% 2.00%Required employee contribution rate 8.00% 7.00% 6.25%Required employer contribution rate 21.33% 21.33% 21.33%
Miscellaneous
75

As of June 30, 2019, the City had 2,303 active members of which 1,397 were considered “classic” members (hired prior to 12/31/2012) and 906 fall under the decreased benefits as prescribed in the Public Employees Pension Reform Act of 2012 (PEPRA). As noted in the table above, Safety PEPRA members pay a higher employee contribution which, by law, cannot be paid by the employer. Additionally, PEPRA employees have a higher eligible retirement age and a lower benefit. For FY 2017-18, CalPERS changed payment for the employer paid amortization of the unfunded pension liability from using a level percentage of pay to a flat dollar amount. In FY 2018-19, the City paid CalPERS $17,270,221, $8,365,070 and $3,937,262 for the employer paid amortization of the unfunded liability for the miscellaneous, police and fire plans respectively. In addition, the City paid $1.3 million beyond the actuarially determined contribution. Funding Policy Section 20814(c) of the California Public Employees’ Retirement Law requires that the employer contribution rates for all public employers be determined on an annual basis by the actuary and shall be effective on the July 1 following notice of a change in the rate. Funding contributions for the Plans are determined annually on an actuarial basis as of June 30 by CalPERS.
Hire DatePrior to
December 31, 2012On or after
January 1, 2013Benefit formula 3.00% @ 55 2.70% @ 57Benefit vesting schedule 5 years service 5 years serviceBenefits payments monthly for life monthly for lifeRetirement age 50-55 50-57Monthly benefits, as a % of eligible compensation 2.40% - 3.00% 2.00% - 2.70%Cost of living adjustment 2.00% 2.00%Required employee contribution rate 9.00% 9.50%Required employer contribution rate 39.71% 39.71%
Fire
Hire DatePrior to
December 31, 2012On or after
January 1, 2013Benefit formula 3.00% @ 50 2.70% @ 57Benefit vesting schedule 5 years service 5 years serviceBenefits payments monthly for life monthly for lifeRetirement age 50 50-57Monthly benefits, as a % of eligible compensation 3.00% 2.00% - 2.70%Cost of living adjustment 2.00% 2.00%Required employee contribution rate 9.00% 11.25%Required employer contribution rate 48.49% 48.49%
Police
76

Active full-time members in the Plan are required to contribute 6.25% to 8.00% (for miscellaneous employees), 9.00% to 11.25% (for Police safety employees), and 9.00% to 9.5% (for Fire safety employees), of their annual covered salary. The City makes such employee contributions on behalf and for employees hired before July 1, 2012 for miscellaneous employees only. The City is required to contribute the actuarially determined remaining amounts necessary to fund the benefits for its members earned during the year with an additional amount to amortize the unfunded accrued liability. The City is required to contribute the difference between the actuarially determined rate and the contribution rate of employees. The actuarial methods and assumptions used are those adopted by the CalPERS Board of Administration. The contribution requirements of the plan members are established by State statute and the employer contribution rate is established and may be amended by CalPERS. Miscellaneous members hired prior to July 1, 2012 reimburse the City for the cost of an enhanced benefit at a rate of 6.7%. Police safety employees hired prior to July 1, 2012 reimburse the City at a rate of 6.5% during FY 2017-18 and 7.5% during FY 2018-19 and fire safety employees reimburse the City at a rate of 4.0% during FY 2017-18 and 5.0% during FY 2018-19. Employee reimbursements totaled $11,687,459 in FY 2018-19. Employees Covered At June 30, 2017, the following employees were covered by the benefit terms for each Plan:
Employees Miscellaneous Police FireInactive employees or their beneficiaries currently receiving benefits 1,290 317 143Inactive employees entitled to but not yet receiving benefits 219 8 3Active members 1,909 207 116 Total 3,418 532 262
Note: Information derived from 2017 CalPERS Census Data
Public Safety
Net Pension Liability The City’s net pension liability for each Plan is measured as the total pension liability, less the pension plan’s fiduciary net position. The total pension liability of each of the Plans is measured as of June 30, 2018, using an annual actuarial valuation as of June 30, 2017 rolled forward to June 30, 2018 using standard update procedures. A summary of principal assumptions and methods used to determine the net pension liability is shown below.
77

Actuarial Methods and Assumptions Used to Determine Total Pension Liability For the measurement period ending June 30, 2018 (the measurement date), the total pension liability was determined using the following actuarial methods and assumptions:
The underlying mortality assumptions and all other actuarial assumptions used in the June 30, 2017 valuation were based on the results of an actuarial experience study for the period 1997 to 2015, including updates to salary increase, mortality and retirement rates. The Experience Study report may be accessed on the CalPERS website at www.calpers.ca.gov under “Forms and Publications.” Change in assumption In 2018, demographic assumptions and inflation rates were changed in accordance with the CalPERS Experience Study and Review of Actuarial Assumptions December 2017. There were no changes to the discount rate in 2018. Discount Rate The discount rate used to measure the total pension liability was 7.15% for each Plan. To determine whether the municipal bond rate should be used in the calculation of a discount rate for each plan, CalPERS stress tested plans that would most likely result in a discount rate that would be different from the actuarially assumed discount rate. Based on the testing, none of the tested plans run out of assets. Therefore, the current 7.15% discount rate is adequate, and the use of the municipal bond rate calculation is not necessary. The long-term expected discount rate of 7.15% will be applied to all plans in the Public Employees Retirement Fund (PERF). The stress test results are presented in a detailed report called “GASB Crossover Testing Report” that can be obtained at the CalPERS website under the GASB 68 section.
Miscellaneous Safety - Police Safety - FireValuation date June 30, 2017 June 30, 2017 June 30, 2017Measurement date June 30, 2018 June 30, 2018 June 30, 2018Actuarial cost methodActuarial assumptions: Discount rate 7.15% 7.15% 7.15% Inflation 2.50% 2.50% 2.50% Projected salary increase Investment rate of return 1 7.15% 7.15% 7.15% Mortality 2
Post retirement benefit increase
1 Net of pension plan investment expenses, including inflation. 7.0% after 0.15% administrative costs.2 The mortality table used was developed based on CalPERS-specific data. The table includes 15 years
of mortality improvements using Society of Actuaries 90% Scale MP 2016. For more details on this table,
please refer to the December 2017 Experience Study report (based on CalPERS demographic data
from 1997 to 2015 that can be found on the CalPERS website.
Entry-Age Normal
Varies by entry age and service
Derived using CalPERS' membership data for all fundsContract COLA up to 2.00% until Purchasing Power ProtectionsAllowance Floor on Purchasing Power applies, 2.50% therafter
78

The long-term expected rate of return on pension plan investments was determined using a building-block method in which best-estimate ranges of expected future real rates of return (expected returns net of pension plan investment expense and inflation) are developed for each major asset class.
In determining the long-term expected rate of return, both short- and long-term market return expectations were considered by CalPERS as well as the expected pension fund cash flows. Such cash flows were developed assuming that both members and employers will make their required contributions on time and as scheduled in all future years. Using historical returns of all the funds’ asset classes, expected compound (geometric) returns were calculated over the short-term (first 10 years) and the long-term (11-60 years) using a building-block approach. Using the expected nominal returns for both short-term and long-term, the present value of benefits was calculated for each fund. The expected rate of return was set by calculating the single equivalent expected return that arrived at the same present value of benefits for cash flows as the one calculated using both short-term and long-term returns. The expected rate of return was then set equivalent to the single equivalent rate calculated above and rounded down to the nearest one quarter of one percent.
The table below reflects long-term expected real rate of return by asset class. The rate of return was calculated using the capital market assumptions applied to determine the discount rate and asset allocation. The target allocation shown was adopted by the Board effective July 1, 2014. These geometric rates of return are net of administrative expenses.
Asset Class 1Current Target
Allocation %Real Return %
Years 1 - 10 Real Return %
Years 11+Global equity 50.00 4.80 5.98Fixed income 28.00 1.00 2.62Inflation assets - 0.77 1.81Private equity 8.00 6.30 7.23Real assets 13.00 3.75 4.93Liquidity 1.00 - (0.92)Total 100.001 In the System's CAFR, Fixed Income is included in the Global Debt Securities; liquidity is included in the Short-term Investments; Inflation Assets expected inflation of 2.50% used for this period included in both Global Equity Securities and Global Debt Securities.
Recognition of Gains and Losses
Under GASB 68, gains and losses related to changes in total pension liability and fiduciary net position are recognized in pension expense systematically over time. The first amortized amounts are recognized in pension expense for the year the gain or loss occurs. The remaining amounts are categorized as deferred outflows and deferred inflows of resources related to pensions and are to be recognized in future pension expense.
79

The amortization period differs depending on the source of the gain or loss:
Difference between projected and 5 year straight-line amortization actual earnings on investments
All other amounts Straight-line amortization over the expected average remaining service lives of all members that are provided benefits (active, inactive, and retired) as of the beginning of the measurement period
The expected average remaining service lifetime (EARSL) is calculated by dividing the total future service years by the total number of plan participants (active, inactive, and retired). Note that inactive employees and retirees have remaining service lifetimes equal to 0. Also note that total future service is based on members’ probability of decrementing due to an event other than receiving a cash refund.
80

Changes in Net Pension Liability The following tables display the changes in net pension liability recognized over the measurement period for each of the City’s Plans:
Miscellaneous:Total Pension
LiabilityPlan Fiduciary Net Position
Net Pension Liability/(Asset)
(a) (b) (c)=(a)-(b)Balance at 6/30/2017 (VD)1 1,095,335,870$ 829,912,035 265,423,835 Changes recognized for the measurement period
Service cost 27,141,560 — 27,141,560Interest on total pension liability 76,677,361 — 76,677,361Changes of assumptions (8,896,401) — (8,896,401)Differences between expected and actual experience (5,319,485) — (5,319,485)Plan to plan resource movement — (2,066) 2,066Contribution - employer — 29,338,109 (29,338,109)Contribution - employee — 11,221,260 (11,221,260)Net investment income — 70,094,677 (70,094,677)Benefit payments, includes employee contribution refunds (44,560,263) (44,560,263) — Administrative expense — (1,293,232) 1,293,232 Other Miscellaneous Income(Expense) 3 — (2,455,869) 2,455,869
Net changes 45,042,772 62,342,616 (17,299,844) Balance at 6/30/2018 (MD)2 1,140,378,642$ 892,254,651 248,123,991 1 VD = Valuation Date2 MD = Measurement Date
Increase (Decrease)
3 During Fiscal Year 2017-18, as a result of Governmental Accounting Standards Board (GASB) Statement No. 75, Accounting and Financial Report for Post Employment Benefit Plans other than Pensions (GASB75), CalPERS reported its proportionate share of activity related to post employment benefit plans for participation in the State of California's agent OPEB plan. Accordingly, CalPERS reported a one-time expense as a result of the adoption of GASB 75.
Additionally, CalPERS employees participate in various State of California agent pension plans and during Fiscal Year 2017-18, CalPERS recorded a correction to previously report financial statements to properly reflect its proportionate share of activity realted to pensions in accordnace with GASB 68, Accounting and Financial Reporting for Pensions (GASB 68).
81

Public Safety - Police:Total Pension
LiabilityPlan Fiduciary Net
PositionNet Pension
Liability/(Asset)(a) (b) (c)=(a)-(b)
Balance at 6/30/2017 (VD)1 460,413,681$ 332,325,615 128,088,066 Changes recognized for the measurement period
Service cost 10,217,345 — 10,217,345 Interest on total pension liability 32,412,581 — 32,412,581 Changes of assumptions (2,129,031) — (2,129,031) Differences between expected and actual experience 587,060 — 587,060 Plan to plan resource movement — (823) 823 Contribution - employer — 13,774,479 (13,774,479) Contribution - employee — 3,021,783 (3,021,783) Net investment income — 28,113,907 (28,113,907) Benefit payments, includes employee contribution refunds (21,315,119) (21,315,119) — Administrative expense — (517,855) 517,855 Other Miscellaneous Income(Expense) 3 — (983,415) 983,415
Net changes 19,772,836 22,092,957 (2,320,121) Balance at 6/30/2018 (MD)2 480,186,517$ 354,418,572 125,767,945 1 VD = Valuation Date2 MD = Measurement Date
Increase (Decrease)
3 During Fiscal Year 2017-18, as a result of Governmental Accounting Standards Board (GASB) Statement No. 75, Accounting and Financial Report for Post Employment Benefit Plans other than Pensions (GASB75), CalPERS reported its proportionate share of activity related to post employment benefit plans for participation in the State of California's agent OPEB plan. Accordingly, CalPERS reported a one-time expense as a result of the adoption of GASB 75.
Additionally, CalPERS employees participate in various State of California agent pension plans and during Fiscal Year 2017-18, CalPERS recorded a correction to previously report financial statements to properly reflect its proportionate share of activity realted to pensions in accordnace with GASB 68, Accounting and Financial Reporting for Pensions (GASB 68).
82

Public Safety - Fire:Total Pension
LiabilityPlan Fiduciary Net Position
Net Pension Liability/(Asset)
(a) (b) (c)=(a)-(b)Balance at 6/30/2017 (VD)1 238,799,314$ 165,491,653 73,307,661 Changes recognized for the measurement period
Service cost 4,738,879 — 4,738,879 Interest on total pension liability 16,808,267 — 16,808,267 Changes of assumptions (1,206,898) — (1,206,898) Differences between expected and actual experience 1,380,602 — 1,380,602 Net plan to plan resource movement (405) 405 Contribution - employer — 6,276,049 (6,276,049) Contribution - employee — 1,661,415 (1,661,415) Net investment income — 13,896,417 (13,896,417) Benefit payments, includes employee contribution refunds (12,523,618) (12,523,618) — Administrative expense — (257,882) 257,882 Other Miscellaneous Income(Expense) 3 — (489,721) 489,721
Net changes 9,197,232 8,562,255 634,977 Balance at 6/30/2018 (MD)2 247,996,546$ 174,053,908 73,942,638 1 VD = Valuation Date2 MD = Measurement Date
Increase (Decrease)
3 During Fiscal Year 2017-18, as a result of Governmental Accounting Standards Board (GASB) Statement No. 75, Accounting and Financial Report for Post Employment Benefit Plans other than Pensions (GASB75), CalPERS reported its proportionate share of activity related to post employment benefit plans for participation in the State of California's agent OPEB plan. Accordingly, CalPERS reported a one-time expense as a result of the adoption of GASB 75.
Additionally, CalPERS employees participate in various State of California agent pension plans and during Fiscal Year 2017-18, CalPERS recorded a correction to previously report financial statements to properly reflect its proportionate share of activity realted to pensions in accordnace with GASB 68, Accounting and Financial Reporting for Pensions (GASB 68).
83

Sensitivity of the Net Pension Liability to Changes in the Discount Rate The following presents the net pension liability of the Plans as of the Measurement Date, calculated using the discount rate of 7.15% (7.0% after 0.15% administrative costs), as well as the net pension liability if it were calculated using a discount rate that is 1 percentage-point lower (6.15%) or 1 percentage-point higher (8.15%) than the current rate (all rates are gross of 0.15% administrative cost):
Discount RateMiscellaneous Safety - Police Safety - Fire
1% Decrease 6.15% 6.15% 6.15%Net Pension Liability 404,284,094$ 192,282,564 106,842,076
Current Discount Rate 7.15% 7.15% 7.15%Net Pension Liability 248,123,991$ 125,767,945 73,942,638
1% Increase 8.15% 8.15% 8.15%Net Pension Liability 119,057,655$ 71,279,674 46,805,959
Plan
Pension Plan Fiduciary Net Position Detailed information about each pension plan’s fiduciary net position is available in the separately issued CalPERS financial report.
84

Pension Expense, Deferred Outflows and Deferred Inflows of Resources Related to Pensions For the year ended June 30, 2019, the City recognized pension expense as follows:
PlanPension Expense
Miscellaneous 34,633,834$ Safety - Police 21,109,536Safety - Fire 9,326,943Total 65,070,313$
As of June 30, 2019, the City had deferred outflows and deferred inflows of resources related to pensions as follows:
The amounts above are net of outflows and inflows recognized in the pension expense for the fiscal year ended June 30, 2019.
Deferred Outflows of Resources
Deferred Inflows of Resources
Deferred Outflows of Resources
Deferred Inflows of Resources
Deferred Outflows of Resources
Deferred Inflows of Resources
Changes of assumptions 30,329,256 $ (6,726,547) 11,366,451 (1,520,736) 8,497,590 (2,008,635)Difference between expected and actual experience — (12,994,127) 419,329 (1,502,484) 1,157,924 (2,129,921)Net difference between projected and actual earnings on pension plan investments 869,220 — 464,043 — 436,630 — Employer contributions subsequent to the measurement date 32,912,563 — 15,924,164 — 7,211,427 — Total 64,111,039$ (19,720,674) 28,173,987 (3,023,220) 17,303,571 (4,138,556)
Miscellaneous Safety - Police Safety - Fire
85

Contributions of $56,048,154 that were made by the City subsequent to the measurement date are reported as deferred outflows of resources and will be recognized as a reduction of the net pension liability in the fiscal year ended June 30, 2020. Other amounts reported as deferred outflows and inflows of resources will be recognized in future pension expense as follows:
Deferred Compensation Plans The City offers to its employees an optional deferred compensation plan created in accordance with Section 457 of the Internal Revenue Code. This plan is available to substantially all employees and allows participants to defer a portion of their current income until future years to shelter such funds and earnings from state and federal taxation until withdrawal. The deferred compensation is not available to participants until termination, retirement, death or unforeseeable emergency. For the fiscal year ended June 30, 2019 the total employee contributions were $12,013,472. The City offers an employer discretionary, defined contribution plan established and governed under Internal Revenue Code Section 401(a). Employee-only contributions are calculated based upon a percentage of employee compensation under agreements with employee bargaining groups and unions. For the fiscal year ended June 30, 2019 the total employee contributions were $827,472. The City offers to its as-needed employees a separate Section 457 deferred compensation plan under the Omnibus Budget Reconciliation Act (OBRA). This plan is available to all as-needed employees who are not eligible to participate in CalPERS. This plan requires equal employer and employee contributions based on a percentage of earnings. For the fiscal year ended June 30, 2019 the combined employee/employer contributions were $426,733. These plans are administered through third-party administrators. The City does not perform the investing function and has no fiduciary accountability for the plans. Thus, plan assets and any related liabilities to plan participants have been excluded from the City’s basic financial statements.
Measurement Periodsended June 30 Miscellaneous Safety - Police Safety - Fire
2019 16,331,116$ 9,959,807 3,048,707 2020 9,435,170 3,717,992 1,802,857 2021 (11,706,552) (3,528,968) 176,626 2022 (2,581,932) (922,228) 891,779 2023 — — 28,017
Thereafter — — 5,602
Deferred Outflows / (Inflows) of Resources
86

Other Postemployment Benefits In addition to providing pension benefits through CalPERS, the City, in accordance with agreements with various bargaining units and groups, provides medical insurance benefits that are considered other postemployment benefits (OPEB) to certain retired employees under a single employer benefit plan. These benefits are subject to negotiations between the City and each bargaining unit and the related memorandum of understanding (MOU) is approved by the City Council. Employees of the Executive Pay Plan group and management employees of the Rent Control Board are eligible for a City paid medical insurance benefit if their combined retirement age and years of City service equals or exceeds 70. Under the terms of a MOU between the City and a coalition of the various non-sworn bargaining units (Coalition), all non-sworn permanent retirees are allowed to continue participating in one of the City’s health plans at the same rate as active employees. As with other MOU’s, this benefit is subject to bargaining between the City and the Coalition. The City also maintains minimum benefits for public safety employees provided by the City’s contract with its healthcare provider CalPERS. The City pays for OPEB through employer only contributions to a qualified OPEB trust, with no contribution required from employees. The Plan does not issue a stand-alone financial statement. Employees Covered As of the June 30, 2017 actuarial valuation date, the following current and former employees were covered by the benefit terms under the OPEB plan: Active employees 2,137 Inactive employees or beneficiaries receiving benefits 218 Inactive employees entitled to, but not receiving benefits 116
Total 2,471 Contributions
The OPEB Plan and its contribution requirements are established by Memorandum of Understanding with the applicable employee bargaining units and may be amended by agreements between the City and these bargaining units. The annual contribution is based on the actuarially determined contribution. For the fiscal year ended June 30, 2019, the City’s cash contributions were $3,047,011 in payments to a CalPERS CERBT trust.
87

Net OPEB Liability
The City’s net OPEB liability was measured as of June 30, 2018 and the total OPEB liability used to calculate the net OPEB liability was determined by actuarial valuation dated June 30, 2017 based on the following assumptions:
Actuarial Assumptions:
Discount rate 6.30%Inflation 2.75%Salary increases
Investment rate of return 6.30%Mortality rate
Pre-retirement Turnover
Healthcare Trend Rate 7.50% decreasing to 5.00%
Mortality rates used were those published by CalPERS, adjusted to back out 20 years of Scale BB central year 2008, then projected on a generational basis using the MacLeod Watts Scale 2017.Assumed rates of termination vary based on the current age, service and employee type (fire, police or miscellaneous) as developed by CalPERS and published in their January 2014 Experience Study Report.
3.25% per year , used only to allocate the costs between service years.
88

The long-term expected rate of return on OPEB plan investments was determined using a building block method in which future real rates of return (expected returns, net of OPEB plan investment expense and inflation) are developed for each major asset class. These ranges are combined to produce the long-term expected rate of return by weighing the expected future real rates of return by the target asset allocation percentage and by adding expected inflation. The target allocation and best estimates of arithmetic real rates for each major asset class are summarized in the following table:
Asset ClassTarget
Allocation
Long-term expected real rate of return
Global equity 40% 5.98%Fixed Income 43% 2.62%Global real estate 8% 5.00%Treasury Inflation Protected Securities 5% 1.46%Commodities 4% 2.87%
Discount Rate The discount rate used to measure the OPEB liability was 6.3%. The projection of cash flows used to determine the discount rate assumed that the City contributions will be made at rates equal to the actuarially determined contribution rates. Based on those assumptions, the OPEB plan’s fiduciary net position was projected to be available to make all projected OPEB payments for current active and inactive employees and beneficiaries. Therefore, the long-term expected rate of return on OPEB plan investments was applied to all periods of projected benefit payments to determine the total OPEB liability.
89

Changes in OPEB liability The changes in the net OPEB liability for the Plan are as follows:
Total OPEB Liability
Fiduciary Net Position Net OPEB Liability
(a) (b) (c)=(a)-(b)Balance at 6/30/2017 30,382,130$ 4,006,539 26,375,591 Changes recognized for the measurement period
Service cost 1,073,506 — 1,073,506 Interest on total OPEB liability 2,064,073 — 2,064,073 Changes of assumptions 1,443,660 — 1,443,660 Contribution - employer — 3,011,934 (3,011,934) Net investment income — 412,595 (412,595) Benefit payments (1,571,807) (1,571,807) — Administrative expense — (3,600) 3,600 Other expenses — (5,303) 5,303
Net changes 3,009,432 1,843,819 1,165,613 Balance at 6/30/2018 33,391,562$ 5,850,358 27,541,204
Increase (Decrease)
The majority of benefit payments, $1,153,435, and employer contributions, $2,220,030, satisfy the cost of the implicit rate subsidies. Sensitivity of the Net OPEB Liability to Changes in the Discount Rate The following presents the net OPEB liability of the City if it were calculated using a discount rate that is one percentage point lower or one percentage point higher than the current rate, for the measurement period ended June 30, 2018:
1% Decrease (5.3%)
Current Discount Rate
(6.3%)1% Increase
(7.3%)Net OPEB Liability 31,341,892$ 27,541,204 24,339,290
90

Sensitivity of the Net OPEB Liability to Changes in Health Care Cost Trend Rates The following presents the net OPEB liability of the City if it were calculated using health care cost trend rates that are one percentage point lower or one percentage point higher than the current rate, for measurement period ended June 30, 2018.
1% Decrease (6.5% decreasing
to 4.0%)
Current Healthcare Cost
Trend Rates (7.5% decreasing
to 5.0%)
1% Increase (8.5% decreasing
to 6.0%) Net OPEB Liability 23,106,975$ 27,541,204 33,726,899
OPEB Plan Fiduciary Net Position CalPERS issues publicly available financial statement for the California Employers’ Retiree Benefit Trust that may be obtained from CalPERS, 400 Q Street, Sacramento, CA 95811 or at www.calpers.ca.gov. Recognition of Deferred Outflows and Deferred Inflows of Resources Gains and losses related to changes in total OPEB liability and fiduciary net position are recognized in OPEB expense systematically over time. Amounts are first recognized in OPEB expense for the year the gain or loss occurs. The remaining amounts are categorized as deferred outflows and deferred inflows of resources related to OPEB and are recognized in future OPEB expense. The recognition period differs depending on the source of gain or loss:
Net difference between projected and 5 year straight-line amortization actual earnings on investments
All other amounts Straight-line amortization over the expected average remaining service lives of all members that are provided benefits (active, inactive, and retired) as of the beginning of the measurement period (9.0 years for June 30, 2018)
91

OPEB Expense and Deferred Outflows/Inflows of Resources Related to OPEB
For the fiscal year ended June 30, 2019 the City recognized OPEB expense of $2,782,963. As of fiscal year ended June 30, 2019, the City reported deferred outflows/inflows of resources related to OPEB from the following sources:
Deferred Outflows of Resources
Deferred Inflows of Resources
Changes in assumption $ 1,283,253 249,859 Differences between expected and actual experience - 905,916 Net difference between projected and actual earnings on investments - 142,002 OPEB contributions subsequent to measurement date 3,047,011 -
$ 4,330,264 1,297,777
The $3,047,011 reported as deferred outflows of resources related to contributions subsequent to the June 30, 2018 measurement date will be recognized as a reduction of the net OPEB liability during the fiscal year ending June 30, 2020. Other amounts reported as deferred inflows of resources related to OPEB will be recognized as expense as follows:
Fiscal Year Ending June
30
Recognized Deferred
Outflows(Inflows) of Resources
2020 (45,718)$ 2021 (45,718) 2022 (45,717) 2023 (23,661) 2024 (4,703)
Thereafter 150,993
In prior years, pension and OPEB liabilities have been extinguished primarily by the General Fund.
92

Medical Trusts The City contributes, consistent with bargaining unit agreements, monies to medical trusts, a defined contribution plan that provide postemployment medical benefits to employees. The amount of benefits provided to employees under these plans is limited solely to the amount contributed (determined by negotiations between the various bargaining groups and the City) related investment earnings, and forfeitures. For the fiscal year ended June 30, 2019 the City contributed $4,148,834 towards the retiree medical trusts. These are administered through third-party administrators and the City does not perform the investing function or have other significant responsibility relating to the management of plan assets. Thus, plan assets and any related liabilities have been excluded from the City’s basic financial statements.
93

(17) SUCCESSOR AGENCY TRUST FUND FOR ASSETS OF FORMER REDEVELOPMENT AGENCY On December 29, 2011, the California Supreme Court upheld AB 1X26 (“the Bill”) that provides for the dissolution of all redevelopment agencies in the State of California. This action impacted the reporting entity of the City of Santa Monica that previously reported a redevelopment agency as a blended component unit.
The Bill provides that upon dissolution of a redevelopment agency (RDA), either the sponsoring city or another unit of local government will agree to serve as the “successor agency” to hold the former RDA’s non-housing assets until they are distributed to other units of state and local government and all enforceable obligations have been paid. In accordance with the Bill, the successor agency is a separate legal entity from the sponsoring city or other local government unit. The Bill also provides for the transfer of the former RDA's housing assets to the City, acting in its municipal capacity.
On January 10, 2012, the City Council elected to become the Successor Agency for the Redevelopment Agency of the City of Santa Monica in accordance with the Bill as part of City resolution number 10647. In accordance with the timeline set forth in the Bill (as modified by the California Supreme Court on December 29, 2011) all redevelopment agencies in the State of California were dissolved and ceased to operate as a legal entity as of February 1, 2012. The assets and activities of the dissolved redevelopment agency are reported in a private-purpose trust fund in the financial statements of the City.
Cash and Investments Cash and investments as of June 30, 2019 are classified in the accompanying financial statements as follows:
Statement of Fiduciary Net Position:
Restricted cash and investments $ 20,156,779 Restricted cash and investments with fiscal agent 6,985,359
Total cash and investments $ 27,142,138
Investments of the Successor Agency are governed by Government Code Section 53601 and the City’s Investment Policy, which restrict the term and types of investments that can be made. See Note 5. Fair Value Hierarchy The Successor Agency categorizes its fair value measurements within the fair value hierarchy established by generally accepted accounting principles. The hierarchy is based on the valuation inputs used to measure the fair value of the asset. Level 1 inputs are quoted prices in active markets for identical assets; Level 2 inputs are significant other observable inputs; Level 3 inputs are significant unobservable inputs. As of June 30, 2019, the Successor Agency had $6,985,359 (invested in money market mutual funds) classified in Level 1 of the fair value hierarchy valued using prices quoted in active markets for those securities.
94

Investments Not Measured at Fair Value The Successor Agency holds $846 in the Local Agency Investment Fund which is not measured at fair value. Investments Authorized by Debt Agreements Investment of debt proceeds held by bond trustees are governed by provisions of the debt agreements, rather than the general provisions of the California Government Code or the Successor Agency’s investment policy. The table below identifies the investment types that are authorized for investments held by the bond trustee. The table also identifies certain provisions of these debt agreements that address interest rate risk and concentration of credit risk.
Maximum MaximumMaximum Percentage InvestmentMaturity Allowed in One Issuer
U.S Treasury Obligations None None NoneFederal Housing Administration Debentures None None NoneU.S. Agency Securities None None NoneTime Deposits None None NoneUnsecured Certificates of Deposit 180 days None NoneBanker's Acceptances 180 days None NoneState Obligations None None NoneRepurchase Agreements 1 year None NonePre-refunded Municipal Obligations None None NoneCommercial Paper 270 days None NoneMoney Market Mutual Funds None None NoneInvestment Contracts 30 years None None
Authorized Investment Type
95

Disclosures Relating to Interest Rate Risk Interest rate risk is the risk that changes in market interest rates will adversely affect the fair value of an investment. Generally, the longer the maturity of an investment, the greater the sensitivity of its fair value to changes in market interest rates. The primary way the Successor Agency manages its exposure to interest rate risk is by keeping funds in very liquid vehicles such as money market mutual funds and demand deposit accounts providing the cash flow and liquidity needed for operations. Information about the sensitivity of the fair values of the Successor Agency’s investments held by bond trustee to market interest rate fluctuations is provided by the following table that shows the distribution of these investments by maturity.
Disclosures Relating to Credit Risk Generally, credit risk is the risk that an issuer of an investment will not fulfill its obligation to the holder of the investment. This is measured by the assignment of a rating by a nationally recognized statistical rating organization. Presented below is the minimum rating required by (where applicable) the California Government Code, the City’s investment policy, or debt agreements, and the actual rating as of year-end for each investment type.
Minimum Legal
Total Rating AAAm Not ratedHeld by City
State Investment Pool $ 846 N/A - 846 Held by bond trustee:
Money market mutual funds 6,985,359 AAAm 6,985,359 - Total $ 6,986,205 6,985,359 846
Investment Type
Concentration of Credit Risk No investments in any one issuer (other than U.S. Treasury securities, mutual funds, and investment pools) represent 5% or more of total investments.
Custodial Credit Risk The Successor Agency does not have separate certificates of deposit or demand accounts held by bond trustee that have disclosable custodial credit risk (as defined by GASB Statement No. 40). For the investments held by bond trustee, the bond trustee selects the investment under the terms of the applicable trust agreement and under the direction of reporting agency, acquires the investment, and holds the investment on behalf of the
12 Months or less
Held by CityState Investment Pool 846$
Held by bond trustee:Money market mutual funds 6,985,359
Total 6,986,205$
Investment Type
96

reporting agency.
SUCCESSOR AGENCY LONG-TERM LIABILITIES
Changes in long-term liabilities:
Long-term liability activity for the fiscal year ended June 30, 2019 was as follows:
Balance a t
J une 30, 2018 Additio ns Reductio ns
Balance a t
J une 30, 2019
Due within
o ne year
Due beyo nd
o ne year
Lo ans and no tes payable
fro m direc t bo rro wings 39,145,469$ — 631,088 38,514,381 674,118 37,840,263
Term lo an fro m direc t bo rro wings 31,818,176 — 3,030,306 28,787,870 3,030,303 25,757,567
Tax a llo catio n bo nds 81,400,000 — 2,625,000 78,775,000 2,730,000 76,045,000
No tes payable to the City o f
Santa Mo nica (1) 25,710,220 — 15,668,648 10,041,572 7,693,325 2,348,247
Les s deferred amo unts :
Fo r is s uance dis co unts (88,918) — (8,083) (80,835) — (80,835)
Fo r is s uance premiums 314,090 — 13,654 300,436 — 300,436
To ta l lo ans , no tes and bo nds payable 178,299,037$ — 21,960,613 156,338,424 14,127,746 142,210,678 (1) The original note agreements called for any accrued interest to be added to the principal balance to create a new principal balance. SB 107
requires that interest be calculated at a simple 3% and is not included in the principal balance. The restatement removes the accrued interest
from this table.
A summary of long-term bonds and loans outstanding at year-end is as follows:
Date of issue Original issue
Final
maturity
date
Interest
rate
Balance at
June 30, 2019
Tax allocation bonds:
Earthquake Recovery Project 2011 * June 7, 2011 41,050,000$ July 1, 2042 5.00-5.875% 41,050,000$
Earthquake Recovery Project Refunding 2006 * April 27, 2006 64,720,000 July 1, 2029 4.00-5.50% 37,725,000
Subtotal tax allocation bonds 78,775,000
Loans and notes from direct borrowings:
Bank of America Term Loan (1) * May 1, 2008 50,000,000 July 15, 2028 LIBOR plus 1.25% 28,787,870
Promissory note to the City of Santa Monica (2) Oct 24, 1978 4,400,000 June 29, 2028 3.00% 2,429,447
Promissory note to the City of Santa Monica (3) Jan 9, 2003 38,930,000 Jan 1, 2021 3.00 % 2,952,725
Promissory note to the City of Santa Monica (3) Jan 9, 2003 21,070,000 Jan 1, 2022 3.00 % 4,659,400
Promissory notes payable to others(3)* Nov 1, 2010 42,500,000 Jan 1, 2042 6.82% 38,514,381
Subtotal loans and notes 77,343,823
Total 156,118,823$
*Final and conclusive determination received from the Department of Finance
Revisions to the Health and Safety Code changed the interest rate on all City Agency Loans to a simple 3%
(1) To fund low moderate income housing projects (2) For project area costs including the purchase of land and other capital assets.
(3) For purchase of real estate
97
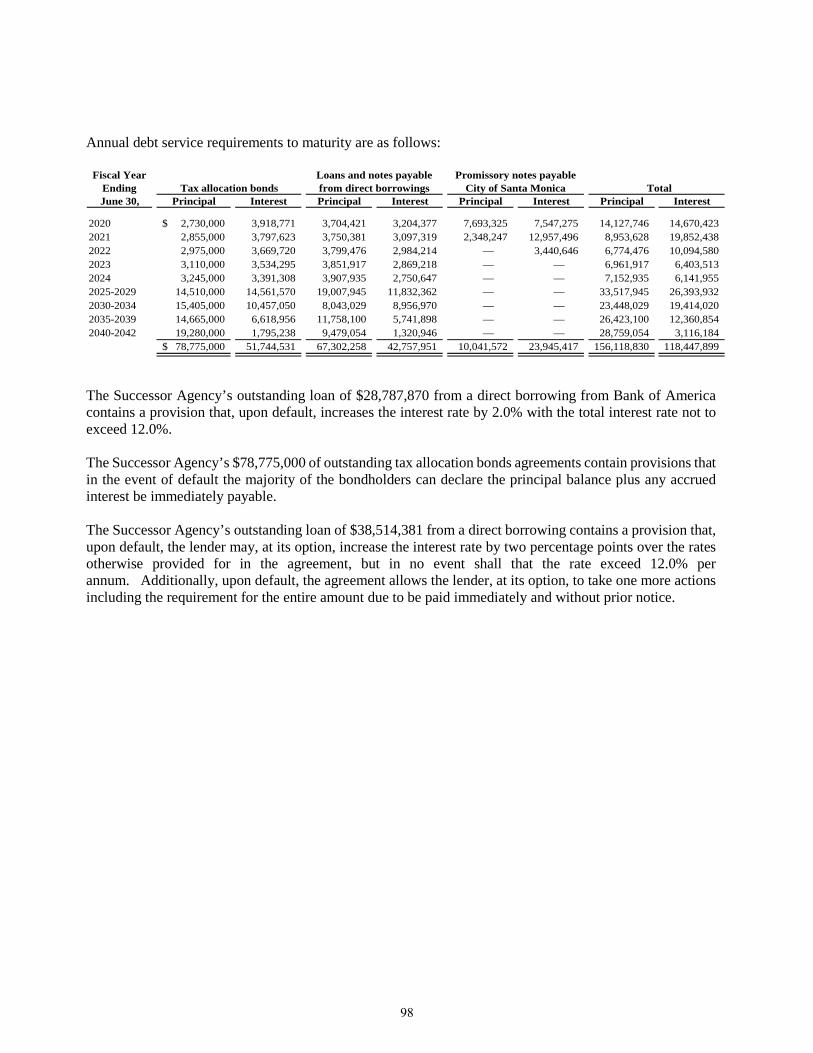
Annual debt service requirements to maturity are as follows:
Fiscal Year EndingJune 30, Principal Interest Principal Interest Principal Interest Principal Interest
2020 2,730,000$ 3,918,771 3,704,421 3,204,377 7,693,325 7,547,275 14,127,746 14,670,423 2021 2,855,000 3,797,623 3,750,381 3,097,319 2,348,247 12,957,496 8,953,628 19,852,438 2022 2,975,000 3,669,720 3,799,476 2,984,214 — 3,440,646 6,774,476 10,094,580 2023 3,110,000 3,534,295 3,851,917 2,869,218 — — 6,961,917 6,403,513 2024 3,245,000 3,391,308 3,907,935 2,750,647 — — 7,152,935 6,141,955 2025-2029 14,510,000 14,561,570 19,007,945 11,832,362 — — 33,517,945 26,393,932 2030-2034 15,405,000 10,457,050 8,043,029 8,956,970 — — 23,448,029 19,414,020 2035-2039 14,665,000 6,618,956 11,758,100 5,741,898 — — 26,423,100 12,360,854 2040-2042 19,280,000 1,795,238 9,479,054 1,320,946 — — 28,759,054 3,116,184
78,775,000$ 51,744,531 67,302,258 42,757,951 10,041,572 23,945,417 156,118,830 118,447,899
Loans and notes payable from direct borrowings TotalTax allocation bonds
Promissory notes payable City of Santa Monica
The Successor Agency’s outstanding loan of $28,787,870 from a direct borrowing from Bank of America contains a provision that, upon default, increases the interest rate by 2.0% with the total interest rate not to exceed 12.0%. The Successor Agency’s $78,775,000 of outstanding tax allocation bonds agreements contain provisions that in the event of default the majority of the bondholders can declare the principal balance plus any accrued interest be immediately payable. The Successor Agency’s outstanding loan of $38,514,381 from a direct borrowing contains a provision that, upon default, the lender may, at its option, increase the interest rate by two percentage points over the rates otherwise provided for in the agreement, but in no event shall that the rate exceed 12.0% per annum. Additionally, upon default, the agreement allows the lender, at its option, to take one more actions including the requirement for the entire amount due to be paid immediately and without prior notice.
98

Pledged Revenue The Former Redevelopment Agency had a number of debt issues that were assumed by the Successor Agency that involve the pledging of revenues. The amounts and terms of the remainder of these commitments and the purposes for which the proceeds of the debt issuances are utilized are indicated in the summary of long-term bonds and loans and notes outstanding at year-end presented in this note. AB1X26 only allows sufficient tax revenues to be allocated to the Successor Agency in an amount equal to pay debt service that is deemed to be an enforceable obligation and debt service payments as a percentage of the pledged gross revenue (net of certain expenses where so specified in debt covenants) will always be 100%. These percentages also approximate the relationship of debt service to pledged revenue for the remainder of the term of the commitment.
Annual amount of pledged revenue (net of expenses, where
required)
Annual debt service payments (of all
debt secured by this revenue)
Debt service as a percentage of
pledged revenue
Future amount of pledged
revenue Description of pledged revenue/debt:
Tax incrementEarthquake Recovery Project Refunding 2006 4,445,054$ 4,445,054$ 100% 44,484,916$ Earthquake Recovery Project 2011 2,262,413 2,262,413 100% 81,315,881 Note Payable to Others 3,300,000 3,300,000 100% 78,300,000 Bank of America Term Loan 4,208,628 4,208,628 100% 29,950,376
99

(18) PRIOR PERIOD ADJUSTMENT The accompanying financial statements reflects an adjustment resulting from a restatement of net position as
of June 30, 2019 as follows:
Restatement on Government-wide Statements:
Business Type Activities
Beginning Net Position, as previously reported 597,372,456$ Restatement
Grant revenue incorrectly recognized (1,483,998) Beginning Net Position, as restated 595,888,458$
Restatement on Fund Statements, Proprietary Funds:
Big Blue BusFund
Beginning Net Position, as previously reported 204,944,425$ Restatement
Grant revenue incorrectly recognized (1,483,998) Beginning Net Position, as restated 203,460,427$
100

(19) SPECIAL ITEMS Special items are unusual and infrequent in nature but within the control of management. The following transactions are reported as special items:
• The Water Fund assumed the pollution remediation obligation from the General Fund which resulted in a special item in the Water Fund of $21,327,312.
101

(20) RELATED PARTY TRANSACTIONS The following related party transactions took place during FY 2018-19:
• Assistant City Manager/Chief Operating Officer’s husband is the President and CEO of Chrysalis (non-profit). The City hires Chrysalis clients for temporary work. During Fiscal 2018-19, the City paid Chrysalis $624,951.
• A newly elected council member owns a restaurant that leases property on the Pier. The lease was in place prior to the council member being elected. During Fiscal 2018-19, the restaurant paid the City $400,975.
102

City of Santa Monica, California
Year Ended June 30, 2019
REQUIRED SUPPLEMENTARY INFORMATION
103

CITY OF SANTA MONICA, CALIFORNIASchedule of Revenues, Expenditures and Changes in
Fund Balance - Budget and ActualGeneral Fund
For the fiscal year ended June 30, 2019
Originalbudget
Finalbudget
Actual,GAAP basis Encumbrance
Actual,budgetary
basisVariance withfinal budget
Revenues:Property taxes $ 61,937,045 61,523,006 62,615,270 - 62,615,270 1,092,264Sales and use taxes 69,066,000 70,120,000 73,709,191 - 73,709,191 3,589,191Transient occupancy taxes 60,600,000 61,900,000 60,762,881 - 60,762,881 (1,137,119)Utility user taxes 29,567,000 29,661,000 28,306,582 - 28,306,582 (1,354,418)Business license taxes 31,756,000 31,400,000 31,947,056 - 31,947,056 547,056Other taxes 18,622,000 19,585,000 22,576,476 - 22,576,476 2,991,476Licenses and permits 44,336,334 46,077,034 44,987,628 - 44,987,628 (1,089,406)Intergovernmental 1,394,203 1,394,203 1,860,596 - 1,860,596 466,393Charges for services 46,763,608 46,013,681 45,279,116 - 45,279,116 (734,565)Fines and forfeitures 16,245,989 15,845,989 14,877,572 - 14,877,572 (968,417)Investment income 6,500,000 7,400,000 15,284,964 - 15,284,964 7,884,964Rental income 7,709,843 7,709,843 7,561,578 - 7,561,578 (148,265)Settlement income 3,670,000 3,670,000 - - - (3,670,000)Other revenue 5,297,778 5,281,673 6,220,509 - 6,220,509 938,836
Total revenues 403,465,800 407,581,429 415,989,419 - 415,989,419 8,407,990Expenditures:
General government:City council 994,452 1,534,525 936,979 75,500 1,012,479 522,046City manager 6,851,439 7,379,539 7,235,119 294,737 7,529,856 (150,317)Record and election services 3,186,330 3,592,433 3,312,296 52,887 3,365,183 227,250Finance 15,542,552 14,590,084 13,436,221 791,600 14,227,821 362,263City attorney 11,853,352 17,532,671 17,195,925 1 17,195,926 336,745Human resources 5,108,180 5,304,749 5,171,360 21,002 5,192,362 112,387Information services 9,071,766 9,321,022 9,222,387 63,876 9,286,263 34,759Public Works 4,345,216 6,973,081 4,288,421 2,082,866 6,371,287 601,794Other 7,399,764 9,383,452 6,032,180 378,077 6,410,257 2,973,195Capital improvement 47,287,202 136,448,374 34,953,987 84,358,291 119,312,278 17,136,096
Total general government 111,640,253 212,059,930 101,784,875 88,118,837 189,903,712 22,156,218Public safety:
City Manager 5,650,908 5,718,973 5,486,128 76,848 5,562,976 155,997Police 90,177,571 94,167,032 96,011,374 128,606 96,139,980 (1,972,948)Fire 42,940,435 43,265,464 45,038,326 209,601 45,247,927 (1,982,463)Capital improvement 4,621,000 54,193,446 21,071,876 17,601,416 38,673,292 15,520,154
143,389,914 197,344,915 167,607,704 18,016,471 185,624,175 11,720,740Total public safety
See accompanying notes to required supplementary information (Continued)
104

CITY OF SANTA MONICA, CALIFORNIASchedule of Revenues, Expenditures and Changes in
Fund Balance - Budget and ActualGeneral Fund
For the fiscal year ended June 30, 2019
Originalbudget
Finalbudget
Actual,GAAP basis Encumbrance
Actual,budgetary
basisVariance withfinal budget
General services:Planning and community development $ 14,072,733 15,737,199 15,957,164 2,474 15,959,638 (222,439)Public works 45,910,371 47,244,050 45,342,248 50,462 45,392,710 1,851,340Capital improvement 5,268,450 28,332,362 8,426,887 6,964,236 15,391,123 12,941,239
Total general services 65,251,554 91,313,611 69,726,299 7,017,172 76,743,471 14,570,140Cultural and recreational services:
Community and cultural services 28,559,790 30,026,437 28,977,931 477,592 29,455,523 570,914Other 25,224,168 25,517,668 26,304,000 - 26,304,000 (786,332)Capital improvement 9,046,399 19,369,276 4,089,748 877,380 4,967,128 14,402,148
Total cultural and recreational services 62,830,357 74,913,381 59,371,679 1,354,972 60,726,651 14,186,730
Library:Library 13,376,418 13,626,708 13,390,314 52,576 13,442,890 183,818Capital improvement 350,000 758,760 238,095 116,974 355,069 403,691
Total library 13,726,418 14,385,468 13,628,409 169,550 13,797,959 587,509
Housing and community development:Planning and community development 22,219,097 23,732,878 21,455,885 1,132,964 22,588,849 1,144,029Housing and economic development 9,282,442 11,519,849 8,199,763 1,541,751 9,741,514 1,778,335Other - 452,934 57,006 - 57,006 395,928Capital improvement - 500,000 59,263 - 59,263 440,737
Total housing and community development 31,501,539 36,205,661 29,771,917 2,674,715 32,446,632 3,759,029
Bond issuance costs 2,991,600 2,991,600 4,025 - 4,025 2,987,575
Total expenditures 431,331,635 629,214,566 441,894,908 117,351,717 559,246,625 69,967,941Excess (deficiency) of revenues over (under) expenditures (27,865,835) (221,633,137) (25,905,489) (117,351,717) (143,257,206) 78,375,931
Other financing sources (uses):Transfers in 11,157,848 11,157,848 9,082,615 - 9,082,615 (2,075,233)Transfers out (20,061,996) (75,094,795) (78,309,472) - (78,309,472) (3,214,677)
(8,904,148) (63,936,947) (69,226,857) - (69,226,857) (5,289,910)
(36,769,983) (285,570,084) (95,132,346) (117,351,717) (212,484,063) 73,086,021
435,811,126 435,811,126 435,811,126 - 435,811,126 -
$ 399,041,143 150,241,042 340,678,780 (117,351,717) 223,327,063 73,086,021
Total other financing sources (uses)
Net change in fund balance
Fund balance at beginning of year
Fund balance at end of year
See accompanying notes to required supplementary information
105

CITY OF SANTA MONICA, CALIFORNIASchedule of Revenues, Expenditures and Changes in
Fund Balance - Budget and ActualLow and Moderate Income Housing Asset Special Revenue Fund
For the fiscal year ended June 30, 2019
Originalbudget
Finalbudget
Actual,GAAP basis Encumbrance
Actual,budgetary
basisVariance withfinal budget
Revenues:Investment income $ 100,000 100,000 277,697 - 277,697 177,697Other 600,000 600,000 291,448 - 291,448 (308,552)
Total revenues 700,000 700,000 569,145 - 569,145 (130,855)Expenditures:
Housing and community development:Other - 187,605 187,603 - 187,603 2
Total housing and community development - 187,605 187,603 - 187,603 2Total expenditures - 187,605 187,603 - 187,603 2Excess (deficiency) of revenues over (under) expenditures 700,000 512,395 381,542 - 381,542 (130,853)
Other financing sources (uses):Transfers in 2,841,138 3,133,730 3,133,730 - 3,133,730 -
Total other financing sources (uses) 2,841,138 3,133,730 3,133,730 - 3,133,730 -
3,541,138 3,646,125 3,515,272 - 3,515,272 (130,853)
56,121,719 56,121,719 56,121,719 - 56,121,719 -
$ 59,662,857 59,767,844 59,636,991 - 59,636,991 (130,853)
Net change in fund balance
Fund balance at beginning of year
Fund balance at end of year
See accompanying notes to required supplementary information
106

BUDGETARY AND LEGAL COMPLIANCE
The City Council is required to adopt an annual budget resolution by June 30 each fiscal year for the General Fund, each special revenue fund and each capital projects fund, except the Rent Control Fund and the Asset Seizure Fund. The legal level of budgetary control is the department level. The City Council also approves annual operating budgets for the City’s proprietary and internal service funds to facilitate management evaluation and control.
The budget is prepared on a non-GAAP budgetary basis, which considers encumbrances outstanding at year-end as an expenditure of that year. Encumbrances outstanding at the beginning of a fiscal year, which were recognized as budgetary expenditures in the prior year, are recognized as GAAP-basis expenditures but not as budgetary expenditures unless re-appropriated. It is the City’s policy to only re-appropriate capital encumbrances and unencumbered balances of specific capital appropriations. Appropriations in governmental funds outstanding at year-end lapse, except for encumbered amounts, for which fund balances are restricted, committed or assigned at year-end for governmental funds.
The actual results of operations on a budgetary basis compared to the appropriations adopted by the City Council for budgeted major governmental funds are presented as required supplementary information. The comparisons of actual results with the budget for nonmajor funds are presented as supplementary information in the combining schedules.
For the fiscal year ended June 30, 2019, expenditures exceeded appropriations in the General Fund. The Police and Fire departments were over budget due to overtime. Police Department overtime reflects the continuing impact of Proposition 47, a 14% increase in arrests requiring officers to appear in court outside of their patrol duty, time required to transition a number of newly-hired officers in training to the Police force, and coverage for personnel who are recovering from injuries. The Fire Department exceeded its budget due to mutual aid strike team deployments for which the City was fully reimbursed, and unbudgeted expenses for a recruitment academy and a pilot program focusing on the City’s homeless population.
107

Total Pension Liability 2019 2018 2017 2016 2015
Service Cost 27,141,560$ 27,164,949 24,044,347 23,584,538 24,972,667
Interest on the total pension liability 76,677,361 73,555,405 70,686,179 67,091,447 63,926,580
Changes in assumptions (8,896,401) 62,254,788 - (16,726,947) -
Difference between expected and actual experience (5,319,485) (14,768,176) (7,701,743) (12,672,814) -
Benefit payments, including refunds of employee
contributions (44,560,263) (41,097,884) (36,967,774) (35,460,612) (32,834,279)
Net change in total pension liability 45,042,772 107,109,082 50,061,009 25,815,612 56,064,968
Total pension liability - beginning 1,095,335,870 988,226,788 938,165,779 912,350,167 856,285,199
Total pension liability - ending (a) 1,140,378,642$ 1,095,335,870 988,226,788 938,165,779 912,350,167
Plan fiduciary net position
Contribution - employer 29,338,109$ 56,350,053 28,154,218 28,349,184 27,433,064
Contribution - employee 11,221,260 11,398,672 11,256,065 10,754,206 11,418,160
Net investment income 70,094,677 82,395,628 3,759,440 15,956,734 104,724,175
Benefit payments (44,560,263) (41,097,884) (36,967,774) (35,460,612) (32,834,279)
Plan to plan resource movement (2,066) (61,526) (767) (909) -
Administrative expense (1,293,232) (1,065,974) (436,504) (806,463) -
Other Miscellaneous Income (Expense) (2,455,869) - - - -
Net change in plan fiduciary - net position 62,342,616 107,918,969 5,764,678 18,792,140 110,741,120
Plan fiduciary net position - beginning 829,912,035 721,993,066 716,228,388 697,436,244 586,695,124
Plan fiduciary net position - ending (b) 892,254,651 829,912,035 721,993,066 716,228,384 697,436,244
Net pension liability - ending (a)-(b) 248,123,991$ 265,423,835 266,233,722 221,937,395 214,913,922
Plan fiduciary net position as a percentage of the
total pension liability 78.24% 75.77% 73.06% 76.34% 76.44%
Covered payroll 149,416,791$ 147,371,283 142,942,436 137,199,170 138,199,596
Net pension liability as a percentage of covered-
employee payroll 166.06% 180.11% 186.25% 161.76% 155.51%
1Fiscal year 2015 was first year of implementation, therefore only five years are shown.
Notes to Schedule:
Benefit Changes: There were no changes in benefits.
CITY OF SANTA MONICA, CALIFORNIA
Required Supplementary Information
Schedule of Changes in the Net Pension Liability and Related Ratios Miscellaneous Plan
Last Five Fiscal Years (Unaudited) 1
Changes of Assumptions:
In 2018, demographic assumptions and inflation rate were changed in accordance to the CalPERS Experience Study and Review of Actuarial Assumptions December
2017. There were no changes in the discount rate.
In 2017, the discount rate was reduced from 7.65% to 7.15%.
In 2016, there were no changes.
In 2015, amounts reported reflect an adjustment of the discount rate from 7.5% (net of administrative expense) to 7.65% (without a reduction for pension plan
administrative expense).
108

2019 2018 2017 2016 2015
Total Pension Liability
Service Cost 10,217,345$ 9,940,041 8,471,379 8,324,522 8,493,146
Interest on the total pension liability 32,412,581 31,045,060 29,901,653 28,537,027 27,132,667
Changes in assumptions (2,129,031) 26,521,719 - (7,150,335) -
Difference between expected and actual experience 587,060 (3,121,761) (1,152,112) (501,077) -
Benefit payments, including refunds of employee
contributions (21,315,119) (19,596,092) (18,767,835) (17,121,429) (16,130,411)
Net change in total pension liability 19,772,836 44,788,967 18,453,085 12,088,708 19,495,402
Total pension liability - beginning 460,413,681 415,624,714 397,171,629 385,082,921 365,587,519
Total pension liability - ending (a) 480,186,517$ 460,413,681 415,624,714 397,171,629 385,082,921
Plan fiduciary net position
Contribution - employer 13,774,479$ 26,559,693 12,697,470 13,033,273 12,515,162
Contribution - employee 3,021,783 2,827,317 2,753,594 2,695,506 3,372,358
Net investment income 28,113,907 32,951,701 1,516,091 6,513,781 43,315,499
Benefit payments (21,315,119) (19,596,092) (18,767,835) (17,121,429) (16,130,411)
Plan to plan resource movement (823) 61,526 767 - -
Administrative expense (517,855) (428,091) (177,915) (328,610) -
Other Miscellaneous Income (Expense) (983,415) - - - -
Net change in plan fiduciary - net position 22,092,957 42,376,054 (1,977,828) 4,792,521 43,072,608
Plan fiduciary net position - beginning 332,325,615 289,949,561 291,927,389 287,134,868 244,062,260
Plan fiduciary net position - ending (b) 354,418,572 332,325,615 289,949,561 291,927,389 287,134,868
Net pension liability - ending (a)-(b) 125,767,945$ 128,088,066 125,675,153 105,244,240 97,948,053
Plan fiduciary net position as a percentage of the
total pension liability 73.81% 72.18% 69.76% 73.50% 74.56%
Covered payroll 31,769,364$ 30,592,273 29,176,438 28,791,622 28,470,873
Net pension liability as a percentage of covered-
employee payroll 395.88% 418.69% 430.74% 365.54% 344.03%
1Fiscal year 2015 was first year of implementation, therefore only five years are shown.
Notes to Schedule:
Benefit Changes: There were no changes in benefits.
CITY OF SANTA MONICA, CALIFORNIA
Required Supplementary Information
Schedule of Changes in the Net Pension Liability and Related Ratios Police Safety Plan
Last Five Fiscal Years (Unaudited) 1
Changes of Assumptions:
In 2018, demographic assumptions and inflation rate were changed in accordance to the CalPERS Experience Study and Review of Actuarial Assumptions December
2017. There were no changes in the discount rate.
In 2017, the discount rate was reduced from 7.65% to 7.15%.
In 2016, there were no changes.
In 2015, amounts reported reflect an adjustment of the discount rate from 7.5% (net of administrative expense) to 7.65% (without a reduction for pension plan
administrative expense).
109

2019 2018 2017 2016 2015
Total Pension Liability
Service Cost 4,738,879$ 4,623,044 3,778,677 3,766,398 3,975,757
Interest on the total pension liability 16,808,267 16,174,733 15,730,320 15,338,448 14,735,448
Changes in assumptions (1,206,898) 13,218,472 - (3,653,466) -
Difference between expected and actual experience 1,380,602 (943,161) (2,919,523) (515,792) -
Benefit payments, including refunds of employee
contributions (12,523,618) (11,813,956) (11,409,171) (10,728,684) (10,085,994)
Net change in total pension liability 9,197,232 21,259,132 5,180,303 4,206,904 8,625,211
Total pension liability - beginning 238,799,314 217,540,182 212,359,879 208,152,975 199,527,764
Total pension liability - ending (a) 247,996,546$ 238,799,314 217,540,182 212,359,879 208,152,975
Plan fiduciary net position
Contribution - employer 6,276,049$ 10,375,991 5,320,402 5,142,818 4,954,271
Contribution - employee 1,661,415 1,565,941 1,479,400 1,375,301 1,421,733
Net investment income 13,896,417 16,797,654 706,789 3,458,100 23,479,329
Benefit payments (12,523,618) (11,813,956) (11,409,171) (10,728,684) (10,085,994)
Plan to plan resource movement (405) - - - -
Administrative expense (257,882) (219,672) (93,112) (171,948) -
Other Miscellaneous Income (Expense) (489,721) - - - -
Net change in plan fiduciary - net position 8,562,255 16,705,958 (3,995,692) (924,413) 19,769,339
Plan fiduciary net position - beginning 165,491,653 148,785,695 152,781,387 153,705,800 133,936,461
Plan fiduciary net position - ending (b) 174,053,908 165,491,653 148,785,695 152,781,387 153,705,800
Net pension liability - ending (a)-(b) 73,942,638$ 73,307,661 68,754,487 59,578,492 54,447,175
Plan fiduciary net position as a percentage of the
total pension liability 70.18% 69.30% 68.39% 71.94% 73.84%
Covered payroll 17,748,610$ 16,861,345 15,701,959 15,565,558 15,733,733
Net pension liability as a percentage of covered-
employee payroll 416.61% 434.77% 437.87% 382.76% 346.05%
1Fiscal year 2015 was first year of implementation, therefore only five years are shown.
Notes to Schedule:
Benefit Changes: There were no changes in benefits.
CITY OF SANTA MONICA, CALIFORNIA
Required Supplementary Information
Schedule of Changes in the Net Pension Liability and Related Ratios Fire Safety Plan
Last Five Fiscal Years (Unaudited) 1
Changes of Assumptions:
In 2018, demographic assumptions and inflation rate were changed in accordance to the CalPERS Experience Study and Review of Actuarial Assumptions December
2017. There were no changes in the discount rate.
In 2017, the discount rate was reduced from 7.65% to 7.15%.
In 2016, there were no changes.
In 2015, amounts reported reflect an adjustment of the discount rate from 7.5% (net of administrative expense) to 7.65% (without a reduction for pension plan
administrative expense).
110

2019 2018 2017 2016 2015
Actuarially determined contribution 32,707,844$ 29,021,468 29,097,156 27,377,582 25,320,840
Contributions in relation to actuarially
determined contributions (32,912,563) (29,331,033) (56,352,251) (28,152,578) (28,349,184)
Contribution excess (204,719)$ (309,565) (27,255,095) (774,996) (3,028,344)
Covered payroll 151,403,970$ 149,416,791 147,371,283 142,942,436 137,199,170
Contributions as a percentage of covered- 21.74% 19.63% 38.24% 19.70% 20.66%
payroll
Notes to Schedule
Valuation date
Actuarial Cost Method Entry Age Normal
Amortization Method Level Percentage of Payroll
Asset Valuation Method Market Value
Inflation 2.75%
Salary increases
Payroll Growth 3.00%
Investments Rate of Return 7.50%
Retirement Age
Mortality
The probabilities of Retirement are based on the 2014 CalPERS
Experience Study for the period from 1997 to 2011
The probabilities of mortality are based on the 2014 CalPERS
Experience Study for the period from 1997 to 2011. Pre-retirement
and Post-retirement mortality rates include 20 years of projected
mortality improvement using Scale BB published by the Society of
Actuaries.
CITY OF SANTA MONICA, CALIFORNIA
Required Supplementary Information
Schedule of Contributions - Miscellaneous Pension Plan
Last Five Fiscal Years (Unaudited)
Actuarially determined contribution rates are calculated as of June
30, three years prior to the end of the fiscal year in which
contributions are reported.
Varies by entry age and service
111

2019 2018 2017 2016 2015
Actuarially determined contribution 15,428,327$ 13,453,498 13,559,983 12,327,896 11,589,142
Contributions in relation to actuarially
determined contributions (15,924,164) (13,773,882) (26,557,166) (12,697,470) (13,033,273)
Contribution excess (495,837)$ (320,384) (12,997,183) (369,574) (1,444,131)
Covered payroll 33,034,533$ 31,769,364 30,592,273 29,176,438 28,791,622
Contributions as a percentage of covered- 48.20% 43.36% 86.81% 43.52% 45.27%
payroll
Notes to Schedule
Valuation date
Actuarial Cost Method Entry Age Normal
Amortization Method Level Percentage of Payroll
Asset Valuation Method Market Value
Inflation 2.75%
Salary increases
Payroll Growth 3.00%
Investments Rate of Return 7.50%
Retirement Age
Mortality
The probabilities of Retirement are based on the 2014 CalPERS
Experience Study for the period from 1997 to 2011
The probabilities of mortality are based on the 2014 CalPERS
Experience Study for the period from 1997 to 2011. Pre-retirement
and Post-retirement mortality rates include 20 years of projected
mortality improvement using Scale BB published by the Society of
Actuaries.
CITY OF SANTA MONICA, CALIFORNIA
Required Supplementary Information
Schedule of Contributions - Safety Police Pension Plan
Last Five Fiscal Years (Unaudited)
Actuarially determined contribution rates are calculated as of June
30, three years prior to the end of the fiscal year in which
contributions are reported.
Varies by entry age and service
112

2019 2018 2017 2016 2015
Actuarially determined contribution 6,959,294$ 5,884,665 5,624,625 5,185,401 4,615,293
Contributions in relation to actuarially
determined contributions (7,211,427) (6,276,048) (10,372,347) (5,320,402) (5,142,818)
Contribution excess (252,133)$ (391,383) (4,747,722) (135,001) (527,525)
Covered payroll 18,577,401$ 17,748,610 16,861,345 15,701,959 15,565,558
Contributions as a percentage of covered 38.82% 35.36% 61.52% 33.88% 33.04%
payroll
Notes to Schedule
Valuation date
Actuarial Cost Method Entry Age Normal
Amortization Method Level Percentage of Payroll
Asset Valuation Method Market Value
Inflation 2.75%
Salary increases
Payroll Growth 3.00%
Investments Rate of Return 7.50%
Retirement Age
Mortality
The probabilities of Retirement are based on the 2014 CalPERS
Experience Study for the period from 1997 to 2011
The probabilities of mortality are based on the 2014 CalPERS
Experience Study for the period from 1997 to 2011. Pre-retirement
and Post-retirement mortality rates include 20 years of projected
mortality improvement using Scale BB published by the Society of
Actuaries.
CITY OF SANTA MONICA, CALIFORNIA
Required Supplementary Information
Schedule of Contributions - Safety Fire Pension Plan
Last Five Fiscal Years (Unaudited)
Actuarially determined contribution rates are calculated as of June 30,
three years prior to the end of the fiscal year in which contributions
are reported.
Varies by entry age and service
113

Fiscal Yearend FYE 2019 FYE 2018
Measurement Date 6/30/2018 6/30/2017
Total OPEB Liability
Service Cost 1,073,506$ 1,017,718
Interest on the total OPEB liability 2,064,073 2,063,748
Changes in assumptions 1,443,660 (321,247)
Difference between expected and actual experience - (1,164,748)
Benefit payments, including refunds of employee
contributions (1,571,807) (1,721,051)
Net change in total OPEB liability 3,009,432 (125,580)
Total OPEB liability - beginning 30,382,130 30,507,710
Total OPEB liability - ending (a) 33,391,562$ 30,382,130
Plan fiduciary net position
Contribution - employer 3,011,934$ 2,686,113
Net investment income 412,595 325,621
Benefit payments (1,571,807) (1,721,051)
Administrative expense (3,600) (2,680)
Other expenses (5,303) -
Net change in plan fiduciary - net position 1,843,819 1,288,003
Plan fiduciary net position - beginning 4,006,539 2,718,536
Plan fiduciary net position - ending (b) 5,850,358 4,006,539
Net OPEB liability - ending (a)-(b) 27,541,204$ 26,375,591
Plan fiduciary net position as a percentage of the
total OPEB liability 17.52% 13.19%
Covered employee payroll 216,623,938$ 206,778,649
Net OPEB liability as a percentage of covered
employee payroll 12.71% 12.76%
Notes to Schedule:
Benefit Changes: There were no changes in benefits.
Changes of Assumptions: There were no changes of assumptions.
1Fiscal year 2018 was first year of implementation, therefore only two years are shown. Historical information is required only for measurement periods for which
GASB 75 is applicable. Future years' information will be displayed up to 10 years as information becomes available.
CITY OF SANTA MONICA, CALIFORNIA
Required Supplementary Information
Schedule of Changes in the Net OPEB Liability and Related Ratios
Last Two Fiscal Years (Unaudited) 1
114

FYE 2019 FYE 2018
Actuarially determined contribution 2,727,622$ 2,645,395
Contributions in relation to actuarially
determined contributions 3,047,011 3,011,934
Contribution deficiency (excess) (319,389)$ (366,539)
Covered employee payroll 232,059,089$ 216,623,938
Contributions as a percentage of covered 1.31% 1.39%
employee payroll
Notes to Schedule
Valuation Date Used to Determine ADC 6/30/2017
Discount Rate Used to Determine ADC 6.73%
Actuarial Cost Method Entry Age Normal
Amortization Method Level Percentage of Payroll
Asset Valuation Method Market Value
Inflation 2.75%
Salary increases
Retirement Age
Mortality
Mortality Improvement
Healthcare Cost Trend Rate 7.5% in 2019 to 5.0% in steps of 0.5%
50 to 75
MacLeod Watts Scale 2017 applied generationally
CITY OF SANTA MONICA, CALIFORNIA
Required Supplementary Information
Schedule of Contributions OPEB
Last Two Fiscal Year (Unaudited)
3.25% per year, used only to allocate the cost of benefits between
service years
CalPERS 2014 Experience Study
115

City of Santa Monica, California
Year Ended June 30, 2019
SUPPLEMENTARY INFORMATION
116

Nonmajor Governmental Fund Financial Statements
Special Revenue Funds are used to account for specific revenue sources that are restricted or committed to expenditures for particular purposes. The nonmajor special revenue funds used in this report are listed below:
Beach Recreation Fund – To account for beach parking and concession revenues restricted or committed for expenditures related to beach maintenance and recreation activities.
Housing Authority Fund – To account for the receipt and expenditure of Federal and State funds related to housing programs.
Tenant Ownership Rights Charter Amendment (TORCA) Fund – To account for filing fee and conversion tax revenues and expenditures related to various housing programs authorized by Chapter XX of the City Charter.
Asset Seizure Fund – To account for the receipt and expenditure of equitable sharing program funds.
Citizens Option for Public Safety Fund – To account for the receipt and expenditure of the Citizens Option for Public Safety program established by AB3229 of 1996.
Rent Control Fund – To account for revenues and expenditures that are restricted or committed for rent control activities.
Gas Tax Fund – To account for State and County gasoline tax allocations and any Federal funds provided to the City for street-related purposes.
Local Return Fund – To account for State Grant activities including Proposition A and C.
Clean Beaches and Ocean Parcel Tax Fund – To account for activity related to implementation of Watershed Management Plan and the passage of Measure V in November 2006.
Community Development Block Grant (CDBG) Fund – To account for Federal entitlements under the Housing and Community Development Act of 1974, as amended. The City Council annually allocates CDBG funds to various programs.
Miscellaneous Grants Fund – To account for the receipt and expenditure of Federal, State and County awarded grants and special allocations provided to the City.
South Coast Air Quality Management District (SCAQMD) Fund – To account for the receipt and expenditure of Air Quality Management District funds.
Parks and Recreation Fund – To account for funds collected under the City's Unit Dwelling Tax. These funds are to be used for the acquisition, improvement and expansion of public parks, playgrounds and recreational facilities.
117

Debt Service Funds are used to accumulate resources that are restricted, committed, or assigned for, and the payment of, general long-term debt principal, interest and related costs. The debt service funds used by the City in this report are listed below:
Debt Service Fund – To account for accumulation of resources for, and the payment of, general long-term debt principal, interest and related costs for public facilities.
Permanent Funds are used to report resources that are legally restricted to the extent that only earnings, and not principal, may be used for restricted purposes. The specific permanent funds used by the City in this report are listed below:
Cemetery Perpetual Care Fund – To account for all funds received by the City from cemetery users for the perpetual care of the cemetery grounds.
Mausoleum Perpetual Care Fund – To account for all funds designated for perpetual care of the mausoleum located at the City cemetery.
118

CITY OF SANTA MONICA, CALIFORNIACombining Balance Sheet
Nonmajor Governmental FundsJune 30, 2019
Special Revenue Funds
BeachRecreation
HousingAuthority TORCA Asset Seizure
Citizens Optionfor Public Safety Rent Control
AssetsCash and investments $ 15,918,334 58,903 6,753,533 1,437,948 587,330 2,033,027Restricted cash and investments 45,565 87,264 - - - -Receivables (net, where applicable, of allowances for uncollectibles):
Accounts 503,007 5,996 - - - 81,055Notes - - 7,465,426 - - -Taxes - - - - - -Interest 72,947 - 26,252 4,987 1,902 12,554Other governments - 815,383 - - - -
Deposits - - - - - -Prepaids 889 17,601 - - - 32,752Restricted cash and investments with fiscal agent - - - - - -
Total assets $ 16,540,742 985,147 14,245,211 1,442,935 589,232 2,159,388
Liabilities, Deferred Inflows of Resources, and Fund Balances (deficit)Liabilities
Accounts payable $ 994,316 81,494 1,111 80,447 20,843 54,078Accrued liabilities 141,731 28,654 - - 2,136 98,333Contracts payable (retained percentage) 20,143 - - - - -Due to other funds - 803,584 - - - -Unearned revenue 447,347 - - - - 20,395Deposits payable 45,565 - - - - -Advances from other funds 3,842,973 - - - - 420,918
Total liabilities 5,492,075 913,732 1,111 80,447 22,979 593,724
Deferred inflows of resources - - - - - -
Fund balances (deficit)Nonspendable - 17,601 - - - 32,752Restricted 11,048,667 53,814 14,244,100 1,362,488 566,253 1,532,912Unassigned - - - - - -
Total fund balances 11,048,667 71,415 14,244,100 1,362,488 566,253 1,565,664
Total liabilities and fund balances $ 16,540,742 985,147 14,245,211 1,442,935 589,232 2,159,388
continued
119

CITY OF SANTA MONICA, CALIFORNIACombining Balance Sheet
Nonmajor Governmental FundsJune 30, 2019
Special Revenue Funds
Gas Tax Local Return
Clean Beachesand OceanParcel Tax
Community Development Block Grant
MiscellaneousGrants SCAQMD
AssetsCash and investments $ 1,945,197 - 9,438,202 - - 967,860Restricted cash and investments - 11,289,293 - 144,056 - -Receivables (net, where applicable, of allowances for uncollectibles):
Accounts 302,462 5,946 36,337 282,661 1,054,214 -Notes - - - 9,100,878 6,639,778 -Taxes - - 9,854 - - -Interest 7,125 37,132 35,302 1,064 1,452 2,817Other governments - - - - 2,235,899 31,076
Deposits - - - 3,257 - -Prepaids - - - - - -Restricted cash and investments with fiscal agent - - - - - -
Total assets $ 2,254,784 11,332,371 9,519,695 9,531,916 9,931,343 1,001,753
Liabilities, Deferred Inflows of Resources, and Fund Balances (deficit)Liabilities
Accounts payable $ 101 478,858 9,933 5,263 298,493 -Accrued liabilities - - 2 - 7,891 -Contracts payable (retained percentage) 937 114,660 6,400 44,865 121,204 -Due to other funds - - - 142,808 2,373,727 -Unearned revenue - - - - 59,449 -Deposits payable - - - - - -Advances from other funds - - - - - -
Total liabilities 1,038 593,518 16,335 192,936 2,860,764 -
Deferred inflows of resources - - - 282,661 2,086,159 -
Fund balances (deficit)Nonspendable - - - - - -Restricted 2,253,746 10,738,853 9,503,360 9,056,319 8,556,056 1,001,753Unassigned - - - - (3,571,636) -
Total fund balances 2,253,746 10,738,853 9,503,360 9,056,319 4,984,420 1,001,753
Total liabilities and fund balances $ 2,254,784 11,332,371 9,519,695 9,531,916 9,931,343 1,001,753
continued
120

CITY OF SANTA MONICA, CALIFORNIACombining Balance Sheet
Nonmajor Governmental FundsJune 30, 2019
Special RevenueFunds
Debt ServiceFund Permanent Funds
Parks andRecreation Debt Service
CemeteryPerpetual Care
MausoleumPerpetual Care
Total nonmajorgovernmental
funds
AssetsCash and investments $ 164,969 - 24,604 5,363 39,335,270Restricted cash and investments - - - - 11,566,178Receivables (net, where applicable, of allowances for uncollectibles):
Accounts - - 21,828 1,452 2,294,958Notes - - - - 23,206,082Taxes - - - - 9,854Interest 761 - 65,076 7,701 277,072Other governments - - - - 3,082,358
Deposits - - - - 3,257Prepaids - - - - 51,242Restricted cash and investments with fiscal agent - 5,048,924 12,220,102 1,467,657 18,736,683
Total assets $ 165,730 5,048,924 12,331,610 1,482,173 98,562,954
Liabilities, Deferred Inflows of Resources, and Fund Balances (deficit)Liabilities
Accounts payable $ 115 - - - 2,025,052Accrued liabilities - - - - 278,747Contracts payable (retained percentage) 1,776 - - - 309,985Due to other funds - - - - 3,320,119Unearned revenue - - - - 527,191Deposits payable - - - - 45,565Advances from other funds - - - - 4,263,891
Total liabilities 1,891 - - - 10,770,550
Deferred inflows of resources - - - - 2,368,820
Fund balances (deficit)Nonspendable - - 12,331,610 1,482,173 13,864,136Restricted 163,839 5,048,924 - - 75,131,084Unassigned - - - - (3,571,636)
Total fund balances 163,839 5,048,924 12,331,610 1,482,173 85,423,584
Total liabilities and fund balances $ 165,730 5,048,924 12,331,610 1,482,173 98,562,954
121

CITY OF SANTA MONICA, CALIFORNIACombining Statement of Revenues, Expenditures and Changes in Fund Balances
Nonmajor Governmental FundsFor the fiscal year ended June 30, 2019
Special Revenue Funds
BeachRecreation
HousingAuthority TORCA Asset Seizure
Citizens Optionfor Public Safety Rent Control
Revenues:Other taxes $ - - 57,584 - - -Licenses and permits 111,819 - - - - -Intergovernmental 26,933 19,136,464 - 274,309 268,477 -Charges for services 14,051,082 - - - - 5,280,379Investment income 671,151 2,875 235,620 43,803 16,040 134,753Rental income 1,425,366 - - - - -Other revenue 824,708 - 92,933 - - 3,126
Total revenues 17,111,059 19,139,339 386,137 318,112 284,517 5,418,258Expenditures:
Current:General government - - - - - -Public safety - - - 114,548 133,148 -General services 5,856,124 - - - - -Cultural and recreation services 10,921,068 - - - - -Library - - - - - -Housing and community development - 19,058,514 167,781 - - 5,223,860
Debt service expenditures:Principal - - - - - -Interest - - - - - -
Total expenditures 16,777,192 19,058,514 167,781 114,548 133,148 5,223,860Excess (deficiency) of revenues over (under) expenditures 333,867 80,825 218,356 203,564 151,369 194,398
Other financing sources (uses)Transfers in 56,164 403,670 - - - -Transfers out - - (57,501) - - -
Total other financing sources (uses) 56,164 403,670 (57,501) - - -
Net change in fund balances 390,031 484,495 160,855 203,564 151,369 194,398Fund balances (deficit) at the beginning of year 10,658,636 (413,080) 14,083,245 1,158,924 414,884 1,371,266Fund balances at end of year $ 11,048,667 71,415 14,244,100 1,362,488 566,253 1,565,664
continued
122

CITY OF SANTA MONICA, CALIFORNIACombining Statement of Revenues, Expenditures and Changes in Fund Balances
Nonmajor Governmental FundsFor the fiscal year ended June 30, 2019
Special Revenue Funds
Gas Tax Local Return
Clean Beachesand OceanParcel Tax
Community DevelopmentBlock Grant
MiscellaneousGrants SCAQMD
Revenues:Other taxes $ - - 3,148,568 - - -Licenses and permits - - - - - -Intergovernmental 3,567,104 5,505,476 - 459,442 6,897,217 319,869Charges for services - - - - - -Investment income 48,910 327,090 315,163 12,330 6,924 29,080Rental income - - - - - -Other revenue - - - - 492 -
Total revenues 3,616,014 5,832,566 3,463,731 471,772 6,904,633 348,949Expenditures:
Current:General government 3,989 - - 9,747 1,363,932 7,033Public safety - - - - 434,840 -General services - 3,060,003 451,340 582 3,859,597 41,581Cultural and recreation services - - - 201,270 21,120 -Library - - - - 35,344 -Housing and community development - - - 650,062 1,109,176 -
Debt service expenditures:Principal - - - - - -Interest - - - - - -
Total expenditures 3,989 3,060,003 451,340 861,661 6,824,009 48,614Excess (deficiency) of revenues over (under) expenditures 3,612,025 2,772,563 3,012,391 (389,889) 80,624 300,335
Other financing sources (uses)Transfers in - - - - 3,881 -Transfers out (1,894,401) (592,884) (818,189) (166,484) (81,733) -
Total other financing sources (uses) (1,894,401) (592,884) (818,189) (166,484) (77,852) -
Net change in fund balances 1,717,624 2,179,679 2,194,202 (556,373) 2,772 300,335Fund balances (deficit) at the beginning of year 536,122 8,559,174 7,309,158 9,612,692 4,981,648 701,418Fund balances at end of year $ 2,253,746 10,738,853 9,503,360 9,056,319 4,984,420 1,001,753
continued
123

CITY OF SANTA MONICA, CALIFORNIACombining Statement of Revenues, Expenditures and Changes in Fund Balances
Nonmajor Governmental FundsFor the fiscal year ended June 30, 2019
Special RevenueFunds
Debt ServiceFund Permanent Funds
Parks andRecreation Debt Service
CemeteryPerpetual Care
MausoleumPerpetual Care
Total nonmajorgovernmental
fundsRevenues:
Other taxes $ 400 - - - 3,206,552Licenses and permits - - - - 111,819Intergovernmental - - - - 36,455,291Charges for services - - 247,469 41,057 19,619,987Investment income 7,017 6,494 1,109,606 144,153 3,111,009Rental income - - - - 1,425,366Other revenue - - - - 921,259
Total revenues 7,417 6,494 1,357,075 185,210 64,851,283Expenditures:
Current:General government - - - - 1,384,701Public safety - - - - 682,536General services - - - - 13,269,227Cultural and recreation services 38,406 - - - 11,181,864Library - - - - 35,344Housing and community development - - - - 26,209,393
Debt service expenditures:Principal - 4,630,000 - - 4,630,000Interest - 6,310,437 - - 6,310,437
Total expenditures 38,406 10,940,437 - - 63,703,502Excess (deficiency) of revenues over (under) expenditures (30,989) (10,933,943) 1,357,075 185,210 1,147,781
Other financing sources (uses)Transfers in - 11,701,041 - - 12,164,756Transfers out - - (383,325) (45,554) (4,040,071)
Total other financing sources (uses) - 11,701,041 (383,325) (45,554) 8,124,685
Net change in fund balances (30,989) 767,098 973,750 139,656 9,272,466Fund balances (deficit) at the beginning of year 194,828 4,281,826 11,357,860 1,342,517 76,151,118Fund balances at end of year $ 163,839 5,048,924 12,331,610 1,482,173 85,423,584
124

CITY OF SANTA MONICA, CALIFORNIASchedule of Revenues, Expenditures and Changes in
Fund Balance - Budget and ActualBeach Recreation Special Revenue FundFor the fiscal year ended June 30, 2019
BudgetActual,
GAAP basis Encumbrance
Actual,budgetary
basisVariance
with budgetRevenues:
Licenses and permits $ 146,872 111,819 - 111,819 (35,053)Intergovernmental 27,742 26,933 - 26,933 (809)Charges for services 14,583,256 14,051,082 - 14,051,082 (532,174)Investment income 250,000 671,151 - 671,151 421,151Rental income 1,451,072 1,425,366 - 1,425,366 (25,706)Other revenue 903,433 824,708 - 824,708 (78,725)
Total revenues 17,362,375 17,111,059 - 17,111,059 (251,316)Expenditures:
General services:Public works 6,055,247 5,540,453 42,165 5,582,618 472,629Capital improvement 475,671 315,671 - 315,671 160,000
Total general services 6,530,918 5,856,124 42,165 5,898,289 632,629
Cultural and recreational services:Community and cultural services 9,679,822 9,560,826 81,195 9,642,021 37,801Capital improvement 15,993,462 1,360,242 901,195 2,261,437 13,732,025
Total cultural and recreational services 25,673,284 10,921,068 982,390 11,903,458 13,769,826Total expenditures 32,204,202 16,777,192 1,024,555 17,801,747 14,402,455Excess (deficiency) of revenues over (under) expenditures (14,841,827) 333,867 (1,024,555) (690,688) 14,151,139
Other financing sources (uses):Transfers in 44,411 56,164 - 56,164 11,753
Total other financing sources (uses) 44,411 56,164 - 56,164 11,753
(14,797,416) 390,031 (1,024,555) (634,524) 14,162,892
10,658,636 10,658,636 - 10,658,636 -
$ (4,138,780) 11,048,667 (1,024,555) 10,024,112 14,162,892
Net change in fund balance
Fund balance at beginning of year
Fund balance at end of year
125

CITY OF SANTA MONICA, CALIFORNIASchedule of Revenues, Expenditures and Changes in
Fund Balance - Budget and ActualHousing Authority Special Revenue FundFor the fiscal year ended June 30, 2019
BudgetActual,
GAAP basis Encumbrance
Actual,budgetary
basisVariance
with budgetRevenues:
Intergovernmental $ 18,134,510 19,136,464 - 19,136,464 1,001,954Investment income 1,500 2,875 - 2,875 1,375
Total revenues 18,136,010 19,139,339 - 19,139,339 1,003,329Expenditures:
Housing and community development:Housing and economic development 20,001,103 19,046,103 3,712 19,049,815 951,288Capital improvement 12,411 12,411 - 12,411 -
Total housing and community development 20,013,514 19,058,514 3,712 19,062,226 951,288Total expenditures 20,013,514 19,058,514 3,712 19,062,226 951,288Excess (deficiency) of revenues over (under) expenditures (1,877,504) 80,825 (3,712) 77,113 1,954,617
Other financing sources (uses):Transfers in 792,571 403,670 - 403,670 (388,901)
Total other financing sources (uses) 792,571 403,670 - 403,670 (388,901)
(1,084,933) 484,495 (3,712) 480,783 1,565,716
(413,080) (413,080) - (413,080) -
$ (1,498,013) 71,415 (3,712) 67,703 1,565,716
Net change in fund balance
Fund balance at beginning of year
Fund balance at end of year
126

CITY OF SANTA MONICA, CALIFORNIASchedule of Revenues, Expenditures and Changes in
Fund Balance - Budget and ActualTenant Ownership Rights Charter Amendment
(TORCA) Special Revenue FundFor the fiscal year ended June 30, 2019
BudgetActual,
GAAP basis Encumbrance
Actual,budgetary
basisVariance
with budgetRevenues:
Other taxes $ 25,000 57,584 - 57,584 32,584Investment income 75,000 235,620 - 235,620 160,620Other revenue 50,000 92,933 - 92,933 42,933
Total revenues 150,000 386,137 - 386,137 236,137Expenditures:
Housing and community development:Other 167,781 167,781 - 167,781 -
Total housing and community development 167,781 167,781 - 167,781 -Total expenditures 167,781 167,781 - 167,781 -Excess (deficiency) of revenues over (under) expenditures (17,781) 218,356 - 218,356 236,137
Other financing sources (uses):Transfers in - - - - -Transfers out (57,502) (57,501) - (57,501) 1
(57,502) (57,501) - (57,501) 1
(75,283) 160,855 - 160,855 236,138
14,083,245 14,083,245 - 14,083,245 -
$ 14,007,962 14,244,100 - 14,244,100 236,138
Total other financing sources (uses)
Net change in fund balance
Fund balance at beginning of year
Fund balance at end of year
127

CITY OF SANTA MONICA, CALIFORNIASchedule of Revenues, Expenditures and Changes in
Fund Balance - Budget and ActualCitizens Option for Public Safety Special Revenue Fund
For the fiscal year ended June 30, 2019
BudgetActual,
GAAP basis Encumbrance
Actual,budgetary
basisVariance
with budgetRevenues:
Intergovernmental $ 100,000 268,477 - 268,477 168,477Investment income 2,000 16,040 - 16,040 14,040
Total revenues 102,000 284,517 - 284,517 182,517Expenditures:
Public safety:Police 177,148 133,148 44,000 177,148 -
Total public safety 177,148 133,148 44,000 177,148 -Total expenditures 177,148 133,148 44,000 177,148 -
(75,148) 151,369 (44,000) 107,369 182,517
414,884 414,884 - 414,884 -
$ 339,736 566,253 (44,000) 522,253 182,517
Net change in fund balance
Fund balance at beginning of year
Fund balance at end of year
128

CITY OF SANTA MONICA, CALIFORNIASchedule of Revenues, Expenditures and Changes in
Fund Balance - Budget and ActualGas Tax Special Revenue Fund
For the fiscal year ended June 30, 2019
BudgetActual,
GAAP basis Encumbrance
Actual,budgetary
basisVariance
with budgetRevenues:
Intergovernmental $ 3,920,183 3,567,104 - 3,567,104 (353,079)Investment income 10,000 48,910 - 48,910 38,910
Total revenues 3,930,183 3,616,014 - 3,616,014 (314,169)Expenditures:
General government:Other 4,900 3,989 - 3,989 911
Total general government 4,900 3,989 - 3,989 911
General services:Capital improvement 2,437,287 - 879,075 879,075 1,558,212
Total general services 2,437,287 - 879,075 879,075 1,558,212Total expenditures 2,442,187 3,989 879,075 883,064 1,559,123Excess (deficiency) of revenues over (under) expenditures 1,487,996 3,612,025 (879,075) 2,732,950 1,244,954
Other financing sources (uses):Transfers out (3,716,486) (1,894,401) - (1,894,401) 1,822,085
(3,716,486) (1,894,401) - (1,894,401) 1,822,085
(2,228,490) 1,717,624 (879,075) 838,549 3,067,039
536,122 536,122 - 536,122 -
$ (1,692,368) 2,253,746 (879,075) 1,374,671 3,067,039
Total other financing sources (uses)
Net change in fund balance
Fund balance at beginning of year
Fund balance at end of year
129

CITY OF SANTA MONICA, CALIFORNIASchedule of Revenues, Expenditures and Changes in
Fund Balance - Budget and ActualLocal Return Fund Special Revenue FundFor the fiscal year ended June 30, 2019
BudgetActual,
GAAP basis Encumbrance
Actual,budgetary
basisVariance
with budgetRevenues:
Intergovernmental $ 5,157,604 5,505,476 - 5,505,476 347,872Investment income 66,000 327,090 - 327,090 261,090
Total revenues 5,223,604 5,832,566 - 5,832,566 608,962Expenditures:
General government:Capital improvement 40,000 - - - 40,000
Total general government 40,000 - - - 40,000
General services:Other 590,713 533,063 - 533,063 57,650Capital improvement 9,549,190 2,526,940 3,729,296 6,256,236 3,292,954
Total general services 10,139,903 3,060,003 3,729,296 6,789,299 3,350,604Total expenditures 10,179,903 3,060,003 3,729,296 6,789,299 3,390,604Excess (deficiency) of revenues over (under) expenditures (4,956,299) 2,772,563 (3,729,296) (956,733) 3,999,566
Other financing sources (uses):Transfers out (710,000) (592,884) - (592,884) 117,116
Total other financing sources (uses) (710,000) (592,884) - (592,884) 117,116
(5,666,299) 2,179,679 (3,729,296) (1,549,617) 4,116,682
8,559,174 8,559,174 - 8,559,174 -
$ 2,892,875 10,738,853 (3,729,296) 7,009,557 4,116,682
Net change in fund balance
Fund balance at beginning of year
Fund balance at end of year
130

CITY OF SANTA MONICA, CALIFORNIASchedule of Revenues, Expenditures and Changes in
Fund Balance - Budget and ActualClean Beaches and Ocean Parcel Tax Special Revenue Fund
For the fiscal year ended June 30, 2019
BudgetActual,
GAAP basis Encumbrance
Actual,budgetary
basisVariance
with budgetRevenues:
Other taxes $ 3,159,834 3,148,568 - 3,148,568 (11,266)Intergovernmental 5,212 - - - (5,212)Investment income 130,000 315,163 - 315,163 185,163
Total revenues 3,295,046 3,463,731 - 3,463,731 168,685Expenditures:
General services:Public works 872,840 151,760 220,428 372,188 500,652Capital improvement 15,405,697 299,580 1,212,472 1,512,052 13,893,645
Total general services 16,278,537 451,340 1,432,900 1,884,240 14,394,297Total expenditures 16,278,537 451,340 1,432,900 1,884,240 14,394,297Excess (deficiency) of revenues over (under) expenditures (12,983,491) 3,012,391 (1,432,900) 1,579,491 14,562,982
Other financing sources (uses):Transfers in - - - - -Transfers out (776,713) (818,189) - (818,189) (41,476)
Total other financing sources (uses) (776,713) (818,189) - (818,189) (41,476)
(13,760,204) 2,194,202 (1,432,900) 761,302 14,521,506
7,309,158 7,309,158 - 7,309,158 -
$ (6,451,046) 9,503,360 (1,432,900) 8,070,460 14,521,506
Net change in fund balance
Fund balance at beginning of year
Fund balance at end of year
131

CITY OF SANTA MONICA, CALIFORNIASchedule of Revenues, Expenditures and Changes in
Fund Balance - Budget and ActualCommunity Development Block Grant Special Revenue Fund
For the fiscal year ended June 30, 2019
BudgetActual,
GAAP basis Encumbrance
Actual,budgetary
basisVariance
with budgetRevenues:
Intergovernmental $ 1,932,440 459,442 - 459,442 (1,472,998)Investment income 5,000 12,330 - 12,330 7,330
Total revenues 1,937,440 471,772 - 471,772 (1,465,668)Expenditures:
General government:Other 29,499 9,747 - 9,747 19,752
Total general government 29,499 9,747 - 9,747 19,752General services:
Capital improvement 391,673 582 - 582 391,091Total general services 391,673 582 - 582 391,091
Cultural and recreational services:Community and cultural services 201,268 201,270 - 201,270 (2)
Total cultural and recreational services 201,268 201,270 - 201,270 (2)Housing and community development:
Housing and economic development 1,144,660 532,055 612,548 1,144,603 57Capital improvement 118,007 118,007 - 118,007 -
Total housing and community development 1,262,667 650,062 612,548 1,262,610 57Total expenditures 1,885,107 861,661 612,548 1,474,209 410,898Excess (deficiency) of revenues over (under) expenditures 52,333 (389,889) (612,548) (1,002,437) (1,054,770)
Other financing sources (uses):Transfers out (193,452) (166,484) - (166,484) 26,968
(193,452) (166,484) - (166,484) 26,968
(141,119) (556,373) (612,548) (1,168,921) (1,027,802)
9,612,692 9,612,692 - 9,612,692 -
$ 9,471,573 9,056,319 (612,548) 8,443,771 (1,027,802)
Total other financing sources (uses)
Net change in fund balance
Fund balance at beginning of year
Fund balance at end of year
132

CITY OF SANTA MONICA, CALIFORNIASchedule of Revenues, Expenditures and Changes in
Fund Balance - Budget and ActualMiscellaneous Grants Special Revenue Fund
For the fiscal year ended June 30, 2019
BudgetActual,
GAAP basis Encumbrance
Actual,budgetary
basisVariance
with budgetRevenues:
Intergovernmental $ 7,337,965 6,897,217 - 6,897,217 (440,748)Investment income 20,000 6,924 - 6,924 (13,076)Other revenue - 492 - 492 492
Total revenues 7,357,965 6,904,633 - 6,904,633 (453,332)Expenditures:
General government:City manager 263,036 80,000 180,000 260,000 3,036Capital improvement 1,689,491 1,283,932 - 1,283,932 405,559
Total general government 1,952,527 1,363,932 180,000 1,543,932 408,595Public safety:
Police 750,444 281,970 - 281,970 468,474Fire 669,925 152,870 - 152,870 517,055
Total public safety 1,420,369 434,840 - 434,840 985,529General services:
Public works 195,366 31,859 45,254 77,113 118,253Capital improvement 17,733,316 3,827,738 1,154,119 4,981,857 12,751,459
Total general services 17,928,682 3,859,597 1,199,373 5,058,970 12,869,712Cultural and recreational services:
Community and cultural services 371,684 21,120 - 21,120 350,564Capital improvement 10,000 - - - 10,000
Total cultural and recreational services 381,684 21,120 - 21,120 360,564Libraries:
Library 48,520 35,344 - 35,344 13,176Total libraries 48,520 35,344 - 35,344 13,176
Housing and community development:Planning and community development 608,106 362,678 99,965 462,643 145,463Housing and economic development 804,986 746,498 11,676 758,174 46,812
Total housing and community development 1,413,092 1,109,176 111,641 1,220,817 192,275Total expenditures 23,144,874 6,824,009 1,491,014 8,315,023 14,829,851Excess (deficiency) of revenues over (under) expenditures (15,786,909) 80,624 (1,491,014) (1,410,390) 14,376,519
Other financing sources (uses):Transfers in - 3,881 - 3,881 3,881Transfers out (168,605) (81,733) - (81,733) 86,872
(168,605) (77,852) - (77,852) 90,753
(15,955,514) 2,772 (1,491,014) (1,488,242) 14,467,272
4,981,648 4,981,648 - 4,981,648 -
$ (10,973,866) 4,984,420 (1,491,014) 3,493,406 14,467,272
Total other financing sources (uses)
Net change in fund balance
Fund balance at beginning of year
Fund balance at end of year
133

CITY OF SANTA MONICA, CALIFORNIASchedule of Revenues, Expenditures and Changes in
Fund Balance - Budget and ActualSCAQMD Special Revenue Fund
For the fiscal year ended June 30, 2019
BudgetActual,
GAAP basis Encumbrance
Actual,budgetary
basisVariance
with budgetRevenues:
Intergovernmental $ 110,000 319,869 - 319,869 209,869Investment income 5,500 29,080 - 29,080 23,580
Total revenues 115,500 348,949 - 348,949 233,449Expenditures:
General government:Other 7,033 7,033 - 7,033 -Capital improvement 369,035 - - - 369,035
Total general government 376,068 7,033 - 7,033 369,035General services:
Capital improvement 185,647 41,581 45,796 87,377 98,270Total general services 185,647 41,581 45,796 87,377 98,270Total expenditures 561,715 48,614 45,796 94,410 467,305
(446,215) 300,335 (45,796) 254,539 700,754
701,418 701,418 - 701,418 -
$ 255,203 1,001,753 (45,796) 955,957 700,754
Net change in fund balance
Fund balance at beginning of year
Fund balance at end of year
134

CITY OF SANTA MONICA, CALIFORNIASchedule of Revenues, Expenditures and Changes in
Fund Balance - Budget and ActualParks and Recreation Special Revenue Fund
For the fiscal year ended June 30, 2019
BudgetActual,
GAAP basis Encumbrance
Actual,budgetary
basisVariance
with budgetRevenues:
Other taxes $ - 400 - 400 400Investment income 1,000 7,017 - 7,017 6,017
Total revenues 1,000 7,417 - 7,417 6,417Expenditures:
General services:Capital improvement 99,432 - 99,432 99,432 -
Total general services 99,432 - 99,432 99,432 -Cultural and recreational services:
Capital improvement 242,778 38,406 3,552 41,958 200,820Total cultural and recreational services 242,778 38,406 3,552 41,958 200,820Total expenditures 342,210 38,406 102,984 141,390 200,820
(341,210) (30,989) (102,984) (133,973) 207,237
194,828 194,828 - 194,828 -
$ (146,382) 163,839 (102,984) 60,855 207,237
Net change in fund balance
Fund balance at beginning of year
Fund balance at end of year
135

Nonmajor Enterprise Fund Financial Statements
Enterprise Funds are used to report any activity for which a fee is charged to external users for goods or services. Activities are required to be reported as enterprise funds if any one of the following criteria is met: (a) The activity is financed with debt that is secured solely by a pledge of the net revenues from fees and charges of the activity. Debt that is secured by a pledge of net revenues from fees and charges and the full faith and credit of a related primary government or component unit – even if that government is not expected to make any payments – is not payable solely from fees and charges of the activity. (Some debt may be secured, in part, by a portion of its own proceeds but should be considered as payable “solely” from the revenues of the activity.) (b) Laws or regulations require that the activity’s costs of providing services, including capital costs (such as depreciation or debt service), be recovered with fees and charges, rather than with taxes or similar revenues. (c) The pricing policies of the activity establish fees and charges designed to recover its costs, including capital costs (such as depreciation or debt service).
Community Broadband Fund – To account for the activity of leasing the City’s dark and lit fiber networks known as “CityNet”.
Airport Fund – To account for revenues and expenses connected with management of the Santa Monica Municipal Airport.
Pier Fund – To account for revenues and expenses connected with management and development of the Santa Monica Pier.
Stormwater Management Fund – To account for revenues and expenses associated with storm water management.
Cemetery Fund – To account for revenues and expenses associated with operation of Woodlawn Cemetery and Mausoleum.
Parking Authority Fund – To account for acquisition of parking lots or contributing to the construction of parking structures by the City Parking Authority.
136

CITY OF SANTA MONICA, CALIFORNIACombining Statement of Net Position
Nonmajor Enterprise FundsJune 30, 2019
Business-Type Activities - Enterprise FundsCommunityBroadband Airport Pier
StormwaterManagement Cemetery Parking Authority
Total nonmajorenterprise funds
AssetsCurrent assets:
Cash and investments $ 804,834 18,927,619 7,354,991 6,347 665,461 2,107,269 29,866,521Restricted cash and investments - 1,278,418 283,350 5,074,843 - - 6,636,611Receivables (net, where applicable, of allowances for uncollectibles):
Accounts 242,350 28,094 72,020 16,958 421,244 - 780,666Notes receivable Successor Agency - - - - - 7,352,725 7,352,725Interest 849 67,955 23,593 22,043 1,558 9,269 125,267
Due from other governments, restricted - - - 3,474 - - 3,474Prepaids 26,322 49 1 1 12 - 26,385
Total current assets 1,074,355 20,302,135 7,733,955 5,123,666 1,088,275 9,469,263 44,791,649Noncurrent assets:
Notes receivable Successor Agency noncurrent - - - - - 259,400 259,400Accrued interest non current - - - - - 18,278,988 18,278,988Capital assets:
Land - 8 - - 4 1,362,700 1,362,712Construction in progress - 231,937 165,362 2,934,720 - - 3,332,019Buildings - 7,769,091 5,916,024 - 1,716,090 946,242 16,347,447Improvements other than buildings - 5,604,488 5,461,401 147,299 782,158 142,591 12,137,937Machinery and equipment 52,086 568,080 289,426 35,750 374,033 7,237 1,326,612Infrastructure - - 17,382,609 10,739,803 - - 28,122,412Less: accumulated depreciation (25,940) (9,979,665) (15,384,248) (5,086,817) (2,234,140) (521,142) (33,231,952)
Net capital assets 26,146 4,193,939 13,830,574 8,770,755 638,145 1,937,628 29,397,187Total noncurrent assets 26,146 4,193,939 13,830,574 8,770,755 638,145 20,476,016 47,935,575Total assets 1,100,501 24,496,074 21,564,529 13,894,421 1,726,420 29,945,279 92,727,224
DEFERRED OUTFLOWS OF RESOURCESDeferred outflows from pensions 197,422 484,450 652,839 - 156,858 - 1,491,569Deferred outflows from OPEB 5,196 15,156 19,919 - 9,527 - 49,798
TOTAL DEFERRED OUTFLOWS OF RESOURCES 202,618 499,606 672,758 - 166,385 - 1,541,367Liabilities
Current liabilities:Accounts payable 64,144 1,063,669 123,323 76 63,850 - 1,315,062Accrued liabilities 25,237 53,296 72,981 - 20,290 - 171,804Contracts payable (retained percentage) 38,260 191,812 70,512 - - 522 301,106Compensated absences due within one year 24,847 68,840 102,816 - 22,952 - 219,455Accrued interest payable - - - 2,731 - - 2,731Loans and bonds payable due within one year - - - 315,130 - - 315,130Liabilities payable from restricted assets - deposits - 1,278,418 283,350 - - - 1,561,768
Total current liabilities 152,488 2,656,035 652,982 317,937 107,092 522 3,887,056Long-term liabilities:
Compensated absences due in more than one year 17,326 42,297 73,392 - 9,316 - 142,331Advances from other funds - 5,748,972 - - - - 5,748,972Net OPEB liability 33,049 96,394 126,689 - 60,591 - 316,723Net pension liability 764,068 1,874,930 2,526,634 - 607,077 - 5,772,709
Total long-term liabilities 814,443 7,762,593 2,726,715 - 676,984 - 11,980,735Total liabilities 966,931 10,418,628 3,379,697 317,937 784,076 522 15,867,791
DEFERRED INFLOWS OF RESOURCESDeferred inflows from pensions 60,727 149,019 200,816 - 48,250 - 458,812Deferred inflows from OPEB 1,557 4,543 5,970 - 2,855 - 14,925
TOTAL DEFERRED INFLOWS OF RESOURCES 62,284 153,562 206,786 - 51,105 - 473,737Net position
Net investment in capital assets 26,146 4,193,939 13,830,574 8,455,625 638,145 1,937,628 29,082,057Restricted for housing - - - - - 5,178,223 5,178,223Unrestricted 247,758 10,229,551 4,820,230 5,120,859 419,479 22,828,906 43,666,783
Total net position $ 273,904 14,423,490 18,650,804 13,576,484 1,057,624 29,944,757 77,927,063
137

CITY OF SANTA MONICA, CALIFORNIACombining Statement of Revenues, Expenses and Changes in Fund Net Position
Nonmajor Enterprise FundsFor the fiscal year ended June 30, 2019
Business-Type Activities - Enterprise Funds
CommunityBroadband Airport Pier
StormwaterManagement Cemetery
ParkingAuthority
Totalnonmajor
enterprise funds
Operating revenuesCharges for services $ 2,489,716 14,927,524 8,953,035 1,515,810 1,730,351 - 29,616,436
Total operating revenues 2,489,716 14,927,524 8,953,035 1,515,810 1,730,351 - 29,616,436
Operating expensesPersonnel services 1,369,508 2,296,090 2,967,497 - 588,989 550 7,222,634Administrative indirect 116,126 885,884 588,000 - 256,156 - 1,846,166Contractual services 830,593 869,091 1,475,727 - 366,833 - 3,542,244Repairs and maintenance 51,380 522,062 699,825 - 22,904 - 1,296,171Materials and supplies 22,849 2,644,012 688,803 - 308,491 405,277 4,069,432Utilities 4,630 688,745 199,343 - 71,636 - 964,354Casualty property and liability costs 2,832 356,964 307,363 - 65,306 - 732,465Depreciation and amortization 10,459 361,161 1,311,965 324,607 44,313 16,263 2,068,768Other 106,408 738,874 766,595 42,628 20,818 - 1,675,323
Total operating expenses 2,514,785 9,362,883 9,005,118 367,235 1,745,446 422,090 23,417,557
Operating income (loss) (25,069) 5,564,641 (52,083) 1,148,575 (15,095) (422,090) 6,198,879
Nonoperating revenues (expenses)Investment income (loss) 5,954 566,798 193,219 185,952 12,550 313,566 1,278,039Interest expense - (36,121) - (13,517) - - (49,638)Other nonoperating revenues - 1,110,215 235,889 1,253,994 81,684 - 2,681,782
Total nonoperating revenues (expenses) net 5,954 1,640,892 429,108 1,426,429 94,234 313,566 3,910,183
Income before transfers and special item (19,115) 7,205,533 377,025 2,575,004 79,139 (108,524) 10,109,062
Transfers in (note 11) - 103,112 200,000 606,385 428,879 - 1,338,376Transfers out (note 11) - (501,132) (94,522) (1,915,820) - (15,000,000) (17,511,474)
Change in net position (19,115) 6,807,513 482,503 1,265,569 508,018 (15,108,524) (6,064,036)
Net position at beginning of year 293,019 7,615,977 18,168,301 12,310,915 549,606 45,053,281 83,991,099
Net position at end of year $ 273,904 14,423,490 18,650,804 13,576,484 1,057,624 29,944,757 77,927,063
138

Community
Broadband Airport Pier
Stormwater
Management Cemetery
Parking
Authority
Total
nonmajor
enterprise
funds
Cash flows from operating activities:
Cash received from customers 2,498,219$ 14,960,146 8,941,159 1,577,992 1,641,800 — 29,619,316
Cash payments for materials and services (1,035,459) (6,374,205) (5,353,239) (189,301) (1,086,777) (457,075) (14,496,056)
Cash payments to employees for services (705,329) (1,753,668) (2,753,000) — (713,999) (550) (5,926,546)
Other revenue received — 1,110,215 235,889 1,253,994 81,684 — 2,681,782
Net cash provided by (used in)
operating activities 757,431 7,942,488 1,070,809 2,642,685 (77,292) (457,625) 11,878,496
Cash flows from noncapital financing activities:
Repayment of advances from other funds — (1,999,999) — (3,474) — — (2,003,473)
Repayment of promissory note — — — — — 15,000,000 15,000,000
Transfers in — 103,112 200,000 606,385 428,879 — 1,338,376
Transfers out — (501,132) (94,522) (1,915,820) — (15,000,000) (17,511,474)
Net cash provided by (used in)
noncapital financing activities - (2,398,019) 105,478 (1,312,909) 428,879 - (3,176,571)
Cash flows from capital and related financing activities:
Acquisition and construction of capital assets — (109,184) (227,956) — — — (337,140)
Reduction in long-term obligations — — — (307,144) — — (307,144)
Interest paid on long-term obligations — (36,121) — (16,179) — — (52,300)
Net cash used in capital and related
financing activities — (145,305) (227,956) (323,323) — — (696,584)
Cash flows from investing activities:
Investment income (loss) 5,105 547,905 185,979 186,437 11,254 85,505 1,022,185
Net cash provided by (used in) investing activities 5,105 547,905 185,979 186,437 11,254 85,505 1,022,185
Net increase (decrease) in cash
and cash equivalents 762,536 5,947,069 1,134,310 1,192,890 362,841 (372,120) 9,027,526
Cash and cash equivalents at beginning of year, as restated (note 18) 42,298 14,258,968 6,504,031 3,888,300 302,620 2,479,389 27,475,606
Cash and cash equivalents at end of year 804,834$ 20,206,037 7,638,341 5,081,190 665,461 2,107,269 36,503,132
Cash and investments 804,834$ 18,927,619 7,354,991 6,347 665,461 2,107,269 29,866,521
Restricted cash and investments — 1,278,418 283,350 5,074,843 — — 6,636,611
Total cash and cash equivalents 804,834$ 20,206,037 7,638,341 5,081,190 665,461 2,107,269 36,503,132
(Continued)
CITY OF SANTA MONICA, CALIFORNIA
Combining Statement of Cash Flows
Nonmajor Enterprise Funds
For the fiscal year ended June 30, 2019
Business-Type Activities - Enterprise Funds
139

CITY OF SANTA MONICA, CALIFORNIA
Combining Statement of Cash Flows
Nonmajor Enterprise Funds
For the fiscal year ended June 30, 2019
Business-Type Activities - Enterprise Funds
Community
Broadband Airport Pier
Stormwater
Management Cemetery
Parking
Authority
Total
nonmajor
enterprise
funds
Reconciliation of operating income (loss) to net
cash provided by (used in) operating activities:
Operating income (loss) (25,068)$ 5,564,642 (52,083) 1,148,575 (15,096) (422,091) 6,198,879
Adjustments to reconcile operating income
(loss) to net cash provided by (used in)
operating activities:
Add depreciation 10,459 361,161 1,311,965 324,607 44,313 16,263 2,068,768
Other revenue received — 1,110,215 235,889 1,253,994 81,684 — 2,681,782
Changes in assets and liabilities and deferred outflows
and inflows of resources:
(Increase) decrease in accounts receivable 8,503 78,508 (11,876) 62,182 (88,551) — 48,766
(Increase) decrease in prepaids 14,216 (49) (1) (1) (12) — 14,153
Increase (decrease) in accounts payable 46,882 246,903 (641,482) 64 25,380 (51,797) (374,050)
(Decrease) in unearned revenue — (9,591) — — — — (9,591)
Increase (decrease) in accrued liabilities 5,910 (5,877) (221) — 455 — 267
Increase (decrease) in contracts payable 38,260 84,572 13,900 (146,736) — — (10,004)
(Decrease) in deposits payable from restricted assets — (36,295) — — — — (36,295)
Increase (decrease) in compensated absences payable 1,486 8,414 (793) — 3,235 — 12,342
Net OPEB liability and related changes in deferred
outflows and inflows of resources 29,410 19,677 31,703 — (9,225) — 71,565
Net pension liability and related changes in deferred
outflows and inflows of resources 627,373 520,208 183,808 — (119,475) — 1,211,914
Total adjustments 782,499 2,377,846 1,122,892 1,494,110 (62,196) (35,534) 5,679,617
Net cash provided by (used in)
operating activities 757,431$ 7,942,488 1,070,809 2,642,685 (77,292) (457,625) 11,878,496
Schedule of non-cash capital and related financing activities:
Capital assets acquired through accounts payable $ — — — — — — —
140

Internal Service Fund Financial Statements
Internal Service Funds are used to account for the financing of goods or services provided by one department to other departments of the City or to other governments, on a cost-reimbursement basis.
Vehicle Management Fund – To account for user charges from other funds and expenses related to the replacement, maintenance and the fueling of various City vehicles, including specialized mechanical equipment.
Information Technology Replacement and Services Fund – To account for user charges from other funds and expenses related to replacement of computer equipment.
Self-Insurance, General Liability and Auto Fund – To account for user charges from other funds and expenses related to the administration and payment of general liability and auto claims.
Self-Insurance, Bus Fund – To account for user charges from the Big Blue Bus Fund and expenses related to the administration and payment of municipal bus lines liability claims.
Self-Insurance, Risk Management Administration Fund – To account for user charges from other funds and expenses related to the administration of the risk management division.
Self-Insurance, Workers' Compensation Fund – To account for user charges from other funds and expenses related to the administration and payment of workers' compensation claims.
141

CITY OF SANTA MONICA, CALIFORNIACombining Statement of Net Position
Internal Service FundsJune 30, 2019
VehicleManagement
InformationTechnology
Replacementand Services
Self - InsuranceGeneral
Liability / AutoSelf - Insurance
Bus
Self - InsuranceRisk
ManagementAdmin
Self - InsuranceWorkers'
Compensation
Totalinternalservicefunds
AssetsCurrent assets:
Cash and investments $ 20,240,117 4,805,915 8,328,994 6,222,614 2,091,127 54,698,532 96,387,299Receivables:
Accounts 145,188 - - - 20,502 94,020 259,710Interest 79,689 19,515 36,335 20,341 - 193,090 348,970
Inventory 47,914 - - - - - 47,914Prepaids 194 - - - 10,118 - 10,312
Total current assets 20,513,102 4,825,430 8,365,329 6,242,955 2,121,747 54,985,642 97,054,205Noncurrent assets:
Capital assets:Construction in progress 2,748,544 - - - - - 2,748,544Machinery and equipment 40,256,392 1,517,857 2,849 7,386 919 10,065 41,795,468Less: accumulated depreciation (22,239,204) (1,279,325) (2,849) (7,386) (919) (10,065) (23,539,748)
Net capital assets 20,765,732 238,532 - - - - 21,004,264Total assets 41,278,834 5,063,962 8,365,329 6,242,955 2,121,747 54,985,642 118,058,469DEFERRED OUTFLOWS OF RESOURCES
Deferred outflows from pensions 858,589 - - - 576,948 - 1,435,537Deferred outflows from OPEB 41,571 - - - 21,651 - 63,222
TOTAL DEFERRED OUTFLOWS OF RESOURCES 900,160 - - - 598,599 - 1,498,759Liabilities
Current liabilities:Accounts payable 454,408 1,046,368 295,963 412,305 9,484 234,432 2,452,960Accrued liabilities 65,438 30,800 26 10 65,759 15 162,048Compensated absences due within one year 127,676 - - - 83,169 - 210,845Claims payable due within one year - - 5,627,694 3,840,574 - 11,063,388 20,531,656
Total current liabilities 647,522 1,077,168 5,923,683 4,252,889 158,412 11,297,835 23,357,509Long-term liabilities:
Compensated absences due in more than one year 22,827 - - - 55,205 - 78,032Claims payable due in more than one year - - 6,553,278 3,255,173 - 40,164,727 49,973,178Net OPEB liability 264,396 - - - 137,706 - 402,102Net pension liability 3,322,932 - - - 2,232,917 - 5,555,849
Total long-term liabilities 3,610,155 - 6,553,278 3,255,173 2,425,828 40,164,727 56,009,161Total liabilties 4,257,677 1,077,168 12,476,961 7,508,062 2,584,240 51,462,562 79,366,670
DEFERRED INFLOWS OF RESOURCESDeferred inflows from pensions 264,104 - - - 177,469 - 441,573Deferred inflows from OPEB 12,459 - - - 6,489 - 18,948
TOTAL DEFERRED INFLOWS OF RESOURCES 276,563 - - - 183,958 - 460,521Net position
Investment in capital assets 20,765,732 238,532 - - - - 21,004,264Unrestricted 16,879,022 3,748,262 (4,111,632) (1,265,107) (47,852) 3,523,080 18,725,773
Total net position $ 37,644,754 3,986,794 (4,111,632) (1,265,107) (47,852) 3,523,080 39,730,037
142

CITY OF SANTA MONICA, CALIFORNIACombining Statement of Revenues, Expenses and Changes in Fund Net Position
Internal Service FundsFor the fiscal year ended June 30, 2019
VehicleManagement
InformationTechnology
Replacementand Services
Self - InsuranceGeneral
Liability / AutoSelf - Insurance
Bus
Self - InsuranceRisk
ManagementAdmin
Self - InsuranceWorkers'
Compensation
Totalinternal
service funds
Operating revenuesCharges for services $ 12,305,171 2,472,130 3,083,077 3,800,000 3,125,200 21,634,239 46,419,817
Total operating revenues 12,305,171 2,472,130 3,083,077 3,800,000 3,125,200 21,634,239 46,419,817
Operating expensesPersonnel services 3,058,254 - - - 2,224,885 - 5,283,139Administrative indirect 899,384 - - - 325,747 - 1,225,131Contractual services 141,513 - 108,362 365,552 91,151 918,367 1,624,945Repairs and maintenance 1,985,899 - 27,494 27,494 389 55,187 2,096,463Materials and supplies 2,376,101 3,830,323 - 1,533 42,229 6,479 6,256,665Utilities 85,814 - - - 1,330 - 87,144Casualty property and liability costs 143,631 - - - 10,144 - 153,775Claims expense net of claims reserve adjustment - - 6,505,544 1,198,740 - 15,261,133 22,965,417Insurance and bonds - - 1,100,961 1,080,890 2,742,990 824,281 5,749,122Miscellaneous fees and costs - - 1,057,476 484,580 - 485,728 2,027,784Depreciation and amortization 3,356,684 106,123 - - - - 3,462,807Other 316,352 - 960 110 121,892 1,352 440,666
Total operating expenses 12,363,632 3,936,446 8,800,797 3,158,899 5,560,757 17,552,527 51,373,058
Operating income (loss) (58,461) (1,464,316) (5,717,720) 641,101 (2,435,557) 4,081,712 (4,953,241)
Nonoperating revenuesInvestment income 790,327 185,081 336,771 154,320 - 1,616,842 3,083,341Gain on disposal of capital assets 318,917 - - - - - 318,917Other nonoperating revenues 5,130 12,285 - 435 - 92,829 110,679
Total nonoperating revenues 1,114,374 197,366 336,771 154,755 - 1,709,671 3,512,937
Income (loss) before transfers 1,055,913 (1,266,950) (5,380,949) 795,856 (2,435,557) 5,791,383 (1,440,304)
Transfers in (note 11) - - - - 2,452,526 - 2,452,526Transfers out (note 11) - - (496,466) (351,749) - (1,749,029) (2,597,244)
Change in net position 1,055,913 (1,266,950) (5,877,415) 444,107 16,969 4,042,354 (1,585,022)
Net position at beginning of year 36,588,841 5,253,744 1,765,783 (1,709,214) (64,821) (519,274) 41,315,059
Net position at end of year (note 10) $ 37,644,754 3,986,794 (4,111,632) (1,265,107) (47,852) 3,523,080 39,730,037
143

Vehicle
Management
Information
Technology
Replacement
and Services
Self-Insurance
General Liability
/ Auto Self-Insurance Bus
Self-Insurance
Risk Management
Administration
Self-Insurance
Workers'
Compensation
Total internal
service funds
Cash flows from operating activities: Cash received from customers 12,363,184$ 2,472,130 3,083,077 3,800,000 3,126,768 21,634,239 46,479,398 Cash payments for materials and services (6,574,607) (3,146,974) (2,159,553) (1,583,923) (3,337,586) (2,416,213) (19,218,856) Cash payments to employees for services (3,359,020) 30,800 26 10 (1,895,175) 15 (5,223,344) Cash payments for claims and related expenses — — 1,213,476 (341,211) — (10,603,236) (9,730,971) Other revenue received 5,130 12,285 — 435 0 92,829 110,679
Net cash provided by (used in) operating activities 2,434,687 (631,759) 2,137,026 1,875,311 (2,105,993) 8,707,634 12,416,906
Cash flows from noncapital financing activities: Transfers in — — — — 2,452,526 — 2,452,526 Transfers out — — (496,466) (351,749) — (1,749,029) (2,597,244)
Net cash used in noncapital financing activities — — (496,466) (351,749) 2,452,526 (1,749,029) (144,718)
Cash flows from capital and related financing activities: Acquisition and construction of capital assets (11,494,463) — — — — — (11,494,463) Proceeds from sale of capital assets 830,713 — — — — — 830,713
Net cash used in capital and related financing activities (10,663,750) — — — — — (10,663,750)
Cash flows from investing activities – investment income 791,824 184,995 342,435 146,514 — 1,576,460 3,042,228
Net increase (decrease) in cash andcash equivalents (7,437,239) (446,764) 1,982,995 1,670,076 346,533 8,535,065 4,650,666
Cash and cash equivalents at beginning of year, as restated (note 18) 27,677,356 5,252,679 6,345,999 4,552,538 1,744,594 46,163,467 91,736,633
Cash and cash equivalents at end of year 20,240,117$ 4,805,915 8,328,994 6,222,614 2,091,127 54,698,532 96,387,299
Reconciliation of operating income (loss) to net cash provided by (used in) operating income (loss):
Operating income (loss) (58,461)$ (1,464,316) (5,717,720) 641,101 (2,435,557) 4,081,712 (4,953,241)
Adjustments to reconcile operating income (loss) to net cash provided by (used in) operating activities:
Add depreciation 3,356,684 106,123 — — — — 3,462,807Other revenue received 5,130 12,285 — 435 — 92,829 110,679Changes in assets and liabilities and deferred outflowsand inflows of resources:
(Increase) decrease in accounts receivable 58,013 — 3,881,469 — 1,568 (93,986) 3,847,064(Increase) in prepaids (194) — — — (44) — (238)(Increase) in inventory (23,957) — — — — — (23,957)Increase (decrease) in accounts payable (601,762) 683,349 135,700 376,236 (1,670) (124,819) 467,034Increase (decrease) in accrued liabilities 5,842 30,800 26 10 (4,145) 15 32,548Increase (decrease) in compensated absences payable (21,413) — — — 11,748 — (9,665)Increase in claims payable — — 3,837,551 857,529 — 4,751,883 9,446,963
Net OPEB liability and related changes in deferred
outflows and inflows of resources (46,101) — — — (20,549) — (66,650)
Net pension liability and related changes in deferred
outflows and inflows of resources (239,094) — — — 342,656 — 103,562
Total adjustments 2,493,148 832,557 7,854,746 1,234,210 329,564 4,625,922 17,370,147
Net cash provided by (used in) operating activities 2,434,687$ (631,759) 2,137,026 1,875,311 (2,105,993) 8,707,634 12,416,906
Schedule of non-cash capital and related financing activities:
Capital assets acquired through accounts payable $ 89,045 — — — — — 89,045
Gain on disposal of capital assets 830,712 — — — — — 830,712
CITY OF SANTA MONICA, CALIFORNIA
Combining Statement of Cash Flows
Internal Service Funds
For the fiscal year ended June 30, 2019
144

Fiduciary Fund Financial Statements
Agency Funds are custodial in nature and used to receive and disburse funds for an entity/individual, which is not part of the City.
General Trust Fund - To account for funds given to the City for restricted purposes whereby the City is only acting as a pass-through agent.
Street Light Fund - To account for all receipts and disbursements associated with 1911 Act Street Light Assessment Bonds.
145

General Street TotalTrust Light Agency Funds
Assets
Restricted cash and investments 4,528,484 $ 4,741 4,533,225
Accounts receivable 74,473 — 74,473
Total assets 4,602,957 $ 4,741 4,607,698
Liabilities
Accounts payable and accrued liabilities 4,602,957 $ 4,741 4,607,698
Total liabilities 4,602,957 $ 4,741 4,607,698
CITY OF SANTA MONICA, CALIFORNIA
Combining Statement of Fiduciary Net Position
Agency Funds
June 30, 2019
146

June 30, 2018 Additions Reductions June 30, 2019
Fiduciary Funds
Agency Funds:
General Trust
Assets:
Restricted cash and investments 3,948,425 $ 76,992,982 76,412,923 4,528,484
Accounts receivable 56,856 271,876 254,259 74,473
Total assets 4,005,281 $ 77,264,858 76,667,182 4,602,957
Liabilities:
Accounts payable and accrued liabilities 4,005,281 $ 77,725,085 77,127,409 4,602,957
Total liabilities 4,005,281 $ 77,725,085 77,127,409 4,602,957
Street Light
Assets:
Restricted cash and investments 4,997 $ 1,907 2,163 4,741
Total assets 4,997 $ 1,907 2,163 4,741
Liabilities:
Accounts payable and accrued liabilities 4,997 $ 4,070 4,326 4,741
Total liabilities 4,997 $ 4,070 4,326 4,741
Total Fiduciary Funds
Total Agency Funds
Assets:
Restricted cash and investments 3,953,422 $ 76,994,889 76,415,086 4,533,225
Accounts receivable 56,856 271,876 254,259 74,473
Total assets 4,010,278 $ 77,266,765 76,669,345 4,607,698
Liabilities:
Accounts payable and accrued liabilities 4,010,278 $ 77,729,155 77,131,735 4,607,698
Total liabilities 4,010,278 $ 77,729,155 77,131,735 4,607,698
CITY OF SANTA MONICA, CALIFORNIA
Combining Statement of Changes in Fiduciary Assets and Liabilities
Agency Funds
For the fiscal year ended June 30, 2019
147

City of Santa Monica, California
Year Ended June 30, 2019
STATISTICAL SECTION
148

Table PageFinancial Trends Information
These schedules contain trend information to help the reader understand how the government's financial performance and well-being have changed over time.
1 Net Position by Component - Last Ten Fiscal Years 1532 Changes in Net Position - Last Ten Fiscal Years 1543 Fund Balance of Governmental Funds - Last Ten Fiscal Years 1574 Changes in Fund Balance of Governmental Funds - Last Ten Fiscal Years 1585 General Fund Tax Revenues by Source - Last Ten Fiscal Years 160
Revenue Capacity Information
These schedules contain information to help the reader assess the government's most significant local revenue source, the property tax.
6 Assessed Value and Actual Value of Taxable Property - Last Ten Fiscal Years 1617 Direct and Overlapping Property Tax Rates - Last Ten Fiscal Years 1628 Principal Property Taxpayers - Current Fiscal Year and Nine Years Ago 1639 Property Tax Levies and Collections - Last Ten Fiscal Years 16410 Taxable Transactions by Type of Business - Last Ten Calendar Years 165
Debt Capacity Information
These schedules present information to help the reader assess the affordability of the government's current levels of outstanding debt and government's ability to issue additional debt in the future.
11 Ratios of Outstanding Debt by Type - Last Ten Fiscal Years 16612 Ratios of General Bonded Debt - Last Ten Fiscal Years 16713 Direct and Overlapping Governmental Activities Debt 16814 Computation of Legal Debt Margin - Last Ten Fiscal Years 16915 Wastewater Enterprise Revenue Bonds Coverage - Last Ten Fiscal Years 170
CITY OF SANTA MONICA, CALIFORNIAFor the fiscal year ended June 30, 2019
STATISTICAL SECTION (unaudited)
149

Table Page
Demographic and Economic Information
These schedules offer demographic and economic indicators to help the reader understand the environment within which the government's financial activities take place.
16 Demographic and Economic Statistics - Last Ten Calendar Years 17117 Principal Employers - Current Year and Nine Years Ago 172
Operating Information
These schedules contain service and infrastructure data to help the reader understand how the information in the government's financial report relates to the services the government provides and activities it performs.
18 Full-Time Equivalent City Government Employees by Function/Program - Last Ten Fiscal Years
173
19 Operating Indicators by Function/Program - Last Ten Fiscal Years 17420 Capital Assets Statistics by Function/Program - Last Ten Fiscal Years 175
STATISTICAL SECTION (unaudited), continued
CITY OF SANTA MONICA, CALIFORNIAFor the fiscal year ended June 30, 2019
150

TABLE 1
2018-19 2017-18 2016-17 2015-16 2014-15 (1) 2013-14 2012-13 2011-12 2010-11 2009-10
Governmental activities
Net investment in capital assets $ 730,135,331 720,769,829 731,842,870 728,041,792 705,144,194 698,223,620 702,392,065 708,564,360 565,402,905 561,308,717
Restricted 226,867,281 209,428,190 198,720,012 196,524,874 178,624,757 136,510,661 126,827,943 171,964,389 198,990,741 190,302,568
Unrestricted 14,716,293 54,400,893 44,676,618 19,956,676 24,292,525 376,983,696 372,285,005 379,302,789 248,977,209 238,856,963
Total governmental activities net position 971,718,905 984,598,912 975,239,500 944,523,342 908,061,476 1,211,717,977 1,201,505,013 1,259,831,538 1,013,370,855 990,468,248
Business-type activities
Net investment in capital assets 453,239,103 437,613,109 445,314,626 440,369,455 447,257,495 472,808,694 450,345,204 448,028,200 442,305,322 426,367,876
Restricted 19,925,028 23,409,084 18,835,497 12,797,570 15,102,480 11,665,453 13,739,411 16,024,235 13,527,238 10,855,611
Unrestricted 157,216,757 136,350,263 127,841,169 130,752,666 50,488,321 115,636,742 126,804,668 104,588,473 102,753,866 107,670,491
Total business-type activities net position 630,380,888 597,372,456 591,991,292 583,919,691 512,848,296 600,110,889 590,889,283 568,640,908 558,586,426 544,893,978
Primary government
Net investment in capital assets 1,183,374,434 1,158,382,938 1,177,157,496 1,168,411,247 1,152,401,689 1,171,032,314 1,152,737,269 1,156,592,560 1,007,708,227 987,676,593
Restricted 246,792,309 232,837,274 217,555,509 209,322,444 193,727,237 148,176,114 140,567,354 187,988,624 212,517,979 201,158,179
Unrestricted 171,933,050 190,751,156 172,517,787 150,709,342 74,780,846 492,620,438 499,089,673 483,891,262 351,731,075 346,527,454
Total primary government net position $ 1,602,099,793 1,581,971,368 1,567,230,792 1,528,443,033 1,420,909,772 1,811,828,866 1,792,394,296 1,828,472,446 1,571,957,281 1,535,362,226
(1) reduction in 2014-15 unrestricted net position due primarily to the implementation of GASB 68
CITY OF SANTA MONICA, CALIFORNIA
Net Position by Component
Last Ten Fiscal Years
(Accrual Basis of Accounting)
151

TABLE 2
2018-19 2017-18 2016-17 2015-16 2014-15 2013-14 2012-13 2011-12 2010-11 2009-10
Expenses
Governmental activities:
General government $ 87,251,208 94,164,749 69,476,662 56,728,329 74,025,357 73,188,788 56,319,178 65,640,271 61,586,151 61,396,079
Public safety 160,531,648 152,313,163 133,497,286 128,149,081 112,278,370 113,899,354 103,594,567 108,205,471 99,949,848 97,744,567
General services 85,528,797 85,543,024 84,190,176 84,178,175 71,906,263 69,637,595 64,654,131 55,341,929 43,762,251 74,233,708
Cultural and recreation services 73,315,694 73,826,217 57,709,552 58,427,336 53,694,823 54,339,022 94,635,112 62,145,219 57,163,928 40,891,483
Library 14,985,755 14,802,469 12,945,988 14,338,093 12,678,896 13,286,929 16,179,779 11,899,948 11,803,735 11,324,327
Housing and community development 60,314,000 58,442,889 54,613,906 59,633,639 53,831,747 53,652,994 54,539,141 181,970,013 89,321,590 110,251,868
Interest on long-term debt 6,187,333 4,375,324 2,490,698 2,668,433 3,521,630 3,915,313 3,898,325 6,585,618 10,461,700 7,075,187
Total governmental activities 488,114,435 483,467,835 414,924,268 404,123,086 381,937,086 381,919,995 393,820,233 491,788,469 374,049,203 402,917,219
Business-type activities:
Water 23,490,062 25,659,062 23,583,279 23,259,781 21,356,497 24,750,234 20,244,099 19,665,696 16,430,207 16,419,201
Resource recovery and recycling 27,292,721 26,293,628 25,512,992 25,419,861 23,819,237 24,115,496 22,743,427 25,065,338 21,338,133 20,293,510
Community broadband 2,519,298 1,926,149 1,907,535 — — — — — — —
Pier 9,265,493 7,880,131 7,597,438 6,935,901 6,909,632 6,310,236 6,145,567 5,803,944 5,299,875 5,122,011
Wastewater 20,423,956 18,802,613 17,855,472 16,485,444 17,335,625 20,479,514 16,853,861 18,186,844 16,546,844 16,844,271
Civic auditorium (1) — — — — — — 4,691,051 3,239,999 3,638,257 3,663,427
Airport 9,627,471 12,912,869 8,595,011 5,335,556 5,293,714 5,440,949 5,188,707 5,270,688 5,970,916 4,640,782
Storm water management 380,752 359,488 347,197 2,447,698 2,172,116 651,361 406,721 411,985 422,048 424,122
Cemetery 1,805,703 2,071,650 2,340,685 2,184,834 2,154,147 2,077,486 1,852,839 1,812,098 2,431,791 2,633,893
Big Blue Bus 100,093,505 95,349,727 93,652,844 90,560,535 83,106,447 79,215,680 79,238,668 79,835,156 75,219,425 70,899,277
Special aviation — — — — — — — — — —
Parking authority 422,090 216,253 16,178 17,742 403,822 369,367 295,651 315,736 474,629 554,117
Total business-type activities 195,321,051 191,471,570 181,408,631 172,647,352 162,551,237 163,410,323 157,660,591 159,607,484 147,772,125 141,494,611
Total primary governmental activities expenses $ 683,435,486 674,939,405 596,332,899 576,770,438 544,488,323 545,330,318 551,480,824 651,395,953 521,821,328 544,411,830
Program revenues
Governmental activities:
Charges for services:
General government $ 19,645,270 19,860,025 18,447,588 19,279,411 56,875,636 55,834,348 51,075,759 48,239,920 42,771,812 34,681,601
Public safety 21,765,362 24,701,782 22,452,698 24,285,947 22,601,990 22,736,167 21,329,504 22,033,156 21,456,284 22,759,704
General services 45,214,114 43,938,775 44,701,036 49,336,541 2,144,800 2,236,781 2,463,402 2,429,537 2,004,958 3,067,408
Cultural and recreation services 23,412,204 25,508,247 20,835,717 22,466,168 21,359,942 20,448,165 17,921,711 16,083,451 13,523,507 14,219,229
Library 437,269 390,306 388,273 487,809 601,618 614,715 486,204 465,891 488,279 468,385
Housing and community development 25,710,747 26,517,764 29,898,563 42,858,129 26,957,697 19,276,227 28,217,736 16,712,921 14,304,279 16,224,777
Operating grants and contributions 32,835,027 28,012,480 27,933,580 24,647,506 26,332,256 27,773,525 25,798,880 26,739,187 29,111,918 27,556,715
Capital grants and contributions 5,863,192 5,378,290 9,756,158 12,616,479 5,381,978 12,583,594 5,082,847 3,369,221 3,997,076 6,506,765
Total governmental activities program revenues 174,883,185 174,307,669 174,413,613 195,977,990 162,255,917 161,503,522 152,376,043 136,073,284 127,658,113 125,484,584
(continues next page)
CITY OF SANTA MONICA, CALIFORNIA
Changes in Net Position
Last Ten Fiscal Years
152

TABLE 2
2018-19 2017-18 2016-17 2015-16 2014-15 2013-14 2012-13 2011-12 2010-11 2009-10
CITY OF SANTA MONICA, CALIFORNIA
Changes in Net Position
Last Ten Fiscal Years
(continues from previous page)
Business-type activities:
Charges for services:
Water 26,851,412 25,946,122 24,280,023 22,311,686 22,664,712 22,902,640 22,254,867 19,897,464 17,507,315 15,771,081
Resource recovery and recycling 27,444,457 26,393,055 25,953,777 26,831,010 24,425,879 23,271,775 23,526,423 22,253,758 21,870,554 21,514,219
Community broadband 2,489,716 2,200,733 1,924,777 — — — — — — —
Pier 9,188,924 8,453,618 8,202,073 7,443,351 6,813,625 5,953,173 4,589,503 6,004,005 4,729,725 3,777,219
Wastewater 19,626,512 19,802,308 20,221,930 19,316,170 20,162,516 21,033,699 21,126,054 20,007,219 17,820,805 15,198,022
Civic auditorium (1) — — — — — — 1,468,300 1,667,172 2,603,146 2,620,897
Airport 15,690,488 14,132,521 13,149,493 8,679,711 5,897,240 5,396,797 4,185,172 3,891,716 3,748,674 3,768,426
Storm water management 1,515,810 1,462,683 1,869,476 1,500,877 1,458,352 1,395,628 1,439,522 1,419,980 1,167,073 1,613,426
Cemetery 1,730,351 2,043,185 1,713,212 1,501,371 1,604,607 1,325,778 1,315,119 1,133,990 856,141 952,972
Big Blue Bus 16,313,026 25,552,378 19,202,854 19,895,338 16,664,916 17,060,923 16,869,809 16,614,711 16,370,290 14,160,133
Parking authority — — — — — — — 161,504 152,200 152,200
Operating grants and contributions 59,339,434 44,278,243 48,313,010 48,652,428 47,098,487 40,691,095 38,229,718 38,424,357 36,001,870 38,843,722
Capital grants and contributions 23,851,525 17,959,046 23,062,625 23,924,743 10,333,281 28,431,734 21,489,216 25,609,158 32,046,978 29,299,894
Business-type activities program revenues 204,041,655 188,223,892 187,893,250 180,056,685 157,123,615 167,463,242 156,493,703 157,085,034 154,874,771 147,672,211
Total primary government program revenues 378,924,840 362,531,561 362,306,863 376,034,675 319,379,532 328,966,764 308,869,746 293,158,318 282,532,884 273,156,795
Net (expense):
Governmental activities (313,231,250) (309,160,166) (240,510,655) (208,145,096) (219,681,169) (220,416,473) (241,444,190) (355,715,185) (246,391,090) (277,432,635)
Business-type activities 8,720,604 (3,247,678) 6,484,619 7,409,333 (5,427,622) 4,052,919 (1,166,888) (2,522,450) 7,102,646 6,177,600
Total primary government net expense (304,510,646) (312,407,844) (234,026,036) (200,735,763) (225,108,791) (216,363,554) (242,611,078) (358,237,635) (239,288,444) (271,255,035)
General revenues and other changes
in net position
Governmental activities:
Taxes:
Business 31,947,056 31,575,297 30,711,579 30,799,020 31,468,959 30,847,105 28,467,477 27,382,495 26,531,627 27,582,398
Property 62,615,270 56,954,925 56,423,891 50,452,377 52,771,401 47,729,105 43,477,118 59,161,313 108,995,358 110,188,615
Transient occupancy (2) 60,762,881 60,631,025 55,532,325 51,021,050 — — — — — —
Sales and use 73,709,191 68,479,438 54,505,239 54,802,839 51,089,716 49,210,039 47,880,634 45,831,961 31,689,531 26,636,653
Utility users (2) 28,306,582 29,288,341 29,437,753 30,772,815 — — — — — —
Real property transfer (2) 9,808,072 8,169,163 10,951,756 7,850,960 — — — — — —
Parking facility (2) 12,699,044 11,557,811 11,231,324 10,718,156 — — — — — —
Other 3,275,912 3,285,670 3,256,799 3,111,764 101,677,478 95,604,341 91,384,006 84,935,499 80,376,978 75,397,844
Settlement income — — — — — — 9,608,247 3,750,000 — —
Other revenues 11,328,286 11,168,233 11,724,228 15,572,745 11,518,022 18,092,058 19,917,250 120,208,757 12,173,094 9,043,114
Investment earnings 21,569,426 4,360,799 3,105,772 7,049,816 4,084,621 6,613,322 1,431,317 5,791,811 7,995,401 10,062,739
Special Item — 43,678,729 (1,103,146) (11,893,876) — — — — — —
Extraordinary gain (loss) — — — (12,620,539) (5,106,828) (19,149,679) (48,185,126) 261,255,080 — —
Transfers (15,670,477) 1,381,459 5,449,293 6,969,835 2,341,674 1,683,146 (10,863,258) (6,141,048) 1,531,708 (23,779)
Total governmental activities 300,351,243 330,530,890 271,226,813 244,606,962 249,845,043 230,629,437 183,117,665 602,175,868 269,293,697 258,887,584
(continues next page)
153

TABLE 2
2018-19 2017-18 2016-17 2015-16 2014-15 2013-14 2012-13 2011-12 2010-11 2009-10
CITY OF SANTA MONICA, CALIFORNIA
Changes in Net Position
Last Ten Fiscal Years
(continues from previous page)
Business-type activities:
Other revenues 3,049,645 4,580,112 4,312,287 3,723,521 6,230,537 5,207,445 12,540,746 5,310,643 6,767,730 3,912,725
Investment earnings 7,051,704 1,573,331 1,620,842 3,489,865 1,408,083 1,644,388 11,259 1,125,241 1,353,780 2,893,193
Special Item — 6,408,992 1,103,146 10,617,561 — — — — — —
Extraordinary gain (loss) — — — 4,837,753 — — — — — —
Transfers 15,670,477 (1,381,459) (5,449,293) (6,969,835) (2,341,674) (1,683,146) 10,863,258 6,141,048 (1,531,708) 23,779
Total business-type activities 25,771,826 11,180,976 1,586,982 15,698,865 5,296,946 5,168,687 23,415,263 12,576,932 6,589,802 6,829,697
Total primary government 326,123,069 341,711,866 272,813,795 260,305,827 255,141,989 235,798,124 206,532,928 614,752,800 275,883,499 265,717,281
Changes in net position
Governmental activities (12,880,007) 21,370,724 30,716,158 36,461,866 30,163,874 10,212,964 (58,326,525) 246,460,683 22,902,607 (18,545,051)
Business-type activities 34,492,430 7,933,298 8,071,601 23,108,198 (130,676) 9,221,606 22,248,375 10,054,482 13,692,448 13,007,297
Total primary government $ 21,612,423 29,304,022 38,787,759 59,570,064 30,033,198 19,434,570 (36,078,150) 256,515,165 36,595,055 (5,537,754)
(1) Civic auditorium merged with General services in FY 13-14.
(2) Included in "Other" in prior fiscal years.
154

TABLE 3
2018-19 2017-18 2016-17 2015-16 2014-15 2013-14 2012-13 2011-12 2010-11 2009-10
General Fund
Reserved $ — — — — — — — — — 36,257,776
Unreserved — — — — — — — — — 179,212,920
* Nonspendable 11,554,753 12,853,565 15,419,253 21,062,205 23,725,864 22,257,819 22,179,119 22,181,490 26,249,121 —
* Restricted 69,975,839 97,740,458 1,976,576 18,330,042 17,951,299 12,371,619 23,808,940 43,056,449 503,645 —
* Committed 1,943,558 2,478,476 4,760,409 31,365 520,574 519,937 519,506 640,000 710,000 —
* Assigned 182,199,922 256,273,855 256,059,633 280,303,334 218,630,183 212,669,876 220,409,168 233,153,471 159,430,759 —
* Unassigned 75,004,708 66,464,774 68,082,651 67,347,773 114,196,108 118,192,052 117,324,362 117,225,871 108,382,191 —
Total General Fund 340,678,780 435,811,128 346,298,522 387,074,719 375,024,028 366,011,303 384,241,095 416,257,281 295,275,716 215,470,696
All other governmental funds
Reserved — — — — — — — — — 138,504,430
Unreserved, reported in:
Special revenue funds — — — — — — — — — 37,657,180
Capital project funds — — — — — — — — — 50,427,715
* Nonspendable 13,864,136 12,752,261 12,149,082 11,618,768 11,463,849 30,932,430 31,524,610 23,331,591 10,788,188 —
* Restricted 209,832,078 192,169,730 184,752,868 167,750,111 144,902,038 128,610,718 124,852,862 123,658,262 170,449,269 —
* Committed 80,754,976 59,897,829 44,021,082 26,876,316 17,877,709 4,404,491 4,372,829 872,830 51,975 —
* Assigned — — 414,544 927,562 9,649,617 18,033,673 15,057,474 32,550,023 125,697,278 —
* Unassigned (3,571,636) (2,111,163) (4,785,448) (7,279,890) (814,287) (966,157) (1,148,932) (187,396) (16,868,340) —
Total all other governmental funds $ 300,879,554 262,708,657 236,552,128 199,892,867 183,078,926 181,015,155 174,658,843 180,225,310 290,118,370 226,589,325
* Fund Balance descriptions changed due to GASB Statement No. 54 implementation effective July 1, 2010.
CITY OF SANTA MONICA, CALIFORNIA
Fund Balance of Governmental Funds
Last Ten Fiscal Years
(Modified Accrual Basis of Accounting)
155

TABLE 4
2018-19 2017-18 2016-17 2015-16 2014-15 2013-14 2012-13 2011-12 2010-11 2009-10
Revenues
Property taxes 62,615,270$ 56,954,925$ 56,423,891 50,452,377 55,044,307 50,113,693 44,392,416 40,226,124 36,048,260 37,419,658
Incremental property taxes (1) — — — — — — — 19,794,851 73,735,955 73,526,738
Sales & use taxes 73,709,191 68,479,438 54,505,239 54,802,839 51,089,716 49,210,039 47,880,634 45,831,961 31,689,531 26,636,653
Transient occupancy taxes (3) 60,762,881 60,631,025 55,532,325 51,021,050 — — — — — —
Utility user taxes (3) 28,306,582 29,288,341 29,437,753 30,772,815 — — — — — —
Business license taxes (3) 31,947,056 31,050,087 30,118,555 29,893,341 — — — — — —
Other taxes 25,783,028 23,537,854 26,032,957 22,586,559 132,075,022 126,836,936 118,983,521 111,350,245 107,289,588 104,012,543
License and permits 45,099,447 41,950,905 43,134,856 41,367,924 39,490,688 36,967,493 33,777,567 30,608,592 27,564,660 20,658,582
Intergovernmental 38,315,887 37,496,608 39,612,637 39,612,770 31,013,327 33,068,906 26,420,260 28,277,049 30,887,064 30,132,263
Charges for services 65,847,661 66,615,431 63,821,708 61,667,576 56,381,352 55,976,703 50,767,945 52,613,331 45,248,472 46,975,370
Fines and forfeitures 14,877,572 16,362,857 15,461,662 15,904,736 16,287,290 16,253,546 15,303,990 15,651,820 15,952,957 17,492,928
Investment earnings 20,487,980 3,406,372 2,835,151 6,721,207 4,002,879 6,697,552 1,519,576 4,989,972 9,376,656 9,218,863
Rental income 8,986,944 9,596,580 9,047,246 11,683,408 10,602,671 10,311,967 9,843,633 9,619,254 8,541,702 7,026,380
Settlement income — 14,085,000 6,103,175 2,433,175 2,433,175 2,433,175 52,287,404 33,277,271 — 40,196,472
Other 13,220,933 15,896,665 18,757,976 34,384,558 21,058,609 19,309,109 25,518,965 119,494,012 10,306,512 10,833,352
Total revenue 489,960,432 475,352,088 450,825,131 453,304,335 419,479,036 407,179,119 426,695,911 511,734,482 396,641,357 424,129,802
Expenditures
Current
General government 105,337,602 89,671,970 70,164,311 61,354,272 74,741,301 68,308,134 62,250,475 63,819,021 61,134,533 58,843,432
Public safety 168,292,252 144,607,883 136,266,910 132,629,455 117,186,887 111,737,328 104,466,191 106,215,553 99,416,830 99,142,700
General services 83,416,269 87,758,312 83,912,385 88,130,346 71,370,399 57,755,687 58,014,505 77,196,770 34,401,503 97,766,993
Cultural and recreation services 71,499,049 71,348,237 56,868,240 54,742,936 50,430,614 50,386,583 64,104,725 60,322,014 58,557,389 38,707,842
Library 13,663,753 12,967,345 12,476,127 12,667,433 12,025,143 17,158,001 14,880,934 11,323,906 10,594,925 10,067,865
Housing and community development 56,563,679 56,248,372 53,807,030 67,085,802 53,711,340 72,037,131 107,699,039 197,257,796 139,291,179 108,277,261
Other — — — — — — — — — —
Debt service
Principal 4,630,000 9,039,900 6,255,000 8,788,463 6,075,000 5,920,000 3,365,000 13,180,714 9,241,980 7,530,000
Interest 6,310,437 3,596,620 3,014,688 3,392,287 3,785,591 3,966,495 3,942,925 12,312,625 10,059,522 10,079,799
Bond issuance costs 4,025 938,932 — 535,048 — — — 441,993 440,308 219,405
Total expenditures 509,717,066 476,177,571 422,764,691 429,326,042 389,326,275 387,269,359 418,723,794 542,070,392 423,138,169 430,635,297
(continues next page)
CITY OF SANTA MONICA, CALIFORNIA
Changes in Fund Balance of Governmental Funds
Last Ten Fiscal Years
(Modified Accrual Basis of Accounting)
156

TABLE 4
2018-19 2017-18 2016-17 2015-16 2014-15 2013-14 2012-13 2011-12 2010-11 2009-10
CITY OF SANTA MONICA, CALIFORNIA
Changes in Fund Balance of Governmental Funds
Last Ten Fiscal Years
(Modified Accrual Basis of Accounting)
(continues from previous page)
Excess (deficiency) of revenues
over (under) expenditures (19,756,634) (825,483) 28,060,440 23,978,293 30,152,761 19,909,760 7,972,117 (30,335,910) (26,496,812) (6,505,495)
Other financing sources (uses)
Transfers in 46,580,497 41,609,095 48,828,408 24,241,261 19,778,209 26,210,910 21,906,283 98,800,641 108,200,623 53,644,396
Transfers out (83,785,317) (40,405,415) (43,585,095) (17,271,426) (17,289,889) (24,648,414) (32,010,088) (105,257,875) (106,957,815) (53,948,675)
Line of credit proceeds — — — — — — — — 26,528,395 7,986,281
Long-term debt issued — — — — — — — 32,178,250 — —
Refunding bonds issued — — — 26,360,000 — — — 19,950,000 41,050,000 9,155,000
Bonds issued — 102,785,000 — — — — — — — —
Premium on bonds issued — 12,247,767 — 2,020,710 — — — 4,339,840 409,674 558,699
Payments to refunded bond escrow agent — — — (27,826,666) — — — (22,289,654) (1,900,000) (9,478,850)
Proceeds from loans payable — — — — — — — — 102,500,000 —
Total other financing sources (uses) (37,204,820) 116,236,447 5,243,313 7,523,879 2,488,320 1,562,496 (10,103,805) 27,721,202 169,830,877 7,916,851
Special item — — (37,420,689) (4,462,166) — — (21,254,908) — — —
Extraordinary gain (loss) — — — 324,615 (21,564,585) (33,345,736) (14,196,057) 13,703,213 — —
Net change in fund balance (56,961,454)$ 115,410,964 (4,116,936) 27,364,621 11,076,496 (11,873,480) (37,582,653) 11,088,505 143,334,065 1,411,356
Debt service as a percentage of noncapital
expenditures (2) 2.41% 2.91% 2.33% 3.16% 2.65% 2.76% 2.07% 5.23% 5.34% 4.25%
(1) Incremental property tax was received by the redevelopment agency which was dissolved in FY 2011-12
(2) Calculation includes only the principal and interest components of debt service expenditures when calculating this ratio for all years.
(3) Included in "Other taxes" in prior fiscal years.
157

TABLE 5
2018-19 2017-18 2016-17 2015-16 2014-15 2013-14 2012-13 2011-12 2010-11 2009-10
Sales and use taxes 73,709$ 68,480 54,505 54,803 51,090 49,210 47,881 45,832 31,690 26,637
Utility user taxes 28,307 29,288 29,438 30,773 32,066 32,817 31,450 31,296 31,625 31,620
Transient occupancy taxes 60,763 60,631 55,532 51,021 47,629 44,396 40,997 36,143 32,747 29,804
Property taxes (2) 62,615 56,955 56,424 50,452 55,044 50,114 44,392 40,226 36,048 37,420
Business license taxes 31,947 31,575 30,712 30,799 30,354 29,783 27,518 26,325 25,480 26,553
Parking facility tax 12,699 11,558 11,231 10,718 11,072 10,598 9,954 9,394 8,786 7,848
Documentary Transfer Tax 9,808 8,169 10,952 7,851 7,903 6,273 6,027 5,192 3,954 3,432
Vehicle license fees 44 49 42 38 38 39 48 46 492 273
Condominium taxes 25 9 38 73 45 14 18 37 21 19
Total 279,917 266,714 248,874 236,528 235,241 223,244 208,285 194,491 170,843 163,606
(1)
(2)
Source: City of Santa Monica Finance Department
CITY OF SANTA MONICA, CALIFORNIA
General Fund Tax Revenues by Source (1)
Last Ten Fiscal Years
(In Thousands)
Source
Does not include Highway Users Taxes, which are recorded in the Gas Tax Fund, Unit Dwelling Taxes, which are recorded in the Parks and Recreation Facilities Fund, or TORCA Conversion Taxes, which are recorded in the TORCA Fund.
Includes ad valorem property taxes for purposes of paying debt service on general obligation bonds. Does not include tax increment received by redevelopment area.
$
158

TABLE 6
Fiscal
year Land Improvements
Personal
property Public utilities Secured gross Exemptions (1) Secured net Net unsecured
Net assessed
valuations
Total Direct
Tax Rate (2)
2018-19 $ 22,406,863 $ 15,268,820 $ 428,740 $ - $ 38,104,423 $ 1,628,684 $ 36,475,739 $ 1,002,111 $ 37,477,850 1.00%
2017-18 20,799,168 14,235,956 124,391 - 35,159,515 1,656,924 33,502,591 925,241 34,427,832 1.00%
2016-17 19,308,450 13,550,065 48,643 - 32,907,158 653,548 32,253,610 906,371 33,159,981 1.00%
2015-16 17,890,583 12,932,934 472,362 - 31,295,879 1,042,924 30,252,955 902,502 31,155,457 1.00%
2014-15 16,867,678 12,433,379 437,194 742 29,738,993 1,609,033 28,129,960 916,381 29,046,341 1.00%
2013-14 16,046,789 11,701,427 402,171 742 28,151,130 1,573,052 26,578,078 936,031 27,514,109 1.00%
2012-13 14,828,199 10,846,677 370,673 742 26,046,292 1,222,722 24,823,570 942,035 25,765,605 1.00%
2011-12 14,235,295 10,349,621 228,784 742 24,814,442 1,073,027 23,741,415 902,707 24,644,122 1.00%
2010-11 13,795,191 10,070,986 230,387 742 24,097,305 1,095,461 23,001,845 880,331 23,882,176 1.00%
2009-10 13,972,767 9,978,675 234,194 742 24,186,379 1,134,967 23,051,412 969,009 24,020,421 1.00%
(1) Excludes Homeowner Exemption. City is reimbursed by State for taxes lost because of these exemptions.
(2) Excludes Direct and Overlapping Rates. See Table 7 for Direct and Overlapping Rates.
Source: Los Angeles County Auditor-Controller
CITY OF SANTA MONICA, CALIFORNIA
Assessed Value and Actual Value of Taxable Property
Last Ten Fiscal Years
(In Thousands)
159

TABLE 7
Fiscal City County School Miscellaneous
year General Fund General Fund districts special districts Total
2018-19 0.01$ 1.00$ 0.12$ — 1.13$
2017-18 0.01 1.00 0.14 — 1.15
2016-17 0.01 1.00 0.13 — 1.14
2015-16 0.01 1.00 0.13 — 1.14
2014-15 0.01 1.00 0.13 — 1.14
2013-14 0.01 1.00 0.13 — 1.14
2012-13 0.01 1.00 0.13 — 1.14
2011-12 0.01 1.00 0.13 — 1.14
2010-11 0.01 1.00 0.13 — 1.14
2009-10 0.01 1.00 0.13 — 1.14
CITY OF SANTA MONICA, CALIFORNIA
Direct and Overlapping Property Tax Rates*
Last Ten Fiscal Years
* Property tax rate is per $100 of assessed value. Since 1978-79, the maximum allowable rate is levied by the County, property taxes are
collected by the County, and the County allocates the City's share in accordance with distribution formulas established by law. Effective 1981-
82, Proposition 13 allowed jurisdictions to impose rates over the $1.00 base rate only for bonded debt approved by the voters prior to 1978.
However, in 1986, the State Constitution was amended to allow rates over the $1.00 base rate for voter approved general obligation bonds.
City General Fund is allocated approximately $.14 of each $1.00 of the County General Fund amount.
Source: Los Angeles County Auditor-Controller
160

TABLE 8
Taxable Taxable
assessed assessed
Taxpayer value Rank value Rank
De Pacific 233 LLC 661,360,154$ 1 1.79 % — $ — %
California Colorado Center LLC 532,547,288 2 1.44 470,425,014 1 1.95
Water Garden Company 517,040,740 3 1.40 456,900,932 2 1.90
Lantana Media Campus LLC 411,060,000 4 1.11 — —
Office Block Investment LLC 375,343,715 5 1.01 — —
SC Enterprises SMBP LLC 357,959,427 6 0.97 304,000,000 4 1.26
Macerich SMP LP 349,569,934 7 0.94 — —
MDP SPE 1LP 223,286,547 8 0.60 — —
Prudential Insurance 199,675,464 9 0.54 — —
Hart Arboretum LLC 181,549,372 10 0.49 — —
Douglas Emmett Realty Fund — — 307,106,724 3 1.27
CREP 2700 Holdings LLC — — 226,807,200 5 0.94
Ocean Avenue LLC — — 145,571,407 6 0.60
Equity Office Properties Trust — — 138,508,958 7 0.57
New Santa Monica Beach Hotel — — 138,119,347 8 0.57
Maguire Properties Lantana North — — 136,458,496 9 0.57
Rand Corporation — — 132,635,402 10 0.55
Total principal property taxpayers
assessed value 3,809,392,641$ 10.29 % 2,456,533,480$ 10.18 %
Total City net taxable assessed value 37,050,442,968$ 100.00 % 24,096,850,114$ 100.00 %
Source: City of Santa Monica Finance Department; Hdl, Coren and Cone; Los Angeles County Auditor-Controller
value value
of total City of total City
taxable taxable
assessed assessed
Percentage Percentage
CITY OF SANTA MONICA, CALIFORNIA
Principal Property Taxpayers
Current Fiscal Year and Nine Years Ago
2018-19 2009-10
161

TABLE 9
Fiscal year
Total secured tax
levy
Current secured
tax collections
Delinquent
secured tax
collections (1)
Total tax
collections
Outstanding
delinquent taxes
(2)
2018-19 32,779,676$ 32,167,281$ 98.1 % 419,000$ 32,586,281$ 99.4 % 407,817$ 1.2 %
2017-18 30,578,295 30,099,534 98.4 479,245 30,578,779 100.0 379,776 1.2
2016-17 30,859,806 30,545,235 99.0 489,991 31,035,226 100.6 375,288 1.2
2015-16 25,198,360 27,662,256 109.8 512,080 28,174,336 111.8 358,568 1.4
2014-15 26,567,114 26,190,114 98.6 600,642 26,790,756 100.8 438,248 1.6
2013-14 25,173,273 24,689,372 98.1 570,037 25,259,409 100.3 512,940 2.0
2012-13 23,446,717 23,428,590 99.9 713,956 24,142,546 103.0 585,417 2.5
2011-12 23,211,627 22,641,826 97.5 645,927 23,287,753 100.3 661,315 2.8
2010-11 22,293,648 21,759,685 97.6 937,340 22,697,025 101.8 669,232 3.0
2009-10 22,585,685 21,724,105 96.2 1,262,484 22,986,589 101.8 690,928 3.1
(1) Exclusive of penalties and collections related to tax overrides for debt service on general obligation bonds.
(2)
Source: County of Los Angeles
Reflects City of Santa Monica proportionate share of county-wide outstanding delinquencies. The Los Angeles County property tax system does not provide City of Santa Monica specific statistics related to
delinquencies. Should the County change their system to include specific city data, the table will be updated to adjust delinquent taxes by year.
CITY OF SANTA MONICA, CALIFORNIA
Property Tax Levies and Collections
Last Ten Fiscal Years
Percent of levy
collected
Total secured tax
collections as
percent of total tax
levy
Outstanding
delinquent taxes as
percent of total
secured tax levy
162

TABLE 10
Business 2018 2017 2016 2015 2014 2013 2012 2011 2010 2009
Apparel stores 344,337$ 362,841 395,249 390,071 394,070 401,761 391,145 372,497 301,972 279,184
General merchandise 56,860 78,610 89,282 93,741 100,267 106,569 113,745 112,391 66,732 28,622
Food stores 91,803 87,888 88,196 87,729 86,615 82,367 79,495 76,420 73,944 76,155
Eating & drinking places 716,826 693,473 687,794 638,818 598,468 561,613 540,315 503,243 453,736 429,872
Building materials 114,802 112,587 110,186 113,405 114,156 102,818 88,761 88,391 86,558 86,386
Auto dealers & auto suppliers 854,723 766,512 770,658 757,333 739,833 697,249 653,869 632,489 598,461 606,388
Service stations 101,275 90,164 81,810 96,004 112,717 120,566 127,052 126,247 106,520 99,030
Other retail stores 665,606 695,449 657,236 692,105 677,744 657,413 664,771 659,166 582,457 543,826
Retail stores total 2,946,232 2,887,524 2,880,411 2,869,206 2,823,870 2,730,356 2,659,153 2,570,844 2,270,380 2,149,463
All other outlets 904,103 829,773 804,321 787,252 754,803 707,580 646,311 615,753 558,553 537,884
Total all outlets 3,850,335$ 3,717,297 3,684,732 3,656,458 3,578,673 3,437,936 3,305,464 3,186,597 2,828,933 2,687,347
(1) Prior years amounts have been revised to reflect the change of sales tax administration reporting from the State Board of Equalization to the Department of Taxes and Fees Administration;
Amounts do not include allocations from State or County Pools.
Source: State Board of Equalization, California Department of Taxes and Fees Administration, State Controller's Office, The HdL Companies
CITY OF SANTA MONICA, CALIFORNIA
Taxable Transactions by Type of Business (1)
Last Ten Calendar Years
(In Thousands)
Calendar Year
163

TABLE 11
Fiscal
year
General
obligation
bonds
Tax allocation
bonds*
Lease revenue
bonds
Term loans
payable (2)
Line of
credit (2)
Wastewater
bonds
Term loans
payable
Total primary
government
Percentage of
net assessed
valuation (1) Per capita
2018-19 4,754,709$ — 166,858,953$ 200,000$ — 7,074,741$ 855,820$ 179,744,223$ 0.48% 1,920
2017-18 6,012,945 — 171,078,364 400,000 — 9,304,636 661,765 187,457,710 0.54% 2,028
2016-17 7,281,181 — 64,474,634 400,000 — 9,404,529 921,636 82,481,980 0.25% 879
2015-16 8,554,417 — 69,944,367 400,000 — 9,504,426 1,213,411 89,616,621 0.29% 957
2014-15 9,857,652 — 77,431,209 400,000 — 9,604,321 1,497,792 98,790,974 0.34% 1,059
2013-14 11,205,890 — 82,503,548 400,000 — 9,704,216 1,774,966 105,588,620 0.38% 1,145
2012-13 12,518,284 — 87,039,302 400,000 — 17,763,125 2,045,117 119,765,828 0.46% 1,316
2011-12 12,650,793 — 90,574,837 400,000 — 19,319,815 2,308,422 125,253,867 0.51% 1,388
2010-11 15,044,398 103,546,185 61,882,893 101,468,020 50,000,000 20,727,517 2,565,054 355,234,067 1.49% 3,939
2009-10 16,793,432 66,727,384 65,049,340 400,000 23,471,605 22,107,109 2,837,400 197,386,270 0.82% 2,129
Note: Details regarding the City's outstanding debt can be found in the Note 9 fo the Financial Statements.
All bonds amounts are updated to reflect net of related premiums, discounts, and adjustments.
(1) Net assessed property valuations have been used because personal income is not available. See Table 6 for net assessed valuations.
(2) Redevelopment debt was transferred to the Successor Agency on February 1, 2012.
CITY OF SANTA MONICA, CALIFORNIA
Ratios of Outstanding Debt by Type
Last Ten Fiscal Years
Governmental activities Business-type activities
164

TABLE 12
2018-19 2017-18 2016-17 2015-16 2014-15 2013-14 2012-13 2011-12 2010-11 2009-10
General bonded debt outstanding
General obligation bonds 4,754,709$ 6,012,945 7,281,181 8,554,417 9,857,652 11,205,890 12,518,284 12,650,793 15,044,398 16,793,432
Less: Amounts Available in Debt 1,110,000 1,120,000 1,130,000 1,135,000 1,165,000 1,210,000 1,225,000 — — —
Service Fund (4)
Tax allocation bonds (3) — — — — — — — - 103,546,185 66,727,384
Total 3,644,709$ 4,892,945 6,151,181 7,419,417 8,692,652 9,995,890 11,293,284 12,650,793 118,590,583 83,520,816
Assessed value (in thousands) (1) 37,477,850$ 34,427,832 33,159,981 31,155,457 29,046,341 27,514,109 25,765,605 24,644,122 23,882,176 24,096,850
Percentage of assessed
Property value 0.01% 0.01% 0.02% 0.02% 0.03% 0.04% 0.04% 0.05% 0.50% 0.35%
Population (2) 93,593 92,416 93,834 93,640 93,283 92,185 91,040 90,223 90,174 92,703
Per capita 39$ 53 66 79 93 108 124 140 1,315 901
(1) See Table 6 for Assessed Value Data
(2) See Table 16 for Population Data
(3) Redevelopment debt was transferred to the Successor Agency on February 1, 2012.
(4) This is the amount restricted for debt service principal payments.
All bonds amounts are net of related premiums, discounts, and adjustments.
CITY OF SANTA MONICA, CALIFORNIA
Ratios of General Bonded Debt
Last Ten Fiscal Years
165

TABLE 13
Estimated Estimated share
Debt Percentage of Overlapping
Outstanding Applicable (1) Debt
Overlapping debt:
Los Angeles County General Fund Obligations 2,153,701,630$ 2.468% 53,153,356$
Los Angeles County Superintendent of Schools Certificates of Participation 5,827,868 2.468% 143,832
Metropolitan Water District 48,050,000 1.285% 617,443
Santa Monica Community College District 619,229,246 66.254% 410,264,145
Los Angeles Unified School District 10,106,450,000 0.0001% 10,106
Santa Monica-Malibu Unified School District 459,369,497 66.309% 304,603,320
Los Angeles County Regional Park and Open Space Assessment District 13,620,000 2.468% 336,142
Santa Monica Community College District Certificates of Participation 14,475,050 66.254% 9,590,300
Los Angeles Unified School District Certificates of Participation 180,545,000 0.0001% 181
Los Angeles Community College District 3,930,390,000 0.0110% 432,343
Santa Monica-Malibu Unified School District Certificates of Participation 5,452,318 66.309% 3,615,378
Overlapping Tax Increment Debt (Successor Agency): 78,775,000 100.000% 78,775,000
Subtotal, overlapping debt 861,541,546
City direct governmental debt
City of Santa Monica General Obligation Bonds Main Library Improvements (2012) 4,754,709
City of Santa Monica Public Safety Lease Revenue Bonds (2011) 2,169,226
City of Santa Monica Civic Parking Structure Lease Revenue Bonds (2015) 24,861,663
City of Santa Monica Parking Structure 6 Lease Revenue Bonds (2011) 25,432,111
City of Santa Monica City Services Building Lease Revenue Bonds (2017) 200,000
City of Santa Monica Fire Station 1 Lease Revenue Bonds (2018) 76,808,352
State Dept of Housing and Community Development 37,587,601
Subtotal, direct debt (2) 171,813,662
Total direct and overlapping governmental debt (3) 1,033,355,208$
(1) Percentage of overlapping agency's assessed valuation located within boundaries of the city.
(2) Net of issuance discounts and premiums.
(3) Excludes tax and revenue anticipation notes, enterprise revenue, mortgage revenue and tax
allocation bond and non-bonded capital lease obligations.
Source for overlapping debt information: California Municipal Statistics, Inc.
CITY OF SANTA MONICA, CALIFORNIA
Direct and Overlapping Governmental Activities Debt
As of June 30, 2019
166

TABLE 14
2018-19 2017-18 2016-17 2015-16 2014-15 2013-14 2012-13 2011-12 2010-11 2009-10
Total net debt applicable to limit 151,391,076$ 156,788,174 62,271,351 67,444,525 74,876,302 80,994,650 87,000,048 91,804,168 151,252,964 133,493,200
Debt limit 3,610,653,400 3,608,475,600 3,381,352,900 3,219,838,100 3,065,537,400 2,908,716,082 2,720,223,142 2,594,319,674 2,531,305,352 2,545,129,908
Legal debt margin 3,459,262,324 3,451,687,426 3,319,081,549 3,152,393,575 2,990,661,098 2,827,721,432 2,633,223,094 2,502,515,506 2,380,052,388 2,411,636,708
Total net debt applicable to the limit
as a percentage of debt limit 4.19% 4.34% 1.84% 2.09% 2.44% 2.78% 3.20% 3.54% 5.98% 5.25%
Net assessed value 34,477,850,000
Add: exempt property 1,628,684,000
Total gross assessed value 36,106,534,000$
Debt limit - 10% of total assessed value (1) 3,610,653,400
Amount of debt applicable to debt limit:
Total bonded debt 156,440,000
Less:
Assets in debt service funds
available for payment of bonds 5,048,924
Total amount of debt applicable to debt limit 151,391,076
Legal debt margin 3,459,262,324$
(1) Per Section 607 of the City Charter, bonded indebtedness of the City may not exceed 10% of total assessed valuation
of property within the City, exclusive of any indebtedness incurred for the purpose of water supply or sewers or storm drains.
Source: City of Santa Monica Finance Department
CITY OF SANTA MONICA, CALIFORNIA
Computation of Legal Debt Margin
Last Ten Fiscal Years
167

TABLE 15
Direct Net revenue
Gross operating available for
revenues expense (1) debt service Principal Interest Total Coverage (2)
21,231,440$ 11,337,168$ 9,894,272$ 2,130,000$ 266,550$ 2,396,550$ 4.13
19,791,873 9,313,707 10,478,165 — 266,550 266,550 39.31
20,069,691 8,779,235 11,290,456 — 266,550 266,550 42.36
19,680,491 9,573,340 10,107,151 — 266,550 266,550 37.92
20,166,164 10,535,135 9,631,029 — 266,550 266,550 36.13
22,556,413 12,823,959 9,732,454 1,785,000 575,698 2,360,698 4.12
22,490,999 9,853,573 12,637,426 1,700,000 674,700 2,374,700 5.32
21,307,472 10,993,468 10,314,004 1,650,000 846,141 2,496,141 4.13
19,117,006 9,547,632 9,569,374 1,600,000 972,738 2,572,738 3.72
17,036,277 9,449,739 7,586,538 1,545,000 1,026,812 2,571,812 2.95
(1)
(2)
On December 16, 2013 Moody's upgraded the underlying rating of the 2005 bonds to Aa1 from Aa2.
On June 1, 2014, the City redeemed remaining balance $7,810,000 of Wastewater Enterprise Refunding Revenue Bonds 2005.
year
CITY OF SANTA MONICA, CALIFORNIA
Wastewater Enterprise Revenue Bonds Coverage
Last Ten Fiscal Years
Fiscal Debt service requirement
Excludes depreciation expense, write-off of disposed assets, and capital-related expenditures.
Bond covenant requires a coverage ratio of 1.20
The Hyperion Project, Wastewater Enterprise Revenue Bonds were issued November 26, 1991 at an interest rate of 6.25% with ratings of A1 from Moody's Investors
Service, Inc. and A+ from Standard & Poor's Corporation. Debt service began in FY 1992-93. These bonds were refunded by the issuance of insured Wastewater
Enterprise Revenue Bonds, 1993 Refunding Series on December 22, 1993 with an interest rate of 5.3084% with ratings of Aaa and AAA by Moody's Investors Services,
Inc. and Standard & Poor's Corporation, respectively. The Refunding Bonds were insured by AMBAC Indemnity.
On October 13, 2005 the City issued $20,305,000 of Wastewater Enterprise Refunding Revenue Bonds bearing interest from 3.00% to 5.00% to defease $21,535,000 of the
outstanding 1993 Wastewater Enterprise Revenue Bonds, 1993 Refunding Series with ratings from Moody's Investor Services, Inc. of A1, Standard & Poor's Corporation of
AA and Fitch Ratings of AAA. The Refunding Bonds are insured by Financial Guaranty Insurance Company.
On April 16, 2010 Moody's upgraded the underlying rating on the Refunding bond to Aa2 and on November 17, 2008 Standard & Poor's Corporation upgraded the
underlying rating to AAA.
On May 30, 2012 the City issued $8,955,000 Wastewater Refunding Revenue Bonds Series 2012A at interest from 2.00% to 4.00% to defease $9,670,000 of the
outstanding 1993 Wastewater Enterprise Revenue Bonds. Standard & Poor's Corporation rated AAA on the 2012A Refunding bond.
Source: City of Santa Monica Finance Department
2018-19
2011-12
2010-11
2009-10
CUSIP 802475
2017-18
2016-17
2015-16
2014-15
2013-14
2012-13
168

TABLE 16
Calendar
year Population (1)
2019 93,593 $ * $ * 4.2 %
2018 92,416 802,394 60,087 4.8
2017 93,834 760,829 57,160 3.4
2016 93,640 727,377 54,526 3.6
2015 93,283 673,074 50,751 6.3
2014 92,185 635,892 48,425 7.1
2013 91,040 604,832 46,337 8.4
2012 90,223 575,044 44,423 8.4
2011 90,174 561,142 43,688 10.5
2010 92,703 565,365 42,784 10.3
* No data is available for 2019 as of publication date of CAFR
Note: Data shown is the Metropolitan Statistical Area of Los Angeles-Long Beach-Santa Ana, CA.
Data by City is not available.
Source: (1) California Department of Finance
(2) and (3) Bureau of Economic Analysis
(4) State of California, Employment Development Department, Labor Market
Information Division
(millions) personal income (3) rate (4)
CITY OF SANTA MONICA, CALIFORNIA
Demographic and Economic Statistics
Last Ten Calendar Years
Personal income (2) Per capita Unemployment
169

TABLE 17
Employers
Number of
employees Rank
Number of
employees Rank
UCLA Medical Center, Santa Monica 2,344 1 2.61 % 1,786 4 2.41 %
City of Santa Monica 2,170 2 2.42 2,177 2 2.93
Santa Monica College 1,800 3/4 2.00 2,187 1 2.95
Providence Saint John's Health Center 1,800 3/4 2.00 1,813 3 2.44
Santa Monica-Malibu Unified School District 1,734 5 1.93 1,553 5 2.09
SNAP Inc 1,400 6 1.56 — —
Activision Publishing 1,231 7 1.37 663 7 0.89
(Includes Beachhead Studios, Treyarch Corp)
Lion's Gate Entertainment Corp 943 8 1.05 — —
RAND Corporation 891 9 0.99 894 6 1.20
Hulu 882 10 0.98 — —
Universal Music Group — — 620 9 0.84
ET Whitehall, Inc. — — 546 10 0.74
(Casa del Mar, Shutters on the Beach)
MTV Networks — — 648 8 0.87
Total jobs provided by principal employers 15,195 12,887
Average total jobs in Santa Monica 89,853 74,237
Principal employers as percent of total jobs 16.91% 17.36%
Source: City of Santa Monica Economic Development Division, Housing and Economic Development Department
Percentage of
total City
employment
Percentage of
total City
employment
CITY OF SANTA MONICA, CALIFORNIA
Principal Employers
Current Year and Nine Years Ago
2018-19 2009-10
170

TABLE 18
2018-19 2017-18 2016-17 2015-16 2014-15 2013-14 2012-13 2011-12 2010-11 2009-10
General government 276.7 277.6 269.7 281.5 265.7 232.9 230.7 238.6 221.7 222.7
Public safety
Police
Sworn 227.0 224.0 224.0 221.0 221.0 216.0 216.0 209.0 216.0 216.0
Non-sworn 203.4 201.4 202.4 202.4 197.4 217.4 220.4 225.4 221.4 227.4
Fire
Sworn 120.0 120.0 120.0 114.0 114.0 108.0 108.0 108.0 105.0 109.0
Non-sworn 16.0 17.0 16.0 15.8 15.8 21.0 21.0 21.0 22.0 19.0
General services 282.0 281.0 281.6 257.3 257.3 256.1 184.3 184.3 261.9 261.3
Cultural and recreation services 152.7 152.7 152.7 153.0 153.7 151.9 231.1 231.1 151.9 152.8
Library 113.5 113.5 112.5 111.0 111.0 114.8 106.1 106.1 107.1 107.3
Housing and community development 164.8 163.2 161.5 159.5 149.8 138.8 144.4 144.4 146.4 148.4
Beach recreation 52.6 52.6 50.5 50.3 48.9 49.9 46.6 46.6 46.6 47.6
Water 47.0 46.0 46.0 46.0 46.0 46.0 46.0 46.0 47.0 47.0
Resource Recovery & Recycling 91.3 92.3 90.7 89.7 87.7 86.7 75.2 84.2 84.2 84.0
Pier 21.9 21.9 20.3 19.3 17.8 17.8 17.2 15.8 16.2 16.2
Wastewater 21.0 22.0 22.2 22.2 22.2 22.2 22.2 22.2 22.2 22.2
Civic Auditorium — — — — — — 11.0 30.3 34.4 34.4
Airport 20.9 27.9 37.9 12.9 12.4 12.5 12.2 4.0 12.2 12.2
Cemetery 7.0 8.0 8.1 7.1 7.1 7.1 12.1 12.1 12.1 11.1
Big Blue Bus 463.0 464.0 462.9 464.5 436.0 435.5 419.0 419.0 413.7 418.7
Vehicle management 29.3 29.3 29.0 29.0 28.0 28.0 28.0 28.0 28.0 28.0
Self insurance - workers' compensation 13.0 13.0 13.0 13.0 12.0 12.0 14.0 14.0 12.0 12.0
Community Broadband 3.0 4.0 4.0 — — — — — — —
Total all funds 2,326.1 2,331.4 2,325.0 2,269.5 2,203.8 2,174.6 2,165.5 2,190.1 2,182.0 2,197.3
Note: Includes permanent and temporary employees (2,080 hours = 1 full-time position).
Source: City of Santa Monica Budget
CITY OF SANTA MONICA, CALIFORNIA
Full-Time Equivalent City Government Employees by Function/Program
Last Ten Fiscal Years
Function/Program
171

TABLE 19
Function / program 2018-19 2017-18 2016-17 2015-16 2014-15 2013-14 2012-13 2011-12 2010-11 2009-10
General government:
Electronic requests for government information 11,784,998 12,465,631 13,811,858 12,558,833 13,410,283 12,420,770 12,175,143 16,000,000 16,000,000 15,900,000
Hours of live public meeting coverage 230 210 220 275 319 284 330 300 300 300
Public safety:
Number of emergency response incidents 17,355 17,199 16,384 15,963 14,629 13,637 13,540 12,842 12,000 12,005
Number of inspections 8,201 8,795 10,592 10,202 8,119 9,031 8,706 9,549 8,549 7,235
Calls to Police Department for service 128,992 134,192 129,524 130,016 133,516 128,323 120,320 105,642 104,097 109,045
Police reports issued 16,043 16,298 14,467 14,358 13,984 13,983 13,708 13,086 13,377 13,995
Number of crimes recorded 10,369 10,008 8,988 8,774 8,500 8,744 8,986 8,579 8,581 8,793
General services:
Number of square feet of sidewalks repaired 219,871 (1b) 126,959 (1a) 99,907 (1) 14,001 10,359 6,025 3,279 40,000 40,000 33,670
Number of graffiti removals performed 40,156 45,729 43,535 38,311 37,940 37,948 34,289 20,000 20,000 19,500
Feet of sewer mains cleaned 2,072,933 2,093,410 (7) 1,988,287 1,985,816 2,200,810 1,933,560 2,328,874 2,316,757 1,751,717 1,768,024
Cultural and recreation services:
Number of cars parked in beach lots 2,190,104 2,553,233 2,829,771 (2) 2,580,752 2,580,225 2,568,733 2,163,186 1,500,000 1,500,000 1,798,000
Senior services meals served 118,875 104,472 64,406 52,917 48,253 43,020 64,711 56,232 52,440 49,786
Number of low income persons receiving primary health care 4,460 4,711 4,458 4,137 3,089 3,519 3,568 4,164 4,453 3,942
Number of youth regularly attending homework assistance programs 687 597 641 745 624 583 469 466 458 423
Library:
Library visitors 1,131,524 1,221,015 1,257,746 1,184,130 1,262,708 1,265,286 1,373,663 1,500,000 1,500,000 1,500,000
Materials used 1,688,615 1,707,798 1,882,878 1,888,473 1,998,869 2,021,936 2,225,571 2,100,000 2,100,000 2,100,000
Public access computer sessions 159,705 175,485 173,702 164,318 182,655 215,907 271,680 300,000 300,000 300,000
Housing and community development:
Building and Safety plan checks completed 4,389 4,412 4,749 (3) 2,823 3,080 2,366 1,998 1,500 1,500 1,712
Building inspections performed 23,342 24,009 24,080 23,858 20,690 20,732 21,576 16,000 16,000 13,608
Rounds of transportation plan check & entitlement application review completed 530 (5) 323 (4) 640 632 748 839 465 500 500 444
Resident parking passes sold 57,993 53,118 51,325 48,962 56,356 51,674 76,000 73,000 70,000 60,000
Number of traffic signs installed, replaced, repaired, or removed 2,951 3,024 2,858 1,659 2,079 2,417 2,859 5,600 5,600 4,600
Number of parking meters installed, replaced, repaired, or removed 21,650 18,605 14,843 13,844 5,875 5,874 6,100 23,000 23,000 49,000
Water:
Number of direct customer accounts 18,342 18,061 17,976 17,842 17,798 17,760 17,705 17,902 17,823 17,709
Water sold to direct customers in whole acre feet 11,265 11,718 11,552 11,242 12,323 13,344 15,147 11,996 11,779 12,629
Airport:
Number of tenant aircraft 256 278 310 309 325 274 420 420 420 420
Noise ordinance violations issued 38 (6) 130 148 162 118 153 160 142 148 154
Big Blue Bus:
Revenue Miles 4,978,667 5,024,447 4,969,546 4,862,782 4,734,209 4,870,655 5,019,965 5,278,856 5,267,809 5,352,321
Farebox revenue (in millions) 11.40 11.72 11.80 12.84 13.36 13.68 14.09 11.86 11.74 11.63
Total passenger trips (in millions) 12.50 13.18 13.30 16.50 18.70 18.80 19.31 21.96 21.96 21.96
Number of customer relations phone calls 51,952 30,730 37,187 38,705 56,995 64,525 69,075 73,586 73,447 69,738
Total number of charters 0 0 0 0 0 3 3 90 349 202
(1) Per Streets this count was adjusted to include permanent, temporary, and hot-patch repairs.
(1a) There was an increase of 2200 SF of alternative sidewalk pavers replaced compared to the prior fiscal year.
(1b) Increased contractor repairs to multiple locations due to inspections.
(2) Excludes Beach House summer reservations and private event parking.
(3) Includes plan check projects at the public counter (OTC reviews) that were left out last fiscal year.
(4) Division no longer reviewing single family residences.
(5) Per Mobility and Traffic, name updated from "Transportation Managements plan checks completed".
(6) Per Airport decrease from prior year due to shortening of airport runway.
(7) Number updated per Wastewater.
Sources: Various City departments.
CITY OF SANTA MONICA, CALIFORNIA
Operating Indicators by Function/Program
Last Ten Fiscal Years
172

TABLE 20
2018-19 2017-18 2016-17 2015-16 2014-15 2013-14 2012-13 2011-12 2010-11 2009-10
Public safety:Number of police vehicles 237 243 235 (1) 232 220 223 241 239 215 215Number of fire vehicles 71 67 67 71 68 64 56 52 54 57Number of fire stations 5 5 (6) 4 4 4 4 5 5 5 5Number of police substations including Public Safety Facility 3 3 3 3 3 3 4 4 4 4
General services:Square footage of asphalt paved streets 30,191,740 30,170,740 30,170,740 30,170,740 30,403,785 30,403,785 30,403,785 30,403,785 30,385,115 30,585,115Square footage of concrete paved streets 1,183,981 1,177,981 1,177,981 1,177,981 1,128,034 1,128,034 1,106,834 1,106,834 1,125,504 1,125,504Square footage of sidewalks 8,451,871 8,451,871 8,451,871 8,451,871 8,403,428 8,403,428 8,386,998 8,386,998 8,386,998 8,386,998Square footage of curbs and gutters 1,938,820 1,938,420 1,938,420 (2) 1,938,420 1,930,214 1,930,214 1,927,564 1,917,714 1,883,714 1,834,166
Cultural and recreation services:Number of beach parking lots 16 16 16 (3) 16 16 17 17 17 17 17 Number of parks 31 31 30 29 29 29 29 27 27 26 Number of swim centers 2 2 2 2 2 2 2 2 2 2
Library:Number of facilities: main and branches 5 5 5 5 5 5 4 4 4 4
Housing and community development:Downtown structure visitors 5,171,173 5,339,806 5,753,204 (4) 6,722,688 6,405,636 6,455,602 6,790,058 6,659,246 5,958,593 4,078,062
Water:Number of feet of new water main installed 4,825 4,500 (7) 2,269 (5) 2,495 10,465 9,510 9,510 12,384 — — Water main system (in miles) 205 205 205 205 205 205 205 205 205 205Reclaimed water main system (in miles) 5 5 5 5 5 5 4 4 4 4
Wastewater:City sewage flow in million gallons/day 14 13.8 14.2 13.9 13.9 12.2 11.4 11.4 11.3 10.6Sewer main system (in miles) 152 151 151 151 151 151 151 151 152 152
Stormwater:Daily gallons treated for recycling by SMURRF 186,732 180,699 159,740 160,059 170,000 108,000 123,000 122,890 330,000 275,000Storm drain system (in miles) 59 59 59 59 59 59 59 59 58 58
Airport:Aircraft operations (departures and arrivals) 74,511 74,130 83,471 89,217 84,633 85,052 102,109 105,026 106,521 112,212
Big Blue Bus:Number of buses 195 199 200 200 188 201 192 200 214 199
(1) Includes police patrol boat, Mobile Command Center, and SUVs (to eventually replace old Crown Victorias)(2) Per Engineers, curbs and gutters are in linear feet. Thus, use approximate factor of 2 to convert from linear feet to square feet.(3) 1650 Appian is residental parking only and has been removed from count.(4) 2017 Downtown Community Plan (DCP) Downtown perimeter: Wilshire Blvd (north), Lincoln Blvd (east), I-10 Freeway (south), Ocean Avenue (west)
- includes Parking Structures 1-8, Main Library Parking Structure, Ken Edwards Center- excludes Parking Structure 9, Civic Center Parking Lot, Civic Center Parking Structure- includes transient (“daily”) visitor parking and does not include monthly permit parkers
(5) Per Engineers, this total is lower compared to prior years because no water main CIP was started this year.(6) Per Fire, there were 4 permanent and 1 temporary station @ Station #4 for FY17/18(7) Total updated per Engineering.
Sources: Various City departments.
CITY OF SANTA MONICA, CALIFORNIA
Capital Asset Statistics by Function/ProgramLast Ten Fiscal Years
Function / program
173
