city of san jacinto of san jacinto 2010 urban water management plan prepared by: ... 5.1.14 dmm 14...
TRANSCRIPT

861 Village Oaks Drive, Covina, California 91724 Phone: (626) 967-6202, Fax: (626) 331-7065
Covina, CA San Rafael, CA Mesa, AZ
City of San Jacinto
2010 Urban Water Management Plan
Prepared by: Stetson Engineers Inc.

i
Table of Contents
CHAPTER 1 - INTRODUCTION ..................................................................................1-1 1.1 URBAN WATER MANAGEMENT PLAN.....................................................................1-1 1.2 CHANGES TO THE PLAN.......................................................................................1-2 1.3 WATER MANAGEMENT TOOLS..............................................................................1-2 1.4 AGENCY COORDINATION, PUBLIC PARTICIPATION, AND PLAN ADOPTION..................1-2
CHAPTER 2 – DESCRIPTION OF SERVICE AREA...................................................2-1 2.1 BACKGROUND [SECTION 10631 (A)] .....................................................................2-1 2.2 DESCRIPTION OF AREA [SECTION 10631 (A)] ........................................................2-1 2.3 CURRENT AND PROJECTED POPULATION [SECTION 10631 (A)]...............................2-2
CHAPTER 3 – SOURCES OF SUPPLY ......................................................................3-1 3.1 EXISTING AND PLANNED SOURCES OF WATER SUPPLY [SECTION 10631 (B)]...........3-1 3.2 GROUNDWATER MANAGEMENT [SECTION 10631 (B)(1), (B)(2)] ..............................3-2
3.2.1 Groundwater Management Plan.................................................................3-2 3.3 DESCRIPTION OF GROUNDWATER BASIN [SECTION 10631(B)(2), (B)(4)] .................3-3
3.3.1 Hydrogeology .............................................................................................3-3 3.4 PAST AND PROJECTED LOCATION, AMOUNT AND SUFFICIENCY GROUNDWATER
[SECTION 10631 (B)(3), (B)(4)] ...........................................................................3-4 3.5 RELIABILITY OF WATER SUPPLY TO CLIMATE [SECTION 10631 (C)] .........................3-4 3.6 EXCHANGES AND TRANSFERS [SECTION 10631 (D)] ..............................................3-5
3.6.1 Long-Term..................................................................................................3-5 3.6.2 Short-Term .................................................................................................3-5
CHAPTER 4 – WATER USE........................................................................................4-1 4.1 PAST AND CURRENT WATER USE [SECTION 10631 (E)(1)].....................................4-1 4.2 PROJECTED WATER USE [SECTION 10631 (E)(2)] .................................................4-2
CHAPTER 5 – CURRENT CONSERVATION MEASURES.........................................5-1 5.1 DEMAND MANAGEMENT MEASURES AND IMPLEMENTATION [SECTION 10631 (F)] .....5-2
5.1.1 DMM 1 – Water Survey Programs for Single Family Residential and Multi-Family Residential Customers [Section 10631 (f)(1)(A)] .............................5-2
5.1.2 DMM 2 – Residential Plumbing Retrofit [Section 10631 (f)(1)(B)] ..............5-2 5.1.3 DMM 3 – System Water Audits, Leak Detection and Repair [Section 10631
(f)(1)(C)] ......................................................................................................5-2 5.1.4 DMM 4 – Metering with Commodity Rates for all New Connections and
Retrofit of Existing Connections [Section 10631 (f)(1)(D)] ..........................5-3 5.1.5 DMM 5 – Large Landscape Conservation Programs and Incentives [Section
10631 (f)(1)(E)] ...........................................................................................5-3 5.1.6 DMM 6 – High-efficiency Washing Machine Rebate Programs [Section
10631 (f)(1)(F)] ...........................................................................................5-4 5.1.7 DMM 7 – Public Information Programs [Section 10631 (f)(1)(G)] ...............5-4 5.1.8 DMM 8 – School Education Programs [Section 10631 (f)(1)(H)] ................5-4 5.1.9 DMM 9 – Conservation Programs for Commercial, Industrial and Institutional

ii
Accounts [Section 10631 (f)(1)(I)] ...............................................................5-5 5.1.10 DMM 10 – Wholesale Agency Programs....................................................5-6 5.1.11 DMM 11 – Conservation Pricing [Section 10631 (f)(1)(K)] .........................5-6 5.1.12 DMM 12 – Water Conservation Coordinator [Section 10631 (f)(1)(L)]........5-6 5.1.13 DMM 13 – Water Waste Prohibition [Section 10631 (f)(1)(M)] ...................5-6 5.1.14 DMM 14 – Residential Ultra Low-Flush Toilet Replacement Program [Section
10631 (f)(1)(N)] ...........................................................................................5-7
CHAPTER 6 – WATER SUPPLY OPPORTUNITIES ..................................................6-1 6.1 FUTURE WATER SUPPLY PROJECTS AND PROGRAMS [SECTION 10631 (H)].............6-1 6.2 DESALINATED WATER [SECTION 10631 (I)] ...........................................................6-1
CHAPTER 7 – URBAN WATER SHORTAGE CONTINGENCY ANALYSIS ..............7-1 7.1 MANAGEMENT OF WATER SHORTAGES [SECTION 10632 (E)] .................................7-1 7.2 STAGES OF ACTION [SECTION 10632 (A)] .............................................................7-2 7.3 THREE YEAR MINIMUM WATER SUPPLY [SECTION 10632 (B)] ................................7-2 7.4 PREPARATION FOR CATASTROPHIC WATER SUPPLY [SECTION 10632 (C)]...............7-2 7.5 PROHIBITIONS AND PENALTIES [SECTION 10632 (D), (F)] .......................................7-2 7.6 REVENUE AND EXPENDITURE IMPACTS [SECTION 10632 (G)]..................................7-4 7.7 WATER SHORTAGE CONTINGENCY ORDINANCE/RESOLUTION [SECTION 10632 (H)] .7-4 7.8 REDUCTION MEASURING MECHANISM [SECTION 10632 (I)] ....................................7-4
CHAPTER 8 – RECYCLED WATER ...........................................................................8-1 8.1 EXISTING WATER RECLAMATION FACILITIES [SECTION 10633 (A),(B)] .....................8-1 8.2 POTENTIAL USES OF RECYCLED WATER [SECTION 10633 (C)] ...............................8-2 8.3 PROJECTED USE OF RECYCLED WATER [SECTION 10633(D-F)]..............................8-2
CHAPTER 9 – WATER QUALITY ...............................................................................9-1 9.1 SAN JACINTO GROUNDWATER BASIN....................................................................9-1
CHAPTER 10 – WATER SUPPLY RELIABILITY......................................................10-1 10.1 SB 7 REQUIRED WATER USE PARAMETERS.............................................10-1
10.1.1 BASELINE DAILY PER CAPITA WATER USE ........................................10-1 10.1.2 URBAN WATER USE TARGET ...............................................................10-3 10.1.3 INTERIM URBAN WATER USE TARGET ...............................................10-5 10.1.4 COMPLIANCE DAILY PER CAPITA WATER USE..................................10-5 10.1.5 MINIMUM WATER USE REDUCTION REQUIREMENT .........................10-5
10.2 ASSESSMENT OF THE RELIABILITY OF WATER SUPPLY.........................10-6 10.2.1 NORMAL WATER YEAR .........................................................................10-6 10.2.2 SINGLE-DRY YEAR.................................................................................10-7 10.2.3 MULTIPLE DRY YEARS ..........................................................................10-7 10.2.4 GROUNDWATER RELIABILITY ..............................................................10-7
10.3 RELIABILITY INFORMATION ........................................................................10-8 10.4 WATER USE REDUCTION PLAN ..................................................................10-8 10.5 PROGRESS REPORT ...................................................................................10-8

iii
List of Tables
Table 1 – Climate Table 2 – Historical Annual Production Table 3 – Projected Water Supply and Demand Table 4 – Supply Reliability Table 5 – Past, Current and Projected Water Sales Table 6 – Water Rationing Stages and Reduction Goals Table 7 – Baseline Daily Per Capita Water Use Table 8 – Projected Normal Water Year Supply and Demand Comparison Table 9 – Projected Single-Dry Year Supply and Demand Comparison Table 10 – Projected Multiple Dry Years Supply and Demand Comparison
List of Figures Figure 1 – Annual Rainfall
List of Plates Plate 1 – Water Service Area, Wells and EMWD Connections Plate 2 – San Jacinto Groundwater Basin
List of Appendices
Appendix A – California Urban Water Management Planning Act Appendix B – Public Notification Letter and Water Use Letter Appendix C – Draft Groundwater Management Plan Appendix D – City of San Jacinto’s Water Rates Appendix E – 2004 Annual Water Quality Report Appendix F – Multi-Hazard Functional Plan Appendix G – Draft Water Shortage Contingency Resolution Appendix H – EMWD Draft 2010 Plan Appendix I – City Resolution Adopting Plan Appendix J – Urban Water Management Plan Checklist

City of San Jacinto 2010 Urban Water Management Plan
1-1
Chapter 1 - Introduction
Section 10620. (a) Every urban water supplier shall prepare and adopt an urban water management
plan in the manner set forth in Article 3 (commencing with Section 10640). (b) Every person that becomes an urban water supplier shall adopt an urban water
management plan within one year after it has become an urban water supplier. (c) An urban water supplier indirectly providing water shall not include planning elements
in its water management plan as provided in Article 2 (commencing with Section 10630) that would be applicable to urban water suppliers or public agencies directly providing water, or to their customers, without the consent of those suppliers or public agencies.
(d) (1) An urban water supplier may satisfy the requirements of this part by participation in area wide, regional, watershed, or basin wide urban water management planning where those plans will reduce preparation costs and contribute to the achievement of conservation and efficient water use. (2) Each urban water supplier shall coordinate the preparation of its plan with other appropriate agencies in the area, including other water suppliers that share a common source, water management agencies, and relevant public agencies, to the extent practicable.
(e) The urban water supplier may prepare the plan with its own staff, by contract, or in cooperation with other governmental agencies.
(f) An urban water supplier shall describe in the plan water management tools and options used by that entity that will maximize resources and minimize the need to import water from other regions.
1.1 Urban Water Management Plan
Section 10617. “Urban Water Supplier” means a supplier, either publicly or privately owned, providing water for municipal purposes either directly or indirectly to more than 3,000 customers or supplying more than 3,000 acre-feet of water annually. An urban water supplier includes a supplier or contractor for water, regardless of the basis of right, which distributes or sells for ultimate resale to customers.
This Urban Water Management Plan (Plan) was prepared in accordance with the California Urban Water Management Planning Act (Act),∗ which became effective on January 1, 1985 (see Appendix A.1). The Act requires every “urban water supplier" to prepare and adopt an Urban Water Management Plan, and to periodically review its Plan at least once every five years and make any amendments or changes which are indicated by the review. The City of San Jacinto’s (City) Plan is an update for the year 2010.
∗ Water Code Sections 10610 through 10656.

City of San Jacinto 2010 Urban Water Management Plan
1-2
The City’s Plan is intended to review the activities of the City as a retail water supplier in the San Jacinto Groundwater Basin (Basin) and to describe the operations of the Basin to achieve the maximum practicable conservation and efficient use of the water resources of the area, both local and imported.
1.2 Changes to the Plan
Section 10621. (a) Each urban water supplier shall update its plan at least once every five years on or
before December 31, in years ending in five and zero. (b) Every urban water supplier required to prepare a plan pursuant to this part shall notify
any city or county within which the supplier provides water supplies that the urban water supplier will be reviewing the plan and considering amendments or changes to the plan. The urban water supplier may consult with, and obtain comments from, any city or county that receives notice pursuant to this subdivision.
(c) The amendments to, or changes in, the plan shall be adopted and filed in the manner set forth in Article 3 (commencing with Section 10640).
The following are new amendments to the Act and some reorganization of the water code sections:
1) Senate Bill 1087, Requires reporting of water use projections for lower income
households 2) Assembly Bill 1376, Requires 60 days notice of a public hearing on an UWMP 3) Assembly Bill 1420, Conditions state funding 4) Senate Bill 7, Requires 20 percent reduction in use by 2020 (attached in Appendix A.2)
The City has reviewed its 2005 Urban Water Management Plan and included appropriate amendments and changes to its 2010 Urban Water Management Plan.
1.3 Water Management Tools
This Plan describes the management tools and options used by the City to maximize resources and minimize the need to import water from other regions. The City will comply with the anticipated Groundwater Management Plan, which is discussed in Chapter 3; implements Demand Management Measures to reduce water demand whenever possible, as discussed in Chapter 5; and is involved with water supply projects to optimize the use of its groundwater supply, as discussed in Chapter 6.
1.4 Agency Coordination, Public Participation, and Plan Adoption
Section 10620 (a) Every urban water supplier shall prepare and adopt an urban water management plan in the manner set forth in Article 3 (commencing with Section 10640). (b) Every person that becomes an urban water supplier shall adopt an urban water management plan within one year after it has become an urban water supplier.

City of San Jacinto 2010 Urban Water Management Plan
1-3
(c) An urban water supplier indirectly providing water shall not include planning elements in its water management plan as provided in Article 2 (commencing with Section 10630) that would be applicable to urban water suppliers or public agencies directly providing water, or to their customers, without the consent of those suppliers or public agencies. (d) (1) An urban water supplier may satisfy the requirements of this part by participation in area wide, regional, watershed, or basin wide urban water management planning where those plans will reduce preparation costs and contribute to the achievement of conservation and efficient water use. (2) Each urban water supplier shall coordinate the preparation of its plan with other appropriate agencies in the area, including other water suppliers that share a common source, water management agencies, and relevant public agencies, to the extent practicable. (e) The urban water supplier may prepare the plan with its own staff, by contract, or in cooperation with other governmental agencies. Section 10621 (b) Every urban water supplier required to prepare a plan pursuant to this part shall, at least 60 days prior to the public hearing on the plan required by Section 10642, notify any city or county within which the supplier provides water supplies that the urban water supplier will be reviewing the plan and considering amendments or changes to the plan. The urban water supplier may consult with, and obtain comments from, any city or county that receives notices pursuant to this subdivision. Section 10631 (k) Urban water suppliers that rely upon a wholesale agency for a source of water, shall provide the wholesale agency with water use projections from that agency for that source of water in five-year increments to 20 years or as far as data is available. The wholesale agency shall provide information to the urban water supplier for inclusion in the urban water supplier’s plan that identifies and quantifies, to the extent possible, the existing and planned sources of water as required by subdivision (b), available from the wholesale agency to the urban water supplier over the same five-year increments, and during various water-year types in accordance with subdivision (c). An urban water supplier may rely upon water supply information provided by the wholesale agency in fulfilling the plan informational requirements of subdivisions (b) and (c). Section 10635 (b) The urban water supplier shall provide that portion of its urban water management plan prepared pursuant to this article to any city or county within which it provides water supplies no later than 60 days after submission of its urban water management plan. Section 10642 Each urban water supplier shall encourage the active involvement of diverse social, cultural, and economic elements of the population within the service area prior to and during the preparation of the plan. Prior to adopting a plan, the urban water supplier shall make the plan available for public inspection and shall hold a public hearing thereon. Prior to the hearing, notice of the time and place of hearing shall be published within the jurisdiction of the publicly owned water supplier pursuant to Section 6066 of the Government Code. The urban water supplier shall provide notice of the time and place of hearing to any city or county within which the supplier provides water supplies. A privately owned water supplier shall provide an equivalent notice within its service area. After the hearing, the plan shall be adopted as prepared or as modified after the hearing. Section 10643 An urban water supplier shall implement its plan adopted pursuant to this chapter in accordance with the schedule set forth in its plan.

City of San Jacinto 2010 Urban Water Management Plan
1-4
Section 10644 (a) An urban water supplier shall file with the department and any city or county within which the supplier provides water supplies a copy of its plan no later than 30 days after adoption. Section 10645 Not later than 30 days after filing a copy of its plan with the department, the urban water supplier and the department shall make the plan available for public review during normal business hours.
The City mainly produces groundwater from the Basin. The City is within the boundaries of Eastern Municipal Water District (EMWD) and has historically purchased minor amounts of treated imported water on an emergency basis to supplement groundwater supplies. EMWD is a wholesale water agency that obtains imported water from the Metropolitan Water District Southern California (MWD). The City has received the Urban Water Management Plans prepared by both EMWD and MWD. The City notified EMWD, the County of Riverside, and the City of San Jacinto of the preparation of its 2010 Plan. Copies of the notification letters to the agencies are in Appendix B.1. In addition, the City informed all parties and other potentially affected agencies to participate in the development of the 2010 Plan by providing comments. The City has provided EMWD with water use projections and existing/planned sources of water through email as required by Section 10631(k) of the California Water Code, as shown in Appendix B.2. EMWD provided the City with water use projections and existing/planned sources of water, as shown in Appendix B.2. The City does not provide water outside its City boundaries and therefore has not notified adjacent cities. [Stetson to write a sentence here if anyone provided comments to the City or not]. The City reviewed and implemented its 2005 Plan in accordance with the schedule set forth in the 2005 Plan. The City prepared its 2010 draft Plan and provided at least a 60-day notice of preparation of its 2010 Plan to all relevant public agencies, cities and counties, as shown in Appendix B.1. The City also provided a 2-week notice of a public hearing of its 2010 Draft Plan to all relevant public agencies, water companies, cities, and counties. The City made the Draft 2010 Plan available at City Hall (595 S. San Jacinto Ave) for public review and published a notice of the public review in the City’s website and in a local newspaper, as shown in Appendix B.3. The notice of public hearing was published and distributed to allow involvement of local governments, social, cultural, and economic community groups. In addition, a public notification of the Public Hearing was provided to EMWD, the City of San Jacinto and the County of Riverside. Public notification of the review period is required pursuant to Section 10642 of the California Water Code. The City held a public hearing on September 6, 2011 at 7pm. [Stetson to write a sentence here if public attended public hearing and if they had any comments to the City’s Plan or not and who attended]. City staff reviewed this Plan and comments from the review were incorporated into the final Plan. Following the public hearing, the City adopted the Draft Plan on September 6, 2011, as its Plan. A copy of the resolution showing the City adopted the 2010 Plan is shown in Appendix I. The City sent a notice of intention to adopt its Draft Plan to EMWD, the City of San Jacinto and the County of
City of San Jacinto 2010 Urban Water Management Plan
1-5
Riverside, as shown in Appendix B.4. Within 30 days of adoption of the Plan by the City, a copy of the Plan is to be filed with the State of California, Department of Water Resources (DWR), the State of California Library, the County of Riverside and the City of San Jacinto. Copies of the letters to DWR, the State Library and the City of San Jacinto and the County of Riverside are located in Appendix B.5. A copy of the final 2010 Plan is available for public review in City Hall.

City of San Jacinto 2010 Urban Water Management Plan
2-1
Chapter 2 – Description of Service Area
Section 10631. A plan shall be adopted in accordance with this chapter and shall do the following:
(a) Describe the service area of the supplier; including current and projected population, climate, and other demographic factors affecting the supplier’s water management planning. The projected population estimates shall be based upon data from the state, regional, or local service agency population projections within the service area of the urban water supplier and shall be in five-year increments to 20 years or as far as data is available.
2.1 Background [Section 10631 (a)]
The City owns and operates a water distribution system serving a portion of the City of San Jacinto. The remaining portion of the City is served by EMWD and Lake Hemet Municipal Water District (LHMWD). The City operates under the Public Water System (PWS) Identification Number CA3310032. The City was incorporated on April 9, 1888. The City has about 4,050 service connections serving a population of approximately 14,200 people. Following is a breakdown of the District’s service connections by customer type.
• Residential – 3,090 service connections • Commercial – 760 service connections • Industrial – 4 service connections • Irrigation – 190 service connections • Other – 7 service connections
2.2 Description of Area [Section 10631 (a)]
The City is located in the southwesterly part of Riverside County at the base of the San Jacinto Mountains. It is generally bounded on the north by the City of Beaumont, the south by the City of Hemet and the west by the City of Moreno Valley. The area surrounding the City is predominantly rural and supports farming and agricultural activity. The climate in the City of San Jacinto is moderate. Summers are warm and winters are mild. The average temperature ranges from 52.3 degrees Fahrenheit (oF) in January to 80.3 oF in August, as shown on Table 1. The average rainfall ranges from 2.8 inches in February to 0.1 inches in June and July, as shown on Table 1. The Evapotranspiration ranges from 1.9 inches January and December to 6.5 inches July, as shown on Table 1. There are no other demographic factors affecting water management.

City of San Jacinto 2010 Urban Water Management Plan
2-2
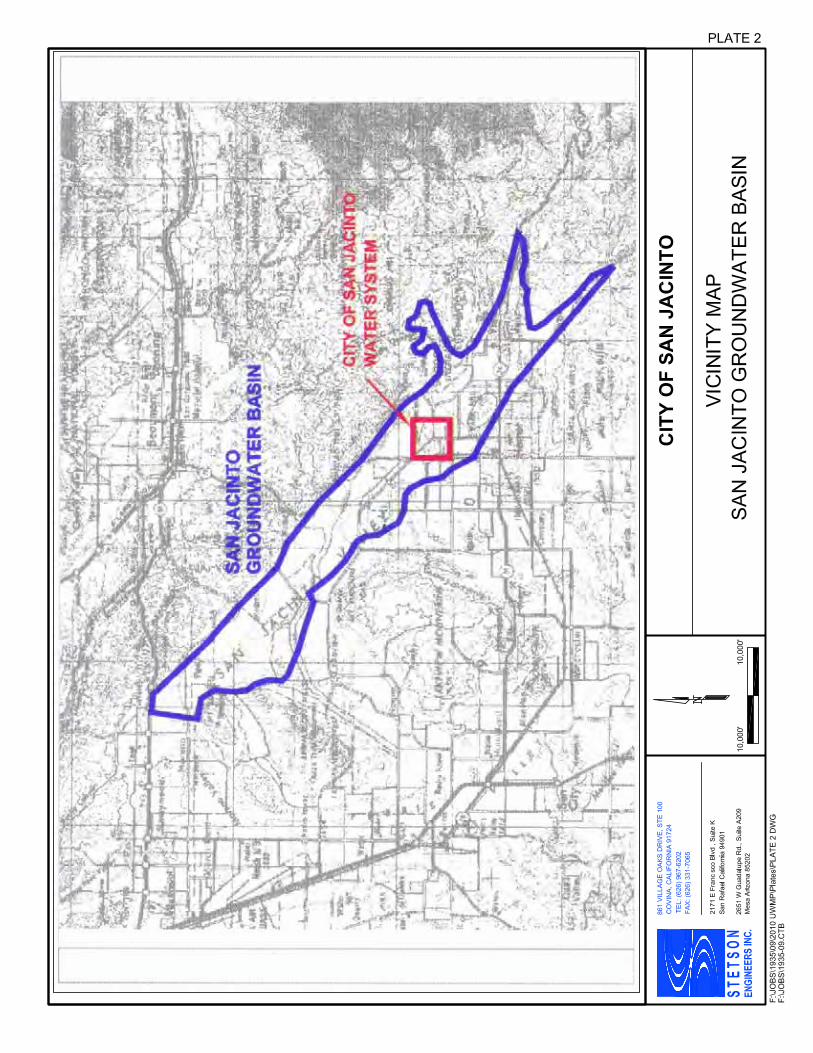
Rainfall data, shown in Figure 1, has been compiled from the National Climatic Center records for San Jacinto over the 50-year period from 1950 to 1999 and from Riverside County Flood Control District over a 10-year period from 2000 to 2010. The City’s 60-year average annual rainfall is about 11.7 inches per year. Over the same period of time, the historical high precipitation was 25.61 inches in 1993 and the historical low was 3.7 inches in 2002. The City relies almost exclusively on groundwater pumped by four wells, as shown on Plate 1. The wells produce groundwater from the Basin, which covers an area of about 60 square miles, as shown on Plate 2. The Basin is drained by the San Jacinto River and is recharged by surface runoff from adjacent mountains and hills, by rainfall directly on the valley floor and by return flow from water applied from overlying uses. The Basin serves as a natural storage reservoir and filtering system for wells constructed therein.
2.3 Current and Projected Population [Section 10631 (a)]
The City of San Jacinto occupies an area of about 12.8 square miles and had a population estimated at 51,300 during calendar year 2010 by the Census. However, the City’s water system provides water to about 29.6 percent of the total population. Therefore, this percentage was used to estimate the population the City’s water system provides water to, which is estimated to be about 15,200 people (51,300 x 29.6%) during calendar year 2010. The population within the City water service area is estimated to be built out by 2020 at about 6,000 meters or about 23,000 people. The following tabulation presents a comparison of the estimated historic and projected population of the entire City of San Jacinto and the area included in the City service area from calendar year 1950 to 2030. Population Population City of San Served by San Jacinto Percent Year Jacinto (Total) Source Water District Increase 1950 1,778 Census 1,778 (Est.) -- 1960 2,553 Census 2,553 (Est.) 44 1970 4,385 Census 4,385 (Est.) 72 1980 7,098 Census 7,098 (Est.) 62 1990 16,210 Census 9,000 (Est.) 27 2000 23,800 Census 12,200 (Est.) 36 2005 30,000 Census 13,200 (Est.) 8 2010 51,300 SCAG 15,200 (Est.) 15 2015 68,700 SCAG 18,700 (Est.) 23 2020 80,900 SCAG 23,000 (Est.) 23 2025 87,000 SCAG 23,000 (Est.) 0 2030 92,200 SCAG 23,000 (Est.) 0

City of San Jacinto 2010 Urban Water Management Plan
3-1
Chapter 3 – Sources of Supply
Section 10631. (b) Identify and quantify, to the extent practicable, the existing and planned sources of
water available to the supplier over the same five-year increments described in subdivision (a). If groundwater is identified as an existing or planned source of water available to the supplier, all of the following information shall be included in the plan: 1. A copy of any groundwater management plan adopted by the urban water
supplier, including plans adopted pursuant to Part 2.75 (commencing with Section 10750), or any other specific authorization for groundwater management.
2. A description of any groundwater basin or basins from which the urban water supplier pumps groundwater. For those basins for which a court or the board has adjudicated the rights to pump groundwater, a copy of the order or decree adopted by the court of the board and a description of the amount of groundwater the urban water supplier has the legal right to pump under the order or decree. For basins that have not been adjudicated, information as to whether the department has identified the basin or basins as over drafted or has projected that the basin will become over drafted if present management conditions continue, in the most current official departmental bulletin that characterizes the condition of the groundwater basin, and a detailed description of the efforts being undertaken by the urban water supplier to eliminate the long-term overdraft condition.
3. A detailed description and analysis of the location, amount, and sufficiency of groundwater pumped by the urban water supplier for the past five years. The description and analysis shall be based on information that is reasonably available, including, but not limited to, historic use records.
4. A detailed description and analysis of the amount and location of groundwater that is projected to be pumped by the urban water supplier. The description and analysis shall be based on information that is reasonably available, including, but not limited to, historic use records.
(c) Describe the reliability of the water supply and vulnerability to seasonal or climatic shortage, to the extent practicable, and provide data for each of the following: 1. An average water year. 2. A single dry water year. 3. Multiple dry water years.
(d) Describe the opportunities for exchanges or transfers of water on a short-term or long-term basis.
3.1 Existing and Planned Sources of Water Supply [Section 10631 (b)]
The City has two sources of water supply: groundwater from the Basin and treated imported water from EMWD, as shown in Tables 2 and 3. Historically, 100 percent of the City’s water supply is from groundwater. The City’s potential sources of supply consist of four active wells, two treatment facilities, and three service connections to EMWD, which are all described below. The Grand Well is located in the westerly portion of the City’s service area, as shown on Plate 1. The Grand Well is 650 feet deep, is perforated from 200 feet to 650 feet below ground surface (bgs) and has a capacity of about 1,700 gallons per minute (gpm).

City of San Jacinto 2010 Urban Water Management Plan
3-2
The Bath Well is located in the easterly portion of the City’s service area as shown on Plate 1. The Bath Well is 1,320 feet deep, is perforated from 340 feet to 1,300 feet bgs and has a capacity of 1,700 gpm. The Artesia Well is located in the easterly portion of the City’s service area as shown on Plate 1. The Artesia Well is 1,210 feet deep, is perforated from 390 feet to 1,000 feet bgs and has a capacity of 1,650 gpm. The Lake Park Well is located east of the City’s service area as shown on Plate 1. The Lake Park Well is 1,200 feet deep, is perforated from 625 feet to 1,180 feet bgs and has a capacity of 2,800 gpm. The City currently owns and operates two Iron and Manganese treatment facilities which are located at the Grand and Bath Well sites. The Iron and Manganese concentrations in the Grand and Bath Wells exceed secondary maximum contaminant levels (MCLs) and are not be suitable for potable use, without treatment. The Iron and Manganese treatment facilities include three dual-media filtering vessels consisting of Anthracite and greensand. The treatment facility at the Grand Well site has a maximum capacity of about 1,350 gpm and the treatment facility at the Bath Well site has a maximum capacity of about 1,500 gpm. The City has three service connections to EMWD, as shown on Plate 1. The connection at Hewitt and Evans has a capacity of about 2,000 gpm; the connection at Idyllwild and Tiger Lane has a capacity of about 600 gpm; and the connection at Santa Fe and Esplanade has a capacity of about 600 gpm. Historically, the City has relied on groundwater from the Basin, making up 100 percent of the City’s total water supply. However, the City has purchased treated imported water from EMWD during calendar years 1995 through 1998, 2002 through 2004, 2006 and 2008 primarily during summer months to supplement peak demands, as shown on Table 2, due to mechanical failure at one of the City’s wells.
3.2 Groundwater Management [Section 10631 (b)(1), (b)(2)]
3.2.1 Groundwater Management Plan
Local water purveyors in the Basin have developed a Groundwater Management Plan (GWMP) in November 2007 for the San Jacinto-Hemet Valley to effectively manage the groundwater basin, allocate and protect groundwater resources, and maintain local control over those resources, as shown in Appendix C. Under the GWMP, the City will be allocated an annual quantity of water it may pump from the groundwater basin that is free of replacement water assessments. In the event the City exceeds its annual pumping allocation, the City will be required to purchase replacement water for the Basin.

City of San Jacinto 2010 Urban Water Management Plan
3-3
3.3 Description of Groundwater Basin [Section 10631(b)(2), (b)(4)]
The City water system is primarily reliant on four wells which pump from the Basin. The City’s 2005 Water Master Plan notes the general boundaries of the Basin are the Casa Loma Fault on the southwest, which separates it form the Hemet and Lakeview groundwater basins; the San Jacinto Fault on the northeast, along the base of the San Jacinto Mountains; Valle Vista in the southeast and Moreno in the northwest. The Basin is a structural trough located between two faults that have been filled with layered alluvial materials, including clay, silt, sand and gravel. The City’s wells overlie a part of the Basin called the “Pressure Area”. The Basin in this region is generally divided into an upper, unconfined aquifer and lower confined aquifer. The groundwater in the deeper aquifer is typically under pressure due to the presence of a relatively impervious, confining layer which provides some separation between the upper and lower aquifers. The Grand Well has been constructed to a depth of 650 feet and pumps primarily from the upper aquifer. The Bath Well, Artesia Well and Lake Park Well have been constructed to a depth of approximately 1,300 feet, 1,210 feet, and 1,200 feet respectively, and the primary water source is the lower aquifer. The Department of Water Resources Bulletin 118 does not identify the Basin as being in overdraft.
3.3.1 Hydrogeology
DWR describes the hydrogeology of Basin in its Bulletin 118. That report notes: Water Bearing Formations. The San Jacinto Groundwater Basin contains sediments that have filled valleys and underlying canyons incised into crystalline basement rock. The valley fill deposits are generally divided into younger and older alluvium. Maximum depths of valley fill reach about 900 feet in the western and northern parts of the Basin, but may exceed 5,000 feet in the eastern part of the Basin between the Casa Loma and Claremont faults. Confined groundwater is found in the eastern part of the Basin between the Casa Loma and Claremont fault. Wells in this Basin produce 200 to 2,600 gpm. The younger alluvium in the southeastern part of the Basin is generally coarse and permeable with specific yield estimated to range from about 12 to 15 percent. In other parts of the Basin, specific yield is estimated to be about 5 to 10 percent. The older alluvium may correlate to sediments of Pleistocene age that are exposed in the San Timoteo Badlands and underlies the San Jacinto River near the confluence of Bautista Creek. These sediments generally contain more fine material and have lower specific yield and transmissivity values than the younger alluvium. Restrictive Structures. The San Jacinto fault zone cuts through the eastern part of the Basin and is composed of five northwest trending sediments: the San Jacinto,

City of San Jacinto 2010 Urban Water Management Plan
3-4
Claremont, Hot Springs, Park Hill, and Casa Loma faults. These active faults are barriers to groundwater movement. Recharge Areas. Natural recharge to the Basin is primarily from percolation of flow in the San Jacinto River and its tributary stream and from infiltration of rainfall on the valley floor. The primary recharge area for the confined aquifers is found where the San Jacinto River and Bautista Creek enter the San Jacinto Valley. Percolation of water stored in Lake Perris has been an additional source of recharge since construction of the lake in the 1970s. Groundwater Level Trends. Prior to the extraction of groundwater from the Basin, groundwater flow was generally along the course of the San Jacinto River and westward out of the Basin. High extraction rates had produced groundwater depressions and locally reversed the historical flow pattern. During the 1960s, groundwater levels in the western and central parts of the Basin declined; whereas, in the south-central part of the Basin, they were moderately stable. During the 1970s through the 1990s, groundwater levels declined about 20 to 40 feet in the northern and southwestern parts of the Basin and were relatively stable in the southern part of the Basin. During the 1970s through the 1980s, groundwater levels rose 80 to 200 feet in the western part of the Basin because of infiltration from Lake Perris. Groundwater Storage. The estimated groundwater storage capacity of the Basin is 3,070,000 acre feet. In 1975, the calculated amount of groundwater in storage was 2,700,000 acre feet.
3.4 Past and Projected Location, Amount and Sufficiency Groundwater [Section 10631 (b)(3), (b)(4)]
The City along with EMWD, LHMWD, the City of Hemet and private producers rely on the Basin for groundwater supplies. The Basin historically had not been managed. However, local agencies are developing a proposed GWMP to maintain long-term reliability of groundwater supplies. A final copy of the proposed GWMP is included in Appendix C. During the City’s dry single year and multiple dry year sequence, the City was able to meet its demands, as shown in Table 2 which is based on metered data. Due to the City’s GWMP and wells, the City is expected to meet its demands within the next 20 years during a normal year, as shown on Table 3. Due to the City’s GWMP, the City is also expected to meet its demands within the next 20 years during a single dry year and multiple dry year sequence, as shown in Table 4.
3.5 Reliability of Water Supply to Climate [Section 10631 (c)]
The City water system is primarily dependent on groundwater supplies from the Basin to meet water demands although historic short-term mechanical failure at a City well resulted in the purchase of treated imported water. The City, along with other local

City of San Jacinto 2010 Urban Water Management Plan
3-5
water agencies, has developed a proposed GWMP. According to the rainfall data on Figure 1, the 60-year average rainfall within the City’s service area is about 11.7 inches. Calendar year 2003 represents an average water year for the City in which the total amount of rainfall was about 13.6 inches. A single dry year for the City was experienced in 2004 in which the total amount of rainfall was about 7.6 inches. A multiple dry year sequence for the City is represented from 2006 to 2009. During those years, the total amount of rainfall was about 8.8, 6.5, 11.3, and 7.4 inches respectively. Table 4 shows that during an average year, single dry year and multiple dry years, the City’s supplies met its customer’s demands. Therefore, the climate and environmental factors do not affect the City’s supply. In addition, there are no other factors resulting in inconsistent sources of supply.
3.6 Exchanges and Transfers [Section 10631 (d)]
3.6.1 Long-Term
The City does not have long-term exchanges or transfers of water.
3.6.2 Short-Term
The City may purchase water from EMWD through three interconnections. The three interconnections have a total capacity of approximately 3,200 gpm. Historically, the City has relied on EMWD for purchased treated imported water only for emergency supplies, as shown in Table 2.

City of San Jacinto 2010 Urban Water Management Plan
4-1
Chapter 4 – Water Use
Section 10631. (e) (1) Quantify, to the extent records are available, past and current water use, over the
same five-year increments described in subdivision (a), and projected water use, identifying the uses among water use sectors including, but not necessarily limited to, all of the following uses:
(A) Single-family residential. (B) Multifamily. (C) Commercial. (D) Industrial. (E) Institutional and governmental. (F) Landscape. (G) Sales to other agencies. (H) Saline water intrusion barriers, groundwater recharge, or
conjunctive use, or any combination thereof. (I) Agricultural
(2)The water use projections shall be in the same five-year increments described in subdivision (a).
4.1 Past and Current Water Use [Section 10631 (e)(1)]
The City maintains records of groundwater production and treated imported water, which it occasionally purchases from EMWD. Water is sold to residential, commercial, industrial, irrigation and other customers. Prior to 2009, historical records are not available for water sales by customer group, as shown on Table 5. Historical annual water sales are shown on Table 2. During calendar year 2009, the City had a total of about 4,050 service connections. Records of water sales and number of meters during calendar year 2009 by customer group are shown on Table 5. The City does not have low-income housing within its service area. The City water system historically has served primarily single family residential customers and the City does not anticipate that trend will change over the next 20 years. Table 2 indicates the water use per customer has remained relatively constant over the past 20 years indicating no significant influx of large (commercial, industrial, agricultural) water users. Much of the agricultural water use is from privately owned wells and not associated with the City. The growth over the next 20 years of the City’s water system will likely consist of additional single family residences. Current and historical water uses are presented in Tables 2 and 5. The City’s estimated unaccounted system water loss is about 2 percent. The City does not have other additional water uses.

City of San Jacinto 2010 Urban Water Management Plan
4-2
4.2 Projected Water Use [Section 10631 (e)(2)]
The projected water use by customer group is shown in Table 5. Chapter 2 indicates the City water system’s future population is estimated to increase from about 15,200 people in 2010 to about 23,000 people in 2030. The City does not have low-income housing within its service area. The City anticipates providing all future demands from its groundwater sources. The GWMP for the Basin will enhance the City’s ability to rely solely on groundwater. In the event of mechanical failure to any of the City’s wells, the City has connections with EMWD to provide sufficient imported water supply until the equipment is repaired or replaced.

City of San Jacinto 2010 Urban Water Management Plan
5-1
Chapter 5 – Current Conservation Measures
Section 10631. (f) Provide a description of the supplier’s water demand management measures. This
description shall include all of the following: 1. A description of each water demand management measure that is currently
being implemented, or scheduled for implementation, including the steps necessary to implement any proposed measures, including, but not limited to, all of the following:
(A) Water survey programs for single-family residential and multi-family residential customers. (B) Residential plumbing retrofit. (C) System water audits, leak detection, and repair. (D) Metering with commodity rates for all new connections and retrofit of existing connections. (E) Large landscape conservation programs and incentives. (F) High-efficiency washing machine rebate programs. (G) Public information programs. (H) School education programs. (I) Conservation programs for commercial, industrial and institutional accounts. (J) Wholesale agency programs. (K) Conservation pricing. (L) Water conservation coordinator. (M) Water waste prohibition. (N) Residential ultra-low-flush toilet replacement programs.
2. A schedule of implementation for all water demand management measures proposed or described in the plan.
3. A description of the methods, if any, that the supplier will use to evaluate the effectiveness of water demand management measures implemented or described under the plan.
4. An estimate, if available, of existing conservation savings on water use within the supplier’s service area, and the effect of the savings on the supplier’s ability to further reduce demand.
(g) An evaluation of each water demand management measure listed in paragraph (1) of subdivision (f) that is not currently being implemented or scheduled for implementation. In the course of the evaluation, first consideration shall be given to water demand management measures, or a combination of measures, that offer lower incremental costs than expanded or additional water supplies. This evaluation shall do all of the following:
1. Take into account economic and non-economic factors, including environmental, social, health, customer impact, and technological factors.
2. Include a cost-benefit analysis, identifying total benefits and total costs. 3. Include a description of funding available to implement any planned water
supply project that would provide water at a higher unit cost. 4. Include a description of the water supplier’s legal authority to implement the
measure and efforts to work with other relevant agencies to ensure the implementation of the measure and to share the cost of implementation.

City of San Jacinto 2010 Urban Water Management Plan
5-2
5.1 Demand Management Measures and Implementation [Section 10631 (f)]
The City is not a signatory to the Memorandum of Understanding regarding Urban Water Conservation in California and not a member of the California Urban Water Conservation Council (CUWCC). Each of the 14 water Demand Management Measures (DMM) [Section 10631 (f)] are addressed in the sections below. The City plans to coordinate with EMWD and MWD on the DMMs.
5.1.1 DMM 1 – Water Survey Programs for Single Family Residential and Multi-Family Residential Customers [Section 10631 (f)(1)(A)]
City staff regularly reviews water usage within the service area. If the City finds that a customer has an unusually high water consumption, City staff may conduct field inspections, check customer meters for accuracy and review historical water usage in an attempt to identify the cause of the high usage for both indoor and outdoor water surveys. In addition, the City will endeavor to educate customers on how to find leaks and read meters. It is unknown when the program first started. Historical survey data is not readily available and the number of surveys is not readily available. The evaluation of the effectiveness is not readily available. The estimates of existing conservation savings on water use and the effect of such savings are not readily available.
5.1.2 DMM 2 – Residential Plumbing Retrofit [Section 10631 (f)(1)(B)] The City is interested in expanding its water conservation programs and plans to coordinate with EMWD and MWD to implement an agreement for participation in the distribution of low flow showerheads, toilet displacement devices, toilet flappers and faucet aerators to City customers. This conservation program will be designed to increase indoor water use efficiency and assist the City in conserving water. The City plans to inform all its customers within its service area of EMWD and MWD’s residential plumbing retrofit programs available. More information on devices provided to customers, quantifications and implementation can be found in EMWD’s 2010 Plan and MWD’s 2010 Plan. It is unknown when the program first started. The evaluation of the effectiveness and the estimates of existing conservation savings on water use and the effect of such savings are not readily available.
5.1.3 DMM 3 – System Water Audits, Leak Detection and Repair [Section 10631 (f)(1)(C)]
The City established an Ordinance for Water Conservation and Water Supply Shortage Program and Regulations (Water Conservation Ordinance) on January 22, 2009, as shown in Appendix G. Section E.5 of the City’s Water Conservation Ordinance states, “Excessive use, loss or escape of water through breaks, leaks or other malfunctions in the water user’s plumbing or distribution system for any period of time after such escape of water should have reasonably been discovered and corrected and in no event more than 72 hours of receiving notice from the City of San Jacinto, is prohibited.”

City of San Jacinto 2010 Urban Water Management Plan
5-3
In addition, City staff regularly inspects the water system to identify potential leaks from underground water pipelines, wells, pumps and reservoirs. In addition, the City has a program to compare metered water production (at wells) to metered customer sales on a monthly basis. A discrepancy of more than 10 percent will serve as an indication for City staff to conduct additional field inspections and meter checking in an attempt to identify the cause of the discrepancy. The City conducts this program monthly, and an audit was last completed in November 2010 and the next audit will be completed the following month, December 2010. As previously mentioned in Chapter 4, the City’s unaccounted water loss is about 2 percent. The actual historical audits are not readily available. The evaluation of the effectiveness is not readily available. The estimates of existing conservation savings on water use and the effect of such savings are not readily available.
5.1.4 DMM 4 – Metering with Commodity Rates for all New Connections and Retrofit of Existing Connections [Section 10631 (f)(1)(D)]
The City meters all water sales to its customers. As stated in Chapter 2, the number of meters (accounts) is about 4,050. The City does not have any unmetered accounts. The commodity rates are based on a tiered system that rewards conservation with lower rates. The City’s commodity rates include a fixed “availability of service” charge, plus additional charges for water use, as shown in Appendix D. The fixed charge is used by the City to offset fixed operating costs, such as staffing, and reduces the possibility of revenue shortfalls should water sales decrease. It is unknown when the program first started. The evaluation of the effectiveness and the estimates of existing conservation savings on water use and the effect of such savings are not readily available.
5.1.5 DMM 5 – Large Landscape Conservation Programs and Incentives [Section 10631 (f)(1)(E)]
As discussed in Chapter 2, the City has 424 commercial customers, 3 industrial customers, and two irrigation customers. The City plans to create a tiered rate structure to promote conservation for its irrigation, industrial and commercial meters. The City plans to create the tiered rate structure within the next 5 years. In addition the City established a Water Conservation Ordinance on January 22, 2009, as shown in Appendix G. Section E of the City’s Water Conservation Ordinance prohibits waste of water at all times. Under Sections E.1, E.2, and E.3, the City established requirements on landscape, which are discussed below. Section E.1 – Limits on Water Hours: Watering or irrigating of lawn, landscape or other vegetated area with potable water is prohibited between the hours of 9:00 a.m. and 5:00 p.m., Pacific Standard Time on any day, except by use of a hand-held bucket or similar container, a hand-held hose equipped with a positive self-closing water shut-off nozzle or device, or for very short periods of time for express purposes of adjusting or repairing an irrigation system.

City of San Jacinto 2010 Urban Water Management Plan
5-4
Section E.2 – Limit on Water Duration: Watering or irrigating of lawn, landscape or other vegetated area with potable water using a landscape irrigation system or a water device that is not continuously attended is limited to no more than fifteen minutes of watering per day per station. This subsection does not apply to landscape irrigation systems that exclusively use very low-flow drip type irrigation systems when no emitter producers more than two (2) gallons of water per hour and weather based controllers or stream rotor sprinklers that meet a 70 percent efficiency standard. Section E.3 – No Excessive Water Flow or Runoff: Watering or irrigating of any lawn, landscape or other vegetated area in manner that causes or allows excessive water flow or runoff onto an adjoining sidewalk, driveway, street, alley, gutter or ditch is prohibited. The evaluation of the effectiveness and the estimates of existing conservation savings on water use and the effect of such savings are not readily available.
5.1.6 DMM 6 – High-efficiency Washing Machine Rebate Programs [Section 10631 (f)(1)(F)]
The City is interested in expanding its water conservation programs and plans to coordinate with EMWD and MWD to implement an agreement for participation in MWD’s high efficiency washing machine rebate program. The City plans to inform its customers of EMWD and MWD’s high-efficiency washing machine rebate programs. According to EMWD’s 2010 draft Plan, EMWD offers a rebate of $85 for washing machines with a water use factor of 5.0 or less. EMWD has provided incentives for high-efficiency washing machines since 2001 and to date has estimated 6,624 high-efficiency washing machines have received incentives. This rebate program is designed to aid homeowners in purchasing high-efficiency washing machines and to assist the City in conserving water supplies. The evaluation of the effectiveness and the estimates of existing conservation savings on water use and the effect of such savings are not readily available.
5.1.7 DMM 7 – Public Information Programs [Section 10631 (f)(1)(G)] The City distributes an annual Consumer Confidence Report to all its customers. The Consumer Confidence Report identifies water quality of the City’s distribution system, the impact to human health and actions taken to ensure a high quality of water served to customers. In addition, the City plans to inform its customers of EMWD and MWD’s water conservation programs. It is unknown when the program first started. The evaluation of the effectiveness and the estimates of existing conservation savings on water use and the effect of such savings are not readily available.
5.1.8 DMM 8 – School Education Programs [Section 10631 (f)(1)(H)] The City is interested in expanding its water conservation programs and plans to coordinate with EMWD to implement an agreement for participation in EMWD’s school education programs. According to EMWD’s 2010 draft Plan, EMWD offers water

City of San Jacinto 2010 Urban Water Management Plan
5-5
conservation programs to students in kindergarten through the twelfth grade. EMWD has a substantial school education program that promotes water conservation and all environmental education. It is unknown when the program first started. The evaluation of the effectiveness and the estimates of existing conservation savings on water use and the effect of such savings are not readily available.
5.1.9 DMM 9 – Conservation Programs for Commercial, Industrial and Institutional Accounts [Section 10631 (f)(1)(I)]
As discussed in Chapter 2, the City has 424 commercial customers, 3 industrial customers, and no institutional customers. The City plans to create a tiered rate structure to promote conservation for its industrial and commercial meters. The City plans to create the tiered rate structure within the next 5 years. In addition the City established a Water Conservation Ordinance on January 22, 2009, as shown in Appendix G. Section E of the City’s Water Conservation Ordinance prohibits waste of water at all times. Under Sections E.6, E.8, E.9, E.10, E.11, E.12, and E.13, the City established requirements on commercial and industrial customers, which are discussed below. Section E.6 – Re-circulating Water Required for Water Fountains and Decorative Water Features: Operating a water fountain or other decorative water feature that does not use re-circulated water is prohibited. Section E.8 – Drinking Water Served Upon Request Only: Eating or drinking establishments, including but not limited to a restaurant, hotel, café, cafeteria, bar other public place where food or drinks are sold, served, or offered for sale, are prohibited from providing drinking water to any person unless expressly requested. Section E.9 – Commercial Lodging Establishments Must Provide Guests Option to Decline Daily Linen Services: Hotels, motels and other commercial lodging establishments must provide customers the option of not having towels and linen laundered daily. Commercial lodging establishments must prominently display notice of this option in each bathroom using clear and easily understood language. Section E.10 – No Installation of Single Pass Cooling Systems: Installation of single pass cooling systems is prohibited in buildings requesting new water service. Section E.11 – No Installation of Non-re-circulating in Commercial Car Wash and Laundry Systems: Installation of non-re-circulating water systems is prohibited in new commercial conveyor car wash and new commercial laundry systems. Section E.12 – Restaurants Required to Use Water Conservation Dish Wash Spray Valves: Food preparation establishments, such as restaurants or cafes, are prohibited from using non-water conserving dish wash spray valves.

City of San Jacinto 2010 Urban Water Management Plan
5-6
Section E.13 – Commercial Car Wash Systems: Effective on January 1, 2010 all commercial conveyor car wash systems must have installed operational re-circulating water systems, or must have secured a waiver of this requirement from the City of San Jacinto. The actual historical survey data is not readily available. The evaluation of the effectiveness and the estimates of existing conservation savings on water use and the effect of such savings are not readily available.
5.1.10 DMM 10 – Wholesale Agency Programs The City is a retailer and not a wholesale agency. Although, this program does not apply, the City coordinates with its wholesalers (EMWD and MWD) regarding water conservation opportunities. These programs are incorporated by reference.
5.1.11 DMM 11 – Conservation Pricing [Section 10631 (f)(1)(K)] As previously discussed, the City has a tiered rate structure. As shown in Appendix D, the City’s tiered rate structure creates an incentive to reduce water use. In addition, the City provides sewer service to its customers. However, EMWD owns and operates the wastewater treatment facility. The City’s sewer rate structure is attached in Appendix D. It is unknown when the program first started. The evaluation of the effectiveness and the estimates of existing conservation savings on water use and the effect of such savings are not readily available.
5.1.12 DMM 12 – Water Conservation Coordinator [Section 10631 (f)(1)(L)] The City has designated its Public Works Director as the City’s water conservation coordinator, which oversees conservation programs. In addition, the City will coordinate with EMWD and MWD on expanding it’s conservation programs. The City began implementing this program in 2005. The evaluation of the effectiveness and the estimates of existing conservation savings on water use and the effect of such savings are not readily available.
5.1.13 DMM 13 – Water Waste Prohibition [Section 10631 (f)(1)(M)] The City established an Ordinance for Water Conservation and Water Supply Shortage Program and Regulations on January 22, 2009, as shown in Appendix G. Section E of the City’s Water Conservation Ordinance prohibits waste of water at all times. The following are the subject requirements under Section E and violation of these requirements at any time is considered to be wasting water. Details of Section E can be found in Appendix G.
1. Limits on Water Hours 2. Limit on Watering Duration 3. No Excessive Water Flow or Runoff 4. No Washing Down Hard or Paved Surfaces

City of San Jacinto 2010 Urban Water Management Plan
5-7
5. Obligation to Fix Leaks, Breaks or Malfunctions 6. Re-circulating Water Required for Water Fountains and Decorative Water
Features 7. Limits on Washing Vehicles 8. Drinking Water Served Upon Request only 9. Commercial Lodging Establishments Must Provide Guests Option to Decline
Daily Linen Services 10. No Installation of Single Pass Cooling Systems 11. No Installation of Non-re-circulating in Commercial Car Wash and Laundry
Systems 12. Restaurants Required to Use Water Conserving Dish Wash Spray Valves 13. Commercial Car Wash Systems
Section K of the City’s Water Conservation Ordinance states the penalties and violations of any requirements listed in the City’s Water Conservation Ordinance. The number of on-site visits is not readily available. The evaluation of the effectiveness and the estimates of existing conservation savings on water use and the effect of such savings are not readily available.
5.1.14 DMM 14 – Residential Ultra Low-Flush Toilet Replacement Program [Section 10631 (f)(1)(N)]
The City is interested in expanding its water conservation programs and plans to coordinate with EMWD and MWD to implement an agreement for participation in MWD’s Residential Ultra Low-Flush Toilet Rebate Program. According to EMWD’s 2010 draft Plan, EMWD offers a rebate with funding through MWD. This rebate program is designed to aid homeowners in replacing toilets manufactured before 1992 with new, water efficient toilets and to assist the City in conserving water supplies. EMWD began offering incentives for toilet retrofits in 1992. Incentives for High Efficiency Toilets were added in 2005. It is unknown when the program first started. The evaluation of the effectiveness and the estimates of existing conservation savings on water use and the effect of such savings are not readily available.

City of San Jacinto 2010 Urban Water Management Plan
6-1
Chapter 6 – Water Supply Opportunities
Section 10631. (h) Include a description of all water supply projects and water supply programs that may
be undertaken by the urban water supplier to meet the total projected water uses as established pursuant to subdivision (a) of Section 10635. The urban water supplier shall include a detailed description of expected future projects and programs, other than the demand management programs identified pursuant to paragraph (1) of subdivision (f), that the urban water supplier may implement to increase the amount of water supply available to the urban water supplier in average, single dry, and multiple-dry water years. The description shall identify specific projects and include a description of the increase in water supply that is expected to be available from each project. The description shall include an estimate with regard to the implementation timeline for each project or program.
(i) Describe the opportunities for development of desalinated water, including, but not limited to, ocean water, brackish water, and groundwater, as a long-term supply.
6.1 Future Water Supply Projects and Programs [Section 10631 (h)]
The City, along with EMWD, LHMWD, and the City of Hemet have developed a proposed GWMP to ensure the Basin continues to provide a reliable source of supply and is discussed in Chapter 3. With the implementation of the GWMP, the City will have enough water supply to meet its demands in the future. As of December 2010, the City does not expect additional water supply projects or programs in the future.
6.2 Desalinated Water [Section 10631 (i)]
The City does not have opportunities to incorporate desalinated water into its supply. The City pumps groundwater from the Basin which is low in Total Dissolved Solids (TDS) and does not require desalination. According to “The City of San Jacinto’s 2009 Annual Water Quality Report”, which is provided in Appendix E, the average TDS value for the City’s active wells is about 295 parts per million (ppm) and ranges from 290 ppm to 300 ppm.

City of San Jacinto 2010 Urban Water Management Plan
7-1
Chapter 7 – Urban Water Shortage Contingency Analysis
Section 10632. The Plan shall provide an urban water shortage contingency analysis that includes each of the following elements that are within the authority of the urban water supplier: (a) Stages of action to be undertaken by the urban water supplier in response to water
supply shortages, including up to 50 percent reduction in water supply, and an outline of specific water supply conditions which are applicable to each stage.
(b) An estimate of the minimum water supply available during each of the next three water years based on the driest three-year historic sequence for the agency’s water supply.
(c) Actions to be undertaken by the urban water supplier to prepare for, and implement during, a catastrophic interruption of water supplies including, but not limited to, a regional power outage, an earthquake, or other disaster.
(d) Additional, mandatory prohibitions against specific water use practices during water shortages, including, but not limited to, prohibiting the use of potable water for street cleaning.
(e) Consumption reduction methods in the most restrictive stages. Each urban water supplier may use any type of consumption reduction methods in its water shortage contingency analysis that would reduce water use, are appropriate for its area, and have the ability to achieve a water use reduction consistent with up to a 50 percent reduction in water supply.
(f) Penalties or charges for excessive use, where applicable. (g) An analysis of the impacts of each of the actions and conditions described in
subdivisions (a) to (f), inclusive, on the revenues and expenditures of the urban water supplier, and proposed measures to overcome those impacts, such as the development of reserves and rate adjustments.
(h) A draft water shortage contingency resolution or ordinance. (i) A mechanism for determining actual reductions in water use pursuant to the urban
water shortage contingency analysis. 7.1 Management of Water Shortages [Section 10632 (e)]
As discussed in Chapter 5, the City established a Water Conservation and Water Supply Shortage Program Ordinance on January 22, 2009, as shown in Appendix G. In addition to a Water Conservation Program, the Ordinance also established a three-level Water Supply Shortage Program, which is also discussed in Chapter 5. The City water system typically relies exclusively on groundwater supplies from the Basin and has never experienced a groundwater supply shortage, regardless of the hydrologic conditions. In the event of mechanical failure of one of its wells, the City has interconnections with EMWD. However, as noted in Chapters 3 and 4 treated imported water from EMWD has been used infrequently.

City of San Jacinto 2010 Urban Water Management Plan
7-2
7.2 Stages of Action [Section 10632 (a)]
The City has developed a ‘four-stage’ rationing plan including up to 50 percent reduction in water supply if the City experiences a water supply shortage. The City’s plan includes voluntary and mandatory stages. In the event of a prolonged and severe drought, the rationing programs could be implemented as shown in Table 6. Stages I and II are voluntary stages and the customer reduction goal is 10 percent and 20 percent, respectively. Stages III and IV are mandatory stages and the customer reduction goal is 30 percent and 50 percent or greater, respectively.
7.3 Three Year Minimum Water Supply [Section 10632 (b)]
The City’s driest three-year period was 2006, 2007, and 2008. During those years, the City’s demand was 3,858, 3,681, and 3,029 acre-feet per year, respectively, as shown on Table 4. The City had adequate water supply from groundwater and imported water from EMWD to meet its demands, as shown on Table 2. Based on the City’s GWMP and historical data of meeting its demands during multiple dry year periods, it is anticipated the City will be able to provide adequate water to its customers in the next three-year period. Therefore, the three-year estimated minimum water supply available to the City is about 3,000 acre-feet per year from groundwater and 25 acre-feet per year from imported water from EMWD. Consequently, the City will have adequate supply in an average, single-dry and multiple dry year sequence.
7.4 Preparation for Catastrophic Water Supply [Section 10632 (c)]
The City has prepared an Emergency Operations Plan, as shown in Appendix F. The Emergency Operations Plan describes the actions the City will take during a catastrophic interruption of water supplies including, but not limited to, a regional power outage, an earthquake, or other disaster. In the event of a system failure, the City has three emergency water interconnections with EMWD. These interconnections are manually activated and can supply water in the event the City may need additional water due to a power failure or disaster.
7.5 Prohibitions and Penalties [Section 10632 (d), (f)]
As previously discussed, the City established a Water Conservation and Water Supply Shortage Program Ordinance on January 22, 2009, as shown in Appendix G. Section E of the Ordnance lists all the prohibitions the City requires and Section K of the Ordinance lists the penalties for violating any of the waste water prohibitions. The following are the subject requirements under Section E and violation of these requirements at any time is considered to be wasting water. Details of Section E can be found in Appendix G.

City of San Jacinto 2010 Urban Water Management Plan
7-3
1. Limits on Water Hours 2. Limit on Watering Duration 3. No Excessive Water Flow or Runoff 4. No Washing Down Hard or Paved Surfaces 5. Obligation to Fix Leaks, Breaks or Malfunctions 6. Re-circulating Water Required for Water Fountains and Decorative Water
Features 7. Limits on Washing Vehicles 8. Drinking Water Served Upon Request only 9. Commercial Lodging Establishments Must Provide Guests Option to Decline
Daily Linen Services 10. No Installation of Single Pass Cooling Systems 11. No Installation of Non-re-circulating in Commercial Car Wash and Laundry
Systems 12. Restaurants Required to Use Water Conserving Dish Wash Spray Valves 13. Commercial Car Wash Systems
The following are the penalties and violations under Section K. Details of Section K can be found in Appendix G.
1. Misdemeanor: Any violation of this section may be prosecuted as a misdemeanor punishable by imprisonment in the county jail for not more than 30 days, or by a fine not exceeding $1,000, or by both.
2. Penalties: Penalties for failure to comply with any provisions of the section are as follows:
a. First Violation: The City of San Jacinto will issue a written warning and deliver a copy of the section by mail.
b. Second Violation: A second violation within the preceding 12 calendar months is punishable by a fine not to exceed $25.
c. Third Violation: A third violation within the preceding 12 calendar months is punishable by a fine not to exceed $100.
d. Fourth and Subsequent Violations: A fourth and any subsequent violation is punishable by a fine not to exceed $500.
i. Water Flow Restrictor: In addition to any fines, the City of San Jacinto may install a water flow restrictor device of approximately one gallon per minute capacity for services up to one and one-half inch size and comparatively sized restrictors for larger services after written notice of intent to install a flow restrictor for a minimum of 48 hours.
e. Discontinuing Service: In addition to any fines and the installation of a water flow restrictor, the City of San Jacinto may disconnect a customer’s water service for willful violations of this section and adequate notice to the customer.

City of San Jacinto 2010 Urban Water Management Plan
7-4
7.6 Revenue and Expenditure Impacts [Section 10632 (g)]
The City has developed a tiered rate structure that 1) establishes a minimum monthly fixed charge for water service and 2) rewards water conservation with lower water rates. The City is cognizant of seasonal variation of water supply and, in turn, water sales. As a result, the City has developed a rate structure that conservatively and consistently will generate sufficient fixed income, based on water connections, to fund fixed costs. As an example, the water rates during calendar year 2009, which is provided in Appendix D, would conservatively generate about $750,000 using the water service rate of $15.36 per customer per month and assuming all 4,050 customers were small residential users. Over the same period fixed costs for staffing, insurance and rent were adequately funded. Variable costs such as repairs, cost of energy, and supplies are tied to the level of water service actually provided and will be funded by water sales. In addition, the City regularly reviews its revenues and expenses. Therefore, the City can adjust its rates if need to. This cursory review of the City’s fixed revenue and expenses along with the adopted rate structure indicates a reduction in sales should not result in a funding deficit. In the event of insufficient water sales, groundwater production could be reduced by 50 percent. In fiscal year 2008-09, the City’s revenues from water sales were about $1.8 million; which is about 60 percent of the total water revenues ($3.5 million) during fiscal year 2008-09. If revenue from water sales was reduced by 50 percent ($0.9 million), the City would face a reduction in its total revenue of about 70 percent. The City may be faced with the necessity to utilize operating reserve funds and/or capital reserve funds to cover fixed operating expenses until normal operating revenues could be reestablished. Significant reductions in the City’s operating and non-operating reserves could postpone or otherwise impact established water supply project and program schedules.
7.7 Water Shortage Contingency Ordinance/Resolution [Section 10632 (h)]
As previously discussed, the City established a Water Conservation and Water Supply Shortage Program Ordinance on January 22, 2009, as shown in Appendix G.
7.8 Reduction Measuring Mechanism [Section 10632 (i)]
As previously discussed, the City established a Water Conservation and Water Supply Shortage Program Ordinance on January 22, 2009, as shown in Appendix G. Section E of the Ordinance discusses the methods of reducing water use. Sections F, G and H of the Ordinance discusses the three levels the City established during a water supply shortage. The following are the subject requirements under Section E and violation of these

City of San Jacinto 2010 Urban Water Management Plan
7-5
requirements at any time is considered to be wasting water. Details of Section E can be found in Appendix G.
1. Limits on Water Hours 2. Limit on Watering Duration 3. No Excessive Water Flow or Runoff 4. No Washing Down Hard or Paved Surfaces 5. Obligation to Fix Leaks, Breaks or Malfunctions 6. Re-circulating Water Required for Water Fountains and Decorative Water
Features 7. Limits on Washing Vehicles 8. Drinking Water Served Upon Request only 9. Commercial Lodging Establishments Must Provide Guests Option to Decline
Daily Linen Services 10. No Installation of Single Pass Cooling Systems 11. No Installation of Non-re-circulating in Commercial Car Wash and Laundry
Systems 12. Restaurants Required to Use Water Conserving Dish Wash Spray Valves 13. Commercial Car Wash Systems
Below discusses the three levels established during a water supply shortage under Sections F, G, and H. The percentage of water use reductions (up to 50 percent) will be determined by the City Manager.
1. Level 1 Water Supply Shortage – Upon the declaration of a Level 1, the City will implement the mandatory Level 1 conservation measures:
a. Limits on Water Days: Limit to three days per week or one day per week during November through March.
b. Obligation to Fix Leaks, Breaks and Malfunctions: All leaks, breaks and malfunctions must be repaired within 72 hours of notification by the City.
2. Level 2 Water Supply Shortage – Upon the declaration of a Level 2, the City will implement the mandatory Level 2 conservation measures:
a. Watering Days: Watering is limit to two days a week or one day per week during November through March.
b. Obligation to Fix Leaks, Breaks and Malfunctions: All leaks, breaks and malfunctions must be repaired within 48 hours of notification by the City.
c. Limits on Filling Ornamental Lakes or Ponds: Filling or re-filling ornamental lakes or ponds is prohibited, except to sustain aquatic life.
d. Limits on Washing Vehicles: Using water to wash or clean vehicles is prohibited except by use of a hand-held bucket, a hand-held hose equipped with a positive self-closing water shut-off nozzle or a commercial car washing facility that utilizes a re-circulating water system.
e. Limits on Filling Residential Swimming Pools and Spas: Re-filling of more than one foot with potable water is prohibited.
3. Level 3 Water Supply Shortage – Upon the declaration of a Level 2, the City will implement the mandatory Level 2 conservation measures:
a. No Watering or Irrigating

City of San Jacinto 2010 Urban Water Management Plan
7-6
b. Obligation to Fix Leaks, Breaks and Malfunctions: All leaks, breaks and malfunctions must be repaired within 24 hours of notification by the City.
c. No New Potable Water Service d. Limits on Building Permits e. Discontinue Service f. No New Annexations

City of San Jacinto 2010 Urban Water Management Plan
8-1
Chapter 8 – Recycled Water
Section 10633. The plan shall provide, to the extent available, information on recycled water and its potential for use as a water source in the service area of the urban water supplier. The preparation of the plan shall be coordinated with local water, wastewater, groundwater, and planning agencies that operate within the supplier’s service area, and shall include all of the following: (a) A description of the wastewater collection and treatment systems in the supplier’s
service area, including a quantification of the amount of wastewater collected and treated and the methods of wastewater disposal.
(b) A description of the quantity of treated wastewater that meets recycled water standards, is being discharged, and is otherwise available for use in a recycled water project.
(c) A description of the recycled water currently being used in the supplier’s service area, including, but not limited to, the type, place, and quantity of use.
(d) A description and quantification of the potential uses of recycled water, including, but not limited to, agricultural irrigation, landscape irrigation, wildlife habitat enhancement, wetlands, industrial reuse, groundwater recharge, and other appropriate uses, and a determination with regard to the technical and economic feasibility of serving those uses.
(e) The projected use of recycled water within the supplier’s service area at the end of 5, 10, 15 and 20 years, and a description of the actual use of recycled water in comparison to uses previously projected pursuant to this subdivision.
(f) A description of actions, including financial incentives, which may be taken to encourage the use of recycled water, and the projected results of these actions in terms of acre-feet of recycled water used per year.
(g) A plan for optimizing the use of recycled water in the supplier’s service area, including actions to facilitate the installation of dual distribution systems, to promote recirculating uses, to facilitate the increased use of treated wastewater that meets recycled water standards, and to overcome any obstacles to achieving that increased use.
8.1 Existing Water Reclamation Facilities [Section 10633 (a),(b)]
The City does not own or operate any wastewater treatment facilities. All sewage generated within the City water system is provided to the Hemet/San Jacinto Regional Water Reclamation Facility (RWRF), which is operated by EMWD. A more thorough discussion of the RWRF is included in EMWD’s 2010 Plan, which is shown in Appendix H. According to EMWD’s 2010 Plan all treated wastewater is discharged into EMWD’s regional recycled water distribution system. EMWD has developed over 135 miles of regional transmission pipelines which connect all four of EMWD’s RWRFs, providing a flexible recycled water delivery system. In conjunction with over 6,000 acre-feet of surface storage reservoirs, these pipelines allow EMWD to sell over 90 percent to 100 percent of the treated wastewater produced in its service area. The balance of the treated recycled water is lost to incidental percolation during winter storage when

City of San Jacinto 2010 Urban Water Management Plan
8-2
demands for recycled water are minimal. The amount of wastewater collected, treated and disposed is shown in EMWD’s 2010 draft Plan, which is attached in Appendix H.
8.2 Potential Uses of Recycled Water [Section 10633 (c)]
As noted above, EMWD owns, operates and controls all recycled water use in the City’s service area. The recycled water production is sold for agricultural use, landscape, wildlife habitat, wetlands/lake, and industrial use. Prior to constructing a recycled water distribution system, the potential uses for recycled water must be identified. Potential uses of recycled water include:
1. Landscape irrigation; 2. Irrigation of community parks and schoolyards; 3. Industrial process (i.e. heating and cooling and contingent on suitable recycled
water quality; 4. Car washes; 5. Residential landscaping and toilet flushing in new developments, incorporating
dual piping systems for recycled and potable water.
8.3 Projected Use of Recycled Water [Section 10633(d-f)]
As previously mentioned, there is no recycled water available to the City for a reuse program at this time. The City will look at the possibility of using recycled water in the future when supplies may be available. Currently, the potential use of recycled water by the City is not technically or economically feasible.

City of San Jacinto 2010 Urban Water Management Plan
9-1
Chapter 9 – Water Quality
Section 10634. The plan shall include information, to the extent practicable, relating to the quality of existing sources of water available to the supplier over the same five-year increments as described in subdivision (a) of Section 10631, and the manner in which water quality affects water management strategies and supply reliability.
9.1 San Jacinto Groundwater Basin
The City supplies water to its customers from four active wells, as described in Chapter 3. The City tests water from each of its wells and files water quality reports with the California Department of Public Health (CDPH), as required. A copy of the City’s 2009 Annual Water Quality Report is presented in Appendix E, which shows high levels of Manganese and Iron in the raw water (untreated) at the City’s Grand and Bath Wells. The City operates two groundwater treatment plants for removal of Manganese and Iron located at the City’s Grand and Bath wellsites. After treatment, all water delivered to the City’s customers meets CDPH guidelines and is not expected to change over the next 20 years. Therefore, the water available to the City over the next 20 years will not be affected by the water quality.

City of San Jacinto 2010 Urban Water Management Plan
10-1
Chapter 10 – Water Supply Reliability
10.1 SB 7 REQUIRED WATER USE PARAMETERS
Section 10608.20 (a) (1) Each urban retail water supplier shall develop urban water use targets and an interim
urban water use target by July 1, 2011. Urban retail water suppliers may elect to determine and report progress toward achieving these targets on an individual or regional basis, as provided in subdivision (a) of Section 10608.28, and may determine the targets on a fiscal year or calendar year basis.
(2) It is the intent of the Legislature that the urban water use targets described in subdivision (a) cumulatively result in a 20-percent reduction from the baseline daily per capita water use by December 31, 2020.
Section 10608.20 (e)
An urban retail water supplier shall include in its urban water management plan required pursuant to Part 2.6 (commencing with Section 10610) due in 2010 the baseline daily per capita water use, urban water use target, interim urban water use target, and compliance daily per capita water use, along with the bases for determining those estimates, including references to supporting data.
Methodologies for calculating baseline and compliance urban per capita water use for the consistent implementation of the Water Conservation Act of 2009 have been published by DWR in its October 2010 guidance document.1 DWR’s guidance document was used by the City to determine the required water use parameters which are discussed below.
10.1.1 BASELINE DAILY PER CAPITA WATER USE
The Baseline Daily Per Capita Water Use is defined as the average water use, expressed in gallons per capita per day (GPCD), for a continuous, multi-year baseline period. There are two different baseline periods for calculating Baseline Daily Per Capita Water Use, as follows (CWC Sections 10608.20 and 10608.22):
• The first baseline period is a continuous 10- to 15-year period, and is used to
calculate Baseline Per Capita Water Use per CWC Section 10608.20. The first baseline period is determined as follows:
o If recycled water makes up less than 10 percent of 2008 retail water
delivery, use a continuous 10-year period ending no earlier than December 31, 2004, and no later than December 31, 2010.
1 California Department of Water Resources, Division of Statewide Integrated Water Management, Water
Use and Efficiency Branch. Methodologies for Calculating Baseline and Compliance Urban Per Capita Water Use. October 1, 2010.

City of San Jacinto 2010 Urban Water Management Plan
10-2
o If recycled water makes up 10 percent or more of 2008 retail water delivery, use a continuous 10- to 15-year period ending no earlier than December 31, 2004, and no later than December 31, 2010.
The City does not use recycled water. Consequently, the first baseline period will consist of a continuous 10-year period that can be selected between 1995-96 and 2008-09.
• The second baseline period is a continuous five-year period, and is used to determine whether the 2020 per capita water use target meets the legislation’s minimum water use reduction per CWC Section 10608.22. The continuous five-year period shall end no earlier than December 31, 2007, and no later than December 31, 2010.
The second baseline period consisting of a continuous five-year period can be selected between 2004 and 2009.
Unless the urban water retailer’s five-year Baseline Daily Per Capita Water Use per CWC Section 10608.12(b)(3) is 100 GPCD or less, Baseline Daily Per Capita Water Use must be calculated for both baseline periods. The calculation of the Baseline Daily Per Capita Water Use entails the following four steps:
Step 1 Calculate gross water use for each year in the baseline period using Methodology 1 in DWR’s guidance document. According to Methodology 1, gross water use is a measure of water supplied to the distribution system over 12 months and adjusted for changes in distribution system storage and deliveries to other water suppliers that pass through the distribution system. Recycled water deliveries are to be excluded from the calculation of gross water use. Water delivered through the distribution system for agricultural use may be deducted from the calculation of gross water use. Under certain conditions, industrial process water use also may be deducted from gross water use.
The calculated gross water use, based on recorded groundwater use, for each year in the baseline period is shown on Table 7.
Step 2 Estimate service area population for each year in the baseline period
using Methodology 2 in DWR’s guidance document. To obtain an accurate estimate of GPCD, water suppliers must estimate population of the areas that they actually serve, which may or may not coincide with either their jurisdictional boundaries or with the boundaries of cities. According to Methodology 2, data published by the California Department of Finance (DOF) or the U.S. Census Bureau must serve as the foundational building block for population estimates. In some instances, data published by these two sources may be directly applicable. In other
City of San Jacinto 2010 Urban Water Management Plan
10-3
instances, additional refinements may be necessary. For example, to account for distribution areas that do not match city boundaries, customers with private sources of supply, or other unique local circumstances, water suppliers may have to supplement the above sources of data with additional local data sources such as county assessor data, building permits data, and traffic analysis zone data. These refinements are acceptable as long as they are consistently applied over time, and as long as they build upon population data sources of the DOF or the U.S Census Bureau.
The City’s service area population for each year in the baseline period was based on the U.S. Census Bureau data (see Table 7).
Step 3 Calculate daily per capita water use for each year in the baseline period.
Divide gross water use (determined in Step 1) by service area population (determined in Step 2).
The calculated daily per capita water use for each year in the baseline period is shown on Table 7.
Step 4 Calculate Baseline Daily Per Capita Water Use. Calculate average per
capita water use by summing the values calculated in Step 3 and dividing by the number of years in the baseline period. The result is Baseline Daily Per Capita Water Use for the selected baseline period.
The average per capita water use calculated for a continuous 10-year baseline period (first baseline period) is shown on Table 7, with the highest value of 218 GPCD.
The Baseline Daily Per Capita Water Use for the City was determined to be 218 GPCD, based on the highest value calculated for a continuous 10-year period (first baseline period) between 1996 and 2009 (see Table 7).
10.1.2 URBAN WATER USE TARGET
Section 10608.20 (b) An urban retail water supplier shall adopt one of the following methods for determining its urban water use target pursuant to subdivision (a): (1) Eighty percent of the urban retail water supplier’s baseline per capita daily water
use. (2) The per capita daily water use that is estimated using the sum of the following
performance standards: (A) For indoor residential water use, 55 gallons per capita daily water use as a
provisional standard. Upon completion of the department’s 2016 report to the Legislature pursuant to Section 10608.42, this standard may be adjusted by the Legislature by statute.
(B) For landscape irrigated through dedicated or residential meters or connections, water efficiency equivalent to the standards of the Model Water Efficient Landscape Ordinance set forth in Chapter 2.7 (commencing with Section 490) of Division 2 of Title 23 of the California Code of Regulations, as

City of San Jacinto 2010 Urban Water Management Plan
10-4
in effect the later of the year of the landscape’s installation or 1992. An urban retail water supplier using the approach specified in this subparagraph shall use satellite imagery, site visits, or other best available technology to develop an accurate estimate of landscaped areas.
(C) For commercial, industrial, and institutional uses, a 10-percent reduction in water use from the baseline commercial, industrial, and institutional water use by 2020.
(3) Ninety-five percent of the applicable state hydrologic region target, as set forth in the state’s draft 20x2020 Water Conservation Plan (dated April 30, 2009). If the service area of an urban water supplier includes more than one hydrologic region, the supplier shall apportion its service area to each region based on population or area.
(4) A method that shall be identified and developed by the department, through a public process, and reported to the Legislature no later than December 31, 2010. The method developed by the department shall identify per capita targets that cumulatively result in a statewide 20-percent reduction in urban daily per capita water use by December 31, 2020. In developing urban daily per capita water use targets, the department shall do all of the following: (A) Consider climatic differences within the state. (B) Consider population density differences within the state. (C) Provide flexibility to communities and regions in meeting the targets. (D) Consider different levels of per capita water use according to plant water
needs in different regions. (E) Consider different levels of commercial, industrial, and institutional water use
in different regions of the state. (F) Avoid placing an undue hardship on communities that have implemented
conservation measures or taken actions to keep per capita water use low.
The Urban Water Use Target is determined using one of the following methods:
Method 1: Eighty percent of the urban retail water supplier’s Baseline Per Capita Daily Water Use.
Using this method, the Urban Water Use Target for the City was calculated as 174 GPCD, based on the City’s Baseline Per Capita Daily Water Use of 218 GPCD.
Method 2: Estimate using the sum of the specified three performance standards.
Due to insufficient data, this method was not considered.
Method 3: Ninety-five percent of the applicable state hydrologic region target, as
set forth in the state’s 20x2020 Water Conservation Plan.2
Based on the 20x2020 Water Conservation Plan, the City’s service area lies in DWR Hydrologic Region 4 (South Coast), with an established Baseline Per Capita Daily Water Use of 180 GPCD and a Target Per Capita Daily Water Use of 149 GPCD. Using this method,
2 California Department of Water Resources, State Water Resources Control Board, California Bay-Delta
Authority, California Energy Commission, California Department of Public Health, California Public Utilities Commission, and California Air Resources Board. 20x2020 Water Conservation Plan. February 2010.

City of San Jacinto 2010 Urban Water Management Plan
10-5
the Urban Water Use Target for the City was calculated as 142 GPCD.
Method 4: [To be developed by DWR]
The City’s Urban Water Use Target was determined to be 174 GPCD for 2020, based on Method 1 above.
10.1.3 INTERIM URBAN WATER USE TARGET
Based on the City’s Baseline Daily Per Capita Water Use of 218 GPCD and Urban Water Use Target of 174 GPCD, the City’s Interim Urban Water Use Target for 2015 was calculated as 196 GPCD.
10.1.4 COMPLIANCE DAILY PER CAPITA WATER USE
Compliance Daily Per Capita Water Use is defined as the Gross Water Use during the final year of the reporting period, and reported in GPCD. The Compliance Daily Per Capita Water Use will be reported in the City’s 2015 Plan (interim compliance) and 2020 Plan (final compliance).
10.1.5 MINIMUM WATER USE REDUCTION REQUIREMENT
Section10608.22 Notwithstanding the method adopted by an urban retail water supplier pursuant to Section 10608.20, an urban retail water supplier’s per capita daily water use reduction shall be no less than 5 percent of base daily per capita water use as defined in paragraph (3) of subdivision (b) of Section 10608.12. This section does not apply to an urban retail water supplier with a base daily per capita water use at or below 100 gallons per capita per day.
The following calculation is made because the five-year Baseline Per Capita Water Use per CWC Section 10608.12(b)(3) is greater than 100 GPCD. The calculation is used to determine whether the water supplier’s 2015 and 2020 per capita water use targets meet the legislation’s minimum water use reduction requirement per CWC Section 10608.22. The calculation entails three steps:
Step 1: Calculate Baseline Daily Per Capita Water Use using a continuous five-year period ending no earlier than December 31, 2007, and no later than December 31, 2010.
This value was calculated as 218 GPCD (see Table 7).
Step 2: Multiply the result from Step 1 by 0.95. The 2020 per capita water use
target cannot exceed this value (unless the water supplier’s five-year Baseline Per Capita Water Use is 100 GPCD or less). If the 2020 target is greater than this value, reduce the target to this value.

City of San Jacinto 2010 Urban Water Management Plan
10-6
This value was calculated as 207 GPCD. The City’s 2020 Urban Water Use Target was determined using Method 3 above to be 174 GPCD, which is lower than the value calculated in this step. Therefore, no adjustment is needed for the City’s 2020 Urban Water Use Target of 174 GPCD.
Step 3: Set the 2015 target to mid-point between the 10- or 15-year Baseline Per
Capita Water Use and the 2020 target determined in Step 2.
The City’s 2015 Interim Urban Water Use Target is therefore set at 196 GPCD, which is the same value determined in Section 10.1.3 above.
Therefore, the City’s 2015 Interim Urban Water Use Target of 196 GPCD and 2020 Urban Water Use Target of 174 GPCD meet the legislation’s minimum water use reduction requirement per CWC Section 10608.22.
10.2 ASSESSMENT OF THE RELIABILITY OF WATER SUPPLY
Section 10635 (a) Every urban water supplier shall include, as part of its urban water management plan,
an assessment of the reliability of its water service to its customers during normal, dry, and multiple dry years. This water supply and demand assessment shall compare the total water supply sources available to the water supplier with the total projected water use over the next 20 years, in five-year increments, for a normal water year, a single dry year water year, and multiple dry water years. The water service reliability assessment shall be based upon the information compiled pursuant to Section 10631, including available data from state, regional, or local agency population projections within the service area of the urban water supplier.
As previously discussed in Section 10.1, the City applied Senate Bill No. 7 to estimate the City’s 2015 Interim Urban Water Use Target of 196 GPCD and the City’s 2020 Urban Water Use Target of 174 GPCD. These Urban Water Use Targets were then applied to estimate the City’s projected normal year supplies in 2015, 2020, 2025 and 2030. However, the City estimates buildout by 2020 at an estimated demand of 4,271 acre-feet or 166 GPCD, which is lower than the required 2015 and 2020 Urban Water Use Targets of 196 GPCD and 174 GPCD, respectively, as shown on Table 3. Therefore, the City expects to meet its 2015 and 2020 Urban Water Use Targets. The City will continue to use groundwater as its future water supplies over the next 20 years. The following sections discuss the City’s water service reliability assessment, which compares the City’s supply and demand over the next 20 years during normal, dry and multiple dry years.
10.2.1 NORMAL WATER YEAR
As previously discussed, the City will meet the required 2015 and 2020 Urban Water Use Targets during a normal water year. The City’s projected demand and supply was based on the estimated buildout by 2020 at 4,271 acre-feet, as shown on Table 3. The
City of San Jacinto 2010 Urban Water Management Plan
10-7
comparison of the City’s projected supply and demand during a normal water year is shown on Table 8. As shown on Table 8, the City’s supply can meet demands during a normal water year for the next 20 years.
10.2.2 SINGLE-DRY YEAR
As shown on Table 4, the City experienced a single-dry year during calendar year 2004 and a normal water year during calendar year 2003. The ratio between the normal water year and single-dry year was estimated for the City’s supply and demand, as shown on Table 4. This ratio and the projected supply and demand during a normal water year from Table 8 was used to estimate the City’s projected supply and demand during a single-dry year over the next 20 years in five-year increments. The comparison of the City’s projected supply and demand during a single-dry year is shown on Table 9. As shown on Table 9, the City’s supply can meet demands during a single-dry year for the next 20 years.
10.2.3 MULTIPLE DRY YEARS
As shown on Table 4, the City experienced multiple dry years during calendar years 2006, 2007, 2008, and 2009. The ratio between the normal water year in 2003 and multiple dry years were estimated for the City’s supply and demand, as shown on Table 4. This ratio and the projected supply and demand during a normal water year from Table 8 was used to estimate the City’s projected supply and demand during multiple dry years over the next 20 years in five-year increments. However, if this calculation was greater than the City’s estimated buildout of 4,271 acre-feet, then projected the supply/demand during multiple dry years would be capped at 4,271 acre-feet, as shown on Table 10. The comparison of the City’s projected supply and demand during multiple dry years is shown on Table 10. As shown on Table 10, the City’s supply can meet demands during multiple dry years for the next 20 years.
10.2.4 GROUNDWATER RELIABILITY
The City has historically relied on the Basin as its source to meet all demands. The City has satisfactory met all water demands, even during the prolonged statewide drought in the late 1980’s. The City does not anticipate any water supply problems over the next 20 years. Demands based on projected population increased are estimated to increase from about 2,900 acre-feet during calendar year 2010 to about 4,271 acre-feet in calendar year 2030, increase of 1,371 acre-feet. In addition, the City has treated imported water connections with EMWD in the event of a mechanical failure at one of its wells as backup water supply. The City primarily relies on groundwater from the Basin. The City and other local water agencies are developing a GWMP, cooperatively manage water supplies and continue to pursue water management options. Consequently, the City believes its water supplies will reliably meet demand, even under multiple dry years.

City of San Jacinto 2010 Urban Water Management Plan
10-8
10.3 RELIABILITY INFORMATION
Section 10635(b) The urban water supplier shall provide that portion of its urban water management plan prepared pursuant to this article to any city or county within which it provides water supplies no later than 60 days after submission of its urban water management plan.
The City will provide a copy of the 2010 Plan to the following agencies, cities and counties no later than 60 days after submission of the 2010 Plan to DWR:
1. City of San Jacinto 2. County of Riverside 3. Eastern Municipal Water District
10.4 WATER USE REDUCTION PLAN
Section 10608.36. Urban wholesale water suppliers shall include in the urban water management plans required pursuant to Part 2.6 (commencing with Section 10610) an assessment of their present and proposed future measures, programs, and policies to help achieve the water use reductions required by this part.
The City is not an urban wholesale water supplier. Therefore, this requirement is not applicable to the City.
10.5 PROGRESS REPORT
Section 10608.40. Urban water retail suppliers shall report to the department on their progress in meeting their urban water use targets as part of their urban water management plans submitted pursuant to Section 10631. The data shall be reported using a standardized form developed pursuant to Section 10608.52.
The City will report to the DWR on its progress in meeting its urban water use targets,
using a standardized form to be developed by the DWR, when the form becomes
available.

Janu
ary
Febr
uary
Mar
chA
pril
May
June
July
Aug
ust
Sept
embe
rO
ctob
erN
ovem
ber
Dec
embe
rA
nnua
l
Ave
rage
Rai
nfal
l (in
.)2.
62.
72.
20.
60.
40
00.
20.
30.
50.
90.
311
.7A
vera
ge T
empe
ratu
re (o F)
52.3
54.4
56.2
61.4
6773
.979
.880
.375
.567
.257
.652
.564
.8Ev
apot
rans
pira
tion
(ETo
)1.
92.
23.
44.
85.
66.
36.
56.
24.
83.
72.
41.
949
.7
Sou
rce:
Dat
a fro
m w
ww
.city
-dat
a.co
m u
nder
City
of S
an J
acin
to
Clim
ate
Tabl
e 1
Z:\J
obs\
1935
\09\
2010
UW
MP
\tabl
es\T
able
s

Grand Old Bath New Bath Mistletoe Artesia Lake Park Subtotal
1982 1/ 1/ -- 1/ -- -- 1,908 0 1,908 2,519 0.76 1983 1/ 1/ -- 1/ -- -- 1,991 0 1,991 2,561 0.78 1984 1/ 1/ -- 1/ -- -- 2,345 0 2,345 2,602 0.90 1985 1/ 1/ -- 1/ -- -- 2,442 0 2,442 2,633 0.93 1986 1/ 1/ -- 1/ -- -- 2,572 0 2,572 2,687 0.96 1987 1/ 1/ -- 1/ -- -- 2,573 0 2,573 2,715 0.95 1988 1/ 1/ -- 1/ -- -- 2,394 0 2,394 2,802 0.85 1989 1/ 2/ 1/ 1/ -- -- 2,497 0 2,497 2,917 0.86 1990 1/ -- 1/ 1/ -- -- 2,430 0 2,430 3,165 0.77 1991 1/ -- 1/ 1/ -- -- 1,953 0 1,953 3,325 0.59 1992 1/ -- 1/ 1/ -- -- NA 0 NA 3,406 NA1993 1,274 -- 1,460 20 -- -- 2,753 0 2,753 3,418 3/ 0.81 3/1994 1,018 -- 1,600 216 -- -- 2,834 0 2,834 3,430 3/ 0.83 3/1995 1,357 -- 1,221 12 -- -- 2,590 54 2,644 3,441 3/ 0.77 3/1996 1,163 -- 1,774 46 -- -- 2,982 47 3,029 3,453 3/ 0.88 3/1997 987 -- 1,282 2/ -- -- 2,269 600 2,869 3,465 3/ 0.83 3/1998 1,080 -- 1,734 -- -- -- 2,814 120 2,934 3,477 3/ 0.84 3/1999 550 -- 1,357 -- 819 -- 2,725 0 2,725 3,488 3/ 0.78 3/2000 465 -- 934 -- 1,381 -- 2,780 0 2,780 3,500 3/ 0.79 3/2001 495 -- 941 -- 1,306 -- 2,742 0 2,742 3,510 3/ 0.78 3/2002 866 -- 996 -- 1,369 -- 3,231 34 3,265 3,520 3/ 0.93 3/2003 895 -- 963 -- 1,296 -- 3,154 2 3,157 3,529 3/ 0.89 2004 510 -- 712 -- 1,572 -- 2,794 175 2,968 3,539 3/ 0.84 3/2005 370 -- 939 -- 1,773 -- 3,082 0 3,082 4,228 0.73 2006 652 -- 1,002 -- 2,152 -- 3,806 52 3,858 4,634 0.83 2007 687 -- 705 -- 1,540 749 3,681 0 3,681 4,030 0.91 2008 508 -- 483 -- 705 1,310 3,006 23 3,029 3,998 0.76 2009 505 -- 679 -- 401 1,283 2,868 0 2,868 3,956 0.72 2010 733 -- 703 -- 424 935 2,795 0 2,795 4,045 0.69
Average 0.82
3/ Estimated
City of San Jacinto
NA Information Not Available
Table 2
Historical Annual Production (acre-feet)
Water Use per Customer (AF/meter)
Customers (meters)
Water Supply (AF)
Purchased Water from EMWD
2/ Ceased Operation
TotalCalendar YearLocal Groundwater Wells
1/ Not quantified seperately
Z:\Jobs\1935\09\2010 UWMP\tables\Tables 8/3/2011

Year
Ag
Dom
estic
Tota
lG
roun
dEM
WD
Tota
lW
ater
2/
2010
02,
900
2,90
02,
900
02,
900
170
--20
150
3,46
93,
469
3,46
90
3,46
916
619
620
200
4,27
14,
271
4,27
10
4,27
116
617
420
250
4,27
14,
271
4,27
10
4,27
116
617
420
300
4,27
14,
271
4,27
10
4,27
116
617
4
1/ D
ata
from
City
sta
ff. C
ity s
taff
estim
ates
bui
ldou
t at 4
,271
acr
e-fe
et b
y 20
20.
2/ I
nclu
des
Sob
oba
Set
tlem
ent a
nd in
form
atio
n fro
m G
roun
dwat
er M
anag
emen
t Pla
n3/
Bas
ed o
n pr
ojec
ted
dem
ands
from
City
sta
ff an
d pr
ojec
ted
popu
latio
n fro
m C
hapt
er 2
4/ E
stim
ated
Wat
er U
se b
ased
on
proj
ecte
d de
man
ds is
low
er th
an U
rban
Wat
er U
se T
arge
ts.
Ther
efor
e, th
e C
ity w
ill b
e ab
le to
mee
t the
Sta
te's
requ
irem
ents
.
Tabl
e 3
City
of S
an J
acin
to P
roje
cted
Wat
er S
uppl
y an
d D
eman
d(a
cre-
feet
)
Dem
and
1/Su
pply
Urb
an W
ater
Use
Ta
rget
(GPC
D) 4
/
Estim
ated
Wat
er U
se
Bas
ed o
n Pr
ojec
ted
Dem
ands
(GPC
D) 3
/
Z:\J
obs\
1935
\09\
2010
UW
MP
\tabl
es\T
able
s

Year 1 Year 2 Year 3 Year 4(2003) (2004) (2006) (2007) (2008) (2009)
Anticipated Demand 1/ 3,157 2,968 3,858 3,681 3,029 2,868
Percent of Normal Year Demand -- 94 122 117 96 91
Anticipated Supply 1/
San Jacinto Basin 3,154 2,794 3,806 3,681 3,006 2,868EMWD 2 175 52 0 23 0Total 3,157 2,968 3,858 3,681 3,029 2,868
Percent of Normal Year Supply -- 94 122 117 96 91
1/ See Table 2
Multiple Dry Water YearsAverage/ Normal Water Year
Single Dry Water Year
Table 4City of San JacintoSupply Reliability
(acre-feet)
Z:\Jobs\1935\09\2010 UWMP\tables\Tables

# of accounts Deliveries AFY # of accounts Deliveries AFY Single family NA NA NA NA Multi family NA NA NA NA Commercial/Institutional NA NA NA NA Industrial NA NA NA NALandscape Irrigation NA NA NA NA Other NA NA NA NALow Income Housing NA NA NA NA
Total NA NA NA NA
# of accounts Deliveries AFY # of accounts Deliveries AFY Single family 2,780 1,061 0 0 Multi family 310 721 0 0 Commercial/Institutional 758 447 0 0 Industrial 4 3 0 0Landscape Irrigation 190 459 0 0 Other 7 126 0 0Low Income Housing NA NA NA NA
Total 4,049 2,817 0 0
# of accounts Deliveries AFY # of accounts Deliveries AFY Single family 3,500 1,544 0 0 Multi family 410 821 0 0 Commercial/Institutional 760 447 0 0 Industrial 4 3 0 0Landscape Irrigation 190 459 0 0 Other 7 126 0 0Low Income Housing NA NA NA NA
Total 4,871 3,400 0 0
unmetered
metered unmetered
Water Use SectorsCalendar Year 2015
metered unmetered
Water Use Sectors
Table 5City of San Jacinto
Past, Current and Projected Water Sales
Calendar Year 2009
Water Use SectorsCalendar Year 2005
metered
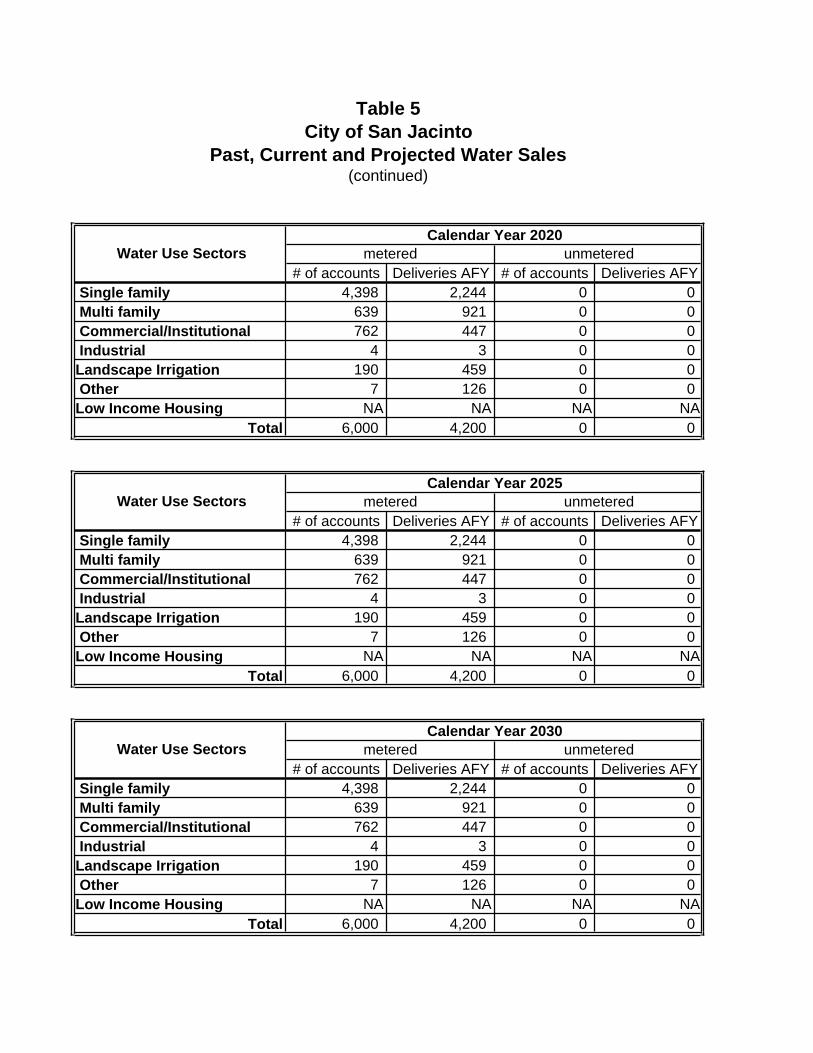
Table 5City of San Jacinto
Past, Current and Projected Water Sales
# of accounts Deliveries AFY # of accounts Deliveries AFY Single family 4,398 2,244 0 0 Multi family 639 921 0 0 Commercial/Institutional 762 447 0 0 Industrial 4 3 0 0Landscape Irrigation 190 459 0 0 Other 7 126 0 0Low Income Housing NA NA NA NA
Total 6,000 4,200 0 0
# of accounts Deliveries AFY # of accounts Deliveries AFY Single family 4,398 2,244 0 0 Multi family 639 921 0 0 Commercial/Institutional 762 447 0 0 Industrial 4 3 0 0Landscape Irrigation 190 459 0 0 Other 7 126 0 0Low Income Housing NA NA NA NA
Total 6,000 4,200 0 0
# of accounts Deliveries AFY # of accounts Deliveries AFY Single family 4,398 2,244 0 0 Multi family 639 921 0 0 Commercial/Institutional 762 447 0 0 Industrial 4 3 0 0Landscape Irrigation 190 459 0 0 Other 7 126 0 0Low Income Housing NA NA NA NA
Total 6,000 4,200 0 0
Water Use SectorsCalendar Year 2025
metered unmetered
Water Use SectorsCalendar Year 2030
metered unmetered
Calendar Year 2020metered unmetered
(continued)
Water Use Sectors

Table 6
Customer Type ofShortage Reduction RationingCondition Stage Goal Program
Up to 15% I 10% Voluntary15 - 25% II 20% Voluntary25 - 35% III 30% Mandatory35 - 50% IV 50% or greater Mandatory
Water Rationing Stages and Reduction Goals
Z:\Jobs\1935\09\2010 UWMP\tables\Tables

10-Y
ear
Con
tinuo
us3/
5-Ye
arC
ontin
uous
4/
1996
3,02
92,
704,
076
1996
10,9
2024
819
972,
869
2,56
0,80
019
9711
,240
228
1998
2,93
42,
618,
940
1998
11,5
6022
719
992,
725
2,43
2,86
319
9911
,880
205
2000
2,78
02,
481,
274
2000
12,2
0020
320
012,
742
2,44
7,51
420
0112
,400
197
2002
3,26
52,
914,
627
2002
12,6
0023
120
033,
157
2,81
7,86
220
0312
,800
220
2004
2,96
82,
649,
890
2004
13,0
0020
420
053,
082
2,75
0,93
720
0513
,200
208
217
2006
3,85
83,
443,
814
2006
13,6
0025
321
820
073,
681
3,28
6,16
320
0714
,000
235
218
2008
3,02
92,
703,
626
2008
14,4
0018
821
421
820
092,
868
2,56
0,03
220
0914
,800
173
211
211
10-Y
ear B
asel
ine
Dai
ly P
er C
apita
Wat
er U
se =
218
5-Y
ear B
asel
ine
Dai
ly P
er C
apita
Wat
er U
se =
218
1/ S
ee T
able
2.
Incl
udes
EM
WD
pur
chas
es2/
See
Cha
pter
2 o
n po
pula
tion.
3/ A
vera
ge p
er c
apita
wat
er u
se fo
r firs
t bas
e pe
riod
of 1
0-ye
ar c
ontin
uous
, end
ing
no e
arlie
r tha
n D
ecem
ber 3
1, 2
004
and
no la
ter t
han
Dec
embe
r 31,
201
0.4/
Ave
rage
per
cap
ita w
ater
use
for s
econ
d ba
se p
erio
d of
5-y
ear c
ontin
uous
, end
ing
no e
arlie
r tha
n D
ecem
ber 3
1, 2
007
and
no la
ter t
han
Dec
embe
r 31,
201
0.5/
Hig
hest
val
ue c
alcu
late
d fo
r a 1
0-ye
ar c
ontin
uous
per
iod
betw
een
1995
-96
and
2008
-09.
6/ H
ighe
st v
alue
cal
cula
ted
for a
5-y
ear c
ontin
uous
per
iod
betw
een
2003
-04
and
2008
-09.
Cal
cula
ted
Gro
ss W
ater
U
se (g
allo
ns
per d
ay)
Rec
orde
dSu
pply
(acr
e-fe
et)1/
Cal
enda
rYe
ar
Ave
rage
Per
Cap
ita W
ater
Use
Cal
cula
ted
Dai
ly P
er
Cap
ita W
ater
U
se
Estim
ated
Serv
ice
Are
a Po
pula
tion
2/
Cal
enda
rYe
ar
Tabl
e 7
City
of S
an J
acin
to
Wat
er U
seSe
rvic
e A
rea
Popu
latio
nPe
r Cap
ita W
ater
Use
Bas
elin
e D
aily
Per
Cap
ita W
ater
Use
Z:\J
obs\
1935
\09\
2010
UW
MP
\tabl
es\T
able
s

2015 2020 2025 2030
Projected Normal Water Year SupplyTotal Supply 1/ 3,469 4,271 4,271 4,271Percent of Base Year for Normal Year (2003) 2/ 110 135 135 135
Projected Normal Water Year DemandDemand 1/ 3,469 4,271 4,271 4,271Percent of Current Year (2009) 3/ 121 149 149 149
Projected Normal Year Supply and Demand ComparisonDifference (Supply minus Demand) 0 0 0 0Difference as Percent of Supply 0 0 0 0Difference as Percent of Demand 0 0 0 0
1/ See Table 32/ Ratio of projected water supply with Base Year for Normal Water Year (2003). See Table 23/ Ratio of projected water demand with Current Year (2009). See Table 2
Table 8Projected Normal Water Year Supply and Demand Comparison
(acre-feet)
Z:\Jobs\1935\09\2010 UWMP\tables\Tables

2015 2020 2025 2030
Projected Single-Dry Year SupplyTotal Supply 1/ 3,262 4,016 4,016 4,016Percent of Projected Normal Year 2/ 94 94 94 94
Projected Normal Water Year DemandDemand 1/ 3,262 4,016 4,016 4,016Percent of Projected Normal Year 3/ 94 94 94 94
Projected Normal Year Supply and Demand ComparisonDifference (Supply minus Demand) 0 0 0 0Difference as Percent of Supply 0 0 0 0Difference as Percent of Demand 0 0 0 0
1/ See Table 32/ Ratio of projected Single-Dry water supply with projected Normal Year supply. See Table 83/ Ratio of projected Single-Dry water demand with projected Normal Year demand See Table 8
Table 9Projected Single-Dry Year Supply and Demand Comparison
(acre-feet)
Z:\Jobs\1935\09\2010 UWMP\tables\Tables

Period Beginning 2015 Year 1 Year 2 Year 3 Year 4 Year 5Projected Multiple-Dry Year Water Supply
Supply 1/ 4,240 4,046 3,328 3,152 3,152Percent of Projected Normal Year 2/ 122 117 96 91 91
Projected Multiple-Dry Year Water DemandDemand 1/ 4,240 4,046 3,328 3,152 3,152Percent of Projected Normal Year 2/ 122 117 96 91 91
Projected Multiple-Dry Year Water Supply and Demand Comparison Difference (Supply minus Demand) 0 0 0 0 0Difference as Percent of Supply 0 0 0 0 0Difference as Percent of Demand 0 0 0 0 0
Period Beginning 2020 Year 1 Year 2 Year 3 Year 4 Year 5Projected Multiple-Dry Year Water Supply
Supply 1/ 4,271 4,271 4,098 3,880 3,880Percent of Projected Normal Year 2/ 100 100 96 91 91
Projected Multiple-Dry Year Water DemandDemand 1/ 4,271 4,271 4,098 3,880 3,880Percent of Projected Normal Year 2/ 100 100 96 91 91
Projected Multiple-Dry Year Water Supply and Demand Comparison Difference (Supply minus Demand) 0 0 0 0 0Difference as Percent of Supply 0 0 0 0 0Difference as Percent of Demand 0 0 0 0 0
Table 10Projected Multiple Dry Years Supply and Demand Comparison
(acre-feet)
Z:\Jobs\1935\09\2010 UWMP\tables\Tables

Table 10Projected Multiple Dry Years Supply and Demand Comparison
(acre-feet)
Period Beginning 2025 Year 1 Year 2 Year 3 Year 4 Year 5Projected Multiple-Dry Year Water Supply
Supply 1/ 4,271 4,271 4,098 3,880 3,880Percent of Projected Normal Year 2/ 100 100 96 91 91
Projected Multiple-Dry Year Water DemandDemand 1/ 4,271 4,271 4,098 3,880 3,880Percent of Projected Normal Year 2/ 100 100 96 91 91
Projected Multiple-Dry Year Water Supply and Demand Comparison Difference (Supply minus Demand) 0 0 0 0 0Difference as Percent of Supply 0 0 0 0 0Difference as Percent of Demand 0 0 0 0 0
Period Beginning 2030 Year 1 Year 2 Year 3 Year 4 Year 5Projected Multiple-Dry Year Water Supply
Supply 1/ 4,271 4,271 4,098 3,880 3,880Percent of Projected Normal Year 2/ 100 100 96 91 91
Projected Multiple-Dry Year Water DemandDemand 1/ 4,271 4,271 4,098 3,880 3,880Percent of Projected Normal Year 2/ 100 100 96 91 91
Projected Multiple-Dry Year Water Supply and Demand Comparison Difference (Supply minus Demand) 0 0 0 0 0Difference as Percent of Supply 0 0 0 0 0Difference as Percent of Demand 0 0 0 0 0
1/ Based on ratio between Normal Water Year with Multiple Dry Years. See Tables 4 and 8. However, if calculation is greater than the City's estimated buildout of 4,271 AF, then supply/demand will cap at 4,271 AF.
2/ Ratio of projected multiple dry years with projected normal water year. See Table 8
(continued)
Z:\Jobs\1935\09\2010 UWMP\tables\Tables

CIT
Y O
F SA
N J
AC
INTO
STE
TSO
N E
NG
INE
ER
S IN
C.
Cov
ina
San
Raf
ael
Mes
a, A
rizon
aA
NN
UA
L R
AIN
FALL
WA
TER
RE
SO
UR
CE
EN
GIN
EE
RS
Figure 1
051015202530 1950
1952
1954
1956
1958
1960
1962
1964
1966
1968
1970
1972
1974
1976
1978
*19
8019
8219
8419
8619
8819
9019
9219
9419
9619
9820
0020
0220
0420
0620
08
Cal
enda
r Yea
r
Inches Sou
rce:
Clim
atol
ogic
al D
ata
Ann
ual S
umm
ary,
VO
L. 5
4 th
roug
h103
for c
alen
dar y
ears
195
0 - 1
999
and
Cou
nty
of R
iver
side
Flo
od C
ontro
l for
Cal
enda
r Yea
rs 2
000
- 200
5*S
tatio
n m
oved
from
San
Jac
into
to S
an J
acin
to R
ange
r Sta
tion
begi
nnin
g in
197
8
60-y
ear A
vera
ge
11.6
7 in
ches
Z:\J
obs\
1935
\09\
2010
UW
MP
\figu
res\
Figu
re1