city of san antonio antonio baseball...city of san antonio ... 2001 albuquerque dukes portland, or...
TRANSCRIPT

CITY OF SAN ANTONIO
MINOR LEAGUE BASEBALL
DUE DILIGENCE REPORT
PREPARED BY:
BARRETT SPORTS GROUP, LLC
SEPTEMBER 16, 2016
PRELIMINARY DRAFT – SUBJECT TO REVISION CONFIDENTIAL

Page 2Preliminary Draft – Subject to Revision Confidential
The following report has been prepared for the internal use of the City of San Antonio and is subject to the attached limiting conditions and assumptions
The scope of services has been limited – additional due diligence required
Findings are preliminary in nature and subject to revision
This report may not be used, in whole or in part, in any financing document

Page 3Preliminary Draft – Subject to Revision Confidential
I. EXECUTIVE SUMMARY
II. SAN ANTONIO MISSIONS OVERVIEW
III. TRIPLE-A BASEBALL OVERVIEW
IV. MARKET OVERVIEW
V. PRELIMINARY PROGRAM RECOMMENDATION
VI. FINANCIAL ANALYSIS
VII. FINANCING ALTERNATIVES
APPENDIX A: MARKET DEMOGRAPHICS
APPENDIX B: BRAILSFORD & DUNLAVEY REPORT REVIEW
APPENDIX C: MLB POTENTIAL
LIMITING CONDITIONS AND ASSUMPTIONS
TABLE OF CONTENTS

I. EXECUTIVE SUMMARY

Page 5Preliminary Draft – Subject to Revision Confidential
Introduction
Barrett Sports Group, LLC (BSG) is pleased to present our preliminary findings to the City of SanAntonio (City)
The City retained BSG to evaluate potential feasibility of the proposed development of a new state-of-the-art Triple-A minor league baseball stadium in San Antonio, Texas
Seven potential Triple-A stadium sites have been identified by the City and Populous ITC Fox Tech South Fox Tech UTSA Alamodome Irish Flats Fox Tech North
The City is currently home to the Double-A San Antonio Missions
The findings are limited since BSG has not completed market surveys and/or focus group sessions –consideration could be given to completing these tasks
I. EXECUTIVE SUMMARY

Page 6Preliminary Draft – Subject to Revision Confidential
Potential Stadium Sites
1. ITC Site
2. Fox Tech South Site
3. Fox Tech Site
4. UTSA Site
5. Alamodome Site
6. Irish Flats Site
7. Fox Tech North Site
I. EXECUTIVE SUMMARY
Page 7Preliminary Draft – Subject to Revision Confidential
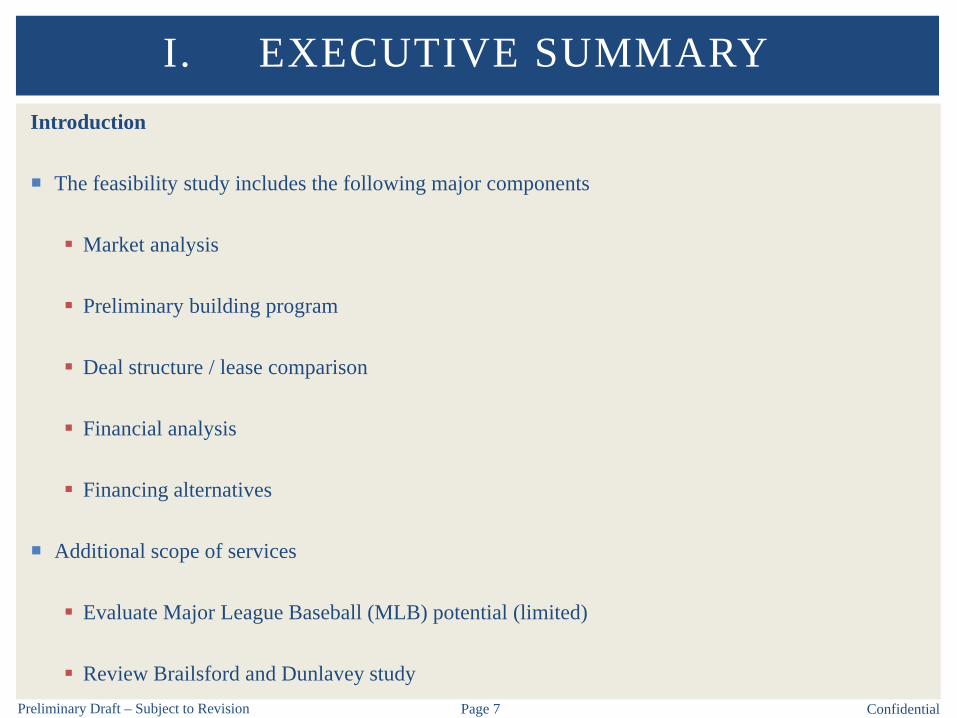
Introduction
The feasibility study includes the following major components
Market analysis
Preliminary building program
Deal structure / lease comparison
Financial analysis
Financing alternatives
Additional scope of services
Evaluate Major League Baseball (MLB) potential (limited)
Review Brailsford and Dunlavey study
I. EXECUTIVE SUMMARY

Page 8Preliminary Draft – Subject to Revision Confidential
Summary of Tasks Completed
Toured potential stadium sites
Reviewed historical operating / financial data for the Missions (limited – confidential)
Prepared overview of Triple-A baseball
Analyzed demographics of local and comparable market areas
Analyzed facility characteristics of competitive facilities
Evaluated facilities in comparable markets
Prepared preliminary program for a new stadium
Reviewed operating and financial data from other MiLB teams and stadiums
Developed cash flow model to estimate operating revenues and expenses for Triple-A team / stadium
Identified potential funding sources
Evaluated Major League Baseball (MLB) potential (limited)
Reviewed Brailsford and Dunlavey and Premier Partnerships studies
I. EXECUTIVE SUMMARY

Page 9Preliminary Draft – Subject to Revision Confidential
San Antonio Missions Overview
San Antonio Missions are a member of the Double-A Texas League
Second highest level of affiliated Minor League Baseball (MiLB)
Missions are currently affiliated with the Major League Baseball (MLB) San Diego Padres
Missions began play in San Antonio in 1972
Prior iteration of the Missions relocated to Midland, Texas following the 1971 season
Missions have played at Wolff Stadium since 1994
Dave Elmore is the owner of the Missions – he and / or his son D.G. Elmore own the following teams
Triple-A Colorado Spring Sky Sox
A-Advanced Bakersfield Blaze (D.G. Elmore) and Lynchburg Hillcats
Single-A Inland Empire 66ers
Short Season-A Eugene Emeralds
Rookie League Idaho Falls Chukars and Helena Brewers (D.G. Elmore)
ECHL Utah Grizzlies
I. EXECUTIVE SUMMARY

Page 10Preliminary Draft – Subject to Revision Confidential
San Antonio Missions OverviewTexas League Attendance
Missions have the lowest average attendance in the Texas League over the past five seasons
I. EXECUTIVE SUMMARY
Team 2011 2012 2013 2014 20155 Year
Average Rank
Frisco RoughRiders 7,276 7,076 7,057 6,614 6,918 6,988 1Tulsa Drillers 5,387 5,323 5,704 6,211 5,858 5,697 2Corpus Christi Hooks 5,645 5,556 5,498 5,625 5,338 5,532 3Springfield Cardinals 5,109 5,111 5,205 5,134 4,964 5,105 4Arkansas Travelers 4,625 4,531 4,519 5,097 5,038 4,762 5Northwest Arkansas Naturals 4,779 4,656 4,685 4,625 4,469 4,643 6Midland RockHounds 4,541 4,562 4,598 4,471 4,248 4,484 7San Antonio Missions 4,203 4,440 4,329 4,269 4,605 4,369 8
Total 41,565 41,255 41,595 42,046 41,438 41,580Average (Ex. San Antonio) 5,337 5,259 5,324 5,397 5,262 5,316Source: Double-A Baseball.

Page 11Preliminary Draft – Subject to Revision Confidential
Triple-A Baseball Overview
Triple-A baseball is the highest level of affiliated minor league baseball
Comprised of 30 teams
Pacific Coast League (16 teams)
International League (14 teams)
I. EXECUTIVE SUMMARY
Pacific Coast League
Albuquerque IsotopesColorado Springs Sky Sox
El Paso ChihuahuasFresno Grizzlies
Iowa CubsLas Vegas 51s
Memphis RedbirdsNashville Sounds
New Orleans ZephyrsOklahoma City DodgersOmaha Storm Chasers
Reno AcesRound Rock Express
Sacramento River CatsSalt Lake Bees
Tacoma Rainiers
International League
Buffalo BisonsCharlotte Knights
Columbus ClippersDurham Bulls
Gwinnett BravesIndianapolis Indians
Lehigh Valley IronPigsLouisville BatsNorfolk Tides
Pawtucket Red SoxRochester Red Wings
Scranton / Wilkes-Barre RailRiders
Syracuse ChiefsToledo Mud Hens

Page 12Preliminary Draft – Subject to Revision Confidential
Triple-A Baseball OverviewTriple-A Map
Team locations for Pacific Coast League (left) and International League (right) are displayed below
I. EXECUTIVE SUMMARY

Page 13Preliminary Draft – Subject to Revision Confidential
Triple-A Baseball OverviewTriple-A Stadium Characteristics
Below is a summary of Triple-Astadium characteristics
I. EXECUTIVE SUMMARY
Team StadiumYear Opened/
RenovatedFixed
CapacityTotal
CapacityLuxury Suites
Club Seats
Nashville Sounds First Tennessee Park 2015 8,500 10,000 22 800El Paso Chihuahuas Southwest University Park 2014 7,200 9,500 24 300Charlotte Knights BB&T Ballpark 2014 8,800 10,200 21 1,027Durham Bulls Durham Bulls Athletic Park 1995/2014 10,000 11,300 10 225Scranton/Wilkes-Barre RailRiders PNC Field 1989/2013 7,300 10,000 18 273Tacoma Rainiers Cheney Stadium 1960/2011 6,500 8,500 16 167Omaha Storm Chasers Werner Park 2011 6,434 9,023 15 675Gwinnett Braves Coolray Field 2009 7,777 10,427 21 0Columbus Clippers Huntington Park 2009 8,800 10,100 32 650Reno Aces Greater Nevada Field 2009 6,500 9,100 22 342Lehigh Valley IronPigs Coca-Cola Park 2008 8,089 10,178 25 1,061Albuquerque Isotopes Isotopes Park 1969/2003 11,124 12,215 30 661Toledo Mud Hens Fifth Third Field 2002 8,943 10,300 32 1,200Fresno Grizzlies Chukchansi Park 2002 12,500 14,500 33 620Memphis Redbirds AutoZone Park 2000 8,404 10,700 29 1,800Louisville Bats Louisville Slugger Field 2000 11,600 13,131 32 850Round Rock Express Dell Diamond 2000 8,631 11,631 30 100Sacramento River Cats Raley Field 2000 11,100 14,680 36 505Pawtucket Red Sox McCoy Stadium 1942/1999 10,031 11,800 13 0Oklahoma City Dodgers Chickasaw Bricktown Ballpark 1998 9,000 9,500 26 550Syracuse Chiefs NBT Bank Stadium 1997 9,891 11,731 20 0New Orleans Zephyrs Zephyr Field 1997 10,000 11,000 16 0Rochester Red Wings Frontier Field 1996 10,840 13,840 23 0Indianapolis Indians Victory Field 1996 12,202 14,202 28 0Salt Lake Bees Smith's Ballpark 1994 13,000 15,334 24 150Norfolk Tides Harbor Park 1993 11,856 12,156 20 0Iowa Cubs Principal Park 1992 11,500 12,000 45 144Buffalo Bisons Coca-Cola Field 1988 17,600 17,750 27 0Colorado Springs Sky Sox Security Service Field 1988 6,200 8,500 18 0Las Vegas 51s Cashman Field 1983 9,334 11,400 0 0
Average 9,655 11,490 24 403Source: Industry Research.

Page 14Preliminary Draft – Subject to Revision Confidential
Triple-A Baseball OverviewTriple-A Attendance
Triple-A teams have averaged6,575 in announced attendanceper game over the past fiveyears
Announced figures are typicallyhigher than actual / turnstileattendance
I. EXECUTIVE SUMMARY
Team 2011 2012 2013 2014 20155 Year
Average Rank
Lehigh Valley IronPigs 9,249 9,153 9,016 9,042 8,769 9,046 1Columbus Clippers 8,704 8,732 9,212 8,985 9,016 8,930 2Indianapolis Indians 8,170 8,501 8,980 9,433 9,331 8,883 3Sacramento River Cats 8,455 8,140 8,435 8,561 9,338 8,586 4Round Rock Express 8,587 8,389 8,181 8,390 8,623 8,434 5Louisville Bats 8,716 8,143 8,185 7,990 7,537 8,114 6Albuquerque Isotopes 8,145 8,120 7,994 8,066 8,007 8,066 7Buffalo Bisons 7,784 7,370 8,273 8,110 8,228 7,953 8Toledo Mud Hens 7,963 7,870 7,779 7,680 7,699 7,798 9Pawtucket Red Sox 8,270 7,551 7,827 7,367 6,572 7,517 10Iowa Cubs 7,256 7,283 6,977 7,029 7,531 7,215 11Durham Bulls 6,517 6,811 7,125 7,615 7,814 7,176 12Salt Lake Bees 6,438 7,162 7,482 6,722 6,823 6,925 13Fresno Grizzlies 6,958 6,551 6,771 6,781 6,457 6,704 14Rochester Red Wings 6,493 6,094 6,098 6,401 6,291 6,275 15Charlotte Knights 4,105 4,030 3,803 9,686 9,428 6,210 16Memphis Redbirds 7,050 6,954 7,223 5,693 4,037 6,191 17Oklahoma City Dodgers/RedHawks 5,262 5,633 5,797 6,045 6,941 5,936 18Omaha Storm Chasers 5,947 5,938 5,666 5,628 5,516 5,739 19Norfolk Tides 5,684 5,560 5,704 5,267 5,767 5,596 20Nashville Sounds 4,857 4,792 5,071 4,909 7,965 5,519 21Reno Aces 6,089 5,415 4,921 5,270 5,377 5,414 22Scranton/Wilkes-Barre RailRiders/Yankees 4,586 3,944 6,409 5,906 5,753 5,320 23El Paso Chihuahuas/Tucson Padres 3,410 2,956 2,818 7,901 8,154 5,048 24New Orleans Zephyrs 5,315 4,999 4,929 4,913 4,710 4,973 25Colorado Springs Sky Sox 4,843 4,915 5,181 5,078 4,619 4,927 26Tacoma Rainiers 5,331 4,889 4,446 4,699 4,965 4,866 27Syracuse Chiefs 5,854 5,288 5,150 3,743 3,803 4,768 28Las Vegas 51's 4,486 4,388 4,690 4,640 4,834 4,608 29Gwinnett Braves 5,095 4,680 4,762 4,281 3,808 4,525 30
Total 195,619 190,251 194,905 201,831 203,713 197,264Average 6,521 6,342 6,497 6,728 6,790 6,575Source: Triple-A Baseball.

Page 15Preliminary Draft – Subject to Revision Confidential
Triple-A Baseball OverviewTriple-A Relocation History
Relocation history (since 1981) is summarized below
I. EXECUTIVE SUMMARY
Season Original Franchise Relocation City, State2013 Tucson Padres El Paso, TX2010 Portland Beavers Tucson, AZ (Temporary)2009 Tucson Sidewinders Reno, NV2009 Richmond Braves Lawrenceville, GA2008 Ottawa Lynx Allentown, PA2005 Edmonton Trappers Round Rock, TX2003 Calgary Cannons Albuquerque, NM2001 Albuquerque Dukes Portland, OR2000 Vancouver Canadiens Sacramento, CA1998 Phoenix Firebirds Tucson, AZ - (1)1998 Tucson Toros Fresno, CA - (1)1994 Portland Beavers Salt Lake City, UT1993 Denver Zephyrs New Orleans, LA1989 Maine Phillies Moosic, PA (Scranton/Wikes-Barre)1988 Hawaii Islanders Colorado Springs, CO1985 Wichita Aeros Buffalo, NY1983 Spokane Indians Las Vegas, NV1982 Springfield Redbirds Louisville, KY1981 Ogden A's Edmonton, Canada(1) The Phoenix Firebirds moved into Tucson and became the Tucson Sidewinders, while the Tucson Toros moved to Fresno, CA. Source: Industry Research.

Page 16Preliminary Draft – Subject to Revision Confidential
Market Overview
Market area size and characteristics will have an impact on market support and the potential demandfor Triple-A baseball
Limited market analysis – evaluated base market characteristics
Triple-A market area comparison with San Antonio
Core based statistical arena designation (CBSA)
Geographic ring designation 20 mile ring designation 30 mile ring designation
Drive time designation 30 minute drive time designation
Demographic comparison focuses on several key factors that impact market demand for teams /stadiums
I. EXECUTIVE SUMMARY

Page 17Preliminary Draft – Subject to Revision Confidential
Market Overview
According to Nielsen, a Core Based Statistical Area (CBSA) is an area consisting of a conglomerationof counties. A CBSA is further defined as a Metropolitan or Micropolitan CBSA. A MetropolitanCBSA consists of a geographic area with an urban core population of at least 50,000. A MicropolitanCBSA consists of a geographic area with an urban core population of between 10,000 and 49,999.
San Antonio-New Braunfels CBSA includes
Bexar County Atascosa County Medina County Bandera County Kendall County Comal County Guadalupe County Wilson County
I. EXECUTIVE SUMMARY

Page 18Preliminary Draft – Subject to Revision Confidential
General Market Overview
Market demographics also evaluated based on geographic ring designation (20 mile / 30 mile)
I. EXECUTIVE SUMMARY

Page 19Preliminary Draft – Subject to Revision Confidential
General Market Overview
Market demographics also evaluated based on drive time designation (30 minutes)
I. EXECUTIVE SUMMARY

Page 20Preliminary Draft – Subject to Revision Confidential
General Market Overview – Population
I. EXECUTIVE SUMMARY
City of Bexar Drive TimeSan Antonio County CBSA 20 Miles 30 Miles 30 Minutes
Population2021 Projection 1,540,300 2,055,185 2,588,668 2,111,558 2,361,103 2,166,6992016 Estimate 1,440,900 1,904,785 2,394,156 1,955,721 2,183,193 2,006,3772010 Census 1,327,407 1,714,773 2,142,508 1,758,459 1,953,981 1,802,2072000 Census 1,150,963 1,392,926 1,711,624 1,415,021 1,553,304 1,448,904
Growth 2016-2021 6.9% 7.9% 8.1% 8.0% 8.1% 8.0%Growth 2010-2016 8.5% 11.1% 11.7% 11.2% 11.7% 11.3%Growth 2000-2010 15.3% 23.1% 25.2% 24.3% 25.8% 24.4%Source: Nielsen 2016.
Geographic Rings

Page 21Preliminary Draft – Subject to Revision Confidential
Triple-A Demographic SummaryCBSA Designation Overview
San Antonio
Population / Households – above average
Estimated Growth – above average
Income – slightly below average
High Income Households – above average
Unemployment Rate – below average
GDP – above average
TV / Radio Population – above average
Corporate Base – above average
Cost of Living – below average
I. EXECUTIVE SUMMARY
Statistical Measure San AntonioRank of 31
Triple-A Average - (1)
2016 Population (000s) 2,394.2 4 1,495.0 2021 Population (000s) 2,588.7 4 1,569.0 Est. % Growth 2016-2021 8.12% 2 4.26%
2016 Households (000s) 858.8 4 570.3 2021 Households (000s) 933.0 4 599.6 Est. % Growth 2016-2021 8.64% 2 4.53%
Average Household Income $72,810 17 $74,479Median Household Income $54,437 19 $55,510High Income Households (000s) 194.1 7 139.5
Average Age 36.7 5 38.1Median Age 34.9 5 37.1
Unemployment Rate 3.40% 5 4.66%
Economy Size (GDP - Billions) $104.8 9 $83.5
TV Population 2,429.4 10 2,139.4 Radio Population 1,990.6 4 1,346.6
Companies w/ $20+mm Sales 684 8 586Companies w/ $50+mm Sales 333 8 285Companies w/ 500+ Employees 172 6 126
Cost of Living Index 86.5 4 96.1
Triple-A Summary - CBSA Designation Overview
(1) - Average excludes San Antonio.Source: Nielsen 2016, ThinkTV 2016, BLS 2016, Hoovers 2016, The Council for Community and Economic Research 2016, and U.S. BEA.

Page 22Preliminary Draft – Subject to Revision Confidential
Demographic SummaryKey Demographic Ratios
San Antonio
Total seat inventory – slightly above average
Luxury suite inventory – slightly belowaverage
Club seat inventory – above average
Population per seat – above average
Corporate base per suite ratios – near average
High income households per club seat –below average (due to Alamodome inventory)
Note: Includes only sports and entertainmentfacilities with 5,000 seats or more and includes apotential new Triple-A stadium replacing thecurrent ballpark
I. EXECUTIVE SUMMARY
Statistical Measure San AntonioRank of 31
Triple-A Average - (1)
Total Seats 126,323 13 119,145Population per Seat 19.0 6 13.1
Total Suites 144 12 152Companies w/ $20mm Sales per Suite 4.8 8 4.8Companies w/ $50mm Sales per Suite 2.3 10 2.3Companies w/ 500+ Employees per Suite 1.2 10 1.1
Total Club Seats 9,706 7 5,186High Income Households per Club Seat 20.0 21 56.2
Triple-A Summary - CBSA Designation Overview
(1) - Average excludes San Antonio.Source: Nielsen 2016, Hoovers 2016, Industry Research.

Page 23Preliminary Draft – Subject to Revision Confidential
Competitive Facilities
Limited number of competitive stadiums / arenas in the San Antonio market
Existing and planned competitive inventory of stadiums / arenas in the San Antonio market couldimpact the operations of the team
Competition from other stadiums, arenas, amphitheaters, performing arts centers (to a lesser degree),and other entertainment alternatives must be considered
Patrons
Advertising / Sponsorships
Premium Seating
Competition from regional facilities must also be considered
Austin and surrounding region
I. EXECUTIVE SUMMARY

Page 24Preliminary Draft – Subject to Revision Confidential
Local Sports Teams
Limited number of competitive local professional sports teams in the San Antonio market
San Antonio is home to only one major professional team (NBA San Antonio Spurs)
San Antonio is also home to four minor / other league teams
MiLB San Antonio Missions
AHL San Antonio Rampage
WNBA San Antonio Stars
USL San Antonio FC
San Antonio also hosts University of Texas at San Antonio athletics
Consideration should also be given to competition from major collegiate programs in the region
I. EXECUTIVE SUMMARY

Page 25Preliminary Draft – Subject to Revision Confidential
Market Analysis – General Observations
San Antonio market can support a new, state-of-the-art, downtown Triple-A stadium
San Antonio would be one of the largest Triple-A markets based on CBSA, 20 and 30 mile rings, and30 minute drive time designations – population, households, high income households, GDP, mediamarket, corporate base
San Antonio is one of the fastest growing markets as compared to other Triple-A markets
San Antonio’s income levels are slightly below (but nearly at) the Triple-A market average
San Antonio ranks favorably in terms of total population and corporate base ratios, but is belowaverage in terms of high income households per club seat (due to Alamodome inventory)
Limited professional competition in San Antonio
NBA San Antonio Spurs season has limited overlap with baseball season USL San Antonio FC season occurs during baseball season
I. EXECUTIVE SUMMARY

Page 26Preliminary Draft – Subject to Revision Confidential
Market Analysis – General Observations
San Antonio has a history of success in terms of local market support (attendance / corporate)
NBA San Antonio Spurs NASL San Antonio Scorpions (now USL San Antonio FC) AHL San Antonio Rampage
Missions have lowest average attendance in the Texas League over past five seasons – area of concern
Potential stadium / site issue
I. EXECUTIVE SUMMARY
Page 27Preliminary Draft – Subject to Revision Confidential
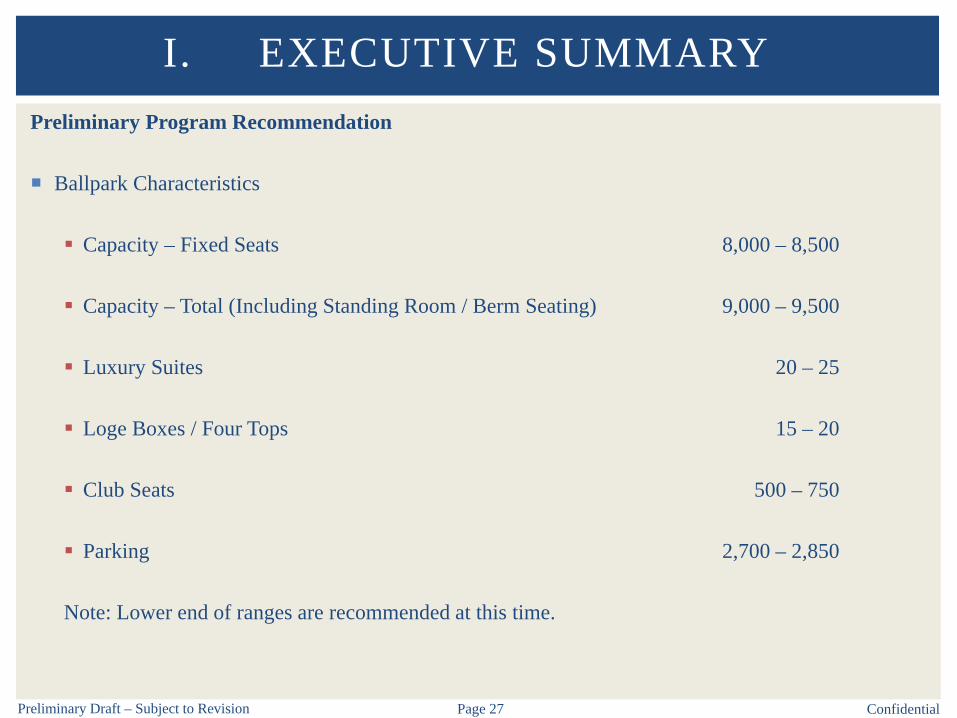
Preliminary Program Recommendation
Ballpark Characteristics
Capacity – Fixed Seats 8,000 – 8,500
Capacity – Total (Including Standing Room / Berm Seating) 9,000 – 9,500
Luxury Suites 20 – 25
Loge Boxes / Four Tops 15 – 20
Club Seats 500 – 750
Parking 2,700 – 2,850
Note: Lower end of ranges are recommended at this time.
I. EXECUTIVE SUMMARY

Page 28Preliminary Draft – Subject to Revision Confidential
Financial Analysis
BSG developed financial and operating assumptions for a Triple-A minor league baseball team andstadium in downtown San Antonio to understand the potential net cash flow from operations
BSG has assumed the following stadium program
8,000 (fixed seats) / 9,000 (total capacity)
20 luxury suites
20 loge boxes / four tops
500 club seats
500 controlled parking spaces (placeholder)
BSG has made significant assumptions related to the team and stadium operating revenues andexpenses
I. EXECUTIVE SUMMARY

Page 29Preliminary Draft – Subject to Revision Confidential
Financial Analysis
BSG reviewed the historical operating and financial performance of the Missions (limited)
BSG reviewed and evaluated comparable team / stadium information from our internal database todevelop key assumptions as well as our industry knowledge
Information obtained from numerous sources including teams, comparable facilities, industry sources,etc.
In order to obtain accurate and relevant information, we agreed to maintain confidentiality of dataprovided by teams / facilities
Comparable data adjusted to reflect impact of key variables on performance Market demographics Cost of living Number of professional and collegiate sports teams Other entertainment alternatives Local market conditions Tenant / event mix Climate Other
I. EXECUTIVE SUMMARY

Page 30Preliminary Draft – Subject to Revision Confidential
Financial Analysis
BSG has assumed the followinglease terms
Analysis does not include (to bedetermined)
Stadium rent Ticket surcharge Capital replacement reserve
I. EXECUTIVE SUMMARY
Stadium RentMinimum RentBase RentPercentage Rent
Taxes/SurchargesTicket Sales Tax
Revenue SharingConcessionsNoveltiesAdvertising – Game DayAdvertising – PermanentTelevisionNaming RightsParkingLuxury Suites – TicketsLuxury Suites – PremiumClub Seats – TicketsClub Seats – Premium
Stadium ExpensesGame Day Operating ExpensesAnnual Operating ExpensesCapital Repairs/Improvements
Other Events
Stadium Share0% 0%0%0%0%0%0%0%0%0%0%
0%0%
To be Determined0%
Amount Paid by TeamTo be DeterminedTo be DeterminedTo be Determined
8.25%Team Share
100% 100%100%100%100%100%100%100%100%100%100%
100% 100%
To be Determined100%

Page 31Preliminary Draft – Subject to Revision Confidential
Financial AnalysisPreliminary Cash Flow Summary
Although assumptions appear reasonable based on current and anticipated market conditions, actualresults depend on actions of team and stadium ownership, team and stadium management, tenants /users, and other factors both internal and external to project, which frequently vary
It is important to note that because events and circumstances may not occur as expected, there may besignificant differences between actual results and those estimated in this analysis, and thosedifferences may be material
Based on the assumptions described herein and assuming experienced and effective management, thefinancial model illustrates that the team would generate a positive net cash flow from operations
The financial model illustrates that the net cash flow from operations may decline after the initial“honeymoon” period (estimated at 3 to 4 years)
Consideration should be given to establishing a capital repair, replacement, and improvement fund
I. EXECUTIVE SUMMARY

Page 32Preliminary Draft – Subject to Revision Confidential
Financial AnalysisAssumptions Summary
Below is a summary of key cashflow model assumptions
We have assumed a three yearhoneymoon period. Attendancehas been assumed to decrease 10%in year four and an additional 5%in year five. In addition, ticketprices and concessions / noveltiesper caps are assumed to remainrelatively constant from year threeto four.
I. EXECUTIVE SUMMARYYear 1 Year 2 Year 3 Year 4 Year 5
Baseball Games (Regular Season) 72 72 72 72 72Paid Attendance (Regular Season)
Average 7,000 7,000 7,000 6,373 6,059Total 504,000 504,000 504,000 458,836 436,254
Complimentary Attendance (General Seating) 10.0% 10.0% 10.0% 10.0% 10.0%No-Show Attendance (General Seating) 15.0% 15.0% 15.0% 15.0% 15.0%Turnstile Attendance (Regular Season)
Average 6,577 6,577 6,577 5,981 5,683Total 473,564 473,564 473,564 430,658 409,205
Average Ticket Price (Weighted Average) $10.00 $10.30 $10.61 $10.64 $10.97Concessions Per Capita
Gross $10.00 $10.30 $10.61 $10.61 $10.93Net $4.50 $4.64 $4.77 $4.77 $4.92
Novelties Per CapitaGross $1.50 $1.55 $1.59 $1.59 $1.64Net $0.45 $0.46 $0.48 $0.48 $0.49
Sponsorship (Gross)Stadium Advertising $2,150,000 $2,214,500 $2,280,935 $2,349,363 $2,419,844Naming Rights $650,000 $669,500 $689,585 $710,273 $731,581
Luxury SuitesTotal Available for Lease 19 19 19 19 19Number Reserved 1 1 1 1 1Number Leased 17 17 17 17 17Gross Price $40,000 $41,000 $42,025 $43,076 $44,153
Loge Boxes/Four TopsTotal Available for Lease 20 20 20 20 20Number Leased 18 18 18 18 18Gross Price $10,000 $10,250 $10,506 $10,769 $11,038Gross Price $0 $0 $0 $0 $0
Club SeatsTotal Available 500 500 500 500 500Number Leased 450 450 450 450 450Gross Price (Per Seat) $1,500 $1,545 $1,591 $1,639 $1,688
ExpensesStadium and Game Expenses $2,750,000 $2,832,500 $2,917,475 $3,004,999 $3,095,149Team Expenses $500,000 $515,000 $530,450 $546,364 $562,754General and Administrative $3,000,000 $3,090,000 $3,182,700 $3,278,181 $3,376,526Other $160,000 $164,800 $169,744 $174,836 $180,081

Page 33Preliminary Draft – Subject to Revision Confidential
Financial AnalysisPreliminary Cash Flow Summary
Net cash flow reflects consolidated team / stadium operation – does not include stadium rent,admission surcharge, or capital improvements (to be determined)
I. EXECUTIVE SUMMARY
($ in 000s)Year 1 Year 2 Year 3 Year 4 Year 5
OPERATING REVENUESTickets (Net) $4,308 $4,437 $4,570 $4,171 $4,091Luxury Suites/Loge Boxes/Four-Tops (Premium) $545 $559 $573 $587 $602Club Seats (Premium) $118 $122 $125 $129 $133Advertising/Sponsorship (Net) $1,828 $1,882 $1,939 $1,997 $2,057Naming Rights (Net) $553 $569 $586 $604 $622Concessions (Net) $2,131 $2,195 $2,261 $2,056 $2,012Novelties (Net) $213 $219 $226 $206 $201Parking (Net) $265 $273 $281 $288 $296Other (Special Events/Promotions/Programs/Etc.) $438 $451 $465 $475 $487
TOTAL OPERATING REVENUES $10,399 $10,707 $11,025 $10,512 $10,501
OPERATING EXPENSESStadium and Game Expenses $2,750 $2,833 $2,917 $3,005 $3,095Team Expenses $500 $515 $530 $546 $563General and Administrative $3,000 $3,090 $3,183 $3,278 $3,377Management Fee $0 $0 $0 $0 $0Other $160 $165 $170 $175 $180
TOTAL OPERATING EXPENSES $6,410 $6,602 $6,800 $7,004 $7,215
NET CASH FLOW FROM OPERATIONS $3,989 $4,105 $4,225 $3,508 $3,286
Less: Stadium Rent TBD TBD TBD TBD TBDLess: Admission Surcharge TBD TBD TBD TBD TBDLess: Capital Improvements TBD TBD TBD TBD TBD
NET CASH FLOW FROM OPERATIONS - ADJUSTED $3,989 $4,105 $4,225 $3,508 $3,286
Estimated

Page 34Preliminary Draft – Subject to Revision Confidential
Financial AnalysisPreliminary Sensitivity Analysis –Year 1
Sensitivities illustrate potentialfluctuations in net cash flow
Sensitivities reflect impact offluctuation of one assumption –impact (positive or negative)likely to occur in more than oneassumption
Does not include stadium rent,admission surcharge, or capitalimprovements (to be determined)
I. EXECUTIVE SUMMARYNET CASH
FLOWBASE CASE - YEAR 1 $3,989
ADJUSTEDASSUMPTION ADJUSTMENT NET IMPACT CASH FLOW
Average Paid Attendance - (1)Increase 10% $592 $4,581Decrease (10%) ($592) $3,396
Average Ticket PriceIncrease 10% $367 $4,356Decrease (10%) ($367) $3,622
Premium Seating - Average Price/OccupancyIncrease 10% $268 $4,256Decrease (10%) ($237) $3,752
AdvertisingIncrease 10% $183 $4,171Decrease (10%) ($183) $3,806
No Naming Rights NA ($553) $3,436
Concessions/Novelties Per CapitasIncrease 10% $234 $4,223Decrease (10%) ($234) $3,754
Operating ExpensesIncrease 10% ($641) $3,348Decrease (10%) $641 $4,630
(1) - Reflects general seating attendance only - does not include premium seating.
SENSITIVITY ANALYSIS

Page 35Preliminary Draft – Subject to Revision Confidential
Financing AlternativesGeneral Trends in Stadium / Arena Facility Finance and Construction
Market conditions and political environment play critical role in developing financing structure
Increasingly difficult to fund construction of sports facilities – public resistance / high costs
Combination of both public and private participation is cornerstone of current financing structures
Planning and construction of public facilities can take many years due to typical construction risks,voter approval, political debate, etc.
Public sector participation can come in numerous forms
Equity investment New or increased taxes Tax rebates (property, payroll, etc.) Conduit financing Credit enhancement / guarantees
I. EXECUTIVE SUMMARY

Page 36Preliminary Draft – Subject to Revision Confidential
Financing AlternativesGeneral Trends in Stadium / Arena Facility Finance and Construction
Private sector participation typically comes in the form of equity and debt secured by facilityoperations and/or corporate guarantees
Private sector participation through non-traditional sources (i.e., PSLs, premium seating, namingrights, vendor rights) can be an important part of financing plans
In some instances, private sector grants and donations have been utilized to fund facilities
Private sector participation in minor league facilities is often limited due to the economics offranchise and stadium operations
Franchises and private management firms have increasingly taken over management and operations ofsports facilities
I. EXECUTIVE SUMMARY

Page 37Preliminary Draft – Subject to Revision Confidential
Financing AlternativesPotential Financing Mechanisms / Funding Sources
BSG identified traditional public funding sources – list narrowed to the following potential sources Admissions surcharge / facility fee Stadium rent Hotel occupancy tax Car rental tax Parking tax Restaurant tax
It is important to note that selected revenue sources discussed herein may require public vote,legislative approval, and/or may require some form of additional credit enhancement, as well asadditional research and confirmation
Information contained herein has been obtained from sources believed to be reliable. Figures have notbeen audited or further verified. Figures provided are subject to accounting / reporting policies andinterpretation.
Additional sources were considered but not included (e.g. sales tax, property tax, cigarette tax, beerand wine tax, etc.)
Financial and political feasibility of potential public revenue streams to be further evaluated
I. EXECUTIVE SUMMARY

Page 38Preliminary Draft – Subject to Revision Confidential
Financing AlternativesTriple-A Stadium Public and Private Investment Must consider total occupancy costs / market characteristics, not just public-private summary charts
I. EXECUTIVE SUMMARY
Stadium Team Location Year Total Cost
First Tennessee Park Nashville Sounds Nashville, TN 2015 $74,500,000 $72,500,000 97.3% $2,000,000 2.7%Southwest University Park El Paso Chihuahuas El Paso, TX 2014 $74,769,249 $64,000,000 85.6% $10,769,247 14.4%BB&T Ballpark Charlotte Knights Charlotte, NC 2014 $56,000,000 $16,000,000 28.6% $40,000,000 71.4%Durham Bulls Athletic Park Durham Bulls Durham, NC 2014 (R) $26,000,000 $12,000,000 46.2% $14,000,000 53.8%PNC Field Scranton/Wilkes-Barre RailRiders Moosic, PA 2013 (R) $45,491,820 $45,178,658 99.3% $313,162 0.7%Cheney Stadium Tacoma Rainiers Tacoma, WA 2011 (R) $30,000,000 $30,000,000 100.0% $0 0.0%Werner Park Omaha Storm Chasers Papillion, NE 2011 $35,000,000 $32,650,000 93.3% $2,350,000 6.7%Coolray Field Gwinnett Braves Lawrenceville, GA 2009 $64,000,000 $64,000,000 100.0% $0 0.0%Greater Nevada Field Reno Aces Reno, NV 2009 $42,000,000 $20,000,000 47.6% $22,000,000 52.4%Huntington Park Columbus Clippers Columbus, OH 2009 $70,237,760 $54,137,760 77.1% $16,100,000 22.9%Coca-Cola Park Lehigh Valley Iron Pigs Allentown, PA 2008 $49,400,000 $49,400,000 100.0% $0 0.0%Isotopes Park Albuquerque Isotopes Albuquerque, NM 2003 (R) $25,000,000 $23,000,000 92.0% $2,000,000 8.0%Fifth Third Field Toledo Mud Hens Toledo, OH 2002 $42,000,000 $25,738,174 61.3% $16,261,826 38.7%Chukchansi Park Fresno Grizzlies Fresno, CA 2002 $52,846,239 $52,846,239 100.0% $0 0.0%Louisville Slugger Field Louisville Bats Louisville, KY 2000 NA NA NA NA NAAutoZone Park Memphis Redbirds Memphis, TN 2000 $80,800,000 $8,800,000 10.9% $72,000,000 89.1%Dell Diamond Round Rock Express Round Rock, TX 2000 $31,055,916 $8,733,378 28.1% $22,322,538 71.9%Raley Field Sacramento River Cats Sacramento, CA 2000 $43,675,000 $7,875,000 18.0% $35,800,000 82.0%Chickasaw Bricktown Ballpark Oklahoma City Redhawks Oklahoma City, OK 1998 $34,200,000 $34,200,000 100.0% $0 0.0%NBT Bank Stadium Syracuse Sky Chiefs Syracuse, NY 1997 $28,000,000 $19,000,000 67.9% $9,000,000 32.1%Zephyr Field New Orleans Zephyrs Metairie, LA 1997 $22,000,000 $18,000,000 81.8% $4,000,000 18.2%Frontier Field Rochester Red Wings Rochester, NY 1996 NA NA NA NA NAVictory Field Indianapolis Indians Indianapolis, IN 1996 $18,000,000 $14,000,000 77.8% $4,000,000 22.2%Smith's Ballpark Salt Lake Bees Salt Lake City, UT 1994 NA NA NA NA NAHarbor Park Norfolk Tides Norfolk, VA 1993 NA NA NA NA NAPrincipal Park Iowa Cubs Des Moines, IA 1992 $12,000,000 $9,676,535 80.6% $2,323,465 19.4%
Total/Weighted Average $956,975,984 $681,735,744 71.2% $275,240,238 28.8%Average $43,498,908 $30,987,988 72.4% $12,510,920 27.6%
Total/Weighted Average Since 2008 $567,398,829 $459,866,418 81.0% $107,532,409 19.0%Average Since 2008 $51,581,712 $41,806,038 79.5% $9,775,674 20.5%Source: Industry Research.
Public Private

Page 39Preliminary Draft – Subject to Revision Confidential
Financing AlternativesPotential Financing Sources
Key Assumptions
I. EXECUTIVE SUMMARY
SCENARIO A
SCENARIO B
SCENARIO C
Revenue Growth Rate 2.00% 2.00% 2.00%
Debt Service CoveragePublic Funding Sources 1.25 1.25 1.25Stadium Funding Sources 1.50 1.50 1.50
Tax Exempt Interest RatePublic Funding Sources 5.00% 4.00% 3.00%
Taxable Interest RateStadium Funding Sources 6.50% 5.50% 4.50%
Costs of Issuance 1.50% 1.50% 1.50%Bond Insurance 0.00% 0.00% 0.00%Debt Service Reserve Fund Yes Yes YesDebt Service Reserve Fund Interest Earnings 2.00% 2.00% 2.00%Surety NA NA NA Construction Period Interest Earnings NA NA NA Capitalized Interest (Years) 0 0 0
Final Maturity (Years) 30 30 30

Page 40Preliminary Draft – Subject to Revision Confidential
Financing AlternativesAnnual Debt Service
Table below summarizes a number of scenarios based on various levels of private investment Figures are presented for illustrative purposes only – deal structure to be negotiated
I. EXECUTIVE SUMMARY
Scenario A Scenario B Scenario C Scenario D
Preliminary Project Cost - Estimated
Preliminary Project Cost - Estimated $80,000,000 $80,000,000 $80,000,000 $80,000,000Less: Private Investment - (1) $0 $10,000,000 $15,000,000 $25,000,000
Adjusted Project Cost $80,000,000 $70,000,000 $65,000,000 $55,000,000
Annual Debt Service Needed to Fund Adjusted Project Cost - (2) $4,900,000 $4,300,000 $4,000,000 $3,400,000Dollar Change from Preceding Scenario NA ($600,000) ($300,000) ($600,000)
Potential Bond Proceeds (Gross) $88,000,000 $77,000,000 $72,000,000 $61,000,000
Potential Bond Proceeds (Net) - (3) $80,000,000 $70,000,000 $65,000,000 $55,000,000
Surplus/(Deficit) $0 $0 $0 $0Note: Figures rounded.(1) Assumed for illustrative purposes only.(2) Estimated. Tax-exempt assumptions modeled.(3) Net of debt service reserve fund, cost of issuance, bond insurance, and capitalized interest fund.
$80,000,000

Page 41Preliminary Draft – Subject to Revision Confidential
Financing AlternativesPreliminary Project Costs – Estimated
Provided by Barton Malow Company – doesnot include land
I. EXECUTIVE SUMMARY
Construction Cost Estimate 9,000 Seats
Civil $4,565,000Structure and Envelope $9,578,950Seating Bowl $12,144,600Field Level $3,498,712Concourse Level $5,696,107Suite Level $4,261,370Stadium Support Systems $9,250,850General Conditions and Requirements $4,556,590Insurance and Bonding $1,594,728Contingency and Escalation $5,514,691CM Fees $2,426,464
Sub-Total $63,088,062
Add: Owner Items $2,135,000Add: Owner Soft Costs $14,642,381
Total $79,865,443Source: Barton Malow Company.

Page 42Preliminary Draft – Subject to Revision Confidential
Financing AlternativesPotential Financing Sources
List represents quantificationof potential sources –feasibility to be determined
Selected revenue sourcesdiscussed herein may requirepublic vote, legislativeapproval, and/or may requiresome form of additionalcredit enhancement, as wellas additional research andconfirmation (certain revenuesources are not eligible butare presented for illustrativepurposes – see discussionherein)
I. EXECUTIVE SUMMARY
Estimates EstimatesAdmissions Surcharge/Facility Fee Parking Tax - City (Sports and Community Venues)
Rate Increase $1.25 Rate Increase $3.00Revenue $630,000 Revenue $360,000Gross Bond Proceeds $7,800,000 Gross Bond Proceeds $4,500,000Net Bond Proceeds $6,900,000 Net Bond Proceeds $4,000,000
Admissions Tax (Sports and Community Venues) Restaurant Tax - CityRate Increase 10.00% Rate Increase 0.25%Revenue $450,000 Revenue $2,630,000Gross Bond Proceeds $5,600,000 Gross Bond Proceeds $47,800,000Net Bond Proceeds $5,000,000 Net Bond Proceeds $43,300,000
Stadium Rent Hotel Occupancy Tax - County (Sports and Community Venues)Revenue $750,000 Rate Increase 0.25%Gross Bond Proceeds $9,300,000 Revenue $2,290,000Net Bond Proceeds $8,300,000 Gross Bond Proceeds $41,600,000
Hotel Occupancy Tax - City Net Bond Proceeds $37,700,000Rate Redirect 0.25% Car Rental Tax - CountyRevenue $2,270,000 Rate Redirect 1.00%Gross Bond Proceeds $41,300,000 Revenue $1,700,000Net Bond Proceeds $37,400,000 Gross Bond Proceeds $30,900,000
Car Rental Tax - City (Sports and Community Venues) Net Bond Proceeds $27,900,000Rate Increase 5.00%Revenue $5,020,000Gross Bond Proceeds $91,200,000Net Bond Proceeds $82,500,000
Notes: Reflects mid-case.
Presented for Illustrative Purposes Only
Team / City / County have not committed any funding source / amount

Page 43Preliminary Draft – Subject to Revision Confidential
Financing AlternativesAdditional Funding Sources
Additional potential funding sources
Tax increment reinvestment zone (TIRZ) (see Financing Alternatives section) Sources from City and/or County (land / infrastructure / etc.) Wolff Stadium land (appraisal required)
Potential land sales / swaps Potential conduit financing (City and/or County) New Market Tax Credits Community Development Block Grants Enterprise Zone(s) Historic Tax Credits (likely not applicable)
I. EXECUTIVE SUMMARY

Page 44Preliminary Draft – Subject to Revision Confidential
Financing AlternativesAdditional Funding Sources
Private sources
Team direct investment
Corporate support Naming rights partner (must consider impact on team / stadium cash flow) Premium seating (must consider impact on team / stadium cash flow) Advertising / sponsorships (must consider impact on team / stadium cash flow)
Third party vendors upfront investment Concessionaire / pouring rights partners (must consider impact on team / stadium cash flow)
Donations / contributions Individuals Corporations Community foundations
Personal seat licenses (limited)
Other
I. EXECUTIVE SUMMARY

Page 45Preliminary Draft – Subject to Revision Confidential
Brailsford & Dunlavey Report – SiteSummary
B&D ranked the Alamo Streetlocation highest
This location was not identifiedby Populous as an option
B&D indicated that other plansexist for the site
Fox Tech South and Irish Flatswere the highest scoring sites thatwere included in the Populousreport
Both are designated as urbancore sites
I. EXECUTIVE SUMMARY

Page 46Preliminary Draft – Subject to Revision Confidential
Brailsford & Dunlavey Report – Site Summary
Of the sites highlighted in the Populous study, four were characterized as “Tier 1 Sites” by B&D
Fox Tech South – development would contribute to San Pedro Creek initiative Irish Flats – could accelerate development on Broadway and take advantage of repurposing Alamodome – lacks control challenges and could link to redevelopment of Hemisfair Park ITC – provides same benefits as Alamodome site
One was characterized as a “Tier 2 Site”
UTSA – adjacent to the core but presents challenges due to railroad tracks and a highway
One was characterized as a “Tier 3 Site”
Fox Tech – awkwardly shaped and would provide design challenges Populous indicated the ballpark would fit on this site
I. EXECUTIVE SUMMARY

Page 47Preliminary Draft – Subject to Revision Confidential
Brailsford & Dunlavey Report – Observations
BSG has reviewed the Brailsford and Dunlavey reports provided regarding minor league baseball
We have made the following notable observations
B&D has assumed a development cost of approximately $74 million Does not include land acquisition and off-site infrastructure / parking
B&D’s public / private stadium funding chart includes capitalization of annual lease payment inteam funding
Drive time was used as the only market designation – BSG utilizes CBSA, CSA, and geographicring data as well Demographics are generally directionally consistent – large population and low income levels
relative to Triple-A markets
Attendance figures were not included for 2014 and 2015 seasons
Building program is generally consistent with BSG preliminary recommendations – B&D slightlyhigher capacity
I. EXECUTIVE SUMMARY

Page 48Preliminary Draft – Subject to Revision Confidential
Brailsford & Dunlavey Report – Observations (Continued)
Although BSG did not complete a site selection study, the City asked that BSG provide some generalobservations regarding potential stadium sites
Proposed stadium could serve as a potential catalyst for downtown redevelopment – core downtown stadiumsoften can have significant impact on surrounding development
Downtown sites benefit from proximity to corporate base, existing parking inventory, and other criticalinfrastructure
Increased activity from baseball fans and other stadium users positively impact local restaurants, bars, etc.
Proposed stadium would result in a long-term commitment from MiLB and increased level of play (Double-A to Triple-A)
Proposed project would result in quality of life benefits
Potential to improve entertainment alternatives in market MiLB provides an affordable form of family entertainment
Fox Tech South, Fox Tech (assuming site can accommodate stadium), and Fox Tech North sites could havesignificant impact on activity in downtown and ongoing redevelopment / revitalization efforts
I. EXECUTIVE SUMMARY

Page 49Preliminary Draft – Subject to Revision Confidential
Brailsford & Dunlavey Report – Observations (Continued)
BSG completed a limited review of B&D revenue and expense assumptions – cash flow statement notcompleted
In general, total operating revenues may be slightly conservative to reasonable Average ticket price ($8.00) – slightly conservative Concessions per cap ($9.50) – reasonable Novelties per cap ($2.00) – reasonable to slightly aggressive Advertising / sponsorship ($2.25 million gross) – reasonable Naming rights ($400,000 gross) – conservative Premium seating inventory Luxury suites – reasonable Loge boxes – aggressive Club seats – reasonable
Premium seating pricing Luxury suites – reasonable to conservative Loge boxes – reasonable to conservative Club seats – reasonable
In general, total operating expenses appear to be reasonable
Year 1 implied cash flow may be slightly conservative ($3.1 million) – does not include annual rent paymentor annual capital expenditure contribution
I. EXECUTIVE SUMMARY

Page 50Preliminary Draft – Subject to Revision Confidential
MLB PotentialGeneral Observations
San Antonio would be one of the smallest markets in MLB in terms of: Population Households High income households Economy size Media market Corporate base
San Antonio’s income levels would be among the lowest in MLB
San Antonio is near the MLB average in terms of key demographic ratios
Population per seat Large companies per suite Below average in terms of high income households per club seat (Alamodome)
San Antonio ranks more favorably in terms of adjusted demographics, but would still be below theMLB average in terms of each measurement of market size
I. EXECUTIVE SUMMARY

Page 51Preliminary Draft – Subject to Revision Confidential
MLB PotentialGeneral Observations
Limited options for MLB team relocation (Oakland A’s / Tampa Rays)
MLB may expand in the future (timing not certain) – Commissioner Manfred has indicated that anyexpansion plans are on hold until stadium issues are resolved for the Oakland A’s and the Tampa Rays
San Antonio is one of the smaller potential relocation / expansion markets San Antonio market is growing rapidly
Given the size of the market, attracting a MLB team would likely require a significant publicinvestment and favorable lease terms
I. EXECUTIVE SUMMARY

II. SAN ANTONIO MISSIONS OVERVIEW

Page 53Preliminary Draft – Subject to Revision Confidential
San Antonio Missions Overview
San Antonio Missions are a member of the Double-A Texas League
Second highest level of affiliated Minor League Baseball (MiLB)
Missions are currently affiliated with the Major League Baseball (MLB) San Diego Padres
Missions began play in San Antonio in 1972
Prior iteration of the Missions relocated to Midland, Texas following the 1971 season
Missions have played at Wolff Stadium since 1994
Dave Elmore is the owner of the Missions – he and his son D.G. Elmore own the following teams
Triple-A Colorado Spring Sky Sox
A-Advanced Bakersfield Blaze (D.G. Elmore) and Lynchburg Hillcats
Single-A Inland Empire 66ers
Short Season-A Eugene Emeralds
Rookie League Idaho Falls Chukars and Helena Brewers (D.G. Elmore)
ECHL Utah Grizzlies
II. SAN ANTONIO MISSIONS OVERVIEW

Page 54Preliminary Draft – Subject to Revision Confidential
Nelson Wolff Stadium
Nelson Wolff Stadium is the home of the San Antonio Missions. The stadium opened in 1994 andhas undergone a number of minor renovations / improvements over the years. The initialconstruction cost was approximately $10.0 million. The stadium includes approximately 6,200 fixedseats (with 3,000 berm seats) and 14 luxury suites. The stadium is located approximately 10 milessouthwest of downtown San Antonio. Wolff Stadium is owned by the City of San Antonio. The SanAntonio Missions ownership group operates the stadium.
II. SAN ANTONIO MISSIONS OVERVIEW
Stadium: Nelson W. Wolff Municipal Stadium
Year Open/Renovated: 1994
Stadium Owner: City of San Antonio
Total Cost: $10 Million
New Construction/Renovation: New Construction
Construction Manager: Lyda, Inc and Bartlett Cocke Jr.
Architect: Ford, Powell & Carson
Management: Elmore Sports Group
Total Seating Capacity: 9,200 (6,200 Seats)
Luxury Suites: 14
Club Seats: 0
Controlled Parking: 2,000

Page 55Preliminary Draft – Subject to Revision Confidential
Texas League Attendance
Missions have the lowest average attendance in the Texas League over the past five seasons
II. SAN ANTONIO MISSIONS OVERVIEW
Team 2011 2012 2013 2014 20155 Year
Average Rank
Frisco RoughRiders 7,276 7,076 7,057 6,614 6,918 6,988 1Tulsa Drillers 5,387 5,323 5,704 6,211 5,858 5,697 2Corpus Christi Hooks 5,645 5,556 5,498 5,625 5,338 5,532 3Springfield Cardinals 5,109 5,111 5,205 5,134 4,964 5,105 4Arkansas Travelers 4,625 4,531 4,519 5,097 5,038 4,762 5Northwest Arkansas Naturals 4,779 4,656 4,685 4,625 4,469 4,643 6Midland RockHounds 4,541 4,562 4,598 4,471 4,248 4,484 7San Antonio Missions 4,203 4,440 4,329 4,269 4,605 4,369 8
Total 41,565 41,255 41,595 42,046 41,438 41,580Average (Ex. San Antonio) 5,337 5,259 5,324 5,397 5,262 5,316Source: Double-A Baseball.

Page 56Preliminary Draft – Subject to Revision Confidential
Wolff Stadium Lease Terms
Initial term of the agreement is November 26, 2006 through September 30, 2016 and, upon mutualagreement, can be extended for three additional periods of five years – Missions have the ability torelocate after September 30, 2016
During the initial term, the team pays a base rent of $50,000 which increases annually by theConsumer Price Index (CPI). The team also paid a facility access fee of $0.75 per paid ticket duringyear 1 which increased to $1.00 during the fifth year of the agreement. Both the rental fee and thefacility access fee are split equally between the Wolff Stadium Building Fund (WSBF) and the HotelOccupancy Tax Renewal and Improvement Fund (HOT R&I Fund).
During the three optional lease extension periods, terms remain the same but the team pays a base rentin the following amounts (CPI-adjusted):
First option term (2016 through 2021) – $75,000 Second option term (2021 through 2026) – $100,000 Third option term (2026 through 2031) – $125,000
II. SAN ANTONIO MISSIONS OVERVIEW

Page 57Preliminary Draft – Subject to Revision Confidential
Wolff Stadium Lease Terms (Continued)
Missions retain the following revenues:
100% of ticket sales excluding the facility access fee and those generated at City events
100% of concessions at Missions events – City retains 30% of gross from City events
100% of team-related novelties – City retains 100% of City related items
100% of parking except at City related events
100% of advertising at Missions games – City retains 100% of temporary advertising at Cityevents
100% of suite rental except for the facility access fee charged on each ticket – City has use of onesuite and 12 admission tickets
II. SAN ANTONIO MISSIONS OVERVIEW

Page 58Preliminary Draft – Subject to Revision Confidential
Wolff Stadium Lease Terms (Continued)
Missions are responsible for all stadium related expenses with the exception of those associated withCity events (defined as those scheduled by the City)
The City has the right to schedule and host City events subject to date availability. The City retainsthese dates at no cost to the City, except the City shall pay for any services that it requests. TheCity will try to provide the team with 60 days written notice of any City event. Once the team andthe City agree to the date and time of a City event by written confirmation, City events shall takepriority over additional Missions events which are scheduled by the team.
Missions are also responsible for all maintenance and improvements at the stadium other thanstructural improvements and capital expenditures, which are paid from the City’s WSBF, which isfunded by 50% of the team’s lease payment and 50% of the facility access fee
The WSBF is not to be used for any preventative maintenance repair items as described in thelease and the City must approve any request for the expenditure of WSBF funds
Team was required to complete installation of video board, left field deck, and $500,000 worth ofother repairs
II. SAN ANTONIO MISSIONS OVERVIEW
Page 59Preliminary Draft – Subject to Revision Confidential
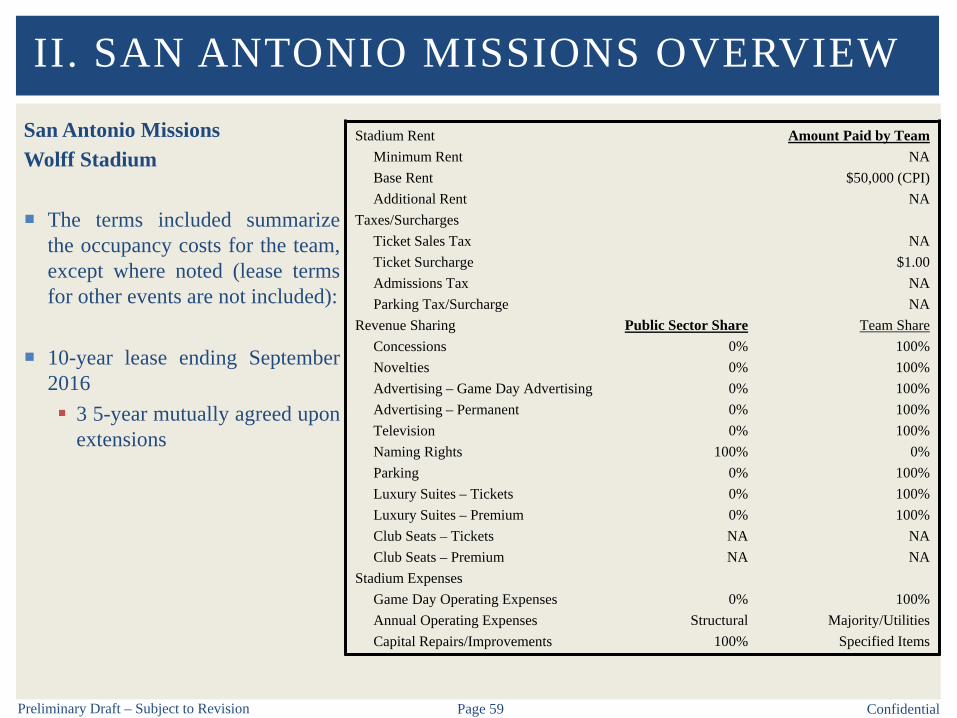
San Antonio MissionsWolff Stadium
The terms included summarizethe occupancy costs for the team,except where noted (lease termsfor other events are not included):
10-year lease ending September2016 3 5-year mutually agreed upon
extensions
II. SAN ANTONIO MISSIONS OVERVIEW
Stadium RentMinimum RentBase RentAdditional Rent
Taxes/SurchargesTicket Sales TaxTicket SurchargeAdmissions TaxParking Tax/Surcharge
Revenue SharingConcessionsNoveltiesAdvertising – Game Day AdvertisingAdvertising – PermanentTelevisionNaming RightsParkingLuxury Suites – TicketsLuxury Suites – PremiumClub Seats – TicketsClub Seats – Premium
Stadium ExpensesGame Day Operating ExpensesAnnual Operating ExpensesCapital Repairs/Improvements
Public Sector Share0%0%0%0%0%
100%0%0%0%NANA
0%Structural
100%
Amount Paid by TeamNA
$50,000 (CPI)NA
NA$1.00
NANA
Team Share100%100%100%100%100%
0%100%100%100%
NANA
100%Majority/Utilities
Specified Items

III. TRIPLE-A BASEBALL OVERVIEW

Page 61Preliminary Draft – Subject to Revision Confidential
Overview
Triple-A baseball is the highest level of affiliated minor league baseball
Comprised of 30 teams
Pacific Coast League (16 teams)
International League (14 teams)
III. TRIPLE-A BASEBALL OVERVIEW
Pacific Coast League
Albuquerque IsotopesColorado Springs Sky Sox
El Paso ChihuahuasFresno Grizzlies
Iowa CubsLas Vegas 51s
Memphis RedbirdsNashville Sounds
New Orleans ZephyrsOklahoma City DodgersOmaha Storm Chasers
Reno AcesRound Rock Express
Sacramento River CatsSalt Lake Bees
Tacoma Rainiers
International League
Buffalo BisonsCharlotte Knights
Columbus ClippersDurham Bulls
Gwinnett BravesIndianapolis Indians
Lehigh Valley IronPigsLouisville BatsNorfolk Tides
Pawtucket Red SoxRochester Red Wings
Scranton/Wilkes-Barre RailRidersSyracuse Chiefs
Toledo Mud Hens

Page 62Preliminary Draft – Subject to Revision Confidential
Triple-A Map
Team locations for Pacific Coast League (left) and International League (right) are displayed below
III. TRIPLE-A BASEBALL OVERVIEW

Page 63Preliminary Draft – Subject to Revision Confidential
Triple-A Stadium Characteristics
Below is a summary of Triple-Astadium characteristics
III. TRIPLE-A BASEBALL OVERVIEW
Team StadiumYear Opened/
RenovatedFixed
CapacityTotal
CapacityLuxury Suites
Club Seats
Nashville Sounds First Tennessee Park 2015 8,500 10,000 22 800El Paso Chihuahuas Southwest University Park 2014 7,200 9,500 24 300Charlotte Knights BB&T Ballpark 2014 8,800 10,200 21 1,027Durham Bulls Durham Bulls Athletic Park 1995/2014 10,000 11,300 10 225Scranton/Wilkes-Barre RailRiders PNC Field 1989/2013 7,300 10,000 18 273Tacoma Rainiers Cheney Stadium 1960/2011 6,500 8,500 16 167Omaha Storm Chasers Werner Park 2011 6,434 9,023 15 675Gwinnett Braves Coolray Field 2009 7,777 10,427 21 0Columbus Clippers Huntington Park 2009 8,800 10,100 32 650Reno Aces Greater Nevada Field 2009 6,500 9,100 22 342Lehigh Valley IronPigs Coca-Cola Park 2008 8,089 10,178 25 1,061Albuquerque Isotopes Isotopes Park 1969/2003 11,124 12,215 30 661Toledo Mud Hens Fifth Third Field 2002 8,943 10,300 32 1,200Fresno Grizzlies Chukchansi Park 2002 12,500 14,500 33 620Memphis Redbirds AutoZone Park 2000 8,404 10,700 29 1,800Louisville Bats Louisville Slugger Field 2000 11,600 13,131 32 850Round Rock Express Dell Diamond 2000 8,631 11,631 30 100Sacramento River Cats Raley Field 2000 11,100 14,680 36 505Pawtucket Red Sox McCoy Stadium 1942/1999 10,031 11,800 13 0Oklahoma City Dodgers Chickasaw Bricktown Ballpark 1998 9,000 9,500 26 550Syracuse Chiefs NBT Bank Stadium 1997 9,891 11,731 20 0New Orleans Zephyrs Zephyr Field 1997 10,000 11,000 16 0Rochester Red Wings Frontier Field 1996 10,840 13,840 23 0Indianapolis Indians Victory Field 1996 12,202 14,202 28 0Salt Lake Bees Smith's Ballpark 1994 13,000 15,334 24 150Norfolk Tides Harbor Park 1993 11,856 12,156 20 0Iowa Cubs Principal Park 1992 11,500 12,000 45 144Buffalo Bisons Coca-Cola Field 1988 17,600 17,750 27 0Colorado Springs Sky Sox Security Service Field 1988 6,200 8,500 18 0Las Vegas 51s Cashman Field 1983 9,334 11,400 0 0
Average 9,655 11,490 24 403Source: Industry Research.

Page 64Preliminary Draft – Subject to Revision Confidential
Triple-A Attendance
Triple-A teams have averaged 457,578 in announced attendance per season over the past five years Number of home games varies amongst teams
Announced figures are typically higher than actual / turnstile attendance
III. TRIPLE-A BASEBALL OVERVIEW
Team 2006 2007 2008 2009 2010 2011 2012 2013 2014 20155 Year
Average Rank
Indianapolis Indians 547,768 586,785 606,166 549,552 569,969 580,082 595,043 637,579 660,289 662,536 627,106 1Lehigh Valley IronPigs/Ottawa Lynx 122,574 126,894 602,033 641,335 645,905 628,925 622,421 613,075 614,888 613,815 618,625 2Columbus Clippers 518,875 507,155 537,889 666,797 635,141 591,884 611,223 635,613 628,980 622,096 617,959 3Sacramento River Cats 728,227 710,235 700,168 657,095 657,910 600,306 586,090 607,329 607,839 672,354 614,784 4Round Rock Express 677,706 662,595 668,623 626,899 596,985 618,261 595,584 589,042 595,700 595,912 598,900 5Louisville Bats 652,692 653,915 631,457 612,525 613,020 601,372 570,003 581,114 567,256 527,588 569,467 6Albuquerque Isotopes 581,308 563,686 593,606 602,129 571,100 578,328 568,417 567,568 564,625 560,519 567,891 7Toledo Mud Hens 569,380 590,159 584,596 559,037 558,059 549,438 550,900 560,080 545,265 531,249 547,386 8Buffalo Bisons 607,929 572,635 590,386 529,789 575,296 521,530 515,898 537,747 535,275 551,303 532,351 9Pawtucket Red Sox 613,065 611,379 636,788 625,561 592,326 578,930 521,023 540,034 515,665 466,600 524,450 10Durham Bulls 507,547 520,952 503,636 488,385 500,073 462,682 483,593 498,735 533,033 554,788 506,566 11Iowa Cubs 546,554 576,310 487,348 536,872 521,669 500,675 509,798 467,481 492,060 504,577 494,918 12Salt Lake Bees 451,938 466,123 500,780 492,321 510,484 437,769 515,633 531,221 470,565 470,760 485,190 13Fresno Grizzlies 499,595 520,093 526,754 480,627 481,606 494,051 471,686 487,536 467,862 458,431 475,913 14Charlotte Knights 303,086 311,119 312,290 320,427 305,842 279,107 282,117 254,834 687,715 669,398 434,634 15Rochester Red Wings 463,836 473,288 490,806 461,946 462,004 448,024 414,398 420,751 422,454 440,360 429,197 16Memphis Redbirds 692,426 633,129 569,172 474,764 462,041 493,528 493,706 498,362 381,429 278,579 429,121 17Oklahoma City Dodgers/RedHawks 526,932 529,690 470,140 397,219 367,082 378,877 399,965 400,025 429,190 471,996 416,011 18Omaha Storm Chasers/Royals 319,777 326,627 349,376 371,046 406,276 410,326 415,650 390,957 393,946 386,141 399,404 19Reno Aces/Tucson Toros/Sidewinders 271,698 270,853 245,121 466,606 447,701 432,314 389,860 349,364 379,439 376,422 385,480 20Norfolk Tides 463,769 464,034 433,767 387,153 392,752 397,889 389,188 382,195 358,147 386,402 382,764 21Nashville Sounds 410,569 411,959 354,662 305,434 319,235 335,143 321,042 355,003 323,961 565,548 380,139 22Scranton/Wilkes-Barre RailRiders/Yankees 376,284 580,908 485,999 358,888 338,731 298,098 272,168 435,839 401,618 402,731 362,091 23El Paso Chihuahuas/Tucson Padres/Portland B 401,092 388,963 392,512 369,580 294,332 242,136 200,991 200,077 560,997 578,952 356,631 24New Orleans Zephyrs 361,493 368,210 355,395 362,771 380,538 372,017 329,942 344,998 348,796 324,973 344,145 25Tacoma Rainiers 313,031 345,538 327,871 352,450 351,095 378,518 352,032 320,080 305,446 352,521 341,719 26Colorado Springs Sky Sox 265,500 274,408 303,048 300,185 328,003 339,009 334,245 326,374 350,374 300,209 330,042 27Las Vegas 51's 365,659 371,676 374,780 337,388 336,488 314,032 311,516 328,266 329,429 333,520 323,353 28Syracuse Chiefs 347,699 380,152 392,028 392,518 416,382 374,680 349,027 345,047 247,046 262,408 315,642 29Gwinnett Braves/Richmond Braves 321,696 342,090 289,570 423,556 337,240 351,565 327,584 323,799 303,959 270,336 315,449 30
Total 13,829,705 14,141,560 14,316,767 14,150,855 13,975,285 13,589,496 13,300,743 13,530,125 14,023,248 14,193,024 13,727,327Average 460,990 471,385 477,226 471,695 465,843 452,983 443,358 451,004 467,442 473,101 457,578Source: Triple-A Baseball.
Page 65Preliminary Draft – Subject to Revision Confidential
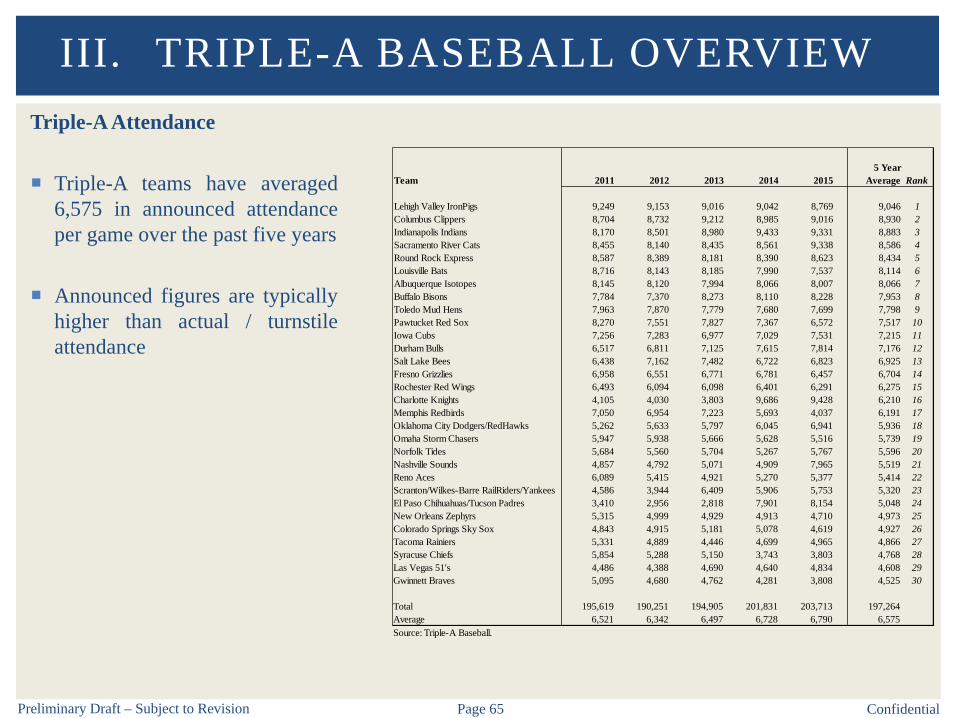
Triple-A Attendance
Triple-A teams have averaged6,575 in announced attendanceper game over the past five years
Announced figures are typicallyhigher than actual / turnstileattendance
III. TRIPLE-A BASEBALL OVERVIEW
Team 2011 2012 2013 2014 20155 Year
Average Rank
Lehigh Valley IronPigs 9,249 9,153 9,016 9,042 8,769 9,046 1Columbus Clippers 8,704 8,732 9,212 8,985 9,016 8,930 2Indianapolis Indians 8,170 8,501 8,980 9,433 9,331 8,883 3Sacramento River Cats 8,455 8,140 8,435 8,561 9,338 8,586 4Round Rock Express 8,587 8,389 8,181 8,390 8,623 8,434 5Louisville Bats 8,716 8,143 8,185 7,990 7,537 8,114 6Albuquerque Isotopes 8,145 8,120 7,994 8,066 8,007 8,066 7Buffalo Bisons 7,784 7,370 8,273 8,110 8,228 7,953 8Toledo Mud Hens 7,963 7,870 7,779 7,680 7,699 7,798 9Pawtucket Red Sox 8,270 7,551 7,827 7,367 6,572 7,517 10Iowa Cubs 7,256 7,283 6,977 7,029 7,531 7,215 11Durham Bulls 6,517 6,811 7,125 7,615 7,814 7,176 12Salt Lake Bees 6,438 7,162 7,482 6,722 6,823 6,925 13Fresno Grizzlies 6,958 6,551 6,771 6,781 6,457 6,704 14Rochester Red Wings 6,493 6,094 6,098 6,401 6,291 6,275 15Charlotte Knights 4,105 4,030 3,803 9,686 9,428 6,210 16Memphis Redbirds 7,050 6,954 7,223 5,693 4,037 6,191 17Oklahoma City Dodgers/RedHawks 5,262 5,633 5,797 6,045 6,941 5,936 18Omaha Storm Chasers 5,947 5,938 5,666 5,628 5,516 5,739 19Norfolk Tides 5,684 5,560 5,704 5,267 5,767 5,596 20Nashville Sounds 4,857 4,792 5,071 4,909 7,965 5,519 21Reno Aces 6,089 5,415 4,921 5,270 5,377 5,414 22Scranton/Wilkes-Barre RailRiders/Yankees 4,586 3,944 6,409 5,906 5,753 5,320 23El Paso Chihuahuas/Tucson Padres 3,410 2,956 2,818 7,901 8,154 5,048 24New Orleans Zephyrs 5,315 4,999 4,929 4,913 4,710 4,973 25Colorado Springs Sky Sox 4,843 4,915 5,181 5,078 4,619 4,927 26Tacoma Rainiers 5,331 4,889 4,446 4,699 4,965 4,866 27Syracuse Chiefs 5,854 5,288 5,150 3,743 3,803 4,768 28Las Vegas 51's 4,486 4,388 4,690 4,640 4,834 4,608 29Gwinnett Braves 5,095 4,680 4,762 4,281 3,808 4,525 30
Total 195,619 190,251 194,905 201,831 203,713 197,264Average 6,521 6,342 6,497 6,728 6,790 6,575Source: Triple-A Baseball.
Page 66Preliminary Draft – Subject to Revision Confidential
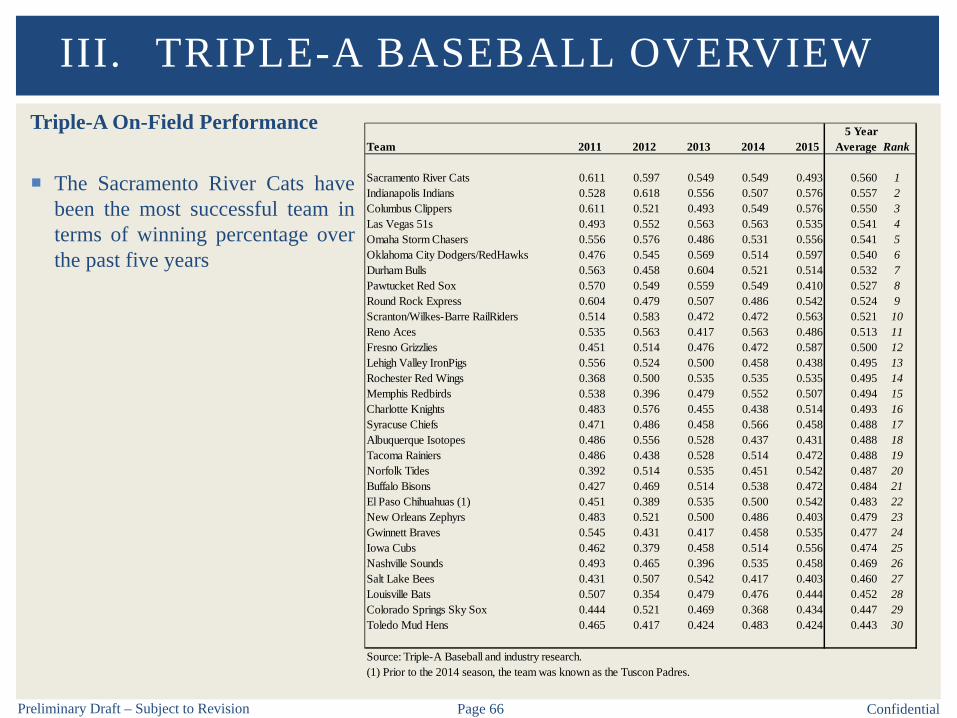
Triple-A On-Field Performance
The Sacramento River Cats havebeen the most successful team interms of winning percentage overthe past five years
III. TRIPLE-A BASEBALL OVERVIEW5 Year
Team 2011 2012 2013 2014 2015 Average
Sacramento River Cats 0.611 0.597 0.549 0.549 0.493 0.560 1Indianapolis Indians 0.528 0.618 0.556 0.507 0.576 0.557 2Columbus Clippers 0.611 0.521 0.493 0.549 0.576 0.550 3Las Vegas 51s 0.493 0.552 0.563 0.563 0.535 0.541 4Omaha Storm Chasers 0.556 0.576 0.486 0.531 0.556 0.541 5Oklahoma City Dodgers/RedHawks 0.476 0.545 0.569 0.514 0.597 0.540 6Durham Bulls 0.563 0.458 0.604 0.521 0.514 0.532 7Pawtucket Red Sox 0.570 0.549 0.559 0.549 0.410 0.527 8Round Rock Express 0.604 0.479 0.507 0.486 0.542 0.524 9Scranton/Wilkes-Barre RailRiders 0.514 0.583 0.472 0.472 0.563 0.521 10Reno Aces 0.535 0.563 0.417 0.563 0.486 0.513 11Fresno Grizzlies 0.451 0.514 0.476 0.472 0.587 0.500 12Lehigh Valley IronPigs 0.556 0.524 0.500 0.458 0.438 0.495 13Rochester Red Wings 0.368 0.500 0.535 0.535 0.535 0.495 14Memphis Redbirds 0.538 0.396 0.479 0.552 0.507 0.494 15Charlotte Knights 0.483 0.576 0.455 0.438 0.514 0.493 16Syracuse Chiefs 0.471 0.486 0.458 0.566 0.458 0.488 17Albuquerque Isotopes 0.486 0.556 0.528 0.437 0.431 0.488 18Tacoma Rainiers 0.486 0.438 0.528 0.514 0.472 0.488 19Norfolk Tides 0.392 0.514 0.535 0.451 0.542 0.487 20Buffalo Bisons 0.427 0.469 0.514 0.538 0.472 0.484 21El Paso Chihuahuas (1) 0.451 0.389 0.535 0.500 0.542 0.483 22New Orleans Zephyrs 0.483 0.521 0.500 0.486 0.403 0.479 23Gwinnett Braves 0.545 0.431 0.417 0.458 0.535 0.477 24Iowa Cubs 0.462 0.379 0.458 0.514 0.556 0.474 25Nashville Sounds 0.493 0.465 0.396 0.535 0.458 0.469 26Salt Lake Bees 0.431 0.507 0.542 0.417 0.403 0.460 27Louisville Bats 0.507 0.354 0.479 0.476 0.444 0.452 28Colorado Springs Sky Sox 0.444 0.521 0.469 0.368 0.434 0.447 29Toledo Mud Hens 0.465 0.417 0.424 0.483 0.424 0.443 30
Source: Triple-A Baseball and industry research.(1) Prior to the 2014 season, the team was known as the Tuscon Padres.
Rank

Page 67Preliminary Draft – Subject to Revision Confidential
Triple-A Economics – Team
Local economics play major role in success of teams – impacted by market characteristics andstadium condition / amenities
III. TRIPLE-A BASEBALL OVERVIEW
TEAM REVENUES
• Gate Receipts• Concessions• Novelties• Parking• Naming Rights/Advertising/Sponsors• Luxury Suite Revenue• Loge Box Revenue• Club Seat Revenue• Other Revenue Sources Broadcasting Revenue
o Local Television (if any)o Local Radio
Publications Promotions/Community Outreach/Hospitality Miscellaneous
-
TEAM EXPENSES
• Rent• Game Day Expenses• Stadium Operating Expenses• Stadium Capital Repairs/Replacement• Salaries and Wages
(Does Not Include Players/Coaches)• General and Administrative Team Travel and Related Team Administration Marketing/Advertising/Promotion Public Relations MLB Expenses Broadcasting Expenses (if any) Other
TEAM NET OPERATING
INCOME / (LOSS)
Before Annual Debt Service
=

Page 68Preliminary Draft – Subject to Revision Confidential
Triple-A Economics – Stadium
Stadium deal structure with team will impact consolidated net income
III. TRIPLE-A BASEBALL OVERVIEW
• Team/Other Event Revenue Rent Concessions Novelties Parking Naming Rights Advertising/Sponsors Premium Seating
o Luxury Suite Revenueo Loge Box Revenueo Club Seat Revenue
Othero Convenience Charge Rebateso Facility Fees
• Game Day/Event Expenses• Stadium Operating Expenses Salaries/Wages Utilities Insurance Marketing Legal/Professional Management Fees (If Any) Repairs and Maintenance General and Administrative Property/Possessory Interest Tax Other
• Stadium Capital Repairs/Replacement
-STADIUM NET OPERATING
INCOME / (LOSS)
Before Annual Debt Service
=
STADIUM REVENUES STADIUM EXPENSES

Page 69Preliminary Draft – Subject to Revision Confidential
Triple-A Relocation History
Relocation history (since 1981) is summarized below
III. TRIPLE-A BASEBALL OVERVIEW
Season Original Franchise Relocation City, State2013 Tucson Padres El Paso, TX2010 Portland Beavers Tucson, AZ (Temporary)2009 Tucson Sidewinders Reno, NV2009 Richmond Braves Lawrenceville, GA2008 Ottawa Lynx Allentown, PA2005 Edmonton Trappers Round Rock, TX2003 Calgary Cannons Albuquerque, NM2001 Albuquerque Dukes Portland, OR2000 Vancouver Canadiens Sacramento, CA1998 Phoenix Firebirds Tucson, AZ - (1)1998 Tucson Toros Fresno, CA - (1)1994 Portland Beavers Salt Lake City, UT1993 Denver Zephyrs New Orleans, LA1989 Maine Phillies Moosic, PA (Scranton/Wikes-Barre)1988 Hawaii Islanders Colorado Springs, CO1985 Wichita Aeros Buffalo, NY1983 Spokane Indians Las Vegas, NV1982 Springfield Redbirds Louisville, KY1981 Ogden A's Edmonton, Canada(1) The Phoenix Firebirds moved into Tucson and became the Tucson Sidewinders, while the Tucson Toros moved to Fresno, CA. Source: Industry Research.

Page 70Preliminary Draft – Subject to Revision Confidential
Triple-A Major League Baseball Affiliations
Major League Baseball teams typically sign two orfour year Player Development Contracts (PDC) withminor league teams
III. TRIPLE-A BASEBALL OVERVIEWTriple-A Minor League Team MLB Affiliate
Pacific Coast LeagueAlbuquerque Isotopes Colorado RockiesColorado Springs Sky Sox Milwaukee BrewersEl Paso Chihuahuas San Diego PadresFresno Grizzlies Houston AstrosIowa Cubs Chicago CubsLas Vegas 51s New York MetsMemphis Redbirds St. Louis CardinalsNashville Sounds Oakland AthleticsNew Orleans Zephyrs Miami MarlinsOklahoma City Dodgers Los Angeles DodgersOmaha Storm Chasers Kansas City RoyalsReno Aces Arizona DiamondbacksRound Rock Express Texas RangersSacramento River Cats San Francisco GiantsSalt Lake Bees Los Angeles Angels of AnaheimTacoma Rainiers Seattle Mariners
International LeagueBuffalo Bisons Toronto Blue JaysCharlotte Knights Chicago White SoxColumbus Clippers Cleveland IndiansDurham Bulls Tampa Bay RaysGwinnett Braves Atlanta BravesIndianapolis Indians Pittsburgh PiratesLehigh Valley IronPigs Philadeplhia PhilliesLouisville Bats Cincinnati RedsNorfolk Tides Baltimore OriolesPawtucket Red Sox Boston Red SoxRochester Red Wings Minnesota TwinsScranton/Wilkes-Barre RailRiders New York YankeesSyracuse Chiefs Washington NationalsToledo Mud Hens Detroit Tigers

Page 71Preliminary Draft – Subject to Revision Confidential
Triple-A Average Ticket Prices
Average low single game ticket price for Triple-A baseball was $9.33 (PCL) / $8.32 (IL) with anaverage high of $19.57 (PCL) / $16.43 (IL)
Missions single game ticket ranged from $8.00 to $11.00 (according to Revenues from SportsVenues)
III. TRIPLE-A BASEBALL OVERVIEW
Team Low Price High Price Team Low Price High PriceAlbuquerque Isotopes $11.00 $23.00 Buffalo Bisons $10.00 $13.00Colorado Springs Sky Sox $10.00 $13.00 Charlotte Knights $7.00 $14.00El Paso Chihuahuas NA NA Columbus Clippers $6.00 $12.00Fresno Grizzlies $9.00 $19.00 Durham Bulls $6.00 $10.00Iowa Cubs $8.00 $27.00 Gwinnett Braves $9.00 $40.00Las Vegas 51s $10.00 $14.00 Indianapolis Indians $10.00 $35.00Memphis Redbirds $9.00 $23.00 Lehigh Valley IronPigs $10.00 $20.00Nashville Sounds $15.00 $15.00 Louisville Bats $7.00 $11.00New Orleans Zephyrs $10.00 $12.00 Norfolk Tides $13.00 $14.00Oklahoma City Dodgers $7.00 $13.00 Pawtucket Red Sox $8.00 $12.00Omaha Storm Chasers $6.00 $16.50 Rochester Red Wings $8.00 $12.00Reno Aces $9.00 $32.00 Scranton/Wilkes-Barre RailRiders $6.50 $9.00Round Rock Express $8.00 $18.00 Syracuse Chiefs $8.00 $20.00Sacramento River Cats $11.00 $17.00 Toledo Mud Hens $8.00 $8.00Salt Lake Bees $10.00 $26.00Tacoma Rainiers $7.00 $25.00
Average $9.33 $19.57 Average $8.32 $16.43Source: 2016 Revenues from Sports Venues and industry research.
Pacific Coast League Single Game Ticket Price International League Single Game Ticket Price

Page 72Preliminary Draft – Subject to Revision Confidential
Triple-A Average Ticket Prices
Average low season ticket price for Triple-A baseball was $550 (PCL) / $527 (IL) with an averagehigh of $940 (PCL) / $787 (IL)
Missions season ticket ranged from $480 to $550 (according to Revenues from Sports Venues)
III. TRIPLE-A BASEBALL OVERVIEW
Team Low Price High Price Team Low Price High PriceAlbuquerque Isotopes $580 $725 Buffalo Bisons $490 $530Colorado Springs Sky Sox $475 $475 Charlotte Knights $475 $545El Paso Chihuahuas $504 $1,404 Columbus Clippers $675 $1,250Fresno Grizzlies $468 $900 Durham Bulls $522 $630Iowa Cubs $425 $500 Gwinnett Braves $650 $2,500Las Vegas 51s $432 $936 Indianapolis Indians $525 $625Memphis Redbirds $700 $850 Lehigh Valley IronPigs $720 $1,080Nashville Sounds $648 $1,440 Louisville Bats $415 $415New Orleans Zephyrs $425 $525 Norfolk Tides $550 $550Oklahoma City Dodgers $569 $720 Pawtucket Red Sox $625 $625Omaha Storm Chasers $569 $720 Rochester Red Wings $295 $390Reno Aces $446 $1,852 Scranton/Wilkes-Barre RailRiders $504 $720Round Rock Express $395 $605 Syracuse Chiefs $350 $575Sacramento River Cats $792 $1,224 Toledo Mud Hens $576 $576Salt Lake Bees $576 $1,368Tacoma Rainiers $792 $792
Average $550 $940 Average $527 $787Source: 2016 Revenues from Sports Venues and industry research.
International League Season Ticket PricePacific Coast League Season Ticket Price

IV. MARKET OVERVIEW

A. DEMOGRAPHIC OVERVIEW

Page 75Preliminary Draft – Subject to Revision Confidential
San Antonio, TX
San Antonio, Texas
Approximately 80 miles southwestof Austin, TX
Approximately 275 miles southwestof Dallas, TX
Approximately 200 miles west ofHouston, TX
A. DEMOGRAPHIC OVERVIEW

Page 76Preliminary Draft – Subject to Revision Confidential
General Market Overview
Bexar County Border
A. DEMOGRAPHIC OVERVIEW

Page 77Preliminary Draft – Subject to Revision Confidential
General Market Overview
According to Nielsen, a Core Based Statistical Area (CBSA) is an area consisting of a conglomerationof counties. A CBSA is further defined as a Metropolitan or Micropolitan CBSA. A MetropolitanCBSA consists of a geographic area with an urban core population of at least 50,000. A MicropolitanCBSA consists of a geographic area with an urban core population of between 10,000 and 49,999.
San Antonio-New Braunfels CBSA includes
Bexar County Atascosa County Medina County Bandera County Kendall County Comal County Guadalupe County Wilson County
A. DEMOGRAPHIC OVERVIEW

Page 78Preliminary Draft – Subject to Revision Confidential
Potential Stadium Sites
1. ITC Site
2. Fox Tech South Site
3. Fox Tech Site
4. UTSA Site
5. Alamodome Site
6. Irish Flats Site
7. Fox Tech North Site
A. DEMOGRAPHIC OVERVIEW

Page 79Preliminary Draft – Subject to Revision Confidential
Potential Stadium Sites
A. DEMOGRAPHIC OVERVIEW

Page 80Preliminary Draft – Subject to Revision Confidential
General Market Overview
Market demographics also evaluated based on geographic ring designation (20 mile / 30 mile)
A. DEMOGRAPHIC OVERVIEW

Page 81Preliminary Draft – Subject to Revision Confidential
General Market Overview
Market demographics also evaluated based on drive time designation (30 minutes)
A. DEMOGRAPHIC OVERVIEW

Page 82Preliminary Draft – Subject to Revision Confidential
General Market Overview – Population
A. DEMOGRAPHIC OVERVIEW
City of Bexar Drive TimeSan Antonio County CBSA 20 Miles 30 Miles 30 Minutes
Population2021 Projection 1,540,300 2,055,185 2,588,668 2,111,558 2,361,103 2,166,6992016 Estimate 1,440,900 1,904,785 2,394,156 1,955,721 2,183,193 2,006,3772010 Census 1,327,407 1,714,773 2,142,508 1,758,459 1,953,981 1,802,2072000 Census 1,150,963 1,392,926 1,711,624 1,415,021 1,553,304 1,448,904
Growth 2016-2021 6.9% 7.9% 8.1% 8.0% 8.1% 8.0%Growth 2010-2016 8.5% 11.1% 11.7% 11.2% 11.7% 11.3%Growth 2000-2010 15.3% 23.1% 25.2% 24.3% 25.8% 24.4%Source: Nielsen 2016.
Geographic Rings

Page 83Preliminary Draft – Subject to Revision Confidential
General Market Overview – Population Clusters (Total Population by ZIP Code )
A. DEMOGRAPHIC OVERVIEW

Page 84Preliminary Draft – Subject to Revision Confidential
General Market Overview – Households
A. DEMOGRAPHIC OVERVIEW
City of Bexar Drive TimeSan Antonio County CBSA 20 Miles 30 Miles 30 Minutes
Households2021 Projection 565,240 738,106 933,019 756,994 846,803 778,4932016 Estimate 525,643 681,007 858,844 698,138 779,722 717,7142010 Census 479,597 608,931 763,022 624,068 693,755 640,7302000 Census 407,563 488,942 601,239 496,532 544,643 508,974
Growth 2016-2021 7.5% 8.4% 8.6% 8.4% 8.6% 8.5%Growth 2010-2016 9.6% 11.8% 12.6% 11.9% 12.4% 12.0%Growth 2000-2010 17.7% 24.5% 26.9% 25.7% 27.4% 25.9%Source: Nielsen 2016.
Geographic Rings

Page 85Preliminary Draft – Subject to Revision Confidential
General Market Overview – Household Clusters (Total Households by ZIP Code)
A. DEMOGRAPHIC OVERVIEW

Page 86Preliminary Draft – Subject to Revision Confidential
General Market Overview – Income
A. DEMOGRAPHIC OVERVIEW
City of Bexar Drive TimeSan Antonio County CBSA 20 Miles 30 Miles 30 Minutes
Income2016 Est. Average HH Income $64,263 $70,137 $72,810 $70,319 $72,547 $70,463
2016 Est. Median HH Income $46,877 $51,750 $54,437 $52,293 $54,080 $52,292
HHs w/ Income $100,000+ 93,908 141,872 194,098 146,995 174,884 151,998Source: Nielsen 2016.
Geographic Rings

Page 87Preliminary Draft – Subject to Revision Confidential
General Market Overview – Income Clusters (Average Household Income by ZIP Code)
A. DEMOGRAPHIC OVERVIEW

Page 88Preliminary Draft – Subject to Revision Confidential
General Market OverviewLargest Employers
Of the top seven largest employers in the SanAntonio Region, three are militaryorganizations
A. DEMOGRAPHIC OVERVIEW
Employer SectorNumber of Local
EmployeesLackland Air Force Base Military 37,097Fort Sam Houston-U.S. Army Military 32,000H-E-B Super Market Chain 20,000USAA Financial Services and Insurance 17,000Northside ISD School District 12,751City of San Antonio - (1) San Antonio 12,000Randolph Air Force Base Military 11,068North East I.S.D. School District 10,052Methodist Healthcare System Health Care Services 8,118San Antonio I.S.D. School District 7,000Baptist Health System Health Care Services 6,498JP Morgan Chase Financial Services 5,200Wells Fargo Financial Services 5,153ATT Phone, Wireless and Internet services 4,200Bill Miller BBQ Restaurant Chain 3,540Christus Santa Rosa Health Care Health Care Services 3,360CPS Energy Utilities 3,022Rackspace IT Managed Hosting Solutions 3,300Toyota Motor Manufacturing Manufacturing 2,900Clear Channel Communications TV and Radio Stations, Outdoor Ads 2,800Boeing Aerospace and Manufacturing 2,800Southwest Research Institute Applied Research 2,700Frost Bank Financial 2,100Accenture Professional Services / Technology Se 1,800Valero Energy Oil Refiner and Gasoline Mktg 1,653Harland Clarke Check Printing 1,500KCI Medical Supplies 1,400HVHC Optical Manufacturing 1,200WellMed Medical Management Inc. Medical Management 1,200Security Service Federal Credit Union Financial Institution 1,200SWBC Insurance 1,200Wal Mart Distribution Center (New Braunfels) Distribution 1,000Randolph-Brooks Federal Credit Union Financial Institution 928Caterpillar Manufacturing 900Gunn Automotive Group Automobile Dealer 803(1) City of San Antonio estimated figure.Source: 2015 San Antonio Business Journal and City of San Antonio.

Page 89Preliminary Draft – Subject to Revision Confidential
General Market Overview – Education
San Antonio is the home to many institutions of higher learning – below are several of the notableuniversities
Our Lady of the Lake University Undergraduate Enrollment: 1,595
St. Mary’s University of San Antonio Undergraduate Enrollment: 2,322
Texas A&M University-San Antonio Undergraduate Enrollment: 4,521
Trinity University Undergraduate Enrollment: 2,297
University of Texas at San Antonio Undergraduate Enrollment: 24,285
University of the Incarnate Word Undergraduate Enrollment: 6,496
A. DEMOGRAPHIC OVERVIEW

Page 90Preliminary Draft – Subject to Revision Confidential
General Market Overview – Tourism
San Antonio Convention & Visitors Bureau
San Antonio has approximately 32.5 million visitors per year
Annual influx of $13.4 billion
Travel supports over 122,500 jobs in San Antonio
Travel contributes over $183 million in taxes and fees to the City of San Antonio
A. DEMOGRAPHIC OVERVIEW

B. DEMOGRAPHIC COMPARISON

Page 92Preliminary Draft – Subject to Revision Confidential
Market Overview
Market area size and characteristics will have an impact on market support and the potential demandfor Triple-A baseball
Limited market analysis – evaluated base market characteristics
Triple-A market area comparison with San Antonio
Core based statistical arena designation (CBSA)
Geographic ring designation 20 mile ring designation 30 mile ring designation
Drive time designation 30 minute drive time designation
Demographic comparison focuses on several key factors that impact market demand for teams /stadiums
B. DEMOGRAPHIC COMPARISON

Page 93Preliminary Draft – Subject to Revision Confidential
Demographic SummaryCBSA Designation Overview
San Antonio
Population / Households – above average
Estimated Growth – above average
Income – slightly below average
High Income Households – above average
Unemployment Rate – below average
GDP – above average
TV / Radio Population – above average
Corporate Base – above average
Cost of Living – below average
B. DEMOGRAPHIC COMPARISON
Statistical Measure San AntonioRank of 31
Triple-A Average - (1)
2016 Population (000s) 2,394.2 4 1,495.0 2021 Population (000s) 2,588.7 4 1,569.0 Est. % Growth 2016-2021 8.12% 2 4.26%
2016 Households (000s) 858.8 4 570.3 2021 Households (000s) 933.0 4 599.6 Est. % Growth 2016-2021 8.64% 2 4.53%
Average Household Income $72,810 17 $74,479Median Household Income $54,437 19 $55,510High Income Households (000s) 194.1 7 139.5
Average Age 36.7 5 38.1Median Age 34.9 5 37.1
Unemployment Rate 3.40% 5 4.66%
Economy Size (GDP - Billions) $104.8 9 $83.5
TV Population 2,429.4 10 2,139.4 Radio Population 1,990.6 4 1,346.6
Companies w/ $20+mm Sales 684 8 586Companies w/ $50+mm Sales 333 8 285Companies w/ 500+ Employees 172 6 126
Cost of Living Index 86.5 4 96.1
Triple-A Summary - CBSA Designation Overview
(1) - Average excludes San Antonio.Source: Nielsen 2016, ThinkTV 2016, BLS 2016, Hoovers 2016, The Council for Community and Economic Research 2016, and U.S. BEA.

Page 94Preliminary Draft – Subject to Revision Confidential
Demographic SummaryCBSA Designation Overview
San Antonio
Total seat inventory – slightly above average
Luxury suite inventory – slightly belowaverage
Club seat inventory – above average
Population per seat – above average
Corporate base per suite ratios – near average
High income households per club seat –below average (due to Alamodome inventory)
Note: Includes only sports and entertainmentfacilities with 5,000 seats or more and includes apotential new Triple-A stadium replacing thecurrent ballpark
B. DEMOGRAPHIC COMPARISON
Statistical Measure San AntonioRank of 31
Triple-A Average - (1)
Total Seats 126,323 13 119,145Population per Seat 19.0 6 13.1
Total Suites 144 12 152Companies w/ $20mm Sales per Suite 4.8 8 4.8Companies w/ $50mm Sales per Suite 2.3 10 2.3Companies w/ 500+ Employees per Suite 1.2 10 1.1
Total Club Seats 9,706 7 5,186High Income Households per Club Seat 20.0 21 56.2
Triple-A Summary - CBSA Designation Overview
(1) - Average excludes San Antonio.Source: Nielsen 2016, Hoovers 2016, Industry Research.

Page 95Preliminary Draft – Subject to Revision Confidential
CBSA DesignationPopulation and Households
San Antonio would rank 4th among Triple-A teams in terms of population and households
B. DEMOGRAPHIC COMPARISON
Team
2016 Population
(000s) Rank
2021 Population
(000s) Rank
Est. % Growth
2016-2021 Rank
2016 Households
(000s) Rank
2021 Households
(000s) Rank
Est. % Growth
2016-2021 RankGwinnett Braves 5,736.3 1 6,102.3 1 6.38% 9 2,117.1 1 2,257.4 1 6.62% 8Tacoma Rainiers 3,737.4 2 3,987.5 2 6.69% 6 1,478.6 2 1,580.9 2 6.92% 7Charlotte Knights 2,436.2 3 2,607.1 3 7.01% 3 932.1 3 997.9 3 7.07% 5San Antonio Triple-A Team 2,394.2 4 2,588.7 4 8.12% 2 858.8 4 933.0 4 8.64% 2Sacramento River Cats 2,277.6 5 2,391.1 5 4.98% 15 831.9 5 874.0 5 5.05% 16Las Vegas 51s 2,119.8 6 2,257.2 6 6.48% 8 772.1 8 821.7 8 6.43% 11Columbus Clippers 2,030.1 7 2,116.9 8 4.27% 19 799.5 6 835.0 7 4.45% 19Round Rock Express 2,006.3 8 2,205.3 7 9.92% 1 763.3 9 841.4 6 10.23% 1Indianapolis Indians 2,001.1 9 2,084.3 9 4.16% 20 774.2 7 806.2 9 4.14% 20Nashville Sounds 1,840.3 10 1,966.8 10 6.87% 4 713.2 10 763.0 10 6.97% 6Norfolk Tides 1,734.8 11 1,796.0 11 3.53% 21 657.7 11 684.2 11 4.02% 21Pawtucket Red Sox 1,613.7 12 1,631.7 12 1.11% 26 635.4 12 644.5 12 1.43% 27Oklahoma City Dodgers 1,365.1 13 1,448.4 13 6.10% 11 533.3 13 566.3 13 6.18% 13Memphis Redbirds 1,347.3 14 1,374.1 14 2.00% 23 503.5 15 514.0 16 2.08% 24Louisville Bats 1,282.0 15 1,320.4 16 3.00% 22 516.3 14 532.4 14 3.12% 22New Orleans Zephyrs 1,270.2 16 1,326.2 15 4.41% 18 501.8 16 528.1 15 5.25% 15Salt Lake Bees 1,174.8 17 1,245.9 17 6.05% 12 390.9 19 416.1 19 6.44% 10Buffalo Bisons 1,136.9 18 1,146.5 18 0.85% 28 481.8 17 489.9 17 1.69% 25Rochester Red Wings 1,083.7 19 1,093.5 19 0.90% 27 438.0 18 445.4 18 1.68% 26Fresno Grizzlies 983.1 20 1,030.6 20 4.83% 16 303.7 23 317.9 23 4.66% 18Omaha Storm Chasers 918.2 21 960.6 21 4.63% 17 355.7 21 372.9 20 4.83% 17Albuquerque Isotopes 908.3 22 924.0 22 1.73% 24 358.1 20 365.6 21 2.11% 23El Paso Chihuahuas 855.3 23 904.2 23 5.72% 13 278.5 24 295.9 24 6.27% 12Lehigh Valley IronPigs 832.8 24 843.1 24 1.24% 25 319.1 22 322.9 22 1.17% 28Colorado Springs Sky Sox 703.0 25 750.4 25 6.73% 5 270.7 25 290.8 25 7.44% 3Syracuse Chiefs 660.8 26 664.3 27 0.53% 29 264.1 26 267.1 26 1.13% 29Iowa Cubs 627.6 27 667.6 26 6.37% 10 245.7 28 261.6 27 6.46% 9Toledo Mud Hens 606.4 28 606.1 28 -0.06% 30 246.1 27 246.9 28 0.34% 30Scranton/Wilkes-Barre RailRiders 557.2 29 553.9 30 -0.59% 31 227.9 29 226.6 30 -0.57% 31Durham Bulls 553.2 30 590.2 29 6.69% 7 222.7 30 238.6 29 7.12% 4Reno Aces 450.9 31 474.2 31 5.18% 14 174.8 31 184.0 31 5.30% 14
Average (Ex. San Antonio) 1,495.0 1,569.0 4.26% 570.3 599.6 4.53%Source: Nielsen 2016.

Page 96Preliminary Draft – Subject to Revision Confidential
CBSA DesignationIncome
San Antonio is slightly below the Triple-Aaverage in terms of average and medianhousehold income, but above average interms of high income households
B. DEMOGRAPHIC COMPARISON
Team
Average Household
Income Rank
Median Household
Income Rank
HHs w/ Income
$100,000+ (000s) Rank
Tacoma Rainiers $95,290 1 $71,126 1 503.8 2Round Rock Express $89,379 2 $65,322 3 231.0 3Salt Lake Bees $85,910 3 $66,741 2 112.3 14Durham Bulls $82,973 4 $56,944 13 58.0 26Iowa Cubs $82,707 5 $64,280 4 68.0 23Sacramento River Cats $80,899 6 $60,270 6 228.2 4Gwinnett Braves $80,325 7 $58,310 11 540.8 1Colorado Springs Sky Sox $78,686 8 $61,226 5 70.1 22Lehigh Valley IronPigs $78,202 9 $60,194 7 81.4 21Pawtucket Red Sox $77,968 10 $58,390 10 168.0 9Columbus Clippers $77,399 11 $58,106 12 202.1 6Omaha Storm Chasers $77,209 12 $59,427 9 87.5 20Charlotte Knights $76,937 13 $54,693 17 221.5 5Nashville Sounds $76,225 14 $55,922 14 162.5 10Norfolk Tides $75,734 15 $59,454 8 160.1 11Reno Aces $74,206 16 $55,357 15 41.3 29San Antonio Triple-A Team $72,810 17 $54,437 19 194.1 7Indianapolis Indians $72,116 18 $53,501 20 168.3 8Syracuse Chiefs $72,046 19 $54,656 18 59.2 25Rochester Red Wings $71,702 20 $54,737 16 96.7 19Oklahoma City Dodgers $71,636 21 $53,270 21 114.4 13Louisville Bats $71,325 22 $53,225 22 110.0 15New Orleans Zephyrs $69,841 23 $47,800 27 106.1 16Buffalo Bisons $68,712 24 $52,502 23 101.3 18Memphis Redbirds $68,451 25 $49,103 25 102.8 17Las Vegas 51s $66,925 26 $51,274 24 144.1 12Albuquerque Isotopes $65,377 27 $48,792 26 67.5 24Fresno Grizzlies $64,490 28 $45,982 29 55.8 27Scranton/Wilkes-Barre RailRiders $62,484 29 $46,909 28 38.9 31Toledo Mud Hens $61,530 30 $45,613 30 41.7 28El Paso Chihuahuas $57,680 31 $42,163 31 40.8 30
Average (Ex. San Antonio) $74,479 $55,510 139.5Source: Nielsen 2016.

Page 97Preliminary Draft – Subject to Revision Confidential
CBSA DesignationAge
San Antonio has a younger population thanthe Triple-A market average
B. DEMOGRAPHIC COMPARISON
TeamAverage
Age RankMedian
Age RankSalt Lake Bees 34.3 1 32.3 3Fresno Grizzlies 34.7 2 32.0 1El Paso Chihuahuas 34.8 3 32.1 2Round Rock Express 35.8 4 34.5 4San Antonio Triple-A Team 36.7 5 34.9 5Gwinnett Braves 36.8 6 36.3 12Colorado Springs Sky Sox 36.8 6 34.9 5Omaha Storm Chasers 37.0 8 35.7 8Memphis Redbirds 37.2 9 36.0 9Oklahoma City Dodgers 37.2 9 35.3 7Iowa Cubs 37.2 9 36.2 11Indianapolis Indians 37.5 12 36.7 15Columbus Clippers 37.5 12 36.4 13Nashville Sounds 37.8 14 36.9 16Charlotte Knights 37.8 14 37.4 19Norfolk Tides 37.9 16 36.0 9Las Vegas 51s 38.0 17 37.2 17Durham Bulls 38.2 18 36.6 14Sacramento River Cats 38.4 19 37.3 18Tacoma Rainiers 38.5 20 37.9 22Albuquerque Isotopes 38.7 21 37.7 21Toledo Mud Hens 38.9 22 37.6 20New Orleans Zephyrs 38.9 22 38.1 23Reno Aces 39.1 24 38.3 24Louisville Bats 39.4 25 39.2 25Syracuse Chiefs 39.9 26 39.4 26Rochester Red Wings 40.3 27 39.9 27Pawtucket Red Sox 40.6 28 40.5 28Lehigh Valley IronPigs 41.0 29 41.5 30Buffalo Bisons 41.1 30 41.0 29Scranton/Wilkes-Barre RailRiders 42.4 31 43.0 31
Average (Ex. San Antonio) 38.1 37.1Source: Nielsen 2016.

Page 98Preliminary Draft – Subject to Revision Confidential
CBSA DesignationUnemployment
San Antonio is below the Triple-A marketaverage in terms of unemployment rate
B. DEMOGRAPHIC COMPARISON
TeamUnemployment
Rate RankRound Rock Express 2.9% 1Nashville Sounds 3.1% 2Omaha Storm Chasers 3.2% 3Iowa Cubs 3.3% 4San Antonio Triple-A Team 3.4% 5Salt Lake Bees 3.6% 6Oklahoma City Dodgers 3.7% 7Columbus Clippers 3.9% 8Norfolk Tides 4.1% 9Louisville Bats 4.1% 9Colorado Springs Sky Sox 4.1% 9Memphis Redbirds 4.4% 12Durham Bulls 4.4% 12Indianapolis Indians 4.5% 14El Paso Chihuahuas 4.5% 14Toledo Mud Hens 4.6% 16Tacoma Rainiers 4.6% 16Syracuse Chiefs 4.7% 18Rochester Red Wings 4.7% 18Charlotte Knights 4.8% 20Gwinnett Braves 4.8% 20Pawtucket Red Sox 4.8% 20Buffalo Bisons 5.0% 23Lehigh Valley IronPigs 5.1% 24Albuquerque Isotopes 5.1% 24Sacramento River Cats 5.1% 24New Orleans Zephyrs 5.3% 27Reno Aces 5.4% 28Las Vegas 51s 6.1% 29Scranton/Wilkes-Barre RailRiders 6.1% 29Fresno Grizzlies 9.7% 31
Average (Ex. San Antonio) 4.7%Note: BLS defines Unemployment Rate by Metropolitan Area.Source: BLS 2016.

Page 99Preliminary Draft – Subject to Revision Confidential
CBSA DesignationGDP
San Antonio is above the Triple-A marketaverage in terms of GDP
B. DEMOGRAPHIC COMPARISON
TeamEconomy Size
(GDP-Billions) RankGwinnett Braves $324.9 1Tacoma Rainiers $300.8 2Charlotte Knights $143.6 3Indianapolis Indians $125.9 4Columbus Clippers $117.8 5Round Rock Express $115.3 6Sacramento River Cats $112.7 7Nashville Sounds $106.7 8San Antonio Triple-A Team $104.8 9Las Vegas 51s $94.5 10Norfolk Tides $90.8 11New Orleans Zephyrs $80.3 12Pawtucket Red Sox $75.9 13Salt Lake Bees $75.7 14Oklahoma City Dodgers $72.6 15Memphis Redbirds $69.9 16Louisville Bats $67.3 17Omaha Storm Chasers $57.9 18Buffalo Bisons $54.9 19Rochester Red Wings $53.3 20Iowa Cubs $45.2 21Durham Bulls $43.5 22Albuquerque Isotopes $42.0 23Fresno Grizzlies $37.1 24Lehigh Valley IronPigs $35.4 25Syracuse Chiefs $31.3 26Toledo Mud Hens $30.0 27Colorado Springs Sky Sox $29.2 28El Paso Chihuahuas $28.5 29Scranton/Wilkes-Barre RailRiders $22.0 30Reno Aces $20.6 31
Average (Ex. San Antonio) $83.5Note: GDP is defined by Metropolitan Area.Source: U.S. BEA.

Page 100Preliminary Draft – Subject to Revision Confidential
CBSA DesignationCost of Living
San Antonio has a lower cost of livingthan the Triple-A average
B. DEMOGRAPHIC COMPARISON
Team
Cost of Living Index Rank
Memphis Redbirds 83.3 1Oklahoma City Dodgers 84.7 2Louisville Bats 86.3 3San Antonio Triple-A Team 86.5 4Durham Bulls 88.1 5Iowa Cubs 88.8 6El Paso Chihuahuas 89.9 7Round Rock Express 90.1 8Columbus Clippers 90.2 9Omaha Storm Chasers 91.6 10Indianapolis Indians 92.4 11Colorado Springs Sky Sox 92.6 12Charlotte Knights 92.7 13Albuquerque Isotopes 94.5 14Salt Lake Bees 94.6 15Norfolk Tides 94.9 16Buffalo Bisons 96.0 17Nashville Sounds 96.1 18New Orleans Zephyrs 98.0 19Gwinnett Braves 98.5 20Rochester Red Wings 101.6 21Scranton/Wilkes-Barre RailRiders 102.3 22Tacoma Rainiers 103.8 23Reno Aces 105.0 24Las Vegas 51s 106.5 25Sacramento River Cats 115.5 26Pawtucket Red Sox 121.2 27Lehigh Valley IronPigs NA NAFresno Grizzlies NA NASyracuse Chiefs NA NAToledo Mud Hens NA NA
Average (Ex. San Antonio) 96.1Source: Council for Community and Economic Research 2016.

Page 101Preliminary Draft – Subject to Revision Confidential
CBSA DesignationMedia Market
San Antonio is above the Triple-A averagein terms of TV and radio population
B. DEMOGRAPHIC COMPARISON
Team
TV Population
(000s) Rank
Radio Population
(000s) RankLehigh Valley IronPigs 7,407 1 720 23Gwinnett Braves 6,231 2 4,646 1Tacoma Rainiers 4,295 3 3,704 2Sacramento River Cats 3,763 4 1,963 5Charlotte Knights 2,925 5 2,205 3Durham Bulls 2,790 6 1,507 11Indianapolis Indians 2,639 7 1,511 10Salt Lake Bees 2,610 8 1,844 6Nashville Sounds 2,456 9 1,403 13San Antonio Triple-A Team 2,429 10 1,991 4Columbus Clippers 2,210 11 1,623 9Las Vegas 51s 1,956 12 1,786 7Round Rock Express 1,868 13 1,679 8Fresno Grizzlies 1,775 14 792 21Norfolk Tides 1,746 15 1,401 14Oklahoma City Dodgers 1,708 16 1,230 16Albuquerque Isotopes 1,633 17 755 22Memphis Redbirds 1,619 18 1,120 17Louisville Bats 1,582 19 1,030 18New Orleans Zephyrs 1,573 20 1,249 15Pawtucket Red Sox 1,470 21 1,404 12Buffalo Bisons 1,352 22 990 19Scranton/Wilkes-Barre RailRiders 1,324 23 692 26Iowa Cubs 1,021 24 711 24Omaha Storm Chasers 1,005 25 694 25Rochester Red Wings 954 26 967 20El Paso Chihuahuas 952 27 691 27Toledo Mud Hens 949 28 517 30Syracuse Chiefs 871 29 570 28Colorado Springs Sky Sox 842 30 566 29Reno Aces 658 31 428 31
Average (Ex. San Antonio) 2,139.4 1,346.6Note: TV market data represents the respective DMAs.Source: ThinkTV 2016, Nielsen 2016.
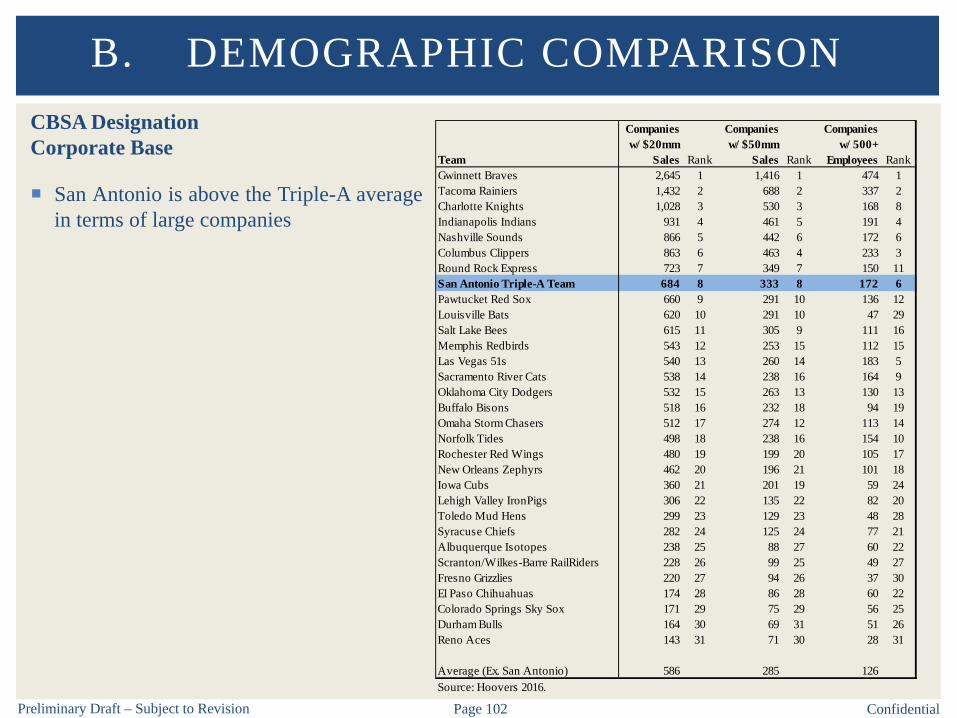
Page 102Preliminary Draft – Subject to Revision Confidential
CBSA DesignationCorporate Base
San Antonio is above the Triple-A averagein terms of large companies
B. DEMOGRAPHIC COMPARISON
Team
Companies w/ $20mm
Sales Rank
Companies w/ $50mm
Sales Rank
Companies w/ 500+
Employees RankGwinnett Braves 2,645 1 1,416 1 474 1Tacoma Rainiers 1,432 2 688 2 337 2Charlotte Knights 1,028 3 530 3 168 8Indianapolis Indians 931 4 461 5 191 4Nashville Sounds 866 5 442 6 172 6Columbus Clippers 863 6 463 4 233 3Round Rock Express 723 7 349 7 150 11San Antonio Triple-A Team 684 8 333 8 172 6Pawtucket Red Sox 660 9 291 10 136 12Louisville Bats 620 10 291 10 47 29Salt Lake Bees 615 11 305 9 111 16Memphis Redbirds 543 12 253 15 112 15Las Vegas 51s 540 13 260 14 183 5Sacramento River Cats 538 14 238 16 164 9Oklahoma City Dodgers 532 15 263 13 130 13Buffalo Bisons 518 16 232 18 94 19Omaha Storm Chasers 512 17 274 12 113 14Norfolk Tides 498 18 238 16 154 10Rochester Red Wings 480 19 199 20 105 17New Orleans Zephyrs 462 20 196 21 101 18Iowa Cubs 360 21 201 19 59 24Lehigh Valley IronPigs 306 22 135 22 82 20Toledo Mud Hens 299 23 129 23 48 28Syracuse Chiefs 282 24 125 24 77 21Albuquerque Isotopes 238 25 88 27 60 22Scranton/Wilkes-Barre RailRiders 228 26 99 25 49 27Fresno Grizzlies 220 27 94 26 37 30El Paso Chihuahuas 174 28 86 28 60 22Colorado Springs Sky Sox 171 29 75 29 56 25Durham Bulls 164 30 69 31 51 26Reno Aces 143 31 71 30 28 31
Average (Ex. San Antonio) 586 285 126Source: Hoovers 2016.

Page 103Preliminary Draft – Subject to Revision Confidential
Demographic SummaryPopulation per Seat
San Antonio is above the Triple-A marketaverage in terms of population per seat
Note: Includes only sports and entertainmentfacilities with 5,000 seats or more and includesa potential new Triple-A stadium replacing thecurrent ballpark
B. DEMOGRAPHIC COMPARISON
Team
Total Seating
Capacity Rank
2016 Population
(000s) RankPopulation
per Seat RankPawtucket Red Sox 50,088 29 1,613.7 12 32.2 1Sacramento River Cats 92,237 17 2,277.6 5 24.7 2Rochester Red Wings 49,108 30 1,083.7 19 22.1 3Gwinnett Braves 261,506 2 5,736.3 1 21.9 4Lehigh Valley IronPigs 40,789 31 832.8 24 20.4 5San Antonio Triple-A Team 126,323 13 2,394.2 4 19.0 6Oklahoma City Dodgers 79,156 21 1,365.1 13 17.2 7Norfolk Tides 110,364 15 1,734.8 11 15.7 8Charlotte Knights 159,255 7 2,436.2 3 15.3 9Las Vegas 51s 143,055 10 2,119.8 6 14.8 10Tacoma Rainiers 261,922 1 3,737.4 2 14.3 11Memphis Redbirds 102,616 16 1,347.3 14 13.1 12Indianapolis Indians 157,588 8 2,001.1 9 12.7 13Fresno Grizzlies 78,327 22 983.1 20 12.6 14Iowa Cubs 50,189 28 627.6 27 12.5 15Omaha Storm Chasers 74,654 23 918.2 21 12.3 16Colorado Springs Sky Sox 66,093 24 703.0 25 10.6 17Columbus Clippers 197,748 5 2,030.1 7 10.3 18Louisville Bats 125,669 14 1,282.0 15 10.2 19Albuquerque Isotopes 90,830 18 908.3 22 10.0 20El Paso Chihuahuas 85,717 19 855.3 23 10.0 21Round Rock Express 208,545 4 2,006.3 8 9.6 22Toledo Mud Hens 64,491 25 606.4 28 9.4 23New Orleans Zephyrs 138,620 11 1,270.2 16 9.2 24Scranton/Wilkes-Barre RailRiders 61,450 27 557.2 29 9.1 25Salt Lake Bees 132,536 12 1,174.8 17 8.9 26Nashville Sounds 229,762 3 1,840.3 10 8.0 27Syracuse Chiefs 83,729 20 660.8 26 7.9 28Buffalo Bisons 144,992 9 1,136.9 18 7.8 29Reno Aces 64,297 26 450.9 31 7.0 30Durham Bulls 169,027 6 553.2 30 3.3 31
Average (Ex. San Antonio) 119,145 1,495.0 13.1Source: Nielsen 2016, Industry Research.

Page 104Preliminary Draft – Subject to Revision Confidential
Demographic SummaryCompanies per Suite
San Antonio is near theTriple-A market average interms of large companiesper suite
Note: Includes only sportsand entertainment facilitieswith 5,000 seats or moreand includes a potentialnew Triple-A stadiumreplacing the currentballpark
B. DEMOGRAPHIC COMPARISON
Team
Total Luxury Suites Rank Count Per Suite Rank Count Per Suite Rank Count Per Suite Rank
Pawtucket Red Sox 40 28 660 16.5 1 291 7.3 1 136 3.4 1Scranton/Wilkes-Barre RailRiders 18 31 228 12.7 2 99 5.5 2 49 2.7 2Norfolk Tides 64 24 498 7.8 3 238 3.7 3 154 2.4 3Rochester Red Wings 62 25 480 7.7 4 199 3.2 6 105 1.7 7Sacramento River Cats 70 22 538 7.7 5 238 3.4 5 164 2.3 5El Paso Chihuahuas 25 30 174 7.0 6 86 3.4 4 60 2.4 4Colorado Springs Sky Sox 27 29 171 6.3 7 75 2.8 7 56 2.1 6San Antonio Triple-A Team 144 12 684 4.8 8 333 2.3 10 172 1.2 10Gwinnett Braves 574 1 2,645 4.6 9 1,416 2.5 9 474 0.8 18Syracuse Chiefs 62 25 282 4.5 10 125 2.0 15 77 1.2 9Iowa Cubs 81 21 360 4.4 11 201 2.5 8 59 0.7 20Lehigh Valley IronPigs 70 22 306 4.4 12 135 1.9 18 82 1.2 11Omaha Storm Chasers 120 16 512 4.3 13 274 2.3 11 113 0.9 15Oklahoma City Dodgers 125 15 532 4.3 14 263 2.1 13 130 1.0 12Las Vegas 51s 127 14 540 4.3 15 260 2.0 14 183 1.4 8Memphis Redbirds 128 13 543 4.2 16 253 2.0 16 112 0.9 17Charlotte Knights 243 6 1,028 4.2 17 530 2.2 12 168 0.7 22Indianapolis Indians 234 7 931 4.0 18 461 2.0 17 191 0.8 19Tacoma Rainiers 379 3 1,432 3.8 19 688 1.8 20 337 0.9 16Louisville Bats 174 11 620 3.6 20 291 1.7 23 47 0.3 30Columbus Clippers 245 5 863 3.5 21 463 1.9 19 233 1.0 14Round Rock Express 207 9 723 3.5 22 349 1.7 22 150 0.7 21Salt Lake Bees 177 10 615 3.5 23 305 1.7 21 111 0.6 23Durham Bulls 52 27 164 3.2 24 69 1.3 24 51 1.0 13Toledo Mud Hens 109 17 299 2.7 25 129 NA NA 48 0.4 27Fresno Grizzlies 87 20 220 2.5 26 94 1.1 26 37 0.4 28Albuquerque Isotopes 105 18 238 2.3 27 88 0.8 29 60 0.6 24Nashville Sounds 390 2 866 2.2 28 442 1.1 25 172 0.4 26New Orleans Zephyrs 209 8 462 2.2 29 196 0.9 27 101 0.5 25Buffalo Bisons 263 4 518 2.0 30 232 0.9 28 94 0.4 29Reno Aces 104 19 143 1.4 31 71 0.7 30 28 0.3 31
Average (Ex. San Antonio) 152 586 4.8 285 2.3 126 1.1Source: Hoovers 2016, Industry Research.
Companies w/ $20mm Sales
Companies w/ $50mm Sales
Companies w/ 500+ Employees

Page 105Preliminary Draft – Subject to Revision Confidential
Demographic SummaryHigh Income Households per Club Seat
San Antonio is below the Triple-A marketaverage in terms of high incomehouseholds per club seat (due toAlamodome inventory)
Note: Includes only sports andentertainment facilities with 5,000 seatsor more and includes a potential newTriple-A stadium replacing the currentballpark
B. DEMOGRAPHIC COMPARISON
TeamTotal Club
Seats Rank
HHs w/ Income $100,000+
(000s) Rank
High Income Households per
Club Seat RankColorado Springs Sky Sox 450 28 70.1 22 155.9 1Sacramento River Cats 1,505 21 228.2 4 151.6 2Pawtucket Red Sox 1,120 23 168.0 9 150.0 3Scranton/Wilkes-Barre RailRiders 273 29 38.9 31 142.4 4Norfolk Tides 1,240 22 160.1 11 129.1 5Iowa Cubs 630 26 68.0 23 107.9 6Reno Aces 492 27 41.3 29 83.9 7Round Rock Express 3,896 13 231.0 3 59.3 8El Paso Chihuahuas 690 25 40.8 30 59.1 9Las Vegas 51s 2,536 16 144.1 12 56.8 10Durham Bulls 1,083 24 58.0 26 53.5 11Memphis Redbirds 2,096 17 102.8 17 49.1 12Lehigh Valley IronPigs 2,053 18 81.4 21 39.6 13Albuquerque Isotopes 1,746 19 67.5 24 38.7 14Oklahoma City Dodgers 3,170 14 114.4 13 36.1 15Fresno Grizzlies 1,620 20 55.8 27 34.5 16Columbus Clippers 5,918 10 202.1 6 34.2 17Tacoma Rainiers 14,830 5 503.8 2 34.0 18Gwinnett Braves 19,059 1 540.8 1 28.4 19Salt Lake Bees 4,368 12 112.3 14 25.7 20San Antonio Triple-A Team 9,706 7 194.1 7 20.0 21Louisville Bats 6,254 9 110.0 15 17.6 22Omaha Storm Chasers 5,202 11 87.5 20 16.8 23Toledo Mud Hens 2,610 15 41.7 28 16.0 24Charlotte Knights 14,536 6 221.5 5 15.2 25Buffalo Bisons 9,378 8 101.3 18 10.8 26Nashville Sounds 16,088 3 162.5 10 10.1 27Indianapolis Indians 17,340 2 168.3 8 9.7 28New Orleans Zephyrs 15,400 4 106.1 16 6.9 29Rochester Red Wings 0 30 96.7 19 NA NASyracuse Chiefs 0 30 59.2 25 NA NA
Average (Ex. San Antonio) 5,186 139.5 56.2Source: Nielsen 2016, Industry Research.

Page 106Preliminary Draft – Subject to Revision Confidential
Demographic Summary20 Mile Ring Designation Overview
San Antonio
Population / Households – above average
Income – below average
High Income Households – above average
Corporate Base – above average
B. DEMOGRAPHIC COMPARISON
Statistical Measure San AntonioRank of 31
Triple-A Average - (1)
2016 Population (000s) 1,955.7 2 1,088.8 2021 Population (000s) 2,111.6 2 1,142.4 Est. % Growth 2016-2021 7.97% 4 4.49%
2016 Households (000s) 698.1 2 414.1 2021 Households (000s) 757.0 2 435.0 Est. % Growth 2016-2021 8.43% 3 4.73%
Average Household Income $70,319 22 $75,450Median Household Income $52,293 22 $56,177High Income Households (000s) 147.0 6 100.2
Average Age 36.0 5 37.8Median Age 34.0 4 36.7
Companies w/ $20+mm Sales 600 9 490Companies w/ $50+mm Sales 290 9 239Companies w/ 500+ Employees 151 6 110
Triple-A Summary - 20 Mile Ring Designation Overview
(1) - Average excludes San Antonio.Source: Nielsen 2016, Hoovers 2016.

Page 107Preliminary Draft – Subject to Revision Confidential
Demographic Summary30 Mile Ring Designation Overview
San Antonio
Population / Households – above average
Income – below average
High Income Households – above average
Corporate Base – above average
B. DEMOGRAPHIC COMPARISON
Statistical Measure San AntonioRank of 31
Triple-A Average - (1)
2016 Population (000s) 2,183.2 5 1,438.6 2021 Population (000s) 2,361.1 4 1,509.2 Est. % Growth 2016-2021 8.15% 2 4.41%
2016 Households (000s) 779.7 6 546.9 2021 Households (000s) 846.8 5 574.7 Est. % Growth 2016-2021 8.60% 2 4.67%
Average Household Income $72,547 19 $75,908Median Household Income $54,080 20 $56,755High Income Households (000s) 174.9 11 138.0
Average Age 36.3 5 38.0Median Age 34.5 4 37.1
Companies w/ $20+mm Sales 655 11 643Companies w/ $50+mm Sales 314 11 311Companies w/ 500+ Employees 159 9 142
Triple-A Summary - 30 Mile Ring Designation Overview
(1) - Average excludes San Antonio.Source: Nielsen 2016, Hoovers 2016.

Page 108Preliminary Draft – Subject to Revision Confidential
Demographic Summary30 Minute Drive Time Designation Overview
San Antonio
Population / Households – above average
Income – below average
High Income Households – above average
B. DEMOGRAPHIC COMPARISON
Statistical Measure San AntonioRank of 31
Triple-A Average - (1)
2016 Population (000s) 2,006.4 3 1,135.3 2021 Population (000s) 2,166.7 3 1,191.0 Est. % Growth 2016-2021 7.99% 3 4.45%
2016 Households (000s) 717.7 3 433.0 2021 Households (000s) 778.5 3 455.0 Est. % Growth 2016-2021 8.47% 2 4.71%
Average Household Income $70,463 22 $74,799Median Household Income $52,292 21 $55,642High Income Households (000s) 152.0 6 104.0
Average Age 36.1 5 37.8Median Age 34.1 5 36.6
Triple-A Summary - 30 Minute Drive Time Designation Overview
(1) - Average excludes San Antonio.Source: Nielsen 2016.

C. COMPETITIVE FACILITIES

Page 110Preliminary Draft – Subject to Revision Confidential
Competitive Facilities
Limited number of competitive stadiums / arenas in the San Antonio market
Existing and planned competitive inventory of stadiums / arenas in the San Antonio market couldimpact the operations of the team
Competition from other stadiums, arenas, amphitheaters, performing arts centers (to a lesser degree),and other entertainment alternatives must be considered
Patrons
Advertising / Sponsorships
Premium Seating
Competition from regional facilities must also be considered
Austin and surrounding region
C. COMPETITIVE FACILITIES

Page 111Preliminary Draft – Subject to Revision Confidential
Primary Facilities – In Market
AT&T Center Owner: Bexar County Operator: Spurs Sports and Entertainment Opened: 2002 (renovated 2015) Primary Tenant: San Antonio Spurs Capacity: 18,581 Luxury Suites: 56 (16 courtside / 40 terrace) $250,000-$375,000 95% occupancy
Ledge Boxes: 22 (20 4-seat / 2 6-seat) $60,000
Club Seats: 2,018 $5,945-$49,200 95% occupancy
It is our understanding that the occupancy ratesmay be higher than reported by ALSD
C. COMPETITIVE FACILITIES

Page 112Preliminary Draft – Subject to Revision Confidential
Primary Facilities – In Market
Alamodome Owner: City of San Antonio Operator: City of San Antonio Opened: 1993 Primary Tenants: University of Texas at San
Antonio Football and Alamo Bowl (NCAA) Capacity: 63,942 Luxury Suites: 52 Club Seats: 6,232
Toyota Field Owner: Bexar County / City of San Antonio Operator: Spurs Sports & Entertainment Opened: 2013 Primary Tenant: San Antonio FC (USL) Capacity: 8,000 Luxury Suites: 16 Club Seats: 864
C. COMPETITIVE FACILITIES

Page 113Preliminary Draft – Subject to Revision Confidential
Secondary Facilities – In Market
Freeman Coliseum Owner: Bexar County Opened: 1949 (renovated 1993) Primary Tenant: NA Capacity: 9,800
Convocation Center(University of Texas at San Antonio) Owner: University of Texas at San Antonio Operator: University of Texas at San Antonio Opened: 1975 Primary Tenant: University of Texas at San Antonio Capacity: 4,080
C. COMPETITIVE FACILITIES

Page 114Preliminary Draft – Subject to Revision Confidential
Other Facilities – In Market
Indoor Cowboys DanceHall San Antonio Capacity: 4,000
H-E-B Performance Hall (Tobin Center) Capacity: 2,100
Laurie Auditorium (Trinity University) Capacity: 2,700
Lila Cockrell Theatre (Harry B. GonzalesConvention Center) Capacity: 2,319
Majestic Theatre Capacity: 2,264
McDermott Center 2,000
C. COMPETITIVE FACILITIES
Open Air Gayle and Tom Benson Stadium 6,000
Heroes Stadium 11,000
R&J Music Pavilion Capacity: 3,000
Sunken Garden Theater Capacity: 4,800 (879 seats)
The Pavilion at Sunset Station Capacity: 4,000

Page 115Preliminary Draft – Subject to Revision Confidential
Major Regional Facilities
Darrel K. Royal – Texas Memorial Stadium (Austin) Owner: University of Texas at Austin Operator: University of Texas at Austin Opened: 1924 Primary Tenant: University of Texas at Austin Capacity: 100,119 Luxury Suites: 110 Club Seats: 3,262
Frank C. Erwin Jr. Special Events Center (Austin) Owner: University of Texas at Austin Operator: University of Texas at Austin Opened: 1977 Primary Tenant: University of Texas at Austin Capacity: 16,755 Luxury Suites: 28
C. COMPETITIVE FACILITIES

Page 116Preliminary Draft – Subject to Revision Confidential
Major Regional Facilities
Dell Diamond (Round Rock) Owner: City of Round Rock Operator: Ryan-Sanders Baseball Opened: 2000 Primary Tenant: Round Rock Express (PCL) Fixed Capacity: 8,631 Luxury Suites: 30 Club Seats: 100
H-E-B Center at Cedar Park (Cedar Park) Owner: City of Cedar Park Operator: Northland Properties Corporation Opened: 2009 Primary Tenants: Austin Spurs (D-League) and
Texas Stars (AHL) Capacity: 7,200 Luxury Suites: 24
C. COMPETITIVE FACILITIES

Page 117Preliminary Draft – Subject to Revision Confidential
Major Regional Facilities
TSU Bobcat Stadium (San Marcos) Owner: Texas State University Operator: Texas State University Opened: 1981 Primary Tenant: Texas State University Capacity: 30,000 Luxury Suites: 15 Club Seats: 450
Strahan Coliseum (San Marcos) Owner: Texas State University Operator: Texas State University Opened: 1982 Primary Tenant: Texas State University Capacity: 7,200
C. COMPETITIVE FACILITIES

Page 118Preliminary Draft – Subject to Revision Confidential
Major Regional Facilities
Circuit of the Americas Owner: Circuit of the Americas LLC (Red
McCombs / partners) Opened: 2012 Major Events (approximately 1 million
annual attendees) Formula One MotoGP WeatherTech SportsCar Championship X Games Track days Festivals
Capacity (Fixed): 70,000-80,000 Total Capacity: 120,000
Luxury Suites: 29 permanent / 28 temporary Loge Boxes: 33 permanent (8 seats) Club Seats: 4,000 temporary
C. COMPETITIVE FACILITIES
Note: figures may change depending on the event.

D. LOCAL SPORTS TEAMS

Page 120Preliminary Draft – Subject to Revision Confidential
Overview
Limited number of competitive local professional sports teams in the San Antonio market
San Antonio is home to only one major professional team (NBA San Antonio Spurs)
San Antonio is also home to four minor / other league teams
MiLB San Antonio Missions
AHL San Antonio Rampage
WNBA San Antonio Stars
USL San Antonio FC
San Antonio also hosts University of Texas at San Antonio athletics
Consideration should also be given to competition from major collegiate programs in the region
D. LOCAL SPORTS TEAMS

Page 121Preliminary Draft – Subject to Revision Confidential
San Antonio SpursAT&T Center
The San Antonio Spurs were founded in Dallas in 1967
Originally a member of the American BasketballAssociation (ABA)
Joined National Basketball Association (NBA) in 1976 Play home games in 18,581 seat AT&T Center Located three miles east of downtown San Antonio
Original construction cost was approximately $186million Current renovation project is estimated to cost
approximately $101.5 million Shared with AHL Rampage and WNBA Stars
Team is owned by Spurs Sports & Entertainment
D. LOCAL SPORTS TEAMS
Season Per Game Attendance
Rank of 30
2006-07 18,654 9
2007-08 18,564 13
2008-09 18,269 14
2009-10 18,089 10
2010-11 18,314 12
2011-12 18,396 12
2012-13 18,431 11
2013-14 18,415 9
2014-15 18,606 12
2015-16 18,449 12
Figures represent announced attendance –typically higher than turnstile / paid attendance
Source: ESPN.

Page 122Preliminary Draft – Subject to Revision Confidential
San Antonio RampageAT&T Center
The San Antonio Rampage began Play in 2002
Rampage play in the American Hockey League (AHL) – equivalent to Triple-A baseball
Rampage are currently affiliated with the National Hockey League Colorado Avalanche
The Rampage play their home games at the AT&T Center
Team is owned by Spurs Sports & Entertainment
D. LOCAL SPORTS TEAMS
Season Per Game Attendance
Rank of 30
2011-12 7,134 7
2012-13 7,067 6
2013-14 7,001 6
2014-15 6,579 7
2015-16 6,137 12Figures represent announced attendance –typically higher than turnstile / paid attendance Source: AHL, industry research.

Page 123Preliminary Draft – Subject to Revision Confidential
San Antonio StarsAT&T Center
The San Antonio Stars moved to San Antonio in 2003 from Salt Lake City, Utah
Stars were originally founded in 1997
Stars play in the Women’s National Basketball Association (WNBA)
The Stars play their home games at the AT&T Center
Played their 2015 season at Freeman Coliseum due to renovations at AT&T Center
Team is owned by Spurs Sports & Entertainment
D. LOCAL SPORTS TEAMS
Season Per Game Attendance
Rank of 12
2011 8,751 4
2012 7,850 4
2013 7,914 5
2014 7,719 7
2015 4,831 12Source: Sports Business Daily.
Figures represent announced attendance –typically higher than turnstile / paid attendance

Page 124Preliminary Draft – Subject to Revision Confidential
San Antonio FCToyota Field
In an effort to bring an MLS franchise to San Antonio, Spurs Sports & Entertainment established theUSL franchise in 2016 As part of the deal, Gordon Hartman ceased operations of the NASL San Antonio Scorpions and
sold Toyota Field to Bexar County / City of San Antonio
San Antonio FC plays its home games at the 8,000 seat Toyota Field Located at the STAR Soccer Complex Expandable to potentially host an MLS team
The team must gain entry into MLS by 2022 or begin paying penalties to Bexar County / City of SanAntonio
D. LOCAL SPORTS TEAMS
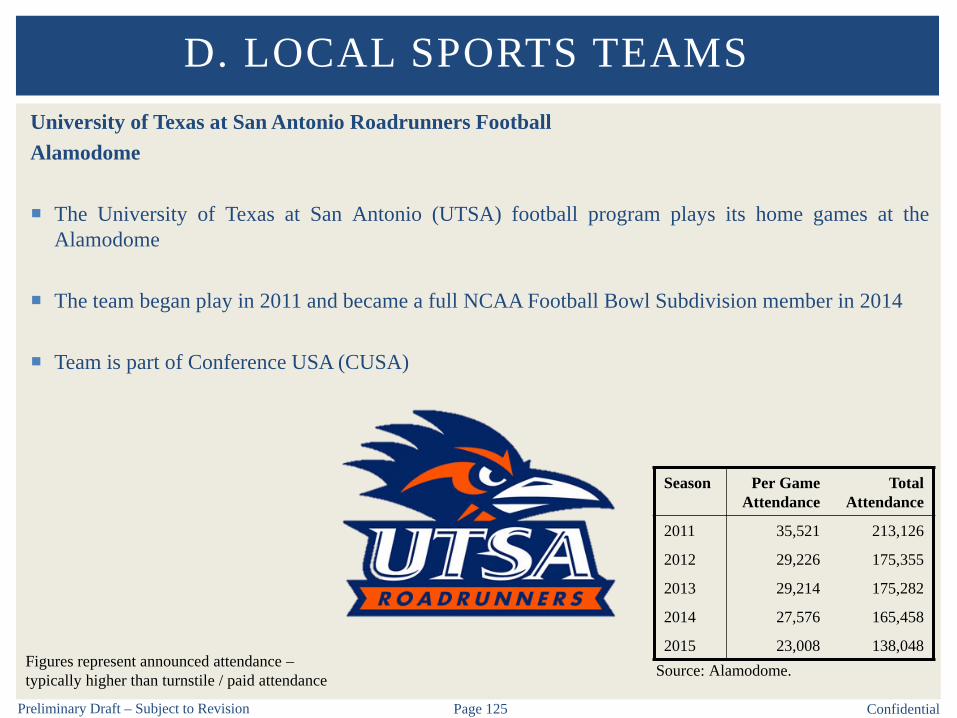
Page 125Preliminary Draft – Subject to Revision Confidential
University of Texas at San Antonio Roadrunners FootballAlamodome
The University of Texas at San Antonio (UTSA) football program plays its home games at theAlamodome
The team began play in 2011 and became a full NCAA Football Bowl Subdivision member in 2014
Team is part of Conference USA (CUSA)
D. LOCAL SPORTS TEAMS
Season Per Game Attendance
TotalAttendance
2011 35,521 213,126
2012 29,226 175,355
2013 29,214 175,282
2014 27,576 165,458
2015 23,008 138,048Source: Alamodome.Figures represent announced attendance –
typically higher than turnstile / paid attendance

V. PRELIMINARY PROGRAM
RECOMMENDATION

Page 127Preliminary Draft – Subject to Revision Confidential
Preliminary Program Recommendation
Ballpark Characteristics
Capacity – Fixed Seats 8,000 – 8,500
Capacity – Total (Including Standing Room / Berm Seating) 9,000 – 9,500
Luxury Suites 20 – 25
Loge Boxes / Four Tops 15 – 20
Club Seats 500 – 750
Parking 2,700 – 2,850
Note: Lower end of ranges are recommended at this time.
V. PRELIMINARY PROGRAM RECOMMENDATION

VI. FINANCIAL ANALYSIS

Page 129Preliminary Draft – Subject to Revision Confidential
Overview
BSG developed financial and operating assumptions for a Triple-A minor league baseball team andstadium in downtown San Antonio to understand the potential net cash flow from operations
BSG has assumed the following stadium program
8,000 (fixed seats) / 9,000 (total capacity)
20 luxury suites
20 loge boxes / four tops
500 club seats
500 controlled parking spaces (placeholder)
BSG has made significant assumptions related to the team and stadium operating revenues andexpenses
VI. FINANCIAL ANALYSIS

Page 130Preliminary Draft – Subject to Revision Confidential
Overview (Continued)
BSG reviewed the historical operating and financial performance of the Missions (limited)
BSG reviewed and evaluated comparable team / stadium information from our internal database todevelop key assumptions as well as our industry knowledge
Information obtained from numerous sources including teams, comparable facilities, industry sources,etc.
In order to obtain accurate and relevant information, we agreed to maintain confidentiality of dataprovided by teams / facilities
Comparable data adjusted to reflect impact of key variables on performance Market demographics Cost of living Number of professional and collegiate sports teams Other entertainment alternatives Local market conditions Tenant / event mix Climate Other
VI. FINANCIAL ANALYSIS

Page 131Preliminary Draft – Subject to Revision Confidential
Overview (Continued)
BSG has assumed the followinglease terms
Analysis does not include (to bedetermined)
Stadium rent Ticket surcharge Capital replacement reserve
VI. FINANCIAL ANALYSIS
Stadium RentMinimum RentBase RentPercentage Rent
Taxes/SurchargesTicket Sales Tax
Revenue SharingConcessionsNoveltiesAdvertising – Game DayAdvertising – PermanentTelevisionNaming RightsParkingLuxury Suites – TicketsLuxury Suites – PremiumClub Seats – TicketsClub Seats – Premium
Stadium ExpensesGame Day Operating ExpensesAnnual Operating ExpensesCapital Repairs/Improvements
Other Events
Stadium Share0% 0%0%0%0%0%0%0%0%0%0%
0%0%
To be Determined0%
Amount Paid by TeamTo be DeterminedTo be DeterminedTo be Determined
8.25%Team Share
100% 100%100%100%100%100%100%100%100%100%100%
100% 100%
To be Determined100%

Page 132Preliminary Draft – Subject to Revision Confidential
Major Assumptions – Operating Revenues
Attendance
Attendance at stadiums can vary significantly due to a variety of factors including: tenant mix;market competition; facility age / capacity / amenities; accounting / reporting policies; etc.
Paid and turnstile attendance estimates only reflect attendance at regular season baseball games atthe proposed stadium and do not include any other events or playoffs
We have estimated baseball attendance as follows (figures rounded):
Average Total Paid Attendance 7,000 504,000 Turnstile Attendance 6,600 474,000
Following the honeymoon period, attendance may decrease slightly
VI. FINANCIAL ANALYSIS

Page 133Preliminary Draft – Subject to Revision Confidential
Major Assumptions – Operating Revenues
Ticket Sales
Factors that impact ticket prices include, among others: market demand, entertainmentalternatives, income levels, team performance, etc.
Minor league baseball is a relatively affordable entertainment alternative
Ticket sales in San Antonio are subject to the local sales tax of 8.25%. In addition, minor leaguebaseball teams are required to make a payment to Major League Baseball (MLB) equal to 7.5% ofticket revenues
This analysis assumes an average ticket price of approximately $10.00 (including premium seatingticket component)
Of the comparable teams evaluated, net ticket revenue averaged approximately $3.7 million
Year 1 net ticket revenue for a team in San Antonio is expected approximately $4.3 million.Following the honeymoon period, net ticket revenue may decrease slightly.
VI. FINANCIAL ANALYSIS
Page 134Preliminary Draft – Subject to Revision Confidential
Major Assumptions – Operating Revenues
Concessions
Concessions are anticipated to provide significant revenue
Concession spending is typically higher at newer or renovated facilities than older facilities due toincreased number of points-of-sale and improved locations
Concessions assumed to be managed and subject to cost of goods sold (COGS), concessionoperating expenses, and profit margin (collectively “expenses”)
Given the limited premium seating inventory, total concession expenses assumed to be 55.0% ofgross concession sales on weighted average basis
Our analysis assumes a gross per capita spending of approximately $10.00
On average, annual net concessions revenues for comparable stadiums was approximately $1.5million
We have assumed annual net concessions of $2.1 million
VI. FINANCIAL ANALYSIS
Page 135Preliminary Draft – Subject to Revision Confidential
Major Assumptions – Operating Revenues
Novelties (Net)
Novelties revenues are typically retained by tenant or act
Facility occasionally receives nominal share of novelties revenues
Novelties assumed to be managed by concessionaire, tenant, or third party and subject to cost ofgoods sold (COGS), operating expenses, and profit margin (collectively “expenses”)
Our analysis assumes a gross per capita spending of approximately $1.50
We have assumed annual net novelties revenue of approximately $213,000
VI. FINANCIAL ANALYSIS

Page 136Preliminary Draft – Subject to Revision Confidential
Major Assumptions – Operating Revenues
Advertising (Net)
Advertising revenues are generally derived from the following sources
Display advertising: outfield wall signs, signage throughout the concourses, concession stands,and other common areas in the stadium
Scoreboard advertising: fixed signage, electronic advertising on the scoreboard, and videomessage boards
Other: programs, etc.
It is important to note that direct comparison of advertising revenue is difficult
Trade and barter arrangements
Revenue sharing
Gross advertising vs net advertising
Overall sponsorship revenues
VI. FINANCIAL ANALYSIS

Page 137Preliminary Draft – Subject to Revision Confidential
Major Assumptions – Operating Revenues
Advertising (Net)
Annual net advertising revenues for comparable stadiums averaged approximately $1.9 million. Itis important to note that in some cases, naming rights revenue may be included in net advertisingrevenues.
We have assumed annual net advertising revenue of $1.8 million for the new San Antonio stadium(excluding naming rights revenue)
Prominent and well integrated signage and sponsorships could cause the advertising revenueassumption to be higher
VI. FINANCIAL ANALYSIS

Page 138Preliminary Draft – Subject to Revision Confidential
Major Assumptions – Operating Revenues
Naming Rights (Net)
Value of naming rights transaction can often be misunderstood and misrepresented Reported in generic terms
Variety of factors to consider in valuing and comparing naming rights deals from purchaser and sellerperspectives Regional / national / international media exposure Market size and demographic profile Number and profile of major tenants Number and type of facility events Facility attendance Facility location / visibility Location of naming rights signage Deal structure and other amenities
Value of naming rights to purchaser is a function of following factors Number of impressions / exposures Brand exclusivity Public relations / community image Sponsorship / cross promotion opportunities Tax deductible expense (as applicable) Other
VI. FINANCIAL ANALYSIS

Page 139Preliminary Draft – Subject to Revision Confidential
Major Assumptions –Operating Revenues
Naming Rights (Net)
Illustrated in thefollowing table is asummary of namingrights deals in Triple-Abaseball
We have assumedannual naming rightsadvertising revenues of$650,000, plus 3.0%annual escalation (10year agreement, $7.5million)
VI. FINANCIAL ANALYSIS
Triple-A Franchise StadiumTotal Value (Millions) # of Years
Avg. Annual Value (Millions) Expiration
Fresno Grizzlies Chukchansi Park $16.0 15 $1.07 2021Sacramento River Cats Raley Field $15.0 20 $0.75 2019Columbus Clippers Huntington Park $12.0 23 $0.52 2030Toledo Mud Hens Fifth Third Field $5.0 15 $0.33 2016Omaha Storm Chasers Werner Park $1.5 5 $0.31 2020Iowa Cubs Principal Park $2.5 14 $0.18 2017Memphis Redbirds AutoZone Park $4.3 25 $0.17 2024Syracuse Chiefs NBT Bank Stadium $2.8 20 $0.14 2024Colorado Springs Sky Sox Security Service Field $1.5 12 $0.13 2017Louisville Bats Louisville Slugger Field $2.0 Indefinite NA NAGwinnett Braves Coolray Field DND 16 DND 2025Nashville Sounds First Tennessee Park DND 10 DND 2025Round Rock Express Dell Diamond DND 10 DND 2023Buffalo Bisons Coca-Cola Field DND 10 DND 2018Rochester Red Wings Frontier Field NA 10 NA 2026Salt Lake Bees Smith's Ballpark DND 6 DND 2020Charlotte Knights BB&T Ballpark DND DND DND DNDEl Paso Chihuahuas Southwest University Park DND DND DND DNDScranton/Wilkes-Barre RailRiders PNC Field DND DND DND DNDReno Aces Greater Nevada Field DND DND DND DNDLehigh Valley IronPigs Coca-Cola Park DND DND DND DNDOklahoma City Dodgers Chickasaw Bricktown Ballpark DND DND DND DND
Average - (1) $6.3 14.07 $0.40(1) Average includes only stadiums that provided full information.Source: Resource Guide Live.

Page 140Preliminary Draft – Subject to Revision Confidential
Major Assumptions – Operating Revenues
Luxury Suite Revenue, Loge Box / Four-Top Revenue, and Club Seat Revenue
Luxury suite and club seat prices vary considerably based on numerous factors, including: age of facility;market; corporate base; premium seat demand; amenities; etc.
Luxury suites We have assumed approximately $462,000 net revenue Assumptions: 20 luxury suites (19 available for lease / 1 reserved) / 90% occupancy rate Luxury suite gross price of $40,000 (includes baseball tickets and four parking spaces)
Loge boxes / four-tops We have assumed approximately $76,000 net revenue Assumptions: 20 loge boxes / four-tops / 90% occupancy rate Loge box / four-top gross price of $10,000 (includes baseball tickets and two parking spaces)
Club seats We have assumed approximately $107,000 net club seat revenue Assumptions: 500 club seats / 90% occupancy rate Club seat gross price of $1,500 (includes baseball tickets and one parking space / two seats)
VI. FINANCIAL ANALYSIS

Page 141Preliminary Draft – Subject to Revision Confidential
Major Assumptions – Operating Revenues
Parking (Net)
Stadium location will impact the number of required parking spaces – downtown facilitiestypically require fewer controlled parking spaces. We have assumed 500 on-site parking spaces.
We have assumed approximately $265,000 of net parking revenue generated by proposed stadium
Other (Net)
Minor league baseball stadiums generally host a limited number of non-baseball events, such asconcerts, football games, soccer games, thrill / dirt shows, festivals, softball / baseball games,corporate events, charity events, civic / community events, etc.
Other event revenue generating potential is relatively limited
We have assumed $438,000 of other net revenue – includes special events, promotions, programs,etc.
VI. FINANCIAL ANALYSIS

Page 142Preliminary Draft – Subject to Revision Confidential
Major Assumptions – Operating Expenses
Stadium and Game Expenses
Stadium and game expenses includes game day expenses and annual operating expenses of thestadium, including: stadium operations staffing, utilities, materials and supplies, repairs andmaintenance, among others
Average annual stadium and game expenses for comparable stadiums was approximately $2.8million
We have assumed total annual stadium and game expenses of approximately $2.75 million for theproposed stadium (excluding stadium rent)
VI. FINANCIAL ANALYSIS

Page 143Preliminary Draft – Subject to Revision Confidential
Major Assumptions – Operating Expenses
Team Expenses
The Professional Baseball Agreement (PBA) between the affiliated MLB ball club and the SanAntonio team will specifically outline which entity pays team expenses (standard contract)
Team expenses include expenses such as travel, equipment, and other team related expenses
Annual team expenses for the comparables was in the $550,000 range
We have assumed annual team expenses expenses of approximately $500,000 in San Antonio
VI. FINANCIAL ANALYSIS

Page 144Preliminary Draft – Subject to Revision Confidential
Major Assumptions – Operating Expenses
General and Administrative
General and administrative expenses include salaries, benefits, payroll taxes, insurance, office,consulting, legal, accounting, other professional fees, human resources, technology, telephone,postage, travel, equipment, supplies, etc.
General and administrative expenses may vary significantly between teams due to differences inallocations
On average, annual general and administrative expenses for comparable was approximately $2.5million
We have assumed annual general and administrate expenses of approximately $3.0 million in SanAntonio
VI. FINANCIAL ANALYSIS

Page 145Preliminary Draft – Subject to Revision Confidential
Major Assumptions – Operating Expenses
Management Fee
In some cases, minor league baseball teams incur a management fee expense
The management fee expense is intended to account for time and expenses for ownership andother overhead expenses
Some facilities hire an outside manager or team affiliate for management of facility
Management fee typically consists of base fee and incentive fee
However, in other situations, the team self manages the ballpark and does not incur a managementfee
We have assumed the San Antonio team would manage the ballpark and not incur an additionalmanagement fee
VI. FINANCIAL ANALYSIS

Page 146Preliminary Draft – Subject to Revision Confidential
Major Assumptions – Operating Expenses
Other Miscellaneous Expenses
Property tax
Assumption to be determined (not included)
Capital replacement reserve
Potential funding required for future capital repairs / replacement Scoreboard / videoboard Seat replacement Field Concessions equipment Parking overlay
Initial funding and annual deposit responsibility – to be determined
VI. FINANCIAL ANALYSIS

Page 147Preliminary Draft – Subject to Revision Confidential
Major Assumptions – Operating Expenses
Total Expenses
On average, total operating expenses in comparable facilities was $6.2 million
We have assumed approximately $6.4 million of total operating expenses at the proposed facility –not including
Stadium rent Admission surcharge Capital replacement reserve
VI. FINANCIAL ANALYSIS

Page 148Preliminary Draft – Subject to Revision Confidential
Preliminary Cash Flow Summary
Although assumptions appear reasonable based on current and anticipated market conditions, actualresults depend on actions of team and stadium ownership, team and stadium management, tenants /users, and other factors both internal and external to project, which frequently vary
It is important to note that because events and circumstances may not occur as expected, there may besignificant differences between actual results and those estimated in this analysis, and thosedifferences may be material
Based on the assumptions described herein and assuming experienced and effective management, thefinancial model illustrates that the team would generate a positive net cash flow from operations
The financial model illustrates that the net cash flow from operations may decline after the initial“honeymoon” period (estimated at 3 to 4 years)
Consideration should be given to establishing a capital repair, replacement, and improvement fund
VI. FINANCIAL ANALYSIS

Page 149Preliminary Draft – Subject to Revision Confidential
Assumptions Summary
Below is a summary of keycash flow model assumptions
We have assumed a three yearhoneymoon period. Attendancehas been assumed to decrease10% in year four and anadditional 5% in year five. Inaddition, ticket prices andconcessions / novelties per capsare assumed to remainrelatively constant from yearthree to four.
VI. FINANCIAL ANALYSISYear 1 Year 2 Year 3 Year 4 Year 5
Baseball Games (Regular Season) 72 72 72 72 72Paid Attendance (Regular Season)
Average 7,000 7,000 7,000 6,373 6,059Total 504,000 504,000 504,000 458,836 436,254
Complimentary Attendance (General Seating) 10.0% 10.0% 10.0% 10.0% 10.0%No-Show Attendance (General Seating) 15.0% 15.0% 15.0% 15.0% 15.0%Turnstile Attendance (Regular Season)
Average 6,577 6,577 6,577 5,981 5,683Total 473,564 473,564 473,564 430,658 409,205
Average Ticket Price (Weighted Average) $10.00 $10.30 $10.61 $10.64 $10.97Concessions Per Capita
Gross $10.00 $10.30 $10.61 $10.61 $10.93Net $4.50 $4.64 $4.77 $4.77 $4.92
Novelties Per CapitaGross $1.50 $1.55 $1.59 $1.59 $1.64Net $0.45 $0.46 $0.48 $0.48 $0.49
Sponsorship (Gross)Stadium Advertising $2,150,000 $2,214,500 $2,280,935 $2,349,363 $2,419,844Naming Rights $650,000 $669,500 $689,585 $710,273 $731,581
Luxury SuitesTotal Available for Lease 19 19 19 19 19Number Reserved 1 1 1 1 1Number Leased 17 17 17 17 17Gross Price $40,000 $41,000 $42,025 $43,076 $44,153
Loge Boxes/Four TopsTotal Available for Lease 20 20 20 20 20Number Leased 18 18 18 18 18Gross Price $10,000 $10,250 $10,506 $10,769 $11,038G oss ce $0 $0 $0 $0 $0
Club SeatsTotal Available 500 500 500 500 500Number Leased 450 450 450 450 450Gross Price (Per Seat) $1,500 $1,545 $1,591 $1,639 $1,688
ExpensesStadium and Game Expenses $2,750,000 $2,832,500 $2,917,475 $3,004,999 $3,095,149Team Expenses $500,000 $515,000 $530,450 $546,364 $562,754General and Administrative $3,000,000 $3,090,000 $3,182,700 $3,278,181 $3,376,526Other $160,000 $164,800 $169,744 $174,836 $180,081

Page 150Preliminary Draft – Subject to Revision Confidential
Preliminary Cash Flow Summary
Net cash flow reflects consolidated team / stadium operation – does not include stadium rent,admission surcharge, or capital improvements (to be determined)
VI. FINANCIAL ANALYSIS
($ in 000s)Year 1 Year 2 Year 3 Year 4 Year 5
OPERATING REVENUESTickets (Net) $4,308 $4,437 $4,570 $4,171 $4,091Luxury Suites/Loge Boxes/Four-Tops (Premium) $545 $559 $573 $587 $602Club Seats (Premium) $118 $122 $125 $129 $133Advertising/Sponsorship (Net) $1,828 $1,882 $1,939 $1,997 $2,057Naming Rights (Net) $553 $569 $586 $604 $622Concessions (Net) $2,131 $2,195 $2,261 $2,056 $2,012Novelties (Net) $213 $219 $226 $206 $201Parking (Net) $265 $273 $281 $288 $296Other (Special Events/Promotions/Programs/Etc.) $438 $451 $465 $475 $487
TOTAL OPERATING REVENUES $10,399 $10,707 $11,025 $10,512 $10,501
OPERATING EXPENSESStadium and Game Expenses $2,750 $2,833 $2,917 $3,005 $3,095Team Expenses $500 $515 $530 $546 $563General and Administrative $3,000 $3,090 $3,183 $3,278 $3,377Management Fee $0 $0 $0 $0 $0Other $160 $165 $170 $175 $180
TOTAL OPERATING EXPENSES $6,410 $6,602 $6,800 $7,004 $7,215
NET CASH FLOW FROM OPERATIONS $3,989 $4,105 $4,225 $3,508 $3,286
Less: Stadium Rent TBD TBD TBD TBD TBDLess: Admission Surcharge TBD TBD TBD TBD TBDLess: Capital Improvements TBD TBD TBD TBD TBD
NET CASH FLOW FROM OPERATIONS - ADJUSTED $3,989 $4,105 $4,225 $3,508 $3,286
Estimated

Page 151Preliminary Draft – Subject to Revision Confidential
Preliminary Cash Flow Summary
Teams in other markets may be able to achieve higher (or lower) net operating income
Market demographics
Physical characteristics
Entertainment alternatives
Competitive facilities
Other
VI. FINANCIAL ANALYSIS

Page 152Preliminary Draft – Subject to Revision Confidential
Preliminary Sensitivity Analysis –Year 1
Sensitivities illustrate potentialfluctuations in net cash flow
Sensitivities reflect impact offluctuation of one assumption –impact (positive or negative)likely to occur in more than oneassumption
Does not include stadium rent,admission surcharge, or capitalimprovements (to be determined)
VI. FINANCIAL ANALYSISNET CASH
FLOWBASE CASE - YEAR 1 $3,989
ADJUSTEDASSUMPTION ADJUSTMENT NET IMPACT CASH FLOW
Average Paid Attendance - (1)Increase 10% $592 $4,581Decrease (10%) ($592) $3,396
Average Ticket PriceIncrease 10% $367 $4,356Decrease (10%) ($367) $3,622
Premium Seating - Average Price/OccupancyIncrease 10% $268 $4,256Decrease (10%) ($237) $3,752
AdvertisingIncrease 10% $183 $4,171Decrease (10%) ($183) $3,806
No Naming Rights NA ($553) $3,436
Concessions/Novelties Per CapitasIncrease 10% $234 $4,223Decrease (10%) ($234) $3,754
Operating ExpensesIncrease 10% ($641) $3,348Decrease (10%) $641 $4,630
(1) - Reflects general seating attendance only - does not include premium seating.
SENSITIVITY ANALYSIS

VII. FINANCING ALTERNATIVES

Page 154Preliminary Draft – Subject to Revision Confidential
General Trends in Stadium / Arena Facility Finance and Construction
Market conditions and political environment play critical role in developing financing structure
Increasingly difficult to fund construction of sports facilities – public resistance / high costs
Combination of both public and private participation is cornerstone of current financing structures
Planning and construction of public facilities can take many years due to typical construction risks,voter approval, political debate, etc.
Public sector participation can come in numerous forms
Equity investment New or increased taxes Tax rebates (property, payroll, etc.) Conduit financing Credit enhancement / guarantees
VII. FINANCING ALTERNATIVES

Page 155Preliminary Draft – Subject to Revision Confidential
General Trends in Stadium / Arena Facility Finance and Construction
Private sector participation typically comes in the form of equity and debt secured by facilityoperations and/or corporate guarantees
Private sector participation through non-traditional sources (i.e., PSLs, premium seating, namingrights, vendor rights) can be an important part of financing plans
In some instances, private sector grants and donations have been utilized to fund facilities
Private sector participation in minor league facilities is often limited due to the economics offranchise and stadium operations
Franchises and private management firms have increasingly taken over management and operations ofsports facilities
VII. FINANCING ALTERNATIVES

Page 156Preliminary Draft – Subject to Revision Confidential
Public Sector Participation
Municipalities may generate wide assortment of revenues that could potentially be used to funddevelopment of sports facilities
Feasibility of introducing, increasing, or redirecting revenue from taxes and fees depends on uniquepolitical / tax environment
Typically, revenue streams shown to benefit from facility’s development and operation will be moresuccessful in gaining public support
Taxes and fees levied on selected groups may receive less resistance (i.e., hotel tax, car rental tax)
VII. FINANCING ALTERNATIVES

Page 157Preliminary Draft – Subject to Revision Confidential
Private Sector Participation
Private sector participation is an essential component of sports facility financial structures
Contractually obligated income (COI) is an important private sector funding source
Following sources provide a brief summary of the more commonly used private sources of funds (inaddition to equity)
Premium seating (luxury suites and club seats) Potential source of security and capital Potential source for construction and/or operations
Advertising Reflect short-term to medium-term contractual obligations Potential source of revenue for construction and/or operations
Naming rights Convey rights to name of facility and provide exposure opportunity (local, national,
international) Potential source of revenue available for construction and/or operations
VII. FINANCING ALTERNATIVES

Page 158Preliminary Draft – Subject to Revision Confidential
Private Sector Participation
Concessions / novelties Rights to concessions provided equipment potential source of up-front capital for development Must consider impact on revenue sharing percentages Potential source of revenue for construction and/or operations
Pouring rights Purchase rights to be exclusive beverage supplier – typically part of larger sponsorship
agreement Potential source of revenue for construction and/or operations
Personal seat licenses (PSL) / seat option bonds (SOB) – often used for major league facilities PSLs typically are equity payments SOBs typically interest-free loans Give patrons right to purchase tickets for selected seats for defined period of time Potential source of revenue available for construction (limited for minor league projects) Must consider tax implications (public sector or non-profit agent)
Private donations or donor contributions (typically for collegiate facilities)
VII. FINANCING ALTERNATIVES

Page 159Preliminary Draft – Subject to Revision Confidential
Financing Instruments – General
General obligation bonds Backed by pledge of “full faith and credit” of the public agency (city, county, state) Credit structure typically requires legislative action or voter approval Typically represents lowest cost of capital
Revenue-backed obligation Secured by defined revenues source(s) – i.e., sales tax, hotel tax, etc. More complex and less secure obligation than general obligation
Lease revenue financing arrangements Lease-backed financing Municipality leases facility to an “authority” and leases facility back from authority under sublease Sublease typically requires annual rent payment sufficient to cover debt service on authority bonds
Certificate of participation (COP)
Tax increment financing (TIF) / Tax increment reinvestment zone (TIRZ) Bonds payable from revenue sources available to agency – i.e., portion of incremental ad valorem
property (and possibly other) taxes on property in redevelopment area
VII. FINANCING ALTERNATIVES

Page 160Preliminary Draft – Subject to Revision Confidential
Financing Instruments – General
Community facilities district
Provides mechanism by which municipalities can issue bonds secured by levy of special taxes Contingent upon voter approval of district voters or landowners
Conduit revenue bonds
Tax-exempt or taxable financing issued by governmental agency Typically loan repayments assigned directly to bond trustee to be distributed to bondholders Bond proceeds typically loaned to non-governmental borrower – i.e., individuals, corporations
(profit / non-profit), partnerships, etc.
Assessment bonds
Issued upon security of assessments Used to finance public improvements provided local agency can legitimize findings the
improvements impart a special benefit to assess parcels of land
VII. FINANCING ALTERNATIVES

Page 161Preliminary Draft – Subject to Revision Confidential
Credit Structure / Debt Security – Major Issues
Potential credit structures range from most secure (general obligations) to least secure (project finance)
Security of debt will have significant impact on interest rates
General fund obligation indicates a commitment to appropriate funds, as necessary
Debt coverage requirements for major league sports facilities financed on a stand-alone basis havehistorically ranged from 1.5x to 2.0x (minor league projects more challenging)
Debt coverage requirements reduced if public sector provides credit enhancement or specific tax revenuesare pledged as additional support
Political environment will often impact coverage required Current economy and sports finance market may require higher coverage ratios (stand-alone scenario)
Private guarantees may be used to enhance credit rating
Major tenants, facility managers, other private entities Revenue from facility operations or general revenues
VII. FINANCING ALTERNATIVES
Page 162Preliminary Draft – Subject to Revision Confidential
Credit Structure / Debt Security – Risk Management
Limit the potential impact and cost of issuing debt
Credit enhancement Interest rate swap Debt service reserve fund Operating reserve fund Capital replacement reserve fund
VII. FINANCING ALTERNATIVES

Page 163Preliminary Draft – Subject to Revision Confidential
Taxable Versus Tax-Exempt Debt
Critical factor driving financing sports facilities is tax status of financing arrangements
Difficult to utilize tax-exempt debt given current tax regulations
1986 tax act restricted general availability of tax-exempt financing since facilities are viewed asprivate purpose facilities
To issue tax-exempt debt, facility must pass private activity test (PAT) and other guidelines
In general, PAT states bond is not tax-exempt if: Over 10% of facility’s use is controlled by private business; and More than 10% of revenues used for debt service are derived from private business
Several efforts to prohibit use of tax-exempt debt
“Stop Tax-Exempt Arena Debt Issuance Act” – former Senator Daniel Patrick Moynihan
VII. FINANCING ALTERNATIVES

Page 164Preliminary Draft – Subject to Revision Confidential
Potential Financing Mechanisms / Funding SourcesChapter 334, Texas Local Government Code (Sports and Community Venues)
Provides for planning, acquisition, establishment, development, construction / renovation of sportsand community venue projects by a city or county
Pertains to facilities and related infrastructure
Authorized revenues sources include: Sales tax 0.50% maximum Short-term motor vehicle rental tax 5.00% maximum – (1) Hotel occupancy tax 2.00% maximum – (1) Admission tax 10.00% maximum Event parking tax $3.00 / vehicle Facility use $5,000 / game / player Special motor vehicle rental tax 5.00% maximum – (2)
1) Certain markets may have slightly higher maximum rate.2) City must border Mexico and host college bowl.
Additional research required to assess City eligibility (initial research indicates City is eligible)
If eligible, City and/or County are authorized to impose taxes above if they have not reached thestatutory limits
If eligible, imposition of tax would require simple majority vote (50% + 1)
VII. FINANCING ALTERNATIVES

Page 165Preliminary Draft – Subject to Revision Confidential
Potential Financing Mechanisms / Funding SourcesChapter 334, Texas Local Government Code (Sports and Community Venues)
Bexar County has utilized the Sports and Community Venues legislation (HOT / car rental tax)
Original AT&T Center construction
In May 2008, Bexar County voters approved extension of the tax sources
Proposition 1: $125 million San Antonio River improvements
Proposition 2: $80 million amateur sports facilities
Proposition 3: $100 million community arenas and grounds
Proposition 4: $110 million cultural arts
VII. FINANCING ALTERNATIVES

Page 166Preliminary Draft – Subject to Revision Confidential
Potential Financing Mechanisms / Funding Sources
Combination of sources were used to fund the recent $50.0 million of improvements at theAlamodome
Debt funding
Increased parking rates by $5.00
Added $2.00 facility fund fee to paid tickets
Added $2.00 service charge to paid tickets
Cash contribution of $7.0 million
VII. FINANCING ALTERNATIVES

Page 167Preliminary Draft – Subject to Revision Confidential
Potential Financing Mechanisms / Funding Sources
BSG identified traditional public funding sources – list narrowed to the following potential sources Admissions surcharge / facility fee Stadium rent Hotel occupancy tax Car rental tax Parking tax Restaurant tax
It is important to note that selected revenue sources discussed herein may require public vote,legislative approval, and/or may require some form of additional credit enhancement, as well asadditional research and confirmation
Information contained herein has been obtained from sources believed to be reliable. Figures have notbeen audited or further verified. Figures provided are subject to accounting / reporting policies andinterpretation.
Additional sources were considered but not included (e.g. sales tax, property tax, cigarette tax, beerand wine tax, etc.)
Financial and political feasibility of potential public revenue streams to be further evaluated
VII. FINANCING ALTERNATIVES

Page 168Preliminary Draft – Subject to Revision Confidential
Potential Financing Mechanisms / Funding Sources
Sales Tax
Texas state allows for a maximum combined rate of 8.25%
Current rate in San Antonio is 8.25% (maximum allowable under State law)
City of San Antonio 1.000% City of San Antonio Edwards Aquifer Protection and
Parks Development and Expansion Venue Projects 0.125% City of San Antonio Pre-K 4 SA 0.125% San Antonio Advanced Transportation District 0.250% San Antonio Metropolitan Transit Authority 0.500% State of Texas 6.250%
Total 8.250%
VII. FINANCING ALTERNATIVES

Page 169Preliminary Draft – Subject to Revision Confidential
Potential Financing Sources
Key Assumptions
VII. FINANCING ALTERNATIVES
SCENARIO A
SCENARIO B
SCENARIO C
Revenue Growth Rate 2.00% 2.00% 2.00%
Debt Service CoveragePublic Funding Sources 1.25 1.25 1.25Stadium Funding Sources 1.50 1.50 1.50
Tax Exempt Interest RatePublic Funding Sources 5.00% 4.00% 3.00%
Taxable Interest RateStadium Funding Sources 6.50% 5.50% 4.50%
Costs of Issuance 1.50% 1.50% 1.50%Bond Insurance 0.00% 0.00% 0.00%Debt Service Reserve Fund Yes Yes YesDebt Service Reserve Fund Interest Earnings 2.00% 2.00% 2.00%Surety NA NA NA Construction Period Interest Earnings NA NA NA Capitalized Interest (Years) 0 0 0
Final Maturity (Years) 30 30 30

Page 170Preliminary Draft – Subject to Revision Confidential
Annual Debt Service
Table below summarizes a number of scenarios based on various levels of private investment
Figures are presented for illustrative purposes only – deal structure to be negotiated
VII. FINANCING ALTERNATIVES
Scenario A Scenario B Scenario C Scenario D
Preliminary Project Cost - Estimated
Preliminary Project Cost - Estimated $80,000,000 $80,000,000 $80,000,000 $80,000,000Less: Private Investment - (1) $0 $10,000,000 $15,000,000 $25,000,000
Adjusted Project Cost $80,000,000 $70,000,000 $65,000,000 $55,000,000
Annual Debt Service Needed to Fund Adjusted Project Cost - (2) $4,900,000 $4,300,000 $4,000,000 $3,400,000Dollar Change from Preceding Scenario NA ($600,000) ($300,000) ($600,000)
Potential Bond Proceeds (Gross) $88,000,000 $77,000,000 $72,000,000 $61,000,000
Potential Bond Proceeds (Net) - (3) $80,000,000 $70,000,000 $65,000,000 $55,000,000
Surplus/(Deficit) $0 $0 $0 $0Note: Figures rounded.(1) Assumed for illustrative purposes only.(2) Estimated. Tax-exempt assumptions modeled.(3) Net of debt service reserve fund, cost of issuance, bond insurance, and capitalized interest fund.
$80,000,000

Page 171Preliminary Draft – Subject to Revision Confidential
Preliminary Project Costs – Estimated
Provided by Barton Malow Company – does notinclude land
Additional detail provided on followingpage
VII. FINANCING ALTERNATIVES
Construction Cost Estimate 9,000 Seats
Civil $4,565,000Structure and Envelope $9,578,950Seating Bowl $12,144,600Field Level $3,498,712Concourse Level $5,696,107Suite Level $4,261,370Stadium Support Systems $9,250,850General Conditions and Requirements $4,556,590Insurance and Bonding $1,594,728Contingency and Escalation $5,514,691CM Fees $2,426,464
Sub-Total $63,088,062
Add: Owner Items $2,135,000Add: Owner Soft Costs $14,642,381
Total $79,865,443Source: Barton Malow Company.

Page 172Preliminary Draft – Subject to Revision Confidential
Preliminary Project Costs – Estimated
Provided by Barton Malow Company – does not includeland
VII. FINANCING ALTERNATIVESConstruction Cost Estimate 9,000 Seats
CivilSite Improvements $3,625,000Area Development $890,000Site Amenities $50,000
Civil - Total $4,565,000Structure and Envelope
Stadium Structure $6,713,950Stadium Envelopee $2,865,000
Structure and Envelope - Total $9,578,950Seating Bowl $12,144,600Field Level
Team Facilities $2,004,743Venue Operations $191,569Miscellaneous $1,302,400
Field Level - Total $3,498,712Concourse Level
Concourse Amenities $3,106,708Team Store $276,826Ticketing $312,443Food Service Commissary $564,373Building Support $110,000Circulation $1,325,757
Concourse Level - Total $5,696,107Suite Level
Suite Amenities $1,817,040Club Amenities $764,352Stadium Administration $665,361Media/Electronic Systems $318,805Building Support $71,500Circulation $624,312
Suite Level - Total $4,261,370Stadium Support Systems
Stadium Specialties $2,800,000Concourse MEP Systems $6,450,850
Stadium Support Systems - Total $9,250,850General Conditions and Requirements $4,556,590Insurance and Bonding $1,594,728Contingency and Escalation $5,514,691CM Fees $2,426,464
Sub-Total $63,088,062
Add: Owner Items $2,135,000Add: Owner Soft Costs
Furnishings Allowance $4,565,614Food Service Equipment $2,250,000Design Fee Allowance $4,239,499Survey, Geotech, Material Testing, etc. $1,304,461Owner's Contingency $2,282,807
Add: Owner Soft Costs - Total $14,642,381
Total $79,865,443Source: Barton Malow Company.

Page 173Preliminary Draft – Subject to Revision Confidential
Potential Financing Sources – Stadium
Admissions Surcharge / Facility Fee (Requires Credit Enhancement)
Paid tickets at Wolff Stadium are currently subject to a $1.25 facility surcharge – revenue is splitbetween the City and Team, but is reinvested into the stadium (operations / capital improvements)
For illustrative purposes, we have assumed a similar $1.25 facility surcharge would apply at theproposed stadium (assumes 2.0% annual growth / taxable interest rate)
VII. FINANCING ALTERNATIVES
PROPOSED STADIUMAdmissions Surcharge/Facility Fee
Year 1Proposed Fee
Portion Dedicated to Stadium Debt Service $1.25
Admissions Surcharge/Facility Fee Dedicated to Stadium Debt Service $630,000
Low Case Mid Case High CasePotential Admissions Surcharge/Facility Fee Revenue $630,000 $630,000 $630,000
Potential Bond Proceeds (Gross) $6,900,000 $7,800,000 $8,900,000
Potential Bond Proceeds (Net) - (1) $6,100,000 $6,900,000 $8,000,000
(1) Net of debt service reserve fund, cost of issuance, bond insurance, and capitalized interest fund.
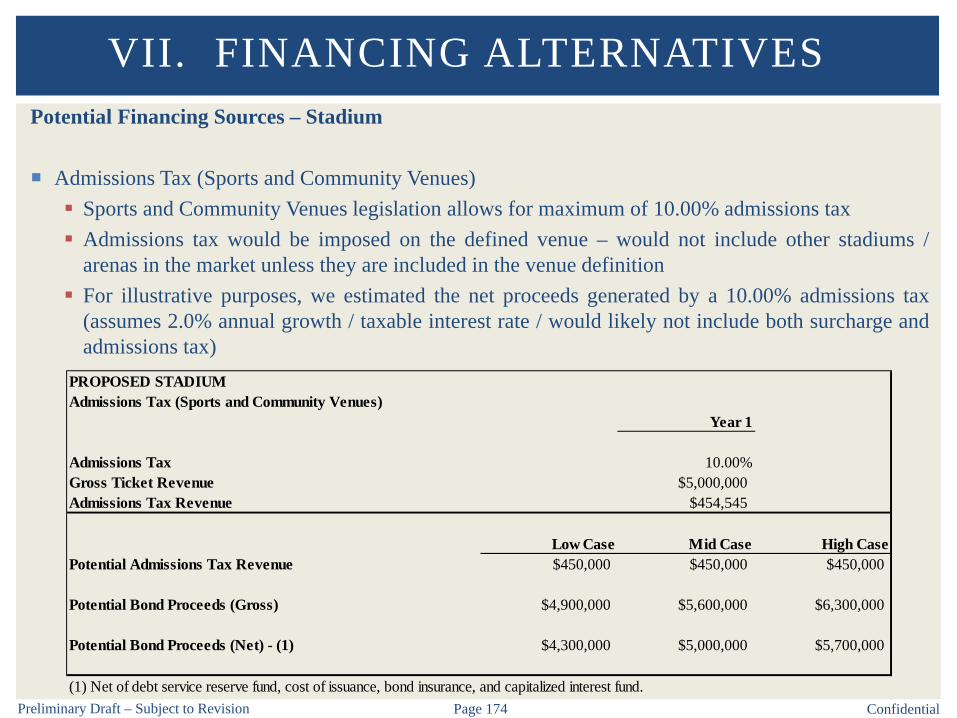
Page 174Preliminary Draft – Subject to Revision Confidential
Potential Financing Sources – Stadium
Admissions Tax (Sports and Community Venues) Sports and Community Venues legislation allows for maximum of 10.00% admissions tax Admissions tax would be imposed on the defined venue – would not include other stadiums /
arenas in the market unless they are included in the venue definition For illustrative purposes, we estimated the net proceeds generated by a 10.00% admissions tax
(assumes 2.0% annual growth / taxable interest rate / would likely not include both surcharge andadmissions tax)
VII. FINANCING ALTERNATIVES
PROPOSED STADIUMAdmissions Tax (Sports and Community Venues)
Year 1
Admissions Tax 10.00%Gross Ticket Revenue $5,000,000Admissions Tax Revenue $454,545
Low Case Mid Case High CasePotential Admissions Tax Revenue $450,000 $450,000 $450,000
Potential Bond Proceeds (Gross) $4,900,000 $5,600,000 $6,300,000
Potential Bond Proceeds (Net) - (1) $4,300,000 $5,000,000 $5,700,000
(1) Net of debt service reserve fund, cost of issuance, bond insurance, and capitalized interest fund.

Page 175Preliminary Draft – Subject to Revision Confidential
Potential Financing Sources – Team Rent
Annual Rent from Triple-A baseball team
Three hypothetical rent scenarios illustrated below Assumes 2.0% annual growth / taxable interest rate
VII. FINANCING ALTERNATIVES
PROPOSED STADIUMAnnual Rent from Team
Low Case Mid Case High CasePotential Stadium Rent
Year 1 Annual Rent @ $500,000 $500,000 $500,000 $500,000Year 1 Annual Rent @ $750,000 $750,000 $750,000 $750,000Year 1 Annual Rent @ $1,000,000 $1,000,000 $1,000,000 $1,000,000
Potential Bond Proceeds (Gross)Year 1 Annual Rent @ $500,000 $5,500,000 $6,200,000 $7,100,000Year 1 Annual Rent @ $750,000 $8,200,000 $9,300,000 $10,600,000Year 1 Annual Rent @ $1,000,000 $11,000,000 $12,400,000 $14,100,000
Potential Bond Proceeds (Net) - (1)Year 1 Annual Rent @ $500,000 $4,900,000 $5,500,000 $6,400,000Year 1 Annual Rent @ $750,000 $7,300,000 $8,300,000 $9,500,000Year 1 Annual Rent @ $1,000,000 $9,700,000 $11,000,000 $12,700,000
(1) Net of debt service reserve fund, cost of issuance, bond insurance, and capitalized interest fund.

Page 176Preliminary Draft – Subject to Revision Confidential
Potential Financing Sources
Hotel occupancy tax (HOT) is imposed on the rental of a room costing $15 or more per day
HOT – City of San Antonio
State 6.00% City 7.00% Convention Center Expansion / Future Projects 2.00% Bexar County 1.75%
Total 16.75%
City does not have capacity to increase HOT
Revenue from the City 7.00% is dedicated to convention / tourism activities and arts / cultural programming 15% is dedicated for history and preservation (Riverwalk) 15% is dedicated to arts and cultural programs
In 2012, City refunded Convention Center debt – to be retired in 2042
County has capacity to increase HOT by 0.25%
VII. FINANCING ALTERNATIVES

Page 177Preliminary Draft – Subject to Revision Confidential
Potential Financing Sources
Hotel Occupancy Tax (HOT) – City of San Antonio
For illustrative purposes, the table below estimates potential bond proceeds if the City were able toincrease or redirect a portion of HOT revenue
VII. FINANCING ALTERNATIVES
City of San AntonioHotel Tax
FY 2016 (B)Current Rate (City Portion) 7.00%
Sales Subject to Tax $908,600,000Tax Collections $63,600,000
Low Case Mid Case High CasePotential Tax Revenue
Increase/Redirect @: 0.25% $2,270,000 $2,270,000 $2,270,000Increase/Redirect @: 0.50% $4,540,000 $4,540,000 $4,540,000
Potential Bond Proceeds (Gross)Increase/Redirect @: 0.25% $36,200,000 $41,300,000 $47,400,000Increase/Redirect @: 0.50% $72,400,000 $82,500,000 $94,800,000
Potential Bond Proceeds (Net) - (1)Increase/Redirect @: 0.25% $32,400,000 $37,400,000 $43,400,000Increase/Redirect @: 0.50% $64,700,000 $74,700,000 $86,800,000
(1) Net of debt service reserve fund, cost of issuance, bond insurance, and capitalized interest fund.Source: City of San Antonio.

Page 178Preliminary Draft – Subject to Revision Confidential
Potential Financing Sources
Car Rental Tax – City of San Antonio
There is currently no car rental tax imposed by the City
The Airport imposes a Customer Facility Charge (CFC) of $5.00 per rental car day (as of July 1,2015) (in addition to other surcharges and sales tax)
CFC to increase to $5.50 on September 1, 2018
Revenue is directed to debt service of the consolidated rental car facility (CONRAC) at the SanAntonio International Airport
Legislative approval would be required to increase tax (confirm)
VII. FINANCING ALTERNATIVES

Page 179Preliminary Draft – Subject to Revision Confidential
Potential Financing Sources
Car Rental Tax – City of San Antonio (Sports and Community Venues)
For illustrative purposes, the table below estimates potential bond proceeds if the City were toimpose a car rental tax
VII. FINANCING ALTERNATIVES
City of San AntonioCar Rental (Sports and Community Venues)
FY 2014Current Rate (City Portion) 0.00%
Sales Subject to Tax - (2) $100,495,241
Low Case Mid Case High CasePotential Tax Revenue
Increase @: 2.50% $2,510,000 $2,510,000 $2,510,000Increase @: 5.00% $5,020,000 $5,020,000 $5,020,000
Potential Bond Proceeds (Gross)Increase @: 2.50% $40,000,000 $45,700,000 $52,500,000Increase @: 5.00% $80,000,000 $91,200,000 $104,800,000
Potential Bond Proceeds (Net) - (1)Increase @: 2.50% $35,700,000 $41,300,000 $48,000,000Increase @: 5.00% $71,500,000 $82,500,000 $95,900,000
(1) Net of debt service reserve fund, cost of issuance, bond insurance, and capitalized interest fund.(2) Reflects FY 2014 gross rental car sales at San Antonion International Airport.Source: 2015 CONRAC Official Statement.

Page 180Preliminary Draft – Subject to Revision Confidential
Potential Financing Sources
Parking Tax – City of San Antonio (Sports and Community Venues) City does not currently levy a tax on parking Sports and Community Venues legislation allows for a $3.00 / vehicle event parking tax Tax may be difficult to oversee / collect (privately owned lots) – additional research required Legislative approval would be required to impose tax For illustrative purposes, the table below estimates bond proceeds of stadium event parking tax
VII. FINANCING ALTERNATIVES
PROPOSED STADIUMParking Tax (Sports and Community Venues)
Year 1
Parking Tax $3.00
Turnstile Attendance 474,000Capture Rate 75%Attendees per Car 3.00Cars Parked 118,500
Parking Tax Revenue $355,500
Low Case Mid Case High CasePotential Parking Tax Revenue $360,000 $360,000 $360,000
Potential Bond Proceeds (Gross) $4,000,000 $4,500,000 $5,100,000
Potential Bond Proceeds (Net) - (1) $3,500,000 $4,000,000 $4,600,000
(1) Net of debt service reserve fund, cost of issuance, bond insurance, and capitalized interest fund.
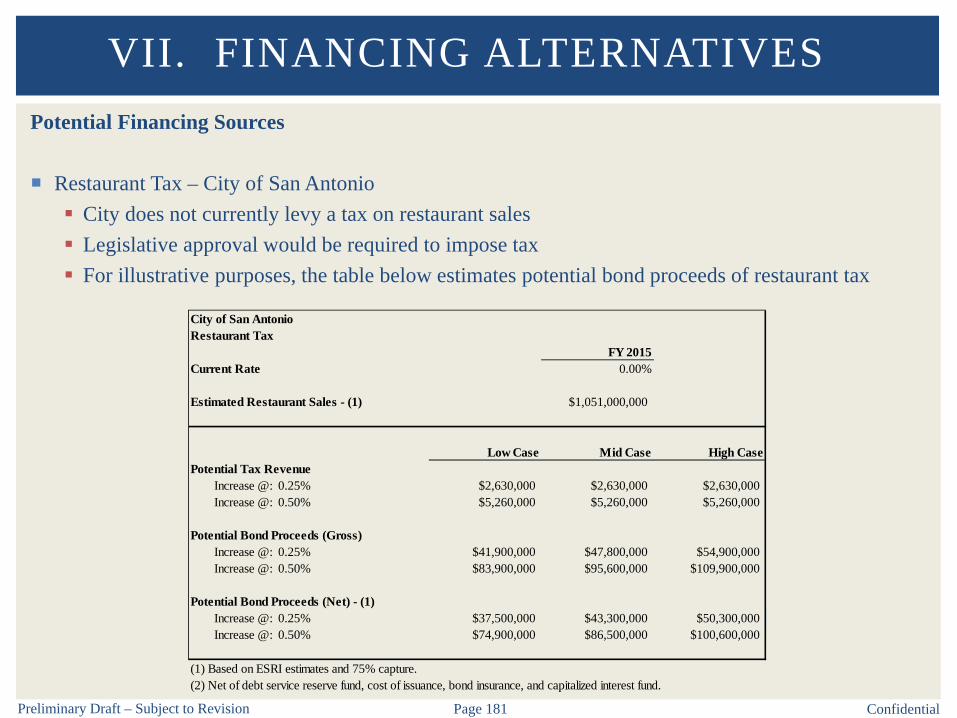
Page 181Preliminary Draft – Subject to Revision Confidential
Potential Financing Sources
Restaurant Tax – City of San Antonio City does not currently levy a tax on restaurant sales Legislative approval would be required to impose tax For illustrative purposes, the table below estimates potential bond proceeds of restaurant tax
VII. FINANCING ALTERNATIVES
City of San AntonioRestaurant Tax
FY 2015Current Rate 0.00%
Estimated Restaurant Sales - (1) $1,051,000,000
Low Case Mid Case High CasePotential Tax Revenue
Increase @: 0.25% $2,630,000 $2,630,000 $2,630,000Increase @: 0.50% $5,260,000 $5,260,000 $5,260,000
Potential Bond Proceeds (Gross)Increase @: 0.25% $41,900,000 $47,800,000 $54,900,000Increase @: 0.50% $83,900,000 $95,600,000 $109,900,000
Potential Bond Proceeds (Net) - (1)Increase @: 0.25% $37,500,000 $43,300,000 $50,300,000Increase @: 0.50% $74,900,000 $86,500,000 $100,600,000
(1) Based on ESRI estimates and 75% capture.(2) Net of debt service reserve fund, cost of issuance, bond insurance, and capitalized interest fund.

Page 182Preliminary Draft – Subject to Revision Confidential
Potential Financing Sources – Bexar County
BSG has estimated potential funding sources for Bexar County – we have not had conversations with theCounty as a potential partner (per City staff direction) – if the County were to participate
Illustrated herein is a summary of revenue streams
Hotel occupancy tax Car rental tax
It is important to note that selected revenue sources discussed herein may require public vote, legislativeapproval, and/or may require some form of additional credit enhancement, as well as additional research andconfirmation
Information contained herein has been obtained from sources believed to be reliable. Figures have not beenaudited or further verified. Figures provided are subject to accounting / reporting policies and interpretation.
Additional sources were considered but not included (e.g. sales tax, property tax, cigarette tax, beer and winetax, etc.)
Financial and political feasibility of potential public revenue streams to be further evaluated
VII. FINANCING ALTERNATIVES
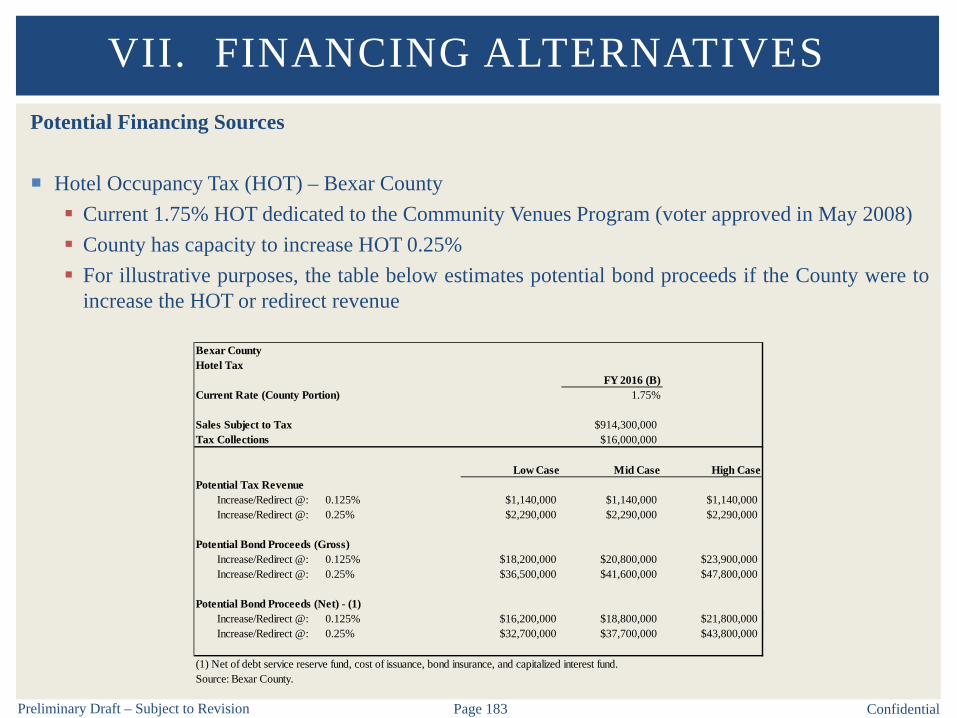
Page 183Preliminary Draft – Subject to Revision Confidential
Potential Financing Sources
Hotel Occupancy Tax (HOT) – Bexar County Current 1.75% HOT dedicated to the Community Venues Program (voter approved in May 2008) County has capacity to increase HOT 0.25% For illustrative purposes, the table below estimates potential bond proceeds if the County were to
increase the HOT or redirect revenue
VII. FINANCING ALTERNATIVES
Bexar CountyHotel Tax
FY 2016 (B)Current Rate (County Portion) 1.75%
Sales Subject to Tax $914,300,000Tax Collections $16,000,000
Low Case Mid Case High CasePotential Tax Revenue
Increase/Redirect @: 0.125% $1,140,000 $1,140,000 $1,140,000Increase/Redirect @: 0.25% $2,290,000 $2,290,000 $2,290,000
Potential Bond Proceeds (Gross)Increase/Redirect @: 0.125% $18,200,000 $20,800,000 $23,900,000Increase/Redirect @: 0.25% $36,500,000 $41,600,000 $47,800,000
Potential Bond Proceeds (Net) - (1)Increase/Redirect @: 0.125% $16,200,000 $18,800,000 $21,800,000Increase/Redirect @: 0.25% $32,700,000 $37,700,000 $43,800,000
(1) Net of debt service reserve fund, cost of issuance, bond insurance, and capitalized interest fund.Source: Bexar County.

Page 184Preliminary Draft – Subject to Revision Confidential
Potential Financing Sources
Car Rental Tax – Bexar County Current 5.00% car rental tax is dedicated to the Community Venues Program County is at maximum car rental tax For illustrative purposes, the table below estimates bond proceeds if County redirected revenue
VII. FINANCING ALTERNATIVES
Bexar CountyCar Rental Tax
FY 2016 (B)Current Rate 5.00%
Sales Subject to Tax $170,000,000Revenue Collections $8,500,000
Low Case Mid Case High CasePotential Tax Revenue
Redirect @: 1.00% $1,700,000 $1,700,000 $1,700,000Redirect @: 2.00% $3,400,000 $3,400,000 $3,400,000
Potential Bond Proceeds (Gross)Redirect @: 1.00% $27,100,000 $30,900,000 $35,500,000Redirect @: 2.00% $54,200,000 $61,800,000 $71,000,000
Potential Bond Proceeds (Net) - (1)Redirect @: 1.00% $24,200,000 $27,900,000 $32,500,000Redirect @: 2.00% $48,400,000 $55,900,000 $64,900,000
(1) Net of debt service reserve fund, cost of issuance, bond insurance, and capitalized interest fund.Source: Bexar County budget.

Page 185Preliminary Draft – Subject to Revision Confidential
Potential Financing Sources
Land sale / land lease
Current Wolff Stadium site redevelopment opportunity
City staff indicated Wolff Stadium land value would need to be estimated (value not available)
Other
At the time of this report, we are not aware of other potential parcels of land that could bemade available for sale – further research required
VII. FINANCING ALTERNATIVES

Page 186Preliminary Draft – Subject to Revision Confidential
Potential Financing Sources
List represents quantificationof potential sources –feasibility to be determined
Selected revenue sourcesdiscussed herein may requirepublic vote, legislativeapproval, and/or may requiresome form of additionalcredit enhancement, as wellas additional research andconfirmation (certain revenuesources are not eligible butare presented for illustrativepurposes – see discussionherein)
VII. FINANCING ALTERNATIVES
Estimates EstimatesAdmissions Surcharge/Facility Fee Parking Tax - City (Sports and Community Venues)
Rate Increase $1.25 Rate Increase $3.00Revenue $630,000 Revenue $360,000Gross Bond Proceeds $7,800,000 Gross Bond Proceeds $4,500,000Net Bond Proceeds $6,900,000 Net Bond Proceeds $4,000,000
Admissions Tax (Sports and Community Venues) Restaurant Tax - CityRate Increase 10.00% Rate Increase 0.25%Revenue $450,000 Revenue $2,630,000Gross Bond Proceeds $5,600,000 Gross Bond Proceeds $47,800,000Net Bond Proceeds $5,000,000 Net Bond Proceeds $43,300,000
Stadium Rent Hotel Occupancy Tax - County (Sports and Community Venues)Revenue $750,000 Rate Increase 0.25%Gross Bond Proceeds $9,300,000 Revenue $2,290,000Net Bond Proceeds $8,300,000 Gross Bond Proceeds $41,600,000
Hotel Occupancy Tax - City Net Bond Proceeds $37,700,000Rate Redirect 0.25% Car Rental Tax - CountyRevenue $2,270,000 Rate Redirect 1.00%Gross Bond Proceeds $41,300,000 Revenue $1,700,000Net Bond Proceeds $37,400,000 Gross Bond Proceeds $30,900,000
Car Rental Tax - City (Sports and Community Venues) Net Bond Proceeds $27,900,000Rate Increase 5.00%Revenue $5,020,000Gross Bond Proceeds $91,200,000Net Bond Proceeds $82,500,000
Notes: Reflects mid-case.
Presented for Illustrative Purposes Only
Team / City / County have not committed any funding source / amount

Page 187Preliminary Draft – Subject to Revision Confidential
Additional Funding Sources
Additional potential funding sources
Tax increment reinvestment zone (TIRZ) Sources from City and/or County (land / infrastructure / etc.) Wolff Stadium land (appraisal required)
Potential land sales / swaps Potential conduit financing (City and/or County) New Market Tax Credits Community Development Block Grants Enterprise Zone(s) Historic Tax Credits (likely not applicable)
Potential funding sources require additional research / confirmation
VII. FINANCING ALTERNATIVES

Page 188Preliminary Draft – Subject to Revision Confidential
Additional Funding Sources
Tax Increment Financing (TIF) / Tax Increment Reinvestment Zone (TIRZ)
Economic development initiative designed to promote redevelopment and private investment
Funding mechanism which captures incremental property tax revenue in defined redevelopmentarea
TIRZ captures all or part of the increased (incremental) tax revenue that may result from theredeveloped area
Only cities are permitted to initiate tax increment zones – counties / special districts / etc. canpotentially participate after process has started
City may also be able to capture sales tax increment (to be confirmed) – Tax Increment FinancingAct (Chapter 311.0123)
VII. FINANCING ALTERNATIVES

Page 189Preliminary Draft – Subject to Revision Confidential
Additional Funding Sources Tax Increment Financing (TIF) / Tax Increment Reinvestment Zone (TIRZ) City staff has indicated the ITC site (proposed Hemisfair TIRZ), Fox Tech South site (Westside
TIRZ), Fox Tech site (Houston Street TIRZ), Fox Tech North site (Houston Street TIRZ), andAlamodome site (Inner City TIRZ) are in current or proposed TIRZ
Funding source to be further evaluated Calculation below to be confirmed pending further discussion with City staff Tax rates and participation rates to be confirmed If selected site is in an already designated TIRZ, incremental revenue may be committed
VII. FINANCING ALTERNATIVES
TIRZ Illustration
Incremental Property Value $50,000,000 $100,000,000 $250,000,000
Participating Entities Rate per $100City of San Antonio 0.558270$ $279,135 $558,270 $1,395,675Bexar County 0.244737$ $122,369 $244,737 $611,843Other TBD NA NA NA
Annual TIRZ Revenue $401,504 $803,007 $2,007,518
Potential Bond Proceeds Per Increase (Gross) $6,300,000 $12,700,000 $31,700,000
Potential Bond Proceeds Per Increase (Net) - (1) $5,700,000 $11,400,000 $28,500,000(1) Net of debt service reserve fund, cost of issuance, bond insurance, and capitalized interest fund.

Page 190Preliminary Draft – Subject to Revision Confidential
Additional Funding Sources
Private sources
Team direct investment
Corporate support Naming rights partner (must consider impact on team / stadium cash flow) Premium seating (must consider impact on team / stadium cash flow) Advertising / sponsorships (must consider impact on team / stadium cash flow)
Third party vendors upfront investment Concessionaire / pouring rights partners (must consider impact on team / stadium cash flow)
Donations / contributions Individuals Corporations Community foundations
Personal seat licenses (insufficient demand)
Other
VII. FINANCING ALTERNATIVES

APPENDIX A: MARKET DEMOGRAPHICS

Page 192Preliminary Draft – Subject to Revision Confidential
20-Mile Ring DesignationPopulation and Households
APPENDIX A: MARKET DEMOGRAPHICS
Team
2016 Population
(000s) Rank
2021 Population
(000s) Rank
Est. % Growth
2016-2021 Rank
2016 Households
(000s) Rank
2021 Households
(000s) Rank
Est. % Growth
2016-2021 RankLas Vegas 51s 2,056.0 1 2,189.0 1 6.47% 9 747.4 1 795.3 1 6.40% 10San Antonio Triple-A Team 1,955.7 2 2,111.6 2 7.97% 4 698.1 2 757.0 2 8.43% 3Sacramento River Cats 1,762.8 3 1,849.8 3 4.93% 17 637.6 3 669.0 3 4.93% 18Gwinnett Braves 1,710.2 4 1,847.8 4 8.05% 3 583.6 7 629.0 7 7.78% 5Charlotte Knights 1,585.5 5 1,720.1 5 8.49% 2 608.3 5 659.7 4 8.45% 2Indianapolis Indians 1,558.1 6 1,633.7 6 4.85% 18 604.5 6 633.0 6 4.72% 19Columbus Clippers 1,542.8 7 1,623.0 7 5.20% 14 614.6 4 646.8 5 5.25% 16Tacoma Rainiers 1,433.1 8 1,518.1 8 5.94% 12 537.5 9 569.8 8 6.01% 13Pawtucket Red Sox 1,423.2 9 1,444.1 9 1.47% 25 552.8 8 562.1 9 1.69% 27Norfolk Tides 1,347.0 10 1,394.3 10 3.51% 21 508.0 10 528.6 10 4.06% 21Salt Lake Bees 1,268.2 11 1,347.0 11 6.21% 11 422.3 16 450.4 15 6.67% 9Round Rock Express 1,199.0 12 1,317.8 12 9.91% 1 461.8 11 509.0 11 10.23% 1Oklahoma City Dodgers 1,150.3 13 1,224.4 13 6.44% 10 452.8 12 481.7 12 6.40% 11Nashville Sounds 1,090.1 14 1,166.1 14 6.97% 6 432.7 14 463.4 13 7.09% 7Louisville Bats 1,083.9 15 1,117.4 15 3.09% 22 442.4 13 456.5 14 3.19% 22Memphis Redbirds 1,057.7 16 1,077.1 17 1.84% 24 400.9 18 409.0 18 2.01% 24Durham Bulls 1,017.0 17 1,093.9 16 7.56% 5 408.8 17 441.3 16 7.93% 4Buffalo Bisons 1,013.1 18 1,023.0 18 0.97% 28 431.8 15 439.5 17 1.79% 26New Orleans Zephyrs 965.3 19 1,007.9 19 4.42% 20 387.2 19 407.7 19 5.29% 15Fresno Grizzlies 869.8 20 911.7 21 4.82% 19 274.1 25 286.8 25 4.62% 20El Paso Chihuahuas 864.6 21 912.4 20 5.52% 13 282.0 24 299.3 24 6.13% 12Lehigh Valley IronPigs 849.0 22 860.4 23 1.35% 26 323.2 23 327.5 23 1.33% 28Omaha Storm Chasers 836.4 23 878.6 22 5.04% 16 323.7 22 340.6 21 5.22% 17Rochester Red Wings 827.3 24 837.4 25 1.21% 27 337.3 20 344.0 20 1.96% 25Albuquerque Isotopes 822.6 25 839.6 24 2.06% 23 327.0 21 334.7 22 2.35% 23Colorado Springs Sky Sox 677.6 26 723.9 26 6.84% 7 260.2 26 279.9 26 7.56% 6Toledo Mud Hens 632.8 27 630.9 27 -0.30% 30 255.7 27 256.0 27 0.13% 30Iowa Cubs 577.8 28 616.6 28 6.72% 8 226.0 28 241.2 28 6.75% 8Syracuse Chiefs 529.4 29 533.3 29 0.75% 29 213.9 29 216.6 29 1.27% 29Scranton/Wilkes-Barre RailRiders 470.7 30 467.5 30 -0.69% 31 192.8 30 191.6 30 -0.60% 31Reno Aces 442.3 31 465.3 31 5.20% 15 171.1 31 180.2 31 5.32% 14
Average (Ex. San Antonio) 1,088.8 1,142.4 4.49% 414.1 435.0 4.73%Source: Nielsen 2016.

Page 193Preliminary Draft – Subject to Revision Confidential
20-Mile Ring DesignationIncome
APPENDIX A: MARKET DEMOGRAPHICS
Team
Average Household
Income Rank
Median Household
Income Rank
HHs w/ Income
$100,000+ (000s) Rank
Durham Bulls $96,456 1 $67,760 2 135.2 11Round Rock Express $92,205 2 $67,702 3 146.9 7Salt Lake Bees $88,395 3 $68,534 1 126.5 12Gwinnett Braves $88,086 4 $65,419 4 175.2 1Charlotte Knights $84,645 5 $59,836 10 166.3 2Iowa Cubs $83,418 6 $64,818 5 63.5 24Pawtucket Red Sox $82,028 7 $61,191 9 157.2 5Nashville Sounds $81,480 8 $57,535 14 107.1 14Columbus Clippers $80,223 9 $59,428 11 164.0 3Lehigh Valley IronPigs $79,119 10 $61,496 7 84.9 18Colorado Springs Sky Sox $79,079 11 $61,351 8 67.8 23Tacoma Rainiers $77,351 12 $61,580 6 138.2 9Omaha Storm Chasers $76,801 13 $58,733 12 78.6 20Sacramento River Cats $76,332 14 $56,863 15 159.4 4Syracuse Chiefs $74,244 15 $56,425 16 50.5 27Norfolk Tides $74,115 16 $57,874 13 118.3 13Reno Aces $74,095 17 $55,250 18 40.2 30Indianapolis Indians $73,910 18 $53,946 19 136.8 10Rochester Red Wings $73,910 18 $55,784 17 79.2 19Oklahoma City Dodgers $72,561 20 $53,592 20 99.0 15Louisville Bats $71,887 21 $52,971 21 95.5 16San Antonio Triple-A Team $70,319 22 $52,293 22 147.0 6Buffalo Bisons $68,635 23 $51,979 23 90.9 17Las Vegas 51s $67,100 24 $51,471 24 140.1 8Albuquerque Isotopes $66,397 25 $49,540 25 63.1 25Memphis Redbirds $66,245 26 $47,056 27 76.3 21New Orleans Zephyrs $65,573 27 $44,596 30 74.0 22Fresno Grizzlies $65,514 28 $46,720 28 52.1 26Scranton/Wilkes-Barre RailRiders $63,103 29 $47,173 26 33.8 31Toledo Mud Hens $62,998 30 $46,626 29 45.7 28El Paso Chihuahuas $57,589 31 $42,061 31 41.2 29
Average (Ex. San Antonio) $75,450 $56,177 100.2Source: Nielsen 2016.

Page 194Preliminary Draft – Subject to Revision Confidential
20-Mile Ring DesignationAge
APPENDIX A: MARKET DEMOGRAPHICS
TeamAverage
Age RankMedian
Age RankSalt Lake Bees 34.5 1 32.4 3El Paso Chihuahuas 34.8 2 32.1 1Fresno Grizzlies 34.9 3 32.1 1Round Rock Express 35.6 4 34.4 5San Antonio Triple-A Team 36.0 5 34.0 4Gwinnett Braves 36.1 6 36.1 15Colorado Springs Sky Sox 36.6 7 34.6 6Omaha Storm Chasers 36.6 7 35.1 9Memphis Redbirds 36.8 9 35.3 10Oklahoma City Dodgers 36.8 9 34.8 7Columbus Clippers 36.8 9 35.3 10Iowa Cubs 36.9 12 35.8 13Indianapolis Indians 36.9 12 35.9 14Charlotte Knights 36.9 12 36.4 17Norfolk Tides 37.2 15 35.0 8Durham Bulls 37.4 16 36.3 16Sacramento River Cats 37.4 16 35.7 12Nashville Sounds 37.6 18 36.5 18Las Vegas 51s 37.8 19 37.0 20Tacoma Rainiers 37.9 20 36.9 19Albuquerque Isotopes 38.6 21 37.5 21New Orleans Zephyrs 38.7 22 37.5 21Reno Aces 39.0 23 38.2 23Louisville Bats 39.3 24 39.0 25Toledo Mud Hens 39.3 24 38.3 24Rochester Red Wings 39.9 26 39.3 26Syracuse Chiefs 40.0 27 39.6 27Pawtucket Red Sox 40.2 28 40.3 28Lehigh Valley IronPigs 40.8 29 41.1 30Buffalo Bisons 41.0 30 40.7 29Scranton/Wilkes-Barre RailRiders 42.5 31 43.2 31
Average (Ex. San Antonio) 37.8 36.7Source: Nielsen 2016.
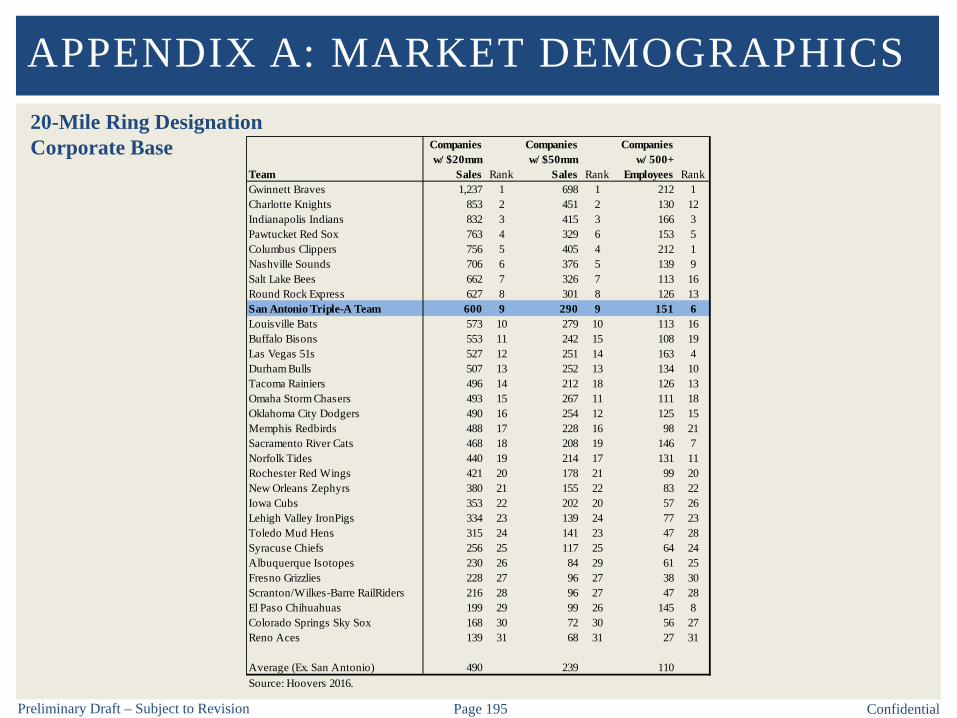
Page 195Preliminary Draft – Subject to Revision Confidential
20-Mile Ring DesignationCorporate Base
APPENDIX A: MARKET DEMOGRAPHICS
Team
Companies w/ $20mm
Sales Rank
Companies w/ $50mm
Sales Rank
Companies w/ 500+
Employees RankGwinnett Braves 1,237 1 698 1 212 1Charlotte Knights 853 2 451 2 130 12Indianapolis Indians 832 3 415 3 166 3Pawtucket Red Sox 763 4 329 6 153 5Columbus Clippers 756 5 405 4 212 1Nashville Sounds 706 6 376 5 139 9Salt Lake Bees 662 7 326 7 113 16Round Rock Express 627 8 301 8 126 13San Antonio Triple-A Team 600 9 290 9 151 6Louisville Bats 573 10 279 10 113 16Buffalo Bisons 553 11 242 15 108 19Las Vegas 51s 527 12 251 14 163 4Durham Bulls 507 13 252 13 134 10Tacoma Rainiers 496 14 212 18 126 13Omaha Storm Chasers 493 15 267 11 111 18Oklahoma City Dodgers 490 16 254 12 125 15Memphis Redbirds 488 17 228 16 98 21Sacramento River Cats 468 18 208 19 146 7Norfolk Tides 440 19 214 17 131 11Rochester Red Wings 421 20 178 21 99 20New Orleans Zephyrs 380 21 155 22 83 22Iowa Cubs 353 22 202 20 57 26Lehigh Valley IronPigs 334 23 139 24 77 23Toledo Mud Hens 315 24 141 23 47 28Syracuse Chiefs 256 25 117 25 64 24Albuquerque Isotopes 230 26 84 29 61 25Fresno Grizzlies 228 27 96 27 38 30Scranton/Wilkes-Barre RailRiders 216 28 96 27 47 28El Paso Chihuahuas 199 29 99 26 145 8Colorado Springs Sky Sox 168 30 72 30 56 27Reno Aces 139 31 68 31 27 31
Average (Ex. San Antonio) 490 239 110Source: Hoovers 2016.

Page 196Preliminary Draft – Subject to Revision Confidential
30-Mile Ring DesignationPopulation and Households
APPENDIX A: MARKET DEMOGRAPHICS
Team
2016 Population
(000s) Rank
2021 Population
(000s) Rank
Est. % Growth
2016-2021 Rank
2016 Households
(000s) Rank
2021 Households
(000s) Rank
Est. % Growth
2016-2021 RankGwinnett Braves 3,210.0 1 3,434.6 1 7.00% 6 1,198.3 1 1,285.3 1 7.26% 7Tacoma Rainiers 2,630.0 2 2,793.9 2 6.23% 12 1,045.8 2 1,114.5 2 6.57% 9Pawtucket Red Sox 2,601.4 3 2,656.6 3 2.12% 24 996.8 3 1,020.1 3 2.34% 23Sacramento River Cats 2,191.5 4 2,307.4 6 5.29% 14 788.9 5 830.4 6 5.27% 14San Antonio Triple-A Team 2,183.2 5 2,361.1 4 8.15% 2 779.7 6 846.8 5 8.60% 2Charlotte Knights 2,145.5 6 2,308.9 5 7.62% 4 820.1 4 882.7 4 7.63% 4Las Vegas 51s 2,072.7 7 2,206.3 7 6.44% 9 754.3 7 802.4 7 6.37% 12Columbus Clippers 1,824.7 8 1,911.7 9 4.77% 15 719.8 8 755.0 8 4.89% 17Indianapolis Indians 1,823.8 9 1,908.3 10 4.63% 17 703.9 9 736.1 9 4.57% 19Salt Lake Bees 1,805.1 10 1,931.3 8 6.99% 7 577.3 14 618.8 12 7.20% 8Round Rock Express 1,729.9 11 1,900.9 11 9.89% 1 667.4 10 735.4 10 10.19% 1Durham Bulls 1,657.0 12 1,784.6 12 7.70% 3 646.2 11 697.2 11 7.89% 3Lehigh Valley IronPigs 1,564.9 13 1,585.8 14 1.34% 26 592.9 12 600.9 15 1.34% 28Norfolk Tides 1,560.0 14 1,613.3 13 3.42% 21 589.4 13 612.4 13 3.92% 21Nashville Sounds 1,465.9 15 1,571.9 15 7.24% 5 570.3 15 611.9 14 7.30% 6Oklahoma City Dodgers 1,287.8 16 1,369.7 16 6.36% 10 503.9 16 536.1 16 6.38% 11Louisville Bats 1,249.2 17 1,288.5 17 3.15% 22 501.7 17 518.0 17 3.25% 22Memphis Redbirds 1,232.8 18 1,260.2 18 2.22% 23 462.1 19 472.6 19 2.27% 24Buffalo Bisons 1,152.4 19 1,161.7 20 0.80% 28 488.0 18 496.1 18 1.65% 27Fresno Grizzlies 1,144.3 20 1,196.3 19 4.54% 18 352.8 23 368.0 23 4.31% 20New Orleans Zephyrs 1,063.8 21 1,109.1 21 4.25% 20 424.4 20 446.2 20 5.14% 15Rochester Red Wings 980.7 22 990.9 22 1.04% 27 398.4 21 405.6 21 1.80% 26Omaha Storm Chasers 921.1 23 965.0 23 4.76% 16 356.7 22 374.4 22 4.96% 16El Paso Chihuahuas 909.3 24 959.1 24 5.47% 13 294.7 26 312.6 26 6.06% 13Albuquerque Isotopes 882.4 25 899.4 25 1.92% 25 348.9 24 356.8 24 2.27% 25Toledo Mud Hens 792.0 26 789.4 26 -0.33% 30 317.6 25 318.0 25 0.14% 30Colorado Springs Sky Sox 709.5 27 757.5 27 6.76% 8 273.1 28 293.5 27 7.49% 5Syracuse Chiefs 698.1 28 700.6 28 0.35% 29 281.2 27 283.9 28 0.99% 29Iowa Cubs 654.8 29 696.4 29 6.35% 11 256.4 30 272.9 29 6.44% 10Scranton/Wilkes-Barre RailRiders 642.6 30 638.4 30 -0.65% 31 259.5 29 258.1 30 -0.54% 31Reno Aces 554.6 31 579.6 31 4.52% 19 216.0 31 226.2 31 4.71% 18
Average (Ex. San Antonio) 1,438.6 1,509.2 4.41% 546.9 574.7 4.67%Source: Nielsen 2016.

Page 197Preliminary Draft – Subject to Revision Confidential
30-Mile Ring DesignationIncome
APPENDIX A: MARKET DEMOGRAPHICS
Team
Average Household
Income Rank
Median Household
Income Rank
HHs w/ Income
$100,000+ (000s) Rank
Round Rock Express $91,441 1 $66,671 2 208.2 5Gwinnett Braves $89,850 2 $63,480 7 355.2 1Pawtucket Red Sox $88,896 3 $66,019 4 315.7 2Salt Lake Bees $88,547 4 $69,984 1 175.7 10Durham Bulls $87,445 5 $63,408 8 188.8 8Tacoma Rainiers $86,594 6 $65,538 5 309.5 3Lehigh Valley IronPigs $86,089 7 $66,169 3 178.2 9Iowa Cubs $82,238 8 $64,174 6 70.4 24Sacramento River Cats $81,835 9 $61,354 10 220.4 4Nashville Sounds $80,255 10 $58,804 13 140.5 14Charlotte Knights $80,183 11 $57,204 15 207.5 6Colorado Springs Sky Sox $79,513 12 $61,730 9 71.9 23Columbus Clippers $79,255 13 $59,341 11 189.3 7Omaha Storm Chasers $77,030 14 $59,231 12 87.4 21Norfolk Tides $74,637 15 $58,645 14 139.5 15Indianapolis Indians $73,616 16 $54,594 19 158.6 12Reno Aces $73,550 17 $54,961 17 49.8 29Rochester Red Wings $72,723 18 $55,493 16 90.7 20San Antonio Triple-A Team $72,547 19 $54,080 20 174.9 11Oklahoma City Dodgers $72,223 20 $53,785 21 109.7 16Syracuse Chiefs $72,022 21 $54,897 18 63.0 27Louisville Bats $71,631 22 $53,416 22 107.8 17Memphis Redbirds $69,388 23 $49,752 25 96.8 19Buffalo Bisons $68,587 24 $52,437 23 102.1 18New Orleans Zephyrs $67,601 25 $45,955 30 85.0 22Las Vegas 51s $67,172 26 $51,513 24 141.8 13Albuquerque Isotopes $66,089 27 $49,390 26 66.9 25Fresno Grizzlies $64,404 28 $46,393 29 64.2 26Scranton/Wilkes-Barre RailRiders $64,053 29 $48,962 27 46.4 30Toledo Mud Hens $63,489 30 $47,875 28 57.4 28El Paso Chihuahuas $56,896 31 $41,482 31 42.0 31
Average (Ex. San Antonio) $75,908 $56,755 138.0Source: Nielsen 2016.
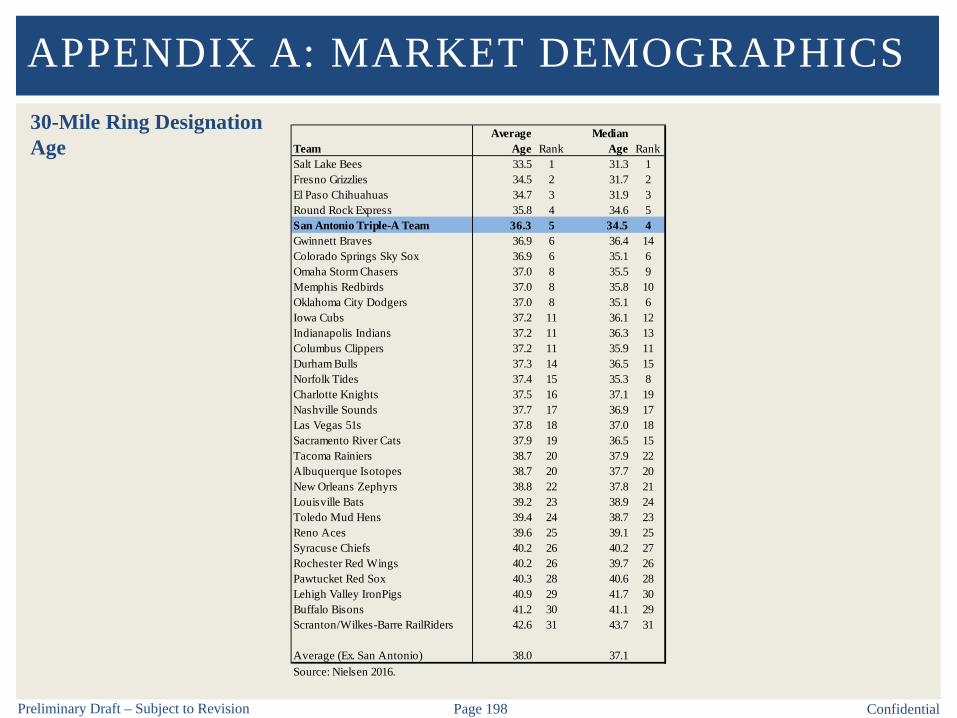
Page 198Preliminary Draft – Subject to Revision Confidential
30-Mile Ring DesignationAge
APPENDIX A: MARKET DEMOGRAPHICS
TeamAverage
Age RankMedian
Age RankSalt Lake Bees 33.5 1 31.3 1Fresno Grizzlies 34.5 2 31.7 2El Paso Chihuahuas 34.7 3 31.9 3Round Rock Express 35.8 4 34.6 5San Antonio Triple-A Team 36.3 5 34.5 4Gwinnett Braves 36.9 6 36.4 14Colorado Springs Sky Sox 36.9 6 35.1 6Omaha Storm Chasers 37.0 8 35.5 9Memphis Redbirds 37.0 8 35.8 10Oklahoma City Dodgers 37.0 8 35.1 6Iowa Cubs 37.2 11 36.1 12Indianapolis Indians 37.2 11 36.3 13Columbus Clippers 37.2 11 35.9 11Durham Bulls 37.3 14 36.5 15Norfolk Tides 37.4 15 35.3 8Charlotte Knights 37.5 16 37.1 19Nashville Sounds 37.7 17 36.9 17Las Vegas 51s 37.8 18 37.0 18Sacramento River Cats 37.9 19 36.5 15Tacoma Rainiers 38.7 20 37.9 22Albuquerque Isotopes 38.7 20 37.7 20New Orleans Zephyrs 38.8 22 37.8 21Louisville Bats 39.2 23 38.9 24Toledo Mud Hens 39.4 24 38.7 23Reno Aces 39.6 25 39.1 25Syracuse Chiefs 40.2 26 40.2 27Rochester Red Wings 40.2 26 39.7 26Pawtucket Red Sox 40.3 28 40.6 28Lehigh Valley IronPigs 40.9 29 41.7 30Buffalo Bisons 41.2 30 41.1 29Scranton/Wilkes-Barre RailRiders 42.6 31 43.7 31
Average (Ex. San Antonio) 38.0 37.1Source: Nielsen 2016.

Page 199Preliminary Draft – Subject to Revision Confidential
30-Mile Ring DesignationCorporate Base
APPENDIX A: MARKET DEMOGRAPHICS
Team
Companies w/ $20mm
Sales Rank
Companies w/ $50mm
Sales Rank
Companies w/ 500+
Employees RankGwinnett Braves 2,257 1 1,270 1 410 1Pawtucket Red Sox 1,527 2 680 2 316 2Tacoma Rainiers 1,262 3 598 3 304 3Charlotte Knights 983 4 506 4 149 11Indianapolis Indians 913 5 452 5 181 5Columbus Clippers 842 6 443 6 232 4Nashville Sounds 815 7 426 7 166 7Salt Lake Bees 802 8 388 8 142 15Lehigh Valley IronPigs 791 9 348 9 147 13Round Rock Express 687 10 325 10 136 16San Antonio Triple-A Team 655 11 314 11 159 9Buffalo Bisons 631 12 279 15 129 17Louisville Bats 627 13 300 12 122 19Durham Bulls 600 14 299 13 153 10Sacramento River Cats 587 15 254 17 170 6Omaha Storm Chasers 549 16 287 14 122 19Memphis Redbirds 530 17 248 19 112 21Las Vegas 51s 527 18 251 18 163 8Oklahoma City Dodgers 526 19 262 16 128 18Norfolk Tides 477 20 226 20 148 12New Orleans Zephyrs 473 21 200 22 102 23Rochester Red Wings 465 22 195 23 109 22Toledo Mud Hens 393 23 178 24 56 29Iowa Cubs 389 24 216 21 65 25Syracuse Chiefs 304 25 134 25 81 24Scranton/Wilkes-Barre RailRiders 282 26 118 27 61 26Fresno Grizzlies 281 27 119 26 54 30Albuquerque Isotopes 236 28 85 29 61 26El Paso Chihuahuas 199 29 99 28 145 14Colorado Springs Sky Sox 173 30 73 31 57 28Reno Aces 170 31 75 30 39 31
Average (Ex. San Antonio) 643 311 142Source: Hoovers 2016.

Page 200Preliminary Draft – Subject to Revision Confidential
30-Minute Drive Time DesignationPopulation and Households
APPENDIX A: MARKET DEMOGRAPHICS
Team
2016 Population
(000s) Rank
2021 Population
(000s) Rank
Est. % Growth
2016-2021 Rank
2016 Households
(000s) Rank
2021 Households
(000s) Rank
Est. % Growth
2016-2021 RankGwinnett Braves 2,185.2 1 2,348.3 1 7.47% 5 800.0 1 860.6 1 7.57% 6Las Vegas 51s 2,037.7 2 2,167.4 2 6.36% 11 740.5 2 787.2 2 6.30% 11San Antonio Triple-A Team 2,006.4 3 2,166.7 3 7.99% 3 717.7 3 778.5 3 8.47% 2Sacramento River Cats 1,863.4 4 1,954.6 4 4.90% 17 676.5 4 709.9 5 4.93% 18Charlotte Knights 1,707.3 5 1,846.8 5 8.17% 2 659.2 5 713.1 4 8.18% 3Pawtucket Red Sox 1,632.0 6 1,658.7 7 1.64% 25 633.2 7 644.9 7 1.85% 26Columbus Clippers 1,592.8 7 1,674.3 6 5.12% 16 633.5 6 666.4 6 5.19% 17Salt Lake Bees 1,544.8 8 1,647.1 8 6.62% 9 502.3 10 537.2 10 6.95% 8Indianapolis Indians 1,524.7 9 1,592.5 9 4.45% 19 595.9 8 622.0 8 4.38% 20Tacoma Rainiers 1,452.8 10 1,538.4 10 5.89% 12 550.3 9 583.3 9 5.99% 13Norfolk Tides 1,289.0 11 1,333.7 12 3.47% 21 488.3 11 508.2 12 4.06% 21Round Rock Express 1,239.5 12 1,358.7 11 9.62% 1 487.9 12 536.9 11 10.03% 1Nashville Sounds 1,154.5 13 1,236.8 13 7.13% 6 455.4 13 488.1 13 7.19% 7Oklahoma City Dodgers 1,147.5 14 1,220.6 14 6.38% 10 453.5 15 482.5 14 6.40% 10Louisville Bats 1,120.5 15 1,155.5 15 3.12% 22 454.9 14 469.5 15 3.22% 22Memphis Redbirds 1,105.0 16 1,128.7 16 2.15% 23 416.5 18 425.8 18 2.23% 24Durham Bulls 1,046.3 17 1,125.3 17 7.55% 4 419.2 17 452.8 17 8.00% 4Buffalo Bisons 1,045.0 18 1,054.7 18 0.92% 28 446.1 16 453.9 16 1.75% 27New Orleans Zephyrs 971.9 19 1,014.3 19 4.37% 20 389.7 19 410.2 19 5.26% 16Fresno Grizzlies 941.7 20 987.0 20 4.81% 18 292.1 24 305.6 24 4.61% 19Rochester Red Wings 844.7 21 855.0 23 1.21% 27 344.9 20 351.7 20 1.96% 25El Paso Chihuahuas 837.4 22 882.3 21 5.36% 13 274.6 25 291.1 25 6.00% 12Omaha Storm Chasers 816.6 23 858.4 22 5.12% 15 316.1 22 332.9 21 5.30% 15Albuquerque Isotopes 812.3 24 828.0 24 1.93% 24 323.8 21 331.1 22 2.25% 23Lehigh Valley IronPigs 812.2 25 824.0 25 1.46% 26 309.5 23 313.8 23 1.40% 28Toledo Mud Hens 671.0 26 669.4 27 -0.23% 30 271.6 26 272.1 26 0.19% 30Colorado Springs Sky Sox 653.9 27 699.0 26 6.90% 7 251.3 27 270.4 27 7.62% 5Iowa Cubs 587.1 28 626.4 28 6.69% 8 229.7 28 245.1 28 6.74% 9Syracuse Chiefs 540.1 29 543.9 29 0.70% 29 218.9 29 221.7 29 1.27% 29Scranton/Wilkes-Barre RailRiders 450.9 30 447.1 31 -0.85% 31 186.8 30 185.4 30 -0.75% 31Reno Aces 432.3 31 454.7 30 5.19% 14 167.2 31 176.1 31 5.30% 14
Average (Ex. San Antonio) 1,135.3 1,191.0 4.45% 433.0 455.0 4.71%Source: Nielsen 2016.

Page 201Preliminary Draft – Subject to Revision Confidential
30-Minute Drive Time DesignationIncome
APPENDIX A: MARKET DEMOGRAPHICS
Team
Average Household
Income Rank
Median Household
Income Rank
HHs w/ Income
$100,000+ (000s) Rank
Durham Bulls $93,520 1 $65,785 2 133.0 11Gwinnett Braves $88,894 2 $63,244 6 235.9 1Salt Lake Bees $87,852 3 $69,165 1 150.8 7Round Rock Express $85,522 4 $63,327 5 141.2 8Pawtucket Red Sox $85,505 5 $63,466 4 190.1 2Iowa Cubs $83,175 6 $64,627 3 64.2 24Charlotte Knights $82,077 7 $57,748 12 172.4 3Nashville Sounds $80,505 8 $57,639 13 111.2 14Columbus Clippers $80,009 9 $59,363 10 168.4 5Lehigh Valley IronPigs $78,766 10 $60,967 8 80.5 19Colorado Springs Sky Sox $78,678 11 $61,000 7 64.8 23Sacramento River Cats $77,070 12 $57,481 15 171.0 4Omaha Storm Chasers $76,440 13 $58,446 11 76.1 21Tacoma Rainiers $75,348 14 $59,994 9 134.4 10Norfolk Tides $73,728 15 $57,516 14 112.1 13Reno Aces $73,653 16 $54,655 18 39.0 30Rochester Red Wings $73,524 17 $55,548 16 80.2 20Syracuse Chiefs $72,512 18 $55,145 17 49.9 27Louisville Bats $71,636 19 $52,759 19 97.4 15Oklahoma City Dodgers $71,412 20 $52,710 20 96.5 16Indianapolis Indians $71,380 21 $52,011 22 126.0 12San Antonio Triple-A Team $70,463 22 $52,292 21 152.0 6Buffalo Bisons $68,480 23 $51,853 23 93.3 17Memphis Redbirds $67,908 24 $48,166 26 83.5 18Las Vegas 51s $66,775 25 $51,136 24 137.3 9Albuquerque Isotopes $66,207 26 $49,291 25 62.2 25New Orleans Zephyrs $65,435 27 $44,606 30 74.1 22Fresno Grizzlies $64,379 28 $45,946 29 53.5 26Toledo Mud Hens $62,907 29 $46,607 28 48.4 28Scranton/Wilkes-Barre RailRiders $62,890 30 $46,898 27 32.6 31El Paso Chihuahuas $57,773 31 $42,158 31 40.4 29
Average (Ex. San Antonio) $74,799 $55,642 104.0Source: Nielsen 2016.

Page 202Preliminary Draft – Subject to Revision Confidential
30-Minute Drive Time DesignationAge
APPENDIX A: MARKET DEMOGRAPHICS
TeamAverage
Age RankMedian
Age RankSalt Lake Bees 33.7 1 31.6 1Fresno Grizzlies 34.6 2 31.7 2El Paso Chihuahuas 34.9 3 32.2 3Round Rock Express 35.3 4 33.8 4San Antonio Triple-A Team 36.1 5 34.1 5Gwinnett Braves 36.3 6 35.9 14Colorado Springs Sky Sox 36.4 7 34.4 6Omaha Storm Chasers 36.5 8 34.9 8Memphis Redbirds 36.8 9 35.4 10Oklahoma City Dodgers 36.8 9 34.7 7Columbus Clippers 36.8 9 35.5 11Iowa Cubs 36.9 12 35.8 13Charlotte Knights 37.0 13 36.4 17Norfolk Tides 37.1 14 34.9 8Durham Bulls 37.1 14 35.7 12Indianapolis Indians 37.2 16 36.1 16Nashville Sounds 37.5 17 36.4 17Sacramento River Cats 37.6 18 35.9 14Las Vegas 51s 37.7 19 36.9 20Tacoma Rainiers 37.7 19 36.5 19Albuquerque Isotopes 38.7 21 37.6 22New Orleans Zephyrs 38.7 21 37.5 21Reno Aces 38.9 23 38.0 23Louisville Bats 39.2 24 38.9 25Toledo Mud Hens 39.3 25 38.2 24Rochester Red Wings 39.9 26 39.3 26Syracuse Chiefs 40.0 27 39.5 27Pawtucket Red Sox 40.4 28 40.6 28Lehigh Valley IronPigs 40.7 29 40.9 30Buffalo Bisons 41.1 30 40.8 29Scranton/Wilkes-Barre RailRiders 42.5 31 43.1 31
Average (Ex. San Antonio) 37.8 36.6Source: Nielsen 2016.
APPENDIX B: BRAILSFORD &
DUNLAVEY REPORT REVIEW

Page 204Preliminary Draft – Subject to Revision Confidential
Observations
BSG has reviewed the Brailsford and Dunlavey reports provided regarding minor league baseball
We have made the following notable observations
B&D has assumed a development cost of approximately $74 million Does not include land acquisition and off-site infrastructure / parking
B&D’s public / private stadium funding chart includes capitalization of annual lease payment inteam funding
Drive time was used as the only market designation – BSG utilizes CBSA, CSA, and geographicring data as well Demographics are generally directionally consistent – large population and low income levels
relative to Triple-A markets
Attendance figures were not included for 2014 and 2015 seasons
Building program is generally consistent with BSG preliminary recommendations – B&D slightlyhigher capacity
APPENDIX B: B&D REPORT REVIEW

Page 205Preliminary Draft – Subject to Revision Confidential
Brailsford & Dunlavey Report – Observations (Continued)
Although BSG did not complete a site selection study, the City asked that BSG provide some generalobservations regarding potential stadium sites
Proposed stadium could serve as a potential catalyst for downtown redevelopment – core downtown stadiumsoften can have significant impact on surrounding development
Downtown sites benefit from proximity to corporate base, existing parking inventory, and other criticalinfrastructure
Increased activity from baseball fans and other stadium users positively impact local restaurants, bars, etc.
Proposed stadium would result in a long-term commitment from MiLB and increased level of play (Double-A to Triple-A)
Proposed project would result in quality of life benefits
Potential to improve entertainment alternatives in market MiLB provides an affordable form of family entertainment
Fox Tech South, Fox Tech (assuming site can accommodate stadium), and Fox Tech North sites could havesignificant impact on activity in downtown and ongoing redevelopment / revitalization efforts
APPENDIX B: B&D REPORT REVIEW

Page 206Preliminary Draft – Subject to Revision Confidential
Observations (Continued)
BSG completed a limited review of B&D revenue and expense assumptions – cash flow statement notcompleted
In general, total operating revenues may be slightly conservative to reasonable Average ticket price ($8.00) – slightly conservative Concessions per cap ($9.50) – reasonable Novelties per cap ($2.00) – reasonable to slightly aggressive Advertising / sponsorship ($2.25 million gross) – reasonable Naming rights ($400,000 gross) – conservative Premium seating inventory Luxury suites – reasonable Loge boxes – aggressive Club seats – reasonable
Premium seating pricing Luxury suites – reasonable to conservative Loge boxes – reasonable to conservative Club seats – reasonable
In general, total operating expenses appear to be reasonable
Year 1 implied cash flow may be slightly conservative ($3.1 million) – does not include annual rent paymentor annual capital expenditure contribution
APPENDIX B: B&D REPORT REVIEW

Page 207Preliminary Draft – Subject to Revision Confidential
Site Summary
B&D scored the AlamoStreet location highest
This location was notidentified by Populous asan option
B&D indicated that otherplans exist for the site
Fox Tech South and IrishFlats were the highestscoring sites that wereincluded in the Populousreport
Both are designated asurban core sites
APPENDIX B: B&D REPORT REVIEW

Page 208Preliminary Draft – Subject to Revision Confidential
Highlights of Top Two Sites
Notable points for the two highest scoringsites: Alamo Street 7.5 acres 1 lot, 1 owner Existing parking Unique design and repurposing
opportunities Alters existing HemisFair plan
Fox Tech South 7.2 acres 17 lots, 8 owners Market parking New development in the area Re-purposing opportunities Housing displacement
APPENDIX B: B&D REPORT REVIEW

Page 209Preliminary Draft – Subject to Revision Confidential
Site Tiers
Of the sites highlighted in the Populous study, four were characterized as “Tier 1 Sites” by B&D
Fox Tech South – development would contribute to San Pedro Creek initiative Irish Flats – could accelerate development on Broadway and take advantage of repurposing Alamodome – lacks control challenges and could link to redevelopment of Hemisfair Park ITC – provides same benefits as Alamodome site
One was characterized as a “Tier 2 Site”
UTSA – adjacent to the core but presents challenges due to railroad tracks and a highway
One was characterized as a “Tier 3 Site”
Fox Tech – awkwardly shaped and would provide design challenges Populous indicates that this site would work
APPENDIX B: B&D REPORT REVIEW

APPENDIX C: MLB POTENTIAL

Page 211Preliminary Draft – Subject to Revision Confidential
Overview
Professional Baseball has been played in the U.S. since 1869 – the National League (NL) wasestablished in 1876 and the American League (AL) in 1901
MLB is currently comprised of 30 teams
The two leagues are further subdivided into East, West, and Central Divisions
APPENDIX C: MLB POTENTIAL
National League
EastAtlanta BravesMiami MarlinsNew York Mets
Philadelphia PhilliesWashington Nationals
CentralChicago Cubs
Cincinnati RedsMilwaukee Brewers
Pittsburgh PiratesSt. Louis Cardinals
WestArizona Diamondbacks
Colorado RockiesLos Angeles Dodgers
San Diego PadresSan Francisco Giants
American League
EastBaltimore OriolesBoston Red Sox
New York YankeesTampa Bay RaysToronto Blue Jays
CentralChicago White SoxCleveland Indians
Detroit TigersKansas City Royals
Minnesota Twins
WestHouston Astros
Los Angeles Angels of AnaheimOakland AthleticsSeattle MarinersTexas Rangers

Page 212Preliminary Draft – Subject to Revision Confidential
MLB Announced Attendance (Average)
Announced figures illustrated below are typically higher than actual / turnstile attendance
APPENDIX C: MLB POTENTIAL
5 Year 10 YearMLB Franchise 2006 2007 2008 2009 2010 2011 2012 2013 2014 2015 Average Rank Average Rank
Los Angeles Dodgers 46,401 47,617 46,056 46,440 43,979 36,236 41,040 46,216 46,695 46,479 43,333 1 44,716 2New York Yankees 52,392 52,729 53,069 45,364 46,491 45,107 43,733 40,488 42,520 39,922 42,354 2 46,182 1San Francisco Giants 38,639 39,792 35,356 35,322 37,499 41,818 41,695 41,584 41,588 41,677 41,672 3 39,497 4St. Louis Cardinals 42,588 43,854 42,353 41,274 40,755 38,196 40,272 41,602 43,711 43,467 41,450 4 41,807 3Los Angeles Angels of Anaheim 42,059 41,551 41,194 40,004 40,133 39,090 37,799 37,277 38,221 37,194 37,916 5 39,452 5Boston Red Sox 36,189 36,679 37,632 37,811 37,610 37,703 37,567 34,979 36,494 35,564 36,461 6 36,823 8Texas Rangers 29,490 29,795 24,320 27,641 30,928 36,382 42,719 38,759 33,564 30,763 36,437 7 32,436 12Philadelphia Phillies 34,200 38,374 42,254 44,453 45,027 45,440 44,021 37,190 29,924 23,475 36,010 8 38,436 6Detroit Tigers 32,048 37,619 39,538 31,693 30,385 32,617 37,383 38,066 36,014 33,654 35,547 9 34,902 10Chicago Cubs 39,040 40,153 40,743 39,610 37,814 37,258 35,589 32,625 32,742 36,540 34,951 10 37,211 7Milwaukee Brewers 28,835 35,421 37,882 37,499 34,278 37,918 34,955 31,248 34,535 31,389 34,009 11 34,396 11Colorado Rockies 25,979 28,978 33,127 32,902 35,940 35,923 32,474 34,491 33,090 31,334 33,462 12 32,424 13Minnesota Twins 28,210 28,349 28,425 29,466 39,798 39,112 34,275 30,588 27,785 27,408 31,834 13 31,342 14Washington Nationals 26,580 24,217 29,005 22,715 22,568 24,877 30,010 32,745 31,844 32,343 30,364 14 27,690 18Cincinnati Reds 26,353 25,414 25,415 21,579 25,438 27,327 28,978 31,288 30,576 29,870 29,608 15 27,224 20Atlanta Braves 31,881 33,891 31,269 29,304 30,989 30,037 29,878 31,465 29,065 25,017 29,092 16 30,280 15Toronto Blue Jays 28,422 29,143 29,626 23,162 20,068 22,445 25,921 31,315 29,327 34,504 28,702 17 27,393 19New York Mets 43,327 47,579 51,165 38,941 32,401 30,108 28,035 26,695 26,860 31,725 28,685 18 35,684 9Pittsburgh Pirates 23,269 22,141 20,113 19,479 19,918 24,255 26,148 28,210 30,155 30,846 27,923 19 24,453 25Baltimore Orioles 26,581 27,060 25,000 23,545 21,662 21,943 26,610 29,105 30,805 29,374 27,567 20 26,169 24San Diego Padres 32,836 34,445 29,969 26,281 26,318 26,457 26,218 26,749 27,103 30,367 27,379 21 28,674 16Arizona Diamondbacks 25,829 28,708 30,986 26,281 25,394 25,992 26,884 26,355 25,601 25,680 26,102 22 26,771 22Kansas City Royals 17,157 19,961 19,986 22,473 20,191 21,289 21,748 21,614 24,154 33,438 24,449 23 22,201 26Seattle Mariners 30,634 32,993 28,761 27,116 25,746 23,411 21,258 21,747 25,485 27,081 23,796 24 26,423 23Houston Astros 37,318 37,288 34,741 31,124 28,783 25,518 19,848 20,393 21,627 26,587 22,795 25 28,323 17Chicago White Sox 36,511 33,140 30,877 28,199 27,091 24,705 24,271 22,105 20,896 21,947 22,785 26 26,974 21Miami Marlins 14,372 16,919 16,688 18,770 18,953 19,007 27,400 19,584 21,386 21,632 21,802 27 19,471 29Oakland Athletics 24,402 23,726 20,558 17,392 17,511 18,232 20,728 22,337 25,045 21,829 21,634 28 21,176 28Cleveland Indians 24,666 28,448 27,122 22,492 17,435 22,726 19,797 19,661 18,428 17,806 19,684 29 21,858 27Tampa Bay Rays 16,925 17,130 22,259 23,147 22,758 18,876 19,255 18,645 17,857 15,403 18,007 30 19,226 30
Average 31,438 32,770 32,516 30,383 30,129 30,334 30,884 30,504 30,437 30,477 30,527 30,987Source: ESPN.com.
Season

Page 213Preliminary Draft – Subject to Revision Confidential
MLB On-Field Performance
Measured by winning percentage
APPENDIX C: MLB POTENTIAL
5 Year 10 YearMLB Franchise 2006 2007 2008 2009 2010 2011 2012 2013 2014 2015 Average Rank Average Rank
St. Louis Cardinals .516 .481 .531 .562 .531 .556 .543 .599 .556 .617 .574 1 .549 3New York Yankees .599 .580 .549 .636 .586 .599 .586 .525 .519 .537 .553 2 .572 1Los Angeles Dodgers .549 .506 .519 .586 .494 .509 .531 .568 .580 .568 .551 3 .541 4Washington Nationals .438 .451 .366 .364 .426 .497 .605 .531 .593 .512 .548 4 .478 23Detroit Tigers .586 .543 .457 .528 .500 .586 .543 .574 .556 .460 .544 5 .533 6Los Angeles Angels of Anaheim .549 .580 .617 .599 .494 .531 .549 .481 .605 .525 .538 6 .553 2Texas Rangers .494 .463 .488 .537 .556 .593 .574 .558 .414 .543 .536 7 .522 8Pittsburgh Pirates .414 .420 .414 .385 .352 .444 .488 .580 .543 .605 .532 8 .465 26Tampa Bay Rays .377 .407 .599 .519 .593 .562 .556 .564 .475 .494 .530 9 .515 10San Francisco Giants .472 .438 .444 .543 .568 .531 .580 .469 .543 .519 .528 10 .511 11Atlanta Braves .488 .519 .444 .531 .562 .549 .580 .593 .488 .414 .525 11 .517 9Baltimore Orioles .432 .426 .422 .395 .407 .426 .574 .525 .593 .500 .524 12 .470 24Oakland Athletics .574 .469 .466 .463 .500 .457 .580 .593 .543 .420 .519 13 .507 12Kansas City Royals .383 .426 .463 .401 .414 .438 .444 .531 .549 .586 .510 14 .464 28Cleveland Indians .481 .593 .500 .401 .426 .494 .420 .568 .525 .503 .502 15 .491 18Cincinnati Reds .494 .444 .457 .481 .562 .488 .599 .556 .469 .395 .501 16 .495 16Boston Red Sox .531 .593 .586 .586 .549 .556 .426 .599 .438 .481 .500 17 .535 5Toronto Blue Jays .537 .512 .531 .463 .525 .500 .451 .457 .512 .574 .499 18 .506 13Milwaukee Brewers .463 .512 .556 .494 .475 .593 .512 .457 .506 .420 .498 19 .499 15Arizona Diamondbacks .469 .556 .506 .432 .401 .580 .500 .500 .395 .488 .493 20 .483 20New York Mets .599 .543 .549 .432 .488 .475 .457 .457 .488 .556 .487 21 .504 14Philadelphia Phillies .525 .549 .568 .574 .599 .630 .500 .451 .451 .389 .484 22 .524 7Chicago White Sox .556 .444 .546 .488 .543 .488 .525 .407 .451 .469 .468 23 .492 17Seattle Mariners .481 .543 .377 .525 .377 .414 .463 .438 .537 .469 .464 24 .462 29San Diego Padres .543 .546 .389 .463 .556 .438 .469 .469 .475 .457 .462 25 .481 21Chicago Cubs .407 .525 .602 .516 .463 .438 .377 .407 .451 .599 .454 26 .479 22Miami Marlins .481 .438 .522 .537 .494 .444 .426 .383 .475 .438 .433 27 .464 27Minnesota Twins .593 .488 .540 .534 .580 .389 .407 .407 .432 .512 .429 28 .488 19Colorado Rockies .469 .552 .457 .568 .512 .451 .395 .457 .407 .420 .426 29 .469 25Houston Astros .506 .451 .534 .457 .469 .346 .340 .315 .432 .531 .393 30 .438 30Source: ESPN.com.
Season

Page 214Preliminary Draft – Subject to Revision Confidential
MLB Stadium Characteristics
The majority of MLB teams play(or are expected to play) in modernstadiums
Oakland Athletics and Tampa BayRays are actively seeking newstadiums
Atlanta Braves (new stadium) andChicago Cubs (major renovation)currently have stadiums underconstruction
Texas Rangers recently announcedplans for a new stadium in 2021 –subject to November 2016 vote
APPENDIX C: MLB POTENTIAL
Year Opened/ Luxury ClubMLB Franchise Stadium Renovated Seats Suites Seats
Chicago Cubs Wrigley Field 1914/2018 41,210 60 874Atlanta Braves SunTrust Park 2017 41,500 TBD 4,000Los Angeles Dodgers Dodger Stadium 1962/2013 56,000 68 2,098Miami Marlins Marlins Park 2012 37,000 50 3,000Boston Red Sox Fenway Park 1912/2011 37,493 45 2,000Minnesota Twins Target Field 2010 39,504 54 3,400Kansas City Royals Kauffman Stadium 1973/2009 39,000 25 2,545New York Yankees Yankee Stadium 2009 52,325 56 6,000New York Mets Citi Field 2009 41,922 54 7,800Washington Nationals Nationals Park 2008 41,506 78 2,751Chicago White Sox U.S. Cellular Field 1991/2007 40,615 104 1,833St. Louis Cardinals Busch Stadium 2006 43,975 64 3,790San Diego Padres Petco Park 2004 42,691 58 5,000Philadelphia Phillies Citizens Bank Park 2004 43,647 70 1,277Cincinnati Reds Great American Ball Park 2003 42,271 64 4,235Pittsburgh Pirates PNC Park 2001 38,496 69 5,558Milwaukee Brewers Miller Park 2001 41,900 66 2,760San Francisco Giants AT&T Park 2000 41,983 67 8,482Houston Astros Minute Maid Park 2000 40,950 63 4,776Detroit Tigers Comerica Park 2000 41,782 102 3,039Seattle Mariners Safeco Field 1999 47,116 61 5,156Arizona Diamondbacks Chase Field 1998 48,633 75 4,400Tampa Bay Rays Tropicana Field 1990/1998 34,078 58 300Los Angeles Angels of Anaheim Angel Stadium of Anaheim 1966/1998 45,050 78 5,075Oakland Athletics Oakland Coliseum 1966/1996 63,024 147 721Colorado Rockies Coors Field 1995 50,398 56 4,444Texas Rangers Globe Life Park in Arlington 1994 49,170 126 5,704Cleveland Indians Progressive Field 1994 43,441 126 2,064Baltimore Orioles Oriole Park at Camden Yards 1992 48,876 72 5,120Toronto Blue Jays Rogers Centre 1989 49,808 153 5,603
Average 44,179 75 3,794Source: Resource Guide Live and industry research.

Page 215Preliminary Draft – Subject to Revision Confidential
MLB Stadium Locations
BSG has categorized each stadium’s locationwithin its city based on the followingcategories:
Downtown – Ballparks located generally inor immediately adjacent to the downtowncore or central business district (CBD)
Urban – Ballparks in an urban setting butnot in the downtown core or CBD
Suburban – Ballparks located in non-urbansettings away from downtown / urbaninfrastructure and commercial development
Texas Rangers new stadium is expected to belocated near their current stadium in asuburban location
APPENDIX C: MLB POTENTIALOriginal Year Geographical
MLB Franchise Stadium Opened Location
Atlanta Braves SunTrust Park - (1) 2017 SuburbanMiami Marlins Marlins Park 2012 UrbanMinnesota Twins Target Field 2010 DowntownNew York Yankees Yankee Stadium 2009 UrbanNew York Mets Citi Field 2009 UrbanWashington Nationals Nationals Park 2008 UrbanSt. Louis Cardinals Busch Stadium 2006 DowntownPhiladelphia Phillies Citizens Bank Park 2004 UrbanSan Diego Padres Petco Park 2004 DowntownCincinnati Reds Great American Ball Park 2003 DowntownMilwaukee Brewers Miller Park 2001 SuburbanPittsburgh Pirates PNC Park 2001 DowntownSan Francisco Giants AT&T Park 2000 DowntownDetroit Tigers Comerica Park 2000 DowntownHouston Astros Minute Maid Park 2000 DowntownSeattle Mariners Safeco Field 1999 UrbanArizona Diamondbacks Chase Field 1998 DowntownColorado Rockies Coors Field 1995 DowntownTexas Rangers Globe Life Park in Arlington 1994 SuburbanCleveland Indians Progressive Field 1994 DowntownBaltimore Orioles Oriole Park at Camden Yards 1992 DowntownChicago White Sox U.S. Cellular Field 1991 UrbanTampa Bay Rays Tropicana Field 1990 UrbanToronto Blue Jays Rogers Centre 1989 DowntownKansas City Royals Kauffman Stadium 1973 SuburbanLos Angeles Angels of Anaheim Angel Stadium of Anaheim 1966 UrbanOakland Athletics Oakland Coliseum 1966 UrbanLos Angeles Dodgers Dodger Stadium 1962 UrbanChicago Cubs Wrigley Field 1914 UrbanBoston Red Sox Fenway Park 1912 Urban
TotalDowntown 13Urban 13Suburban 4(1) - Project includes significant commercial development.Source: Resource Guide Live and industry research.

Page 216Preliminary Draft – Subject to Revision Confidential
MLB Public-Private Funding Must consider total occupancy costs / market characteristics, not just public-private summary charts
APPENDIX C: MLB POTENTIAL
Stadium - (1) Team Location Year Total CostNew Rangers Ballpark Texas Rangers Arlington, TX 2021 $1,000,000,000 $500,000,000 50.0% $500,000,000 50.0%SunTrust Park Atlanta Braves Cobb County, GA 2017 $672,000,000 $300,000,000 44.6% $372,000,000 55.4%Marlins Park Miami Marlins Miami, FL 2012 $644,500,000 $489,500,000 76.0% $155,000,000 24.0%Target Field Minnesota Twins Minneapolis, MN 2010 $555,000,000 $355,500,000 64.1% $199,500,000 35.9%Kauffman Stadium Kansas City Royals Kansas City, MO 2009 $250,000,000 $225,000,000 90.0% $25,000,000 10.0%Yankee Stadium New York Yankees New York, NY 2009 $1,592,900,000 $234,700,000 14.7% $1,358,200,000 85.3%Citi Field New York Mets New York, NY 2009 $814,652,088 $181,100,000 22.2% $633,552,088 77.8%Nationals Park Washington Nationals Washington, DC 2008 $693,000,000 $662,000,000 95.5% $31,000,000 4.5%Busch Stadium St. Louis Cardinals St. Louis, MO 2006 $430,200,000 $85,400,000 19.9% $344,800,000 80.1%Petco Park - (2) San Diego Padres San Diego, CA 2004 $453,400,000 $300,800,000 66.3% $152,600,000 33.7%Citizens Bank Park - (3) Philadelphia Phillies Philadelphia, PA 2004 $346,000,000 $174,000,000 50.3% $172,000,000 49.7%Great American Ballpark Cincinnati Reds Cincinnati, OH 2003 $336,259,938 $292,528,714 87.0% $43,731,225 13.0%Miller Park Milwaukee Brewers Milwaukee, WI 2001 $394,000,000 $304,000,000 77.2% $90,000,000 22.8%PNC Park - (3) Pittsburgh Pirates Pittsburgh, PA 2001 $273,767,637 $224,217,128 81.9% $49,550,509 18.1%AT&T Park San Francisco Giants San Francisco, CA 2000 $354,000,000 $15,000,000 4.2% $339,000,000 95.8%Minute Maid Park Houston Astros Houston, TX 2000 $285,933,028 $222,549,243 77.8% $63,383,785 22.2%Comerica Park Detroit Tigers Detroit, TX 2000 $260,000,000 $95,000,000 36.5% $165,000,000 63.5%Safeco Field Seattle Mariners Seattle, WA 1999 $536,144,408 $386,839,143 72.2% $149,305,265 27.8%Angel Stadium of Anaheim Los Angeles Angels of Anaheim Anaheim, CA 1998 $116,485,302 $20,000,000 17.2% $96,485,302 82.8%Tropicana Field - (4) Tampa Bay Rays Tampa Bay, FL 1998 $223,000,000 $209,000,000 93.7% $14,000,000 6.3%Chase Field Arizona Diamondbacks Phoenix, AZ 1998 $380,000,000 $253,000,000 66.6% $127,000,000 33.4%Turner Field Atlanta Braves Atlanta, GA 1997 $250,000,000 $207,000,000 82.8% $43,000,000 17.2%Coors Field Colorado Rockies Denver, CO 1995 $231,000,000 $196,000,000 84.8% $35,000,000 15.2%Globe Life Park in Arlington Texas Rangers Arlington, TX 1994 $202,677,889 $153,851,450 75.9% $48,826,439 24.1%Progressive Field - (5) Cleveland Indians Cleveland, OH 1994 $193,600,000 $145,600,000 75.2% $47,000,000 24.3%Oriole Park at Camden Yards Baltimore Orioles Baltimore, MD 1992 $234,200,000 $210,700,000 90.0% $23,500,000 10.0%U.S. Cellular Field - (6) Chicago White Sox Chicago, IL 1991 $186,400,000 $182,600,000 98.0% $3,800,000 2.0%
Average - Since 2000 $550,330,158 $274,193,829 56.4% $276,136,330 43.6%Average $441,078,529 $245,403,173 63.5% $195,638,319 36.5%
Total/Weighted Average - Since 2000 $9,355,612,691 $4,661,295,085 49.8% $4,694,317,607 50.2%Total/Weighted Average $11,909,120,290 $6,625,885,678 55.6% $5,282,234,613 44.4%(1) Does not include current/recent renovation projects at Wrigley Field, Dodger Stadium, or Fenway Park. Primarily privately funded.(2) Does not include Padres parking structure ($20,000,000 - $25,000,000).
(4) Unconfirmed $21,000,000 contribution attributed to public sector.(5) Total cost reflects $1,000,0000 charitable contribution.(6) Figures do not include recent renovations.Note: Figures presented in actual dollars. Figures have not been adjusted to reflect current dollars.
Public Private
(3) Figures reflect reported ballpark costs and do not include infrastructure and other related costs. Total private investment (MLB/NFL) in Philadelphia was 47.8% of total project cost. Total private investment(MLB/NFL) in Pittsburgh was 14.8% of total project cost.

Page 217Preliminary Draft – Subject to Revision Confidential
Market Overview
Evaluating local demographics of MLB markets is important to develop an understanding oflocal market area support
Market area size and characteristics will impact the ability of a MLB team to generate localrevenue
Limited market analysis – evaluated base market characteristics
MLB market area comparison
Combined statistical area designation (CSA) Combined statistical area designation (CSA) – Adjusted
CSA is a larger designation than CBSA – used for major league sports San Antonio is not part of a CSA – CBSA figures used (consideration should be given to proximity
of and potential demand from Austin)
APPENDIX C: MLB POTENTIAL

Page 218Preliminary Draft – Subject to Revision Confidential
Demographic SummaryCSA Designation Overview
San Antonio
Population / Households – below average
Estimated Growth – above average
Income – below average
High Income Households – below average
Unemployment Rate – below average
GDP – below average
TV / Radio Population – below average
Corporate Base – below average
Cost of Living – below average
APPENDIX C: MLB POTENTIAL
Statistical Measure San AntonioRank of 31
MLB Average - (1)
2016 Population (000s) 2,394.2 29 7,827.5 2021 Population (000s) 2,588.7 28 8,139.4 Est. % Growth 2016-2021 8.12% 2 4.03%
2016 Households (000s) 858.8 30 2,869.4 2021 Households (000s) 933.0 29 2,991.6 Est. % Growth 2016-2021 8.64% 2 4.42%
Average Household Income $72,810 27 $86,478Median Household Income $54,437 26 $62,819High Income Households (000s) 194.1 30 886.6
Average Age (US Only) 36.7 3 38.8Median Age 34.9 2 38.2
Unemployment Rate 3.40% 2 4.94%
Economy Size (GDP - Billions) (US Only) $104.8 29 $421.7
TV Population 2,429.4 28 6,718.9 Radio Population 1,990.6 27 5,298.2
Companies w/ $20+mm Sales 684 31 3,625Companies w/ $50+mm Sales (US Only) 333 30 1,734Companies w/ 500+ Employees 172 31 657
Cost of Living Index (US Only) 86.5 1 122.9
MLB Summary - CSA Designation Overview
(1) - Average excludes San Antonio.Source: Nielsen 2016, ThinkTV 2016, BLS 2016, Numeris 2015/16, Hoovers 2016, Tetrad 2016, Statistics Canada, The Council for Community and Economic Research 2016, and U.S. BEA.

Page 219Preliminary Draft – Subject to Revision Confidential
CSA DesignationPopulation and Households
San Antonio would rank 29th among MLB teams in terms of population and households
APPENDIX C: MLB POTENTIAL
Team
2016 Population
(000s) Rank
2021 Population
(000s) Rank
Est. % Growth
2016-2021 Rank
2016 Households
(000s) Rank
2021 Households
(000s) Rank
Est. % Growth
2016-2021 RankNew York Mets 23,803.8 1 24,394.6 1 2.48% 21 8,770.6 1 9,005.2 1 2.68% 21New York Yankees 23,803.8 1 24,394.6 1 2.48% 21 8,770.6 1 9,005.2 1 2.68% 21Los Angeles Angels of Anaheim 18,796.0 3 19,651.7 3 4.55% 16 6,080.9 3 6,361.8 3 4.62% 17Los Angeles Dodgers 18,796.0 3 19,651.7 3 4.55% 16 6,080.9 3 6,361.8 3 4.62% 17Chicago White Sox 9,952.6 5 10,046.6 7 0.94% 27 3,692.7 5 3,745.7 7 1.44% 27Chicago Cubs 9,952.6 5 10,046.6 7 0.94% 27 3,692.7 5 3,745.7 7 1.44% 27Baltimore Orioles 9,687.5 7 10,190.6 5 5.19% 14 3,641.8 7 3,835.7 5 5.33% 14Washington Nationals 9,687.5 7 10,190.6 5 5.19% 14 3,641.8 7 3,835.7 5 5.33% 14Oakland Athletics 8,755.7 9 9,254.5 9 5.70% 10 3,155.9 10 3,343.2 9 5.93% 10San Francisco Giants 8,755.7 9 9,254.5 9 5.70% 10 3,155.9 10 3,343.2 9 5.93% 10Boston Red Sox 8,168.3 11 8,410.3 11 2.96% 20 3,192.5 9 3,298.6 11 3.32% 19Texas Rangers 7,528.6 12 8,094.1 12 7.51% 5 2,715.9 13 2,918.4 12 7.46% 6Philadelphia Phillies 7,193.6 13 7,308.4 14 1.60% 24 2,724.6 12 2,773.3 13 1.79% 25Houston Astros 6,875.6 14 7,448.6 13 8.33% 1 2,391.5 15 2,592.0 15 8.38% 3Miami Marlins 6,669.8 15 7,080.8 15 6.16% 8 2,524.4 14 2,679.2 14 6.13% 9Atlanta Braves 6,388.7 16 6,783.4 16 6.18% 7 2,351.8 16 2,502.2 16 6.39% 8Toronto Blue Jays 6,093.9 17 6,458.6 17 6.00% 9 2,218.0 17 2,436.5 17 9.85% 1Detroit Tigers 5,316.9 18 5,331.0 18 0.27% 29 2,103.8 18 2,120.3 18 0.79% 29Seattle Mariners 4,606.6 19 4,894.4 20 6.25% 6 1,826.0 19 1,945.7 19 6.56% 7Arizona Diamondbacks 4,606.4 20 4,955.4 19 7.58% 4 1,688.1 20 1,821.3 20 7.89% 5Minnesota Twins 3,888.6 21 4,057.2 21 4.33% 18 1,519.4 21 1,592.8 21 4.83% 16Cleveland Indians 3,494.9 22 3,496.8 23 0.06% 30 1,443.1 22 1,453.4 23 0.71% 30Colorado Rockies 3,437.5 23 3,702.0 22 7.69% 3 1,359.5 23 1,471.4 22 8.23% 4San Diego Padres 3,311.9 24 3,494.8 24 5.52% 13 1,160.8 26 1,226.7 25 5.67% 12Tampa Bay Rays 2,979.8 25 3,146.8 25 5.60% 12 1,224.8 24 1,291.4 24 5.44% 13St. Louis Cardinals 2,917.3 26 2,946.6 26 1.00% 26 1,171.2 25 1,188.5 26 1.48% 26Pittsburgh Pirates 2,648.5 27 2,647.1 27 -0.05% 31 1,136.5 27 1,144.4 27 0.69% 31Kansas City Royals 2,436.7 28 2,510.7 29 3.03% 19 955.9 28 986.8 28 3.23% 20San Antonio MLB Team 2,394.2 29 2,588.7 28 8.12% 2 858.8 30 933.0 29 8.64% 2Cincinnati Reds 2,222.5 30 2,264.0 30 1.87% 23 869.7 29 887.3 30 2.03% 23Milwaukee Brewers 2,049.4 31 2,074.8 31 1.24% 25 820.8 31 835.6 31 1.80% 24
Average (Ex. San Antonio) 7,827.5 8,139.4 4.03% 2,869.4 2,991.6 4.42%Source: Nielsen 2016, Tetrad 2016.

Page 220Preliminary Draft – Subject to Revision Confidential
CSA DesignationIncome
San Antonio is below the MLB average interms of average and median householdincome and high income households
APPENDIX C: MLB POTENTIAL
Team
Average Household
Income Rank
Median Household
Income Rank
HHs w/ Income
$100,000+ (000s) Rank
Oakland Athletics $116,035 1 $80,974 3 1,295.6 7San Francisco Giants $116,035 1 $80,974 3 1,295.6 7Baltimore Orioles $109,784 3 $81,858 1 1,471.3 5Washington Nationals $109,784 3 $81,858 1 1,471.3 5New York Mets $98,595 5 $68,168 8 2,988.9 1New York Yankees $98,595 5 $68,168 8 2,988.9 1Boston Red Sox $94,637 7 $69,874 5 1,083.5 9Seattle Mariners $91,032 8 $68,548 7 584.2 15Colorado Rockies $90,039 9 $66,994 10 423.8 21San Diego Padres $89,932 10 $65,496 11 362.3 23Minnesota Twins $89,038 11 $69,303 6 479.2 20Houston Astros $87,885 12 $61,339 17 698.4 14Los Angeles Angels of Anaheim $86,475 13 $61,524 15 1,760.2 3Los Angeles Dodgers $86,475 13 $61,524 15 1,760.2 3Chicago White Sox $86,137 15 $62,866 12 1,069.9 10Chicago Cubs $86,137 15 $62,866 12 1,069.9 10Philadelphia Phillies $85,024 17 $62,218 14 791.3 12Texas Rangers $83,945 18 $60,906 18 757.1 13Atlanta Braves $78,561 19 $56,834 22 580.5 16Toronto Blue Jays $78,539 20 $54,758 24 541.8 17Cincinnati Reds $77,186 21 $57,146 20 213.8 29St. Louis Cardinals $76,315 22 $57,024 21 281.9 25Kansas City Royals $75,476 23 $57,835 19 230.4 28Detroit Tigers $73,902 24 $54,052 27 495.6 19Arizona Diamondbacks $73,739 25 $54,725 25 386.0 22Milwaukee Brewers $73,068 26 $55,503 23 190.5 31San Antonio MLB Team $72,810 27 $54,437 26 194.1 30Pittsburgh Pirates $72,507 28 $53,562 28 254.8 26Miami Marlins $71,823 29 $48,494 30 530.7 18Cleveland Indians $70,125 30 $51,263 29 305.9 24Tampa Bay Rays $67,514 31 $47,911 31 234.3 27
Average (Ex. San Antonio) $86,478 $62,819 886.6
Source: Nielsen 2016, Tetrad 2016.
Note: Toronto average/median income statistics were multiplied by IRS 2015 Average CAD-USD Exchange Rate of .75245. Toronto HHs w/ Income $100,000+ statistic represents HH w/ $125,000+ (CAD) ($94,056+ (USD)).

Page 221Preliminary Draft – Subject to Revision Confidential
CSA DesignationAge
San Antonio has a younger population thanthe MLB market average
APPENDIX C: MLB POTENTIAL
TeamAverage
Age RankMedian
Age RankHouston Astros 35.7 1 34.5 1Texas Rangers 36.2 2 35.2 3San Antonio MLB Team 36.7 3 34.9 2Atlanta Braves 36.9 4 36.2 7Los Angeles Angels of Anaheim 37.4 5 36.0 5Los Angeles Dodgers 37.4 5 36.0 5Colorado Rockies 37.6 7 36.7 9Arizona Diamondbacks 37.7 8 36.3 8San Diego Padres 37.7 8 35.9 4Kansas City Royals 38.0 10 37.0 10Minnesota Twins 38.0 10 37.3 11Chicago White Sox 38.2 12 37.3 11Chicago Cubs 38.2 12 37.3 11Baltimore Orioles 38.3 14 37.7 14Washington Nationals 38.3 14 37.7 14Cincinnati Reds 38.6 16 38.0 16Seattle Mariners 38.9 17 38.3 17Milwaukee Brewers 39.0 18 38.4 18Oakland Athletics 39.1 19 38.6 19San Francisco Giants 39.1 19 38.6 19New York Mets 39.4 21 38.9 22New York Yankees 39.4 21 38.9 22Philadelphia Phillies 39.5 23 38.9 22St. Louis Cardinals 39.6 24 39.2 25Detroit Tigers 39.7 25 39.7 26Boston Red Sox 40.2 26 40.0 27Cleveland Indians 40.9 27 41.2 28Miami Marlins 41.4 28 41.4 29Tampa Bay Rays 41.9 29 42.4 30Pittsburgh Pirates 42.5 30 43.3 31Toronto Blue Jays NA NA 38.8 21
Average (Ex. San Antonio) 38.8 38.2Source: Nielsen 2016, Tetrad 2016.

Page 222Preliminary Draft – Subject to Revision Confidential
CSA DesignationUnemployment
San Antonio is below the MLB marketaverage in terms of unemployment rate
APPENDIX C: MLB POTENTIAL
TeamUnemployment
Rate RankColorado Rockies 3.1% 1San Antonio MLB Team 3.4% 2Texas Rangers 3.7% 3Oakland Athletics 3.8% 4San Francisco Giants 3.8% 4Minnesota Twins 3.9% 6Boston Red Sox 4.0% 7Washington Nationals 4.1% 8Kansas City Royals 4.5% 9Tampa Bay Rays 4.5% 9Arizona Diamondbacks 4.6% 11Houston Astros 4.7% 12San Diego Padres 4.7% 12Miami Marlins 4.8% 14Philadelphia Phillies 4.8% 14Cincinnati Reds 4.9% 16Baltimore Orioles 5.0% 17Los Angeles Angels of Anaheim 5.1% 18Los Angeles Dodgers 5.1% 18New York Mets 5.1% 18New York Yankees 5.1% 18St. Louis Cardinals 5.2% 22Atlanta Braves 5.3% 23Seattle Mariners 5.3% 23Detroit Tigers 5.4% 25Milwaukee Brewers 5.5% 26Pittsburgh Pirates 5.6% 27Cleveland Indians 5.7% 28Chicago White Sox 6.8% 29Chicago Cubs 6.8% 29Toronto Blue Jays 7.2% 31
Average (Ex. San Antonio) 4.9%Note: BLS defines Unemployment Rate by Metropolitan Area.Source: BLS 2016, Statistics Canada.

Page 223Preliminary Draft – Subject to Revision Confidential
CSA DesignationGDP
San Antonio is below the MLB marketaverage in terms of GDP
APPENDIX C: MLB POTENTIALTeam
Economy Size (GDP-Billions) Rank
New York Mets $1,558.5 1New York Yankees $1,558.5 1Los Angeles Angels of Anaheim $866.7 3Los Angeles Dodgers $866.7 3Chicago White Sox $610.6 5Chicago Cubs $610.6 5Houston Astros $525.4 7Texas Rangers $504.4 8Washington Nationals $471.6 9Oakland Athletics $412.0 10San Francisco Giants $412.0 10Philadelphia Phillies $391.1 12Boston Red Sox $382.5 13Atlanta Braves $324.9 14Seattle Mariners $300.8 15Miami Marlins $299.2 16Detroit Tigers $236.5 17Minnesota Twins $235.7 18Arizona Diamondbacks $215.2 19San Diego Padres $206.8 20Colorado Rockies $187.1 21Baltimore Orioles $173.5 22St. Louis Cardinals $150.0 23Pittsburgh Pirates $135.7 24Tampa Bay Rays $128.2 25Cleveland Indians $124.6 26Kansas City Royals $121.6 27Cincinnati Reds $121.4 28San Antonio MLB Team $104.8 29Milwaukee Brewers $97.3 30Toronto Blue Jays NA NA
Average (Ex. San Antonio) $421.7Note: GDP is defined by Metropolitan Area.Source: U.S. BEA.

Page 224Preliminary Draft – Subject to Revision Confidential
CSA DesignationCost of Living
San Antonio has a lower cost of livingthan the MLB average
APPENDIX C: MLB POTENTIAL
Team
Cost of Living Index Rank
San Antonio MLB Team 86.5 1St. Louis Cardinals 90.4 2Cincinnati Reds 90.6 3Kansas City Royals 91.3 4Tampa Bay Rays 92.3 5Pittsburgh Pirates 93.3 6Arizona Diamondbacks 96.8 7Houston Astros 97.5 8Detroit Tigers 97.9 9Texas Rangers 97.9 9Cleveland Indians 99.4 11Atlanta Braves 99.6 12Milwaukee Brewers 99.7 13Minnesota Twins 104.4 14Colorado Rockies 109.3 15Miami Marlins 114.1 16Baltimore Orioles 114.8 17Philadelphia Phillies 117.9 18Chicago White Sox 118.9 19Chicago Cubs 118.9 19Los Angeles Dodgers 145.5 21Washington Nationals 146.8 22San Diego Padres 146.9 23Oakland Athletics 147.3 24Seattle Mariners 149.4 25Boston Red Sox 151.1 26Los Angeles Angels of Anaheim 155.5 27San Francisco Giants 177.5 28New York Mets 199.3 29New York Yankees 199.3 29Toronto Blue Jays NA NA
Average (Ex. San Antonio) 122.9
Source: Council for Community and Economic Research 2016.
Note: Index is defined by Urban Area. New York teams' figures are an average of Brooklyn and Manhattan boroughs.
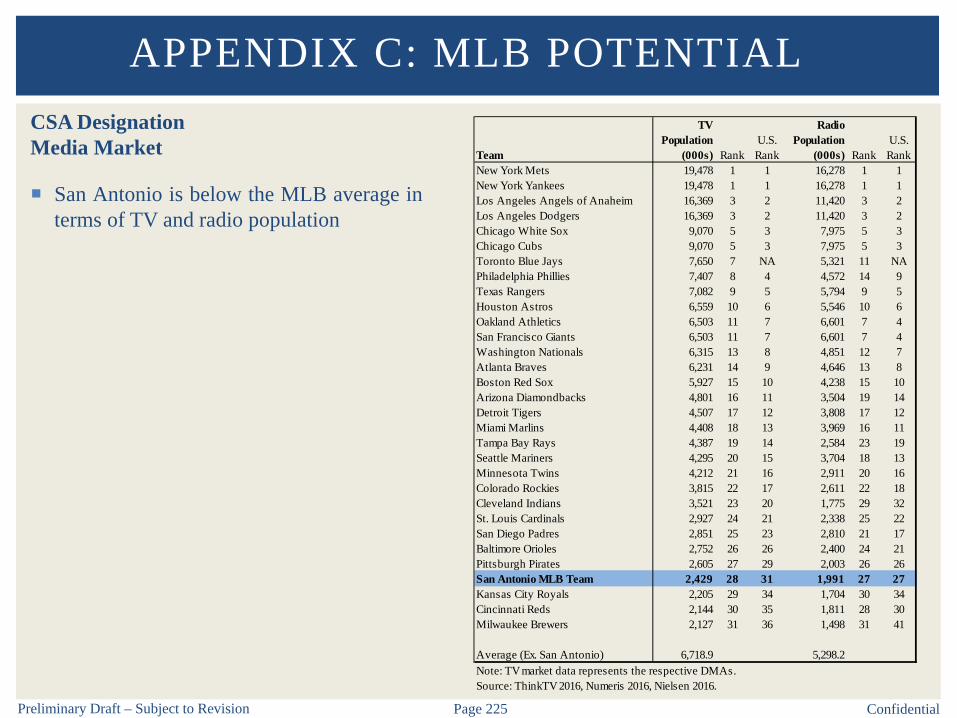
Page 225Preliminary Draft – Subject to Revision Confidential
CSA DesignationMedia Market
San Antonio is below the MLB average interms of TV and radio population
APPENDIX C: MLB POTENTIAL
Team
TV Population
(000s) RankU.S. Rank
Radio Population
(000s) RankU.S. Rank
New York Mets 19,478 1 1 16,278 1 1New York Yankees 19,478 1 1 16,278 1 1Los Angeles Angels of Anaheim 16,369 3 2 11,420 3 2Los Angeles Dodgers 16,369 3 2 11,420 3 2Chicago White Sox 9,070 5 3 7,975 5 3Chicago Cubs 9,070 5 3 7,975 5 3Toronto Blue Jays 7,650 7 NA 5,321 11 NAPhiladelphia Phillies 7,407 8 4 4,572 14 9Texas Rangers 7,082 9 5 5,794 9 5Houston Astros 6,559 10 6 5,546 10 6Oakland Athletics 6,503 11 7 6,601 7 4San Francisco Giants 6,503 11 7 6,601 7 4Washington Nationals 6,315 13 8 4,851 12 7Atlanta Braves 6,231 14 9 4,646 13 8Boston Red Sox 5,927 15 10 4,238 15 10Arizona Diamondbacks 4,801 16 11 3,504 19 14Detroit Tigers 4,507 17 12 3,808 17 12Miami Marlins 4,408 18 13 3,969 16 11Tampa Bay Rays 4,387 19 14 2,584 23 19Seattle Mariners 4,295 20 15 3,704 18 13Minnesota Twins 4,212 21 16 2,911 20 16Colorado Rockies 3,815 22 17 2,611 22 18Cleveland Indians 3,521 23 20 1,775 29 32St. Louis Cardinals 2,927 24 21 2,338 25 22San Diego Padres 2,851 25 23 2,810 21 17Baltimore Orioles 2,752 26 26 2,400 24 21Pittsburgh Pirates 2,605 27 29 2,003 26 26San Antonio MLB Team 2,429 28 31 1,991 27 27Kansas City Royals 2,205 29 34 1,704 30 34Cincinnati Reds 2,144 30 35 1,811 28 30Milwaukee Brewers 2,127 31 36 1,498 31 41
Average (Ex. San Antonio) 6,718.9 5,298.2Note: TV market data represents the respective DMAs.Source: ThinkTV 2016, Numeris 2016, Nielsen 2016.

Page 226Preliminary Draft – Subject to Revision Confidential
CSA DesignationCorporate Base
San Antonio is below the MLB average interms of large companies
APPENDIX C: MLB POTENTIAL
Team
Companies w/ $20mm
Sales Rank
Companies w/ $50mm
Sales Rank
Companies w/ 500+
Employees RankNew York Mets 11,936 1 5,624 1 2,159 1New York Yankees 11,936 1 5,624 1 2,159 1Los Angeles Angels of Anaheim 7,367 3 3,283 3 1,045 5Los Angeles Dodgers 7,367 3 3,283 3 1,045 5Chicago White Sox 5,518 5 2,748 5 956 7Chicago Cubs 5,518 5 2,748 5 956 7Baltimore Orioles 4,267 7 1,981 7 1,102 3Washington Nationals 4,267 7 1,981 7 1,102 3Boston Red Sox 4,136 9 1,961 9 809 9Oakland Athletics 3,976 10 1,910 11 699 11San Francisco Giants 3,976 10 1,910 11 699 11Houston Astros 3,625 12 1,940 10 561 14Toronto Blue Jays 3,534 13 NA NA 370 20Texas Rangers 3,528 14 1,902 13 663 13Philadelphia Phillies 3,403 15 1,639 14 801 10Atlanta Braves 2,578 16 1,413 15 487 15Detroit Tigers 2,522 17 1,213 16 449 16Miami Marlins 2,421 18 1,103 17 418 17Minnesota Twins 2,251 19 1,084 18 378 19Cleveland Indians 1,707 20 802 20 314 22Colorado Rockies 1,618 21 823 19 277 23Seattle Mariners 1,554 22 708 22 379 18St. Louis Cardinals 1,549 23 745 21 256 24Arizona Diamondbacks 1,369 24 600 23 338 21San Diego Padres 1,258 25 553 27 244 25Pittsburgh Pirates 1,254 26 587 24 241 26Kansas City Royals 1,187 27 584 25 204 28Cincinnati Reds 1,108 28 573 26 189 29Milwaukee Brewers 1,070 29 505 28 181 30Tampa Bay Rays 955 30 466 29 217 27San Antonio MLB Team 684 31 333 30 172 31
Average (Ex. San Antonio) 3,625 1,734 657Note: Toronto statistic represents Companies with $20mm (CAD) sales. Source: Hoovers 2016, Tetrad 2016.

Page 227Preliminary Draft – Subject to Revision Confidential
Demographic SummaryPopulation per Seat
San Antonio is below the MLB market averagein terms of population per seat
Note: Includes only sports facilities with10,000 seats or more and assumes a new,35,000 seat MLB ballpark
APPENDIX C: MLB POTENTIAL
Team
Total Seating
Capacity Rank
2016 Population
(000s) RankPopulation
per Seat RankToronto Blue Jays 112,108 30 6,093.9 17 54.4 1Boston Red Sox 170,329 23 8,168.3 11 48.0 2New York Mets 592,293 1 23,803.8 1 40.2 3New York Yankees 592,293 1 23,803.8 1 40.2 3Los Angeles Angels of Anaheim 478,077 3 18,796.0 3 39.3 5Los Angeles Dodgers 478,077 3 18,796.0 3 39.3 5Chicago White Sox 294,590 11 9,952.6 5 33.8 7Chicago Cubs 294,590 11 9,952.6 5 33.8 7Atlanta Braves 209,756 22 6,388.7 16 30.5 9Miami Marlins 222,877 20 6,669.8 15 29.9 10Milwaukee Brewers 73,317 31 2,049.4 31 28.0 11Philadelphia Phillies 263,476 14 7,193.6 13 27.3 12Baltimore Orioles 407,712 7 9,687.5 7 23.8 13Washington Nationals 407,712 7 9,687.5 7 23.8 13Houston Astros 293,473 13 6,875.6 14 23.4 15San Diego Padres 141,835 25 3,311.9 24 23.4 16Cleveland Indians 151,568 24 3,494.9 22 23.1 17Tampa Bay Rays 138,101 27 2,979.8 25 21.6 18Oakland Athletics 417,489 5 8,755.7 9 21.0 19San Francisco Giants 417,489 5 8,755.7 9 21.0 19Seattle Mariners 221,254 21 4,606.6 19 20.8 21St. Louis Cardinals 140,949 26 2,917.3 26 20.7 22Pittsburgh Pirates 134,141 28 2,648.5 27 19.7 23Texas Rangers 392,519 9 7,528.6 12 19.2 24San Antonio MLB Team 128,523 29 2,394.2 29 18.6 25Arizona Diamondbacks 249,107 15 4,606.4 20 18.5 26Detroit Tigers 311,599 10 5,316.9 18 17.1 27Minnesota Twins 228,898 18 3,888.6 21 17.0 28Colorado Rockies 238,688 16 3,437.5 23 14.4 29Kansas City Royals 235,813 17 2,436.7 28 10.3 30Cincinnati Reds 224,964 19 2,222.5 30 9.9 31
Average (Ex. San Antonio) 284,503 7,827.5 26.4Source: Nielsen 2016, Industry Research.

Page 228Preliminary Draft – Subject to Revision Confidential
Demographic SummaryCompanies per Suite
San Antonio is below theMLB market average interms of large companiesper suite
Note: Includes only sportsfacilities with 10,000 seatsor more and assumes anew, 50 suite MLBballpark
APPENDIX C: MLB POTENTIAL
Team
Total Luxury Suites Rank Count Per Suite Rank Count Per Suite Rank Count Per Suite Rank
Boston Red Sox 278 27 4,136 14.9 1 1,961 7.1 1 809 2.9 1New York Mets 894 1 11,936 13.4 2 5,624 6.3 2 2,159 2.4 2New York Yankees 894 1 11,936 13.4 2 5,624 6.3 2 2,159 2.4 2Toronto Blue Jays 398 18 3,534 8.9 4 NA NA NA 370 0.9 20Chicago White Sox 640 8 5,518 8.6 5 2,748 4.3 4 956 1.5 5Chicago Cubs 640 8 5,518 8.6 5 2,748 4.3 4 956 1.5 5Milwaukee Brewers 126 30 1,070 8.5 7 505 4.0 8 181 1.4 7Philadelphia Phillies 405 17 3,403 8.4 8 1,639 4.0 7 801 2.0 4Los Angeles Angels of Anaheim 882 3 7,367 8.4 9 3,283 3.7 9 1,045 1.2 14Los Angeles Dodgers 882 3 7,367 8.4 9 3,283 3.7 9 1,045 1.2 14Houston Astros 478 14 3,625 7.6 11 1,940 4.1 6 561 1.2 16San Diego Padres 171 29 1,258 7.4 12 553 3.2 13 244 1.4 8Oakland Athletics 584 10 3,976 6.8 13 1,910 3.3 11 699 1.2 12San Francisco Giants 584 10 3,976 6.8 13 1,910 3.3 11 699 1.2 12Miami Marlins 413 15 2,421 5.9 15 1,103 2.7 15 418 1.0 18San Antonio MLB Team 124 31 684 5.5 16 333 2.7 14 172 1.4 9Minnesota Twins 409 16 2,251 5.5 17 1,084 2.7 17 378 0.9 22St. Louis Cardinals 288 25 1,549 5.4 18 745 2.6 18 256 0.9 23Baltimore Orioles 804 5 4,267 5.3 19 1,981 2.5 19 1,102 1.4 10Washington Nationals 804 5 4,267 5.3 19 1,981 2.5 19 1,102 1.4 10Cleveland Indians 334 23 1,707 5.1 21 802 2.4 22 314 0.9 19Texas Rangers 715 7 3,528 4.9 22 1,902 2.7 16 663 0.9 21Colorado Rockies 352 21 1,618 4.6 23 823 2.3 23 277 0.8 28Seattle Mariners 343 22 1,554 4.5 24 708 2.1 27 379 1.1 17Detroit Tigers 557 13 2,522 4.5 25 1,213 2.2 24 449 0.8 27Atlanta Braves 574 12 2,578 4.5 26 1,413 2.5 21 487 0.8 26Pittsburgh Pirates 281 26 1,254 4.5 27 587 2.1 25 241 0.9 25Cincinnati Reds 277 28 1,108 4.0 28 573 2.1 26 189 0.7 29Kansas City Royals 320 24 1,187 3.7 29 584 1.8 28 204 0.6 30Arizona Diamondbacks 390 19 1,369 3.5 30 600 1.5 29 338 0.9 24Tampa Bay Rays 355 20 955 2.7 31 466 1.3 30 217 0.6 31
Average (Ex. San Antonio) 502 3,625 6.8 1,734 3.2 657 1.2Source: Hoovers 2016, Industry Research.
Companies w/ $20mm Sales
Companies w/ $50mm Sales
Companies w/ 500+ Employees
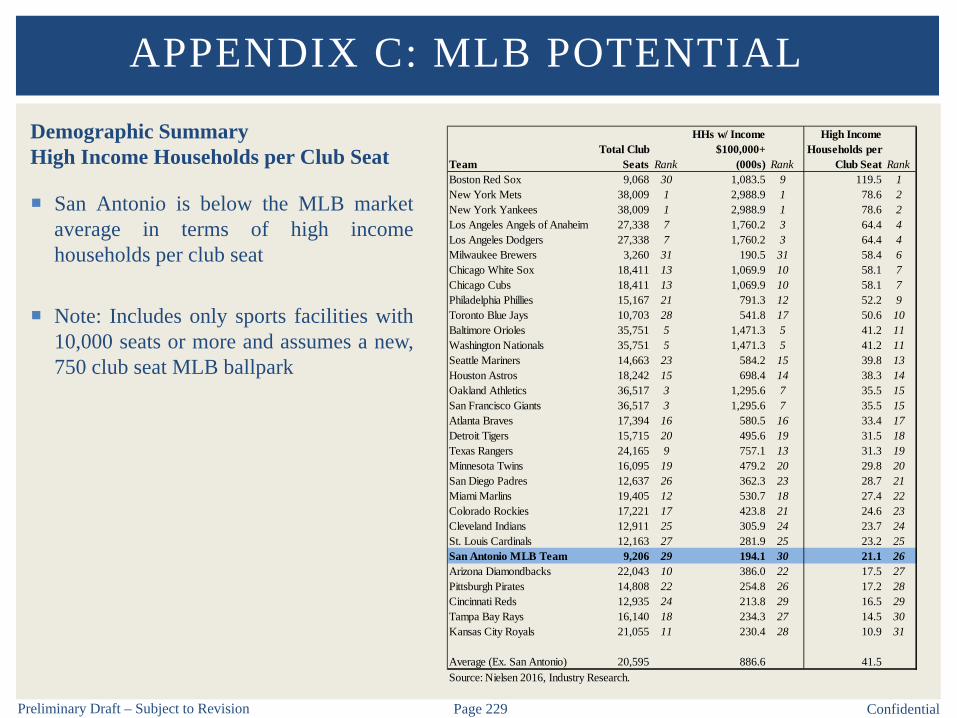
Page 229Preliminary Draft – Subject to Revision Confidential
Demographic SummaryHigh Income Households per Club Seat
San Antonio is below the MLB marketaverage in terms of high incomehouseholds per club seat
Note: Includes only sports facilities with10,000 seats or more and assumes a new,750 club seat MLB ballpark
APPENDIX C: MLB POTENTIAL
TeamTotal Club
Seats Rank
HHs w/ Income $100,000+
(000s) Rank
High Income Households per
Club Seat RankBoston Red Sox 9,068 30 1,083.5 9 119.5 1New York Mets 38,009 1 2,988.9 1 78.6 2New York Yankees 38,009 1 2,988.9 1 78.6 2Los Angeles Angels of Anaheim 27,338 7 1,760.2 3 64.4 4Los Angeles Dodgers 27,338 7 1,760.2 3 64.4 4Milwaukee Brewers 3,260 31 190.5 31 58.4 6Chicago White Sox 18,411 13 1,069.9 10 58.1 7Chicago Cubs 18,411 13 1,069.9 10 58.1 7Philadelphia Phillies 15,167 21 791.3 12 52.2 9Toronto Blue Jays 10,703 28 541.8 17 50.6 10Baltimore Orioles 35,751 5 1,471.3 5 41.2 11Washington Nationals 35,751 5 1,471.3 5 41.2 11Seattle Mariners 14,663 23 584.2 15 39.8 13Houston Astros 18,242 15 698.4 14 38.3 14Oakland Athletics 36,517 3 1,295.6 7 35.5 15San Francisco Giants 36,517 3 1,295.6 7 35.5 15Atlanta Braves 17,394 16 580.5 16 33.4 17Detroit Tigers 15,715 20 495.6 19 31.5 18Texas Rangers 24,165 9 757.1 13 31.3 19Minnesota Twins 16,095 19 479.2 20 29.8 20San Diego Padres 12,637 26 362.3 23 28.7 21Miami Marlins 19,405 12 530.7 18 27.4 22Colorado Rockies 17,221 17 423.8 21 24.6 23Cleveland Indians 12,911 25 305.9 24 23.7 24St. Louis Cardinals 12,163 27 281.9 25 23.2 25San Antonio MLB Team 9,206 29 194.1 30 21.1 26Arizona Diamondbacks 22,043 10 386.0 22 17.5 27Pittsburgh Pirates 14,808 22 254.8 26 17.2 28Cincinnati Reds 12,935 24 213.8 29 16.5 29Tampa Bay Rays 16,140 18 234.3 27 14.5 30Kansas City Royals 21,055 11 230.4 28 10.9 31
Average (Ex. San Antonio) 20,595 886.6 41.5Source: Nielsen 2016, Industry Research.

Page 230Preliminary Draft – Subject to Revision Confidential
Demographic SummaryAdjusted CSA Designation Overview
San Antonio Adjusted
Population / Households – belowaverage
High Income Households – belowaverage
GDP – below average
TV / Radio Population – belowaverage
Corporate Base – below average
APPENDIX C: MLB POTENTIAL
Statistical Measure San AntonioRank of 31
MLB Average - (1)
Number of Major League Teams 2 NA 5.1
2016 Population (000s) 1,197.1 22 1,404.1 2021 Population (000s) 1,294.3 21 1,460.5
2016 Households (000s) 429.4 24 523.7 2021 Households (000s) 466.5 23 546.2
High Income Households (000s) 97.0 24 153.5
Economy Size (GDP - Billions) (US Only) $52.4 23 $78.0
TV Population 1,214.7 18 1,300.6 Radio Population 995.3 15 1,020.8
Companies w/ $20+mm Sales 342 29 647Companies w/ $50+mm Sales (US Only) 167 27 311Companies w/ 500+ Employees 86 23 118
MLB Summary - CSA Designation Overview (Adjusted)
(1) - Average excludes San Antonio.Source: Nielsen 2016, ThinkTV 2016, BLS 2016, Numeris 2015/16, Hoovers 2016, Tetrad 2016, Statistics Canada, and U.S. BEA.

Page 231Preliminary Draft – Subject to Revision Confidential
Adjusted CSA DesignationPopulation and Households
San Antonio would rank 22nd among MLB teams in terms of adjusted population and 24th in adjustedhouseholds
APPENDIX C: MLB POTENTIAL
Team Teams
2016 Population
(000s) Rank
2021 Population
(000s) Rank
2016 Households
(000s) Rank
2021 Households
(000s) RankNew York Mets 11 2,164.0 1 2,217.7 1 797.3 1 818.7 1New York Yankees 11 2,164.0 1 2,217.7 1 797.3 1 818.7 1Los Angeles Angels of Anaheim 9 2,088.4 3 2,183.5 3 675.7 3 706.9 3Los Angeles Dodgers 9 2,088.4 3 2,183.5 3 675.7 3 706.9 3Houston Astros 4 1,718.9 5 1,862.2 5 597.9 9 648.0 7Chicago White Sox 6 1,658.8 6 1,674.4 9 615.5 6 624.3 9Chicago Cubs 6 1,658.8 6 1,674.4 9 615.5 6 624.3 9San Diego Padres 2 1,656.0 8 1,747.4 6 580.4 12 613.3 11Boston Red Sox 5 1,633.7 9 1,682.1 8 638.5 5 659.7 5Atlanta Braves 4 1,597.2 10 1,695.8 7 588.0 10 625.5 8Seattle Mariners 3 1,535.5 11 1,631.5 11 608.7 8 648.6 6Texas Rangers 5 1,505.7 12 1,618.8 12 543.2 14 583.7 13St. Louis Cardinals 2 1,458.6 13 1,473.3 13 585.6 11 594.3 12Philadelphia Phillies 5 1,438.7 14 1,461.7 14 544.9 13 554.7 14Baltimore Orioles 7 1,383.9 15 1,455.8 15 520.3 16 548.0 15Washington Nationals 7 1,383.9 15 1,455.8 15 520.3 16 548.0 15Miami Marlins 5 1,334.0 17 1,416.2 17 504.9 18 535.8 17Detroit Tigers 4 1,329.2 18 1,332.8 18 525.9 15 530.1 18Oakland Athletics 7 1,250.8 19 1,322.1 19 450.8 20 477.6 21San Francisco Giants 7 1,250.8 19 1,322.1 19 450.8 20 477.6 21Toronto Blue Jays 5 1,218.8 21 1,291.7 22 443.6 22 487.3 19San Antonio MLB Team 2 1,197.1 22 1,294.3 21 429.4 24 466.5 23Cleveland Indians 3 1,165.0 23 1,165.6 24 481.0 19 484.5 20Arizona Diamondbacks 4 1,151.6 24 1,238.9 23 422.0 25 455.3 24Cincinnati Reds 2 1,111.2 25 1,132.0 25 434.8 23 443.7 25Milwaukee Brewers 2 1,024.7 26 1,037.4 27 410.4 26 417.8 27Tampa Bay Rays 3 993.3 27 1,048.9 26 408.3 27 430.5 26Pittsburgh Pirates 3 882.8 28 882.4 28 378.8 28 381.5 28Kansas City Royals 3 812.2 29 836.9 29 318.6 29 328.9 29Minnesota Twins 5 777.7 30 811.4 30 303.9 30 318.6 30Colorado Rockies 5 687.5 31 740.4 31 271.9 31 294.3 31
Average (Ex. San Antonio) 1,404.1 1,460.5 523.7 546.2Source: Nielsen 2016, Tetrad 2016.

Page 232Preliminary Draft – Subject to Revision Confidential
Adjusted CSA DesignationIncome
San Antonio is below the MLB average interms of adjusted high income households
APPENDIX C: MLB POTENTIAL
Team Teams
HHs w/ Income
$100,000+ (000s) Rank
New York Mets 11 271.7 1New York Yankees 11 271.7 1Boston Red Sox 5 216.7 3Baltimore Orioles 7 210.2 4Washington Nationals 7 210.2 4Los Angeles Angels of Anaheim 9 195.6 6Los Angeles Dodgers 9 195.6 6Seattle Mariners 3 194.7 8Oakland Athletics 7 185.1 9San Francisco Giants 7 185.1 9San Diego Padres 2 181.1 11Chicago White Sox 6 178.3 12Chicago Cubs 6 178.3 12Houston Astros 4 174.6 14Philadelphia Phillies 5 158.3 15Texas Rangers 5 151.4 16Atlanta Braves 4 145.1 17St. Louis Cardinals 2 140.9 18Detroit Tigers 4 123.9 19Toronto Blue Jays 5 108.4 20Cincinnati Reds 2 106.9 21Miami Marlins 5 106.1 22Cleveland Indians 3 102.0 23San Antonio MLB Team 2 97.0 24Arizona Diamondbacks 4 96.5 25Minnesota Twins 5 95.8 26Milwaukee Brewers 2 95.2 27Pittsburgh Pirates 3 84.9 28Colorado Rockies 5 84.8 29Tampa Bay Rays 3 78.1 30Kansas City Royals 3 76.8 31
Average (Ex. San Antonio) 153.5
Source: Nielsen 2016, Tetrad 2016.
Toronto HHs w/ Income $100,000+ statistic represents HH w/ $125,000+ (CAD) ($94,056+ (USD)).
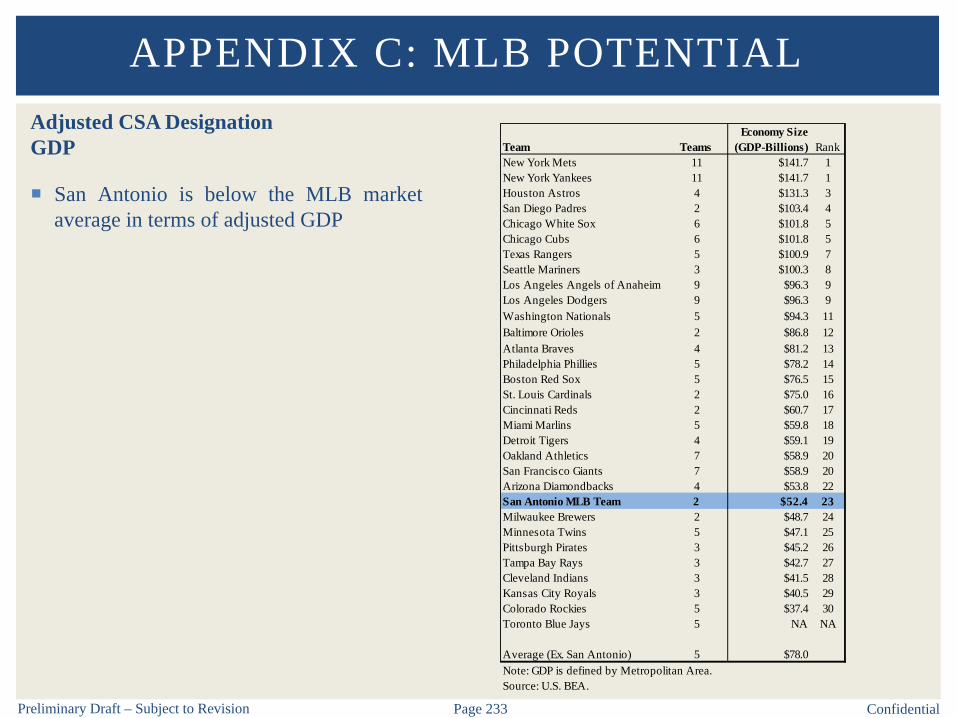
Page 233Preliminary Draft – Subject to Revision Confidential
Adjusted CSA DesignationGDP
San Antonio is below the MLB marketaverage in terms of adjusted GDP
APPENDIX C: MLB POTENTIAL
Team TeamsEconomy Size
(GDP-Billions) RankNew York Mets 11 $141.7 1New York Yankees 11 $141.7 1Houston Astros 4 $131.3 3San Diego Padres 2 $103.4 4Chicago White Sox 6 $101.8 5Chicago Cubs 6 $101.8 5Texas Rangers 5 $100.9 7Seattle Mariners 3 $100.3 8Los Angeles Angels of Anaheim 9 $96.3 9Los Angeles Dodgers 9 $96.3 9Washington Nationals 5 $94.3 11Baltimore Orioles 2 $86.8 12Atlanta Braves 4 $81.2 13Philadelphia Phillies 5 $78.2 14Boston Red Sox 5 $76.5 15St. Louis Cardinals 2 $75.0 16Cincinnati Reds 2 $60.7 17Miami Marlins 5 $59.8 18Detroit Tigers 4 $59.1 19Oakland Athletics 7 $58.9 20San Francisco Giants 7 $58.9 20Arizona Diamondbacks 4 $53.8 22San Antonio MLB Team 2 $52.4 23Milwaukee Brewers 2 $48.7 24Minnesota Twins 5 $47.1 25Pittsburgh Pirates 3 $45.2 26Tampa Bay Rays 3 $42.7 27Cleveland Indians 3 $41.5 28Kansas City Royals 3 $40.5 29Colorado Rockies 5 $37.4 30Toronto Blue Jays 5 NA NA
Average (Ex. San Antonio) 5 $78.0Note: GDP is defined by Metropolitan Area.Source: U.S. BEA.

Page 234Preliminary Draft – Subject to Revision Confidential
Adjusted CSA DesignationMedia Market
San Antonio is below the MLB average interms of adjusted TV and radio population
APPENDIX C: MLB POTENTIAL
Team Teams
TV Population
(000s) Rank
Radio Population
(000s) RankLos Angeles Angels of Anaheim 9 1,818.8 1 1,268.8 7Los Angeles Dodgers 9 1,818.8 1 1,268.8 7New York Mets 11 1,770.7 3 1,479.8 1New York Yankees 11 1,770.7 3 1,479.8 1Houston Astros 4 1,639.8 5 1,386.6 4Atlanta Braves 4 1,557.7 6 1,161.6 12Toronto Blue Jays 5 1,529.9 7 1,064.2 14Chicago White Sox 6 1,511.6 8 1,329.1 5Chicago Cubs 6 1,511.6 8 1,329.1 5Philadelphia Phillies 5 1,481.5 10 914.4 20St. Louis Cardinals 2 1,463.5 11 1,169.1 11Tampa Bay Rays 3 1,462.3 12 861.4 23Seattle Mariners 3 1,431.5 13 1,234.7 9San Diego Padres 2 1,425.4 14 1,405.0 3Texas Rangers 5 1,416.5 15 1,158.8 13Baltimore Orioles 2 1,376.1 16 1,199.8 10Washington Nationals 5 1,262.9 17 970.2 16San Antonio MLB Team 2 1,214.7 18 995.3 15Arizona Diamondbacks 4 1,200.4 19 876.0 22Boston Red Sox 5 1,185.4 20 847.6 24Cleveland Indians 3 1,173.5 21 591.7 28Detroit Tigers 4 1,126.7 22 951.9 17Cincinnati Reds 2 1,071.9 23 905.5 21Milwaukee Brewers 2 1,063.4 24 748.9 26Oakland Athletics 7 929.1 25 943.0 18San Francisco Giants 7 929.1 25 943.0 18Miami Marlins 5 881.7 27 793.8 25Pittsburgh Pirates 3 868.5 28 667.8 27Minnesota Twins 5 842.3 29 582.1 29Colorado Rockies 5 762.9 30 522.2 31Kansas City Royals 3 735.0 31 568.1 30
Average (Ex. San Antonio) 5 1,300.6 1,020.8
Source: ThinkTV 2016, Numeris 2016, Nielsen 2016.Note: TV market data represents the respective DMAs.

Page 235Preliminary Draft – Subject to Revision Confidential
Adjusted CSA DesignationCorporate Base
San Antonio is below the MLBaverage in terms of adjusted largecompanies
APPENDIX C: MLB POTENTIAL
Team Teams
Companies w/ $20mm
Sales Rank
Companies w/ $50mm
Sales Rank
Companies w/ 500+
Employees RankNew York Mets 11 1,085 1 511 1 196 1New York Yankees 11 1,085 1 511 1 196 1Chicago White Sox 6 920 3 458 4 159 5Chicago Cubs 6 920 3 458 4 159 5Houston Astros 4 906 5 485 3 140 9Boston Red Sox 5 827 6 392 6 162 3Los Angeles Angels of Anaheim 9 819 7 365 9 116 15Los Angeles Dodgers 9 819 7 365 9 116 15St. Louis Cardinals 2 775 9 373 8 128 11Toronto Blue Jays 5 707 10 NA NA 74 28Texas Rangers 5 706 11 380 7 133 10Philadelphia Phillies 5 681 12 328 12 160 4Atlanta Braves 4 645 13 353 11 122 14Detroit Tigers 4 631 14 303 13 112 17San Diego Padres 2 629 15 277 17 122 13Baltimore Orioles 7 610 16 283 15 157 7Washington Nationals 7 610 16 283 15 157 7Cleveland Indians 3 569 18 267 20 105 18Oakland Athletics 7 568 19 273 18 100 19San Francisco Giants 7 568 19 273 18 100 19Cincinnati Reds 2 554 21 287 14 95 21Milwaukee Brewers 2 535 22 253 21 91 22Seattle Mariners 3 518 23 236 22 126 12Miami Marlins 5 484 24 221 23 84 25Minnesota Twins 5 450 25 217 24 76 27Pittsburgh Pirates 3 418 26 196 25 80 26Kansas City Royals 3 396 27 195 26 68 30Arizona Diamondbacks 4 342 28 150 30 85 24San Antonio MLB Team 2 342 29 167 27 86 23Colorado Rockies 5 324 30 165 28 55 31Tampa Bay Rays 3 318 31 155 29 72 29
Average (Ex. San Antonio) 647 311 118Note: Toronto statistic represents Companies with $20mm (CAD) sales. Source: Hoovers 2016, Tetrad 2016.

Page 236Preliminary Draft – Subject to Revision Confidential
MLB Relocation CandidatesOverview
The following teams could potentially be considered relocation candidates
Oakland Athletics – seeking new stadium (uncertain status)
Tampa Bay Rays – seeking new stadium (uncertain status)
Although additional teams have leases that are expiring (or close to expiring), the following teams areunlikely to relocate outside of their MLB territory
Seattle Mariners – lease expiring – highly unlikely to relocate outside of territory
Colorado Rockies – lease expiring – highly unlikely to relocate outside of territory
Los Angeles Angels of Anaheim – lease expiring – highly unlikely to relocate outside of territory
Arizona Diamondbacks – lease controversy – highly unlikely to relocate outside of territory
APPENDIX C: MLB POTENTIAL

Page 237Preliminary Draft – Subject to Revision Confidential
Oakland AthleticsOakland-Alameda Coliseum
The Oakland Athletics play their home games at Oakland-Alameda Coliseum. The stadium opened in1966 and is shared with the NFL Oakland Raiders. It was renovated in 1996, and has changed namesseveral times. The term of the lease agreement is 10 years ending in December of 2024, but the team hasthe ability to terminate the lease with one calendar year (plus the remainder of current calendar year)warning. If the Raiders build a new stadium, new terms may be negotiated, and the Authority canterminate the lease with two years warning. The Athletics are currently exploring new stadium options.
APPENDIX C: MLB POTENTIAL
Stadium: Oakland-Alameda Coliseum
Year Open/Renovated: 1966 / 1996
Stadium Owner: Oakland-Alameda County ColiseumAuthority
Lease Term: 10 Years (Through 2024)
Total Cost: $25.5 million / $200 million
Public Investment: 100%
Private Investment: 0%
Cost Overrun Responsibility: Authority
New Construction/Renovation: Renovation
Contractor: Guy F. Atkinson Company
Architect: Skidmore, Owings, and Merrill
Management: AEG
Concessionaire: Ovations
Total Seating Capacity: 63,024
Luxury Suites: 147
Club Seats: 721
Controlled Parking: 9,600
Roof Type: Open-Air
Playing Surface: Grass
Sources: Oakland-Alameda County Coliseum Authority, internal database, and industry research.

Page 238Preliminary Draft – Subject to Revision Confidential
Oakland AthleticsOakland-Alameda Coliseum
The terms included summarizethe occupancy costs for theteam, except where noted (leaseterms for other events are notincluded):
APPENDIX C: MLB POTENTIAL
Stadium RentMinimum RentBase RentAdditional Rent
Taxes/SurchargesTicket Sales TaxTicket SurchargeAdmissions TaxParking Tax/Surcharge
Revenue SharingConcessionsNoveltiesAdvertising – Game Day AdvertisingAdvertising – PermanentTelevisionNaming RightsParkingLuxury Suites – TicketsLuxury Suites – PremiumClub Seats – TicketsClub Seats – Premium
Stadium ExpensesGame Day Operating ExpensesAnnual Operating ExpensesCapital Repairs/Improvements
Public Sector Share0%0%
0% - (2)0%0%
100%0%0%0%0%0%
0%100% - (3)
100%
Amount Paid by TeamNot Applicable
(1)Not Applicable
Not ApplicableNot ApplicableNot Applicable Not Applicable
Team Share100%100%100%100%100%
0%100%100%100%100%100%
100%0%
0% - (4)

Page 239Preliminary Draft – Subject to Revision Confidential
Oakland AthleticsOakland-Alameda Coliseum
1) License Fees are as follows2015: $1.25 million2016-2019: $1.5 million2020-2024: $1.25 million
2) The Raiders have some signage as well. Authority also pays the team $200,000 per year for rights to selladvertising on the Scoreboard Caps.
3) Authority must spend at least $1,000,000 (5% escalation over previous year’s budgeted amount) into a StadiumMaintenance Fund. $150,000 of this is directed by the team.
4) Team was required to spend at least $10 million on video boards.
APPENDIX C: MLB POTENTIAL

Page 240Preliminary Draft – Subject to Revision Confidential
Tampa Bay RaysTropicana Field
The Tampa Bay Rays play their home games at Tropicana Field, which was built in 1990 andsignificantly renovated when an expansion MLB franchise was awarded to the Tampa / St. Petersburgarea. The team began play in 1998 and the team’s lease runs through 2027. The Rays are currentlyexploring new stadium options.
APPENDIX C: MLB POTENTIAL
Stadium: Tropicana Field
Year Open/Renovated: 1990 / 1998
Stadium Owner: City of St. Petersburg
Lease Term: 30 years
Total Cost: $223 million (1990 plus 1998)
Public Investment: $209 million
Private Investment: $14 million
Cost Overrun Responsibility: Public
New Construction/Renovation: Renovation
Contractor: Huber, Hunt & Nichols
Architect: HOK Sport+Venue+Event (Populous)
Management: Tampa Bay Rays
Concessionaire: Centerplate
Total Seating Capacity: 34,078
Luxury Suites: 58
Club Seats: 300
Controlled Parking: TBD
Roof Type: Dome
Playing Surface: Turf
Sources: , and industry research.

Page 241Preliminary Draft – Subject to Revision Confidential
MLB Relocation CandidatesDemographic Comparison
The following table summarizes thedemographic characteristics of SanAntonio, Oakland, and Tampa Bay
San Antonio ranks below the other twomarkets in terms of population,household, media, and corporate basecharacteristics
San Antonio is growing at a rate fasterthan the other two markets in terms ofpopulation and household growth
APPENDIX C: MLB POTENTIAL
CSA DemographicsSan Antonio MLB Team
Oakland Athletics
Tampa Bay Rays
2016 Population (000s) 2,394.2 8,755.7 2,979.82021 Population (000s) 2,588.7 9,254.5 3,146.8Est. % Growth 2016-2021 8.12% 5.70% 5.60%
2016 Households (000s) 858.8 3,155.9 1,224.82021 Households (000s) 933.0 3,343.2 1,291.4Est. % Growth 2016-2021 8.64% 5.93% 5.44%
Average Household Income $72,810 $116,035 $67,514Median Household Income $54,437 $80,974 $47,911HHs w/ Income $100,000+ (000s) 194.1 1,295.6 234.3
Average Age 36.7 39.1 41.9Median Age 34.9 38.6 42.4
Unemployment Rate 3.40% 3.80% 4.50%
Economy Size (GDP-Billions) $104.8 $412.0 $128.2
Cost of Living Index 86.5 147.3 92.3
TV Population (000s) 2,429.4 6,503.4 4,386.9Radio Population (000s) 1,990.6 6,601.3 2,584.3
Companies w/ $20mm Sales 684 3,976 955Companies w/ $50mm Sales 333 1,910 466Companies w/ 500+ Employees 172 699 217Source: Nielsen 2016, ThinkTV 2016, BLS 2016, Numeris 2015/16, Hoovers 2016, Tetrad 2016, Statistics Canada, The Council for Community and Economic Research 2016, and U.S. BEA.

Page 242Preliminary Draft – Subject to Revision Confidential
MLB Relocation CandidatesDemographic Comparison
After adjusting for the number of teamsin the market, San Antoniodemographic characteristics improve
APPENDIX C: MLB POTENTIAL
Adjusted CSA DemographicsSan Antonio MLB Team
Oakland Athletics
Tampa Bay Rays
# of Teams 2 7 3
2016 Population (000s) 1,197.1 1,250.8 993.32021 Population (000s) 1,294.3 1,322.1 1,048.9
2016 Households (000s) 429.4 450.8 408.32021 Households (000s) 466.5 477.6 430.5
HHs w/ Income $100,000+ (000s) 97.0 185.1 78.1
Economy Size (GDP-Billions) $52.4 $58.9 $42.7
TV Population (000s) 1,214.7 929.1 1,462.3Radio Population (000s) 995.3 943.0 861.4
Companies w/ $20mm Sales 342 568 318Companies w/ $50mm Sales 167 273 155Companies w/ 500+ Employees 86 100 72Source: Nielsen 2016, ThinkTV 2016, BLS 2016, Numeris 2015/16, Hoovers 2016, Tetrad 2016, Statistics Canada, The Council for Community and Economic Research 2016, and U.S. BEA.

Page 243Preliminary Draft – Subject to Revision Confidential
MLB ExpansionOverview
MLB Commissioner Rob Manfred has indicated that expansion to 32 teams is inevitable but that it is“on the backburner” until Oakland and Tampa Bay resolve their stadium situations
“The Tampa and Oakland situations have to be resolved. Both of those clubs need new majorleague quality facilities”
Markets that have been mentioned for expansion include the following:
Mexico City (Mexico) Montreal (Canada) Charlotte Las Vegas Monterrey (Mexico) Northern New Jersey Oklahoma City Portland San Antonio
APPENDIX C: MLB POTENTIAL

Page 244Preliminary Draft – Subject to Revision Confidential
MLB ExpansionPotential Expansion Market Demographic Comparison
The following table summarizes the demographic characteristics of San Antonio compared to otherpotential markets
San Antonio is one of the smallest potential markets evaluated
APPENDIX C: MLB POTENTIAL
CSA DemographicsSan Antonio MLB Team Rank
Northern New Jersey Rank
Mexico City (1) Rank Monterrey (2) Rank Montreal Rank Portland Rank Charlotte Rank Las Vegas Rank
Oklahoma City Rank
Average (Ex. San Antonio)
2016 Population (000s) 2,394.2 7 23,803.8 1 20,976.7 2 4,344.2 3 4,061.0 4 3,109.1 5 2,593.8 6 2,366.7 8 1,437.7 9 7,836.62021 Population (000s) 2,588.7 5 24,394.6 1 NA NA NA NA 4,276.1 2 3,272.8 3 2,766.5 4 2,510.2 6 1,524.1 7 6,457.4Est. % Growth 2016-2021 8.12% 1 2.48% 7 NA NA NA NA 5.30% 5 5.26% 6 6.66% 2 6.06% 3 6.00% 4 5.30%
2016 Households (000s) 858.8 6 8,770.6 1 NA NA NA NA 1,757.9 2 1,207.1 3 994.3 4 873.6 5 560.5 7 2,360.62021 Households (000s) 933.0 5 9,005.2 1 NA NA NA NA 1,889.0 2 1,274.2 3 1,061.1 4 926.2 6 594.6 7 2,458.4Est. % Growth 2016-2021 8.64% 1 2.68% 7 NA NA NA NA 7.46% 2 5.56% 6 6.73% 3 6.02% 5 6.08% 4 5.75%
Average Household Income $72,810 4 $98,595 1 NA NA NA NA $57,259 7 $77,475 2 $75,441 3 $65,295 6 $71,131 5 $74,199Median Household Income $54,437 3 $68,168 1 NA NA NA NA $43,182 7 $59,364 2 $53,647 4 $49,764 6 $52,918 5 $54,507HHs w/ Income $100,000+ (000s) 194.1 5 2,988.9 1 NA NA NA NA 254.5 3 302.6 2 228.9 4 155.7 6 118.4 7 674.8
Average Age 36.7 6 39.4 1 NA NA NA NA NA NA 38.8 2 38.0 4 38.8 2 37.2 5 38.4Median Age 34.9 7 38.9 2 NA NA NA NA 39.5 1 38.1 3 37.7 5 38.1 3 35.5 6 38.0
Unemployment Rate 3.40% 7 5.10% 3 NA NA NA NA 7.30% 1 4.70% 5 5.10% 3 6.10% 2 3.90% 6 5.37%
Economy Size (GDP-Billions) $104.8 6 $1,558.5 1 403.6 2 $122.9 5 NA NA $159.3 3 $143.6 4 $94.5 7 $72.6 8 $365.0
Cost of Living Index 86.5 5 199.3 1 NA NA NA NA NA NA 130.6 2 92.7 4 106.5 3 84.7 6 122.8
TV Population (000s) 2,429.4 5 19,478.2 1 NA NA NA NA 4,856.6 2 2,818.5 4 2,925.0 3 1,955.9 6 1,708.1 7 5,623.7Radio Population (000s) 1,990.6 5 16,278.3 1 NA NA NA NA 3,536.0 2 2,257.3 3 2,205.4 4 1,785.8 6 1,230.4 7 4,548.9
Companies w/ $20mm Sales 684 5 11,936 1 NA NA NA NA 2,370 2 1,175 3 1,024 4 540 6 531 7 2,929Companies w/ $50mm Sales 333 4 5,624 1 NA NA NA NA NA NA 552 2 518 3 260 6 261 5 1,443Companies w/ 500+ Employees 172 5 2,159 1 NA NA NA NA 219 3 225 2 168 6 183 4 135 7 515(1) - Mexico City data represents the 2014 demographics for the Mexico city urban area.(2) - Monterrey data represents the 2014 demographics for the municipality of Monterrey.
Source: Nielsen 2016, Brookings, ThinkTV 2016, BLS 2016, Numeris 2015/16, Hoovers 2016, Tetrad 2016, Statistics Canada, The Council for Community and Economic Research 2016, and U.S. BEA.Note: Canadian average/median income statistics were multiplied by IRS 2015 Average CAD-USD Exchange Rate of .75245. Canadian HHs w/ Income $100,000+ statistics represent HH w/ $125,000+ (CAD) ($94,056+ (USD)).

Page 245Preliminary Draft – Subject to Revision Confidential
MLB ExpansionPotential Expansion Market Demographic Comparison
After adjusting for the number of teams in the market, San Antonio rankings improve
APPENDIX C: MLB POTENTIAL
Adjusted CSA DemographicsSan Antonio MLB Team Rank
Northern New Jersey Rank
Mexico City (1) Rank Monterrey (2) Rank Montreal Rank Portland Rank Charlotte Rank Las Vegas Rank
Oklahoma City Rank
Average (Ex. San Antonio)
# of Teams 2 12 4 2 4 3 3 2 2
2016 Population (000s) 1,197.1 4 1,983.6 3 5,244.2 1 2,172.1 2 1,015.3 7 1,036.4 6 864.6 8 1,183.4 5 718.9 9 1,777.32021 Population (000s) 1,294.3 2 2,032.9 1 NA NA NA NA 1,069.0 5 1,090.9 4 922.2 6 1,255.1 3 762.0 7 1,188.7
2016 Households (000s) 429.4 4 730.9 1 NA NA NA NA 439.5 2 402.4 5 331.4 6 436.8 3 280.2 7 436.92021 Households (000s) 466.5 3 750.4 1 NA NA NA NA 472.2 2 424.7 5 353.7 6 463.1 4 297.3 7 460.3
HHs w/ Income $100,000+ (000s) 97.0 3 249.1 1 NA NA NA NA 63.6 6 100.9 2 76.3 5 77.9 4 59.2 7 104.5
Economy Size (GDP-Billions) $52.4 3 $129.9 1 NA NA NA NA NA NA $53.1 2 $47.9 4 $47.3 5 $36.3 6 62.9
TV Population (000s) 1,214.7 2 1,623.2 1 NA NA NA NA 1,214.2 3 939.5 6 975.0 5 977.9 4 854.0 7 1,097.3Radio Population (000s) 995.3 2 1,356.5 1 NA NA NA NA 884.0 4 752.4 5 735.1 6 892.9 3 615.2 7 872.7
Companies w/ $20mm Sales 342 4 995 1 NA NA NA NA 593 2 392 3 341 5 270 6 266 7 475.9Companies w/ $50mm Sales 167 4 469 1 NA NA NA NA NA NA 184 2 173 3 130 6 131 5 217.2Companies w/ 500+ Employees 86 3 180 1 NA NA NA NA 55 7 75 4 56 6 92 2 68 5 87.4(1) - Mexico City data represents the 2014 demographics for the Mexico city urban area.(2) - Monterrey data represents the 2014 demographics for the municipality of Monterrey. Note: Canadian average/median income statistics were multiplied by IRS 2015 Average CAD-USD Exchange Rate of .75245. Canadian HHs w/ Income $100,000+ statistics represent HH w/ $125,000+ (CAD) ($94,056+ (USD)). Source: Nielsen 2016, Brookings, ThinkTV 2016, Numeris 2015/16, Hoovers 2016, Tetrad 2016, Statistics Canada, and U.S. BEA.

Page 246Preliminary Draft – Subject to Revision Confidential
Review of Premier Partnerships Report
BSG has completed a limited review (see below) of the 2011 Bexar County and San Antonio MajorLeague Baseball Analysis
It is important to note that only two of the nine appendices listed in the table of contents wereincluded in the report
The report concluded that San Antonio would have to invest a significant amount of money into a newMLB stadium and that the best option would be a Triple-A team
Report indicates San Antonio is not yet ready for a MLB team
APPENDIX C: MLB POTENTIAL

Page 247Preliminary Draft – Subject to Revision Confidential
Review of Premier Partnerships Report (Continued)
BSG generally agrees with Premier Partnerships’ conclusions, despite some minor differences inmethodology
The report relies heavily on Forbes data, which is typically not reflective of teams’ actualoperating characteristics
The report generally presents renovation as a viable alternative to new stadium construction with ahigh return on investment; however, it is important to note that in small MLB markets majorrenovations often fail to generate a similar impact that comes with a new stadium (no apparentrenovation option in San Antonio)
Cannibalization of the San Antonio Spurs’ fans may be somewhat overstated
Long history / loyalty of Spurs’ fans Limited overlap of seasons
The report contradicts itself by indicating that stadiums without naming rights deals are found inlarger markets then stating that there is no correlation between the two
Information about multi-use stadiums (football / baseball) and potential efficiencies is presented ina misleading manner – two such stadiums do not represent a significant sample size
APPENDIX C: MLB POTENTIAL

Page 248Preliminary Draft – Subject to Revision Confidential
MLB PotentialGeneral Observations
San Antonio would be one of the smallest markets in MLB in terms of: Population Households High income households Economy size Media market Corporate base
San Antonio’s income levels would be among the lowest in MLB
San Antonio is near the MLB average in terms of key demographic ratios
Population per seat Large companies per suite Below average in terms of high income households per club seat (Alamodome)
San Antonio ranks more favorably in terms of adjusted demographics, but would still be below theMLB average in terms of each measurement of market size
APPENDIX C: MLB POTENTIAL

Page 249Preliminary Draft – Subject to Revision Confidential
MLB PotentialGeneral Observations
Limited options for MLB team relocation (Oakland A’s / Tampa Rays)
MLB may expand in the future (timing not certain) – Commissioner Manfred has indicated that anyexpansion plans are on hold until stadium issues are resolved for the Oakland A’s and the Tampa Rays
San Antonio is one of the smaller potential relocation / expansion markets San Antonio market is growing rapidly
Given the size of the market, attracting a MLB team would likely require a significant publicinvestment and favorable lease terms
APPENDIX C: MLB POTENTIAL

LIMITING CONDITIONS AND
ASSUMPTIONS

Page 251Preliminary Draft – Subject to Revision Confidential
This analysis is subject to our contractual terms, as well as the following limiting conditions and assumptions:
The analysis has been prepared for internal decision making purposes of the Client only and shall not be used for any other purposeswithout the prior written permission of Barrett Sports Group, LLC.
The analysis includes findings and recommendations; however, all decisions in connection with the implementation of such findingsand recommendations shall be Client’s responsibility.
Ownership and management of the stadium are assumed to be in competent and responsible hands. Ownership and management canmaterially impact the findings of this analysis.
Any estimates of historical or future prices, revenues, rents, expenses, occupancy, net operating income, mortgage debt service, capitaloutlays, cash flows, inflation, capitalization rates, yield rates or interest rates are intended solely for analytical purposes and are not tobe construed as predictions of the analysts. They represent only the judgment of the authors based on information provided by operatorsand owners active in the market place, and their accuracy is in no way guaranteed.
Our work has been based in part on review and analysis of information provided by unrelated sources which are believed accurate, butcannot be assured to be accurate. No audit or other verification has been completed.
Current and anticipated market conditions are influenced by a large number of external factors. We have not knowingly withheld anypertinent facts, but we do not guarantee that we have knowledge of all factors which might influence the operating potential of thefacility. Due to rapid changes in the external factors, the actual results may vary significantly from estimates presented in this report.
The analysts reserve the right to make such adjustments to the analyses, opinions, and conclusions set forth in this report as may berequired by consideration of additional data or more reliable data which may become available.
The analysis is intended to be read and used as a whole and not in parts. Separation of any section or page from the main body of thereport is expressly forbidden and invalidates the analysis.
Possession of the analysis does not carry with it the right of publication. It shall be used for its intended purpose only and by the partiesto whom it is addressed. Other parties should not rely on the findings of this report for any purpose and should perform their own duediligence.
Our performance of the tasks completed does not constitute an opinion of value or appraisal, or a projection of financial performance oraudit of the facility in accordance with generally accepted audit standards. Estimates of value (ranges) have been prepared to illustratecurrent and possible future market conditions.
The analysis shall not be used in any matters pertaining to any financing, or real estate or other securities offering, registration, orexemption with any state or with the federal Securities and Exchange Commission.
No liability is assumed for matters which are legal or environmental in nature.
LIMITING CONDITIONS AND ASSUMPTIONS