city of roanoke r housing a
TRANSCRIPT
CITY OF ROANOKE
REDEVELOPMENT AND
HOUSING AUTHORITY
MONTHLY OPERATIONS REPORT
FOR THE MONTH OF DECEMBER 2018
JANUARY 28, 2019
MEMORANDUM
To: Board of Commissioners
From: Glenda Edwards Goh, Executive Director
Date: January 22, 2019 Subject: Monthly Operations Reports
Enclosed for your information and review are operations reports from each department for the month of December 2018. The reports are as follows:
Executive Office ............................................................................ Section 1 Executive Director’s Report Human Resources and Administration.......................................... Section 2 Human Resources Workers’ Compensation Section 3 Activities Finance Division ........................................................................... Section 3 Financial Narrative Report Financial Statements and Activity Operations Division ....................................................................... Section 4
Procurement Redevelopment and Revitalization
Housing Division ........................................................................... Section 5 Public Housing Operations Security Activities Section 8 Operations Resident Services

EXECUTIVE OFFICE

1
Executive Director’s Report
Federal Budget
The partial shutdown of the federal government is continuing. Although the House approved a FY 2019 Transportation, Housing and Urban Development (T-HUD) funding bill on January 10, 2019, which reportedly mirrored the T-HUD funding bill approved by the Senate last year, it appears very unlikely that any further action will be taken toward approving the bill at the present time.
According to the National Association of Housing and Redevelopment Officials (NAHRO), HUD has enough money to ensure that February payments for the Housing Choice Voucher (HCV) program and the public housing Operating Fund will be made available to public housing authorities. HUD intends to make those payments on time. NAHRO also stated that there is not currently enough money to make HCV and Operating Fund payments for March, if the government shutdown continues until then.
Due to the shutdown, RRHA has not been notified of the status of renewal funding for the Family Self-Sufficiency (FSS) program for calendar year 2019. RRHA will fund the FSS program from operations in the short-term, anticipating that renewal funding will be announced shortly after HUD operations resume.
Audit
Auditors from Jump, Perry and Company, L.L.P., conducted field work on site at RRHA during the week of December 10, 2018, for the annual independent audit for the year ending September 30, 2018.
Software Update
Yardi Systems staff has substantially completed setup of Rent Café, the portal for RRHA to accept online applications for the HCV program. Yardi will provide training to RRHA staff, and RRHA staff will train community partners who will be involved in assisting individuals with completing applications.
Allowing time for training and publicizing the application process, RRHA anticipates accepting applications for the HCV program by mid-February 2019.
RRHA Agency Plan
During the month of February 2019, RRHA will begin the planning process for the 2019 Annual Plan update to the 2015-2019 Agency Plan required by HUD. The planning process will focus on the HUD-funded Public Housing and Section 8 programs. Community meetings will be scheduled to gather input from residents of all public housing sites as well as Section 8 participants and landlords beginning in late February 2019. Commissioners are invited to attend these community meetings, and the schedule of meetings has been provided to Commissioners.
The RRHA Board of Commissioners is required to hold a public hearing prior to adoption of the 2019 Annual Plan update to the 2015-2019 Agency Plan, which must be submitted to HUD by July 18, 2019.

HUMAN RESOURCES AND
ADMINISTRATION DIVISION

HUMAN RESOURCES
MONTHLY REPORT
DECEMBER 2018
1
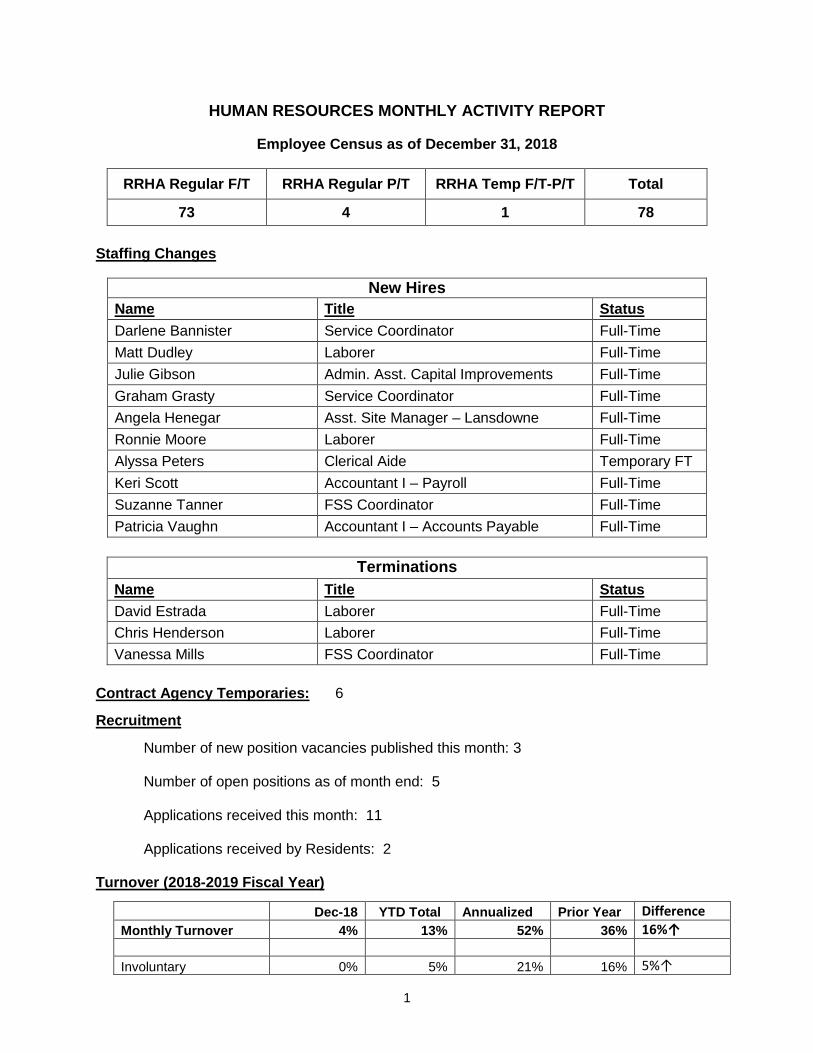
HUMAN RESOURCES MONTHLY ACTIVITY REPORT
Employee Census as of December 31, 2018
RRHA Regular F/T RRHA Regular P/T RRHA Temp F/T-P/T Total
73 4 1 78
Staffing Changes
New Hires
Name Title Status
Darlene Bannister Service Coordinator Full-Time
Matt Dudley Laborer Full-Time
Julie Gibson Admin. Asst. Capital Improvements Full-Time
Graham Grasty Service Coordinator Full-Time
Angela Henegar Asst. Site Manager – Lansdowne Full-Time
Ronnie Moore Laborer Full-Time
Alyssa Peters Clerical Aide Temporary FT
Keri Scott Accountant I – Payroll Full-Time
Suzanne Tanner FSS Coordinator Full-Time
Patricia Vaughn Accountant I – Accounts Payable Full-Time
Terminations
Name Title Status
David Estrada Laborer Full-Time
Chris Henderson Laborer Full-Time
Vanessa Mills FSS Coordinator Full-Time
Contract Agency Temporaries: 6
Recruitment
Number of new position vacancies published this month: 3 Number of open positions as of month end: 5 Applications received this month: 11 Applications received by Residents: 2
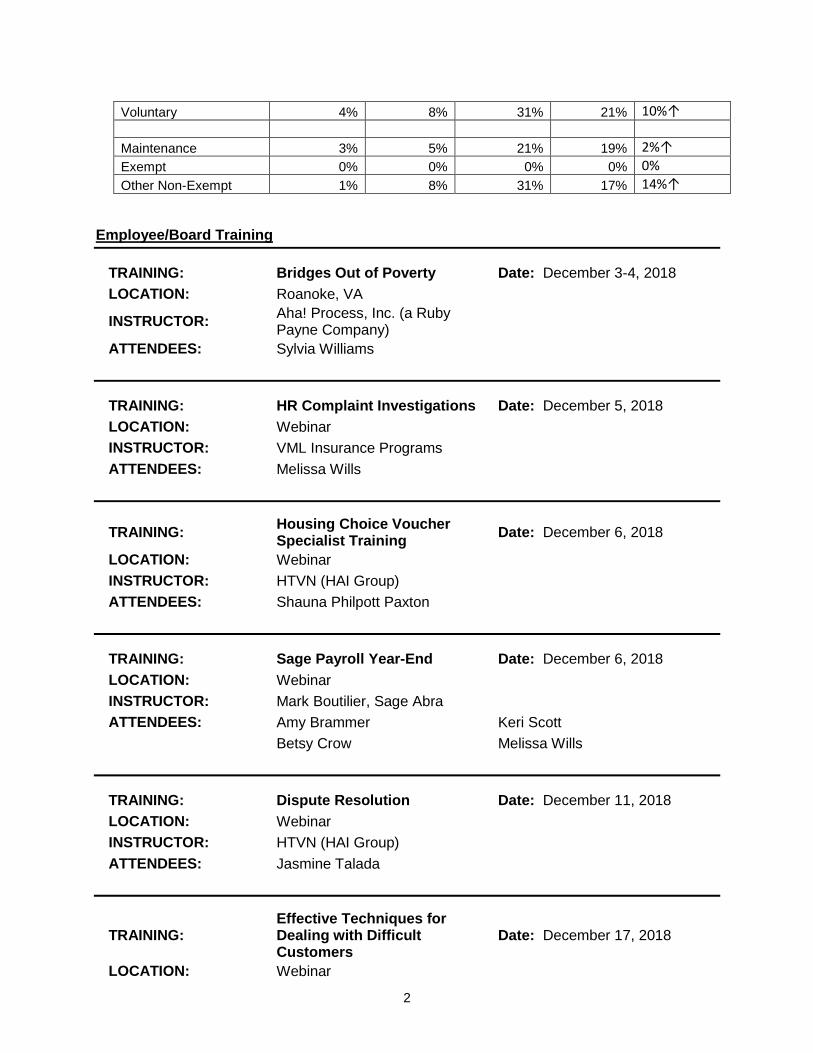
Turnover (2018-2019 Fiscal Year)
Dec-18 YTD Total Annualized Prior Year Difference
Monthly Turnover 4% 13% 52% 36% 16%↑
Involuntary 0% 5% 21% 16% 5%↑
2
Voluntary 4% 8% 31% 21% 10%↑
Maintenance 3% 5% 21% 19% 2%↑
Exempt 0% 0% 0% 0% 0%
Other Non-Exempt 1% 8% 31% 17% 14%↑
Employee/Board Training
TRAINING: Bridges Out of Poverty Date: December 3-4, 2018
LOCATION: Roanoke, VA
INSTRUCTOR: Aha! Process, Inc. (a Ruby Payne Company)
ATTENDEES: Sylvia Williams
TRAINING: HR Complaint Investigations Date: December 5, 2018
LOCATION: Webinar
INSTRUCTOR: VML Insurance Programs
ATTENDEES: Melissa Wills
TRAINING: Housing Choice Voucher Specialist Training
Date: December 6, 2018
LOCATION: Webinar
INSTRUCTOR: HTVN (HAI Group)
ATTENDEES: Shauna Philpott Paxton
TRAINING: Sage Payroll Year-End Date: December 6, 2018
LOCATION: Webinar
INSTRUCTOR: Mark Boutilier, Sage Abra
ATTENDEES: Amy Brammer Keri Scott
Betsy Crow Melissa Wills
TRAINING: Dispute Resolution Date: December 11, 2018
LOCATION: Webinar
INSTRUCTOR: HTVN (HAI Group)
ATTENDEES: Jasmine Talada
TRAINING: Effective Techniques for Dealing with Difficult Customers
Date: December 17, 2018
LOCATION: Webinar
3
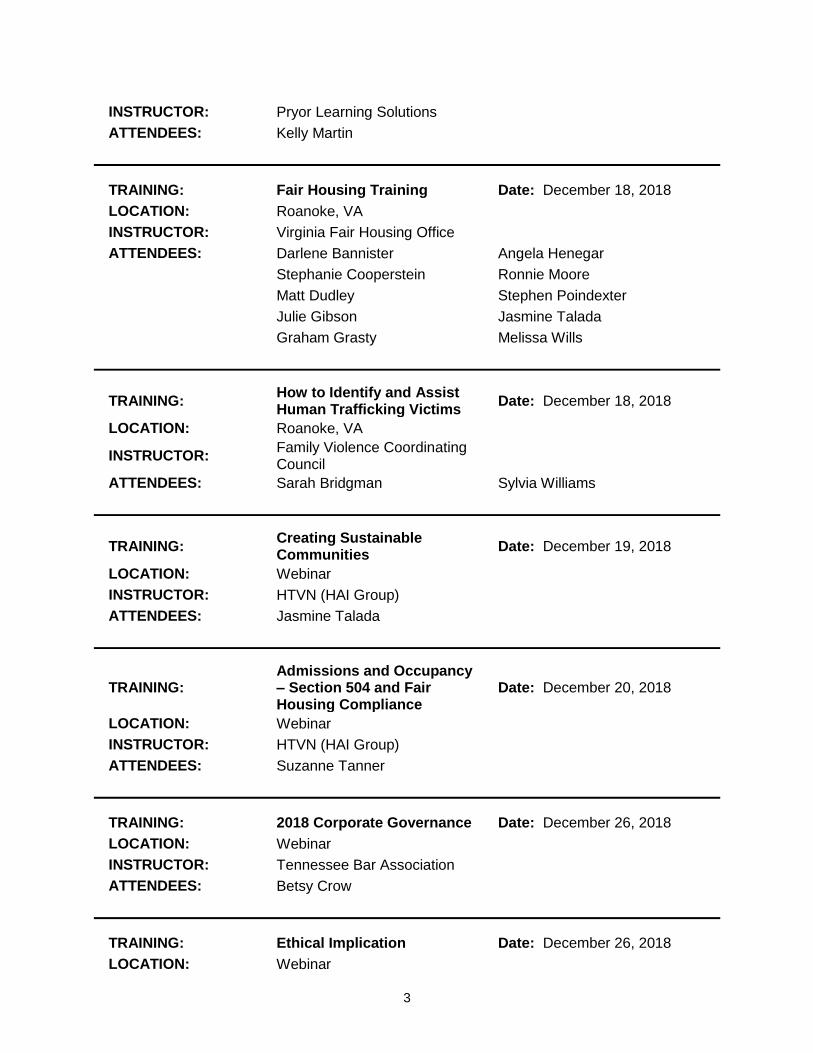
INSTRUCTOR: Pryor Learning Solutions
ATTENDEES: Kelly Martin
TRAINING: Fair Housing Training Date: December 18, 2018
LOCATION: Roanoke, VA
INSTRUCTOR: Virginia Fair Housing Office
ATTENDEES: Darlene Bannister Angela Henegar
Stephanie Cooperstein Ronnie Moore
Matt Dudley Stephen Poindexter
Julie Gibson Jasmine Talada
Graham Grasty Melissa Wills
TRAINING: How to Identify and Assist Human Trafficking Victims
Date: December 18, 2018
LOCATION: Roanoke, VA
INSTRUCTOR: Family Violence Coordinating Council
ATTENDEES: Sarah Bridgman Sylvia Williams
TRAINING: Creating Sustainable Communities
Date: December 19, 2018
LOCATION: Webinar
INSTRUCTOR: HTVN (HAI Group)
ATTENDEES: Jasmine Talada
TRAINING: Admissions and Occupancy – Section 504 and Fair Housing Compliance
Date: December 20, 2018
LOCATION: Webinar
INSTRUCTOR: HTVN (HAI Group)
ATTENDEES: Suzanne Tanner
TRAINING: 2018 Corporate Governance Date: December 26, 2018
LOCATION: Webinar
INSTRUCTOR: Tennessee Bar Association
ATTENDEES: Betsy Crow
TRAINING: Ethical Implication Date: December 26, 2018
LOCATION: Webinar
4
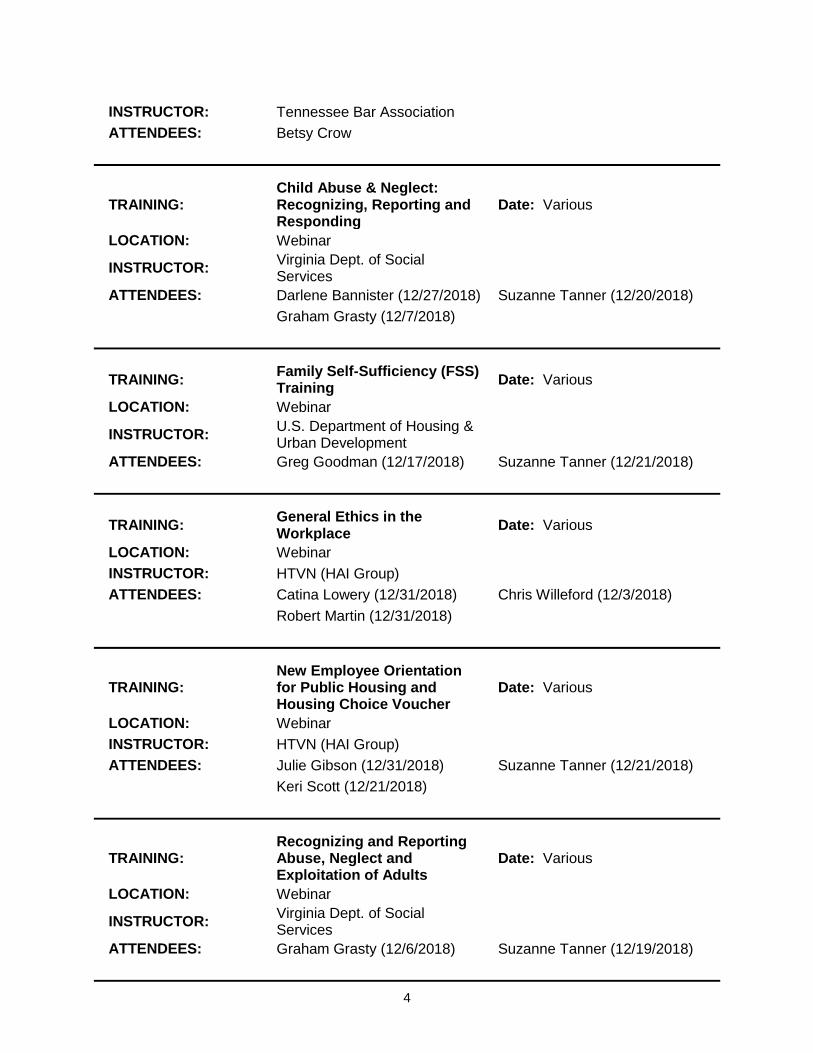
INSTRUCTOR: Tennessee Bar Association
ATTENDEES: Betsy Crow
TRAINING: Child Abuse & Neglect: Recognizing, Reporting and Responding
Date: Various
LOCATION: Webinar
INSTRUCTOR: Virginia Dept. of Social Services
ATTENDEES: Darlene Bannister (12/27/2018) Suzanne Tanner (12/20/2018)
Graham Grasty (12/7/2018)
TRAINING: Family Self-Sufficiency (FSS) Training
Date: Various
LOCATION: Webinar
INSTRUCTOR: U.S. Department of Housing & Urban Development
ATTENDEES: Greg Goodman (12/17/2018) Suzanne Tanner (12/21/2018)
TRAINING: General Ethics in the Workplace
Date: Various
LOCATION: Webinar
INSTRUCTOR: HTVN (HAI Group)
ATTENDEES: Catina Lowery (12/31/2018) Chris Willeford (12/3/2018)
Robert Martin (12/31/2018)
TRAINING: New Employee Orientation for Public Housing and Housing Choice Voucher
Date: Various
LOCATION: Webinar
INSTRUCTOR: HTVN (HAI Group)
ATTENDEES: Julie Gibson (12/31/2018) Suzanne Tanner (12/21/2018)
Keri Scott (12/21/2018)
TRAINING: Recognizing and Reporting Abuse, Neglect and Exploitation of Adults
Date: Various
LOCATION: Webinar
INSTRUCTOR: Virginia Dept. of Social Services
ATTENDEES: Graham Grasty (12/6/2018) Suzanne Tanner (12/19/2018)
5
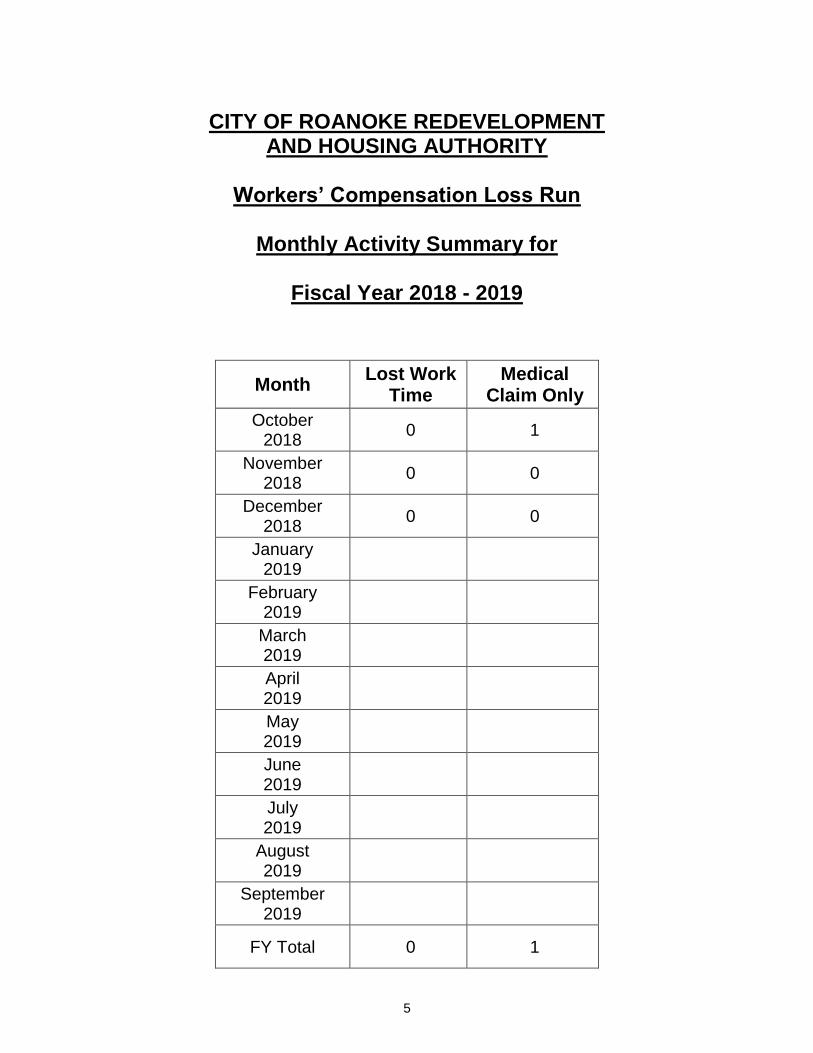
CITY OF ROANOKE REDEVELOPMENT AND HOUSING AUTHORITY
Workers’ Compensation Loss Run
Monthly Activity Summary for
Fiscal Year 2018 - 2019
Month Lost Work
Time Medical
Claim Only
October 2018
0 1
November 2018
0 0
December 2018
0 0
January 2019
February 2019
March 2019
April 2019
May 2019
June 2019
July 2019
August 2019
September 2019
FY Total 0 1
SECTION 3 ACTIVITIES
MONTHLY REPORT
DECEMBER 2018
6
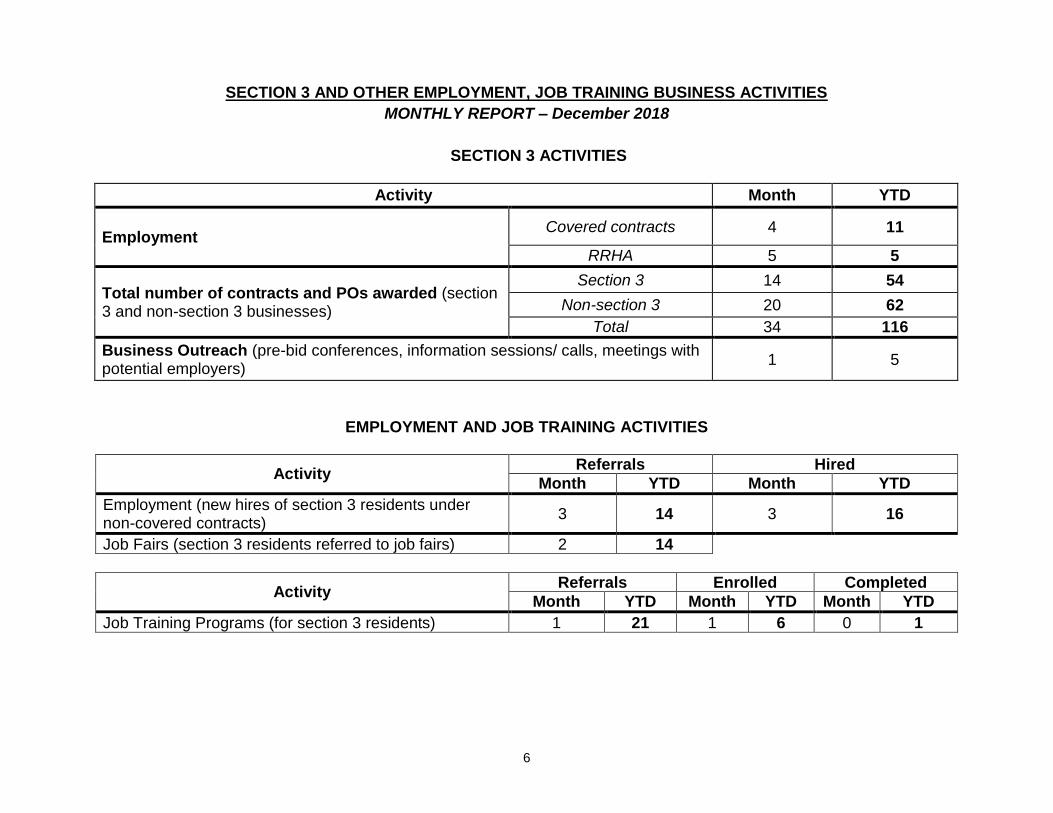
SECTION 3 AND OTHER EMPLOYMENT, JOB TRAINING BUSINESS ACTIVITIES
MONTHLY REPORT – December 2018
SECTION 3 ACTIVITIES
Activity Month YTD
Employment Covered contracts 4 11
RRHA 5 5
Total number of contracts and POs awarded (section 3 and non-section 3 businesses)
Section 3 14 54
Non-section 3 20 62
Total 34 116
Business Outreach (pre-bid conferences, information sessions/ calls, meetings with potential employers)
1 5
EMPLOYMENT AND JOB TRAINING ACTIVITIES
Activity Referrals Hired
Month YTD Month YTD
Employment (new hires of section 3 residents under non-covered contracts)
3 14 3 16
Job Fairs (section 3 residents referred to job fairs) 2 14
Activity Referrals Enrolled Completed
Month YTD Month YTD Month YTD
Job Training Programs (for section 3 residents) 1 21 1 6 0 1

FINANCE DIVISION

DEPARTMENT OF FINANCE
DECEMBER 31, 2018
FINANCIAL NARRATIVE REPORT
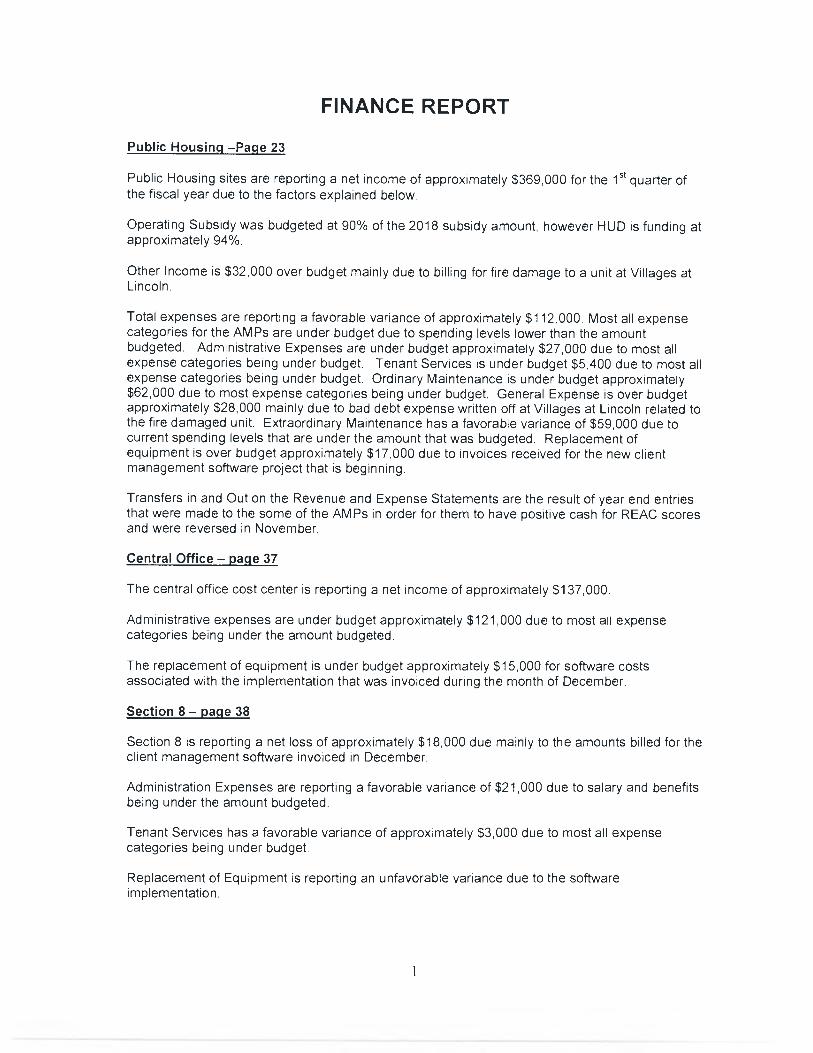
FINANCE REPORT
Public Housinq —Page 23
Public Housing sites are reporting a net income of approximately $369,000 for the 1st quarter of the fiscal year due to the factors explained below.
Operating Subsidy was budgeted at 90% of the 2018 subsidy amount, however HUD is funding at approximately 94%.
Other Income is $32,000 over budget mainly due to billing for fire damage to a unit at Villages at Lincoln.
Total expenses are reporting a favorable variance of approximately $112,000. Most all expense categories for the AMPs are under budget due to spending levels lower than the amount budgeted. Administrative Expenses are under budget approximately $27,000 due to most all expense categories being under budget. Tenant Services is under budget $5,400 due to most all expense categories being under budget. Ordinary Maintenance is under budget approximately $62,000 due to most expense categories being under budget. General Expense is over budget approximately $28,000 mainly due to bad debt expense written off at Villages at Lincoln related to the fire damaged unit. Extraordinary Maintenance has a favorable variance of $59,000 due to current spending levels that are under the amount that was budgeted. Replacement of equipment is over budget approximately $17,000 due to invoices received for the new client management software project that is beginning.
Transfers in and Out on the Revenue and Expense Statements are the result of year end entries that were made to the some of the AMPs in order for them to have positive cash for REAC scores and were reversed in November.
Central Office - page 37
The central office cost center is reporting a net income of approximately $137,000.
Administrative expenses are under budget approximately $121,000 due to most all expense categories being under the amount budgeted.
The replacement of equipment is under budget approximately $15,000 for software costs associated with the implementation that was invoiced during the month of December.
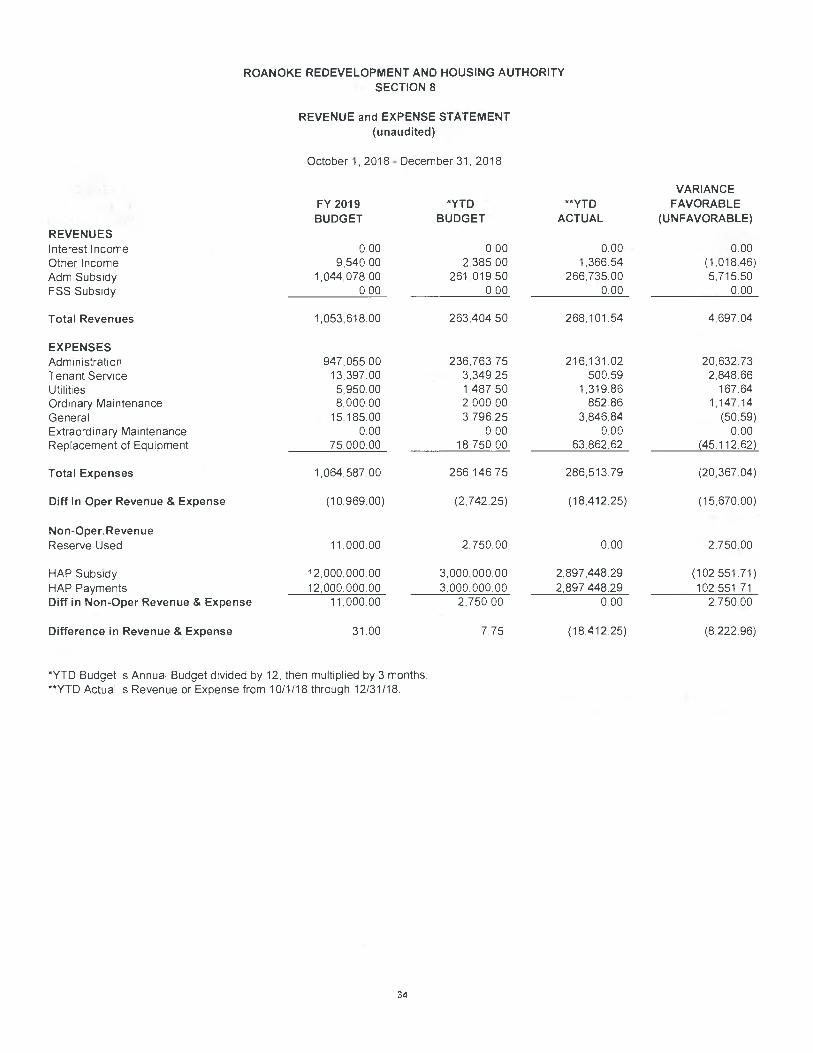
Section 8 - page 38
Section 8 is reporting a net loss of approximately $18,000 due mainly to the amounts billed for the client management software invoiced in December.
Administration Expenses are reporting a favorable variance of $21,000 due to salary and benefits being under the amount budgeted.
Tenant Services has a favorable variance of approximately $3,000 due to most all expense categories being under budget.
Replacement of Equipment is reporting an unfavorable variance due to the software implementation.
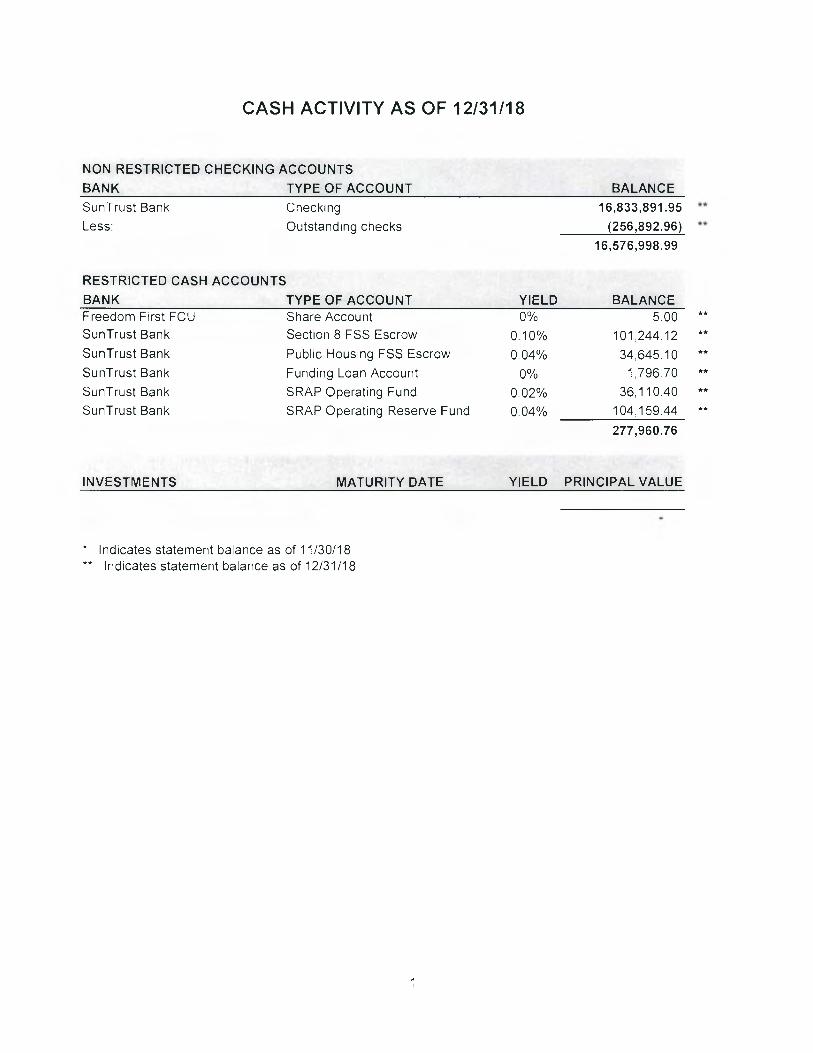
CASH ACTIVITY AS OF 12/31/18
NON RESTRICTED CHECKING ACCOUNTS
BANK TYPE OF ACCOUNT BALANCE
SunTrust Bank Checking 16,833,891.95
Less: Outstanding checks (256,892.96)
16,576,998.99
RESTRICTED CASH ACCOUNTS
BANK TYPE OF ACCOUNT YIELD BALANCE Freedom First FCU Share Account 0% 5.00 SunTrust Bank Section 8 FSS Escrow 0.10% 101,244.12 SunTrust Bank Public Housing FSS Escrow 0.04% 34,645.10 SunTrust Bank Funding Loan Account 0% 1,79670
SunTrust Bank SRAP Operating Fund 0.02% 36,11040
SunTrust Bank SRAP Operating Reserve Fund 0.04% 104,159.44
277,960.76
INVESTMENTS MATURITY DATE YIELD PRINCIPAL VALUE
* Indicates statement balance as of 11/30/18 ** Indicates statement balance as of 12/31/18
BALANCE SHEETS
AS OF DECEMBER 31, 2018
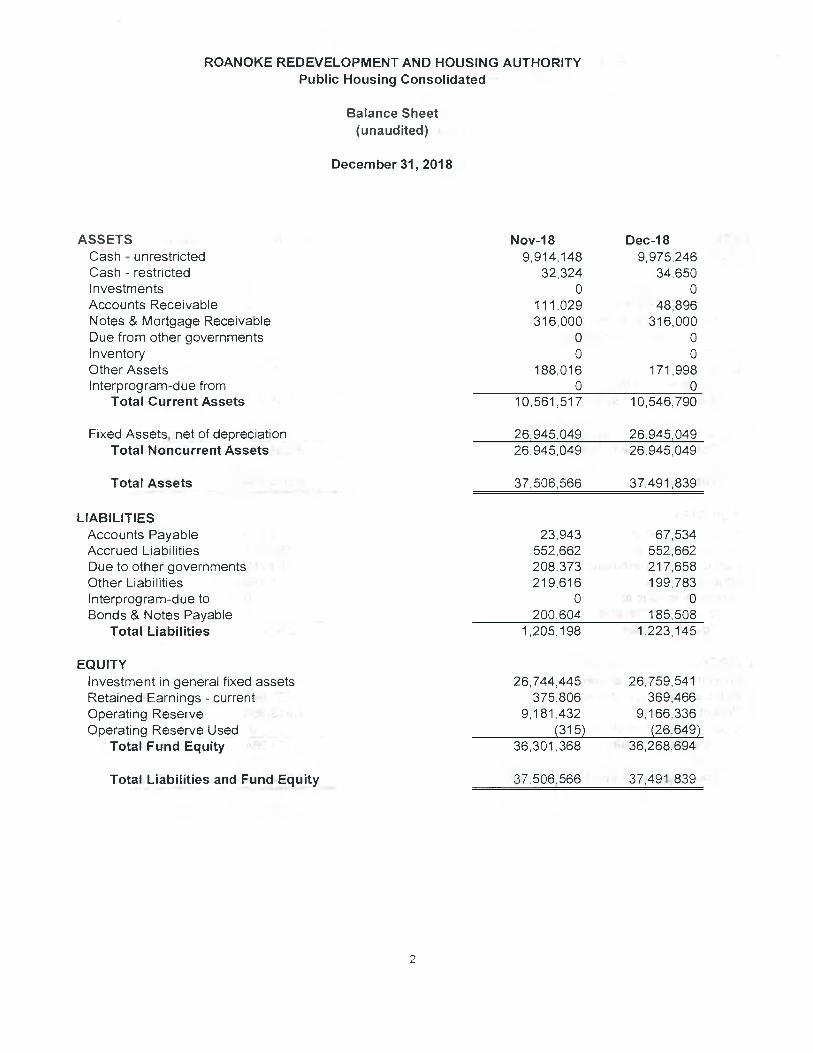
ROANOKE REDEVELOPMENT AND HOUSING AUTHORITY Public Housing Consolidated
Balance Sheet (unaudited)
December 31, 2018
ASSETS Nov-18 Dec-18 Cash - unrestricted 9,914,148 9,975,246 Cash - restricted 32,324 34,650 Investments 0 0 Accounts Receivable 111,029 48,896 Notes & Mortgage Receivable 316,000 316,000 Due from other governments 0 0 Inventory 0 0 Other Assets 188,016 171,998 Interprog ram-due from 0 0
Total Current Assets 10,561,517 10,546,790
Fixed Assets, net of depreciation 26,945,049 26,945,049 Total Noncurrent Assets 26,945,049 26,945,049
Total Assets 37,506,566 37,491 ,839
LIABILITIES Accounts Payable 23,943 67,534 Accrued Liabilities 552,662 552,662 Due to other governments 208,373 217,658 Other Liabilities 219,616 199,783 Interprogram-dueto 0 0 Bonds & Notes Payable 200,604 185,508
Total Liabilities 1,205,198 1,223,145
EQUITY Investment in general fixed assets 26,744,445 26,759,541 Retained Earnings - current 375,806 369,466 Operating Reserve 9,181,432 9,166,336 Operating Reserve Used (315) (26,649)
Total Fund Equity 36,301,368 36,268,694
Total Liabilities and Fund Equity 37506,566 37,491839
2
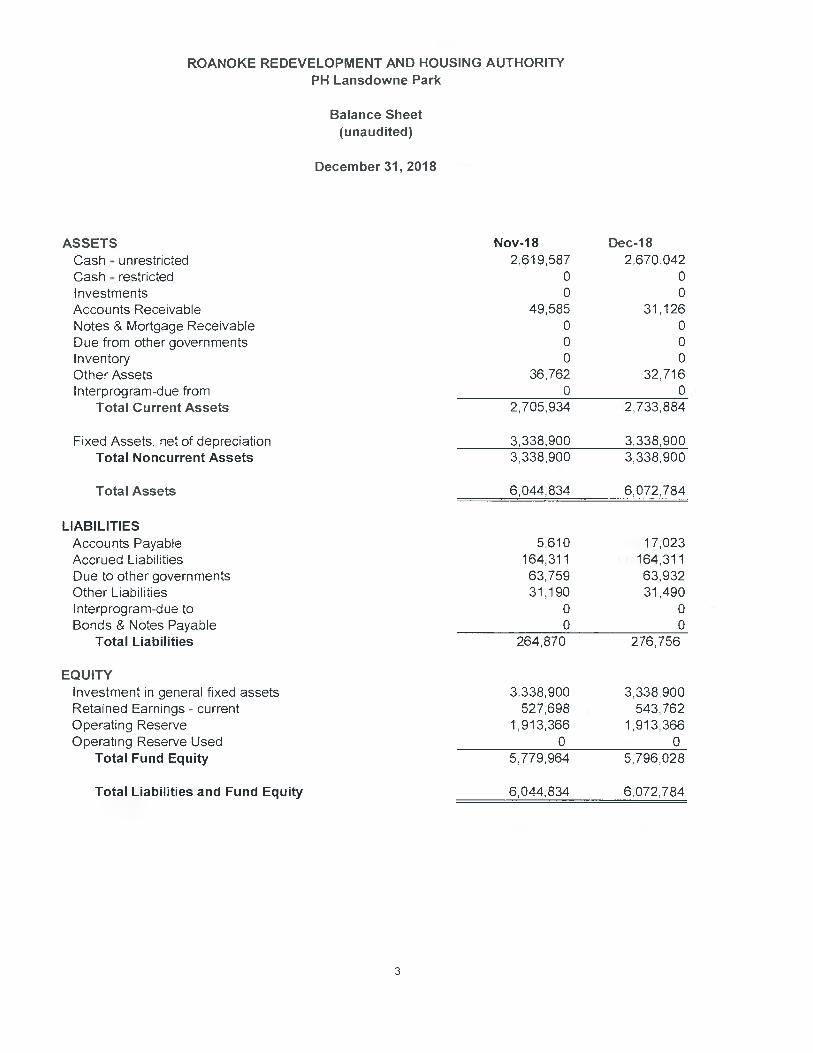
ROANOKE REDEVELOPMENT AND HOUSING AUTHORITY PH Lansdowne Park
Balance Sheet (unaudited)
December 31, 2018
ASSETS Nov-18 Dec-18 Cash - unrestricted 2,619,587 2,670,042 Cash - restricted 0 0 Investments 0 0 Accounts Receivable 49,585 31,126 Notes & Mortgage Receivable 0 0 Due from other governments 0 0 Inventory 0 0 Other Assets 36,762 32,716 Interprogram-due from 0 0
Total Current Assets 2,705,934 2,733,884
Fixed Assets, net of depreciation 3,338,900 3,338,900 Total Noncurrent Assets 3,338,900 3,338,900
Total Assets 6,044,834 6,072,784
LIABILITIES Accounts Payable 5,610 17,023 Accrued Liabilities 164,311 164,311 Due to other governments 63,759 63,932 Other Liabilities 31,190 31,490 Interprogram-dueto 0 0 Bonds & Notes Payable 0 0
Total Liabilities 264,870 276,756
EQUITY Investment in general fixed assets 3,338,900 3,338,900 Retained Earnings - current 527,698 543,762 Operating Reserve 1,913,366 1,913,366 Operating Reserve Used 0 0
Total Fund Equity 5,779,964 5,796,028
Total Liabilities and Fund Equity 6,044,834 6,072,784
3

ROANOKE REDEVELOPMENT AND HOUSING AUTHORITY PH Villages at Lincoln
Balance Sheet (unaudited)
December 31, 2018
ASSETS Nov-18 Dec-18 Cash - unrestricted 1,801,434 1,744,288 Cash - restricted 14,004 15,630 Investments 0 0 Accounts Receivable 3,463 (4,680) Notes & Mortgage Receivable 0 0 Due from other governments 0 0 Inventory 0 0 Other Assets 21,351 18,661 Interprog ram-due from 0 0
Total Current Assets 1,840,252 1,773,899
Fixed Assets, net of depreciation 7,877,229 7,877,229 Total Noncurrent Assets 7,877,229 7,877,229
Total Assets 9,717,481 9,651,128
LIABILITIES Accounts Payable 3,087 3,087 Accrued Liabilities 79,811 79,811 Due to other governments 10,617 10,962 Other Liabilities 52,182 33,474 Interprogram-dueto 0 0 Bonds & Notes Payable 0 0
Total Liabilities 145,697 127,334
EQUITY Investment in general fixed assets 7,877,229 7,877,229 Retained Earnings - current 464,937 430,000 Operating Reserve 1,229,618 1,229,618 Operating Reserve Used 0 (13,053)
Total Fund Equity 9,571,784 9,523,794
Total Liabilities and Fund Equity 9,717,481 9,651,128
4
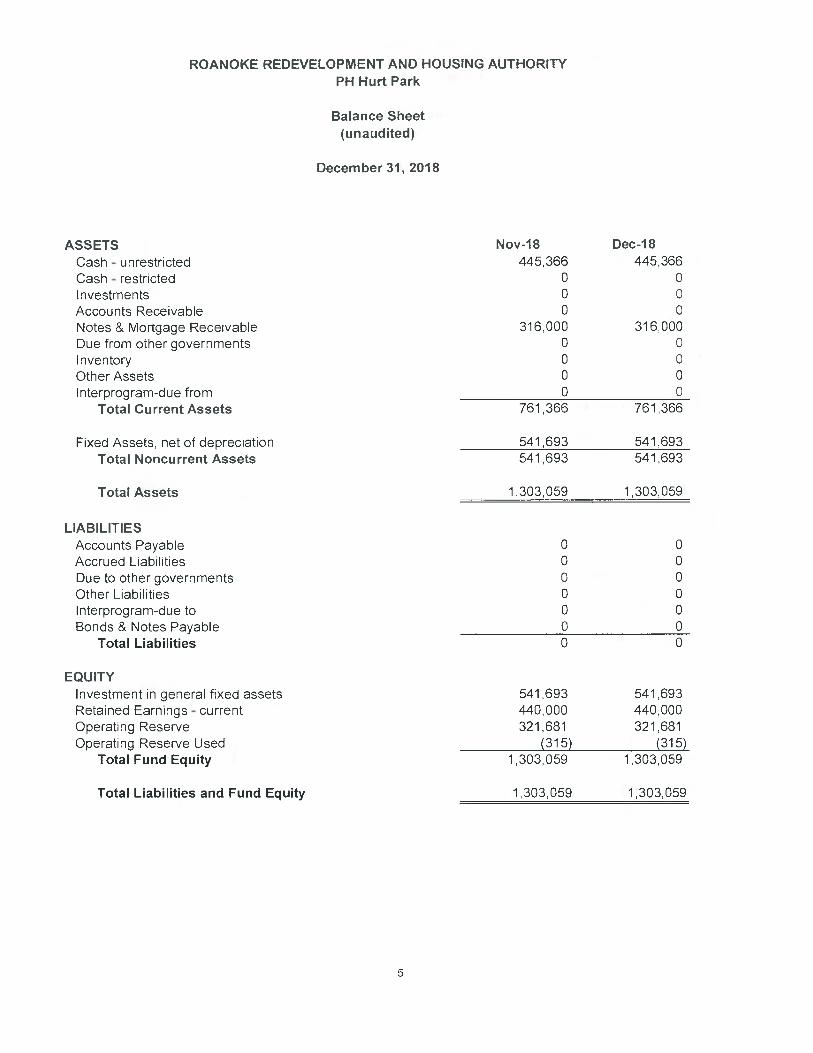
ROANOKE REDEVELOPMENT AND HOUSING AUTHORITY PH Hurt Park
Balance Sheet (unaudited)
December 31, 2018
ASSETS Nov-18 Dec-18 Cash - unrestricted 445,366 445,366 Cash - restricted 0 0 Investments 0 0 Accounts Receivable 0 0 Notes & Mortgage Receivable 316,000 316,000 Due from other governments 0 0 Inventory 0 0 Other Assets 0 0 Interprogram-due from 0 0
Total Current Assets 761,366 761,366
Fixed Assets, net of depreciation 541,693 541,693 Total Noncurrent Assets 541,693 541,693
Total Assets 1,303,059 1,303,059
LIABILITIES Accounts Payable 0 0 Accrued Liabilities 0 0 Due to other governments 0 0 Other Liabilities 0 0 Interprogram-dueto 0 0 Bonds & Notes Payable 0 0
Total Liabilities 0 0
EQUITY Investment in general fixed assets 541,693 541,693 Retained Earnings - current 440,000 440,000 Operating Reserve 321,681 321,681 Operating Reserve Used (315) (315)
Total Fund Equity 1,303,059 1,303,059
Total Liabilities and Fund Equity 1,303,059 1,303,059
5
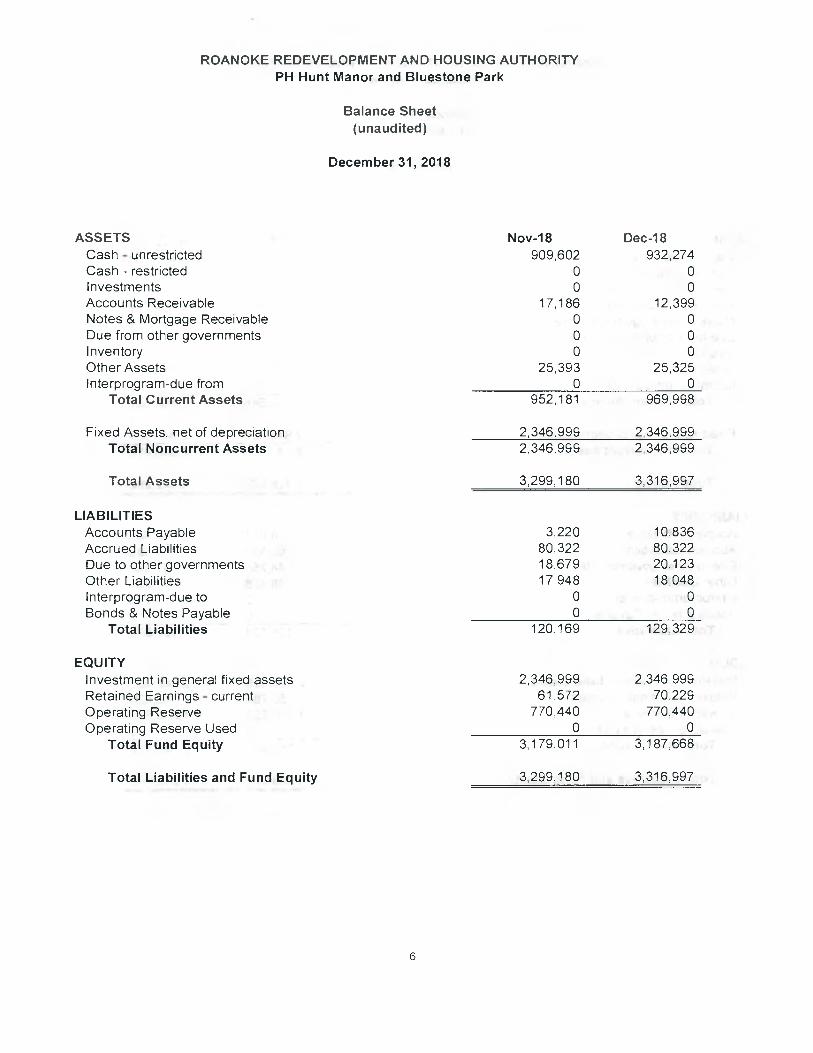
ROANOKE REDEVELOPMENT AND HOUSING AUTHORITY PH Hunt Manor and Bluestone Park
Balance Sheet (unaudited)
December 31, 2018
ASSETS Nov-18 Dec-18 Cash - unrestricted 909,602 932,274 Cash - restricted 0 0 Investments 0 0 Accounts Receivable 17,186 12,399 Notes & Mortgage Receivable 0 0 Due from other governments 0 0 Inventory 0 0 Other Assets 25,393 25,325 Interprogram-due from 0 0
Total Current Assets 952,181 969,998
Fixed Assets, net of depreciation 2,346,999 2,346$99 Total Noncurrent Assets 2,346,999 2,346,999
Total Assets 3,299,180 3,316,997
LIABILITIES Accounts Payable 3,220 10,836 Accrued Liabilities 80,322 80,322 Due to other governments 18,679 20,123 Other Liabilities 17,948 18,048 Interprogram-dueto 0 0 Bonds & Notes Payable 0 0
Total Liabilities 120,169 129,329
EQUITY Investment in general fixed assets 2,346,999 2,346,999 Retained Earnings - current 61,572 70,229 Operating Reserve 770,440 770,440 Operating Reserve Used 0 0
Total Fund Equity 3,179,011 3,187,668
Total Liabilities and Fund Equity 3,299,180 3,316,997
6
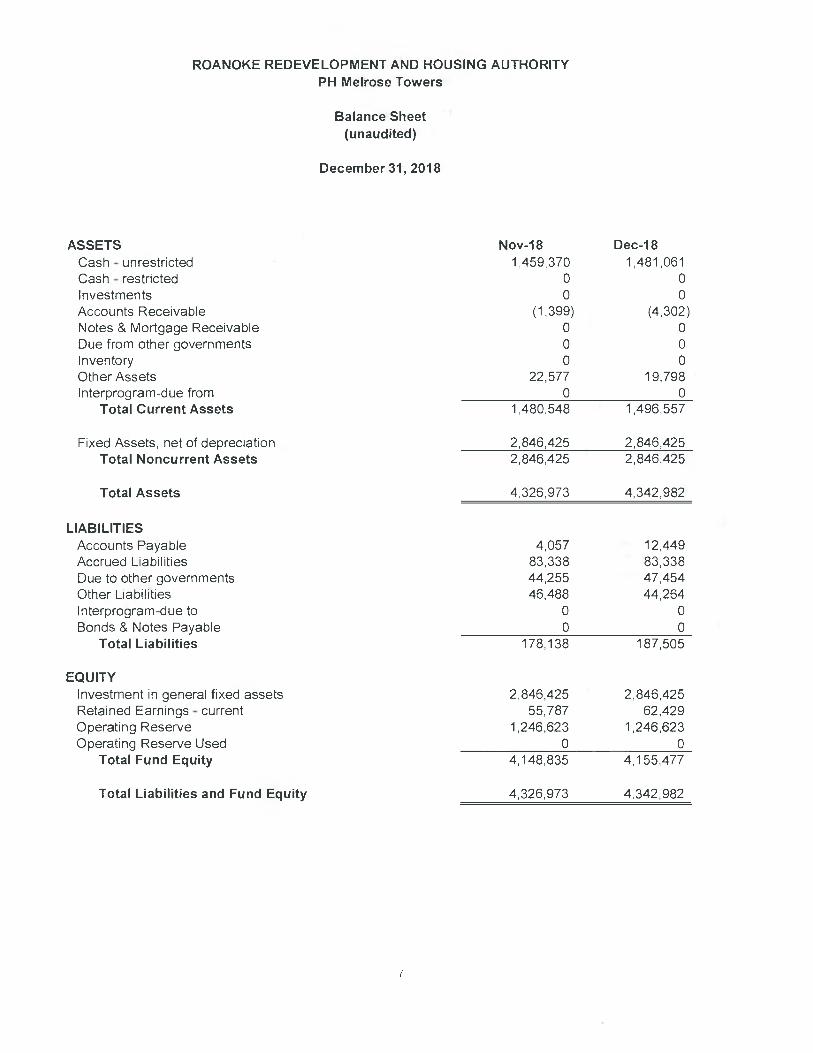
ROANOKE REDEVELOPMENT AND HOUSING AUTHORITY PH Melrose Towers
Balance Sheet (unaudited)
December 31, 2018
ASSETS Nov-18 Dec-18 Cash - unrestricted 1459,370 1,481,061 Cash - restricted 0 0 Investments 0 0 Accounts Receivable (1,399) (4,302) Notes & Mortgage Receivable 0 0 Due from other governments 0 0 Inventory 0 0 Other Assets 22,577 19,798 Interprogram-due from 0 0
Total Current Assets 1,480,548 1,496,557
Fixed Assets, net of depreciation 2,846,425 2,846,425 Total Noncurrent Assets 2,846,425 2,846,425
Total Assets 4,326,973 4,342,982
LIABILITIES Accounts Payable 4,057 12,449 Accrued Liabilities 83,338 83,338 Due to other governments 44,255 47,454 Other Liabilities 46,488 44,264 Interprogram-dueto 0 0 Bonds & Notes Payable 0 0
Total Liabilities 178,138 187,505
EQUITY Investment in general fixed assets 2,846,425 2,846,425 Retained Earnings - current 55,787 62,429 Operating Reserve 1,246,623 1,246,623 Operating Reserve Used 0 0
Total Fund Equity 4,148,835 4,155,477
Total Liabilities and Fund Equity 4,326,973 4342,982
7
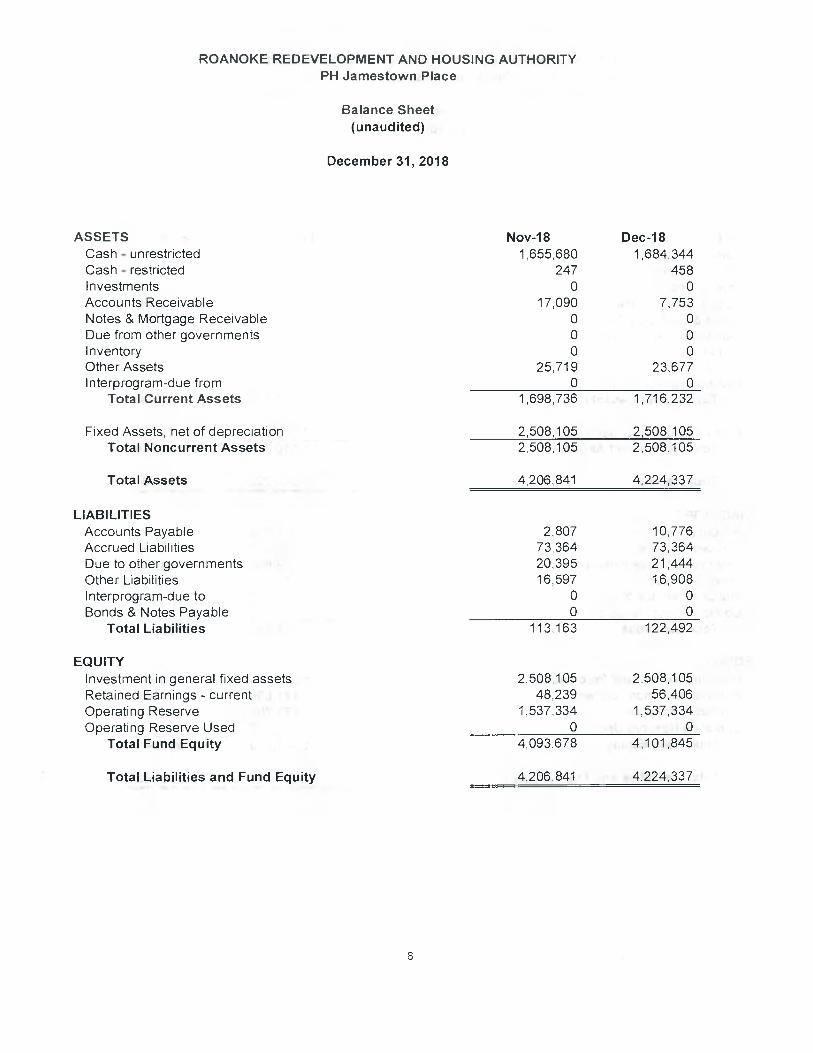
ROANOKE REDEVELOPMENT AND HOUSING AUTHORITY PH Jamestown Place
Balance Sheet (unaudited)
December 31, 2018
ASSETS Nov-18 Dec-18 Cash - unrestricted 1,655,680 1,684,344 Cash - restricted 247 458 Investments 0 0 Accounts Receivable 17,090 7,753 Notes & Mortgage Receivable 0 0 Due from other governments 0 0 Inventory 0 0 Other Assets 25,719 23,677 Interprog ram-due from 0 0
Total Current Assets 1,698,736 1,716,232
Fixed Assets, net of depreciation 2,508,105 2,508,105 Total Noncurrent Assets 2,508,105 2,508,105
Total Assets 4,206,841 4,224,337
LIABILITIES Accounts Payable 2,807 10,776 Accrued Liabilities 73,364 73,364 Due to other governments 20,395 21,444 Other Liabilities 16,597 16,908 Interprogram-due to 0 0 Bonds & Notes Payable 0 0
Total Liabilities 113,163 122,492
EQUITY Investment in general fixed assets 2,508,105 2,508,105 Retained Earnings - current 48,239 56,406 Operating Reserve 1,537,334 1,537,334 Operating Reserve Used 0 0
Total Fund Equity 4,093,678 4,101,845
Total Liabilities and Fund Equity 4,206,841 4,224,337
8
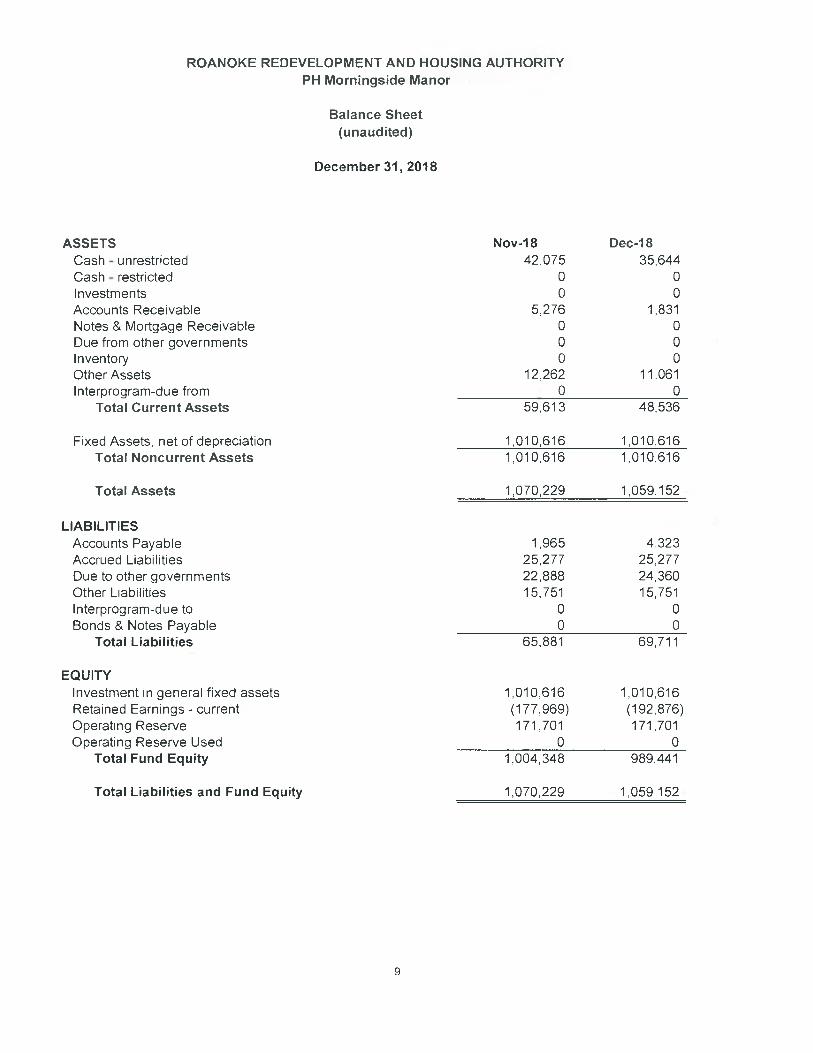
ROANOKE REDEVELOPMENT AND HOUSING AUTHORITY PH Morningside Manor
Balance Sheet (unaudited)
December 31, 2018
ASSETS Nov-18 Dec-18 Cash - unrestricted 42,075 35,644 Cash - restricted 0 0 Investments 0 0 Accounts Receivable 5,276 1,831 Notes & Mortgage Receivable 0 0 Due from other governments 0 0 Inventory 0 0 Other Assets 12,262 11,061 Interprogram-due from 0 0
Total Current Assets 59,613 48,536
Fixed Assets, net of depreciation 1,010,616 1,010,616 Total Noncurrent Assets 1,010,616 1,010,616
Total Assets 1,070,229 1059.152
LIABILITIES Accounts Payable 1,965 4,323 Accrued Liabilities 25,277 25,277 Due to other governments 22,888 24,360 Other Liabilities 15,751 15,751 Interprogram-dueto 0 0 Bonds & Notes Payable 0 0
Total Liabilities 65,881 69,711
EQUITY Investment in general fixed assets 1,010,616 1,010,616 Retained Earnings - current (177,969) (192,876) Operating Reserve 171,701 171,701 Operating Reserve Used 0 0
Total Fund Equity 1,004,348 989,441
Total Liabilities and Fund Equity 1,070,229 1,059,152
9

ROANOKE REDEVELOPMENT AND HOUSING AUTHORITY PH Indian Rock Village
Balance Sheet (unaudited)
December 31, 2018
ASSETS Nov-18 Dec-18 Cash - unrestricted 244,533 239,020 Cash - restricted 18,073 18,562 Investments 0 0 Accounts Receivable 19,832 5,807 Notes & Mortgage Receivable 0 0 Due from other governments 0 0 Inventory 0 0 Other Assets 39,728 37,156 Interprogram-due from 0 0
Total Current Assets 322,166 300,545
Fixed Assets, net of depreciation 5,149,677 5,149,677 Total Noncurrent Assets 5,149,677 5,149,677
Total Assets 5,471,843 5,450,222
LIABILITIES Accounts Payable 2,768 8,611 Accrued Liabilities 39,575 39,575 Due to other governments 20,600 21,795 Other Liabilities 34,160 34,548 Interprogram-due to 0 0 Bonds & Notes Payable 200,604 185,508
Total Liabilities 297,707 290,037
EQUITY Investment in general fixed assets 4,949,073 4,964,169 Retained Earnings - current (1,051,785) (1,052,455) Operating Reserve 1,276,848 1,261,752 Operating Reserve Used 0 (13,281)
Total Fund Equity 5,174,136 5,160,185
Total Liabilities and Fund Equity 5,471 ,843 5,450,222
10
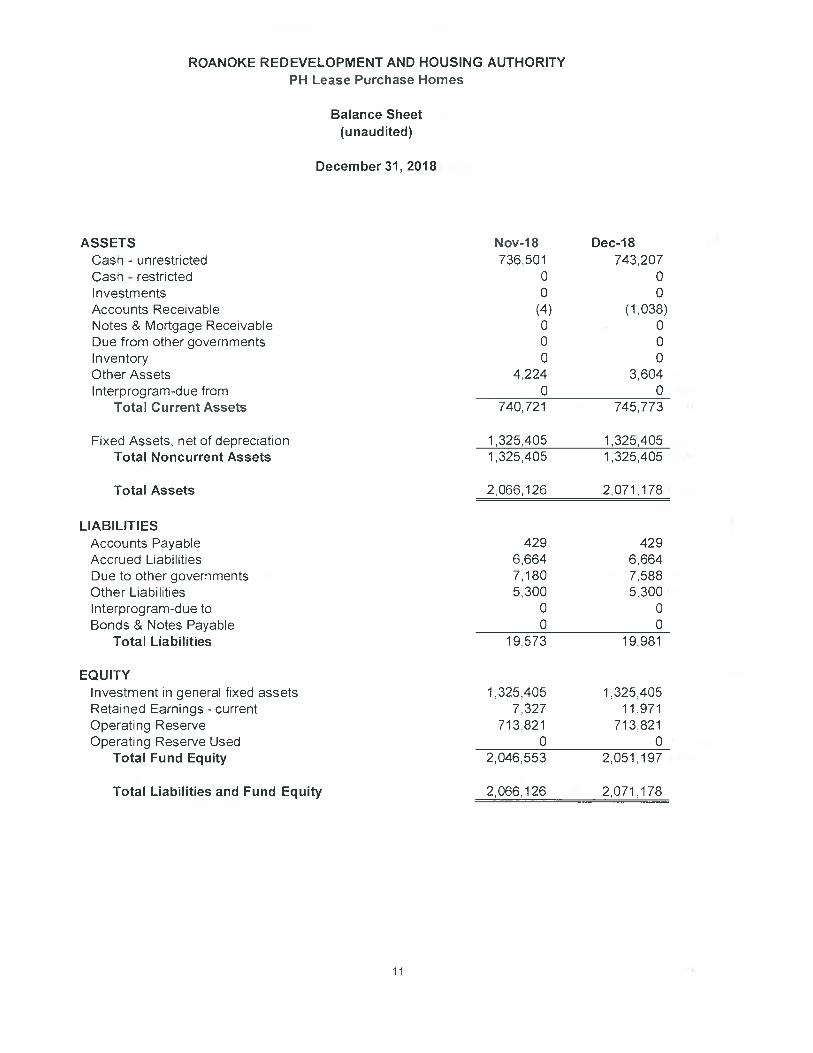
ROANOKE REDEVELOPMENT AND HOUSING AUTHORITY PH Lease Purchase Homes
Balance Sheet (unaudited)
December 31, 2018
ASSETS Nov-18 Dec-18 Cash - unrestricted 736,501 743,207 Cash - restricted 0 0 Investments 0 0 Accounts Receivable (4) (1,038) Notes & Mortgage Receivable 0 0 Due from other governments 0 0 Inventory 0 0 Other Assets 4,224 3,604 Interprogram-due from 0 0
Total Current Assets 740,721 745,773
Fixed Assets, net of depreciation 1,325,405 1,325,405 Total Noncurrent Assets 1,325,405 1,325,405
Total Assets 2,066,126 2,071,178
LIABILITIES Accounts Payable 429 429 Accrued Liabilities 6,664 6,664 Due to other governments 7,180 7,588 Other Liabilities 5,300 5,300 Interprogram-due to 0 0 Bonds & Notes Payable 0 0
Total Liabilities 19,573 19,981
EQUITY Investment in general fixed assets 1,325,405 1,325,405 Retained Earnings - current 7,327 11,971 Operating Reserve 713,821 713,821 Operating Reserve Used 0 0
Total Fund Equity 2,046,553 2,051,197
Total Liabilities and Fund Equity 2,066,126 2,071,178
11
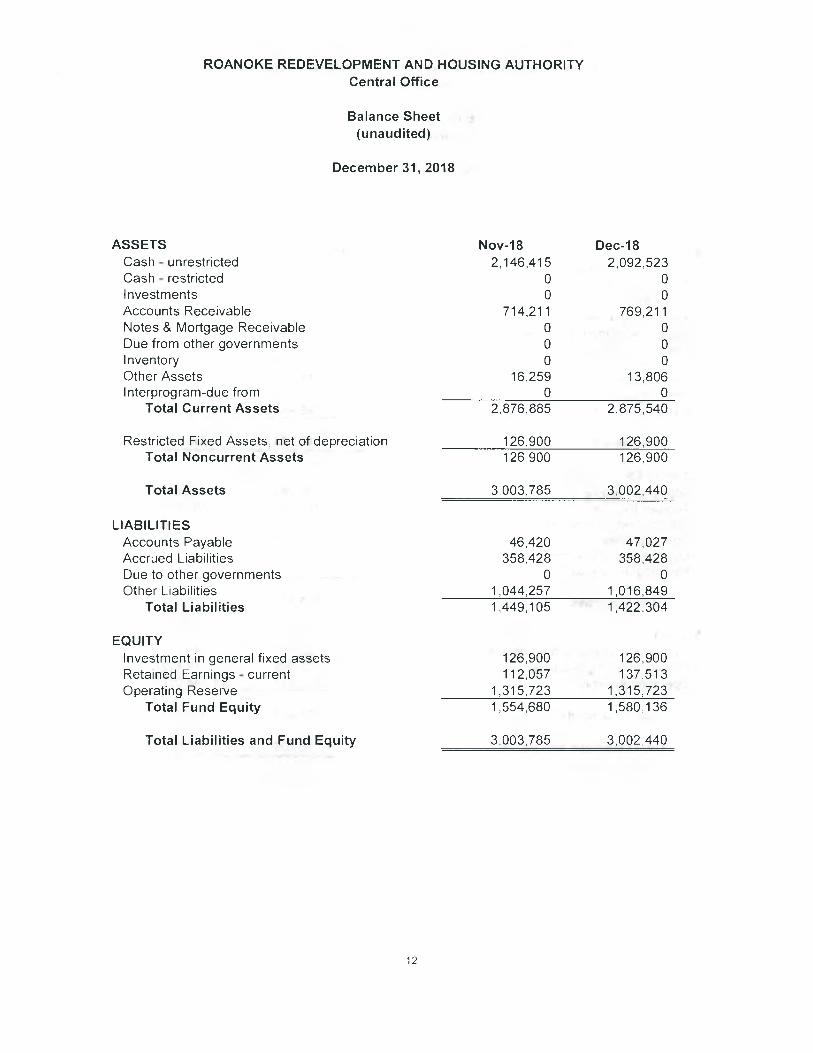
ROANOKE REDEVELOPMENT AND HOUSING AUTHORITY Central Office
Balance Sheet (unaudited)
December 31, 2018
ASSETS Nov-18 Dec-18 Cash - unrestricted 2,146,415 2,092,523 Cash - restricted 0 0 Investments 0 0 Accounts Receivable 714,211 769,211 Notes & Mortgage Receivable 0 0 Due from other governments 0 0 Inventory 0 0 Other Assets 16,259 13,806 Interprog ram-due from 0 0
Total Current Assets 2,876,885 2,875,540
Restricted Fixed Assets, net of depreciation 126,900 126,900 Total Noncurrent Assets 126,900 126,900
Total Assets 3,003,785 3,002,440
LIABILITIES Accounts Payable 46,420 47,027 Accrued Liabilities 358,428 358,428 Due to other governments 0 0 Other Liabilities 1,044,257 1,016,849
Total Liabilities 1,449,105 1,422,304
EQUITY Investment in general fixed assets 126,900 126,900 Retained Earnings - current 112,057 137,513 Operating Reserve 1,315,723 1,315,723
Total Fund Equity 1,554,680 1,580,136
Total Liabilities and Fund Equity 37 003,785 3,002,440
12
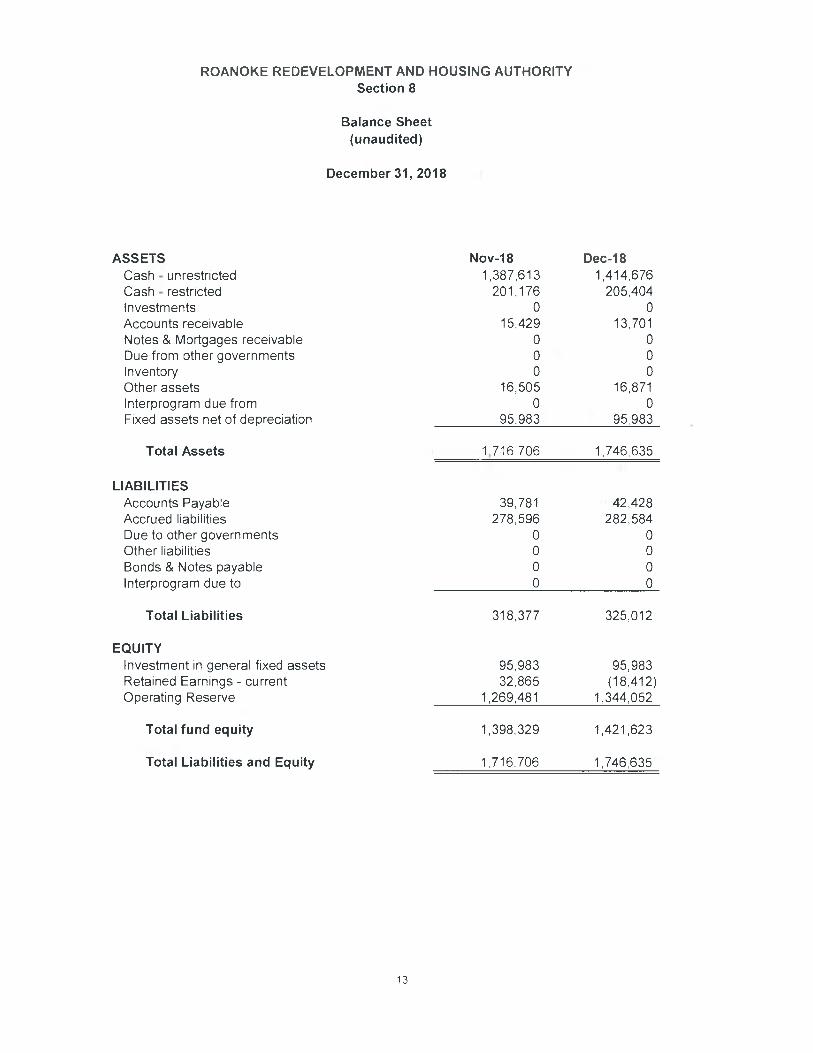
ROANOKE REDEVELOPMENT AND HOUSING AUTHORITY Section 8
Balance Sheet (unaudited)
December 31, 2018
ASSETS Nov-18 Dec-18 Cash - unrestricted 1,387,613 1,414,676 Cash - restricted 201,176 205,404 Investments 0 0 Accounts receivable 15,429 13,701 Notes & Mortgages receivable 0 0 Due from other governments 0 0 Inventory 0 0 Other assets 16,505 16,871 Interprogram due from 0 0 Fixed assets net of depreciation 95,983 95,983
Total Assets 1.716706 1,746,635
LIABILITIES Accounts Payable 39,781 42,428 Accrued liabilities 278,596 282,584 Due to other governments 0 0 Other liabilities 0 0 Bonds & Notes payable 0 0 Interprogram due to 0 0
Total Liabilities 318,377 325,012
EQUITY Investment in general fixed assets 95,983 95,983 Retained Earnings - current 32,865 (18,412) Operating Reserve 1,269,481 1,344,052
Total fund equity 1,398,329 1,421,623
Total Liabilities and Equity 1,716,706 1,746,635
13
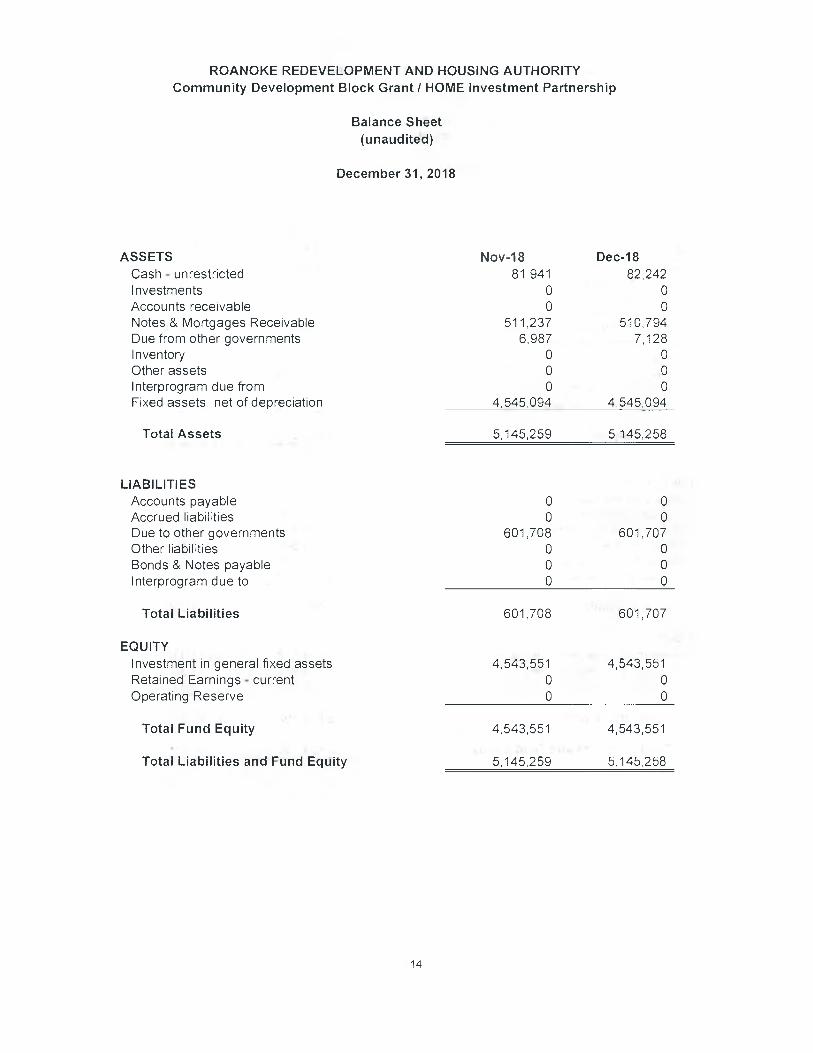
ROANOKE REDEVELOPMENT AND HOUSING AUTHORITY Community Development Block Grant I HOME Investment Partnership
Balance Sheet (unaudited)
December 31, 2018
ASSETS Nov-18 Dec-18 Cash - unrestricted 81,941 82,242 Investments 0 0 Accounts receivable 0 0 Notes & Mortgages Receivable 511,237 510,794 Due from other governments 6,987 7,128 Inventory 0 0 Other assets 0 0 Interprogram due from 0 0 Fixed assets, net of depreciation 4,545,094 4,545,094
Total Assets 5,145,259 5145,258
LIABILITIES Accounts payable 0 0 Accrued liabilities 0 0 Due to other governments 601,708 601,707 Other liabilities 0 0 Bonds & Notes payable 0 0 Interprogram due to 0 0
Total Liabilities 601,708 601,707
EQUITY Investment in general fixed assets 4,543,551 4,543,551 Retained Earnings - current 0 0 Operating Reserve 0 0
Total Fund Equity 4,543,551 4,543,551
Total Liabilities and Fund Equity 5,145,259 5,145,258
14
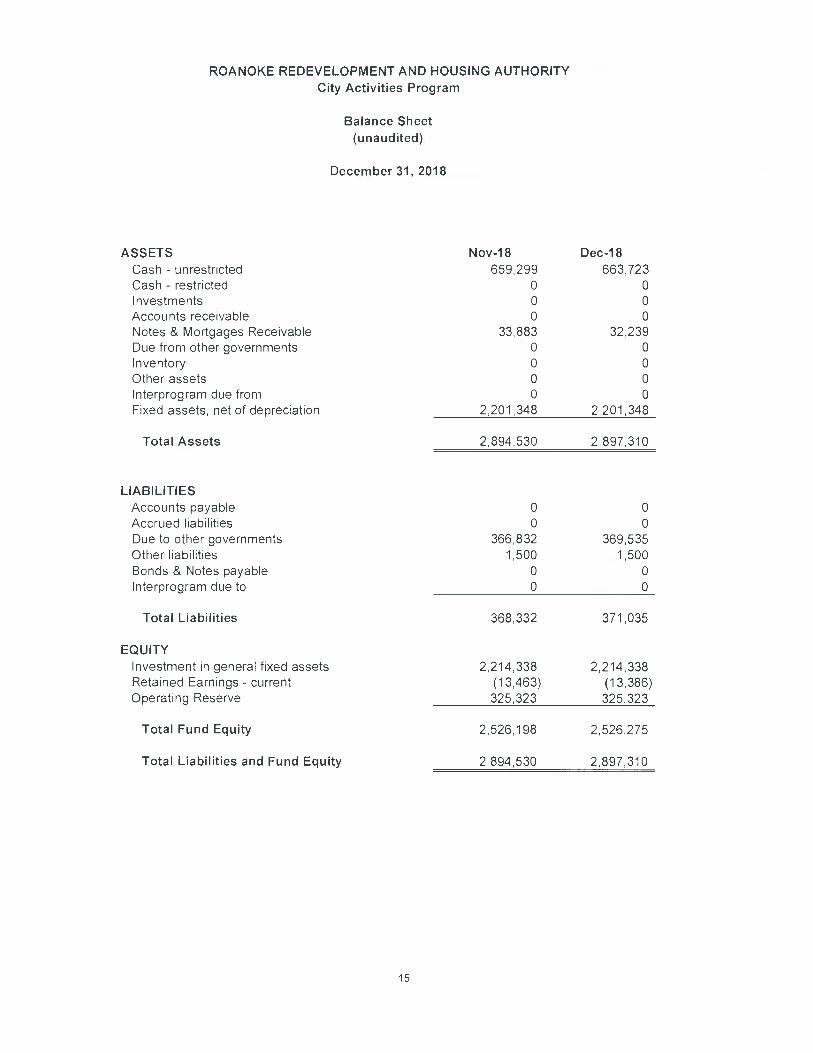
ROANOKE REDEVELOPMENT AND HOUSING AUTHORITY City Activities Program
Balance Sheet (unaudited)
December 31, 2018
ASSETS Nov-18 Dec-18 Cash - unrestricted 659,299 663,723 Cash - restricted 0 0 Investments 0 0 Accounts receivable 0 0 Notes & Mortgages Receivable 33,883 32,239 Due from other governments 0 0 Inventory 0 0 Other assets 0 0 lnterprogram due from 0 0 Fixed assets, net of depreciation 2,201 ,348 2,201,348
Total Assets 2,894,530 2,897,310
LIABILITIES Accounts payable 0 0 Accrued liabilities 0 0 Due to other governments 366,832 369,535 Other liabilities 1,500 1,500 Bonds & Notes payable 0 0 Interprogram due to 0 0
Total Liabilities 368,332 371,035
EQUITY Investment in general fixed assets 2,214,338 2,214338 Retained Earnings - current (13,463) (13,386) Operating Reserve 325,323 325,323
Total Fund Equity 2,526,198 2,526,275
Total Liabilities and Fund Equity 2,894,530 2,897,310
15
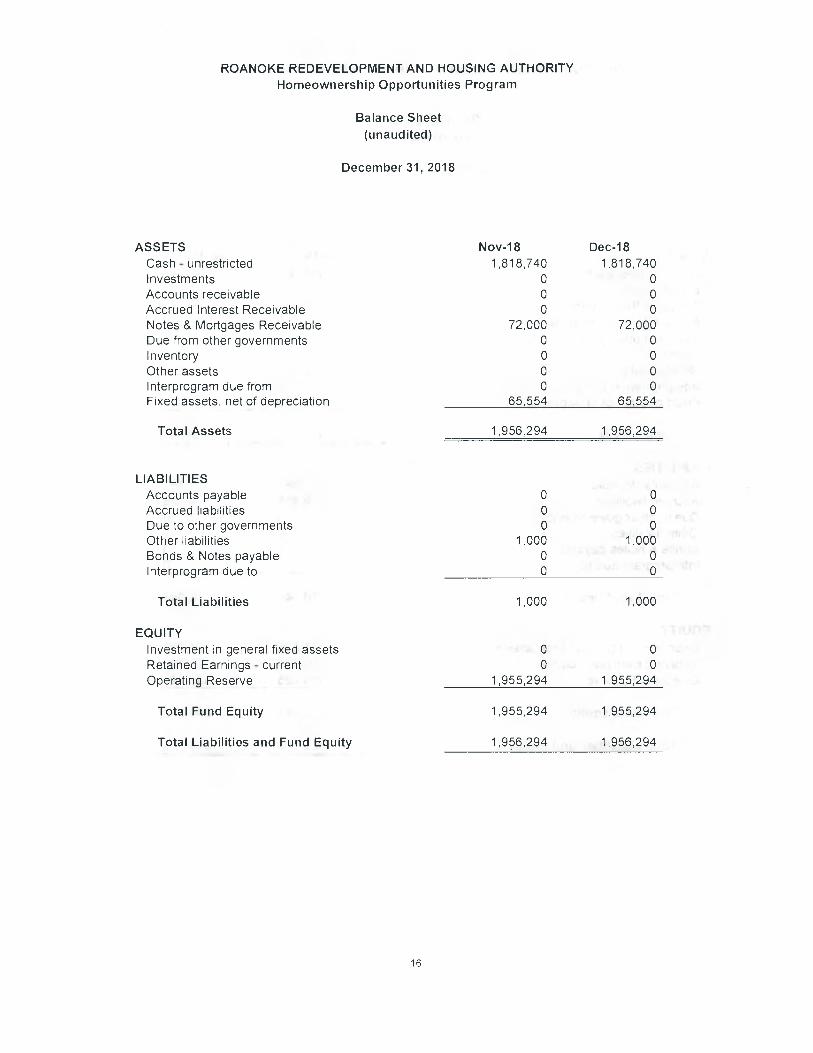
ROANOKE REDEVELOPMENT AND HOUSING AUTHORITY Homeownership Opportunities Program
Balance Sheet (unaudited)
December 31, 2018
ASSETS Nov-18 Dec-18 Cash - unrestricted 1,818740 1,818,740 Investments 0 0 Accounts receivable 0 0 Accrued Interest Receivable 0 0 Notes & Mortgages Receivable 72,000 72,000 Due from other governments 0 0 Inventory 0 0 Other assets 0 0 lnterprogram due from 0 0 Fixed assets, net of depreciation 65,554 65,554
Total Assets 1,956,294 1,956,294
LIABILITIES Accounts payable 0 0 Accrued liabilities 0 0 Due to other governments 0 0 Other liabilities 1,000 1,000 Bonds & Notes payable 0 0 Interprogram due to 0 0
Total Liabilities 1,000 1,000
EQUITY Investment in general fixed assets 0 0 Retained Earnings - current 0 0 Operating Reserve 1,955,294 1,955,294
Total Fund Equity 1,955,294 1,955,294
Total Liabilities and Fund Equity 1,956,294 1,956,294
16

ROANOKE REDEVELOPMENT AND HOUSING AUTHORITY Hackley
Balance Sheet (unaudited)
December 31, 2018
ASSETS Nov-18 Dec-18 Cash - unrestricted 558,303 565,756 Investments 0 0 Accounts Receivable 1,220 (878) Notes & Mortgages receivable 0 0 Due from other governments 0 0 Inventory 0 0 Other assets 2,464 2,097 Interprogram due from 0 0 Fixed assets net of depreciation 91,338 91,338
Total Assets 653,325 658,313
LIABILITIES Accounts Payable 683 683 Accrued liabilities 9,358 9,358 Due to other governments 0 0 Other liabilities 0 0 Bonds & Notes payable 0 0 Interprogram due to 0 0
Total Liabilities 10,041 10,041
EQUITY Investment in general fixed assets 91,338 91,338 Retained Earnings - current 16,721 21,709 Operating Reserve 535,225 535,225
Total fund equity 643,284 648,272
Total Liabilities and Equity 653,325 658,313
17
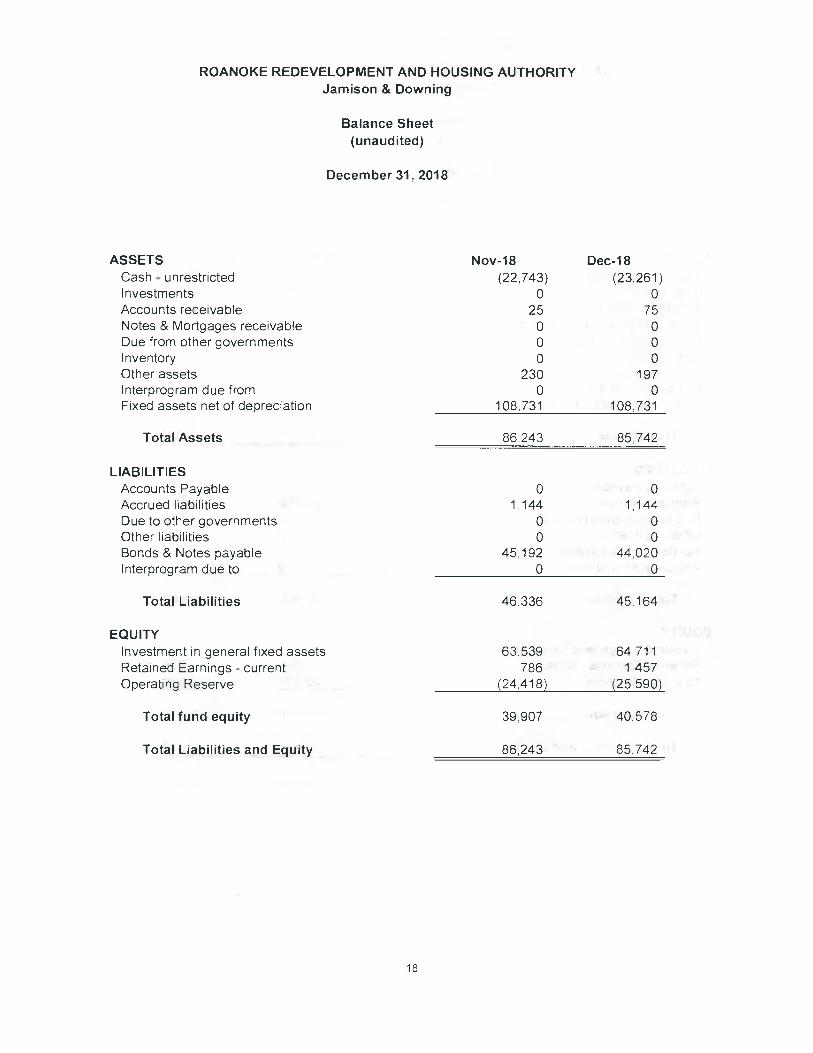
ROANOKE REDEVELOPMENT AND HOUSING AUTHORITY Jamison & Downing
Balance Sheet (unaudited)
December 31, 2018
ASSETS Nov-18 Dec-18 Cash - unrestricted (22,743) (23,261) Investments 0 0 Accounts receivable 25 75 Notes & Mortgages receivable 0 0 Due from other governments 0 0 Inventory 0 0 Other assets 230 197 Interprogram due from 0 0 Fixed assets net of depreciation 108,731 108,731
Total Assets 86,243 85,742
LIABILITIES Accounts Payable 0 0 Accrued liabilities 1,144 1,144 Due to other governments 0 0 Other liabilities 0 0 Bonds & Notes payable 45,192 44,020 Interprogram due to 0 0
Total Liabilities 46,336 45.164
EQUITY Investment in general fixed assets 63,539 64,711 Retained Earnings - current 786 1,457 Operating Reserve (24.418) (25,590)
Total fund equity 39,907 40,578
Total Liabilities and Equity 86,243 85.742
18

ROANOKE REDEVELOPMENT AND HOUSING AUTHORITY Private Management
Balance Sheet (unaudited)
December 31, 2018
ASSETS Nov-18 Dec-18 Cash - unrestricted (50,871) (20,350) Investments 0 0 Accounts receivable 47,051 16,873 Notes & Mortgages receivable 0 0 Due from other governments 0 0 Inventory 0 0 Other assets 1,109 947 Interprogram due from 0 0 Fixed assets net of depreciation 0 0
Total Assets (2,711) (2,530)
LIABILITIES Accounts Payable 0 11 Accrued liabilities 29,669 29,669 Due to other governments 0 0 Other liabilities 0 0 Bonds & Notes payable 0 0 Interprogram due to 0 0
Total Liabilities 29,669 29,680
EQUITY Investment in general fixed assets 0 0 Retained Earnings - current 507 676 Operating Reserve (32,887) (32,886)
Total fund equity (32,380) (32,210)
Total Liabilities and Equity (2,711) (2,530)
19

*
ROANOKE REDEVELOPMENT AND HOUSING AUTHORITY Capital Fund Program (565-568, 272-277)
Balance Sheet (unaudited)
December 31, 2018
ASSETS Nov-18 Dec-18 Cash - unrestricted (33,111) (59,542) Investments 0 0 Accounts Receivable 0 0 Notes & Mortgage Receivable 0 0 Due from other governments 33,111 59,542 Inventory 0 0 Other Assets 0 0 Interprogram-due from
Total Current Assets 0 0
Fixed Assets, net of depreciation 4,800,543 5,276,137 Total Noncurrent Assets 4,800,543 5,276,137
Total Assets 4,800,543 5.276.137
LIABILITIES Accounts Payable 0 0 Accrued Liabilities 0 0 Due to other governments 0 0 Other Liabilities 0 0 Interprogram-dueto 0 0 Bonds & Notes Payable 0 0
Total Liabilities 0 0
EQUITY Investment in general fixed assets 4,800,543 5,276,137 Retained Earnings - current 0 0 Operating Reserve 0 0
Total Fund Equity 4,800,543 5,276,137
Total Liabilities and Fund Equity 4,800543 5,276,137
* Due to timing
20

*
ROANOKE REDEVELOPMENT AND HOUSING AUTHORITY Jobs Plus Grant
Balance Sheet (unaudited)
December 31, 2018
ASSETS Nov-18 Dec-18 Cash - unrestricted (85,008) (33,233) Investments 0 0 Accounts Receivable 0 0 Notes & Mortgage Receivable 0 0 Due from other governments 85,008 33,233 Inventory 0 0 Other Assets 0 0 Interprogram-due from 0 0
Total Current Assets 0 0
Fixed Assets, net of depreciation 0 0 Total Noncurrent Assets 0 0
Total Assets 0 0
LIABILITIES Accounts Payable 0 0 Accrued Liabilities 0 0 Due to other governments 0 0 Other Liabilities 0 0 Interprog ram-due to 0 0 Bonds & Notes Payable 0 0
Total Liabilities 0 0
EQUITY Investment in general fixed assets 0 0 Retained Earnings - current 0 0 Operating Reserve 0 0
Total Fund Equity 0 0
Total Liabilities and Fund Equity 0 0
* Due to timing
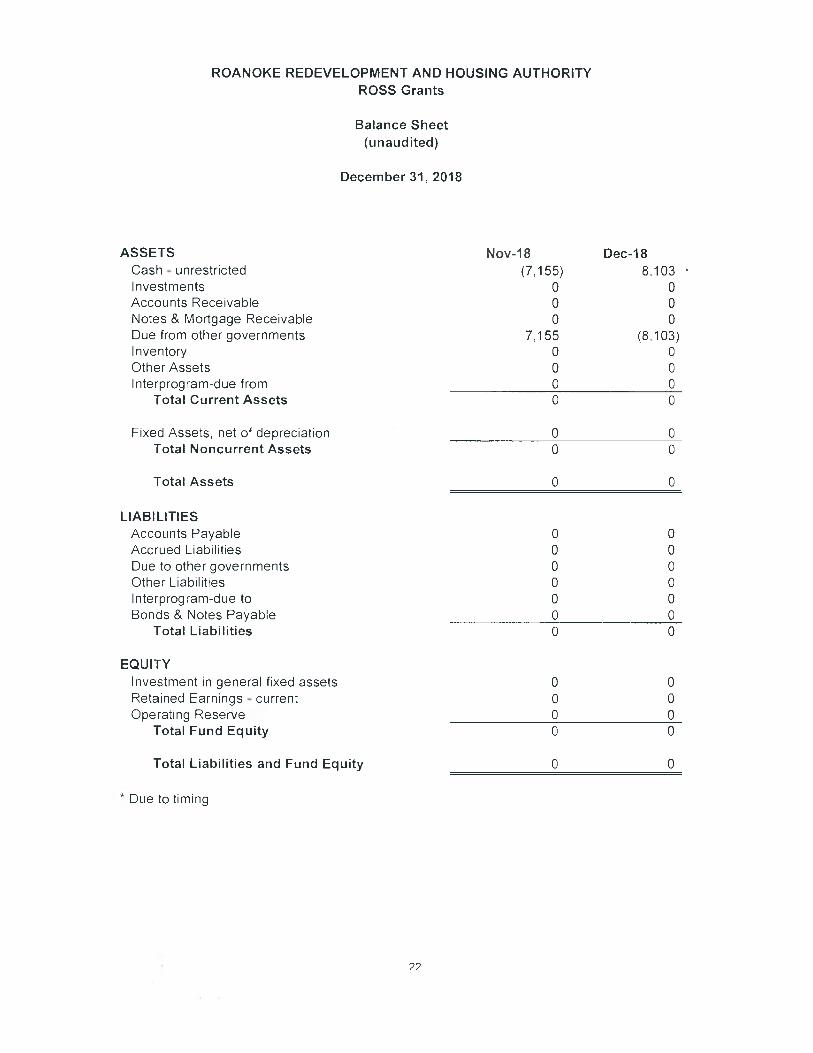
ROANOKE REDEVELOPMENT AND HOUSING AUTHORITY ROSS Grants
Balance Sheet (unaudited)
December 31, 2018
ASSETS Nov-18 Dec-18 Cash - unrestricted (7,155) 8,103 Investments 0 0 Accounts Receivable 0 0 Notes & Mortgage Receivable 0 0 Due from other governments 7,155 (8,103) Inventory 0 0 Other Assets 0 0 Interprog ram-due from 0 0
Total Current Assets 0 0
Fixed Assets, net of depreciation 0 0 Total Noncurrent Assets 0 0
Total Assets 0 0
LIABILITIES Accounts Payable 0 0 Accrued Liabilities 0 0 Due to other governments 0 0 Other Liabilities 0 0 Interprogram-dueto 0 0 Bonds & Notes Payable 0 0
Total Liabilities 0 0
EQUITY Investment in general fixed assets 0 0 Retained Earnings - current 0 0 Operating Reserve 0 0
Total Fund Equity 0 0
Total Liabilities and Fund Equity 0 0
Due to timing
22
REVENUE AND EXPENSE STATEMENTS
FOR THE PERIOD
OCTOBER1, 2018- DECEMBER 31,2018

ROANOKE REDEVELOPMENT AND HOUSING AUTHORITY ALL PUBLIC HOUSING SITES
REVENUE and EXPENSE STATEMENT (unaudited)
REVENUES
October 1, 2018 -
FY 2019 BUDGET
December 31, 2018
*flD
BUDGET **YT
ACTUAL
VARIANCE FAVORABLE
(UNFAVORABLE)
Dwelling Rental 3,223,000.00 805,750.00 783,577.46 (22,172.54) Excess Utilities 76,500.00 19,125.00 46,433.26 27,308.26 Interest Income - - 3.35 3.35 Other Income 239,865.00 59,966.25 92,095.41 32,129.16 Operating Subsidy 2,472,443.00 618,110.75 856,278.00 238,167.25 Utilities Subsidy 1,767,397.00 441,849.25 459,392.25 17,543.00
Total Revenues 7,779,205.00 1,944,801.25 2,237,779.73 292,978.48
EXPENSES Administration 1,125,752.00 281,438.00 254,784.97 26,653.03 Central Office Property Management Fees 975,315.00 243,828.75 246,227.36 (2,398.61) Central Office Bookkeeping Fees 113,603.00 28,400.75 28,680.00 (279.25) Tenant Services 229,728.00 57,432.00 52,041.72 5,390.28 Utilities Expense 1,939,150.00 484,787.50 476,236.45 8,551.05 Ordinary Maintenance 2,499,553.00 624,888.25 563,086.67 61,801.58 Protective Services 136,400.00 34,100.00 35,887.58 (1,787.58) General 543,357.00 135,839.25 163,341.65 (27,502.40) PILOT. 136,035.00 34,008.75 35,377.43 (1,368.68) Extraordinary Maintenance 395,500.00 98,875.00 40,237.65 58,637.35 Replacement of Equipment 110,000 00 27,500.00 44,180 58 (16,680.58) Capital Replacements - - - Interest on Notes/Bonds Payable 6,623.05 1,655.76 2,425.78 770.02 Loss from Sale of Asset - - - - Betterments & Additions - - -
Total Expenses 8,211,016.05 2,052,754.01 1,942,507.84 111,786.21
Diff In Oper Revenues & Expenses (431,811.05) (107,952.76) 295,271.89 404,764.69
Non-Oper.Revenue Transfers In - - 1,300,000.00 1,300,000.00 Transfers Out - - (1,300,000.00) (1,300,000.00) Reserve Used 680,413.00 170,103.25 26,649.31 (143,453.94) Other Income-trf from Capital Fund 190,180.68 47,545.17 47,545.17 Other Income-trf to Central Office - - -
Other Income-Lease Payments - - -
Other Income-Replacement Housing - - - - 870,593.68 217,648.42 74,194.48 (143,453.94)
Difference in Revenue & Expense 438,782.63 109,695.66 369,466.37 261,310.75
*YTD Budget is Annual Budget divided by 12, then multiplied by 3 months.
23

ROANOKE REDEVELOPMENT AND HOUSING AUTHORITY PH LANSDOWNE PARK
REVENUE and EXPENSE STATEMENT (unaudited)
REVENUES
October 1, 2018
FY 2019 BUDGET
- December 31, 2018
*YTD BUDGET
**YTD
ACTUAL
VARIANCE FAVORABLE
(UNFAVORABLE)
Dwelling Rental 690,000.00 172,50000 154,542.36 (17,957.64) Excess Utilities 20,000.00 5,000.00 21,279.48 16,279.48 Interest Income Other Income 65,613.00 16,403.25 14,028.19 (2,375.06) Operating Subsidy 895,817.00 223,954.25 225,566.00 1,611.75 Utilities Subsidy 503,897.00 125,974.25 126,881.50 907.25
Total Revenues 2,175,327.00 543,831.75 542,297.53 (1,534.22)
EXPENSES Administration 229,334.00 57,333.50 47,331.53 10,001.97 Central Office Property Management Fees 229,486.00 57,371 50 57,951.00 (579.50) Central Office Bookkeeping Fees 26,730.00 6,682.50 6,750.00 (67.50) Tenant Services 37,074.00 9,268.50 6,432.59 2,835.91 Utilities Expense 535,500.00 133,87500 131,550.62 2,324.38 Ordinary Maintenance 521,890.00 130,472.50 126,976.37 3,496.13 Protective Services 43,400.00 10,850.00 8,849.20 2,000.80 General 121,410.00 30,352.50 27,871.62 2,480.88 PILOT. 17,450.00 4,362.50 4,427.12 (64.62) Extraordinary Maintenance 171,000.00 42,750.00 42,750.00 Replacement of Equipment 18,824.00 4,706 00 10,395.43 (5,689.43) Capital Replacements - - - - Loss from Sale of Equipment Betterments & Additions
Total Expenses 1,952,098 00 488,024.50 428,535 48 59,489.02
Duff In Oper Revenues & Expenses 223,229.00 55,807.25 113,762.05 57,954.80
Non-Oper. Revenue/Expenses Transfers In 430,000.00 430,00&00 Transfers Out Reserve Used Other Income-trf from Capital Fund Other Income-trf to Central Office Other Income-Lease Payments Other Income-Replacement Housing Cost of Assets Disposed
- - 430,000,00 430,000.00
Difference in Revenue & Expense 223,229.00 55,807.25 543,762.05 487,954.80
*YTD Budget is Annual Budget divided by 12, then multiplied by 3 months. **YTD Actual is Revenue or Expense from 10/1/18 through 12/31/18.
24
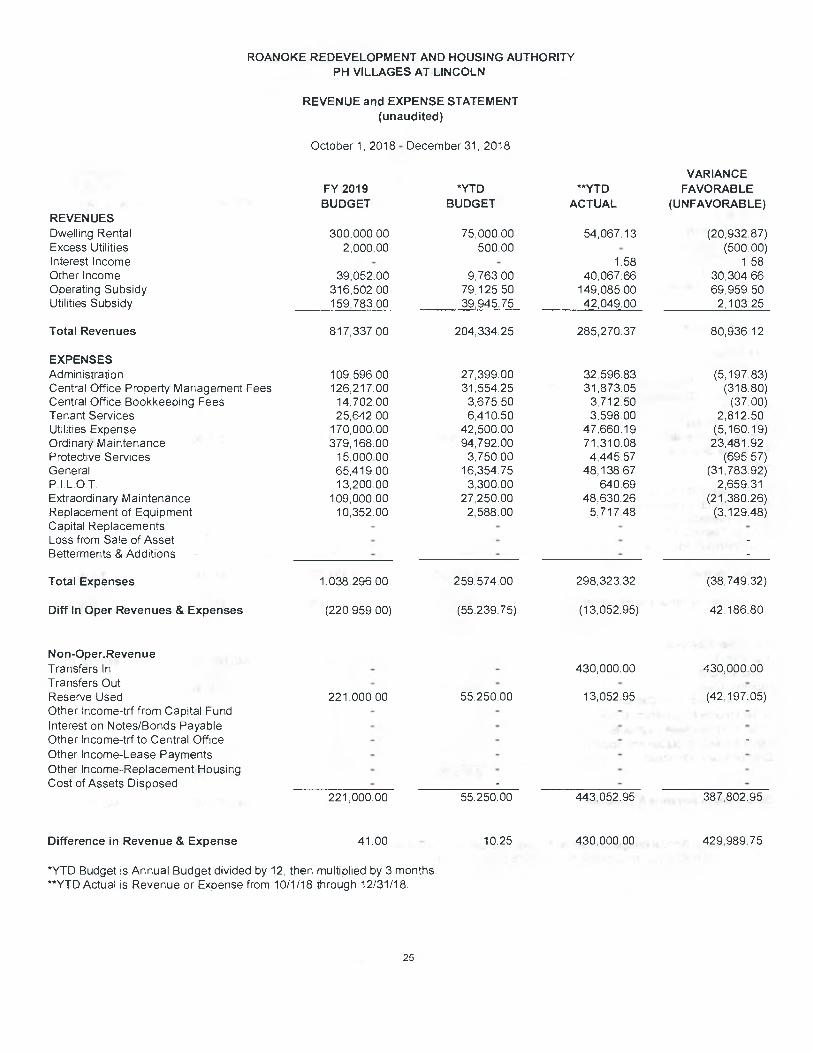
ROANOKE REDEVELOPMENT AND HOUSING AUTHORITY PH VILLAGES AT LINCOLN
REVENUE and EXPENSE STATEMENT (unaudited)
October 1, 2018- December 31, 2018
REVENUES
FY 2019 BUDGET
*YTD
BUDGET
**s(D
ACTUAL
VARIANCE FAVORABLE
(UNFAVORABLE)
Dwelling Rental 300,000.00 75,000.00 54,067.13 (20,932.87) Excess Utilities 2,000.00 500.00 (500.00) Interest Income - 1.58 1 58 Other Income 39,052.00 9,763.00 40,067.66 30,304.66 Operating Subsidy 316,502.00 79,125.50 149,085.00 69,959.50 Utilities Subsidy 159,783.00 39,945.75 42,049.00 2,103.25
Total Revenues 817,337.00 204,334.25 285,270.37 80,936.12
EXPENSES Administration 109,596.00 27,399.00 32,596.83 (5,197.83) Central Office Property Management Fees 126,217.00 31,55425 31,87305 (318.80) Central Office Bookkeeping Fees 14,702 00 3,675.50 3,712.50 (37.00) Tenant Services 25,642.00 6,410.50 3,598.00 2,812.50 Utilities Expense 170,000.00 42,500.00 47,660.19 (5,160.19) Ordinary Maintenance 379,16800 94,792.00 71,310.08 23,481.92 Protective Services 15,000 00 3,750.00 4,445.57 (695,57) General 65,419.00 16,354 75 48,13867 (31,783 92) PILOT. 13,200 00 3,300.00 640.69 2,659.31 Extraordinary Maintenance 109,000.00 27,250.00 48,630.26 (21,380.26) Replacement of Equipment 10,352.00 2,588.00 5,717,48 (3,129.48) Capital Replacements - Loss from Sale of Asset - - Betterments & Additions -
Total Expenses 1,038,296.00 259.574 00 298,323.32 (38,749.32)
Duff In Oper Revenues & Expenses (220,959.00) (55,239.75) (13.052.95) 42,186.80
Non-Oper.Revenue Transfers In - 430,000.00 430,000.00 Transfers Out Reserve Used 221,000.00 55,250.00 13,052.95 (42,197.05) Other Income-trf from Capital Fund Interest on Notes/Bonds Payable Other Income-trf to Central Office Other Income-Lease Payments Other Income-Replacement Housing Cost of Assets Disposed
221,000.00 55,250.00 443,052.95 387,802.95
Difference in Revenue & Expense 41.00 10.25 430,000.00 429,989.75
*YTD Budget is Annual Budget divided by 12, then multiplied by 3 months. **YTD Actual is Revenue or Expense from 10/1/18 through 12/31/18.
25
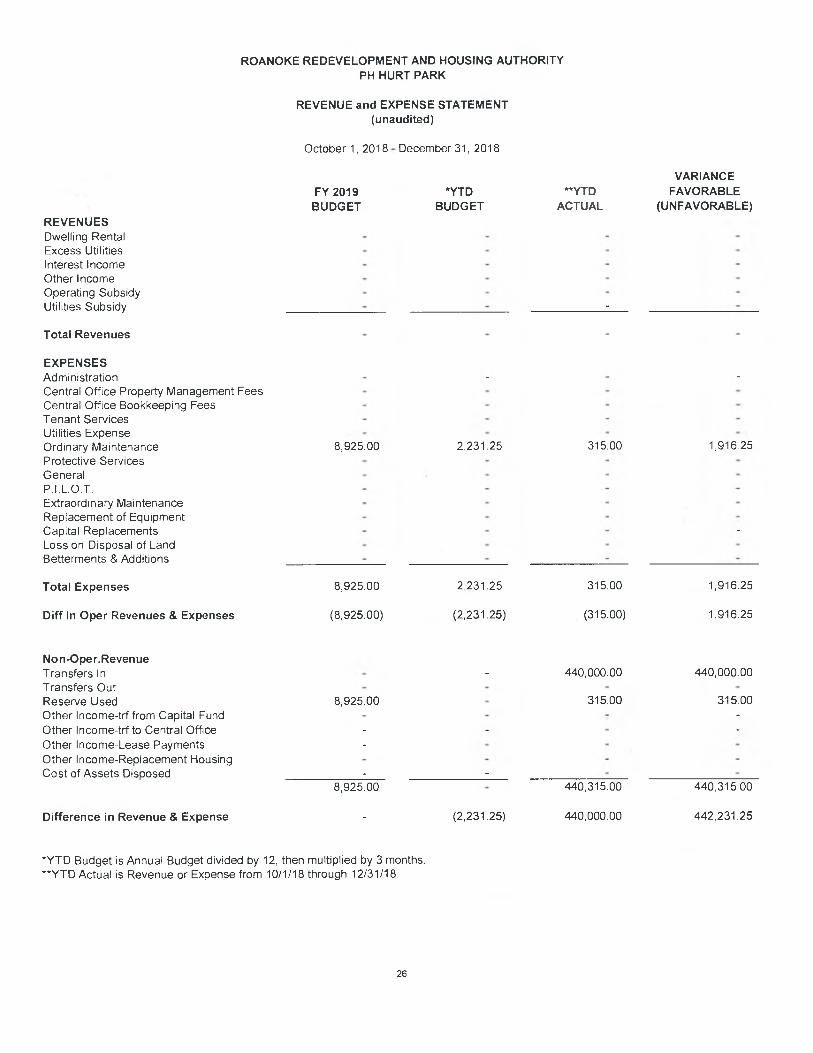
ROANOKE REDEVELOPMENT AND HOUSING AUTHORITY PH HURT PARK
REVENUE and EXPENSE STATEMENT (unaudited)
October 1, 2018- December 31, 2018
FY 2019 BUDGET
'YTD BUDGET ACTUAL
VARIANCE FAVORABLE
(UNFAVORABLE) REVENUES Dwelling Rental Excess Utilities Interest Income Other Income Operating Subsidy Utilities Subsidy
Total Revenues
EXPENSES Administration Central Office Property Management Fees Central Office Bookkeeping Fees Tenant Services Utilities Expense Ordinary Maintenance 8,925.00 2,231.25 315.00 1916.25 Protective Services General P. I. L. 0. T. Extraordinary Maintenance Replacement of Equipment Capital Replacements Loss on Disposal of Land Betterments & Additions
Total Expenses 8,925.00 2,231.25 315.00 1,916.25
Duff In Oper Revenues & Expenses (8925.00) (2,231.25) (315.00) 1,916.25
Non-Oper.Revenue Transfers In - 440,000.00 440,000.00 Transfers Out Reserve Used 8,925.00 315.00 315.00 Other Income-trf from Capital Fund Other Income-trf to Central Office Other Income-Lease Payments Other Income-Replacement Housing Cost of Assets Disposed
8,925.00 440,315.00 440,31500
Difference in Revenue & Expense (2,231.25) 440,000.00 442,231.25
*YTD Budget is Annual Budget divided by 12, then multiplied by 3 months. **YTD Actual is Revenue or Expense from 10/1/18 through 12/31/18
26
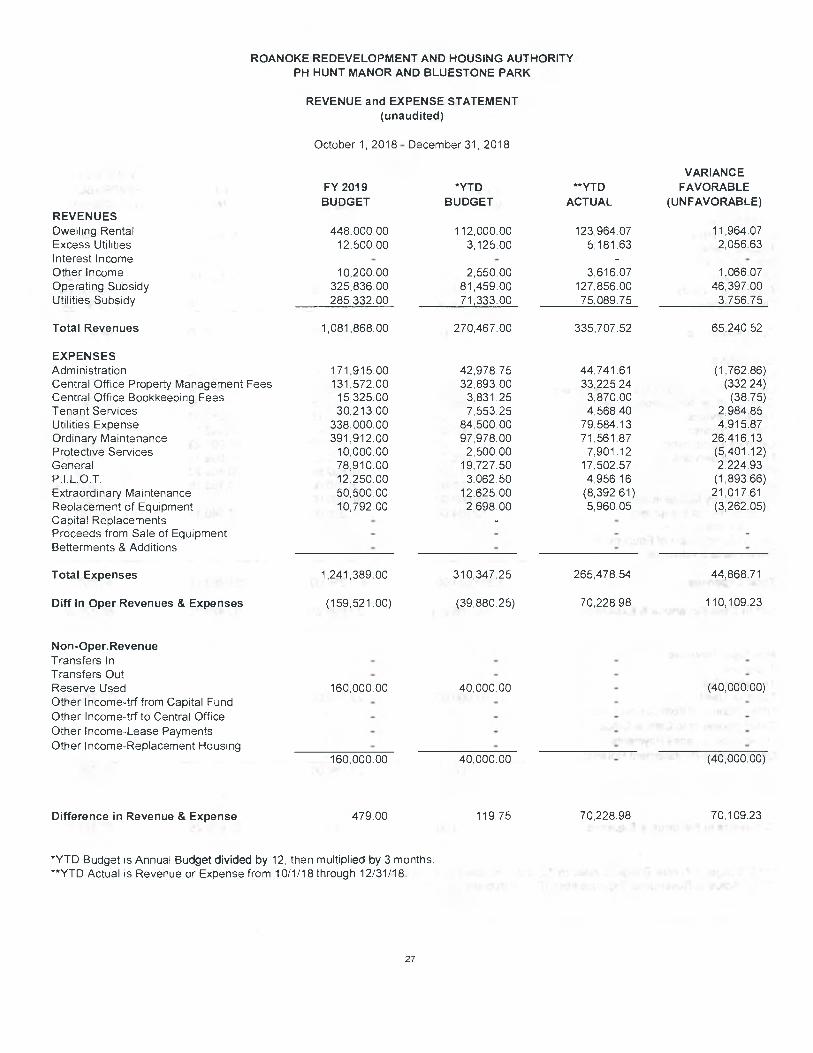
ROANOKE REDEVELOPMENT AND HOUSING AUTHORITY PH HUNT MANOR AND BLUESTONE PARK
REVENUE and EXPENSE STATEMENT (unaudited)
October 1, 2018- December 31, 2018
REVENUES
FY 2019 BUDGET
*YTD
BUDGET YTD
ACTUAL
VARIANCE FAVORABLE
(UNFAVORABLE)
Dwelling Rental 448,00000 112,000.00 123,964.07 11,964.07 Excess Utilities 12,500.00 3,125.00 5,181.63 2,056.63 Interest Income - - Other Income 10,200.00 2,550.00 3,616.07 1,066.07 Operating Subsidy 325,836.00 81,459.00 127,856.00 46,397.00 Utilities Subsidy 285,332.00 71,333.00 75,089.75 3,756.75
Total Revenues 1,081,868.00 270,467.00 335,707.52 65,240 52
EXPENSES Administration 171,915.00 42,978 75 44,741.61 (1,762 86) Central Office Property Management Fees 131,572.00 32,89300 33,225.24 (332.24) Central Office Bookkeeping Fees 15,325.00 3,831.25 3,87000 (38.75) Tenant Services 30,21300 7,553.25 4,568.40 2,984.85 Utilities Expense 338,000.00 84,500.00 79,584.13 4,915.87 Ordinary Maintenance 391,912.00 97,978.00 71,561.87 26,416.13 Protective Services 10,000.00 2,500.00 7,901.12 (5,401.12) General 78,910.00 19,727.50 17,502.57 2,224.93 PILOT. 12,250.00 3,062.50 4,956.16 (1,893.66) Extraordinary Maintenance 50,500.00 12,625.00 (8,392.61) 21,017 61 Replacement of Equipment 10,792 00 2,698 00 5,960.05 (3,262.05) Capital Replacements - - - Proceeds from Sale of Equipment - - - Betterments & Additions - - -
Total Expenses 1,241,389.00 310,347.25 265,478,54 44,868.71
Dff In Oper Revenues & Expenses (159,521.00) (39,880.25) 70,228.98 110,109.23
Non-Oper.Revenue Transfers In Transfers Out Reserve Used 160,000.00 40,000.00 - (40,000.00) Other Income-trf from Capital Fund Other Income-trf to Central Office Other Income-Lease Payments Other Income-Replacement Housing
160,000.00 40,000.00 (40,000.00)
Difference in Revenue & Expense 479.00 119.75 70,228.98 70,109.23
*YTD Budget is Annual Budget divided by 12, then multiplied by 3 months. **YTD Actual is Revenue or Expense from 10/1/18 through 12/31/18.
27
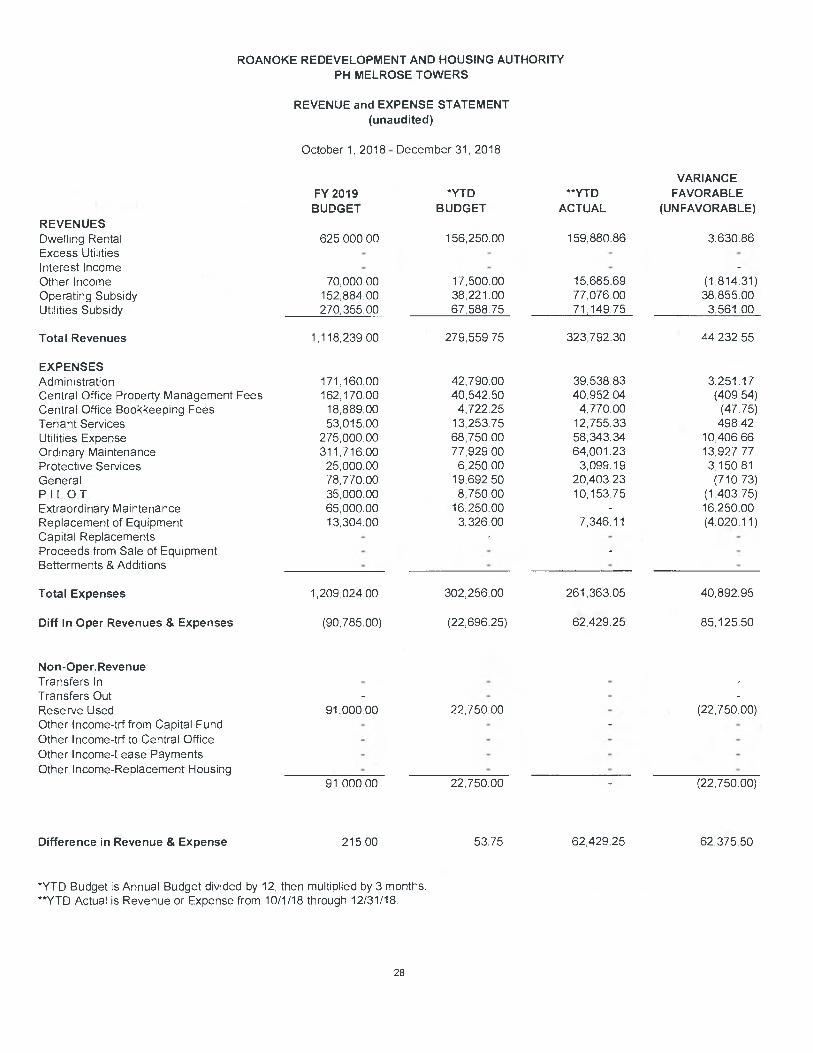
ROANOKE REDEVELOPMENT AND HOUSING AUTHORITY PH MELROSE TOWERS
REVENUE and EXPENSE STATEMENT (unaudited)
October 1, 2018- December 31, 2018
REVENUES
FY 2019 BUDGET
*YTD
BUDGET
**YTD
ACTUAL
VARIANCE FAVORABLE
(UNFAVORABLE)
Dwelling Rental 625,00000 156,250 00 159,880.86 3,630.86 Excess Utilities Interest Income Other Income 70,000.00 17,500 00 15,685.69 (1,814.31) Operating Subsidy 152,884.00 38,221.00 77,076.00 38,855.00 Utilities Subsidy 270,355.00 67,588.75 71,149.75 3,561.00
Total Revenues 1,118,239.00 279,55975 323,792.30 44,232.55
EXPENSES Administration 171,160.00 42,790.00 39,538.83 3,251.17 Central Office Property Management Fees 162,170.00 40,542.50 40,952 04 (409 54) Central Office Bookkeeping Fees 18,889.00 4,722.25 4,770.00 (47.75) Tenant Services 53,015.00 13,253.75 12,755.33 498.42 Utilities Expense 275,000 00 68,750.00 58,343.34 10,406.66 Ordinary Maintenance 311,716.00 77,929 00 64,001.23 13,927.77 Protective Services 25,000.00 6,250.00 3,099.19 3,150.81 General 78,770.00 19,692 50 20,403.23 (710.73) P110T. 35,000.00 8,750,00 10,153.75 (1,403.75) Extraordinary Maintenance 65,000.00 16,250.00 - 16,250.00 Replacement of Equipment 13,304.00 3,326.00 7,346.11 (4,020.11) Capital Replacements - - Proceeds from Sale of Equipment - - - Betterments & Additions - - -
Total Expenses 1,209,024.00 302,256.00 261,363.05 40,892.95
Duff In Oper Revenues & Expenses (90,785.00) (22,696.25) 62,429.25 85,125.50
Non-Oper.Revenue Transfers In Transfers Out Reserve Used 91,000.00 22,750 00 (22,750.00) Other Income-trf from Capital Fund Other Income-trf to Central Office Other Income-Lease Payments Other Income-Replacement Housing
91,000.00 22,750.00 (22,750.00)
Difference in Revenue & Expense 215.00 53.75 62,429.25 62,375.50
*YTD Budget is Annual Budget divided by 12, then multiplied by 3 months. **YTD Actual is Revenue or Expense from 10/1/18 through 12/31/18
28
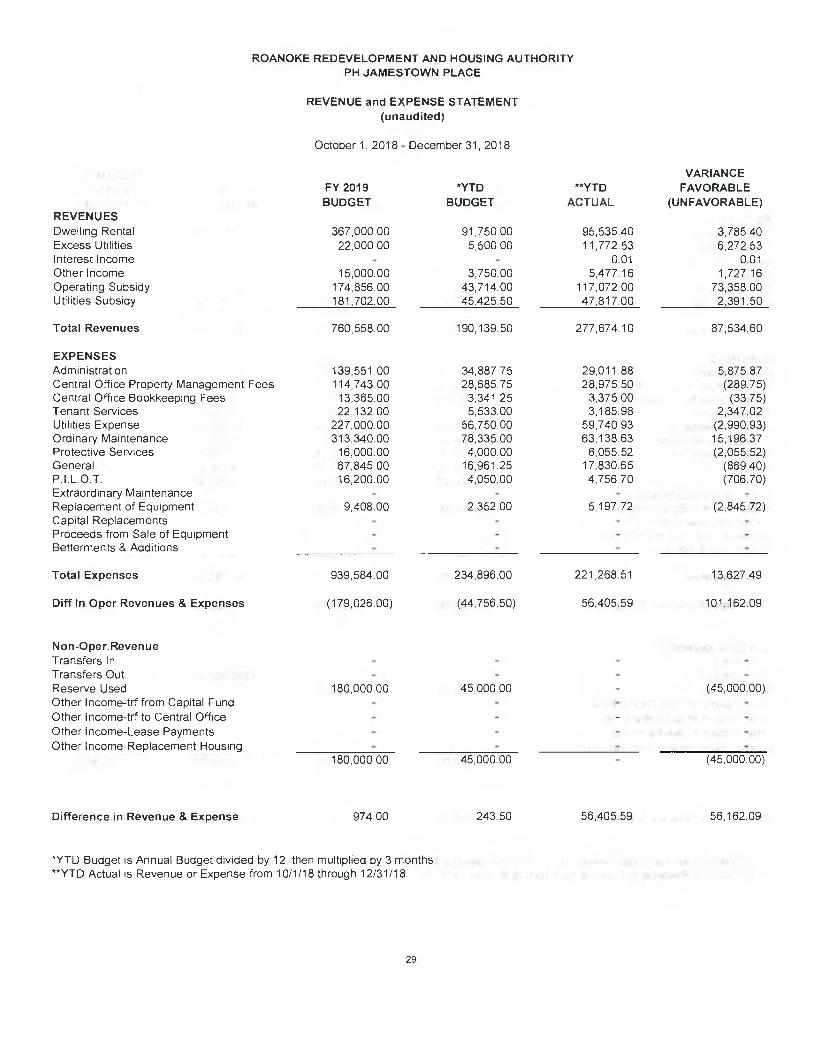
ROANOKE REDEVELOPMENT AND HOUSING AUTHORITY PH JAMESTOWN PLACE
REVENUE and EXPENSE STATEMENT (unaudited)
October 1, 2018- December 31, 2018
REVENUES
FY 2019 BUDGET
*YTD
BUDGET
**YTD
ACTUAL
VARIANCE FAVORABLE
(UNFAVORABLE)
Dwelling Rental 367,00000 91,750.00 95,535.40 3,78540 Excess Utilities 22,000.00 5,500.00 11,772.53 6,272.53 Interest Income 0.01 0.01 Other Income 15,000.00 3,750.00 5,477.16 1727.16 Operating Subsidy 174,856.00 43,714.00 117,072.00 73,358.00 Utilities Subsidy 181,702.00 45,425.50 47,817.00 2,391.50
Total Revenues 760,558.00 190,139.50 277,674,10 87,534.60
EXPENSES Administration 139,551 00 34,887.75 29,011.88 5,875.87 Central Office Property Management Fees 114,743.00 28,68575 28,975.50 (289.75) Central Office Bookkeeping Fees 13,365.00 3,341.25 3,375.00 (33.75) Tenant Services 22,132.00 5,533.00 3,185.98 2,347.02 Utilities Expense 227,000.00 56,750.00 59,740 93 (2,990.93) Ordinary Maintenance 313,340.00 78,335.00 63,138.63 15,196.37 Protective Services 16,000.00 4,000.00 6,055.52 (2,055.52) General 67,845 00 16,961.25 17,830.65 (86940) PILOT. 16,200.00 4,050.00 4,75670 (706.70) Extraordinary Maintenance Replacement of Equipment 9,408.00 2,352.00 5,197 72 (2,845.72) Capital Replacements Proceeds from Sale of Equipment Betterments & Additions
Total Expenses 939,584.00 234,896.00 221,268.51 13,62749
Duff In Oper Revenues & Expenses (179,026.00) (44,756.50) 56,405.59 101,162.09
Non-Oper.Revenue Transfers In Transfers Out Reserve Used 180,000.00 45,000.00 - (45,000.00) Other Income-trf from Capital Fund Other Income-trf to Central Office Other Income-Lease Payments Other Income-Replacement Housing
180,000.00 45,000.00 - (45,000.00)
Difference in Revenue & Expense 974.00 243.50 56,405.59 56,162.09
*YTD Budget is Annual Budget divided by 12, then multiplied by 3 months. **YTD Actual is Revenue or Expense from 10/1/18 through 12/31/18.
29

ROANOKE REDEVELOPMENT AND HOUSING AUTHORITY PH MORNINGSIDE MANOR
REVENUE and EXPENSE STATEMENT (unaudited)
October 1, 2018- December 31, 2018
REVENUES
FY 2019 BUDGET
*YTD
BUDGET YTD
ACTUAL
VARIANCE
FAVORABLE (UNFAVORABLE)
Dwelling Rental 328,00000 82,000 00 82,958.85 958.85 Excess Utilities - - - - Interest Income - - - - Other Income 16,500.00 4,125.00 5,002.93 877.93 Operating Subsidy 145,149.00 36,287.25 38,198.00 1,910.75 Utilities Subsidy 151,073.00 37,76825 39,757.50 1,989.25
Total Revenues 640,722.00 160,180.50 165,917.28 5,736.78
EXPENSES Administration 119,242.00 29,810.50 23,775 56 6,034.94 Central Office Property Management Fees 80,320.00 20,080.00 20,218.46 (138.46) Central Office Bookkeeping Fees 9,356.00 2,339.00 2,355.00 (16.00) Tenant Services 35,581.00 8,895.25 9,582.17 (686.92) Utilities Expense 139,000.00 34,750.00 35,969.68 (1,219.68) Ordinary Maintenance 194,666.00 48,666.50 49,711.86 (1,045.36) Protective Services 8,000.00 2,000.00 686.37 1,313.63 General 39,110.00 9,777.50 8,156.94 1,620.56 P.I.L.O T. 18,900.00 4,725.00 4,698.92 26.08 Extraordinary Maintenance - Replacement of Equipment 6,592.00 1,648.00 3,638.40 (1,990.40) Capital Replacements Proceeds from Sale of Equipment Betterments & Additions
Total Expenses 650,767.00 162,691.75 158,793.36 3,898.39
01ff In Oper Revenues & Expenses (10,045.00) (2,511.25) 7,123.92 9,635.17
Non-Oper.Revenue Transfers In - - - Transfers Out - - (200,000.00) (200,000 00) Reserve Used 10,200.00 2,550.00 (2,550.00) Other Income-trf from Capital Fund - - -
Other Income-trf to Central Office - - - Other Income-Lease Payments - - -
Other Income-Replacement Housing - - -- - 10,200.00 2,55000 (200,000.00) (202,550.00)
Difference in Revenue & Expense 155.00 38.75 (192,876.08) (192,914.83)
*YTD Budget is Annual Budget divided by 12, then multiplied by 3 months. **YTD Actual is Revenue or Expense from 10/1/18 through 12/31/18.
30
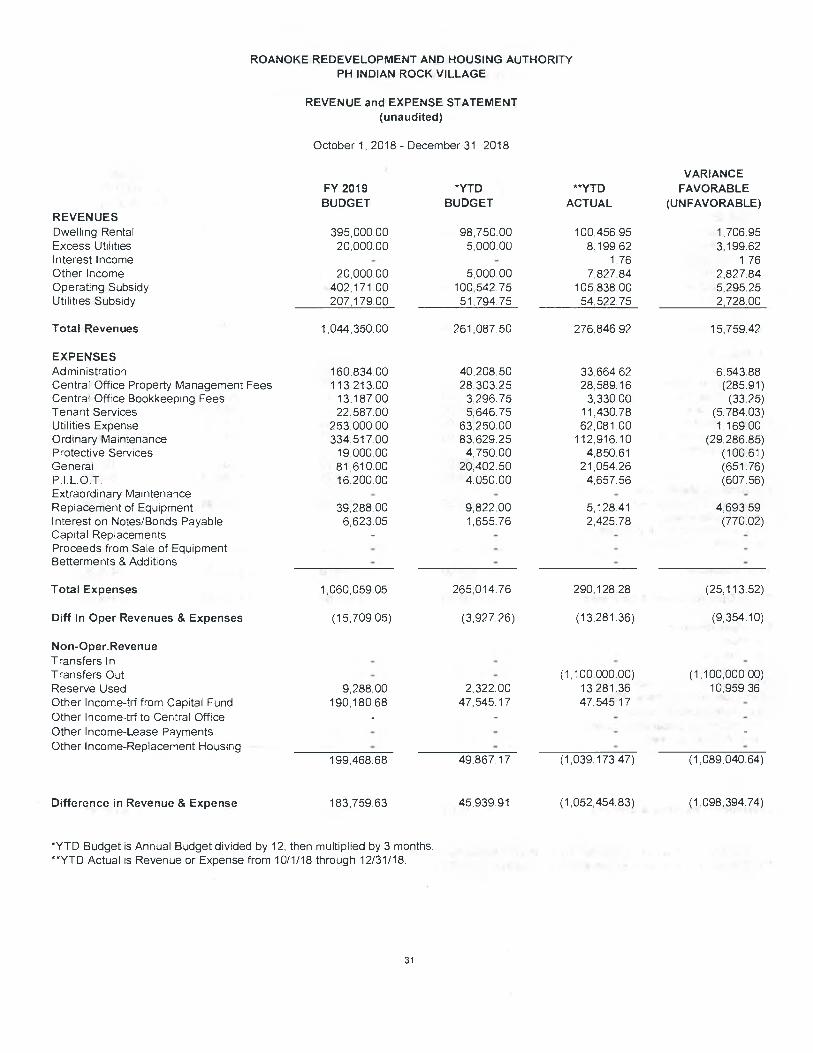
ROANOKE REDEVELOPMENT AND HOUSING AUTHORITY PH INDIAN ROCK VILLAGE
REVENUE and EXPENSE STATEMENT (unaudited)
REVENUES
October 1, 2018 -
FY 2019 BUDGET
December 31, 2018
*YTD
BUDGET
**YTD
ACTUAL
VARIANCE FAVORABLE
(UNFAVORABLE)
Dwelling Rental 395,000.00 98,750.00 100,456.95 1,706.95 Excess Utilities 20,000.00 5,000.00 8,199.62 3,199.62 Interest Income - - 1.76 176 Other Income 20,000.00 5,000.00 7,827.84 2,827.84 Operating Subsidy 402,171.00 100,542.75 105,838.00 5,295.25 Utilities Subsidy 207,179.00 51,794.75 54,522.75 2,728.00
Total Revenues 1,044,350.00 261,087.50 276,846.92 15,759.42
EXPENSES Administration 160,834 00 40,208.50 33,664 62 6,543.88 Central Office Property Management Fees 113,213.00 28,303.25 28,589.16 (285.91) Central Office Bookkeeping Fees 13,18700 3,296.75 3,330.00 (33.25) Tenant Services 22,587.00 5,646.75 11,430.78 (5,784.03) Utilities Expense 253,000 00 63,250.00 62,081.00 1,169.00 Ordinary Maintenance 334,517 00 83,629.25 112,916.10 (29,286.85) Protective Services 19,000 00 4,750.00 4,850.61 (100.61) General 81,610,00 20,402.50 21,054.26 (651.76) P.I.L.O T 16,20000 4,050.00 4,657.56 (607.56) Extraordinary Maintenance - Replacement of Equipment 39,288.00 9,822.00 5,128.41 4,693.59 Interest on Notes/Bonds Payable 6,623.05 1,655.76 2,425.78 (770.02) Capital Replacements - Proceeds from Sale of Equipment Betterments & Additions
Total Expenses 1,060,059.05 265,014.76 290,128.28 (25,113.52)
Duff In Oper Revenues & Expenses (15,709.05) (3,927.26) (13,281.36) (9,354.10)
Non-Oper.Revenue Transfers In - - - Transfers Out - - (1,100,000.00) (1,100,000.00) Reserve Used 9,288.00 2,322.00 13,281.36 10,959.36 Other Income-trf from Capital Fund 190,180.68 47,545.17 47,545.17 - Other Income-trf to Central Office - - Other Income-Lease Payments - - Other Income-Replacement Housing
199,468.68 49,867.17 (1,039,173.47) (1,089,040.64)
Difference in Revenue & Expense 183,759.63 45,93991 (1,052,454.83) (1,098,394.74)
*YTD Budget is Annual Budget divided by 12, then multiplied by 3 months. **YTD Actual is Revenue or Expense from 10/1/18 through 12/31/18.
31
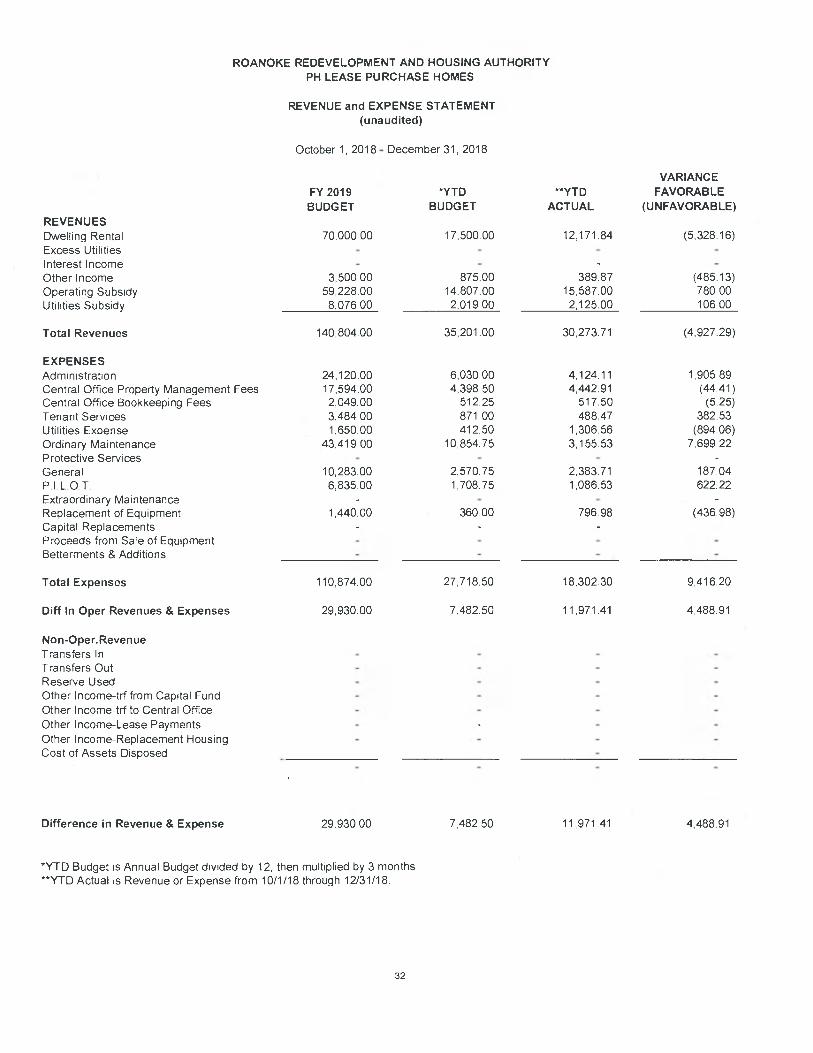
ROANOKE REDEVELOPMENT AND HOUSING AUTHORITY PH LEASE PURCHASE HOMES
REVENUE and EXPENSE STATEMENT (unaudited)
REVENUES
October 1, 2018
FY 2019 BUDGET
- December 31, 2018
*YTD
BUDGET
**YTD
ACTUAL
VARIANCE FAVORABLE
(UNFAVORABLE)
Dwelling Rental 70,000.00 17,500.00 12,171.84 (5,328.16) Excess Utilities Interest Income Other Income 3,500.00 875.00 389.87 (485.13) Operating Subsidy 59,228.00 14,807.00 15,587.00 780.00 Utilities Subsidy 8,076 00 2,019 00 2,125.00 106.00
Total Revenues 140,804.00 35,201.00 30,273.71 (4,927.29)
EXPENSES Administration 24,120.00 6,030.00 4,124.11 1,905.89 Central Office Property Management Fees 17,594.00 4,398.50 4,442.91 (44.41) Central Office Bookkeeping Fees 2,049.00 512.25 517.50 (5.25) Tenant Services 3,484 00 871.00 488.47 382.53 Utilities Expense 1,650.00 412.50 1,306.56 (894.06) Ordinary Maintenance 43,419.00 10,854.75 3,155.53 7,699.22 Protective Services General 10,283.00 2570.75 2,383 71 18704 P.I.L.O T. 6,835.00 1,708.75 1,086.53 622.22 Extraordinary Maintenance Replacement of Equipment 1,440.00 360.00 796.98 (436.98) Capital Replacements Proceeds from Sale of Equipment Betterments & Additions
Total Expenses 110,874.00 27,718.50 18,302.30 9,416.20
Duff In Oper Revenues & Expenses 29,930.00 7,482 50 11,971.41 4,488.91
Non-Oper.Revenue Transfers In Transfers Out Reserve Used Other Income-trf from Capital Fund Other Income-trf to Central Office Other Income-Lease Payments Other Income-Replacement Housing Cost of Assets Disposed
Difference in Revenue & Expense
29,930.00 7,482.50
11,971.41 4,488.91
*YTD Budget is Annual Budget divided by 12, then multiplied by 3 months **YTD Actual is Revenue or Expense from 10/1/18 through 12/31/18.
32
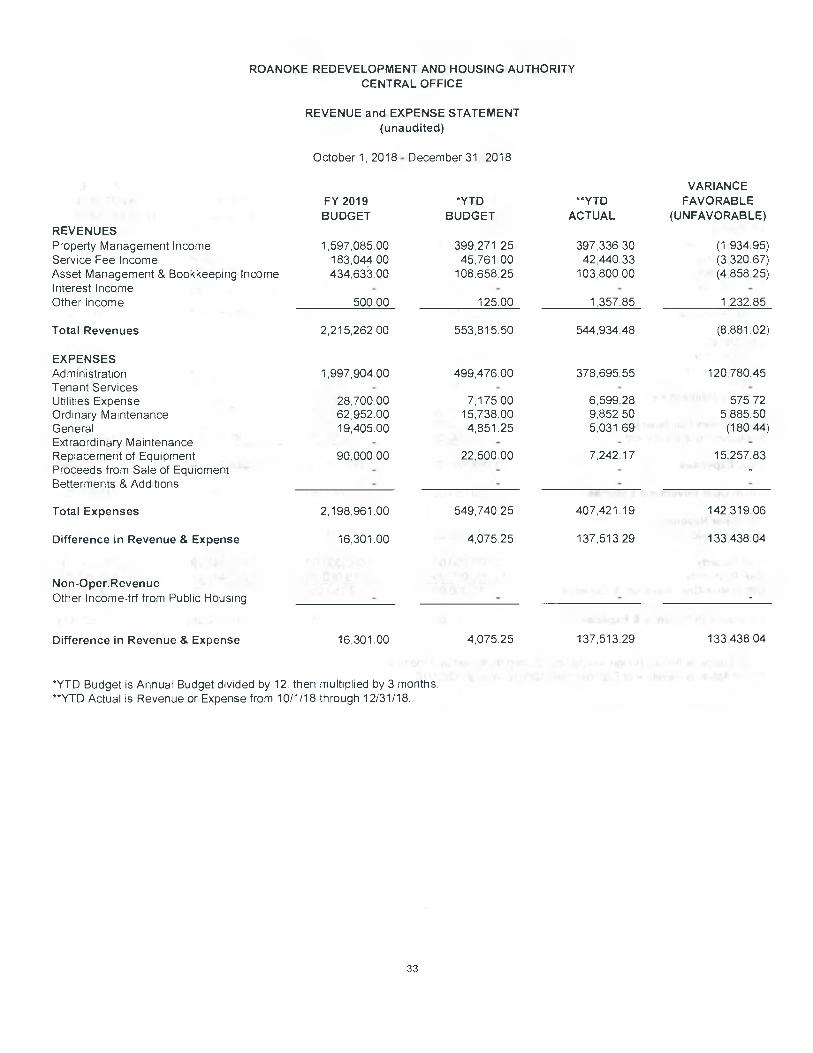
ROANOKE REDEVELOPMENT AND HOUSING AUTHORITY CENTRAL OFFICE
REVENUE and EXPENSE STATEMENT (unaudited)
October 1, 2018- December 31, 2018
REVENUES
FY 2019 BUDGET
*YTD
BUDGET
**YTD
ACTUAL
VARIANCE FAVORABLE
(UNFAVORABLE)
Property Management Income 1597,085.00 399,271.25 397,336.30 (1,934.95) Service Fee Income 183,044.00 45,761.00 42,440.33 (3,320.67) Asset Management & Bookkeeping Income 434,633.00 108658.25 103800.00 (4,858.25) Interest Income Other Income 50000 125.00 1357.85 1,232.85
Total Revenues 2,215,262.00 553,815.50 544,934.48 (8,881.02)
EXPENSES Administration 1,997,904.00 499,476.00 378,695.55 120,780.45 Tenant Services - - - Utilities Expense 28,70000 7,17500 6,599.28 575.72 Ordinary Maintenance 62,952,00 15,738.00 9,85250 5,885.50 General 19,405.00 4,851.25 5,031.69 (180.44) Extraordinary Maintenance - - - Replacement of Equipment 90,000 00 22,500 00 7,242.17 15,257.83 Proceeds from Sale of Equipment - - - Betterments & Additions
Total Expenses 2,198,961.00 549,740.25 407,421.19 142,319.06
Difference in Revenue & Expense 16,301.00 4,075.25 137,513.29 133,438.04
Non-Oper.Revenue Other Income-trf from Public Housing
Difference in Revenue & Expense 16,301.00 4,075.25 137,513.29 133,438.04
*YTD Budget is Annual Budget divided by 12, then multiplied by 3 months **YTD Actual is Revenue or Expense from 10/1/18 through 12/31/18.
33
ROANOKE REDEVELOPMENT AND HOUSING AUTHORITY SECTION 8
REVENUE and EXPENSE STATEMENT (unaudited)
REVENUES
October 1, 2018 -
FY 2019 BUDGET
December 31, 2018
*YTD
BUDGET
**YTD
ACTUAL
VARIANCE FAVORABLE
(UNFAVORABLE)
Interest Income 000 000 0.00 000 Other Income 9,540.00 2,385.00 1,366 54 (1,018.46) Adm Subsidy 1044,078.00 261019.50 266,735.00 5,715.50 FSS Subsidy 000 000 000 000
Total Revenues 1,053,618.00 263,40450 268,101.54 4,697.04
EXPENSES Administration 947,05500 236,763.75 216,131.02 20,632.73 Tenant Service 13,397 00 3,349,25 500.59 2,848.66 Utilities 5,950.00 1,487.50 1,319.86 167.64 Ordinary Maintenance 8,000.00 2,000.00 852.86 1,147.14 General 15,185.00 3,796.25 3,846.84 (50,59) Extraordinary Maintenance 0.00 0.00 0.00 0.00 Replacement of Equipment 75,000.00 18,750.00 63,862.62 (45,112.62)
Total Expenses 1,064,587.00 266,146,75 286,513.79 (20,367.04)
Duff In Oper Revenue & Expense (10,969.00) (2,742.25) (18,412.25) (15,670.00)
Non-Oper.Revenue Reserve Used 11,000.00 2,750 00 0.00 2,750.00
HAP Subsidy 12,000,000.00 3,000,00000 2,897,448.29 (102,551.71) HAP Payments 12,000,000.00 3,000,000.00 2,897,448.29 102,551.71 Diff in Non-Oper Revenue & Expense 11,000.00 2,750 00 0.00 2,750.00
Difference in Revenue & Expense 31.00 7.75 (18,412.25) (8,222.96)
*YTD Budget is Annual Budget divided by 12, then multiplied by 3 months **YTD Actual is Revenue or Expense from 10/1/18 through 12/31/18
34
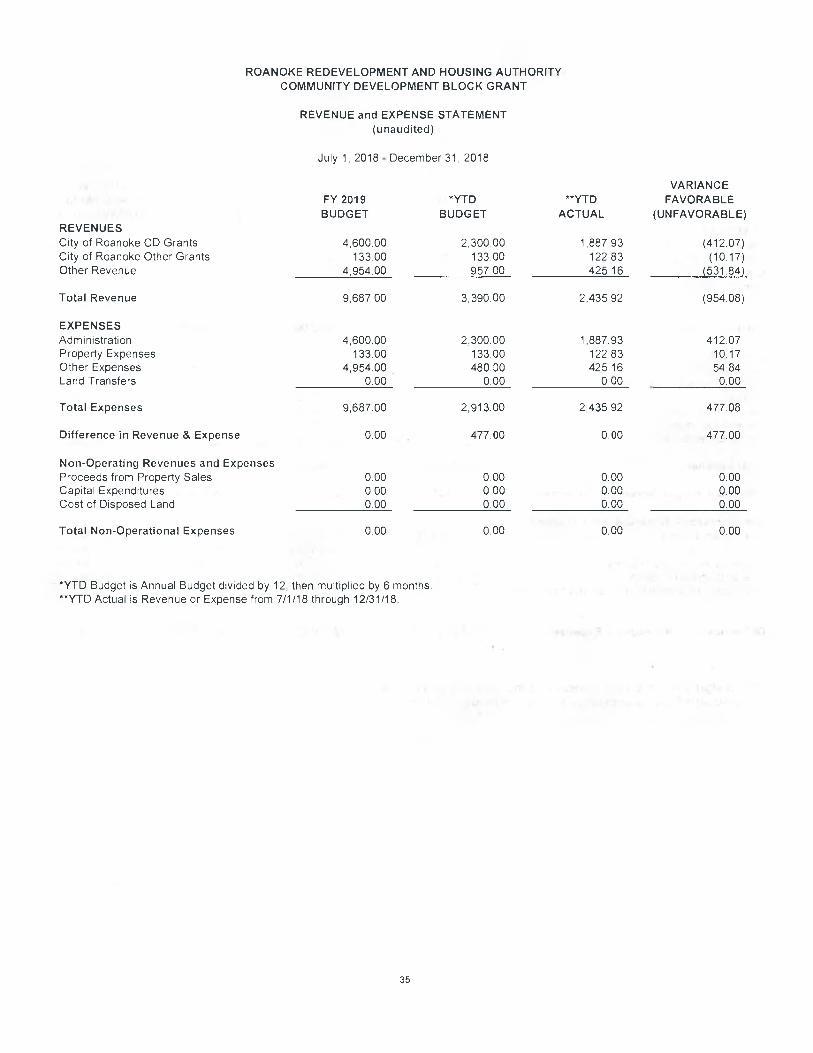
ROANOKE REDEVELOPMENT AND HOUSING AUTHORITY COMMUNITY DEVELOPMENT BLOCK GRANT
REVENUE and EXPENSE STATEMENT (unaudited)
July 1,2018-December 31, 2018
REVENUES
FY 2019 BUDGET
*YTD
BUDGET
**YTD
ACTUAL
VARIANCE FAVORABLE
(UNFAVORABLE)
City of Roanoke CD Grants 4,600.00 2,30000 1,887.93 (412.07) City of Roanoke Other Grants 13300 13300 122.83 (1017) Other Revenue 4,954.00 957.00 425.16 (531.84)
Total Revenue 9,68700 3,390.00 2,435.92 (954.08)
EXPENSES Administration 4,600.00 2,300.00 1,887.93 41207 Property Expenses 133.00 133.00 122.83 10.17 Other Expenses 4,954.00 480.00 425.16 54.84 Land Transfers 0.00 0.00 0.00 0.00
Total Expenses 9,687.00 2,913.00 2,435.92 477 08
Difference in Revenue & Expense 0.00 477,00 0.00 477.00
Non-Operating Revenues and Expenses Proceeds from Property Sales 0.00 0.00 0.00 0.00 Capital Expenditures 0.00 0.00 0.00 0.00 Cost of Disposed Land 0,00 0.00 0.00 0.00
Total Non-Operational Expenses 000 0.00 0.00 0.00
*YTD Budget is Annual Budget divided by 12, then multiplied by 6 months. **YTD Actual is Revenue or Expense from 7/1/18 through 12/31/18.
35
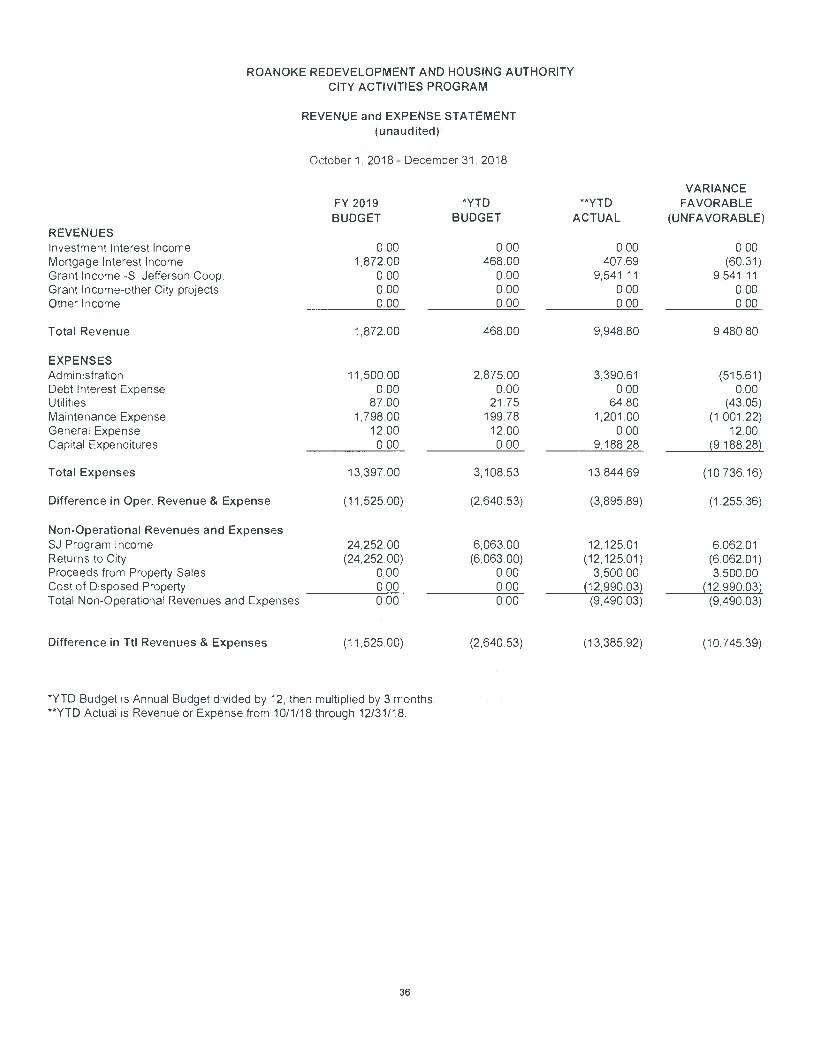
ROANOKE REDEVELOPMENT AND HOUSING AUTHORITY CITY ACTIVITIES PROGRAM
REVENUE and EXPENSE STATEMENT (unaudited)
October 1, 2018- December 31, 2018
REVENUES
FY 2019 BUDGET
*YTD
BUDGET **YTD
ACTUAL
VARIANCE FAVORABLE
(UNFAVORABLE)
Investment Interest Income 000 000 000 0.00 Mortgage Interest Income 1,872.00 468.00 40769 (60.31) Grant Income -S. Jefferson Coop. 000 0.00 9,541 11 9,541.11 Grant Income-other City projects 000 000 000 0.00 Other Income 0.00 0.00 0.00 0.00
Total Revenue 1,872.00 468.00 9,948.80 9,48080
EXPENSES Administration 11500.00 2,875.00 3,390.61 (51 5.61) Debt Interest Expense 0.00 0.00 0,00 0.00 Utilities 87.00 21.75 64.80 (43.05) Maintenance Expense 1,798.00 199.78 1,201.00 (1 .001 .22) General Expense 12.00 12.00 0.00 12.00 Capital Expenditures 0.00 0.00 9,188.28 (9,188.28)
Total Expenses 13,397.00 3,108.53 13,844.69 (10,736.16)
Difference in Oper. Revenue & Expense (11,525.00) (2,640.53) (3,895.89) (1,255.36)
Non-Operational Revenues and Expenses SJ Program Income 24,252.00 6,063.00 12,125.01 6,062.01 Returns to City (24,252.00) (6,063.00) (12,125.01) (6,062.01) Proceeds from Property Sales 0.00 0.00 3,500.00 3,500.00 Cost of Disposed Property 0.00 0.00 (12,990.03) (12,990.03) Total Non-Operational Revenues and Expenses 0.00 0.00 (9,490.03) (9,490.03)
Difference in Ttl Revenues & Expenses (11,525.00) (2,640.53) (13,385.92) (10,745.39)
*YTD Budget is Annual Budget divided by 12, then multiplied by 3 months. **YTD Actual is Revenue or Expense from 10/1/18 through 12/31/18.
36
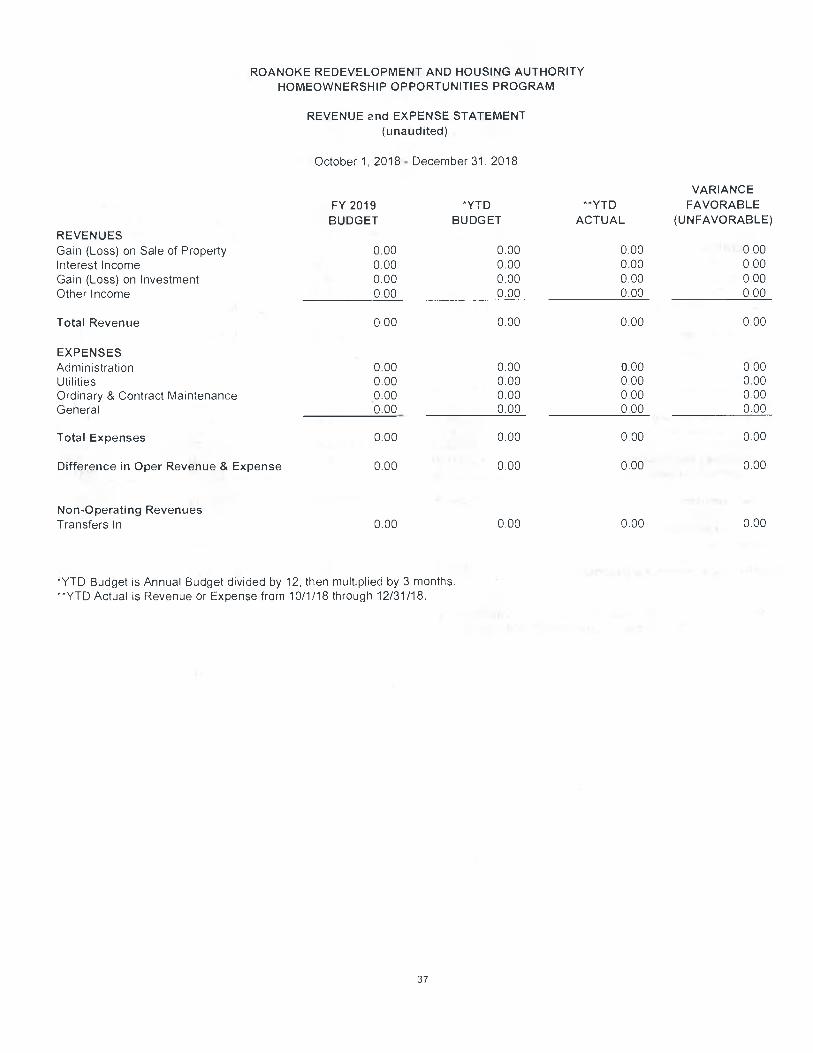
ROANOKE REDEVELOPMENT AND HOUSING AUTHORITY HOMEOWNERSHIP OPPORTUNITIES PROGRAM
REVENUE and EXPENSE STATEMENT (unaudited)
October 1, 2018- December 31, 2018
REVENUES
FY 2019 BUDGET
*YTD
BUDGET
**YTD
ACTUAL
VARIANCE FAVORABLE
(UNFAVORABLE)
Gain (Loss) on Sale of Property 0.00 0.00 0.00 0.00 Interest Income 0.00 0.00 0.00 0.00 Gain (Loss) on Investment 0.00 0.00 0.00 0.00 Other Income 0.00 0.00 0.00 0.00
Total Revenue 0.00 0.00 0.00 0.00
EXPENSES Administration 0.00 0.00 0.00 0.00 Utilities 0.00 0.00 0.00 0.00 Ordinary & Contract Maintenance 0.00 0.00 0.00 0.00 General 0.00 0.00 0.00 0.00
Total Expenses 0.00 0.00 0.00 0.00
Difference in Oper Revenue & Expense 0.00 0.00 0.00 0.00
Non-Operating Revenues Transfers In 0.00 0.00 0.00 0.00
*YTD Budget is Annual Budget divided by 12, then multiplied by 3 months. **YTD Actual is Revenue or Expense from 10/1/18 through 12/31/18.
37
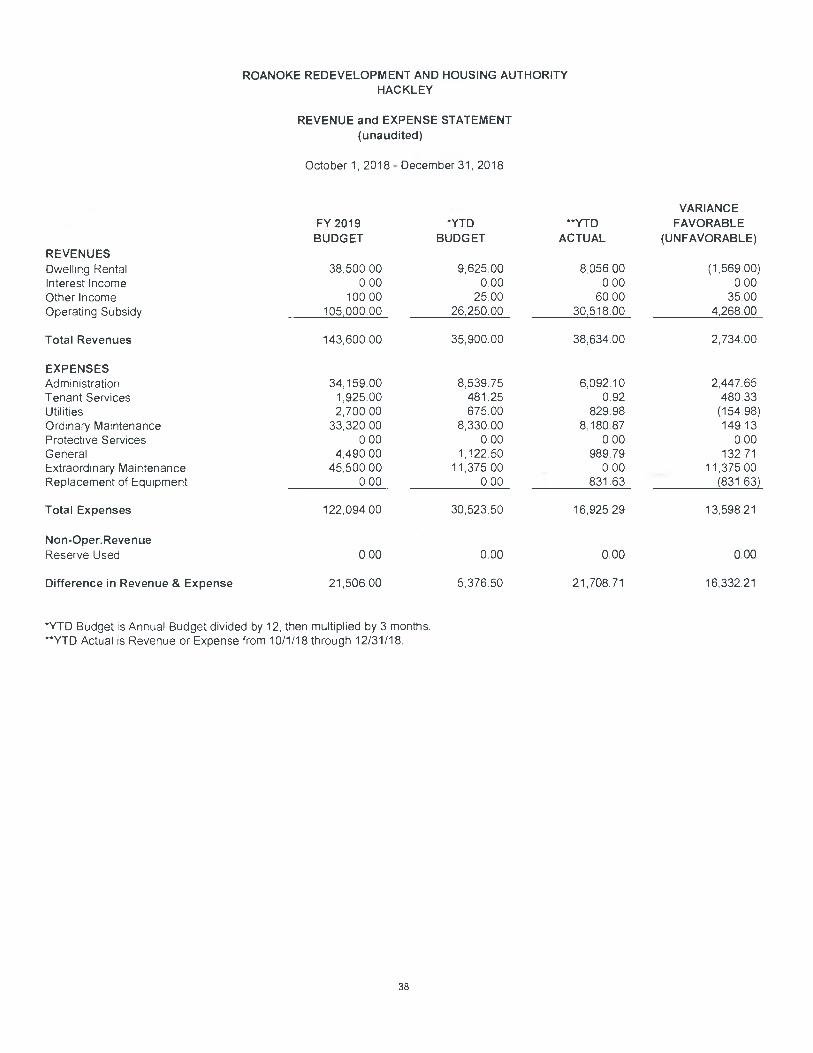
ROANOKE REDEVELOPMENT AND HOUSING AUTHORITY HACKLEY
REVENUE and EXPENSE STATEMENT (unaudited)
October 1, 2018- December 31, 2018
REVENUES
FY 2019 BUDGET
*YTD
BUDGET
**YTD
ACTUAL
VARIANCE FAVORABLE
(UNFAVORABLE)
Dwelling Rental 38,500 00 9,625.00 8,05600 (1,569.00) Interest Income 0.00 0.00 0.00 0.00 Other Income 10000 25.00 60.00 35.00 Operating Subsidy 105,000.00 26,250.00 30,518.00 4,268.00
Total Revenues 143,600.00 35,900.00 38,634.00 2,734.00
EXPENSES Administration 34,159.00 8,539.75 6,092.10 2,447.65 Tenant Services 1,925.00 481.25 0.92 480.33 Utilities 2,700.00 675.00 829.98 (154.98) Ordinary Maintenance 33,320.00 8,330.00 8,180.87 149.13 Protective Services 0.00 0.00 0.00 0.00 General 4,49000 1,122.50 989.79 132,71 Extraordinary Maintenance 45.500 00 11,375.00 0.00 11,375.00 Replacement of Equipment 0.00 0.00 831.63 (831.63)
Total Expenses 122,094 00 30,523.50 16,925.29 13,598.21
Non-Oper.Revenue Reserve Used 000 0.00 0.00 0.00
Difference in Revenue & Expense 21,506.00 5,376.50 21,708.71 16,332.21
*YTD Budget is Annual Budget divided by 12, then multiplied by 3 months. **YTD Actual is Revenue or Expense from 10/1/18 through 12/31/18.
38
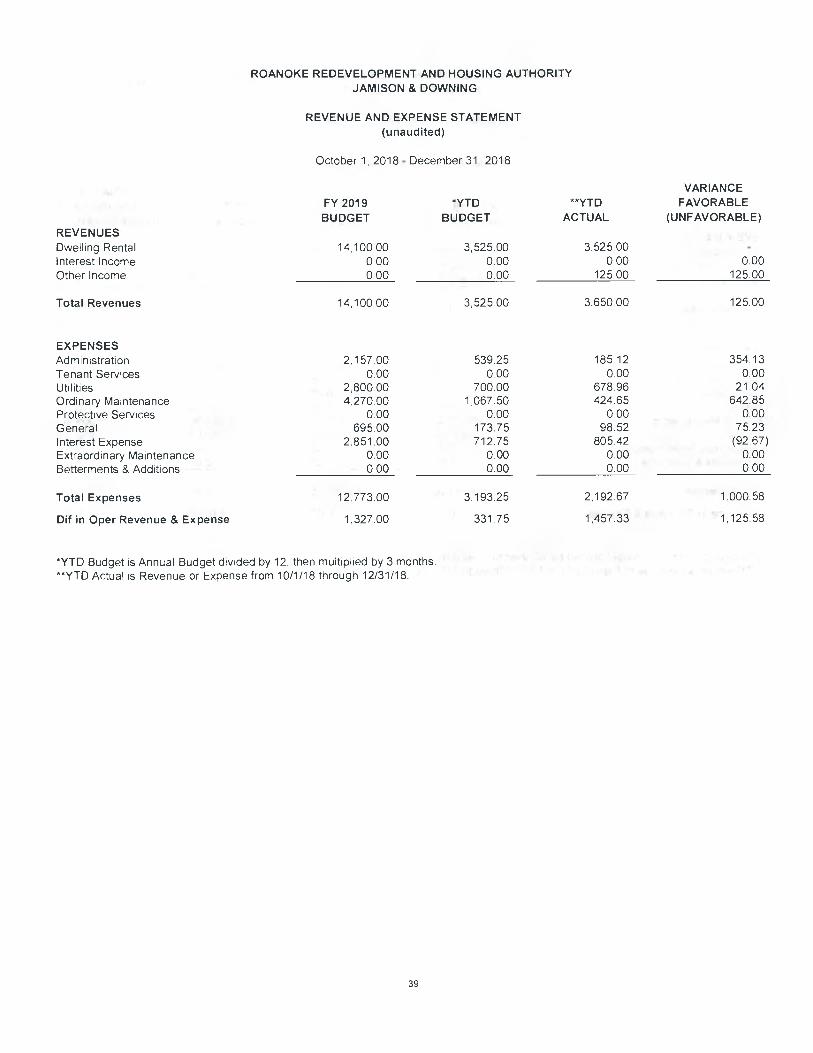
ROANOKE REDEVELOPMENT AND HOUSING AUTHORITY JAM ISON & DOWNING
REVENUE AND EXPENSE STATEMENT (unaudited)
REVENUES
October 1 2018 -
FY 2019 BUDGET
December 31, 2018
*YTD
BUDGET
**YTD
ACTUAL
VARIANCE FAVORABLE
(UNFAVORABLE)
Dwelling Rental 14,10000 3,52500 3,52500 Interest Income 000 0.00 0.00 0.00 Other Income 000 0.00 12500 125.00
Total Revenues 14,100.00 3,525.00 3,65000 125.00
EXPENSES Administration 2,1 57.00 539.25 185.12 354.13 Tenant Services 0.00 0.00 000 000 Utilities 2,800.00 700.00 678.96 21.04 Ordinary Maintenance 4,270.00 1,067.50 42465 642.85 Protective Services 0.00 0.00 0.00 0.00 General 695.00 173.75 98.52 7523 Interest Expense 2,851.00 712.75 80542 (92.67) Extraordinary Maintenance 0,00 0.00 0,00 0.00 Betterments & Additions 0.00 0.00 0.00 0.00
Total Expenses 12.773,00 3,193.25 2,19267 1,000.58
Dif in Oper Revenue & Expense 1,327.00 331.75 1,457.33 1,125.58
*YTD Budget is Annual Budget divided by 12, then multiplied by 3 months. **YTD Actual is Revenue or Expense from 10/1/18 through 12/31/18.
39

ROANOKE REDEVELOPMENT AND HOUSING AUTHORITY PRIVATE MANAGEMENT
REVENUE AND EXPENSE STATEMENT (unaudited)
October 1, 2018- December 31, 2018
REVENUES
FY 2019 BUDGET
*YTD
BUDGET
**YTD
ACTUAL
VARIANCE FAVORABLE
(UNFAVORABLE)
Interest Income 000 0.00 0.00 0.00 Management Fees 74,483.00 18,620.75 17,388.34 (1232.41) Other income 160,658.00 40,164.50 34,817.75 (5,346.75)
Total Revenues 235,141.00 58,785.25 52,206.09 (6,579.16)
EXPENSES Administration 90,518.00 22,629.50 21,930.29 699.21 Management Fees 74,483.00 18,620.75 17,388.34 1,232.41 Tenant Services 0.00 0.00 0.00 0.00 Utilities 15000 3750 31.33 6.17 Ordinary Maintenance 66,790.00 16,697.50 11,692.60 5,004.90 General 3,200.00 800.00 487.05 312.95 Extraordinary Maintenance 0.00 0.00 0.00 0.00 Betterments & Additions 0.00 0.00 0.00 0.00
Total Expenses 235,141.00 58,785.25 51,529.61 7,255.64
Difference in Revenue & Expense 0.00 0.00 676.48 676.48
*YTD Budget is Annual Budget divided by 12, then multiplied by 3 months. **YTD Actual is Revenue or Expense from 10/1/18 through 12/31/18.
40
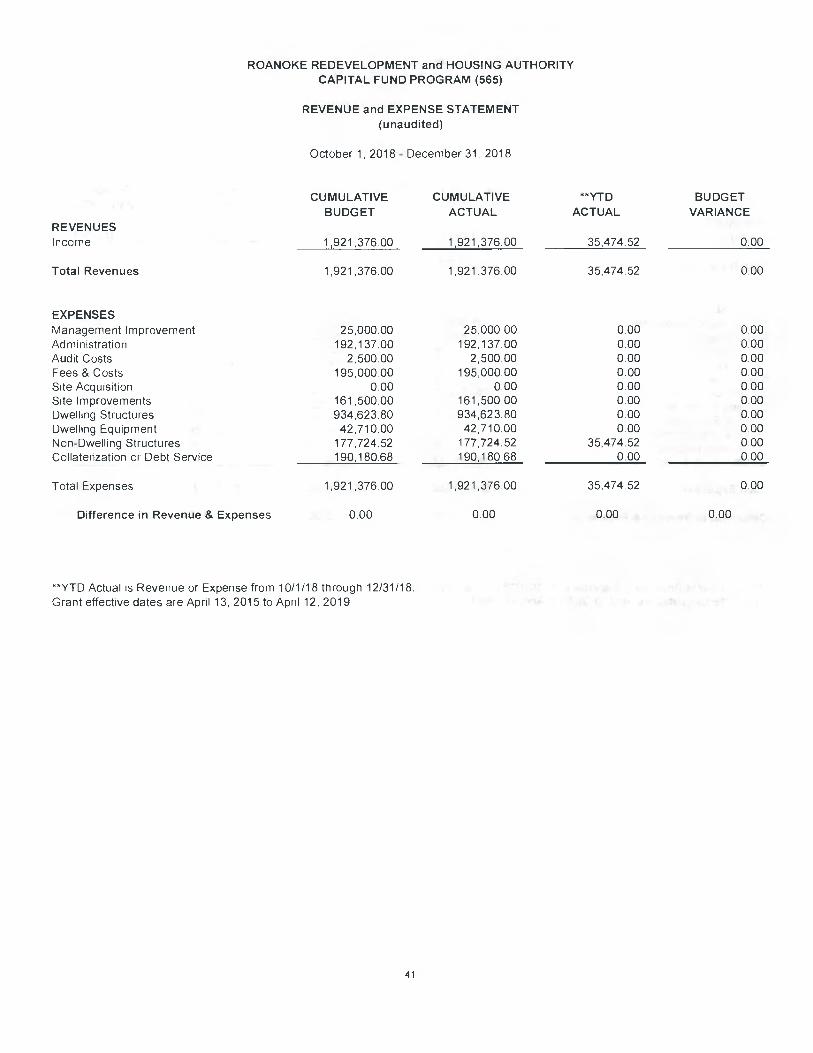
ROANOKE REDEVELOPMENT and HOUSING AUTHORITY CAPITAL FUND PROGRAM (565)
REVENUE and EXPENSE STATEMENT (unaudited)
REVENUES
October 1, 2018
CUMULATIVE BUDGET
- December 31, 2018
CUMULATIVE ACTUAL
**YTD
ACTUAL BUDGET
VARIANCE
Income 1,921,376.00 1,921,376.00 35,474.52 0.00
Total Revenues 1,921,376.00 1,921,376.00 35,474.52 0.00
EXPENSES Management Improvement 25,000.00 25,000.00 0.00 0.00 Administration 192,137.00 192,137.00 0.00 0.00 Audit Costs 2,500.00 2,500.00 0.00 0.00 Fees & Costs 195,000.00 195,000.00 0.00 0.00 Site Acquisition 0.00 0.00 0.00 0.00 Site Improvements 161,500.00 161,500.00 0.00 0.00 Dwelling Structures 934,623.80 934,623.80 0.00 0.00 Dwelling Equipment 42,710.00 42,710.00 0.00 0.00 Non-Dwelling Structures 177,724 52 177,724.52 35,474.52 000 Collatenzation or Debt Service 190,180.68 190,180.68 0.00 0.00
Total Expenses 1,921,376.00 1,921,376.00 35,474,52 0.00
Difference in Revenue & Expenses
0.00 0.00 0.00
0.00
**YTD Actual is Revenue or Expense from 10/1/18 through 12/31/18. Grant effective dates are April 13, 2015 to April 12, 2019
41

ROANOKE REDEVELOPMENT and HOUSING AUTHORITY CAPITAL FUND PROGRAM (566)
REVENUE and EXPENSE STATEMENT (unaudited)
October 1, 2018-December 31, 2018
REVENUES
CUMULATIVE BUDGET
CUMULATIVE ACTUAL
**YTD
ACTUAL BUDGET
VARIANCE
Income 1996,769.00 1,942,924.70 67,223.01 (53,844.30)
Total Revenues 1,996,769.00 1,942,924.70 67,223.01 (53,844.30)
EXPENSES Management Improvement 15,000 00 6,253.41 1,125.00 8,746.59 Administration 199,676.00 199676 00 0.00 0.00 Audit Costs 2,50000 2,500 00 0.00 0,00 Fees & Costs 225,000.00 190,166 93 18,869.20 34,833 07 Site Acquisition 000 0.00 0.00 0.00 Site Improvements 260,175.00 260,175.00 0.00 0.00 Dwelling Structures 967,412.32 967,412.32 2,161.76 0.00 Dwelling Equipment 11,825.00 11,825.00 0.00 0.00 Non-Dwelling Structures 125,000.00 114,735.36 45,067.05 10,264.64 Development Activity 0.00 0.00 0.00 0.00 Collaterization or Debt Service 190,180,68 190,180.68 0.00 0.00
Total Expenses 1,996,769.00 1,942,924.70 67,223.01 53,844.30
Difference in Revenue & Expenses 000 000 0.00 000
**YTD Actual is Revenue or Expense from 10/1/18 through 12/31/18. Grant effective dates are April 13, 2016 to April 12, 2020
42

ROANOKE REDEVELOPMENT and HOUSING AUTHORITY CAPITAL FUND PROGRAM (567)
REVENUE and EXPENSE STATEMENT (unaudited)
REVENUES
October 1, 2018
CUMULATIVE BUDGET
- December 31, 2018
CUMULATIVE ACTUAL
**YTD
ACTUAL BUDGET
VARIANCE
Income 2,066,639.00 1279,1 75.46 410,113.53 (787,463.54)
Total Revenues 2,066,639.00 1,279,175.46 410,113.53 (787,463.54)
EXPENSES Management Improvement 20,000.00 0.00 0.00 20,000.00 Administration 206,663.00 206,663.00 0.00 0.00 Audit Costs 2,500.00 0.00 0.00 2,500.00 Fees & Costs 262,000.00 62,383.62 61,943.62 199,616.38 Site Acquisition 75,000.00 0.00 0.00 75,000.00 Site Improvements 257,000 00 154,689 06 36,496.50 102,310.94 Dwelling Structures 707,895.32 508,424.10 263,49324 199,471.22 Dwelling Equipment 145,315.00 145,315.00 635.00 0.00 Non-Dwelling Structures 200,085.00 11,520.00 0.00 188,565.00 Development Activities 0.00 0.00 0.00 0.00 Collaterization or Debt Service 190,180.68 190,180.68 47,545.17 0.00
Total Expenses 2,066,639.00 1,279,175.46 410,113.53 787,463.54
Difference in Revenue & Expenses 0.00 0.00 0.00 0.00
**YTD Actual is Revenue or Expense from 10/1/18 through 12/31/18. Grant effective dates are August 16, 2017 to August 15, 2021
43
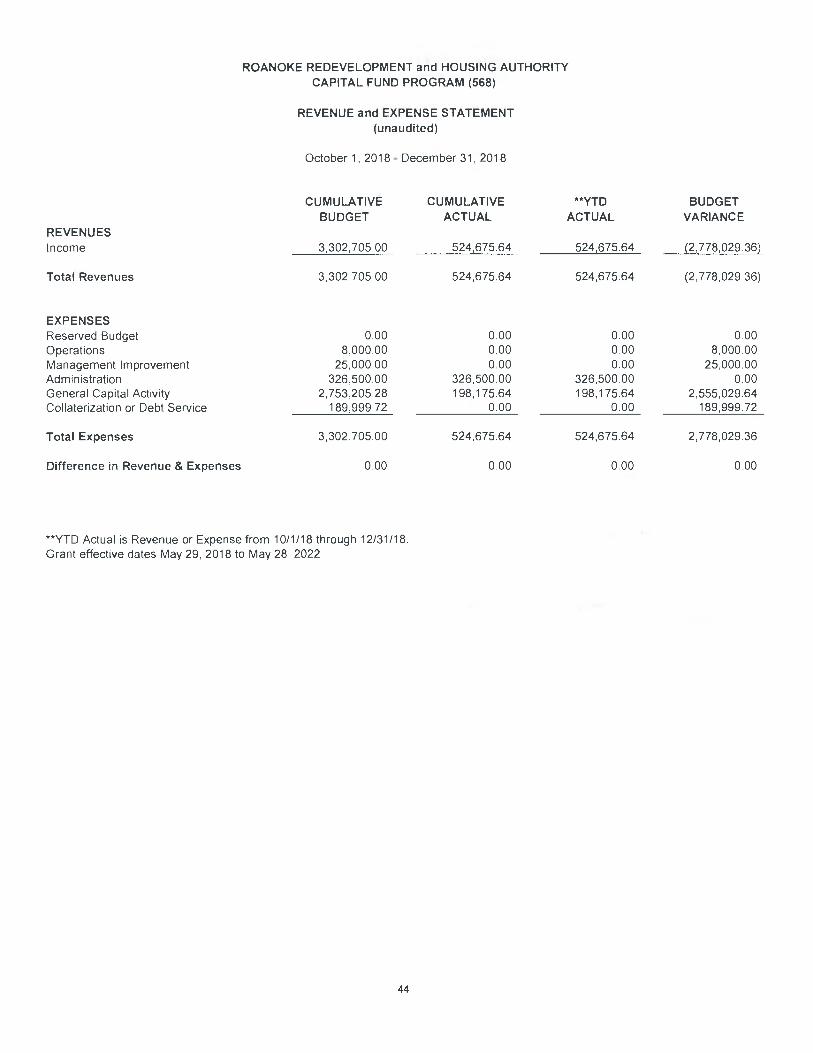
ROANOKE REDEVELOPMENT and HOUSING AUTHORITY CAPITAL FUND PROGRAM (568)
REVENUE and EXPENSE STATEMENT (unaudited)
REVENUES
October 1, 2018
CUMULATIVE BUDGET
- December 31 2018
CUMULATIVE ACTUAL
**YTD
ACTUAL BUDGET
VARIANCE
Income 3302705.00 524,675.64 524,675.64 (2,778,029.36)
Total Revenues 3,302,705.00 524,675.64 524,675.64 (2,778,029 36)
EXPENSES Reserved Budget 0.00 0.00 0.00 0.00 Operations 8,000.00 0.00 0.00 8,000.00 Management Improvement 25,000.00 0.00 0.00 25,000.00 Administration 326,500.00 326,500.00 326,500.00 0.00 General Capital Activity 2,753,205.28 198175.64 198,175.64 2,555,029.64 Collaterization or Debt Service 189,999.72 0.00 0.00 189,999.72
Total Expenses 3,302,705.00 524,675.64 524,675.64 2,778,029 36
Difference in Revenue & Expenses 0.00 0.00 0.00 0.00
**YTD Actual is Revenue or Expense from 10/1/18 through 12/31/18. Grant effective dates May 29, 2018 to May 28, 2022
44
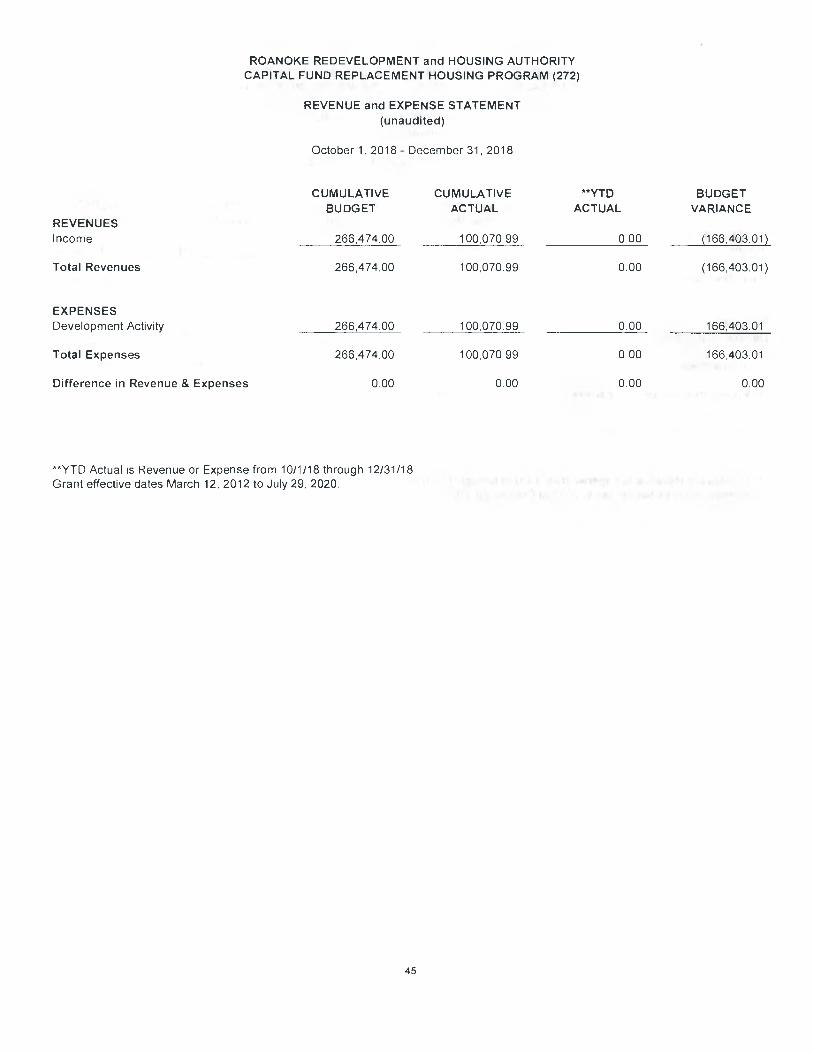
ROANOKE REDEVELOPMENT and HOUSING AUTHORITY CAPITAL FUND REPLACEMENT HOUSING PROGRAM (272)
REVENUE and EXPENSE STATEMENT (unaudited)
REVENUES
October 1, 2018
CUMULATIVE BUDGET
- December 31, 2018
CUMULATIVE ACTUAL
**YTD
ACTUAL BUDGET
VARIANCE
Income 266,474.00 100,070.99 0.00 (166,403.01)
Total Revenues 266,474.00 100,070.99 0.00 (166,403.01)
EXPENSES Development Activity 266,474.00 100,070.99 0.00 166,403.01
Total Expenses 266,474.00 100,070.99 0.00 166,403.01
Difference in Revenue & Expenses 0.00 0.00 0.00 0.00
**YTD Actual is Revenue or Expense from 10/1/18 through 12/31/18. Grant effective dates March 12, 2012 to July 29, 2020,
45
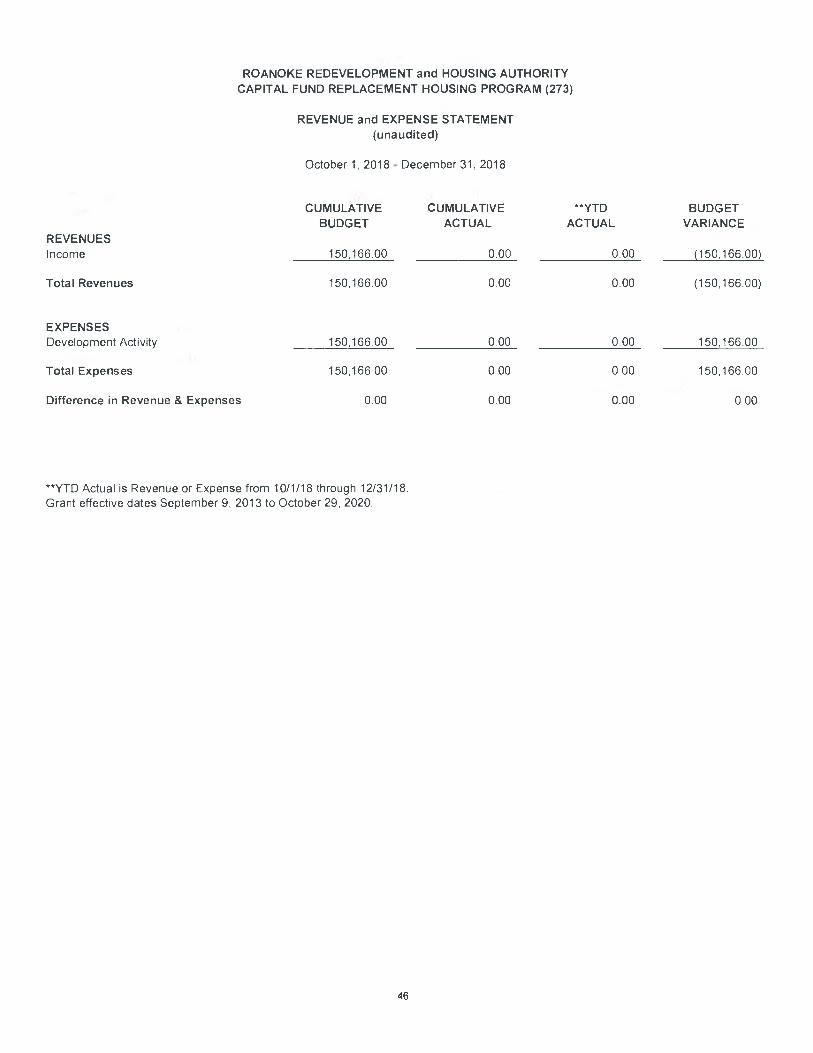
ROANOKE REDEVELOPMENT and HOUSING AUTHORITY CAPITAL FUND REPLACEMENT HOUSING PROGRAM (273)
REVENUE and EXPENSE STATEMENT (unaudited)
REVENUES
October 1, 2018
CUMULATIVE BUDGET
- December 31, 2018
CUMULATIVE ACTUAL
**YTD
ACTUAL BUDGET
VARIANCE
Income 150,166 00 0.00 0.00 (150,166.00)
Total Revenues 150,166 00 000 0.00 (150,166.00)
EXPENSES Development Activity 150,166.00 0.00 0.00 150,166.00
Total Expenses 150,166.00 000 0.00 150,166.00
Difference in Revenue & Expenses 0.00 0.00 0.00 000
**YTD Actual is Revenue or Expense from 10/1/18 through 12/31/18. Grant effective dates September 9, 2013 to October 29, 2020.
46
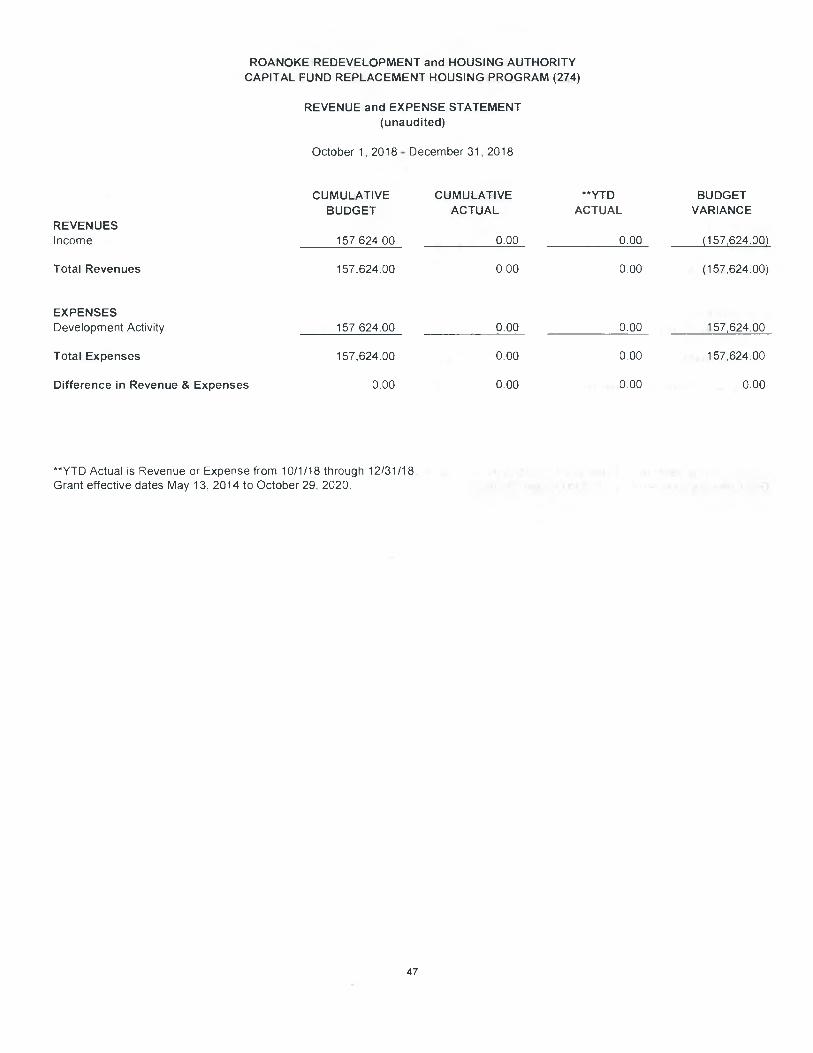
ROANOKE REDEVELOPMENT and HOUSING AUTHORITY CAPITAL FUND REPLACEMENT HOUSING PROGRAM (274)
REVENUE and EXPENSE STATEMENT (unaudited)
REVENUES
October 1, 2018 -
CUMULATIVE BUDGET
December 31, 2018
CUMULATIVE ACTUAL
**YTD
ACTUAL BUDGET
VARIANCE
Income 157,624.00 0.00 0.00 (157,624.00)
Total Revenues 157,624.00 0.00 0.00 (157,624.00)
EXPENSES Development Activity 157,624.00 0.00 0.00 157,624.00
Total Expenses 157,624.00 0.00 0.00 157,624.00
Difference in Revenue & Expenses 0.00 0.00 0,00 0.00
**YTD Actual is Revenue or Expense from 10/1/18 through 12/31/18. Grant effective dates May 13, 2014 to October 29, 2020.
47
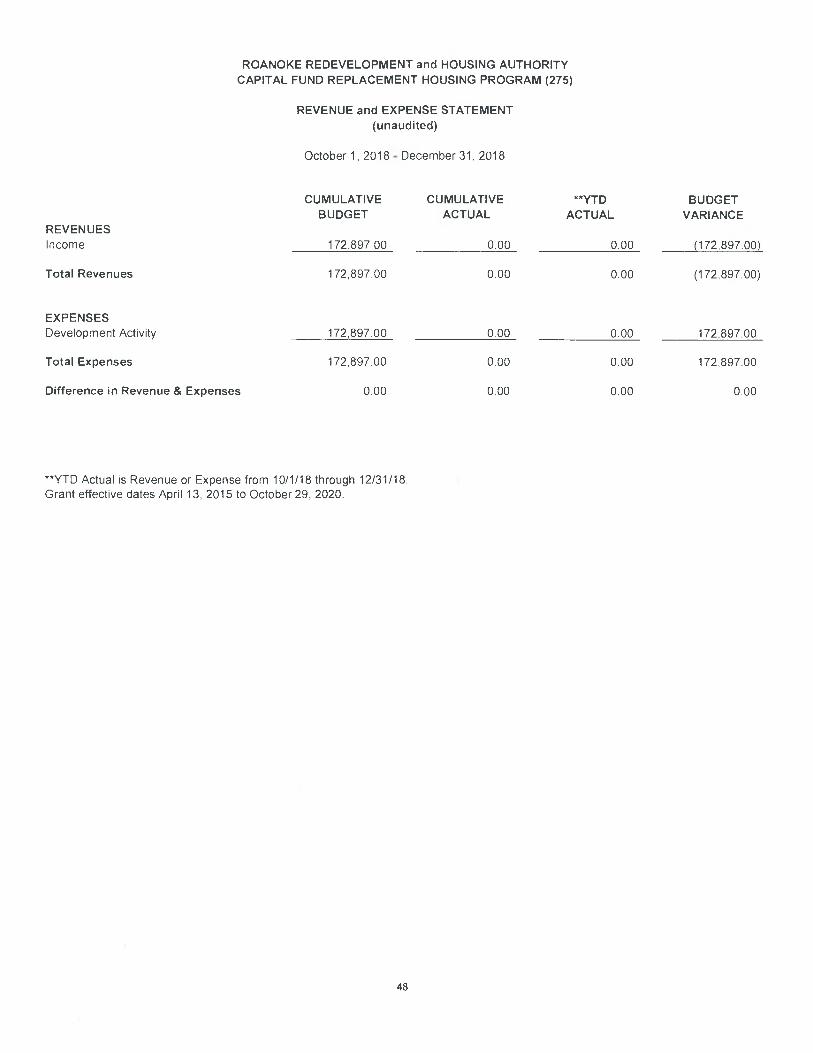
ROANOKE REDEVELOPMENT and HOUSING AUTHORITY CAPITAL FUND REPLACEMENT HOUSING PROGRAM (275)
REVENUE and EXPENSE STATEMENT (unaudited)
October 1,2018-December 31, 2018
REVENUES
CUMULATIVE BUDGET
CUMULATIVE ACTUAL
**YTD
ACTUAL BUDGET
VARIANCE
Income 172,897.00 0.00 0.00 (172,897.00)
Total Revenues 172,897.00 0.00 0.00 (172,897.00)
EXPENSES Development Activity 172,897.00 0.00 0.00 172,897.00
Total Expenses 172,897.00 0.00 0.00 172,897.00
Difference in Revenue & Expenses 000 0.00 0.00 0.00
**YTD Actual is Revenue or Expense from 10/1/18 through 12/31/18. Grant effective dates April 13, 2015 to October 29, 2020.
48
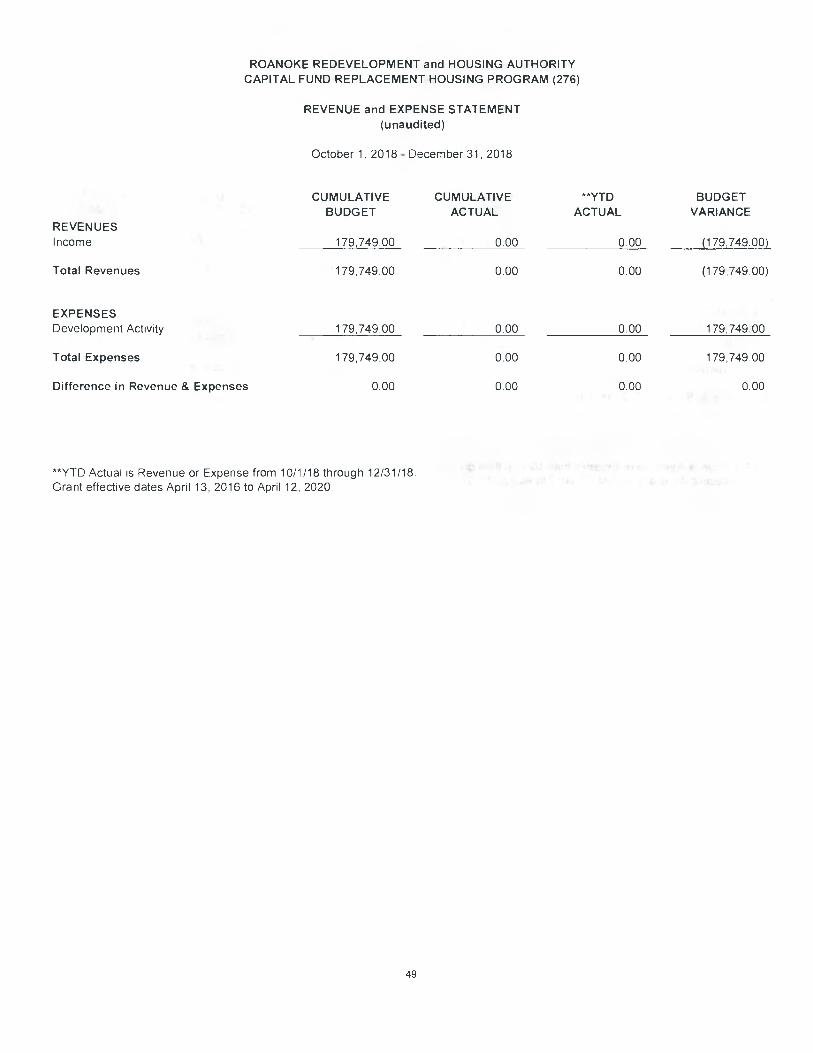
ROANOKE REDEVELOPMENT and HOUSING AUTHORITY CAPITAL FUND REPLACEMENT HOUSING PROGRAM (276)
REVENUE and EXPENSE STATEMENT (unaudited)
REVENUES
October 1, 2018
CUMULATIVE BUDGET
- December 31, 2018
CUMULATIVE ACTUAL
**YTD
ACTUAL BUDGET
VARIANCE
Income 179,749.00 0.00 0.00 (179,749.00)
Total Revenues 179,749.00 0.00 0.00 (179,749.00)
EXPENSES Development Activity 179,749.00 0.00 0.00 179,749.00
Total Expenses 179,749.00 0.00 0.00 179,749 00
Difference in Revenue & Expenses 0.00 0.00 0.00 0.00
**YTD Actual is Revenue or Expense from 10/1/18 through 12/31/18. Grant effective dates April 13, 2016 to April 12, 2020.
49
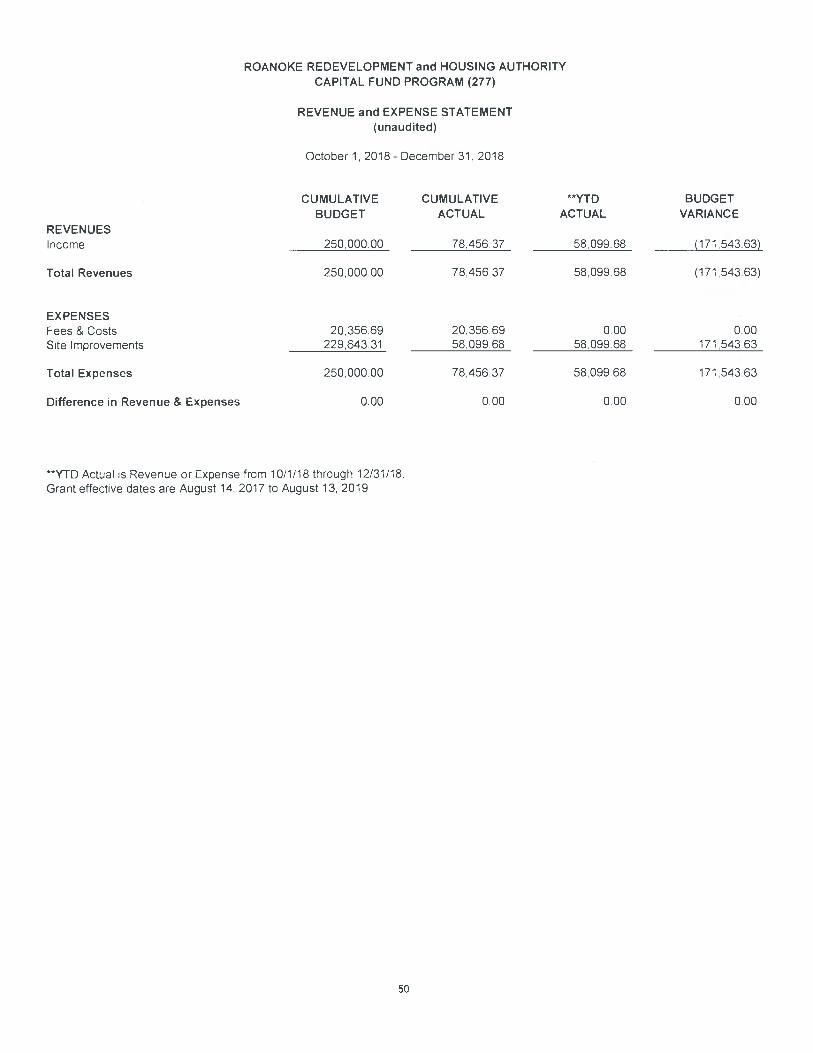
ROANOKE REDEVELOPMENT and HOUSING AUTHORITY CAPITAL FUND PROGRAM (277)
REVENUE and EXPENSE STATEMENT (unaudited)
October 1, 2018- December 31, 2018
REVENUES
CUMULATIVE BUDGET
CUMULATIVE ACTUAL
**flD
ACTUAL BUDGET
VARIANCE
Income 250,000.00 78,456.37 58,099.68 (171,543.63)
Total Revenues 250,000.00 78,456.37 58,099.68 (171,543.63)
EXPENSES Fees & Costs 20,356.69 20,356 69 000 0.00 Site Improvements 229,643,31 58,099 68 58,099.68 171,543.63
Total Expenses 250,000 00 78,456.37 58,099.68 171,543.63
Difference in Revenue & Expenses 000 000 000 000
**YTD Actual is Revenue or Expense from 10/1/18 through 12/31/18. Grant effective dates are August 14, 2017 to August 13, 2019
50

ROANOKE REDEVELOPMENT and HOUSING AUTHORITY JOBS PLUS GRANT
REVENUE and EXPENSE STATEMENT (unaudited)
October 1, 2018- December 31, 2018
REVENUES
CUMULATIVE BUDGET
CUMULATIVE ACTUAL
**YTD
ACTUAL BUDGET
VARIANCE
Income 3,000,000.00 1950,160.55 87,21 9.20 (1049,839.45)
Total Revenues 3,000,000.00 1950,160.55 87,219.20 (1049,839.45)
EXPENSES Salaries 963,000.00 719,976.83 55,001.91 243,023.17 Supportive Services 50,000.00 6,184.58 150.50 43,815.42 Case Management 698,100.00 419,907.05 20,612.93 278,192.95 Training Costs 20,725 00 13,814.25 4,891 54 6,91075 Travel Costs 13,675.00 9,660.20 0.00 4,014.80 Computers/Related Equip 64,500.00 58,309.04 0.00 6,190 96 Technical Assistance 0.00 0.00 0.00 0.00 Administrative/Other Costs 240,000.00 172,843.60 6,562.32 67,15640 Rent Incentives 950,000.00 549,465.00 0.00 400,535.00
Total Expenses 3,000,000.00 1,950,160.55 87,219.20 1,049,839.45
Difference in Revenue & Expenses 0.00 0.00 0.00 0.00
**YTD Actual is Revenue or Expense from 10/1/18 through 12/31/18. Grant effective dates are May 14, 2015 to September 30, 2021.
51
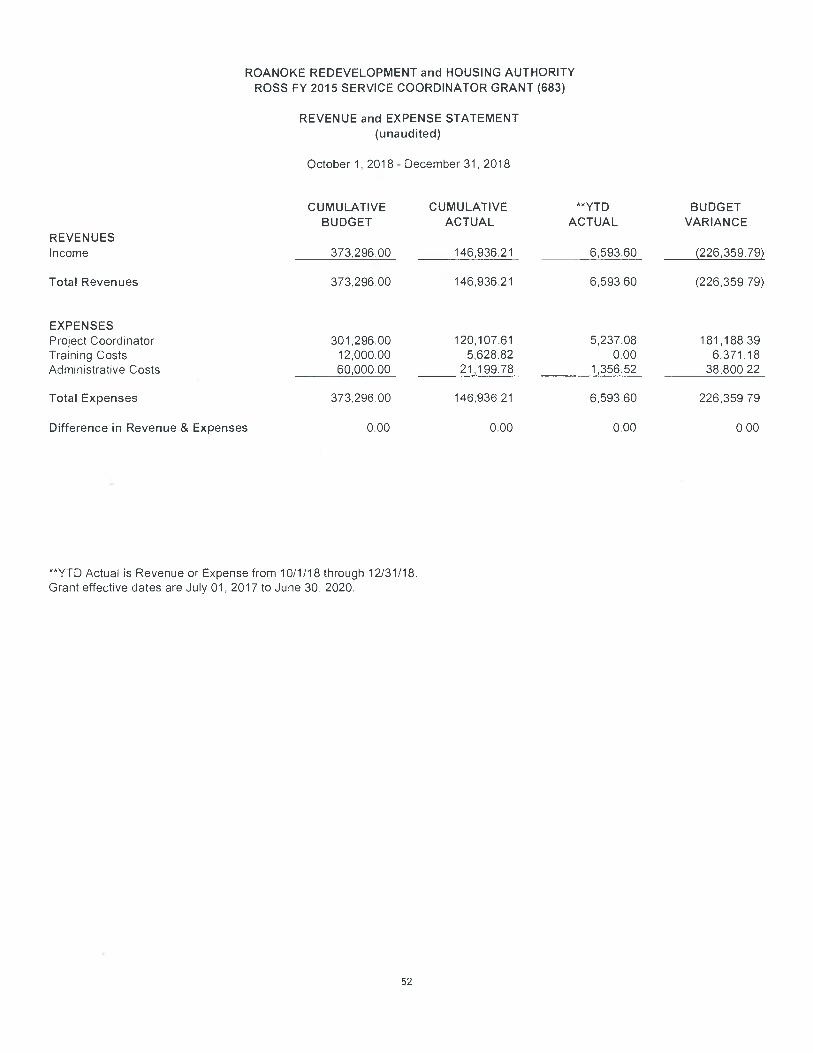
ROANOKE REDEVELOPMENT and HOUSING AUTHORITY ROSS FY 2015 SERVICE COORDINATOR GRANT (683)
REVENUE and EXPENSE STATEMENT (unaudited)
October 1,2018-December 31, 2018
REVENUES
CUMULATIVE BUDGET
CUMULATIVE ACTUAL
**YTD
ACTUAL BUDGET
VARIANCE
Income 373,296.00 146,936.21 6,593.60 (226,359.79)
Total Revenues 373,296.00 146,936.21 6,593.60 (226,359 79)
EXPENSES Project Coordinator 301,296.00 120,107.61 5,237.08 181,188.39 Training Costs 12,000.00 5,628.82 0.00 6,371.18 Administrative Costs 60,000.00 21,199.78 1,356.52 38,800.22
Total Expenses 373,296.00 146936.21 6,593.60 226,359.79
Difference in Revenue & Expenses 0.00 0.00 0.00 0.00
**YTD Actual is Revenue or Expense from 10/1/18 through 12/31/18. Grant effective dates are July 01, 2017 to June 30, 2020.
52
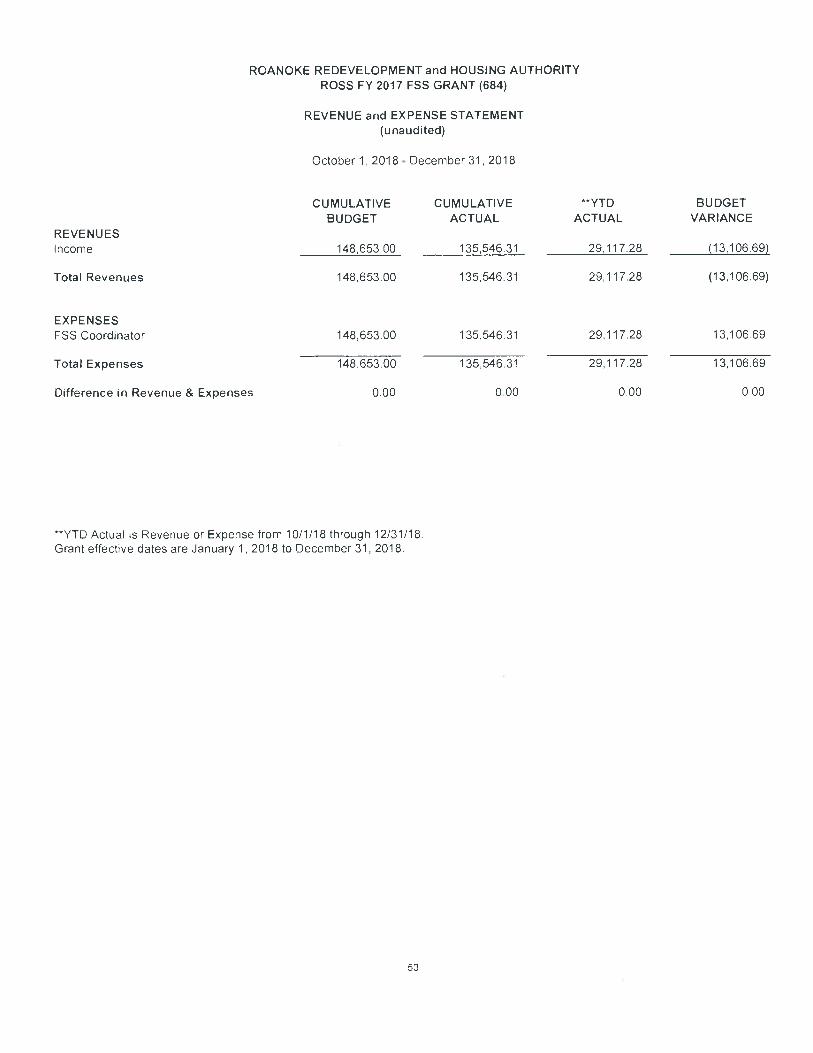
ROANOKE REDEVELOPMENT and HOUSING AUTHORITY
ROSS FY 2017 FSS GRANT (684)
REVENUE and EXPENSE STATEMENT (unaudited)
REVENUES
October 1 2018 -
CUMULATIVE
BUDGET
December 31, 2018
CUMULATIVE
ACTUAL
**YTD
ACTUAL
BUDGET
VARIANCE
Income 148,653.00 135,546.31 29,117.28 (13,106.69)
Total Revenues 148,653.00 135,546.31 29,117.28 (13,106.69)
EXPENSES
FSS Coordinator 148,653.00 135,546.31 29,117.28 13,10669
Total Expenses 148,653.00 135,546.31 29,117.28 13,106.69
Difference in Revenue & Expenses 0.00 000 0.00 0.00
**YTD Actual is Revenue or Expense from 10/1/18 through 12/31/18. Grant effective dates are January 1, 2018 to December 31, 2018.
53

OPERATIONS DIVISION
PROCUREMENT
MONTHLY REPORT
DECEMBER 2018
1
PROCUREMENT DECEMBER MONTHLY ACTIVITY REPORT
I. Capital Fund
A. Contracts Awarded None
B. Solicitations Pending RED-18-11-26 Request for Qualifications for
Architectural/Engineering Services for City of Roanoke Redevelopment and Housing Authority was issued December 2, 2018. Comments were received by December 18, 2018. Statement of Qualifications are due January 4, 2019. The Executive Director appointed an Evaluation Panel of five (5) staff members.
II. Operating Budget
A. Contracts Awarded None
B. Solicitations Pending
None
III. Other Grants and Projects
A. Contracts Awarded None
B. Solicitations Pending RED-18-05-25 Invitation for Bid for New Construction of
Four Public Housing Duplexes, was issued July 8, 2018. A pre-bid meeting was held July 17, 2018. Comments were received by July 24, 2018. Two (2) responsive bids were received by July 31, 2018 and opened on August 1, 2018. G & H Contracting, Inc. submitted the low bid.
2
Commissioners approved Resolution No. 3979 on September 24, 2018 accepting the bid submitted by G & H Contracting, Inc., for the award of a contract with a fixed amount of $1,667,000, contingent upon HUD approval of RRHA Development Plan for RHF 2nd Increment and HUD approval of RRHA Operating Fund Financing Program Plan related to the project. RRHA received approval from HUD for the Development Plan on October 29, 2018. At the request of HUD, RRHA submitted a Request for Extension for obligation of RHF 2nd Increment funds on October 29, 2018, due to delay in receiving approval of Operating Fund Financing Program Plan.
IV. Protests
None

REDEVELOPMENT AND REVITALIZATION
MONTHLY ACTIVITY REPORT
DECEMBER 2018
3
Redevelopment and Revitalization Department
December 2018 MONTHLY ACTIVITY REPORT
Choice Neighborhoods RRHA received confirmation from HUD of submission of its application for the Rental Assistance Demonstration Program (RAD) to convert the 300 units at Lansdowne Park from public housing to Section 8 project based vouchers as part of implementing the Choice Neighborhoods plan. In accordance with RAD regulations, RRHA submitted a multiphase application for six (6) phases. The first phase is 40 units and identifies the 2600 – 2900 blocks of Salem Turnpike as the units to be replaced. The application is the first step towards entering into a RAD conversion. HUD will review the application for eligibility and then determine if a Commitment to Housing Assistance Payments (CHAP) will be issued. Once the CHAP is issued RRHA will either have to submit a financing plan within 180 days or apply for Low-Income Housing Tax Credits. HUD advised it would take 60 days to review the application for eligibility for a CHAP, which would have resulted in notification in early November; however, RRHA has not received any notification to date. The federal government shutdown that began in December will likely further delay a decision from HUD regarding the CHAP. If HUD awards a CHAP, RRHA will work with a designated Transaction Manager from HUD who will advise of milestones, obligations and deadlines to help make the conversion successful. RRHA intends to discuss all of its options with the transaction manager before moving forward with the process. It is still possible for RRHA to opt out of the program, or potentially to slow down the process. The City of Roanoke is moving forward with plans to build out space within Goodwill’s building for the new Melrose library. G&H Contracting was chosen for the project and is on schedule to have the library open in Spring 2019. This project impacts the design of the extension of Forest Park Boulevard and the land in Horton Park that RRHA intends to develop. RRHA has expressed interest in the current library building if it becomes available. The City plans to post a Request for Proposal (RFP) for the disposition of the current library building in January or February. RRHA intends to submit a proposal with potential uses being the development of a EnVision Center if HUD awards that grant and/or new management offices for Lansdowne in alignment with the Choice Neighborhoods Plan and RAD project. The Kiwanis Club of Roanoke has been meeting at RRHA recently with City and RRHA staff to discuss possibilities for a playground in the Lansdowne area. Kiwanis would like to create this playground as a community build project by 2020 and dedicate the playground to the City as a public park. Club members and RRHA staff met with the City Manager, and Kiwanis has selected a company to hire for the equipment. The club held a “meet and greet” community meeting on September 27, 2018 at the Melrose Library and provided dinner for 52 adults and numerous children. After surveying the community, the club decided on a site near Forest
4
Park Academy, close to the new library location at Goodwill. Kiwanis presented this project to City Council in a briefing on October 15, and RRHA staff attended in support. RRHA will continue to work with the group as the scope of the playground and plans for new housing development are furthered. RRHA applied to HUD to use a portion of its operating reserves through the Operating Fund Finance Program (OFFP). Per HUD central office direction, the application was split into two phases; 1) Section 504 modifications to existing public housing units, and 2) development of new public housing units. RRHA has an agreement with Virginia Community Capital (VCC) to finance loans at a rate of 2.00% for up to five (5) years. This agreement was amended in December 2016 with the rate being increased by .25% due to HUD requirements to which VCC had to adjust. The first phase has been submitted to HUD for review and is currently being reviewed by HUD legal staff. HUD Central Office staff advised that both OFFP applications would be approved. For the second phase, RRHA reduced the scope of the project to eight (8) units, to be constructed on lots in the Hurt Park Townhomes subdivision. The second phase of the OFFP will serve as required leverage for the second increment of RHF Funds received from the demolition of Hurt Park, which will also be used to finance the development of the eight (8) units. The development proposal for the eight (8) units has been approved by the Richmond Field Office. HUD directed RRHA to request an extension for the OFFP approval as it pertains to the RHF obligation deadline. RRHA submitted the request and HUD has advised that it will proceed with approval of the OFFP application. RRHA has a construction contract ready to execute for the project, pending OFFP approval. RRHA received notice from the HUD field office that the development plan for the two (2) units planned for construction on RRHA properties adjacent to Villages at Lincoln, was not approved due to not passing the site and neighborhood standards review by the Fair Housing division. RRHA will determine what to do with the two (2) properties in question at 1702 and 1706 Downing Street, NW, and may use homeownership funds to develop new units. The existing house at 1706 Downing Street was significantly damaged by fire in October 2018. The development of the ten (10) new public housing units was intended to further the Choice Neighborhoods plan to replace units at Lansdowne Park. However, if RRHA continues with its RAD application, the units will not be able to replace Lansdowne units. RRHA submitted a site acquisition proposal to the HUD field office for a parcel adjoined by the Bluestone development. If approved, the site will be used for the future development of either a single-family or duplex building for public housing. In December RRHA received a notice from the Fair Housing and Equal Opportunity department of the HUD field office advising that the site is eligible for new development. RRHA was advised by the field office that a significant plan amendment will need to be done for the proposal to be approved. Derelict Structures Program RRHA continues to work with the Gainsboro Southwest Neighborhood organization (GSNA) on the potential transfer of 427 Gilmer Avenue, which was purchased with City CDBG funds. GSNA recently partnered with REACH, a non-profit organization that has
5
some experience in renovating older houses with volunteer labor, usually groups of students or other young people. GSNA’s intent is to have REACH acquire the property to rehabilitate it with help from Gainsboro residents, and then both organizations will work to find a qualified buyer. The City has advised that a 10-year affordability period would need to be maintained. A memorandum of understanding (MOU) has been executed that allows REACH to access the property to do further evaluation of the house. REACH coordinated with Greene Memorial Methodist Church to clean up the property in early July with the help of laborers in the church’s youth summer camp. RRHA has advised GSNA that it will need to pursue grant funding by January, or new proposals will be considered. A deadline of January 4, 2019 was given to GSNA to submit an updated pro forma that shows the sources and demonstrates the ability of the organization to successfully complete the project. Loan Consolidation Program & Surplus Real Estate RRHA continues to work with the City on the loan consolidation program and the disposition of surplus real estate RRHA is holding for the City. RRHA currently owns 84 vacant parcels in the City. Of these, 77 are part of the Cherry Hill property between Gainsboro Road, 5th Street, and Orange and Cherry Avenues, NW. Three (3) are lots adjacent to the Park Street Square development on 5th Street, NW, and are used for utility connections. These three (3) lots are essentially undevelopable. There is one (1) lot in the Hackley development, two (2) on the 2500 block of Shenandoah Avenue and one (1) at 1805 Rorer Ave, SW. RRHA is working on a contract to purchase five (5) lots on the 2700 block of Centre Ave, NW, but the seller has been non-responsive for months.
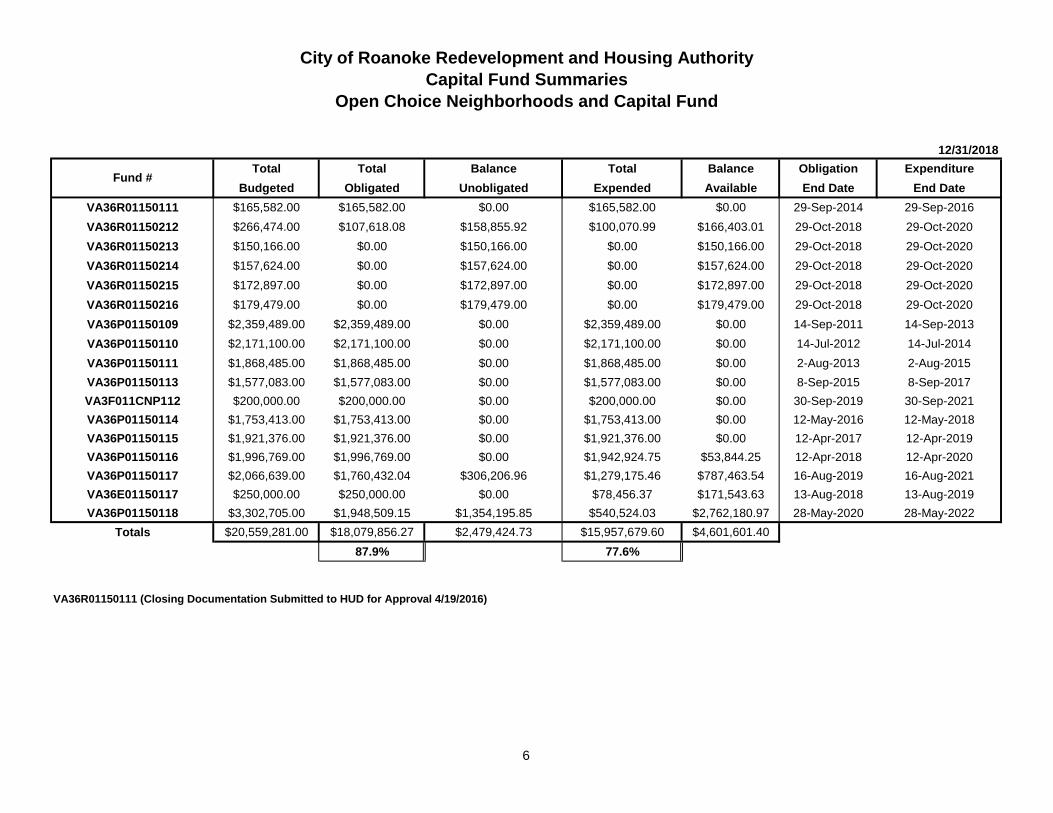
City of Roanoke Redevelopment and Housing Authority
Capital Fund Summaries
Open Choice Neighborhoods and Capital Fund
12/31/2018
Total Total Balance Total Balance Obligation Expenditure
Budgeted Obligated Unobligated Expended Available End Date End Date
VA36R01150111 $165,582.00 $165,582.00 $0.00 $165,582.00 $0.00 29-Sep-2014 29-Sep-2016
VA36R01150212 $266,474.00 $107,618.08 $158,855.92 $100,070.99 $166,403.01 29-Oct-2018 29-Oct-2020
VA36R01150213 $150,166.00 $0.00 $150,166.00 $0.00 $150,166.00 29-Oct-2018 29-Oct-2020
VA36R01150214 $157,624.00 $0.00 $157,624.00 $0.00 $157,624.00 29-Oct-2018 29-Oct-2020
VA36R01150215 $172,897.00 $0.00 $172,897.00 $0.00 $172,897.00 29-Oct-2018 29-Oct-2020
VA36R01150216 $179,479.00 $0.00 $179,479.00 $0.00 $179,479.00 29-Oct-2018 29-Oct-2020
VA36P01150109 $2,359,489.00 $2,359,489.00 $0.00 $2,359,489.00 $0.00 14-Sep-2011 14-Sep-2013
VA36P01150110 $2,171,100.00 $2,171,100.00 $0.00 $2,171,100.00 $0.00 14-Jul-2012 14-Jul-2014
VA36P01150111 $1,868,485.00 $1,868,485.00 $0.00 $1,868,485.00 $0.00 2-Aug-2013 2-Aug-2015
VA36P01150113 $1,577,083.00 $1,577,083.00 $0.00 $1,577,083.00 $0.00 8-Sep-2015 8-Sep-2017
VA3F011CNP112 $200,000.00 $200,000.00 $0.00 $200,000.00 $0.00 30-Sep-2019 30-Sep-2021
VA36P01150114 $1,753,413.00 $1,753,413.00 $0.00 $1,753,413.00 $0.00 12-May-2016 12-May-2018
VA36P01150115 $1,921,376.00 $1,921,376.00 $0.00 $1,921,376.00 $0.00 12-Apr-2017 12-Apr-2019
VA36P01150116 $1,996,769.00 $1,996,769.00 $0.00 $1,942,924.75 $53,844.25 12-Apr-2018 12-Apr-2020
VA36P01150117 $2,066,639.00 $1,760,432.04 $306,206.96 $1,279,175.46 $787,463.54 16-Aug-2019 16-Aug-2021
VA36E01150117 $250,000.00 $250,000.00 $0.00 $78,456.37 $171,543.63 13-Aug-2018 13-Aug-2019
VA36P01150118 $3,302,705.00 $1,948,509.15 $1,354,195.85 $540,524.03 $2,762,180.97 28-May-2020 28-May-2022
Totals $20,559,281.00 $18,079,856.27 $2,479,424.73 $15,957,679.60 $4,601,601.40
87.9% 77.6%
VA36R01150111 (Closing Documentation Submitted to HUD for Approval 4/19/2016)
Fund #
6
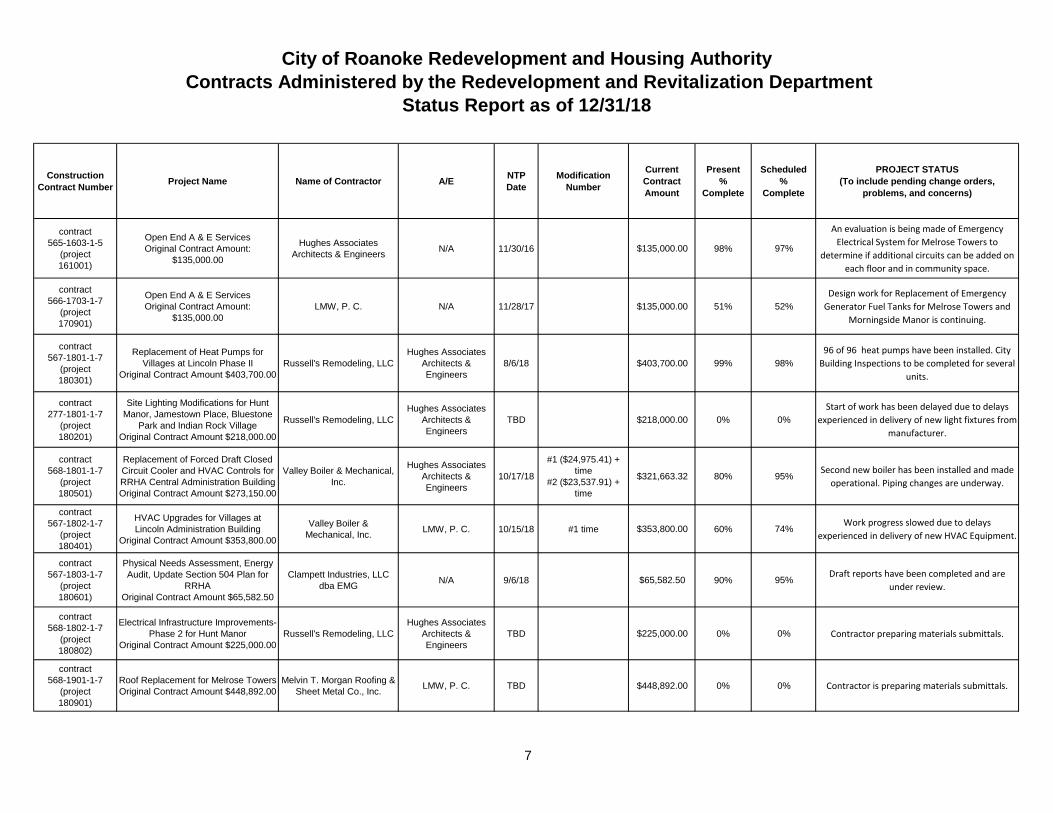
City of Roanoke Redevelopment and Housing Authority
Contracts Administered by the Redevelopment and Revitalization Department
Status Report as of 12/31/18
Construction
Contract NumberProject Name Name of Contractor A/E
NTP
Date
Modification
Number
Current
Contract
Amount
Present
%
Complete
Scheduled
%
Complete
PROJECT STATUS
(To include pending change orders,
problems, and concerns)
contract
565-1603-1-5
(project
161001)
Open End A & E Services
Original Contract Amount:
$135,000.00
Hughes Associates
Architects & EngineersN/A 11/30/16 $135,000.00 98% 97%
An evaluation is being made of Emergency
Electrical System for Melrose Towers to
determine if additional circuits can be added on
each floor and in community space.
contract
566-1703-1-7
(project
170901)
Open End A & E Services
Original Contract Amount:
$135,000.00
LMW, P. C. N/A 11/28/17 $135,000.00 51% 52%
Design work for Replacement of Emergency
Generator Fuel Tanks for Melrose Towers and
Morningside Manor is continuing.
contract
567-1801-1-7
(project
180301)
Replacement of Heat Pumps for
Villages at Lincoln Phase II
Original Contract Amount $403,700.00
Russell's Remodeling, LLC
Hughes Associates
Architects &
Engineers
8/6/18 $403,700.00 99% 98%
96 of 96 heat pumps have been installed. City
Building Inspections to be completed for several
units.
contract
277-1801-1-7
(project
180201)
Site Lighting Modifications for Hunt
Manor, Jamestown Place, Bluestone
Park and Indian Rock Village
Original Contract Amount $218,000.00
Russell's Remodeling, LLC
Hughes Associates
Architects &
Engineers
TBD $218,000.00 0% 0%
Start of work has been delayed due to delays
experienced in delivery of new light fixtures from
manufacturer.
contract
568-1801-1-7
(project
180501)
Replacement of Forced Draft Closed
Circuit Cooler and HVAC Controls for
RRHA Central Administration Building
Original Contract Amount $273,150.00
Valley Boiler & Mechanical,
Inc.
Hughes Associates
Architects &
Engineers
10/17/18
#1 ($24,975.41) +
time
#2 ($23,537.91) +
time
$321,663.32 80% 95%Second new boiler has been installed and made
operational. Piping changes are underway.
contract
567-1802-1-7
(project
180401)
HVAC Upgrades for Villages at
Lincoln Administration Building
Original Contract Amount $353,800.00
Valley Boiler &
Mechanical, Inc.LMW, P. C. 10/15/18 #1 time $353,800.00 60% 74%
Work progress slowed due to delays
experienced in delivery of new HVAC Equipment.
contract
567-1803-1-7
(project
180601)
Physical Needs Assessment, Energy
Audit, Update Section 504 Plan for
RRHA
Original Contract Amount $65,582.50
Clampett Industries, LLC
dba EMGN/A 9/6/18 $65,582.50 90% 95%
Draft reports have been completed and are
under review.
contract
568-1802-1-7
(project
180802)
Electrical Infrastructure Improvements-
Phase 2 for Hunt Manor
Original Contract Amount $225,000.00
Russell's Remodeling, LLC
Hughes Associates
Architects &
Engineers
TBD $225,000.00 0% 0% Contractor preparing materials submittals.
contract
568-1901-1-7
(project
180901)
Roof Replacement for Melrose Towers
Original Contract Amount $448,892.00
Melvin T. Morgan Roofing &
Sheet Metal Co., Inc.LMW, P. C. TBD $448,892.00 0% 0% Contractor is preparing materials submittals.
7
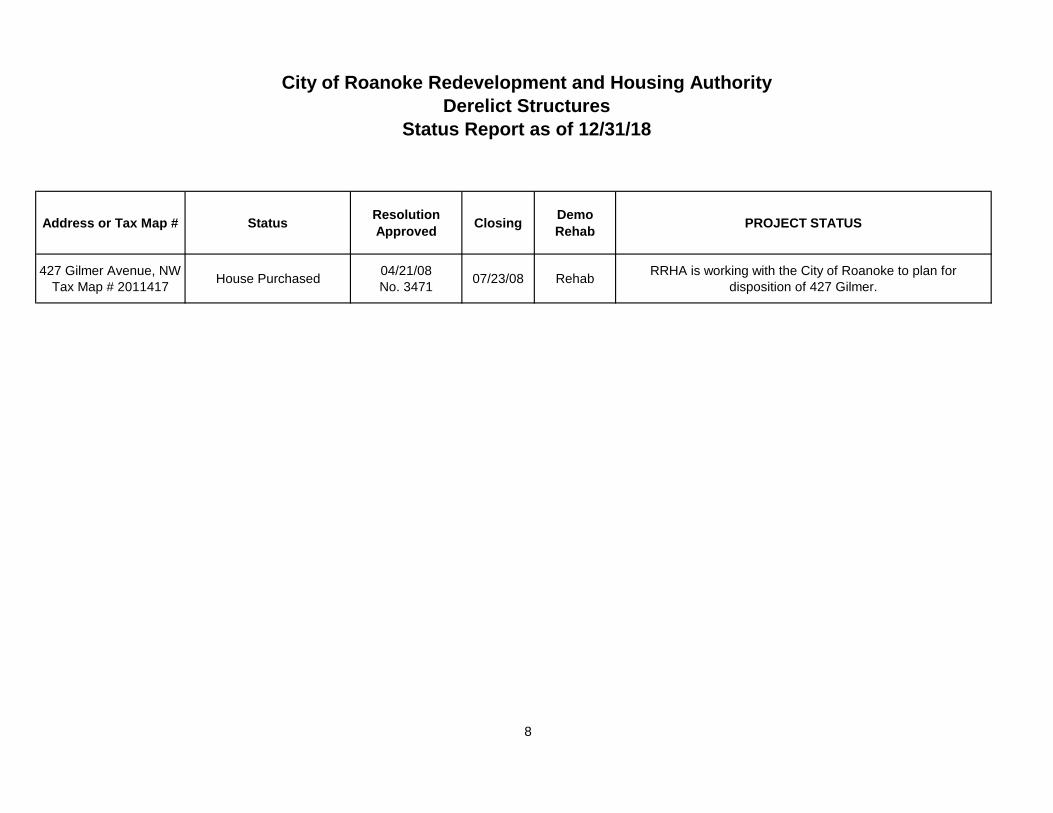
City of Roanoke Redevelopment and Housing Authority
Derelict Structures
Status Report as of 12/31/18
Address or Tax Map # StatusResolution
ApprovedClosing
Demo
RehabPROJECT STATUS
427 Gilmer Avenue, NW
Tax Map # 2011417House Purchased
04/21/08
No. 347107/23/08 Rehab
RRHA is working with the City of Roanoke to plan for
disposition of 427 Gilmer.
8
HOUSING DIVISION
PUBLIC HOUSING PROGRAM
MONTHLY OPERATIONS REPORT
DECEMBER 2018

Monthly Management Report
Occupancy Comparison
(1st of the Month)
RRHA-Owned Properties AMP #Actual Unit
Count
Adjusted
Unit Count/
Units in
MOD status
Occupied
UnitsTotal Days
Unoccupied
Days
Occupied
Days
Occupancy
Rate
Vacancy
Rate
Public Housing
Lansdowne Park 201 300 0 300 9300 44 9256 99.53% 0.47%
The Villages at Lincoln/
Handicapped/Elderly Cottages 202 180 1 179 5580 49 5531 99.12% 0.88%
Hunt Manor/Bluestone Park 259 172 0 172 5332 2 5330 99.96% 0.04% Melrose Towers 206 212 2 210 6572 50 6522 99.24% 0.76%
Jamestown Place 207 150 0 150 4650 30 4620 99.35% 0.65% Morningside Manor 208 105 0 105 3255 48 3207 98.53% 1.47%
Indian Rock Village/53 Scattered 210 148 4 144 4588 3 4585 99.93% 0.07%The Villages at Lincoln-
24 Transitional/Homeownership 215 8 0 8 248 11 237 95.56% 4.44%
Portfolio Total: 1275 7 1268 39525 237 39288 99.40% 0.60%
Other Rental Housing AMP #Actual Unit
Count
Occupied
UnitsTotal Days
Unoccupied
Days
Occupied
Days
Occupancy
Rate
Vacancy
Rate
Hackley Avenue 400 24 24 744 0 744 100.00% 0.00%Jamison Avenue 420 3 3 93 0 93 100.00% 0.00%Portfolio Total: 27 27 837 0 837 100.00% 0.00%
Non-Owned Properties
Managed by RRHA/Tax CreditAMP #
Actual Unit
Count
Occupied
UnitsTotal Days
Unoccupied
Days
Occupied
Days
Occupancy
Rate
Vacancy
Rate
Stepping Stone (LIHTC) 455 30 30 930 0 930 100.00% 0.00%
Hillcrest Heights (LIHTC) 456 24 24 744 9 735 98.79% 1.21%
Park Street Square (LIHTC) 457 25 24 775 47 728 93.94% 6.06%Hurt Park LP (LIHTC) 459 40 40 1240 13 1227 98.95% 1.05%
McCray Court (LIHTC) 470 68 67 2108 6 2102 99.72% 0.28%
Gilmer Housing (LIHTC) 471 20 18 620 113 507 81.77% 18.23% *
Portfolio Total: 207 203 6417 188 6229 97.07% 2.93%
Points
16128410
* 821 & 823 Gilmer are undergoing substantial rehab
PHAS Scoring
< 92% but ≥ 90%< 90%
≥ 98%< 98% but ≥ 96%< 96% but ≥ 94%
Occupancy
< 94% but ≥ 92%
1
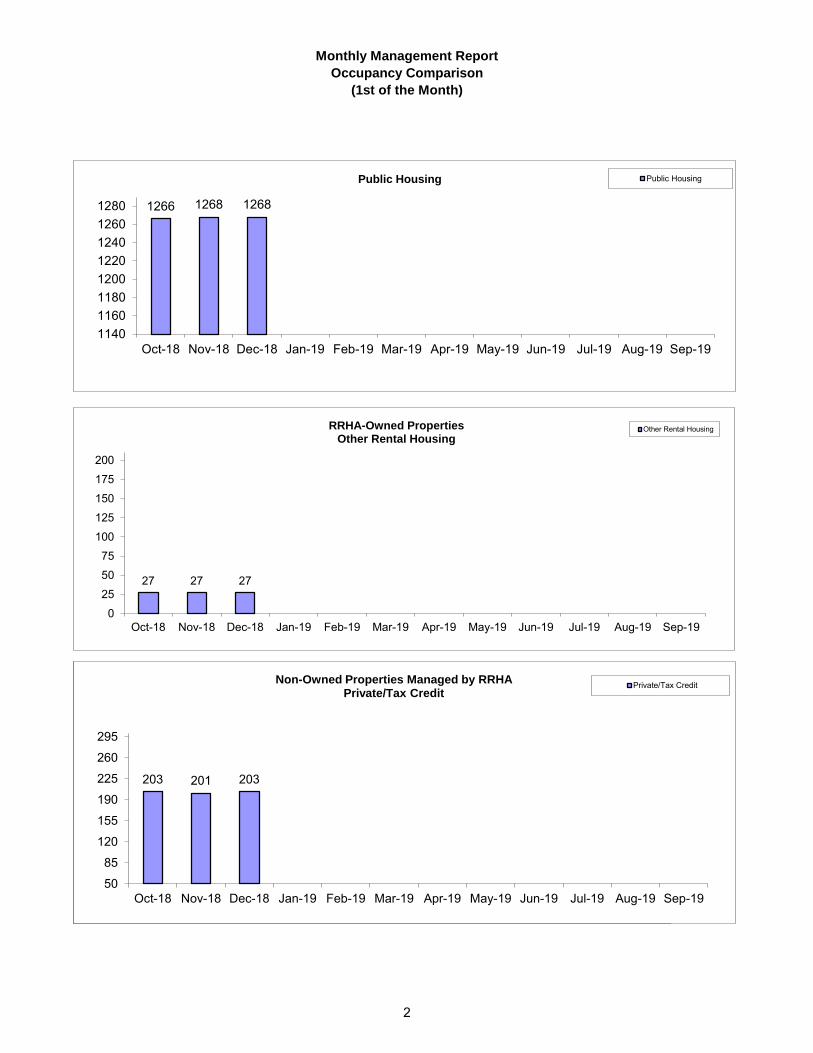
Monthly Management Report
Occupancy Comparison
(1st of the Month)
100
105
110
115
120
Oct-18
Nov-18
Dec-18
Jan-19
Feb-19
Mar-19
Apr-19
May-19
Jun-19
Jul-19
Aug-19
Sep-19
Private/Tax Credit
Private/Tax Credit
1266 1268 1268
11401160118012001220124012601280
Oct-18 Nov-18 Dec-18 Jan-19 Feb-19 Mar-19 Apr-19 May-19 Jun-19 Jul-19 Aug-19 Sep-19
Public Housing Public Housing
27 27 27
0
2550
75
100
125
150
175
200
Oct-18 Nov-18 Dec-18 Jan-19 Feb-19 Mar-19 Apr-19 May-19 Jun-19 Jul-19 Aug-19 Sep-19
RRHA-Owned Properties Other Rental Housing
Other Rental Housing
203 201 203
50
85
120
155
190
225
260
295
Oct-18 Nov-18 Dec-18 Jan-19 Feb-19 Mar-19 Apr-19 May-19 Jun-19 Jul-19 Aug-19 Sep-19
Non-Owned Properties Managed by RRHA Private/Tax Credit
Private/Tax Credit
2
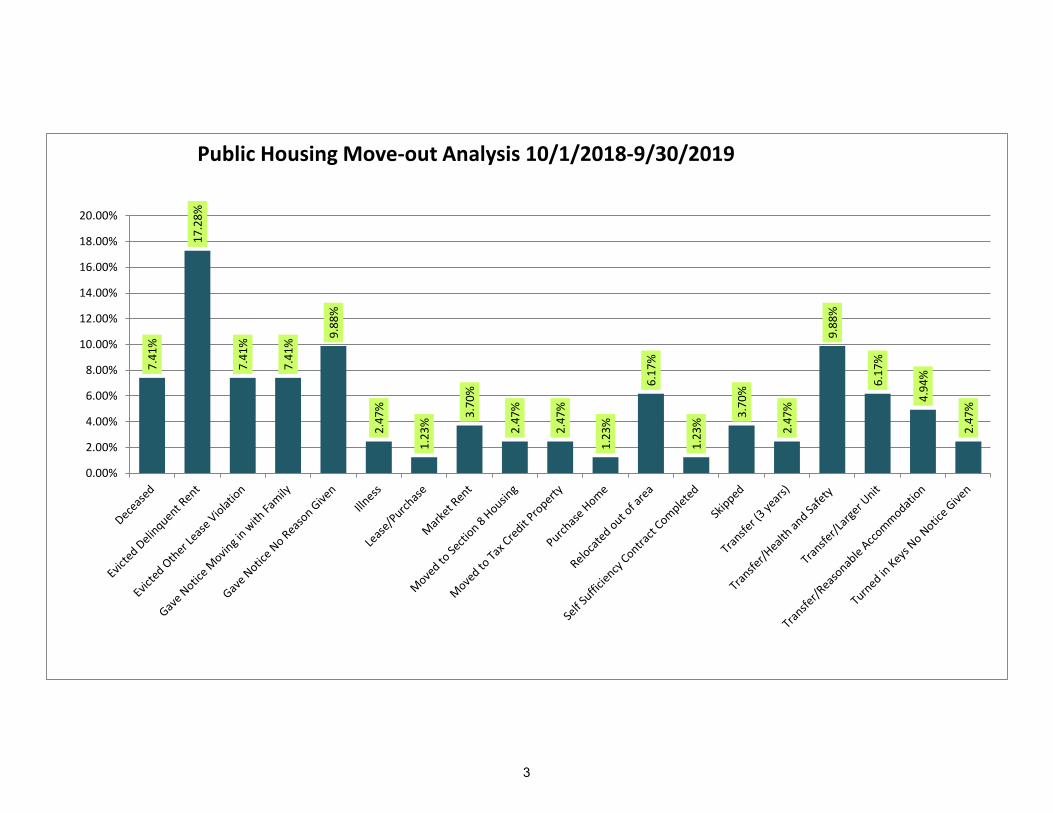
7.4
1%
17
.28
%
7.4
1%
7.4
1%
9.8
8%
2.4
7%
1.2
3%
3.7
0%
2.4
7%
2.4
7%
1.2
3%
6.1
7%
1.2
3%
3.7
0%
2.4
7%
9.8
8%
6.1
7%
4.9
4%
2.4
7%
0.00%
2.00%
4.00%
6.00%
8.00%
10.00%
12.00%
14.00%
16.00%
18.00%
20.00%
Public Housing Move-out Analysis 10/1/2018-9/30/2019
3
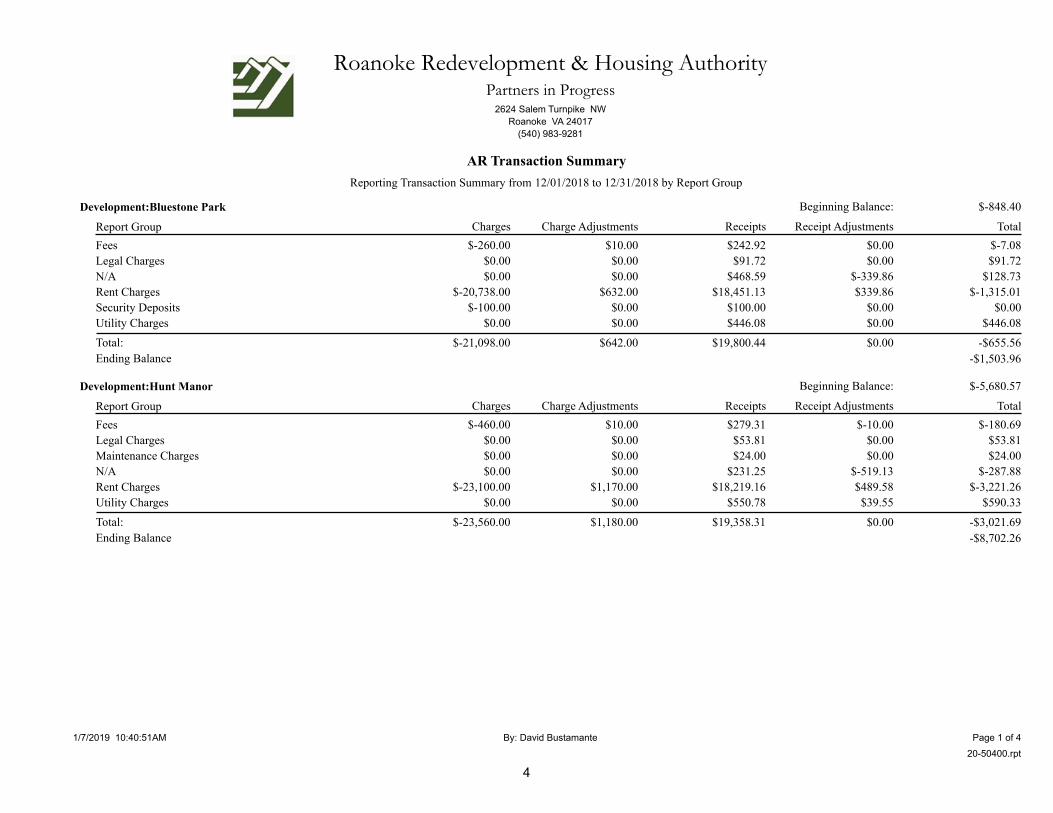
Roanoke Redevelopment & Housing AuthorityPartners in Progress
2624 Salem Turnpike NWRoanoke VA 24017
(540) 983-9281
AR Transaction Summary
Reporting Transaction Summary from 12/01/2018 to 12/31/2018 by Report Group
Development:Bluestone Park Beginning Balance: $-848.40
Report Group TotalReceipt AdjustmentsReceiptsCharge AdjustmentsCharges
$-7.08$0.00$242.92$10.00$-260.00Fees
$91.72$0.00$91.72$0.00$0.00Legal Charges
$128.73$-339.86$468.59$0.00$0.00N/A
$-1,315.01$339.86$18,451.13$632.00$-20,738.00Rent Charges
$0.00$0.00$100.00$0.00$-100.00Security Deposits
$446.08$0.00$446.08$0.00$0.00Utility Charges
-$1,503.96
$0.00$19,800.44$642.00$-21,098.00
Ending Balance
Total: -$655.56
Development:Hunt Manor Beginning Balance: $-5,680.57
Report Group TotalReceipt AdjustmentsReceiptsCharge AdjustmentsCharges
$-180.69$-10.00$279.31$10.00$-460.00Fees
$53.81$0.00$53.81$0.00$0.00Legal Charges
$24.00$0.00$24.00$0.00$0.00Maintenance Charges
$-287.88$-519.13$231.25$0.00$0.00N/A
$-3,221.26$489.58$18,219.16$1,170.00$-23,100.00Rent Charges
$590.33$39.55$550.78$0.00$0.00Utility Charges
-$8,702.26
$0.00$19,358.31$1,180.00$-23,560.00
Ending Balance
Total: -$3,021.69
By: David Bustamante Page 1 of 4
20-50400.rpt
1/7/2019 10:40:51AM
4
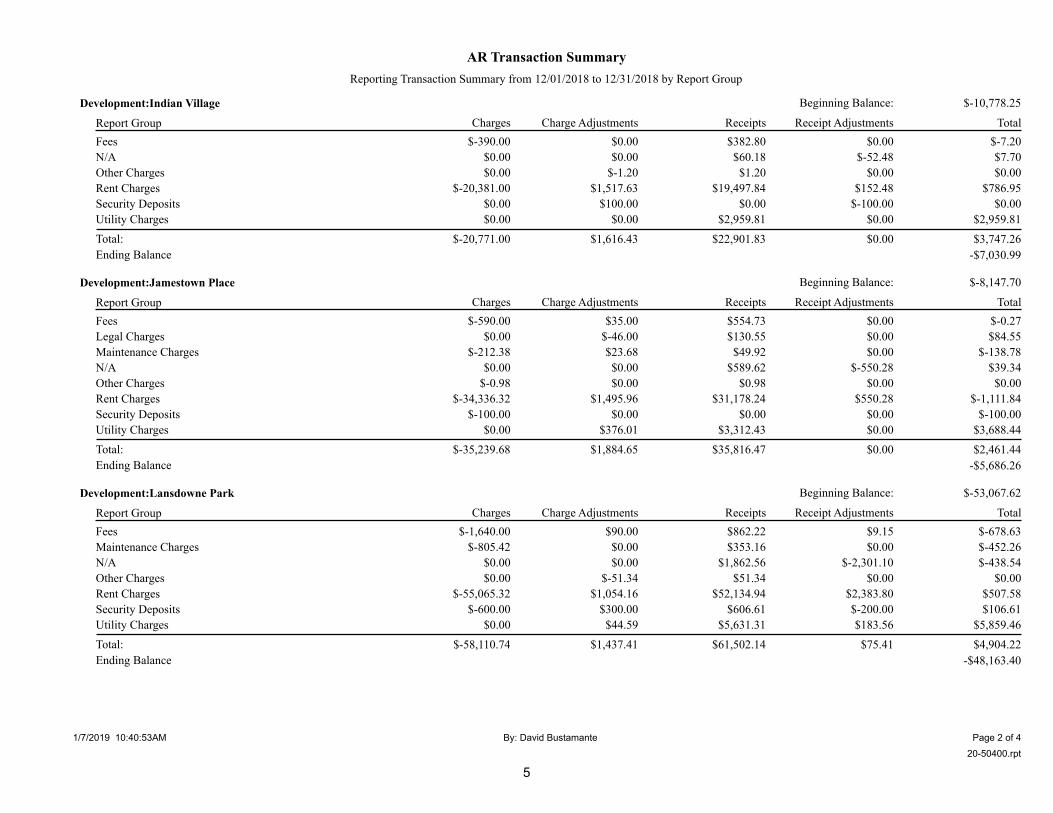
AR Transaction Summary
Reporting Transaction Summary from 12/01/2018 to 12/31/2018 by Report Group
Development:Indian Village Beginning Balance: $-10,778.25
Report Group TotalReceipt AdjustmentsReceiptsCharge AdjustmentsCharges
$-7.20$0.00$382.80$0.00$-390.00Fees
$7.70$-52.48$60.18$0.00$0.00N/A
$0.00$0.00$1.20$-1.20$0.00Other Charges
$786.95$152.48$19,497.84$1,517.63$-20,381.00Rent Charges
$0.00$-100.00$0.00$100.00$0.00Security Deposits
$2,959.81$0.00$2,959.81$0.00$0.00Utility Charges
-$7,030.99
$0.00$22,901.83$1,616.43$-20,771.00
Ending Balance
Total: $3,747.26
Development:Jamestown Place Beginning Balance: $-8,147.70
Report Group TotalReceipt AdjustmentsReceiptsCharge AdjustmentsCharges
$-0.27$0.00$554.73$35.00$-590.00Fees
$84.55$0.00$130.55$-46.00$0.00Legal Charges
$-138.78$0.00$49.92$23.68$-212.38Maintenance Charges
$39.34$-550.28$589.62$0.00$0.00N/A
$0.00$0.00$0.98$0.00$-0.98Other Charges
$-1,111.84$550.28$31,178.24$1,495.96$-34,336.32Rent Charges
$-100.00$0.00$0.00$0.00$-100.00Security Deposits
$3,688.44$0.00$3,312.43$376.01$0.00Utility Charges
-$5,686.26
$0.00$35,816.47$1,884.65$-35,239.68
Ending Balance
Total: $2,461.44
Development:Lansdowne Park Beginning Balance: $-53,067.62
Report Group TotalReceipt AdjustmentsReceiptsCharge AdjustmentsCharges
$-678.63$9.15$862.22$90.00$-1,640.00Fees
$-452.26$0.00$353.16$0.00$-805.42Maintenance Charges
$-438.54$-2,301.10$1,862.56$0.00$0.00N/A
$0.00$0.00$51.34$-51.34$0.00Other Charges
$507.58$2,383.80$52,134.94$1,054.16$-55,065.32Rent Charges
$106.61$-200.00$606.61$300.00$-600.00Security Deposits
$5,859.46$183.56$5,631.31$44.59$0.00Utility Charges
-$48,163.40
$75.41$61,502.14$1,437.41$-58,110.74
Ending Balance
Total: $4,904.22
By: David Bustamante Page 2 of 4
20-50400.rpt
1/7/2019 10:40:53AM
5
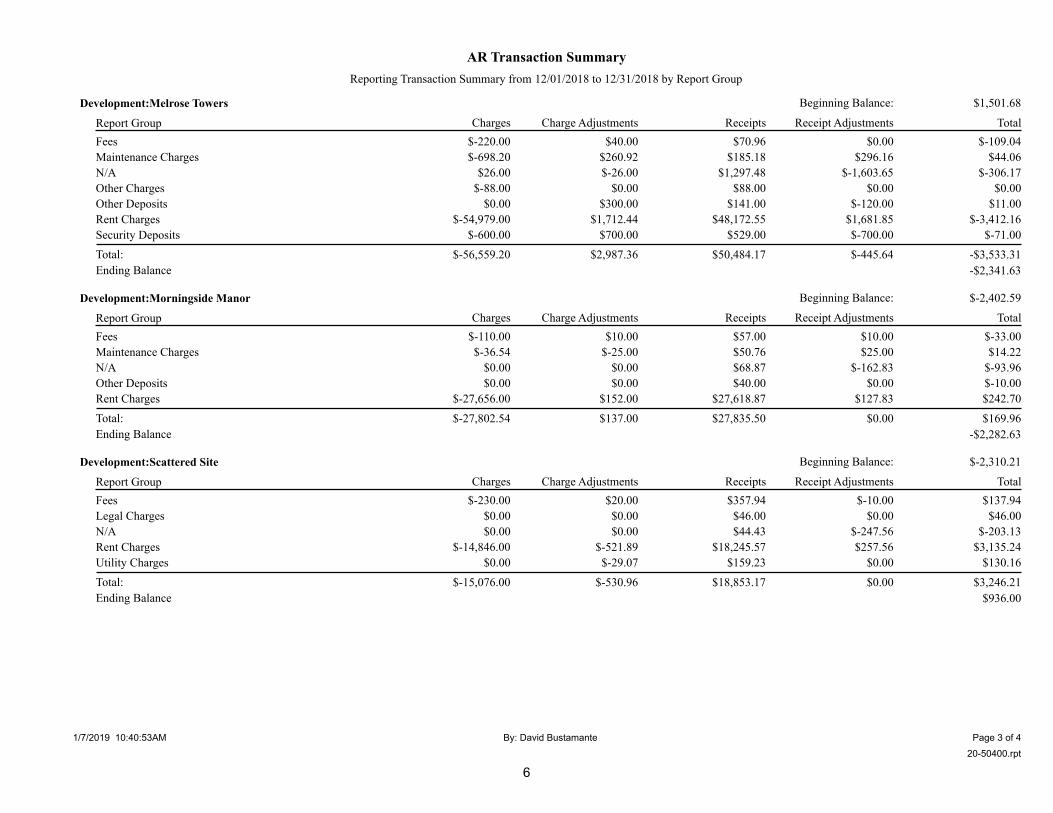
AR Transaction Summary
Reporting Transaction Summary from 12/01/2018 to 12/31/2018 by Report Group
Development:Melrose Towers Beginning Balance: $1,501.68
Report Group TotalReceipt AdjustmentsReceiptsCharge AdjustmentsCharges
$-109.04$0.00$70.96$40.00$-220.00Fees
$44.06$296.16$185.18$260.92$-698.20Maintenance Charges
$-306.17$-1,603.65$1,297.48$-26.00$26.00N/A
$0.00$0.00$88.00$0.00$-88.00Other Charges
$11.00$-120.00$141.00$300.00$0.00Other Deposits
$-3,412.16$1,681.85$48,172.55$1,712.44$-54,979.00Rent Charges
$-71.00$-700.00$529.00$700.00$-600.00Security Deposits
-$2,341.63
$-445.64$50,484.17$2,987.36$-56,559.20
Ending Balance
Total: -$3,533.31
Development:Morningside Manor Beginning Balance: $-2,402.59
Report Group TotalReceipt AdjustmentsReceiptsCharge AdjustmentsCharges
$-33.00$10.00$57.00$10.00$-110.00Fees
$14.22$25.00$50.76$-25.00$-36.54Maintenance Charges
$-93.96$-162.83$68.87$0.00$0.00N/A
$-10.00$0.00$40.00$0.00$0.00Other Deposits
$242.70$127.83$27,618.87$152.00$-27,656.00Rent Charges
-$2,282.63
$0.00$27,835.50$137.00$-27,802.54
Ending Balance
Total: $169.96
Development:Scattered Site Beginning Balance: $-2,310.21
Report Group TotalReceipt AdjustmentsReceiptsCharge AdjustmentsCharges
$137.94$-10.00$357.94$20.00$-230.00Fees
$46.00$0.00$46.00$0.00$0.00Legal Charges
$-203.13$-247.56$44.43$0.00$0.00N/A
$3,135.24$257.56$18,245.57$-521.89$-14,846.00Rent Charges
$130.16$0.00$159.23$-29.07$0.00Utility Charges
$936.00
$0.00$18,853.17$-530.96$-15,076.00
Ending Balance
Total: $3,246.21
By: David Bustamante Page 3 of 4
20-50400.rpt
1/7/2019 10:40:53AM
6

AR Transaction Summary
Reporting Transaction Summary from 12/01/2018 to 12/31/2018 by Report Group
Development:Villages at Lincoln Beginning Balance: $1,754.87
Report Group TotalReceipt AdjustmentsReceiptsCharge AdjustmentsCharges
$-57.00$10.00$133.00$70.00$-270.00Fees
$-16.68$0.00$0.00$121.36$-138.04Maintenance Charges
$-420.15$-725.00$304.85$0.00$0.00N/A
$0.00$0.00$50.00$0.00$-50.00Other Deposits
$591.12$815.00$20,330.81$-96.69$-20,458.00Rent Charges
$0.00$-200.00$200.00$300.00$-300.00Security Deposits
$1,852.16
$-100.00$21,018.66$394.67$-21,216.04
Ending Balance
Total: $97.29
Development:Villages at Lincoln Homeownership Beginning Balance: $638.53
Report Group TotalReceipt AdjustmentsReceiptsCharge AdjustmentsCharges
$-18.00$30.00$12.00$0.00$-60.00Fees
$98.99$-21.31$120.30$0.00$0.00N/A
$-142.43$0.00$0.00$0.00$-142.43Other Charges
$255.04$-8.69$5,233.70$21.87$-4,991.84Rent Charges
$0.00$-100.00$100.00$100.00$-100.00Security Deposits
$832.13
$-100.00$5,466.00$121.87$-5,294.27
Ending Balance
Total: $193.60
Total for all Developments Beginning Balance: $-79,340.26
Report Group TotalReceipt AdjustmentsReceiptsCharge AdjustmentsCharges
$-952.97$39.15$2,952.88$285.00$-4,230.00Fees
$276.08$0.00$322.08$-46.00$0.00Legal Charges
$-525.44$321.16$663.02$380.96$-1,890.58Maintenance Charges
$-1,475.07$-6,523.20$5,048.13$-26.00$26.00N/A
$-142.43$0.00$141.52$-52.54$-231.41Other Charges
$361.00$-120.00$231.00$300.00$-50.00Other Deposits
$-3,541.64$6,789.55$259,082.81$7,137.48$-276,551.48Rent Charges
$-64.39$-1,300.00$1,535.61$1,500.00$-1,800.00Security Deposits
$13,674.28$223.11$13,059.64$391.53$0.00Utility Charges
-$71,730.84
$-570.23$283,036.69$9,870.43$-284,727.47
Ending Balance
Total: $7,609.42
**End of Report**
By: David Bustamante Page 4 of 4
20-50400.rpt
1/7/2019 10:40:53AM
7
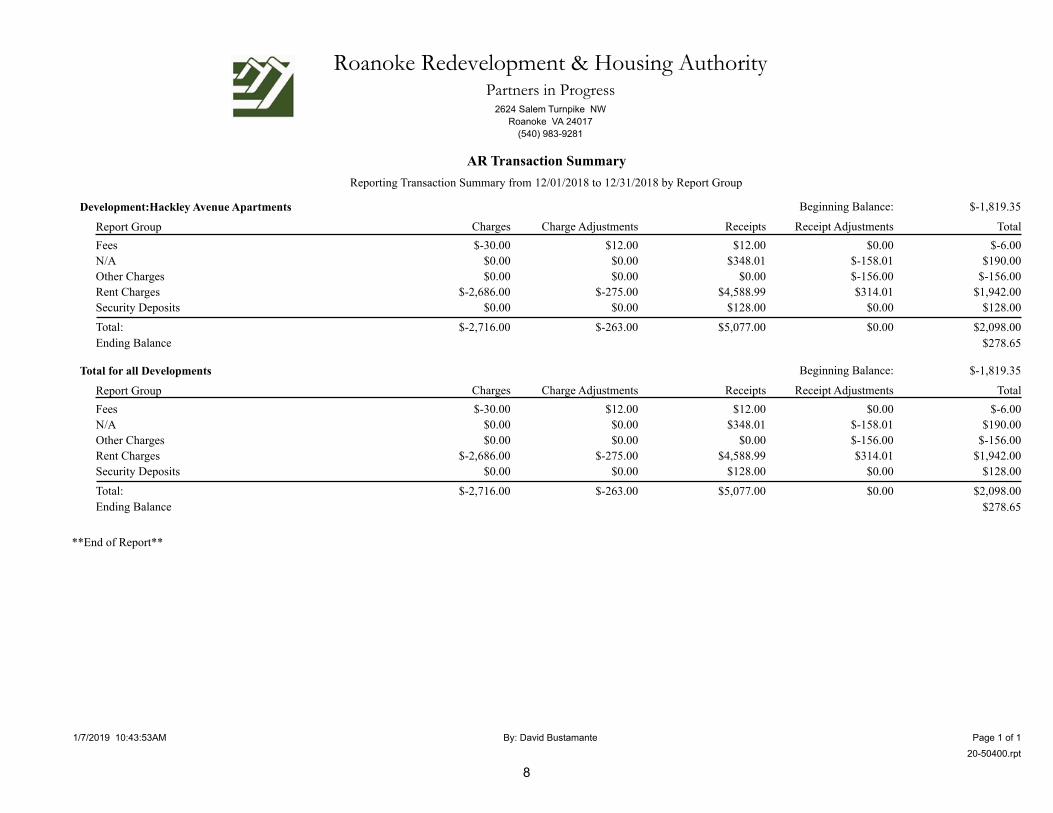
Roanoke Redevelopment & Housing AuthorityPartners in Progress
2624 Salem Turnpike NWRoanoke VA 24017
(540) 983-9281
AR Transaction Summary
Reporting Transaction Summary from 12/01/2018 to 12/31/2018 by Report Group
Development:Hackley Avenue Apartments Beginning Balance: $-1,819.35
Report Group TotalReceipt AdjustmentsReceiptsCharge AdjustmentsCharges
$-6.00$0.00$12.00$12.00$-30.00Fees
$190.00$-158.01$348.01$0.00$0.00N/A
$-156.00$-156.00$0.00$0.00$0.00Other Charges
$1,942.00$314.01$4,588.99$-275.00$-2,686.00Rent Charges
$128.00$0.00$128.00$0.00$0.00Security Deposits
$278.65
$0.00$5,077.00$-263.00$-2,716.00
Ending Balance
Total: $2,098.00
Total for all Developments Beginning Balance: $-1,819.35
Report Group TotalReceipt AdjustmentsReceiptsCharge AdjustmentsCharges
$-6.00$0.00$12.00$12.00$-30.00Fees
$190.00$-158.01$348.01$0.00$0.00N/A
$-156.00$-156.00$0.00$0.00$0.00Other Charges
$1,942.00$314.01$4,588.99$-275.00$-2,686.00Rent Charges
$128.00$0.00$128.00$0.00$0.00Security Deposits
$278.65
$0.00$5,077.00$-263.00$-2,716.00
Ending Balance
Total: $2,098.00
**End of Report**
By: David Bustamante Page 1 of 1
20-50400.rpt
1/7/2019 10:43:53AM
8
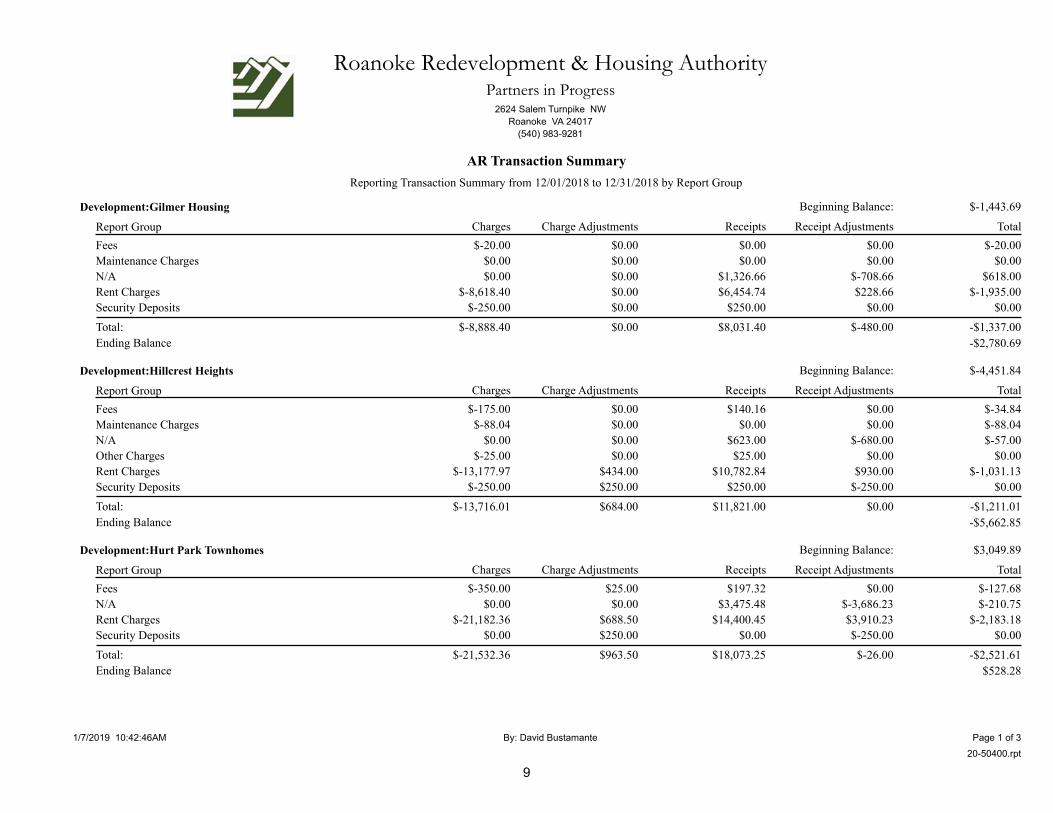
Roanoke Redevelopment & Housing AuthorityPartners in Progress
2624 Salem Turnpike NWRoanoke VA 24017
(540) 983-9281
AR Transaction Summary
Reporting Transaction Summary from 12/01/2018 to 12/31/2018 by Report Group
Development:Gilmer Housing Beginning Balance: $-1,443.69
Report Group TotalReceipt AdjustmentsReceiptsCharge AdjustmentsCharges
$-20.00$0.00$0.00$0.00$-20.00Fees
$0.00$0.00$0.00$0.00$0.00Maintenance Charges
$618.00$-708.66$1,326.66$0.00$0.00N/A
$-1,935.00$228.66$6,454.74$0.00$-8,618.40Rent Charges
$0.00$0.00$250.00$0.00$-250.00Security Deposits
-$2,780.69
$-480.00$8,031.40$0.00$-8,888.40
Ending Balance
Total: -$1,337.00
Development:Hillcrest Heights Beginning Balance: $-4,451.84
Report Group TotalReceipt AdjustmentsReceiptsCharge AdjustmentsCharges
$-34.84$0.00$140.16$0.00$-175.00Fees
$-88.04$0.00$0.00$0.00$-88.04Maintenance Charges
$-57.00$-680.00$623.00$0.00$0.00N/A
$0.00$0.00$25.00$0.00$-25.00Other Charges
$-1,031.13$930.00$10,782.84$434.00$-13,177.97Rent Charges
$0.00$-250.00$250.00$250.00$-250.00Security Deposits
-$5,662.85
$0.00$11,821.00$684.00$-13,716.01
Ending Balance
Total: -$1,211.01
Development:Hurt Park Townhomes Beginning Balance: $3,049.89
Report Group TotalReceipt AdjustmentsReceiptsCharge AdjustmentsCharges
$-127.68$0.00$197.32$25.00$-350.00Fees
$-210.75$-3,686.23$3,475.48$0.00$0.00N/A
$-2,183.18$3,910.23$14,400.45$688.50$-21,182.36Rent Charges
$0.00$-250.00$0.00$250.00$0.00Security Deposits
$528.28
$-26.00$18,073.25$963.50$-21,532.36
Ending Balance
Total: -$2,521.61
By: David Bustamante Page 1 of 3
20-50400.rpt
1/7/2019 10:42:46AM
9
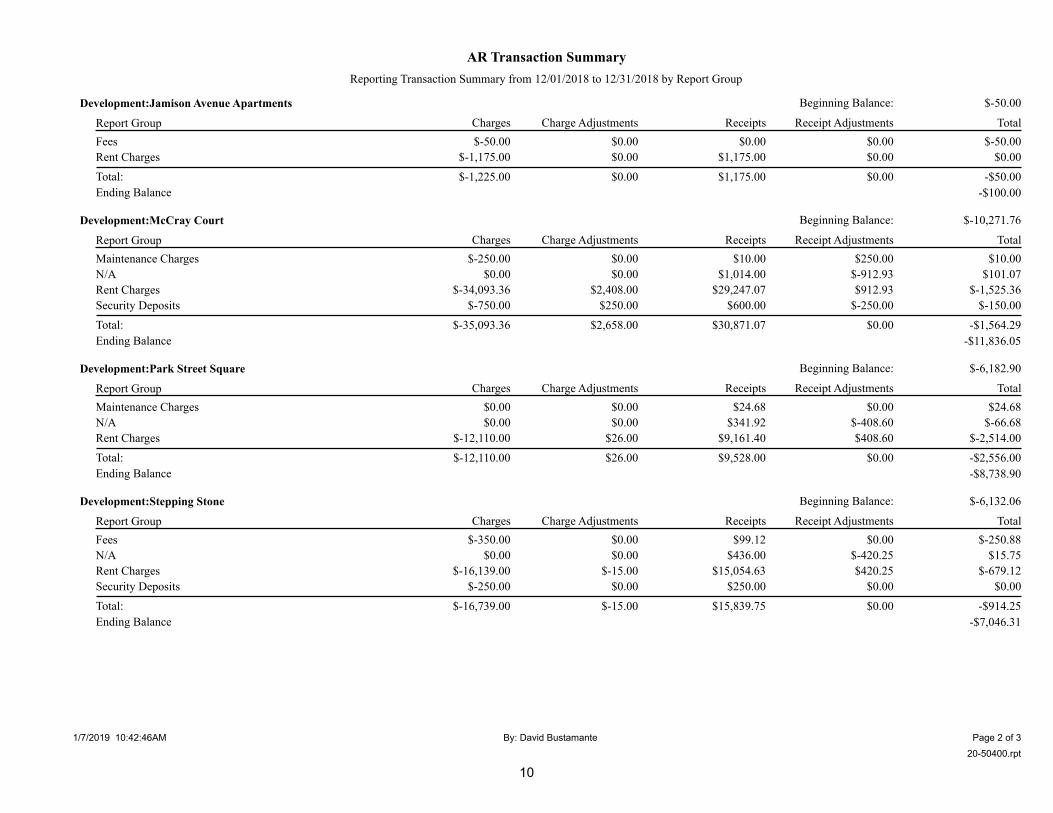
AR Transaction Summary
Reporting Transaction Summary from 12/01/2018 to 12/31/2018 by Report Group
Development:Jamison Avenue Apartments Beginning Balance: $-50.00
Report Group TotalReceipt AdjustmentsReceiptsCharge AdjustmentsCharges
$-50.00$0.00$0.00$0.00$-50.00Fees
$0.00$0.00$1,175.00$0.00$-1,175.00Rent Charges
-$100.00
$0.00$1,175.00$0.00$-1,225.00
Ending Balance
Total: -$50.00
Development:McCray Court Beginning Balance: $-10,271.76
Report Group TotalReceipt AdjustmentsReceiptsCharge AdjustmentsCharges
$10.00$250.00$10.00$0.00$-250.00Maintenance Charges
$101.07$-912.93$1,014.00$0.00$0.00N/A
$-1,525.36$912.93$29,247.07$2,408.00$-34,093.36Rent Charges
$-150.00$-250.00$600.00$250.00$-750.00Security Deposits
-$11,836.05
$0.00$30,871.07$2,658.00$-35,093.36
Ending Balance
Total: -$1,564.29
Development:Park Street Square Beginning Balance: $-6,182.90
Report Group TotalReceipt AdjustmentsReceiptsCharge AdjustmentsCharges
$24.68$0.00$24.68$0.00$0.00Maintenance Charges
$-66.68$-408.60$341.92$0.00$0.00N/A
$-2,514.00$408.60$9,161.40$26.00$-12,110.00Rent Charges
-$8,738.90
$0.00$9,528.00$26.00$-12,110.00
Ending Balance
Total: -$2,556.00
Development:Stepping Stone Beginning Balance: $-6,132.06
Report Group TotalReceipt AdjustmentsReceiptsCharge AdjustmentsCharges
$-250.88$0.00$99.12$0.00$-350.00Fees
$15.75$-420.25$436.00$0.00$0.00N/A
$-679.12$420.25$15,054.63$-15.00$-16,139.00Rent Charges
$0.00$0.00$250.00$0.00$-250.00Security Deposits
-$7,046.31
$0.00$15,839.75$-15.00$-16,739.00
Ending Balance
Total: -$914.25
By: David Bustamante Page 2 of 3
20-50400.rpt
1/7/2019 10:42:46AM
10
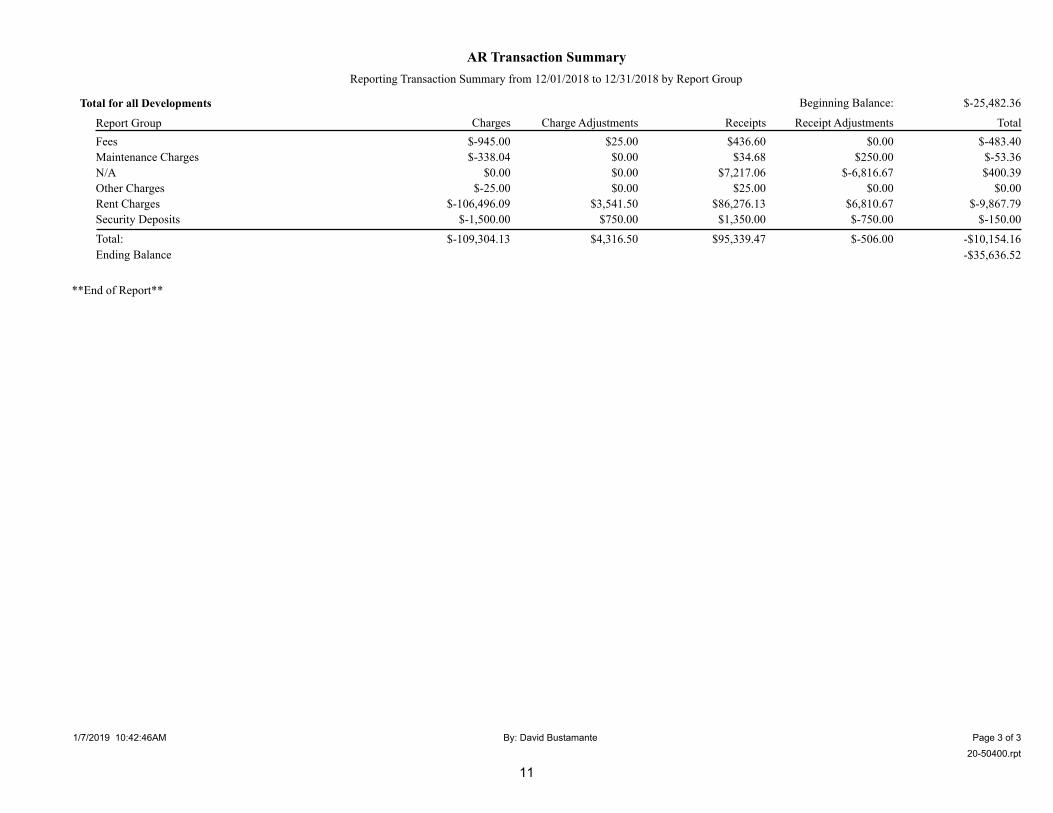
AR Transaction Summary
Reporting Transaction Summary from 12/01/2018 to 12/31/2018 by Report Group
Total for all Developments Beginning Balance: $-25,482.36
Report Group TotalReceipt AdjustmentsReceiptsCharge AdjustmentsCharges
$-483.40$0.00$436.60$25.00$-945.00Fees
$-53.36$250.00$34.68$0.00$-338.04Maintenance Charges
$400.39$-6,816.67$7,217.06$0.00$0.00N/A
$0.00$0.00$25.00$0.00$-25.00Other Charges
$-9,867.79$6,810.67$86,276.13$3,541.50$-106,496.09Rent Charges
$-150.00$-750.00$1,350.00$750.00$-1,500.00Security Deposits
-$35,636.52
$-506.00$95,339.47$4,316.50$-109,304.13
Ending Balance
Total: -$10,154.16
**End of Report**
By: David Bustamante Page 3 of 3
20-50400.rpt
1/7/2019 10:42:46AM
11

Monthly
Management Report
Charges vs. Receipts
December 2018
RRHA-Owned PropertiesAMP
Number
Vacated Unit
Cumulative Charge-
Offs as of 12/31/18
Vacated Unit
Cumulative
Collections as of
12/31/18
Non-Public Housing $0.00 $0.00
Lansdowne Park 201 $3,246.73 $897.94
The Villages at Lincoln/ Handicapped/Elderly Cottages 202 $32,962.40 $0.00
Note: $31,275.00 was due to a tenant caused
fire. Unit has been placed in HUD casualty
loss status and contractors are repairing
the unit.
Hunt Manor/Bluestone Park 259 $3,202.68 $945.55
Melrose Towers 206 $2,834.54 $857.55
Jamestown Place 207 $3,799.10 $1,051.00
Morningside Manor 208 $169.21 $0.00
Indian Rock Village/53 Scattered 210 $5,124.66 $102.98
The Villages at Lincoln- 24 Transitional/Homeownership 215 $0.00 $0.00
Public Housing TOTAL $51,339.32 $3,855.02
12
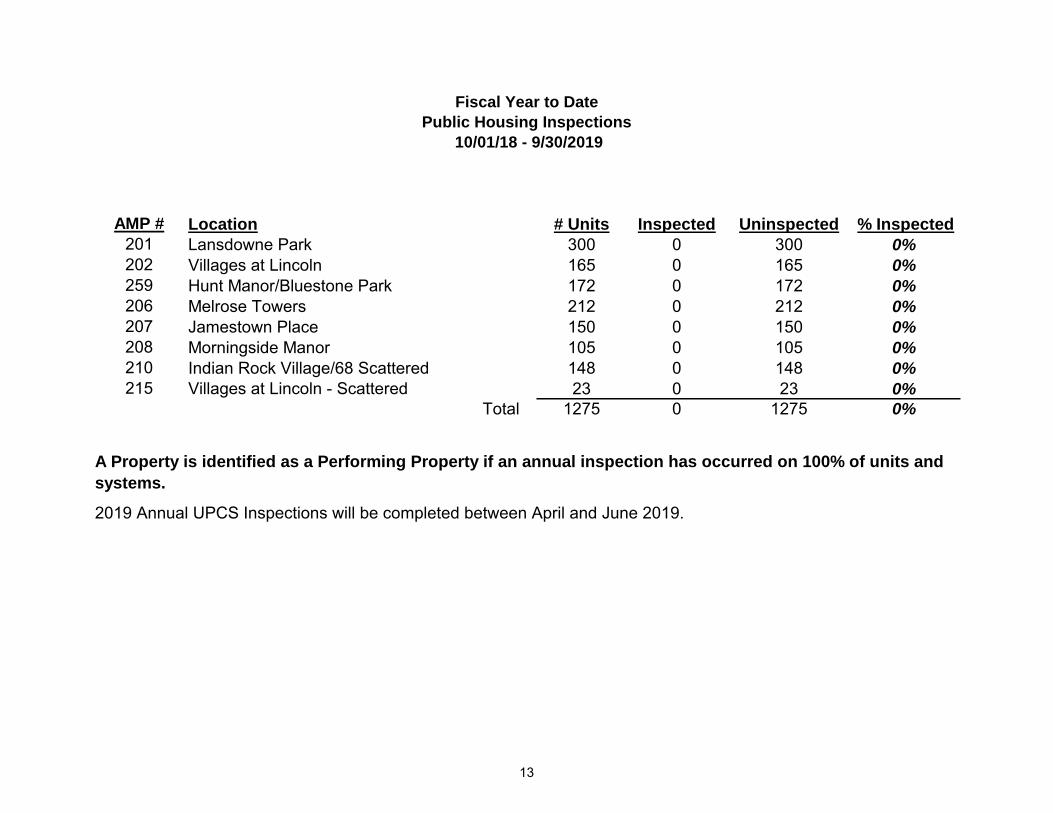
Fiscal Year to Date
Public Housing Inspections
10/01/18 - 9/30/2019
AMP # Location # Units Inspected Uninspected % Inspected
201 Lansdowne Park 300 0 300 0%
202 Villages at Lincoln 165 0 165 0%
259 Hunt Manor/Bluestone Park 172 0 172 0%
206 Melrose Towers 212 0 212 0%
207 Jamestown Place 150 0 150 0%
208 Morningside Manor 105 0 105 0%
210 Indian Rock Village/68 Scattered 148 0 148 0%
215 Villages at Lincoln - Scattered 23 0 23 0%
Total 1275 0 1275 0%
2019 Annual UPCS Inspections will be completed between April and June 2019.
A Property is identified as a Performing Property if an annual inspection has occurred on 100% of units and
systems.
13

Utility Costs
AMP Number of Cost PUM Cost PUM Cost PUM Total PUM RRHA PUM Percent
Units Electric Gas Water AMP Average Difference
201 300 36.92 63.09 75.09 175.10 162.96 107.45%
202 165 93.37 3.75 71.24 168.36 162.96 103.31%
259 172 41.41 38.38 84.17 163.96 162.96 100.61%
206 212 37.78 26.32 32.29 96.39 162.96 59.15%
207 150 38.35 35.02 68.99 142.36 162.96 87.36%
208 105 56.48 35.41 30.31 122.20 162.96 74.99%
210 148 43.43 48.09 67.43 158.95 162.96 97.54%
215 23 N/A N/A N/A N/A 162.96 N/ATotal Units: 1275Average Cost PUM: 49.95 47.00 66.01 162.96
Consumption
AMP Number of THERMS RRHA PUM Percent KWH RRHA PUM Percent Usage RRHA PUM Percent
Units PUM Average Difference PUM Average Difference PUM Average Difference
201 300 96.67 69.59 138.91% 590 640 92.19% 6.99 5.72 122.20%202 165 N/A 69.59 N/A 833 640 130.16% 5.55 5.72 97.03%
259 172 58.87 69.59 84.60% 554 640 86.56% 7.33 5.72 128.15%206 212 40.12 69.59 57.65% 560 640 87.50% 3.06 5.72 53.50%
207 150 53.11 69.59 76.32% 560 640 87.50% 6.60 5.72 115.38%
208 105 54.01 69.59 77.61% 800 640 125.00% 2.53 5.72 44.23%
210 148 71.90 69.59 103.32% 492 640 76.88% 5.20 5.72 90.91%
215 23 N/A 69.59 N/A N/A 640 N/A N/A 5.72 N/ATotal Units: 1275
Average THERM PUM: 69.59 Average KWH PUM: 640 Average water usage PUM: 5.72Note: AMP 202 - Residential units do not use gas utility - HVAC is total electric (heat pumps).
Note: AMP 202 - Administration building and maintenance shop use gas utility.
Note: AMP 208 - Residential units have central air conditioning.
Note: AMP 210 - Includes 21 scattered sites - residents pay utilities - no utility data available.
Note: AMP 215 - Transitional/Homeownership - residents pay utilities - no utility data available.
Note: Stormwater Utility Fee for RRHA public housing properties for FY 2019 = $31,611.60
A property is identified as a PERFORMING Property if it has utility consumption not exceeding 120% of the agency average.
Utility Consumption ReportOctober 2018 - September 2019
Gas Electric Water
Consumption and Costs as of November 30, 2018
14
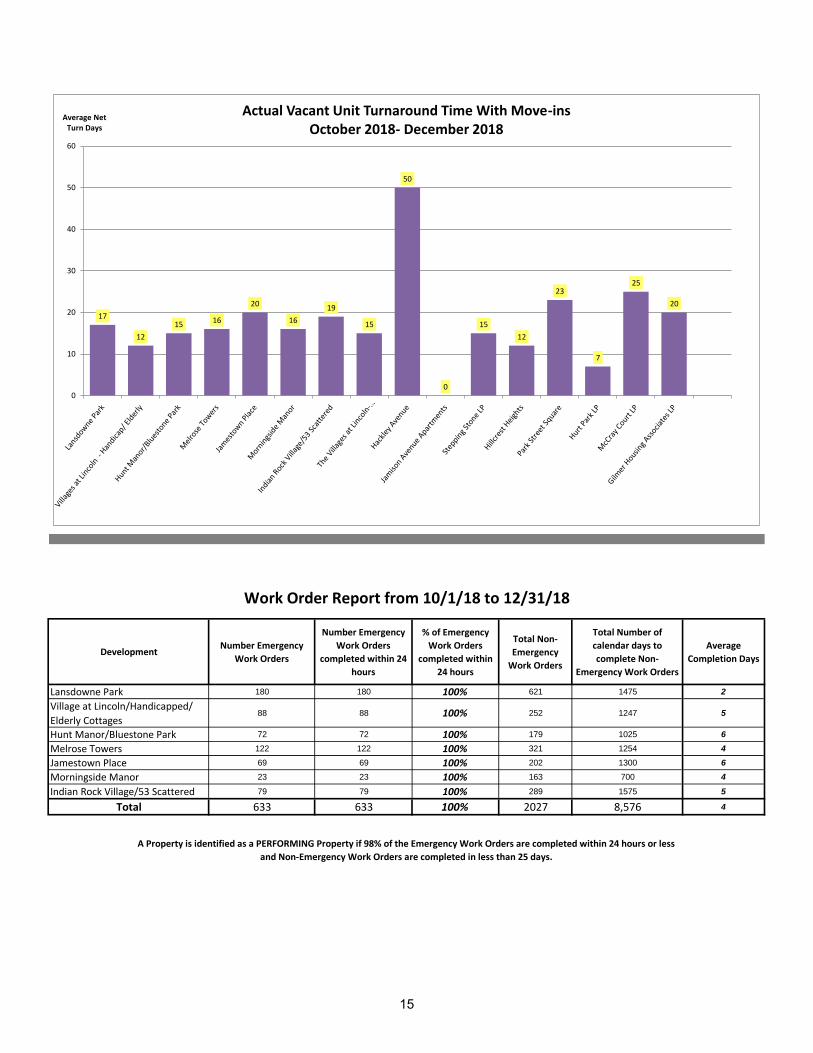
DevelopmentNumber Emergency
Work Orders
Number Emergency
Work Orders
completed within 24
hours
% of Emergency
Work Orders
completed within
24 hours
Total Non-
Emergency
Work Orders
Total Number of
calendar days to
complete Non-
Emergency Work Orders
Average
Completion Days
Lansdowne Park 180 180 100% 621 1475 2
Village at Lincoln/Handicapped/
Elderly Cottages88 88 100% 252 1247 5
Hunt Manor/Bluestone Park 72 72 100% 179 1025 6
Melrose Towers 122 122 100% 321 1254 4
Jamestown Place 69 69 100% 202 1300 6
Morningside Manor 23 23 100% 163 700 4
Indian Rock Village/53 Scattered 79 79 100% 289 1575 5
Total 633 633 100% 2027 8,576 4
Work Order Report from 10/1/18 to 12/31/18
A Property is identified as a PERFORMING Property if 98% of the Emergency Work Orders are completed within 24 hours or less
and Non-Emergency Work Orders are completed in less than 25 days.
17
12
15 16
20
16
19
15
50
0
15
12
23
7
25
20
0
10
20
30
40
50
60
Average Net Turn Days
Actual Vacant Unit Turnaround Time With Move-ins October 2018- December 2018
15
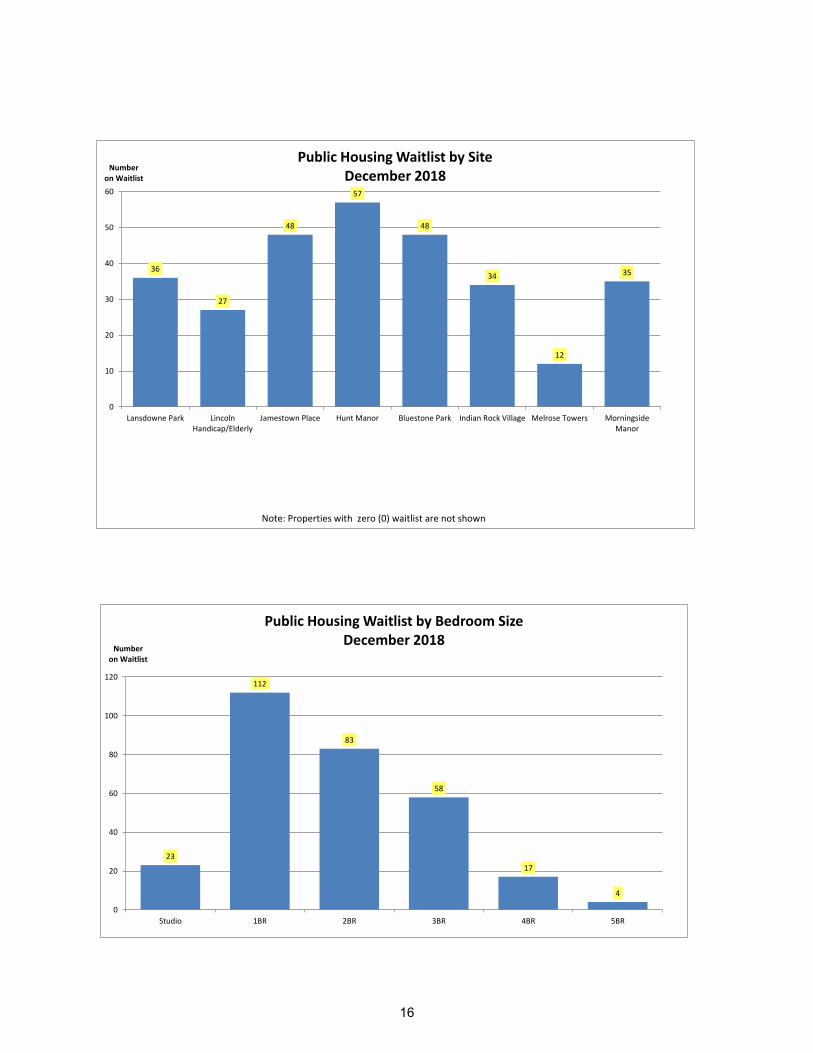
36
27
48
57
48
34
12
35
0
10
20
30
40
50
60
Lansdowne Park LincolnHandicap/Elderly
Jamestown Place Hunt Manor Bluestone Park Indian Rock Village Melrose Towers MorningsideManor
Number on Waitlist
Public Housing Waitlist by Site December 2018
Note: Properties with zero (0) waitlist are not shown
23
112
83
58
17
4
0
20
40
60
80
100
120
Studio 1BR 2BR 3BR 4BR 5BR
Number on Waitlist
Public Housing Waitlist by Bedroom Size December 2018
16
SECURITY ACTIVITIES
MONTHLY REPORT
DECEMBER 2018
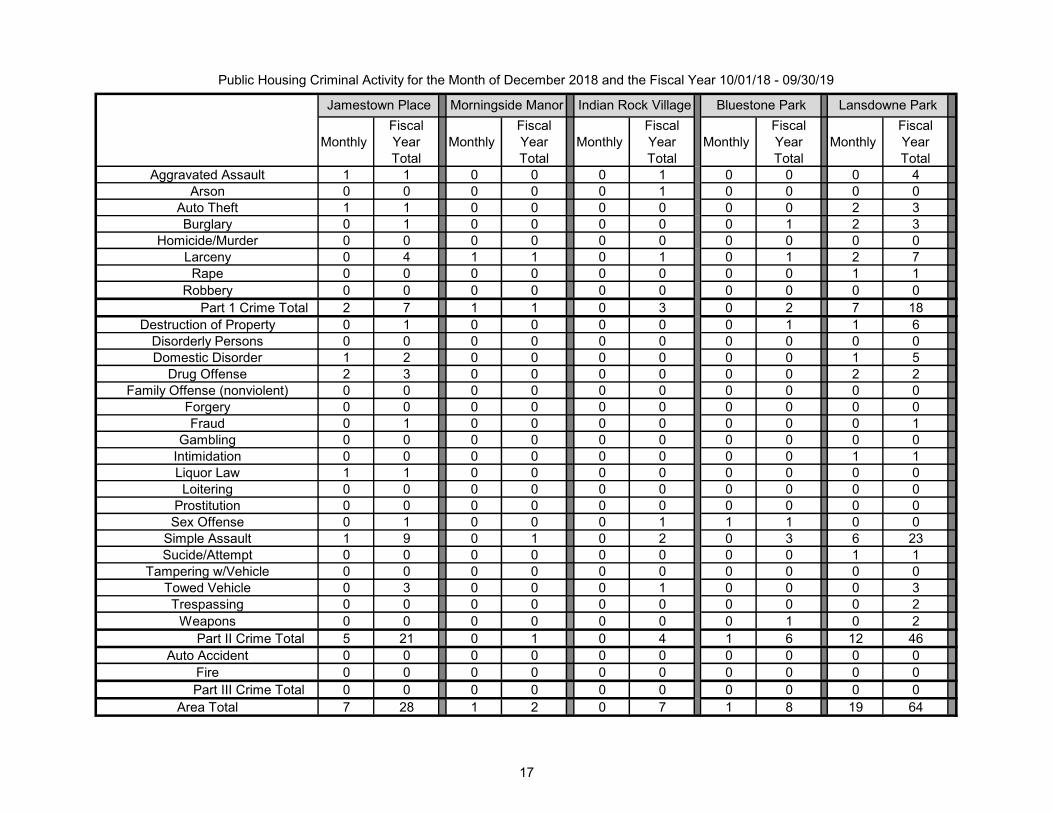
Public Housing Criminal Activity for the Month of December 2018 and the Fiscal Year 10/01/18 - 09/30/19
MonthlyFiscal Year Total
MonthlyFiscal Year Total
MonthlyFiscal Year Total
MonthlyFiscal Year Total
MonthlyFiscal Year Total
Aggravated Assault 1 1 0 0 0 1 0 0 0 4Arson 0 0 0 0 0 1 0 0 0 0
Auto Theft 1 1 0 0 0 0 0 0 2 3Burglary 0 1 0 0 0 0 0 1 2 3
Homicide/Murder 0 0 0 0 0 0 0 0 0 0Larceny 0 4 1 1 0 1 0 1 2 7
Rape 0 0 0 0 0 0 0 0 1 1Robbery 0 0 0 0 0 0 0 0 0 0
Part 1 Crime Total 2 7 1 1 0 3 0 2 7 18Destruction of Property 0 1 0 0 0 0 0 1 1 6
Disorderly Persons 0 0 0 0 0 0 0 0 0 0Domestic Disorder 1 2 0 0 0 0 0 0 1 5
Drug Offense 2 3 0 0 0 0 0 0 2 2Family Offense (nonviolent) 0 0 0 0 0 0 0 0 0 0
Forgery 0 0 0 0 0 0 0 0 0 0Fraud 0 1 0 0 0 0 0 0 0 1
Gambling 0 0 0 0 0 0 0 0 0 0Intimidation 0 0 0 0 0 0 0 0 1 1Liquor Law 1 1 0 0 0 0 0 0 0 0Loitering 0 0 0 0 0 0 0 0 0 0
Prostitution 0 0 0 0 0 0 0 0 0 0Sex Offense 0 1 0 0 0 1 1 1 0 0
Simple Assault 1 9 0 1 0 2 0 3 6 23Sucide/Attempt 0 0 0 0 0 0 0 0 1 1
Tampering w/Vehicle 0 0 0 0 0 0 0 0 0 0Towed Vehicle 0 3 0 0 0 1 0 0 0 3Trespassing 0 0 0 0 0 0 0 0 0 2
Weapons 0 0 0 0 0 0 0 1 0 2Part II Crime Total 5 21 0 1 0 4 1 6 12 46
Auto Accident 0 0 0 0 0 0 0 0 0 0Fire 0 0 0 0 0 0 0 0 0 0Part III Crime Total 0 0 0 0 0 0 0 0 0 0
Area Total 7 28 1 2 0 7 1 8 19 64
Jamestown Place Morningside Manor Indian Rock Village Bluestone Park Lansdowne Park
17
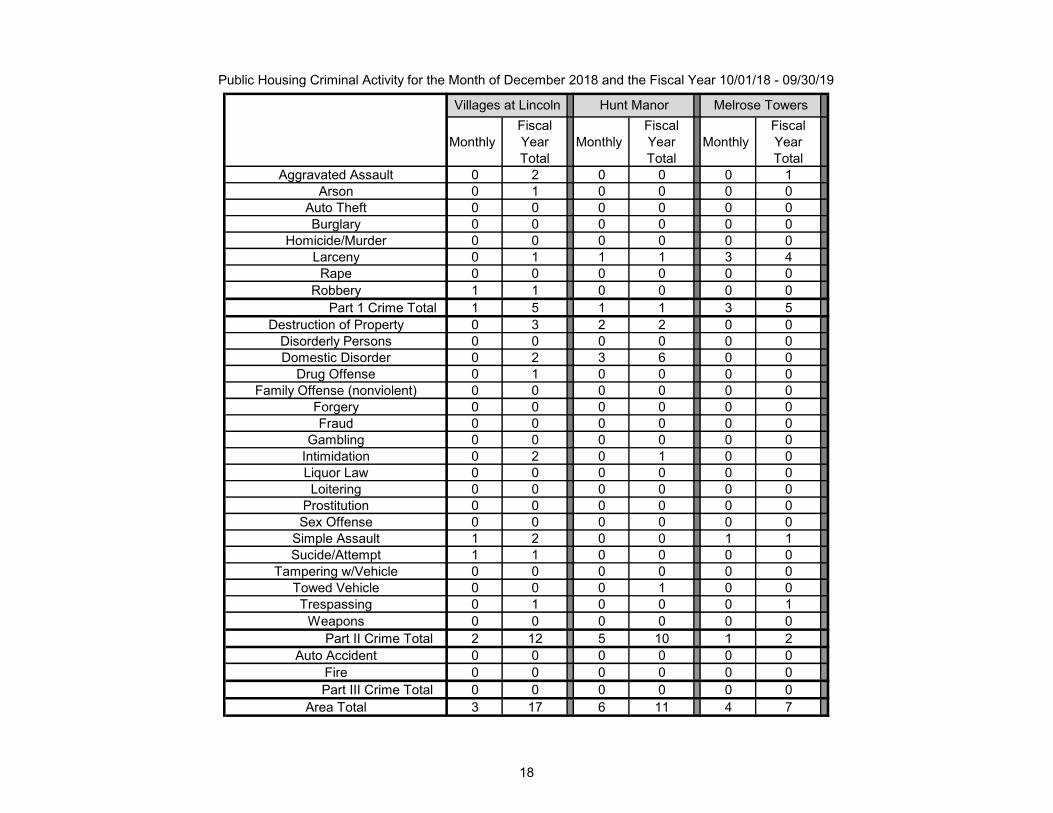
Public Housing Criminal Activity for the Month of December 2018 and the Fiscal Year 10/01/18 - 09/30/19
Aggravated AssaultArson
Auto TheftBurglary
Homicide/MurderLarceny
RapeRobbery
Part 1 Crime Total Destruction of Property
Disorderly PersonsDomestic Disorder
Drug OffenseFamily Offense (nonviolent)
ForgeryFraud
GamblingIntimidationLiquor LawLoitering
ProstitutionSex Offense
Simple AssaultSucide/Attempt
Tampering w/VehicleTowed VehicleTrespassing
WeaponsPart II Crime Total
Auto AccidentFirePart III Crime Total
Area Total
Monthly
Fiscal Year Total
MonthlyFiscal Year Total
MonthlyFiscal Year Total
0 2 0 0 0 10 1 0 0 0 00 0 0 0 0 00 0 0 0 0 00 0 0 0 0 00 1 1 1 3 40 0 0 0 0 01 1 0 0 0 01 5 1 1 3 50 3 2 2 0 00 0 0 0 0 00 2 3 6 0 00 1 0 0 0 00 0 0 0 0 00 0 0 0 0 00 0 0 0 0 00 0 0 0 0 00 2 0 1 0 00 0 0 0 0 00 0 0 0 0 00 0 0 0 0 00 0 0 0 0 01 2 0 0 1 11 1 0 0 0 00 0 0 0 0 00 0 0 1 0 00 1 0 0 0 10 0 0 0 0 02 12 5 10 1 20 0 0 0 0 00 0 0 0 0 00 0 0 0 0 03 17 6 11 4 7
Villages at Lincoln Hunt Manor Melrose Towers
18

Public Housing Community vs. Site - Part 1 and Part II Crimes Percentage - December 2018
Part I Crime Community Site Community Site
Jamestown Place 0.0088 0.0133 151.59% 0.0522 0.0467 89.37% 0.0200 133.33% 0.0281 85.82%
Morningside Manor 0.0088 0.0095 108.28% 0.0282 0.0095 33.81% 0.0000 - - 0.0281 0.24%
Indian Rock Village 0.0088 0.0000 0.00% 0.0282 0.0375 133.13% 0.0000 - - 0.0281 0.24%
Bluestone 0.0094 0.0000 0.00% 0.0288 0.0263 91.22% 0.0263 0.06% 0.0301 -4.16%
Lansdowne Park 0.0067 0.0233 349.56% 0.0219 0.0600 273.45% 0.0533 12.57% 0.0218 0.65%
Villages at Lincoln 0.0067 0.0061 90.80% 0.0219 0.0303 138.11% 0.0061 396.77% 0.0218 0.65%
Hunt Manor 0.0067 0.0104 156.05% 0.0219 0.0104 47.47% 0.0104 0% - 0.0218 0.65%
Melrose Towers 0.0067 0.0142 212.00% 0.0219 0.0236 107.49% 0.0094 150.90% 0.0218 0.65%
Part II Crime Community Site Community Site
Jamestown Place 0.0217 0.0333 153.54% 0.0669 0.1400 209.23% 0.2133 -34.36% 0.0730 -8.34%
Morningside Manor 0.0217 0.0000 0.00% 0.0669 0.0095 14.23% 0.0381 -75.00% 0.0730 -8.34%
Indian Rock Village 0.0217 0.0000 0.00% 0.0669 0.0500 74.73% 0.0750 -33.33% 0.0730 -8.34%
Bluestone 0.0153 0.0132 86.26% 0.0483 0.0789 163.35% 0.1053 -25.03% 0.0506 -4.48%
Lansdowne Park 0.0197 0.0400 203.10% 0.0639 0.1533 239.93% 0.1600 -4.17% 0.0600 6.51%
Villages at Lincoln 0.0197 0.0121 61.55% 0.0639 0.0727 113.80% 0.1152 -36.87% 0.0600 6.51%
Hunt Manor 0.0197 0.0521 264.45% 0.0639 0.1042 162.99% 0.1563 -33.35% 0.0600 6.51%
Melrose Towers 0.0197 0.0047 23.95% 0.0639 0.0094 14.76% 0.0189 -50.08% 0.0600 6.51%
Site Rate YTD
Compared to
prior YTD
Site No. Per
Household
prior YTD
Community
No. Per
Household
prior YTD
Community
Rate YTD
Compared to
prior YTD
Site Rate YTD
Compared to
prior YTD
Community
No. Per
Household
prior YTD
Community
Rate YTD
Compared to
prior YTD
Site No. Per
Household
prior YTD
No. Per Household No. Per Household
MONTH YEAR TO DATE
No. Per Household No. Per Household
MONTH YEAR TO DATE
Site Rate
Compared to
Community
Site Rate
Compared to
Community
Site Rate
Compared to
Community
Site Rate
Compared to
Community
19
SECTION 8 PROGRAMS
MONTHLY OPERATIONS REPORT
DECEMBER 2018
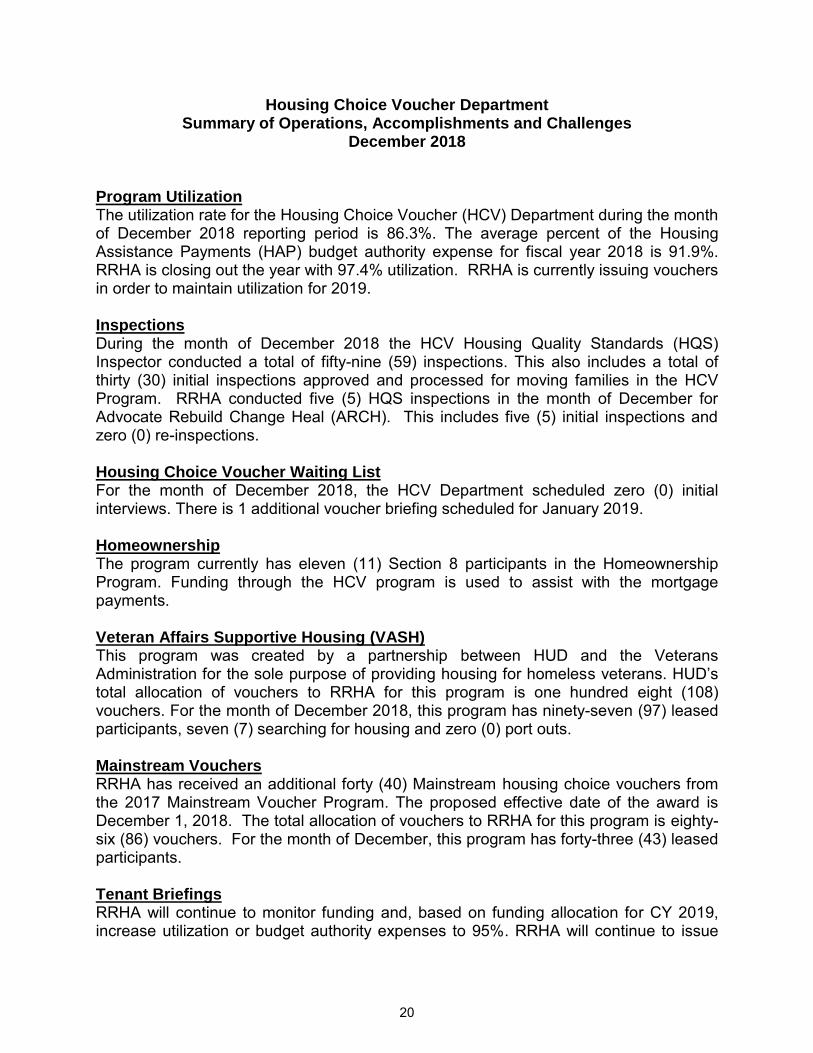
Housing Choice Voucher Department Summary of Operations, Accomplishments and Challenges
December 2018
Program Utilization The utilization rate for the Housing Choice Voucher (HCV) Department during the month of December 2018 reporting period is 86.3%. The average percent of the Housing Assistance Payments (HAP) budget authority expense for fiscal year 2018 is 91.9%. RRHA is closing out the year with 97.4% utilization. RRHA is currently issuing vouchers in order to maintain utilization for 2019. Inspections During the month of December 2018 the HCV Housing Quality Standards (HQS) Inspector conducted a total of fifty-nine (59) inspections. This also includes a total of thirty (30) initial inspections approved and processed for moving families in the HCV Program. RRHA conducted five (5) HQS inspections in the month of December for Advocate Rebuild Change Heal (ARCH). This includes five (5) initial inspections and zero (0) re-inspections. Housing Choice Voucher Waiting List For the month of December 2018, the HCV Department scheduled zero (0) initial interviews. There is 1 additional voucher briefing scheduled for January 2019. Homeownership The program currently has eleven (11) Section 8 participants in the Homeownership Program. Funding through the HCV program is used to assist with the mortgage payments. Veteran Affairs Supportive Housing (VASH) This program was created by a partnership between HUD and the Veterans Administration for the sole purpose of providing housing for homeless veterans. HUD’s total allocation of vouchers to RRHA for this program is one hundred eight (108) vouchers. For the month of December 2018, this program has ninety-seven (97) leased participants, seven (7) searching for housing and zero (0) port outs. Mainstream Vouchers RRHA has received an additional forty (40) Mainstream housing choice vouchers from the 2017 Mainstream Voucher Program. The proposed effective date of the award is December 1, 2018. The total allocation of vouchers to RRHA for this program is eighty-six (86) vouchers. For the month of December, this program has forty-three (43) leased participants. Tenant Briefings RRHA will continue to monitor funding and, based on funding allocation for CY 2019, increase utilization or budget authority expenses to 95%. RRHA will continue to issue
20
HUD-VASH vouchers that were awarded to RRHA in 2015, 2016 & 2018. The HCV Client Specialists provided customer service to four hundred forty-one (441) HCV participants/owners during the month of December 2018. This number represents scheduled appointments and walk-in participants such as landlords and HCV clients to sign leases and contracts or to drop off paperwork. Landlord Briefings The Section 8 staff has daily contact with current and prospective landlords in regards to describing and answering questions concerning the HCV Program. In addition, RRHA continues to offer support to our HCV Landlords with any questions they may have regarding the Landlord Portal. Voucher Issuance Briefings The Housing Choice Voucher Department conducted one (1) voucher briefing for the month of December 2018. Family Unification Program (FUP) HUD’s Family Unification Program focuses on preventing family separation due to homelessness and easing the transition to adulthood for aging-out youth in Foster Care. A total of eighty-one (81) vouchers have been allocated to the City of Roanoke Redevelopment and Housing Authority to serve this population. All referrals for the program come through the Roanoke City and Roanoke County Departments of Social Services (DSS). Currently, there are fifty-one (51) families under lease.
21
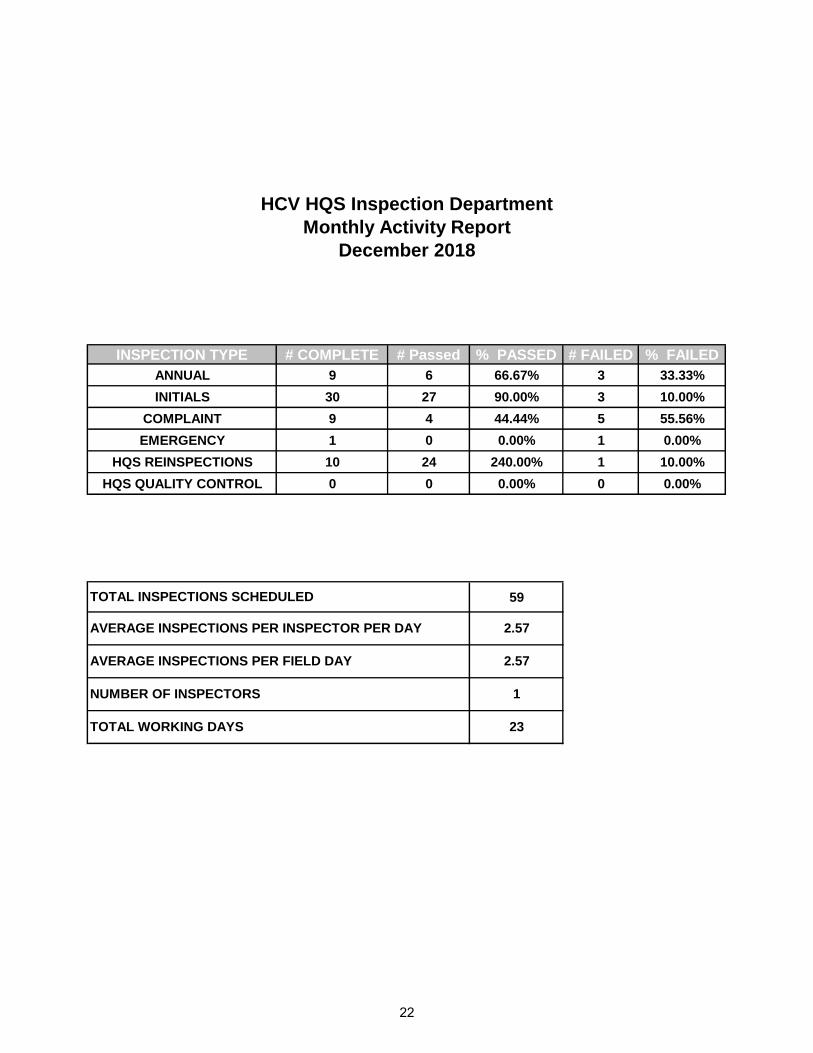
INSPECTION TYPE # COMPLETE # Passed % PASSED # FAILED % FAILED
ANNUAL 9 6 66.67% 3 33.33%
INITIALS 30 27 90.00% 3 10.00%
COMPLAINT 9 4 44.44% 5 55.56%
EMERGENCY 1 0 0.00% 1 0.00%
HQS REINSPECTIONS 10 24 240.00% 1 10.00%
HQS QUALITY CONTROL 0 0 0.00% 0 0.00%
59
TOTAL WORKING DAYS 23
HCV HQS Inspection Department
Monthly Activity Report
December 2018
TOTAL INSPECTIONS SCHEDULED
AVERAGE INSPECTIONS PER INSPECTOR PER DAY 2.57
AVERAGE INSPECTIONS PER FIELD DAY 2.57
NUMBER OF INSPECTORS 1
22
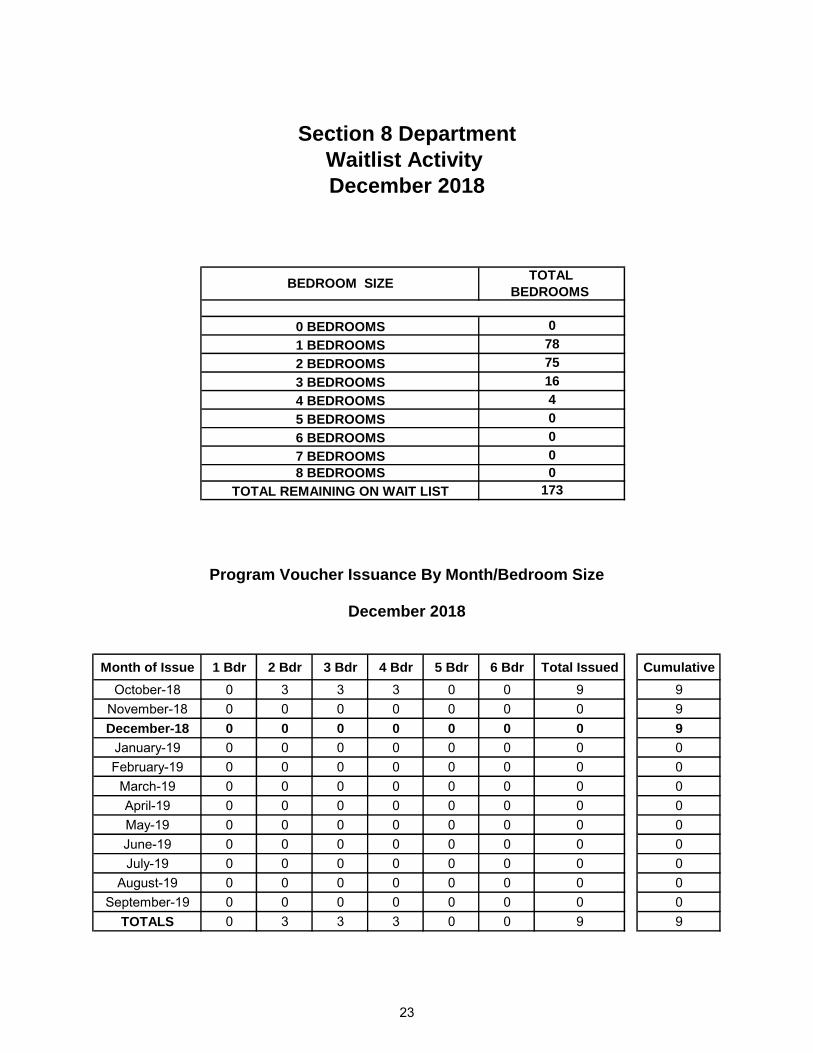
TOTAL
BEDROOMS
Month of Issue 1 Bdr 2 Bdr 3 Bdr 4 Bdr 5 Bdr 6 Bdr Total Issued Cumulative
October-18 0 3 3 3 0 0 9 9November-18 0 0 0 0 0 0 0 9December-18 0 0 0 0 0 0 0 9
January-19 0 0 0 0 0 0 0 0February-19 0 0 0 0 0 0 0 0
March-19 0 0 0 0 0 0 0 0April-19 0 0 0 0 0 0 0 0May-19 0 0 0 0 0 0 0 0June-19 0 0 0 0 0 0 0 0July-19 0 0 0 0 0 0 0 0
August-19 0 0 0 0 0 0 0 0September-19 0 0 0 0 0 0 0 0
TOTALS 0 3 3 3 0 0 9 9
Section 8 Department
Waitlist Activity
December 2018
December 2018
75
0
173
0
16
4
05 BEDROOMS
8 BEDROOMS
Program Voucher Issuance By Month/Bedroom Size
4 BEDROOMS
0
TOTAL REMAINING ON WAIT LIST
7 BEDROOMS
6 BEDROOMS
2 BEDROOMS
3 BEDROOMS
BEDROOM SIZE
0
78
0 BEDROOMS
1 BEDROOMS
23

October 2018 41 0 0 0 0 0 22November 2018 0 0 0 0 3 3 12December 2018 0 0 0 0 0 0 5
January 2019 0 0 0 0 0 0 0February 2019 0 0 0 0 0 0 0
March 2019 0 0 0 0 0 0 0 April 2019 0 0 0 0 0 0 0May 2019 0 0 0 0 0 0 0June 2019 0 0 0 0 0 0 0 July 2019 0 0 0 0 0 0 0
August 2019 0 0 0 0 0 0 0 September 2019 0 0 0 0 0 0 0
TOTALS 0 0 0 0 0 0 0
Meanings
Waitlist Applicant
December 2018
Month Notes
Number
of Other
WD
Number
of PC
Number
of Mail
Ret.
Number
of NS WD
Number of
Files
Pending
Number
Okay to
Issue
Number
Selected /
Interviewed
Off Wait-list
WD Other = Withdrawn for owing debt, criminal history, or over income, etc.
NS = No Show
Pending = Still waiting on information for qualification
VB = Voucher Briefing
WD = Withdrawn
WD Mail = Withdrawn for Mail Returned
PC = Preference Change, goes back on wait list
24

PROGRAM NAME UNIT MONTHS Jan-18 Feb-18 Mar-18 Apr-18 May-18 Jun-18 Jul-18 Aug-18 Sep-18 Oct-18 Nov-18 Dec-18
HOUSING CHOICE ALLOCATED 1,888 1,888 1,888 1,888 1,888 1,888 1,888 1,888 1,888 1,888 1,888 1,888
VOUCHERS LEASED 1,711 1,708 1,701 1,697 1,686 1,682 1,676 1,655 1,648 1,635 1,641 1,640
MAINSTREAM ALLOCATED 46 46 46 46 46 46 46 46 46 46 86 46
LEASED 41 41 39 39 39 39 38 42 45 42 42 43
VASH (35) ALLOCATED 35 35 35 35 35 35 35 35 35 35 35 35
LEASED 32 34 34 34 34 35 35 35 35 34 34 33
VASH (25) ALLOCATED 25 25 25 25 25 25 25 25 25 25 25 25
LEASED 25 25 25 25 25 24 24 24 24 24 24 24
FUP (31) ALLOCATED 31 31 31 31 31 31 31 31 31 31 31 31
LEASED 20 20 20 19 19 19 19 19 19 18 17 17
FUP (50) ALLOCATED 50 50 50 50 50 50 50 50 50 50 50 50
LEASED 36 35 35 37 37 37 37 37 36 36 35 34
VASH (10) ALLOCATED 10 10 10 10 10 10 10 10 10 10 10 10
LEASED 8 7 7 7 7 7 8 8 8 9 10 9
VASH (10) B ALLOCATED 10 10 10 10 10 10 10 10 10 10 10 10
LEASED 8 10 10 10 10 9 9 9 8 8 8 8
VASH (10) C ALLOCATED 10 10 10 10 10 10 10 10 10 10 10 10
LEASED 10 8 10 9 9 9 9 9 9 10 9 9
VASH (8) ALLOCATED 8 8 8 8 8 8 8 8 8 8 8 8
LEASED 6 6 6 7 7 7 8 8 7 8 8 8
VASH (5) ALLOCATED 5 5 5 5 5 5 5 5
LEASED 0 0 0 0 0 3 3 3 3 5 5 5
VASH (5) B ALLOCATED 5 5 5
LEASED 0 0 0 0 0 0 0 0 0 0 1 1
SECTION 8 MONTHLY STATISTIC REPORT (CY)
25
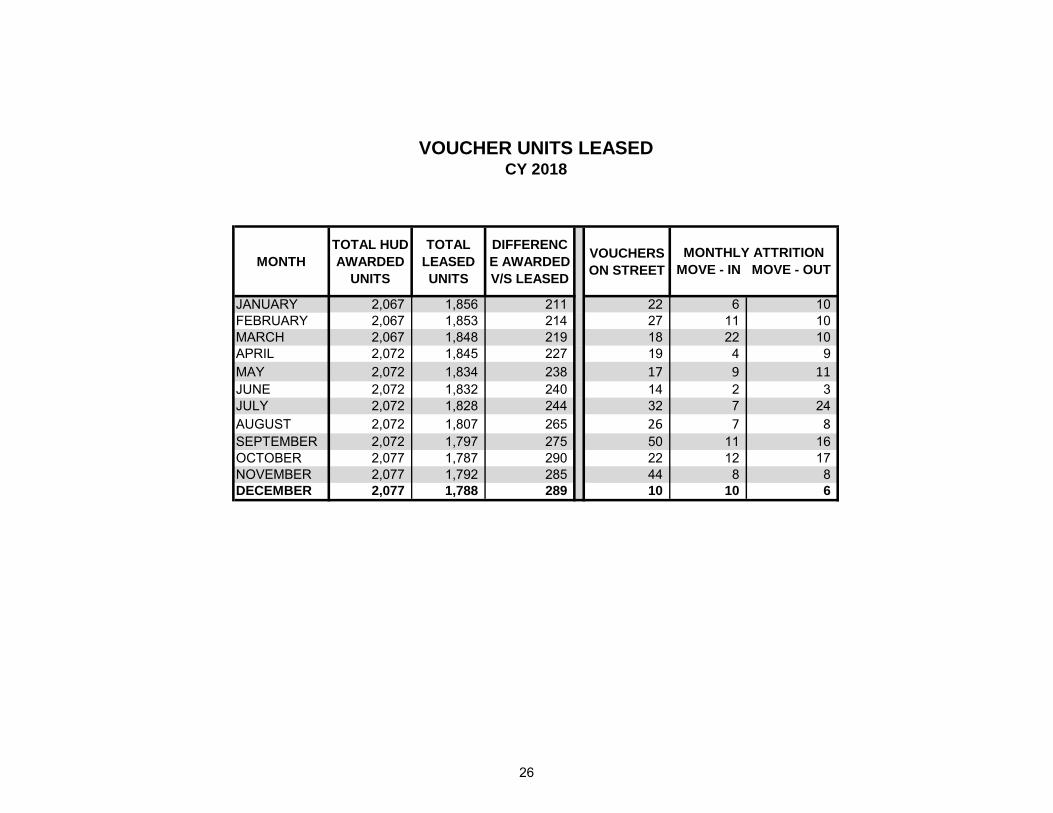
MONTH
TOTAL HUD
AWARDED
UNITS
TOTAL
LEASED
UNITS
DIFFERENC
E AWARDED
V/S LEASED
VOUCHERS
ON STREET
JANUARY 2,067 1,856 211 22 6 10 FEBRUARY 2,067 1,853 214 27 11 10 MARCH 2,067 1,848 219 18 22 10 APRIL 2,072 1,845 227 19 4 9 MAY 2,072 1,834 238 17 9 11 JUNE 2,072 1,832 240 14 2 3 JULY 2,072 1,828 244 32 7 24 AUGUST 2,072 1,807 265 26 7 8 SEPTEMBER 2,072 1,797 275 50 11 16 OCTOBER 2,077 1,787 290 22 12 17 NOVEMBER 2,077 1,792 285 44 8 8 DECEMBER 2,077 1,788 289 10 10 6
MONTHLY ATTRITION
MOVE - IN MOVE - OUT
VOUCHER UNITS LEASEDCY 2018
26
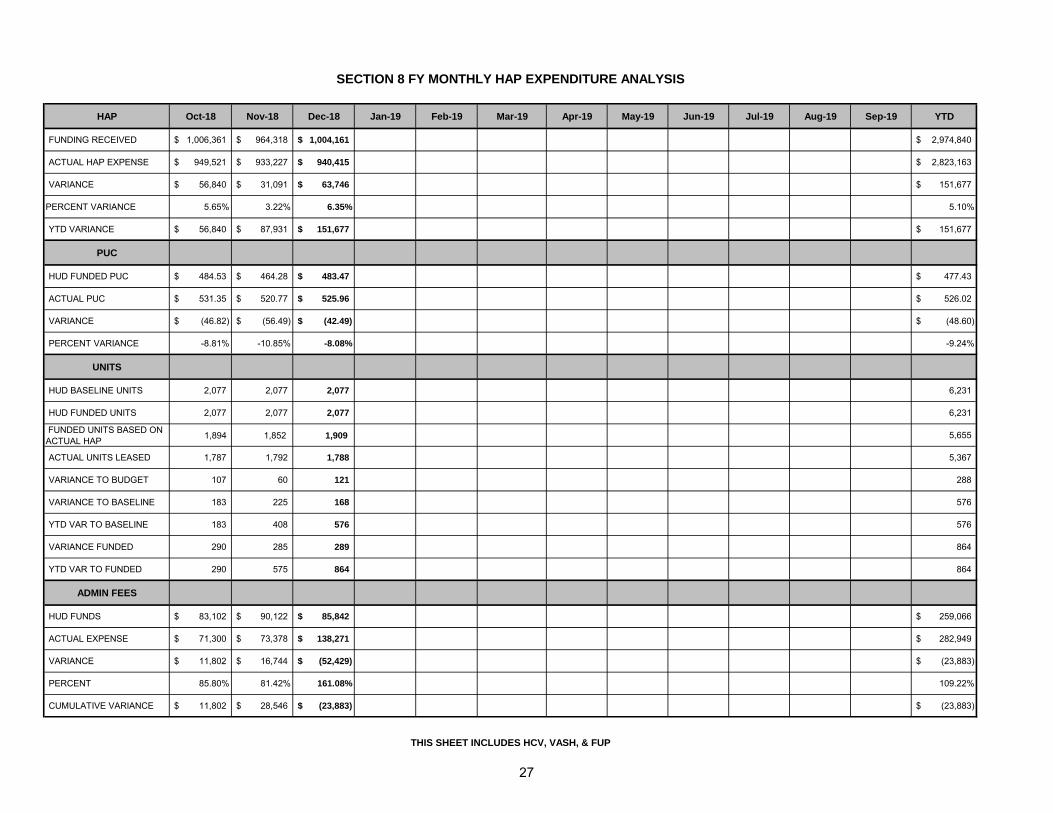
HAP Oct-18 Nov-18 Dec-18 Jan-19 Feb-19 Mar-19 Apr-19 May-19 Jun-19 Jul-19 Aug-19 Sep-19 YTD
FUNDING RECEIVED 1,006,361$ 964,318$ 1,004,161$ 2,974,840$
ACTUAL HAP EXPENSE 949,521$ 933,227$ 940,415$ 2,823,163$
VARIANCE 56,840$ 31,091$ 63,746$ 151,677$
PERCENT VARIANCE 5.65% 3.22% 6.35% 5.10%
YTD VARIANCE 56,840$ 87,931$ 151,677$ 151,677$
PUC
HUD FUNDED PUC 484.53$ 464.28$ 483.47$ 477.43$
ACTUAL PUC 531.35$ 520.77$ 525.96$ 526.02$
VARIANCE (46.82)$ (56.49)$ (42.49)$ (48.60)$
PERCENT VARIANCE -8.81% -10.85% -8.08% -9.24%
UNITS
HUD BASELINE UNITS 2,077 2,077 2,077 6,231
HUD FUNDED UNITS 2,077 2,077 2,077 6,231
FUNDED UNITS BASED ON ACTUAL HAP 1,894 1,852 1,909 5,655
ACTUAL UNITS LEASED 1,787 1,792 1,788 5,367
VARIANCE TO BUDGET 107 60 121 288
VARIANCE TO BASELINE 183 225 168 576
YTD VAR TO BASELINE 183 408 576 576
VARIANCE FUNDED 290 285 289 864
YTD VAR TO FUNDED 290 575 864 864
ADMIN FEES
HUD FUNDS 83,102$ 90,122$ 85,842$ 259,066$
ACTUAL EXPENSE 71,300$ 73,378$ 138,271$ 282,949$
VARIANCE 11,802$ 16,744$ (52,429)$ (23,883)$
PERCENT 85.80% 81.42% 161.08% 109.22%
CUMULATIVE VARIANCE 11,802$ 28,546$ (23,883)$ (23,883)$
SECTION 8 FY MONTHLY HAP EXPENDITURE ANALYSIS
THIS SHEET INCLUDES HCV, VASH, & FUP
27
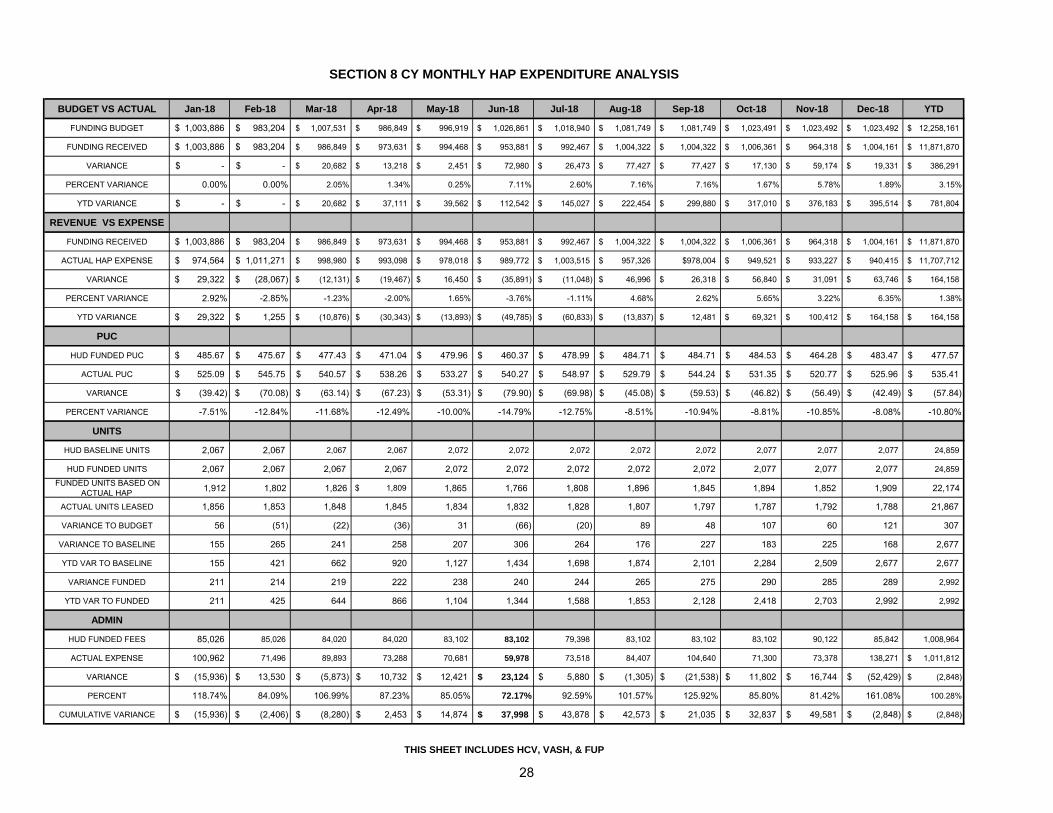
BUDGET VS ACTUAL Jan-18 Feb-18 Mar-18 Apr-18 May-18 Jun-18 Jul-18 Aug-18 Sep-18 Oct-18 Nov-18 Dec-18 YTD
FUNDING BUDGET 1,003,886$ 983,204$ 1,007,531$ 986,849$ 996,919$ 1,026,861$ 1,018,940$ 1,081,749$ 1,081,749$ 1,023,491$ 1,023,492$ 1,023,492$ 12,258,161$
FUNDING RECEIVED 1,003,886$ 983,204$ 986,849$ 973,631$ 994,468$ 953,881$ 992,467$ 1,004,322$ 1,004,322$ 1,006,361$ 964,318$ 1,004,161$ 11,871,870$
VARIANCE -$ -$ 20,682$ 13,218$ 2,451$ 72,980$ 26,473$ 77,427$ 77,427$ 17,130$ 59,174$ 19,331$ 386,291$
PERCENT VARIANCE 0.00% 0.00% 2.05% 1.34% 0.25% 7.11% 2.60% 7.16% 7.16% 1.67% 5.78% 1.89% 3.15%
YTD VARIANCE -$ -$ 20,682$ 37,111$ 39,562$ 112,542$ 145,027$ 222,454$ 299,880$ 317,010$ 376,183$ 395,514$ 781,804$
REVENUE VS EXPENSE
FUNDING RECEIVED 1,003,886$ 983,204$ 986,849$ 973,631$ 994,468$ 953,881$ 992,467$ 1,004,322$ 1,004,322$ 1,006,361$ 964,318$ 1,004,161$ 11,871,870$
ACTUAL HAP EXPENSE 974,564$ 1,011,271$ 998,980$ 993,098$ 978,018$ 989,772$ 1,003,515$ 957,326$ $978,004 949,521$ 933,227$ 940,415$ 11,707,712$
VARIANCE 29,322$ (28,067)$ (12,131)$ (19,467)$ 16,450$ (35,891)$ (11,048)$ 46,996$ 26,318$ 56,840$ 31,091$ 63,746$ 164,158$
PERCENT VARIANCE 2.92% -2.85% -1.23% -2.00% 1.65% -3.76% -1.11% 4.68% 2.62% 5.65% 3.22% 6.35% 1.38%
YTD VARIANCE 29,322$ 1,255$ (10,876)$ (30,343)$ (13,893)$ (49,785)$ (60,833)$ (13,837)$ 12,481$ 69,321$ 100,412$ 164,158$ 164,158$
PUC
HUD FUNDED PUC 485.67$ 475.67$ 477.43$ 471.04$ 479.96$ 460.37$ 478.99$ 484.71$ 484.71$ 484.53$ 464.28$ 483.47$ 477.57$
ACTUAL PUC 525.09$ 545.75$ 540.57$ 538.26$ 533.27$ 540.27$ 548.97$ 529.79$ 544.24$ 531.35$ 520.77$ 525.96$ 535.41$
VARIANCE (39.42)$ (70.08)$ (63.14)$ (67.23)$ (53.31)$ (79.90)$ (69.98)$ (45.08)$ (59.53)$ (46.82)$ (56.49)$ (42.49)$ (57.84)$
PERCENT VARIANCE -7.51% -12.84% -11.68% -12.49% -10.00% -14.79% -12.75% -8.51% -10.94% -8.81% -10.85% -8.08% -10.80%
UNITS
HUD BASELINE UNITS 2,067 2,067 2,067 2,067 2,072 2,072 2,072 2,072 2,072 2,077 2,077 2,077 24,859
HUD FUNDED UNITS 2,067 2,067 2,067 2,067 2,072 2,072 2,072 2,072 2,072 2,077 2,077 2,077 24,859
FUNDED UNITS BASED ON ACTUAL HAP 1,912 1,802 1,826 $ 1,809 1,865 1,766 1,808 1,896 1,845 1,894 1,852 1,909 22,174
ACTUAL UNITS LEASED 1,856 1,853 1,848 1,845 1,834 1,832 1,828 1,807 1,797 1,787 1,792 1,788 21,867
VARIANCE TO BUDGET 56 (51) (22) (36) 31 (66) (20) 89 48 107 60 121 307
VARIANCE TO BASELINE 155 265 241 258 207 306 264 176 227 183 225 168 2,677
YTD VAR TO BASELINE 155 421 662 920 1,127 1,434 1,698 1,874 2,101 2,284 2,509 2,677 2,677
VARIANCE FUNDED 211 214 219 222 238 240 244 265 275 290 285 289 2,992
YTD VAR TO FUNDED 211 425 644 866 1,104 1,344 1,588 1,853 2,128 2,418 2,703 2,992 2,992
ADMIN
HUD FUNDED FEES 85,026 85,026 84,020 84,020 83,102 83,102 79,398 83,102 83,102 83,102 90,122 85,842 1,008,964
ACTUAL EXPENSE 100,962 71,496 89,893 73,288 70,681 59,978 73,518 84,407 104,640 71,300 73,378 138,271 1,011,812$
VARIANCE (15,936)$ 13,530$ (5,873)$ 10,732$ 12,421$ 23,124$ 5,880$ (1,305)$ (21,538)$ 11,802$ 16,744$ (52,429)$ (2,848)$
PERCENT 118.74% 84.09% 106.99% 87.23% 85.05% 72.17% 92.59% 101.57% 125.92% 85.80% 81.42% 161.08% 100.28%
CUMULATIVE VARIANCE (15,936)$ (2,406)$ (8,280)$ 2,453$ 14,874$ 37,998$ 43,878$ 42,573$ 21,035$ 32,837$ 49,581$ (2,848)$ (2,848)$
THIS SHEET INCLUDES HCV, VASH, & FUP
SECTION 8 CY MONTHLY HAP EXPENDITURE ANALYSIS
28
RESIDENT SERVICES REPORT
DECEMBER 2018

Grant Period- 01/01/18 - 12/31/18 December 2018
Coordinators: Vanessa Mills, Greg Goodman
Current Number of Participants - 161 Number with Escrow Accounts - 66
Total amount in Escrow - $135,847.41 FSS Program Terminations - 1 FSS Program Graduations - 0
2017 Family Self-Sufficiency (Grant Funded )
10
8.0
0%
92
.57
%
15
0.0
0%
69
.00
%
60
.00
%
20
0.0
0%
10
0.0
0%
0.0
0%
0.0
0%
17
5.0
0%
25
.00
%
12
0.0
0%
20
0.0
0%
0.0
0%
11
3.3
3%
50
.00
%
86
.67
%
15
.00
%
25
.00
% 1
08
.57
%
63
.33
%
63
.33
%
73
.33
%
60
.00
%
75
.00
%
87
.50
%
48
.00
%
0.0
0%
14
0.0
0%
10
0.0
0%
10
.00
%
75
.00
%
0.0
0%
0.0
0%
16
0.0
0%
16
0.0
0%
10
0.0
0%
0.0
0%
10
0.0
0%
60
0.0
0%
0.0
0%
10
0.0
0%
10
0.0
0%
0.00%
100.00%
200.00%
300.00%
400.00%
500.00%
600.00%
700.00%
29

Program Manager: Yvonne Thomas Case Managers: Sarah Bridgman, Sylvia Williams, Nick McCord Grant Period: 4/2/2015 - 4/1/2019
Percent of Work-able Residents Who Are Employed 51.24%
Percent of Current Residents with a Jobs Plus Assessment and Who Are Employed 56.71%
Percent of Work-able Residents with a Jobs Plus Assessment Employed at Living Wage 2.47%
Jobs Plus Monthly Report - December 20181
64
.29
%
11
9.0
0%
11
4.0
0%
11
8.0
0%
96
.00
%
65
.00
%
72
.92
%
10
4.3
8%
25
2.5
0%
71
.00
%
23
4.2
9%
82
.50
%
4.0
0%
11
2.5
0%
15
0.0
0%
68
.80
%
0.0
0%
11
.67
%
25
.00
%
7.5
0%
0.0
0%
16
.67
%
10
2.5
0%
20
.00
%
20
.00
%
58
.33
%
15
0.0
0%
16
1.5
0%
18
8.0
0%
0.00%
50.00%
100.00%
150.00%
200.00%
250.00%
300.00%
30

Program Manager: Yvonne Thomas Case Managers: Sarah Bridgman, Sylvia Williams, Nick McCord Grant Period: 4/2/2015 - 4/1/2019
Percent of Work-able Residents Who Are Employed 51.24%
Percent of Current Residents with a Jobs Plus Assessment and Who Are Employed 56.71%
Percent of Work-able Residents with a Jobs Plus Assessment Employed at Living Wage 2.47%
Jobs Plus Quarterly Report October - December 2018
28.00%
130.00%
200.00% 191.43%
360.00%
32.00%
0
0.5
1
1.5
2
2.5
3
3.5
4
Work-able Residents Who Connectedwith a Jobs Plus Community Coach (75)
Adults Who Attended a Jobs Plus Event(40)
Changed From Part-Time to Full-TimeEmployment (5)
Participants Continuously Employed for90 Days or Longer (35)
Participants Continuously Employed for180 Days or Longer (15)
Participants Employed at AssessmentDate and Still Employed (50)
31
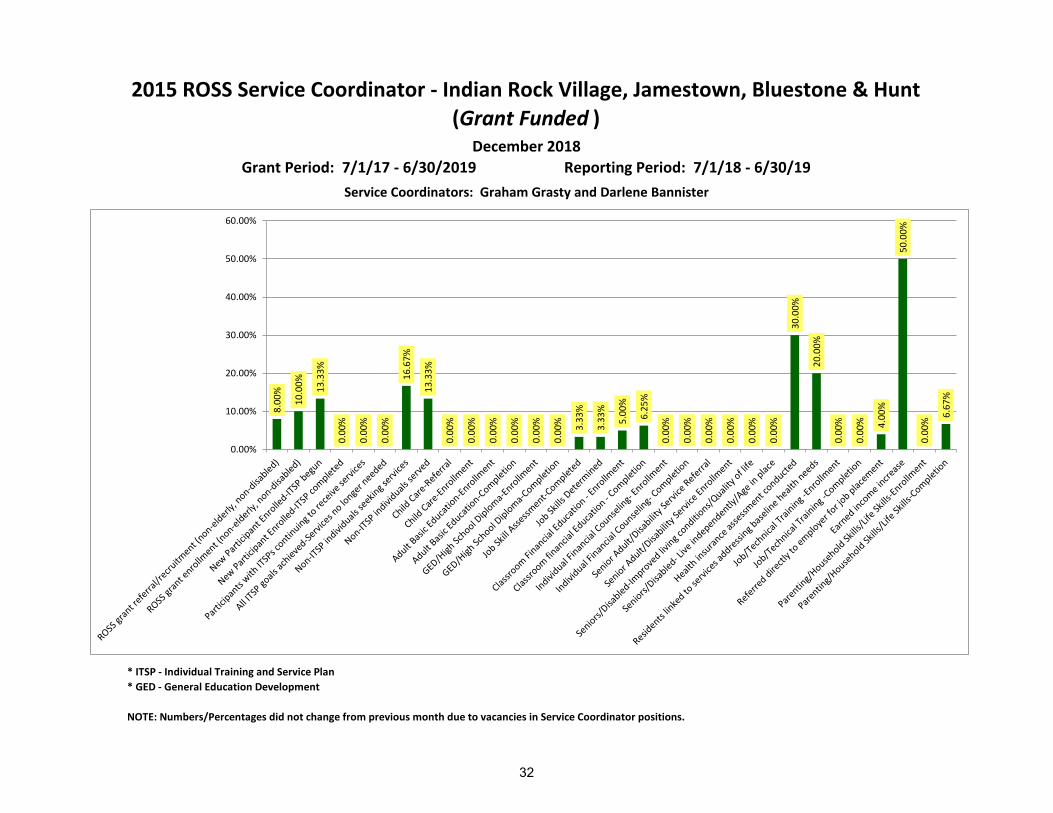
* ITSP - Individual Training and Service Plan
* GED - General Education Development
NOTE: Numbers/Percentages did not change from previous month due to vacancies in Service Coordinator positions.
2015 ROSS Service Coordinator - Indian Rock Village, Jamestown, Bluestone & Hunt
(Grant Funded )December 2018
Grant Period: 7/1/17 - 6/30/2019 Reporting Period: 7/1/18 - 6/30/19
Service Coordinators: Graham Grasty and Darlene Bannister
8.0
0%
10
.00
%
13
.33
%
0.0
0%
0.0
0%
0.0
0%
16
.67
%
13
.33
%
0.0
0%
0.0
0%
0.0
0%
0.0
0%
0.0
0%
0.0
0%
3.3
3%
3.3
3%
5.0
0%
6.2
5%
0.0
0%
0.0
0%
0.0
0%
0.0
0%
0.0
0%
0.0
0%
30
.00
%
20
.00
%
0.0
0%
0.0
0%
4.0
0%
50
.00
%
0.0
0%
6.6
7%
0.00%
10.00%
20.00%
30.00%
40.00%
50.00%
60.00%
32
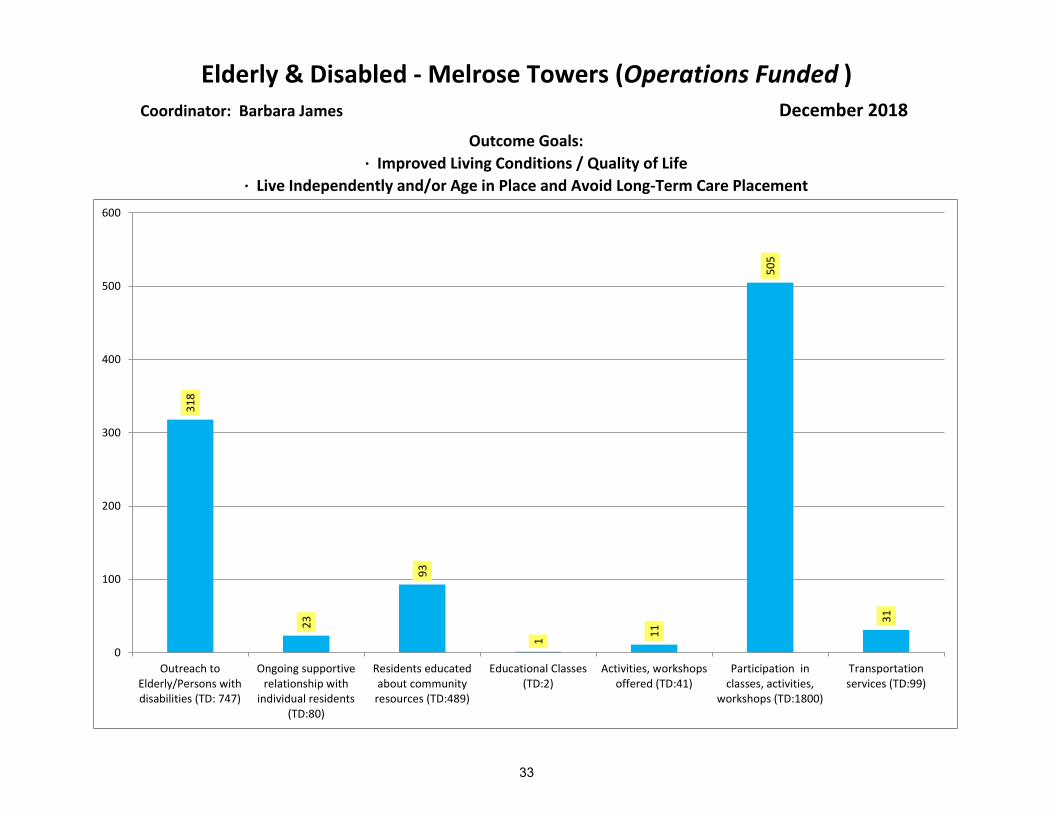
Coordinator: Barbara James December 2018
Elderly & Disabled - Melrose Towers (Operations Funded )
Outcome Goals:
· Improved Living Conditions / Quality of Life
· Live Independently and/or Age in Place and Avoid Long-Term Care Placement3
18
23
93
1 1
1
50
5
31
0
100
200
300
400
500
600
Outreach toElderly/Persons withdisabilities (TD: 747)
Ongoing supportiverelationship with
individual residents(TD:80)
Residents educatedabout community
resources (TD:489)
Educational Classes(TD:2)
Activities, workshopsoffered (TD:41)
Participation inclasses, activities,
workshops (TD:1800)
Transportationservices (TD:99)
33
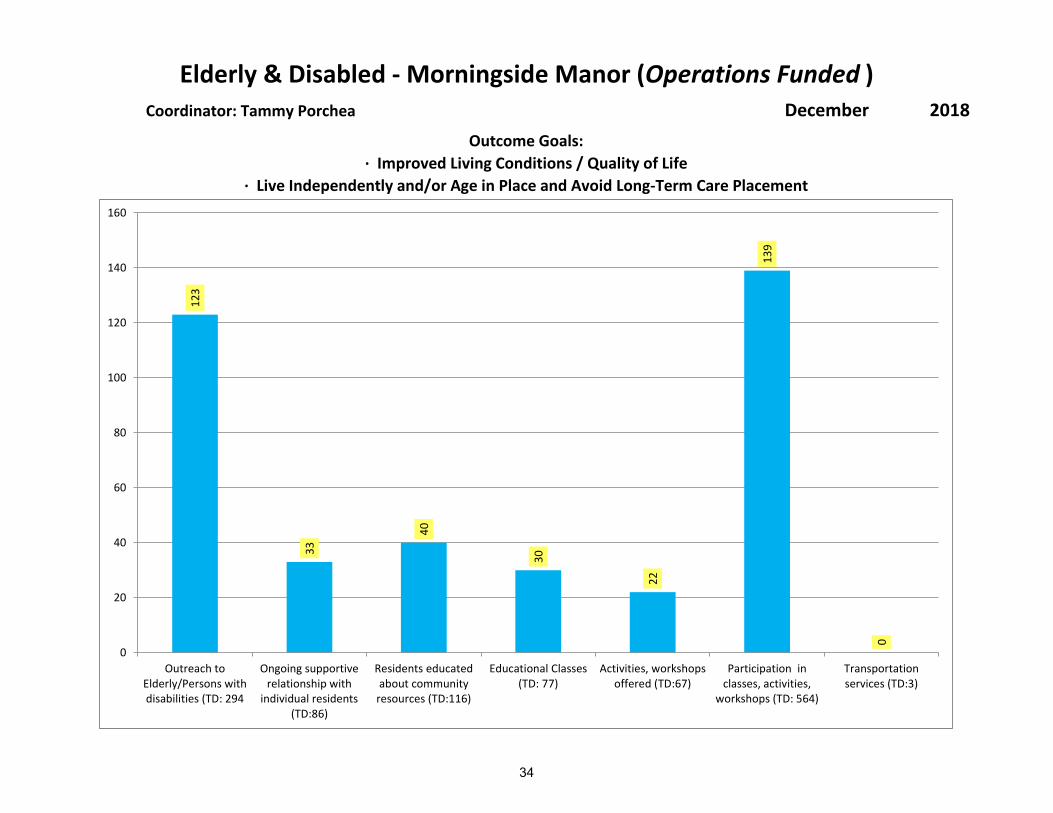
Coordinator: Tammy Porchea December 2018
Elderly & Disabled - Morningside Manor (Operations Funded )
Outcome Goals:
· Improved Living Conditions / Quality of Life
· Live Independently and/or Age in Place and Avoid Long-Term Care Placement1
23
33
40
30
22
13
9
0
0
20
40
60
80
100
120
140
160
Outreach toElderly/Persons withdisabilities (TD: 294
Ongoing supportiverelationship with
individual residents(TD:86)
Residents educatedabout community
resources (TD:116)
Educational Classes(TD: 77)
Activities, workshopsoffered (TD:67)
Participation inclasses, activities,
workshops (TD: 564)
Transportationservices (TD:3)
34