city of raleigh...world of bluegrass conference and events. the 2016 world of bluegrass event was...
TRANSCRIPT
CITY OF RALEIGHNORTH CAROLINA
For The Fiscal Year Ended June 30, 2016
Comprehensive Annual Financial Report
On the cover — the banjostand
Pictured here at the Raleigh Convention Center Plaza is Bruno Luchessi’s iconic Sir Walter Raleigh sculpture, enhanced by artist Bland Hoke’s temporary public art piece, Banjostand. Commissioned by the Raleigh Arts Commission for the City of Raleigh, Banjostand is created from hundreds of cast-off banjo parts and has become a destination place each year for those attending the wildly popular International Bluegrass Music Association’s World of Bluegrass Conference and events.
The 2016 World of Bluegrass event was held in Raleigh from Sept. 27-Oct. 1 and included: the three-day IBMA Business Conference, the International Bluegrass Music Awards Show, Bluegrass Ramble and the two-day PNC presents Wide Open Bluegrass Festival. This year’s World of Bluegrass week was record-breaking with 217,225 people attending the events associated with World of Bluegrass and generating $11.5 million in direct visitor spending.
Photo by Bryan Regan
1
Comprehensive AnnualFinancial Report
For the Fiscal Year Ended June 30, 2016
Prepared by the Finance DepartmentPerry E. James, III
Chief Financial Officer
NORTH CAROLINA

2
3
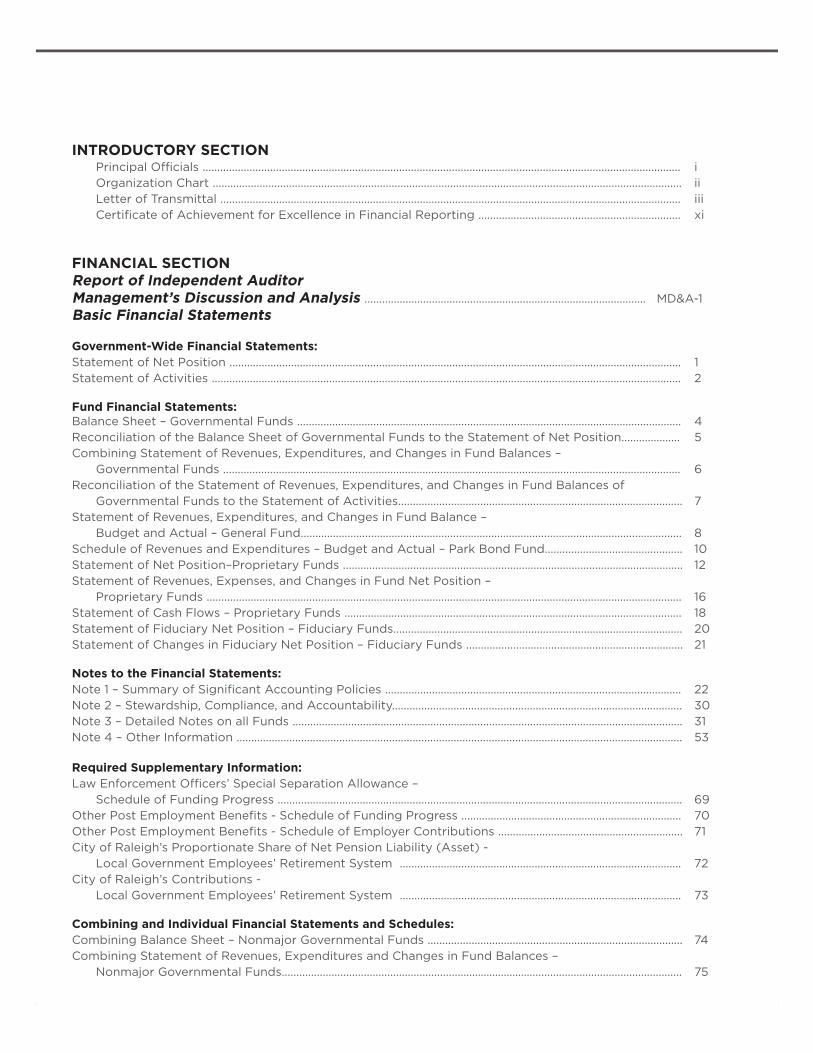
INTRODUCTORY SECTION Principal Officials ................................................................................................................................................................... i Organization Chart ................................................................................................................................................................ ii Letter of Transmittal ............................................................................................................................................................. iii Certificate of Achievement for Excellence in Financial Reporting ..................................................................... xi
FINANCIAL SECTIONReport of Independent AuditorManagement’s Discussion and Analysis ................................................................................................ MD&A-1Basic Financial Statements
Government-Wide Financial Statements: Statement of Net Position .......................................................................................................................................................... 1Statement of Activities ................................................................................................................................................................ 2
Fund Financial Statements: Balance Sheet – Governmental Funds ................................................................................................................................... 4 Reconciliation of the Balance Sheet of Governmental Funds to the Statement of Net Position.................... 5Combining Statement of Revenues, Expenditures, and Changes in Fund Balances – Governmental Funds ............................................................................................................................................................ 6Reconciliation of the Statement of Revenues, Expenditures, and Changes in Fund Balances of Governmental Funds to the Statement of Activities................................................................................................. 7 Statement of Revenues, Expenditures, and Changes in Fund Balance – Budget and Actual – General Fund.................................................................................................................................. 8 Schedule of Revenues and Expenditures – Budget and Actual – Park Bond Fund............................................... 10Statement of Net Position–Proprietary Funds .................................................................................................................... 12Statement of Revenues, Expenses, and Changes in Fund Net Position – Proprietary Funds .................................................................................................................................................................. 16 Statement of Cash Flows – Proprietary Funds ................................................................................................................... 18Statement of Fiduciary Net Position – Fiduciary Funds................................................................................................... 20Statement of Changes in Fiduciary Net Position – Fiduciary Funds .......................................................................... 21
Notes to the Financial Statements:Note 1 – Summary of Significant Accounting Policies ..................................................................................................... 22Note 2 – Stewardship, Compliance, and Accountability................................................................................................... 30Note 3 – Detailed Notes on all Funds ..................................................................................................................................... 31Note 4 – Other Information ........................................................................................................................................................ 53
Required Supplementary Information:Law Enforcement Officers’ Special Separation Allowance – Schedule of Funding Progress .......................................................................................................................................... 69Other Post Employment Benefits - Schedule of Funding Progress ........................................................................... 70Other Post Employment Benefits - Schedule of Employer Contributions ............................................................... 71City of Raleigh’s Proportionate Share of Net Pension Liability (Asset) - Local Government Employees’ Retirement System ................................................................................................ 72City of Raleigh’s Contributions - Local Government Employees’ Retirement System ................................................................................................ 73
Combining and Individual Financial Statements and Schedules:Combining Balance Sheet – Nonmajor Governmental Funds ....................................................................................... 74Combining Statement of Revenues, Expenditures and Changes in Fund Balances – Nonmajor Governmental Funds......................................................................................................................................... 75
Special Revenue Funds:Combining Balance Sheet – Nonmajor Special Revenue Funds ................................................................................... 76Combining Statement of Revenues, Expenditures and Changes in Fund Balances – Nonmajor Special Revenue Funds .................................................................................................................................... 78Schedule of Revenues and Expenditures Compared with Budget: Grants Fund ............................................................................................................................................................................... 80 Housing Bond Fund ............................................................................................................................................................... 81 Community Development Fund ........................................................................................................................................ 82 Disaster Recovery Fund ....................................................................................................................................................... 83 Convention Center Financing Fund ................................................................................................................................. 84 Emergency Telephone System Fund ............................................................................................................................... 85
General Capital Projects Funds: Combining Balance Sheet – Nonmajor Capital Projects Funds .................................................................................... 86Combining Statement of Revenues, Expenditures and Changes in Fund Balances – Nonmajor Capital Projects Funds ..................................................................................................................................... 88Schedule of Revenues and Expenditures Compared with Budget: Street Improvement Fund .................................................................................................................................................... 90 Street Bond Fund .................................................................................................................................................................... 91 Sidewalk Fund .......................................................................................................................................................................... 92 Park Improvement Fund ....................................................................................................................................................... 93 Raleigh Union Station Fund ................................................................................................................................................ 94 Facility Fees Fund ................................................................................................................................................................... 95 Miscellaneous Capital Improvements Fund .................................................................................................................. 96 Walnut Creek Amphitheater Projects Fund .................................................................................................................. 97 Technology Capital Projects Fund ................................................................................................................................... 98 Major Public Facilities Fund................................................................................................................................................. 99
Enterprise Funds: Schedule of Revenues and Expenditures – Budget (Modified Accrual Basis) and Actual: Water and Sewer Fund (major fund): Water and Sewer Operating Fund ........................................................................................................................... 100 Water Capital Projects Fund ...................................................................................................................................... 102 Sewer Capital Projects Fund ...................................................................................................................................... 103 Water and Sewer Revenue Bond Fund ................................................................................................................... 104 Reconciliation of Modified Accrual Basis to Full Accrual Basis-Water and Sewer Funds .................. 105 Convention Center Complex Fund (major fund): Convention Center and Performing Arts Complex Operating Fund ........................................................... 106 Convention Center and Performing Arts Complex Projects Fund ............................................................... 107 Convention Center Complex Capital Projects Fund .......................................................................................... 108 Reconciliation of Modified Accrual Basis to Full Accrual Basis-Convention Center Funds ................ 109 Mass Transit Fund (major fund): Mass Transit Fund............................................................................................................................................................. 110 Reconciliation of Modified Accrual Basis to Full Accrual Basis-Mass Transit Fund ............................... 111 Stormwater Fund (major fund): Stormwater Utility Operating Fund ......................................................................................................................... 112 Stormwater Utility Capital Projects Fund............................................................................................................... 113 Stormwater Utility Bond Fund ................................................................................................................................... 114 Reconciliation of Modified Accrual Basis to Full Accrual Basis-Stormwater Utility Funds ................ 115
5
Parking Fund (major fund): Parking Facilities Operating Fund ............................................................................................................................ 116 Parking Facilities Capital Projects Fund ................................................................................................................. 117 Reconciliation of Modified Accrual Basis to Full Accrual Basis-Parking Facilities Funds ................... 118 Solid Waste Services Fund (major fund): Solid Waste Services Fund .......................................................................................................................................... 119 Reconciliation of Modified Accrual Basis to Full Accrual Basis-Solid Waste Services Funds ........... 120 Internal Service Funds: Combining Statement of Net Position .................................................................................................................................... 121Combining Statement of Revenues, Expenses and Changes in Fund Net Position .............................................. 123Combining Statement of Cash Flows ...................................................................................................................................... 125
Fiduciary Funds: Combining Statement of Net Position – Pension Trust Funds ...................................................................................... 127Combining Statement of Changes in Plan Net Position – Pension Trust Funds ..................................................... 128
Other Schedules: Schedule of Long-Term Obligation Maturities and Debt Service Requirements .................................................... 129Schedule of General Governmental Long-Term Obligations .......................................................................................... 131Schedule of Enterprise Long-Term Obligations .................................................................................................................. 133Schedule of Internal Service Long-Term Obligations ........................................................................................................ 135
STATISTICAL SECTION Net Position by Component – Last Ten Fiscal Years ......................................................................................................... 137 Changes in Net Position – Last Ten Fiscal Years ................................................................................................................. 139Fund Balances, Governmental Funds – Last Ten Fiscal Years ....................................................................................... 143Changes in Fund Balances, Governmental Funds – Last Ten Fiscal Years ................................................................ 145Assessed Value of Taxable Property – Last Ten Fiscal Years ......................................................................................... 147Property Tax Rates – Direct and Overlapping Governments – Last Ten Fiscal Years .......................................... 148Principal Property Taxpayers ..................................................................................................................................................... 149Property Tax Levies and Collections – Last Ten Fiscal Years ......................................................................................... 150Analysis of Current Tax Levy ...................................................................................................................................................... 151Schedule of Ad Valorem Taxes Receivable ........................................................................................................................... 152Ratios of Outstanding Debt by Type – Last Ten Fiscal Years ........................................................................................ 153Ratios of General Bonded Debt Outstanding – Last Ten Fiscal Years ........................................................................ 154Direct and Overlapping Governmental Activities Debt ................................................................................................... 155Legal Debt Margin Information – Last Ten Fiscal Years ................................................................................................... 156Pledged Revenue Coverage – Last Ten Fiscal Years ......................................................................................................... 157Demographic and Economic Statistics – Last Ten Fiscal Years .................................................................................... 158Principal Employers ........................................................................................................................................................................ 159City Government Employees by Function/Department – Last Ten Fiscal Years .................................................... 160Operating Indicators by Function – Last Ten Fiscal Years .............................................................................................. 161Capital Asset Statistics by Function – Last Ten Fiscal Years .......................................................................................... 163
SINGLE AUDIT SECTION Reports of Independent Auditor Schedule of Expenditures of Federal and State Awards ....................................................................... 165 Schedule of Findings and Questioned Costs

6

1
INTRODUCTORY SECTION
City of RaleighNorth CaroliNa

2
i
Ruffin L. HallCity Manager
Tansy HaywardAssistant City Manager
Marchell Adams-DavidAssistant City Manager
James Greene Jr.Assistant City Manager
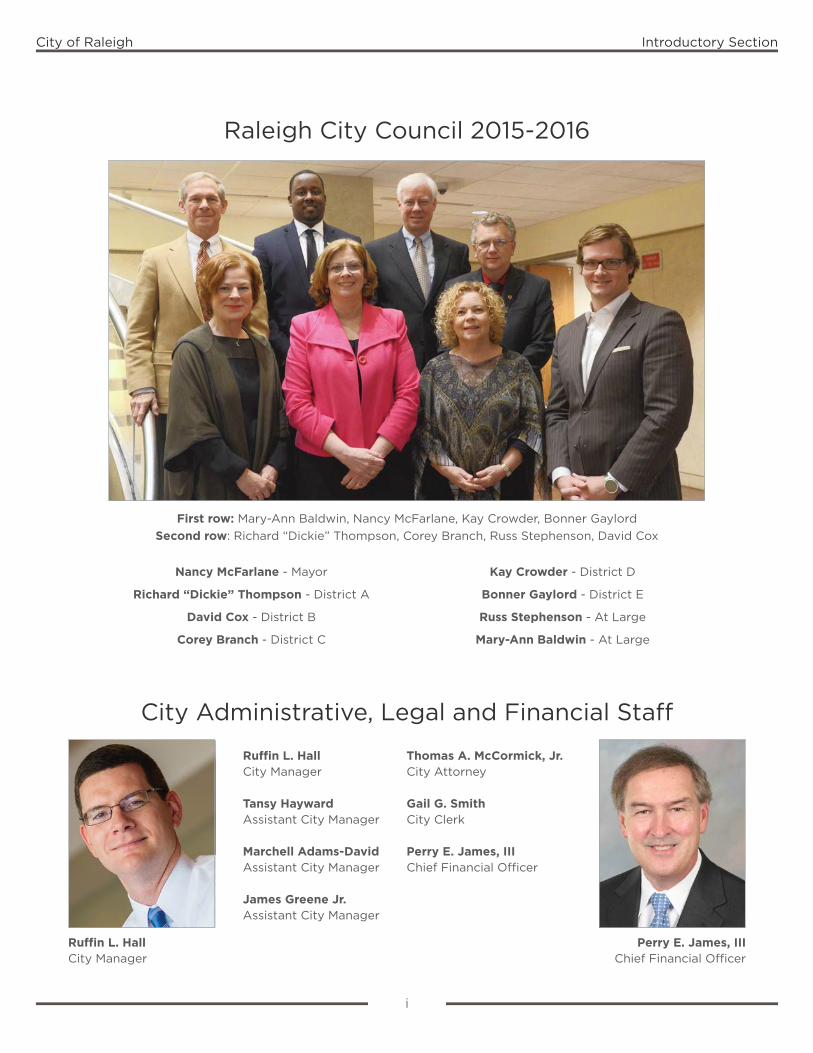
Raleigh City Council 2015-2016
First row: Mary-Ann Baldwin, Nancy McFarlane, Kay Crowder, Bonner GaylordSecond row: Richard “Dickie” Thompson, Corey Branch, Russ Stephenson, David Cox
City Administrative, Legal and Financial Staff
Thomas A. McCormick, Jr.City Attorney
Gail G. SmithCity Clerk
Perry E. James, IIIChief Financial Officer
Nancy McFarlane - Mayor
Richard “Dickie” Thompson - District A
David Cox - District B
Corey Branch - District C
Kay Crowder - District D
Bonner Gaylord - District E
Russ Stephenson - At Large
Mary-Ann Baldwin - At Large
Ruffin L. HallCity Manager
Perry E. James, IIIChief Financial Officer
City of Raleigh Introductory Section
ii
City of Raleigh Introductory Section
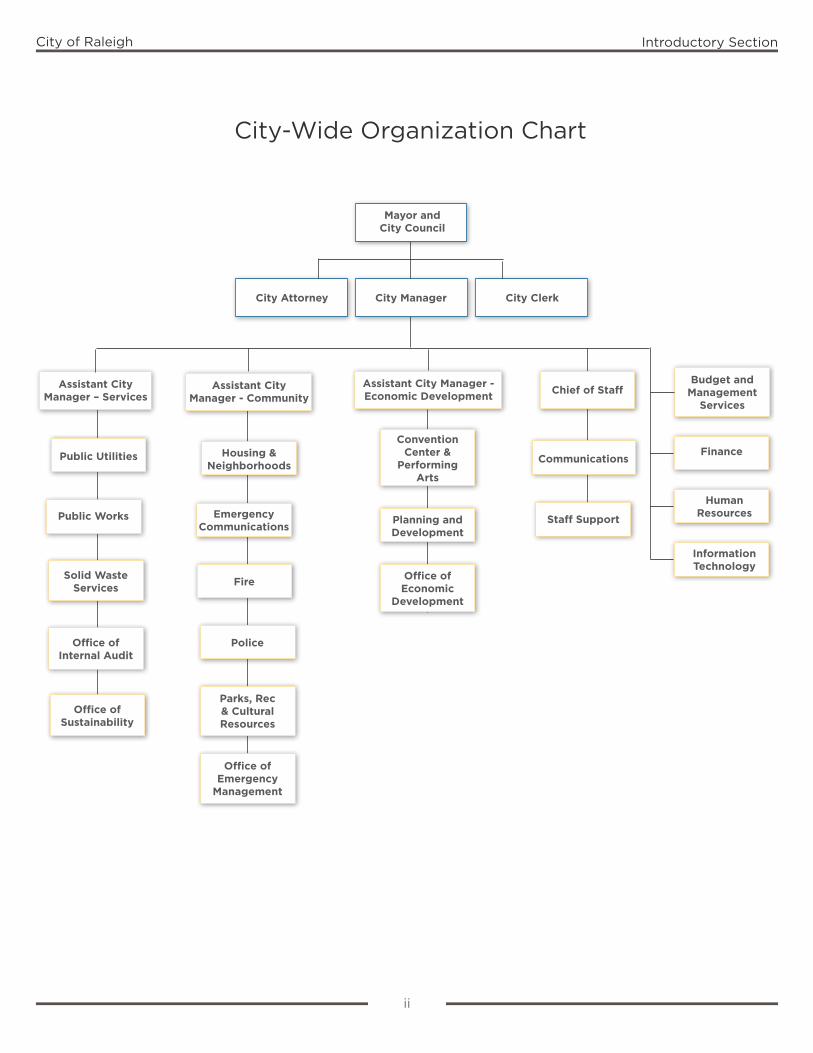
City-Wide Organization Chart
Mayor andCity Council
City ClerkCity ManagerCity Attorney
Assistant City Manager – Services
Assistant City Manager - Community
Assistant City Manager - Economic Development
Budget and Management
Services
Finance
HumanResources
InformationTechnology
Convention Center &
Performing Arts
Chief of Staff
Planning and Development
Office of Economic
Development
Communications
Staff Support
Housing & Neighborhoods
Emergency Communications
Fire
Police
Parks, Rec & Cultural Resources
Office of Emergency
Management
Public Utilities
Public Works
Solid Waste Services
Office of Internal Audit
Office of Sustainability
iii
To The Honorable Mayor and Members of the City Council and Citizens of the City of Raleigh, North Carolina
It is our pleasure to submit the Comprehensive Annual Financial Report of the City of Raleigh, North Carolina for the fiscal year ended June 30, 2016. State law requires that all general-purpose local governments annually publish a complete set of financial statements. The financial statements must be presented in accordance with accounting principles generally accepted in the United States of America and audited in accordance with generally accepted auditing standards by a firm of licensed certified public accountants. This report complies with these requirements.
The Comprehensive Annual Financial Report consists of management’s representations concerning the finances of the City. Consequently, management assumes full responsibility for the completeness and reliability of all of the information presented in this report. To provide a reasonable basis for making these representations, management of the City has established a comprehensive internal control framework that is designed both to protect City assets from loss, theft, or misuse and to compile sufficient reliable information for the preparation of the City’s financial statements in conformity with accounting principles generally accepted in the United States of America. The City’s comprehensive framework of internal controls has been designed to provide reasonable rather than absolute assurance that the financial statements are free from material misstatement. As management, we assert that, to the best of our knowledge and belief, this financial report is complete and reliable in all material respects.
The City’s financial statements have been audited by Cherry Bekaert LLP, a firm of licensed certified public accountants. The goal of the independent audit is to provide reasonable assurance that the financial statements of the City for the fiscal year ended June 30, 2016, are free of material misstatement. The independent auditor concluded, based upon their audit, that the City’s financial statements for the fiscal year ended June 30, 2016 are fairly presented in accordance with accounting principles generally accepted in the United States of America. The independent auditor’s report is presented as the first component of the financial section of this report.
The independent audit of the financial statements of the City was part of a broader, federal and state mandated “Single Audit” designed to meet the special needs of grantor agencies. The standards governing Single Audit engagements require the independent auditor to report not only on the fair presentation of the financial statements, but also on the audited government’s internal controls and compliance with legal requirements, with special emphasis on internal controls and legal requirements involving the administration of federal and state awards. These auditor reports are available in the Single Audit section of this report.
Accounting principles generally accepted in the United States of America require that management provide a narrative introduction, overview, and analysis to accompany the basic financial statements in the form of Management’s Discussion and Analysis (MD&A). This letter of transmittal is designed to complement the MD&A and should be read in conjunction with it. The City’s MD&A can be found immediately following the report of the independent auditors.
October 26, 2016
City of Raleigh Introductory Section
222 West Hargett Street • Post Office Box 590 • Raleigh, NC 27602-0590
iv
City of Raleigh Introductory Section
Profile of City of Raleigh
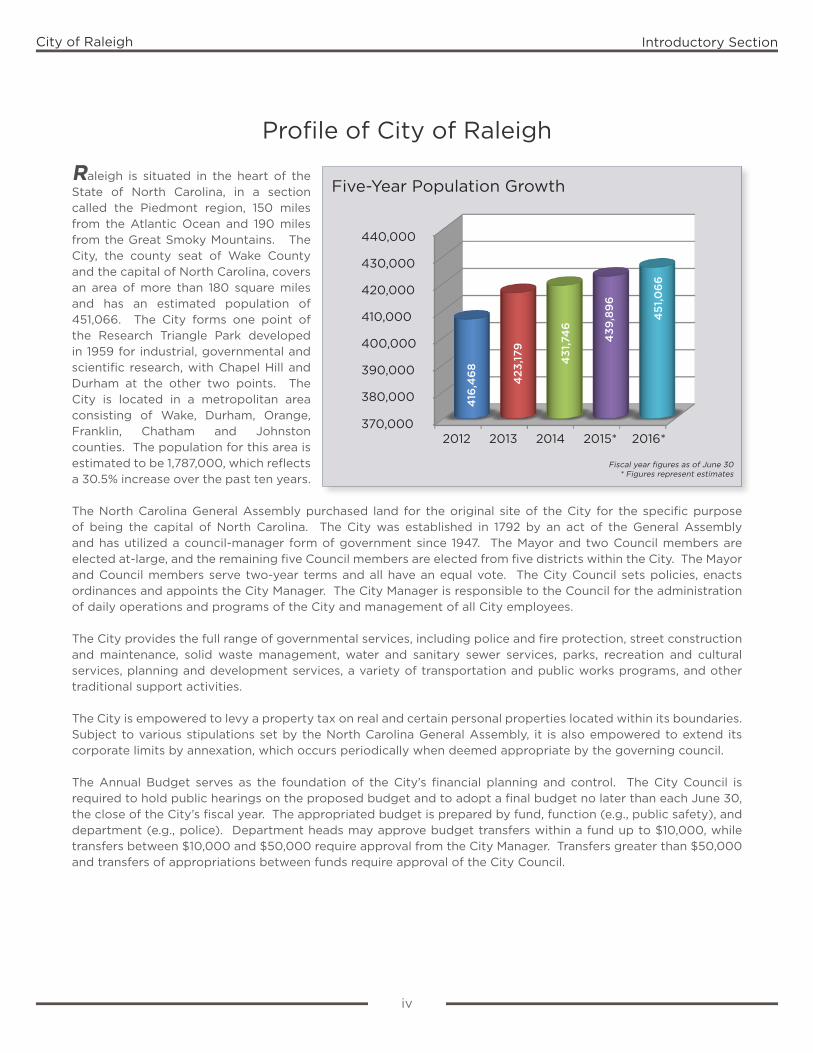
Raleigh is situated in the heart of the State of North Carolina, in a section called the Piedmont region, 150 miles from the Atlantic Ocean and 190 miles from the Great Smoky Mountains. The City, the county seat of Wake County and the capital of North Carolina, covers an area of more than 180 square miles and has an estimated population of 451,066. The City forms one point of the Research Triangle Park developed in 1959 for industrial, governmental and scientific research, with Chapel Hill and Durham at the other two points. The City is located in a metropolitan area consisting of Wake, Durham, Orange, Franklin, Chatham and Johnston counties. The population for this area is estimated to be 1,787,000, which reflects a 30.5% increase over the past ten years.
The North Carolina General Assembly purchased land for the original site of the City for the specific purpose of being the capital of North Carolina. The City was established in 1792 by an act of the General Assembly and has utilized a council-manager form of government since 1947. The Mayor and two Council members are elected at-large, and the remaining five Council members are elected from five districts within the City. The Mayor and Council members serve two-year terms and all have an equal vote. The City Council sets policies, enacts ordinances and appoints the City Manager. The City Manager is responsible to the Council for the administration of daily operations and programs of the City and management of all City employees.
The City provides the full range of governmental services, including police and fire protection, street construction and maintenance, solid waste management, water and sanitary sewer services, parks, recreation and cultural services, planning and development services, a variety of transportation and public works programs, and other traditional support activities.
The City is empowered to levy a property tax on real and certain personal properties located within its boundaries. Subject to various stipulations set by the North Carolina General Assembly, it is also empowered to extend its corporate limits by annexation, which occurs periodically when deemed appropriate by the governing council.
The Annual Budget serves as the foundation of the City’s financial planning and control. The City Council is required to hold public hearings on the proposed budget and to adopt a final budget no later than each June 30, the close of the City’s fiscal year. The appropriated budget is prepared by fund, function (e.g., public safety), and department (e.g., police). Department heads may approve budget transfers within a fund up to $10,000, while transfers between $10,000 and $50,000 require approval from the City Manager. Transfers greater than $50,000 and transfers of appropriations between funds require approval of the City Council.
Five-Year Population Growth
Fiscal year figures as of June 30* Figures represent estimates
440,000
430,000
420,000
410,000
400,000
390,000
380,000
370,000 2012 2013 2014 2015* 2016*
451
,06
6
416
,46
8
423
,179
431
,74
6
439
,89
6

v
City of Raleigh Introductory Section
Economic Conditions and Outlook
The information presented in the financial statements is perhaps best understood when it is considered from the broader perspective of the specific environment within which the City operates.
Raleigh continues to be widely recognized by independent sources as one of the nation’s most attractive metropolitan areas. Recent accolades include:
--One of the 7 Hottest Startup Hubs Outside of Silicon Valley (February 2016 – Mattermark)--One of the 100 Best Cities for Recent Graduates (March 2016 – NerdWallet.com)--3rd Best City for Young Professionals (March 2016 – Forbes Magazine)--3rd Best City for Young Families (February 2016 – ValuePenguin.com)--5th on list of America’s Next Boom Towns (January 2016 – Forbes Magazine)
The Raleigh area’s excellent business environment, its nationally ranked universities, and the outstanding health care facilities are some of the many attributes that attract people to the area. The mild climate, diverse work force and proximity to Research Triangle Park, a nationally recognized epicenter of innovation in more than a dozen industries, combine to make the City a great place to live. The City has experienced steady growth in population, land area and commercial activity over the past several years, becoming the 42nd largest city in the United States. As the capital of the State, the City derives its economic profile from a diverse combination of business and employment centers, including Federal and State government, higher education, information technology, scientific research, healthcare and retail trade. The City is the home of the principal executive, judicial and regulatory offices of State government, as well as six public and private institutions of higher education, including North Carolina State University, the largest university in North Carolina.
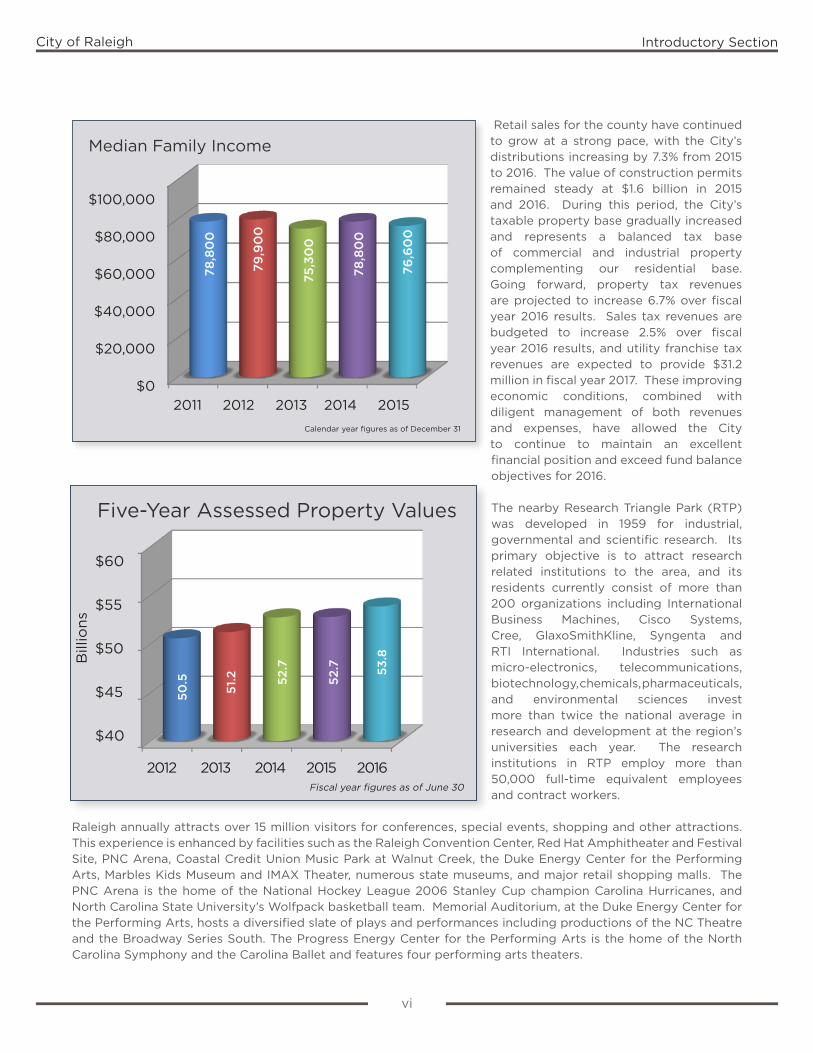
The City’s new strategic plan has provided priorities and guidance in developing budget recommendations, as reported to Council during the fiscal year 2016-17 budget process. As a result, budget resources are directed to investing in public safety, arts and cultural resources, economic development and transportation, as well as expanding vital services and focusing on organizational excellence. Financial projections for fiscal year 2016-17 show signs of continued revenue growth, specifically in sales tax and property tax revenues, while user fee revenues for water and sewer services, stormwater management, and solid waste services remain steady. The property tax revaluation process conducted at the end of calendar year 2015 resulted in an 8% increase in the property tax base, but the fiscal year 2016-17 budget includes a decrease in the property tax rate from 42.10 cents to 41.83 cents per $100 valuation. Locally, the unemployment rate at June 30, 2016 was 4.4%, which represents a decrease from the June 2015 rate of 5.1%. Median family incomes, as shown on the following page, has decreased slightly from $78,800 in calendar year 2014 to $76,600 in calendar year 2015. The overall decline in median family income over the past few years is consistent with a nationwide decline of 8% from the period of 1999 to 2014, when adjusted for inflation.
Fiscal year figures as of June 30* State and U.S. rates have been seasonally adjusted since 2013
Five-Year Unemployment Rate
City State US
12.0%
10.0%
8.0%
6.0%
4.0%
2.0%
0.0%
2012 2013* 2014 2015 2016
7.5%
9.6
%
8.2% 8.3%
6.9
% 7.5%
6.4
%
5.2% 6.1% 6.1%
5.1% 5.3%
5.2%
4.4
%
4.9
%
vi
City of Raleigh Introductory Section
Retail sales for the county have continued to grow at a strong pace, with the City’s distributions increasing by 7.3% from 2015 to 2016. The value of construction permits remained steady at $1.6 billion in 2015 and 2016. During this period, the City’s taxable property base gradually increased and represents a balanced tax base of commercial and industrial property complementing our residential base. Going forward, property tax revenues are projected to increase 6.7% over fiscal year 2016 results. Sales tax revenues are budgeted to increase 2.5% over fiscal year 2016 results, and utility franchise tax revenues are expected to provide $31.2 million in fiscal year 2017. These improving economic conditions, combined with diligent management of both revenues and expenses, have allowed the City to continue to maintain an excellent financial position and exceed fund balance objectives for 2016. The nearby Research Triangle Park (RTP) was developed in 1959 for industrial, governmental and scientific research. Its primary objective is to attract research related institutions to the area, and its residents currently consist of more than 200 organizations including International Business Machines, Cisco Systems, Cree, GlaxoSmithKline, Syngenta and RTI International. Industries such as micro-electronics, telecommunications, biotechnology, chemicals, pharmaceuticals, and environmental sciences invest more than twice the national average in research and development at the region’s universities each year. The research institutions in RTP employ more than 50,000 full-time equivalent employees and contract workers.
Raleigh annually attracts over 15 million visitors for conferences, special events, shopping and other attractions. This experience is enhanced by facilities such as the Raleigh Convention Center, Red Hat Amphitheater and Festival Site, PNC Arena, Coastal Credit Union Music Park at Walnut Creek, the Duke Energy Center for the Performing Arts, Marbles Kids Museum and IMAX Theater, numerous state museums, and major retail shopping malls. The PNC Arena is the home of the National Hockey League 2006 Stanley Cup champion Carolina Hurricanes, and North Carolina State University’s Wolfpack basketball team. Memorial Auditorium, at the Duke Energy Center for the Performing Arts, hosts a diversified slate of plays and performances including productions of the NC Theatre and the Broadway Series South. The Progress Energy Center for the Performing Arts is the home of the North Carolina Symphony and the Carolina Ballet and features four performing arts theaters.
Fiscal year figures as of June 30
Five-Year Assessed Property Values
$60
$55
$50
$45
$40
2012 2013 2014 2015 2016
Bill
ions
50.5
51.2 52
.7
52.7 53
.8
Median Family Income
Calendar year figures as of December 31
74
,90
0
76
,90
0
77,
700
78,
800
78,8
00
78,8
00
79,9
00
75,3
00
$100,000
$80,000
$60,000
$40,000
$20,000
$02011 2012 2013 2014 2015
76,6
00
vii
City of Raleigh Introductory Section
The City continues to recognize economic benefits from its investment in downtown and other areas of the City. The Raleigh Convention Center Complex has been met with outstanding bookings by regional, national and international conference groups, and continues to experience positive momentum. The Center held 270 events with 402,976 attendees during the twelve month period ending June 30, 2016. The events during fiscal year 2016 included 57 conventions and tradeshows, as well as 23 competitions, which had an estimated $49.4 million economic impact on Wake County. The Red Hat Amphitheater also has held a large number of events since opening in June 2010. Thirty-seven shows brought more than 107,000 attendees in the most recent summer season.
Major Initiatives
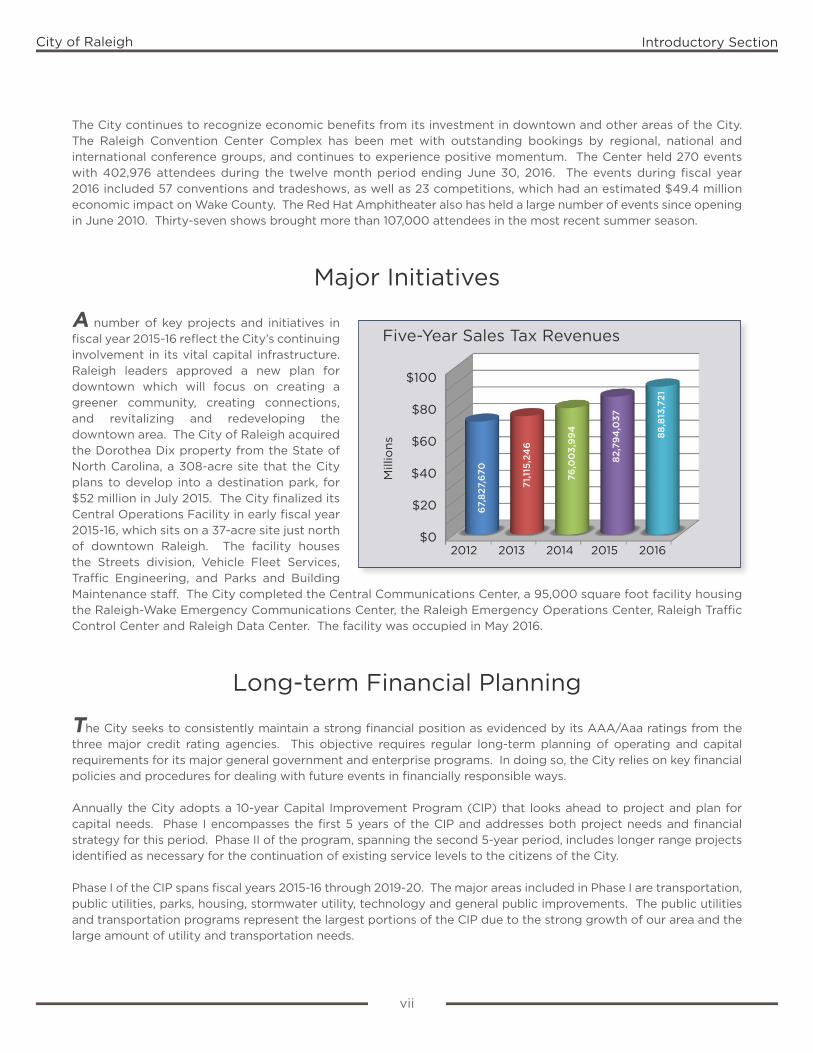
A number of key projects and initiatives in fiscal year 2015-16 reflect the City’s continuing involvement in its vital capital infrastructure. Raleigh leaders approved a new plan for downtown which will focus on creating a greener community, creating connections, and revitalizing and redeveloping the downtown area. The City of Raleigh acquired the Dorothea Dix property from the State of North Carolina, a 308-acre site that the City plans to develop into a destination park, for $52 million in July 2015. The City finalized its Central Operations Facility in early fiscal year 2015-16, which sits on a 37-acre site just north of downtown Raleigh. The facility houses the Streets division, Vehicle Fleet Services, Traffic Engineering, and Parks and Building Maintenance staff. The City completed the Central Communications Center, a 95,000 square foot facility housing the Raleigh-Wake Emergency Communications Center, the Raleigh Emergency Operations Center, Raleigh Traffic Control Center and Raleigh Data Center. The facility was occupied in May 2016.
Long-term Financial Planning
The City seeks to consistently maintain a strong financial position as evidenced by its AAA/Aaa ratings from the three major credit rating agencies. This objective requires regular long-term planning of operating and capital requirements for its major general government and enterprise programs. In doing so, the City relies on key financial policies and procedures for dealing with future events in financially responsible ways.
Annually the City adopts a 10-year Capital Improvement Program (CIP) that looks ahead to project and plan for capital needs. Phase I encompasses the first 5 years of the CIP and addresses both project needs and financial strategy for this period. Phase II of the program, spanning the second 5-year period, includes longer range projects identified as necessary for the continuation of existing service levels to the citizens of the City.
Phase I of the CIP spans fiscal years 2015-16 through 2019-20. The major areas included in Phase I are transportation, public utilities, parks, housing, stormwater utility, technology and general public improvements. The public utilities and transportation programs represent the largest portions of the CIP due to the strong growth of our area and the large amount of utility and transportation needs.
$100
$80
$60
$40
$20
$02012 2013 2014 2015 2016
Mill
ions
67,8
27,6
70
71,1
15,2
46
76
,00
3,9
94
88,8
13,7
21
82,
794
,037
Five-Year Sales Tax Revenues
viii
City of Raleigh Introductory Section
A key financial goal of the City for many years has been the maintenance of a 14.0% unassigned fund balance level in the general fund. In addition, the City is able to appropriate a consistent level of fund balance each year resulting from positive budget variances. These goals are met in the fiscal year 2016 results that are built into the 2016-17 operating budgets. A number of financial models are also used in the budget process and provide a means of projecting long-term resource requirements. These include general and enterprise debt models, rate sensitivity analyses and financing proformas. Other financial practices are designed to avoid the meeting of recurring expense needs with one-time revenue resources and to ensure an ongoing mix of pay-as-you-go funding of capital needs with long-term debt.
General Budget Information
For the Year 2015-16
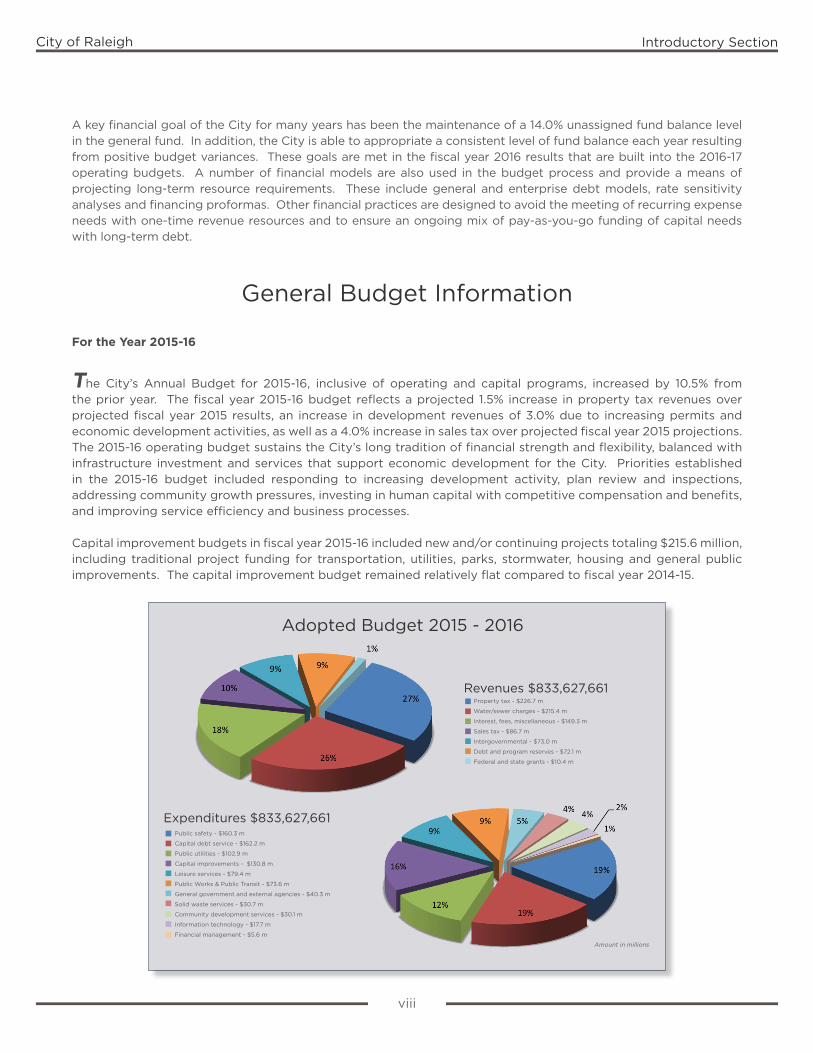
The City’s Annual Budget for 2015-16, inclusive of operating and capital programs, increased by 10.5% from the prior year. The fiscal year 2015-16 budget reflects a projected 1.5% increase in property tax revenues over projected fiscal year 2015 results, an increase in development revenues of 3.0% due to increasing permits and economic development activities, as well as a 4.0% increase in sales tax over projected fiscal year 2015 projections. The 2015-16 operating budget sustains the City’s long tradition of financial strength and flexibility, balanced with infrastructure investment and services that support economic development for the City. Priorities established in the 2015-16 budget included responding to increasing development activity, plan review and inspections, addressing community growth pressures, investing in human capital with competitive compensation and benefits, and improving service efficiency and business processes.
Capital improvement budgets in fiscal year 2015-16 included new and/or continuing projects totaling $215.6 million, including traditional project funding for transportation, utilities, parks, stormwater, housing and general public improvements. The capital improvement budget remained relatively flat compared to fiscal year 2014-15.
Amount in millions
Adopted Budget 2015 - 2016
Expenditures $833,627,661Public safety - $160.3 m
Capital debt service - $162.2 m
Public utilities - $102.9 m
Capital improvements - $130.8 m
Leisure services - $79.4 m
Public Works & Public Transit - $73.6 m
General government and external agencies - $40.3 m
Solid waste services - $30.7 m
Community development services - $30.1 m
Information technology - $17.7 m
Financial management - $5.6 m
Amount in millions
Revenues $833,627,661Property tax - $226.7 m
Water/sewer charges - $215.4 m
Interest, fees, miscellaneous - $149.3 m
Sales tax - $86.7 m
Intergovernmental - $73.0 m
Debt and program reserves - $72.1 m
Federal and state grants - $10.4 m
ix
City of Raleigh Introductory Section
For the FutureThe fiscal year 2016-17 Annual Budget was adopted by the City Council on June 20, 2016. The combined capital and operating budget for the fiscal year beginning July 1, 2016 totals $859.0 million, which represents a 3.0% increase from the fiscal year 2015-16 Annual Budget. The fiscal year 2016-17 budget reflects a projected 6.7% increase in property tax revenues over fiscal year 2016 results, a 2.5% increase in sales tax revenues over fiscal year 2016 results, and steady revenues for water and sewer services, stormwater management and solid waste services. Priorities established in the 2016-17 budget include investing in economic development and innovation, growth, natural resources, transportation, arts and cultural resources, and human capital; improving service efficiency and business processes; and maintaining a safe community.
The 2016-17 capital budget includes new and/or continuing projects totaling $180.0 million. This budget includes traditional project funding for transportation, utilities, parks, stormwater, housing and general public improvements. Fiscal year 2016-17 capital funding sources include traditional capital revenues such as Powell Bill funds, facility fees, capital reserves, parking operations, and other pay-as-you-go funds. The capital budget is also funded by the appropriation of previously issued bond proceeds as well as new planned long-term debt issues.
Awards and Acknowledgments
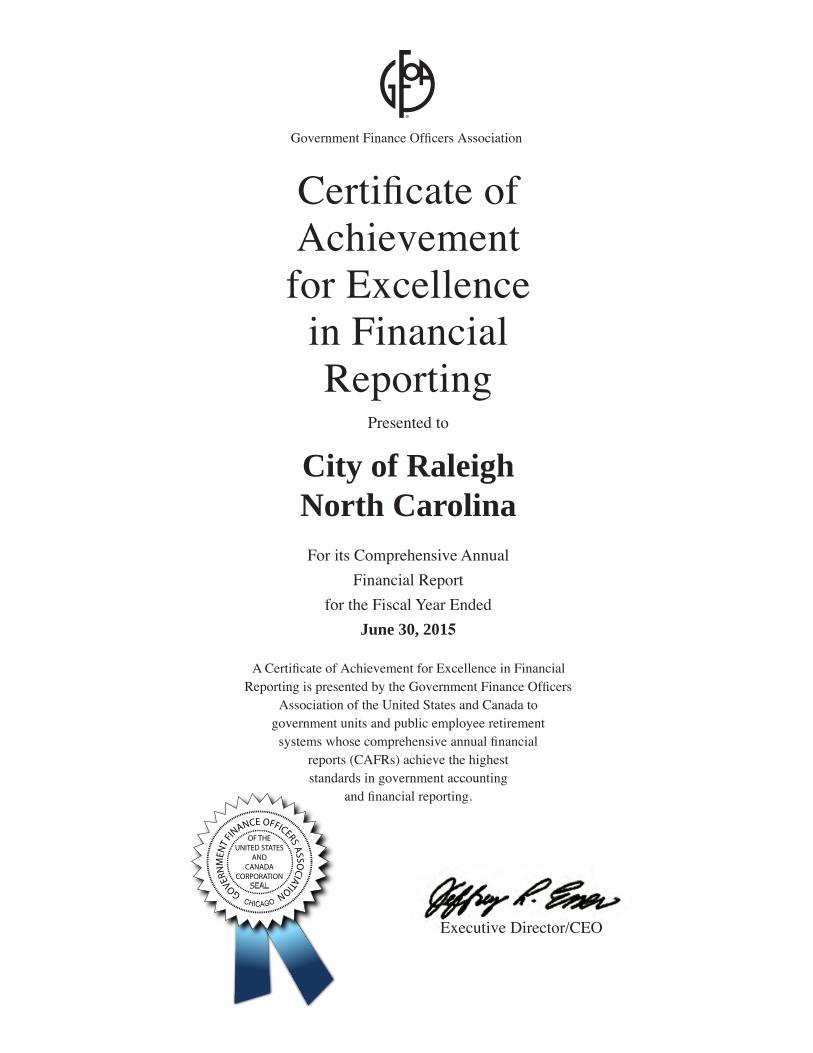
The City has participated in the Government Finance Officers Association (GFOA) Certificate of Achievement for Excellence in Financial Reporting Program since 1980. GFOA recognizes governmental units that issue their comprehensive annual financial report (CAFR) substantially in conformity with GAAP and all legal requirements. The City has received this award for its comprehensive annual financial report for thirty-five straight years since 1980.
A Certificate of Achievement is valid for a period of one year only. We believe that our current CAFR continues to meet the Certificate of Achievement Program’s requirements and we are submitting it to the GFOA to determine its eligibility for another certificate.
The preparation of this report has been accomplished by the City’s Finance Department staff. The contributions of all are invaluable and clearly reflect the high standards we have set for ourselves.
It is also appropriate to thank the Mayor and members of the City Council for making possible the excellent financial position of the City through their interest and support in planning and conducting the financial affairs of the City.
Respectfully submitted,
Ruffin L. HallCity Manager
Perry E. James IIIChief Financial Officer

x
City of Raleigh Introductory Section
xi
City of Raleigh Introductory Section
xi
City of Raleigh Introductory Section
1
GOVERN
MEN
T FINANCE OFFICERS ASSO
CIATION
OF THEUNITED STATES
ANDCANADA
CORPORATION
Executive Director/CEO
Government Finance Officers Association
Certificate ofAchievement
for Excellencein FinancialReporting
Presented to
City of RaleighNorth CarolinaFor its Comprehensive Annual
Financial Reportfor the Fiscal Year Ended
June 30, 2015
A Certificate of Achievement for Excellence in Financial Reporting is presented by the Government Finance Officers
Association of the United States and Canada to government units and public employee retirement
systems whose comprehensive annual financialreports (CAFRs) achieve the higheststandards in government accounting
and financial reporting.


1
FINANCIAL SECTION

ii
Report of Independent Auditor To the Honorable Mayor and Members of the City Council City of Raleigh, North Carolina Report on the Financial Statements We have audited the accompanying financial statements of the governmental activities, the business-type activities, each major fund, and the aggregate remaining fund information of the City of Raleigh, North Carolina (the “City”) as of and for the year ended June 30, 2016, and the related notes to the financial statements, which collectively comprise the City’s basic financial statements as listed in the table of contents. Management’s Responsibility for the Financial Statements Management is responsible for the preparation and fair presentation of these financial statements in accordance with accounting principles generally accepted in the United States of America; this includes the design, implementation, and maintenance of internal control relevant to the preparation and fair presentation of financial statements that are free from material misstatement, whether due to fraud or error. Auditor’s Responsibility Our responsibility is to express opinions on these financial statements based on our audit. We conducted our audit in accordance with auditing standards generally accepted in the United States of America and the standards applicable to financial audits contained in Government Auditing Standards, issued by the Comptroller General of the United States. Those standards require that we plan and perform the audit to obtain reasonable assurance about whether the financial statements are free from material misstatement. An audit involves performing procedures to obtain audit evidence about the amounts and disclosures in the financial statements. The procedures selected depend on the auditor’s judgment, including the assessment of the risks of material misstatement of the financial statements, whether due to fraud or error. In making those risk assessments, the auditor considers internal control relevant to the City’s preparation and fair presentation of the financial statements in order to design audit procedures that are appropriate in the circumstances, but not for the purpose of expressing an opinion on the effectiveness of the City’s internal control. Accordingly, we express no such opinion. An audit also includes evaluating the appropriateness of accounting policies used and the reasonableness of significant accounting estimates made by management, as well as evaluating the overall presentation of the financial statements. We believe that the audit evidence we have obtained is sufficient and appropriate to provide a basis for our audit opinions. Opinions In our opinion, the financial statements referred to above present fairly, in all material respects, the respective financial position of the governmental activities, the business-type activities, each major fund, and the aggregate remaining fund information of the City, as of June 30, 2016, and, the respective changes in financial position and, where applicable, cash flows thereof and the respective budgetary comparison for the General Fund for the year then ended in accordance with accounting principles generally accepted in the United States of America.


Emphasis of Matter As disclosed in Note 4 (G) of the basic financial statements, the City adopted Governmental Accounting Standards Board Statement No. 73, Accounting and Financial Reporting for Pensions and Related Assets That Are Not within the Scope of GASB Statement 68, and Amendments to Certain Provisions of GASB Statements 67 and 68. As a result, net position as of June 30, 2015 of the governmental activities has been restated. Our opinion was not modified with respect to this matter. Other Matters Required Supplementary Information Accounting principles generally accepted in the United States of America require that the management’s discussion and analysis and the required supplementary information as listed in the table of contents be presented to supplement the basic financial statements. Such information, although not a part of the basic financial statements, is required by the Governmental Accounting Standards Board, who considers it to be an essential part of financial reporting for placing the basic financial statements in an appropriate operational, economic, or historical context. We have applied certain limited procedures to the required supplementary information in accordance with auditing standards generally accepted in the United States of America, which consisted of inquiries of management about the methods of preparing the information and comparing the information for consistency with management’s responses to our inquiries, the basic financial statements, and other knowledge we obtained during our audit of the basic financial statements. We do not express an opinion or provide any assurance on the information because the limited procedures do not provide us with sufficient evidence to express an opinion or provide any assurance. Supplementary and Other Information Our audit was conducted for the purpose of forming opinions on the financial statements that collectively comprise the City’s basic financial statements. The introductory section, combining and individual fund statements and schedules, and statistical section, as listed in the table of contents, are presented for purposes of additional analysis and are not a required part of the basic financial statements. The accompanying schedule of expenditures of federal and state awards is presented for purposes of additional analysis as required by Title 2 U.S. Code of Federal Regulations (CFR) Part 200, Uniform Administrative Requirements, Cost Principles, and Audit Requirements for Federal Awards (Uniform Guidance), and the State Single Audit Implementation Act, and is also not a required part of the financial statements. The combining and individual fund statements and schedules, as listed in the table of contents, and the accompanying schedule of expenditures of federal and state awards are the responsibility of management and were derived from, and relate directly to, the underlying accounting and other records used to prepare the basic financial statements. Such information has been subjected to the auditing procedures applied in the audit of the basic financial statements and certain additional procedures, including comparing and reconciling such information directly to the underlying accounting and other records used to prepare the basic financial statements or to the basic financial statements themselves, and other additional procedures in accordance with auditing standards generally accepted in the United States of America. In our opinion, the information is fairly stated, in all material respects, in relation to the basic financial statements as a whole. The introductory and statistical sections have not been subjected to the auditing procedures applied in the audit of the basic financial statements and, accordingly, we do not express an opinion or provide any assurance on them.

Other Reporting Required by Government Auditing Standards In accordance with Government Auditing Standards, we have also issued our report dated October 26, 2016, on our consideration of the City’s internal control over financial reporting and on our tests of its compliance with certain provisions of laws, regulations, contracts, and grant agreements and other matters. The purpose of that report is to describe the scope of our testing of internal control over financial reporting and compliance and the results of that testing, and not to provide an opinion on internal control over financial reporting or on compliance. That report is an integral part of an audit performed in accordance with Government Auditing Standards in considering the City’s internal control over financial reporting and compliance.
Raleigh, North Carolina October 26, 2016

MD&A-1
MANAGEMENT’S DISCUSSION AND ANALYSISAs management of the City of Raleigh (the City), we offer readers of the City’s financial statements this narrative overview and analysis of the financial activities of the City for the fiscal year ended June 30, 2016. Please read it in conjunction with the transmittal letter at the front of this report and the City’s financial statements, which follow this section.
FINANCIAL HIGHLIGHTSIn 2015-16, the City maintained its strong financial position for both its general governmental and business-type
funds. Key indicators of that were overall positive budget variances, increases in fund balance amounts, growth of
key general tax and business-type revenues, and continued funding of long-term pensions, risk management claims
and OPEB liabilities on an actuarial basis. Consistent with those indicators, the City’s general obligation ratings
remained AAA/Aaa. The following are summary financial highlights:
• The assets and deferred outflows of resources of the City of Raleigh exceeded its liabilities and deferred
inflows of resources at the close of the most recent fiscal year by $2,225.4 million (net position).
• This amount represents a $146.9 million increase in operating results from the prior year, or 7.1%
• Of this amount, $483.1 million (unrestricted net position) may be used to meet the government’s
ongoing obligations to citizens and creditors
• As of the close of the current fiscal year, the City’s governmental funds reported combined ending fund
balances of $559.3 million.
• $297.1 million, or 53.1% is assigned for specific purposes as identified by the City, with the largest
assigned amount being $101.3 million for future debt service
• $84.8 million, or 15.2% is unassigned in the general fund and is available for spending at the City’s
discretion
• $77.7 million, or 13.9% is considered nonspendable
• $96.9 million, or 17.3% is restricted by outside agencies
• $2.9 million of fund balance is committed for the law enforcement officers’ special separation
allowance fund
• At the end of the current fiscal year, fund balance for the general fund was $268.2 million.
• Highlights of financing issues and activities for the City during 2015-16 are as follows:
• The City obtained a loan of $52.0 million to finance the purchase of the Dorothea Dix property that
will be used as a destination park
• The City issued $11.5 million in limited obligation bonds to finance the construction of a fire station and
projects for the Duke Energy Center for the Performing Arts
• The City issued $6.0 million in taxable housing bonds
• The City issued $31.0 million in limited obligation bonds to refund the 2009 variable rate limited
obligation bonds
• The City issued $19.2 million in limited obligation bonds to refund remaining parking certificate of
participation obligations which will reduce gross future debt service payments by $3.8 million over
the next fifteen years
• The City issued $14.2 million in limited obligation bonds to refund an installment financing draw
program for improvements to the Duke Energy Center for the Performing Arts
City of Raleigh Management’s Discussion and Analysis
MD&A-2
• The City issued $118.1 million in general obligation bonds to refund remaining general obligation public
improvement and housing bonds which will reduce gross future debt service payments by $14.8
million over the next fifteen years
• The City issued $49.9 million in revenue bonds to refund remaining water and sewer revenue bond
obligations which will reduce gross future debt service payments by $6.5 million over the next ten
years
• The City drew down $2.5 million from the PNC Bank drawdown program to fund various capital
projects at the Convention Center Complex
• The City of Raleigh maintained its AAA/Aaa general obligation bond rating from all three major rating agencies.
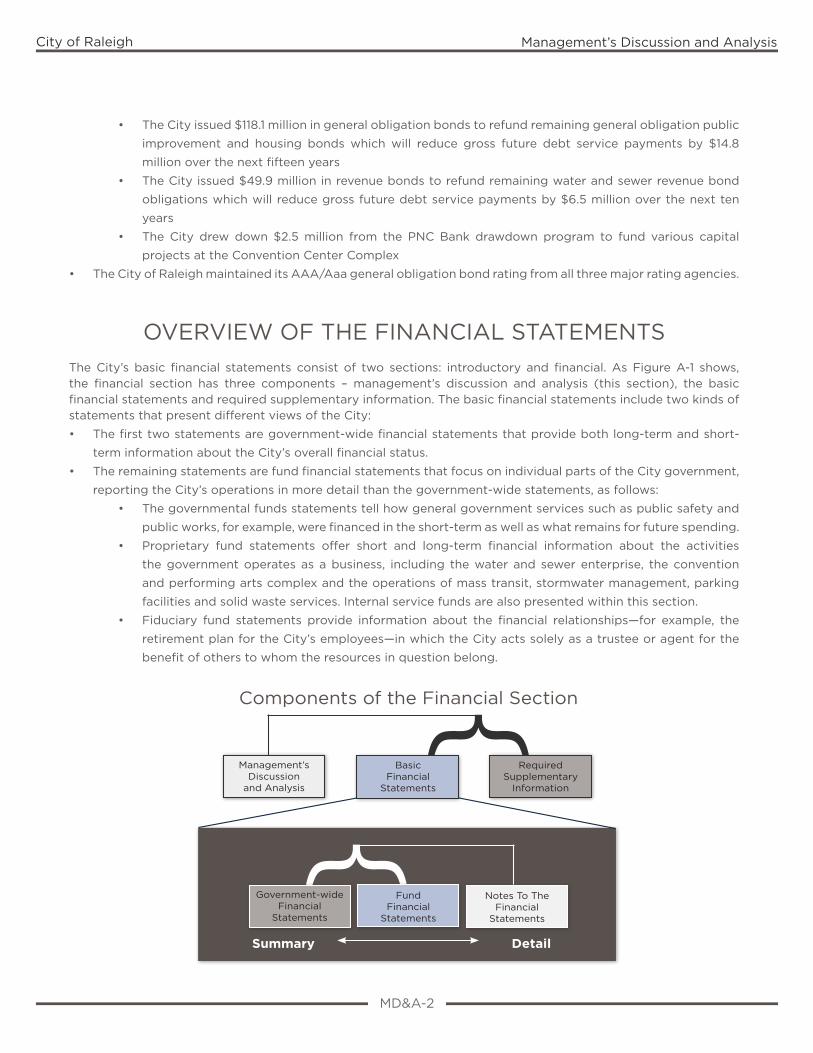
OVERVIEW OF THE FINANCIAL STATEMENTSThe City’s basic financial statements consist of two sections: introductory and financial. As Figure A-1 shows, the financial section has three components – management’s discussion and analysis (this section), the basic financial statements and required supplementary information. The basic financial statements include two kinds of statements that present different views of the City:
• The first two statements are government-wide financial statements that provide both long-term and short-
term information about the City’s overall financial status.
• The remaining statements are fund financial statements that focus on individual parts of the City government,
reporting the City’s operations in more detail than the government-wide statements, as follows:
• The governmental funds statements tell how general government services such as public safety and
public works, for example, were financed in the short-term as well as what remains for future spending.
• Proprietary fund statements offer short and long-term financial information about the activities
the government operates as a business, including the water and sewer enterprise, the convention
and performing arts complex and the operations of mass transit, stormwater management, parking
facilities and solid waste services. Internal service funds are also presented within this section.
• Fiduciary fund statements provide information about the financial relationships—for example, the
retirement plan for the City’s employees—in which the City acts solely as a trustee or agent for the
benefit of others to whom the resources in question belong.
City of Raleigh Management’s Discussion and Analysis
}}
Summary Detail
Management’s Discussion
and Analysis
BasicFinancial
Statements
RequiredSupplementary
Information
Government-wideFinancial
Statements
FundFinancial
Statements
Notes To TheFinancial
Statements
Components of the Financial Section

MD&A-3
The financial statements also include notes that explain some of the information in the financial statements and provide more detailed data. The statements are followed by a section of required supplementary information that further explains and supports the information in the financial statements. Figure A-1 shows how the required parts of this annual report are arranged and relate to one another. The remainder of this overview section of management’s discussion and analysis explains the structure and contents of each of the statements.
Government-wide financial statements. The government-wide financial statements are designed to provide the reader with a broad overview of the City’s finances, similar in format to a financial statement of a private-sector business. The government-wide statements provide short and long-term information about the City’s financial status as a whole.
The statement of net position presents information on all of the City’s assets and deferred outflows of resources compared to liabilities and deferred inflows of resources, with the difference between reported as net position. This statement combines and consolidates governmental fund’s current financial resources (short-term spendable resources) with capital assets and long-term obligations. Over time, increases and decreases in net position may serve as useful indicators of whether the financial position of the City of Raleigh is improving or deteriorating.
The statement of activities presents information showing how the City’s net position changed during the most recent fiscal year. All changes in net position are reported as soon as the underlying event giving rise to the change occurs, regardless of the timing of related cash flows. Thus, revenues and expenses are reported in this statement for some items that will only result in cash flows in future fiscal periods (e.g., uncollected taxes and earned but unused vacation leave).
Both of the government-wide financial statements distinguish functions of the City that are principally supported by taxes and intergovernmental revenues (governmental activities) from other functions that are intended to recover all or a significant portion of their costs through user fees and charges (business-type activities). This is intended to simplify and summarize the user’s analysis of the cost of various governmental services and/or subsidy to various business-type activities. The governmental activities of the City include general government, community development, public works, public safety, leisure services, and economic development programs. The business-type activities of the City include water and sewer, convention and performing arts complex fund, parking facilities, mass transit, stormwater management and solid waste services.
The government-wide financial statements include the Walnut Creek Financing Assistance Corporation (WCFAC, a blended component unit), an organization formed to be the financing conduit for certain debt issuances such as certificate of participation. The WCFAC, although legally separate, functions for all practical purposes as a department of the City, and therefore has been included as an integral part of the primary government.
The government-wide financial statements can be found on pages 1 - 3 of this report.
Fund financial statements. Traditional users of governmental fund financial statements will find the fund financial statements presentation more familiar. However, the focus is on major funds, rather than the individual fund types. The fund financial statements provide a more detailed look at the City’s most significant activities.
A fund is a grouping of related accounts that is used to maintain control over resources that have been segregated for specific activities or objectives. The City of Raleigh, like all other governmental entities in North Carolina, uses fund accounting to ensure and demonstrate compliance with finance-related legal requirements, such as the general statutes or the City’s budget ordinance. All of the funds of the City can be divided into three categories: governmental funds, proprietary funds, and fiduciary funds.
Governmental funds. Governmental funds are used to account for essentially the same functions reported as governmental activities in the government-wide financial statements. However, unlike the government-wide financial statements, governmental fund financial statements focus on near-term inflows and outflows of spendable resources, as well as on balances of spendable resources available at the end of the fiscal year. Such information may be useful in evaluating a government’s near-term financing requirements.
City of Raleigh Management’s Discussion and Analysis
MD&A-4
While the focus of governmental funds is narrower than that of the government-wide financial statements, it is still useful to compare the information presented for governmental funds with similar information presented for governmental activities in the government-wide financial statements. By doing so, readers may better understand the long-term impact of the government’s near-term financing decisions. Both the governmental fund balance sheet and the governmental fund statement of revenues, expenditures, and changes in fund balances provide a reconciliation to facilitate this comparison between governmental funds and governmental activities.
The City maintains eighteen individual governmental funds. Information is presented separately in the governmental fund balance sheet and in the governmental fund statement of revenues, expenditures, and changes in fund balance for the general fund, which is considered to be a major fund. Data from the other seventeen governmental funds are combined into a single, aggregated presentation. Individual fund data for each of these nonmajor governmental funds is provided in the form of combining statements elsewhere in this report.
The City adopts an annual appropriated budget for its general fund. A budgetary comparison statement has been provided for the general fund to demonstrate compliance with this budget.
The basic governmental fund financial statements can be found on pages 4 - 10 of this report.
Proprietary funds. The City of Raleigh maintains two different types of proprietary funds. Enterprise funds are used to report the same functions presented as business-type activities in the government-wide financial statements. The City uses enterprise funds to account for its water and sewer, convention and performing arts complex (referred to as convention center) operations, parking facilities, mass transit, stormwater management operations, and solid waste services. Internal service funds are an accounting device used to accumulate and allocate costs internally amongst the City’s various functions. The City of Raleigh uses internal service funds to account for governmental and business-type activities, such as risk management, employees’ health benefits trust and vehicle fleet services. The City also maintains equipment replacement funds for governmental, solid waste services and public utilities. These internal services benefit government-wide functions except for the public utilities and solid waste services equipment replacement funds, which benefit business-type functions. These services have been included within their respective predominant activities in the government-wide financial statements.
Proprietary fund statements provide the same type of information as the government-wide financial statements, only in more detail. The proprietary fund financial statements provide separate information for the six enterprise funds, all reported as major. Conversely, all internal service funds are combined into a single, aggregated presentation in the proprietary fund financial statements. Individual fund data for the internal service funds is provided in the form of combining statements elsewhere in this report.
The basic proprietary fund financial statements can be found on pages 12 - 19 of this report.
Fiduciary funds. Fiduciary funds are used to account for resources held for the benefit of parties outside the government. Fiduciary funds are not reflected in the government-wide financial statement because the resources of those funds are not available to support the City’s own programs. The accounting used for fiduciary funds is much like that used for proprietary funds.
The basic fiduciary fund financial statements can be found on pages 20 - 21 of this report.
Notes to the financial statements. The notes provide additional information that is essential to a full understanding of the data provided in the government-wide and fund financial statements. The notes to the financial statements can be found on pages 22 - 68 of this report.
Other information. In addition to the basic financial statements and accompanying notes, this report also presents certain required supplementary information concerning the City of Raleigh’s progress in funding its obligation to provide pension benefits to City employees, which includes Other Post-Employment Benefits (OPEB), Local Government Employees’ Retirement System (LGERS), as well as Law Enforcement Officers (LEO). Required supplementary information can be found on pages 69 - 73 of this report.
City of Raleigh Management’s Discussion and Analysis
MD&A-5
The combining statements referred to earlier in connection with nonmajor governmental funds and internal service funds are presented immediately following the required supplementary information on pensions. Combining and individual fund statements and schedules can be found on pages 74 - 126 of this report.
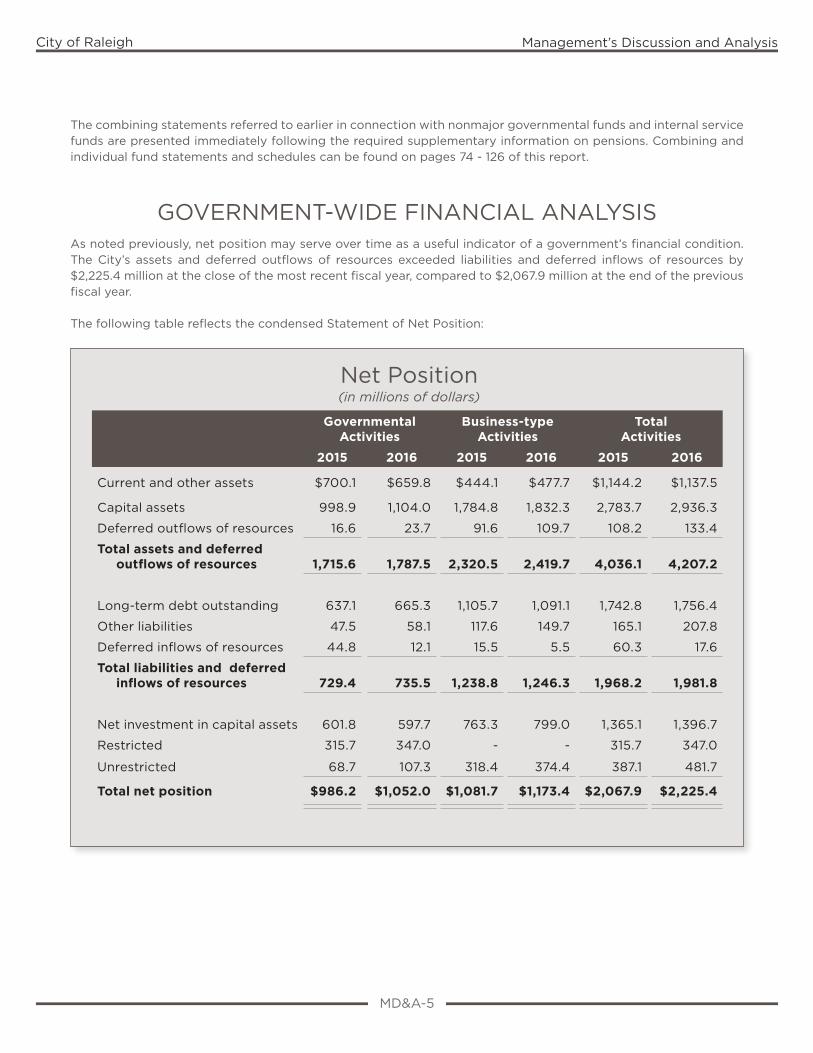
GOVERNMENT-WIDE FINANCIAL ANALYSISAs noted previously, net position may serve over time as a useful indicator of a government’s financial condition. The City’s assets and deferred outflows of resources exceeded liabilities and deferred inflows of resources by $2,225.4 million at the close of the most recent fiscal year, compared to $2,067.9 million at the end of the previous fiscal year.
The following table reflects the condensed Statement of Net Position:
Net Position(in millions of dollars)
GovernmentalActivities
Business-typeActivities
TotalActivities
2015 2016 2015 2016 2015 2016
Current and other assets $700.1 $659.8 $444.1 $477.7 $1,144.2 $1,137.5
Capital assets 998.9 1,104.0 1,784.8 1,832.3 2,783.7 2,936.3
Deferred outflows of resources 16.6 23.7 91.6 109.7 108.2 133.4
Total assets and deferred outflows of resources 1,715.6 1,787.5
2,320.5 2,419.7 4,036.1 4,207.2
Long-term debt outstanding 637.1 665.3 1,105.7 1,091.1 1,742.8 1,756.4
Other liabilities 47.5 58.1 117.6 149.7 165.1 207.8
Deferred inflows of resources 44.8 12.1 15.5 5.5 60.3 17.6
Total liabilities and deferred inflows of resources 729.4 735.5 1,238.8 1,246.3 1,968.2 1,981.8
Net investment in capital assets 601.8 597.7 763.3 799.0 1,365.1 1,396.7
Restricted 315.7 347.0 - - 315.7 347.0
Unrestricted 68.7 107.3 318.4 374.4 387.1 481.7
Total net position $986.2 $1,052.0 $1,081.7 $1,173.4 $2,067.9 $2,225.4
City of Raleigh Management’s Discussion and Analysis

MD&A-6
City of Raleigh Management’s Discussion and Analysis
By far the largest portion of the City of Raleigh’s net position ($1,396.7 million or 62.8%) reflects its investment in capital assets (e.g., land, buildings, machinery, and equipment) net of any related debt used to acquire those assets that is still outstanding. The City of Raleigh uses these capital assets to provide services to citizens; consequently these assets are not available for future spending. Although the City of Raleigh’s investment in its capital assets is reported net of outstanding related debt, it should be noted that the resources needed to repay this debt must be provided from other sources, since the capital assets themselves cannot be used to liquidate these liabilities.
An additional portion of the City’s net position ($347.0 million or 15.6%) represents resources that are subject to external restrictions on how they may be used. The remaining balance of unrestricted net position ($481.7 million or 21.6%) may be used to meet the City’s ongoing operations.
At the end of the current fiscal year, the City of Raleigh is able to report positive balances in all three categories of net position both for the City as a whole, as well as for its separate governmental and business-type activities.
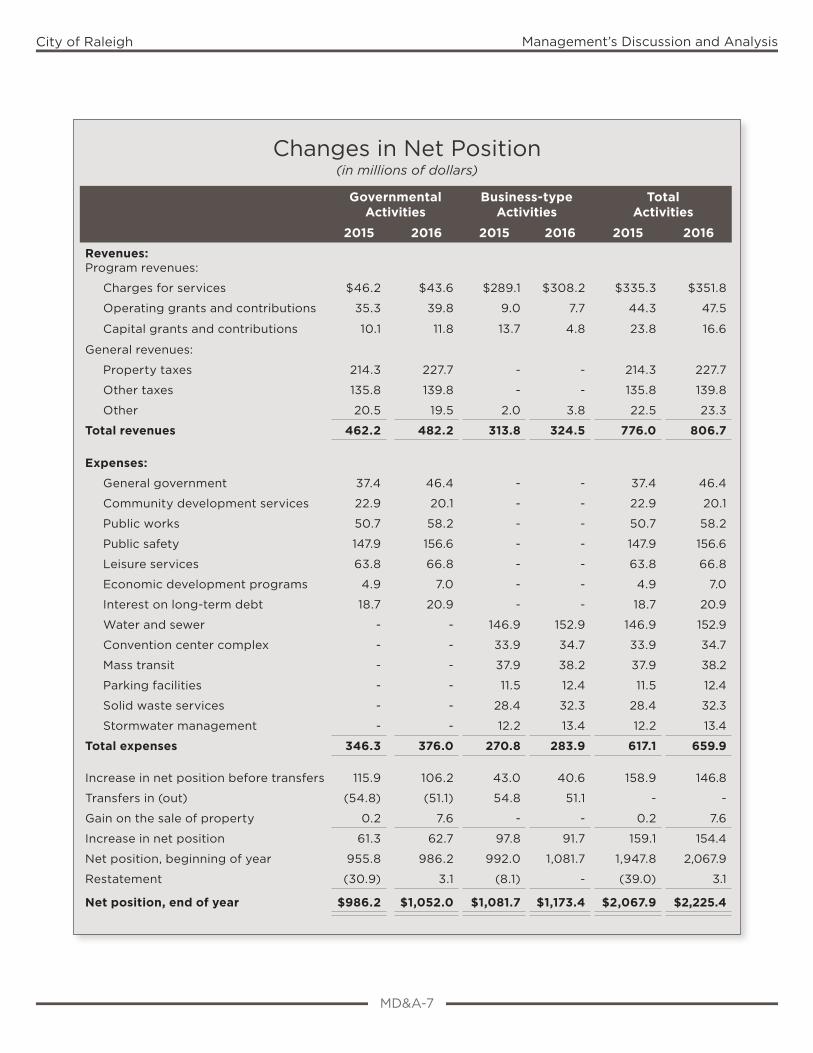
The City’s net position increased by $157.5 million in operating results from prior year. In fiscal year 2015-16, the City had a restatement of fund balance in the General Fund that reclassified the Law Enforcement Officers’ Special Separation Allowance from a pension trust fund to the General Fund in compliance with Governmental Accounting Standards Board Statement 73. The City’s net pension asset in prior year also changed and is reported as a net pension liability for June 30, 2016, and there will continue to be fluctuations from year to year due to actuarial assumptions and investment earnings. The following table summarizes the changes in net position, including a restatement amount of $3.1 million:
MD&A-7
City of Raleigh Management’s Discussion and Analysis
Changes in Net Position(in millions of dollars)
GovernmentalActivities
Business-typeActivities
TotalActivities
2015 2016 2015 2016 2015 2016Revenues:Program revenues:
Charges for services $46.2 $43.6 $289.1 $308.2 $335.3 $351.8
Operating grants and contributions 35.3 39.8 9.0 7.7 44.3 47.5
Capital grants and contributions 10.1 11.8 13.7 4.8 23.8 16.6
General revenues:
Property taxes 214.3 227.7 - - 214.3 227.7
Other taxes 135.8 139.8 - - 135.8 139.8
Other 20.5 19.5 2.0 3.8 22.5 23.3
Total revenues 462.2 482.2 313.8 324.5 776.0 806.7
Expenses:
General government 37.4 46.4 - - 37.4 46.4
Community development services 22.9 20.1 - - 22.9 20.1
Public works 50.7 58.2 - - 50.7 58.2
Public safety 147.9 156.6 - - 147.9 156.6
Leisure services 63.8 66.8 - - 63.8 66.8
Economic development programs 4.9 7.0 - - 4.9 7.0
Interest on long-term debt 18.7 20.9 - - 18.7 20.9
Water and sewer - - 146.9 152.9 146.9 152.9
Convention center complex - - 33.9 34.7 33.9 34.7
Mass transit - - 37.9 38.2 37.9 38.2
Parking facilities - - 11.5 12.4 11.5 12.4
Solid waste services - - 28.4 32.3 28.4 32.3
Stormwater management - - 12.2 13.4 12.2 13.4
Total expenses 346.3 376.0 270.8 283.9 617.1 659.9
Increase in net position before transfers 115.9 106.2 43.0 40.6 158.9 146.8
Transfers in (out) (54.8) (51.1) 54.8 51.1 - -
Gain on the sale of property 0.2 7.6 - - 0.2 7.6
Increase in net position 61.3 62.7 97.8 91.7 159.1 154.4
Net position, beginning of year 955.8 986.2 992.0 1,081.7 1,947.8 2,067.9
Restatement (30.9) 3.1 (8.1) - (39.0) 3.1
Net position, end of year $986.2 $1,052.0 $1,081.7 $1,173.4 $2,067.9 $2,225.4
MD&A-8
City of Raleigh Management’s Discussion and Analysis
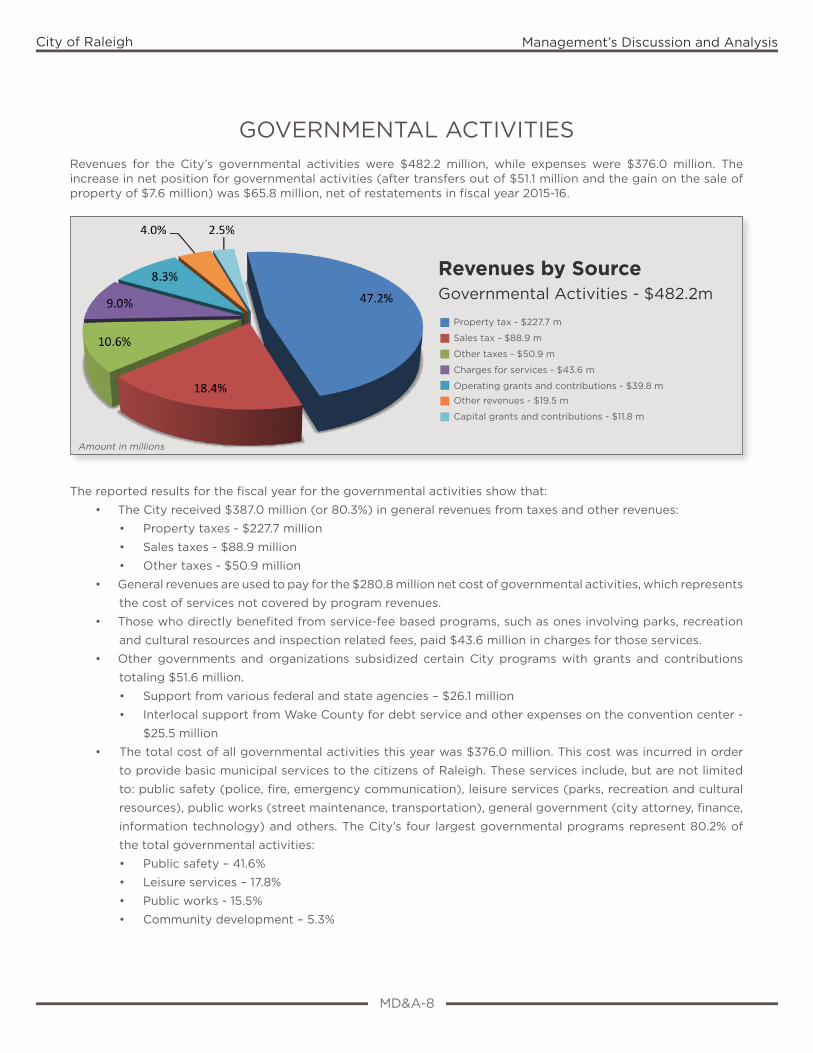
GOVERNMENTAL ACTIVITIESRevenues for the City’s governmental activities were $482.2 million, while expenses were $376.0 million. The increase in net position for governmental activities (after transfers out of $51.1 million and the gain on the sale of property of $7.6 million) was $65.8 million, net of restatements in fiscal year 2015-16.
The reported results for the fiscal year for the governmental activities show that:
• The City received $387.0 million (or 80.3%) in general revenues from taxes and other revenues:
• Property taxes - $227.7 million
• Sales taxes - $88.9 million
• Other taxes - $50.9 million
• General revenues are used to pay for the $280.8 million net cost of governmental activities, which represents
the cost of services not covered by program revenues.
• Those who directly benefited from service-fee based programs, such as ones involving parks, recreation
and cultural resources and inspection related fees, paid $43.6 million in charges for those services.
• Other governments and organizations subsidized certain City programs with grants and contributions
totaling $51.6 million.
• Support from various federal and state agencies – $26.1 million
• Interlocal support from Wake County for debt service and other expenses on the convention center -
$25.5 million
• The total cost of all governmental activities this year was $376.0 million. This cost was incurred in order
to provide basic municipal services to the citizens of Raleigh. These services include, but are not limited
to: public safety (police, fire, emergency communication), leisure services (parks, recreation and cultural
resources), public works (street maintenance, transportation), general government (city attorney, finance,
information technology) and others. The City’s four largest governmental programs represent 80.2% of
the total governmental activities:
• Public safety – 41.6%
• Leisure services – 17.8%
• Public works - 15.5%
• Community development – 5.3%
Property tax - $227.7 m
Sales tax - $88.9 m
Other taxes - $50.9 m
Charges for services - $43.6 m
Operating grants and contributions - $39.8 m
Other revenues - $19.5 m
Capital grants and contributions - $11.8 m
Revenues by Source Governmental Activities - $482.2m
Amount in millions
MD&A-9
City of Raleigh Management’s Discussion and Analysis
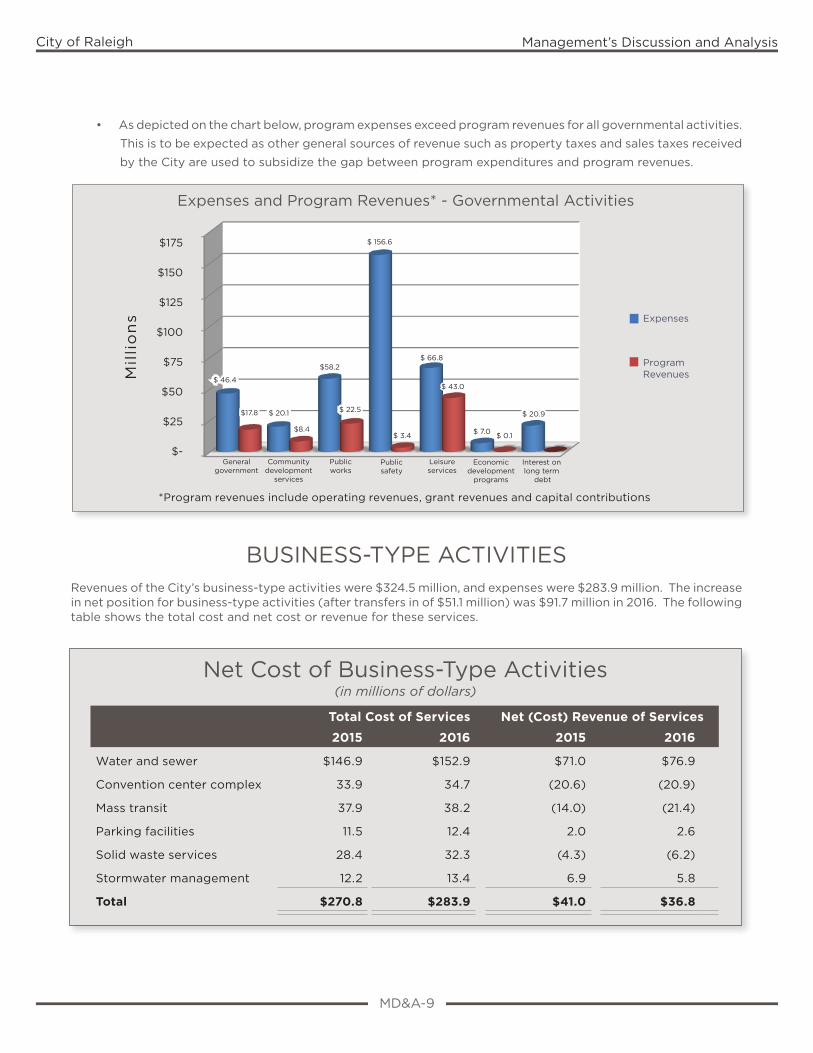
• As depicted on the chart below, program expenses exceed program revenues for all governmental activities.
This is to be expected as other general sources of revenue such as property taxes and sales taxes received
by the City are used to subsidize the gap between program expenditures and program revenues.
BUSINESS-TYPE ACTIVITIESRevenues of the City’s business-type activities were $324.5 million, and expenses were $283.9 million. The increase in net position for business-type activities (after transfers in of $51.1 million) was $91.7 million in 2016. The following table shows the total cost and net cost or revenue for these services.
Expenses and Program Revenues* - Governmental Activities
Expenses
Program Revenues
General government
Community development
services
Public works
Public safety
Leisure services
Economicdevelopment
programs
Interest on long term
debt
$ 46.4
$ 20.1
$58.2
$ 3.4
$ 66.8
$ 7.0
$ 20.9
$ 43.0
$ 22.5
$8.4
$17.8
$ 0.1
$175
$150
$125
$100
$75
$50
$25
$-
Mil
lio
ns
*Program revenues include operating revenues, grant revenues and capital contributions
$ 156.6
Net Cost of Business-Type Activities(in millions of dollars)
Total Cost of Services Net (Cost) Revenue of Services2015 2016 2015 2016
Water and sewer $146.9 $152.9 $71.0 $76.9
Convention center complex 33.9 34.7 (20.6) (20.9)
Mass transit 37.9 38.2 (14.0) (21.4)
Parking facilities 11.5 12.4 2.0 2.6
Solid waste services 28.4 32.3 (4.3) (6.2)
Stormwater management 12.2 13.4 6.9 5.8
Total $270.8 $283.9 $41.0 $36.8
MD&A-10
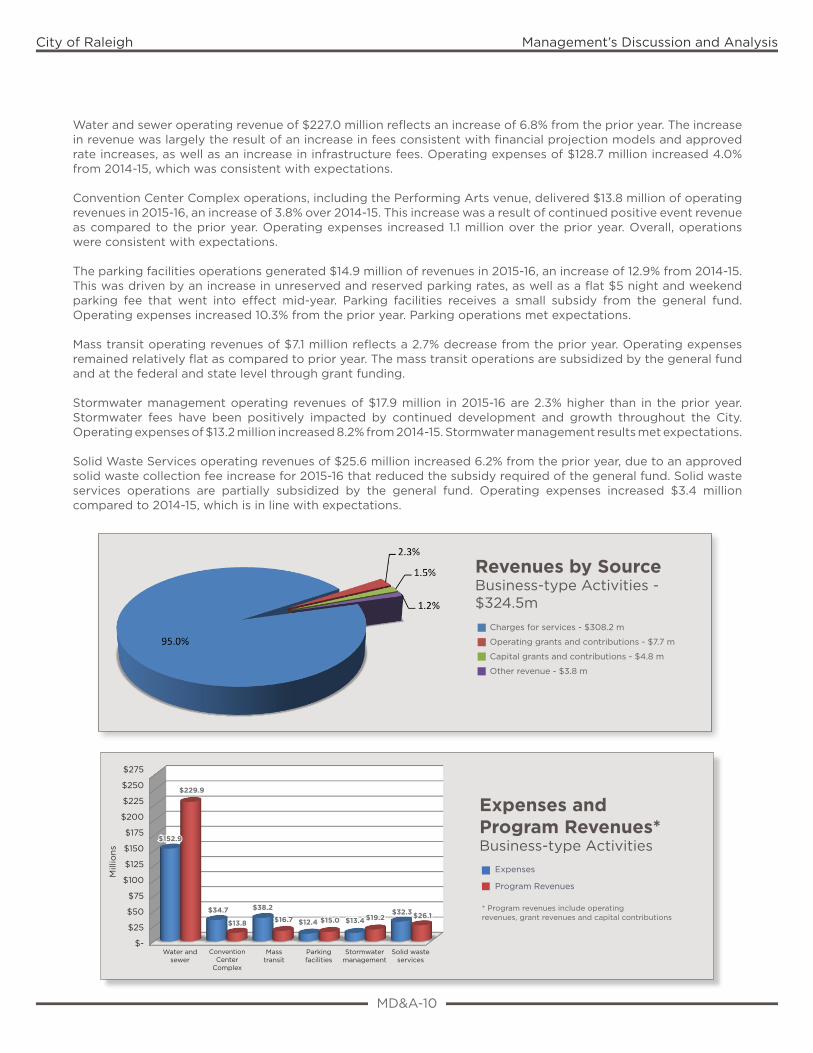
Water and sewer operating revenue of $227.0 million reflects an increase of 6.8% from the prior year. The increase in revenue was largely the result of an increase in fees consistent with financial projection models and approved rate increases, as well as an increase in infrastructure fees. Operating expenses of $128.7 million increased 4.0% from 2014-15, which was consistent with expectations.
Convention Center Complex operations, including the Performing Arts venue, delivered $13.8 million of operating revenues in 2015-16, an increase of 3.8% over 2014-15. This increase was a result of continued positive event revenue as compared to the prior year. Operating expenses increased 1.1 million over the prior year. Overall, operations were consistent with expectations.
The parking facilities operations generated $14.9 million of revenues in 2015-16, an increase of 12.9% from 2014-15. This was driven by an increase in unreserved and reserved parking rates, as well as a flat $5 night and weekend parking fee that went into effect mid-year. Parking facilities receives a small subsidy from the general fund. Operating expenses increased 10.3% from the prior year. Parking operations met expectations.
Mass transit operating revenues of $7.1 million reflects a 2.7% decrease from the prior year. Operating expenses remained relatively flat as compared to prior year. The mass transit operations are subsidized by the general fund and at the federal and state level through grant funding.
Stormwater management operating revenues of $17.9 million in 2015-16 are 2.3% higher than in the prior year. Stormwater fees have been positively impacted by continued development and growth throughout the City. Operating expenses of $13.2 million increased 8.2% from 2014-15. Stormwater management results met expectations.
Solid Waste Services operating revenues of $25.6 million increased 6.2% from the prior year, due to an approved solid waste collection fee increase for 2015-16 that reduced the subsidy required of the general fund. Solid waste services operations are partially subsidized by the general fund. Operating expenses increased $3.4 million compared to 2014-15, which is in line with expectations.
City of Raleigh Management’s Discussion and Analysis
Amount in millions
Revenues by Source Business-type Activities - $324.5m
Charges for services - $308.2 m
Operating grants and contributions - $7.7 m
Capital grants and contributions - $4.8 m
Other revenue - $3.8 m
Expenses and Program Revenues*
Business-type ActivitiesExpenses Program Revenues
$275
$250
$225
$200
$175
$150
$125
$100
$75
$50
$25
$-Water and
sewerConvention
CenterComplex
Mass transit
Parking facilities
Stormwatermanagement
Solid wasteservices
$34.7
$13.8
$152.9
$229.9
$38.2
$16.7 $12.4 $15.0 $13.4 $19.2$32.3 $26.1
Mill
ions
* Program revenues include operating revenues, grant revenues and capital contributions
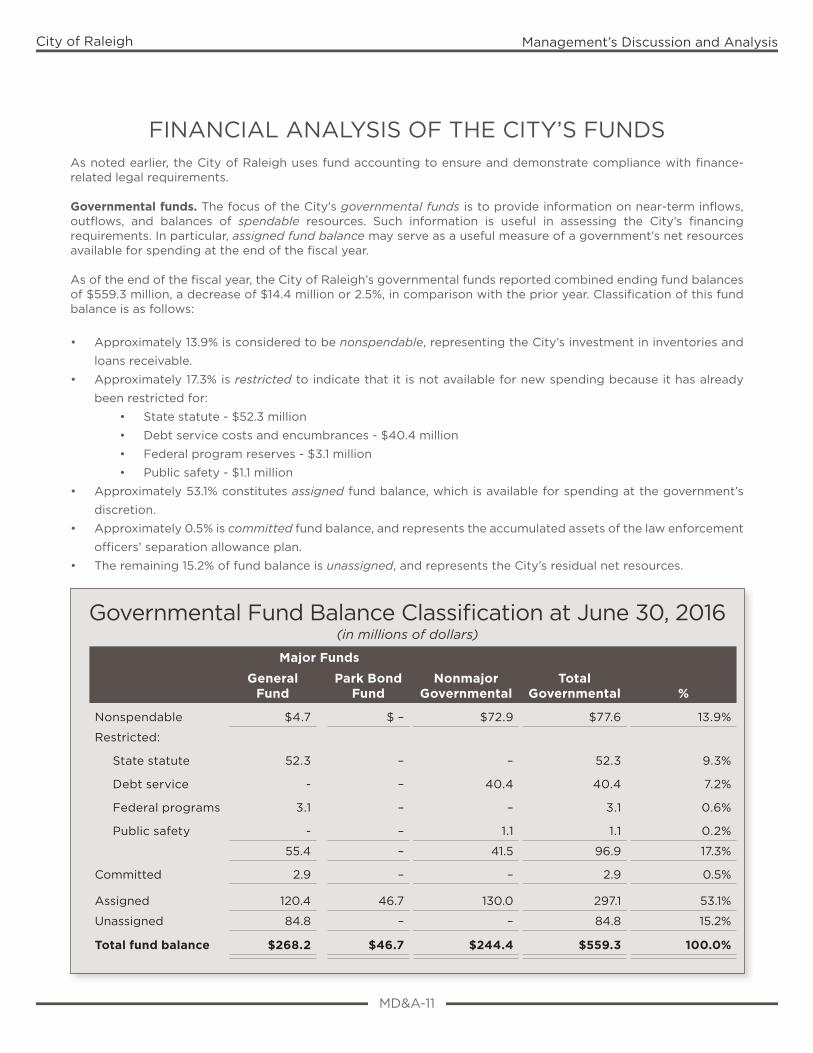
MD&A-11
City of Raleigh Management’s Discussion and Analysis
FINANCIAL ANALYSIS OF THE CITY’S FUNDSAs noted earlier, the City of Raleigh uses fund accounting to ensure and demonstrate compliance with finance-related legal requirements.
Governmental funds. The focus of the City’s governmental funds is to provide information on near-term inflows, outflows, and balances of spendable resources. Such information is useful in assessing the City’s financing requirements. In particular, assigned fund balance may serve as a useful measure of a government’s net resources available for spending at the end of the fiscal year.
As of the end of the fiscal year, the City of Raleigh’s governmental funds reported combined ending fund balances of $559.3 million, a decrease of $14.4 million or 2.5%, in comparison with the prior year. Classification of this fund balance is as follows:
• Approximately 13.9% is considered to be nonspendable, representing the City’s investment in inventories and
loans receivable.
• Approximately 17.3% is restricted to indicate that it is not available for new spending because it has already
been restricted for:
• State statute - $52.3 million
• Debt service costs and encumbrances - $40.4 million
• Federal program reserves - $3.1 million
• Public safety - $1.1 million
• Approximately 53.1% constitutes assigned fund balance, which is available for spending at the government’s
discretion.
• Approximately 0.5% is committed fund balance, and represents the accumulated assets of the law enforcement
officers’ separation allowance plan.
• The remaining 15.2% of fund balance is unassigned, and represents the City’s residual net resources.
Governmental Fund Balance Classification at June 30, 2016(in millions of dollars)
Major FundsGeneral
FundPark Bond
FundNonmajor
GovernmentalTotal
Governmental %
Nonspendable $4.7 $ – $72.9 $77.6 13.9%
Restricted:
State statute 52.3 – – 52.3 9.3%
Debt service - – 40.4 40.4 7.2%
Federal programs 3.1 – – 3.1 0.6%
Public safety - – 1.1 1.1 0.2%
55.4 – 41.5 96.9 17.3%
Committed 2.9 – – 2.9 0.5%
Assigned 120.4 46.7 130.0 297.1 53.1%
Unassigned 84.8 – – 84.8 15.2%
Total fund balance $268.2 $46.7 $244.4 $559.3 100.0%
MD&A-12
The general fund is the chief operating fund of the City. The fund balance of the general fund increased by $18.4 million during the current fiscal year. Revenues continue to show positive growth and were utilized for normal City programs, as well as continued investment in employees.
The North Carolina Local Government Commission strongly recommends that local governments maintain an unassigned fund balance of at least 8.0% of general fund expenditures. The City’s policy is to maintain an unassigned fund balance of at least 14.0% of the succeeding year’s expenditure budget. Unassigned fund balance of $84.8 million represents 17.4% of the 2016-17 general fund expenditure budget. Unassigned fund balance is the amount remaining after management’s policy designations.
Proprietary funds. The City of Raleigh’s proprietary funds provide the same type of information found in the government-wide financial statements, but in more detail. All enterprise funds are treated as major funds and include the water and sewer, convention and performing arts complex, mass transit, stormwater management, parking facilities and solid waste services funds. Additional discussion concerning the finances of these funds has already been addressed in the discussion of the City’s business-type activities.
BUDGETARY HIGHLIGHTSDuring the fiscal year, City Council approved various modifications to the original, approved budget. Generally, budget amendments fall into one of four categories: 1) amendments made to adjust the estimates that are used to prepare the original budget ordinance once final information is available; 2) amendments made to recognize new funding amounts from external sources, such as from Federal or State grants; 3) increases in appropriations that become necessary to maintain services; and 4) amounts that are carried over from the previous year and re-designated for the subsequent year’s expenditures.
General Fund. General fund revenues recognized positive budget variances during 2015-16 with actual results coming in at $8.5 million above final budget. Revenue was positively impacted by continued improvement in both property tax and sales tax, two of the City’s primary revenue streams. General fund expenditures came in well below budget, which resulted in a positive budget variance of $48.4 million. All expenditure functions and departments reported positive budget variances, which is a result of conservative budget practices as well as the City’s cost management efforts.
CAPITAL ASSET AND DEBT ADMINISTRATIONCapital assets. The City of Raleigh’s cumulative investment in capital assets for its governmental and business-type activities, as of June 30, 2016, amounts to $2.9 billion (net of accumulated depreciation). This investment in capital assets includes land, construction in progress, watershed protection rights, buildings and machinery, water and sewer systems, streets and sidewalks, parking decks, buses, equipment, furniture and fixtures, enterprise-wide software and general improvements. The City’s investment in capital assets for the current fiscal year was $152.5 million, a 5.5% increase over prior year.
Major capital asset investments during the fiscal year included the following:
• Construction began and/or was completed for governmental activities including a variety of street, park and
greenway projects. Total governmental projects completed and capitalized in fiscal year 2015-16 were $186.6
million. Examples include:
• The New Communications Center was completed for a total capitalized cost of $66.4 million
• The Central Operations Facility was completed for a total capitalized cost of $54.5 million
• The Falls of Neuse Road Realignment and Widening project was completed for a total capitalized cost
of $20.8 million
• The Perry Creek Road Widening project was completed for a total capitalized cost of $9.4 million
City of Raleigh Management’s Discussion and Analysis
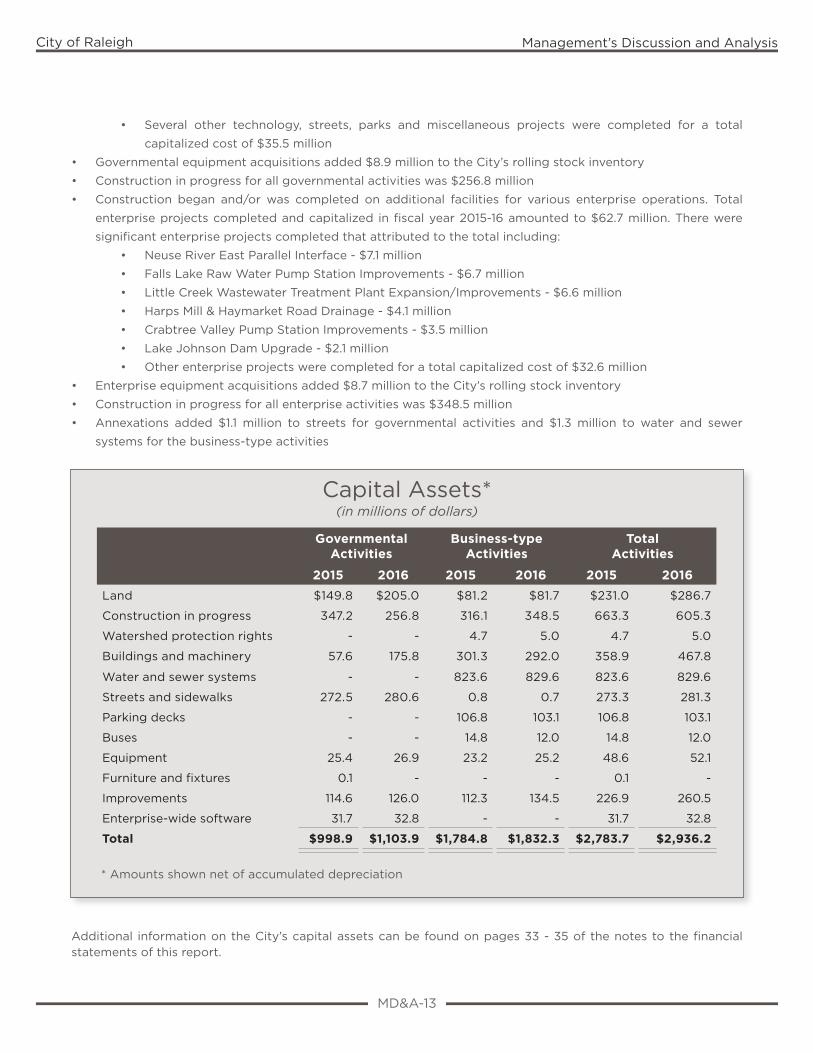
MD&A-13
City of Raleigh Management’s Discussion and Analysis
• Several other technology, streets, parks and miscellaneous projects were completed for a total
capitalized cost of $35.5 million
• Governmental equipment acquisitions added $8.9 million to the City’s rolling stock inventory
• Construction in progress for all governmental activities was $256.8 million
• Construction began and/or was completed on additional facilities for various enterprise operations. Total
enterprise projects completed and capitalized in fiscal year 2015-16 amounted to $62.7 million. There were
significant enterprise projects completed that attributed to the total including:
• Neuse River East Parallel Interface - $7.1 million
• Falls Lake Raw Water Pump Station Improvements - $6.7 million
• Little Creek Wastewater Treatment Plant Expansion/Improvements - $6.6 million
• Harps Mill & Haymarket Road Drainage - $4.1 million
• Crabtree Valley Pump Station Improvements - $3.5 million
• Lake Johnson Dam Upgrade - $2.1 million
• Other enterprise projects were completed for a total capitalized cost of $32.6 million
• Enterprise equipment acquisitions added $8.7 million to the City’s rolling stock inventory
• Construction in progress for all enterprise activities was $348.5 million
• Annexations added $1.1 million to streets for governmental activities and $1.3 million to water and sewer
systems for the business-type activities
Additional information on the City’s capital assets can be found on pages 33 - 35 of the notes to the financial statements of this report.
Capital Assets* (in millions of dollars)
GovernmentalActivities
Business-typeActivities
TotalActivities
2015 2016 2015 2016 2015 2016Land $149.8 $205.0 $81.2 $81.7 $231.0 $286.7
Construction in progress 347.2 256.8 316.1 348.5 663.3 605.3
Watershed protection rights - - 4.7 5.0 4.7 5.0
Buildings and machinery 57.6 175.8 301.3 292.0 358.9 467.8
Water and sewer systems - - 823.6 829.6 823.6 829.6
Streets and sidewalks 272.5 280.6 0.8 0.7 273.3 281.3
Parking decks - - 106.8 103.1 106.8 103.1
Buses - - 14.8 12.0 14.8 12.0
Equipment 25.4 26.9 23.2 25.2 48.6 52.1
Furniture and fixtures 0.1 - - - 0.1 -
Improvements 114.6 126.0 112.3 134.5 226.9 260.5
Enterprise-wide software 31.7 32.8 - - 31.7 32.8
Total $998.9 $1,103.9 $1,784.8 $1,832.3 $2,783.7 $2,936.2
* Amounts shown net of accumulated depreciation
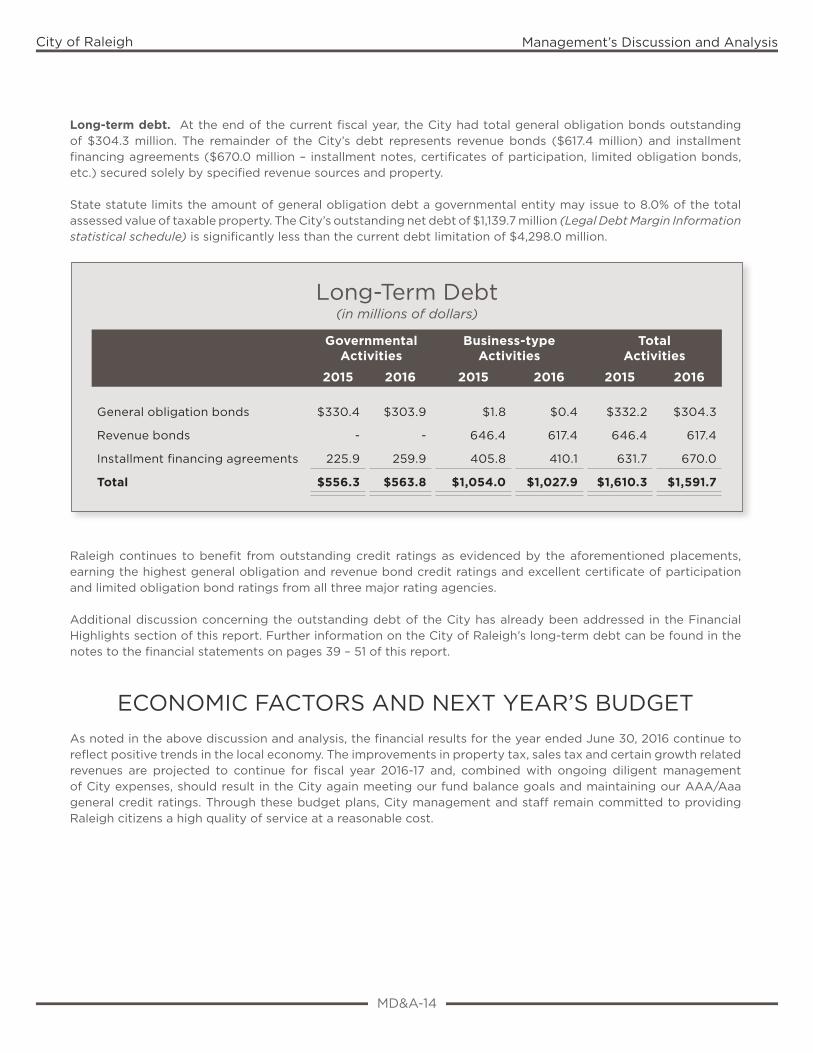
MD&A-14
City of Raleigh Management’s Discussion and Analysis
Long-term debt. At the end of the current fiscal year, the City had total general obligation bonds outstanding of $304.3 million. The remainder of the City’s debt represents revenue bonds ($617.4 million) and installment financing agreements ($670.0 million – installment notes, certificates of participation, limited obligation bonds, etc.) secured solely by specified revenue sources and property.
State statute limits the amount of general obligation debt a governmental entity may issue to 8.0% of the total assessed value of taxable property. The City’s outstanding net debt of $1,139.7 million (Legal Debt Margin Information statistical schedule) is significantly less than the current debt limitation of $4,298.0 million.
Raleigh continues to benefit from outstanding credit ratings as evidenced by the aforementioned placements, earning the highest general obligation and revenue bond credit ratings and excellent certificate of participation and limited obligation bond ratings from all three major rating agencies.
Additional discussion concerning the outstanding debt of the City has already been addressed in the Financial Highlights section of this report. Further information on the City of Raleigh’s long-term debt can be found in the notes to the financial statements on pages 39 – 51 of this report.
ECONOMIC FACTORS AND NEXT YEAR’S BUDGETAs noted in the above discussion and analysis, the financial results for the year ended June 30, 2016 continue to reflect positive trends in the local economy. The improvements in property tax, sales tax and certain growth related revenues are projected to continue for fiscal year 2016-17 and, combined with ongoing diligent management of City expenses, should result in the City again meeting our fund balance goals and maintaining our AAA/Aaa general credit ratings. Through these budget plans, City management and staff remain committed to providing Raleigh citizens a high quality of service at a reasonable cost.
Long-Term Debt(in millions of dollars)
GovernmentalActivities
Business-typeActivities
TotalActivities
2015 2016 2015 2016 2015 2016
General obligation bonds
$330.4 $303.9 $1.8 $0.4 $332.2 $304.3
Revenue bonds - - 646.4 617.4 646.4 617.4
Installment financing agreements 225.9 259.9 405.8 410.1 631.7 670.0
Total $556.3 $563.8 $1,054.0 $1,027.9 $1,610.3 $1,591.7
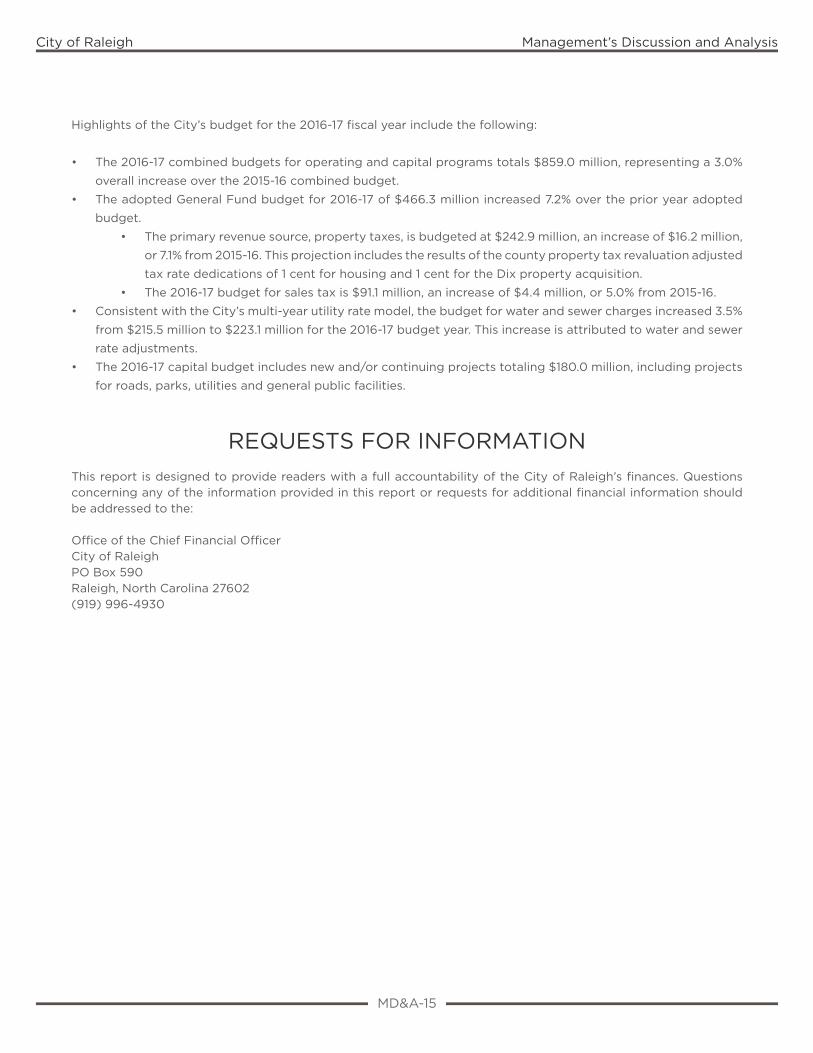
MD&A-15
City of Raleigh Management’s Discussion and Analysis
Highlights of the City’s budget for the 2016-17 fiscal year include the following:
• The 2016-17 combined budgets for operating and capital programs totals $859.0 million, representing a 3.0%
overall increase over the 2015-16 combined budget.
• The adopted General Fund budget for 2016-17 of $466.3 million increased 7.2% over the prior year adopted
budget.
• The primary revenue source, property taxes, is budgeted at $242.9 million, an increase of $16.2 million,
or 7.1% from 2015-16. This projection includes the results of the county property tax revaluation adjusted
tax rate dedications of 1 cent for housing and 1 cent for the Dix property acquisition.
• The 2016-17 budget for sales tax is $91.1 million, an increase of $4.4 million, or 5.0% from 2015-16.
• Consistent with the City’s multi-year utility rate model, the budget for water and sewer charges increased 3.5%
from $215.5 million to $223.1 million for the 2016-17 budget year. This increase is attributed to water and sewer
rate adjustments.
• The 2016-17 capital budget includes new and/or continuing projects totaling $180.0 million, including projects
for roads, parks, utilities and general public facilities.
REQUESTS FOR INFORMATIONThis report is designed to provide readers with a full accountability of the City of Raleigh’s finances. Questions concerning any of the information provided in this report or requests for additional financial information should be addressed to the:
Office of the Chief Financial OfficerCity of RaleighPO Box 590Raleigh, North Carolina 27602(919) 996-4930

City of Raleigh Management’s Discussion and Analysis
1
City of Raleigh Financial Section
Basic Financial StatementsThe Basic Financial Statements provide a dual perspective summary overview of the financial position and operating results of the government as a whole (government-wide financial statements) and of all funds (fund financial statements). They also serve as a condensed introduction to the more detailed statements and schedules that follow.

2
City of Raleigh Financial Section
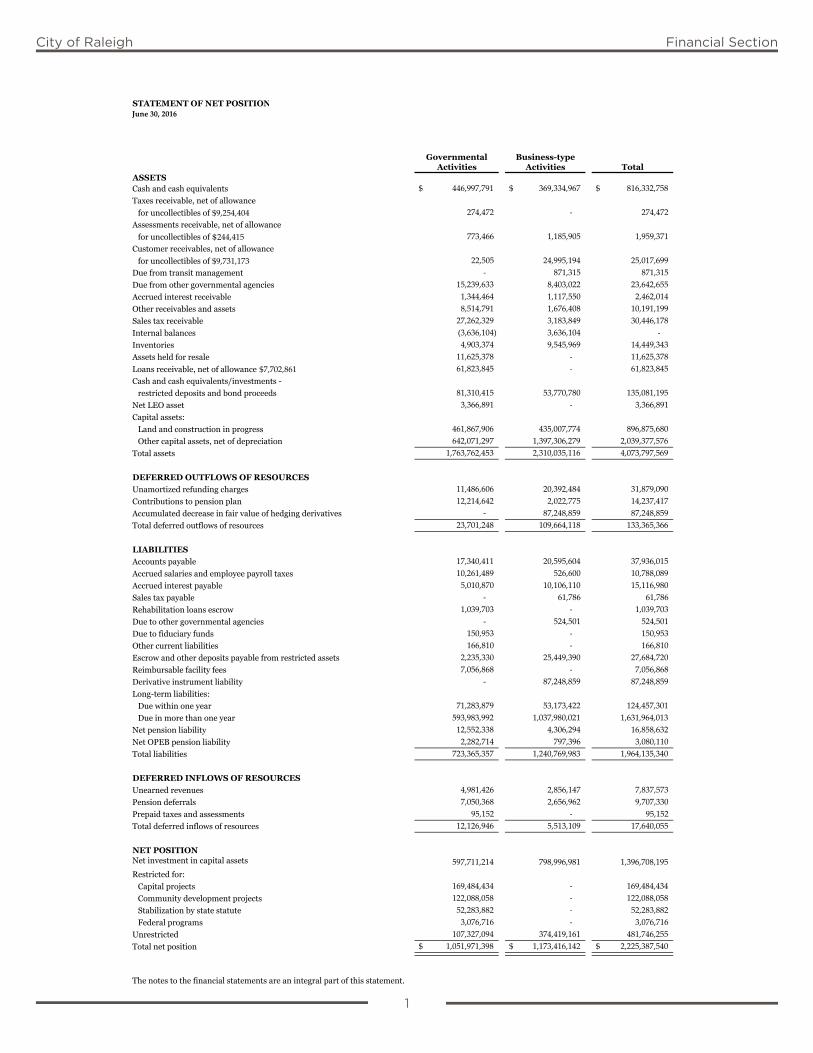
1
City of Raleigh Financial Section
June 30, 2016
446,997,791$ 369,334,967$ 816,332,758$
$9,254,404 274,472 - 274,472
244,415 773,466 1,185,905 1,959,371
$9,731,173 22,505 24,995,194 25,017,699 - 871,315 871,315 15,239,633 8,403,022 23,642,655 1,344,464 1,117,550 2,462,014 8,514,791 1,676,408 10,191,199 27,262,329 3,183,849 30,446,178 (3,636,104) 3,636,104 - 4,903,374 9,545,969 14,449,343 11,625,378 - 11,625,378 $7,702,861 61,823,845 - 61,823,845
81,310,415 53,770,780 135,081,195 3,366,891 - 3,366,891
461,867,906 435,007,774 896,875,680 642,071,297 1,397,306,279 2,039,377,576
1,763,762,453 2,310,035,116 4,073,797,569
11,486,606 20,392,484 31,879,090 12,214,642 2,022,775 14,237,417 - 87,248,859 87,248,859 23,701,248 109,664,118 133,365,366
17,340,411 20,595,604 37,936,015 10,261,489 526,600 10,788,089 5,010,870 10,106,110 15,116,980 - 61,786 61,786 1,039,703 - 1,039,703 - 524,501 524,501 150,953 - 150,953 166,810 - 166,810 2,235,330 25,449,390 27,684,720 7,056,868 - 7,056,868 - 87,248,859 87,248,859
71,283,879 53,173,422 124,457,301 593,983,992 1,037,980,021 1,631,964,013
12,552,338 4,306,294 16,858,632 2,282,714 797,396 3,080,110 723,365,357 1,240,769,983 1,964,135,340
4,981,426 2,856,147 7,837,573 7,050,368 2,656,962 9,707,330 95,152 - 95,152 12,126,946 5,513,109 17,640,055
597,711,214 798,996,981 1,396,708,195
169,484,434 - 169,484,434 122,088,058 - 122,088,058 52,283,882 - 52,283,882 3,076,716 - 3,076,716
107,327,094 374,419,161 481,746,255 1,051,971,398$ 1,173,416,142$ 2,225,387,540$
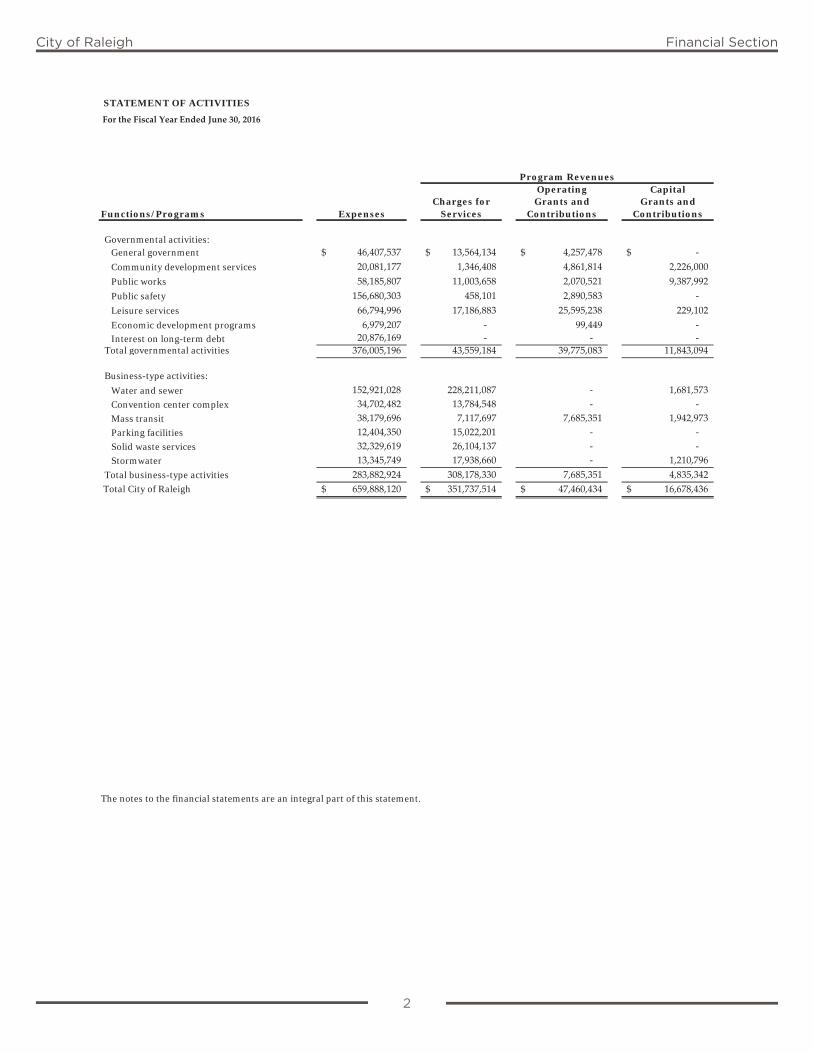
2
City of Raleigh Financial Section
Program RevenuesOperating Capital
Charges for Grants and Grants andFunctions/Programs Expenses Services Contributions Contributions
Governmental activities:General government 46,407,537$ 13,564,134$ 4,257,478$ ‐$ Community development services 20,081,177 1,346,408 4,861,814 2,226,000 Public works 58,185,807 11,003,658 2,070,521 9,387,992 Public safety 156,680,303 458,101 2,890,583 ‐ Leisure services 66,794,996 17,186,883 25,595,238 229,102 Economic development programs 6,979,207 ‐ 99,449 ‐ Interest on long-term debt 20,876,169 ‐ ‐ ‐
Total governmental activities 376,005,196 43,559,184 39,775,083 11,843,094
Business-type activities:
Water and sewer 152,921,028 228,211,087 ‐ 1,681,573 Convention center complex 34,702,482 13,784,548 ‐ ‐ Mass transit 38,179,696 7,117,697 7,685,351 1,942,973 Parking facilities 12,404,350 15,022,201 ‐ ‐ Solid waste services 32,329,619 26,104,137 ‐ ‐ Stormwater 13,345,749 17,938,660 ‐ 1,210,796
Total business-type activities 283,882,924 308,178,330 7,685,351 4,835,342 Total City of Raleigh 659,888,120$ 351,737,514$ 47,460,434$ 16,678,436$
The notes to the financial statements are an integral part of this statement.
STATEMENT OF ACTIVITIES
For the Fiscal Year Ended June 30, 2016
2
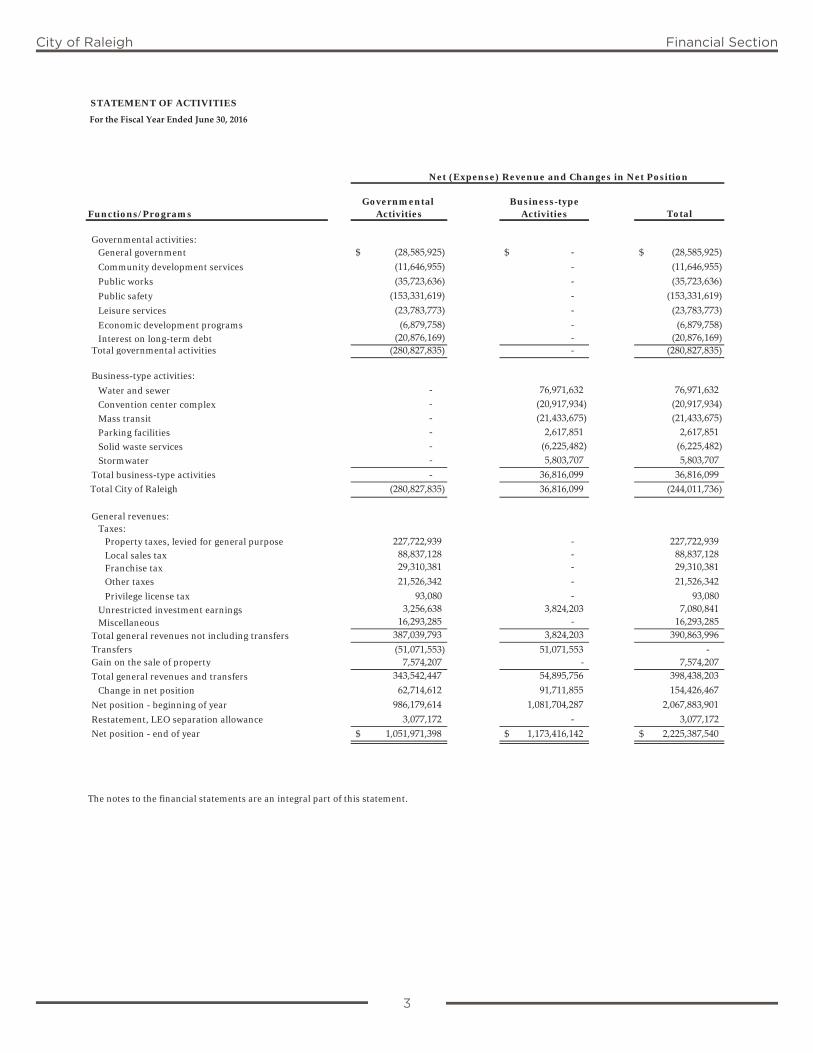
3
City of Raleigh Financial Section
Net (Expense) Revenue and Changes in Net Position
Governmental Business-typeFunctions/Programs Activities Activities Total
Governmental activities:General government (28,585,925)$ ‐$ (28,585,925)$ Community development services (11,646,955) ‐ (11,646,955) Public works (35,723,636) ‐ (35,723,636) Public safety (153,331,619) ‐ (153,331,619) Leisure services (23,783,773) ‐ (23,783,773) Economic development programs (6,879,758) ‐ (6,879,758) Interest on long-term debt (20,876,169) ‐ (20,876,169)
Total governmental activities (280,827,835) ‐ (280,827,835)
Business-type activities:
Water and sewer ‐ 76,971,632 76,971,632 Convention center complex ‐ (20,917,934) (20,917,934) Mass transit ‐ (21,433,675) (21,433,675) Parking facilities ‐ 2,617,851 2,617,851 Solid waste services ‐ (6,225,482) (6,225,482) Stormwater ‐ 5,803,707 5,803,707
Total business-type activities ‐ 36,816,099 36,816,099 Total City of Raleigh (280,827,835) 36,816,099 (244,011,736)
General revenues:Taxes:
Property taxes, levied for general purpose 227,722,939 ‐ 227,722,939 Local sales tax 88,837,128 ‐ 88,837,128 Franchise tax 29,310,381 ‐ 29,310,381 Other taxes 21,526,342 ‐ 21,526,342 Privilege license tax 93,080 ‐ 93,080
Unrestricted investment earnings 3,256,638 3,824,203 7,080,841 Miscellaneous 16,293,285 ‐ 16,293,285
Total general revenues not including transfers 387,039,793 3,824,203 390,863,996 Transfers (51,071,553) 51,071,553 ‐ Gain on the sale of property 7,574,207 ‐ 7,574,207 Total general revenues and transfers 343,542,447 54,895,756 398,438,203
Change in net position 62,714,612 91,711,855 154,426,467 Net position - beginning of year 986,179,614 1,081,704,287 2,067,883,901 Restatement, LEO separation allowance 3,077,172 ‐ 3,077,172 Net position - end of year 1,051,971,398$ 1,173,416,142$ 2,225,387,540$
The notes to the financial statements are an integral part of this statement.
STATEMENT OF ACTIVITIES
For the Fiscal Year Ended June 30, 2016
3
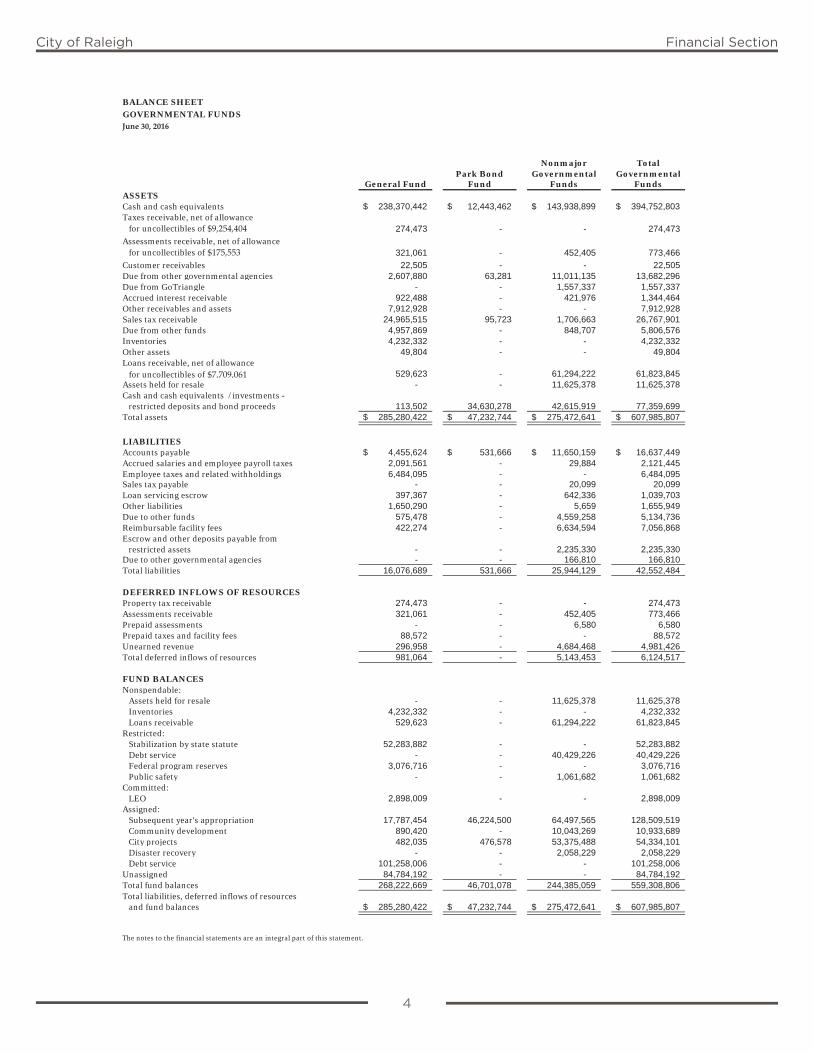
4
City of Raleigh Financial Section
BALANCE SHEETGOVERNMENTAL FUNDSJune 30, 2016
Nonmajor TotalPark Bond Governmental Governmental
General Fund Fund Funds FundsASSETSCash and cash equivalents 238,370,442$ 12,443,462$ 143,938,899$ 394,752,803$ Taxes receivable, net of allowance for uncollectibles of $9,254,404 274,473 - - 274,473
Assessments receivable, net of allowance for uncollectibles of $175,553 321,061 - 452,405 773,466
Customer receivables 22,505 - - 22,505 Due from other governmental agencies 2,607,880 63,281 11,011,135 13,682,296 Due from GoTriangle - - 1,557,337 1,557,337 Accrued interest receivable 922,488 - 421,976 1,344,464 Other receivables and assets 7,912,928 - - 7,912,928 Sales tax receivable 24,965,515 95,723 1,706,663 26,767,901 Due from other funds 4,957,869 - 848,707 5,806,576 Inventories 4,232,332 - - 4,232,332 Other assets 49,804 - - 49,804 Loans receivable, net of allowance for uncollectibles of $7,709,061 529,623 - 61,294,222 61,823,845 Assets held for resale - - 11,625,378 11,625,378 Cash and cash equivalents /investments -
restricted deposits and bond proceeds 113,502 34,630,278 42,615,919 77,359,699 Total assets 285,280,422$ 47,232,744$ 275,472,641$ 607,985,807$
LIABILITIESAccounts payable 4,455,624$ 531,666$ 11,650,159$ 16,637,449$ Accrued salaries and employee payroll taxes 2,091,561 - 29,884 2,121,445 Employee taxes and related withholdings 6,484,095 - - 6,484,095 Sales tax payable - - 20,099 20,099 Loan servicing escrow 397,367 - 642,336 1,039,703 Other liabilities 1,650,290 - 5,659 1,655,949 Due to other funds 575,478 - 4,559,258 5,134,736 Reimbursable facility fees 422,274 - 6,634,594 7,056,868 Escrow and other deposits payable from
restricted assets - - 2,235,330 2,235,330 Due to other governmental agencies - - 166,810 166,810 Total liabilities 16,076,689 531,666 25,944,129 42,552,484
DEFERRED INFLOWS OF RESOURCESProperty tax receivable 274,473 - - 274,473 Assessments receivable 321,061 - 452,405 773,466 Prepaid assessments - - 6,580 6,580 Prepaid taxes and facility fees 88,572 - - 88,572 Unearned revenue 296,958 - 4,684,468 4,981,426 Total deferred inflows of resources 981,064 - 5,143,453 6,124,517
FUND BALANCESNonspendable:
Assets held for resale - - 11,625,378 11,625,378 Inventories 4,232,332 - - 4,232,332 Loans receivable 529,623 - 61,294,222 61,823,845
Restricted:Stabilization by state statute 52,283,882 - - 52,283,882 Debt service - - 40,429,226 40,429,226 Federal program reserves 3,076,716 - - 3,076,716 Public safety - - 1,061,682 1,061,682
Committed:LEO 2,898,009 - - 2,898,009
Assigned:Subsequent year's appropriation 17,787,454 46,224,500 64,497,565 128,509,519 Community development 890,420 - 10,043,269 10,933,689 City projects 482,035 476,578 53,375,488 54,334,101 Disaster recovery - - 2,058,229 2,058,229 Debt service 101,258,006 - - 101,258,006
Unassigned 84,784,192 - - 84,784,192 Total fund balances 268,222,669 46,701,078 244,385,059 559,308,806 Total liabilities, deferred inflows of resources and fund balances 285,280,422$ 47,232,744$ 275,472,641$ 607,985,807$
The notes to the financial statements are an integral part of this statement.
4
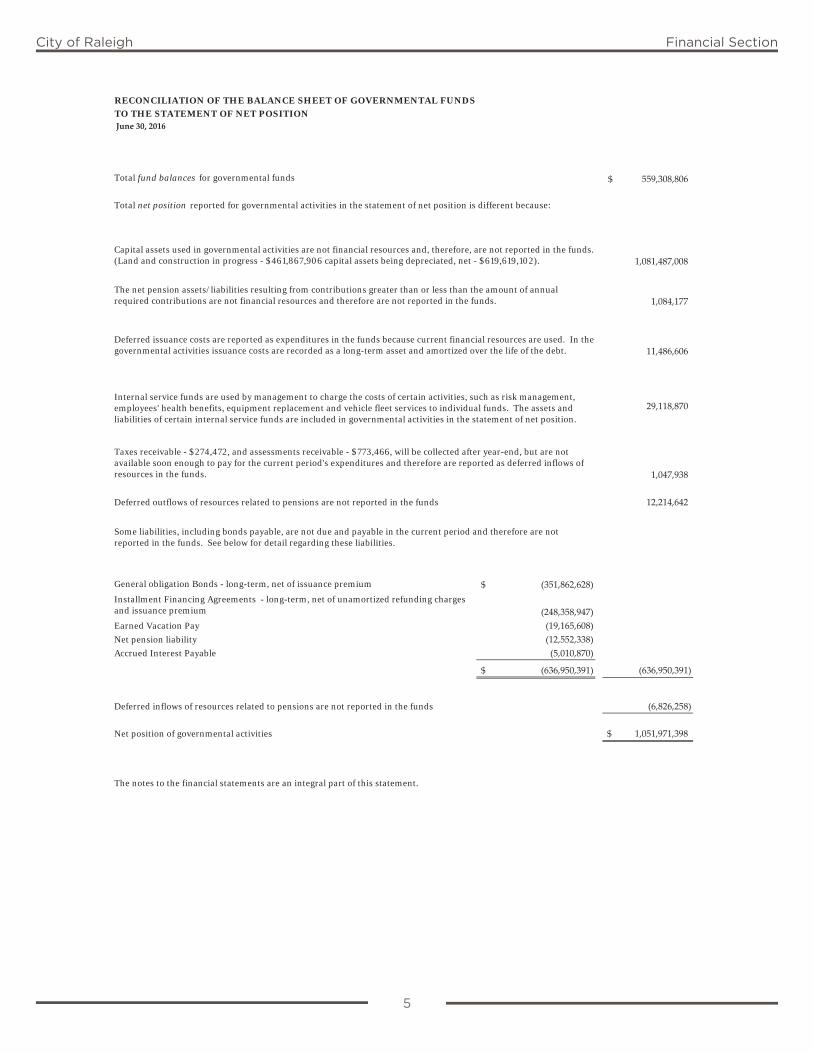
5
City of Raleigh Financial Section
RECONCILIATION OF THE BALANCE SHEET OF GOVERNMENTAL FUNDS
TO THE STATEMENT OF NET POSITION June 30, 2016
Total fund balances for governmental funds 559,308,806$
Total net position reported for governmental activities in the statement of net position is different because:
1,081,487,008
1,084,177
11,486,606
29,118,870
1,047,938
Deferred outflows of resources related to pensions are not reported in the funds 12,214,642
(351,862,628)$
(248,358,947) Earned Vacation Pay (19,165,608) Net pension liability (12,552,338) Accrued Interest Payable (5,010,870)
(636,950,391)$ (636,950,391)
Deferred inflows of resources related to pensions are not reported in the funds (6,826,258)
Net position of governmental activities 1,051,971,398$
The notes to the financial statements are an integral part of this statement.
Some liabilities, including bonds payable, are not due and payable in the current period and therefore are not reported in the funds. See below for detail regarding these liabilities.
General obligation Bonds - long-term, net of issuance premium
Installment Financing Agreements - long-term, net of unamortized refunding charges and issuance premium
The net pension assets/liabilities resulting from contributions greater than or less than the amount of annual required contributions are not financial resources and therefore are not reported in the funds.
Capital assets used in governmental activities are not financial resources and, therefore, are not reported in the funds.(Land and construction in progress - $461,867,906 capital assets being depreciated, net - $619,619,102).
Deferred issuance costs are reported as expenditures in the funds because current financial resources are used. In the governmental activities issuance costs are recorded as a long-term asset and amortized over the life of the debt.
Internal service funds are used by management to charge the costs of certain activities, such as risk management, employees' health benefits, equipment replacement and vehicle fleet services to individual funds. The assets and liabilities of certain internal service funds are included in governmental activities in the statement of net position.
Taxes receivable - $274,472, and assessments receivable - $773,466, will be collected after year-end, but are not available soon enough to pay for the current period's expenditures and therefore are reported as deferred inflows of resources in the funds.
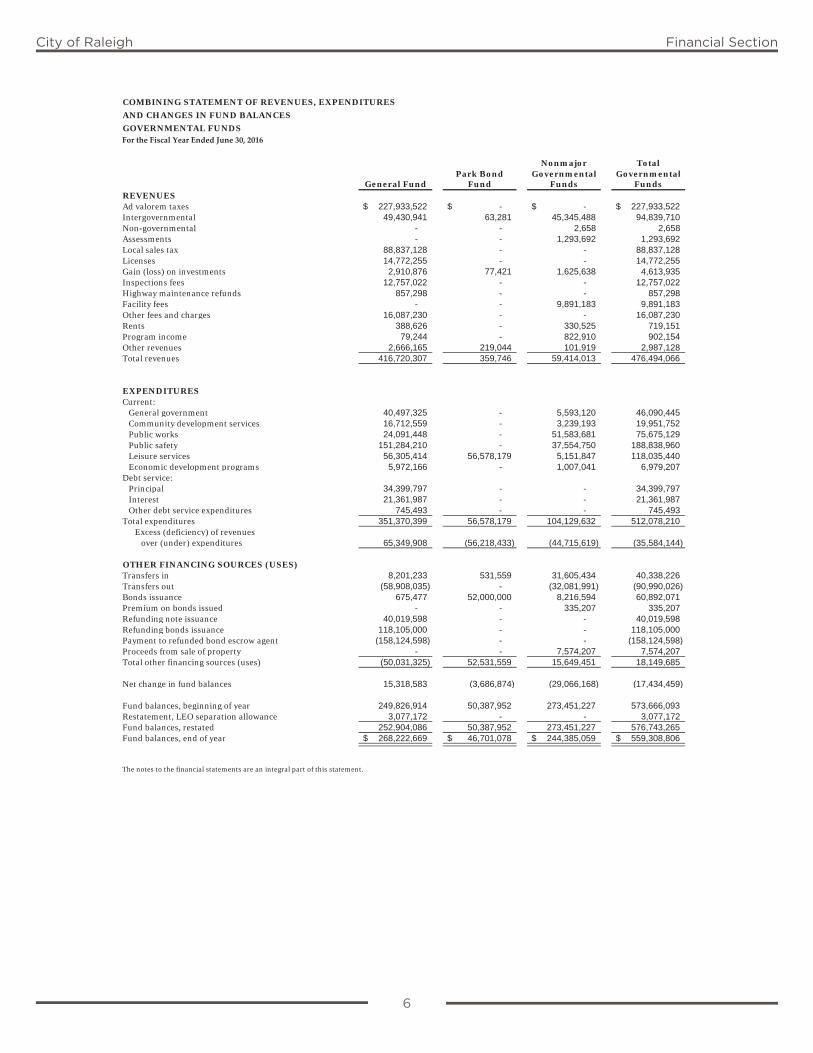
6
City of Raleigh Financial Section
COMBINING STATEMENT OF REVENUES, EXPENDITURES
AND CHANGES IN FUND BALANCES
GOVERNMENTAL FUNDSFor the Fiscal Year Ended June 30, 2016
Nonmajor TotalPark Bond Governmental Governmental
General Fund Fund Funds FundsREVENUESAd valorem taxes 227,933,522$ -$ -$ 227,933,522$ Intergovernmental 49,430,941 63,281 45,345,488 94,839,710 Non-governmental - - 2,658 2,658 Assessments - - 1,293,692 1,293,692 Local sales tax 88,837,128 - - 88,837,128 Licenses 14,772,255 - - 14,772,255 Gain (loss) on investments 2,910,876 77,421 1,625,638 4,613,935 Inspections fees 12,757,022 - - 12,757,022 Highway maintenance refunds 857,298 - - 857,298 Facility fees - - 9,891,183 9,891,183 Other fees and charges 16,087,230 - - 16,087,230 Rents 388,626 - 330,525 719,151 Program income 79,244 - 822,910 902,154 Other revenues 2,666,165 219,044 101,919 2,987,128 Total revenues 416,720,307 359,746 59,414,013 476,494,066
EXPENDITURESCurrent:
General government 40,497,325 - 5,593,120 46,090,445 Community development services 16,712,559 - 3,239,193 19,951,752 Public works 24,091,448 - 51,583,681 75,675,129 Public safety 151,284,210 - 37,554,750 188,838,960 Leisure services 56,305,414 56,578,179 5,151,847 118,035,440 Economic development programs 5,972,166 - 1,007,041 6,979,207
Debt service:Principal 34,399,797 - - 34,399,797 Interest 21,361,987 - - 21,361,987 Other debt service expenditures 745,493 - - 745,493
Total expenditures 351,370,399 56,578,179 104,129,632 512,078,210 Excess (deficiency) of revenues
over (under) expenditures 65,349,908 (56,218,433) (44,715,619) (35,584,144)
OTHER FINANCING SOURCES (USES)Transfers in 8,201,233 531,559 31,605,434 40,338,226 Transfers out (58,908,035) - (32,081,991) (90,990,026) Bonds issuance 675,477 52,000,000 8,216,594 60,892,071 Premium on bonds issued - - 335,207 335,207 Refunding note issuance 40,019,598 - - 40,019,598 Refunding bonds issuance 118,105,000 - - 118,105,000 Payment to refunded bond escrow agent (158,124,598) - - (158,124,598) Proceeds from sale of property - - 7,574,207 7,574,207 Total other financing sources (uses) (50,031,325) 52,531,559 15,649,451 18,149,685
Net change in fund balances 15,318,583 (3,686,874) (29,066,168) (17,434,459)
Fund balances, beginning of year 249,826,914 50,387,952 273,451,227 573,666,093 Restatement, LEO separation allowance 3,077,172 - - 3,077,172 Fund balances, restated 252,904,086 50,387,952 273,451,227 576,743,265 Fund balances, end of year 268,222,669$ 46,701,078$ 244,385,059$ 559,308,806$
The notes to the financial statements are an integral part of this statement.
6
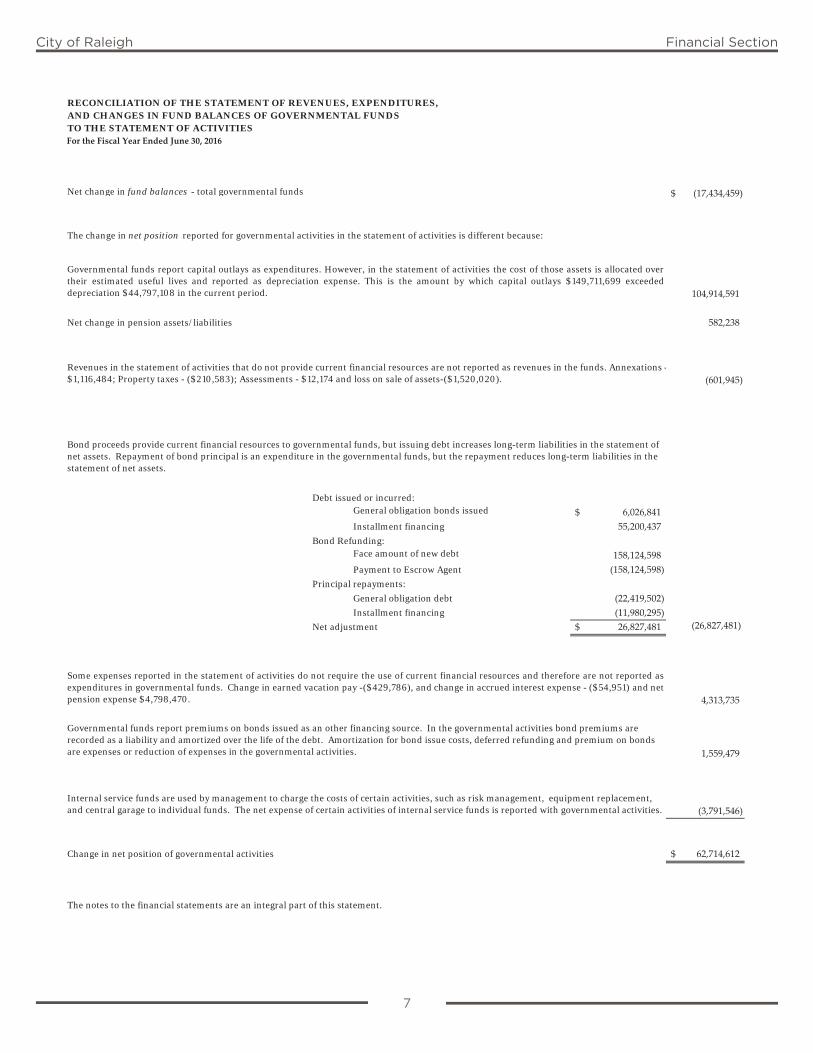
7
City of Raleigh Financial Section
Net change in fund balances - total governmental funds (17,434,459)$
104,914,591
Net change in pension assets/liabilities 582,238
(601,945)
Debt issued or incurred:General obligation bonds issued 6,026,841$ Installment financing 55,200,437
Bond Refunding:Face amount of new debt 158,124,598 Payment to Escrow Agent (158,124,598)
Principal repayments:
General obligation debt (22,419,502) Installment financing (11,980,295)
Net adjustment 26,827,481$ (26,827,481)
4,313,735
1,559,479
(3,791,546)
Change in net position of governmental activities 62,714,612$
The notes to the financial statements are an integral part of this statement.
Revenues in the statement of activities that do not provide current financial resources are not reported as revenues in the funds. Annexations -$1,116,484; Property taxes - ($210,583); Assessments - $12,174 and loss on sale of assets-($1,520,020).
Bond proceeds provide current financial resources to governmental funds, but issuing debt increases long-term liabilities in the statement of net assets. Repayment of bond principal is an expenditure in the governmental funds, but the repayment reduces long-term liabilities in the statement of net assets.
Some expenses reported in the statement of activities do not require the use of current financial resources and therefore are not reported asexpenditures in governmental funds. Change in earned vacation pay -($429,786), and change in accrued interest expense - ($54,951) and netpension expense $4,798,470.
Governmental funds report premiums on bonds issued as an other financing source. In the governmental activities bond premiums are recorded as a liability and amortized over the life of the debt. Amortization for bond issue costs, deferred refunding and premium on bonds are expenses or reduction of expenses in the governmental activities.
Internal service funds are used by management to charge the costs of certain activities, such as risk management, equipment replacement, and central garage to individual funds. The net expense of certain activities of internal service funds is reported with governmental activities.
RECONCILIATION OF THE STATEMENT OF REVENUES, EXPENDITURES,AND CHANGES IN FUND BALANCES OF GOVERNMENTAL FUNDSTO THE STATEMENT OF ACTIVITIESFor the Fiscal Year Ended June 30, 2016
The change in net position reported for governmental activities in the statement of activities is different because:
Governmental funds report capital outlays as expenditures. However, in the statement of activities the cost of those assets is allocated overtheir estimated useful lives and reported as depreciation expense. This is the amount by which capital outlays $149,711,699 exceededdepreciation $44,797,108 in the current period.
7
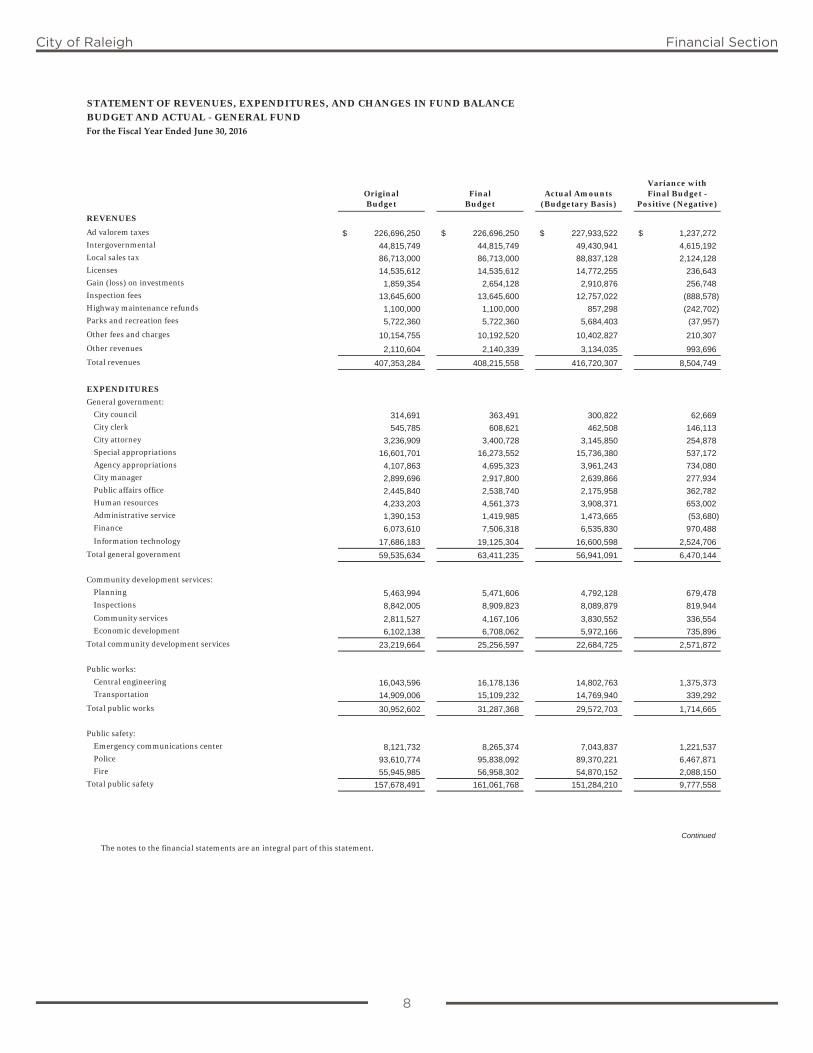
8
City of Raleigh Financial Section
STATEMENT OF REVENUES, EXPENDITURES, AND CHANGES IN FUND BALANCE
OriginalBudget
FinalBudget
Actual Amounts (Budgetary Basis)
Variance with Final Budget -
Positive (Negative)
REVENUES
Ad valorem taxes 226,696,250$ 226,696,250$ 227,933,522$ 1,237,272$ Intergovernmental 44,815,749 44,815,749 49,430,941 4,615,192 Local sales tax 86,713,000 86,713,000 88,837,128 2,124,128 Licenses 14,535,612 14,535,612 14,772,255 236,643 Gain (loss) on investments 1,859,354 2,654,128 2,910,876 256,748 Inspection fees 13,645,600 13,645,600 12,757,022 (888,578) Highway maintenance refunds 1,100,000 1,100,000 857,298 (242,702) Parks and recreation fees 5,722,360 5,722,360 5,684,403 (37,957)
Other fees and charges 10,154,755 10,192,520 10,402,827 210,307
Other revenues 2,110,604 2,140,339 3,134,035 993,696
Total revenues 407,353,284 408,215,558 416,720,307 8,504,749
EXPENDITURES
General government:
City council 314,691 363,491 300,822 62,669 City clerk 545,785 608,621 462,508 146,113 City attorney 3,236,909 3,400,728 3,145,850 254,878 Special appropriations 16,601,701 16,273,552 15,736,380 537,172 Agency appropriations 4,107,863 4,695,323 3,961,243 734,080City manager 2,899,696 2,917,800 2,639,866 277,934 Public affairs office 2,445,840 2,538,740 2,175,958 362,782 Human resources 4,233,203 4,561,373 3,908,371 653,002 Administrative service 1,390,153 1,419,985 1,473,665 (53,680) Finance 6,073,610 7,506,318 6,535,830 970,488
Information technology 17,686,183 19,125,304 16,600,598 2,524,706
Total general government 59,535,634 63,411,235 56,941,091 6,470,144
Community development services:
Planning 5,463,994 5,471,606 4,792,128 679,478 Inspections 8,842,005 8,909,823 8,089,879 819,944
Community services 2,811,527 4,167,106 3,830,552 336,554 Economic development 6,102,138 6,708,062 5,972,166 735,896
Total community development services 23,219,664 25,256,597 22,684,725 2,571,872
Public works:
Central engineering 16,043,596 16,178,136 14,802,763 1,375,373 Transportation 14,909,006 15,109,232 14,769,940 339,292
Total public works 30,952,602 31,287,368 29,572,703 1,714,665
Public safety:
Emergency communications center 8,121,732 8,265,374 7,043,837 1,221,537 Police 93,610,774 95,838,092 89,370,221 6,467,871Fire 55,945,985 56,958,302 54,870,152 2,088,150
Total public safety 157,678,491 161,061,768 151,284,210 9,777,558
Continued
The notes to the financial statements are an integral part of this statement.
BUDGET AND ACTUAL - GENERAL FUNDFor the Fiscal Year Ended June 30, 2016
8
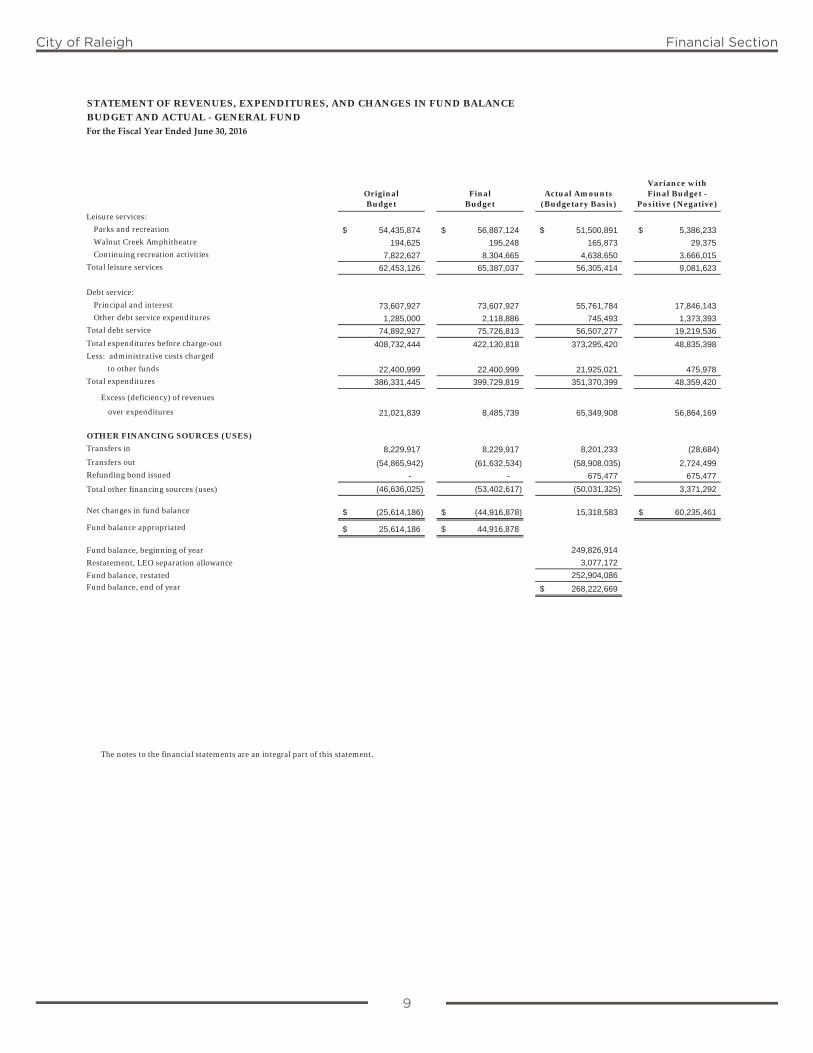
9
City of Raleigh Financial Section
STATEMENT OF REVENUES, EXPENDITURES, AND CHANGES IN FUND BALANCE
OriginalBudget
FinalBudget
Actual Amounts (Budgetary Basis)
Variance with Final Budget -
Positive (Negative)
BUDGET AND ACTUAL - GENERAL FUNDFor the Fiscal Year Ended June 30, 2016
Leisure services:
Parks and recreation 54,435,874$ 56,887,124$ 51,500,891$ 5,386,233$ Walnut Creek Amphitheatre 194,625 195,248 165,873 29,375 Continuing recreation activities 7,822,627 8,304,665 4,638,650 3,666,015
Total leisure services 62,453,126 65,387,037 56,305,414 9,081,623
Debt service:
Principal and interest 73,607,927 73,607,927 55,761,784 17,846,143 Other debt service expenditures 1,285,000 2,118,886 745,493 1,373,393
Total debt service 74,892,927 75,726,813 56,507,277 19,219,536
Total expenditures before charge-out 408,732,444 422,130,818 373,295,420 48,835,398 Less: administrative costs charged
to other funds 22,400,999 22,400,999 21,925,021 475,978 Total expenditures 386,331,445 399,729,819 351,370,399 48,359,420
Excess (deficiency) of revenues
over expenditures 21,021,839 8,485,739 65,349,908 56,864,169
OTHER FINANCING SOURCES (USES)
Transfers in 8,229,917 8,229,917 8,201,233 (28,684)
Transfers out (54,865,942) (61,632,534) (58,908,035) 2,724,499 Refunding bond issued - - 675,477 675,477
Total other financing sources (uses) (46,636,025) (53,402,617) (50,031,325) 3,371,292
Net changes in fund balance (25,614,186)$ (44,916,878)$ 15,318,583 60,235,461$
Fund balance appropriated 25,614,186$ 44,916,878$
Fund balance, beginning of year 249,826,914
Restatement, LEO separation allowance 3,077,172
Fund balance, restated 252,904,086
Fund balance, end of year 268,222,669$
The notes to the financial statements are an integral part of this statement.
9

10
City of Raleigh Financial Section
SCHEDULE OF REVENUES AND EXPENDITURES BUDGET AND ACTUAL - PARK BOND FUNDFor the Fiscal Year Ended June 30, 2016
OverPrior Current (Under)Years Year Total Budget Budget
REVENUESIntergovernmental:
State of North Carolina $ 607,031 $ 63,281 $ 670,312 $ 925,000 $ (254,688) North Carolina Department of Environment and Natural Resources - - - 200,000 (200,000) Other local sources 50,000 - 50,000 50,000 -
Gain (loss) on investments - 77,421 77,421 - 77,421 Miscellaneous other - 219,044 219,044 - 219,044
Total revenues 657,031 359,746 1,016,777 1,175,000 (158,223)
OTHER FINANCING SOURCESTransfers from:
General fund - 531,559 531,559 531,559 - Issuance of debt 46,055,006 52,000,000 98,055,006 116,205,006 (18,150,000)Premium on issuance of debt 2,094,501 - 2,094,501 2,094,501 -
Total other financing sources 48,149,507 52,531,559 100,681,066 118,831,066 (18,150,000)
Total revenues and other financing sources $ 48,806,538 $ 52,891,305 $ 101,697,843 120,006,066 $ (18,308,223)
Fund balance appropriated 53,480,490 $ 173,486,556
EXPENDITURESLeisure services $ 74,163,976 $ 56,578,179 $ 130,742,155 $ 173,486,556 $ (42,744,401)
Actual
10
11
City of Raleigh Financial Section
LEFT BLANK INTENTIONALLY
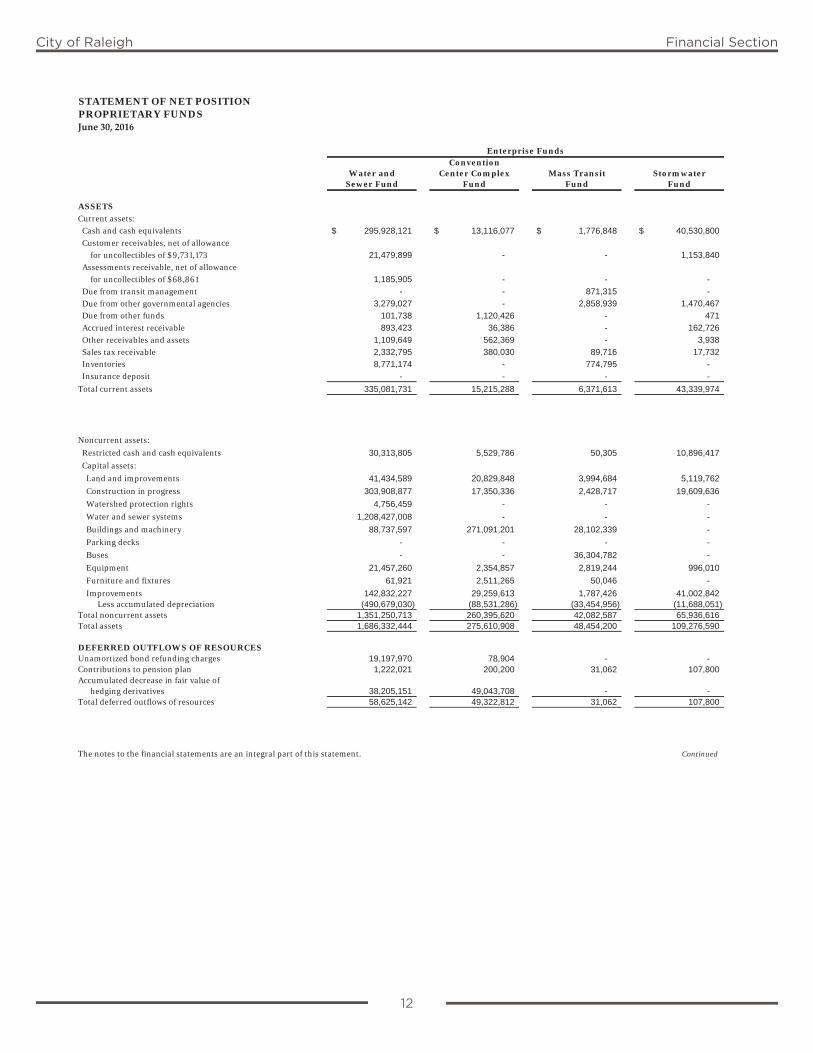
12
City of Raleigh Financial Section
STATEMENT OF NET POSITIONPROPRIETARY FUNDSJune 30, 2016
ConventionWater and Center Complex Mass Transit Stormwater
Sewer Fund Fund Fund Fund
ASSETSCurrent assets: Cash and cash equivalents 295,928,121$ 13,116,077$ 1,776,848$ 40,530,800$
Customer receivables, net of allowance for uncollectibles of $9,731,173 21,479,899 - - 1,153,840
Assessments receivable, net of allowance for uncollectibles of $68,861 1,185,905 - - -
Due from transit management - - 871,315 -
Due from other governmental agencies 3,279,027 - 2,858,939 1,470,467 Due from other funds 101,738 1,120,426 - 471
Accrued interest receivable 893,423 36,386 - 162,726
Other receivables and assets 1,109,649 562,369 - 3,938
Sales tax receivable 2,332,795 380,030 89,716 17,732 Inventories 8,771,174 - 774,795 - Insurance deposit - - - -
Total current assets 335,081,731 15,215,288 6,371,613 43,339,974
Noncurrent assets:
Restricted cash and cash equivalents 30,313,805 5,529,786 50,305 10,896,417
Capital assets:
Land and improvements 41,434,589 20,829,848 3,994,684 5,119,762
Construction in progress 303,908,877 17,350,336 2,428,717 19,609,636
Watershed protection rights 4,756,459 - - -
Water and sewer systems 1,208,427,008 - - -
Buildings and machinery 88,737,597 271,091,201 28,102,339 -
Parking decks - - - -
Buses - - 36,304,782 -
Equipment 21,457,260 2,354,857 2,819,244 996,010
Furniture and fixtures 61,921 2,511,265 50,046 -
Improvements 142,832,227 29,259,613 1,787,426 41,002,842 Less accumulated depreciation (490,679,030) (88,531,286) (33,454,956) (11,688,051)
Total noncurrent assets 1,351,250,713 260,395,620 42,082,587 65,936,616Total assets 1,686,332,444 275,610,908 48,454,200 109,276,590
DEFERRED OUTFLOWS OF RESOURCESUnamortized bond refunding charges 19,197,970 78,904 - -Contributions to pension plan 1,222,021 200,200 31,062 107,800Accumulated decrease in fair value of hedging derivatives 38,205,151 49,043,708 - -Total deferred outflows of resources 58,625,142 49,322,812 31,062 107,800
The notes to the financial statements are an integral part of this statement. Continued
Enterprise Funds
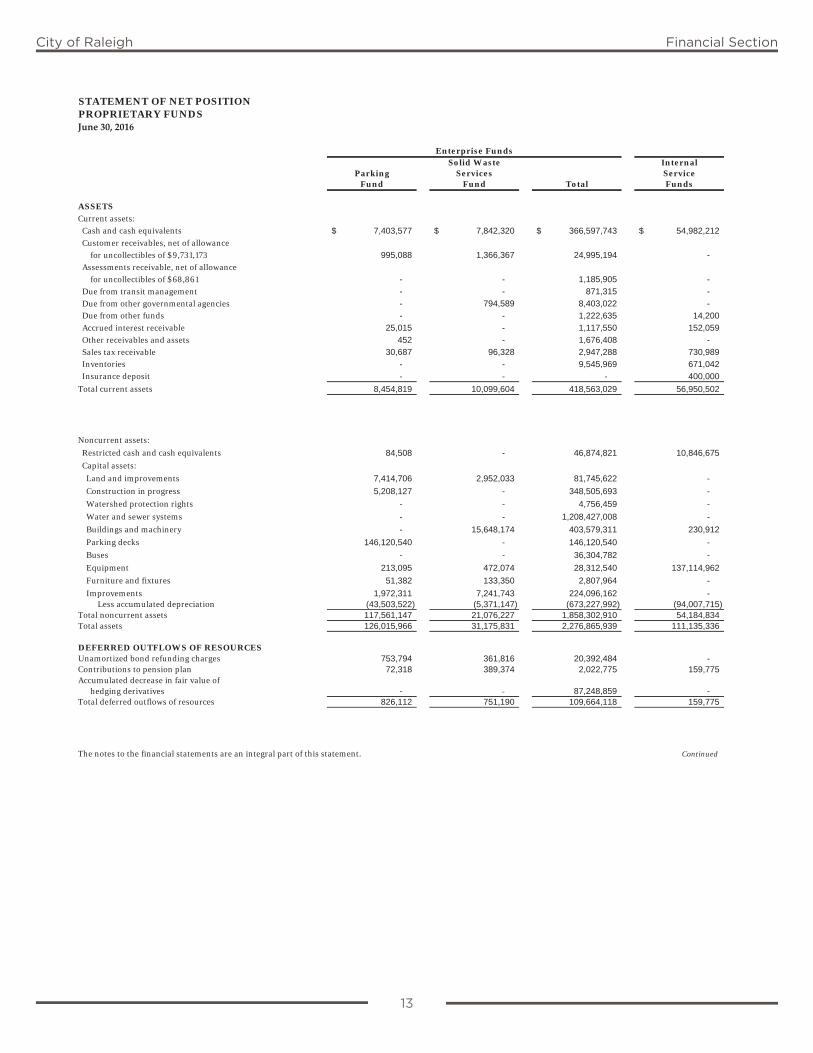
13
City of Raleigh Financial Section
STATEMENT OF NET POSITIONPROPRIETARY FUNDSJune 30, 2016
Solid Waste InternalParking Services Service
Fund Fund Total Funds
ASSETSCurrent assets: Cash and cash equivalents 7,403,577$ 7,842,320$ 366,597,743$ 54,982,212$
Customer receivables, net of allowance for uncollectibles of $9,731,173 995,088 1,366,367 24,995,194 -
Assessments receivable, net of allowance for uncollectibles of $68,861 - - 1,185,905 -
Due from transit management - - 871,315 -
Due from other governmental agencies - 794,589 8,403,022 - Due from other funds - - 1,222,635 14,200
Accrued interest receivable 25,015 - 1,117,550 152,059
Other receivables and assets 452 - 1,676,408 -
Sales tax receivable 30,687 96,328 2,947,288 730,989 Inventories - - 9,545,969 671,042 Insurance deposit - - - 400,000
Total current assets 8,454,819 10,099,604 418,563,029 56,950,502
Noncurrent assets:
Restricted cash and cash equivalents 84,508 - 46,874,821 10,846,675
Capital assets:
Land and improvements 7,414,706 2,952,033 81,745,622 -
Construction in progress 5,208,127 - 348,505,693 -
Watershed protection rights - - 4,756,459 -
Water and sewer systems - - 1,208,427,008 -
Buildings and machinery - 15,648,174 403,579,311 230,912
Parking decks 146,120,540 - 146,120,540 -
Buses - - 36,304,782 -
Equipment 213,095 472,074 28,312,540 137,114,962
Furniture and fixtures 51,382 133,350 2,807,964 -
Improvements 1,972,311 7,241,743 224,096,162 - Less accumulated depreciation (43,503,522) (5,371,147) (673,227,992) (94,007,715)
Total noncurrent assets 117,561,147 21,076,227 1,858,302,910 54,184,834Total assets 126,015,966 31,175,831 2,276,865,939 111,135,336
DEFERRED OUTFLOWS OF RESOURCESUnamortized bond refunding charges 753,794 361,816 20,392,484 -Contributions to pension plan 72,318 389,374 2,022,775 159,775Accumulated decrease in fair value of hedging derivatives - - 87,248,859 -Total deferred outflows of resources 826,112 751,190 109,664,118 159,775
The notes to the financial statements are an integral part of this statement. Continued
Enterprise Funds
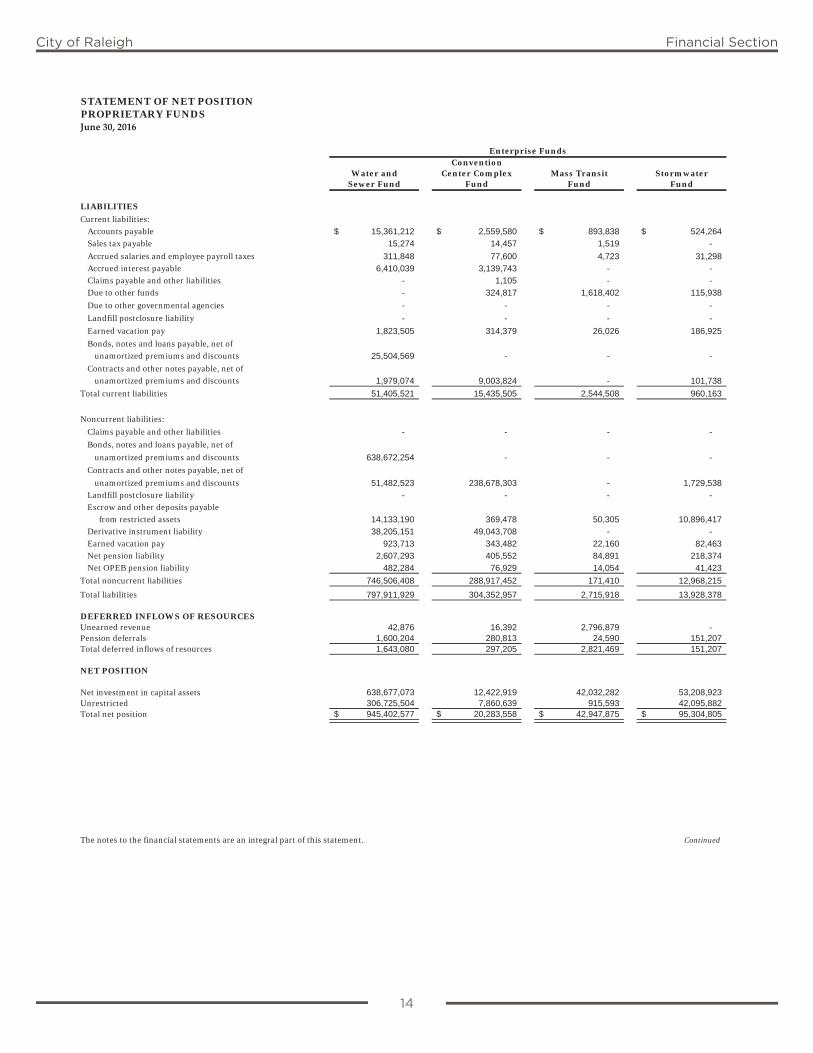
14
City of Raleigh Financial Section
STATEMENT OF NET POSITIONPROPRIETARY FUNDSJune 30, 2016
ConventionWater and Center Complex Mass Transit Stormwater
Sewer Fund Fund Fund Fund
LIABILITIES
Current liabilities:Accounts payable 15,361,212$ 2,559,580$ 893,838$ 524,264$Sales tax payable 15,274 14,457 1,519 -
Accrued salaries and employee payroll taxes 311,848 77,600 4,723 31,298Accrued interest payable 6,410,039 3,139,743 - -Claims payable and other liabilities - 1,105 - -Due to other funds - 324,817 1,618,402 115,938
Due to other governmental agencies - - - -
Landfill postclosure liability - - - -
Earned vacation pay 1,823,505 314,379 26,026 186,925
Bonds, notes and loans payable, net of unamortized premiums and discounts 25,504,569 - - -
Contracts and other notes payable, net ofunamortized premiums and discounts 1,979,074 9,003,824 - 101,738
Total current liabilities 51,405,521 15,435,505 2,544,508 960,163
Noncurrent liabilities:
Claims payable and other liabilities - - - -
Bonds, notes and loans payable, net of
unamortized premiums and discounts 638,672,254 - - -
Contracts and other notes payable, net of
unamortized premiums and discounts 51,482,523 238,678,303 - 1,729,538Landfill postclosure liability - - - -Escrow and other deposits payable
from restricted assets 14,133,190 369,478 50,305 10,896,417Derivative instrument liability 38,205,151 49,043,708 - -Earned vacation pay 923,713 343,482 22,160 82,463Net pension liability 2,607,293 405,552 84,891 218,374Net OPEB pension liability 482,284 76,929 14,054 41,423
Total noncurrent liabilities 746,506,408 288,917,452 171,410 12,968,215
Total liabilities 797,911,929 304,352,957 2,715,918 13,928,378
DEFERRED INFLOWS OF RESOURCESUnearned revenue 42,876 16,392 2,796,879 -Pension deferrals 1,600,204 280,813 24,590 151,207Total deferred inflows of resources 1,643,080 297,205 2,821,469 151,207
NET POSITION
Net investment in capital assets 638,677,073 12,422,919 42,032,282 53,208,923Unrestricted 306,725,504 7,860,639 915,593 42,095,882Total net position 945,402,577$ 20,283,558$ 42,947,875$ 95,304,805$
The notes to the financial statements are an integral part of this statement. Continued
Enterprise Funds
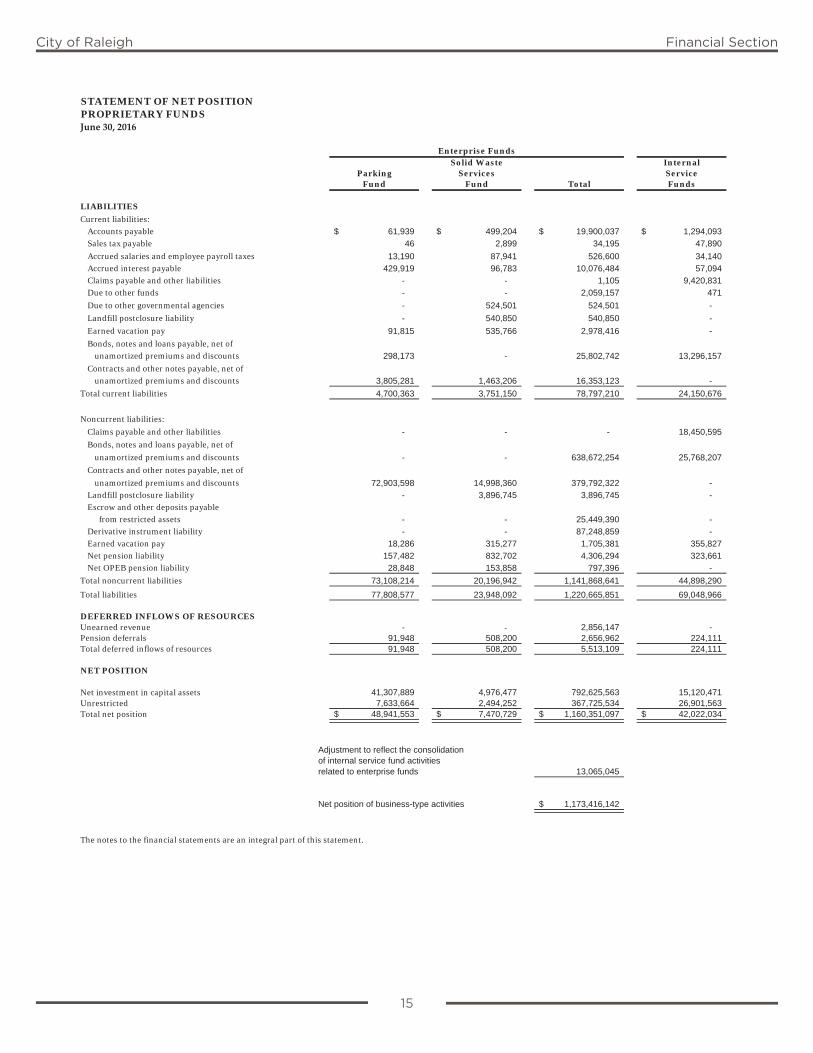
15
City of Raleigh Financial Section
STATEMENT OF NET POSITIONPROPRIETARY FUNDSJune 30, 2016
Solid Waste InternalParking Services Service
Fund Fund Total Funds
LIABILITIES
Current liabilities:Accounts payable 61,939$ 499,204$ 19,900,037$ 1,294,093$Sales tax payable 46 2,899 34,195 47,890
Accrued salaries and employee payroll taxes 13,190 87,941 526,600 34,140Accrued interest payable 429,919 96,783 10,076,484 57,094Claims payable and other liabilities - - 1,105 9,420,831Due to other funds - - 2,059,157 471
Due to other governmental agencies - 524,501 524,501 -
Landfill postclosure liability - 540,850 540,850 -
Earned vacation pay 91,815 535,766 2,978,416 -
Bonds, notes and loans payable, net of unamortized premiums and discounts 298,173 - 25,802,742 13,296,157
Contracts and other notes payable, net ofunamortized premiums and discounts 3,805,281 1,463,206 16,353,123 -
Total current liabilities 4,700,363 3,751,150 78,797,210 24,150,676
Noncurrent liabilities:
Claims payable and other liabilities - - - 18,450,595
Bonds, notes and loans payable, net of
unamortized premiums and discounts - - 638,672,254 25,768,207
Contracts and other notes payable, net of
unamortized premiums and discounts 72,903,598 14,998,360 379,792,322 -Landfill postclosure liability - 3,896,745 3,896,745 -Escrow and other deposits payable
from restricted assets - - 25,449,390 -Derivative instrument liability - - 87,248,859 -Earned vacation pay 18,286 315,277 1,705,381 355,827Net pension liability 157,482 832,702 4,306,294 323,661Net OPEB pension liability 28,848 153,858 797,396 -
Total noncurrent liabilities 73,108,214 20,196,942 1,141,868,641 44,898,290
Total liabilities 77,808,577 23,948,092 1,220,665,851 69,048,966
DEFERRED INFLOWS OF RESOURCESUnearned revenue - - 2,856,147 -Pension deferrals 91,948 508,200 2,656,962 224,111Total deferred inflows of resources 91,948 508,200 5,513,109 224,111
NET POSITION
Net investment in capital assets 41,307,889 4,976,477 792,625,563 15,120,471Unrestricted 7,633,664 2,494,252 367,725,534 26,901,563Total net position 48,941,553$ 7,470,729$ 1,160,351,097$ 42,022,034$
Adjustment to reflect the consolidation of internal service fund activities related to enterprise funds 13,065,045
Net position of business-type activities 1,173,416,142$
The notes to the financial statements are an integral part of this statement.
Enterprise Funds

16
City of Raleigh Financial Section
STATEMENT OF REVENUES, EXPENSESAND CHANGES IN FUND NET POSITIONPROPRIETARY FUNDSFor the fiscal year ended June 30, 2016
ConventionWater and Center Complex Mass Transit Stormwater
Operating revenues Sewer Fund Fund Fund Fund
User charges 219,842,310$ 13,766,370$ 6,874,246$ 17,829,638$
Charges for services - internal - - - -
Other 7,153,975 18,178 242,984 109,022
Drug rebate - - - -
Total operating revenues 226,996,285 13,784,548 7,117,230 17,938,660
Operating expensesPersonnel services - 8,528,890 701,724 4,249,119
Other facility operating costs - 8,832,222 8,752,035 6,823,903
Operational expenses - - - -
Administration 9,634,152 - - -
Water supply and treatment 27,928,220 - - -
Sewer system and treatment 20,871,828 - - -
Warehousing, maintenance and construction 16,669,275 - - -
Utility billing 5,926,932 - - -
Other services 3,956,179 - - -
Non-departmental charges 8,886,751 - - -
Management contract charges - - 24,989,504 -
Claims - - - -
Premiums - - - -
Depreciation 34,822,233 8,215,751 3,724,582 2,118,660
Other - - - -
Total operating expenses 128,695,570 25,576,863 38,167,845 13,191,682
Operating income (loss) 98,300,715 (11,792,315) (31,050,615) 4,746,978
Nonoperating revenue (expense)Gain (loss) on investments 3,036,029 135,671 - 537,907
Subsidy income - federal and state - - 7,685,351 -
Recovery of claims - - - -
Other revenues 600,130 - - -
Interest expense (22,227,256) (7,788,151) - -
Gain (loss) on sale of capital assets 614,672 - 467 -
Miscellaneous expense (2,417,249) (1,224,881) - -
Total nonoperating revenue (expense) (20,393,674) (8,877,361) 7,685,818 537,907
Income (loss) before contributions, transfers and special items 77,907,041 (20,669,676) (23,364,797) 5,284,885
Capital contributions 1,681,573 - 1,942,973 1,210,796
Transfers in 331,360 22,883,546 20,075,542 18,326
Transfers out (1,709,278) (257,694) (241,164) (180,232)
Change in net position 78,210,696 1,956,176 (1,587,446) 6,333,775
Net position, beginning of year 867,191,881 18,327,382 44,535,321 88,971,030
Net position, end of year 945,402,577$ 20,283,558$ 42,947,875$ 95,304,805$
The notes to the financial statements are an integral part of this statement.
Enterprise Funds
16
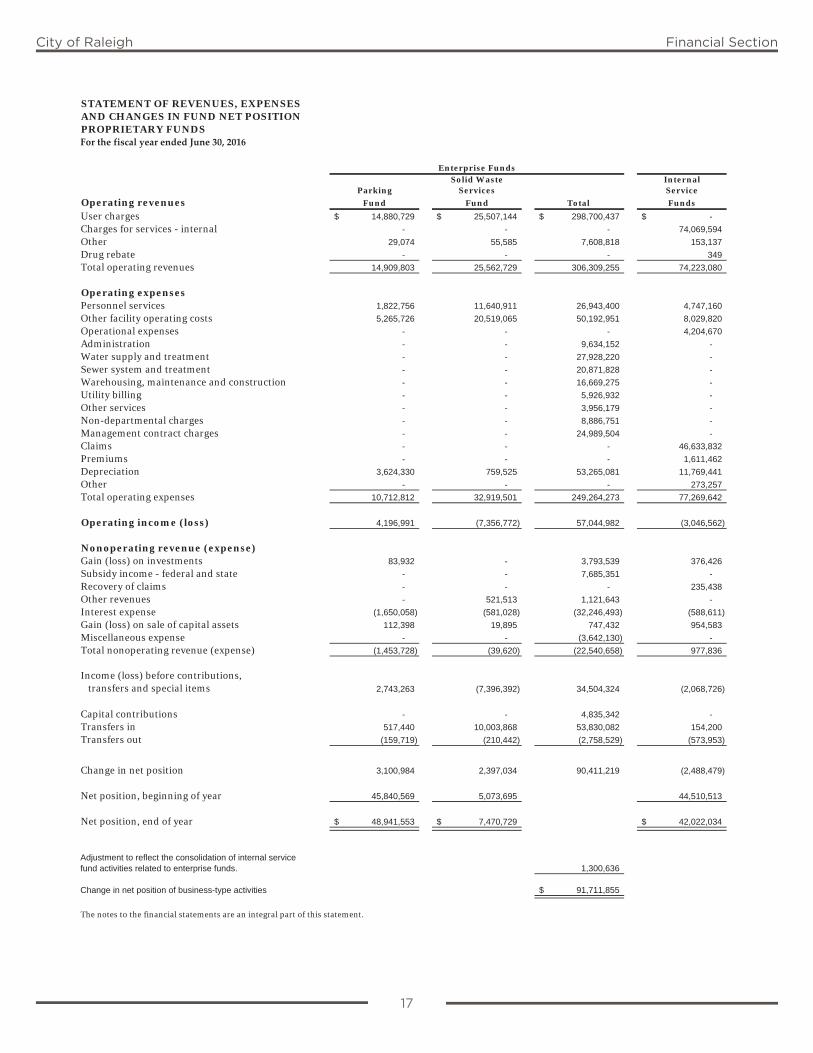
17
City of Raleigh Financial Section
STATEMENT OF REVENUES, EXPENSESAND CHANGES IN FUND NET POSITIONPROPRIETARY FUNDSFor the fiscal year ended June 30, 2016
Solid Waste InternalParking Services Service
Operating revenues Fund Fund Total Funds
User charges 14,880,729$ 25,507,144$ 298,700,437$ -$
Charges for services - internal - - - 74,069,594
Other 29,074 55,585 7,608,818 153,137
Drug rebate - - - 349
Total operating revenues 14,909,803 25,562,729 306,309,255 74,223,080
Operating expensesPersonnel services 1,822,756 11,640,911 26,943,400 4,747,160
Other facility operating costs 5,265,726 20,519,065 50,192,951 8,029,820
Operational expenses - - - 4,204,670
Administration - - 9,634,152 -
Water supply and treatment - - 27,928,220 -
Sewer system and treatment - - 20,871,828 -
Warehousing, maintenance and construction - - 16,669,275 -
Utility billing - - 5,926,932 -
Other services - - 3,956,179 -
Non-departmental charges - - 8,886,751 -
Management contract charges - - 24,989,504 -
Claims - - - 46,633,832
Premiums - - - 1,611,462
Depreciation 3,624,330 759,525 53,265,081 11,769,441
Other - - - 273,257
Total operating expenses 10,712,812 32,919,501 249,264,273 77,269,642
Operating income (loss) 4,196,991 (7,356,772) 57,044,982 (3,046,562)
Nonoperating revenue (expense)Gain (loss) on investments 83,932 - 3,793,539 376,426
Subsidy income - federal and state - - 7,685,351 -
Recovery of claims - - - 235,438
Other revenues - 521,513 1,121,643 -
Interest expense (1,650,058) (581,028) (32,246,493) (588,611)
Gain (loss) on sale of capital assets 112,398 19,895 747,432 954,583
Miscellaneous expense - - (3,642,130) -
Total nonoperating revenue (expense) (1,453,728) (39,620) (22,540,658) 977,836
Income (loss) before contributions, transfers and special items 2,743,263 (7,396,392) 34,504,324 (2,068,726)
Capital contributions - - 4,835,342 -
Transfers in 517,440 10,003,868 53,830,082 154,200
Transfers out (159,719) (210,442) (2,758,529) (573,953)
Change in net position 3,100,984 2,397,034 90,411,219 (2,488,479)
Net position, beginning of year 45,840,569 5,073,695 44,510,513
Net position, end of year 48,941,553$ 7,470,729$ 42,022,034$
Adjustment to reflect the consolidation of internal servicefund activities related to enterprise funds. 1,300,636
Change in net position of business-type activities 91,711,855$
The notes to the financial statements are an integral part of this statement.
Enterprise Funds
17

18
City of Raleigh Financial Section
STATEMENT OF CASH FLOWS
PROPRIETARY FUNDS
For the fiscal year ended June 30, 2016
ConventionWater and Center Complex Mass Transit StormwaterSewer Fund Fund Fund Fund
CASH FLOWS FROM OPERATING ACTIVITIESReceipts from customers 226,594,716$ 13,852,100$ 6,874,246$ 17,806,285 Payments to employees (41,473,951) (8,548,384) (702,462) (4,232,348) Payments to suppliers and service providers (53,132,462) (7,595,973) (33,817,900) (7,187,411) Claims paid - - - - Premiums paid - - - - Other receipts 600,130 18,178 242,984 109,022 Other payments - (1,224,881) - - Net cash provided by (used in) operating activities 132,588,433 (3,498,960) (27,403,132) 6,495,548
CASH FLOWS FROM NONCAPITAL FINANCING ACTIVITIESOperating subsidies and transfers from other funds 331,360 22,883,546 20,075,542 18,326 Operating subsidies and transfers to other funds (1,709,278) (257,694) (241,164) (180,232) Operating grants received - - 2,627,581 - Other expenditures - - - Internal activity - payments from (to) other funds - (1,129,340) 1,618,402 13,729 Net cash provided by (used in) noncapital financing activities (1,377,918) 21,496,512 24,080,361 (148,177)
CASH FLOWS FROM CAPITAL AND RELATED FINANCING ACTIVITIESPurchase and construction of capital assets (62,451,982) (11,239,543) (2,428,717) (5,244,780) Capital grants and other capital contributions 1,915,194 - 9,242,903 232,734 Proceeds from capital debt 68,478,073 13,002,909 - - Intergovernmental proceeds for capital debt - - - - Principal paid on capital debt (81,978,885) (7,695,000) - (101,738) Interest paid on capital debt (22,420,459) (7,928,619) - - Other debt related payments (2,417,249) - - - Proceeds from the sale of capital assets 614,672 - 467 - Escrow deposits (287,513) - - 1,608,689 Net cash provided by (used in) capital and related
financing activities (98,548,149) (13,860,253) 6,814,653 (3,505,095)
CASH FLOWS FROM INVESTING ACTIVITIESGain (loss) on investments held 2,585,645 115,807 - 470,183 Net cash provided by investing activities 2,585,645 115,807 - 470,183
Net increase (decrease) in cash and cash equivalents 35,248,011 4,253,106 3,491,882 3,312,459 Cash and cash equivalents - beginning of year 290,993,915 14,392,757 (1,664,729) 48,114,758 Cash and cash equivalents - end of year 326,241,926$ 18,645,863$ 1,827,153$ 51,427,217$
RECONCILIATION OF OPERATING INCOME (LOSS) TO NET CASH PROVIDED (USED) BY OPERATING ACTIVITIES
Operating income (loss) 98,300,715$ (11,792,315)$ (31,050,615)$ 4,746,978$ Adjustments to reconcile operating income (loss)
to net cash provided by (used in) operating activities:Depreciation expense 34,822,233 8,215,751 3,724,582 2,118,660 Miscellaneous nonoperating income 600,130 - - - Miscellaneous nonoperating expense - (1,224,881) - - Change in assets and liabilities:
Operating receivables 410,326 (147,952) (594,509) (23,353) Sales tax receivable 90,727 (124,773) 76,315 9,144 Inventories (133,509) - (109,345) - Other receivables and assets (747,602) - - (3,938) Accounts payable and other accrued liabilities (535,367) 1,508,972 551,178 (368,715) Landfill postclosure liability - - - - Decrease in pension asset 3,455,844 561,575 91,796 302,386 (Increase) decrease in deferred outflows of resources - pensions 542,293 86,501 15,803 46,578 Increase (decrease) in deferred inflows of resources - pensions (6,947,891) (1,108,252) (202,469) (596,751) Increase in pension liability 2,607,293 405,552 84,891 218,374 Escrow and other deposits - 79,644 - - Earned vacation pay and other payroll liabilities 187,534 35,132 9,241 46,185 Unearned revenue (64,293) 6,086 - -
Total adjustments 34,287,718 8,293,355 3,647,483 1,748,570 Net cash provided by (used in) operating activities 132,588,433$ (3,498,960)$ (27,403,132)$ 6,495,548$
Noncash investing, capital, and financing activities:Capital contributions from annexations and mergers 1,278,008$ -$ -$ -$ Capital contributions from grant and assessment receivables (1,511,629)$ -$ -$ -$ Acquisition and construction of capital assets 6,779,370$ -$ -$ -$
The notes to the financial statements are an integral part of this statement.
Enterprise Funds
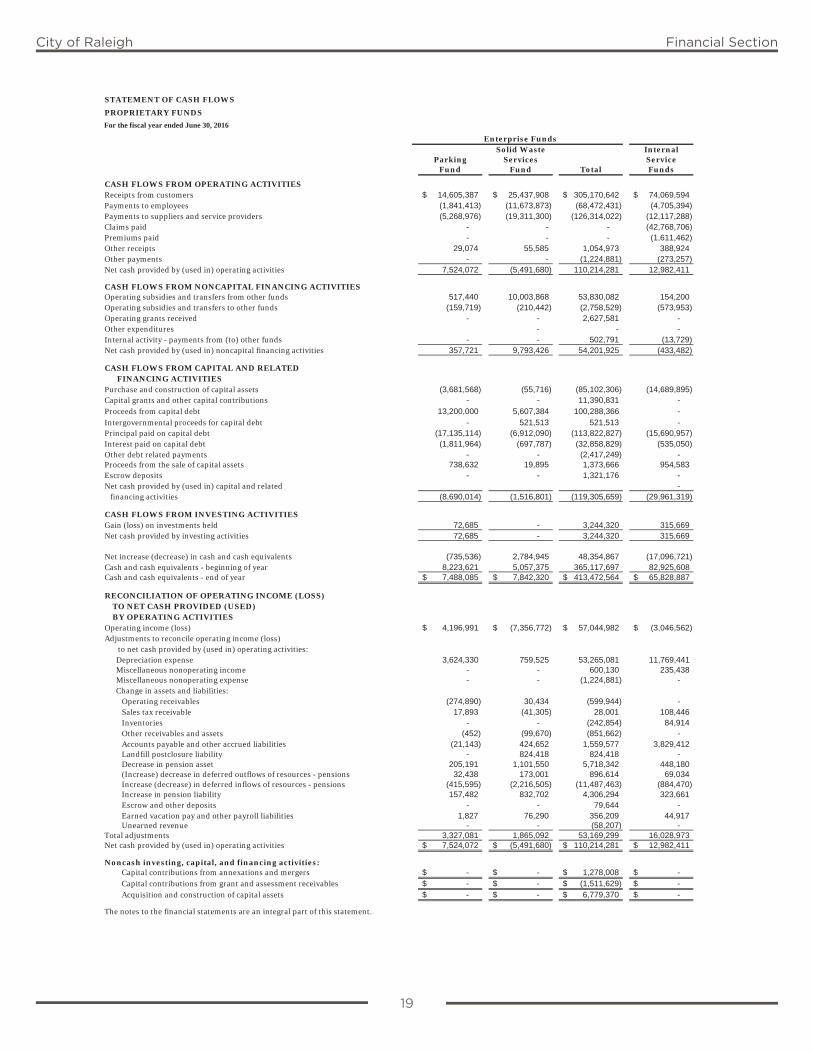
19
City of Raleigh Financial Section
STATEMENT OF CASH FLOWS
PROPRIETARY FUNDS
For the fiscal year ended June 30, 2016
Solid Waste InternalParking Services Service
Fund Fund Total Funds
CASH FLOWS FROM OPERATING ACTIVITIESReceipts from customers 14,605,387$ 25,437,908$ 305,170,642$ 74,069,594$ Payments to employees (1,841,413) (11,673,873) (68,472,431) (4,705,394) Payments to suppliers and service providers (5,268,976) (19,311,300) (126,314,022) (12,117,288) Claims paid - - - (42,768,706) Premiums paid - - - (1,611,462) Other receipts 29,074 55,585 1,054,973 388,924 Other payments - - (1,224,881) (273,257) Net cash provided by (used in) operating activities 7,524,072 (5,491,680) 110,214,281 12,982,411
CASH FLOWS FROM NONCAPITAL FINANCING ACTIVITIESOperating subsidies and transfers from other funds 517,440 10,003,868 53,830,082 154,200 Operating subsidies and transfers to other funds (159,719) (210,442) (2,758,529) (573,953) Operating grants received - - 2,627,581 - Other expenditures - - - Internal activity - payments from (to) other funds - - 502,791 (13,729) Net cash provided by (used in) noncapital financing activities 357,721 9,793,426 54,201,925 (433,482)
CASH FLOWS FROM CAPITAL AND RELATED FINANCING ACTIVITIESPurchase and construction of capital assets (3,681,568) (55,716) (85,102,306) (14,689,895) Capital grants and other capital contributions - - 11,390,831 - Proceeds from capital debt 13,200,000 5,607,384 100,288,366 - Intergovernmental proceeds for capital debt - 521,513 521,513 - Principal paid on capital debt (17,135,114) (6,912,090) (113,822,827) (15,690,957) Interest paid on capital debt (1,811,964) (697,787) (32,858,829) (535,050) Other debt related payments - - (2,417,249) - Proceeds from the sale of capital assets 738,632 19,895 1,373,666 954,583 Escrow deposits - - 1,321,176 - Net cash provided by (used in) capital and related -
financing activities (8,690,014) (1,516,801) (119,305,659) (29,961,319)
CASH FLOWS FROM INVESTING ACTIVITIESGain (loss) on investments held 72,685 - 3,244,320 315,669 Net cash provided by investing activities 72,685 - 3,244,320 315,669
Net increase (decrease) in cash and cash equivalents (735,536) 2,784,945 48,354,867 (17,096,721) Cash and cash equivalents - beginning of year 8,223,621 5,057,375 365,117,697 82,925,608 Cash and cash equivalents - end of year 7,488,085$ 7,842,320$ 413,472,564$ 65,828,887$
RECONCILIATION OF OPERATING INCOME (LOSS) TO NET CASH PROVIDED (USED) BY OPERATING ACTIVITIES
Operating income (loss) 4,196,991$ (7,356,772)$ 57,044,982$ (3,046,562)$ Adjustments to reconcile operating income (loss)
to net cash provided by (used in) operating activities:Depreciation expense 3,624,330 759,525 53,265,081 11,769,441 Miscellaneous nonoperating income - - 600,130 235,438 Miscellaneous nonoperating expense - - (1,224,881) - Change in assets and liabilities:
Operating receivables (274,890) 30,434 (599,944) - Sales tax receivable 17,893 (41,305) 28,001 108,446 Inventories - - (242,854) 84,914 Other receivables and assets (452) (99,670) (851,662) - Accounts payable and other accrued liabilities (21,143) 424,652 1,559,577 3,829,412 Landfill postclosure liability - 824,418 824,418 - Decrease in pension asset 205,191 1,101,550 5,718,342 448,180 (Increase) decrease in deferred outflows of resources - pensions 32,438 173,001 896,614 69,034 Increase (decrease) in deferred inflows of resources - pensions (415,595) (2,216,505) (11,487,463) (884,470) Increase in pension liability 157,482 832,702 4,306,294 323,661 Escrow and other deposits - - 79,644 - Earned vacation pay and other payroll liabilities 1,827 76,290 356,209 44,917 Unearned revenue - - (58,207) -
Total adjustments 3,327,081 1,865,092 53,169,299 16,028,973 Net cash provided by (used in) operating activities 7,524,072$ (5,491,680)$ 110,214,281$ 12,982,411$
Noncash investing, capital, and financing activities:Capital contributions from annexations and mergers -$ -$ 1,278,008$ -$ Capital contributions from grant and assessment receivables -$ -$ (1,511,629)$ -$ Acquisition and construction of capital assets -$ -$ 6,779,370$ -$
The notes to the financial statements are an integral part of this statement.
Enterprise Funds
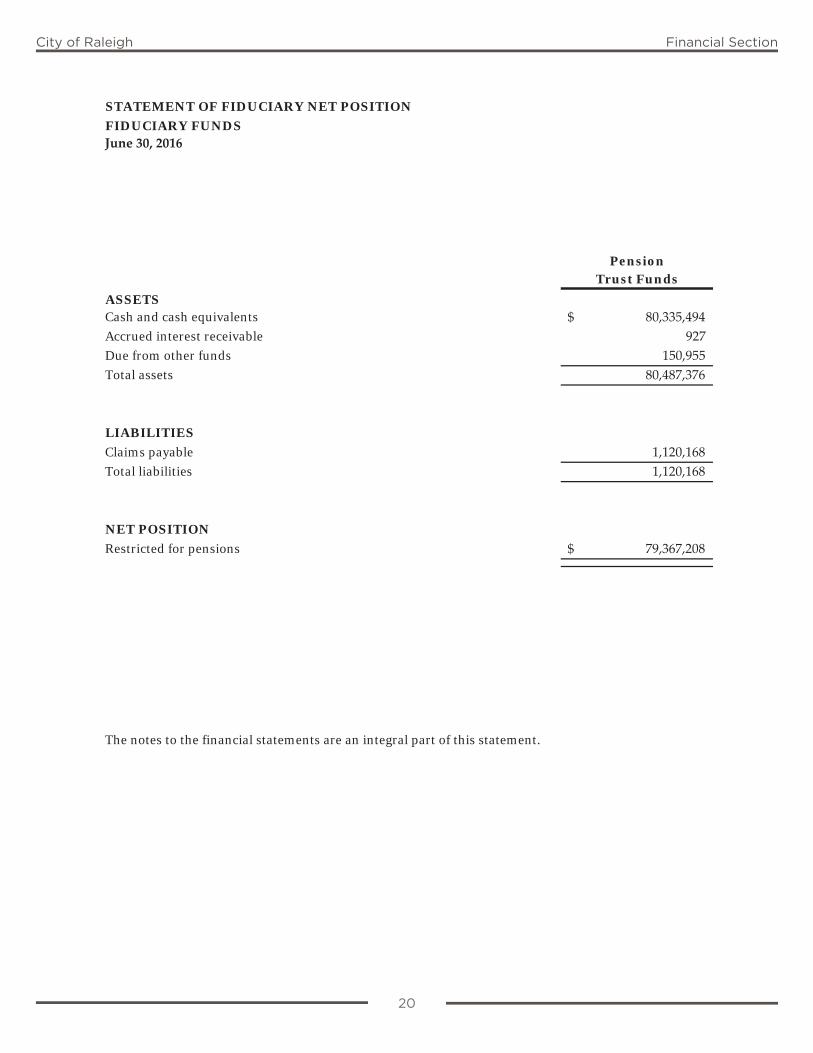
20
City of Raleigh Financial Section
STATEMENT OF FIDUCIARY NET POSITION
FIDUCIARY FUNDSJune 30, 2016
PensionTrust Funds
ASSETSCash and cash equivalents 80,335,494$ Accrued interest receivable 927 Due from other funds 150,955 Total assets 80,487,376
LIABILITIES
Claims payable 1,120,168 Total liabilities 1,120,168
NET POSITION
Restricted for pensions 79,367,208$
The notes to the financial statements are an integral part of this statement.
20
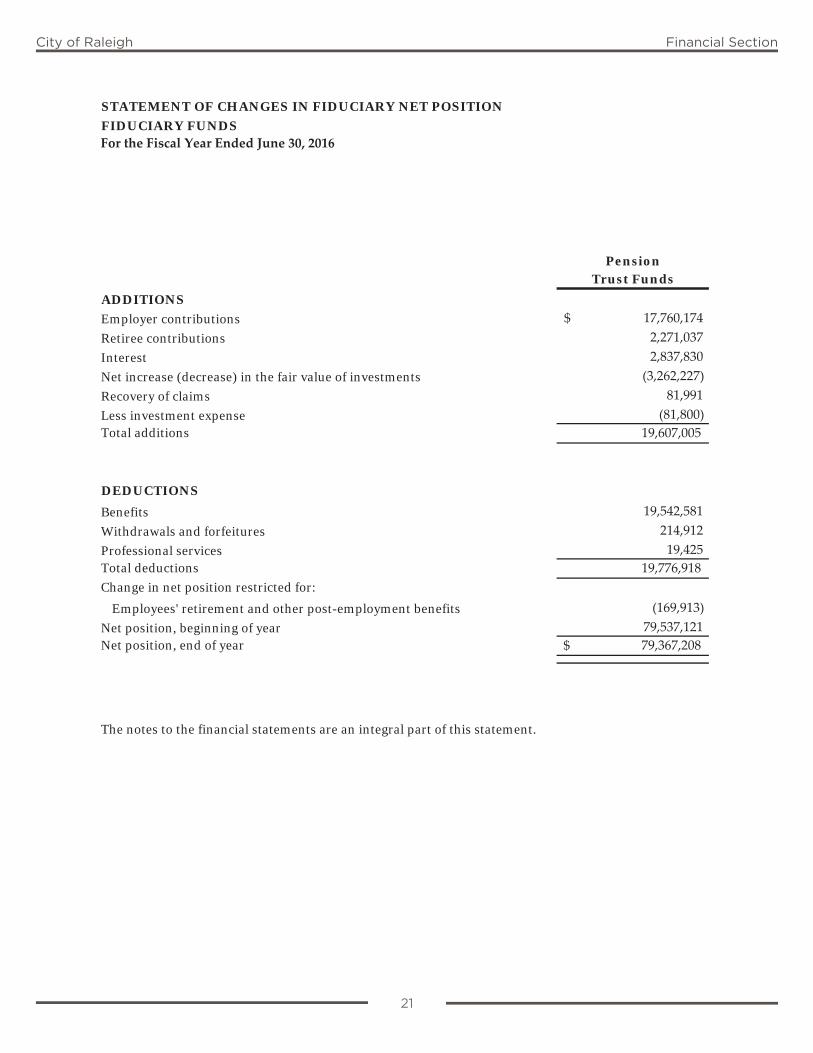
21
City of Raleigh Financial Section
STATEMENT OF CHANGES IN FIDUCIARY NET POSITION
FIDUCIARY FUNDSFor the Fiscal Year Ended June 30, 2016
PensionTrust Funds
ADDITIONS
Employer contributions $ 17,760,174 Retiree contributions 2,271,037 Interest 2,837,830 Net increase (decrease) in the fair value of investments (3,262,227)Recovery of claims 81,991 Less investment expense (81,800)Total additions 19,607,005
DEDUCTIONS
Benefits 19,542,581 Withdrawals and forfeitures 214,912 Professional services 19,425 Total deductions 19,776,918 Change in net position restricted for:
Employees' retirement and other post-employment benefits (169,913)Net position, beginning of year 79,537,121 Net position, end of year 79,367,208$
The notes to the financial statements are an integral part of this statement.
21
22
City of Raleigh Financial Section
NOTES TO THE BASIC FINANCIAL STATEMENTS JUNE 30, 2016
Note 1. Summary of Significant Accounting Policies
A. Reporting entity The City of Raleigh (the “City”) is a municipal corporation established in 1792 by the North Carolina General Assembly. The City operates under a council‐manager form of government with a mayor and seven Council Members comprising the governing body. The accounting policies of the City of Raleigh conform to generally accepted accounting principles (GAAP) as applicable to governments. The Governmental Accounting Standards Board (GASB) is the accepted standard‐setting body for establishing governmental accounting and financial reporting principles in the United States of America. All applicable GASB statements have been implemented. The accompanying financial statements present the government and its component unit, a legally separate entity for which the City is financially accountable. The financial statements of the following organization are included in this report as a blended component unit: Blended Component Unit. Walnut Creek Financing Assistance Corporation (WCFAC). The WCFAC is governed by a five‐member board appointed by the City Council. Although it is legally separate from the City, the WCFAC is reported as if it were part of the primary government because its main purpose is to issue certificates of participation for the City. Financial transactions of the WCFAC are audited and reported through the Cityʹs annual audit. No separate financial statements are prepared.
B. Government‐wide and fund financial statements Government‐Wide Statements. The government‐wide financial statements (i.e., the statement of net position and the statement of activities) report information on all of the nonfiduciary activities of the City and its blended component unit. Eliminations have been made to minimize the double‐counting of internal activities. These statements distinguish between the governmental and business‐type activities of the City. Governmental activities generally are financed through taxes, intergovernmental revenues, and other nonexchange transactions. Business‐type activities are financed in whole or in part by fees charged to external parties.
The statement of activities demonstrates the degree to which the direct expenses of a given function or business‐type activity is offset by program revenues. Direct expenses are those that are clearly identifiable with a specific function or activity. Indirect expense allocations are not shown on the statement of activities. Program revenues include 1) charges to customers or applicants who purchase, use or directly benefit from goods, services, or privileges provided by a given function or activity and 2) grants and contributions that are restricted to meeting the operational or capital requirements of a particular function or activity. Taxes and other items not properly included among program revenues are reported instead as general revenues.
Separate financial statements are provided for governmental funds, proprietary funds, and fiduciary funds, even though the latter are excluded from the government‐wide financial statements. Major individual governmental funds and major individual enterprise funds are reported as separate columns in the fund financial statements.
22
23
City of Raleigh Financial Section
C. Measurement focus, basis of accounting, and financial statement presentation The government‐wide financial statements are reported using the economic resources measurement focus and the accrual basis of accounting, as are the proprietary fund and fiduciary fund financial statements. Revenues are recorded when earned and expenses are recorded when a liability is incurred, regardless of the timing of related cash flows. Property taxes are recognized as revenues in the year for which they are levied. Grants and similar items are recognized as revenue as soon as all eligibility requirements imposed by the provider have been met. Governmental fund financial statements are reported using the current financial resources measurement focus and the modified accrual basis of accounting. Revenues are recognized as soon as they are both measurable and available. Revenues are considered to be available when they are collectible within the current period or soon enough thereafter to pay liabilities of the current period. For this purpose, the City considers all revenues to be available if they are collected within 90 days after year‐end, except for property taxes. Expenditures generally are recorded when a liability is incurred, as under accrual accounting. However, debt service expenditures, as well as expenditures related to earned vacation pay and claims and judgments, are recorded only when payment is due. Sales taxes collected and held by the State at year‐end on behalf of the City are recognized as revenue. Sales taxes are considered a shared revenue for the City because the tax is levied by Wake County and then remitted to and distributed by the State. Ad valorem taxes receivable are not accrued as a revenue because the amount is not susceptible to accrual. All other revenue items are considered to be measurable and available only when cash is received by the government. At June 30, taxes receivable for property other than motor vehicles are materially past due and are not considered to be an available resource to finance the operations of the current year. Also, as of September 1, 2013, State law altered the procedures for the assessment and collection of property taxes on registered motor vehicles in North Carolina. Effective with this change in the law, the State of North Carolina is responsible for billing and collecting the property taxes on registered motor vehicles on behalf of all municipalities and special tax districts. Property taxes are due when vehicles are registered. The billed taxes are applicable to the fiscal year in which they are received. Uncollected taxes that were billed in periods prior to September 1, 2013 and for limited registration plates are shown as a receivable in these financial statements and are offset by deferred inflows of resources. The City reports the following major governmental funds: General fund – The general fund is the primary operating fund of the City. It is used to account for all financial resources of the general government, except those required to be accounted for in other funds. Park bond fund – The park bond fund accounts for all bond proceeds and capital project costs related to the construction of park improvements or park land acquisition.
The City reports the following major enterprise funds: Water and sewer fund – The water and sewer fund accounts for the user charges, fees, other resources and all costs associated with the operation of the water and sewer systems of the City. Convention center fund – The convention center complex fund accounts for the user charges, fees, other resources and all costs associated with the operation of the convention center and performing arts center facilities of the City. Mass transit fund – The mass transit fund accounts for the user charges, fees, federal contributions and all operating costs associated with the operation of the transit system in the City.
23

24
City of Raleigh Financial Section
Stormwater fund – The stormwater fund is established to account for revenues and expenses related to stormwater management.
Parking fund – The parking facilities fund accounts for the parking fee charges and all costs associated with the operation of all parking decks and lots owned by the City. Solid waste services fund – The solid waste services fund accounts for the revenues and expenses related to the operation of the City’s residential garbage collection and recycling programs.
Additionally, the City reports the following fund types: Internal service funds ‐ Account for employees’ health benefits, equipment replacement, risk management services, and vehicle fleet services provided to other departments or agencies of the City on a cost reimbursement basis. Fiduciary funds ‐ The pension trust funds account for the City’s contributions to a supplemental money purchase pension plan fund, the law enforcement officers’ special separation allowance fund, and other post‐employment benefits.
As a general rule the effect of interfund activity has been eliminated from the government‐wide financial statements. Exceptions to this general rule are payments‐in‐lieu of taxes and other charges between the City’s water and sewer function and various other City functions. Elimination of these charges would distort the direct costs and program revenues reported for the various functions concerned. Amounts reported as program revenues include 1) charges to customers or applicants for goods, services, or privileges provided, 2) operating grants and contributions, and 3) capital grants and contributions, including special assessments. Internally dedicated resources are reported as general revenues rather than as program revenues. Likewise, general revenues include all taxes. Proprietary funds distinguish operating revenues and expenses from nonoperating items. Operating revenues and expenses generally result from providing services and producing and delivering goods in connection with a proprietary fund’s principal ongoing operations. The principal operating revenues of the City’s enterprise funds and internal service funds are charges to customers for sales and services. Operating expenses for enterprise funds and internal service funds include the costs of sales and services, administrative expenses, and depreciation on capital assets. All revenues and expenses not meeting this definition are reported as nonoperating revenues and expenses. When both restricted and unrestricted resources are available for use, it is the City’s policy to use restricted resources first, then unrestricted resources as they are needed. Management of the City has made a number of estimates and assumptions relating to the reporting of assets, liabilities, revenues, expenses, and the disclosure of contingent assets and liabilities to prepare the financial statements in conformity with generally accepted accounting principles. Actual results could differ from those estimates.
24
25
City of Raleigh Financial Section
D. Assets, liabilities, deferred outflows/inflows of resources and net position or equity 1. Deposits and investments
The City pools money from several funds to facilitate disbursement and investment and to maximize investment income. Therefore, all cash and investments are essentially demand deposits and are considered cash and cash equivalents. All deposits are made in City Council designated official depositories and are secured as required by State law (G.S. 159‐30(c)). The City may designate, as an official depository, any bank or savings association whose principal office is located in North Carolina. Also, the City may establish time deposit accounts such as NOW and SuperNOW accounts, money market accounts, and certificates of deposit. State law (G.S. 159‐30(c)) authorizes the City to invest in obligations of the United States or obligations fully guaranteed both as to principal and interest by the United States; obligations of the State of North Carolina; bonds and notes of any North Carolina local government or public authority; obligations of certain non‐guaranteed federal agencies; certain high quality issues of commercial paper and bankers’ acceptances and the North Carolina Capital Management Trust (NCCMT). The City’s investments are reported at fair value. The NCCMT‐Cash Portfolio, a SEC registered (2a‐7) external investment pool, is measured at amortized cost, which is the NCCMT’s share price. The NCCMT‐Term Portfolio’s securities are valued at fair value. The City’s investments with a maturity of more than one year at acquisition and non‐money market investments are reported at fair value as determined by quoted market prices. The securities of the NCCMT Cash Portfolio, a SEC‐registered (2a‐7) money market mutual fund, are valued at fair value, which is the NCCMT’s share price. In accordance with State law, the City has a portion of its investments in callable securities, some of which provide for periodic interest rate increases in specific increments until maturity. These investments are reported at fair value as determined by quoted market prices.
2. Receivables and payables
Activities between funds that are representative of lending/borrowing arrangements outstanding at the end of the fiscal year are referred to as “due to/from other funds” (i.e., the current portion of interfund loans). Any residual balances outstanding between the governmental activities and business‐type activities are reported in the government‐wide financial statements as “internal balances.” City ad valorem taxes are billed by the Wake County Revenue Collector after July 1 of each year based upon the assessed value on property, other than motor vehicles, listed as of the prior January 1 lien date. In accordance with state law, property taxes on certain registered motor vehicles are assessed and collected throughout the year based on a staggered registration system. Wake County is responsible for the monthly billing and collections of City property taxes due on registered motor vehicles. Under the staggered registration system, property taxes become due the first day of the fourth month after the vehicles are registered. The billed taxes are applicable to the fiscal year in which they become due. The City Council is required to approve the tax levy no later than August 1, although this traditionally occurs in the month of June. Taxes are due on September 1 but do not begin to accrue penalties for nonpayment until the following January 5. Collections of City taxes are made by the County and are remitted to the City as collected. Ad valorem taxes receivable at year‐end are not considered to be available as a resource that can be used to finance the current year operations of the City and, therefore, are not susceptible to recognition as earned revenue. The amount of the recorded receivable for ad valorem taxes has been reduced by an allowance for uncollectible accounts and the net receivable is offset by unavailable revenue in an equal amount.
25
26
City of Raleigh Financial Section
Other accounts receivable which are reported in governmental funds and which represent amounts considered measurable and available are recorded as revenue but, based on state law, are restricted in fund balance at year‐end. Any other accounts receivable which represent amounts not subject to accrual as earned revenue are recorded as assets and are offset by unavailable revenue in an equal amount. Assessments receivable have been reduced by an amount deemed to be uncollectible. The amounts due from other governmental agencies are grants and participation agreements which are restricted for specific programs and capital projects. Program grants, primarily accounted for in the special revenue funds, are recognized as receivables and revenue in the period benefited, i.e., at the time reimbursable program costs are incurred. Capital project grants are recorded as receivables and revenues at the time reimbursable project costs are incurred.
3. Inventories, prepaid items and assets held for resale Inventories in the governmental, enterprise and internal service funds consist primarily of expendable supplies held for consumption. Inventories are recorded as an expenditure at the time an item is used and are carried at cost, using the first‐in, first‐out (FIFO) method. Certain payments to vendors reflect costs applicable to future accounting periods and are recorded as prepaid items in both government‐wide and fund financial statements. Assets held for resale in the amount of $11,625,378 as of June 30, 2016, can be found on the combining balance sheet for capital project funds as well as the government wide statement of net position and represents property that was repurchased during 2013‐14 which is currently being held for resale.
4. Restricted assets Certain proceeds of the City’s enterprise fund revenue bonds and general obligation bonds are classified as restricted assets on the balance sheet because their use is limited by applicable bond covenants.
5. Capital assets
Capital assets, which include property, plant, equipment, software, and infrastructure assets, (e.g. streets, sidewalks, water and sewer delivery systems and similar items) are reported in the applicable governmental or business‐type activities columns in the government‐wide financial statements. All infrastructure acquired before July 1, 2001 (date of implementation of GASB 34) has been recorded by the City at historical cost if purchased or constructed or at fair market value at the date of donation. Capital assets are defined by the City as assets with an initial, individual cost of more than $5,000 and an estimated useful life in excess of two years. Such assets are recorded at historical cost or estimated historical cost if purchased or constructed. Donated capital assets received prior to June 15, 2015 are recorded at their estimated fair value at the date of donation. Donated capital assets received after June 15, 2015 are recorded at acquisition value. All other purchased or constructed capital assets are reported at cost or estimated historical cost. The costs of normal maintenance and repairs that do not add to the value of the asset or materially extend assets lives are not capitalized. Major outlays for capital assets and improvements are capitalized as projects are constructed. Interest incurred during the construction phase of capital assets of business‐type activities is included as part of the capitalized value of the assets constructed. The total interest expense incurred by the City for business‐type activities during the fiscal year was $32,561,887. Of this amount, $5,582,185 was included as part of the cost of capital assets under construction in connection with water and sewer projects.
27
City of Raleigh Financial Section
Capital assets are depreciated using the straight line method over the following estimated useful lives:
Assets Years Buildings and machinery 40 Water and sewer systems 50 Streets and sidewalks 25 Major improvements 20 Software 20 Buses 10 Furniture & fixtures 5 Equipment 5‐10
6. Deferred outflows/inflows of resources In addition to assets, the statement of net position will sometimes report a separate section for deferred outflows of resources. This separate financial statement element, Deferred Outflows of Resources, represents a consumption of net position that applies to a future period and so will not be recognized as an expense or expenditure until then. The City has three items that meet this criterion, unamortized bond refunding charges, contributions made to the pension plan in the 2016 fiscal year and an accumulated decrease in the fair value of hedging derivatives for the City’s interest rate swap agreements. In addition to liabilities, the statement of financial position will sometimes report a separate section for deferred inflows of resources. This separate financial statement element, Deferred Inflows of Resources, represents an acquisition of net position that applies to a future period and so will not be recognized as revenue until then. The City has multiple items that meet the criterion for this category ‐ prepaid taxes, loans receivable, assessments and property taxes receivable and deferrals of pension expense that result from the implementation of GASB Statement 68.
7. Earned vacation pay
It is the City’s policy to permit employees to accumulate earned but unused vacation and sick pay benefits. There is no liability for unpaid accumulated sick leave since the City does not have a policy to pay any amounts when employees separate from service. All vacation pay is accrued when incurred in the government‐wide and proprietary fund financial statements. A liability for these amounts is reported in governmental funds only if they have matured, for example, as a result of employee resignations and retirements.
8. Long‐term obligations
In the government‐wide financial statements, and proprietary fund types in the fund financial statements, long‐term debt and other long‐term obligations are reported as liabilities in the applicable governmental activities, or proprietary fund type statement of net position. Bond premiums and discounts are deferred and amortized over the life of the bonds using the effective interest method. Bonds payable are reported net of the applicable bond premium or discount. In the fund financial statements, governmental fund types recognize bond premiums and discounts, as well as bond issuance costs, during the current period. The face amount of the debt issued is reported as other financing sources. Premiums received on debt issuances are reported as other financing sources while discounts on debt issuances are reported as other financing uses. Issuance costs, whether or not withheld from the actual debt proceeds received, are reported as debt expenditures.
27
28
City of Raleigh Financial Section
9. Net position/fund balances Net position in government‐wide and proprietary fund financial statements are classified as net investment in capital assets; restricted; and unrestricted. Restricted net position represents constraints on resources that are either externally imposed by creditors, grantors, contributors, or laws or regulations of other governments or imposed by law through state statute. In the governmental fund financial statements, fund balance is composed of five classifications designed to disclose the hierarchy of constraints placed on how fund balance can be spent. The governmental fund types classify fund balance as follows:
Nonspendable Fund Balance – This classification includes amounts that cannot be spent because they are either (a) not in spendable form or (b) legally or contractually required to be maintained intact.
Inventories – portion of fund balance that is not an available resource because it represents the year‐end balance for inventories, which are not spendable resources. Assets held for resale – portion of fund balance that is not an available resource because it represents property that is available for sale, which is not a spendable resource. Loans receivable ‐ portion of fund balance that is not an available resource because it represents revolving loans receivable due to the City, which are not spendable resources.
Restricted Fund Balance – This classification includes amounts that are restricted to specific purposes externally imposed by creditors or imposed by law.
Restricted for stabilization by state statute ‐ portion of fund balance restricted by State Statute [G.S.15‐98(a)]. Restricted for debt service – portion of fund balance that must be used to pay City obligations. Restricted for federal program reserves – portion of fund balance that is restricted by revenue source for federal programs. Restricted for streets – Powell Bill portion of fund balance that is restricted by revenue source for street construction and maintenance expenditures. Restricted for public safety – portion of fund balance that is restricted by revenue source for certain emergency telephone system expenditures.
Committed Fund Balance – This classification includes a portion of fund balance that can only be used for specific purposes imposed by majority vote by quorum of City of Raleigh’s City Council. The City Council, by adoption of an ordinance prior to the end of the fiscal year, commits fund balance. Once adopted, the limitation imposed by the ordinance remains in place until a similar action is taken (the adoption of another ordinance) to remove or revise the limitation. Committed for Law Enforcement Officers’ Special Separation Allowance Fund ‐ portion of fund balance committed for contributions to a defined benefit plan provided to City law enforcement officers.
28
29
City of Raleigh Financial Section
Assigned Fund Balance – This classification includes a portion of fund balance that the City of Raleigh intends to use for specific purposes. The City of Raleigh City Council has designated the City Manager as the delegated Official that can “assign” portions of fund balance per the City of Raleigh’s fund balance goal policy.
Subsequent year’s appropriation – portion of fund balance that is appropriated in the next year’s budget that is not already classified in restricted or committed. The governing body approves the appropriation; all budget amendments regardless of amount must be submitted to the City council for approval.
Assigned for community development – portion of fund balance the City intends to use for community development across the City. Assigned for City projects – portion of fund balance that the City intends to use for specific projects.
Assigned for disaster recovery – portion of fund balance that the City intends to use for disaster recovery efforts.
Assigned for debt service – portion of fund balance that the City intends to use for future debt service payments. Assigned for parks and recreation – portion of fund balance that the City intends to use for specific parks and recreation programs.
Unassigned Fund Balance – This classification includes the portion of fund balance that has not been restricted, committed, or assigned to specific purposes or other funds.
When an expenditure is incurred for purposes for which both restricted and unrestricted fund balance is available, the City considers restricted funds to have been spent first. When an expenditure is incurred for which committed, assigned, or unassigned fund balances are available, the City considers amounts to have been spent first out of committed funds, then assigned funds, and finally unassigned funds, as needed, unless the City Council has provided otherwise in its commitment or assignment actions. The City of Raleigh has also adopted a minimum fund balance policy for the general fund which instructs management to conduct business of the City in such a manner that available fund balance is at least equal to or greater that 14% of next years budgeted expenditures. Any portion of the general fund balance in excess of 14% of budgeted expenditures may be appropriated for one‐time expenditures and may not be used for any purpose that would obligate the City in a future budget.
10. Pensions For purposes of measuring the net pension asset, deferred outflows of resources and deferred inflows of resources related to pensions, and pension expense, information about the fiduciary net position of the Local Governmental Employees’ Retirement System (LGERS) and additions to/deductions from LGERS’ fiduciary net position have been determined on the same basis as they are reported by LGERS. For this purpose, plan member contributions are recognized in the period in which the contributions are due. The City of Raleigh’s employer contributions are recognized when due and the City of Raleigh has a legal requirement to provide the contributions. Benefits and refunds are recognized when due and payable in accordance with the terms of LGERS. Investments are reported at fair value.
11. Interest rate swap The City enters into interest rate swap agreements to modify interest rates on outstanding debt. The interest rate swaps are reported in the net position statements for government‐wide and proprietary funds at fair market value.
29
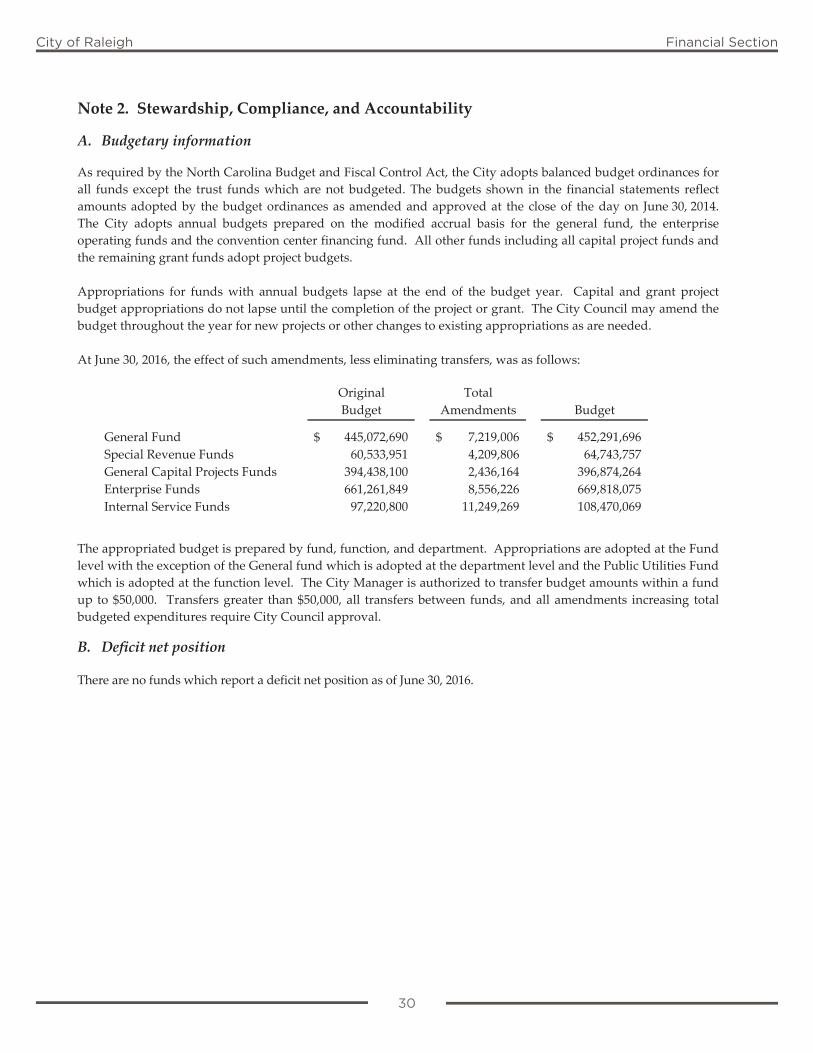
30
City of Raleigh Financial Section
Note 2. Stewardship, Compliance, and Accountability A. Budgetary information As required by the North Carolina Budget and Fiscal Control Act, the City adopts balanced budget ordinances for all funds except the trust funds which are not budgeted. The budgets shown in the financial statements reflect amounts adopted by the budget ordinances as amended and approved at the close of the day on June 30, 2014. The City adopts annual budgets prepared on the modified accrual basis for the general fund, the enterprise operating funds and the convention center financing fund. All other funds including all capital project funds and the remaining grant funds adopt project budgets. Appropriations for funds with annual budgets lapse at the end of the budget year. Capital and grant project budget appropriations do not lapse until the completion of the project or grant. The City Council may amend the budget throughout the year for new projects or other changes to existing appropriations as are needed. At June 30, 2016, the effect of such amendments, less eliminating transfers, was as follows:
Original Total Budget Amendments Budget
General Fund 445,072,690$ 7,219,006$ 452,291,696$ Special Revenue Funds 60,533,951 4,209,806 64,743,757 General Capital Projects Funds 394,438,100 2,436,164 396,874,264 Enterprise Funds 661,261,849 8,556,226 669,818,075 Internal Service Funds 97,220,800 11,249,269 108,470,069
The appropriated budget is prepared by fund, function, and department. Appropriations are adopted at the Fund level with the exception of the General fund which is adopted at the department level and the Public Utilities Fund which is adopted at the function level. The City Manager is authorized to transfer budget amounts within a fund up to $50,000. Transfers greater than $50,000, all transfers between funds, and all amendments increasing total budgeted expenditures require City Council approval. B. Deficit net position There are no funds which report a deficit net position as of June 30, 2016.
30
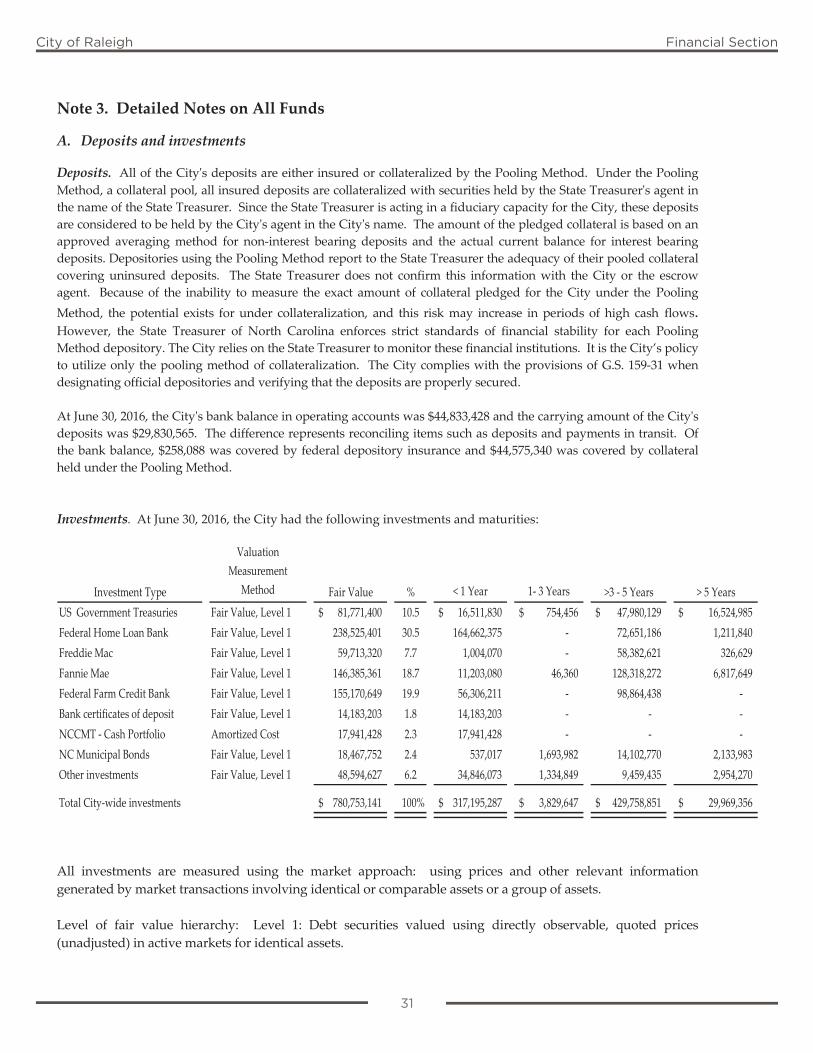
31
City of Raleigh Financial Section
Note 3. Detailed Notes on All Funds A. Deposits and investments Deposits. All of the Cityʹs deposits are either insured or collateralized by the Pooling Method. Under the Pooling Method, a collateral pool, all insured deposits are collateralized with securities held by the State Treasurerʹs agent in the name of the State Treasurer. Since the State Treasurer is acting in a fiduciary capacity for the City, these deposits are considered to be held by the Cityʹs agent in the Cityʹs name. The amount of the pledged collateral is based on an approved averaging method for non‐interest bearing deposits and the actual current balance for interest bearing deposits. Depositories using the Pooling Method report to the State Treasurer the adequacy of their pooled collateral covering uninsured deposits. The State Treasurer does not confirm this information with the City or the escrow agent. Because of the inability to measure the exact amount of collateral pledged for the City under the Pooling Method, the potential exists for under collateralization, and this risk may increase in periods of high cash flows. However, the State Treasurer of North Carolina enforces strict standards of financial stability for each Pooling Method depository. The City relies on the State Treasurer to monitor these financial institutions. It is the City’s policy to utilize only the pooling method of collateralization. The City complies with the provisions of G.S. 159‐31 when designating official depositories and verifying that the deposits are properly secured. At June 30, 2016, the Cityʹs bank balance in operating accounts was $44,833,428 and the carrying amount of the Cityʹs deposits was $29,830,565. The difference represents reconciling items such as deposits and payments in transit. Of the bank balance, $258,088 was covered by federal depository insurance and $44,575,340 was covered by collateral held under the Pooling Method. Investments. At June 30, 2016, the City had the following investments and maturities:
Investment Type Fair Value % < 1 Year 1‐ 3 Years >3 ‐ 5 Years > 5 YearsUS Government Treasuries Fair Value, Level 1 81,771,400$ 10.5 16,511,830$ 754,456$ 47,980,129$ 16,524,985$ Federal Home Loan Bank Fair Value, Level 1 238,525,401 30.5 164,662,375 ‐ 72,651,186 1,211,840 Freddie Mac Fair Value, Level 1 59,713,320 7.7 1,004,070 ‐ 58,382,621 326,629 Fannie Mae Fair Value, Level 1 146,385,361 18.7 11,203,080 46,360 128,318,272 6,817,649 Federal Farm Credit Bank Fair Value, Level 1 155,170,649 19.9 56,306,211 ‐ 98,864,438 ‐ Bank certificates of deposit Fair Value, Level 1 14,183,203 1.8 14,183,203 ‐ ‐ ‐ NCCMT ‐ Cash Portfolio Amortized Cost 17,941,428 2.3 17,941,428 ‐ ‐ ‐ NC Municipal Bonds Fair Value, Level 1 18,467,752 2.4 537,017 1,693,982 14,102,770 2,133,983 Other investments Fair Value, Level 1 48,594,627 6.2 34,846,073 1,334,849 9,459,435 2,954,270
Total City‐wide investments 780,753,141$ 100% 317,195,287$ 3,829,647$ 429,758,851$ 29,969,356$
Valuation Measurement
Method
All investments are measured using the market approach: using prices and other relevant information generated by market transactions involving identical or comparable assets or a group of assets. Level of fair value hierarchy: Level 1: Debt securities valued using directly observable, quoted prices (unadjusted) in active markets for identical assets.
31
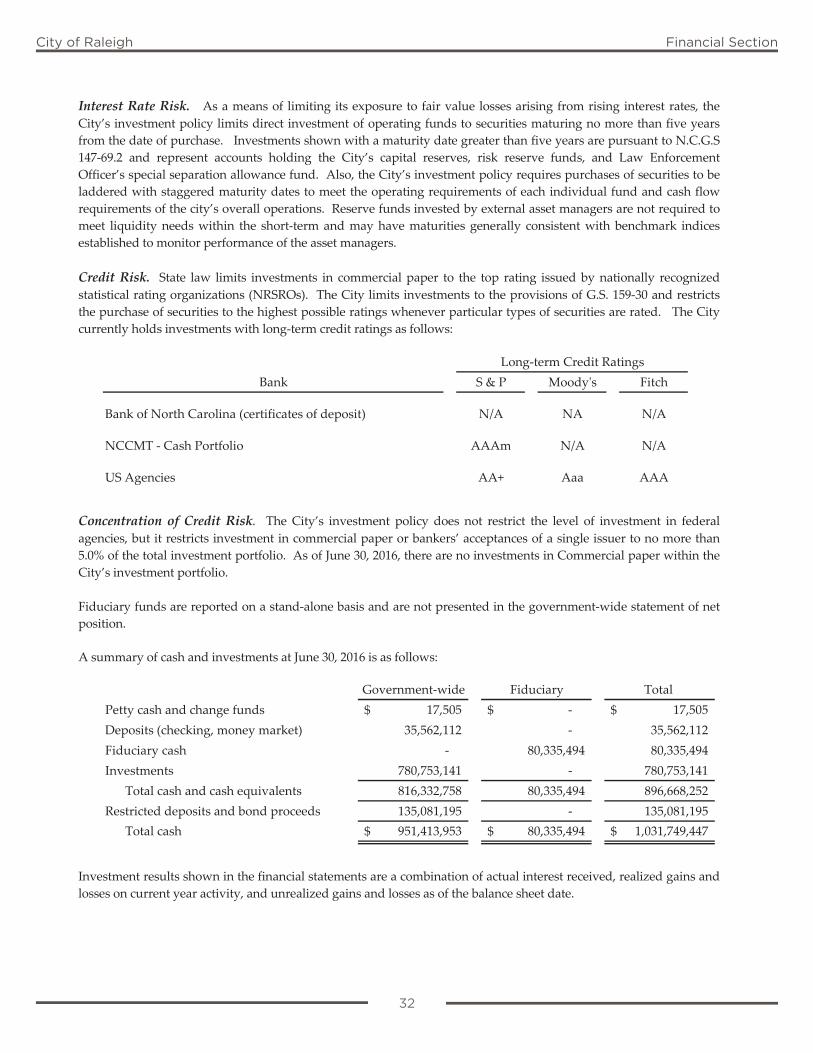
32
City of Raleigh Financial Section
Interest Rate Risk. As a means of limiting its exposure to fair value losses arising from rising interest rates, the City’s investment policy limits direct investment of operating funds to securities maturing no more than five years from the date of purchase. Investments shown with a maturity date greater than five years are pursuant to N.C.G.S 147‐69.2 and represent accounts holding the City’s capital reserves, risk reserve funds, and Law Enforcement Officer’s special separation allowance fund. Also, the City’s investment policy requires purchases of securities to be laddered with staggered maturity dates to meet the operating requirements of each individual fund and cash flow requirements of the city’s overall operations. Reserve funds invested by external asset managers are not required to meet liquidity needs within the short‐term and may have maturities generally consistent with benchmark indices established to monitor performance of the asset managers. Credit Risk. State law limits investments in commercial paper to the top rating issued by nationally recognized statistical rating organizations (NRSROs). The City limits investments to the provisions of G.S. 159‐30 and restricts the purchase of securities to the highest possible ratings whenever particular types of securities are rated. The City currently holds investments with long‐term credit ratings as follows:
Bank S & P Moodyʹs Fitch
Bank of North Carolina (certificates of deposit) N/A NA N/A
NCCMT ‐ Cash Portfolio AAAm N/A N/A
US Agencies AA+ Aaa AAA
Long‐term Credit Ratings
Concentration of Credit Risk. The City’s investment policy does not restrict the level of investment in federal agencies, but it restricts investment in commercial paper or bankers’ acceptances of a single issuer to no more than 5.0% of the total investment portfolio. As of June 30, 2016, there are no investments in Commercial paper within the City’s investment portfolio. Fiduciary funds are reported on a stand‐alone basis and are not presented in the government‐wide statement of net position. A summary of cash and investments at June 30, 2016 is as follows:
Government‐wide Fiduciary Total Petty cash and change funds 17,505$ ‐$ 17,505$ Deposits (checking, money market) 35,562,112 ‐ 35,562,112 Fiduciary cash ‐ 80,335,494 80,335,494 Investments 780,753,141 ‐ 780,753,141
Total cash and cash equivalents 816,332,758 80,335,494 896,668,252 Restricted deposits and bond proceeds 135,081,195 ‐ 135,081,195
Total cash 951,413,953$ 80,335,494$ 1,031,749,447$
Investment results shown in the financial statements are a combination of actual interest received, realized gains and losses on current year activity, and unrealized gains and losses as of the balance sheet date.
32
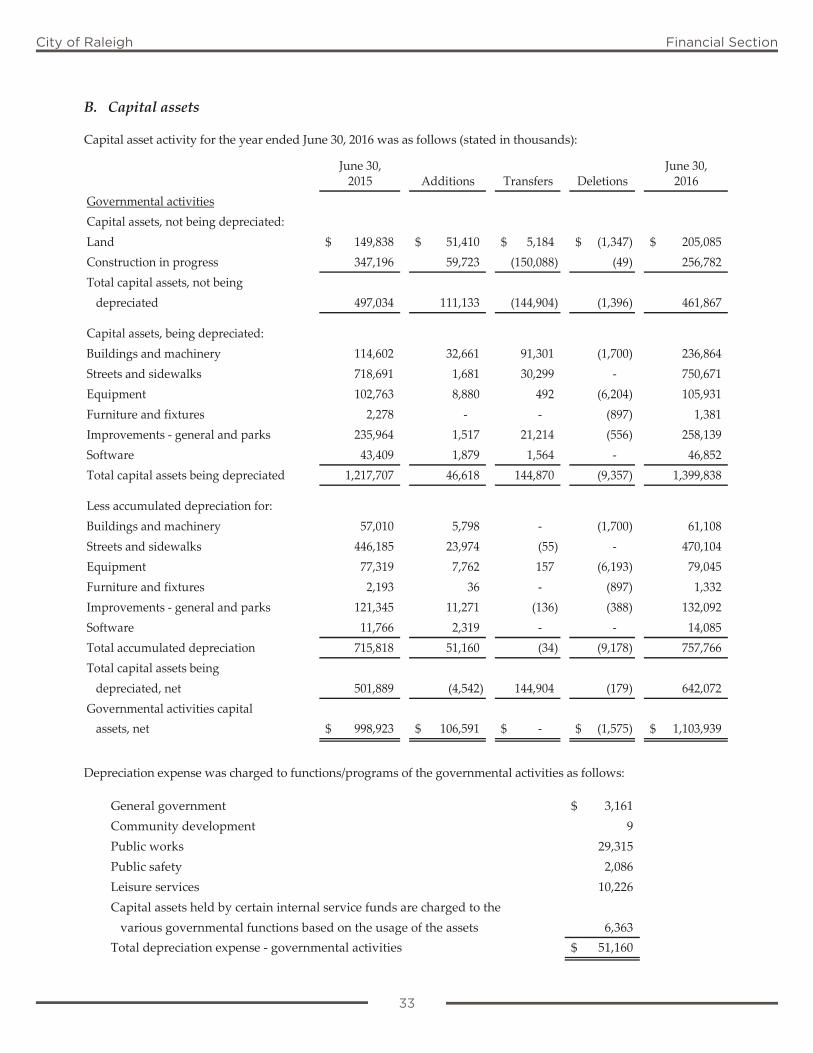
33
City of Raleigh Financial Section
B. Capital assets Capital asset activity for the year ended June 30, 2016 was as follows (stated in thousands):
June 30, June 30,2015 Additions Transfers Deletions 2016
Governmental activitiesCapital assets, not being depreciated:Land 149,838$ 51,410$ 5,184$ (1,347)$ 205,085$ Construction in progress 347,196 59,723 (150,088) (49) 256,782 Total capital assets, not being depreciated 497,034 111,133 (144,904) (1,396) 461,867
Capital assets, being depreciated:Buildings and machinery 114,602 32,661 91,301 (1,700) 236,864 Streets and sidewalks 718,691 1,681 30,299 ‐ 750,671 Equipment 102,763 8,880 492 (6,204) 105,931 Furniture and fixtures 2,278 ‐ ‐ (897) 1,381 Improvements ‐ general and parks 235,964 1,517 21,214 (556) 258,139 Software 43,409 1,879 1,564 ‐ 46,852 Total capital assets being depreciated 1,217,707 46,618 144,870 (9,357) 1,399,838
Less accumulated depreciation for:Buildings and machinery 57,010 5,798 ‐ (1,700) 61,108 Streets and sidewalks 446,185 23,974 (55) ‐ 470,104 Equipment 77,319 7,762 157 (6,193) 79,045 Furniture and fixtures 2,193 36 ‐ (897) 1,332 Improvements ‐ general and parks 121,345 11,271 (136) (388) 132,092 Software 11,766 2,319 ‐ ‐ 14,085 Total accumulated depreciation 715,818 51,160 (34) (9,178) 757,766 Total capital assets being depreciated, net 501,889 (4,542) 144,904 (179) 642,072 Governmental activities capital assets, net 998,923$ 106,591$ ‐$ (1,575)$ 1,103,939$
Depreciation expense was charged to functions/programs of the governmental activities as follows:
General government 3,161$ Community development 9 Public works 29,315 Public safety 2,086 Leisure services 10,226 Capital assets held by certain internal service funds are charged to the various governmental functions based on the usage of the assets 6,363 Total depreciation expense ‐ governmental activities 51,160$
33
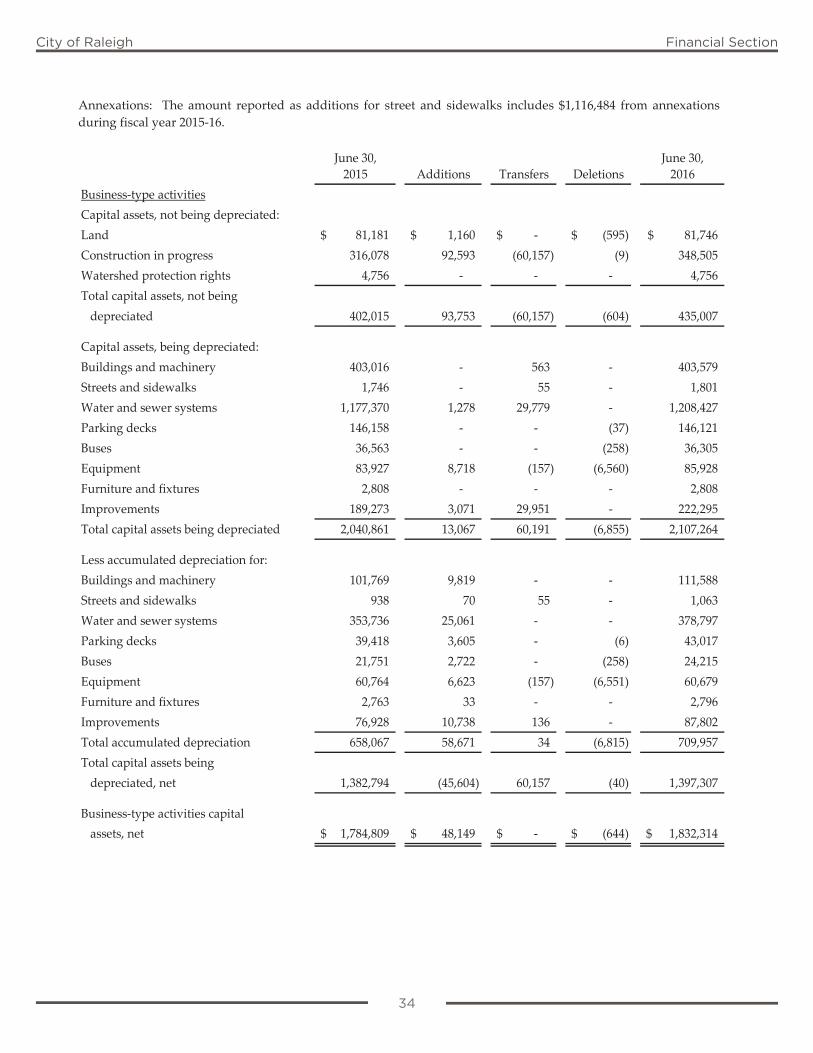
34
City of Raleigh Financial Section
Annexations: The amount reported as additions for street and sidewalks includes $1,116,484 from annexations during fiscal year 2015‐16.
June 30, June 30,2015 Additions Transfers Deletions 2016
Business‐type activitiesCapital assets, not being depreciated:Land 81,181$ 1,160$ ‐$ (595)$ 81,746$ Construction in progress 316,078 92,593 (60,157) (9) 348,505 Watershed protection rights 4,756 ‐ ‐ ‐ 4,756 Total capital assets, not being depreciated 402,015 93,753 (60,157) (604) 435,007
Capital assets, being depreciated:Buildings and machinery 403,016 ‐ 563 ‐ 403,579 Streets and sidewalks 1,746 ‐ 55 ‐ 1,801 Water and sewer systems 1,177,370 1,278 29,779 ‐ 1,208,427 Parking decks 146,158 ‐ ‐ (37) 146,121 Buses 36,563 ‐ ‐ (258) 36,305 Equipment 83,927 8,718 (157) (6,560) 85,928 Furniture and fixtures 2,808 ‐ ‐ ‐ 2,808 Improvements 189,273 3,071 29,951 ‐ 222,295 Total capital assets being depreciated 2,040,861 13,067 60,191 (6,855) 2,107,264
Less accumulated depreciation for:Buildings and machinery 101,769 9,819 ‐ ‐ 111,588 Streets and sidewalks 938 70 55 ‐ 1,063 Water and sewer systems 353,736 25,061 ‐ ‐ 378,797 Parking decks 39,418 3,605 ‐ (6) 43,017 Buses 21,751 2,722 ‐ (258) 24,215 Equipment 60,764 6,623 (157) (6,551) 60,679 Furniture and fixtures 2,763 33 ‐ ‐ 2,796 Improvements 76,928 10,738 136 ‐ 87,802 Total accumulated depreciation 658,067 58,671 34 (6,815) 709,957 Total capital assets being depreciated, net 1,382,794 (45,604) 60,157 (40) 1,397,307
Business‐type activities capital assets, net 1,784,809$ 48,149$ ‐$ (644)$ 1,832,314$
34
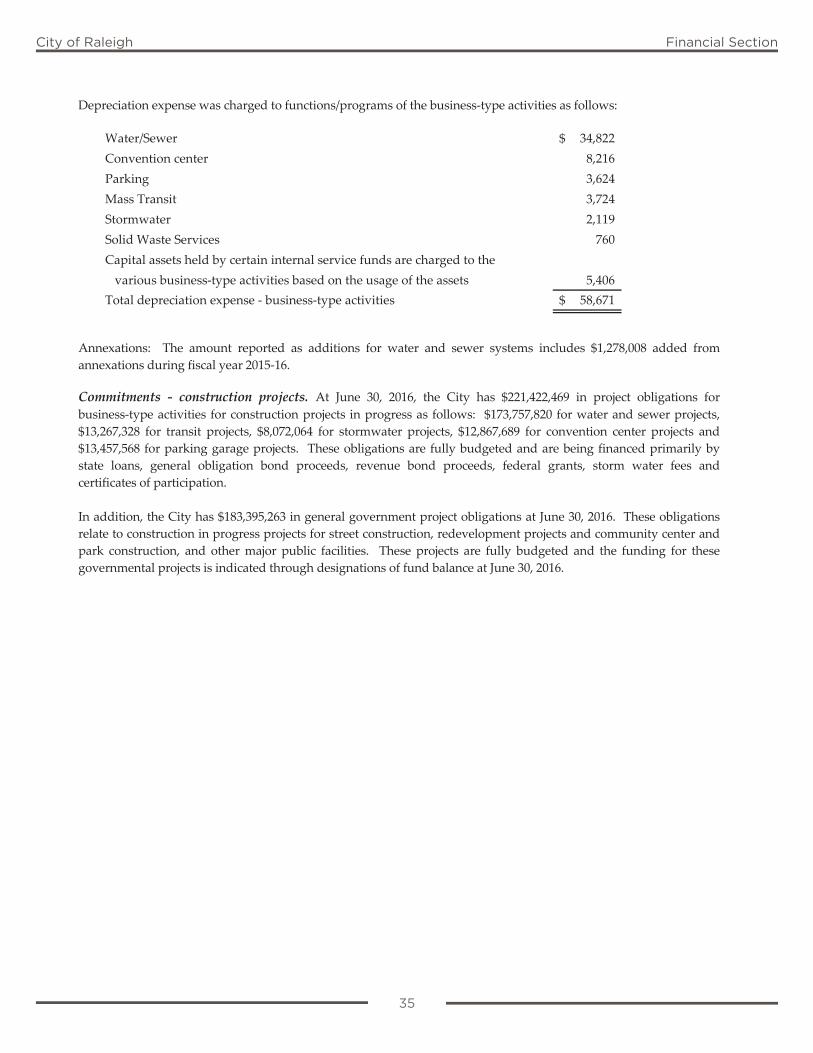
35
City of Raleigh Financial Section
Depreciation expense was charged to functions/programs of the business‐type activities as follows:
Water/Sewer 34,822$ Convention center 8,216 Parking 3,624 Mass Transit 3,724 Stormwater 2,119 Solid Waste Services 760 Capital assets held by certain internal service funds are charged to the various business‐type activities based on the usage of the assets 5,406 Total depreciation expense ‐ business‐type activities 58,671$
Annexations: The amount reported as additions for water and sewer systems includes $1,278,008 added from annexations during fiscal year 2015‐16. Commitments ‐ construction projects. At June 30, 2016, the City has $221,422,469 in project obligations for business‐type activities for construction projects in progress as follows: $173,757,820 for water and sewer projects, $13,267,328 for transit projects, $8,072,064 for stormwater projects, $12,867,689 for convention center projects and $13,457,568 for parking garage projects. These obligations are fully budgeted and are being financed primarily by state loans, general obligation bond proceeds, revenue bond proceeds, federal grants, storm water fees and certificates of participation. In addition, the City has $183,395,263 in general government project obligations at June 30, 2016. These obligations relate to construction in progress projects for street construction, redevelopment projects and community center and park construction, and other major public facilities. These projects are fully budgeted and the funding for these governmental projects is indicated through designations of fund balance at June 30, 2016.
35

36
City of Raleigh Financial Section
C. Unavailable revenue and unearned revenue Governmental funds report unavailable revenue in connection with receivables for revenues that are not considered to be available to liquidate liabilities of the current period. Governmental funds also defer revenue recognition in connection with inflows of resources that have been received, but not yet earned. At the end of the current fiscal year, the various components of unavailable revenue and unearned revenue reported in the governmental funds were as follows:
NonmajorGeneral Governmental Total
Amounts arising from cash: Police informant account 47,018$ ‐$ 47,018$ Cemetery cash account 8,088 ‐ 8,088 Cafeteria plan cash 217,652 ‐ 217,652 Prepaid taxes and assessments 88,572 6,580 95,152 Unearned revenue 24,200 4,684,468 4,708,668
385,530 4,691,048 5,076,578
Amounts not arising from cash: Taxes receivable 274,473 ‐ 274,473 Assessments receivable 321,061 452,405 773,466
595,534 452,405 1,047,939
Total 981,064$ 5,143,453$ 6,124,517$
36
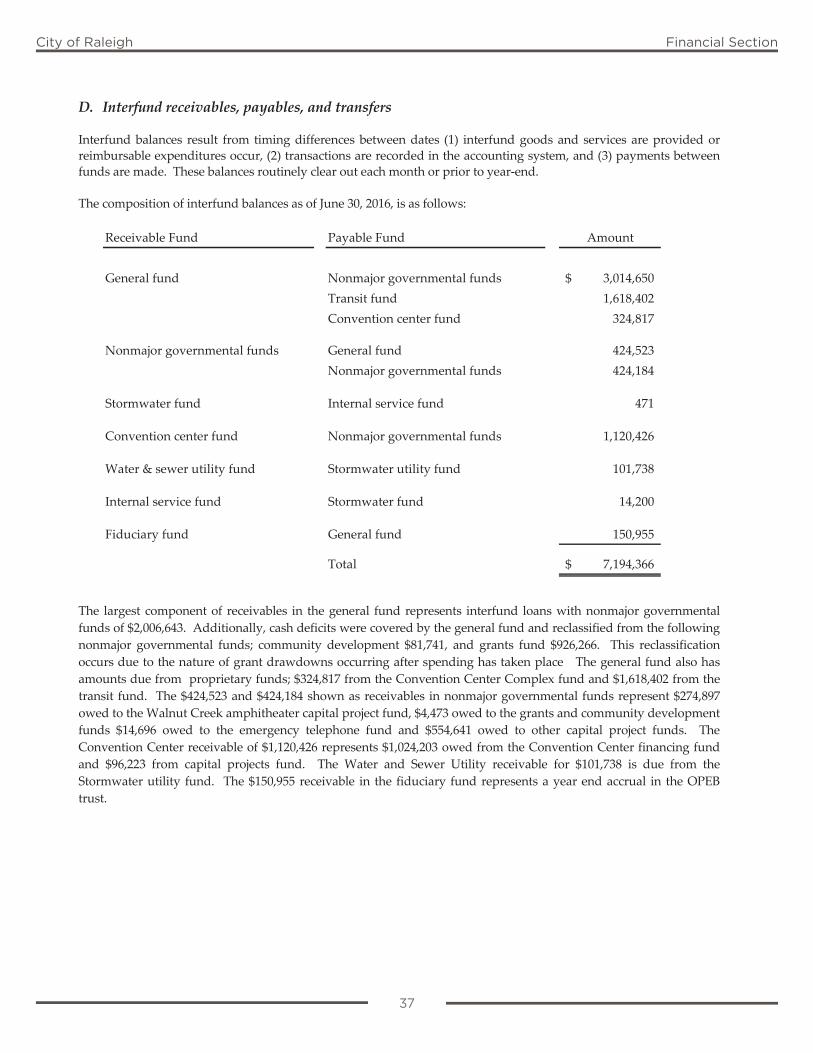
37
City of Raleigh Financial Section
D. Interfund receivables, payables, and transfers Interfund balances result from timing differences between dates (1) interfund goods and services are provided or reimbursable expenditures occur, (2) transactions are recorded in the accounting system, and (3) payments between funds are made. These balances routinely clear out each month or prior to year‐end. The composition of interfund balances as of June 30, 2016, is as follows:
Receivable Fund Payable Fund Amount
General fund Nonmajor governmental funds 3,014,650$ Transit fund 1,618,402 Convention center fund 324,817
Nonmajor governmental funds General fund 424,523 Nonmajor governmental funds 424,184
Stormwater fund Internal service fund 471
Convention center fund Nonmajor governmental funds 1,120,426
Water & sewer utility fund Stormwater utility fund 101,738
Internal service fund Stormwater fund 14,200
Fiduciary fund General fund 150,955
Total 7,194,366$
The largest component of receivables in the general fund represents interfund loans with nonmajor governmental funds of $2,006,643. Additionally, cash deficits were covered by the general fund and reclassified from the following nonmajor governmental funds; community development $81,741, and grants fund $926,266. This reclassification occurs due to the nature of grant drawdowns occurring after spending has taken place The general fund also has amounts due from proprietary funds; $324,817 from the Convention Center Complex fund and $1,618,402 from the transit fund. The $424,523 and $424,184 shown as receivables in nonmajor governmental funds represent $274,897 owed to the Walnut Creek amphitheater capital project fund, $4,473 owed to the grants and community development funds $14,696 owed to the emergency telephone fund and $554,641 owed to other capital project funds. The Convention Center receivable of $1,120,426 represents $1,024,203 owed from the Convention Center financing fund and $96,223 from capital projects fund. The Water and Sewer Utility receivable for $101,738 is due from the Stormwater utility fund. The $150,955 receivable in the fiduciary fund represents a year end accrual in the OPEB trust.
37
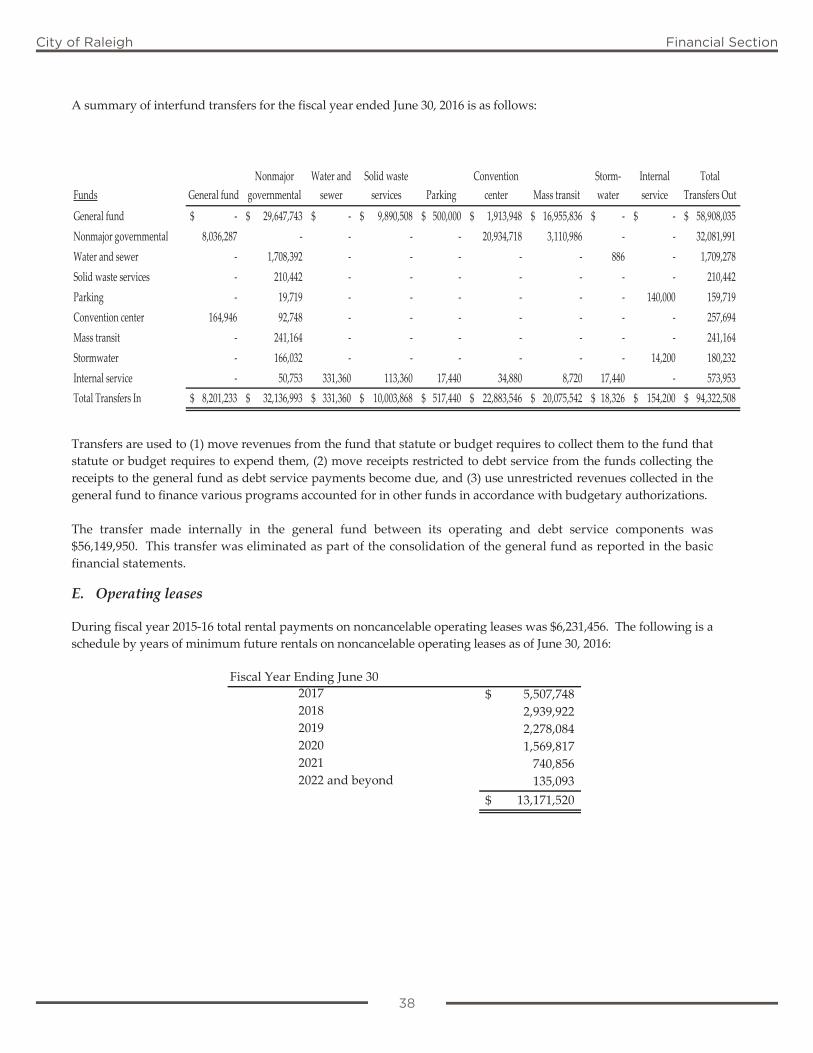
38
City of Raleigh Financial Section
A summary of interfund transfers for the fiscal year ended June 30, 2016 is as follows:
Funds General fundNonmajor
governmentalWater and sewer
Solid waste services Parking
Convention center Mass transit
Storm‐ water
Internal service
Total Transfers Out
General fund ‐$ 29,647,743$ ‐$ 9,890,508$ 500,000$ 1,913,948$ 16,955,836$ ‐$ ‐$ 58,908,035$ Nonmajor governmental 8,036,287 ‐ ‐ ‐ ‐ 20,934,718 3,110,986 ‐ ‐ 32,081,991 Water and sewer ‐ 1,708,392 ‐ ‐ ‐ ‐ ‐ 886 ‐ 1,709,278 Solid waste services ‐ 210,442 ‐ ‐ ‐ ‐ ‐ ‐ ‐ 210,442 Parking ‐ 19,719 ‐ ‐ ‐ ‐ ‐ ‐ 140,000 159,719 Convention center 164,946 92,748 ‐ ‐ ‐ ‐ ‐ ‐ ‐ 257,694 Mass transit ‐ 241,164 ‐ ‐ ‐ ‐ ‐ ‐ ‐ 241,164 Stormwater ‐ 166,032 ‐ ‐ ‐ ‐ ‐ ‐ 14,200 180,232 Internal service ‐ 50,753 331,360 113,360 17,440 34,880 8,720 17,440 ‐ 573,953 Total Transfers In 8,201,233$ 32,136,993$ 331,360$ 10,003,868$ 517,440$ 22,883,546$ 20,075,542$ 18,326$ 154,200$ 94,322,508$
Transfers are used to (1) move revenues from the fund that statute or budget requires to collect them to the fund that statute or budget requires to expend them, (2) move receipts restricted to debt service from the funds collecting the receipts to the general fund as debt service payments become due, and (3) use unrestricted revenues collected in the general fund to finance various programs accounted for in other funds in accordance with budgetary authorizations. The transfer made internally in the general fund between its operating and debt service components was $56,149,950. This transfer was eliminated as part of the consolidation of the general fund as reported in the basic financial statements. E. Operating leases During fiscal year 2015‐16 total rental payments on noncancelable operating leases was $6,231,456. The following is a schedule by years of minimum future rentals on noncancelable operating leases as of June 30, 2016:
Fiscal Year Ending June 302017 5,507,748$ 2018 2,939,922 2019 2,278,084 2020 1,569,817 2021 740,856 2022 and beyond 135,093
13,171,520$
38
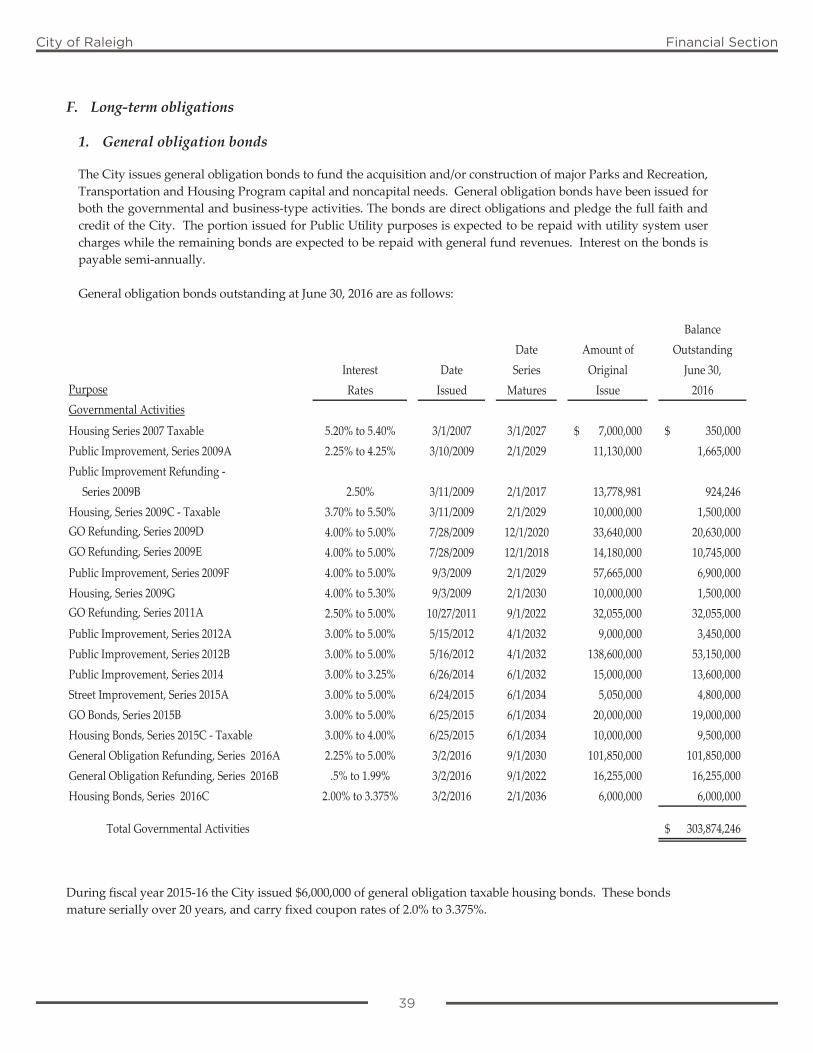
39
City of Raleigh Financial Section
F. Long‐term obligations
1. General obligation bonds The City issues general obligation bonds to fund the acquisition and/or construction of major Parks and Recreation, Transportation and Housing Program capital and noncapital needs. General obligation bonds have been issued for both the governmental and business‐type activities. The bonds are direct obligations and pledge the full faith and credit of the City. The portion issued for Public Utility purposes is expected to be repaid with utility system user charges while the remaining bonds are expected to be repaid with general fund revenues. Interest on the bonds is payable semi‐annually. General obligation bonds outstanding at June 30, 2016 are as follows:
Balance
Date Amount of OutstandingInterest Date Series Original June 30,
Purpose Rates Issued Matures Issue 2016Governmental Activities
Housing Series 2007 Taxable 5.20% to 5.40% 3/1/2007 3/1/2027 7,000,000$ 350,000$ Public Improvement, Series 2009A 2.25% to 4.25% 3/10/2009 2/1/2029 11,130,000 1,665,000 Public Improvement Refunding ‐ Series 2009B 2.50% 3/11/2009 2/1/2017 13,778,981 924,246 Housing, Series 2009C ‐ Taxable 3.70% to 5.50% 3/11/2009 2/1/2029 10,000,000 1,500,000 GO Refunding, Series 2009D 4.00% to 5.00% 7/28/2009 12/1/2020 33,640,000 20,630,000 GO Refunding, Series 2009E 4.00% to 5.00% 7/28/2009 12/1/2018 14,180,000 10,745,000 Public Improvement, Series 2009F 4.00% to 5.00% 9/3/2009 2/1/2029 57,665,000 6,900,000 Housing, Series 2009G 4.00% to 5.30% 9/3/2009 2/1/2030 10,000,000 1,500,000 GO Refunding, Series 2011A 2.50% to 5.00% 10/27/2011 9/1/2022 32,055,000 32,055,000 Public Improvement, Series 2012A 3.00% to 5.00% 5/15/2012 4/1/2032 9,000,000 3,450,000 Public Improvement, Series 2012B 3.00% to 5.00% 5/16/2012 4/1/2032 138,600,000 53,150,000 Public Improvement, Series 2014 3.00% to 3.25% 6/26/2014 6/1/2032 15,000,000 13,600,000 Street Improvement, Series 2015A 3.00% to 5.00% 6/24/2015 6/1/2034 5,050,000 4,800,000 GO Bonds, Series 2015B 3.00% to 5.00% 6/25/2015 6/1/2034 20,000,000 19,000,000 Housing Bonds, Series 2015C ‐ Taxable 3.00% to 4.00% 6/25/2015 6/1/2034 10,000,000 9,500,000 General Obligation Refunding, Series 2016A 2.25% to 5.00% 3/2/2016 9/1/2030 101,850,000 101,850,000 General Obligation Refunding, Series 2016B .5% to 1.99% 3/2/2016 9/1/2022 16,255,000 16,255,000 Housing Bonds, Series 2016C 2.00% to 3.375% 3/2/2016 2/1/2036 6,000,000 6,000,000
Total Governmental Activities 303,874,246$
During fiscal year 2015‐16 the City issued $6,000,000 of general obligation taxable housing bonds. These bonds mature serially over 20 years, and carry fixed coupon rates of 2.0% to 3.375%.
39
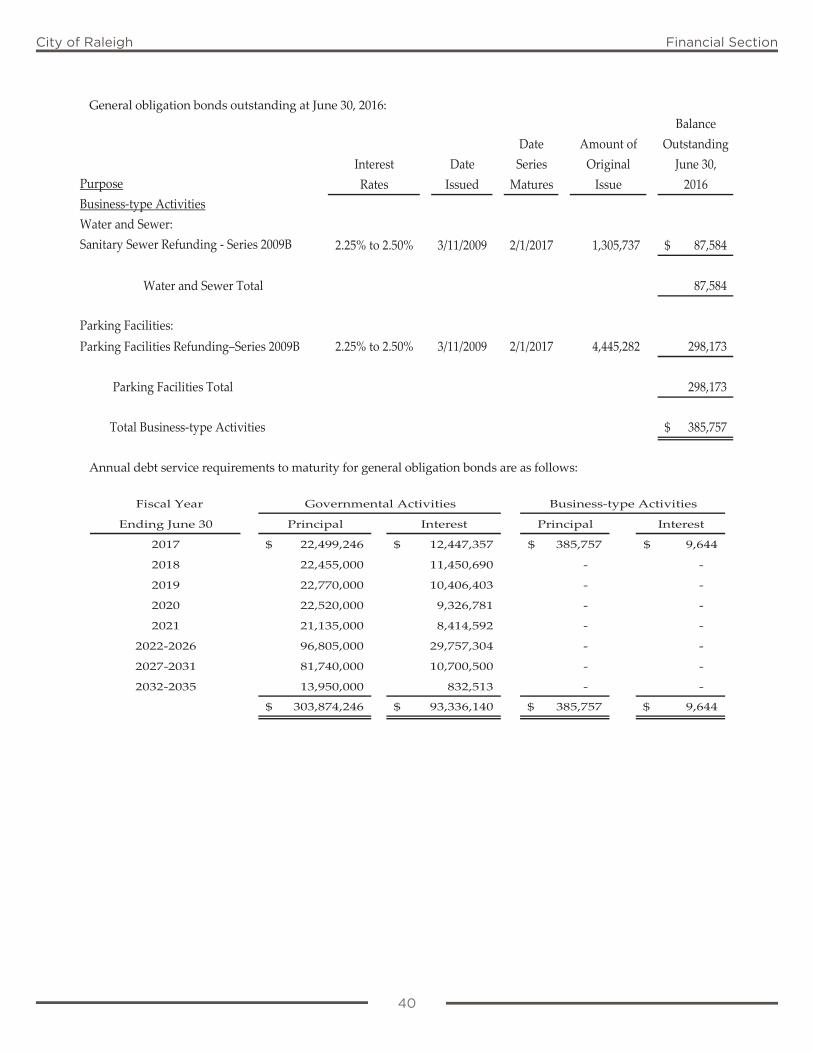
40
City of Raleigh Financial Section
General obligation bonds outstanding at June 30, 2016: Balance
Date Amount of OutstandingInterest Date Series Original June 30,
Purpose Rates Issued Matures Issue 2016Business‐type ActivitiesWater and Sewer:Sanitary Sewer Refunding ‐ Series 2009B 2.25% to 2.50% 3/11/2009 2/1/2017 1,305,737 87,584$
Water and Sewer Total 87,584
Parking Facilities:Parking Facilities Refunding–Series 2009B 2.25% to 2.50% 3/11/2009 2/1/2017 4,445,282 298,173
Parking Facilities Total 298,173
Total Business‐type Activities 385,757$
Annual debt service requirements to maturity for general obligation bonds are as follows:
Fiscal Year
Ending June 30 Principal Interest Principal Interest
2017 22,499,246$ 12,447,357$ 385,757$ 9,644$
2018 22,455,000 11,450,690 ‐ ‐
2019 22,770,000 10,406,403 ‐ ‐
2020 22,520,000 9,326,781 ‐ ‐
2021 21,135,000 8,414,592 ‐ ‐
2022‐2026 96,805,000 29,757,304 ‐ ‐
2027‐2031 81,740,000 10,700,500 ‐ ‐
2032‐2035 13,950,000 832,513 ‐ ‐
303,874,246$ 93,336,140$ 385,757$ 9,644$
Governmental Activities Business‐type Activities
40
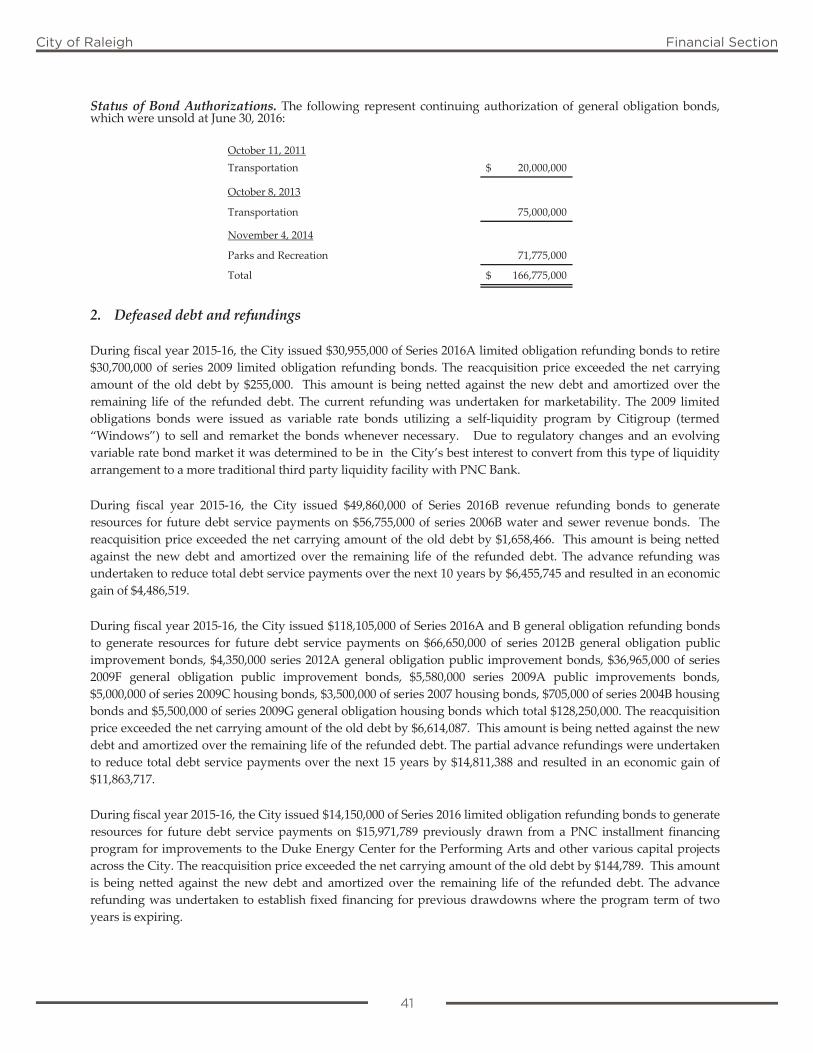
41
City of Raleigh Financial Section
Status of Bond Authorizations. The following represent continuing authorization of general obligation bonds, which were unsold at June 30, 2016:
October 11, 2011Transportation 20,000,000$
October 8, 2013
Transportation 75,000,000 November 4, 2014
Parks and Recreation 71,775,000
Total 166,775,000$
2. Defeased debt and refundings
During fiscal year 2015‐16, the City issued $30,955,000 of Series 2016A limited obligation refunding bonds to retire $30,700,000 of series 2009 limited obligation refunding bonds. The reacquisition price exceeded the net carrying amount of the old debt by $255,000. This amount is being netted against the new debt and amortized over the remaining life of the refunded debt. The current refunding was undertaken for marketability. The 2009 limited obligations bonds were issued as variable rate bonds utilizing a self‐liquidity program by Citigroup (termed “Windows”) to sell and remarket the bonds whenever necessary. Due to regulatory changes and an evolving variable rate bond market it was determined to be in the City’s best interest to convert from this type of liquidity arrangement to a more traditional third party liquidity facility with PNC Bank.
During fiscal year 2015‐16, the City issued $49,860,000 of Series 2016B revenue refunding bonds to generate resources for future debt service payments on $56,755,000 of series 2006B water and sewer revenue bonds. The reacquisition price exceeded the net carrying amount of the old debt by $1,658,466. This amount is being netted against the new debt and amortized over the remaining life of the refunded debt. The advance refunding was undertaken to reduce total debt service payments over the next 10 years by $6,455,745 and resulted in an economic gain of $4,486,519.
During fiscal year 2015‐16, the City issued $118,105,000 of Series 2016A and B general obligation refunding bonds to generate resources for future debt service payments on $66,650,000 of series 2012B general obligation public improvement bonds, $4,350,000 series 2012A general obligation public improvement bonds, $36,965,000 of series 2009F general obligation public improvement bonds, $5,580,000 series 2009A public improvements bonds, $5,000,000 of series 2009C housing bonds, $3,500,000 of series 2007 housing bonds, $705,000 of series 2004B housing bonds and $5,500,000 of series 2009G general obligation housing bonds which total $128,250,000. The reacquisition price exceeded the net carrying amount of the old debt by $6,614,087. This amount is being netted against the new debt and amortized over the remaining life of the refunded debt. The partial advance refundings were undertaken to reduce total debt service payments over the next 15 years by $14,811,388 and resulted in an economic gain of $11,863,717.
During fiscal year 2015‐16, the City issued $14,150,000 of Series 2016 limited obligation refunding bonds to generate resources for future debt service payments on $15,971,789 previously drawn from a PNC installment financing program for improvements to the Duke Energy Center for the Performing Arts and other various capital projects across the City. The reacquisition price exceeded the net carrying amount of the old debt by $144,789. This amount is being netted against the new debt and amortized over the remaining life of the refunded debt. The advance refunding was undertaken to establish fixed financing for previous drawdowns where the program term of two years is expiring.
41
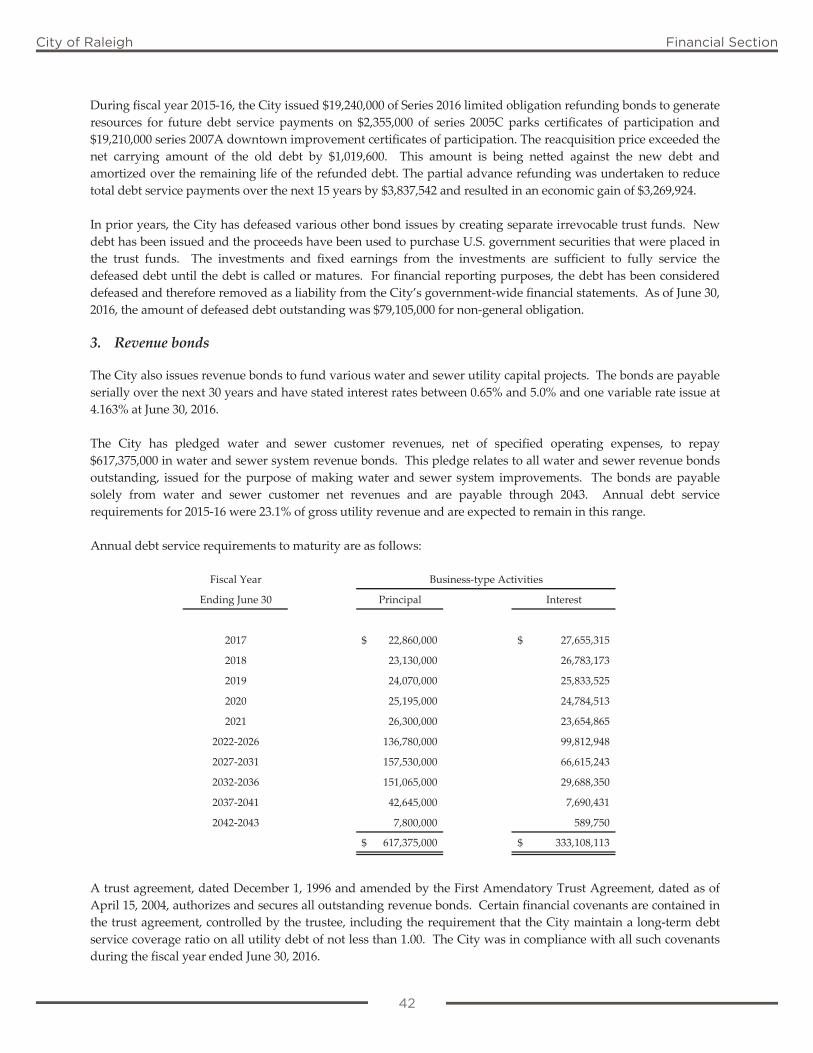
42
City of Raleigh Financial Section
During fiscal year 2015‐16, the City issued $19,240,000 of Series 2016 limited obligation refunding bonds to generate resources for future debt service payments on $2,355,000 of series 2005C parks certificates of participation and $19,210,000 series 2007A downtown improvement certificates of participation. The reacquisition price exceeded the net carrying amount of the old debt by $1,019,600. This amount is being netted against the new debt and amortized over the remaining life of the refunded debt. The partial advance refunding was undertaken to reduce total debt service payments over the next 15 years by $3,837,542 and resulted in an economic gain of $3,269,924.
In prior years, the City has defeased various other bond issues by creating separate irrevocable trust funds. New debt has been issued and the proceeds have been used to purchase U.S. government securities that were placed in the trust funds. The investments and fixed earnings from the investments are sufficient to fully service the defeased debt until the debt is called or matures. For financial reporting purposes, the debt has been considered defeased and therefore removed as a liability from the City’s government‐wide financial statements. As of June 30, 2016, the amount of defeased debt outstanding was $79,105,000 for non‐general obligation.
3. Revenue bonds The City also issues revenue bonds to fund various water and sewer utility capital projects. The bonds are payable serially over the next 30 years and have stated interest rates between 0.65% and 5.0% and one variable rate issue at 4.163% at June 30, 2016. The City has pledged water and sewer customer revenues, net of specified operating expenses, to repay $617,375,000 in water and sewer system revenue bonds. This pledge relates to all water and sewer revenue bonds outstanding, issued for the purpose of making water and sewer system improvements. The bonds are payable solely from water and sewer customer net revenues and are payable through 2043. Annual debt service requirements for 2015‐16 were 23.1% of gross utility revenue and are expected to remain in this range.
Annual debt service requirements to maturity are as follows:
Fiscal Year
Ending June 30 Principal Interest
2017 22,860,000$ 27,655,315$
2018 23,130,000 26,783,173
2019 24,070,000 25,833,525
2020 25,195,000 24,784,513
2021 26,300,000 23,654,865
2022‐2026 136,780,000 99,812,948
2027‐2031 157,530,000 66,615,243
2032‐2036 151,065,000 29,688,350
2037‐2041 42,645,000 7,690,431
2042‐2043 7,800,000 589,750
617,375,000$ 333,108,113$
Business‐type Activities
A trust agreement, dated December 1, 1996 and amended by the First Amendatory Trust Agreement, dated as of April 15, 2004, authorizes and secures all outstanding revenue bonds. Certain financial covenants are contained in the trust agreement, controlled by the trustee, including the requirement that the City maintain a long‐term debt service coverage ratio on all utility debt of not less than 1.00. The City was in compliance with all such covenants during the fiscal year ended June 30, 2016.
42
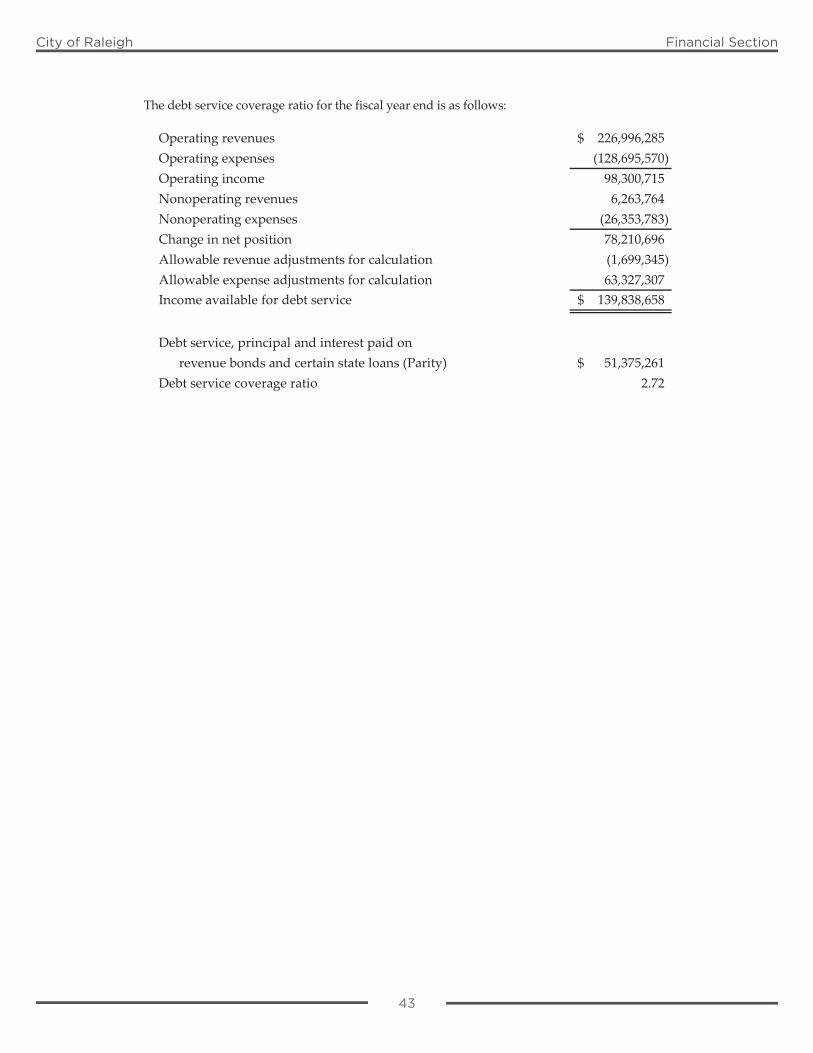
43
City of Raleigh Financial Section
The debt service coverage ratio for the fiscal year end is as follows:
Operating revenues 226,996,285$ Operating expenses (128,695,570) Operating income 98,300,715 Nonoperating revenues 6,263,764 Nonoperating expenses (26,353,783) Change in net position 78,210,696 Allowable revenue adjustments for calculation (1,699,345) Allowable expense adjustments for calculation 63,327,307 Income available for debt service 139,838,658$
Debt service, principal and interest paid onrevenue bonds and certain state loans (Parity) 51,375,261$
Debt service coverage ratio 2.72
43
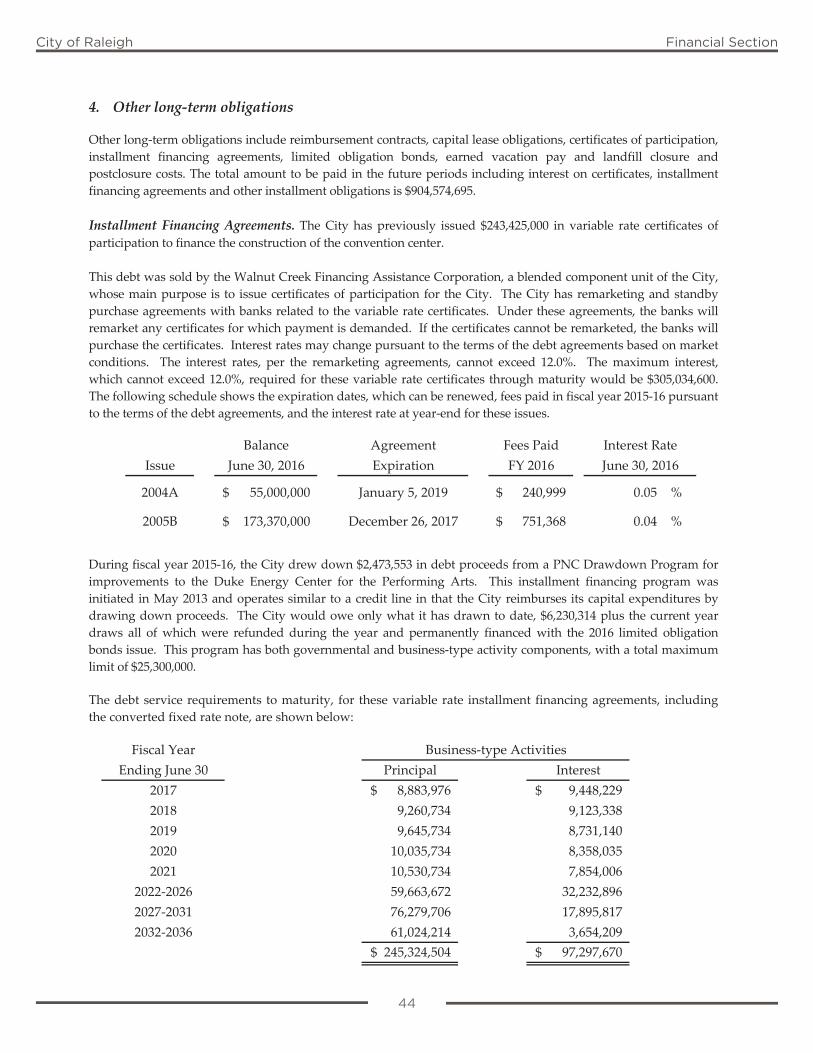
44
City of Raleigh Financial Section
4. Other long‐term obligations Other long‐term obligations include reimbursement contracts, capital lease obligations, certificates of participation, installment financing agreements, limited obligation bonds, earned vacation pay and landfill closure and postclosure costs. The total amount to be paid in the future periods including interest on certificates, installment financing agreements and other installment obligations is $904,574,695.
Installment Financing Agreements. The City has previously issued $243,425,000 in variable rate certificates of participation to finance the construction of the convention center.
This debt was sold by the Walnut Creek Financing Assistance Corporation, a blended component unit of the City, whose main purpose is to issue certificates of participation for the City. The City has remarketing and standby purchase agreements with banks related to the variable rate certificates. Under these agreements, the banks will remarket any certificates for which payment is demanded. If the certificates cannot be remarketed, the banks will purchase the certificates. Interest rates may change pursuant to the terms of the debt agreements based on market conditions. The interest rates, per the remarketing agreements, cannot exceed 12.0%. The maximum interest, which cannot exceed 12.0%, required for these variable rate certificates through maturity would be $305,034,600. The following schedule shows the expiration dates, which can be renewed, fees paid in fiscal year 2015‐16 pursuant to the terms of the debt agreements, and the interest rate at year‐end for these issues.
Balance Agreement Fees Paid
Issue June 30, 2016 Expiration FY 2016
2004A 55,000,000$ January 5, 2019 240,999$ 0.05 %
2005B 173,370,000$ December 26, 2017 751,368$ 0.04 %
June 30, 2016Interest Rate
During fiscal year 2015‐16, the City drew down $2,473,553 in debt proceeds from a PNC Drawdown Program for improvements to the Duke Energy Center for the Performing Arts. This installment financing program was initiated in May 2013 and operates similar to a credit line in that the City reimburses its capital expenditures by drawing down proceeds. The City would owe only what it has drawn to date, $6,230,314 plus the current year draws all of which were refunded during the year and permanently financed with the 2016 limited obligation bonds issue. This program has both governmental and business‐type activity components, with a total maximum limit of $25,300,000. The debt service requirements to maturity, for these variable rate installment financing agreements, including the converted fixed rate note, are shown below:
Fiscal YearEnding June 30 Principal Interest
2017 8,883,976$ 9,448,229$ 2018 9,260,734 9,123,338 2019 9,645,734 8,731,140 2020 10,035,734 8,358,035 2021 10,530,734 7,854,006
2022‐2026 59,663,672 32,232,896 2027‐2031 76,279,706 17,895,817 2032‐2036 61,024,214 3,654,209
245,324,504$ 97,297,670$
Business‐type Activities
44

45
City of Raleigh Financial Section
The City has previously entered into installment financing agreements to finance various general governmental capital projects. These debt issues carry fixed interest rates of 5.54% (outdoor amphitheater), 3.0% to 5.25% (downtown improvement projects), 1.76% (enterprise resource planning technology), and 3.0% to 4.25% (parks projects). The City also previously entered into limited obligation bonds that carry fixed coupon interest rates from 3.0% to 5.57%, and one variable rate at 0.42% at June 30, 2016, for the purpose of rehabilitating existing structures and constructing remote operations centers. Principal and interest requirements will be provided by appropriation in the year in which they become due. During fiscal year 2015‐16, the City issued $11,460,000 of Series 2016 limited obligation bonds to finance the construction of a fire station and finance projects for the Duke Energy Center for the Performing Arts. These bonds mature serially over 20 years, and carry fixed coupon rates of 4.25% to 5.0%. Also during fiscal year 2015‐16, the City drew down $1,032,846 in debt proceeds from a PNC Drawdown Program for the design of street improvement project. This installment financing program was initiated in May 2013 and operates similar to a credit line in that the City reimburses its capital expenditures by drawing down proceeds. The City owes only what it has drawn to date including prior draws of $6,262,553 and interest is a variable rate which was 0.52% at June 30, 2016. This program has both governmental and business‐type activity components, with a total maximum limit of $25,300,000.
On July 24th, 2015, the City of Raleigh and the State of North Carolina completed the closing process for the City’s acquisition of 308 acres of the Dorothea Dix Campus. As such, the City issued $52,000,000 in a private placement installment financing. The loan is to be repaid at a fixed interest rate of 2.18%, with final maturity at July 1, 2025.
Annual maturities are as follows:
Fiscal Year
Ending June 30 Principal Interest
2017 17,592,798$ 9,066,321$
2018 17,543,568 8,578,656
2019 14,653,241 8,049,007
2020 14,608,511 7,574,837
2021 14,046,201 7,089,700
2022‐2026 68,496,735 27,978,815
2027‐2031 41,234,277 17,155,983
2032‐2036 37,200,091 7,816,440
2037‐2040 16,860,000 1,275,872 242,235,422$ 94,585,631$
Governmental Activities
The City has previously entered into installment financing agreements to finance various downtown parking facilities. These agreements bear interest at rates ranging from 4.20% to 5.25% with a variable rate component for one agreement, not to exceed 15%, which was 0.25% at June 30, 2016. There are also two variable rate agreements that each had an interest rate of 0.46% at June 30, 2016. Principal and interest requirements will be provided by appropriation in the year in which they become due.
45
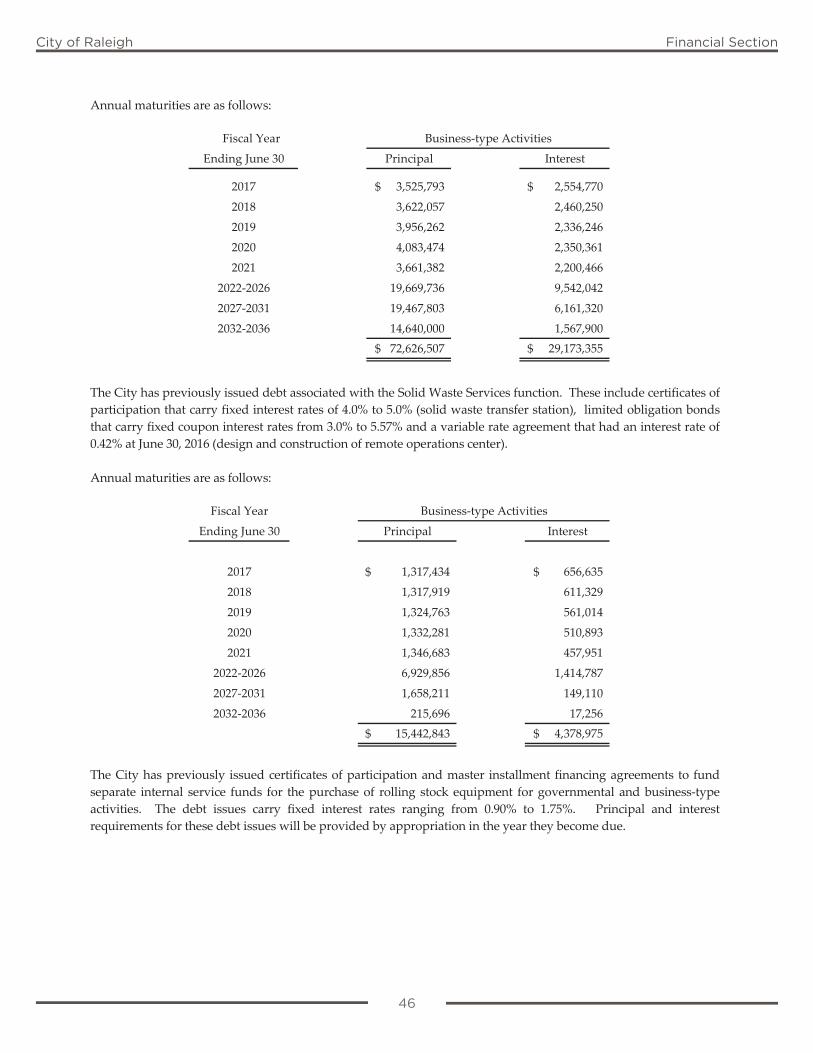
46
City of Raleigh Financial Section
Annual maturities are as follows:
Fiscal Year
Ending June 30 Principal Interest
2017 3,525,793$ 2,554,770$
2018 3,622,057 2,460,250
2019 3,956,262 2,336,246
2020 4,083,474 2,350,361
2021 3,661,382 2,200,466
2022‐2026 19,669,736 9,542,042
2027‐2031 19,467,803 6,161,320
2032‐2036 14,640,000 1,567,900 72,626,507$ 29,173,355$
Business‐type Activities
The City has previously issued debt associated with the Solid Waste Services function. These include certificates of participation that carry fixed interest rates of 4.0% to 5.0% (solid waste transfer station), limited obligation bonds that carry fixed coupon interest rates from 3.0% to 5.57% and a variable rate agreement that had an interest rate of 0.42% at June 30, 2016 (design and construction of remote operations center). Annual maturities are as follows:
Fiscal Year
Ending June 30 Principal Interest
2017 1,317,434$ 656,635$
2018 1,317,919 611,329
2019 1,324,763 561,014
2020 1,332,281 510,893
2021 1,346,683 457,951
2022‐2026 6,929,856 1,414,787
2027‐2031 1,658,211 149,110
2032‐2036 215,696 17,256 15,442,843$ 4,378,975$
Business‐type Activities
The City has previously issued certificates of participation and master installment financing agreements to fund separate internal service funds for the purchase of rolling stock equipment for governmental and business‐type activities. The debt issues carry fixed interest rates ranging from 0.90% to 1.75%. Principal and interest requirements for these debt issues will be provided by appropriation in the year they become due.
46

47
City of Raleigh Financial Section
Annual maturities are as follows:
Fiscal Year
Ending June 30 Principal Interest Principal Interest
2017 5,800,937$ 190,457$ 7,495,219$ 223,431$
2018 5,593,027 125,099 7,202,259 141,325
2019 3,083,119 72,774 3,360,180 79,313
2020 3,176,830 31,387 3,352,848 34,207
17,653,913$ 419,717$ 21,410,506$ 478,276$
Governmental Activities Business‐type Activities
State Revolving Loans. During the current fiscal year, the City’s Water and Sewer Utility enterprise received $8,096,049 in proceeds from state revolving fund loans. These loans carry fixed interest rates of 0.0% to 2.00% and are payable over 20 years. Final amounts for these loans will be determined when the associated projects close. Repayment will begin six months after respective project completion. The City has previously entered into state revolving loans to finance various water and sewer capital projects. These debt issues carry fixed interest rates of 2.00% to 2.95% (water/sewer system improvements), 2.66% (water improvements to Rolesville merged utilities), and 0.0% (spray irrigation). Principal and interest requirements for these debt issues will be provided by appropriation in the year they become due. The City’s participation in the state revolving fund loan program is summarized below:
BalanceDate Amount of Outstanding
Interest Date Series Original June 30,State Revolving Loans Rates Issued Matures Issue 2016Water and Sewer:Neuse River Nitrogen Removal 2.95% 7/31/1998 5/1/2018 7,972,965$ 796,101$ Crabtree Creek Interceptor Phase 3 2.60% 1/7/2000 5/1/2020 3,300,000 660,000 Rolesville Projects (F‐97‐0931) 2.66% 11/14/2005 5/1/2025 2,316,247 1,042,311 Rolesville Projects (F‐98‐0931) 2.66% 11/14/2005 5/1/2025 683,753 307,689 Spray Irrigation 0.00% 9/1/2010 5/1/2030 625,694 393,899 Crabtree Creek North Bank Interceptor 2.45% 7/5/2011 5/1/2033 11,094,556 8,254,331 Centennial Reuse Pipeline Segment 4 0.00% 5/1/2012 5/1/2033 5,125,312 2,225,791 NRWWTP 15MGD Expansion 2.00% 4/18/2013 5/1/2037 27,638,450 22,049,849 DE Benton Backwash Waste Facility 0.00% 5/18/2013 5/1/2034 7,075,847 6,608,823 Sodium Permanganate Facility 0.00% 3/26/2015 5/1/2036 3,678,800 1,662,151 Crabtree Creek Improvement Phase II 2.00% 7/13/2015 5/1/2037 37,500,000 9,460,652
Water and Sewer Total 53,461,597
Stormwater:Upper Longview Restoration 0.00% 1/16/2013 5/1/2035 2,034,751 1,831,276
Stormwater Total 1,831,276
Total Loan Amount 55,292,873$
47

48
City of Raleigh Financial Section
Annual maturities for Water and Sewer Utility are as follows:
Fiscal Year
Ending June 30 Principal Interest
2017 1,979,074$ 279,199$
2018 5,235,996 838,253
2019 4,837,945 741,172
2020 4,837,945 655,833
2021 4,672,945 570,495
2022‐2026 15,673,152 2,163,456
2027‐2031 11,449,039 982,876
2032‐2036 4,775,501 116,240 53,461,597$ 6,347,524$
Business‐type Activities
The City has previously entered into a state revolving loan program to fund lake and stream enhancements. The loan is to be repaid in annual payments over 20 years at 0% interest. Annual maturities for the Stormwater Utility are as follows:
Fiscal Year Business‐type Activities
Ending June 30 Principal
2017 101,738$
2018 101,738
2019 101,738
2020 101,738
2021 101,738
2022‐2026 508,690
2027‐2031 508,690
2032‐2036 305,206 1,831,276$
Earned Vacation Pay. At June 30, 2016, earned vacation pay consists of $19,521,435 for governmental activities and $4,683,796 for business‐type activities. Landfill Postclosure Care Costs. State and federal laws and regulations require the City to maintain a final cover over its Wilders Grove landfill site and to perform certain maintenance and monitoring functions at the site for thirty years after closure. The landfill was closed for waste disposal on December 31, 1997. During 2015‐16 the third party cost estimate was updated for both postclosure costs and the corrective action plan (CAP) costs associated with ground water violations at the landfill identified in 2007‐08. The $4,437,595 reported as landfill postclosure liability as of June 30, 2016 includes the CAP report cost estimate as well as the cost to perform the on‐going postclosure care. Actual costs may be higher due to inflation, changes in technology, or changes in regulations.
The City is required by state and federal laws and regulations to demonstrate financial assurance for postclosure care. The City is in compliance with these requirements, and, demonstrated such by completion of the local government financial assurance test submitted to DENR on November 24, 2015.
48
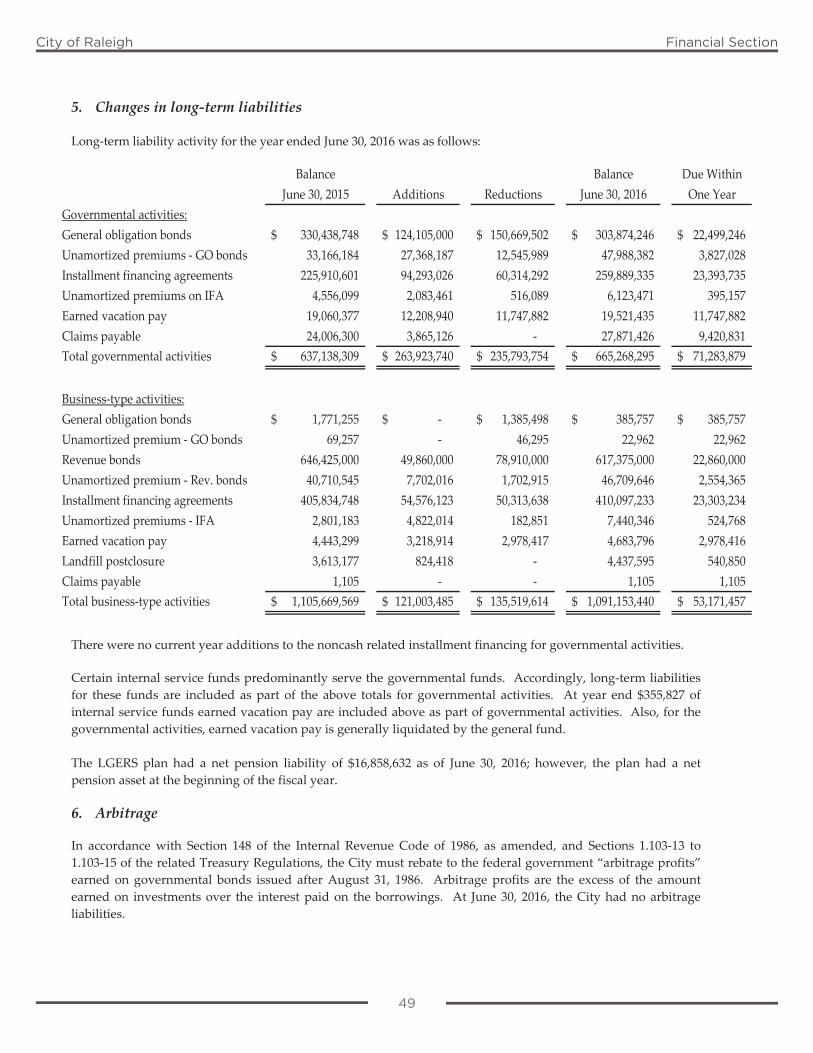
49
City of Raleigh Financial Section
5. Changes in long‐term liabilities Long‐term liability activity for the year ended June 30, 2016 was as follows:
Balance Balance Due WithinJune 30, 2015 Additions Reductions June 30, 2016 One Year
Governmental activities:General obligation bonds 330,438,748$ 124,105,000$ 150,669,502$ 303,874,246$ 22,499,246$ Unamortized premiums ‐ GO bonds 33,166,184 27,368,187 12,545,989 47,988,382 3,827,028 Installment financing agreements 225,910,601 94,293,026 60,314,292 259,889,335 23,393,735 Unamortized premiums on IFA 4,556,099 2,083,461 516,089 6,123,471 395,157 Earned vacation pay 19,060,377 12,208,940 11,747,882 19,521,435 11,747,882 Claims payable 24,006,300 3,865,126 ‐ 27,871,426 9,420,831 Total governmental activities 637,138,309$ 263,923,740$ 235,793,754$ 665,268,295$ 71,283,879$
Business‐type activities:General obligation bonds 1,771,255$ ‐$ 1,385,498$ 385,757$ 385,757$ Unamortized premium ‐ GO bonds 69,257 ‐ 46,295 22,962 22,962 Revenue bonds 646,425,000 49,860,000 78,910,000 617,375,000 22,860,000 Unamortized premium ‐ Rev. bonds 40,710,545 7,702,016 1,702,915 46,709,646 2,554,365 Installment financing agreements 405,834,748 54,576,123 50,313,638 410,097,233 23,303,234 Unamortized premiums ‐ IFA 2,801,183 4,822,014 182,851 7,440,346 524,768 Earned vacation pay 4,443,299 3,218,914 2,978,417 4,683,796 2,978,416 Landfill postclosure 3,613,177 824,418 ‐ 4,437,595 540,850 Claims payable 1,105 ‐ ‐ 1,105 1,105 Total business‐type activities 1,105,669,569$ 121,003,485$ 135,519,614$ 1,091,153,440$ 53,171,457$
There were no current year additions to the noncash related installment financing for governmental activities. Certain internal service funds predominantly serve the governmental funds. Accordingly, long‐term liabilities for these funds are included as part of the above totals for governmental activities. At year end $355,827 of internal service funds earned vacation pay are included above as part of governmental activities. Also, for the governmental activities, earned vacation pay is generally liquidated by the general fund. The LGERS plan had a net pension liability of $16,858,632 as of June 30, 2016; however, the plan had a net pension asset at the beginning of the fiscal year.
6. Arbitrage In accordance with Section 148 of the Internal Revenue Code of 1986, as amended, and Sections 1.103‐13 to 1.103‐15 of the related Treasury Regulations, the City must rebate to the federal government “arbitrage profits” earned on governmental bonds issued after August 31, 1986. Arbitrage profits are the excess of the amount earned on investments over the interest paid on the borrowings. At June 30, 2016, the City had no arbitrage liabilities.
49
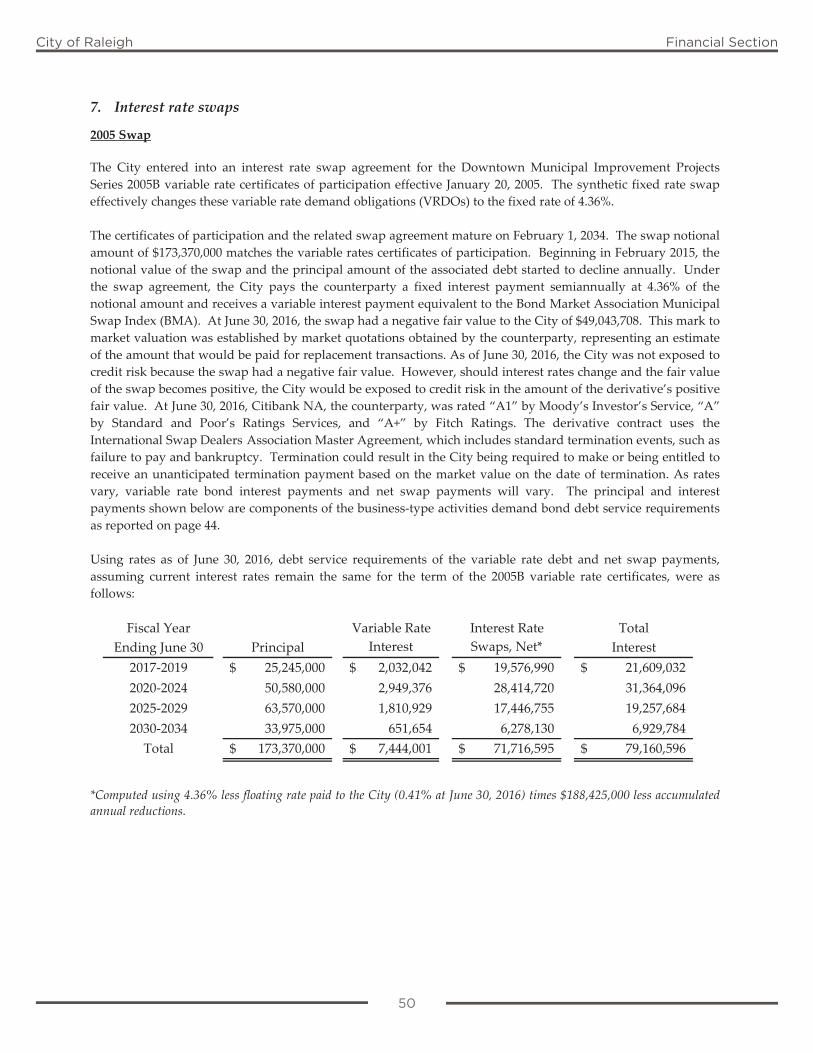
50
City of Raleigh Financial Section
7. Interest rate swaps 2005 Swap
The City entered into an interest rate swap agreement for the Downtown Municipal Improvement Projects Series 2005B variable rate certificates of participation effective January 20, 2005. The synthetic fixed rate swap effectively changes these variable rate demand obligations (VRDOs) to the fixed rate of 4.36%. The certificates of participation and the related swap agreement mature on February 1, 2034. The swap notional amount of $173,370,000 matches the variable rates certificates of participation. Beginning in February 2015, the notional value of the swap and the principal amount of the associated debt started to decline annually. Under the swap agreement, the City pays the counterparty a fixed interest payment semiannually at 4.36% of the notional amount and receives a variable interest payment equivalent to the Bond Market Association Municipal Swap Index (BMA). At June 30, 2016, the swap had a negative fair value to the City of $49,043,708. This mark to market valuation was established by market quotations obtained by the counterparty, representing an estimate of the amount that would be paid for replacement transactions. As of June 30, 2016, the City was not exposed to credit risk because the swap had a negative fair value. However, should interest rates change and the fair value of the swap becomes positive, the City would be exposed to credit risk in the amount of the derivative’s positive fair value. At June 30, 2016, Citibank NA, the counterparty, was rated “A1” by Moody’s Investor’s Service, “A” by Standard and Poor’s Ratings Services, and “A+” by Fitch Ratings. The derivative contract uses the International Swap Dealers Association Master Agreement, which includes standard termination events, such as failure to pay and bankruptcy. Termination could result in the City being required to make or being entitled to receive an unanticipated termination payment based on the market value on the date of termination. As rates vary, variable rate bond interest payments and net swap payments will vary. The principal and interest payments shown below are components of the business‐type activities demand bond debt service requirements as reported on page 44. Using rates as of June 30, 2016, debt service requirements of the variable rate debt and net swap payments, assuming current interest rates remain the same for the term of the 2005B variable rate certificates, were as follows:
Fiscal Year Variable Rate Interest Rate Total
Ending June 30 Principal Interest Swaps, Net* Interest2017‐2019 25,245,000$ 2,032,042$ 19,576,990$ 21,609,032$ 2020‐2024 50,580,000 2,949,376 28,414,720 31,364,096 2025‐2029 63,570,000 1,810,929 17,446,755 19,257,684 2030‐2034 33,975,000 651,654 6,278,130 6,929,784 Total 173,370,000$ 7,444,001$ 71,716,595$ 79,160,596$
*Computed using 4.36% less floating rate paid to the City (0.41% at June 30, 2016) times $188,425,000 less accumulated annual reductions.
50
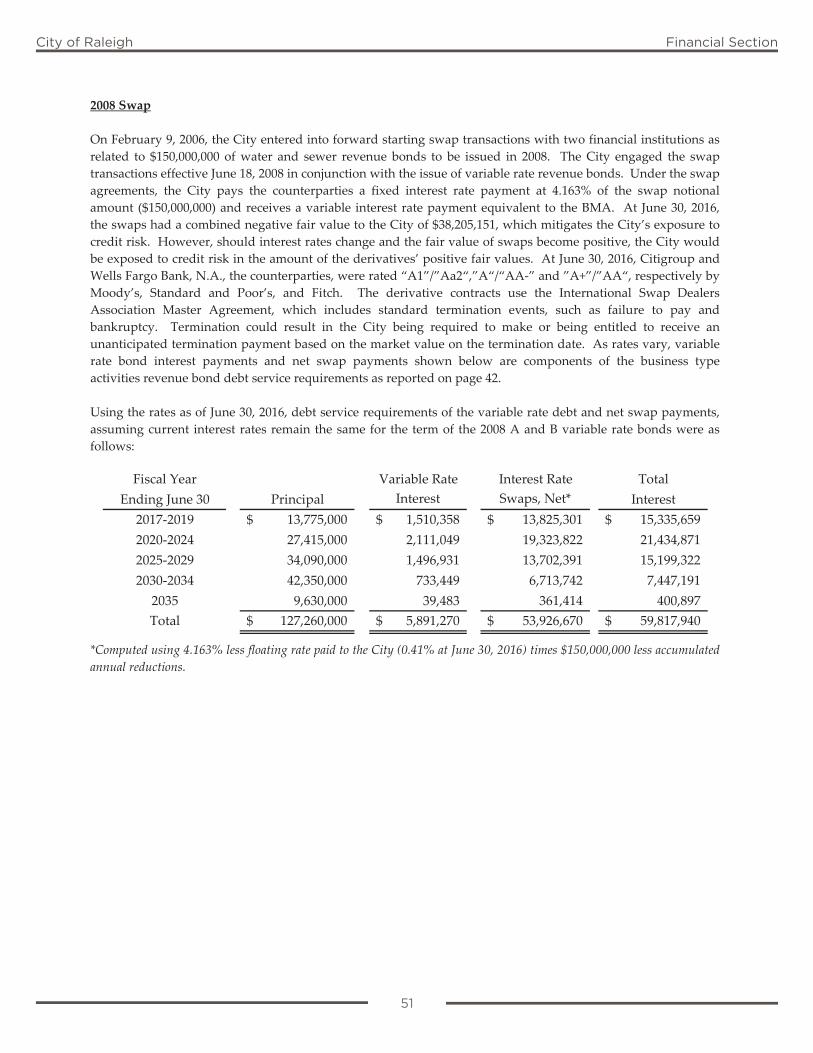
51
City of Raleigh Financial Section
2008 Swap On February 9, 2006, the City entered into forward starting swap transactions with two financial institutions as related to $150,000,000 of water and sewer revenue bonds to be issued in 2008. The City engaged the swap transactions effective June 18, 2008 in conjunction with the issue of variable rate revenue bonds. Under the swap agreements, the City pays the counterparties a fixed interest rate payment at 4.163% of the swap notional amount ($150,000,000) and receives a variable interest rate payment equivalent to the BMA. At June 30, 2016, the swaps had a combined negative fair value to the City of $38,205,151, which mitigates the City’s exposure to credit risk. However, should interest rates change and the fair value of swaps become positive, the City would be exposed to credit risk in the amount of the derivatives’ positive fair values. At June 30, 2016, Citigroup and Wells Fargo Bank, N.A., the counterparties, were rated “A1”/”Aa2“,”A“/“AA‐” and ”A+”/”AA“, respectively by Moody’s, Standard and Poor’s, and Fitch. The derivative contracts use the International Swap Dealers Association Master Agreement, which includes standard termination events, such as failure to pay and bankruptcy. Termination could result in the City being required to make or being entitled to receive an unanticipated termination payment based on the market value on the termination date. As rates vary, variable rate bond interest payments and net swap payments shown below are components of the business type activities revenue bond debt service requirements as reported on page 42.
Using the rates as of June 30, 2016, debt service requirements of the variable rate debt and net swap payments, assuming current interest rates remain the same for the term of the 2008 A and B variable rate bonds were as follows:
Fiscal Year Variable Rate Interest Rate TotalEnding June 30 Principal Interest Swaps, Net* Interest
2017‐2019 13,775,000$ 1,510,358$ 13,825,301$ 15,335,659$ 2020‐2024 27,415,000 2,111,049 19,323,822 21,434,871 2025‐2029 34,090,000 1,496,931 13,702,391 15,199,322 2030‐2034 42,350,000 733,449 6,713,742 7,447,191
2035 9,630,000 39,483 361,414 400,897 Total 127,260,000$ 5,891,270$ 53,926,670$ 59,817,940$
*Computed using 4.163% less floating rate paid to the City (0.41% at June 30, 2016) times $150,000,000 less accumulated annual reductions.
51
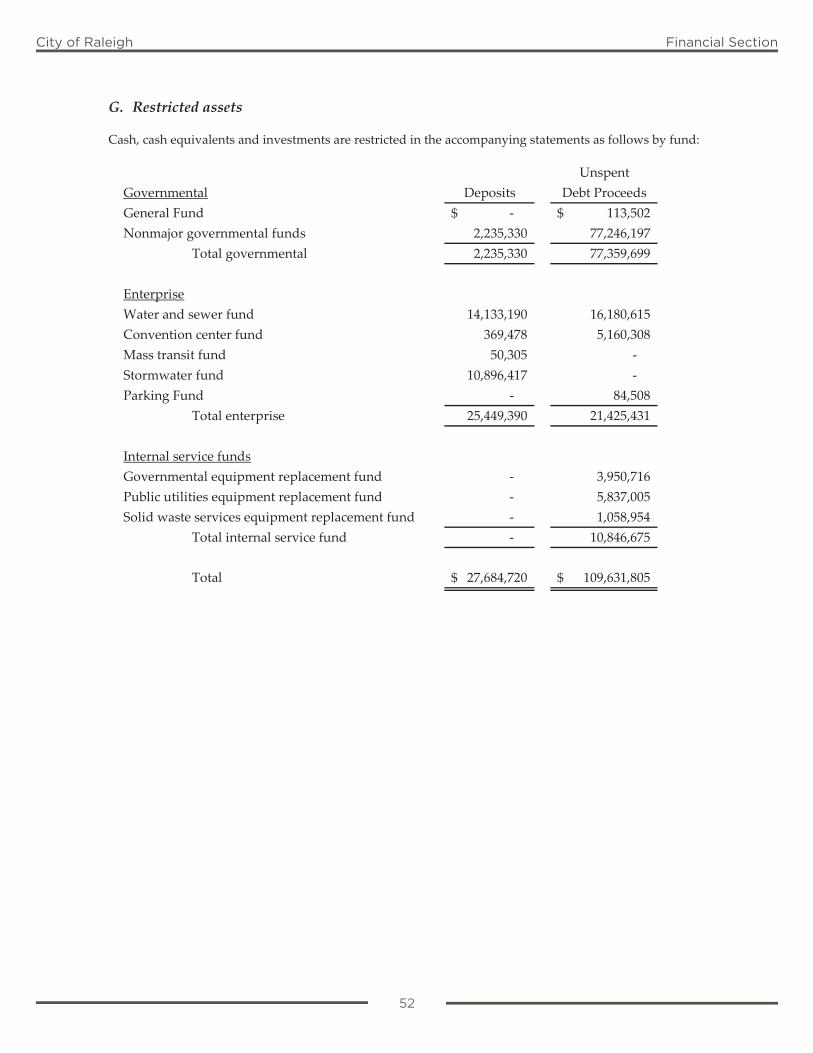
52
City of Raleigh Financial Section
G. Restricted assets Cash, cash equivalents and investments are restricted in the accompanying statements as follows by fund:
UnspentGovernmental Deposits Debt ProceedsGeneral Fund ‐$ 113,502$ Nonmajor governmental funds 2,235,330 77,246,197 Total governmental 2,235,330 77,359,699
EnterpriseWater and sewer fund 14,133,190 16,180,615 Convention center fund 369,478 5,160,308 Mass transit fund 50,305 ‐ Stormwater fund 10,896,417 ‐ Parking Fund ‐ 84,508
Total enterprise 25,449,390 21,425,431
Internal service fundsGovernmental equipment replacement fund ‐ 3,950,716 Public utilities equipment replacement fund ‐ 5,837,005 Solid waste services equipment replacement fund ‐ 1,058,954 Total internal service fund ‐ 10,846,675
Total 27,684,720$ 109,631,805$
52
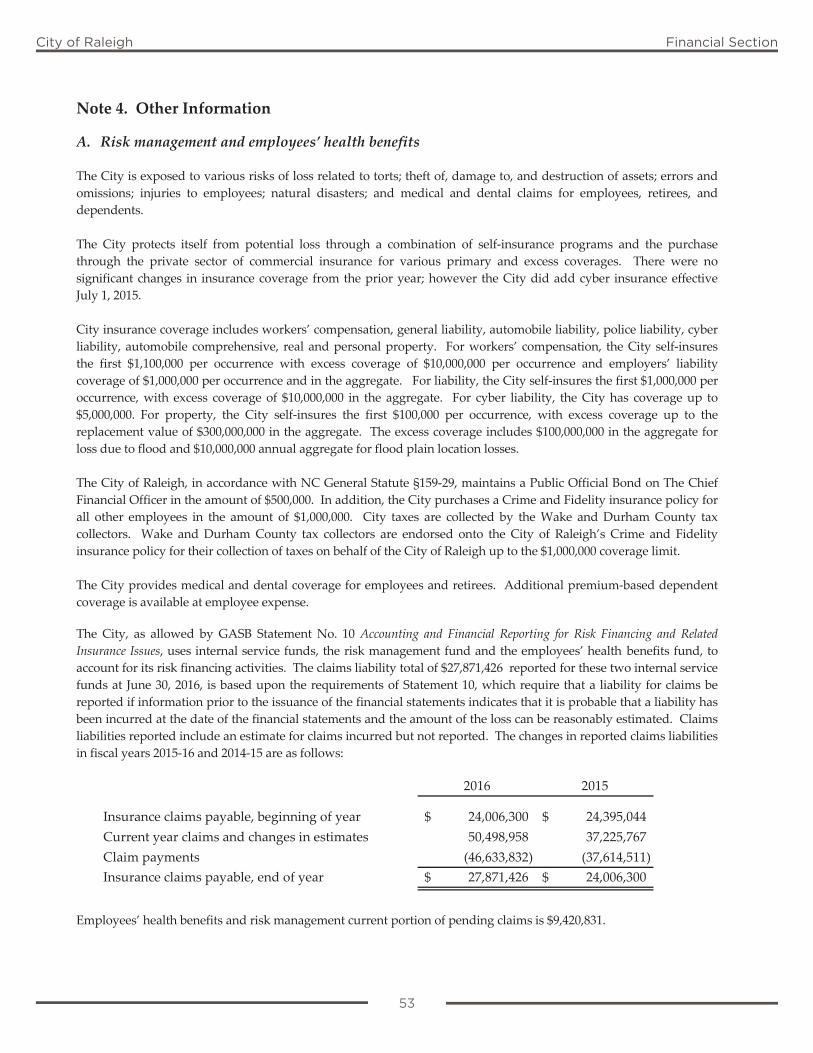
53
City of Raleigh Financial Section
Note 4. Other Information
A. Risk management and employees’ health benefits The City is exposed to various risks of loss related to torts; theft of, damage to, and destruction of assets; errors and omissions; injuries to employees; natural disasters; and medical and dental claims for employees, retirees, and dependents. The City protects itself from potential loss through a combination of self‐insurance programs and the purchase through the private sector of commercial insurance for various primary and excess coverages. There were no significant changes in insurance coverage from the prior year; however the City did add cyber insurance effective July 1, 2015. City insurance coverage includes workers’ compensation, general liability, automobile liability, police liability, cyber liability, automobile comprehensive, real and personal property. For workers’ compensation, the City self‐insures the first $1,100,000 per occurrence with excess coverage of $10,000,000 per occurrence and employers’ liability coverage of $1,000,000 per occurrence and in the aggregate. For liability, the City self‐insures the first $1,000,000 per occurrence, with excess coverage of $10,000,000 in the aggregate. For cyber liability, the City has coverage up to $5,000,000. For property, the City self‐insures the first $100,000 per occurrence, with excess coverage up to the replacement value of $300,000,000 in the aggregate. The excess coverage includes $100,000,000 in the aggregate for loss due to flood and $10,000,000 annual aggregate for flood plain location losses. The City of Raleigh, in accordance with NC General Statute §159‐29, maintains a Public Official Bond on The Chief Financial Officer in the amount of $500,000. In addition, the City purchases a Crime and Fidelity insurance policy for all other employees in the amount of $1,000,000. City taxes are collected by the Wake and Durham County tax collectors. Wake and Durham County tax collectors are endorsed onto the City of Raleigh’s Crime and Fidelity insurance policy for their collection of taxes on behalf of the City of Raleigh up to the $1,000,000 coverage limit. The City provides medical and dental coverage for employees and retirees. Additional premium‐based dependent coverage is available at employee expense.
The City, as allowed by GASB Statement No. 10 Accounting and Financial Reporting for Risk Financing and Related Insurance Issues, uses internal service funds, the risk management fund and the employees’ health benefits fund, to account for its risk financing activities. The claims liability total of $27,871,426 reported for these two internal service funds at June 30, 2016, is based upon the requirements of Statement 10, which require that a liability for claims be reported if information prior to the issuance of the financial statements indicates that it is probable that a liability has been incurred at the date of the financial statements and the amount of the loss can be reasonably estimated. Claims liabilities reported include an estimate for claims incurred but not reported. The changes in reported claims liabilities in fiscal years 2015‐16 and 2014‐15 are as follows:
2016 2015
Insurance claims payable, beginning of year 24,006,300$ 24,395,044$ Current year claims and changes in estimates 50,498,958 37,225,767 Claim payments (46,633,832) (37,614,511) Insurance claims payable, end of year 27,871,426$ 24,006,300$
Employees’ health benefits and risk management current portion of pending claims is $9,420,831.
53
54
City of Raleigh Financial Section
B. Commitments and contingent liabilities
Commitment ‐ Enterprise Funds. In February 1972, the City entered into a raw water storage contract and joint use construction costs with the U. S. Corps of Engineers for raw water usage of up to 100 million gallons per day from Falls Lake. The City’s estimated share of construction cost for the project was estimated at $12,170,000 payable annually over 50 years beginning in 1984. The contract requires that the City pay certain capital and operating costs of the lake which are dependent upon future costs of operation. The City’s fiscal year 2015‐16 obligation was $848,305. It is estimated, at this time, that the future cost to the City will not exceed $850,000 annually and will be repaid in 2033 with a final payment of $3,726,122. Contingent Liabilities. Amounts received or receivable from grant agencies are subject to audit and adjustment by grantor agencies, principally by the federal government. Any disallowed claims, including amounts already collected, may constitute a liability of the applicable funds. The amount, if any, of expenditures that may be disallowed by the grantor cannot be determined at this time, although the City expects such amounts, if any, to be immaterial. The City is a defendant in various lawsuits. Although the outcome of these lawsuits is not presently determinable, in the opinion of the City’s counsel the resolution of these matters will not have a material adverse effect on the financial condition of the City. Contingent Liabilities – Facility Fees. The City enters into Thoroughfare Facility Fee Reimbursement contracts that provide developers with contract awards based on the calculated value of the capital contributions to the City. Each contract states minimum amounts that must be paid and recorded as long‐term liabilities in the City’s entity‐wide financial statements. The remaining liability amounts for each contract are paid based on a formula and are contingent on available funds in the facility fee reimbursement account. The total value of the contracts at June 30, 2016 was $13,611,552. Of this amount, $7,056,868 was recorded as a liability, and the remaining $6,554,684 represents a contingent liability. C. Jointly governed organizations Raleigh‐Durham Airport Authority. The Raleigh‐Durham Airport Authority plans and conducts operations of the Raleigh‐Durham International Airport. This eight‐member governing body is jointly appointed by the City of Durham, City of Raleigh, County of Durham and County of Wake, with each member government appointing two members. The authority selects the management and sets the budget and financing requirements of the airport. Each member government contributes $12,500 annually for administration of the authority. Neither the City nor the other member governments exercise management control or are responsible for budget and financing requirements for the authority. A special airport tax district of Durham and Wake Counties was created to aid in the financing of major airport facilities and is governed by two members each from the respective county boards of commissioners. Because of its limited role in the Raleigh‐Durham Airport Authority and the related special tax district, the City does not consider its participation to be a joint venture and, accordingly, further disclosure of the airport entity is not included. The authority does not meet the criteria to be included in the City’s financial reporting entity. Triangle J Council of Governments. The City, in conjunction with three counties and 22 other municipalities are members of the Triangle J Council of Governments. The participating governments established the council to coordinate various regional interests and intergovernmental funding. Each participating government appoints one delegate to the councilʹs governing board. The City paid dues of $122,585 to the council during the fiscal year ended June 30, 2016. The council does not meet the criteria to be included in the City’s financial reporting entity.
54
55
City of Raleigh Financial Section
Related organizations The Raleigh Housing Authority. The Raleigh Housing Authority assists in providing housing for low income, elderly and disabled residents of the City. The mayor appoints all members of the authorityʹs governing body, but the authority is not otherwise financially accountable to the City. The City has no responsibility in selecting the management of the authority. The primary revenue sources for the authority are federal grants and program revenues. Financial transactions between the City and the authority reflect contractual agreements between the parties for the provision of specific services by the authority for the City. The City is not responsible for financing any deficits of the authority nor is it entitled to any surplus. In addition, the City does not guarantee any debt of the authority and such debt is not included in determining the Cityʹs statutory debt limit. The Raleigh Historic Districts Commission, Inc. The Raleigh Historic Districts Commission, Inc. was formed in 1993 to exercise jurisdiction for all historic properties and historic overlay districts within Raleighʹs city limits and extraterritorial jurisdiction. The commission consists of 12 members appointed by the city council. The City’s accountability for the commission does not extend beyond making appointments to the commission. Revenues to support the commission come from private contributions and grants from local and state governments. In the fiscal year ended June 30, 2016 the City appropriated $60,774 to the commission. The not‐for‐profit organization does not meet the criteria to be included in the City’s financial reporting entity. The Raleigh Parking Deck Associates, Inc. A for‐profit corporation established to finance and construct a parking deck is reflected in substance through a capital lease with the City. The corporation does not meet the criteria to be included in the City’s financial reporting entity. Interlocal agreement with Wake County Pursuant to enabling legislation in 1991, the City of Raleigh and Wake County entered into an interlocal agreement to provide for the funding of various projects and facilities from the proceeds to be realized from the levy of a county‐wide room occupancy tax and a prepared food and beverage tax. The proceeds and distributions of the taxes are accounted for in a special revenue fund maintained by the County. The City, by terms of the enabling legislation, is granted specific allocations of the taxes, but has entered into the interlocal agreement requiring joint action of the City and County governing bodies to expend both the City and County allocations. At June 30, 2016 the balance of the trust maintained by the County was $2,404,889, which is not available to the City except for current and future projects jointly determined by the City and the County. During fiscal year 2015‐16, the City received funding as follows: an annual $1,000,000 that the City Council previously dedicated for continuing support of the performing arts and convention center complex; an annual $680,000 to fund visitor‐related programs and activities and $25,517,817 to support the financing of the convention center facility. The City will continue to receive $1,000,000 allocations that the City Council may use for any eligible purpose in the original state legislation. In addition, the City will annually receive 85% of all uncommitted interlocal tax funds for debt service and other costs related to the convention center facility. A tri‐party agreement exists between the City of Raleigh, Wake County and the Centennial Authority, a public body created by the State of North Carolina to construct and govern operations of a multi‐purpose regional sports and entertainment complex, which opened in October, 1999. Through the interlocal and tri‐party agreements, part of the funding for this construction has been provided by the trust. Future receipts from the taxes are committed by the authority for operating support and repayment of the authority’s debt.
55
56
City of Raleigh Financial Section
Joint venture The Greater Raleigh Convention and Visitors Bureau. The Greater Raleigh Convention and Visitors Bureau promotes and solicits business, conventions, meeting and tourism in Wake County. The bureau receives its primary revenue from a county‐wide 6% occupancy tax and is a joint venture of the City of Raleigh and Wake County. The governing body of the bureau is a board of directors appointed by the Raleigh City Council and the Wake County Commissioners. The County is required to distribute monthly a percentage of the tax collected with a minimum aggregate annual distribution of $1,000,000. If tax revenues are not sufficient to fully fund the bureauʹs minimum annual distributions, the City and County must fund the deficiency equally to ensure that the bureau receives its minimum distribution of $1,000,000 in any fiscal year. There was no additional funding required of the City or County in the year ended June 30, 2016. All unexpended funds of the bureau revert to the County and City at the end of the fiscal year. Except for an investment in capital assets previously recorded by the City, the only equity in the fund at year‐end is for encumbrances which will be expensed in the subsequent year. Based on this, no additional equity interest in the bureau is recorded at June 30, 2016. Full financial statements for the bureau can be obtained at the Greater Raleigh Convention and Visitors Bureau, Post Office Box 1879, Raleigh, North Carolina 27602. The bureau does not meet the criteria to be included in the City’s financial reporting entity.
D. Employee retirement systems and pension plans North Carolina Local Government Employeesʹ Retirement System Plan Description. The City of Raleigh is a participating employer in the statewide Local Government Employeesʹ Retirement System (LGERS); a cost‐sharing multiple‐employer defined benefit pension plan administered by the State of North Carolina. LGERS membership is comprised of general employees and local law enforcement officers (LEOs) of participating local governmental entities. Article 3 of G.S. Chapter 128 assigns the authority to establish and amend benefit provisions to the North Carolina General Assembly. Management of the plan is vested in the LGERS Board of Trustees, which consists of 13 members – nine appointed by the Governor, one appointed by the State Senate, one appointed by the State House of Representatives, and the State Treasurer and State Superintendent, who serve as ex‐officio members. The Local Government Employees’ Retirement System is included in the Comprehensive Annual Financial Report (CAFR) for the State of North Carolina. The State’s CAFR includes financial statements and required supplementary information for LGERS. That report may be obtained by writing to the Office of the State Controller, 1410 Mail Services Center, Raleigh, North Carolina 27699‐1410, or by calling (919) 981‐5454 or at www.osc.nc.gov. Benefits Provided. LGERS provides retirement and survivor benefits. Retirement benefits are determined as 1.85% of the member’s average final compensation times the member’s years of creditable service. A member’s average final compensation is calculated as the average of a member’s four highest consecutive years of compensation. Plan members are eligible to retire with full retirement benefits at age 65 with five years of creditable service, at age 60 with 25 years of creditable service, or at any age with 30 years of creditable service. Plan members are eligible to retire with partial retirement benefits at age 50 with 20 years of creditable service or at age 60 with five years of creditable service (age 55 for firefighters). Survivor benefits are available to eligible beneficiaries of members who die while in active service or within 180 days of their last day of service and who have either completed 20 years of creditable service regardless of age (15 years of creditable service for firefighters and rescue squad members who are killed in the line of duty) or have completed five years of service and have reached age 60. Eligible beneficiaries may elect to receive a monthly Survivor’s Alternate Benefit for life or a return of the member’s contributions. The plan does not provide for automatic post‐retirement benefit increases. Increases are contingent upon actuarial gains of the plan. LGERS plan members who are LEOs are eligible to retire with full retirement benefits at age 55 with five years of creditable service as an officer, or at any age with 30 years of creditable service. LEO plan members are eligible to retire with partial retirement benefits at age 50 with 15 years of creditable service as an officer. Survivor benefits
56
57
City of Raleigh Financial Section
are available to eligible beneficiaries of LEO members who die while in active service or within 180 days of their last day of service and who also have either completed 20 years of creditable service regardless of age, or have completed 15 years of service as a LEO and have reached age 50, or have completed five years of creditable service as a LEO and have reached age 55, or have completed 15 years of creditable service as a LEO if killed in the line of duty. Eligible beneficiaries may elect to receive a monthly Survivor’s Alternate Benefit for life or a return of the member’s contributions. Contributions. Contribution provisions are established by General Statute 128‐30 and may be amended only by the North Carolina General Assembly. City of Raleigh employees are required to contribute 6% of their compensation. Employer contributions are actuarially determined and set annually by the LGERS Board of Trustees. The City of Raleigh’s contractually required contribution rate for the year ended June 30, 2016, was 7.15% of compensation for law enforcement officers and 6.67% for general employees and firefighters, actuarially determined as an amount that, when combined with employee contributions, is expected to finance the costs of benefits earned by employees during the year. Contributions to the pension plan from the City of Raleigh were $14,237,418 for the year ended June 30, 2016. Refunds of Contributions. City employees who have terminated service as a contributing member of LGERS, may file an application for a refund of their contributions. By state law, refunds to members with at least five years of service include 4% interest. State law requires a 60 day waiting period after service termination before the refund may be paid. The acceptance of a refund payment cancels the individual’s right to employer contributions or any other benefit provided by LGERS. Pension Liabilities, Pension Expense, and Deferred Outflows of Resources and Deferred Inflows of Resources Related to Pensions. At June 30, 2016, the City reported a liability of $16,858,632 for its proportionate share of the net pension liability. The net pension liability was measured as of June 30, 2015. The total pension liability used to calculate the net pension liability was determined by an actuarial valuation as of December 31, 2014. The total pension liability was then rolled forward to the measurement date of June 30, 2015 utilizing update procedures incorporating the actuarial assumptions. The City’s proportion of the net pension liability was based on a projection of the City’s long‐term share of future payroll covered by the pension plan, relative to the projected future payroll covered by the pension plan of all participating LGERS employers, actuarially determined. At June 30, 2015, the City’s proportion was 3.76%, which was an increase of 0.05% from its proportion measured as of June 30, 2014. For the year ended June 30, 2016, the City recognized pension expense of $7,406,406. At June 30, 2016, the City reported deferred outflows of resources and deferred inflows of resources related to pensions from the following sources:
Deferred Outflows of Resources
Deferred Inflows of Resources
Differences between expected and actual experience -$ 3,962,728$
- 4,799,587
- 945,015City contributions subsequent to the measurement date 14,237,417 - Total 14,237,417$ 9,707,330$
Net difference between projected and actual earnings on pension plan investmentsChanges in proportion and differences between City contributions and proportionate share of contributions
57
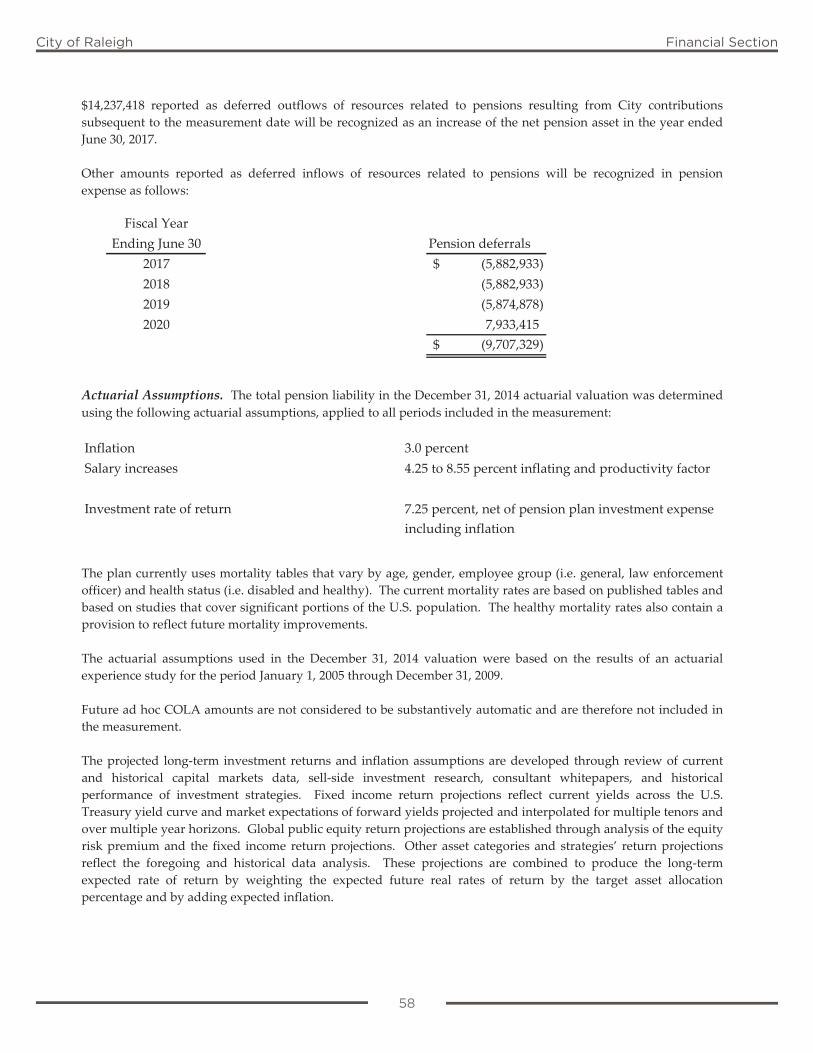
58
City of Raleigh Financial Section
$14,237,418 reported as deferred outflows of resources related to pensions resulting from City contributions subsequent to the measurement date will be recognized as an increase of the net pension asset in the year ended June 30, 2017. Other amounts reported as deferred inflows of resources related to pensions will be recognized in pension expense as follows:
Fiscal YearEnding June 30 Pension deferrals
2017 (5,882,933)$ 2018 (5,882,933) 2019 (5,874,878) 2020 7,933,415
(9,707,329)$
Actuarial Assumptions. The total pension liability in the December 31, 2014 actuarial valuation was determined using the following actuarial assumptions, applied to all periods included in the measurement: Inflation 3.0 percentSalary increases
Investment rate of return
4.25 to 8.55 percent inflating and productivity factor
7.25 percent, net of pension plan investment expense including inflation
The plan currently uses mortality tables that vary by age, gender, employee group (i.e. general, law enforcement officer) and health status (i.e. disabled and healthy). The current mortality rates are based on published tables and based on studies that cover significant portions of the U.S. population. The healthy mortality rates also contain a provision to reflect future mortality improvements. The actuarial assumptions used in the December 31, 2014 valuation were based on the results of an actuarial experience study for the period January 1, 2005 through December 31, 2009. Future ad hoc COLA amounts are not considered to be substantively automatic and are therefore not included in the measurement. The projected long‐term investment returns and inflation assumptions are developed through review of current and historical capital markets data, sell‐side investment research, consultant whitepapers, and historical performance of investment strategies. Fixed income return projections reflect current yields across the U.S. Treasury yield curve and market expectations of forward yields projected and interpolated for multiple tenors and over multiple year horizons. Global public equity return projections are established through analysis of the equity risk premium and the fixed income return projections. Other asset categories and strategies’ return projections reflect the foregoing and historical data analysis. These projections are combined to produce the long‐term expected rate of return by weighting the expected future real rates of return by the target asset allocation percentage and by adding expected inflation.
58
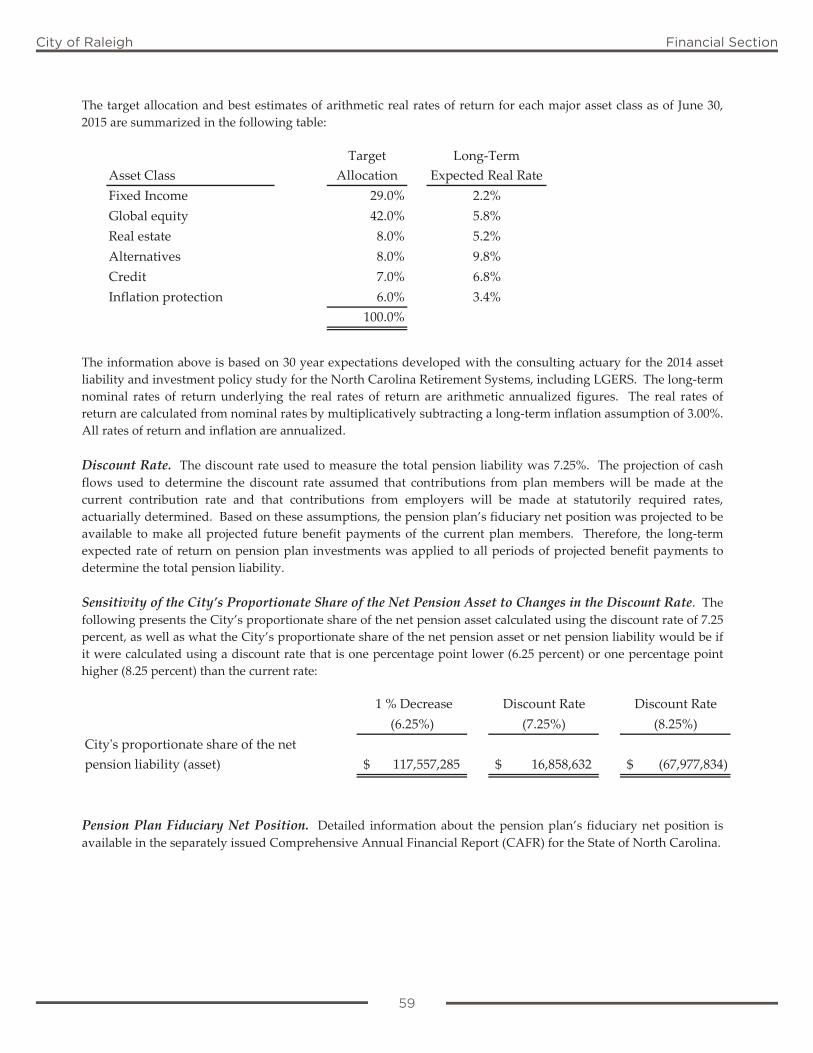
59
City of Raleigh Financial Section
The target allocation and best estimates of arithmetic real rates of return for each major asset class as of June 30, 2015 are summarized in the following table:
Asset ClassFixed Income 29.0% 2.2%Global equity 42.0% 5.8%Real estate 8.0% 5.2%Alternatives 8.0% 9.8%Credit 7.0% 6.8%Inflation protection 6.0% 3.4%
100.0%
Target Allocation
Long‐Term Expected Real Rate
The information above is based on 30 year expectations developed with the consulting actuary for the 2014 asset liability and investment policy study for the North Carolina Retirement Systems, including LGERS. The long‐term nominal rates of return underlying the real rates of return are arithmetic annualized figures. The real rates of return are calculated from nominal rates by multiplicatively subtracting a long‐term inflation assumption of 3.00%. All rates of return and inflation are annualized. Discount Rate. The discount rate used to measure the total pension liability was 7.25%. The projection of cash flows used to determine the discount rate assumed that contributions from plan members will be made at the current contribution rate and that contributions from employers will be made at statutorily required rates, actuarially determined. Based on these assumptions, the pension plan’s fiduciary net position was projected to be available to make all projected future benefit payments of the current plan members. Therefore, the long‐term expected rate of return on pension plan investments was applied to all periods of projected benefit payments to determine the total pension liability. Sensitivity of the City’s Proportionate Share of the Net Pension Asset to Changes in the Discount Rate. The following presents the City’s proportionate share of the net pension asset calculated using the discount rate of 7.25 percent, as well as what the City’s proportionate share of the net pension asset or net pension liability would be if it were calculated using a discount rate that is one percentage point lower (6.25 percent) or one percentage point higher (8.25 percent) than the current rate:
1 % Decrease Discount Rate Discount Rate(6.25%) (7.25%) (8.25%)
Cityʹs proportionate share of the net pension liability (asset) 117,557,285$ 16,858,632$ (67,977,834)$
Pension Plan Fiduciary Net Position. Detailed information about the pension plan’s fiduciary net position is available in the separately issued Comprehensive Annual Financial Report (CAFR) for the State of North Carolina.
59
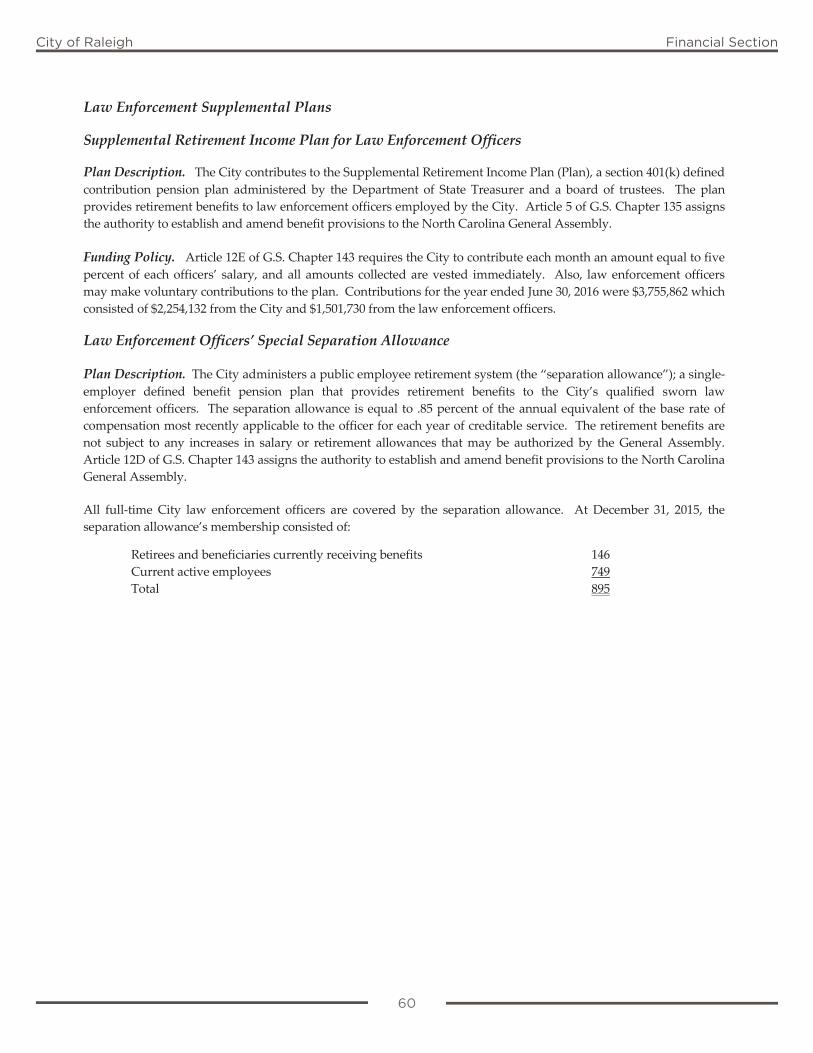
60
City of Raleigh Financial Section
Law Enforcement Supplemental Plans Supplemental Retirement Income Plan for Law Enforcement Officers Plan Description. The City contributes to the Supplemental Retirement Income Plan (Plan), a section 401(k) defined contribution pension plan administered by the Department of State Treasurer and a board of trustees. The plan provides retirement benefits to law enforcement officers employed by the City. Article 5 of G.S. Chapter 135 assigns the authority to establish and amend benefit provisions to the North Carolina General Assembly. Funding Policy. Article 12E of G.S. Chapter 143 requires the City to contribute each month an amount equal to five percent of each officers’ salary, and all amounts collected are vested immediately. Also, law enforcement officers may make voluntary contributions to the plan. Contributions for the year ended June 30, 2016 were $3,755,862 which consisted of $2,254,132 from the City and $1,501,730 from the law enforcement officers. Law Enforcement Officers’ Special Separation Allowance Plan Description. The City administers a public employee retirement system (the “separation allowance”); a single‐employer defined benefit pension plan that provides retirement benefits to the City’s qualified sworn law enforcement officers. The separation allowance is equal to .85 percent of the annual equivalent of the base rate of compensation most recently applicable to the officer for each year of creditable service. The retirement benefits are not subject to any increases in salary or retirement allowances that may be authorized by the General Assembly. Article 12D of G.S. Chapter 143 assigns the authority to establish and amend benefit provisions to the North Carolina General Assembly. All full‐time City law enforcement officers are covered by the separation allowance. At December 31, 2015, the separation allowance’s membership consisted of:
Retirees and beneficiaries currently receiving benefits 146 Current active employees 749 Total 895
60
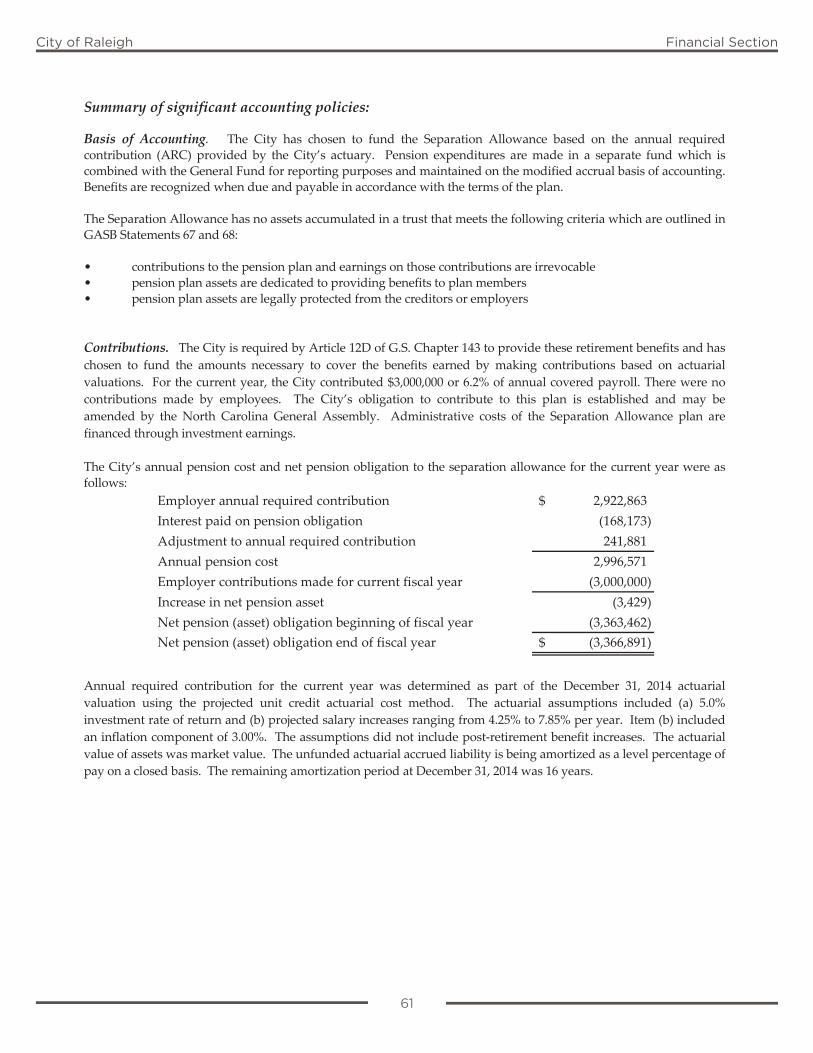
61
City of Raleigh Financial Section
Summary of significant accounting policies: Basis of Accounting. The City has chosen to fund the Separation Allowance based on the annual required contribution (ARC) provided by the City’s actuary. Pension expenditures are made in a separate fund which is combined with the General Fund for reporting purposes and maintained on the modified accrual basis of accounting. Benefits are recognized when due and payable in accordance with the terms of the plan. The Separation Allowance has no assets accumulated in a trust that meets the following criteria which are outlined in GASB Statements 67 and 68: • contributions to the pension plan and earnings on those contributions are irrevocable • pension plan assets are dedicated to providing benefits to plan members • pension plan assets are legally protected from the creditors or employers
Contributions. The City is required by Article 12D of G.S. Chapter 143 to provide these retirement benefits and has chosen to fund the amounts necessary to cover the benefits earned by making contributions based on actuarial valuations. For the current year, the City contributed $3,000,000 or 6.2% of annual covered payroll. There were no contributions made by employees. The City’s obligation to contribute to this plan is established and may be amended by the North Carolina General Assembly. Administrative costs of the Separation Allowance plan are financed through investment earnings. The City’s annual pension cost and net pension obligation to the separation allowance for the current year were as follows:
Employer annual required contribution 2,922,863$ Interest paid on pension obligation (168,173) Adjustment to annual required contribution 241,881 Annual pension cost 2,996,571 Employer contributions made for current fiscal year (3,000,000) Increase in net pension asset (3,429) Net pension (asset) obligation beginning of fiscal year (3,363,462) Net pension (asset) obligation end of fiscal year (3,366,891)$
Annual required contribution for the current year was determined as part of the December 31, 2014 actuarial valuation using the projected unit credit actuarial cost method. The actuarial assumptions included (a) 5.0% investment rate of return and (b) projected salary increases ranging from 4.25% to 7.85% per year. Item (b) included an inflation component of 3.00%. The assumptions did not include post‐retirement benefit increases. The actuarial value of assets was market value. The unfunded actuarial accrued liability is being amortized as a level percentage of pay on a closed basis. The remaining amortization period at December 31, 2014 was 16 years.
61
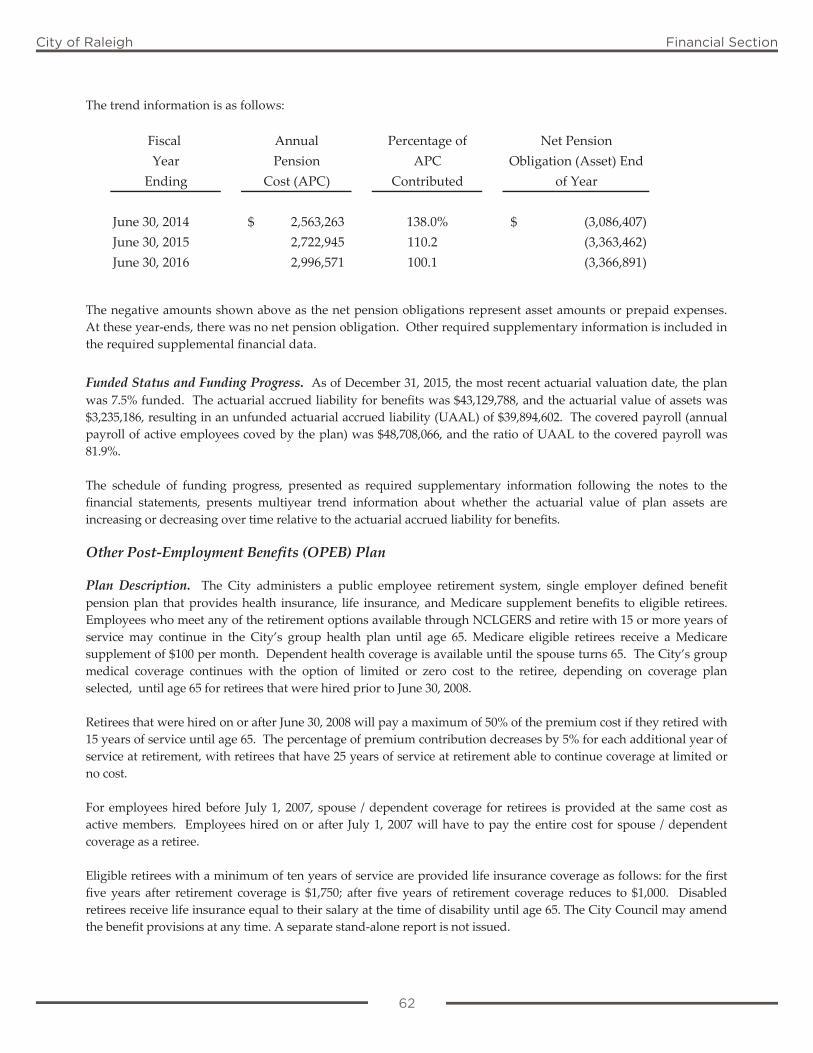
62
City of Raleigh Financial Section
The trend information is as follows:
Fiscal Annual Percentage of Net PensionYear Pension APC Obligation (Asset) End
Ending Cost (APC) Contributed of Year
June 30, 2014 2,563,263$ 138.0% (3,086,407)$ June 30, 2015 2,722,945 110.2 (3,363,462) June 30, 2016 2,996,571 100.1 (3,366,891)
The negative amounts shown above as the net pension obligations represent asset amounts or prepaid expenses. At these year‐ends, there was no net pension obligation. Other required supplementary information is included in the required supplemental financial data. Funded Status and Funding Progress. As of December 31, 2015, the most recent actuarial valuation date, the plan was 7.5% funded. The actuarial accrued liability for benefits was $43,129,788, and the actuarial value of assets was $3,235,186, resulting in an unfunded actuarial accrued liability (UAAL) of $39,894,602. The covered payroll (annual payroll of active employees coved by the plan) was $48,708,066, and the ratio of UAAL to the covered payroll was 81.9%. The schedule of funding progress, presented as required supplementary information following the notes to the financial statements, presents multiyear trend information about whether the actuarial value of plan assets are increasing or decreasing over time relative to the actuarial accrued liability for benefits.
Other Post‐Employment Benefits (OPEB) Plan Plan Description. The City administers a public employee retirement system, single employer defined benefit pension plan that provides health insurance, life insurance, and Medicare supplement benefits to eligible retirees. Employees who meet any of the retirement options available through NCLGERS and retire with 15 or more years of service may continue in the City’s group health plan until age 65. Medicare eligible retirees receive a Medicare supplement of $100 per month. Dependent health coverage is available until the spouse turns 65. The City’s group medical coverage continues with the option of limited or zero cost to the retiree, depending on coverage plan selected, until age 65 for retirees that were hired prior to June 30, 2008. Retirees that were hired on or after June 30, 2008 will pay a maximum of 50% of the premium cost if they retired with 15 years of service until age 65. The percentage of premium contribution decreases by 5% for each additional year of service at retirement, with retirees that have 25 years of service at retirement able to continue coverage at limited or no cost. For employees hired before July 1, 2007, spouse / dependent coverage for retirees is provided at the same cost as active members. Employees hired on or after July 1, 2007 will have to pay the entire cost for spouse / dependent coverage as a retiree. Eligible retirees with a minimum of ten years of service are provided life insurance coverage as follows: for the first five years after retirement coverage is $1,750; after five years of retirement coverage reduces to $1,000. Disabled retirees receive life insurance equal to their salary at the time of disability until age 65. The City Council may amend the benefit provisions at any time. A separate stand‐alone report is not issued.
62
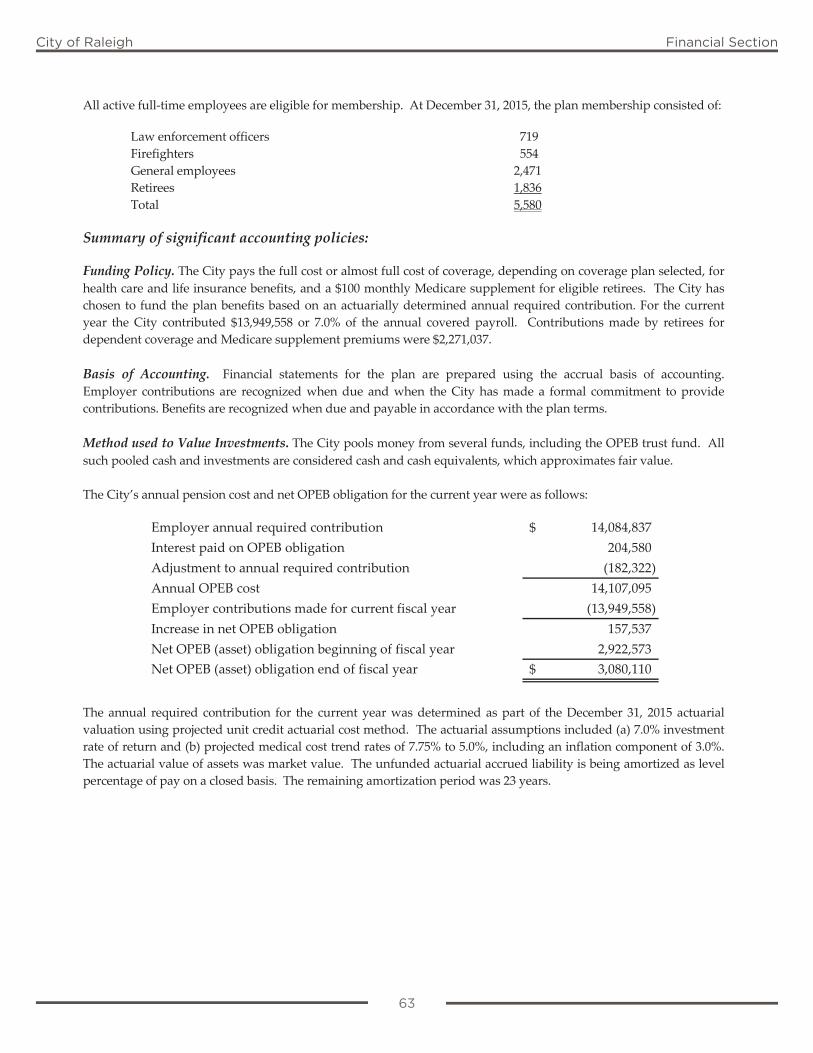
63
City of Raleigh Financial Section
All active full‐time employees are eligible for membership. At December 31, 2015, the plan membership consisted of: Law enforcement officers 719 Firefighters 554 General employees 2,471 Retirees 1,836 Total 5,580
Summary of significant accounting policies: Funding Policy. The City pays the full cost or almost full cost of coverage, depending on coverage plan selected, for health care and life insurance benefits, and a $100 monthly Medicare supplement for eligible retirees. The City has chosen to fund the plan benefits based on an actuarially determined annual required contribution. For the current year the City contributed $13,949,558 or 7.0% of the annual covered payroll. Contributions made by retirees for dependent coverage and Medicare supplement premiums were $2,271,037. Basis of Accounting. Financial statements for the plan are prepared using the accrual basis of accounting. Employer contributions are recognized when due and when the City has made a formal commitment to provide contributions. Benefits are recognized when due and payable in accordance with the plan terms. Method used to Value Investments. The City pools money from several funds, including the OPEB trust fund. All such pooled cash and investments are considered cash and cash equivalents, which approximates fair value. The City’s annual pension cost and net OPEB obligation for the current year were as follows:
Employer annual required contribution 14,084,837$ Interest paid on OPEB obligation 204,580 Adjustment to annual required contribution (182,322) Annual OPEB cost 14,107,095 Employer contributions made for current fiscal year (13,949,558) Increase in net OPEB obligation 157,537 Net OPEB (asset) obligation beginning of fiscal year 2,922,573 Net OPEB (asset) obligation end of fiscal year 3,080,110$
The annual required contribution for the current year was determined as part of the December 31, 2015 actuarial valuation using projected unit credit actuarial cost method. The actuarial assumptions included (a) 7.0% investment rate of return and (b) projected medical cost trend rates of 7.75% to 5.0%, including an inflation component of 3.0%. The actuarial value of assets was market value. The unfunded actuarial accrued liability is being amortized as level percentage of pay on a closed basis. The remaining amortization period was 23 years.
63
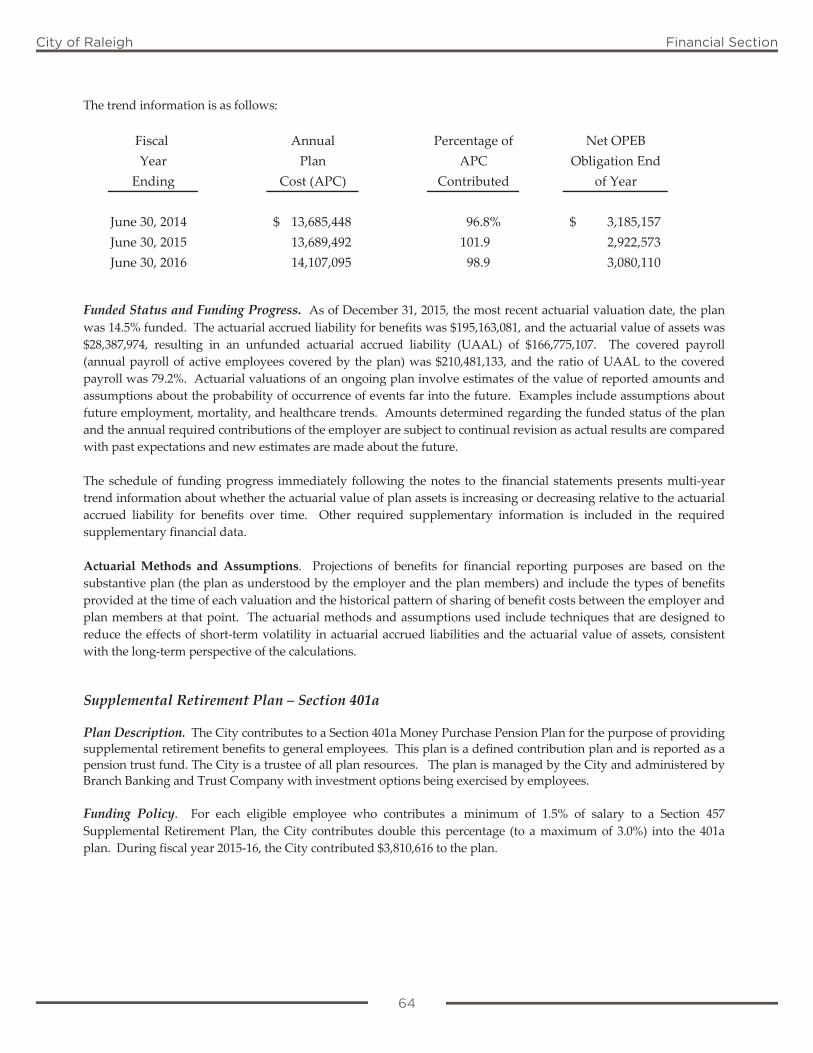
64
City of Raleigh Financial Section
The trend information is as follows:
Fiscal Annual Percentage of Net OPEBYear Plan APC Obligation End
Ending Cost (APC) Contributed of Year
June 30, 2014 13,685,448$ 96.8% 3,185,157$ June 30, 2015 13,689,492 101.9 2,922,573 June 30, 2016 14,107,095 98.9 3,080,110
Funded Status and Funding Progress. As of December 31, 2015, the most recent actuarial valuation date, the plan was 14.5% funded. The actuarial accrued liability for benefits was $195,163,081, and the actuarial value of assets was $28,387,974, resulting in an unfunded actuarial accrued liability (UAAL) of $166,775,107. The covered payroll (annual payroll of active employees covered by the plan) was $210,481,133, and the ratio of UAAL to the covered payroll was 79.2%. Actuarial valuations of an ongoing plan involve estimates of the value of reported amounts and assumptions about the probability of occurrence of events far into the future. Examples include assumptions about future employment, mortality, and healthcare trends. Amounts determined regarding the funded status of the plan and the annual required contributions of the employer are subject to continual revision as actual results are compared with past expectations and new estimates are made about the future. The schedule of funding progress immediately following the notes to the financial statements presents multi‐year trend information about whether the actuarial value of plan assets is increasing or decreasing relative to the actuarial accrued liability for benefits over time. Other required supplementary information is included in the required supplementary financial data. Actuarial Methods and Assumptions. Projections of benefits for financial reporting purposes are based on the substantive plan (the plan as understood by the employer and the plan members) and include the types of benefits provided at the time of each valuation and the historical pattern of sharing of benefit costs between the employer and plan members at that point. The actuarial methods and assumptions used include techniques that are designed to reduce the effects of short‐term volatility in actuarial accrued liabilities and the actuarial value of assets, consistent with the long‐term perspective of the calculations. Supplemental Retirement Plan – Section 401a Plan Description. The City contributes to a Section 401a Money Purchase Pension Plan for the purpose of providing supplemental retirement benefits to general employees. This plan is a defined contribution plan and is reported as a pension trust fund. The City is a trustee of all plan resources. The plan is managed by the City and administered by Branch Banking and Trust Company with investment options being exercised by employees. Funding Policy. For each eligible employee who contributes a minimum of 1.5% of salary to a Section 457 Supplemental Retirement Plan, the City contributes double this percentage (to a maximum of 3.0%) into the 401a plan. During fiscal year 2015‐16, the City contributed $3,810,616 to the plan.
64
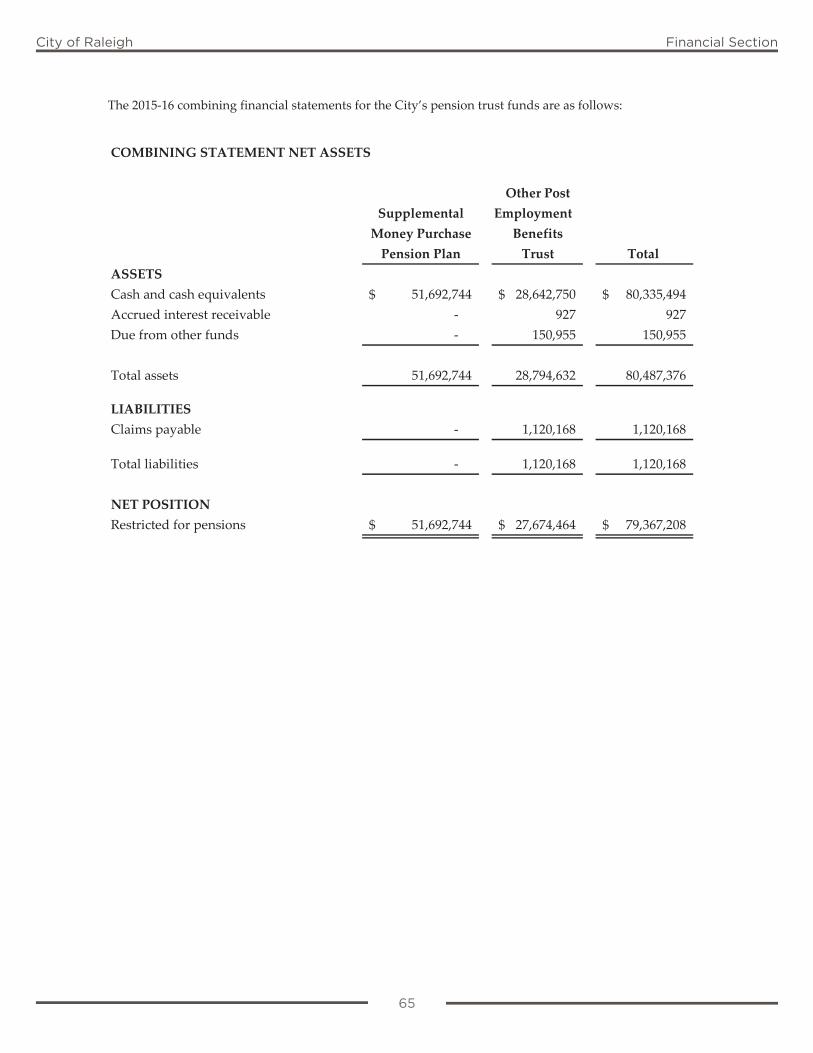
65
City of Raleigh Financial Section
The 2015‐16 combining financial statements for the City’s pension trust funds are as follows:
COMBINING STATEMENT NET ASSETS
Other PostSupplemental EmploymentMoney Purchase BenefitsPension Plan Trust Total
ASSETSCash and cash equivalents 51,692,744$ 28,642,750$ 80,335,494$ Accrued interest receivable ‐ 927 927 Due from other funds ‐ 150,955 150,955
Total assets 51,692,744 28,794,632 80,487,376
LIABILITIESClaims payable ‐ 1,120,168 1,120,168
Total liabilities ‐ 1,120,168 1,120,168
NET POSITIONRestricted for pensions 51,692,744$ 27,674,464$ 79,367,208$
65
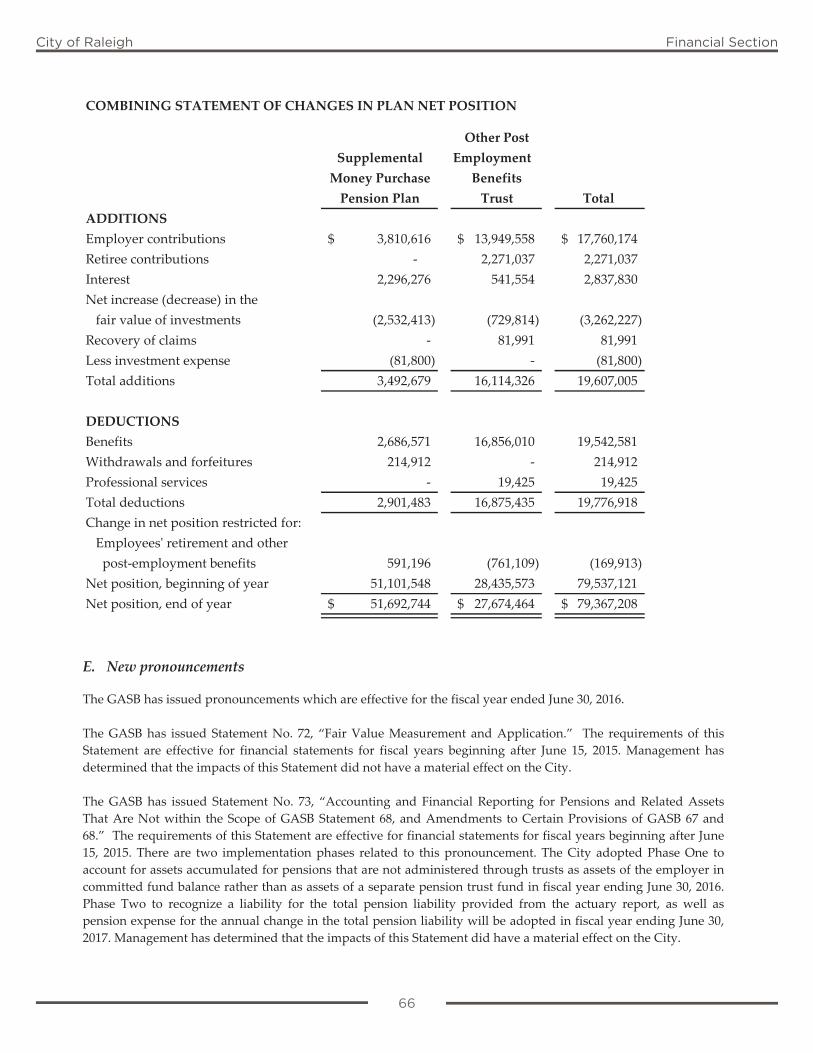
66
City of Raleigh Financial Section
COMBINING STATEMENT OF CHANGES IN PLAN NET POSITION
Other PostSupplemental EmploymentMoney Purchase BenefitsPension Plan Trust Total
ADDITIONSEmployer contributions 3,810,616$ 13,949,558$ 17,760,174$ Retiree contributions ‐ 2,271,037 2,271,037 Interest 2,296,276 541,554 2,837,830 Net increase (decrease) in thefair value of investments (2,532,413) (729,814) (3,262,227)
Recovery of claims ‐ 81,991 81,991 Less investment expense (81,800) ‐ (81,800) Total additions 3,492,679 16,114,326 19,607,005
DEDUCTIONSBenefits 2,686,571 16,856,010 19,542,581 Withdrawals and forfeitures 214,912 ‐ 214,912 Professional services ‐ 19,425 19,425 Total deductions 2,901,483 16,875,435 19,776,918 Change in net position restricted for:Employeesʹ retirement and other post‐employment benefits 591,196 (761,109) (169,913)
Net position, beginning of year 51,101,548 28,435,573 79,537,121 Net position, end of year 51,692,744$ 27,674,464$ 79,367,208$
E. New pronouncements The GASB has issued pronouncements which are effective for the fiscal year ended June 30, 2016. The GASB has issued Statement No. 72, “Fair Value Measurement and Application.” The requirements of this Statement are effective for financial statements for fiscal years beginning after June 15, 2015. Management has determined that the impacts of this Statement did not have a material effect on the City. The GASB has issued Statement No. 73, “Accounting and Financial Reporting for Pensions and Related Assets That Are Not within the Scope of GASB Statement 68, and Amendments to Certain Provisions of GASB 67 and 68.” The requirements of this Statement are effective for financial statements for fiscal years beginning after June 15, 2015. There are two implementation phases related to this pronouncement. The City adopted Phase One to account for assets accumulated for pensions that are not administered through trusts as assets of the employer in committed fund balance rather than as assets of a separate pension trust fund in fiscal year ending June 30, 2016. Phase Two to recognize a liability for the total pension liability provided from the actuary report, as well as pension expense for the annual change in the total pension liability will be adopted in fiscal year ending June 30, 2017. Management has determined that the impacts of this Statement did have a material effect on the City.
66
67
City of Raleigh Financial Section
The GASB has issued Statement No. 76, “The Hierarchy of Generally Accepted Accounting Principles for State and Local Governments.” The requirements of this Statement are effective for financial statements for fiscal years beginning after June 15, 2015. Management has determined that the impacts of this Statement did not have a material effect on the City. The GASB has issued Statement No. 79, “Certain External Investment Pools and Pool Participants.” The requirements of this Statement are effective for financial statements for fiscal years beginning after June 15, 2015. Management has determined that the impacts of this Statement did not have a material effect on the City. The GASB has issued pronouncements prior to June 30, 2016, which have an effective date that may impact future presentations. GASB Statement No. 74, “Financial Reporting for Postemployment Benefit Plans Other than Pension Plans.” This Statement is effective for periods beginning after June 15, 2016. GASB Statement No. 75, “Accounting and Financial Reporting for Postemployment Benefits Other than Pensions.” This Statement is effective for periods beginning after June 15, 2017. GASB Statement No. 77, “Tax Abatement Disclosures.” This Statement is effective for periods beginning after December 15, 2015. GASB Statement No. 78, “Pensions Provided through Certain Multi‐Employer Defined Benefit Pension Plans.” This Statement is effective for periods beginning after December 15, 2015. GASB Statement No. 80, “Blending Requirement for Certain Component Units.” This Statement is effective for periods beginning after June 15, 2016. GASB Statement No. 81, “Irrevocable Split‐Interest Agreements.” This Statement is effective for periods beginning after December 15, 2016. GASB Statement No. 82, “Pension Issues.” This Statement is effective for periods beginning after June 15, 2016. Management has not currently determined what impact the implementation of the above statements may have on the financial statements of the City.
F. Subsequent events The City has evaluated events through October 26, 2016 in connection with the preparation of these financial statements, which is the date the financials were available to be issued. In August 2016, the North Carolina Supreme Court issued its decision in the matter of Quality Built Homes, Inc. vs. Town of Carthage. The court held that the imposition of certain development fees by the town was not authorized by state law. The case was remanded to the North Carolina Court of Appeals for further consideration of some issues raised in the case. The City Attorney’s Office is currently reviewing the Supreme Court opinion and will be following the remand process at the Court of Appeals. It is unlikely that a Court of Appeals decision will be handed down until sometime after the upcoming general election. At that time the City will be in a better position to determine any effect the case might have on the City.
67

68
City of Raleigh Financial Section
G. Change in accounting principles/restatement
In accordance with Governmental Accounting Standards Board (GASB) Statement 73, the City reclassified the Law Enforcement Officers’ Special Separation Allowance trust fund to the General Fund. As a result, net position for the governmental activities increased by $3,077,172.
68

City of Raleigh Financial Section
Required Supplementary Information
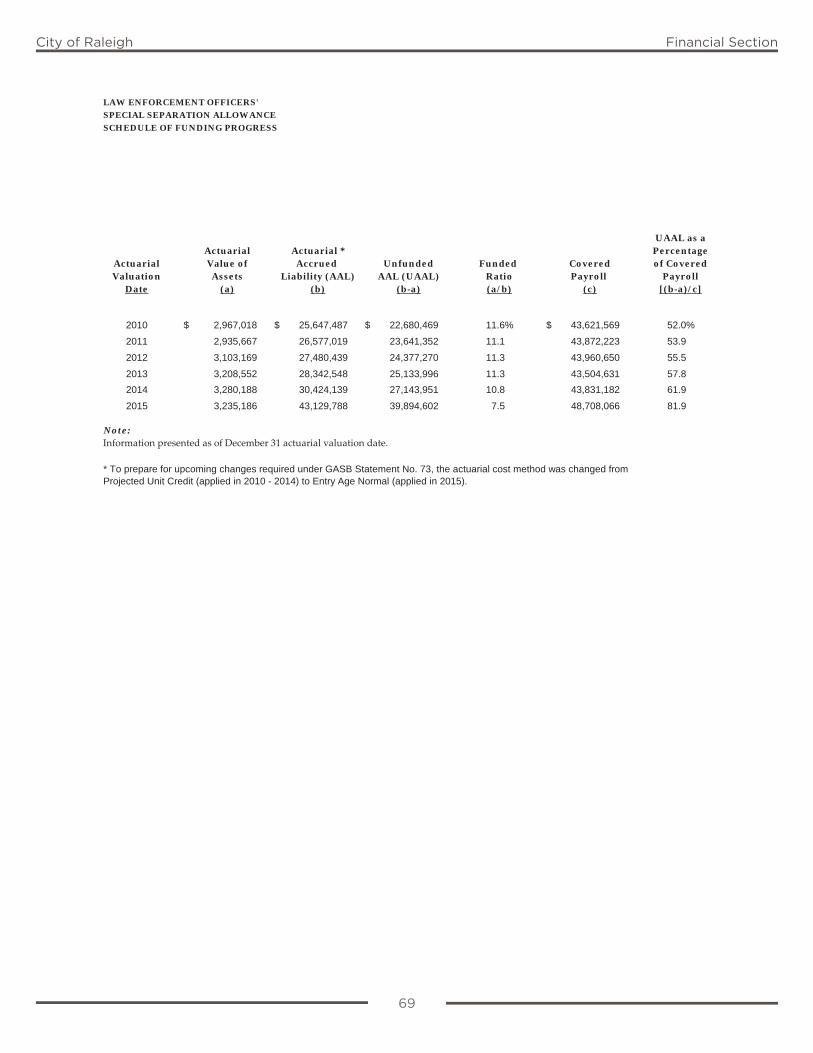
69
City of Raleigh Financial Section
LAW ENFORCEMENT OFFICERS'
SPECIAL SEPARATION ALLOWANCE
SCHEDULE OF FUNDING PROGRESS
UAAL as aActuarial Actuarial * Percentage
Actuarial Value of Accrued Unfunded Funded Covered of CoveredValuation Assets Liability (AAL) AAL (UAAL) Ratio Payroll Payroll
Date (a) (b) (b-a) (a/b) (c) [(b-a)/c]
2010 $ 2,967,018 $ 25,647,487 $ 22,680,469 11.6% $ 43,621,569 52.0%
2011 2,935,667 26,577,019 23,641,352 11.1 43,872,223 53.9
2012 3,103,169 27,480,439 24,377,270 11.3 43,960,650 55.5
2013 3,208,552 28,342,548 25,133,996 11.3 43,504,631 57.8
2014 3,280,188 30,424,139 27,143,951 10.8 43,831,182 61.9
2015 3,235,186 43,129,788 39,894,602 7.5 48,708,066 81.9
Note:Information presented as of December 31 actuarial valuation date.
* To prepare for upcoming changes required under GASB Statement No. 73, the actuarial cost method was changed fromProjected Unit Credit (applied in 2010 - 2014) to Entry Age Normal (applied in 2015).
69
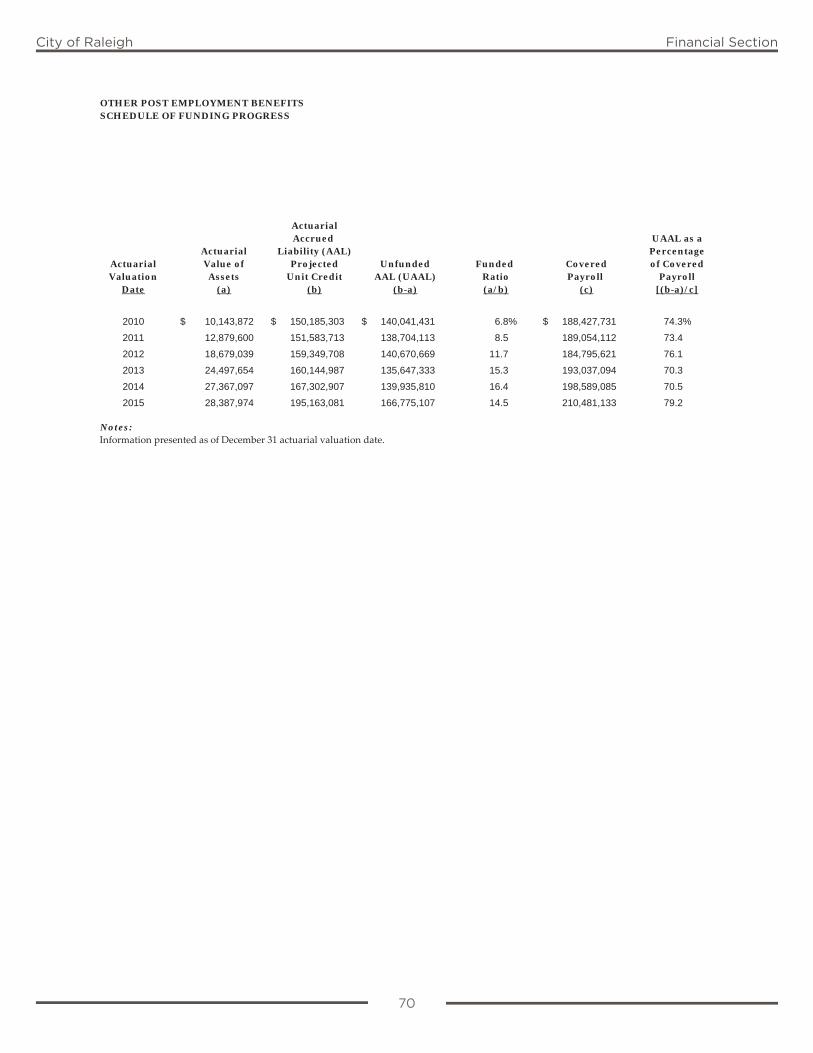
70
City of Raleigh Financial Section
OTHER POST EMPLOYMENT BENEFITSSCHEDULE OF FUNDING PROGRESS
ActuarialAccrued UAAL as a
Actuarial Liability (AAL) PercentageActuarial Value of Projected Unfunded Funded Covered of CoveredValuation Assets Unit Credit AAL (UAAL) Ratio Payroll Payroll
Date (a) (b) (b-a) (a/b) (c) [(b-a)/c]
2010 $ 10,143,872 $ 150,185,303 $ 140,041,431 6.8% $ 188,427,731 74.3%
2011 12,879,600 151,583,713 138,704,113 8.5 189,054,112 73.4
2012 18,679,039 159,349,708 140,670,669 11.7 184,795,621 76.1
2013 24,497,654 160,144,987 135,647,333 15.3 193,037,094 70.3
2014 27,367,097 167,302,907 139,935,810 16.4 198,589,085 70.5
2015 28,387,974 195,163,081 166,775,107 14.5 210,481,133 79.2
Notes:Information presented as of December 31 actuarial valuation date.
70
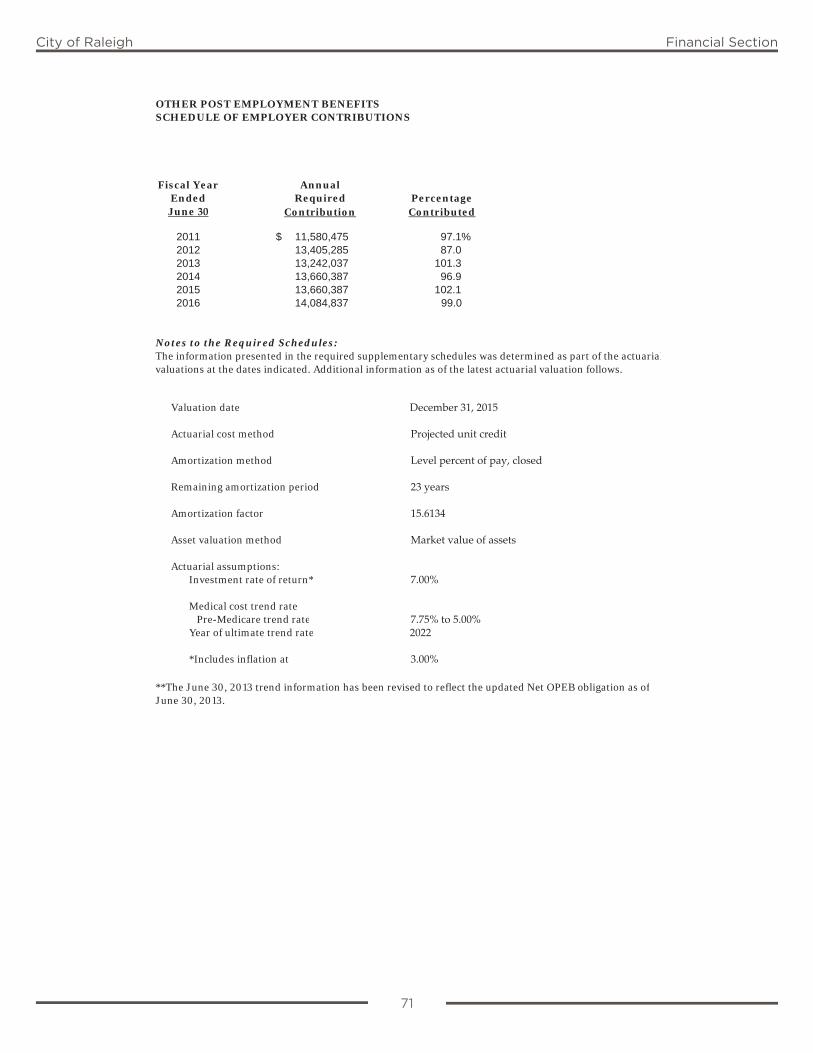
71
City of Raleigh Financial Section
OTHER POST EMPLOYMENT BENEFITSSCHEDULE OF EMPLOYER CONTRIBUTIONS
Fiscal Year AnnualEnded Required PercentageJune 30 Contribution Contributed
2011 $ 11,580,475 97.1%2012 13,405,285 87.02013 13,242,037 101.32014 13,660,387 96.92015 13,660,387 102.12016 14,084,837 99.0
Notes to the Required Schedules:The information presented in the required supplementary schedules was determined as part of the actuarialvaluations at the dates indicated. Additional information as of the latest actuarial valuation follows.
Valuation date December 31, 2015
Actuarial cost method Projected unit credit
Amortization method Level percent of pay, closed
Remaining amortization period 23 years
Amortization factor 15.6134
Asset valuation method Market value of assets
Actuarial assumptions: Investment rate of return* 7.00%
Medical cost trend rate Pre-Medicare trend rate 7.75% to 5.00% Year of ultimate trend rate 2022
*Includes inflation at 3.00%
**The June 30, 2013 trend information has been revised to reflect the updated Net OPEB obligation as ofJune 30, 2013.
71
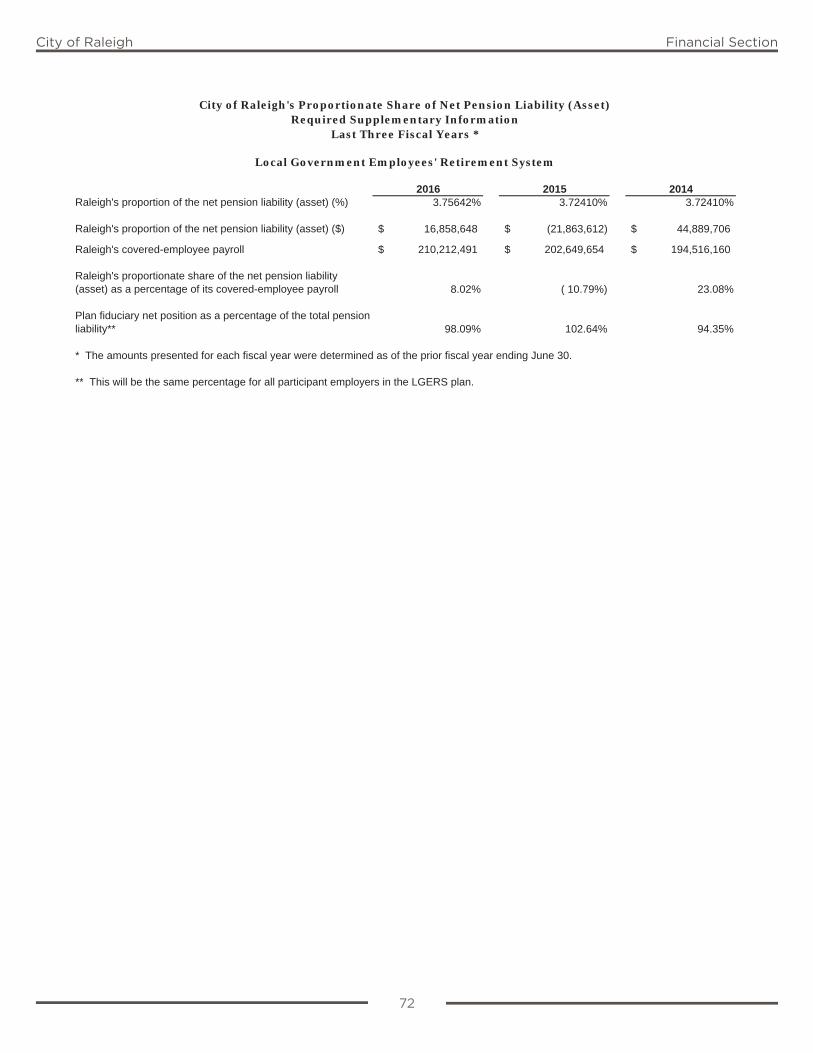
72
City of Raleigh Financial Section
2016 2015 2014Raleigh's proportion of the net pension liability (asset) (%) 3.75642% 3.72410% 3.72410%
Raleigh's proportion of the net pension liability (asset) ($) 16,858,648$ (21,863,612)$ 44,889,706$
Raleigh's covered-employee payroll 210,212,491$ 202,649,654$ 194,516,160$
Raleigh's proportionate share of the net pension liability (asset) as a percentage of its covered-employee payroll 8.02% ( 10.79%) 23.08%
Plan fiduciary net position as a percentage of the total pension liability** 98.09% 102.64% 94.35%
* The amounts presented for each fiscal year were determined as of the prior fiscal year ending June 30.
** This will be the same percentage for all participant employers in the LGERS plan.
City of Raleigh's Proportionate Share of Net Pension Liability (Asset)Required Supplementary Information
Last Three Fiscal Years *
Local Government Employees' Retirement System
72
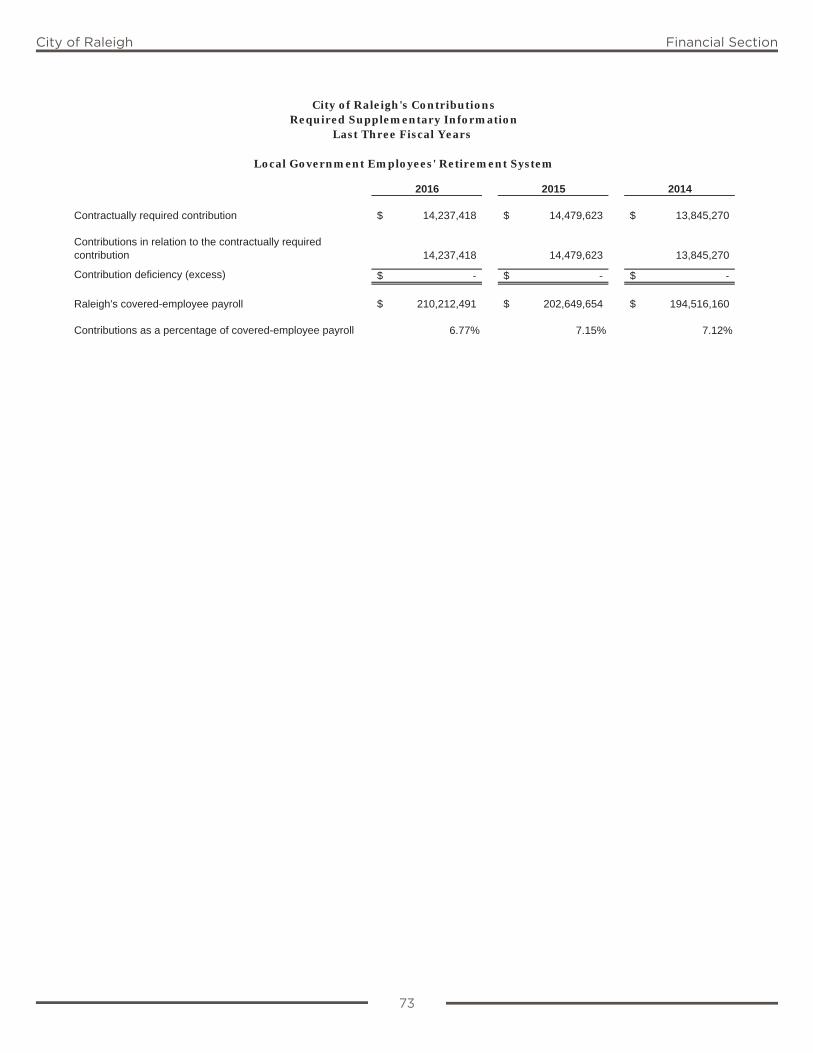
73
City of Raleigh Financial Section
2016 2015 2014
Contractually required contribution 14,237,418$ 14,479,623$ 13,845,270$
Contributions in relation to the contractually required contribution 14,237,418 14,479,623 13,845,270
Contribution deficiency (excess) -$ -$ -$
Raleigh's covered-employee payroll 210,212,491$ 202,649,654$ 194,516,160$
Contributions as a percentage of covered-employee payroll 6.77% 7.15% 7.12%
City of Raleigh's ContributionsRequired Supplementary Information
Last Three Fiscal Years
Local Government Employees' Retirement System
73
City of Raleigh Financial Section
Combining and IndividualFinancial Statements and Schedules
The Combining and Individual Financial Statements and Schedules reflect the detail level of presentation behind the basic financial statements.
Included are the following:
• Combining Statements - By Fund Type
• Individual Fund Schedules with Comparisons to Budget
• Other Schedules - Debt

City of Raleigh Financial Section
City of Raleigh Financial Section
Nonmajor Governmental FundsThe Nonmajor Governmental Funds statements include the combining balance sheet and combining statement of revenues, expenditures and changes in fund balance for nonmajor special revenue funds and nonmajor capital projects funds that comprise the other governmental funds column in the basic financial statements. The combining nonmajor special revenue funds statements and the combining nonmajor capital projects funds statements are detailed behind the special revenue funds and capital project funds dividers.
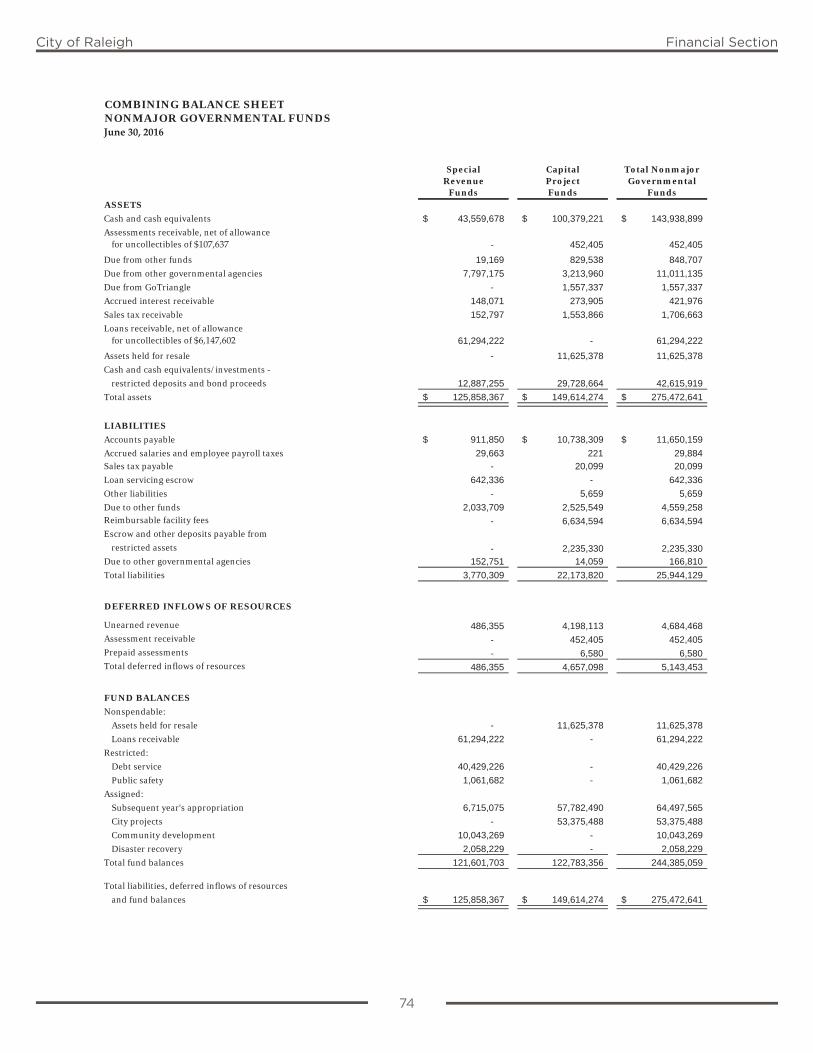
74
City of Raleigh Financial Section
COMBINING BALANCE SHEETNONMAJOR GOVERNMENTAL FUNDSJune 30, 2016
Special Capital Total NonmajorRevenue Project Governmental
Funds Funds FundsASSETS
Cash and cash equivalents 43,559,678$ 100,379,221$ 143,938,899$
Assessments receivable, net of allowancefor uncollectibles of $107,637 - 452,405 452,405
Due from other funds 19,169 829,538 848,707
Due from other governmental agencies 7,797,175 3,213,960 11,011,135
Due from GoTriangle - 1,557,337 1,557,337
Accrued interest receivable 148,071 273,905 421,976
Sales tax receivable 152,797 1,553,866 1,706,663
Loans receivable, net of allowancefor uncollectibles of $6,147,602 61,294,222 - 61,294,222
Assets held for resale - 11,625,378 11,625,378
Cash and cash equivalents/investments -
restricted deposits and bond proceeds 12,887,255 29,728,664 42,615,919
Total assets 125,858,367$ 149,614,274$ 275,472,641$
LIABILITIES
Accounts payable 911,850$ 10,738,309$ 11,650,159$
Accrued salaries and employee payroll taxes 29,663 221 29,884 Sales tax payable - 20,099 20,099
Loan servicing escrow 642,336 - 642,336
Other liabilities - 5,659 5,659
Due to other funds 2,033,709 2,525,549 4,559,258 Reimbursable facility fees - 6,634,594 6,634,594 Escrow and other deposits payable from
restricted assets - 2,235,330 2,235,330Due to other governmental agencies 152,751 14,059 166,810
Total liabilities 3,770,309 22,173,820 25,944,129
DEFERRED INFLOWS OF RESOURCES
Unearned revenue 486,355 4,198,113 4,684,468 Assessment receivable - 452,405 452,405 Prepaid assessments - 6,580 6,580 Total deferred inflows of resources 486,355 4,657,098 5,143,453
FUND BALANCES
Nonspendable:
Assets held for resale - 11,625,378 11,625,378
Loans receivable 61,294,222 - 61,294,222
Restricted:
Debt service 40,429,226 - 40,429,226
Public safety 1,061,682 - 1,061,682
Assigned:
Subsequent year's appropriation 6,715,075 57,782,490 64,497,565
City projects - 53,375,488 53,375,488
Community development 10,043,269 - 10,043,269
Disaster recovery 2,058,229 - 2,058,229
Total fund balances 121,601,703 122,783,356 244,385,059
Total liabilities, deferred inflows of resources
and fund balances 125,858,367$ 149,614,274$ 275,472,641$
74

75
City of Raleigh Financial Section
COMBINING STATEMENT OF REVENUES, EXPENDITURES AND CHANGES IN FUND BALANCESNONMAJOR GOVERNMENTAL FUNDSFor the Fiscal Year Ended June 30, 2016
Special Capital Total NonmajorRevenue Projects Combining Governmental
Funds Funds Eliminations FundsREVENUES
Intergovernmental 36,076,073$ 9,269,415$ -$ 45,345,488$
Non-governmental 2,658 - - 2,658
Assessments - 1,293,692 - 1,293,692
Gain (loss) on investments 518,233 1,107,405 - 1,625,638
Facility fees - 9,891,183 - 9,891,183
Rents 55,628 274,897 - 330,525
Program income 822,910 - - 822,910
Miscellaneous other 21,764 80,155 - 101,919
Total revenues 37,497,266 21,916,747 - 59,414,013
EXPENDITURESCurrent:
General government 525 5,592,595 - 5,593,120
Community development services 3,239,193 - - 3,239,193
Public works 3,834,661 47,749,020 - 51,583,681
Public safety 4,454,741 33,100,009 - 37,554,750
Leisure services 1,074,043 4,077,804 - 5,151,847
Economic development programs 1,007,041 - - 1,007,041
Total expenditures 13,610,204 90,519,428 - 104,129,632
Excess (deficiency) of revenues
over (under) expenditures 23,887,062 (68,602,681) - (44,715,619)
OTHER FINANCING SOURCES (USES)
Transfers in 868,855 30,760,702 (24,123) 31,605,434
Transfers out (21,345,064) (10,761,050) 24,123 (32,081,991)
Issuance of debt 6,000,019 2,216,575 - 8,216,594
Premium on issuance of debt 26,841 308,366 - 335,207
Proceeds from sale of property 654,370 6,919,837 - 7,574,207
Total other financing sources and uses (13,794,979) 29,444,430 - 15,649,451
Net change in fund balances 10,092,083 (39,158,251) - (29,066,168)
Fund balances, beginning of year 111,509,620 161,941,607 - 273,451,227
Fund balances, end of year 121,601,703$ 122,783,356$ -$ 244,385,059$
75

City of Raleigh Financial Section

City of Raleigh Financial Section
Special Revenue FundsThe primary purpose of the Special Revenue Funds is to account for the proceeds of designated revenue sources that are restricted by law or administrative action for specific purposes. Revenue sources accounted for through the City’s special revenue funds include various grant funds, housing bond fund, community development fund, disaster recovery fund, convention center financing fund, and emergency telephone system fund.

City of Raleigh Financial Section
City of Raleigh Financial Section
Special Revenue Funds
Grants Fund (nonmajor fund)The Grants Fund accounts for activities to which federal, state, and other aid is contributed, with the exception of capital projects, federal community development, and public transportation assistance. This fund centralizes all funding sources for these activities and provides for full budgetary accountability.
Housing Bond Fund (nonmajor fund)The Housing Bond Fund accounts for City housing development programs which are financed by general obligation bond issues.
Community Development Fund (nonmajor fund)The Community Development Fund accounts for United States Department of Housing and Urban Development (HUD) grant proceeds allocated to the City for community development programs.
Disaster Recovery Fund (nonmajor fund)The Disaster Recovery Fund accounts for federal and state reimbursement for disaster recovery activities resulting from various natural disasters and the City’s flood mitigation program.
Convention Center Financing Fund (nonmajor fund)The Convention Center Financing Fund accounts for hotel and motel occupancy taxes collected by the County and remitted to the City per an interlocal agreement to fund the financing of the Convention Center.
Emergency Telephone System Fund (nonmajor fund)The Emergency Telephone System Fund is used to account for 911 revenues received by the state 911 board to enhance the state’s 911 system.
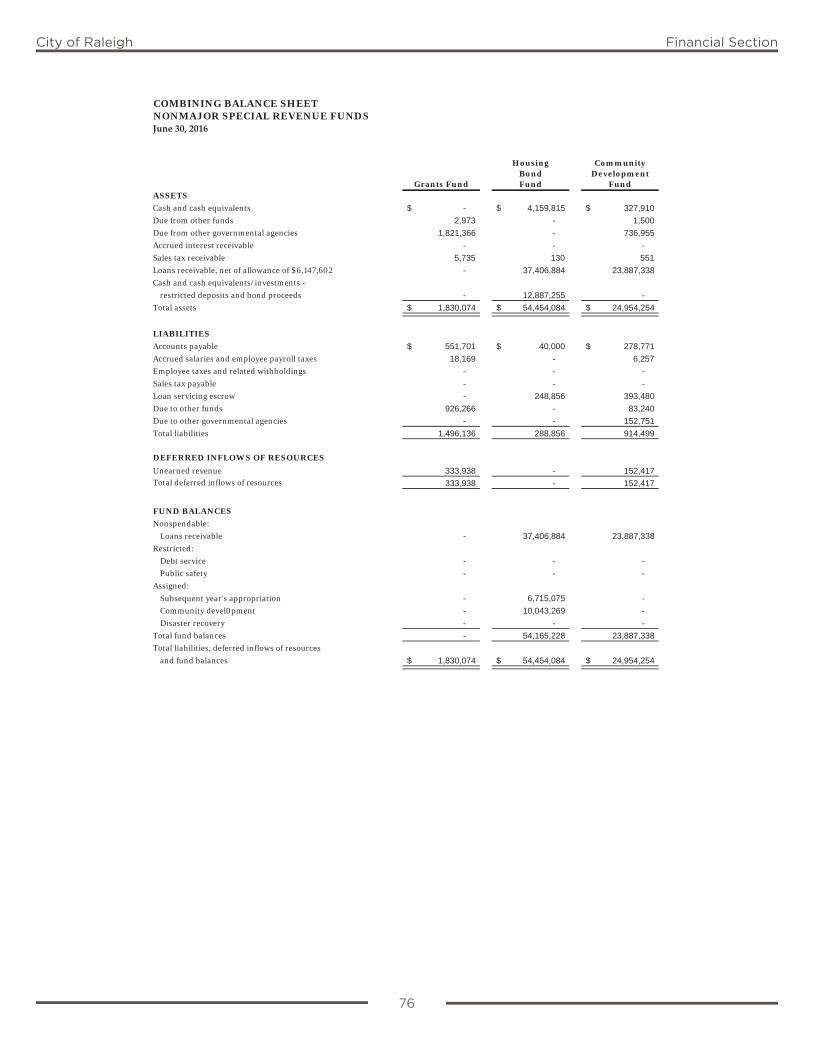
76
City of Raleigh Financial Section
COMBINING BALANCE SHEETNONMAJOR SPECIAL REVENUE FUNDSJune 30, 2016
Housing CommunityBond Development
Grants Fund Fund FundASSETS
Cash and cash equivalents -$ 4,159,815$ 327,910$
Due from other funds 2,973 - 1,500
Due from other governmental agencies 1,821,366 - 736,955
Accrued interest receivable - - -
Sales tax receivable 5,735 130 551
Loans receivable, net of allowance of $6,147,602 - 37,406,884 23,887,338
Cash and cash equivalents/investments -
restricted deposits and bond proceeds - 12,887,255 -
Total assets 1,830,074$ 54,454,084$ 24,954,254$
LIABILITIES
Accounts payable 551,701$ 40,000$ 278,771$
Accrued salaries and employee payroll taxes 18,169 - 6,257
Employee taxes and related withholdings - - -
Sales tax payable - - -
Loan servicing escrow - 248,856 393,480
Due to other funds 926,266 - 83,240
Due to other governmental agencies - - 152,751
Total liabilities 1,496,136 288,856 914,499
DEFERRED INFLOWS OF RESOURCES
Unearned revenue 333,938 - 152,417 Total deferred inflows of resources 333,938 - 152,417
FUND BALANCES
Nonspendable:
Loans receivable - 37,406,884 23,887,338
Restricted:
Debt service - - -
Public safety - - -
Assigned:
Subsequent year's appropriation - 6,715,075 -
Community devel0pment - 10,043,269 -
Disaster recovery - - -
Total fund balances - 54,165,228 23,887,338
Total liabilities, deferred inflows of resources
and fund balances 1,830,074$ 54,454,084$ 24,954,254$
76

77
City of Raleigh Financial Section
COMBINING BALANCE SHEETNONMAJOR SPECIAL REVENUE FUNDSJune 30, 2016
Convention EmergencyDisaster Center Telephone Total NonmajorRecovery Financing System Special Revenue
Fund Fund Fund FundsASSETS
Cash and cash equivalents 1,516,786$ 36,674,862$ 880,305$ 43,559,678$
Due from other funds - - 14,696 19,169
Due from other governmental agencies 541,443 4,639,087 58,324 7,797,175
Accrued interest receivable - 139,480 8,591 148,071
Sales tax receivable - - 146,381 152,797
Loans receivable, net of allowance of $6,147,602 - - - 61,294,222
Cash and cash equivalents/investments -
restricted deposits and bond proceeds - - - 12,887,255
Total assets 2,058,229$ 41,453,429$ 1,108,297$ 125,858,367$
LIABILITIES
Accounts payable -$ -$ 41,378$ 911,850$
Accrued salaries and employee payroll taxes - - 5,237 29,663
Employee taxes and related withholdings - - - -
Sales tax payable - - - -
Loan servicing escrow - - - 642,336
Due to other funds - 1,024,203 - 2,033,709
Due to other governmental agencies - - - 152,751
Total liabilities - 1,024,203 46,615 3,770,309
DEFERRED INFLOWS OF RESOURCES
Unearned revenue - - - 486,355 Total deferred inflows of resources - - - 486,355
FUND BALANCES
Nonspendable:
Loans receivable - - - 61,294,222
Restricted:
Debt service - 40,429,226 - 40,429,226
Public safety - - 1,061,682 1,061,682
Assigned:
Subsequent year's appropriation - - - 6,715,075
Community devel0pment - - - 10,043,269
Disaster recovery 2,058,229 - - 2,058,229
Total fund balances 2,058,229 40,429,226 1,061,682 121,601,703
Total liabilities, deferred inflows of resources
and fund balances 2,058,229$ 41,453,429$ 1,108,297$ 125,858,367$
77
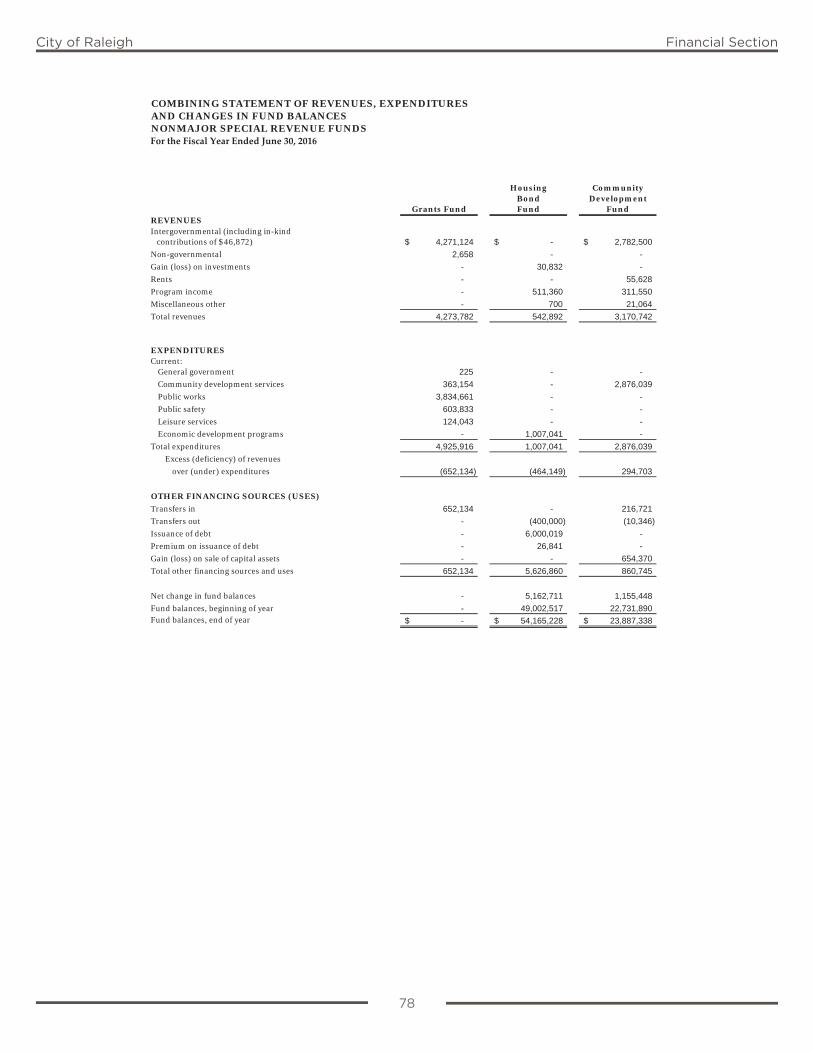
78
City of Raleigh Financial Section
COMBINING STATEMENT OF REVENUES, EXPENDITURES AND CHANGES IN FUND BALANCESNONMAJOR SPECIAL REVENUE FUNDSFor the Fiscal Year Ended June 30, 2016
Housing CommunityBond Development
Grants Fund Fund FundREVENUESIntergovernmental (including in-kind contributions of $46,872) 4,271,124$ -$ 2,782,500$
Non-governmental 2,658 - -
Gain (loss) on investments - 30,832 -
Rents - - 55,628
Program income - 511,360 311,550
Miscellaneous other - 700 21,064
Total revenues 4,273,782 542,892 3,170,742
EXPENDITURESCurrent:
General government 225 - -
Community development services 363,154 - 2,876,039
Public works 3,834,661 - -
Public safety 603,833 - -
Leisure services 124,043 - -
Economic development programs - 1,007,041 -
Total expenditures 4,925,916 1,007,041 2,876,039
Excess (deficiency) of revenues
over (under) expenditures (652,134) (464,149) 294,703
OTHER FINANCING SOURCES (USES)
Transfers in 652,134 - 216,721
Transfers out - (400,000) (10,346)
Issuance of debt - 6,000,019 -
Premium on issuance of debt - 26,841 -
Gain (loss) on sale of capital assets - - 654,370
Total other financing sources and uses 652,134 5,626,860 860,745
Net change in fund balances - 5,162,711 1,155,448
Fund balances, beginning of year - 49,002,517 22,731,890 Fund balances, end of year -$ 54,165,228$ 23,887,338$
78
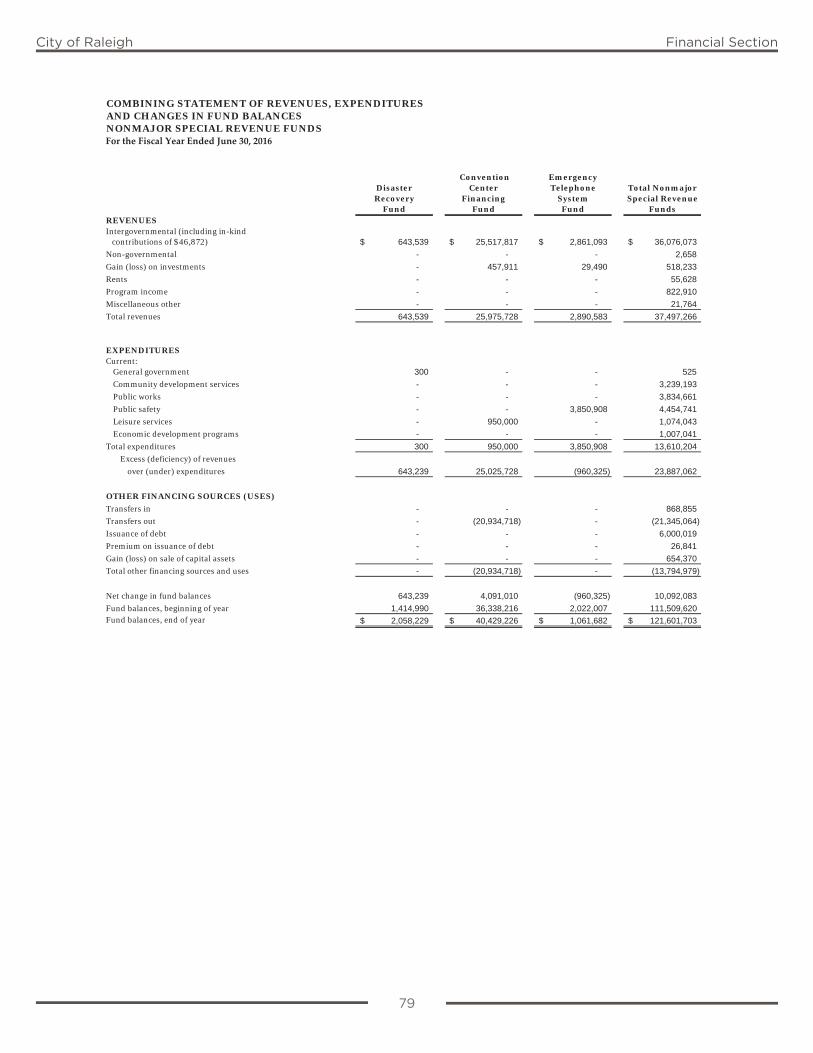
79
City of Raleigh Financial Section
COMBINING STATEMENT OF REVENUES, EXPENDITURES AND CHANGES IN FUND BALANCESNONMAJOR SPECIAL REVENUE FUNDSFor the Fiscal Year Ended June 30, 2016
Convention EmergencyDisaster Center Telephone Total NonmajorRecovery Financing System Special Revenue
Fund Fund Fund FundsREVENUESIntergovernmental (including in-kind contributions of $46,872) 643,539$ 25,517,817$ 2,861,093$ 36,076,073$
Non-governmental - - - 2,658
Gain (loss) on investments - 457,911 29,490 518,233
Rents - - - 55,628
Program income - - - 822,910
Miscellaneous other - - - 21,764
Total revenues 643,539 25,975,728 2,890,583 37,497,266
EXPENDITURESCurrent:
General government 300 - - 525
Community development services - - - 3,239,193
Public works - - - 3,834,661
Public safety - - 3,850,908 4,454,741
Leisure services - 950,000 - 1,074,043
Economic development programs - - - 1,007,041
Total expenditures 300 950,000 3,850,908 13,610,204
Excess (deficiency) of revenues
over (under) expenditures 643,239 25,025,728 (960,325) 23,887,062
OTHER FINANCING SOURCES (USES)
Transfers in - - - 868,855
Transfers out - (20,934,718) - (21,345,064)
Issuance of debt - - - 6,000,019
Premium on issuance of debt - - - 26,841
Gain (loss) on sale of capital assets - - - 654,370
Total other financing sources and uses - (20,934,718) - (13,794,979)
Net change in fund balances 643,239 4,091,010 (960,325) 10,092,083
Fund balances, beginning of year 1,414,990 36,338,216 2,022,007 111,509,620 Fund balances, end of year 2,058,229$ 40,429,226$ 1,061,682$ 121,601,703$
79
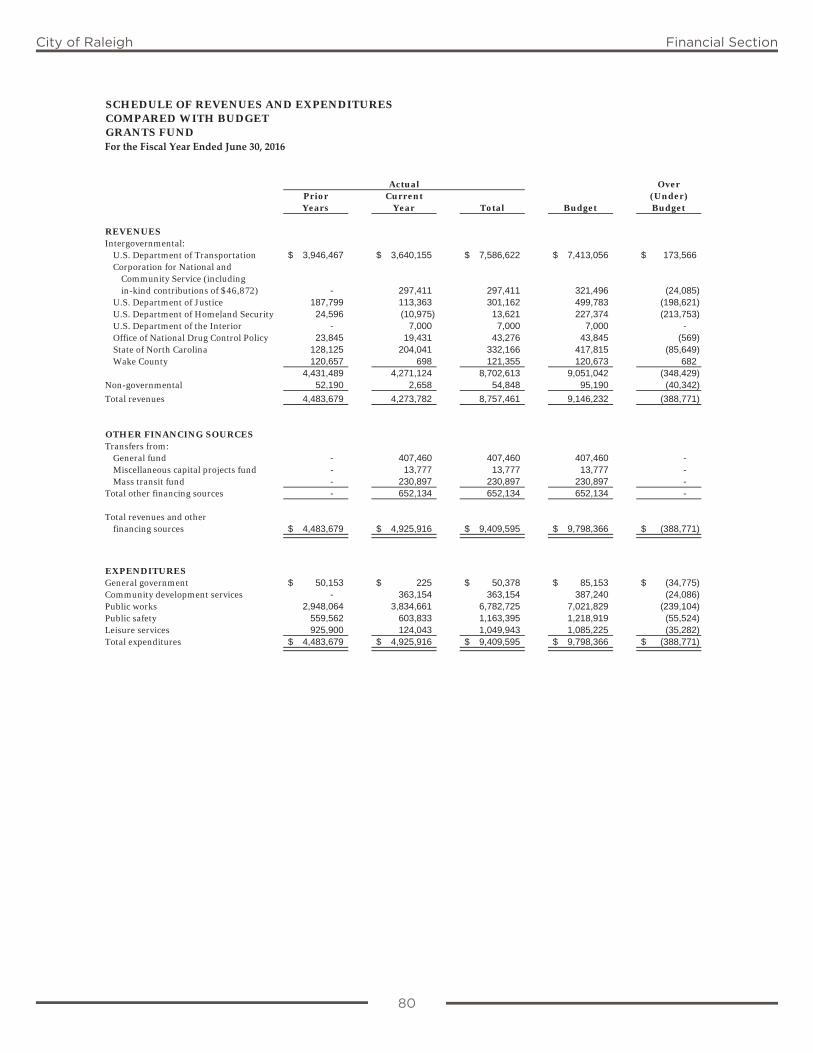
80
City of Raleigh Financial Section
SCHEDULE OF REVENUES AND EXPENDITURESCOMPARED WITH BUDGETGRANTS FUNDFor the Fiscal Year Ended June 30, 2016
OverPrior Current (Under)Years Year Total Budget Budget
REVENUESIntergovernmental:
U.S. Department of Transportation 3,946,467$ 3,640,155$ 7,586,622$ 7,413,056$ 173,566$Corporation for National and
Community Service (includingin-kind contributions of $46,872) - 297,411 297,411 321,496 (24,085)
U.S. Department of Justice 187,799 113,363 301,162 499,783 (198,621)U.S. Department of Homeland Security 24,596 (10,975) 13,621 227,374 (213,753)U.S. Department of the Interior - 7,000 7,000 7,000 - Office of National Drug Control Policy 23,845 19,431 43,276 43,845 (569)State of North Carolina 128,125 204,041 332,166 417,815 (85,649)Wake County 120,657 698 121,355 120,673 682
4,431,489 4,271,124 8,702,613 9,051,042 (348,429)Non-governmental 52,190 2,658 54,848 95,190 (40,342)
Total revenues 4,483,679 4,273,782 8,757,461 9,146,232 (388,771)
OTHER FINANCING SOURCESTransfers from:
General fund - 407,460 407,460 407,460 - Miscellaneous capital projects fund - 13,777 13,777 13,777 - Mass transit fund - 230,897 230,897 230,897 -
Total other financing sources - 652,134 652,134 652,134 -
Total revenues and otherfinancing sources 4,483,679$ 4,925,916$ 9,409,595$ 9,798,366$ (388,771)$
EXPENDITURESGeneral government 50,153$ 225$ 50,378$ 85,153$ (34,775)$Community development services - 363,154 363,154 387,240 (24,086)Public works 2,948,064 3,834,661 6,782,725 7,021,829 (239,104)Public safety 559,562 603,833 1,163,395 1,218,919 (55,524)Leisure services 925,900 124,043 1,049,943 1,085,225 (35,282)Total expenditures 4,483,679$ 4,925,916$ 9,409,595$ 9,798,366$ (388,771)$
Actual
80
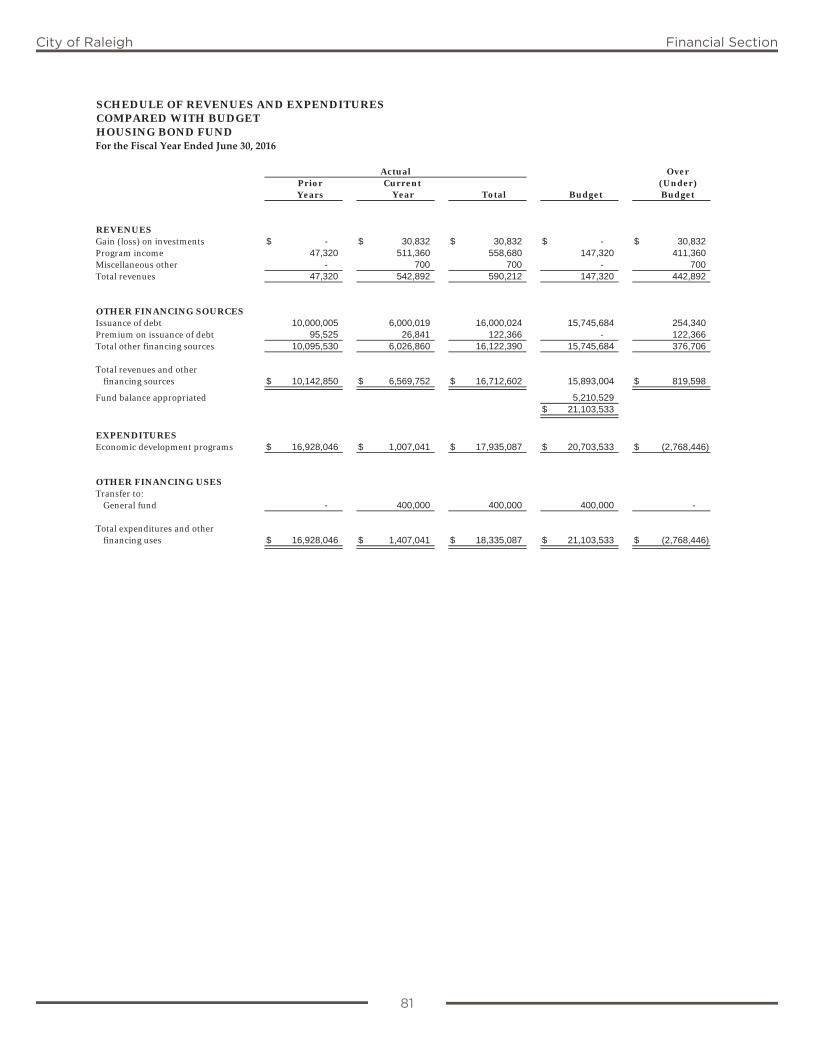
81
City of Raleigh Financial Section
SCHEDULE OF REVENUES AND EXPENDITURESCOMPARED WITH BUDGETHOUSING BOND FUNDFor the Fiscal Year Ended June 30, 2016
OverPrior Current (Under)Years Year Total Budget Budget
REVENUESGain (loss) on investments $ - $ 30,832 $ 30,832 $ - $ 30,832 Program income 47,320 511,360 558,680 147,320 411,360 Miscellaneous other - 700 700 - 700 Total revenues 47,320 542,892 590,212 147,320 442,892
OTHER FINANCING SOURCESIssuance of debt 10,000,005 6,000,019 16,000,024 15,745,684 254,340 Premium on issuance of debt 95,525 26,841 122,366 - 122,366 Total other financing sources 10,095,530 6,026,860 16,122,390 15,745,684 376,706
Total revenues and otherfinancing sources $ 10,142,850 $ 6,569,752 $ 16,712,602 15,893,004 $ 819,598
Fund balance appropriated 5,210,529 $ 21,103,533
EXPENDITURESEconomic development programs $ 16,928,046 $ 1,007,041 $ 17,935,087 $ 20,703,533 $ (2,768,446)
OTHER FINANCING USESTransfer to:
General fund - 400,000 400,000 400,000 -
Total expenditures and otherfinancing uses $ 16,928,046 $ 1,407,041 $ 18,335,087 $ 21,103,533 $ (2,768,446)
Actual
81
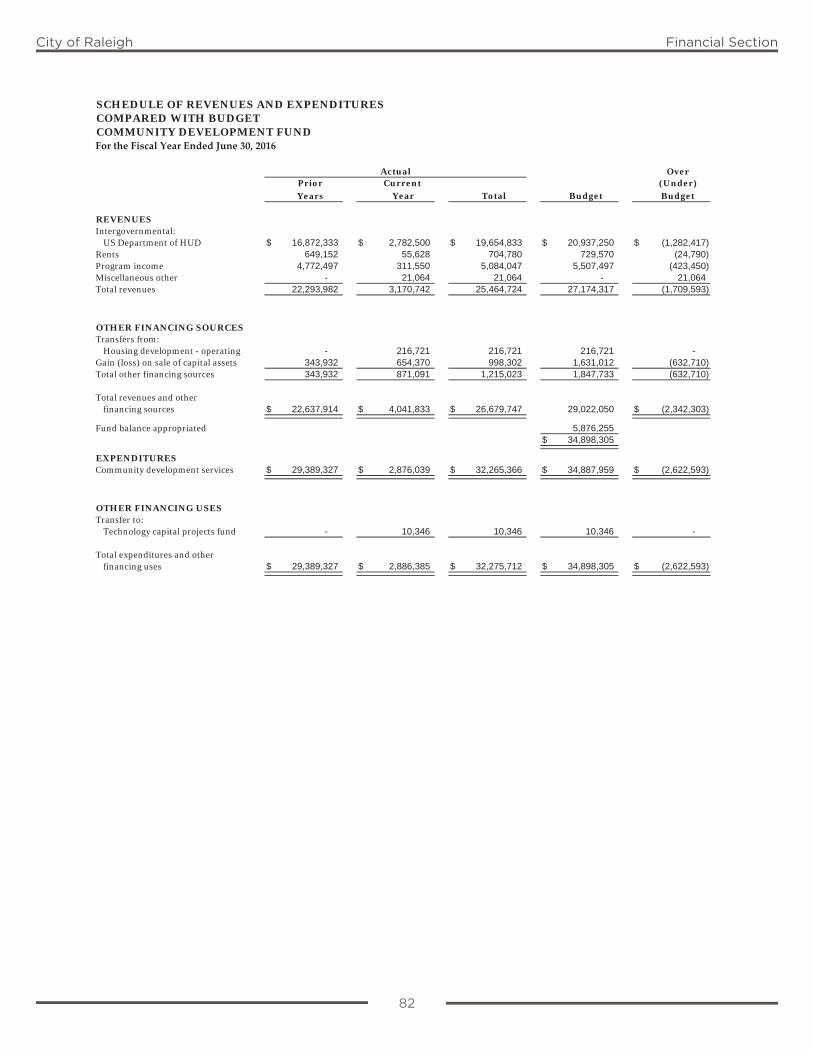
82
City of Raleigh Financial Section
SCHEDULE OF REVENUES AND EXPENDITURESCOMPARED WITH BUDGETCOMMUNITY DEVELOPMENT FUNDFor the Fiscal Year Ended June 30, 2016
OverPrior Current (Under)Years Year Total Budget Budget
REVENUESIntergovernmental:
US Department of HUD $ 16,872,333 $ 2,782,500 $ 19,654,833 $ 20,937,250 $ (1,282,417) Rents 649,152 55,628 704,780 729,570 (24,790) Program income 4,772,497 311,550 5,084,047 5,507,497 (423,450) Miscellaneous other - 21,064 21,064 - 21,064 Total revenues 22,293,982 3,170,742 25,464,724 27,174,317 (1,709,593)
OTHER FINANCING SOURCESTransfers from:
Housing development - operating - 216,721 216,721 216,721 - Gain (loss) on sale of capital assets 343,932 654,370 998,302 1,631,012 (632,710) Total other financing sources 343,932 871,091 1,215,023 1,847,733 (632,710)
Total revenues and otherfinancing sources $ 22,637,914 $ 4,041,833 $ 26,679,747 29,022,050 $ (2,342,303)
Fund balance appropriated 5,876,255 $ 34,898,305
EXPENDITURESCommunity development services $ 29,389,327 $ 2,876,039 $ 32,265,366 $ 34,887,959 $ (2,622,593)
OTHER FINANCING USESTransfer to:
Technology capital projects fund - 10,346 10,346 10,346 -
Total expenditures and otherfinancing uses $ 29,389,327 $ 2,886,385 $ 32,275,712 $ 34,898,305 $ (2,622,593)
Actual
82
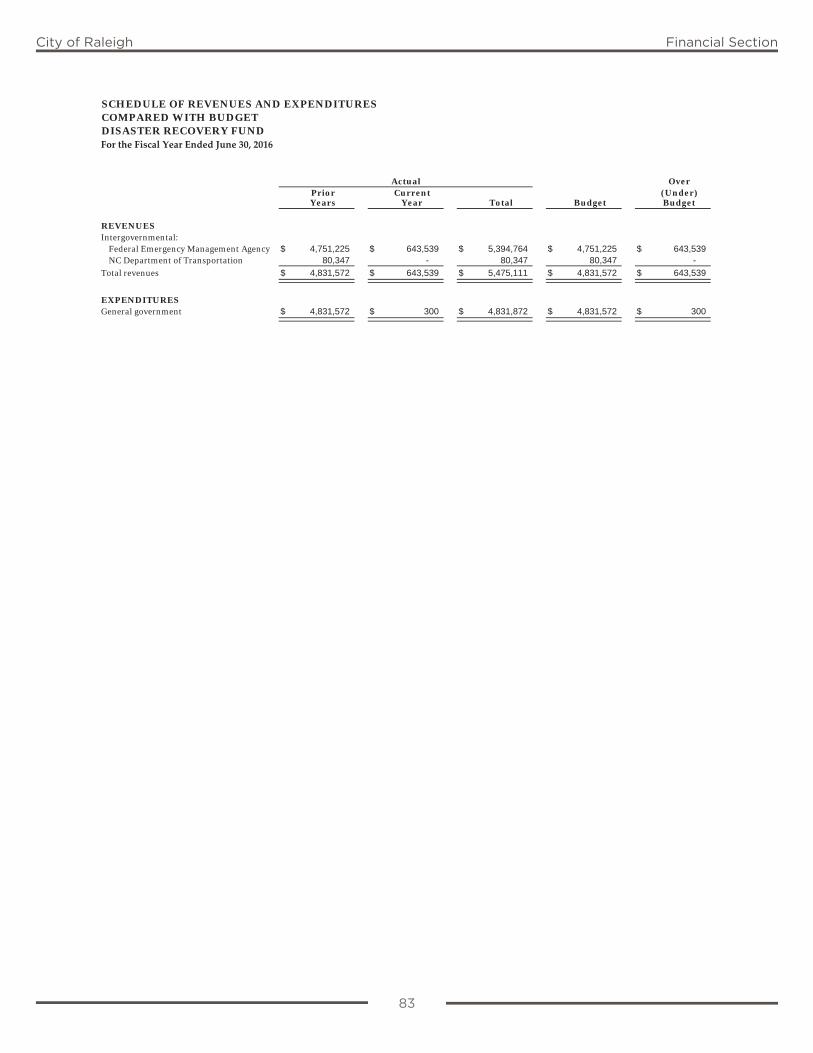
83
City of Raleigh Financial Section
SCHEDULE OF REVENUES AND EXPENDITURESCOMPARED WITH BUDGETDISASTER RECOVERY FUNDFor the Fiscal Year Ended June 30, 2016
OverPrior Current (Under)Years Year Total Budget Budget
REVENUESIntergovernmental:
Federal Emergency Management Agency $ 4,751,225 $ 643,539 $ 5,394,764 $ 4,751,225 $ 643,539 NC Department of Transportation 80,347 - 80,347 80,347 -
Total revenues $ 4,831,572 $ 643,539 $ 5,475,111 $ 4,831,572 $ 643,539
EXPENDITURESGeneral government $ 4,831,572 $ 300 $ 4,831,872 $ 4,831,572 $ 300
Actual
83

84
City of Raleigh Financial Section
SCHEDULE OF REVENUES AND EXPENDITURESCOMPARED WITH BUDGETCONVENTION CENTER FINANCING FUNDFor the Fiscal Year Ended June 30, 2016
Over(Under)
Actual Budget BudgetREVENUES
Intergovernmental:Wake County $ 25,517,817 $ 23,887,002 $ 1,630,815
Gain (loss) on investments 457,911 1,054,934 (597,023) Total revenues $ 25,975,728 $ 24,941,936 $ 1,033,792
EXPENDITURESLeisure services $ 950,000 $ 2,382,191 $ (1,432,191)
OTHER FINANCING USESTransfers to:
Convention center and performing artscomplex operating fund 19,782,718 21,407,745 (1,625,027)
Convention center complex capital projects fund 1,152,000 1,152,000 -
Total other financing uses 20,934,718 22,559,745 (1,625,027)
Total expenditures and otherfinancing uses $ 21,884,718 $ 24,941,936 $ (3,057,218)
84
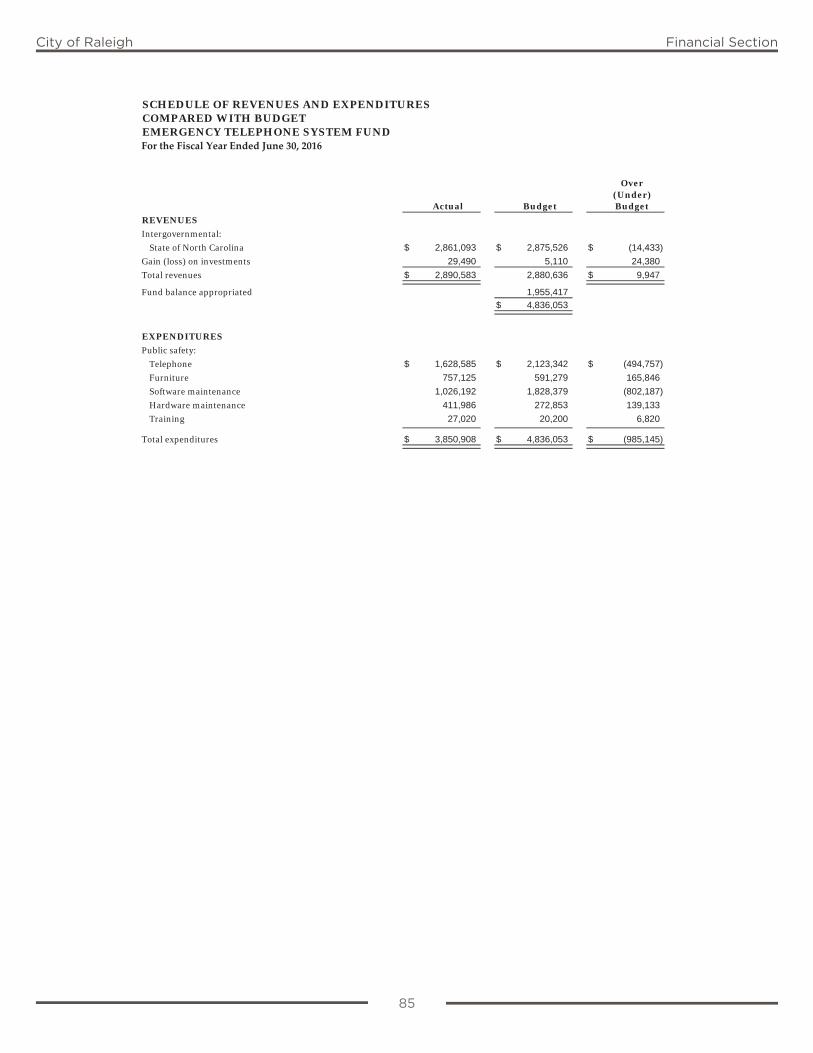
85
City of Raleigh Financial Section
SCHEDULE OF REVENUES AND EXPENDITURESCOMPARED WITH BUDGETEMERGENCY TELEPHONE SYSTEM FUNDFor the Fiscal Year Ended June 30, 2016
Over(Under)
Actual Budget Budget
REVENUES
Intergovernmental:
State of North Carolina $ 2,861,093 $ 2,875,526 $ (14,433)
Gain (loss) on investments 29,490 5,110 24,380
Total revenues $ 2,890,583 2,880,636 $ 9,947
Fund balance appropriated 1,955,417
$ 4,836,053
EXPENDITURES
Public safety:
Telephone $ 1,628,585 $ 2,123,342 $ (494,757)
Furniture 757,125 591,279 165,846
Software maintenance 1,026,192 1,828,379 (802,187)
Hardware maintenance 411,986 272,853 139,133
Training 27,020 20,200 6,820
Total expenditures $ 3,850,908 $ 4,836,053 $ (985,145)
85

City of Raleigh Financial Section
City of Raleigh Financial Section
General Capital Projects FundsThe purpose of the General Capital Projects Funds are to account for the financial resources segregated for the acquisition or construction of major general capital assets and facilities. The budgets within these funds are adopted for the life of the project. Under the project accounting concept, project expenditures, and the revenues used to fund them, are accumulated until the year the project is completed. General projects accounted for within the general capital projects funds include street projects, park improvements, Raleigh Union Station, technology projects, major public facilities and other miscellaneous capital projects.

City of Raleigh Financial Section
City of Raleigh Financial Section
General Capital Projects Funds
Street Improvement Fund (nonmajor fund)The Street Improvement Fund accounts for all street improvement programs to be financed from applicable street assessment proceeds and other non-bond street improvement resources.
Street Bond Fund (nonmajor fund)The Street Bond Fund accounts for the street construction projects financed from the general obligation street bond issues.
Sidewalk Fund (nonmajor fund)The Sidewalk Fund accounts for capital project costs for the construction of sidewalks within the City.
Park Improvement Fund (nonmajor fund)The Park Improvement Fund accounts for transfers from the general fund and other revenues and allocations, and all project costs in the construction of park improvements as well as park land and greenway acquisition.
Raleigh Union Station Fund (nonmajor fund)The Raleigh Union Station Fund accounts for capital project costs for construction of the Raleigh Union Station. This fund is financed by both federal monies from the Federal Railroad Administration as well as with state match and local funding.
Facility Fees Fund (nonmajor fund)The Facility Fees Fund accounts for facility fees collected from developers to be expended for street and park capital purposes within designated zones in the City.
Miscellaneous Capital Improvements Fund (nonmajor fund)The Miscellaneous Capital Improvements Fund accounts for all capital improvement costs not applicable to other capital improvement programs. These improvements are financed from non-bond resources.
Walnut Creek Amphitheater Fund (nonmajor fund)The Walnut Creek Amphitheater Fund accounts for capital projects costs of the Amphitheater financed by a portion of the Amphitheater rent.
Technology Capital Projects Fund (nonmajor fund)The Technology Capital Projects Fund accounts for long-term technology projects as recommended by the City’s technology governance process. These projects are financed from general fund resources.
Major Public Facilities Fund (nonmajor fund)The Major Public Facilities Fund accounts for capital project costs for construction of new public facilities including remote operations centers for streets, parks, solid waste and public works. These projects are financed from certificates or participations debt issues.
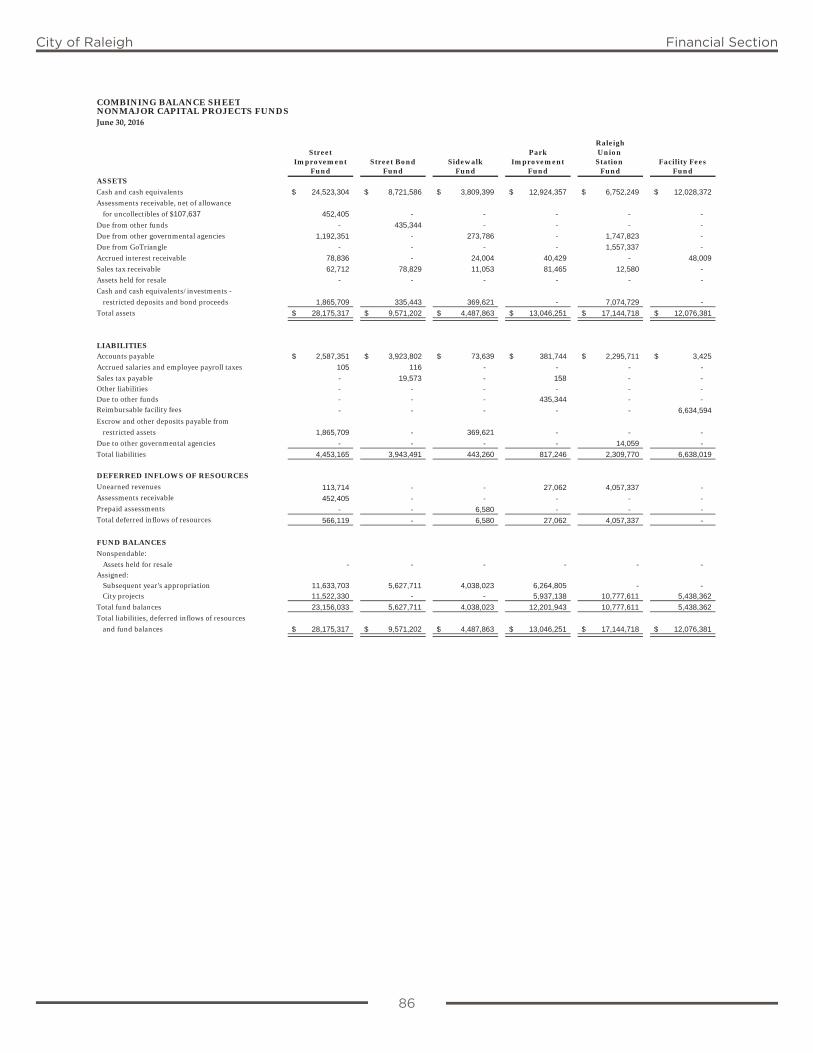
86
City of Raleigh Financial Section
COMBINING BALANCE SHEETNONMAJOR CAPITAL PROJECTS FUNDSJune 30, 2016
RaleighStreet Park Union
Improvement Street Bond Sidewalk Improvement Station Facility FeesFund Fund Fund Fund Fund Fund
ASSETS
Cash and cash equivalents 24,523,304$ 8,721,586$ 3,809,399$ 12,924,357$ 6,752,249$ 12,028,372$
Assessments receivable, net of allowance
for uncollectibles of $107,637 452,405 - - - - -
Due from other funds - 435,344 - - - -
Due from other governmental agencies 1,192,351 - 273,786 - 1,747,823 -
Due from GoTriangle - - - - 1,557,337 -
Accrued interest receivable 78,836 - 24,004 40,429 - 48,009
Sales tax receivable 62,712 78,829 11,053 81,465 12,580 -
Assets held for resale - - - - - -
Cash and cash equivalents/investments -
restricted deposits and bond proceeds 1,865,709 335,443 369,621 - 7,074,729 -
Total assets 28,175,317$ 9,571,202$ 4,487,863$ 13,046,251$ 17,144,718$ 12,076,381$
LIABILITIESAccounts payable 2,587,351$ 3,923,802$ 73,639$ 381,744$ 2,295,711$ 3,425$
Accrued salaries and employee payroll taxes 105 116 - - - -
Sales tax payable - 19,573 - 158 - - Other liabilities - - - - - - Due to other funds - - - 435,344 - - Reimbursable facility fees - - - - - 6,634,594
Escrow and other deposits payable from
restricted assets 1,865,709 - 369,621 - - -
Due to other governmental agencies - - - - 14,059 -
Total liabilities 4,453,165 3,943,491 443,260 817,246 2,309,770 6,638,019
DEFERRED INFLOWS OF RESOURCES
Unearned revenues 113,714 - - 27,062 4,057,337 - Assessments receivable 452,405 - - - - - Prepaid assessments - - 6,580 - - - Total deferred inflows of resources 566,119 - 6,580 27,062 4,057,337 -
FUND BALANCES
Nonspendable:
Assets held for resale - - - - - - Assigned:
Subsequent year's appropriation 11,633,703 5,627,711 4,038,023 6,264,805 - - City projects 11,522,330 - - 5,937,138 10,777,611 5,438,362
Total fund balances 23,156,033 5,627,711 4,038,023 12,201,943 10,777,611 5,438,362
Total liabilities, deferred inflows of resources
and fund balances 28,175,317$ 9,571,202$ 4,487,863$ 13,046,251$ 17,144,718$ 12,076,381$
86
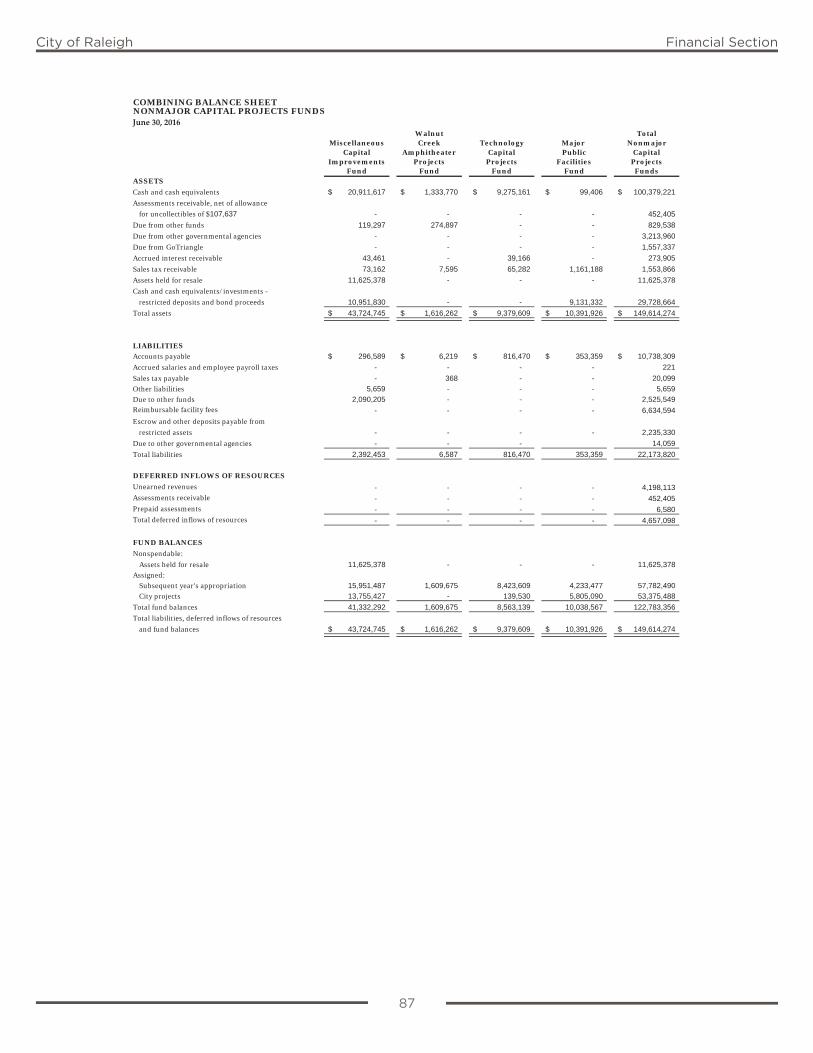
87
City of Raleigh Financial Section
COMBINING BALANCE SHEETNONMAJOR CAPITAL PROJECTS FUNDSJune 30, 2016
Walnut TotalMiscellaneous Creek Technology Major Nonmajor
Capital Amphitheater Capital Public CapitalImprovements Projects Projects Facilities Projects
Fund Fund Fund Fund FundsASSETS
Cash and cash equivalents 20,911,617$ 1,333,770$ 9,275,161$ 99,406$ 100,379,221$
Assessments receivable, net of allowance
for uncollectibles of $107,637 - - - - 452,405
Due from other funds 119,297 274,897 - - 829,538
Due from other governmental agencies - - - - 3,213,960
Due from GoTriangle - - - - 1,557,337
Accrued interest receivable 43,461 - 39,166 - 273,905
Sales tax receivable 73,162 7,595 65,282 1,161,188 1,553,866
Assets held for resale 11,625,378 - - - 11,625,378
Cash and cash equivalents/investments -
restricted deposits and bond proceeds 10,951,830 - - 9,131,332 29,728,664
Total assets 43,724,745$ 1,616,262$ 9,379,609$ 10,391,926$ 149,614,274$
LIABILITIESAccounts payable 296,589$ 6,219$ 816,470$ 353,359$ 10,738,309$
Accrued salaries and employee payroll taxes - - - - 221
Sales tax payable - 368 - - 20,099
Other liabilities 5,659 - - - 5,659
Due to other funds 2,090,205 - - - 2,525,549 Reimbursable facility fees - - - - 6,634,594
Escrow and other deposits payable from
restricted assets - - - - 2,235,330
Due to other governmental agencies - - - 14,059
Total liabilities 2,392,453 6,587 816,470 353,359 22,173,820
DEFERRED INFLOWS OF RESOURCES
Unearned revenues - - - - 4,198,113 Assessments receivable - - - - 452,405 Prepaid assessments - - - - 6,580 Total deferred inflows of resources - - - - 4,657,098
FUND BALANCES
Nonspendable:
Assets held for resale 11,625,378 - - - 11,625,378
Assigned:Subsequent year's appropriation 15,951,487 1,609,675 8,423,609 4,233,477 57,782,490
City projects 13,755,427 - 139,530 5,805,090 53,375,488
Total fund balances 41,332,292 1,609,675 8,563,139 10,038,567 122,783,356
Total liabilities, deferred inflows of resources
and fund balances 43,724,745$ 1,616,262$ 9,379,609$ 10,391,926$ 149,614,274$
87
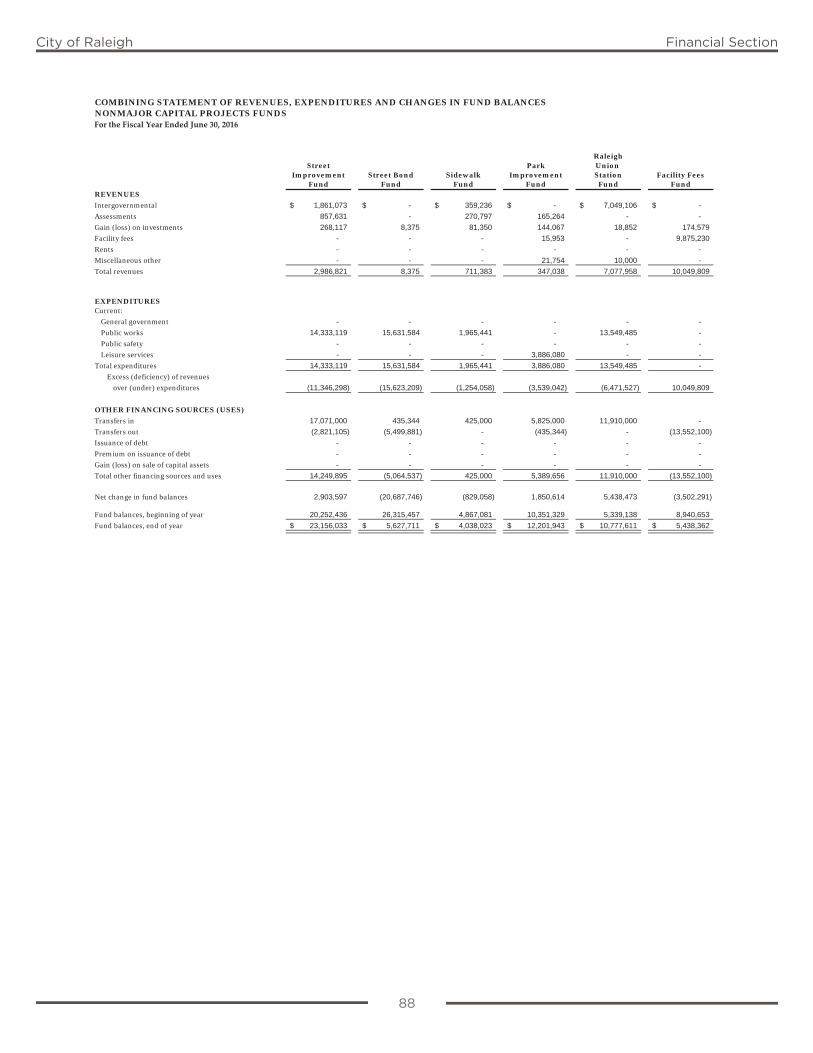
88
City of Raleigh Financial Section
COMBINING STATEMENT OF REVENUES, EXPENDITURES AND CHANGES IN FUND BALANCESNONMAJOR CAPITAL PROJECTS FUNDSFor the Fiscal Year Ended June 30, 2016
RaleighStreet Park Union
Improvement Street Bond Sidewalk Improvement Station Facility FeesFund Fund Fund Fund Fund Fund
REVENUES
Intergovernmental 1,861,073$ -$ 359,236$ -$ 7,049,106$ -$
Assessments 857,631 - 270,797 165,264 - -
Gain (loss) on investments 268,117 8,375 81,350 144,067 18,852 174,579
Facility fees - - - 15,953 - 9,875,230
Rents - - - - - -
Miscellaneous other - - - 21,754 10,000 -
Total revenues 2,986,821 8,375 711,383 347,038 7,077,958 10,049,809
EXPENDITURESCurrent:
General government - - - - - -
Public works 14,333,119 15,631,584 1,965,441 - 13,549,485 -
Public safety - - - - - -
Leisure services - - - 3,886,080 - -
Total expenditures 14,333,119 15,631,584 1,965,441 3,886,080 13,549,485 -
Excess (deficiency) of revenues
over (under) expenditures (11,346,298) (15,623,209) (1,254,058) (3,539,042) (6,471,527) 10,049,809
OTHER FINANCING SOURCES (USES)
Transfers in 17,071,000 435,344 425,000 5,825,000 11,910,000 -
Transfers out (2,821,105) (5,499,881) - (435,344) - (13,552,100)
Issuance of debt - - - - - -
Premium on issuance of debt - - - - - -
Gain (loss) on sale of capital assets - - - - - -
Total other financing sources and uses 14,249,895 (5,064,537) 425,000 5,389,656 11,910,000 (13,552,100)
Net change in fund balances 2,903,597 (20,687,746) (829,058) 1,850,614 5,438,473 (3,502,291)
Fund balances, beginning of year 20,252,436 26,315,457 4,867,081 10,351,329 5,339,138 8,940,653
Fund balances, end of year 23,156,033$ 5,627,711$ 4,038,023$ 12,201,943$ 10,777,611$ 5,438,362$
88
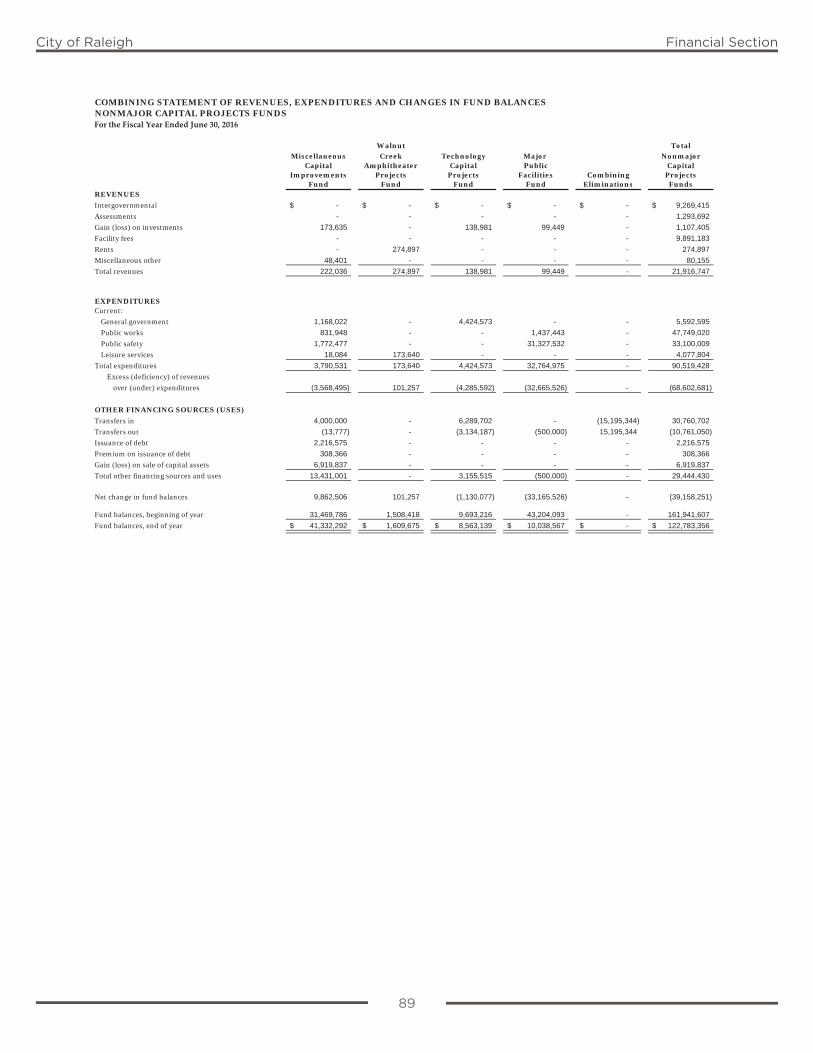
89
City of Raleigh Financial Section
COMBINING STATEMENT OF REVENUES, EXPENDITURES AND CHANGES IN FUND BALANCESNONMAJOR CAPITAL PROJECTS FUNDSFor the Fiscal Year Ended June 30, 2016
Walnut TotalMiscellaneous Creek Technology Major Nonmajor
Capital Amphitheater Capital Public CapitalImprovements Projects Projects Facilities Combining Projects
Fund Fund Fund Fund Eliminations FundsREVENUES
Intergovernmental -$ -$ -$ -$ -$ 9,269,415$
Assessments - - - - - 1,293,692
Gain (loss) on investments 173,635 - 138,981 99,449 - 1,107,405
Facility fees - - - - - 9,891,183
Rents - 274,897 - - - 274,897
Miscellaneous other 48,401 - - - - 80,155
Total revenues 222,036 274,897 138,981 99,449 - 21,916,747
EXPENDITURESCurrent:
General government 1,168,022 - 4,424,573 - - 5,592,595
Public works 831,948 - - 1,437,443 - 47,749,020
Public safety 1,772,477 - - 31,327,532 - 33,100,009
Leisure services 18,084 173,640 - - - 4,077,804
Total expenditures 3,790,531 173,640 4,424,573 32,764,975 - 90,519,428
Excess (deficiency) of revenues
over (under) expenditures (3,568,495) 101,257 (4,285,592) (32,665,526) - (68,602,681)
OTHER FINANCING SOURCES (USES)
Transfers in 4,000,000 - 6,289,702 - (15,195,344) 30,760,702
Transfers out (13,777) - (3,134,187) (500,000) 15,195,344 (10,761,050)
Issuance of debt 2,216,575 - - - - 2,216,575
Premium on issuance of debt 308,366 - - - - 308,366
Gain (loss) on sale of capital assets 6,919,837 - - - - 6,919,837
Total other financing sources and uses 13,431,001 - 3,155,515 (500,000) - 29,444,430
Net change in fund balances 9,862,506 101,257 (1,130,077) (33,165,526) - (39,158,251)
Fund balances, beginning of year 31,469,786 1,508,418 9,693,216 43,204,093 - 161,941,607
Fund balances, end of year 41,332,292$ 1,609,675$ 8,563,139$ 10,038,567$ -$ 122,783,356$
89
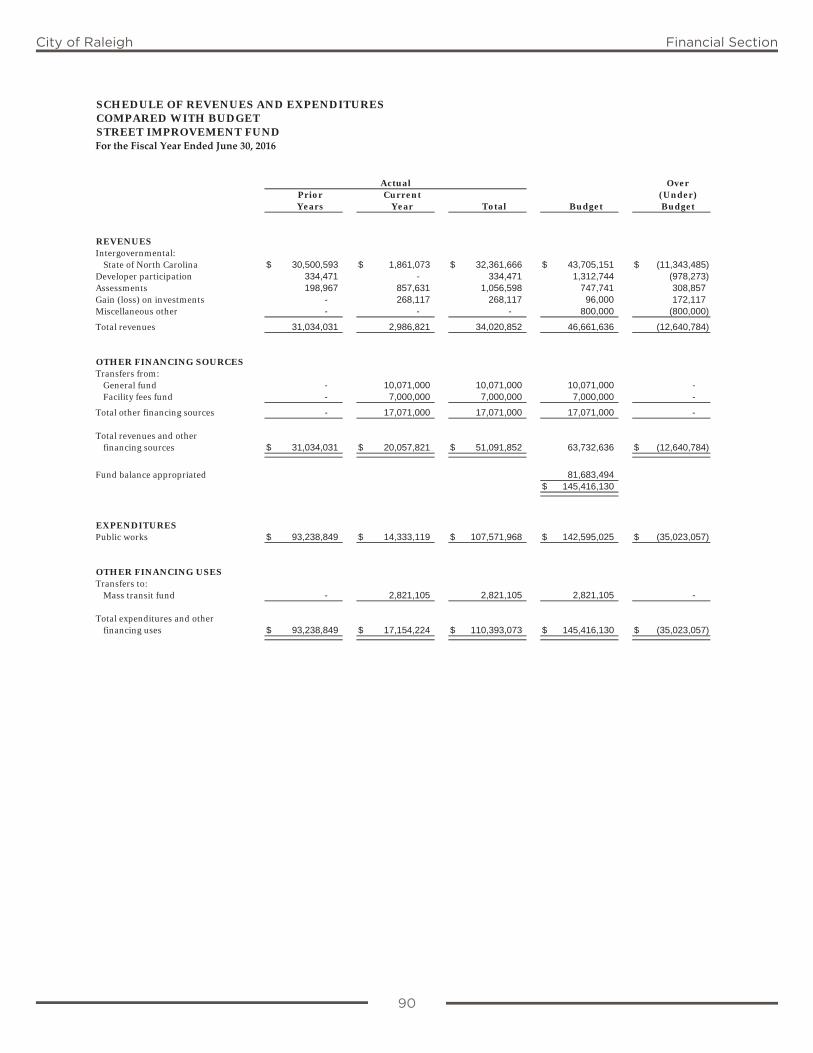
90
City of Raleigh Financial Section
SCHEDULE OF REVENUES AND EXPENDITURES COMPARED WITH BUDGETSTREET IMPROVEMENT FUNDFor the Fiscal Year Ended June 30, 2016
OverPrior Current (Under)Years Year Total Budget Budget
REVENUESIntergovernmental:
State of North Carolina $ 30,500,593 $ 1,861,073 $ 32,361,666 $ 43,705,151 $ (11,343,485)Developer participation 334,471 - 334,471 1,312,744 (978,273) Assessments 198,967 857,631 1,056,598 747,741 308,857 Gain (loss) on investments - 268,117 268,117 96,000 172,117 Miscellaneous other - - - 800,000 (800,000)
Total revenues 31,034,031 2,986,821 34,020,852 46,661,636 (12,640,784)
OTHER FINANCING SOURCESTransfers from:
General fund - 10,071,000 10,071,000 10,071,000 - Facility fees fund - 7,000,000 7,000,000 7,000,000 -
Total other financing sources - 17,071,000 17,071,000 17,071,000 -
Total revenues and other financing sources $ 31,034,031 $ 20,057,821 $ 51,091,852 63,732,636 $ (12,640,784)
Fund balance appropriated 81,683,494 $ 145,416,130
EXPENDITURESPublic works $ 93,238,849 $ 14,333,119 $ 107,571,968 $ 142,595,025 $ (35,023,057)
OTHER FINANCING USESTransfers to:
Mass transit fund - 2,821,105 2,821,105 2,821,105 -
Total expenditures and otherfinancing uses $ 93,238,849 $ 17,154,224 $ 110,393,073 $ 145,416,130 $ (35,023,057)
Actual
90
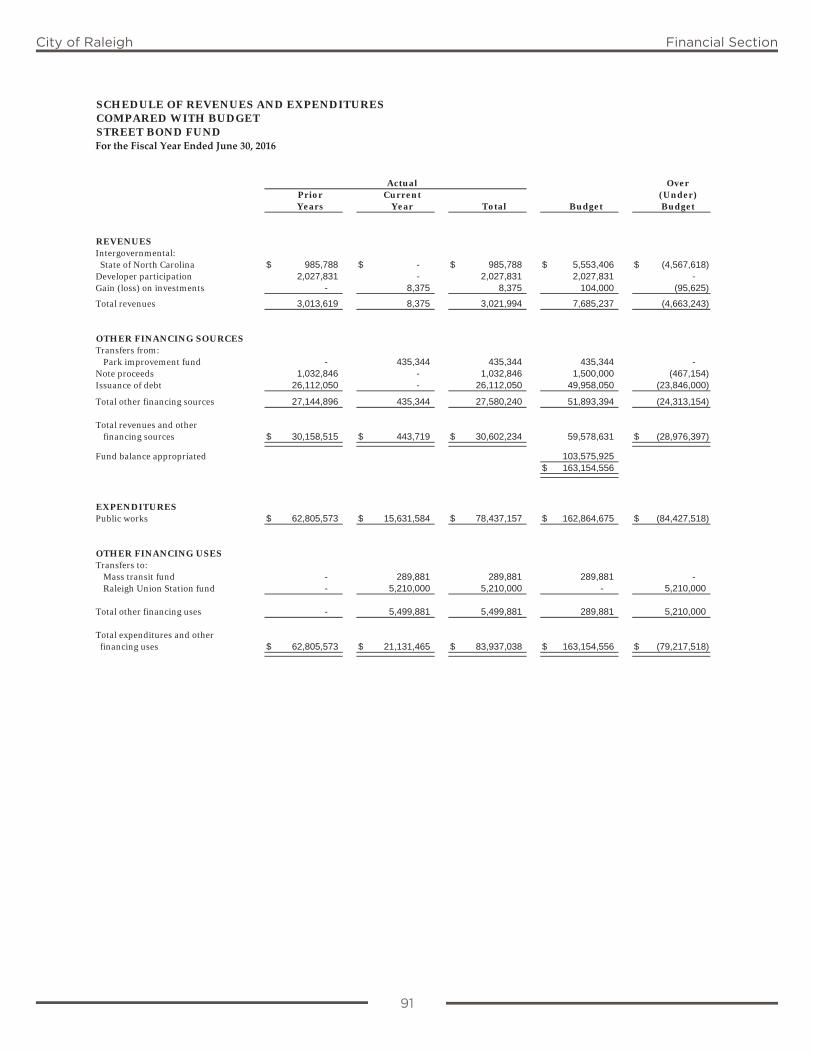
91
City of Raleigh Financial Section
SCHEDULE OF REVENUES AND EXPENDITURES COMPARED WITH BUDGETSTREET BOND FUNDFor the Fiscal Year Ended June 30, 2016
OverPrior Current (Under)Years Year Total Budget Budget
REVENUESIntergovernmental: State of North Carolina $ 985,788 $ - $ 985,788 $ 5,553,406 $ (4,567,618) Developer participation 2,027,831 - 2,027,831 2,027,831 - Gain (loss) on investments - 8,375 8,375 104,000 (95,625)
Total revenues 3,013,619 8,375 3,021,994 7,685,237 (4,663,243)
OTHER FINANCING SOURCESTransfers from:
Park improvement fund - 435,344 435,344 435,344 - Note proceeds 1,032,846 - 1,032,846 1,500,000 (467,154) Issuance of debt 26,112,050 - 26,112,050 49,958,050 (23,846,000)
Total other financing sources 27,144,896 435,344 27,580,240 51,893,394 (24,313,154)
Total revenues and other financing sources $ 30,158,515 $ 443,719 $ 30,602,234 59,578,631 $ (28,976,397)
Fund balance appropriated 103,575,925$ 163,154,556
EXPENDITURESPublic works $ 62,805,573 $ 15,631,584 $ 78,437,157 $ 162,864,675 $ (84,427,518)
OTHER FINANCING USESTransfers to:
Mass transit fund - 289,881 289,881 289,881 - Raleigh Union Station fund - 5,210,000 5,210,000 - 5,210,000
Total other financing uses - 5,499,881 5,499,881 289,881 5,210,000
Total expenditures and other financing uses $ 62,805,573 $ 21,131,465 $ 83,937,038 $ 163,154,556 $ (79,217,518)
Actual
91
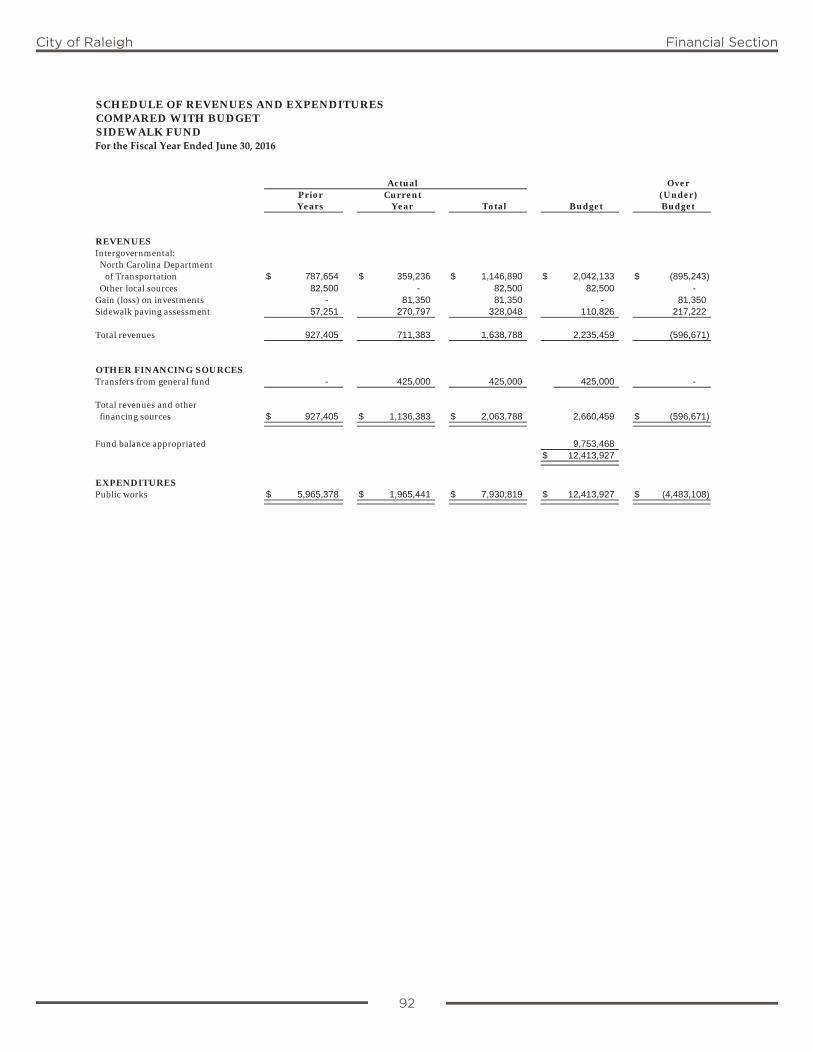
92
City of Raleigh Financial Section
SCHEDULE OF REVENUES AND EXPENDITURES COMPARED WITH BUDGETSIDEWALK FUNDFor the Fiscal Year Ended June 30, 2016
OverPrior Current (Under)Years Year Total Budget Budget
REVENUESIntergovernmental: North Carolina Department
of Transportation $ 787,654 $ 359,236 $ 1,146,890 $ 2,042,133 $ (895,243) Other local sources 82,500 - 82,500 82,500 - Gain (loss) on investments - 81,350 81,350 - 81,350 Sidewalk paving assessment 57,251 270,797 328,048 110,826 217,222
Total revenues 927,405 711,383 1,638,788 2,235,459 (596,671)
OTHER FINANCING SOURCESTransfers from general fund - 425,000 425,000 425,000 -
Total revenues and other financing sources $ 927,405 $ 1,136,383 $ 2,063,788 2,660,459 $ (596,671)
Fund balance appropriated 9,753,468 $ 12,413,927
EXPENDITURESPublic works $ 5,965,378 $ 1,965,441 $ 7,930,819 $ 12,413,927 $ (4,483,108)
Actual
92
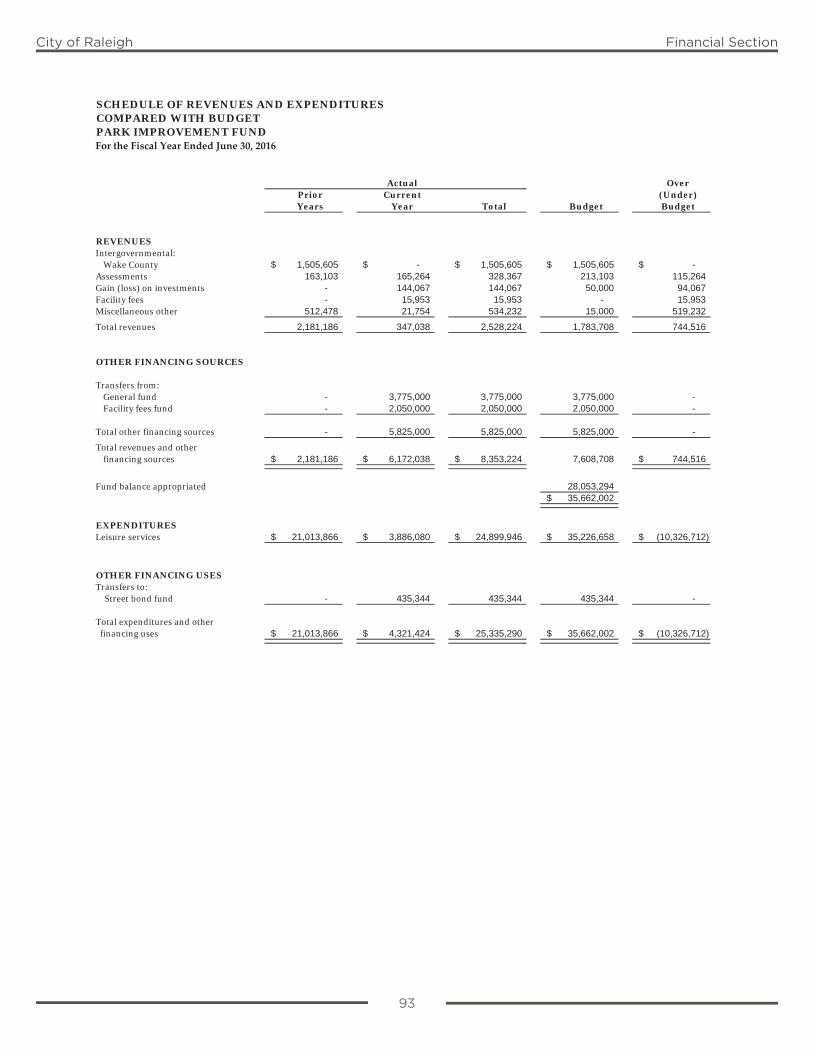
93
City of Raleigh Financial Section
SCHEDULE OF REVENUES AND EXPENDITURES COMPARED WITH BUDGETPARK IMPROVEMENT FUNDFor the Fiscal Year Ended June 30, 2016
OverPrior Current (Under)Years Year Total Budget Budget
REVENUESIntergovernmental:
Wake County $ 1,505,605 $ - $ 1,505,605 $ 1,505,605 $ - Assessments 163,103 165,264 328,367 213,103 115,264 Gain (loss) on investments - 144,067 144,067 50,000 94,067 Facility fees - 15,953 15,953 - 15,953 Miscellaneous other 512,478 21,754 534,232 15,000 519,232
Total revenues 2,181,186 347,038 2,528,224 1,783,708 744,516
OTHER FINANCING SOURCES
Transfers from:General fund - 3,775,000 3,775,000 3,775,000 - Facility fees fund - 2,050,000 2,050,000 2,050,000 -
Total other financing sources - 5,825,000 5,825,000 5,825,000 -
Total revenues and other financing sources $ 2,181,186 $ 6,172,038 $ 8,353,224 7,608,708 $ 744,516
Fund balance appropriated 28,053,294 $ 35,662,002
EXPENDITURESLeisure services $ 21,013,866 $ 3,886,080 $ 24,899,946 $ 35,226,658 $ (10,326,712)
OTHER FINANCING USESTransfers to: Street bond fund - 435,344 435,344 435,344 -
Total expenditures and other financing uses $ 21,013,866 $ 4,321,424 $ 25,335,290 $ 35,662,002 $ (10,326,712)
Actual
93
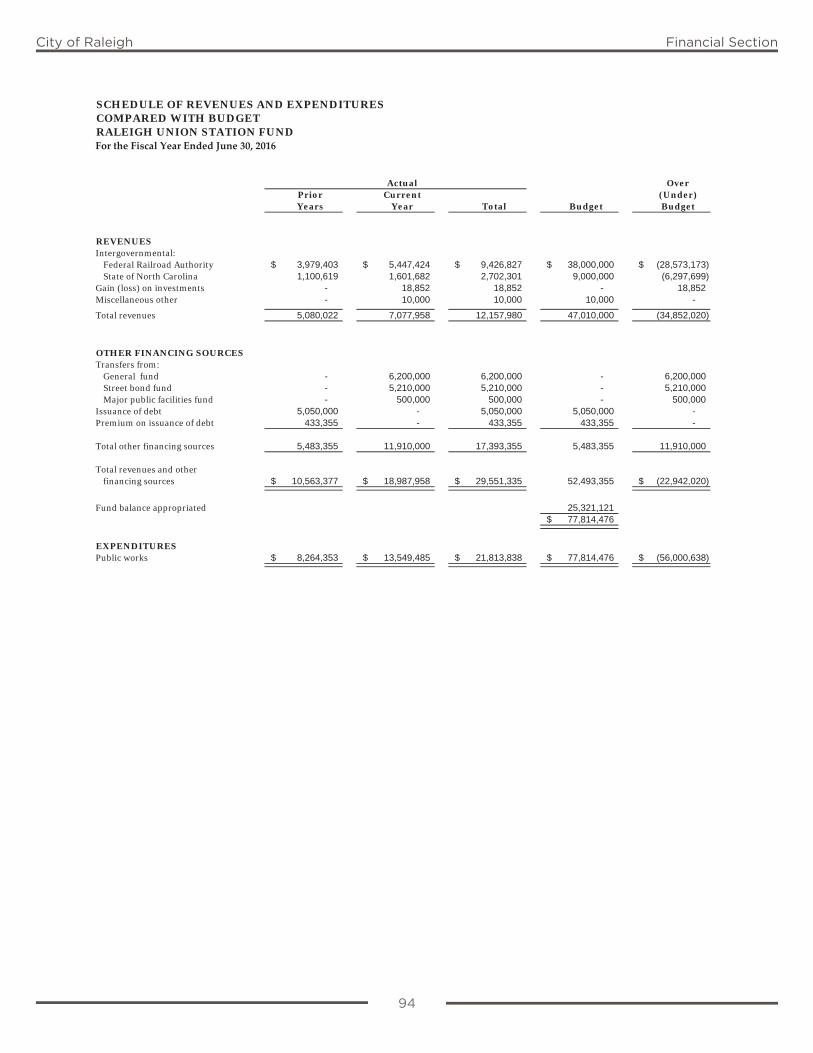
94
City of Raleigh Financial Section
SCHEDULE OF REVENUES AND EXPENDITURES COMPARED WITH BUDGETRALEIGH UNION STATION FUNDFor the Fiscal Year Ended June 30, 2016
OverPrior Current (Under)Years Year Total Budget Budget
REVENUESIntergovernmental:
Federal Railroad Authority $ 3,979,403 $ 5,447,424 $ 9,426,827 $ 38,000,000 $ (28,573,173)State of North Carolina 1,100,619 1,601,682 2,702,301 9,000,000 (6,297,699)
Gain (loss) on investments - 18,852 18,852 - 18,852 Miscellaneous other - 10,000 10,000 10,000 -
Total revenues 5,080,022 7,077,958 12,157,980 47,010,000 (34,852,020)
OTHER FINANCING SOURCESTransfers from:
General fund - 6,200,000 6,200,000 - 6,200,000 Street bond fund - 5,210,000 5,210,000 - 5,210,000 Major public facilities fund - 500,000 500,000 - 500,000
Issuance of debt 5,050,000 - 5,050,000 5,050,000 - Premium on issuance of debt 433,355 - 433,355 433,355 -
Total other financing sources 5,483,355 11,910,000 17,393,355 5,483,355 11,910,000
Total revenues and other financing sources $ 10,563,377 $ 18,987,958 $ 29,551,335 52,493,355 $ (22,942,020)
Fund balance appropriated 25,321,121 $ 77,814,476
EXPENDITURESPublic works $ 8,264,353 $ 13,549,485 $ 21,813,838 $ 77,814,476 $ (56,000,638)
Actual
94
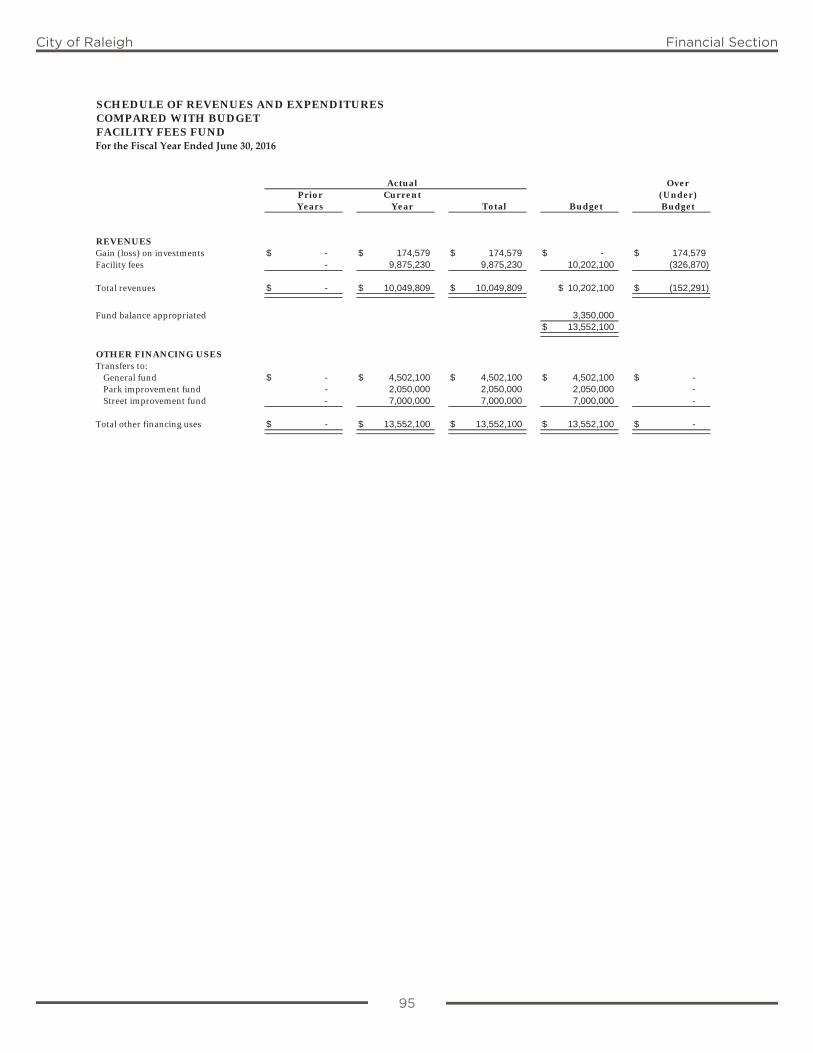
95
City of Raleigh Financial Section
SCHEDULE OF REVENUES AND EXPENDITURES COMPARED WITH BUDGETFACILITY FEES FUNDFor the Fiscal Year Ended June 30, 2016
OverPrior Current (Under)Years Year Total Budget Budget
REVENUESGain (loss) on investments $ - $ 174,579 $ 174,579 $ - $ 174,579 Facility fees - 9,875,230 9,875,230 10,202,100 (326,870)
Total revenues $ - $ 10,049,809 $ 10,049,809 10,202,100$ $ (152,291)
Fund balance appropriated 3,350,000 $ 13,552,100
OTHER FINANCING USESTransfers to:
General fund $ - $ 4,502,100 $ 4,502,100 $ 4,502,100 $ - Park improvement fund - 2,050,000 2,050,000 2,050,000 - Street improvement fund - 7,000,000 7,000,000 7,000,000 -
Total other financing uses $ - $ 13,552,100 $ 13,552,100 $ 13,552,100 $ -
Actual
95
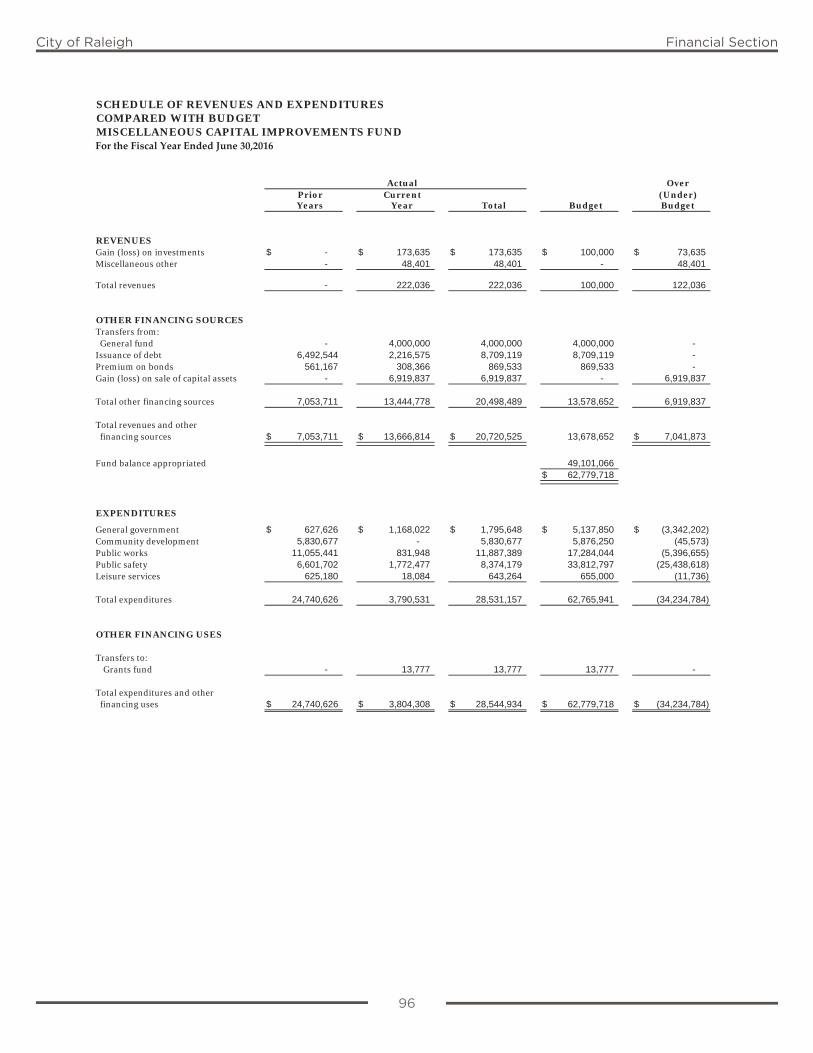
96
City of Raleigh Financial Section
SCHEDULE OF REVENUES AND EXPENDITURES COMPARED WITH BUDGETMISCELLANEOUS CAPITAL IMPROVEMENTS FUNDFor the Fiscal Year Ended June 30,2016
OverPrior Current (Under)Years Year Total Budget Budget
REVENUESGain (loss) on investments $ - $ 173,635 $ 173,635 $ 100,000 $ 73,635 Miscellaneous other - 48,401 48,401 - 48,401
Total revenues - 222,036 222,036 100,000 122,036
OTHER FINANCING SOURCESTransfers from: General fund - 4,000,000 4,000,000 4,000,000 - Issuance of debt 6,492,544 2,216,575 8,709,119 8,709,119 - Premium on bonds 561,167 308,366 869,533 869,533 - Gain (loss) on sale of capital assets - 6,919,837 6,919,837 - 6,919,837
Total other financing sources 7,053,711 13,444,778 20,498,489 13,578,652 6,919,837
Total revenues and other financing sources $ 7,053,711 $ 13,666,814 $ 20,720,525 13,678,652 $ 7,041,873
Fund balance appropriated 49,101,066 $ 62,779,718
EXPENDITURES
General government $ 627,626 $ 1,168,022 $ 1,795,648 $ 5,137,850 $ (3,342,202) Community development 5,830,677 - 5,830,677 5,876,250 (45,573) Public works 11,055,441 831,948 11,887,389 17,284,044 (5,396,655) Public safety 6,601,702 1,772,477 8,374,179 33,812,797 (25,438,618)Leisure services 625,180 18,084 643,264 655,000 (11,736)
Total expenditures 24,740,626 3,790,531 28,531,157 62,765,941 (34,234,784)
OTHER FINANCING USES
Transfers to:Grants fund - 13,777 13,777 13,777 -
Total expenditures and other financing uses $ 24,740,626 $ 3,804,308 $ 28,544,934 $ 62,779,718 $ (34,234,784)
Actual
96
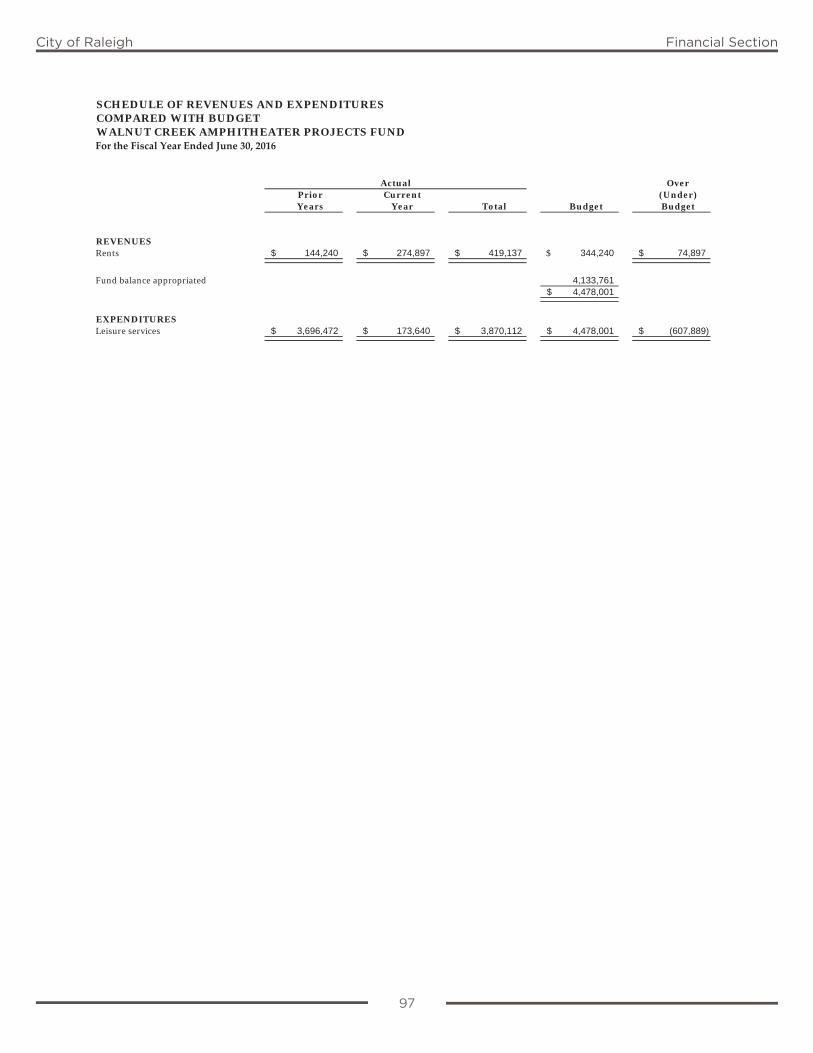
97
City of Raleigh Financial Section
SCHEDULE OF REVENUES AND EXPENDITURES COMPARED WITH BUDGETWALNUT CREEK AMPHITHEATER PROJECTS FUNDFor the Fiscal Year Ended June 30, 2016
OverPrior Current (Under)Years Year Total Budget Budget
REVENUESRents $ 144,240 $ 274,897 $ 419,137 $ 344,240 $ 74,897
Fund balance appropriated 4,133,761 $ 4,478,001
EXPENDITURESLeisure services $ 3,696,472 $ 173,640 $ 3,870,112 $ 4,478,001 $ (607,889)
Actual
97
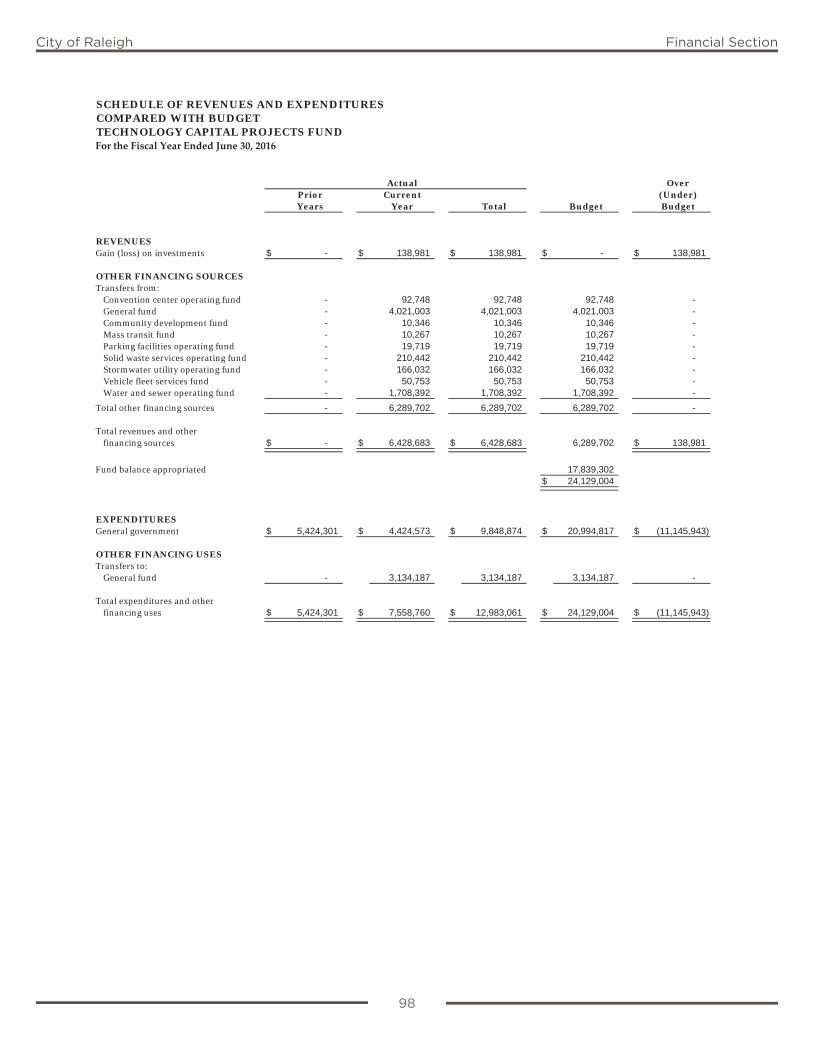
98
City of Raleigh Financial Section
SCHEDULE OF REVENUES AND EXPENDITURES COMPARED WITH BUDGETTECHNOLOGY CAPITAL PROJECTS FUNDFor the Fiscal Year Ended June 30, 2016
OverPrior Current (Under)Years Year Total Budget Budget
REVENUESGain (loss) on investments $ - $ 138,981 $ 138,981 $ - $ 138,981
OTHER FINANCING SOURCESTransfers from:
Convention center operating fund - 92,748 92,748 92,748 - General fund - 4,021,003 4,021,003 4,021,003 - Community development fund - 10,346 10,346 10,346 - Mass transit fund - 10,267 10,267 10,267 - Parking facilities operating fund - 19,719 19,719 19,719 - Solid waste services operating fund - 210,442 210,442 210,442 - Stormwater utility operating fund - 166,032 166,032 166,032 - Vehicle fleet services fund - 50,753 50,753 50,753 - Water and sewer operating fund - 1,708,392 1,708,392 1,708,392 -
Total other financing sources - 6,289,702 6,289,702 6,289,702 -
Total revenues and other financing sources $ - $ 6,428,683 $ 6,428,683 6,289,702 $ 138,981
Fund balance appropriated 17,839,302 $ 24,129,004
EXPENDITURESGeneral government $ 5,424,301 $ 4,424,573 $ 9,848,874 $ 20,994,817 $ (11,145,943)
OTHER FINANCING USESTransfers to:
General fund - 3,134,187 3,134,187 3,134,187 -
Total expenditures and otherfinancing uses $ 5,424,301 $ 7,558,760 $ 12,983,061 $ 24,129,004 $ (11,145,943)
Actual
98
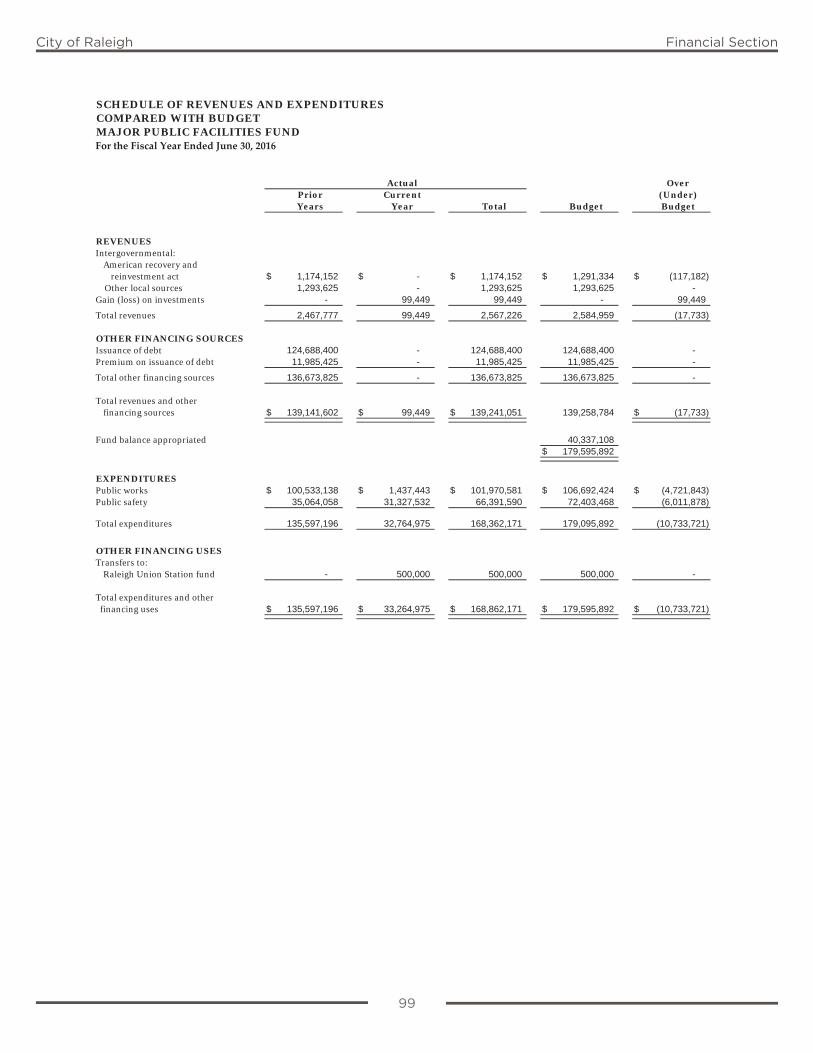
99
City of Raleigh Financial Section
SCHEDULE OF REVENUES AND EXPENDITURES COMPARED WITH BUDGETMAJOR PUBLIC FACILITIES FUNDFor the Fiscal Year Ended June 30, 2016
OverPrior Current (Under)Years Year Total Budget Budget
REVENUESIntergovernmental:
American recovery andreinvestment act $ 1,174,152 $ - $ 1,174,152 $ 1,291,334 $ (117,182)
Other local sources 1,293,625 - 1,293,625 1,293,625 - Gain (loss) on investments - 99,449 99,449 - 99,449
Total revenues 2,467,777 99,449 2,567,226 2,584,959 (17,733)
OTHER FINANCING SOURCESIssuance of debt 124,688,400 - 124,688,400 124,688,400 - Premium on issuance of debt 11,985,425 - 11,985,425 11,985,425 -
Total other financing sources 136,673,825 - 136,673,825 136,673,825 -
Total revenues and other financing sources $ 139,141,602 $ 99,449 $ 139,241,051 139,258,784 $ (17,733)
Fund balance appropriated 40,337,108 $ 179,595,892
EXPENDITURESPublic works $ 100,533,138 $ 1,437,443 $ 101,970,581 $ 106,692,424 $ (4,721,843) Public safety 35,064,058 31,327,532 66,391,590 72,403,468 (6,011,878)
Total expenditures 135,597,196 32,764,975 168,362,171 179,095,892 (10,733,721)
OTHER FINANCING USESTransfers to:
Raleigh Union Station fund - 500,000 500,000 500,000 -
Total expenditures and other financing uses $ 135,597,196 $ 33,264,975 $ 168,862,171 $ 179,595,892 $ (10,733,721)
Actual
99

City of Raleigh Financial Section
City of Raleigh Financial Section
Enterprise FundsEnterprise Funds are a subclassification of the proprietary fund types and are used to account for operations:
(a) that are financed and operated in a manner similar to private business enterprises – where the intent of the governing body is that the costs of providing goods or services to the general public be recovered through user charges; or,
(b) where the governing body has decided that periodic determinations of revenues earned, expenses incurred, and/or net income is appropriate for capital maintenance, public policy, management control, accountability or other purposes.
The City’s enterprise fund operations include water and sewer utility, convention center complex, mass transit, stormwater utility, parking facilities and solid waste services.

City of Raleigh Financial Section

City of Raleigh Financial Section
Enterprise Funds
Water and Sewer Fund (major fund)The Water and Sewer Fund accounts for operating and capital costs associated with the City’s water and sewer operations. This fund combines the Water and Sewer Operating Fund, the Water Capital Projects Fund, the Sewer Capital Projects Fund, the Water and Sewer Revenue Bond Fund.
Convention Center Complex Fund (major fund)The Convention Center Complex Fund accounts for the operating and capital costs at the City’s convention center and performing arts complex. This fund combines the Convention Center and Performing Arts Complex Operating Fund, the Convention Center and Performing Arts Projects Fund and the Convention Center Complex Capital Projects Fund.
Mass Transit Fund (major fund)The Mass Transit Fund accounts for the user charges, fees, federal contributions and all operating costs associated with the operation of the transit system in the City. This fund also accounts for all capital projects financed by transit grant proceeds.
Stormwater Utility Fund (major fund)The Stormwater Utility Fund accounts for operating and capital costs associated with the City’s stormwater management program. This fund combines the Stormwater Utility Operating Fund, the Stormwater Utility Capital Projects Fund, and the Stormwater Utility Bond Fund.
Parking Facilities Fund (major fund)The Parking Facilities Fund accounts for the parking fee charges and all operating costs associated with City-owned off-street and on-street parking facilities. This fund combines the Parking Facilities Operating Fund and the Parking Facilities Capital Projects Fund.
Solid Waste Services Fund (major fund)The Solid Waste Services Fund accounts for operating and capital costs associated with the City’s residential solid waste and recycling program. This fund also accounts for the City’s landfill post closure liability.

City of Raleigh Financial Section
City of Raleigh Financial Section
Schedule of Revenues and Expenditures – Budget (Modified Accrual Basis) and
Actual Enterprise FundsThe following schedules present the results of operations for all individual enterprise funds on the modified accrual basis for comparison to the legally adopted budgets for each fund. For GAAP purposes the individual funds are consolidated into the three funds shown in basic financial statements and the two funds shown in the preceding combining financial statements. A reconciliation of the modified accrual basis to the full accrual basis (per generally accepted accounting principles) follows each schedule or group of schedules.
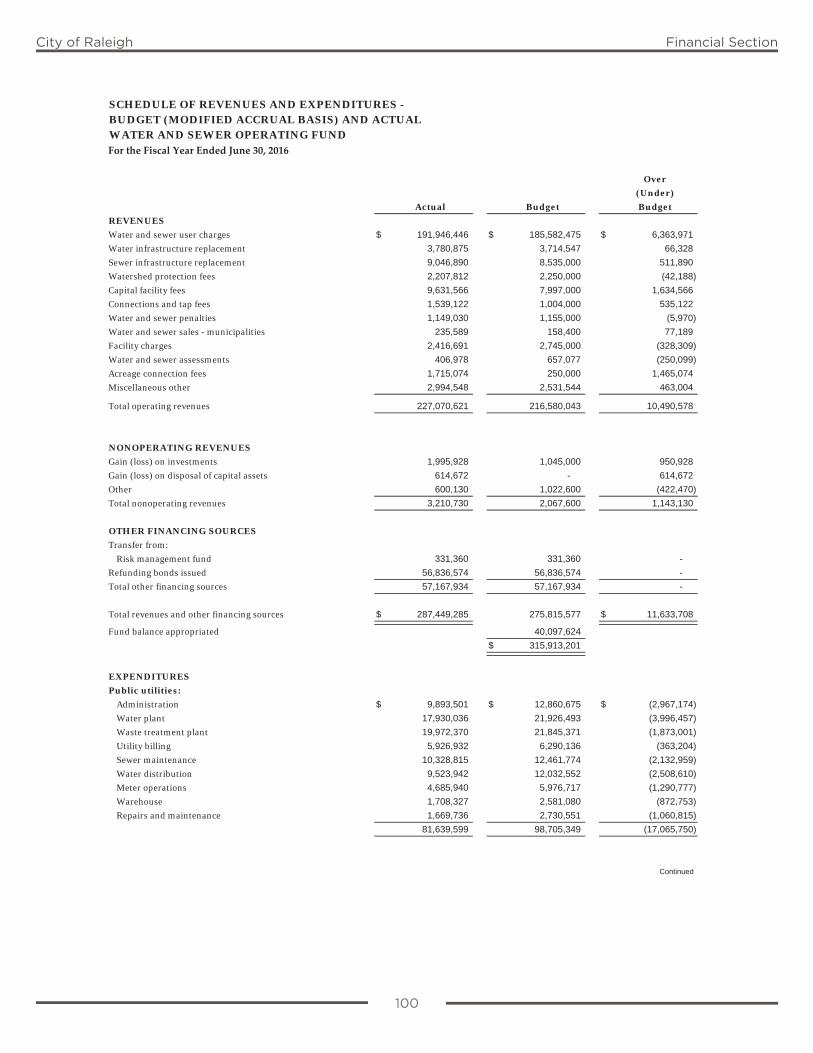
100
City of Raleigh Financial Section
SCHEDULE OF REVENUES AND EXPENDITURES -BUDGET (MODIFIED ACCRUAL BASIS) AND ACTUALWATER AND SEWER OPERATING FUNDFor the Fiscal Year Ended June 30, 2016
Over
(Under)
Actual Budget Budget
REVENUES
Water and sewer user charges $ 191,946,446 $ 185,582,475 $ 6,363,971
Water infrastructure replacement 3,780,875 3,714,547 66,328
Sewer infrastructure replacement 9,046,890 8,535,000 511,890
Watershed protection fees 2,207,812 2,250,000 (42,188)
Capital facility fees 9,631,566 7,997,000 1,634,566
Connections and tap fees 1,539,122 1,004,000 535,122
Water and sewer penalties 1,149,030 1,155,000 (5,970)
Water and sewer sales - municipalities 235,589 158,400 77,189
Facility charges 2,416,691 2,745,000 (328,309)
Water and sewer assessments 406,978 657,077 (250,099)
Acreage connection fees 1,715,074 250,000 1,465,074
Miscellaneous other 2,994,548 2,531,544 463,004
Total operating revenues 227,070,621 216,580,043 10,490,578
NONOPERATING REVENUES
Gain (loss) on investments 1,995,928 1,045,000 950,928
Gain (loss) on disposal of capital assets 614,672 - 614,672
Other 600,130 1,022,600 (422,470)
Total nonoperating revenues 3,210,730 2,067,600 1,143,130
OTHER FINANCING SOURCES
Transfer from:
Risk management fund 331,360 331,360 -
Refunding bonds issued 56,836,574 56,836,574 -
Total other financing sources 57,167,934 57,167,934 -
Total revenues and other financing sources $ 287,449,285 275,815,577 $ 11,633,708
Fund balance appropriated 40,097,624
$ 315,913,201
EXPENDITURES
Public utilities:
Administration $ 9,893,501 $ 12,860,675 $ (2,967,174)
Water plant 17,930,036 21,926,493 (3,996,457)
Waste treatment plant 19,972,370 21,845,371 (1,873,001)
Utility billing 5,926,932 6,290,136 (363,204)
Sewer maintenance 10,328,815 12,461,774 (2,132,959)
Water distribution 9,523,942 12,032,552 (2,508,610)
Meter operations 4,685,940 5,976,717 (1,290,777)
Warehouse 1,708,327 2,581,080 (872,753)
Repairs and maintenance 1,669,736 2,730,551 (1,060,815)
81,639,599 98,705,349 (17,065,750)
Continued
100
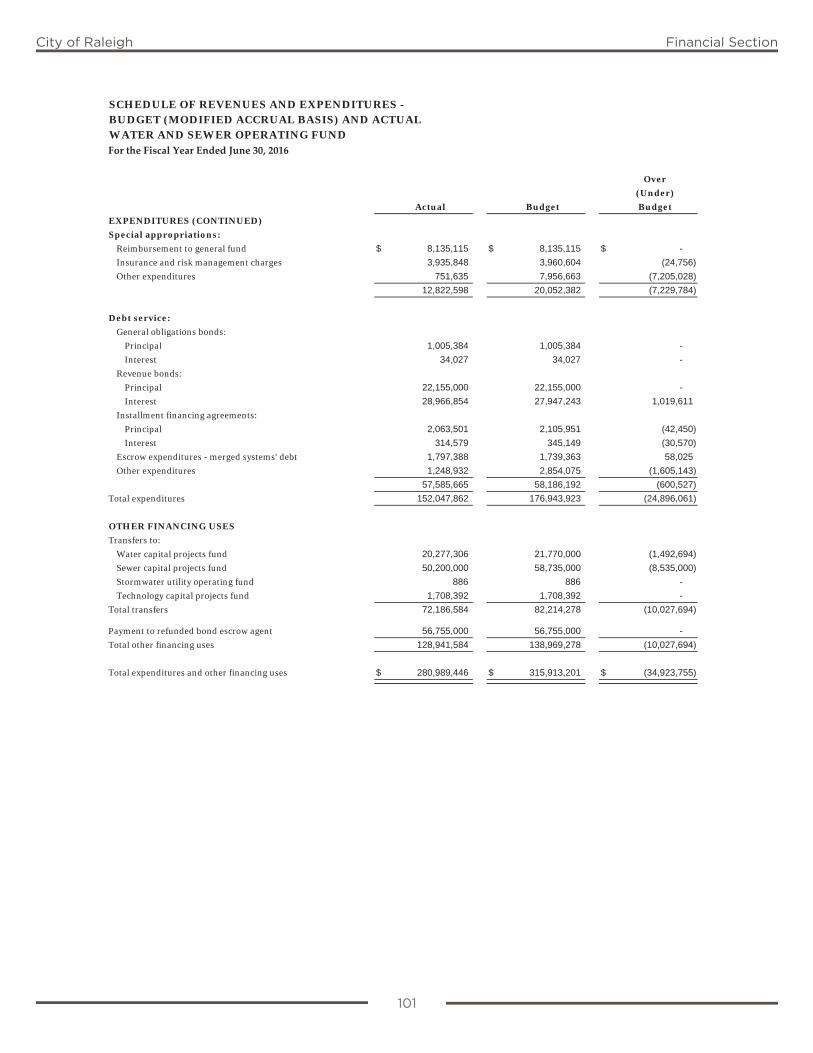
101
City of Raleigh Financial Section
SCHEDULE OF REVENUES AND EXPENDITURES -BUDGET (MODIFIED ACCRUAL BASIS) AND ACTUALWATER AND SEWER OPERATING FUNDFor the Fiscal Year Ended June 30, 2016
Over
(Under)
Actual Budget Budget
EXPENDITURES (CONTINUED)
Special appropriations:
Reimbursement to general fund $ 8,135,115 $ 8,135,115 $ -
Insurance and risk management charges 3,935,848 3,960,604 (24,756)
Other expenditures 751,635 7,956,663 (7,205,028)
12,822,598 20,052,382 (7,229,784)
Debt service:
General obligations bonds:
Principal 1,005,384 1,005,384 -
Interest 34,027 34,027 -
Revenue bonds:
Principal 22,155,000 22,155,000 -
Interest 28,966,854 27,947,243 1,019,611
Installment financing agreements:
Principal 2,063,501 2,105,951 (42,450)
Interest 314,579 345,149 (30,570)
Escrow expenditures - merged systems' debt 1,797,388 1,739,363 58,025
Other expenditures 1,248,932 2,854,075 (1,605,143)
57,585,665 58,186,192 (600,527)
Total expenditures 152,047,862 176,943,923 (24,896,061)
OTHER FINANCING USES
Transfers to:
Water capital projects fund 20,277,306 21,770,000 (1,492,694)
Sewer capital projects fund 50,200,000 58,735,000 (8,535,000)
Stormwater utility operating fund 886 886 -
Technology capital projects fund 1,708,392 1,708,392 -
Total transfers 72,186,584 82,214,278 (10,027,694)
Payment to refunded bond escrow agent 56,755,000 56,755,000 -
Total other financing uses 128,941,584 138,969,278 (10,027,694)
Total expenditures and other financing uses $ 280,989,446 $ 315,913,201 $ (34,923,755)
101
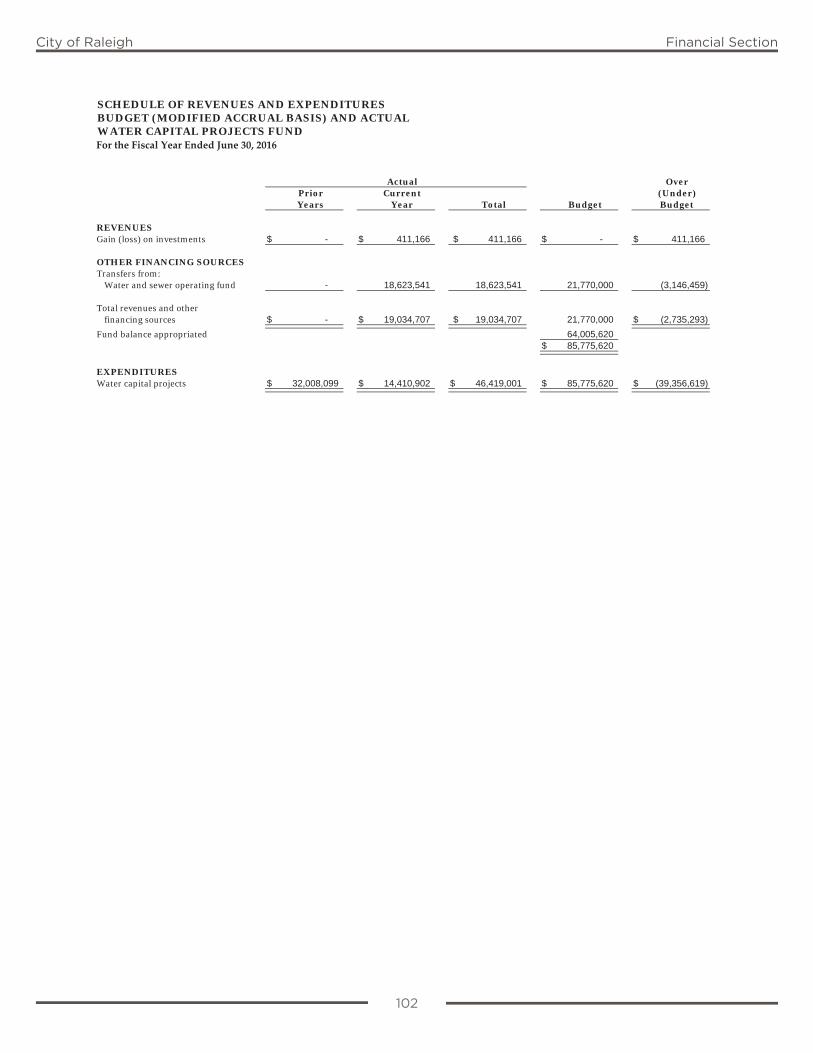
102
City of Raleigh Financial Section
SCHEDULE OF REVENUES AND EXPENDITURESBUDGET (MODIFIED ACCRUAL BASIS) AND ACTUALWATER CAPITAL PROJECTS FUNDFor the Fiscal Year Ended June 30, 2016
OverPrior Current (Under)Years Year Total Budget Budget
REVENUESGain (loss) on investments $ - $ 411,166 $ 411,166 $ - $ 411,166
OTHER FINANCING SOURCESTransfers from:
Water and sewer operating fund - 18,623,541 18,623,541 21,770,000 (3,146,459)
Total revenues and other financing sources $ - $ 19,034,707 $ 19,034,707 21,770,000 $ (2,735,293)
Fund balance appropriated 64,005,620 $ 85,775,620
EXPENDITURESWater capital projects $ 32,008,099 $ 14,410,902 $ 46,419,001 $ 85,775,620 $ (39,356,619)
Actual
102

103
City of Raleigh Financial Section
SCHEDULE OF REVENUES AND EXPENDITURESBUDGET (MODIFIED ACCRUAL BASIS) AND ACTUALSEWER CAPITAL PROJECTS FUNDFor the Fiscal Year Ended June 30, 2016
OverPrior Current (Under)Years Year Total Budget Budget
REVENUESGain (loss) on investments $ - $ 571,541 $ 571,541 $ - $ 571,541
OTHER FINANCING SOURCESTransfers from:
Water and sewer operating fund - 51,853,765 51,853,765 58,735,000 (6,881,235)
Total revenues and otherfinancing sources $ - $ 52,425,306 $ 52,425,306 58,735,000 $ (6,309,694)
Fund balance appropriated 68,433,009$ 127,168,009
EXPENDITURESSewer capital projects $ 23,955,811 $ 12,585,975 $ 36,541,786 $ 127,168,009 $ (90,626,223)
Actual
103
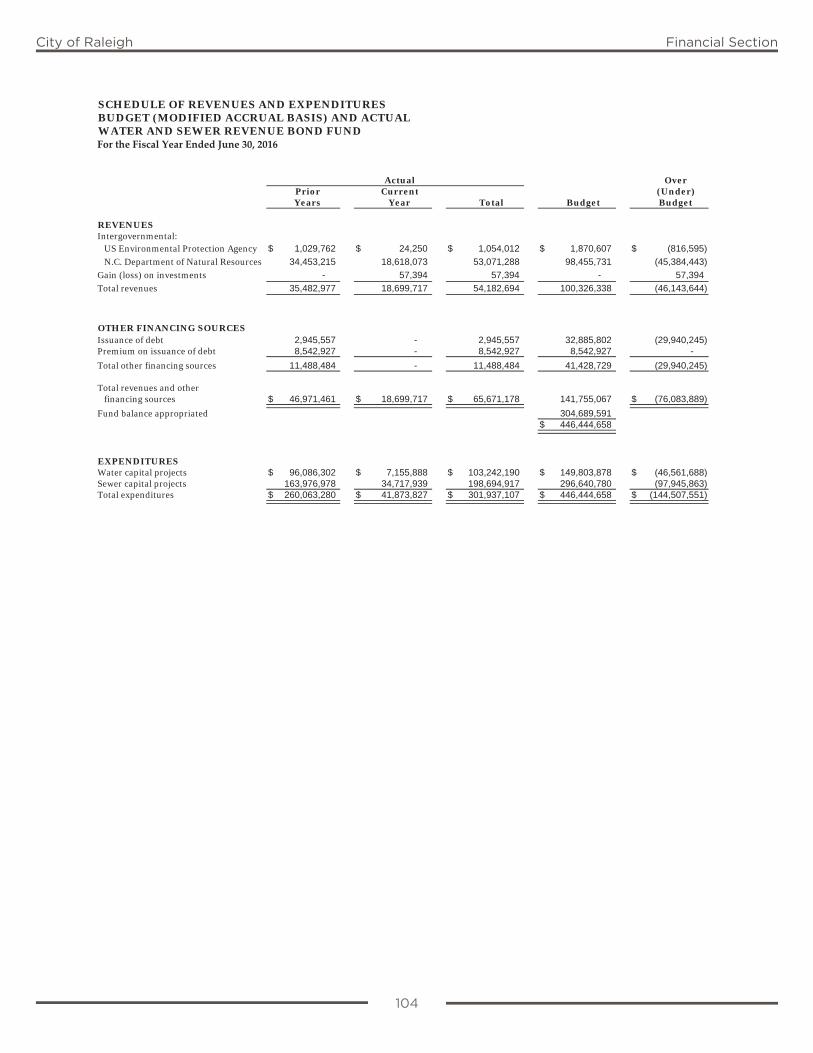
104
City of Raleigh Financial Section
SCHEDULE OF REVENUES AND EXPENDITURESBUDGET (MODIFIED ACCRUAL BASIS) AND ACTUALWATER AND SEWER REVENUE BOND FUNDFor the Fiscal Year Ended June 30, 2016
OverPrior Current (Under)Years Year Total Budget Budget
REVENUESIntergovernmental:
US Environmental Protection Agency $ 1,029,762 $ 24,250 $ 1,054,012 $ 1,870,607 $ (816,595)
N.C. Department of Natural Resources 34,453,215 18,618,073 53,071,288 98,455,731 (45,384,443)
Gain (loss) on investments - 57,394 57,394 - 57,394
Total revenues 35,482,977 18,699,717 54,182,694 100,326,338 (46,143,644)
OTHER FINANCING SOURCESIssuance of debt 2,945,557 - 2,945,557 32,885,802 (29,940,245)Premium on issuance of debt 8,542,927 - 8,542,927 8,542,927 -
Total other financing sources 11,488,484 - 11,488,484 41,428,729 (29,940,245)
Total revenues and otherfinancing sources $ 46,971,461 $ 18,699,717 $ 65,671,178 141,755,067 $ (76,083,889)
Fund balance appropriated 304,689,591$ 446,444,658
EXPENDITURESWater capital projects $ 96,086,302 $ 7,155,888 $ 103,242,190 $ 149,803,878 $ (46,561,688)Sewer capital projects 163,976,978 34,717,939 198,694,917 296,640,780 (97,945,863)Total expenditures $ 260,063,280 $ 41,873,827 $ 301,937,107 $ 446,444,658 $ (144,507,551)
Actual
104
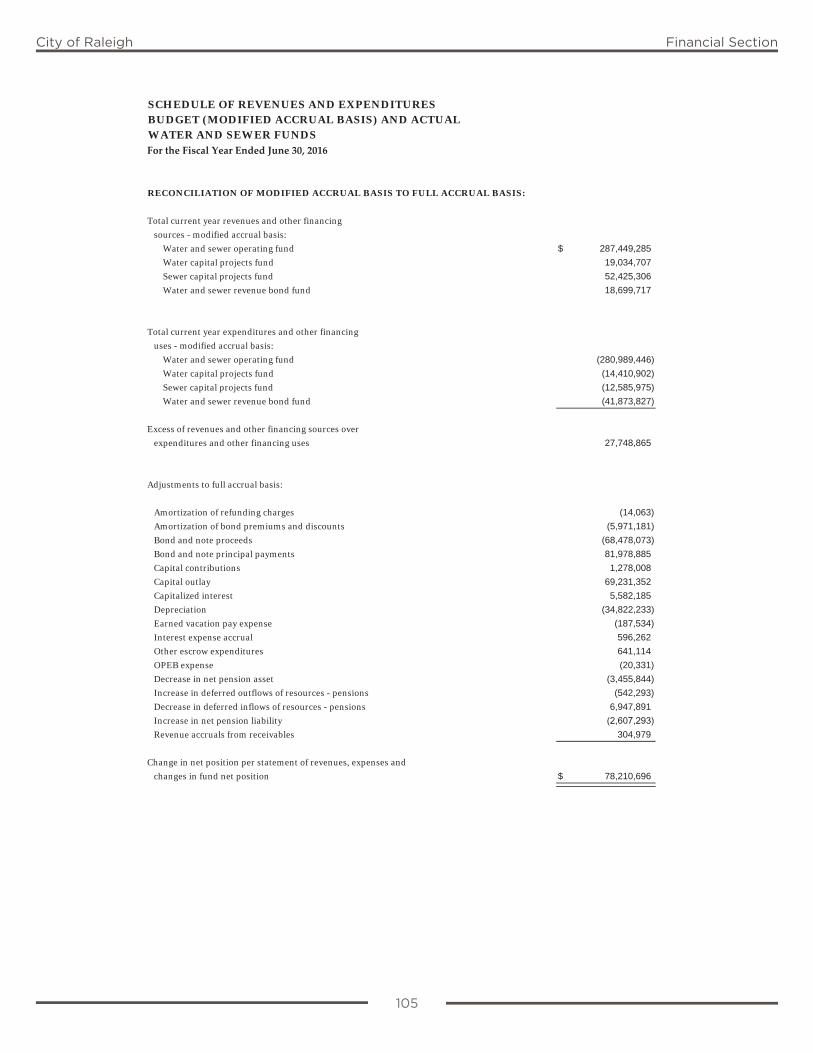
105
City of Raleigh Financial Section
SCHEDULE OF REVENUES AND EXPENDITURES BUDGET (MODIFIED ACCRUAL BASIS) AND ACTUALWATER AND SEWER FUNDSFor the Fiscal Year Ended June 30, 2016
RECONCILIATION OF MODIFIED ACCRUAL BASIS TO FULL ACCRUAL BASIS:
Total current year revenues and other financing
sources - modified accrual basis:
Water and sewer operating fund $ 287,449,285
Water capital projects fund 19,034,707
Sewer capital projects fund 52,425,306
Water and sewer revenue bond fund 18,699,717
Total current year expenditures and other financing
uses - modified accrual basis:
Water and sewer operating fund (280,989,446)
Water capital projects fund (14,410,902)
Sewer capital projects fund (12,585,975)
Water and sewer revenue bond fund (41,873,827)
Excess of revenues and other financing sources over
expenditures and other financing uses 27,748,865
Adjustments to full accrual basis:
Amortization of refunding charges (14,063)
Amortization of bond premiums and discounts (5,971,181)
Bond and note proceeds (68,478,073)
Bond and note principal payments 81,978,885
Capital contributions 1,278,008
Capital outlay 69,231,352
Capitalized interest 5,582,185
Depreciation (34,822,233)
Earned vacation pay expense (187,534)
Interest expense accrual 596,262
Other escrow expenditures 641,114
OPEB expense (20,331)
Decrease in net pension asset (3,455,844)
Increase in deferred outflows of resources - pensions (542,293)
Decrease in deferred inflows of resources - pensions 6,947,891
Increase in net pension liability (2,607,293) Revenue accruals from receivables 304,979
Change in net position per statement of revenues, expenses and
changes in fund net position $ 78,210,696
105

106
City of Raleigh Financial Section
SCHEDULE OF REVENUES AND EXPENDITURES BUDGET (MODIFIED ACCRUAL BASIS) AND ACTUALCONVENTION CENTER AND PERFORMING ARTS COMPLEX OPERATING FUNDFor the Fiscal Year Ended June 30, 2016
Over (Under)
Actual Budget Budget
REVENUESUser charges: Convention and civic center $ 6,166,767 $ 5,446,359 $ 720,408 Performing arts center 5,419,245 6,044,758 (625,513) Red Hat amphitheater 1,908,229 1,993,500 (85,271) Special events 272,277 270,000 2,277 Total user charges 13,766,518 13,754,617 11,901
Gain (loss) on investments 126,096 38,003 88,093 Total revenues 13,892,614 13,792,620 99,994
OTHER FINANCING SOURCESTransfers from: General fund 1,913,948 1,913,948 - Risk management fund 34,880 34,880 - Convention center financing fund 19,782,718 21,407,745 (1,625,027) Refunding bonds issued 8,703,867 8,703,867 -
Total other financing sources 30,435,413 32,060,440 (1,625,027)
Total revenues and other financing sources $ 44,328,027 45,853,060 $ (1,525,033)
Fund balance appropriated 280,295 $ 46,133,355
EXPENDITURESCivic and convention center $ 8,244,079 $ 8,603,040 $ (358,962) Performing arts center 6,750,530 7,377,445 (626,915) Red Hat amphitheater 2,013,117 2,287,131 (274,014) Special events 395,259 479,258 (83,998) Total operating expenditures 17,402,985 18,746,874 (1,343,889)
DEBT SERVICEPrincipal 7,695,000 7,695,000 -Interest 7,928,619 9,139,000 (1,210,381) Payment to refunded bond escrow agent 8,703,867 8,703,867 - Other debt service costs 1,224,883 1,590,920 (366,037) Total debt service 25,552,369 27,128,787 (1,576,418)
OTHER FINANCING USESTransfers to:
General fund 164,946 164,946 - Technology capital projects fund 92,748 92,748 -
Total other financing uses 257,694 257,694 -
Total expenditures and other financing uses $ 43,213,048 $ 46,133,355 $ (2,920,307)
106
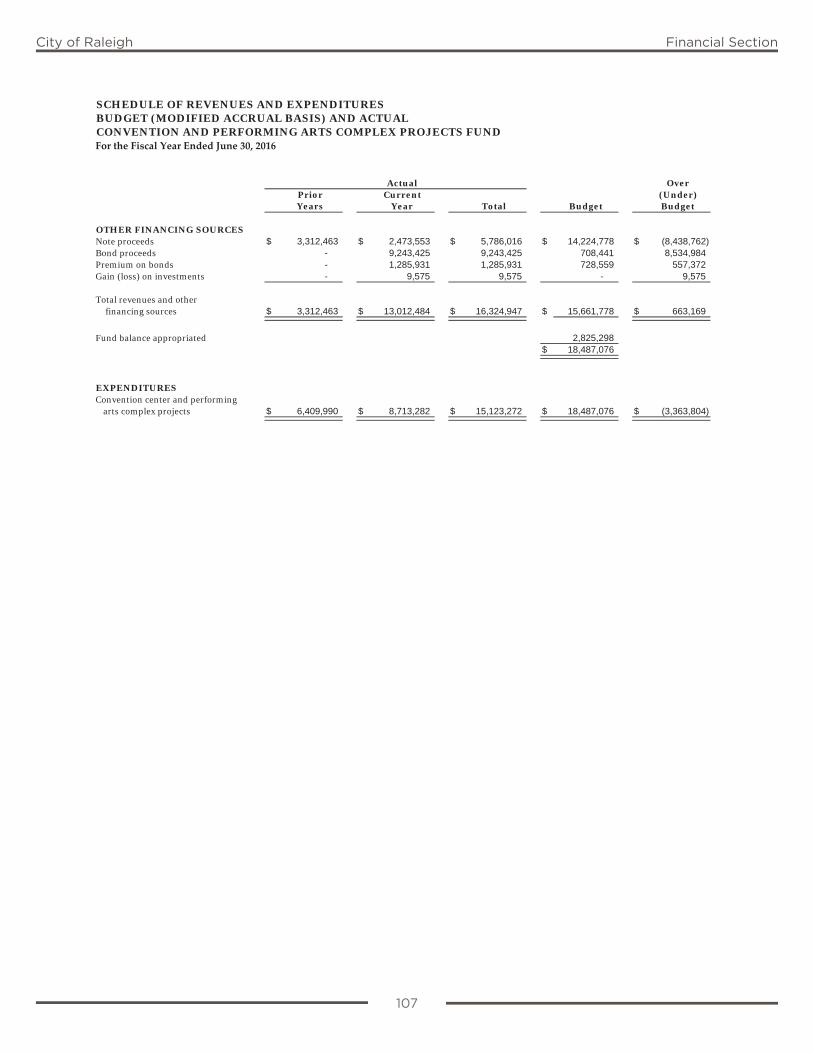
107
City of Raleigh Financial Section
SCHEDULE OF REVENUES AND EXPENDITURESBUDGET (MODIFIED ACCRUAL BASIS) AND ACTUALCONVENTION AND PERFORMING ARTS COMPLEX PROJECTS FUNDFor the Fiscal Year Ended June 30, 2016
OverPrior Current (Under)Years Year Total Budget Budget
OTHER FINANCING SOURCESNote proceeds $ 3,312,463 $ 2,473,553 $ 5,786,016 $ 14,224,778 $ (8,438,762) Bond proceeds - 9,243,425 9,243,425 708,441 8,534,984 Premium on bonds - 1,285,931 1,285,931 728,559 557,372 Gain (loss) on investments - 9,575 9,575 - 9,575
Total revenues and other financing sources $ 3,312,463 $ 13,012,484 $ 16,324,947 $ 15,661,778 $ 663,169
Fund balance appropriated 2,825,298 $ 18,487,076
EXPENDITURESConvention center and performing
arts complex projects $ 6,409,990 $ 8,713,282 $ 15,123,272 $ 18,487,076 $ (3,363,804)
Actual
107
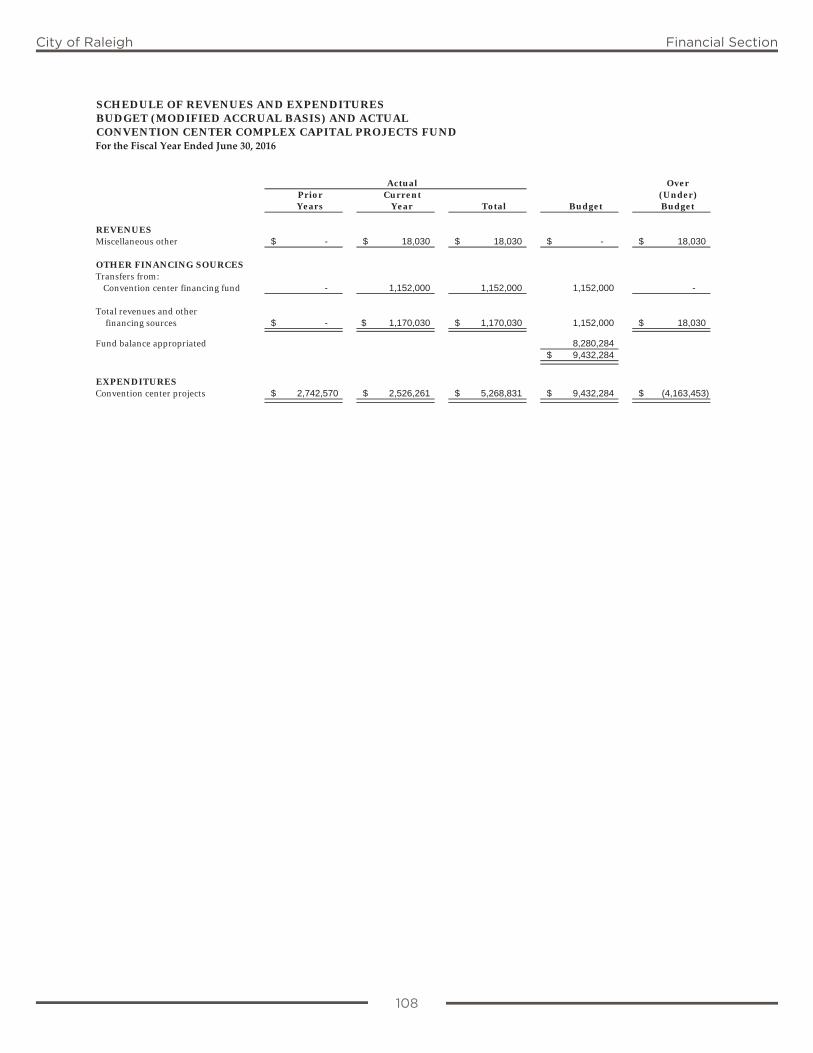
108
City of Raleigh Financial Section
SCHEDULE OF REVENUES AND EXPENDITURESBUDGET (MODIFIED ACCRUAL BASIS) AND ACTUALCONVENTION CENTER COMPLEX CAPITAL PROJECTS FUNDFor the Fiscal Year Ended June 30, 2016
OverPrior Current (Under)Years Year Total Budget Budget
REVENUESMiscellaneous other $ - $ 18,030 $ 18,030 $ - $ 18,030
OTHER FINANCING SOURCESTransfers from:
Convention center financing fund - 1,152,000 1,152,000 1,152,000 -
Total revenues and other financing sources $ - $ 1,170,030 $ 1,170,030 1,152,000 $ 18,030
Fund balance appropriated 8,280,284 $ 9,432,284
EXPENDITURESConvention center projects $ 2,742,570 $ 2,526,261 $ 5,268,831 $ 9,432,284 $ (4,163,453)
Actual
108
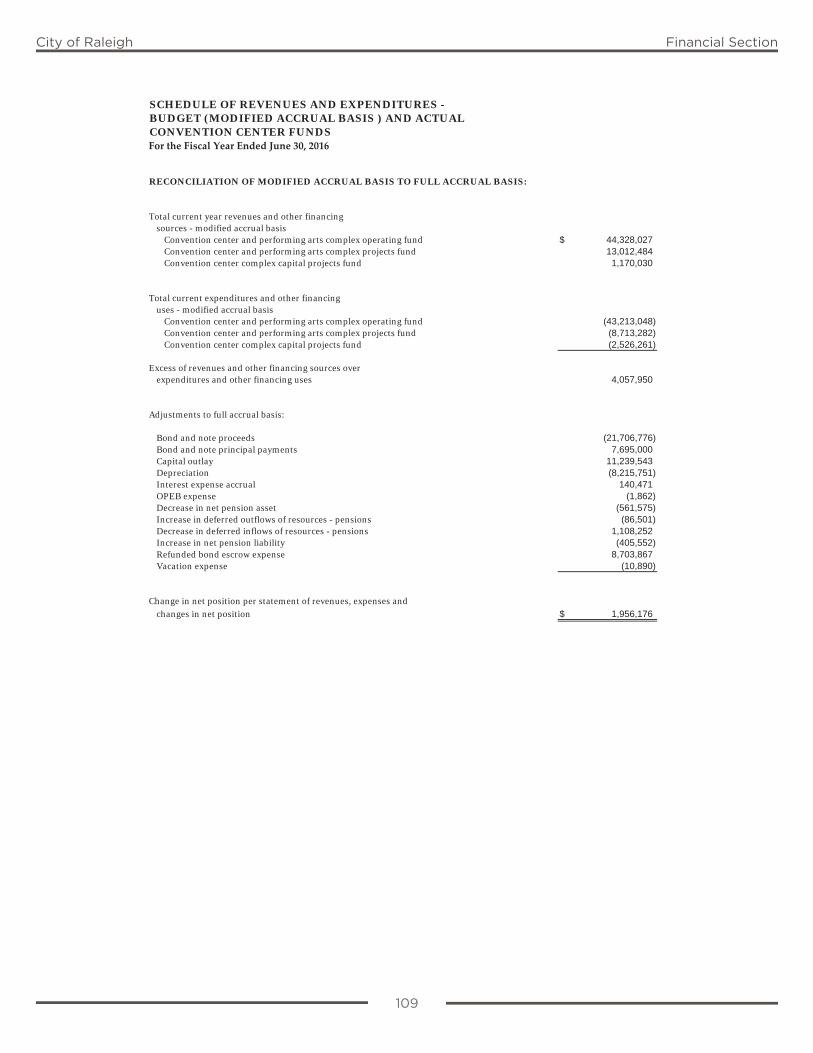
109
City of Raleigh Financial Section
SCHEDULE OF REVENUES AND EXPENDITURES - BUDGET (MODIFIED ACCRUAL BASIS ) AND ACTUALCONVENTION CENTER FUNDS For the Fiscal Year Ended June 30, 2016
RECONCILIATION OF MODIFIED ACCRUAL BASIS TO FULL ACCRUAL BASIS:
Total current year revenues and other financingsources - modified accrual basis
Convention center and performing arts complex operating fund $ 44,328,027Convention center and performing arts complex projects fund 13,012,484 Convention center complex capital projects fund 1,170,030
Total current expenditures and other financing uses - modified accrual basis
Convention center and performing arts complex operating fund (43,213,048)Convention center and performing arts complex projects fund (8,713,282)Convention center complex capital projects fund (2,526,261)
Excess of revenues and other financing sources over expenditures and other financing uses 4,057,950
Adjustments to full accrual basis:
Bond and note proceeds (21,706,776)Bond and note principal payments 7,695,000Capital outlay 11,239,543Depreciation (8,215,751)Interest expense accrual 140,471OPEB expense (1,862)Decrease in net pension asset (561,575)Increase in deferred outflows of resources - pensions (86,501)Decrease in deferred inflows of resources - pensions 1,108,252Increase in net pension liability (405,552)Refunded bond escrow expense 8,703,867Vacation expense (10,890)
Change in net position per statement of revenues, expenses andchanges in net position $ 1,956,176
109

110
City of Raleigh Financial Section
SCHEDULE OF REVENUES AND EXPENDITURESBUDGET (MODIFIED ACCRUAL BASIS) AND ACTUALMASS TRANSIT FUNDFor the Fiscal Year Ended June 30, 2016
OverPrior Current (Under)Years Year Total Budget Budget
REVENUESFarebox $ - $ 6,074,541 $ 6,074,541 $ 6,119,254 $ (44,713) ART program fees - 799,705 799,705 800,000 (295) Intergovernmental revenue: Federal Transit Administration 27,194,959 6,960,915 34,155,874 55,517,732 (21,361,858) State of North Carolina 1,397,543 2,667,409 4,064,952 5,479,719 (1,414,767) Miscellaneous other - 242,984 242,984 130,000 112,984
Total revenues 28,592,502 16,745,554 45,338,056 68,046,705 (22,708,649)
OTHER FINANCING SOURCESProceeds on disposal of capital assets - 467 467 - 467 Transfers from:
General fund - 16,955,836 16,955,836 18,574,238 (1,618,402) Risk management fund - 8,720 8,720 8,720 - Street bond fund - 289,881 289,881 289,881 - Street improvement fund - 2,821,105 2,821,105 2,821,105 -
Total other financing sources - 20,076,009 20,076,009 21,693,944 (1,617,935)
Total revenues and other financing sources $ 28,592,502 $ 36,821,563 $ 65,414,065 89,740,649 $ (24,326,584)
Fund balance appropriated 1,384,471$ 91,125,120
EXPENDITURESMass transit operating expenditures $ - $ 18,706,972 $ 18,706,972 $ 20,793,681 $ (2,086,709) ART program operating expenditures - 7,993,672 7,993,672 8,668,984 (675,312) Capital grant expenditures 34,216,477 8,637,230 42,853,707 61,418,369 (18,564,662)
Total expenditures 34,216,477 35,337,874 69,554,351 90,881,034 (21,326,683)
OTHER FINANCING USESTransfers to:
Grants fund - 230,897 230,897 233,819 (2,922) Technology capital projects fund - 10,267 10,267 10,267 -
Total other financing uses - 241,164 241,164 244,086 (2,922)
Total expenditures and otherfinancing uses $ 34,216,477 $ 35,579,038 $ 69,795,515 $ 91,125,120 $ (21,329,605)
Actual
110
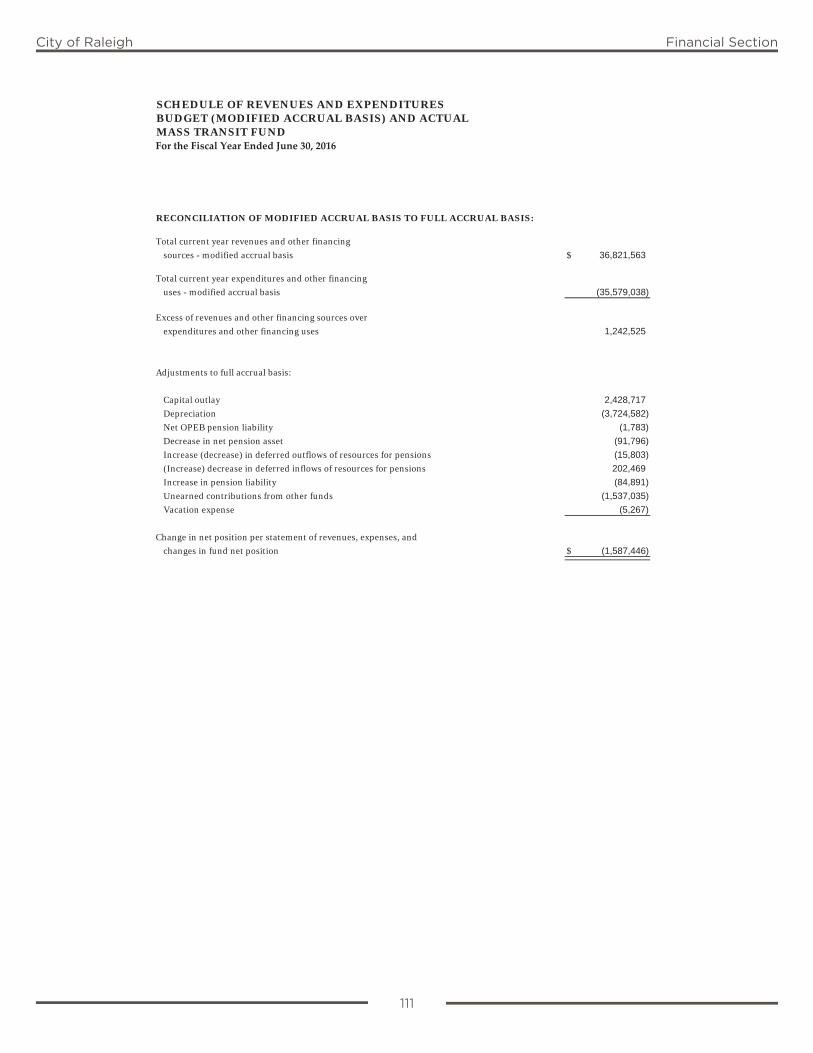
111
City of Raleigh Financial Section
SCHEDULE OF REVENUES AND EXPENDITURES BUDGET (MODIFIED ACCRUAL BASIS) AND ACTUALMASS TRANSIT FUNDFor the Fiscal Year Ended June 30, 2016
RECONCILIATION OF MODIFIED ACCRUAL BASIS TO FULL ACCRUAL BASIS:
Total current year revenues and other financing
sources - modified accrual basis $ 36,821,563
Total current year expenditures and other financing
uses - modified accrual basis (35,579,038)
Excess of revenues and other financing sources over
expenditures and other financing uses 1,242,525
Adjustments to full accrual basis:
Capital outlay 2,428,717
Depreciation (3,724,582)
Net OPEB pension liability (1,783)
Decrease in net pension asset (91,796)
Increase (decrease) in deferred outflows of resources for pensions (15,803)
(Increase) decrease in deferred inflows of resources for pensions 202,469
Increase in pension liability (84,891)
Unearned contributions from other funds (1,537,035)
Vacation expense (5,267)
Change in net position per statement of revenues, expenses, and
changes in fund net position $ (1,587,446)
111
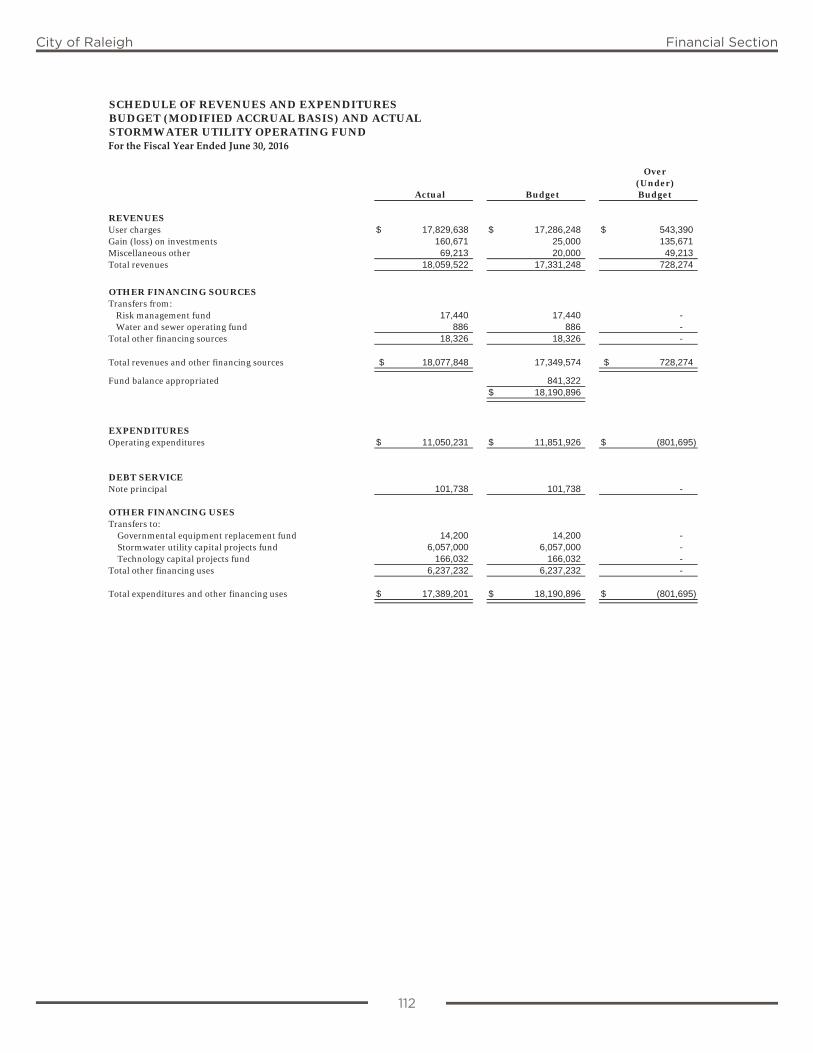
112
City of Raleigh Financial Section
SCHEDULE OF REVENUES AND EXPENDITURES BUDGET (MODIFIED ACCRUAL BASIS) AND ACTUALSTORMWATER UTILITY OPERATING FUNDFor the Fiscal Year Ended June 30, 2016
Over (Under)
Actual Budget Budget
REVENUESUser charges $ 17,829,638 $ 17,286,248 $ 543,390 Gain (loss) on investments 160,671 25,000 135,671 Miscellaneous other 69,213 20,000 49,213 Total revenues 18,059,522 17,331,248 728,274
OTHER FINANCING SOURCESTransfers from:
Risk management fund 17,440 17,440 - Water and sewer operating fund 886 886 -
Total other financing sources 18,326 18,326 -
Total revenues and other financing sources $ 18,077,848 17,349,574 $ 728,274
Fund balance appropriated 841,322 $ 18,190,896
EXPENDITURESOperating expenditures $ 11,050,231 $ 11,851,926 $ (801,695)
DEBT SERVICE Note principal 101,738 101,738 -
OTHER FINANCING USESTransfers to: Governmental equipment replacement fund 14,200 14,200 - Stormwater utility capital projects fund 6,057,000 6,057,000 - Technology capital projects fund 166,032 166,032 - Total other financing uses 6,237,232 6,237,232 -
Total expenditures and other financing uses $ 17,389,201 $ 18,190,896 $ (801,695)
112
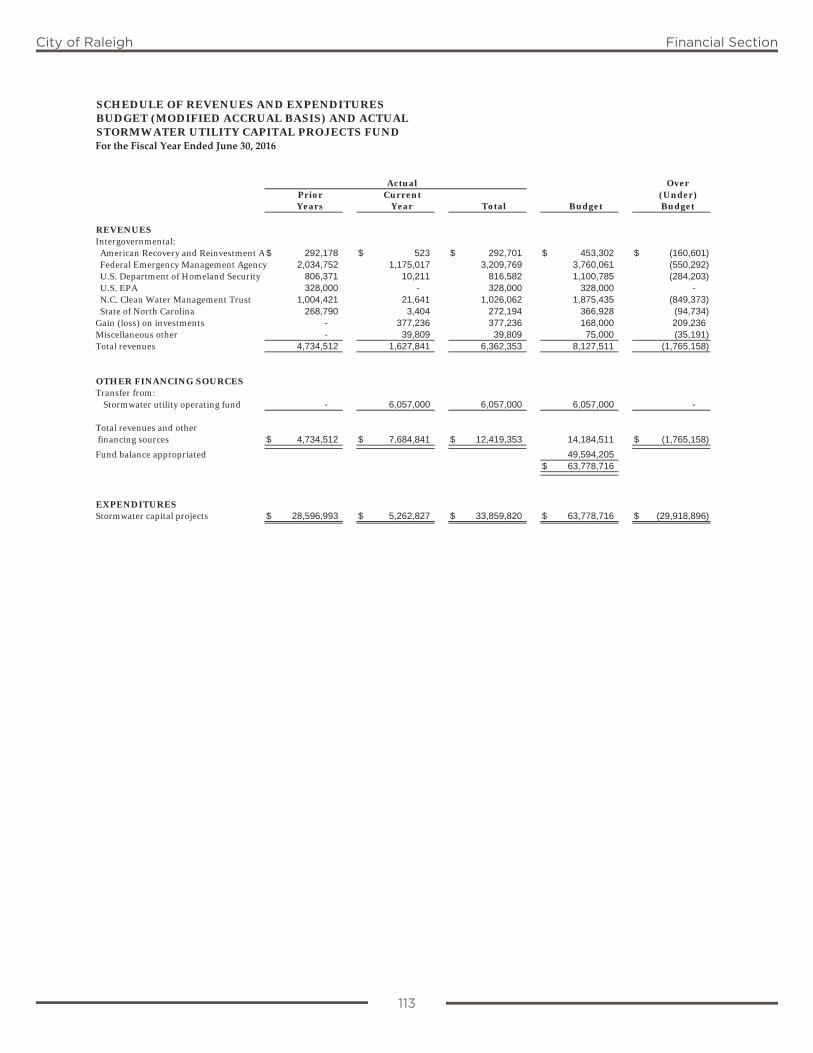
113
City of Raleigh Financial Section
SCHEDULE OF REVENUES AND EXPENDITURESBUDGET (MODIFIED ACCRUAL BASIS) AND ACTUALSTORMWATER UTILITY CAPITAL PROJECTS FUNDFor the Fiscal Year Ended June 30, 2016
OverPrior Current (Under)Years Year Total Budget Budget
REVENUESIntergovernmental: American Recovery and Reinvestment A $ 292,178 $ 523 $ 292,701 $ 453,302 $ (160,601) Federal Emergency Management Agency 2,034,752 1,175,017 3,209,769 3,760,061 (550,292) U.S. Department of Homeland Security 806,371 10,211 816,582 1,100,785 (284,203) U.S. EPA 328,000 - 328,000 328,000 - N.C. Clean Water Management Trust 1,004,421 21,641 1,026,062 1,875,435 (849,373) State of North Carolina 268,790 3,404 272,194 366,928 (94,734) Gain (loss) on investments - 377,236 377,236 168,000 209,236 Miscellaneous other - 39,809 39,809 75,000 (35,191) Total revenues 4,734,512 1,627,841 6,362,353 8,127,511 (1,765,158)
OTHER FINANCING SOURCESTransfer from:
Stormwater utility operating fund - 6,057,000 6,057,000 6,057,000 -
Total revenues and other financing sources $ 4,734,512 $ 7,684,841 $ 12,419,353 14,184,511 $ (1,765,158)
Fund balance appropriated 49,594,205 $ 63,778,716
EXPENDITURESStormwater capital projects $ 28,596,993 $ 5,262,827 $ 33,859,820 $ 63,778,716 $ (29,918,896)
Actual
113
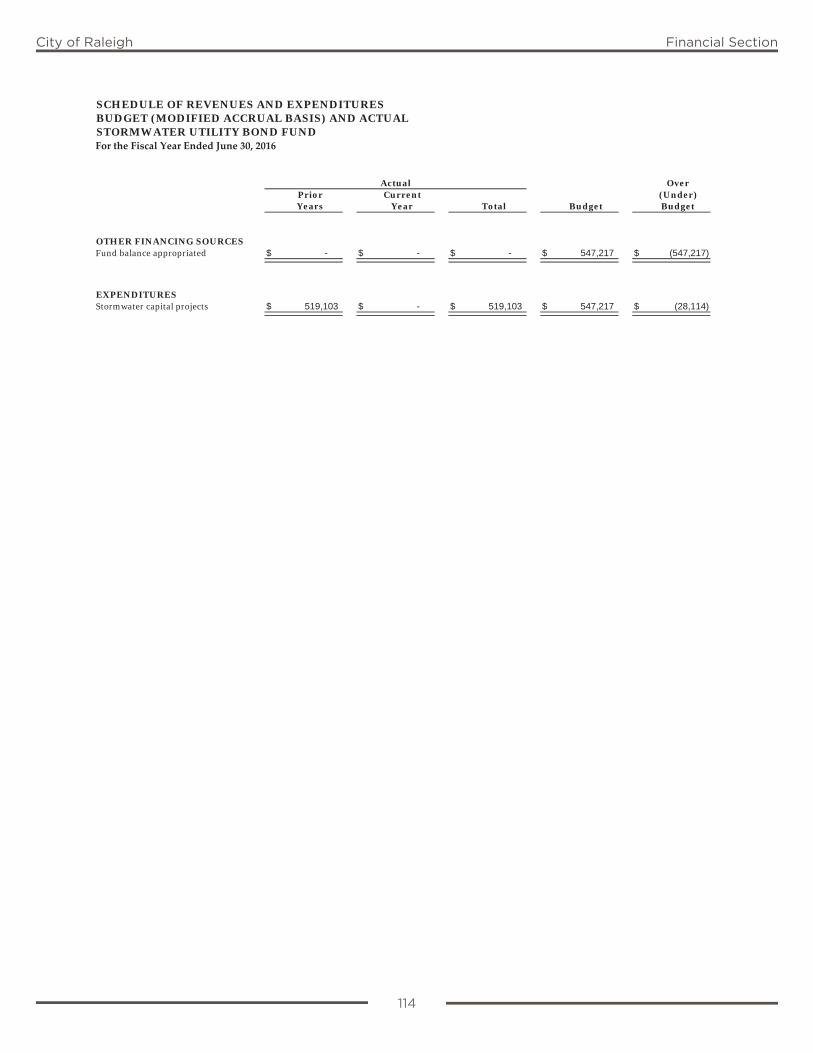
114
City of Raleigh Financial Section
SCHEDULE OF REVENUES AND EXPENDITURESBUDGET (MODIFIED ACCRUAL BASIS) AND ACTUALSTORMWATER UTILITY BOND FUNDFor the Fiscal Year Ended June 30, 2016
OverPrior Current (Under)Years Year Total Budget Budget
OTHER FINANCING SOURCESFund balance appropriated $ - $ - $ - $ 547,217 $ (547,217)
EXPENDITURESStormwater capital projects $ 519,103 $ - $ 519,103 $ 547,217 $ (28,114)
Actual
114
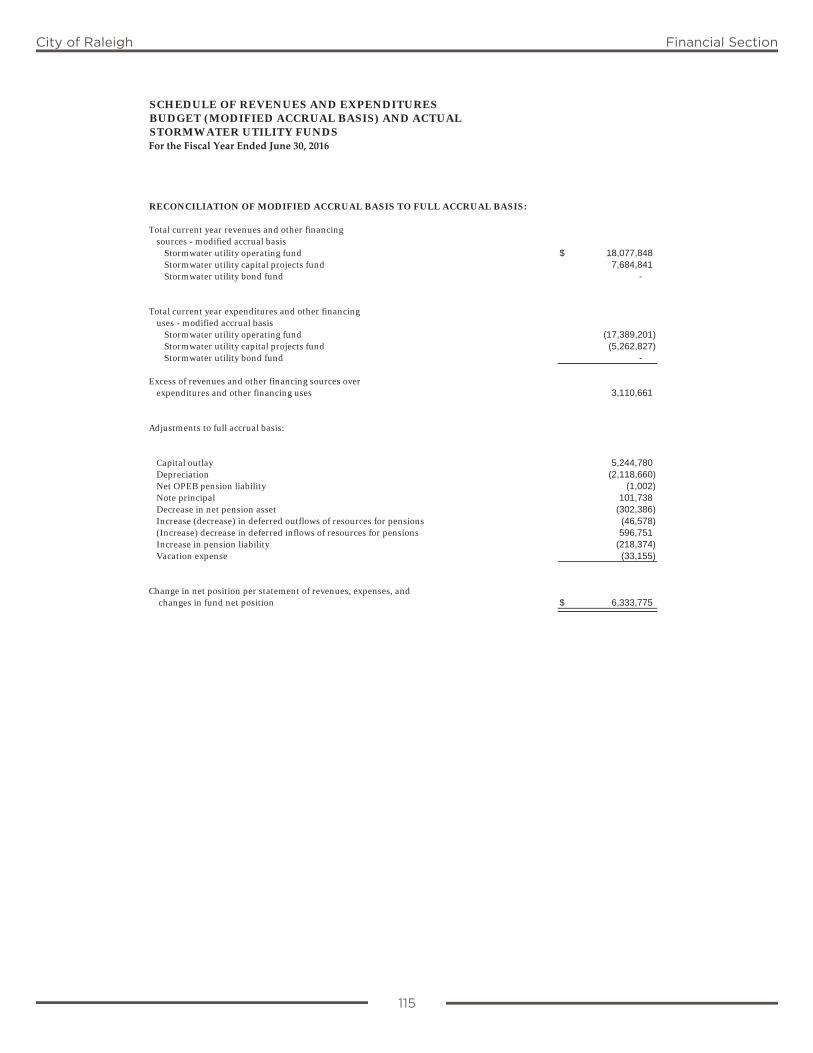
115
City of Raleigh Financial Section
SCHEDULE OF REVENUES AND EXPENDITURES BUDGET (MODIFIED ACCRUAL BASIS) AND ACTUALSTORMWATER UTILITY FUNDSFor the Fiscal Year Ended June 30, 2016
RECONCILIATION OF MODIFIED ACCRUAL BASIS TO FULL ACCRUAL BASIS:
Total current year revenues and other financing sources - modified accrual basis
Stormwater utility operating fund $ 18,077,848 Stormwater utility capital projects fund 7,684,841 Stormwater utility bond fund -
Total current year expenditures and other financing uses - modified accrual basis
Stormwater utility operating fund (17,389,201) Stormwater utility capital projects fund (5,262,827) Stormwater utility bond fund -
Excess of revenues and other financing sources overexpenditures and other financing uses 3,110,661
Adjustments to full accrual basis:
Capital outlay 5,244,780 Depreciation (2,118,660) Net OPEB pension liability (1,002) Note principal 101,738 Decrease in net pension asset (302,386) Increase (decrease) in deferred outflows of resources for pensions (46,578) (Increase) decrease in deferred inflows of resources for pensions 596,751 Increase in pension liability (218,374) Vacation expense (33,155)
Change in net position per statement of revenues, expenses, and changes in fund net position $ 6,333,775
115
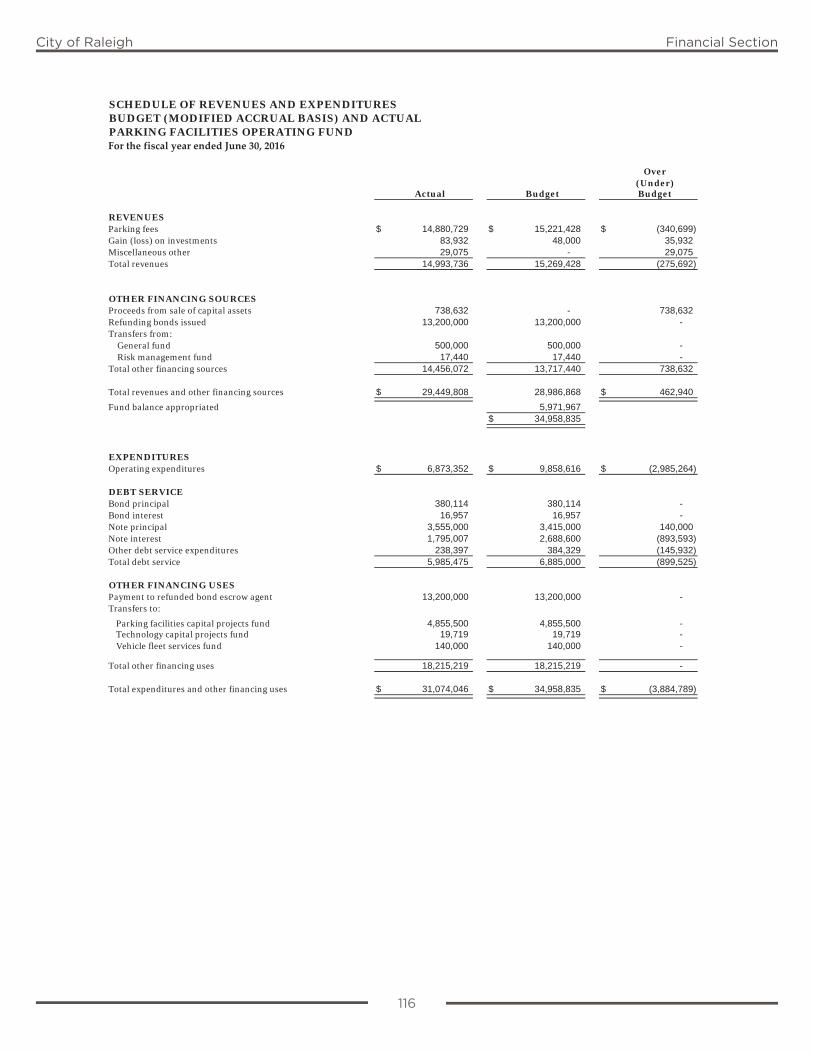
116
City of Raleigh Financial Section
SCHEDULE OF REVENUES AND EXPENDITURES BUDGET (MODIFIED ACCRUAL BASIS) AND ACTUALPARKING FACILITIES OPERATING FUNDFor the fiscal year ended June 30, 2016
Over (Under)
Actual Budget Budget
REVENUESParking fees $ 14,880,729 $ 15,221,428 $ (340,699) Gain (loss) on investments 83,932 48,000 35,932 Miscellaneous other 29,075 - 29,075 Total revenues 14,993,736 15,269,428 (275,692)
OTHER FINANCING SOURCESProceeds from sale of capital assets 738,632 - 738,632 Refunding bonds issued 13,200,000 13,200,000 - Transfers from: General fund 500,000 500,000 - Risk management fund 17,440 17,440 - Total other financing sources 14,456,072 13,717,440 738,632
Total revenues and other financing sources $ 29,449,808 28,986,868 $ 462,940
Fund balance appropriated 5,971,967 $ 34,958,835
EXPENDITURESOperating expenditures $ 6,873,352 $ 9,858,616 $ (2,985,264)
DEBT SERVICEBond principal 380,114 380,114 - Bond interest 16,957 16,957 - Note principal 3,555,000 3,415,000 140,000 Note interest 1,795,007 2,688,600 (893,593) Other debt service expenditures 238,397 384,329 (145,932) Total debt service 5,985,475 6,885,000 (899,525)
OTHER FINANCING USESPayment to refunded bond escrow agent 13,200,000 13,200,000 -Transfers to:
Parking facilities capital projects fund 4,855,500 4,855,500 - Technology capital projects fund 19,719 19,719 -Vehicle fleet services fund 140,000 140,000 -
Total other financing uses 18,215,219 18,215,219 -
Total expenditures and other financing uses $ 31,074,046 $ 34,958,835 $ (3,884,789)
116
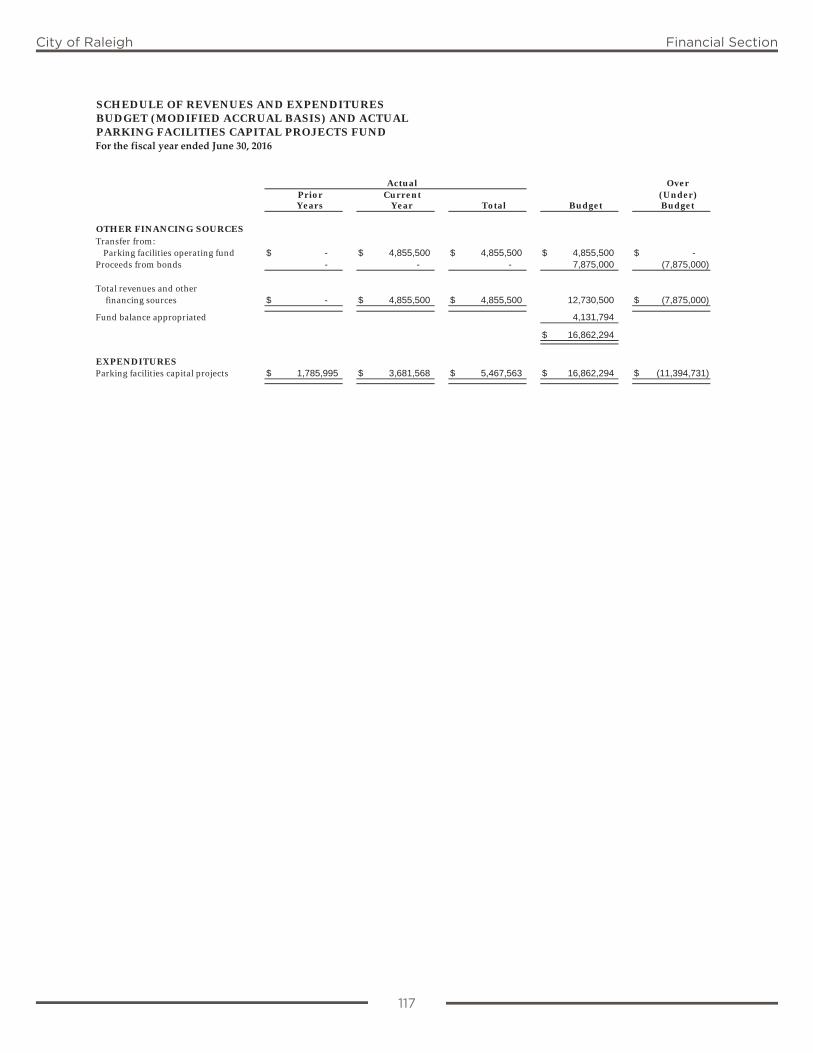
117
City of Raleigh Financial Section
SCHEDULE OF REVENUES AND EXPENDITURESBUDGET (MODIFIED ACCRUAL BASIS) AND ACTUALPARKING FACILITIES CAPITAL PROJECTS FUNDFor the fiscal year ended June 30, 2016
OverPrior Current (Under)Years Year Total Budget Budget
OTHER FINANCING SOURCESTransfer from:
Parking facilities operating fund $ - $ 4,855,500 $ 4,855,500 $ 4,855,500 $ - Proceeds from bonds - - - 7,875,000 (7,875,000)
Total revenues and other financing sources $ - $ 4,855,500 $ 4,855,500 12,730,500 $ (7,875,000)
Fund balance appropriated 4,131,794
$ 16,862,294
EXPENDITURESParking facilities capital projects $ 1,785,995 $ 3,681,568 $ 5,467,563 $ 16,862,294 $ (11,394,731)
Actual
117
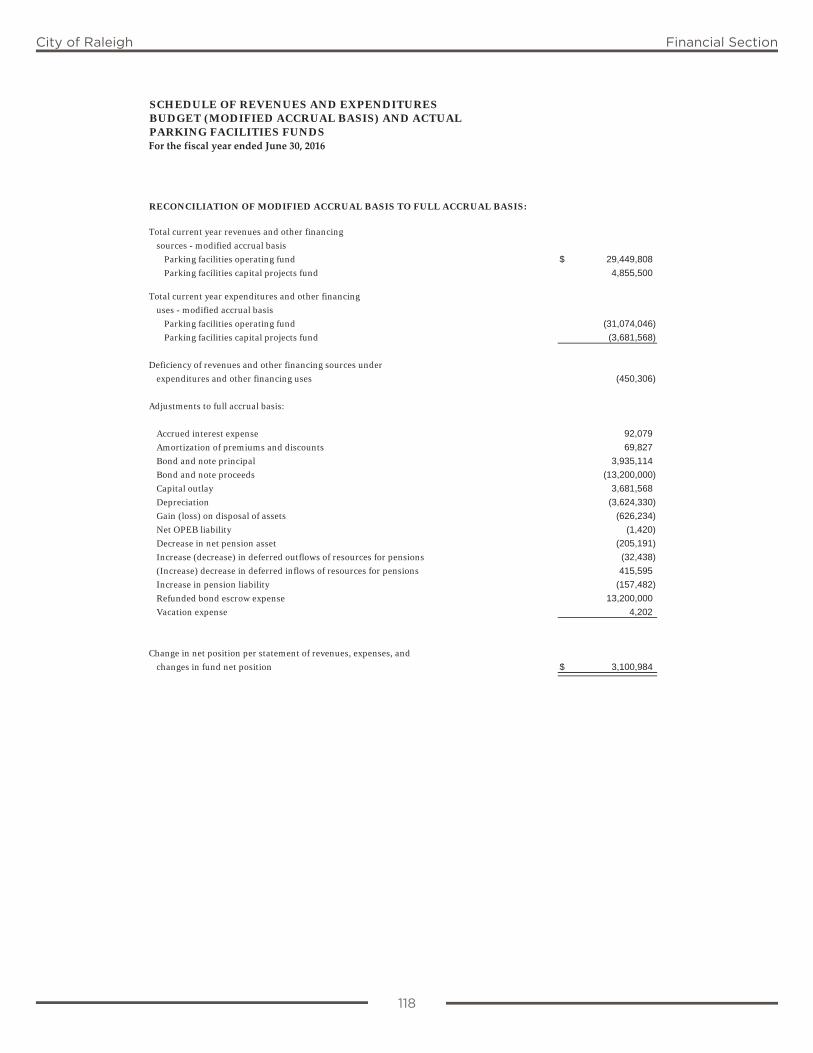
118
City of Raleigh Financial Section
SCHEDULE OF REVENUES AND EXPENDITURES BUDGET (MODIFIED ACCRUAL BASIS) AND ACTUALPARKING FACILITIES FUNDSFor the fiscal year ended June 30, 2016
RECONCILIATION OF MODIFIED ACCRUAL BASIS TO FULL ACCRUAL BASIS:
Total current year revenues and other financing
sources - modified accrual basis
Parking facilities operating fund $ 29,449,808
Parking facilities capital projects fund 4,855,500
Total current year expenditures and other financing
uses - modified accrual basis
Parking facilities operating fund (31,074,046)
Parking facilities capital projects fund (3,681,568)
Deficiency of revenues and other financing sources under
expenditures and other financing uses (450,306)
Adjustments to full accrual basis:
Accrued interest expense 92,079
Amortization of premiums and discounts 69,827
Bond and note principal 3,935,114
Bond and note proceeds (13,200,000)
Capital outlay 3,681,568
Depreciation (3,624,330)
Gain (loss) on disposal of assets (626,234)
Net OPEB liability (1,420)
Decrease in net pension asset (205,191)
Increase (decrease) in deferred outflows of resources for pensions (32,438)
(Increase) decrease in deferred inflows of resources for pensions 415,595
Increase in pension liability (157,482)
Refunded bond escrow expense 13,200,000
Vacation expense 4,202
Change in net position per statement of revenues, expenses, and
changes in fund net position $ 3,100,984
118
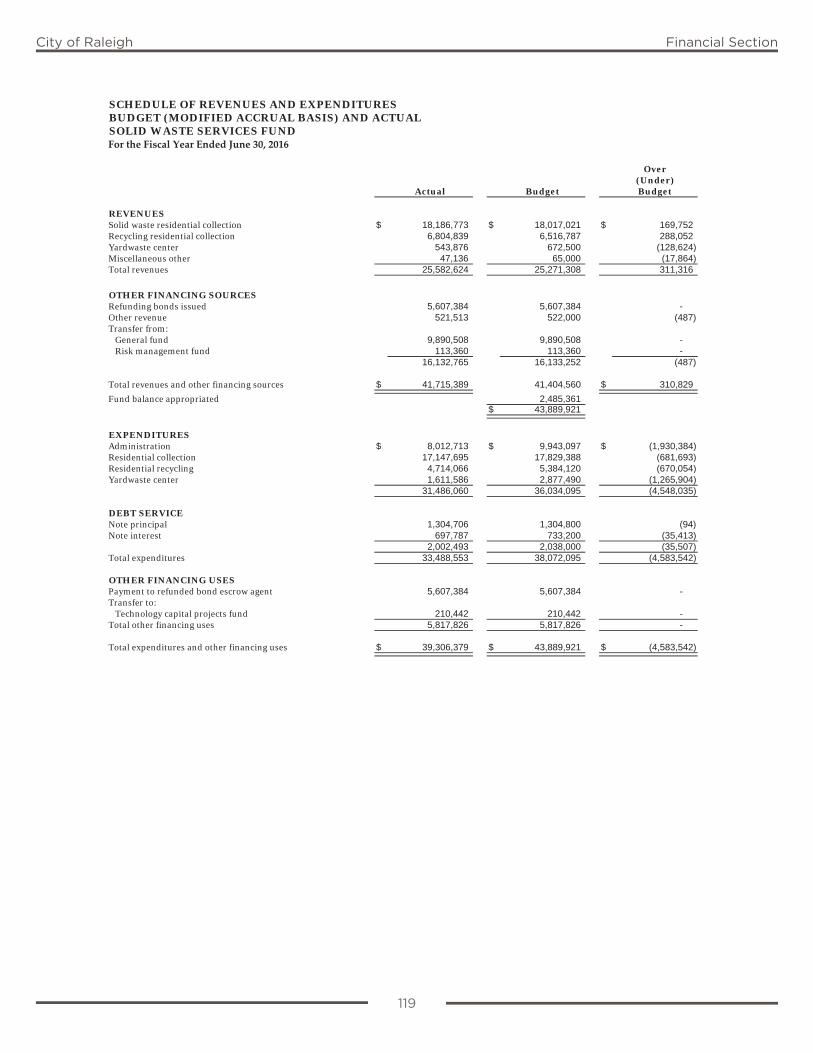
119
City of Raleigh Financial Section
SCHEDULE OF REVENUES AND EXPENDITURES BUDGET (MODIFIED ACCRUAL BASIS) AND ACTUALSOLID WASTE SERVICES FUNDFor the Fiscal Year Ended June 30, 2016
Over(Under)
Actual Budget Budget
REVENUESSolid waste residential collection $ 18,186,773 $ 18,017,021 $ 169,752 Recycling residential collection 6,804,839 6,516,787 288,052 Yardwaste center 543,876 672,500 (128,624) Miscellaneous other 47,136 65,000 (17,864) Total revenues 25,582,624 25,271,308 311,316
OTHER FINANCING SOURCESRefunding bonds issued 5,607,384 5,607,384 -Other revenue 521,513 522,000 (487)Transfer from:
General fund 9,890,508 9,890,508 -Risk management fund 113,360 113,360 -
16,132,765 16,133,252 (487)
Total revenues and other financing sources $ 41,715,389 41,404,560 $ 310,829
Fund balance appropriated 2,485,361$ 43,889,921
EXPENDITURESAdministration $ 8,012,713 $ 9,943,097 $ (1,930,384) Residential collection 17,147,695 17,829,388 (681,693) Residential recycling 4,714,066 5,384,120 (670,054) Yardwaste center 1,611,586 2,877,490 (1,265,904)
31,486,060 36,034,095 (4,548,035)
DEBT SERVICENote principal 1,304,706 1,304,800 (94)Note interest 697,787 733,200 (35,413)
2,002,493 2,038,000 (35,507) Total expenditures 33,488,553 38,072,095 (4,583,542)
OTHER FINANCING USESPayment to refunded bond escrow agent 5,607,384 5,607,384 -Transfer to:
Technology capital projects fund 210,442 210,442 -Total other financing uses 5,817,826 5,817,826 -
Total expenditures and other financing uses $ 39,306,379 $ 43,889,921 $ (4,583,542)
119
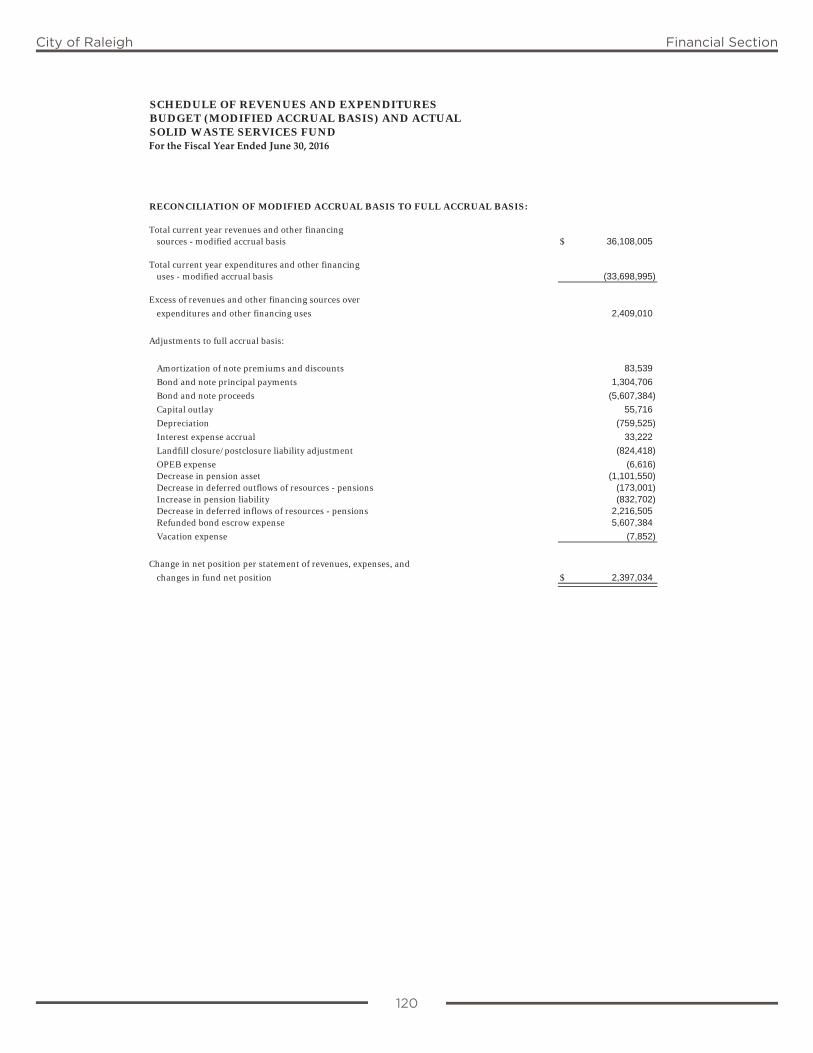
120
City of Raleigh Financial Section
SCHEDULE OF REVENUES AND EXPENDITURES BUDGET (MODIFIED ACCRUAL BASIS) AND ACTUALSOLID WASTE SERVICES FUNDFor the Fiscal Year Ended June 30, 2016
RECONCILIATION OF MODIFIED ACCRUAL BASIS TO FULL ACCRUAL BASIS:
Total current year revenues and other financingsources - modified accrual basis $ 36,108,005
Total current year expenditures and other financinguses - modified accrual basis (33,698,995)
Excess of revenues and other financing sources over
expenditures and other financing uses 2,409,010
Adjustments to full accrual basis:
Amortization of note premiums and discounts 83,539
Bond and note principal payments 1,304,706
Bond and note proceeds (5,607,384)
Capital outlay 55,716
Depreciation (759,525)
Interest expense accrual 33,222
Landfill closure/postclosure liability adjustment (824,418)
OPEB expense (6,616)Decrease in pension asset (1,101,550)Decrease in deferred outflows of resources - pensions (173,001)Increase in pension liability (832,702)Decrease in deferred inflows of resources - pensions 2,216,505Refunded bond escrow expense 5,607,384
Vacation expense (7,852)
Change in net position per statement of revenues, expenses, and
changes in fund net position $ 2,397,034
120
City of Raleigh Financial Section
Internal Service FundsInternal Service Funds are used to account for centralized services provided on a cost-reimbursement basis. The City maintains six internal service funds for its risk management, health benefits, equipment replacement programs, and vehicle fleet services.

City of Raleigh Financial Section
City of Raleigh Financial Section
Internal Service Funds
Risk Management FundThe Risk Management Fund accounts for risk management activities of the City, including premiums, claims expenses and loss reserves.
Employees’ Health Benefits FundThe Employees’ Health Benefits Fund accounts for the City’s and employees’ contributions to a medical trust and its related costs, including claims and operating expenses.
Governmental Equipment Replacement FundThe Governmental Equipment Replacement Fund accounts for the activities related to managing the equipment replacement program for governmental activities.
Solid Waste Services Equipment Replacement FundThe Solid Waste Services Equipment Replacement Fund accounts for the activities related to managing the City’s equipment replacement program for the City’s Solid Waste Services Department.
Public Utilities Equipment Replacement FundThe Public Utilities Equipment Replacement Fund accounts for the activities related to managing the City’s equipment replacement program for the City’s public utilities.
Vehicle Fleet Services FundThe Vehicle Fleet Services Fund accounts for the activities related to the City’s central garage operations.
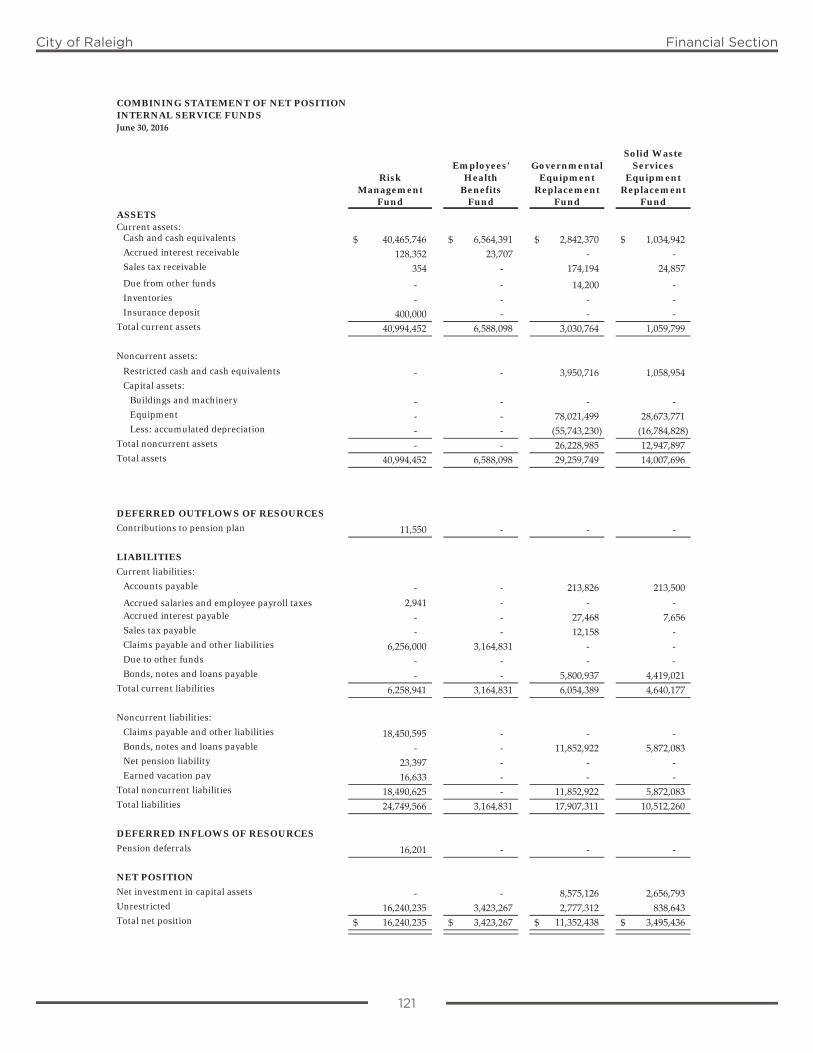
121
City of Raleigh Financial Section
COMBINING STATEMENT OF NET POSITIONINTERNAL SERVICE FUNDSJune 30, 2016
Solid WasteEmployees' Governmental Services
Risk Health Equipment EquipmentManagement Benefits Replacement Replacement
Fund Fund Fund FundASSETSCurrent assets:
Cash and cash equivalents 40,465,746$ 6,564,391$ 2,842,370$ 1,034,942$ Accrued interest receivable 128,352 23,707 ‐ ‐ Sales tax receivable 354 ‐ 174,194 24,857 Due from other funds ‐ ‐ 14,200 ‐ Inventories ‐ ‐ ‐ ‐ Insurance deposit 400,000 ‐ ‐ ‐
Total current assets 40,994,452 6,588,098 3,030,764 1,059,799
Noncurrent assets:
Restricted cash and cash equivalents ‐ ‐ 3,950,716 1,058,954 Capital assets:
Buildings and machinery ‐ ‐ ‐ ‐ Equipment ‐ ‐ 78,021,499 28,673,771 Less: accumulated depreciation ‐ ‐ (55,743,230) (16,784,828)
Total noncurrent assets ‐ ‐ 26,228,985 12,947,897 Total assets 40,994,452 6,588,098 29,259,749 14,007,696
DEFERRED OUTFLOWS OF RESOURCES
Contributions to pension plan 11,550 ‐ ‐ ‐
LIABILITIES
Current liabilities:
Accounts payable ‐ ‐ 213,826 213,500 Accrued salaries and employee payroll taxes 2,941 ‐ ‐ ‐ Accrued interest payable ‐ ‐ 27,468 7,656 Sales tax payable ‐ ‐ 12,158 ‐ Claims payable and other liabilities 6,256,000 3,164,831 ‐ ‐ Due to other funds ‐ ‐ ‐ ‐ Bonds, notes and loans payable ‐ ‐ 5,800,937 4,419,021
Total current liabilities 6,258,941 3,164,831 6,054,389 4,640,177
Noncurrent liabilities:
Claims payable and other liabilities 18,450,595 ‐ ‐ ‐ Bonds, notes and loans payable ‐ ‐ 11,852,922 5,872,083 Net pension liability 23,397 ‐ ‐ ‐ Earned vacation pay 16,633 ‐ ‐ ‐
Total noncurrent liabilities 18,490,625 ‐ 11,852,922 5,872,083 Total liabilities 24,749,566 3,164,831 17,907,311 10,512,260
DEFERRED INFLOWS OF RESOURCES
Pension deferrals 16,201 ‐ ‐ ‐
NET POSITION
Net investment in capital assets ‐ ‐ 8,575,126 2,656,793 Unrestricted 16,240,235 3,423,267 2,777,312 838,643 Total net position 16,240,235$ 3,423,267$ 11,352,438$ 3,495,436$
121
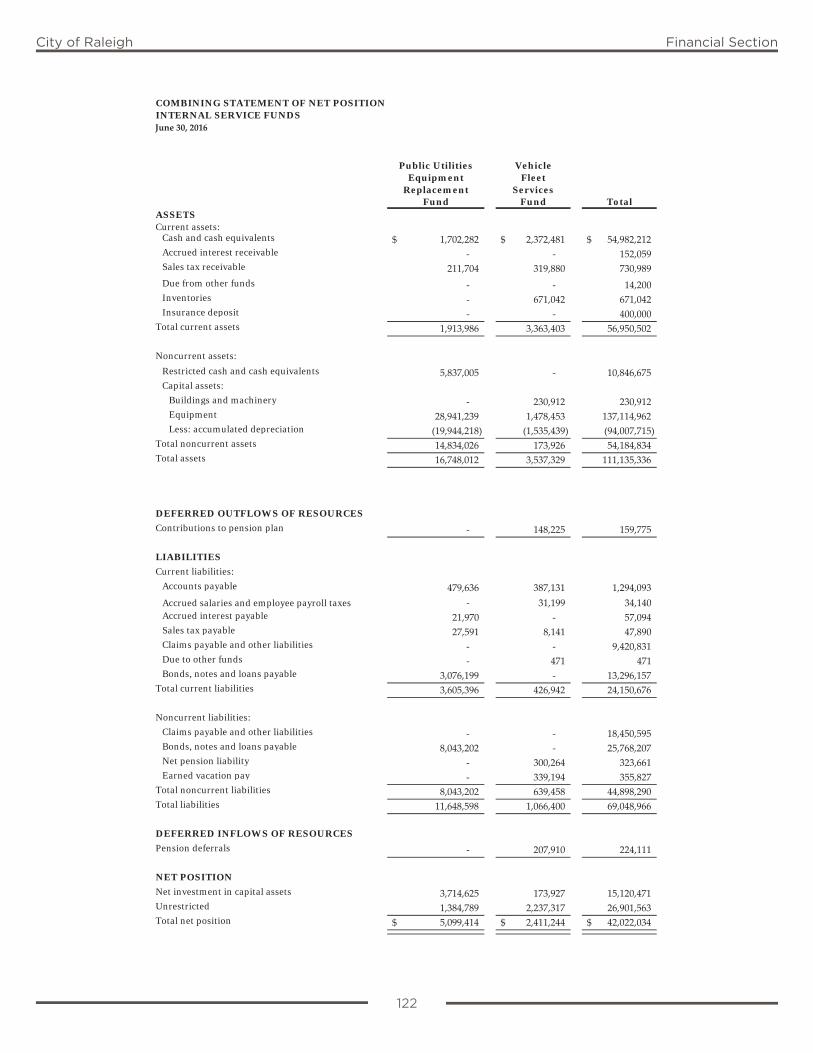
122
City of Raleigh Financial Section
COMBINING STATEMENT OF NET POSITIONINTERNAL SERVICE FUNDSJune 30, 2016
Public Utilities VehicleEquipment Fleet
Replacement Services Fund Fund Total
ASSETSCurrent assets:
Cash and cash equivalents 1,702,282$ 2,372,481$ 54,982,212$ Accrued interest receivable ‐ ‐ 152,059 Sales tax receivable 211,704 319,880 730,989 Due from other funds ‐ ‐ 14,200 Inventories ‐ 671,042 671,042 Insurance deposit ‐ ‐ 400,000
Total current assets 1,913,986 3,363,403 56,950,502
Noncurrent assets:
Restricted cash and cash equivalents 5,837,005 ‐ 10,846,675 Capital assets:
Buildings and machinery ‐ 230,912 230,912 Equipment 28,941,239 1,478,453 137,114,962 Less: accumulated depreciation (19,944,218) (1,535,439) (94,007,715)
Total noncurrent assets 14,834,026 173,926 54,184,834 Total assets 16,748,012 3,537,329 111,135,336
DEFERRED OUTFLOWS OF RESOURCES
Contributions to pension plan ‐ 148,225 159,775
LIABILITIES
Current liabilities:
Accounts payable 479,636 387,131 1,294,093 Accrued salaries and employee payroll taxes ‐ 31,199 34,140 Accrued interest payable 21,970 ‐ 57,094 Sales tax payable 27,591 8,141 47,890 Claims payable and other liabilities ‐ ‐ 9,420,831 Due to other funds ‐ 471 471 Bonds, notes and loans payable 3,076,199 ‐ 13,296,157
Total current liabilities 3,605,396 426,942 24,150,676
Noncurrent liabilities:
Claims payable and other liabilities ‐ ‐ 18,450,595 Bonds, notes and loans payable 8,043,202 ‐ 25,768,207 Net pension liability ‐ 300,264 323,661 Earned vacation pay ‐ 339,194 355,827
Total noncurrent liabilities 8,043,202 639,458 44,898,290 Total liabilities 11,648,598 1,066,400 69,048,966
DEFERRED INFLOWS OF RESOURCES
Pension deferrals ‐ 207,910 224,111
NET POSITION
Net investment in capital assets 3,714,625 173,927 15,120,471 Unrestricted 1,384,789 2,237,317 26,901,563 Total net position 5,099,414$ 2,411,244$ 42,022,034$
122
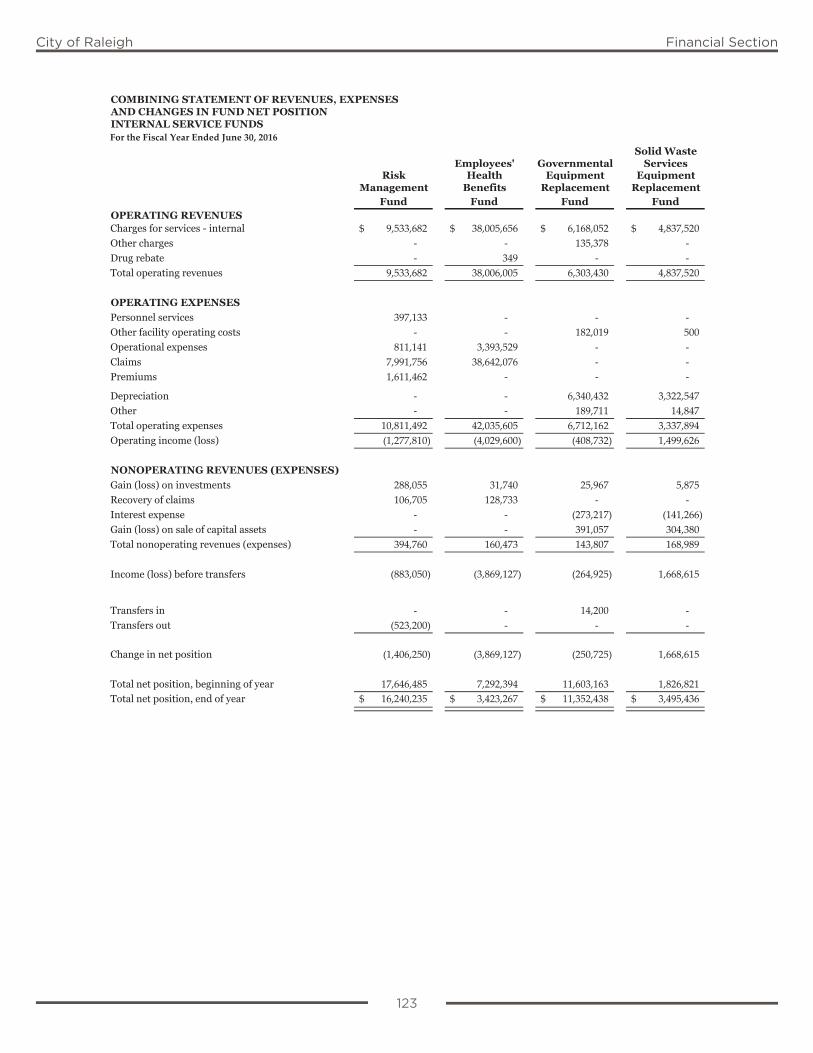
123
City of Raleigh Financial Section
COMBINING STATEMENT OF REVENUES, EXPENSESAND CHANGES IN FUND NET POSITIONINTERNAL SERVICE FUNDSFor the Fiscal Year Ended June 30, 2016
Solid WasteEmployees' Governmental Services
Risk Health Equipment EquipmentManagement Benefits Replacement Replacement
Fund Fund Fund FundOPERATING REVENUESCharges for services - internal 9,533,682$ 38,005,656$ 6,168,052$ 4,837,520$ Other charges - - 135,378 - Drug rebate - 349 - - Total operating revenues 9,533,682 38,006,005 6,303,430 4,837,520
OPERATING EXPENSESPersonnel services 397,133 - - - Other facility operating costs - - 182,019 500 Operational expenses 811,141 3,393,529 - - Claims 7,991,756 38,642,076 - - Premiums 1,611,462 - - -
Depreciation - - 6,340,432 3,322,547 Other - - 189,711 14,847 Total operating expenses 10,811,492 42,035,605 6,712,162 3,337,894 Operating income (loss) (1,277,810) (4,029,600) (408,732) 1,499,626
NONOPERATING REVENUES (EXPENSES)Gain (loss) on investments 288,055 31,740 25,967 5,875 Recovery of claims 106,705 128,733 - - Interest expense - - (273,217) (141,266) Gain (loss) on sale of capital assets - - 391,057 304,380 Total nonoperating revenues (expenses) 394,760 160,473 143,807 168,989
Income (loss) before transfers (883,050) (3,869,127) (264,925) 1,668,615
Transfers in - - 14,200 - Transfers out (523,200) - - -
Change in net position (1,406,250) (3,869,127) (250,725) 1,668,615
Total net position, beginning of year 17,646,485 7,292,394 11,603,163 1,826,821 Total net position, end of year 16,240,235$ 3,423,267$ 11,352,438$ 3,495,436$
123

124
City of Raleigh Financial Section
COMBINING STATEMENT OF REVENUES, EXPENSESAND CHANGES IN FUND NET POSITIONINTERNAL SERVICE FUNDSFor the Fiscal Year Ended June 30, 2016
Public Utilities VehicleEquipment Fleet
Replacement ServicesFund Fund Total
OPERATING REVENUESCharges for services - internal 3,412,269$ 12,112,415$ 74,069,594$ Other charges 14,166 3,593 153,137 Drug rebate - - 349 Total operating revenues 3,426,435 12,116,008 74,223,080
OPERATING EXPENSES Personnel services - 4,350,027 4,747,160 Other facility operating costs 33,722 7,813,579 8,029,820 Operational expenses - - 4,204,670 Claims - - 46,633,832 Premiums - - 1,611,462
Depreciation 2,083,865 22,597 11,769,441 Other 68,699 - 273,257 Total operating expenses 2,186,286 12,186,203 77,269,642 Operating income (loss) 1,240,149 (70,195) (3,046,562)
NONOPERATING REVENUES (EXPENSES) Gain (loss) on investments 24,789 - 376,426 Recovery of claims - - 235,438 Interest expense (174,128) - (588,611) Gain (loss) on sale of capital assets 230,023 29,123 954,583 Total nonoperating revenues (expenses) 80,684 29,123 977,836
Income (loss) before transfers 1,320,833 (41,072) (2,068,726)
Transfers in - 140,000 154,200 Transfers out - (50,753) (573,953)
Change in net position 1,320,833 48,175 (2,488,479)
Total net position, beginning of year 3,778,581 2,363,069 44,510,513 Total net position, end of year 5,099,414$ 2,411,244$ 42,022,034$
124
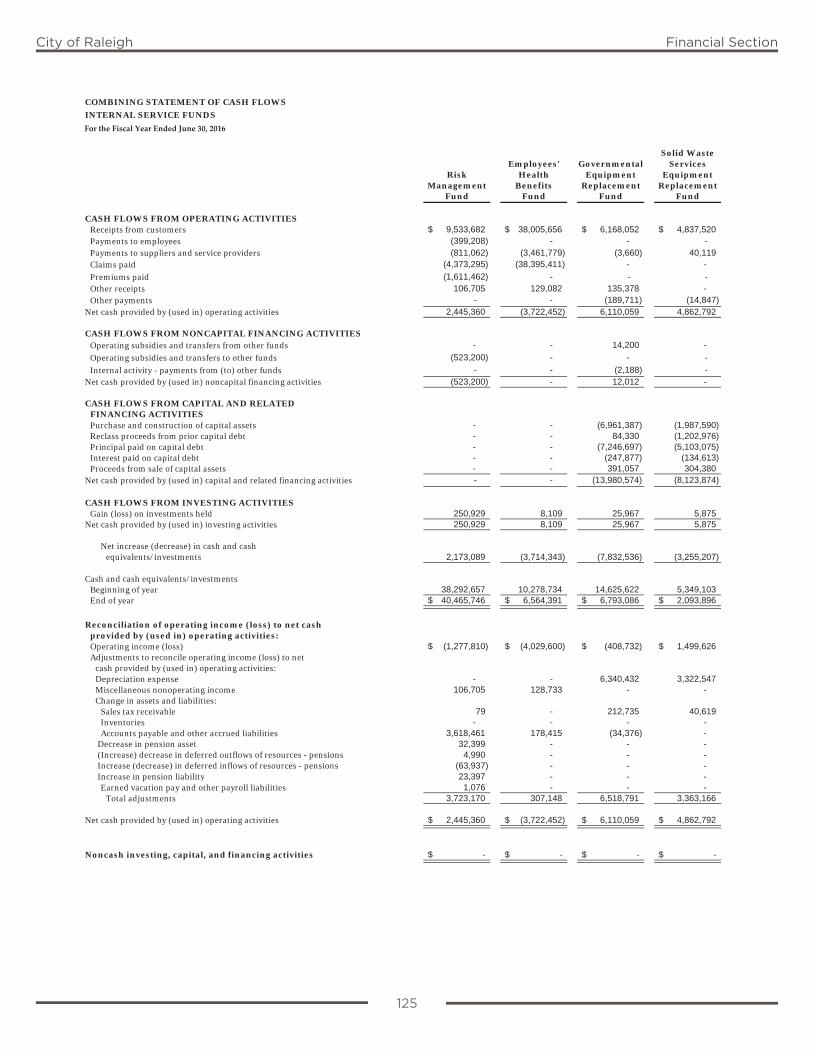
125
City of Raleigh Financial Section
COMBINING STATEMENT OF CASH FLOWS
INTERNAL SERVICE FUNDS
For the Fiscal Year Ended June 30, 2016
Solid WasteEmployees' Governmental Services
Risk Health Equipment EquipmentManagement Benefits Replacement Replacement
Fund Fund Fund Fund
CASH FLOWS FROM OPERATING ACTIVITIESReceipts from customers 9,533,682$ 38,005,656$ 6,168,052$ 4,837,520$Payments to employees (399,208) - - ‐ Payments to suppliers and service providers (811,062) (3,461,779) (3,660) 40,119Claims paid (4,373,295) (38,395,411) - -
Premiums paid (1,611,462) - ‐ ‐ Other receipts 106,705 129,082 135,378 -Other payments ‐ - (189,711) (14,847)
Net cash provided by (used in) operating activities 2,445,360 (3,722,452) 6,110,059 4,862,792
CASH FLOWS FROM NONCAPITAL FINANCING ACTIVITIESOperating subsidies and transfers from other funds - - 14,200 -
Operating subsidies and transfers to other funds (523,200) - - ‐ Internal activity - payments from (to) other funds ‐ - (2,188) ‐
Net cash provided by (used in) noncapital financing activities (523,200) - 12,012 -
CASH FLOWS FROM CAPITAL AND RELATEDFINANCING ACTIVITIESPurchase and construction of capital assets - - (6,961,387) (1,987,590)Reclass proceeds from prior capital debt - - 84,330 (1,202,976)Principal paid on capital debt - - (7,246,697) (5,103,075)Interest paid on capital debt - - (247,877) (134,613)Proceeds from sale of capital assets - - 391,057 304,380
Net cash provided by (used in) capital and related financing activities ‐ - (13,980,574) (8,123,874)
CASH FLOWS FROM INVESTING ACTIVITIESGain (loss) on investments held 250,929 8,109 25,967 5,875
Net cash provided by (used in) investing activities 250,929 8,109 25,967 5,875
Net increase (decrease) in cash and cashequivalents/investments 2,173,089 (3,714,343) (7,832,536) (3,255,207)
Cash and cash equivalents/investmentsBeginning of year 38,292,657 10,278,734 14,625,622 5,349,103End of year 40,465,746$ 6,564,391$ 6,793,086$ 2,093,896$
Reconciliation of operating income (loss) to net cashprovided by (used in) operating activities:Operating income (loss) (1,277,810)$ (4,029,600)$ (408,732)$ 1,499,626$Adjustments to reconcile operating income (loss) to net
cash provided by (used in) operating activities:Depreciation expense - - 6,340,432 3,322,547Miscellaneous nonoperating income 106,705 128,733 - -Change in assets and liabilities:
Sales tax receivable 79 - 212,735 40,619Inventories - - - -Accounts payable and other accrued liabilities 3,618,461 178,415 (34,376) -
Decrease in pension asset 32,399 - - - (Increase) decrease in deferred outflows of resources - pensions 4,990 - - - Increase (decrease) in deferred inflows of resources - pensions (63,937) - - - Increase in pension liability 23,397 - - -
Earned vacation pay and other payroll liabilities 1,076 - - -Total adjustments 3,723,170 307,148 6,518,791 3,363,166
Net cash provided by (used in) operating activities 2,445,360$ (3,722,452)$ 6,110,059$ 4,862,792$
Noncash investing, capital, and financing activities -$ -$ -$ -$
125
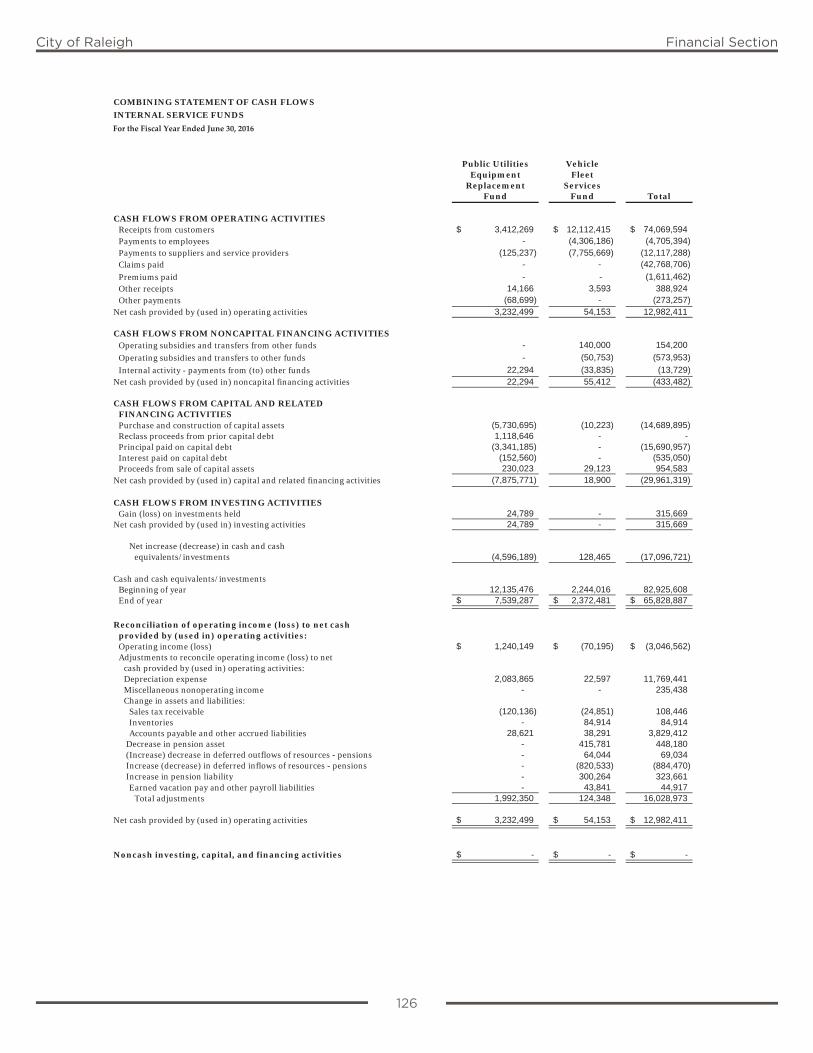
126
City of Raleigh Financial Section
COMBINING STATEMENT OF CASH FLOWS
INTERNAL SERVICE FUNDS
For the Fiscal Year Ended June 30, 2016
Public Utilities VehicleEquipment Fleet
Replacement ServicesFund Fund Total
CASH FLOWS FROM OPERATING ACTIVITIESReceipts from customers 3,412,269$ 12,112,415$ 74,069,594$ Payments to employees ‐ (4,306,186) (4,705,394) Payments to suppliers and service providers (125,237) (7,755,669) (12,117,288) Claims paid ‐ - (42,768,706)
Premiums paid ‐ ‐ (1,611,462) Other receipts 14,166 3,593 388,924 Other payments (68,699) - (273,257)
Net cash provided by (used in) operating activities 3,232,499 54,153 12,982,411
CASH FLOWS FROM NONCAPITAL FINANCING ACTIVITIESOperating subsidies and transfers from other funds ‐ 140,000 154,200
Operating subsidies and transfers to other funds ‐ (50,753) (573,953)
Internal activity - payments from (to) other funds 22,294 (33,835) (13,729) Net cash provided by (used in) noncapital financing activities 22,294 55,412 (433,482)
CASH FLOWS FROM CAPITAL AND RELATEDFINANCING ACTIVITIESPurchase and construction of capital assets (5,730,695) (10,223) (14,689,895) Reclass proceeds from prior capital debt 1,118,646 - - Principal paid on capital debt (3,341,185) - (15,690,957) Interest paid on capital debt (152,560) - (535,050) Proceeds from sale of capital assets 230,023 29,123 954,583
Net cash provided by (used in) capital and related financing activities (7,875,771) 18,900 (29,961,319)
CASH FLOWS FROM INVESTING ACTIVITIESGain (loss) on investments held 24,789 - 315,669
Net cash provided by (used in) investing activities 24,789 - 315,669
Net increase (decrease) in cash and cashequivalents/investments (4,596,189) 128,465 (17,096,721)
Cash and cash equivalents/investmentsBeginning of year 12,135,476 2,244,016 82,925,608 End of year 7,539,287$ 2,372,481$ 65,828,887$
Reconciliation of operating income (loss) to net cashprovided by (used in) operating activities:Operating income (loss) 1,240,149$ (70,195)$ (3,046,562)$ Adjustments to reconcile operating income (loss) to net
cash provided by (used in) operating activities:Depreciation expense 2,083,865 22,597 11,769,441 Miscellaneous nonoperating income - - 235,438 Change in assets and liabilities:
Sales tax receivable (120,136) (24,851) 108,446 Inventories - 84,914 84,914 Accounts payable and other accrued liabilities 28,621 38,291 3,829,412
Decrease in pension asset - 415,781 448,180 (Increase) decrease in deferred outflows of resources - pensions - 64,044 69,034 Increase (decrease) in deferred inflows of resources - pensions - (820,533) (884,470) Increase in pension liability - 300,264 323,661
Earned vacation pay and other payroll liabilities - 43,841 44,917 Total adjustments 1,992,350 124,348 16,028,973
Net cash provided by (used in) operating activities 3,232,499$ 54,153$ 12,982,411$
Noncash investing, capital, and financing activities -$ -$ -$
126

City of Raleigh Financial Section
City of Raleigh Financial Section
Fiduciary Funds
The Fiduciary Funds are used to account for resources received and held by the City as the trustee or for which the City acts as agent. These funds are expended or invested in accordance with agreements or applicable prescribed procedures.
The City’s fiduciary funds include two pension trust funds, which account for activities of the City’s general supplemental retirement plan and other post employment benefits.

City of Raleigh Financial Section
City of Raleigh Financial Section
Fiduciary Funds
Supplemental Money Purchase Pension Plan FundThe Supplemental Money Purchase Pension Plan Fund accounts for the City’s contributions to the City of Raleigh Money Purchase Pension Plan, a Section 401a plan established to provide supplemental retirement benefits to eligible general government employees. Plan assets are held by the City through a third party in a fiduciary capacity.
Other Post Employment Benefits FundThe Other Post Employment Benefits Fund accounts for the City’s contributions and retirees’ contributions to health, life insurance, and Medicare supplement benefits provided to eligible retirees.
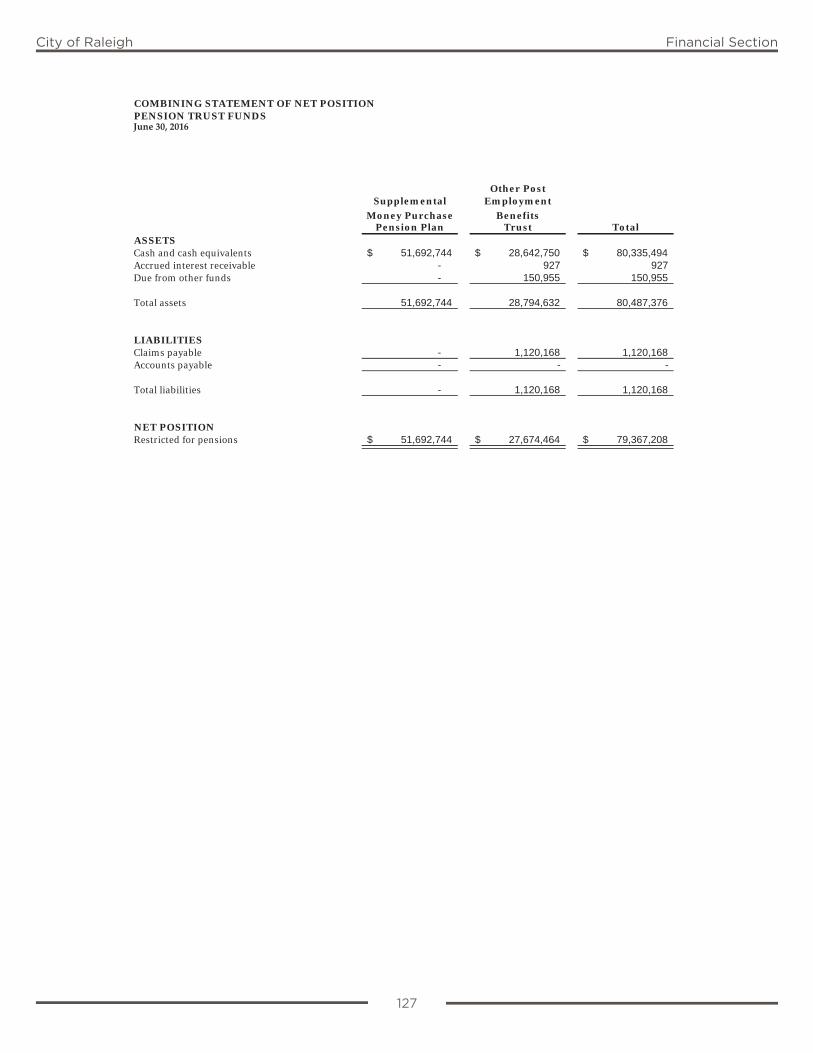
127
City of Raleigh Financial Section
COMBINING STATEMENT OF NET POSITIONPENSION TRUST FUNDSJune 30, 2016
Other PostSupplemental Employment
Money Purchase Benefits Pension Plan Trust Total
ASSETSCash and cash equivalents 51,692,744$ 28,642,750$ 80,335,494$ Accrued interest receivable - 927 927 Due from other funds - 150,955 150,955
Total assets 51,692,744 28,794,632 80,487,376
LIABILITIESClaims payable - 1,120,168 1,120,168 Accounts payable - - -
Total liabilities - 1,120,168 1,120,168
NET POSITIONRestricted for pensions 51,692,744$ 27,674,464$ 79,367,208$
127
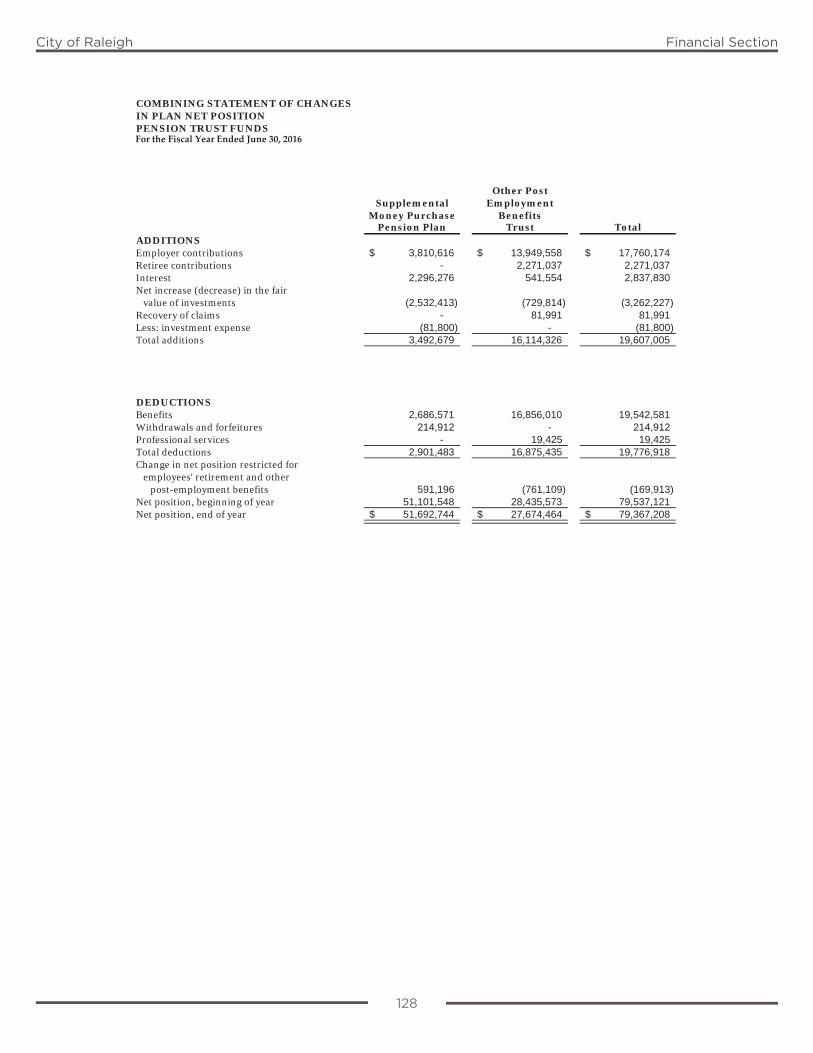
128
City of Raleigh Financial Section
COMBINING STATEMENT OF CHANGES IN PLAN NET POSITIONPENSION TRUST FUNDSFor the Fiscal Year Ended June 30, 2016
Other PostSupplemental Employment
Money Purchase BenefitsPension Plan Trust Total
ADDITIONSEmployer contributions 3,810,616$ 13,949,558$ 17,760,174$ Retiree contributions - 2,271,037 2,271,037 Interest 2,296,276 541,554 2,837,830 Net increase (decrease) in the fair value of investments (2,532,413) (729,814) (3,262,227) Recovery of claims - 81,991 81,991 Less: investment expense (81,800) - (81,800) Total additions 3,492,679 16,114,326 19,607,005
DEDUCTIONSBenefits 2,686,571 16,856,010 19,542,581 Withdrawals and forfeitures 214,912 - 214,912 Professional services - 19,425 19,425 Total deductions 2,901,483 16,875,435 19,776,918 Change in net position restricted for employees' retirement and other
post-employment benefits 591,196 (761,109) (169,913) Net position, beginning of year 51,101,548 28,435,573 79,537,121 Net position, end of year 51,692,744$ 27,674,464$ 79,367,208$
128

City of Raleigh Financial Section

City of Raleigh Financial Section
Other Schedules
The Other Schedules represent various financial schedules of the City. Included are a schedule of long-term obligation maturities covering all fund types and detailed schedules of general, enterprise, and internal service long-term obligations.
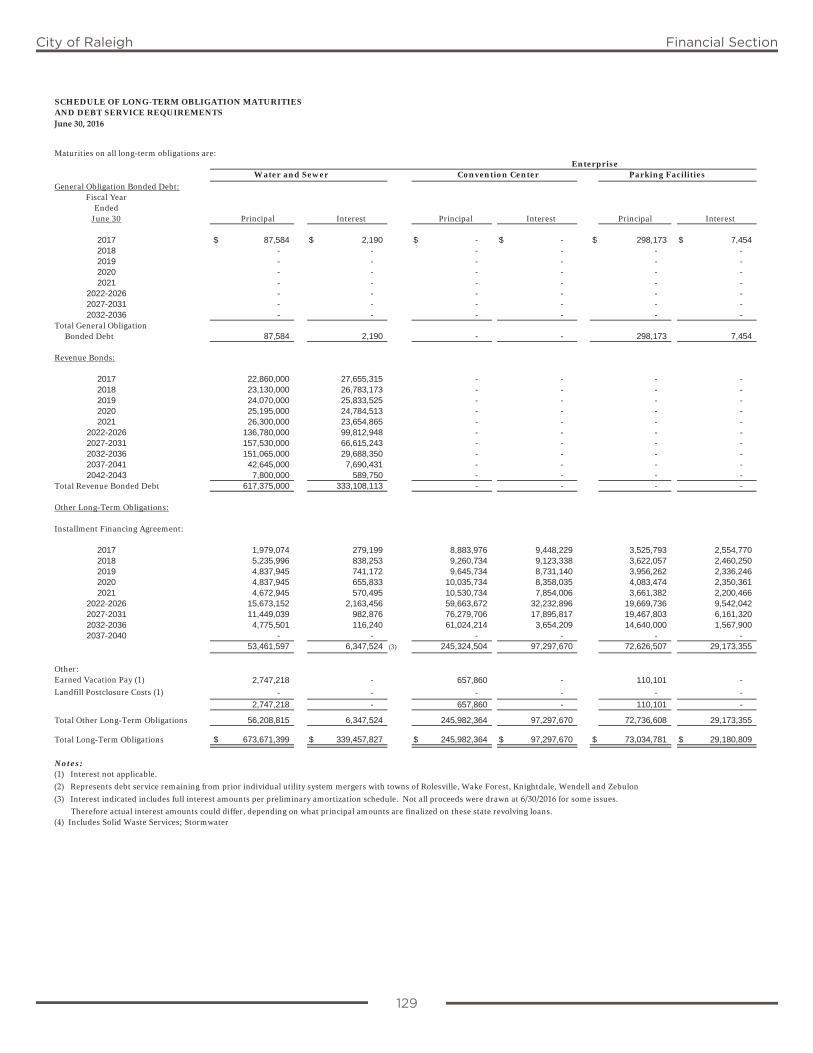
129
City of Raleigh Financial Section
SCHEDULE OF LONG-TERM OBLIGATION MATURITIESAND DEBT SERVICE REQUIREMENTSJune 30, 2016
Maturities on all long-term obligations are:
Water and Sewer Parking Facilities
General Obligation Bonded Debt:Fiscal Year
EndedJune 30 Principal Interest Principal Interest Principal Interest
2017 $ 87,584 $ 2,190 $ - $ - $ 298,173 $ 7,4542018 - - - - - -2019 - - - - - -2020 - - - - - -2021 - - - - - -
2022-2026 - - - - - -2027-2031 - - - - - -2032-2036 - - - - - -
Total General Obligation Bonded Debt 87,584 2,190 - - 298,173 7,454
Revenue Bonds:
2017 22,860,000 27,655,315 - - - -2018 23,130,000 26,783,173 - - - -2019 24,070,000 25,833,525 - - - -2020 25,195,000 24,784,513 - - - -2021 26,300,000 23,654,865 - - - -
2022-2026 136,780,000 99,812,948 - - - -2027-2031 157,530,000 66,615,243 - - - -2032-2036 151,065,000 29,688,350 - - - -2037-2041 42,645,000 7,690,431 - - - -2042-2043 7,800,000 589,750 - - - -
Total Revenue Bonded Debt 617,375,000 333,108,113 - - - -
Other Long-Term Obligations:
Installment Financing Agreement:
2017 1,979,074 279,199 8,883,976 9,448,229 3,525,793 2,554,7702018 5,235,996 838,253 9,260,734 9,123,338 3,622,057 2,460,2502019 4,837,945 741,172 9,645,734 8,731,140 3,956,262 2,336,2462020 4,837,945 655,833 10,035,734 8,358,035 4,083,474 2,350,3612021 4,672,945 570,495 10,530,734 7,854,006 3,661,382 2,200,466
2022-2026 15,673,152 2,163,456 59,663,672 32,232,896 19,669,736 9,542,0422027-2031 11,449,039 982,876 76,279,706 17,895,817 19,467,803 6,161,3202032-2036 4,775,501 116,240 61,024,214 3,654,209 14,640,000 1,567,9002037-2040 - - - - - -
53,461,597 6,347,524 (3) 245,324,504 97,297,670 72,626,507 29,173,355
Other:Earned Vacation Pay (1) 2,747,218 - 657,860 - 110,101 -
Landfill Postclosure Costs (1) - - - - - -
2,747,218 - 657,860 - 110,101 -
Total Other Long-Term Obligations 56,208,815 6,347,524 245,982,364 97,297,670 72,736,608 29,173,355
Total Long-Term Obligations $ 673,671,399 $ 339,457,827 $ 245,982,364 $ 97,297,670 $ 73,034,781 $ 29,180,809
Notes:(1) Interest not applicable.
(2) Represents debt service remaining from prior individual utility system mergers with towns of Rolesville, Wake Forest, Knightdale, Wendell and Zebulon
(3) Interest indicated includes full interest amounts per preliminary amortization schedule. Not all proceeds were drawn at 6/30/2016 for some issues.
Therefore actual interest amounts could differ, depending on what principal amounts are finalized on these state revolving loans.(4) Includes Solid Waste Services; Stormwater
EnterpriseConvention Center
129
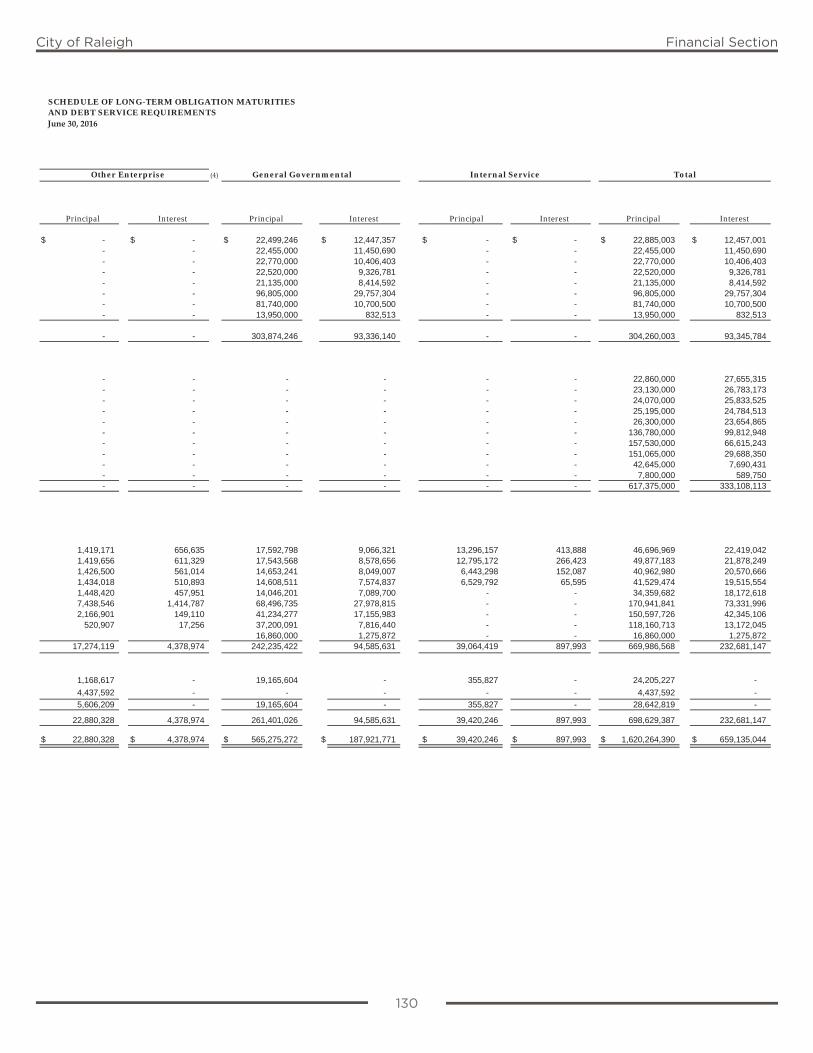
130
City of Raleigh Financial Section
SCHEDULE OF LONG-TERM OBLIGATION MATURITIESAND DEBT SERVICE REQUIREMENTSJune 30, 2016
(4) General Governmental Total
Principal Interest Principal Interest Principal Interest Principal Interest
$ - $ - $ 22,499,246 $ 12,447,357 $ - $ - $ 22,885,003 $ 12,457,001- - 22,455,000 11,450,690 - - 22,455,000 11,450,690- - 22,770,000 10,406,403 - - 22,770,000 10,406,403- - 22,520,000 9,326,781 - - 22,520,000 9,326,781- - 21,135,000 8,414,592 - - 21,135,000 8,414,592- - 96,805,000 29,757,304 - - 96,805,000 29,757,304- - 81,740,000 10,700,500 - - 81,740,000 10,700,500- - 13,950,000 832,513 - - 13,950,000 832,513
- - 303,874,246 93,336,140 - - 304,260,003 93,345,784
- - - - - - 22,860,000 27,655,315- - - - - - 23,130,000 26,783,173- - - - - - 24,070,000 25,833,525- - - - - - 25,195,000 24,784,513- - - - - - 26,300,000 23,654,865- - - - - - 136,780,000 99,812,948- - - - - - 157,530,000 66,615,243- - - - - - 151,065,000 29,688,350- - - - - - 42,645,000 7,690,431- - - - - - 7,800,000 589,750- - - - - - 617,375,000 333,108,113
1,419,171 656,635 17,592,798 9,066,321 13,296,157 413,888 46,696,969 22,419,0421,419,656 611,329 17,543,568 8,578,656 12,795,172 266,423 49,877,183 21,878,2491,426,500 561,014 14,653,241 8,049,007 6,443,298 152,087 40,962,980 20,570,6661,434,018 510,893 14,608,511 7,574,837 6,529,792 65,595 41,529,474 19,515,5541,448,420 457,951 14,046,201 7,089,700 - - 34,359,682 18,172,6187,438,546 1,414,787 68,496,735 27,978,815 - - 170,941,841 73,331,9962,166,901 149,110 41,234,277 17,155,983 - - 150,597,726 42,345,106
520,907 17,256 37,200,091 7,816,440 - - 118,160,713 13,172,04516,860,000 1,275,872 - - 16,860,000 1,275,872
17,274,119 4,378,974 242,235,422 94,585,631 39,064,419 897,993 669,986,568 232,681,147
1,168,617 - 19,165,604 - 355,827 - 24,205,227 -
4,437,592 - - - - - 4,437,592 -
5,606,209 - 19,165,604 - 355,827 - 28,642,819 -
22,880,328 4,378,974 261,401,026 94,585,631 39,420,246 897,993 698,629,387 232,681,147
$ 22,880,328 $ 4,378,974 $ 565,275,272 $ 187,921,771 $ 39,420,246 $ 897,993 $ 1,620,264,390 $ 659,135,044
Other Enterprise Internal Service
130
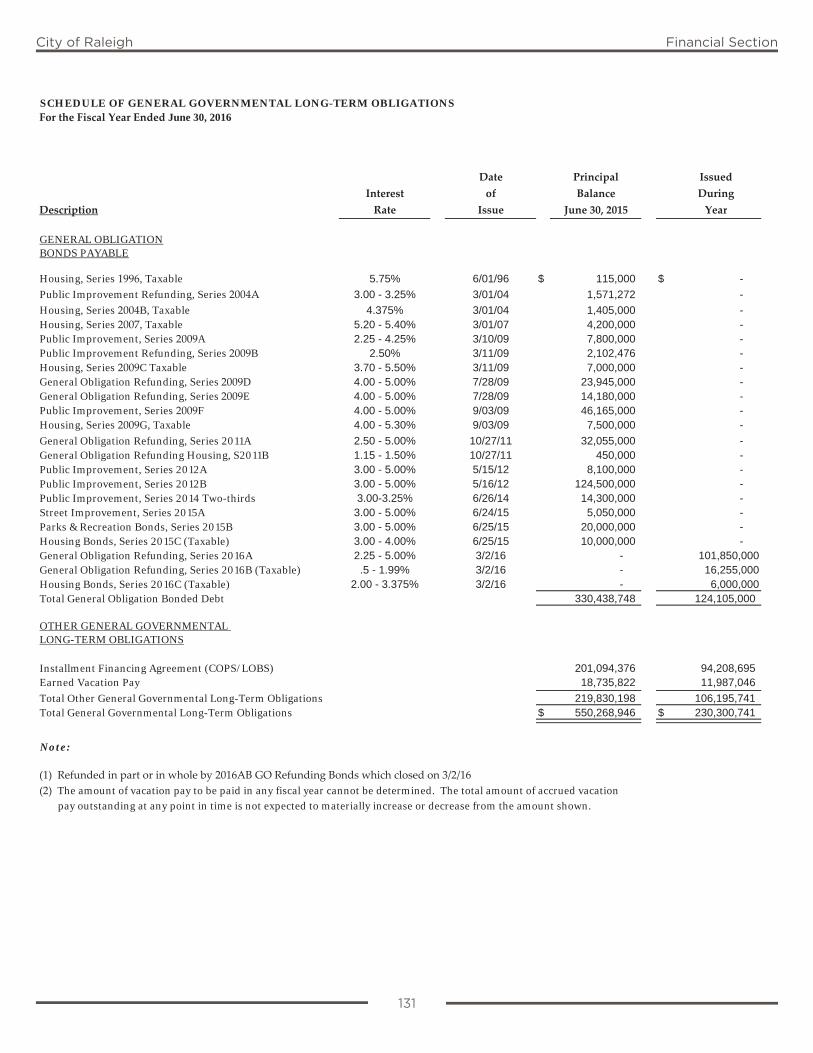
131
City of Raleigh Financial Section
SCHEDULE OF GENERAL GOVERNMENTAL LONG-TERM OBLIGATIONSFor the Fiscal Year Ended June 30, 2016
Date Principal IssuedInterest of Balance During
Description Rate Issue June 30, 2015 Year
GENERAL OBLIGATIONBONDS PAYABLE
Housing, Series 1996, Taxable 5.75% 6/01/96 $ 115,000 $ -
Public Improvement Refunding, Series 2004A 3.00 - 3.25% 3/01/04 1,571,272 -
Housing, Series 2004B, Taxable 4.375% 3/01/04 1,405,000 - Housing, Series 2007, Taxable 5.20 - 5.40% 3/01/07 4,200,000 -Public Improvement, Series 2009A 2.25 - 4.25% 3/10/09 7,800,000 -Public Improvement Refunding, Series 2009B 2.50% 3/11/09 2,102,476 -Housing, Series 2009C Taxable 3.70 - 5.50% 3/11/09 7,000,000 -General Obligation Refunding, Series 2009D 4.00 - 5.00% 7/28/09 23,945,000 -General Obligation Refunding, Series 2009E 4.00 - 5.00% 7/28/09 14,180,000 -Public Improvement, Series 2009F 4.00 - 5.00% 9/03/09 46,165,000 -Housing, Series 2009G, Taxable 4.00 - 5.30% 9/03/09 7,500,000 -
General Obligation Refunding, Series 2011A 2.50 - 5.00% 10/27/11 32,055,000 - General Obligation Refunding Housing, S2011B 1.15 - 1.50% 10/27/11 450,000 - Public Improvement, Series 2012A 3.00 - 5.00% 5/15/12 8,100,000 - Public Improvement, Series 2012B 3.00 - 5.00% 5/16/12 124,500,000 - Public Improvement, Series 2014 Two-thirds 3.00-3.25% 6/26/14 14,300,000 - Street Improvement, Series 2015A 3.00 - 5.00% 6/24/15 5,050,000 - Parks & Recreation Bonds, Series 2015B 3.00 - 5.00% 6/25/15 20,000,000 - Housing Bonds, Series 2015C (Taxable) 3.00 - 4.00% 6/25/15 10,000,000 - General Obligation Refunding, Series 2016A 2.25 - 5.00% 3/2/16 - 101,850,000General Obligation Refunding, Series 2016B (Taxable) .5 - 1.99% 3/2/16 - 16,255,000Housing Bonds, Series 2016C (Taxable) 2.00 - 3.375% 3/2/16 - 6,000,000Total General Obligation Bonded Debt 330,438,748 124,105,000
OTHER GENERAL GOVERNMENTAL LONG-TERM OBLIGATIONS
Installment Financing Agreement (COPS/LOBS) 201,094,376 94,208,695 Earned Vacation Pay 18,735,822 11,987,046
Total Other General Governmental Long-Term Obligations 219,830,198 106,195,741 Total General Governmental Long-Term Obligations $ 550,268,946 $ 230,300,741
Note:
(1) Refunded in part or in whole by 2016AB GO Refunding Bonds which closed on 3/2/16(2) The amount of vacation pay to be paid in any fiscal year cannot be determined. The total amount of accrued vacation pay outstanding at any point in time is not expected to materially increase or decrease from the amount shown.
131
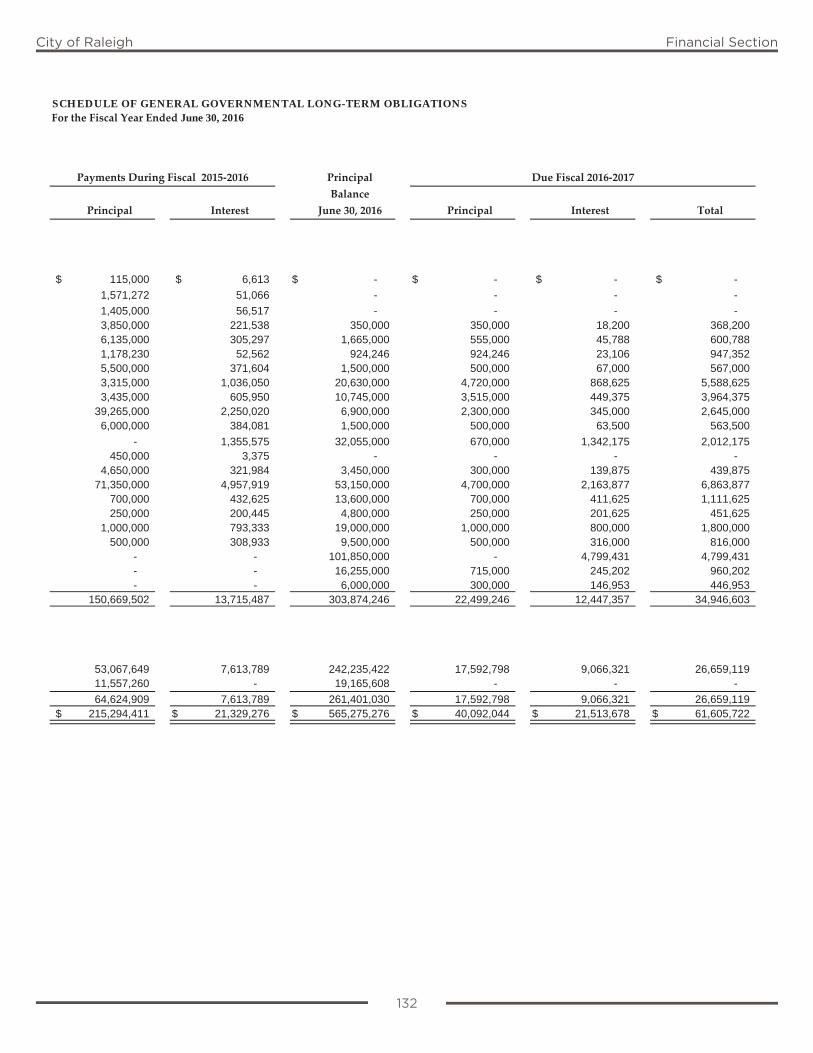
132
City of Raleigh Financial Section
SCHEDULE OF GENERAL GOVERNMENTAL LONG-TERM OBLIGATIONSFor the Fiscal Year Ended June 30, 2016
PrincipalBalance
Principal Interest June 30, 2016 Principal Interest Total
$ 115,000 $ 6,613 $ - $ - $ - $ -
1,571,272 51,066 - - - -
1,405,000 56,517 - - - - 3,850,000 221,538 350,000 350,000 18,200 368,2006,135,000 305,297 1,665,000 555,000 45,788 600,7881,178,230 52,562 924,246 924,246 23,106 947,3525,500,000 371,604 1,500,000 500,000 67,000 567,0003,315,000 1,036,050 20,630,000 4,720,000 868,625 5,588,6253,435,000 605,950 10,745,000 3,515,000 449,375 3,964,375
39,265,000 2,250,020 6,900,000 2,300,000 345,000 2,645,0006,000,000 384,081 1,500,000 500,000 63,500 563,500
- 1,355,575 32,055,000 670,000 1,342,175 2,012,175 450,000 3,375 - - - -
4,650,000 321,984 3,450,000 300,000 139,875 439,875 71,350,000 4,957,919 53,150,000 4,700,000 2,163,877 6,863,877
700,000 432,625 13,600,000 700,000 411,625 1,111,625 250,000 200,445 4,800,000 250,000 201,625 451,625
1,000,000 793,333 19,000,000 1,000,000 800,000 1,800,000 500,000 308,933 9,500,000 500,000 316,000 816,000
- - 101,850,000 - 4,799,431 4,799,431 - - 16,255,000 715,000 245,202 960,202 - - 6,000,000 300,000 146,953 446,953
150,669,502 13,715,487 303,874,246 22,499,246 12,447,357 34,946,603
53,067,649 7,613,789 242,235,422 17,592,798 9,066,321 26,659,119 11,557,260 - 19,165,608 - - -
64,624,909 7,613,789 261,401,030 17,592,798 9,066,321 26,659,119 $ 215,294,411 $ 21,329,276 $ 565,275,276 $ 40,092,044 $ 21,513,678 $ 61,605,722
Payments During Fiscal 2015‐2016 Due Fiscal 2016‐2017
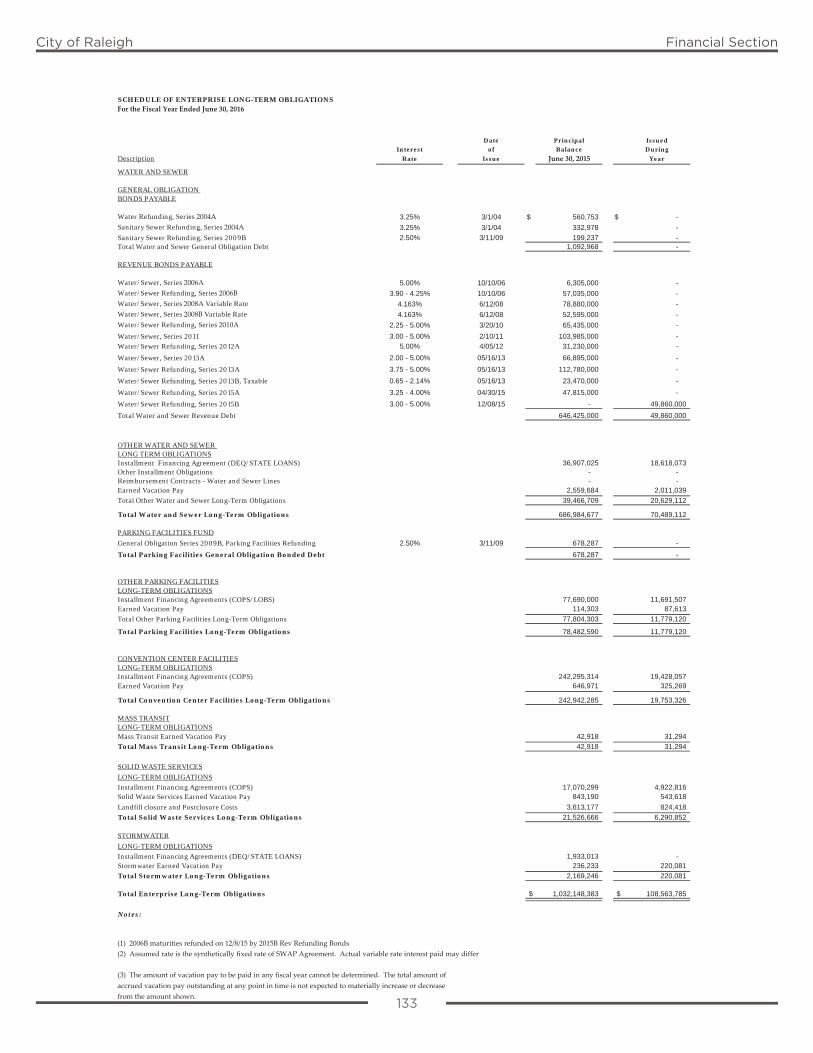
133
City of Raleigh Financial Section
SCHEDULE OF ENTERPRISE LONG-TERM OBLIGATIONSFor the Fiscal Year Ended June 30, 2016
Date Principal IssuedInterest of Balance During
Description Rate Issue June 30, 2015 Year
WATER AND SEWER
GENERAL OBLIGATION BONDS PAYABLE
Water Refunding, Series 2004A 3.25% 3/1/04 $ 560,753 $ -
Sanitary Sewer Refunding, Series 2004A 3.25% 3/1/04 332,978 -
Sanitary Sewer Refunding, Series 2009B 2.50% 3/11/09 199,237 -Total Water and Sewer General Obligation Debt 1,092,968 -
REVENUE BONDS PAYABLE
Water/Sewer, Series 2006A 5.00% 10/10/06 6,305,000 -
Water/Sewer Refunding, Series 2006B 3.90 - 4.25% 10/10/06 57,035,000 -
Water/Sewer, Series 2008A Variable Rate 4.163% 6/12/08 78,880,000 -
Water/Sewer, Series 2008B Variable Rate 4.163% 6/12/08 52,595,000 -
Water/Sewer Refunding, Series 2010A 2.25 - 5.00% 3/20/10 65,435,000 -
Water/Sewer, Series 2011 3.00 - 5.00% 2/10/11 103,985,000 -Water/Sewer Refunding, Series 2012A 5.00% 4/05/12 31,230,000 -
Water/Sewer, Series 2013A 2.00 - 5.00% 05/16/13 66,895,000 -
Water/Sewer Refunding, Series 2013A 3.75 - 5.00% 05/16/13 112,780,000 -
Water/Sewer Refunding, Series 2013B, Taxable 0.65 - 2.14% 05/16/13 23,470,000 -
Water/Sewer Refunding, Series 2015A 3.25 - 4.00% 04/30/15 47,815,000 -
Water/Sewer Refunding, Series 2015B 3.00 - 5.00% 12/08/15 - 49,860,000
Total Water and Sewer Revenue Debt 646,425,000 49,860,000
OTHER WATER AND SEWER LONG TERM OBLIGATIONSInstallment Financing Agreement (DEQ/STATE LOANS) 36,907,025 18,618,073Other Installment Obligations - -Reimbursement Contracts - Water and Sewer Lines - -Earned Vacation Pay 2,559,684 2,011,039
Total Other Water and Sewer Long-Term Obligations 39,466,709 20,629,112
Total Water and Sewer Long-Term Obligations 686,984,677 70,489,112
PARKING FACILITIES FUND
General Obligation Series 2009B, Parking Facilities Refunding 2.50% 3/11/09 678,287 -
Total Parking Facilities General Obligation Bonded Debt 678,287 -
OTHER PARKING FACILITIESLONG-TERM OBLIGATIONSInstallment Financing Agreements (COPS/LOBS) 77,690,000 11,691,507Earned Vacation Pay 114,303 87,613
Total Other Parking Facilities Long-Term Obligations 77,804,303 11,779,120
Total Parking Facilities Long-Term Obligations 78,482,590 11,779,120
CONVENTION CENTER FACILITIESLONG-TERM OBLIGATIONSInstallment Financing Agreements (COPS) 242,295,314 19,428,057Earned Vacation Pay 646,971 325,269
Total Convention Center Facilities Long-Term Obligations 242,942,285 19,753,326
MASS TRANSITLONG-TERM OBLIGATIONSMass Transit Earned Vacation Pay 42,918 31,294
Total Mass Transit Long-Term Obligations 42,918 31,294
SOLID WASTE SERVICES
LONG-TERM OBLIGATIONS
Installment Financing Agreements (COPS) 17,070,299 4,922,816Solid Waste Services Earned Vacation Pay 843,190 543,618
Landfill closure and Postclosure Costs 3,613,177 824,418
Total Solid Waste Services Long-Term Obligations 21,526,666 6,290,852
STORMWATER
LONG-TERM OBLIGATIONS
Installment Financing Agreements (DEQ/STATE LOANS) 1,933,013 -Stormwater Earned Vacation Pay 236,233 220,081
Total Stormwater Long-Term Obligations 2,169,246 220,081
Total Enterprise Long-Term Obligations $ 1,032,148,383 $ 108,563,785
Notes:
(1) 2006B maturities refunded on 12/8/15 by 2015B Rev Refunding Bonds(2) Assumed rate is the synthetically fixed rate of SWAP Agreement. Actual variable rate interest paid may differ.
(3) The amount of vacation pay to be paid in any fiscal year cannot be determined. The total amount of accrued vacation pay outstanding at any point in time is not expected to materially increase or decrease from the amount shown.
133
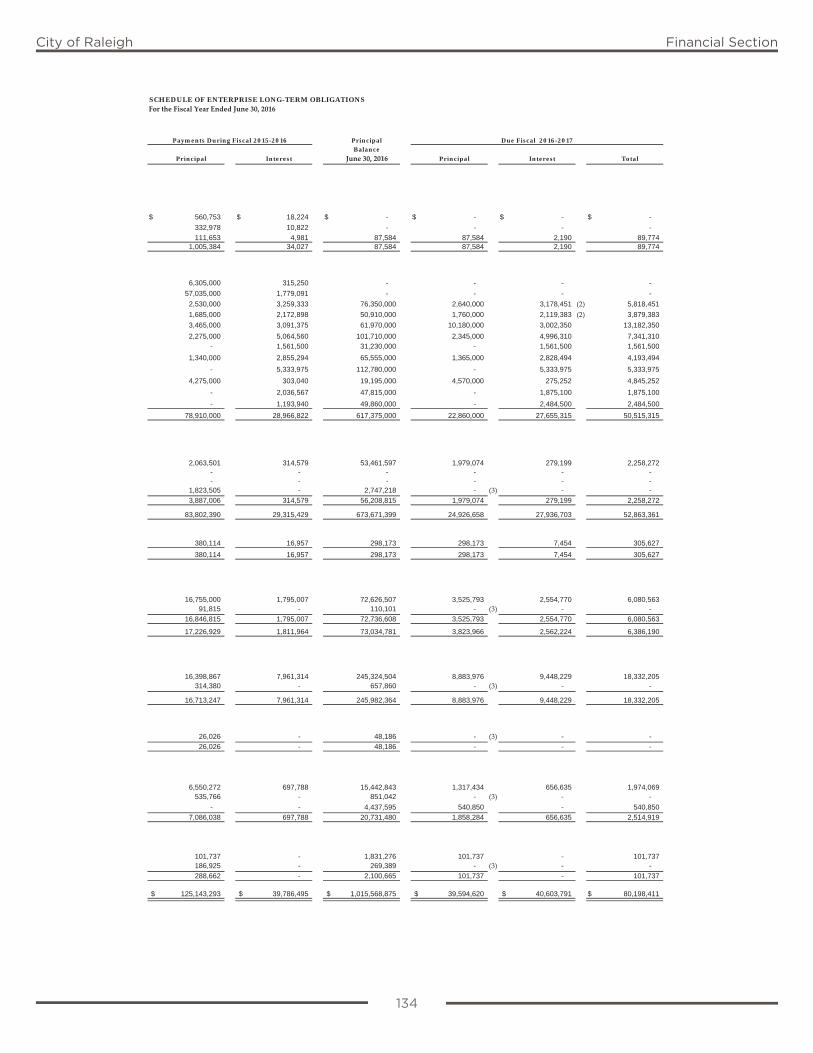
134
City of Raleigh Financial Section
SCHEDULE OF ENTERPRISE LONG-TERM OBLIGATIONSFor the Fiscal Year Ended June 30, 2016
PrincipalBalance
Principal Interest June 30, 2016 Principal Interest Total
$ 560,753 $ 18,224 $ - $ - $ - $ -
332,978 10,822 - - - -
111,653 4,981 87,584 87,584 2,190 89,7741,005,384 34,027 87,584 87,584 2,190 89,774
6,305,000 315,250 - - - -
57,035,000 1,779,091 - - - -
2,530,000 3,259,333 76,350,000 2,640,000 3,178,451 (2) 5,818,451
1,685,000 2,172,898 50,910,000 1,760,000 2,119,383 (2) 3,879,383
3,465,000 3,091,375 61,970,000 10,180,000 3,002,350 13,182,350
2,275,000 5,064,560 101,710,000 2,345,000 4,996,310 7,341,310- 1,561,500 31,230,000 - 1,561,500 1,561,500
1,340,000 2,855,294 65,555,000 1,365,000 2,828,494 4,193,494
- 5,333,975 112,780,000 - 5,333,975 5,333,975
4,275,000 303,040 19,195,000 4,570,000 275,252 4,845,252
- 2,036,567 47,815,000 - 1,875,100 1,875,100
- 1,193,940 49,860,000 - 2,484,500 2,484,500
78,910,000 28,966,822 617,375,000 22,860,000 27,655,315 50,515,315
2,063,501 314,579 53,461,597 1,979,074 279,199 2,258,272- - - - - -- - - - - -
1,823,505 - 2,747,218 - (3) - -
3,887,006 314,579 56,208,815 1,979,074 279,199 2,258,272
83,802,390 29,315,429 673,671,399 24,926,658 27,936,703 52,863,361
380,114 16,957 298,173 298,173 7,454 305,627
380,114 16,957 298,173 298,173 7,454 305,627
16,755,000 1,795,007 72,626,507 3,525,793 2,554,770 6,080,56391,815 - 110,101 - (3) - -
16,846,815 1,795,007 72,736,608 3,525,793 2,554,770 6,080,563
17,226,929 1,811,964 73,034,781 3,823,966 2,562,224 6,386,190
16,398,867 7,961,314 245,324,504 8,883,976 9,448,229 18,332,205314,380 - 657,860 - (3) - -
16,713,247 7,961,314 245,982,364 8,883,976 9,448,229 18,332,205
26,026 - 48,186 - (3) - -
26,026 - 48,186 - - -
6,550,272 697,788 15,442,843 1,317,434 656,635 1,974,069535,766 - 851,042 - (3) - -
- - 4,437,595 540,850 - 540,850
7,086,038 697,788 20,731,480 1,858,284 656,635 2,514,919
101,737 - 1,831,276 101,737 - 101,737186,925 - 269,389 - (3) - -
288,662 - 2,100,665 101,737 - 101,737
$ 125,143,293 $ 39,786,495 $ 1,015,568,875 $ 39,594,620 $ 40,603,791 $ 80,198,411
Payments During Fiscal 2015-2016 Due Fiscal 2016-2017
134

135
City of Raleigh Financial Section
SCHEDULE OF INTERNAL SERVICE LONG-TERM OBLIGATIONSFor the Fiscal Year Ended June 30, 2016
Date
Interest ofDescription Rate Issue
EQUIPMENT INTERNAL SERVICE
LONG-TERM OBLIGATIONS PAYABLE
INSTALLMENT FINANCING AGREEMENTS:
Equipment Acquisition Project, Series 2011 1.75% 05/18/11 $ 2,422,583 $ -
Equipment Acquisition Project, Series 2013 0.9007% 05/13/13 20,482,062 -
Equipment Acquisition Project, Series 2015 1.3379% 06/18/15 31,850,676 -
Total Installment Financing Agreements: 54,755,321 -
OTHER INTERNAL SERVICE
LONG-TERM OBLIGATIONS
Earned Vacation Pay - Risk Management 16,522 19,979
Earned Vacation Pay - Vehicle Fleet Services 308,033 201,915
Total Other Internal Service Long-Term Obligations 324,555 221,894
Total Internal Service Long-Term Obligations $ 55,079,876 $ 221,894
Note:
(1) The amount of vacation pay to be paid in any fiscal year cannot be determined.
Principal Issued
Balance DuringJune 30, 2015 Year
135
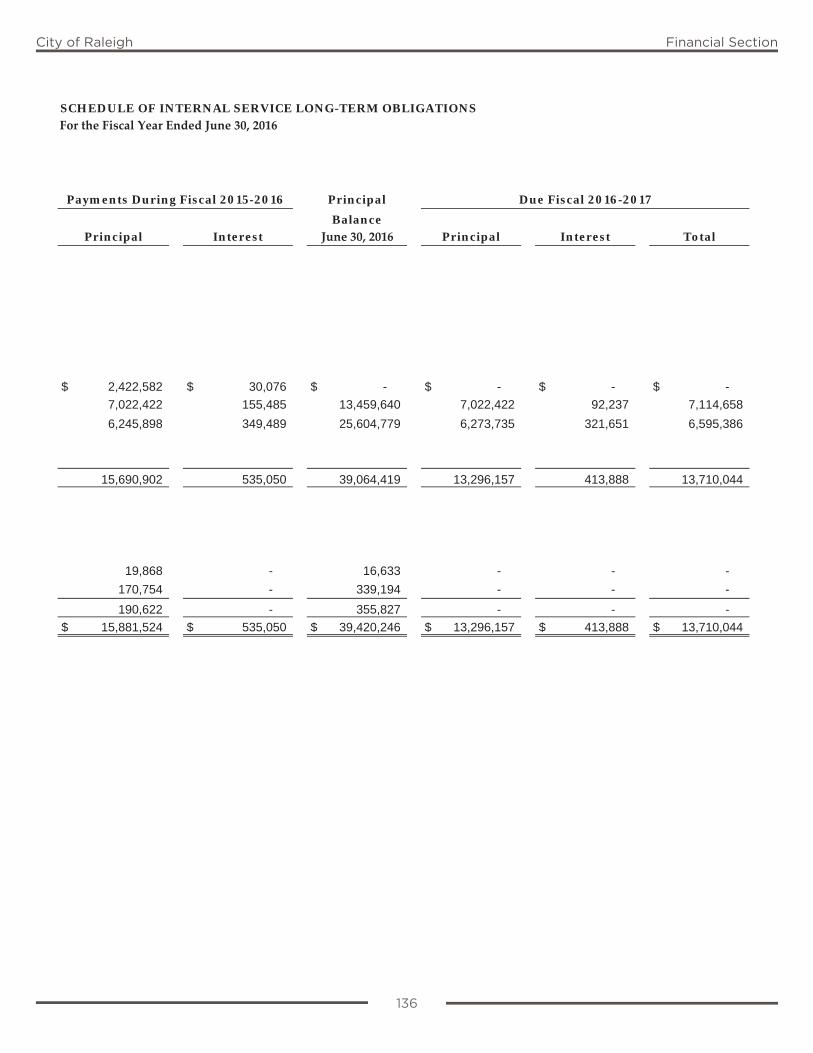
136
City of Raleigh Financial Section
SCHEDULE OF INTERNAL SERVICE LONG-TERM OBLIGATIONSFor the Fiscal Year Ended June 30, 2016
$ 2,422,582 $ 30,076 $ - $ - $ - $ -
7,022,422 155,485 13,459,640 7,022,422 92,237 7,114,658
6,245,898 349,489 25,604,779 6,273,735 321,651 6,595,386
15,690,902 535,050 39,064,419 13,296,157 413,888 13,710,044
19,868 - 16,633 - - -
170,754 - 339,194 - - -
190,622 - 355,827 - - -
$ 15,881,524 $ 535,050 $ 39,420,246 $ 13,296,157 $ 413,888 $ 13,710,044
Principal
Principal
BalancePrincipal Interest June 30, 2016
Payments During Fiscal 2015-2016 Due Fiscal 2016-2017
Interest Total
136

City of Raleigh Financial Section
138
City of Raleigh Financial Section
STATISTICAL SECTIONThe Statistical Section presents detailed information on financial trends, revenue capacity,
debt capacity, demographic and economic information, and operating information as a context for understanding what the information in the financial statements, note disclosures
and required supplementary information says about the City’s overall health.

139
City of Raleigh Financial Section
City of Raleigh Statistical Section
Statistical Schedules
This part of the Comprehensive Annual Financial Report presents detailed information as a context for understanding what the information in the financial statements, note disclosures, and required supplementary information says about the City’s overall financial health.
Financial TrendsThese schedules contain trend information to help the reader understand how the City’s financial performance and well-being have changed over time.
Revenue CapacityThese schedules contain information to help the reader assess the City’s most significant local revenue source, the property tax.
Debt CapacityThese schedules present information to help the reader assess the affordability of the City’s current levels of outstanding debt and the City’s ability to issue additional debt in the future.
Demographic and Economic InformationThese schedules offer demographic and economic indicators to help the reader understand the environment within which the City’s financial activities take place.
Operating InformationThese schedules contain service and infrastructure data to help the reader understand how the information in the City’s financial report relates to the services the government provides and the activities it performs.
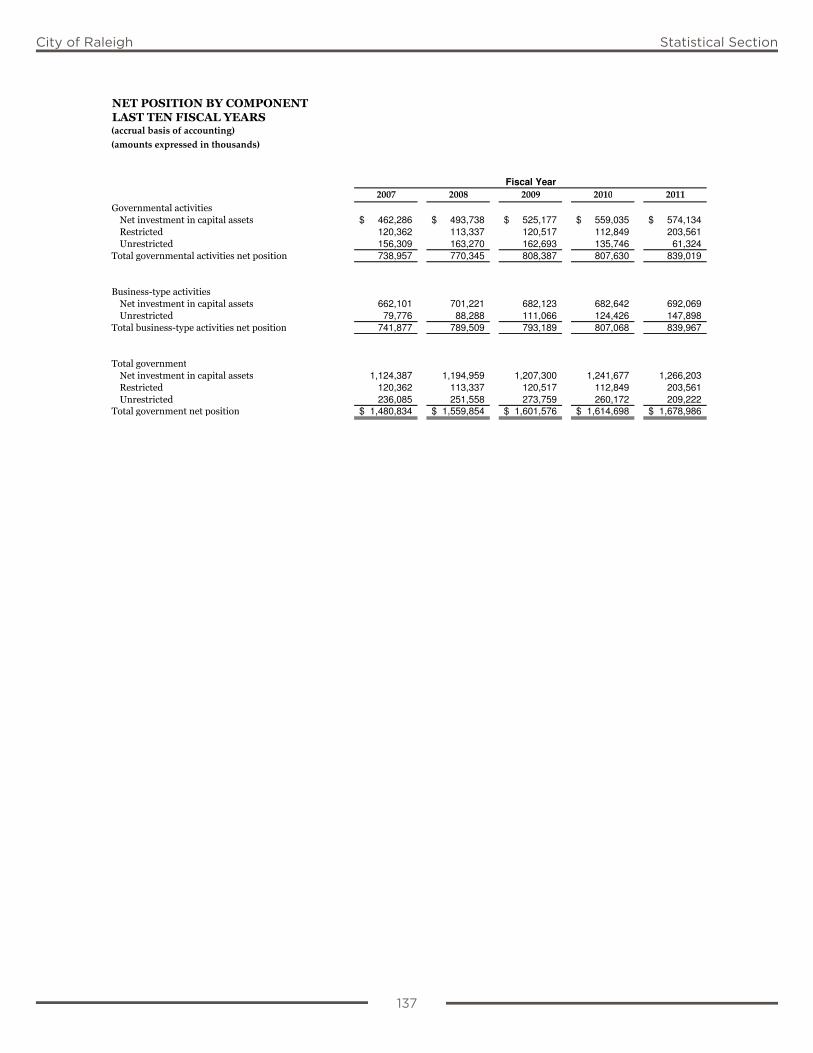
137
City of Raleigh Statistical Section
(accrual basis of accounting)(amounts expressed in thousands)
2007 2008 2009 2010 2011 462,286$ 493,738$ 525,177$ 559,035$ 574,134$
120,362 113,337 120,517 112,849 203,561
156,309 163,270 162,693 135,746 61,324
738,957 770,345 808,387 807,630 839,019
662,101 701,221 682,123 682,642 692,069
79,776 88,288 111,066 124,426 147,898
741,877 789,509 793,189 807,068 839,967
1,124,387 1,194,959 1,207,300 1,241,677 1,266,203
120,362 113,337 120,517 112,849 203,561
236,085 251,558 273,759 260,172 209,222 1,480,834$ 1,559,854$ 1,601,576$ 1,614,698$ 1,678,986$
Fiscal Year
137
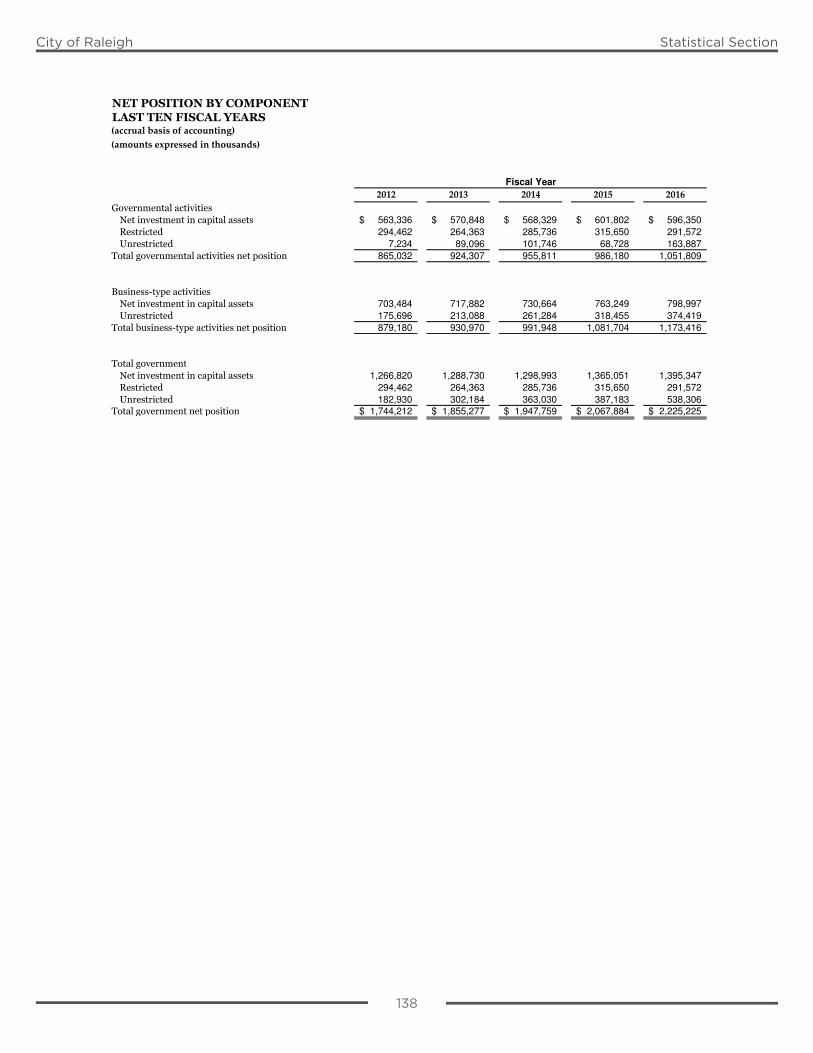
138
City of Raleigh Statistical Section
(accrual basis of accounting)(amounts expressed in thousands)
2012 2013 2014 2015 2016 563,336$ 570,848$ 568,329$ 601,802$ 596,350$
294,462 264,363 285,736 315,650 291,572
7,234 89,096 101,746 68,728 163,887
865,032 924,307 955,811 986,180 1,051,809
703,484 717,882 730,664 763,249 798,997
175,696 213,088 261,284 318,455 374,419
879,180 930,970 991,948 1,081,704 1,173,416
1,266,820 1,288,730 1,298,993 1,365,051 1,395,347
294,462 264,363 285,736 315,650 291,572
182,930 302,184 363,030 387,183 538,306 1,744,212$ 1,855,277$ 1,947,759$ 2,067,884$ 2,225,225$
Fiscal Year
138
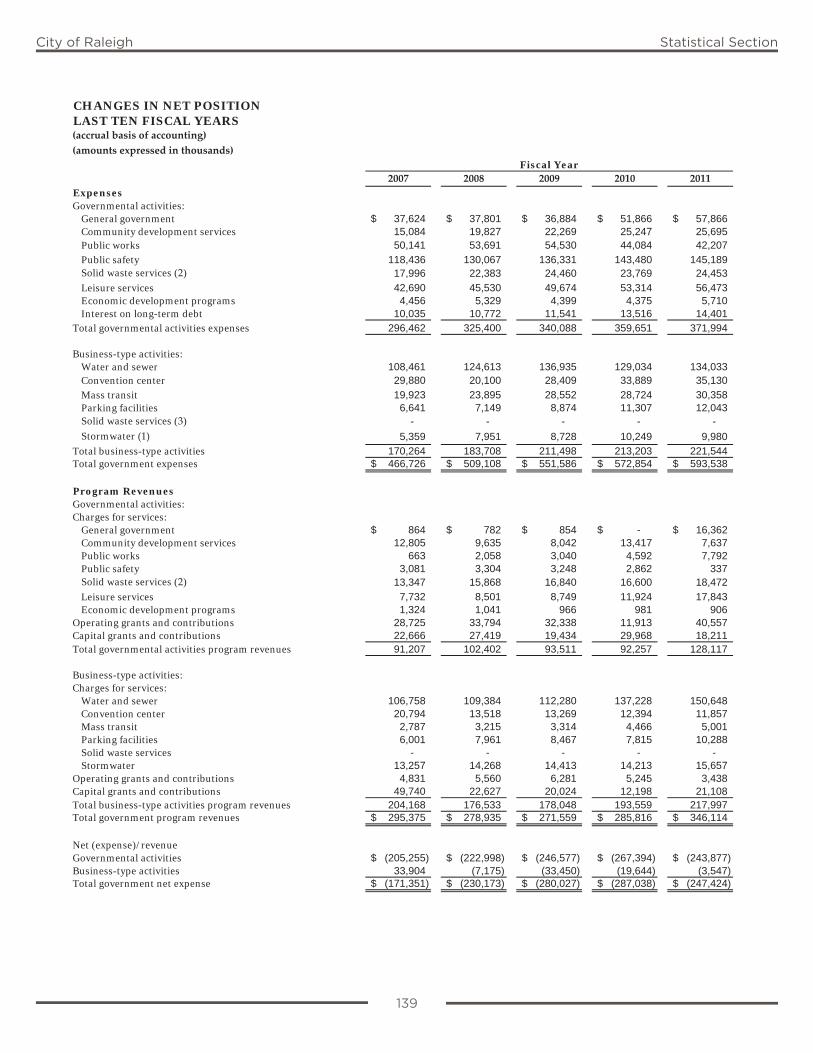
139
City of Raleigh Statistical Section
CHANGES IN NET POSITIONLAST TEN FISCAL YEARS(accrual basis of accounting)(amounts expressed in thousands)
2007 2008 2009 2010 2011ExpensesGovernmental activities:
General government 37,624$ 37,801$ 36,884$ 51,866$ 57,866$ Community development services 15,084 19,827 22,269 25,247 25,695 Public works 50,141 53,691 54,530 44,084 42,207
Public safety 118,436 130,067 136,331 143,480 145,189 Solid waste services (2) 17,996 22,383 24,460 23,769 24,453
Leisure services 42,690 45,530 49,674 53,314 56,473 Economic development programs 4,456 5,329 4,399 4,375 5,710 Interest on long-term debt 10,035 10,772 11,541 13,516 14,401
Total governmental activities expenses 296,462 325,400 340,088 359,651 371,994
Business-type activities:Water and sewer 108,461 124,613 136,935 129,034 134,033 Convention center 29,880 20,100 28,409 33,889 35,130
Mass transit 19,923 23,895 28,552 28,724 30,358Parking facilities 6,641 7,149 8,874 11,307 12,043 Solid waste services (3) - - - - -
Stormwater (1) 5,359 7,951 8,728 10,249 9,980
Total business-type activities 170,264 183,708 211,498 213,203 221,544 Total government expenses 466,726$ 509,108$ 551,586$ 572,854$ 593,538$
Program RevenuesGovernmental activities:Charges for services:
General government 864$ 782$ 854$ -$ 16,362$ Community development services 12,805 9,635 8,042 13,417 7,637 Public works 663 2,058 3,040 4,592 7,792 Public safety 3,081 3,304 3,248 2,862 337 Solid waste services (2) 13,347 15,868 16,840 16,600 18,472
Leisure services 7,732 8,501 8,749 11,924 17,843 Economic development programs 1,324 1,041 966 981 906
Operating grants and contributions 28,725 33,794 32,338 11,913 40,557 Capital grants and contributions 22,666 27,419 19,434 29,968 18,211 Total governmental activities program revenues 91,207 102,402 93,511 92,257 128,117
Business-type activities:Charges for services:
Water and sewer 106,758 109,384 112,280 137,228 150,648 Convention center 20,794 13,518 13,269 12,394 11,857 Mass transit 2,787 3,215 3,314 4,466 5,001Parking facilities 6,001 7,961 8,467 7,815 10,288 Solid waste services - - - - - Stormwater 13,257 14,268 14,413 14,213 15,657
Operating grants and contributions 4,831 5,560 6,281 5,245 3,438 Capital grants and contributions 49,740 22,627 20,024 12,198 21,108 Total business-type activities program revenues 204,168 176,533 178,048 193,559 217,997 Total government program revenues 295,375$ 278,935$ 271,559$ 285,816$ 346,114$
Net (expense)/revenueGovernmental activities (205,255)$ (222,998)$ (246,577)$ (267,394)$ (243,877)$Business-type activities 33,904 (7,175) (33,450) (19,644) (3,547) Total government net expense (171,351)$ (230,173)$ (280,027)$ (287,038)$ (247,424)$
Fiscal Year
139
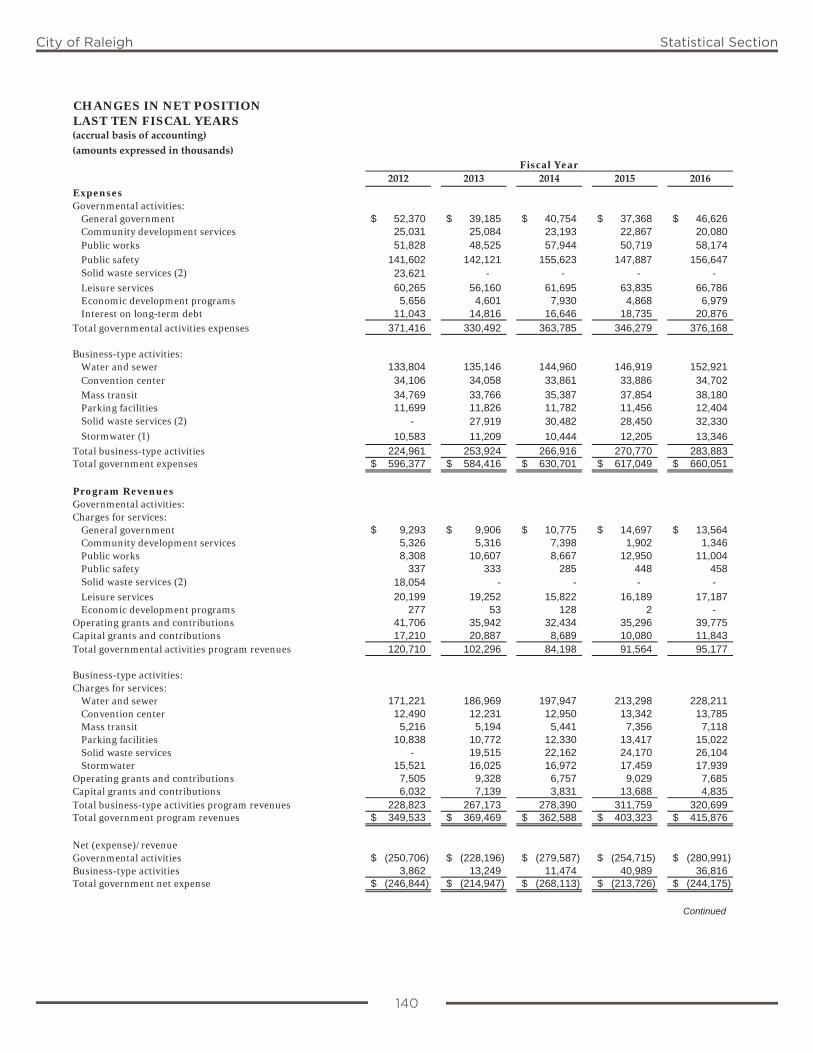
140
City of Raleigh Statistical Section
CHANGES IN NET POSITIONLAST TEN FISCAL YEARS(accrual basis of accounting)(amounts expressed in thousands)
2012 2013 2014 2015 2016ExpensesGovernmental activities:
General government 52,370$ 39,185$ 40,754$ 37,368$ 46,626$ Community development services 25,031 25,084 23,193 22,867 20,080 Public works 51,828 48,525 57,944 50,719 58,174
Public safety 141,602 142,121 155,623 147,887 156,647 Solid waste services (2) 23,621 - - - -
Leisure services 60,265 56,160 61,695 63,835 66,786 Economic development programs 5,656 4,601 7,930 4,868 6,979 Interest on long-term debt 11,043 14,816 16,646 18,735 20,876
Total governmental activities expenses 371,416 330,492 363,785 346,279 376,168
Business-type activities:Water and sewer 133,804 135,146 144,960 146,919 152,921 Convention center 34,106 34,058 33,861 33,886 34,702
Mass transit 34,769 33,766 35,387 37,854 38,180Parking facilities 11,699 11,826 11,782 11,456 12,404 Solid waste services (2) - 27,919 30,482 28,450 32,330
Stormwater (1) 10,583 11,209 10,444 12,205 13,346
Total business-type activities 224,961 253,924 266,916 270,770 283,883 Total government expenses 596,377$ 584,416$ 630,701$ 617,049$ 660,051$
Program RevenuesGovernmental activities:Charges for services:
General government 9,293$ 9,906$ 10,775$ 14,697$ 13,564$ Community development services 5,326 5,316 7,398 1,902 1,346 Public works 8,308 10,607 8,667 12,950 11,004 Public safety 337 333 285 448 458 Solid waste services (2) 18,054 - - - -
Leisure services 20,199 19,252 15,822 16,189 17,187 Economic development programs 277 53 128 2 -
Operating grants and contributions 41,706 35,942 32,434 35,296 39,775 Capital grants and contributions 17,210 20,887 8,689 10,080 11,843 Total governmental activities program revenues 120,710 102,296 84,198 91,564 95,177
Business-type activities:Charges for services:
Water and sewer 171,221 186,969 197,947 213,298 228,211 Convention center 12,490 12,231 12,950 13,342 13,785 Mass transit 5,216 5,194 5,441 7,356 7,118Parking facilities 10,838 10,772 12,330 13,417 15,022 Solid waste services - 19,515 22,162 24,170 26,104 Stormwater 15,521 16,025 16,972 17,459 17,939
Operating grants and contributions 7,505 9,328 6,757 9,029 7,685 Capital grants and contributions 6,032 7,139 3,831 13,688 4,835 Total business-type activities program revenues 228,823 267,173 278,390 311,759 320,699 Total government program revenues 349,533$ 369,469$ 362,588$ 403,323$ 415,876$
Net (expense)/revenueGovernmental activities (250,706)$ (228,196)$ (279,587)$ (254,715)$ (280,991)$Business-type activities 3,862 13,249 11,474 40,989 36,816 Total government net expense (246,844)$ (214,947)$ (268,113)$ (213,726)$ (244,175)$
Continued
Fiscal Year
140
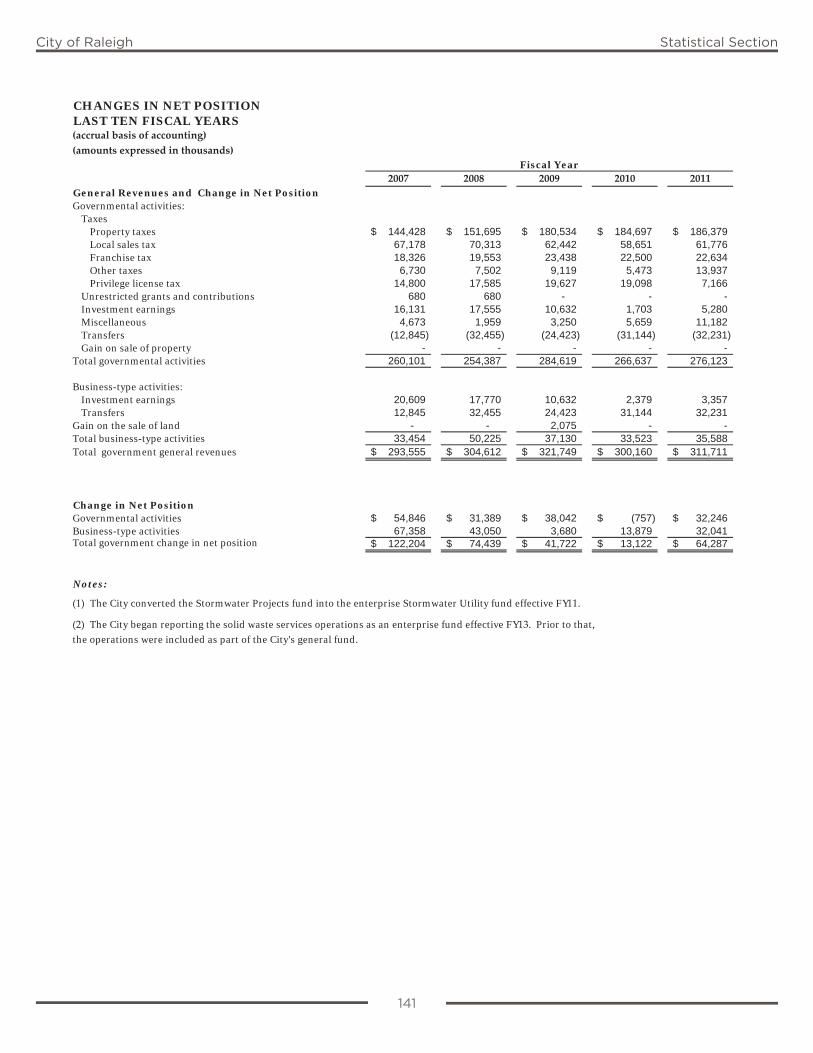
141
City of Raleigh Statistical Section
CHANGES IN NET POSITIONLAST TEN FISCAL YEARS(accrual basis of accounting)(amounts expressed in thousands)
2007 2008 2009 2010 2011Fiscal Year
General Revenues and Change in Net PositionGovernmental activities:
TaxesProperty taxes 144,428$ 151,695$ 180,534$ 184,697$ 186,379$ Local sales tax 67,178 70,313 62,442 58,651 61,776 Franchise tax 18,326 19,553 23,438 22,500 22,634 Other taxes 6,730 7,502 9,119 5,473 13,937 Privilege license tax 14,800 17,585 19,627 19,098 7,166
Unrestricted grants and contributions 680 680 - - - Investment earnings 16,131 17,555 10,632 1,703 5,280 Miscellaneous 4,673 1,959 3,250 5,659 11,182 Transfers (12,845) (32,455) (24,423) (31,144) (32,231) Gain on sale of property - - - - -
Total governmental activities 260,101 254,387 284,619 266,637 276,123
Business-type activities:Investment earnings 20,609 17,770 10,632 2,379 3,357 Transfers 12,845 32,455 24,423 31,144 32,231
Gain on the sale of land - - 2,075 - - Total business-type activities 33,454 50,225 37,130 33,523 35,588 Total government general revenues 293,555$ 304,612$ 321,749$ 300,160$ 311,711$
Change in Net PositionGovernmental activities 54,846$ 31,389$ 38,042$ (757)$ 32,246$ Business-type activities 67,358 43,050 3,680 13,879 32,041 Total government change in net position 122,204$ 74,439$ 41,722$ 13,122$ 64,287$
Notes:
(1) The City converted the Stormwater Projects fund into the enterprise Stormwater Utility fund effective FY11.
(2) The City began reporting the solid waste services operations as an enterprise fund effective FY13. Prior to that,
the operations were included as part of the City's general fund.
141
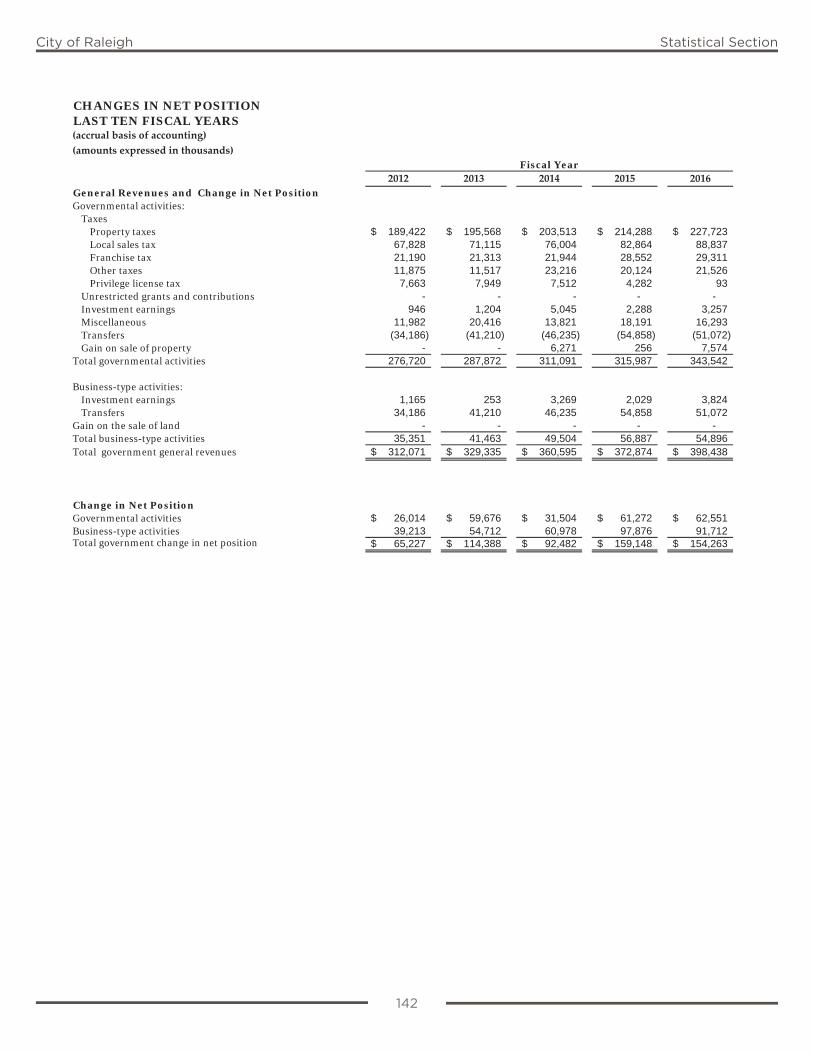
142
City of Raleigh Statistical Section
CHANGES IN NET POSITIONLAST TEN FISCAL YEARS(accrual basis of accounting)(amounts expressed in thousands)
2012 2013 2014 2015 2016Fiscal Year
General Revenues and Change in Net PositionGovernmental activities:
TaxesProperty taxes 189,422$ 195,568$ 203,513$ 214,288$ 227,723$ Local sales tax 67,828 71,115 76,004 82,864 88,837 Franchise tax 21,190 21,313 21,944 28,552 29,311 Other taxes 11,875 11,517 23,216 20,124 21,526 Privilege license tax 7,663 7,949 7,512 4,282 93
Unrestricted grants and contributions - - - - - Investment earnings 946 1,204 5,045 2,288 3,257 Miscellaneous 11,982 20,416 13,821 18,191 16,293 Transfers (34,186) (41,210) (46,235) (54,858) (51,072) Gain on sale of property - - 6,271 256 7,574
Total governmental activities 276,720 287,872 311,091 315,987 343,542
Business-type activities:Investment earnings 1,165 253 3,269 2,029 3,824 Transfers 34,186 41,210 46,235 54,858 51,072
Gain on the sale of land - - - - - Total business-type activities 35,351 41,463 49,504 56,887 54,896 Total government general revenues 312,071$ 329,335$ 360,595$ 372,874$ 398,438$
Change in Net PositionGovernmental activities 26,014$ 59,676$ 31,504$ 61,272$ 62,551$ Business-type activities 39,213 54,712 60,978 97,876 91,712 Total government change in net position 65,227$ 114,388$ 92,482$ 159,148$ 154,263$
142
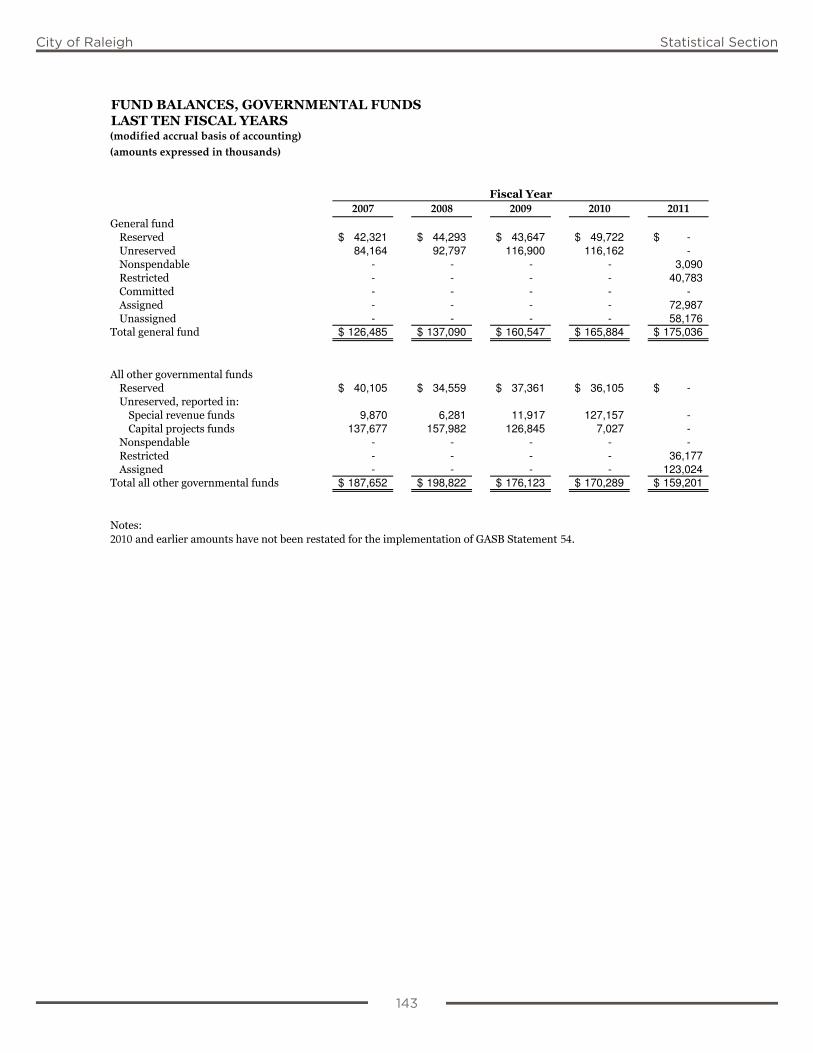
143
City of Raleigh Statistical Section
(modified accrual basis of accounting)(amounts expressed in thousands)
2007 2008 2009 2010 2011 42,321$ 44,293$ 43,647$ 49,722$ -$ 84,164 92,797 116,900 116,162 - - - - - 3,090 - - - - 40,783 - - - - - - - - - 72,987 - - - - 58,176
126,485$ 137,090$ 160,547$ 165,884$ 175,036$
40,105$ 34,559$ 37,361$ 36,105$ -$ 9,870 6,281 11,917 127,157 - 137,677 157,982 126,845 7,027 -
- - - - - - - - - 36,177 - - - - 123,024
187,652$ 198,822$ 176,123$ 170,289$ 159,201$
2010 54
143
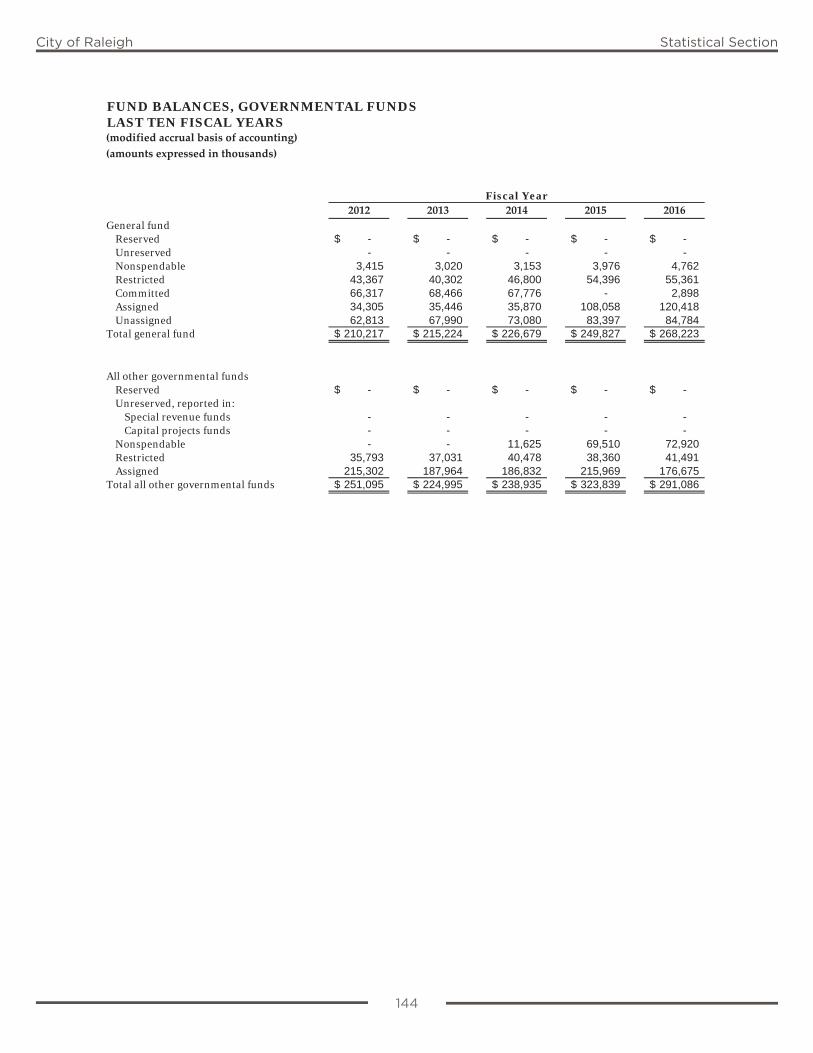
144
City of Raleigh Statistical Section
FUND BALANCES, GOVERNMENTAL FUNDSLAST TEN FISCAL YEARS(modified accrual basis of accounting)(amounts expressed in thousands)
2012 2013 2014 2015 2016General fund
Reserved -$ -$ -$ -$ -$ Unreserved - - - - - Nonspendable 3,415 3,020 3,153 3,976 4,762 Restricted 43,367 40,302 46,800 54,396 55,361 Committed 66,317 68,466 67,776 - 2,898 Assigned 34,305 35,446 35,870 108,058 120,418 Unassigned 62,813 67,990 73,080 83,397 84,784
Total general fund 210,217$ 215,224$ 226,679$ 249,827$ 268,223$
All other governmental fundsReserved -$ -$ -$ -$ -$ Unreserved, reported in:
Special revenue funds - - - - - Capital projects funds - - - - -
Nonspendable - - 11,625 69,510 72,920Restricted 35,793 37,031 40,478 38,360 41,491 Assigned 215,302 187,964 186,832 215,969 176,675
Total all other governmental funds 251,095$ 224,995$ 238,935$ 323,839$ 291,086$
Fiscal Year
144
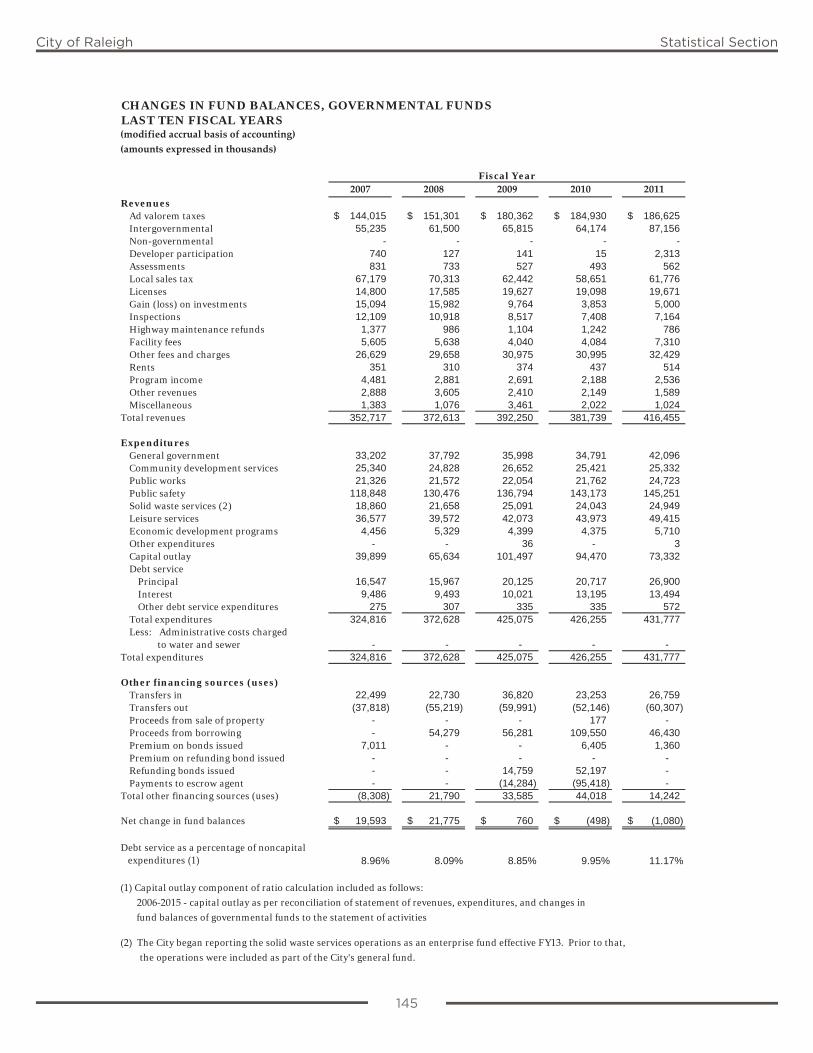
145
City of Raleigh Statistical Section
CHANGES IN FUND BALANCES, GOVERNMENTAL FUNDSLAST TEN FISCAL YEARS(modified accrual basis of accounting)(amounts expressed in thousands)
2007 2008 2009 2010 2011Revenues
Ad valorem taxes 144,015$ 151,301$ 180,362$ 184,930$ 186,625$Intergovernmental 55,235 61,500 65,815 64,174 87,156Non-governmental - - - - -Developer participation 740 127 141 15 2,313Assessments 831 733 527 493 562Local sales tax 67,179 70,313 62,442 58,651 61,776Licenses 14,800 17,585 19,627 19,098 19,671Gain (loss) on investments 15,094 15,982 9,764 3,853 5,000Inspections 12,109 10,918 8,517 7,408 7,164Highway maintenance refunds 1,377 986 1,104 1,242 786Facility fees 5,605 5,638 4,040 4,084 7,310Other fees and charges 26,629 29,658 30,975 30,995 32,429Rents 351 310 374 437 514Program income 4,481 2,881 2,691 2,188 2,536Other revenues 2,888 3,605 2,410 2,149 1,589Miscellaneous 1,383 1,076 3,461 2,022 1,024
Total revenues 352,717 372,613 392,250 381,739 416,455
ExpendituresGeneral government 33,202 37,792 35,998 34,791 42,096Community development services 25,340 24,828 26,652 25,421 25,332Public works 21,326 21,572 22,054 21,762 24,723Public safety 118,848 130,476 136,794 143,173 145,251Solid waste services (2) 18,860 21,658 25,091 24,043 24,949Leisure services 36,577 39,572 42,073 43,973 49,415Economic development programs 4,456 5,329 4,399 4,375 5,710Other expenditures - - 36 - 3Capital outlay 39,899 65,634 101,497 94,470 73,332Debt service
Principal 16,547 15,967 20,125 20,717 26,900Interest 9,486 9,493 10,021 13,195 13,494Other debt service expenditures 275 307 335 335 572
Total expenditures 324,816 372,628 425,075 426,255 431,777Less: Administrative costs charged
to water and sewer - - - - -Total expenditures 324,816 372,628 425,075 426,255 431,777
Other financing sources (uses)Transfers in 22,499 22,730 36,820 23,253 26,759Transfers out (37,818) (55,219) (59,991) (52,146) (60,307)Proceeds from sale of property - - - 177 - Proceeds from borrowing - 54,279 56,281 109,550 46,430Premium on bonds issued 7,011 - - 6,405 1,360Premium on refunding bond issued - - - - - Refunding bonds issued - - 14,759 52,197 - Payments to escrow agent - - (14,284) (95,418) -
Total other financing sources (uses) (8,308) 21,790 33,585 44,018 14,242
Net change in fund balances 19,593$ 21,775$ 760$ (498)$ (1,080)$
Debt service as a percentage of noncapital expenditures (1) 8.96% 8.09% 8.85% 9.95% 11.17%
(1) Capital outlay component of ratio calculation included as follows:
2006‐2015 - capital outlay as per reconciliation of statement of revenues, expenditures, and changes in
fund balances of governmental funds to the statement of activities
(2) The City began reporting the solid waste services operations as an enterprise fund effective FY13. Prior to that,
the operations were included as part of the City's general fund.
Fiscal Year
145
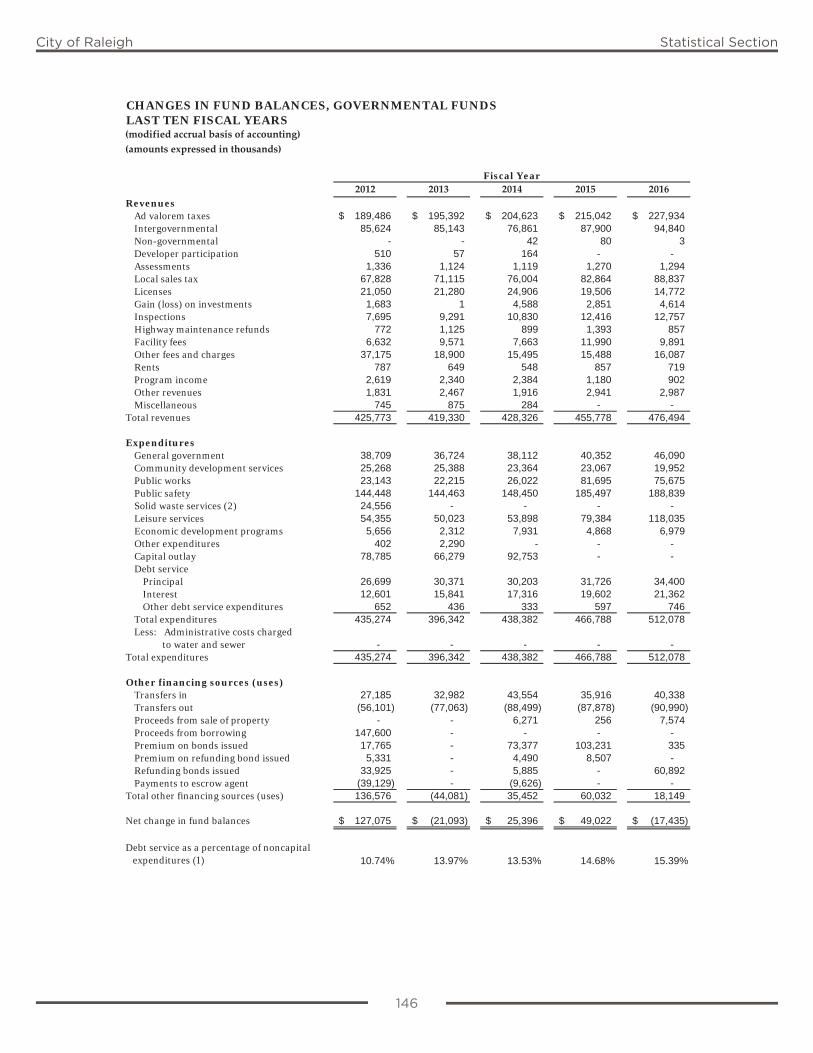
146
City of Raleigh Statistical Section
CHANGES IN FUND BALANCES, GOVERNMENTAL FUNDSLAST TEN FISCAL YEARS(modified accrual basis of accounting)(amounts expressed in thousands)
2012 2013 2014 2015 2016Revenues
Ad valorem taxes 189,486$ 195,392$ 204,623$ 215,042$ 227,934$Intergovernmental 85,624 85,143 76,861 87,900 94,840Non-governmental - - 42 80 3Developer participation 510 57 164 - - Assessments 1,336 1,124 1,119 1,270 1,294Local sales tax 67,828 71,115 76,004 82,864 88,837Licenses 21,050 21,280 24,906 19,506 14,772Gain (loss) on investments 1,683 1 4,588 2,851 4,614Inspections 7,695 9,291 10,830 12,416 12,757Highway maintenance refunds 772 1,125 899 1,393 857Facility fees 6,632 9,571 7,663 11,990 9,891Other fees and charges 37,175 18,900 15,495 15,488 16,087Rents 787 649 548 857 719Program income 2,619 2,340 2,384 1,180 902Other revenues 1,831 2,467 1,916 2,941 2,987Miscellaneous 745 875 284 - -
Total revenues 425,773 419,330 428,326 455,778 476,494
ExpendituresGeneral government 38,709 36,724 38,112 40,352 46,090Community development services 25,268 25,388 23,364 23,067 19,952Public works 23,143 22,215 26,022 81,695 75,675Public safety 144,448 144,463 148,450 185,497 188,839Solid waste services (2) 24,556 - - - - Leisure services 54,355 50,023 53,898 79,384 118,035Economic development programs 5,656 2,312 7,931 4,868 6,979Other expenditures 402 2,290 - - - Capital outlay 78,785 66,279 92,753 - - Debt service
Principal 26,699 30,371 30,203 31,726 34,400Interest 12,601 15,841 17,316 19,602 21,362Other debt service expenditures 652 436 333 597 746
Total expenditures 435,274 396,342 438,382 466,788 512,078Less: Administrative costs charged
to water and sewer - - - - - Total expenditures 435,274 396,342 438,382 466,788 512,078
Other financing sources (uses)Transfers in 27,185 32,982 43,554 35,916 40,338Transfers out (56,101) (77,063) (88,499) (87,878) (90,990)Proceeds from sale of property - - 6,271 256 7,574Proceeds from borrowing 147,600 - - - - Premium on bonds issued 17,765 - 73,377 103,231 335Premium on refunding bond issued 5,331 - 4,490 8,507 - Refunding bonds issued 33,925 - 5,885 - 60,892Payments to escrow agent (39,129) - (9,626) - -
Total other financing sources (uses) 136,576 (44,081) 35,452 60,032 18,149
Net change in fund balances 127,075$ (21,093)$ 25,396$ 49,022$ (17,435)$
Debt service as a percentage of noncapital expenditures (1) 10.74% 13.97% 13.53% 14.68% 15.39%
Fiscal Year
146
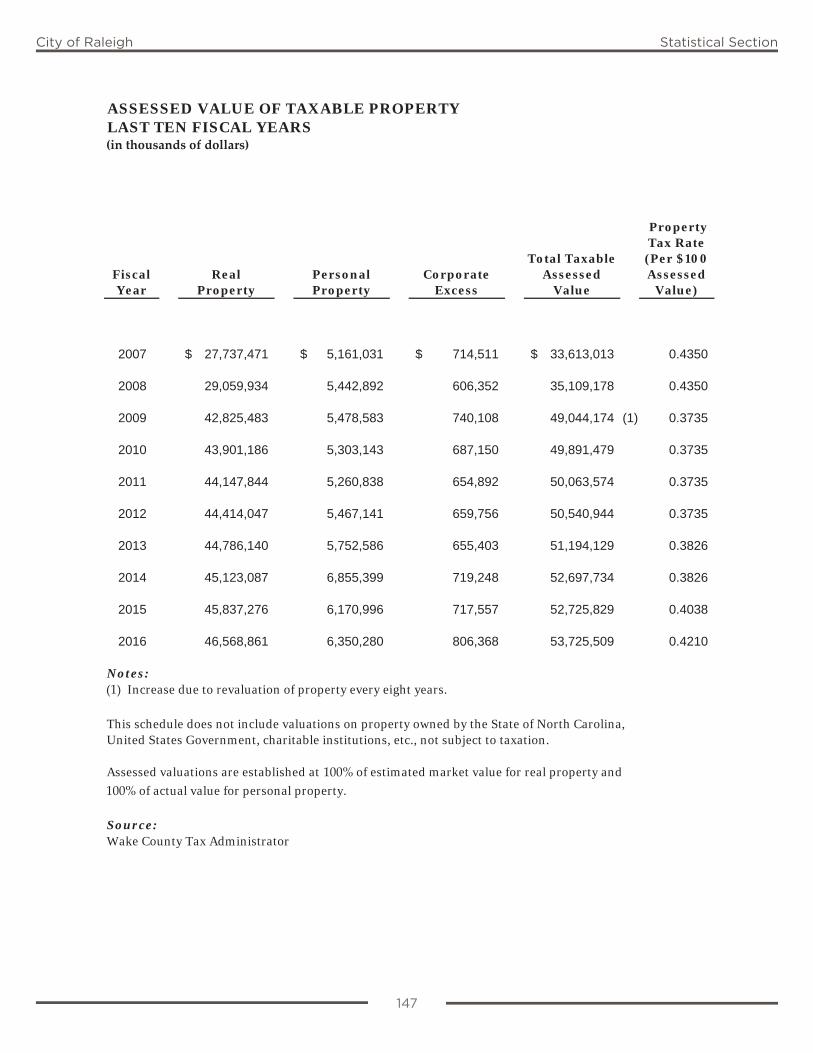
147
City of Raleigh Statistical Section
ASSESSED VALUE OF TAXABLE PROPERTYLAST TEN FISCAL YEARS(in thousands of dollars)
FiscalYear
RealProperty
PersonalProperty
CorporateExcess
Total TaxableAssessed
Value
Property Tax Rate
(Per $100 Assessed
Value)
2007 27,737,471$ 5,161,031$ 714,511$ 33,613,013$ 0.4350
2008 29,059,934 5,442,892 606,352 35,109,178 0.4350
2009 42,825,483 5,478,583 740,108 49,044,174 (1) 0.3735
2010 43,901,186 5,303,143 687,150 49,891,479 0.3735
2011 44,147,844 5,260,838 654,892 50,063,574 0.3735
2012 44,414,047 5,467,141 659,756 50,540,944 0.3735
2013 44,786,140 5,752,586 655,403 51,194,129 0.3826
2014 45,123,087 6,855,399 719,248 52,697,734 0.3826
2015 45,837,276 6,170,996 717,557 52,725,829 0.4038
2016 46,568,861 6,350,280 806,368 53,725,509 0.4210
Notes:(1) Increase due to revaluation of property every eight years.
This schedule does not include valuations on property owned by the State of North Carolina,United States Government, charitable institutions, etc., not subject to taxation.
Assessed valuations are established at 100% of estimated market value for real property and
100% of actual value for personal property.
Source:Wake County Tax Administrator
147
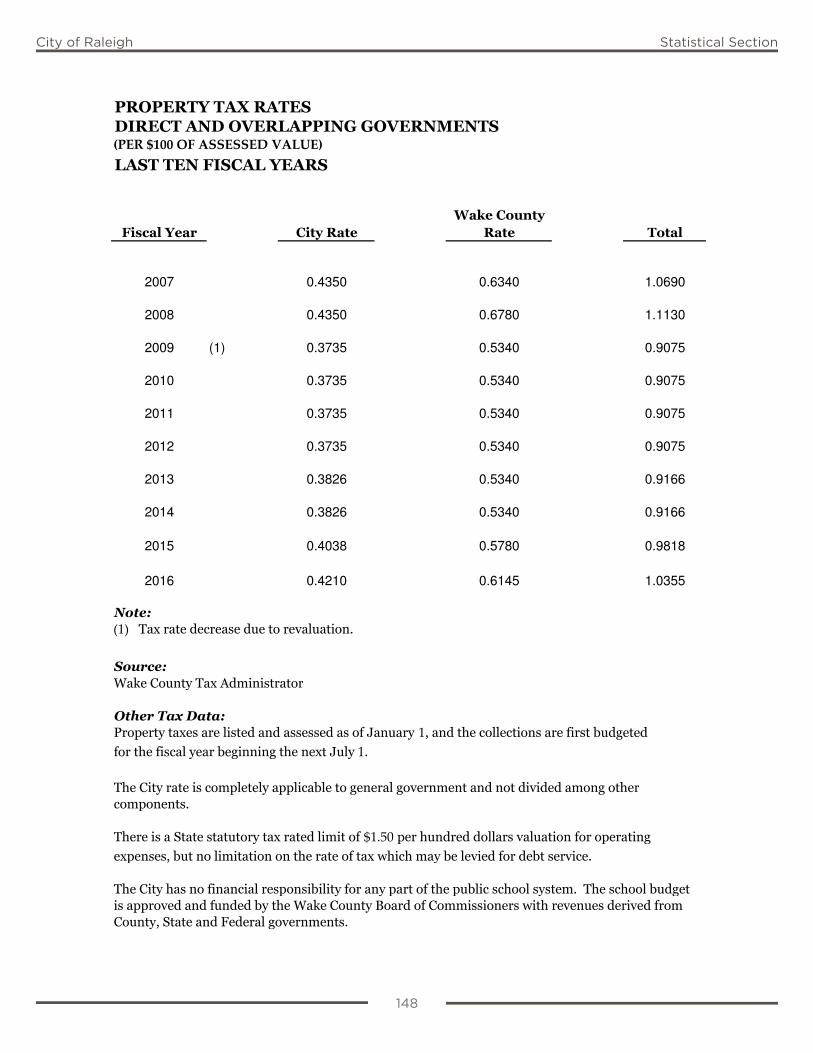
148
City of Raleigh Statistical Section
(PER $100 OF ASSESSED VALUE)
2007 0.4350 0.6340 1.0690
2008 0.4350 0.6780 1.1130
2009 (1) 0.3735 0.5340 0.9075
2010 0.3735 0.5340 0.9075
2011 0.3735 0.5340 0.9075
2012 0.3735 0.5340 0.9075
2013 0.3826 0.5340 0.9166
2014 0.3826 0.5340 0.9166
2015 0.4038 0.5780 0.9818
2016 0.4210 0.6145 1.0355
(1)
11
$1.50
148
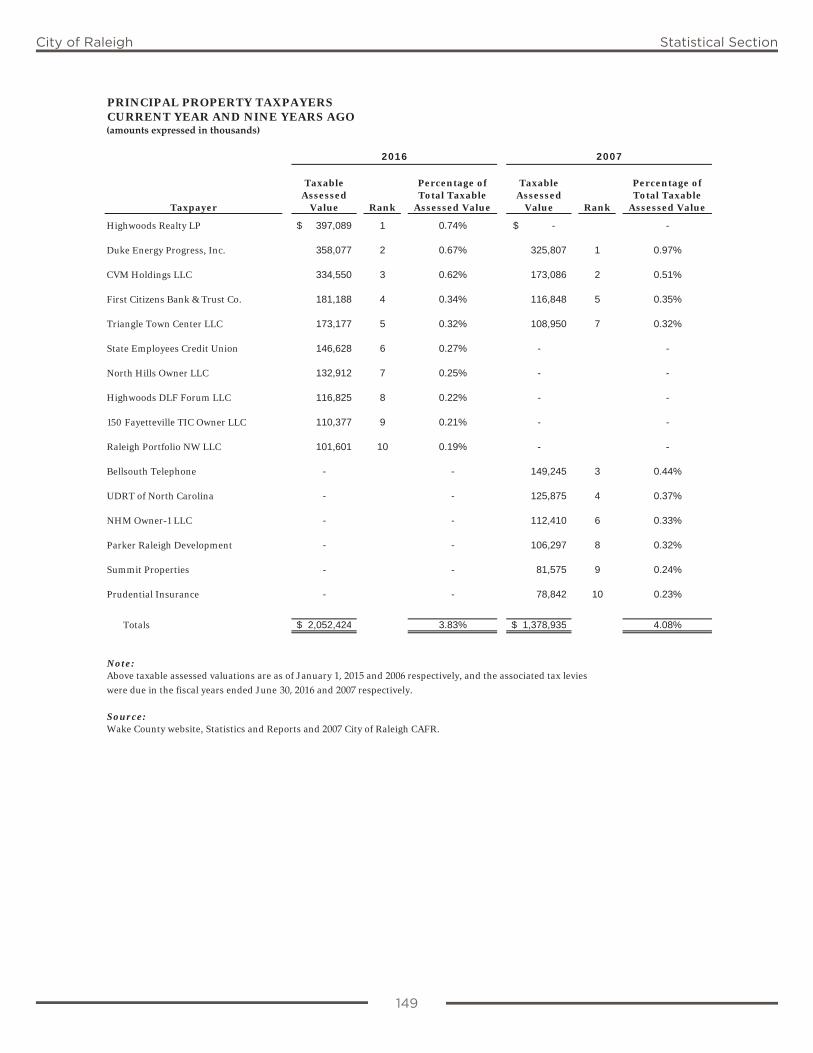
149
City of Raleigh Statistical Section
PRINCIPAL PROPERTY TAXPAYERSCURRENT YEAR AND NINE YEARS AGO(amounts expressed in thousands)
Taxpayer
TaxableAssessed
Value Rank
Percentage of Total Taxable
Assessed Value
TaxableAssessed
Value Rank
Percentage of Total Taxable
Assessed Value
Highwoods Realty LP 397,089$ 1 0.74% -$ -
Duke Energy Progress, Inc. 358,077 2 0.67% 325,807 1 0.97%
CVM Holdings LLC 334,550 3 0.62% 173,086 2 0.51%
First Citizens Bank & Trust Co. 181,188 4 0.34% 116,848 5 0.35%
Triangle Town Center LLC 173,177 5 0.32% 108,950 7 0.32%
State Employees Credit Union 146,628 6 0.27% - -
North Hills Owner LLC 132,912 7 0.25% - -
Highwoods DLF Forum LLC 116,825 8 0.22% - -
150 Fayetteville TIC Owner LLC 110,377 9 0.21% - -
Raleigh Portfolio NW LLC 101,601 10 0.19% - -
Bellsouth Telephone - - 149,245 3 0.44%
UDRT of North Carolina - - 125,875 4 0.37%
NHM Owner-1 LLC - - 112,410 6 0.33%
Parker Raleigh Development - - 106,297 8 0.32%
Summit Properties - - 81,575 9 0.24%
Prudential Insurance - - 78,842 10 0.23%
Totals 2,052,424$ 3.83% 1,378,935$ 4.08%
Note:Above taxable assessed valuations are as of January 1, 2015 and 2006 respectively, and the associated tax levies
were due in the fiscal years ended June 30, 2016 and 2007 respectively.
Source:Wake County website, Statistics and Reports and 2007 City of Raleigh CAFR.
2016 2007
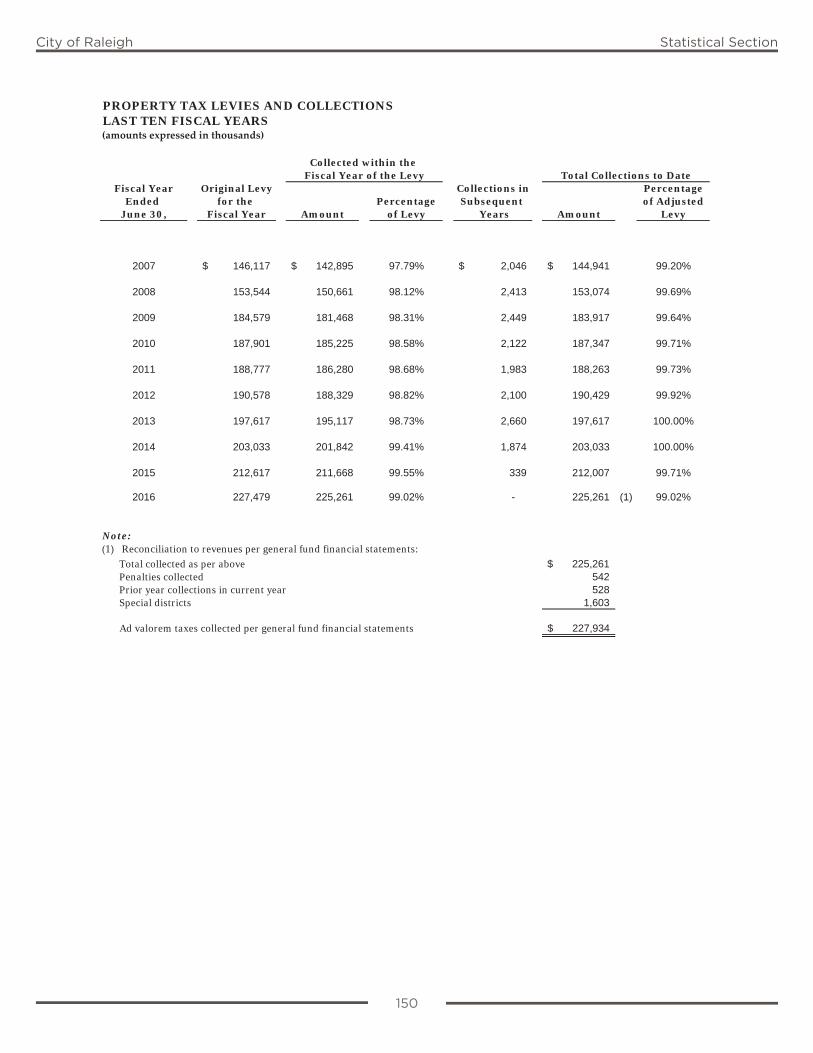
150
City of Raleigh Statistical Section
PROPERTY TAX LEVIES AND COLLECTIONSLAST TEN FISCAL YEARS(amounts expressed in thousands)
Fiscal Year Original Levy Collections in PercentageEnded for the Percentage Subsequent of Adjusted
June 30, Fiscal Year Amount of Levy Years Amount Levy
2007 146,117$ 142,895$ 97.79% 2,046$ 144,941$ 99.20%
2008 153,544 150,661 98.12% 2,413 153,074 99.69%
2009 184,579 181,468 98.31% 2,449 183,917 99.64%
2010 187,901 185,225 98.58% 2,122 187,347 99.71%
2011 188,777 186,280 98.68% 1,983 188,263 99.73%
2012 190,578 188,329 98.82% 2,100 190,429 99.92%
2013 197,617 195,117 98.73% 2,660 197,617 100.00%
2014 203,033 201,842 99.41% 1,874 203,033 100.00%
2015 212,617 211,668 99.55% 339 212,007 99.71%
2016 227,479 225,261 99.02% - 225,261 (1) 99.02%
Note:(1) Reconciliation to revenues per general fund financial statements:
Total collected as per above 225,261$Penalties collected 542Prior year collections in current year 528Special districts 1,603
Ad valorem taxes collected per general fund financial statements 227,934$
Fiscal Year of the Levy Total Collections to DateCollected within the
150
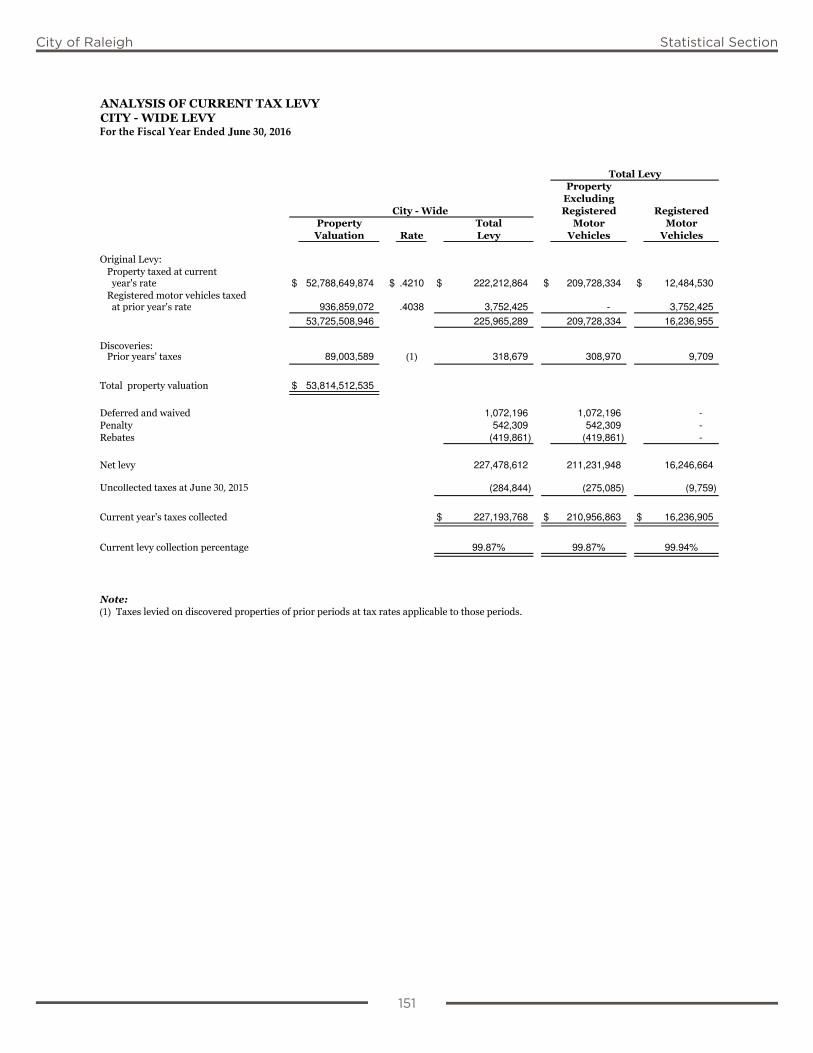
151
City of Raleigh Statistical Section
For the Fiscal Year Ended June 30, 2016
$ 52,788,649,874 $ .4210 $ 222,212,864 $ 209,728,334 $ 12,484,530
936,859,072 .4038 3,752,425 - 3,752,425
53,725,508,946 225,965,289 209,728,334 16,236,955
89,003,589 (1) 318,679 308,970 9,709
$ 53,814,512,535
1,072,196 1,072,196 -
542,309 542,309 -
(419,861) (419,861) -
227,478,612 211,231,948 16,246,664
30, 2015 (284,844) (275,085) (9,759)
$ 227,193,768 $ 210,956,863 $ 16,236,905
99.87% 99.87% 99.94%
-
(1)
151
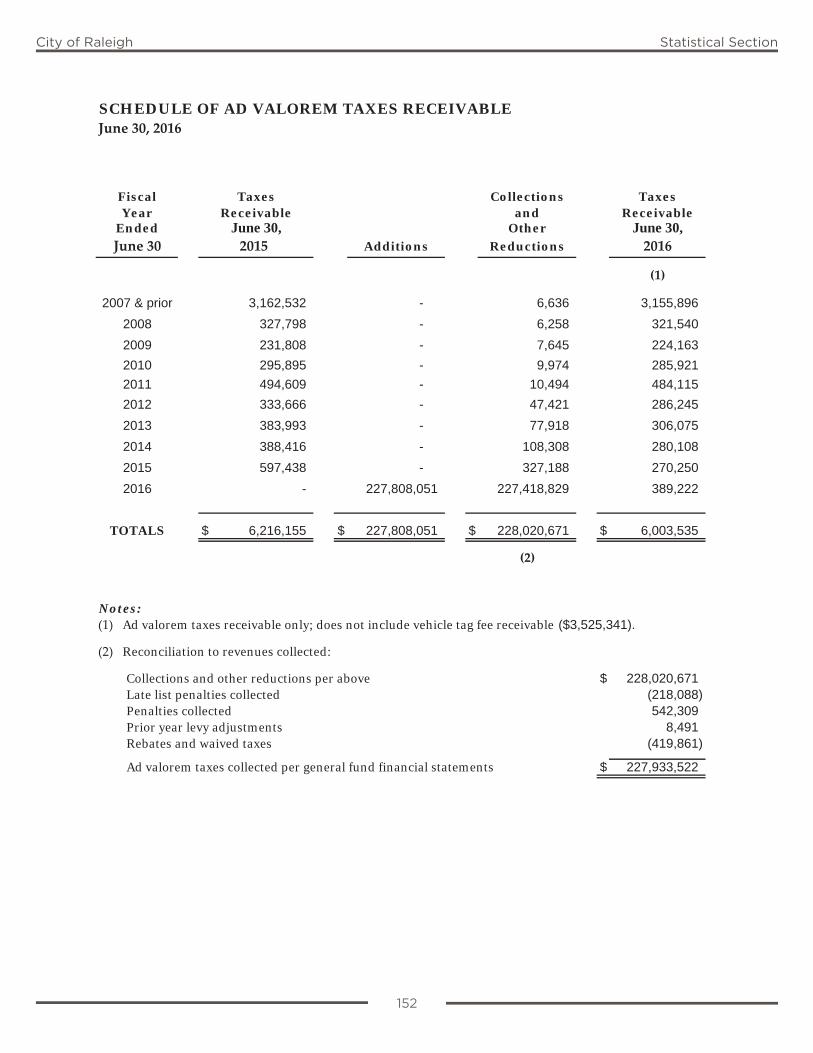
152
City of Raleigh Statistical Section
SCHEDULE OF AD VALOREM TAXES RECEIVABLEJune 30, 2016
Fiscal Taxes Collections TaxesYear Receivable and Receivable
Ended Other June 30,June 30 Additions Reductions 2016
(1)
2007 & prior 3,162,532 - 6,636 3,155,896
2008 327,798 - 6,258 321,540
2009 231,808 - 7,645 224,163
2010 295,895 - 9,974 285,921
2011 494,609 - 10,494 484,115
2012 333,666 - 47,421 286,245
2013 383,993 - 77,918 306,075
2014 388,416 - 108,308 280,108
2015 597,438 - 327,188 270,250
2016 - 227,808,051 227,418,829 389,222
TOTALS $ 6,216,155 $ 227,808,051 $ 228,020,671 $ 6,003,535
(2)
Notes:(1) Ad valorem taxes receivable only; does not include vehicle tag fee receivable ($3,525,341).
(2) Reconciliation to revenues collected:
Collections and other reductions per above $ 228,020,671 Late list penalties collected (218,088) Penalties collected 542,309 Prior year levy adjustments 8,491 Rebates and waived taxes (419,861)
Ad valorem taxes collected per general fund financial statements $ 227,933,522
June 30,2015
152

153
City of Raleigh Statistical Section
(amounts expressed in thousands)
(1) (1)
2007 183,219$ 60,272$ 18,916$ 415,540$ 338,067$ 1,016,014$ 6.89% 2,760.95
2008 170,030 104,398 15,405 560,240 344,335 1,194,408 7.93% 3,141.75
2009 177,949 139,825 12,616 554,740 349,998 1,235,128 8.36% 3,203.91
2010 230,567 120,967 10,574 546,250 361,869 1,270,227 8.21% 3,239.69
2011 213,916 161,229 8,569 643,725 352,794 1,380,233 8.41% 3,417.33
2012 344,046 142,883 6,679 629,750 342,932 1,466,290 8.35% 3,567.62
2013 (3) 351,612 139,903 5,118 727,382 369,471 1,593,486 8.16% 3,765.51
2014 (3) 343,739 162,224 3,467 708,895 389,116 1,607,441 (2) 3,723.12
2015 (3) 363,605 230,467 1,840 687,136 408,636 1,691,684 (2) 3,845.65
2016 (3) 351,863 266,013 409 664,085 417,537 1,699,907 (2) 3,768.64
(1) 146(2) 2014, 2015 2016(3)
Governmental Activities Business-type Activities
351,863 409
- 664,085
266,013 417,537
19,521 4,684
- 4,437
27,871 1
665,268 1,091,153
153
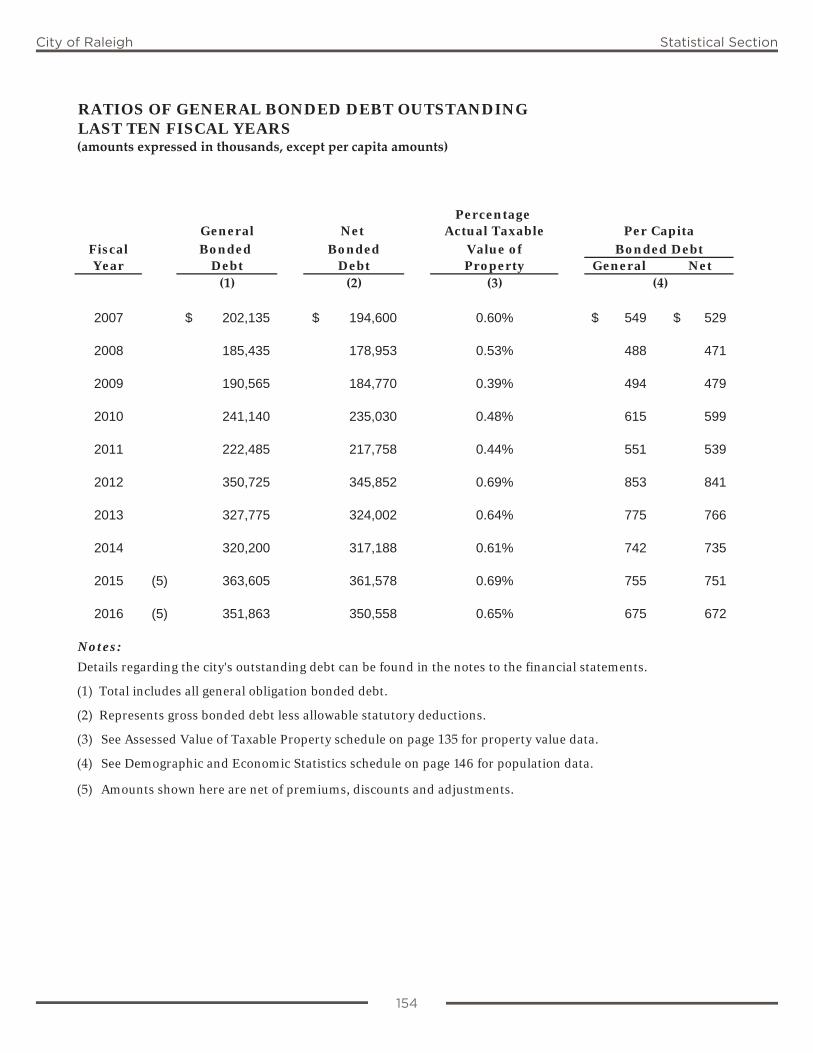
154
City of Raleigh Statistical Section
RATIOS OF GENERAL BONDED DEBT OUTSTANDINGLAST TEN FISCAL YEARS(amounts expressed in thousands, except per capita amounts)
PercentageGeneral Net Actual Taxable
Fiscal Bonded Bonded Value ofYear Debt Debt Property General Net
(1) (2) (3) (4)
2007 202,135$ 194,600$ 0.60% 549$ 529$
2008 185,435 178,953 0.53% 488 471
2009 190,565 184,770 0.39% 494 479
2010 241,140 235,030 0.48% 615 599
2011 222,485 217,758 0.44% 551 539
2012 350,725 345,852 0.69% 853 841
2013 327,775 324,002 0.64% 775 766
2014 320,200 317,188 0.61% 742 735
2015 (5) 363,605 361,578 0.69% 755 751
2016 (5) 351,863 350,558 0.65% 675 672
Notes:Details regarding the city's outstanding debt can be found in the notes to the financial statements.
(1) Total includes all general obligation bonded debt.
(2) Represents gross bonded debt less allowable statutory deductions.
(3) See Assessed Value of Taxable Property schedule on page 135 for property value data.
(4) See Demographic and Economic Statistics schedule on page 146 for population data.
(5) Amounts shown here are net of premiums, discounts and adjustments.
Per CapitaBonded Debt
154
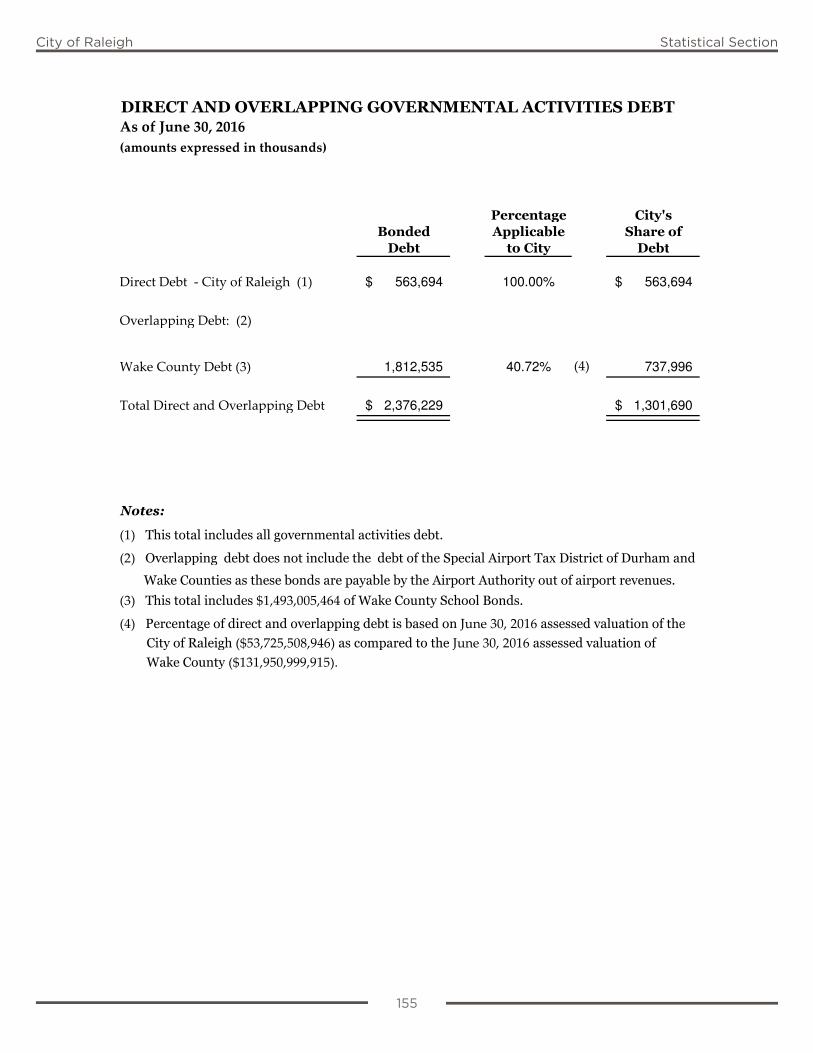
155
City of Raleigh Statistical Section
As of June 30, 2016(amounts expressed in thousands)
Direct Debt - City of Raleigh (1) 563,694$ 100.00% 563,694$
Overlapping Debt: (2)
Wake County Debt (3) 1,812,535 40.72% (4) 737,996
Total Direct and Overlapping Debt 2,376,229$ 1,301,690$
(1)
(2)
(3) $1,493,005,464 (4) June 30, 2016 ($53,725,508,946) June 30, 2016 ($131,950,999,915).
155
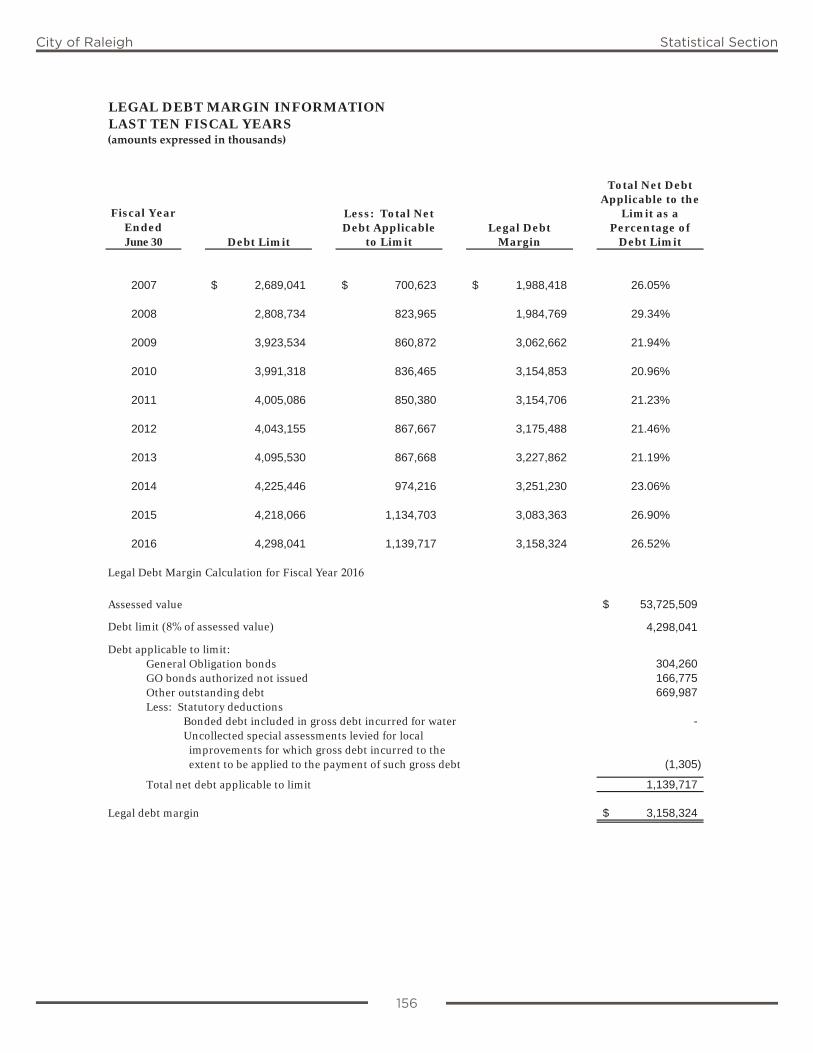
156
City of Raleigh Statistical Section
LEGAL DEBT MARGIN INFORMATIONLAST TEN FISCAL YEARS(amounts expressed in thousands)
Fiscal Year Ended June 30 Debt Limit
Less: Total Net Debt Applicable
to LimitLegal Debt
Margin
Total Net Debt Applicable to the
Limit as a Percentage of
Debt Limit
2007 2,689,041$ 700,623$ 1,988,418$ 26.05%
2008 2,808,734 823,965 1,984,769 29.34%
2009 3,923,534 860,872 3,062,662 21.94%
2010 3,991,318 836,465 3,154,853 20.96%
2011 4,005,086 850,380 3,154,706 21.23%
2012 4,043,155 867,667 3,175,488 21.46%
2013 4,095,530 867,668 3,227,862 21.19%
2014 4,225,446 974,216 3,251,230 23.06%
2015 4,218,066 1,134,703 3,083,363 26.90%
2016 4,298,041 1,139,717 3,158,324 26.52%
Legal Debt Margin Calculation for Fiscal Year 2016
Assessed value 53,725,509$
Debt limit (8% of assessed value) 4,298,041
Debt applicable to limit:General Obligation bonds 304,260GO bonds authorized not issued 166,775Other outstanding debt 669,987Less: Statutory deductions
Bonded debt included in gross debt incurred for water -Uncollected special assessments levied for local improvements for which gross debt incurred to the extent to be applied to the payment of such gross debt (1,305)
Total net debt applicable to limit 1,139,717
Legal debt margin 3,158,324$
156
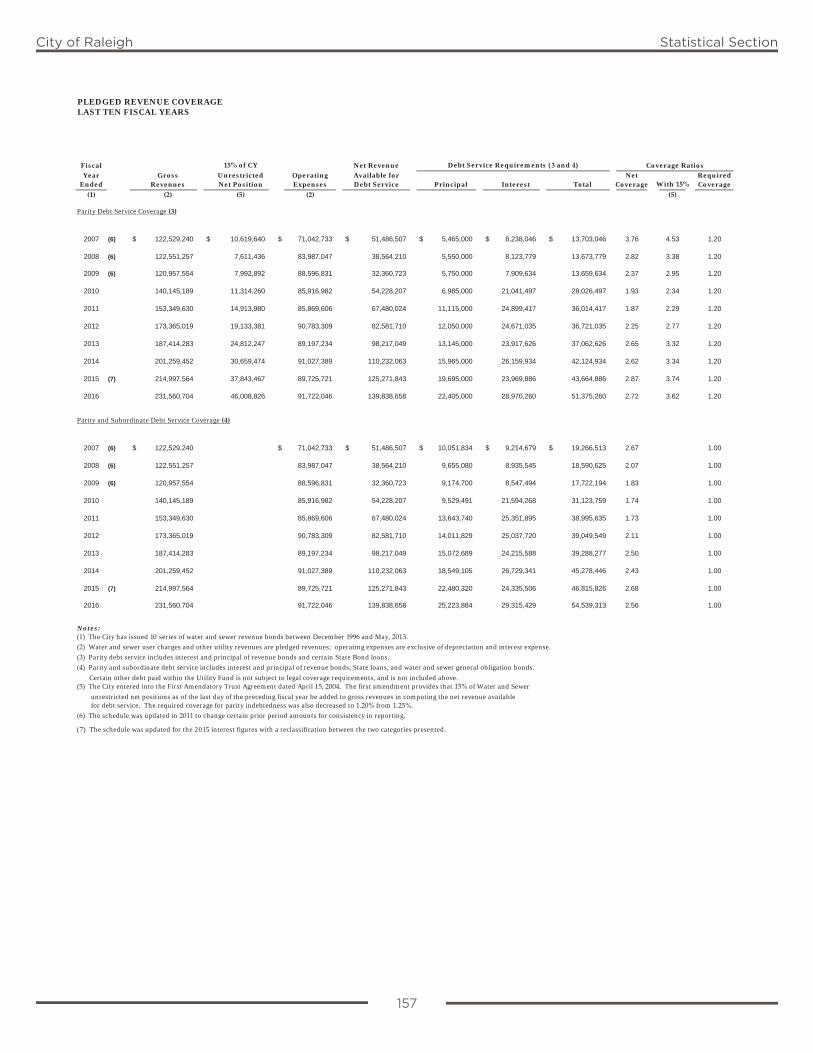
157
City of Raleigh Statistical Section
PLEDGED REVENUE COVERAGELAST TEN FISCAL YEARS
Fiscal 15% of CY Net Revenue Debt Service Requirements (3 and 4)Year Gross Unrestricted Operating Available for Net Required
Ended Revenues Net Position Expenses Debt Service Principal Interest Total Coverage With 15% Coverage
(1) (2) (5) (2) (5)
Parity Debt Service Coverage (3)
2007 (6) $ 122,529,240 $ 10,619,640 $ 71,042,733 $ 51,486,507 $ 5,465,000 $ 8,238,046 $ 13,703,046 3.76 4.53 1.20
2008 (6) 122,551,257 7,611,436 83,987,047 38,564,210 5,550,000 8,123,779 13,673,779 2.82 3.38 1.20
2009 (6) 120,957,554 7,992,892 88,596,831 32,360,723 5,750,000 7,909,634 13,659,634 2.37 2.95 1.20
2010 140,145,189 11,314,260 85,916,982 54,228,207 6,985,000 21,041,497 28,026,497 1.93 2.34 1.20
2011 153,349,630 14,913,980 85,869,606 67,480,024 11,115,000 24,899,417 36,014,417 1.87 2.29 1.20
2012 173,365,019 19,133,381 90,783,309 82,581,710 12,050,000 24,671,035 36,721,035 2.25 2.77 1.20
2013 187,414,283 24,812,247 89,197,234 98,217,049 13,145,000 23,917,626 37,062,626 2.65 3.32 1.20
2014 201,259,452 30,659,474 91,027,389 110,232,063 15,965,000 26,159,934 42,124,934 2.62 3.34 1.20
2015 (7) 214,997,564 37,843,467 89,725,721 125,271,843 19,695,000 23,969,886 43,664,886 2.87 3.74 1.20
2016 231,560,704 46,008,826 91,722,046 139,838,658 22,405,000 28,970,260 51,375,260 2.72 3.62 1.20
Parity and Subordinate Debt Service Coverage (4)
2007 (6) $ 122,529,240 $ 71,042,733 $ 51,486,507 $ 10,051,834 $ 9,214,679 $ 19,266,513 2.67 1.00
2008 (6) 122,551,257 83,987,047 38,564,210 9,655,080 8,935,545 18,590,625 2.07 1.00
2009 (6) 120,957,554 88,596,831 32,360,723 9,174,700 8,547,494 17,722,194 1.83 1.00
2010 140,145,189 85,916,982 54,228,207 9,529,491 21,594,268 31,123,759 1.74 1.00
2011 153,349,630 85,869,606 67,480,024 13,643,740 25,351,895 38,995,635 1.73 1.00
2012 173,365,019 90,783,309 82,581,710 14,011,829 25,037,720 39,049,549 2.11 1.00
2013 187,414,283 89,197,234 98,217,049 15,072,689 24,215,588 39,288,277 2.50 1.00
2014 201,259,452 91,027,389 110,232,063 18,549,105 26,729,341 45,278,446 2.43 1.00
2015 (7) 214,997,564 89,725,721 125,271,843 22,480,320 24,335,506 46,815,826 2.68 1.00
2016 231,560,704 91,722,046 139,838,658 25,223,884 29,315,429 54,539,313 2.56 1.00
Notes:(1) The City has issued 10 series of water and sewer revenue bonds between December 1996 and May, 2013.
(2) Water and sewer user charges and other utility revenues are pledged revenues; operating expenses are exclusive of depreciation and interest expense.
(3) Parity debt service includes interest and principal of revenue bonds and certain State Bond loans.
(4) Parity and subordinate debt service includes interest and principal of revenue bonds, State loans, and water and sewer general obligation bonds.
Certain other debt paid within the Utility Fund is not subject to legal coverage requirements, and is not included above.(5) The City entered into the First Amendatory Trust Agreement dated April 15, 2004. The first amendment provides that 15% of Water and Sewer
unrestricted net positions as of the last day of the preceding fiscal year be added to gross revenues in computing the net revenue available for debt service. The required coverage for parity indebtedness was also decreased to 1.20% from 1.25%.(6) The schedule was updated in 2011 to change certain prior period amounts for consistency in reporting.
(7) The schedule was updated for the 2015 interest figures with a reclassification between the two categories presented.
Coverage Ratios
157
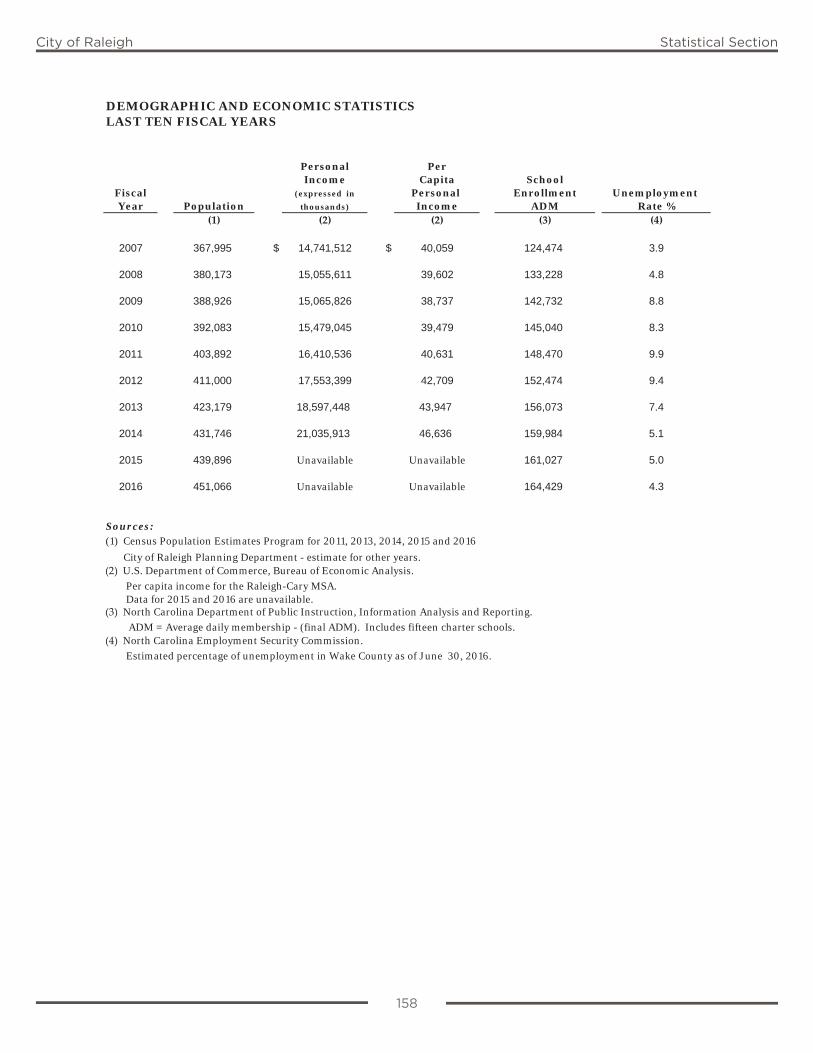
158
City of Raleigh Statistical Section
DEMOGRAPHIC AND ECONOMIC STATISTICSLAST TEN FISCAL YEARS
Personal PerIncome Capita School
Fiscal (expressed in Personal Enrollment UnemploymentYear Population thousands) Income ADM Rate %
(1) (2) (2) (3) (4)
2007 367,995 $ 14,741,512 $ 40,059 124,474 3.9
2008 380,173 15,055,611 39,602 133,228 4.8
2009 388,926 15,065,826 38,737 142,732 8.8
2010 392,083 15,479,045 39,479 145,040 8.3
2011 403,892 16,410,536 40,631 148,470 9.9
2012 411,000 17,553,399 42,709 152,474 9.4
2013 423,179 18,597,448 43,947 156,073 7.4
2014 431,746 21,035,913 46,636 159,984 5.1
2015 439,896 Unavailable Unavailable 161,027 5.0
2016 451,066 Unavailable Unavailable 164,429 4.3
Sources:(1) Census Population Estimates Program for 2011, 2013, 2014, 2015 and 2016
City of Raleigh Planning Department - estimate for other years.(2) U.S. Department of Commerce, Bureau of Economic Analysis.
Per capita income for the Raleigh-Cary MSA. Data for 2015 and 2016 are unavailable.(3) North Carolina Department of Public Instruction, Information Analysis and Reporting.
ADM = Average daily membership - (final ADM). Includes fifteen charter schools. (4) North Carolina Employment Security Commission.
Estimated percentage of unemployment in Wake County as of June 30, 2016.
158
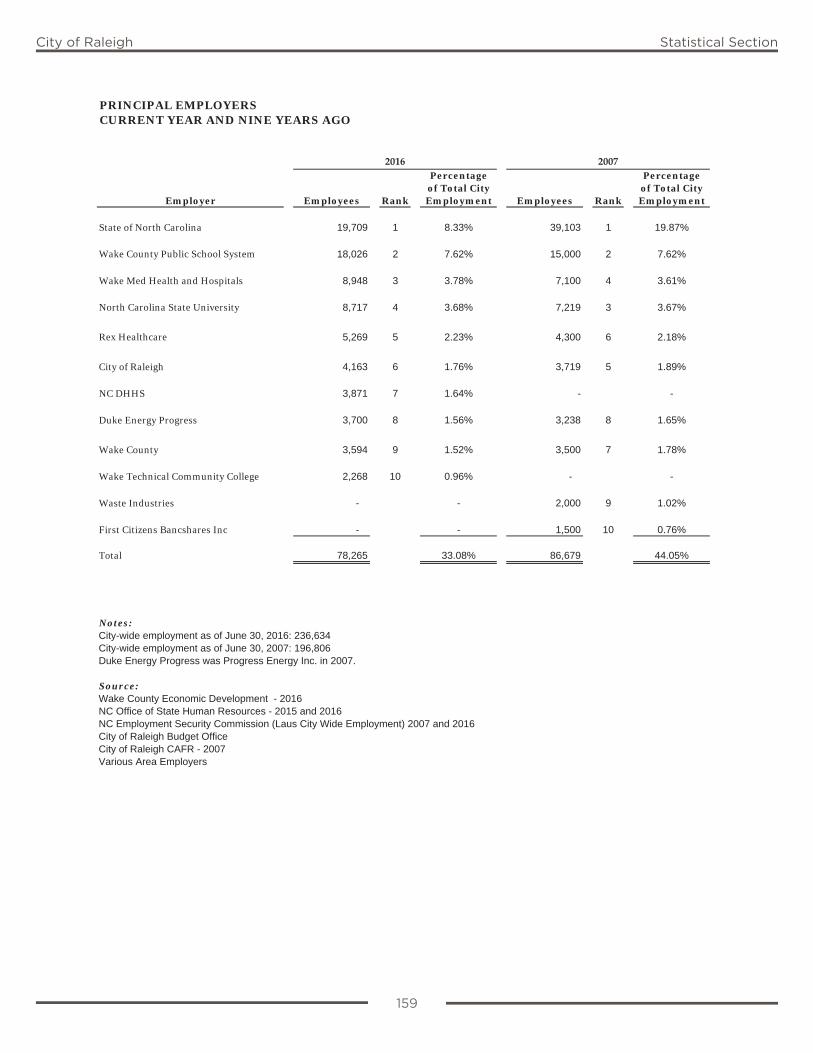
159
City of Raleigh Statistical Section
PRINCIPAL EMPLOYERSCURRENT YEAR AND NINE YEARS AGO
Percentage Percentageof Total City of Total City
Employer Employees Rank Employment Employees Rank Employment
State of North Carolina 19,709 1 8.33% 39,103 1 19.87%
Wake County Public School System 18,026 2 7.62% 15,000 2 7.62%
Wake Med Health and Hospitals 8,948 3 3.78% 7,100 4 3.61%
North Carolina State University 8,717 4 3.68% 7,219 3 3.67%
Rex Healthcare 5,269 5 2.23% 4,300 6 2.18%
City of Raleigh 4,163 6 1.76% 3,719 5 1.89%
NC DHHS 3,871 7 1.64% - -
Duke Energy Progress 3,700 8 1.56% 3,238 8 1.65%
Wake County 3,594 9 1.52% 3,500 7 1.78%
Wake Technical Community College 2,268 10 0.96% - -
Waste Industries - - 2,000 9 1.02%
First Citizens Bancshares Inc - - 1,500 10 0.76%
Total 78,265 33.08% 86,679 44.05%
Notes:City-wide employment as of June 30, 2016: 236,634City-wide employment as of June 30, 2007: 196,806Duke Energy Progress was Progress Energy Inc. in 2007.
Source:Wake County Economic Development - 2016NC Office of State Human Resources - 2015 and 2016NC Employment Security Commission (Laus City Wide Employment) 2007 and 2016City of Raleigh Budget OfficeCity of Raleigh CAFR - 2007Various Area Employers
20072016
159
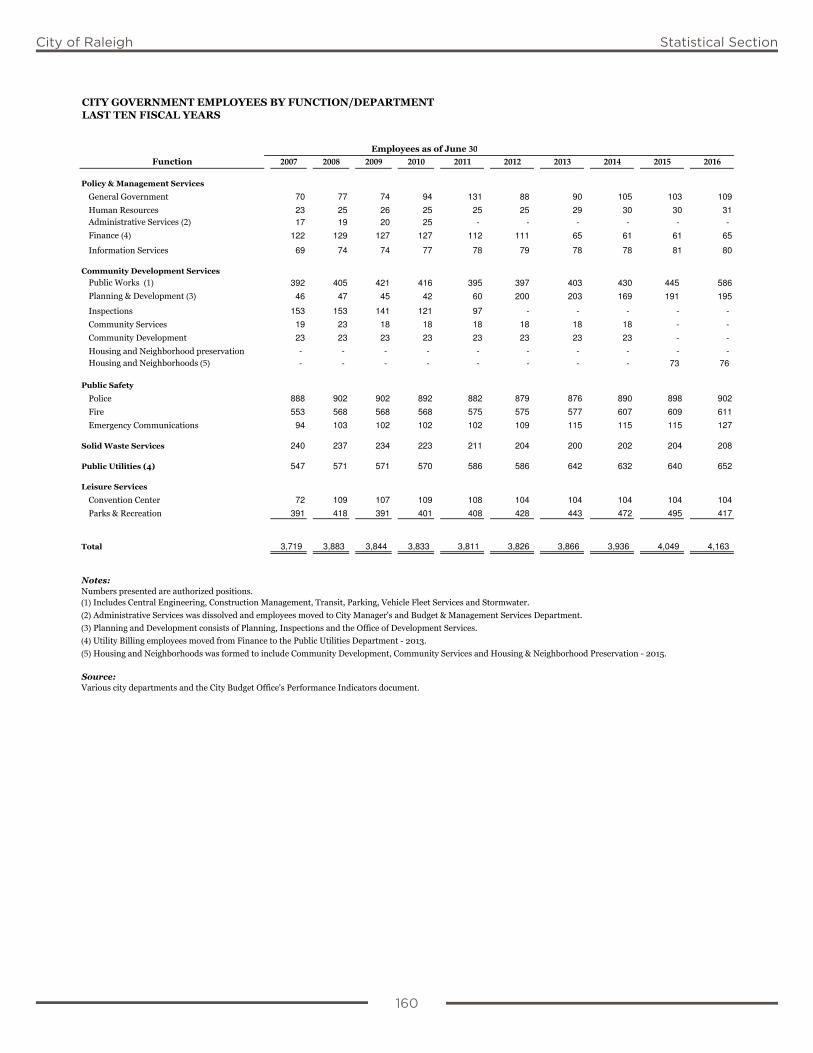
160
City of Raleigh Statistical Section
2007 2008 2009 2010 2011 2012 2013 2014 2015 2016
70 77 74 94 131 88 90 105 103 109
23 25 26 25 25 25 29 30 30 31
(2) 17 19 20 25 - - - - - -
(4) 122 129 127 127 112 111 65 61 61 65
69 74 74 77 78 79 78 78 81 80
(1) 392 405 421 416 395 397 403 430 445 586
(3) 46 47 45 42 60 200 203 169 191 195
153 153 141 121 97 - - - - -
19 23 18 18 18 18 18 18 - -
23 23 23 23 23 23 23 23 - -
- - - - - - - - - -
(5) - - - - - - - - 73 76
888 902 902 892 882 879 876 890 898 902
553 568 568 568 575 575 577 607 609 611
94 103 102 102 102 109 115 115 115 127
240 237 234 223 211 204 200 202 204 208
547 571 571 570 586 586 642 632 640 652
72 109 107 109 108 104 104 104 104 104
391 418 391 401 408 428 443 472 495 417
3,719 3,883 3,844 3,833 3,811 3,826 3,866 3,936 4,049 4,163
(1)(2) (3) (4)(5)
30
160
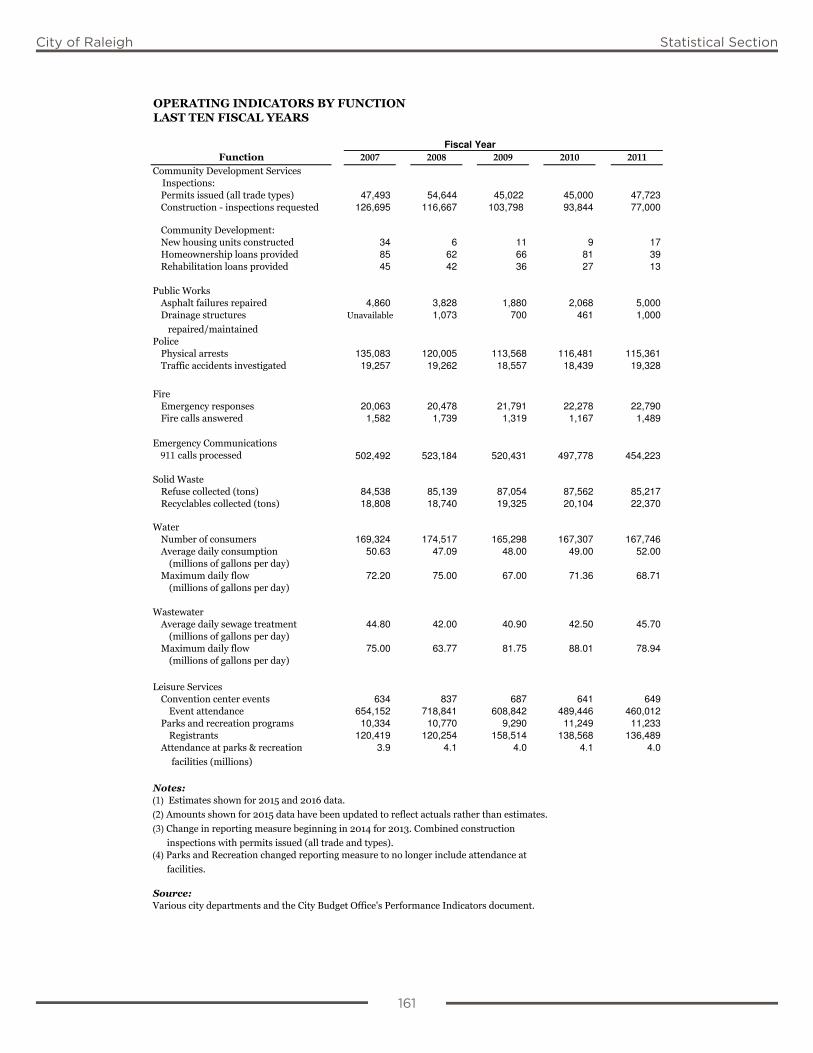
161
City of Raleigh Statistical Section
2007 2008 2009 2010 2011 47,493 54,644 45,022 45,000 47,723
126,695 116,667 103,798 93,844 77,000
34 6 11 9 17
85 62 66 81 39
45 42 36 27 13
4,860 3,828 1,880 2,068 5,000
1,073 700 461 1,000
135,083 120,005 113,568 116,481 115,361
19,257 19,262 18,557 18,439 19,328
20,063 20,478 21,791 22,278 22,790
1,582 1,739 1,319 1,167 1,489
911 502,492 523,184 520,431 497,778 454,223
84,538 85,139 87,054 87,562 85,217
18,808 18,740 19,325 20,104 22,370
169,324 174,517 165,298 167,307 167,746
50.63 47.09 48.00 49.00 52.00
72.20 75.00 67.00 71.36 68.71
44.80 42.00 40.90 42.50 45.70
75.00 63.77 81.75 88.01 78.94
634 837 687 641 649
654,152 718,841 608,842 489,446 460,012
10,334 10,770 9,290 11,249 11,233
120,419 120,254 158,514 138,568 136,489
3.9 4.1 4.0 4.1 4.0
(1) (2) (3)(4)
Fiscal Year
161
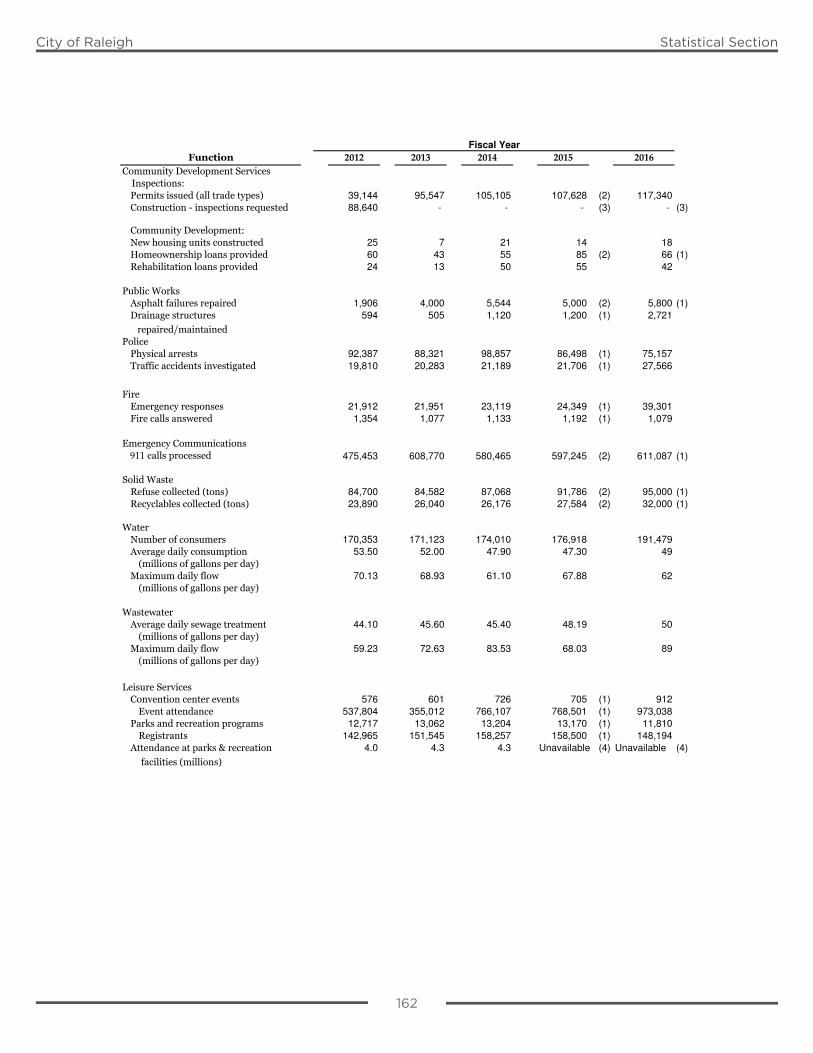
162
City of Raleigh Statistical Section
2012 2013 2014 2015 2016 39,144 95,547 105,105 107,628 (2) 117,340
88,640 - - - (3) - (3)
25 7 21 14 18
60 43 55 85 (2) 66 (1)
24 13 50 55 42
1,906 4,000 5,544 5,000 (2) 5,800 (1)
594 505 1,120 1,200 (1) 2,721
92,387 88,321 98,857 86,498 (1) 75,157
19,810 20,283 21,189 21,706 (1) 27,566
21,912 21,951 23,119 24,349 (1) 39,301
1,354 1,077 1,133 1,192 (1) 1,079
911 475,453 608,770 580,465 597,245 (2) 611,087 (1)
84,700 84,582 87,068 91,786 (2) 95,000 (1)
23,890 26,040 26,176 27,584 (2) 32,000 (1)
170,353 171,123 174,010 176,918 191,479
53.50 52.00 47.90 47.30 49
70.13 68.93 61.10 67.88 62
44.10 45.60 45.40 48.19 50
59.23 72.63 83.53 68.03 89
576 601 726 705 (1) 912
537,804 355,012 766,107 768,501 (1) 973,038
12,717 13,062 13,204 13,170 (1) 11,810
142,965 151,545 158,257 158,500 (1) 148,194
4.0 4.3 4.3 Unavailable (4) Unavailable (4)
Fiscal Year
162
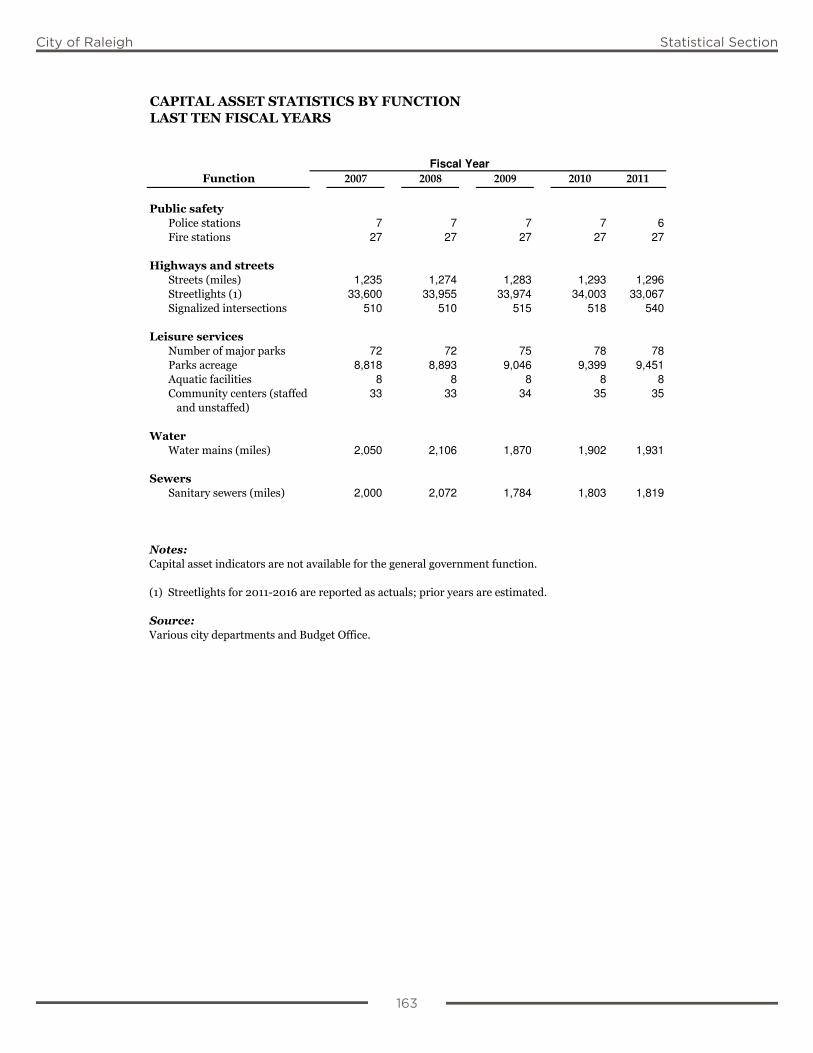
163
City of Raleigh Statistical Section
2007 2008 2009 2010 2011
7 7 7 7 6
27 27 27 27 27
1,235 1,274 1,283 1,293 1,296
33,600 33,955 33,974 34,003 33,067
510 510 515 518 540
72 72 75 78 78
8,818 8,893 9,046 9,399 9,451
8 8 8 8 8
33 33 34 35 35
2,050 2,106 1,870 1,902 1,931
2,000 2,072 1,784 1,803 1,819
Fiscal Year
163
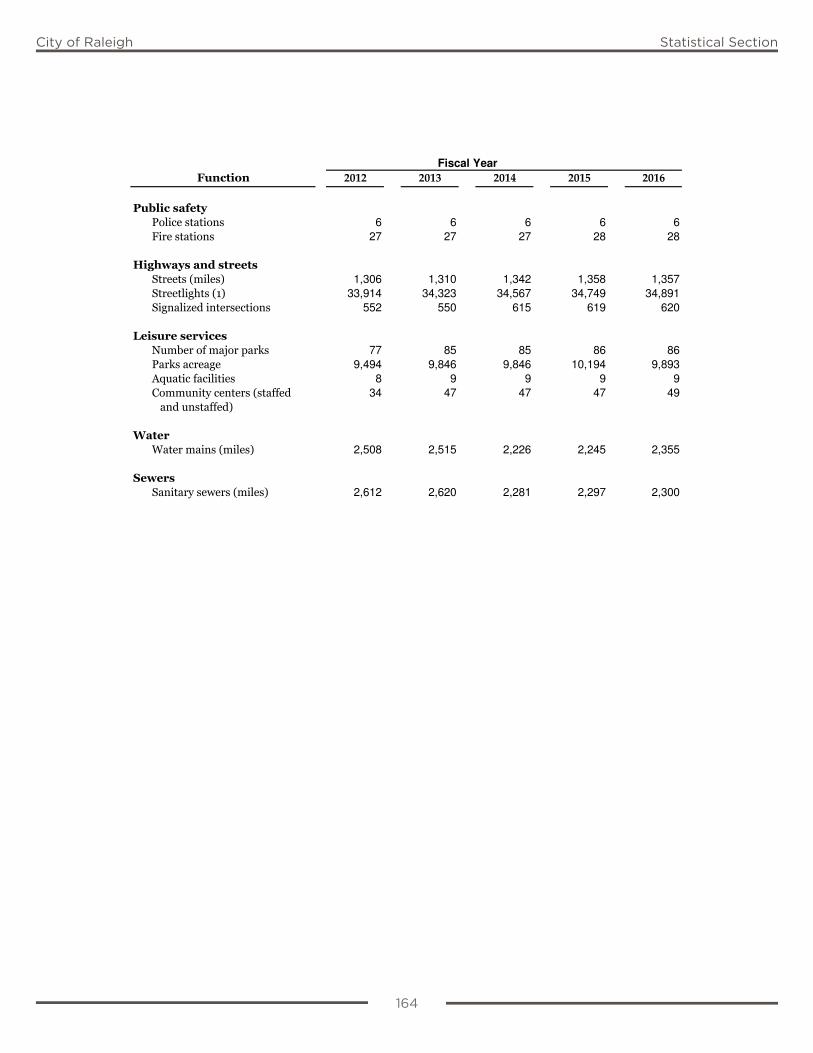
164
City of Raleigh Statistical Section
2012 2013 2014 2015 2016
6 6 6 6 6
27 27 27 28 28
1,306 1,310 1,342 1,358 1,357
33,914 34,323 34,567 34,749 34,891
552 550 615 619 620
77 85 85 86 86
9,494 9,846 9,846 10,194 9,893
8 9 9 9 9
34 47 47 47 49
2,508 2,515 2,226 2,245 2,355
2,612 2,620 2,281 2,297 2,300
Fiscal Year
164

City of Raleigh Statistical Section
166
City of Raleigh Financial Section
SINGLE AUDIT SECTIONThe Single Audit Section contains schedules, exhibits and auditor reports reflecting federal,
state and other participation in various projects and programs of the City as required by Title 2 United States Code of Federal Regulations, Part 200, Uniform Administrative Requirements, Cost Principles, and Audit Requirements for Federal Awards, the North
Carolina State Single Audit Implementation Act, and the American Recovery and Reinvestment Act.

167
City of Raleigh Financial Section
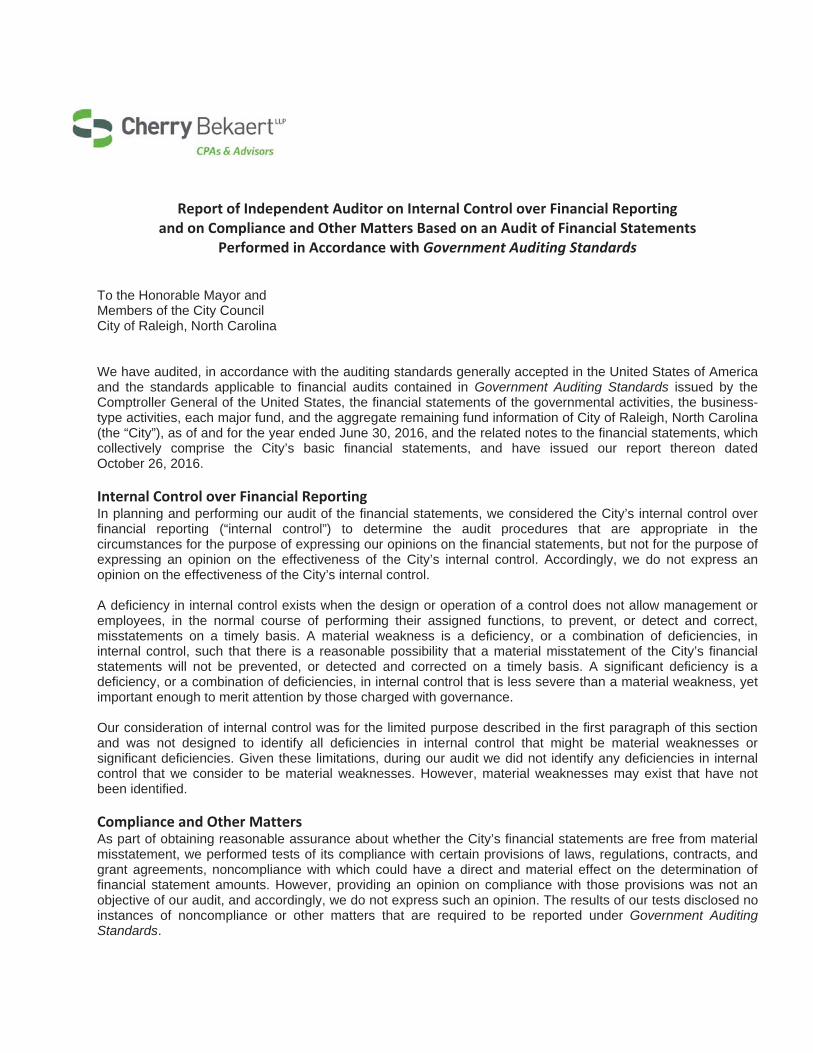
168
City of Raleigh Financial Section
Report of Independent Auditor on Internal Control over Financial Reporting and on Compliance and Other Matters Based on an Audit of Financial Statements
Performed in Accordance with Government Auditing Standards
To the Honorable Mayor and Members of the City Council City of Raleigh, North Carolina
We have audited, in accordance with the auditing standards generally accepted in the United States of America and the standards applicable to financial audits contained in Government Auditing Standards issued by the Comptroller General of the United States, the financial statements of the governmental activities, the business-type activities, each major fund, and the aggregate remaining fund information of City of Raleigh, North Carolina (the “City”), as of and for the year ended June 30, 2016, and the related notes to the financial statements, which collectively comprise the City’s basic financial statements, and have issued our report thereon dated October 26, 2016.
Internal Control over Financial Reporting In planning and performing our audit of the financial statements, we considered the City’s internal control over financial reporting (“internal control”) to determine the audit procedures that are appropriate in the circumstances for the purpose of expressing our opinions on the financial statements, but not for the purpose of expressing an opinion on the effectiveness of the City’s internal control. Accordingly, we do not express an opinion on the effectiveness of the City’s internal control.
A deficiency in internal control exists when the design or operation of a control does not allow management or employees, in the normal course of performing their assigned functions, to prevent, or detect and correct, misstatements on a timely basis. A material weakness is a deficiency, or a combination of deficiencies, in internal control, such that there is a reasonable possibility that a material misstatement of the City’s financial statements will not be prevented, or detected and corrected on a timely basis. A significant deficiency is a deficiency, or a combination of deficiencies, in internal control that is less severe than a material weakness, yet important enough to merit attention by those charged with governance.
Our consideration of internal control was for the limited purpose described in the first paragraph of this section and was not designed to identify all deficiencies in internal control that might be material weaknesses or significant deficiencies. Given these limitations, during our audit we did not identify any deficiencies in internal control that we consider to be material weaknesses. However, material weaknesses may exist that have not been identified.
Compliance and Other Matters As part of obtaining reasonable assurance about whether the City’s financial statements are free from material misstatement, we performed tests of its compliance with certain provisions of laws, regulations, contracts, and grant agreements, noncompliance with which could have a direct and material effect on the determination of financial statement amounts. However, providing an opinion on compliance with those provisions was not an objective of our audit, and accordingly, we do not express such an opinion. The results of our tests disclosed no instances of noncompliance or other matters that are required to be reported under Government Auditing Standards.

169
City of Raleigh Single Audit Section
170
City of Raleigh Single Audit Section
Purpose of this Report The purpose of this report is solely to describe the scope of our testing of internal control and compliance and the results of that testing, and not to provide an opinion on the effectiveness of the City’s internal control or on compliance. This report is an integral part of an audit performed in accordance with Government Auditing Standards in considering the City’s internal control and compliance. Accordingly, this communication is not suitable for any other purpose.
Raleigh, North Carolina October 26, 2016

171
City of Raleigh Single Audit Section
172
City of Raleigh Single Audit Section
Report of Independent Auditor on Compliance for Each Major Federal Program and on Internal Control over Compliance in Accordance with OMB Uniform Guidance
and the State Single Audit Implementation Act
To the Honorable Mayor and Members of the City Council City of Raleigh, North Carolina
Report on Compliance for Each Major Federal Program We have audited the City of Raleigh, North Carolina (the “City”), compliance with the types of compliance requirements described in the OMB Compliance Supplement and the Audit Manual for Governmental Auditors in North Carolina, issued by the Local Government Commission, that could have a direct and material effect on each of the City’s major federal programs for the year ended June 30, 2016. The City’s major federal programs are identified in the summary of auditor’s results section of the accompanying schedule of findings and questioned costs.
Management’s Responsibility Management is responsible for compliance with the requirements of laws, regulations, contracts, and grants applicable to its federal programs.
Auditor’s Responsibility Our responsibility is to express an opinion on compliance for each of the City’s major federal programs based on our audit of the types of compliance requirements referred to above. We conducted our audit of compliance in accordance with auditing standards generally accepted in the United States of America; the standards applicable to financial audits contained in Government Auditing Standards, issued by the Comptroller General of the United States; and the audit requirements of Title 2 U.S. Code of Federal Regulations (CFR) Part 200, Uniform Administrative Requirements, Cost Principles, and Audit Requirements for Federal Awards (Uniform Guidance), and the State Single Audit Implementation Act. Those standards, the Uniform Guidance, and the State Single Audit Implementation Act require that we plan and perform the audit to obtain reasonable assurance about whether noncompliance with the types of compliance requirements referred to above that could have a direct and material effect on a major federal program occurred. An audit includes examining, on a test basis, evidence about the City’s compliance with those requirements and performing such other procedures as we considered necessary in the circumstances.
We believe that our audit provides a reasonable basis for our opinion on compliance for each major federal program. However, our audit does not provide a legal determination of the City’s compliance.
Opinion on Each Major Federal Program In our opinion, the City complied, in all material respects, with the types of compliance requirements referred to above that could have a direct and material effect on each of its major federal programs for the year ended June 30, 2016.
Report on Internal Control over Compliance Management of the City is responsible for establishing and maintaining effective internal control over compliance with the types of compliance requirements referred to above. In planning and performing our audit of compliance, we considered the City’s internal control over compliance with the types of requirements that could have a direct and material effect on each major federal program to determine the auditing procedures that are appropriate in the circumstances for the purpose of expressing an opinion on compliance for each major federal program and to test and report on internal control over compliance in accordance with the Uniform Guidance, but not for the purpose of expressing an opinion on the effectiveness of internal control over compliance. Accordingly, we do not express an opinion on the effectiveness of the City’s internal control over compliance.

173
City of Raleigh Single Audit Section
174
City of Raleigh Single Audit Section
A deficiency in internal control over compliance exists when the design or operation of a control over compliance does not allow management or employees, in the normal course of performing their assigned functions, to prevent, or detect and correct, noncompliance with a type of compliance requirement of a federal program on a timely basis. A material weakness in internal control over compliance is a deficiency, or combination of deficiencies, in internal control over compliance, such that there is a reasonable possibility that material noncompliance with a type of compliance requirement of a federal program will not be prevented, or detected and corrected, on a timely basis. A significant deficiency in internal control over compliance is a deficiency, or a combination of deficiencies, in internal control over compliance with a type of compliance requirement of a federal program that is less severe than a material weakness in internal control over compliance, yet important enough to merit attention by those charged with governance.
Our consideration of internal control over compliance was for the limited purpose described in the first paragraph of this section and was not designed to identify all deficiencies in internal control over compliance that might be material weaknesses or significant deficiencies. We did not identify any deficiencies in internal control over compliance that we consider to be material weaknesses. However, material weaknesses may exist that have not been identified.
The purpose of this report on internal control over compliance is solely to describe the scope of our testing of internal control over compliance and the results of that testing based on the requirements of the Uniform Guidance. Accordingly, this report is not suitable for any other purpose.
Raleigh, North Carolina October 26, 2016

175
City of Raleigh Single Audit Section
176
City of Raleigh Single Audit Section
Report of Independent Auditor on Compliance for Each Major State Program and on Internal Control over Compliance in Accordance with the Uniform Guidance
and the State Single Audit Implementation Act
To the Honorable Mayor and Members of the City Council City of Raleigh, North Carolina
Report on Compliance for Each Major State Program We have audited the City of Raleigh, North Carolina (the “City”), compliance with the types of compliance requirements described in the Audit Manual for Governmental Auditors in North Carolina, issued by the Local Government Commission that could have a direct and material effect on each of the City’s major state programs for the year ended June 30, 2016. The City’s major state programs are identified in the summary of auditor’s results section of the accompanying schedule of findings and questioned costs.
Management’s Responsibility Management is responsible for compliance with the requirements of laws, regulations, contracts, and grants applicable to its state programs.
Auditor’s Responsibility Our responsibility is to express an opinion on compliance for each of the City’s major state programs based on our audit of the types of compliance requirements referred to above. We conducted our audit of compliance in accordance with auditing standards generally accepted in the United States of America; the standards applicable to financial audits contained in Government Auditing Standards, issued by the Comptroller General of the United States; and applicable sections of Title 2 U.S. Code of Federal Regulations (CFR) Part 200, Uniform Administrative Requirements, Cost Principles, and Audit Requirements for Federal Awards (Uniform Guidance), as described in the Audit Manual for Governmental Auditors in North Carolina, and the State Single Audit Implementation Act. Those standards, the Uniform Guidance, and the State Single Audit Implementation Act require that we plan and perform the audit to obtain reasonable assurance about whether noncompliance with the types of compliance requirements referred to above that could have a direct and material effect on a major state program occurred. An audit includes examining, on a test basis, evidence about the City’s compliance with those requirements and performing such other procedures as we considered necessary in the circumstances.
We believe that our audit provides a reasonable basis for our opinion on compliance for each major state program. However, our audit does not provide a legal determination of the City’s compliance.
Opinion on Each Major State Program In our opinion, the City complied, in all material respects, with the types of compliance requirements referred to above that could have a direct and material effect on its major state program for the year ended June 30, 2016.
Report on Internal Control over Compliance Management of the City is responsible for establishing and maintaining effective internal control over compliance with the types of compliance requirements referred to above. In planning and performing our audit of compliance, we considered the City’s internal control over compliance with the types of requirements that could have a direct and material effect on a major state program to determine the auditing procedures that are appropriate in the circumstances for the purpose of expressing an opinion on compliance for each major state program and to test and report on internal control over compliance in accordance with the Uniform Guidance, but not for the purpose of expressing an opinion on the effectiveness of internal control over compliance. Accordingly, we do not express an opinion on the effectiveness of the City’s internal control over compliance.

177
City of Raleigh Single Audit Section

178
City of Raleigh Single Audit Section
A deficiency in internal control over compliance exists when the design or operation of a control over compliance does not allow management or employees, in the normal course of performing their assigned functions, to prevent, or detect and correct, noncompliance with a type of compliance requirement of a state program on a timely basis. A material weakness in internal control over compliance is a deficiency, or combination of deficiencies, in internal control over compliance, such that there is a reasonable possibility that material noncompliance with a type of compliance requirement of a state program will not be prevented, or detected and corrected, on a timely basis. A significant deficiency in internal control over compliance is a deficiency, or a combination of deficiencies, in internal control over compliance with a type of compliance requirement of a state program that is less severe than a material weakness in internal control over compliance, yet important enough to merit attention by those charged with governance.
Our consideration of internal control over compliance was for the limited purpose described in the first paragraph of this section and was not designed to identify all deficiencies in internal control over compliance that might be material weaknesses or significant deficiencies. We did not identify any deficiencies in internal control over compliance that we consider to be material weaknesses. However, material weaknesses may exist that have not been identified.
The purpose of this report on internal control over compliance is solely to describe the scope of our testing of internal control over compliance and the results of that testing based on the requirements of the Uniform Guidance. Accordingly, this report is not suitable for any other purpose.
Raleigh, North Carolina October 26, 2016

179
City of Raleigh Single Audit Section

180
City of Raleigh Single Audit Section
Single Audit Schedules
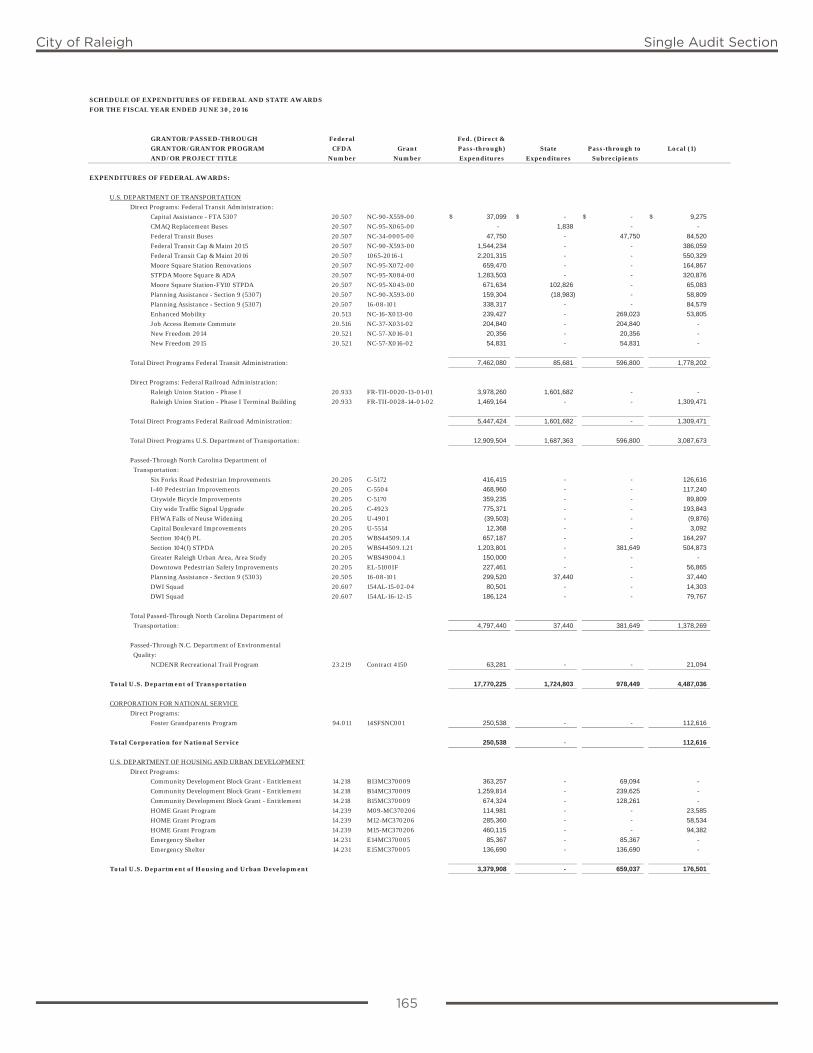
165
City of Raleigh Single Audit Section
SCHEDULE OF EXPENDITURES OF FEDERAL AND STATE AWARDS
FOR THE FISCAL YEAR ENDED JUNE 30, 2016
GRANTOR/PASSED-THROUGH Federal Fed. (Direct &
GRANTOR/GRANTOR PROGRAM CFDA Grant Pass-through) State Pass-through to Local (1)
AND/OR PROJECT TITLE Number Number Expenditures Expenditures Subrecipients
EXPENDITURES OF FEDERAL AWARDS:
U.S. DEPARTMENT OF TRANSPORTATION
Direct Programs: Federal Transit Administration:
Capital Assistance - FTA 5307 20.507 NC-90-X559-00 $ 37,099 $ - $ - $ 9,275
CMAQ Replacement Buses 20.507 NC-95-X065-00 - 1,838 - -
Federal Transit Buses 20.507 NC-34-0005-00 47,750 - 47,750 84,520
Federal Transit Cap & Maint 2015 20.507 NC-90-X593-00 1,544,234 - - 386,059
Federal Transit Cap & Maint 2016 20.507 1065-2016-1 2,201,315 - - 550,329
Moore Square Station Renovations 20.507 NC-95-X072-00 659,470 - - 164,867
STPDA Moore Square & ADA 20.507 NC-95-X084-00 1,283,503 - - 320,876
Moore Square Station-FY10 STPDA 20.507 NC-95-X043-00 671,634 102,826 - 65,083
Planning Assistance - Section 9 (5307) 20.507 NC-90-X593-00 159,304 (18,983) - 58,809
Planning Assistance - Section 9 (5307) 20.507 16-08-101 338,317 - - 84,579
Enhanced Mobility 20.513 NC-16-X013-00 239,427 - 269,023 53,805
Job Access Remote Commute 20.516 NC-37-X031-02 204,840 - 204,840 -
New Freedom 2014 20.521 NC-57-X016-01 20,356 - 20,356 -
New Freedom 2015 20.521 NC-57-X016-02 54,831 - 54,831 -
Total Direct Programs Federal Transit Administration: 7,462,080 85,681 596,800 1,778,202
Direct Programs: Federal Railroad Administration:
Raleigh Union Station - Phase I 20.933 FR-TII-0020-13-01-01 3,978,260 1,601,682 - -
Raleigh Union Station - Phase I Terminal Building 20.933 FR-TII-0028-14-01-02 1,469,164 - - 1,309,471
Total Direct Programs Federal Railroad Administration: 5,447,424 1,601,682 - 1,309,471
Total Direct Programs U.S. Department of Transportation: 12,909,504 1,687,363 596,800 3,087,673
Passed-Through North Carolina Department of
Transportation:
Six Forks Road Pedestrian Improvements 20.205 C-5172 416,415 - - 126,616
I-40 Pedestrian Improvements 20.205 C-5504 468,960 - - 117,240
Citywide Bicycle Improvements 20.205 C-5170 359,235 - - 89,809
City wide Traffic Signal Upgrade 20.205 C-4923 775,371 - - 193,843
FHWA Falls of Neuse Widening 20.205 U-4901 (39,503) - - (9,876)
Capital Boulevard Improvements 20.205 U-5514 12,368 - - 3,092
Section 104(f) PL 20.205 WBS44509.1.4 657,187 - - 164,297
Section 104(f) STPDA 20.205 WBS44509.1.21 1,203,801 - 381,649 504,873
Greater Raleigh Urban Area, Area Study 20.205 WBS49004.1 150,000 - - -
Downtown Pedestrian Safety Improvements 20.205 EL-5100IF 227,461 - - 56,865
Planning Assistance - Section 9 (5303) 20.505 16-08-101 299,520 37,440 - 37,440
DWI Squad 20.607 154AL-15-02-04 80,501 - - 14,303
DWI Squad 20.607 154AL-16-12-15 186,124 - - 79,767
Total Passed-Through North Carolina Department of
Transportation: 4,797,440 37,440 381,649 1,378,269
Passed-Through N.C. Department of Environmental
Quality:
NCDENR Recreational Trail Program 23.219 Contract 4150 63,281 - - 21,094
Total U.S. Department of Transportation 17,770,225 1,724,803 978,449 4,487,036
CORPORATION FOR NATIONAL SERVICE
Direct Programs:
Foster Grandparents Program 94.011 14SFSNC001 250,538 - - 112,616
Total Corporation for National Service 250,538 - 112,616
U.S. DEPARTMENT OF HOUSING AND URBAN DEVELOPMENT
Direct Programs:
Community Development Block Grant - Entitlement 14.218 B13MC370009 363,257 - 69,094 -
Community Development Block Grant - Entitlement 14.218 B14MC370009 1,259,814 - 239,625 -
Community Development Block Grant - Entitlement 14.218 B15MC370009 674,324 - 128,261 -
HOME Grant Program 14.239 M09-MC370206 114,981 - - 23,585
HOME Grant Program 14.239 M12-MC370206 285,360 - - 58,534
HOME Grant Program 14.239 M15-MC370206 460,115 - - 94,382
Emergency Shelter 14.231 E14MC370005 85,367 - 85,367 -
Emergency Shelter 14.231 E15MC370005 136,690 - 136,690 -
Total U.S. Department of Housing and Urban Development 3,379,908 - 659,037 176,501
165
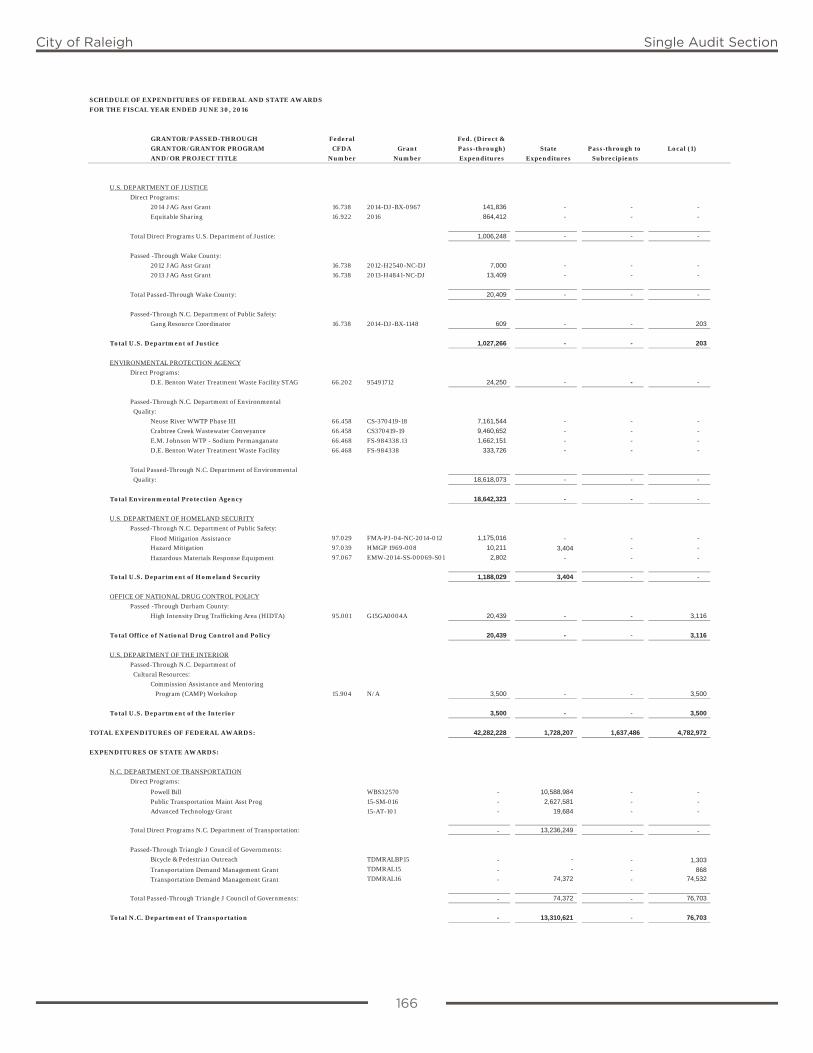
166
City of Raleigh Single Audit Section
SCHEDULE OF EXPENDITURES OF FEDERAL AND STATE AWARDS
FOR THE FISCAL YEAR ENDED JUNE 30, 2016
GRANTOR/PASSED-THROUGH Federal Fed. (Direct &
GRANTOR/GRANTOR PROGRAM CFDA Grant Pass-through) State Pass-through to Local (1)
AND/OR PROJECT TITLE Number Number Expenditures Expenditures Subrecipients
U.S. DEPARTMENT OF JUSTICE
Direct Programs:
2014 JAG Asst Grant 16.738 2014-DJ-BX-0967 141,836 - - -
Equitable Sharing 16.922 2016 864,412 - - -
Total Direct Programs U.S. Department of Justice: 1,006,248 - - -
Passed -Through Wake County:
2012 JAG Asst Grant 16.738 2012-H2540-NC-DJ 7,000 - - -
2013 JAG Asst Grant 16.738 2013-H4841-NC-DJ 13,409 - - -
Total Passed-Through Wake County: 20,409 - - -
Passed-Through N.C. Department of Public Safety:
Gang Resource Coordinator 16.738 2014-DJ-BX-1148 609 - - 203
Total U.S. Department of Justice 1,027,266 - - 203
ENVIRONMENTAL PROTECTION AGENCY
Direct Programs:
D.E. Benton Water Treatment Waste Facility STAG 66.202 95491712 24,250 - - -
Passed-Through N.C. Department of Environmental
Quality:
Neuse River WWTP Phase III 66.458 CS-370419-18 7,161,544 - - -
Crabtree Creek Wastewater Conveyance 66.458 CS370419-19 9,460,652 - - -
E.M. Johnson WTP - Sodium Permanganate 66.468 FS-984338.13 1,662,151 - - -
D.E. Benton Water Treatment Waste Facility 66.468 FS-984338 333,726 - - -
Total Passed-Through N.C. Department of Environmental
Quality: 18,618,073 - - -
Total Environmental Protection Agency 18,642,323 - - -
U.S. DEPARTMENT OF HOMELAND SECURITY
Passed-Through N.C. Department of Public Safety:
Flood Mitigation Assistance 97.029 FMA-PJ-04-NC-2014-012 1,175,016 - - -
Hazard Mitigation 97.039 HMGP 1969-008 10,211 3,404 - -
Hazardous Materials Response Equipment 97.067 EMW-2014-SS-00069-S01 2,802 - - -
Total U.S. Department of Homeland Security 1,188,029 3,404 - -
OFFICE OF NATIONAL DRUG CONTROL POLICY
Passed -Through Durham County:
High Intensity Drug Trafficking Area (HIDTA) 95.001 G15GA0004A 20,439 - - 3,116
Total Office of National Drug Control and Policy 20,439 - - 3,116
U.S. DEPARTMENT OF THE INTERIOR
Passed-Through N.C. Department of
Cultural Resources:
Commission Assistance and Mentoring
Program (CAMP) Workshop 15.904 N/A 3,500 - - 3,500
Total U.S. Department of the Interior 3,500 - - 3,500
TOTAL EXPENDITURES OF FEDERAL AWARDS: 42,282,228 1,728,207 1,637,486 4,782,972
EXPENDITURES OF STATE AWARDS:
N.C. DEPARTMENT OF TRANSPORTATION
Direct Programs:
Powell Bill WBS32570 - 10,588,984 - -
Public Transportation Maint Asst Prog 15-SM-016 - 2,627,581 - -
Advanced Technology Grant 15-AT-101 - 19,684 - -
Total Direct Programs N.C. Department of Transportation: - 13,236,249 - -
Passed-Through Triangle J Council of Governments:
Bicycle & Pedestrian Outreach TDMRALBP15 - - - 1,303
Transportation Demand Management Grant TDMRAL15 - - - 868
Transportation Demand Management Grant TDMRAL16 - 74,372 - 74,532
Total Passed-Through Triangle J Council of Governments: - 74,372 - 76,703
Total N.C. Department of Transportation - 13,310,621 - 76,703
166
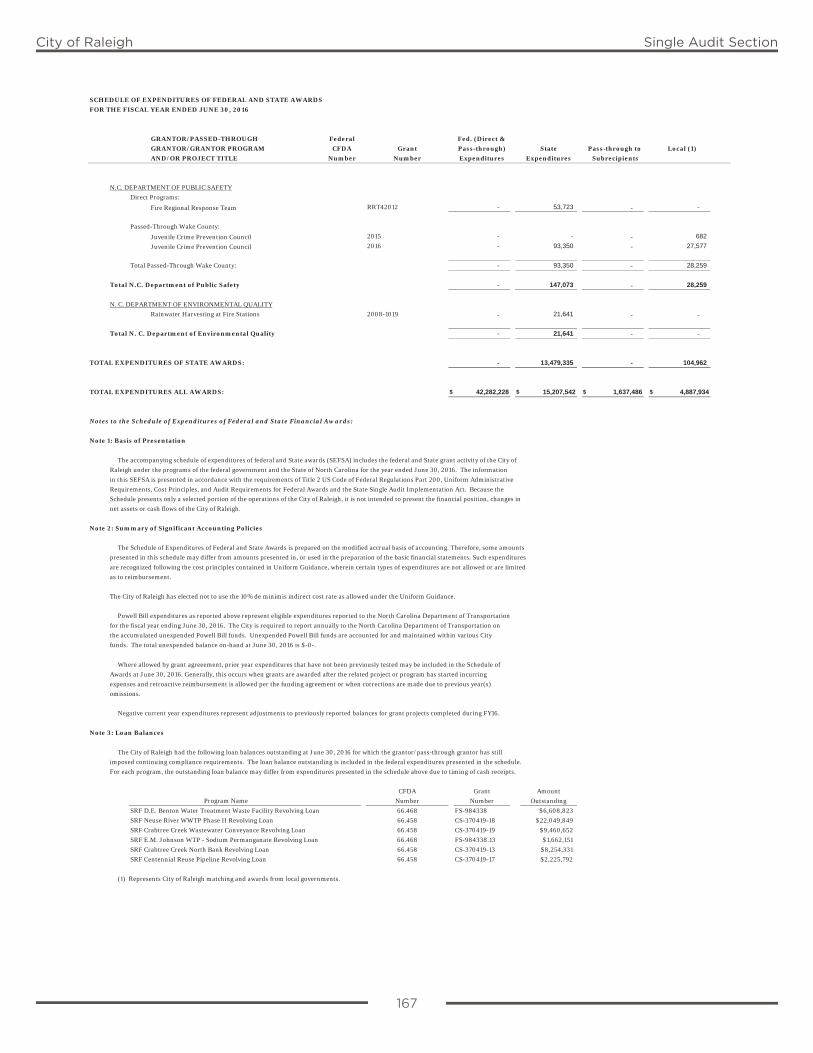
167
City of Raleigh Single Audit Section
SCHEDULE OF EXPENDITURES OF FEDERAL AND STATE AWARDS
FOR THE FISCAL YEAR ENDED JUNE 30, 2016
GRANTOR/PASSED-THROUGH Federal Fed. (Direct &
GRANTOR/GRANTOR PROGRAM CFDA Grant Pass-through) State Pass-through to Local (1)
AND/OR PROJECT TITLE Number Number Expenditures Expenditures Subrecipients
N.C. DEPARTMENT OF PUBLIC SAFETY
Direct Programs:
Fire Regional Response Team RRT42012 - 53,723 - -
Passed-Through Wake County:
Juvenile Crime Prevention Council 2015 - - - 682
Juvenile Crime Prevention Council 2016 - 93,350 - 27,577
Total Passed-Through Wake County: - 93,350 - 28,259
Total N.C. Department of Public Safety - 147,073 - 28,259
N. C. DEPARTMENT OF ENVIRONMENTAL QUALITY
Rainwater Harvesting at Fire Stations 2008-1019 - 21,641 - -
Total N. C. Department of Environmental Quality - 21,641 - -
TOTAL EXPENDITURES OF STATE AWARDS: - 13,479,335 - 104,962
TOTAL EXPENDITURES ALL AWARDS: $ 42,282,228 $ 15,207,542 $ 1,637,486 $ 4,887,934
Notes to the Schedule of Expenditures of Federal and State Financial Awards:
Note 1: Basis of Presentation
The accompanying schedule of expenditures of federal and State awards (SEFSA) includes the federal and State grant activity of the City of
Raleigh under the programs of the federal government and the State of North Carolina for the year ended June 30, 2016. The information
in this SEFSA is presented in accordance with the requirements of Title 2 US Code of Federal Regulations Part 200, Uniform Administrative
Requirements, Cost Principles, and Audit Requirements for Federal Awards and the State Single Audit Implementation Act. Because the
Note 2: Summary of Significant Accounting Policies
are recognized following the cost principles contained in Uniform Guidance, wherein certain types of expenditures are not allowed or are limited
as to reimbursement.
The City of Raleigh has elected not to use the 10% de minimis indirect cost rate as allowed under the Uniform Guidance.
Where allowed by grant agreeement, prior year expenditures that have not been previously tested may be included in the Schedule of
Awards at June 30, 2016. Generally, this occurs when grants are awarded after the related project or program has started incurring
expenses and retroactive reimbursement is allowed per the funding agreement or when corrections are made due to previous year(s)
omissions.
Note 3: Loan Balances
The City of Raleigh had the following loan balances outstanding at June 30, 2016 for which the grantor/pass-through grantor has still
imposed continuing compliance requirements. The loan balance outstanding is included in the federal expenditures presented in the schedule.
For each program, the outstanding loan balance may differ from expenditures presented in the schedule above due to timing of cash receipts.
CFDA Grant Amount
Number Number Outstanding
SRF D.E. Benton Water Treatment Waste Facility Revolving Loan 66.468 FS-984338 $6,608,823
SRF Neuse River WWTP Phase II Revolving Loan 66.458 CS-370419-18 $22,049,849
SRF Crabtree Creek Wastewater Conveyance Revolving Loan 66.458 CS-370419-19 $9,460,652
SRF E.M. Johnson WTP - Sodium Permanganate Revolving Loan 66.468 FS-984338.13 $1,662,151
SRF Crabtree Creek North Bank Revolving Loan 66.458 CS-370419-13 $8,254,331
SRF Centennial Reuse Pipeline Revolving Loan 66.458 CS-370419-17 $2,225,792
(1) Represents City of Raleigh matching and awards from local governments.
Program Name
the accumulated unexpended Powell Bill funds. Unexpended Powell Bill funds are accounted for and maintained within various City
funds. The total unexpended balance on-hand at June 30, 2016 is $-0-.
Negative current year expenditures represent adjustments to previously reported balances for grant projects completed during FY16.
Schedule presents only a selected portion of the operations of the City of Raleigh, it is not intended to present the financial position, changes in
Powell Bill expenditures as reported above represent eligible expenditures reported to the North Carolina Department of Transportation
for the fiscal year ending June 30, 2016. The City is required to report annually to the North Carolina Department of Transportation on
net assets or cash flows of the City of Raleigh.
The Schedule of Expenditures of Federal and State Awards is prepared on the modified accrual basis of accounting. Therefore, some amounts
presented in this schedule may differ from amounts presented in, or used in the preparation of the basic financial statements. Such expenditures
167
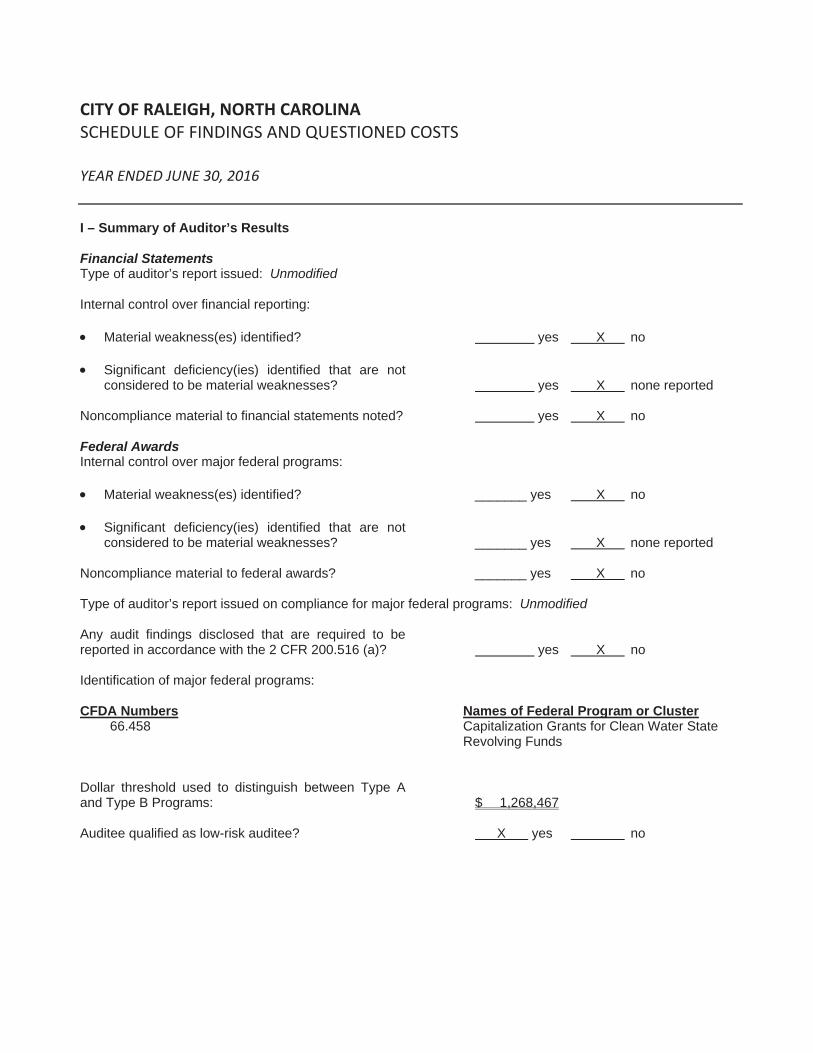
168
City of Raleigh Single Audit Section
CITY OF RALEIGH, NORTH CAROLINA SCHEDULE OF FINDINGS AND QUESTIONED COSTS YEAR ENDED JUNE 30, 2016
I – Summary of Auditor’s Results
Financial Statements Type of auditor’s report issued: Unmodified
Internal control over financial reporting:
Material weakness(es) identified? yes X no
Significant deficiency(ies) identified that are not considered to be material weaknesses? yes X none reported
Noncompliance material to financial statements noted? yes X no
Federal AwardsInternal control over major federal programs:
Material weakness(es) identified? _______ yes X no
Significant deficiency(ies) identified that are not considered to be material weaknesses? _______ yes X none reported
Noncompliance material to federal awards? _______ yes X no
Type of auditor’s report issued on compliance for major federal programs: Unmodified
Any audit findings disclosed that are required to be reported in accordance with the 2 CFR 200.516 (a)? yes X no
Identification of major federal programs:
CFDA Numbers Names of Federal Program or Cluster 66.458 Capitalization Grants for Clean Water State
Revolving Funds
Dollar threshold used to distinguish between Type A and Type B Programs: $ 1,268,467
Auditee qualified as low-risk auditee? X yes no

169
City of Raleigh Single Audit Section
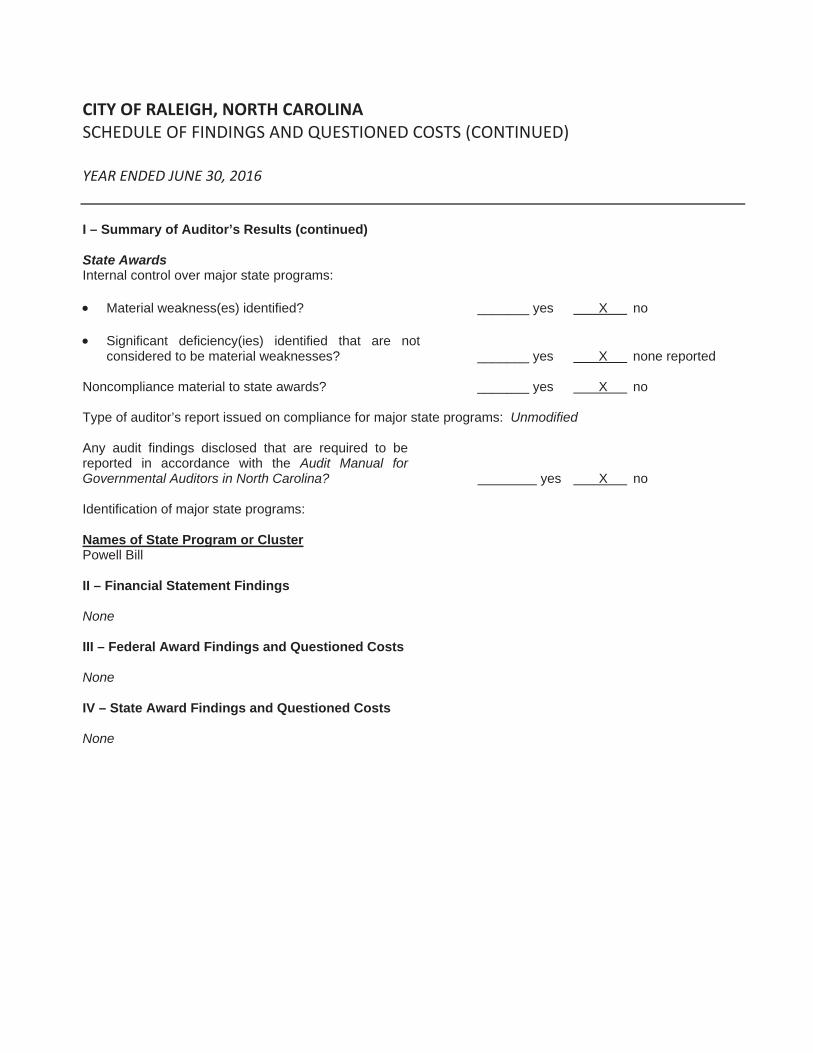
170
City of Raleigh Single Audit Section
CITY OF RALEIGH, NORTH CAROLINA SCHEDULE OF FINDINGS AND QUESTIONED COSTS (CONTINUED) YEAR ENDED JUNE 30, 2016
I – Summary of Auditor’s Results (continued)
State AwardsInternal control over major state programs:
Material weakness(es) identified? _______ yes X no
Significant deficiency(ies) identified that are not considered to be material weaknesses? _______ yes X none reported
Noncompliance material to state awards? _______ yes X no
Type of auditor’s report issued on compliance for major state programs: Unmodified
Any audit findings disclosed that are required to be reported in accordance with the Audit Manual for Governmental Auditors in North Carolina? yes X no
Identification of major state programs:
Names of State Program or Cluster Powell Bill
II – Financial Statement Findings
None
III – Federal Award Findings and Questioned Costs
None
IV – State Award Findings and Questioned Costs
None

171
City of Raleigh Single Audit Section
172
City of Raleigh Single Audit Section
CITY OF RALEIGH, NORTH CAROLINA SUMMARY SCHEDULE OF PRIOR AUDIT FINDINGS YEAR ENDED JUNE 30, 2016
There were no findings reported in the prior year audit of the basic financial statements, findings and questioned costs related to our audit of federal and state awards.

173
City of Raleigh Single Audit Section


CITY OF RALEIGH
Office of the City Manager919.996.3070
Office of the Chief Financial Officer919.996.4930
Post Office Box 590Raleigh, North Carolina 27602
raleighnc.gov