city of philadelphia philadelphia water department ... financial statements - final.pdfcity of...
TRANSCRIPT

City Of Philadelphia
Philadelphia Water Department
Financial Statements Fiscal Years Ended June 30, 2016 And 2015

CITY OF PHILADELPHIA WATER DEPARTMENT
YEAR ENDED JUNE 30, 2016 AND 2015
TABLE OF CONTENTS
MANAGEMENT DISCUSSION & ANALYSIS 1-7
BASIC FINANCIAL STATEMENTS
STATEMENTS OF NET POSITION 8
STATEMENTS OF REVENUES, EXPENSES, AND CHANGES IN NET POSITION 9
STATEMENTS OF CASH FLOWS 10
NOTES TO THE FINANCIAL STATEMENTS
REPORTING ENTITY 11-13
SUMMARY OF SIGNIFICANT ACCOUNTING POLICIES 13-19
DEPOSITS AND INVESTMENTS 19-23
ACCOUNTS RECEIVABLE 24
PROPERTY, PLANT, AND EQUIPMENT 25
LEASES 26
IMPAIRED ASSETS 26
RESTRICTED ASSETS 26-27
VACATION LEAVE 27
SICK LEAVE 27
ACCOUNTING FOR THE NEW RIVER CITY PROJECT FUNDS – WATER SINKING
FUND RESERVE SUBSTITUTION 27-28
DEFERRED COMPENSATION PLAN 28
ARBITRAGE REBATE 28
DEBT PAYABLE 29-34
DERIVATIVE INSTRUMENT 35-36
PENSION PLAN 37-61
OTHER POST EMPLOYMENT BENEFITS 61-63
CLAIMS, LITIGATION, AND CONTINGENCIES 63-64
LONG TERM AGREEMENT 64-66
COMBINED SEWER OVERFLOW PROGRAM 66-67
PLEDGE OF REVENUES 67-68
RISK MANAGEMENT 68-69
RESTATEMENT OF NET POSITION / CHANGE IN ACCOUNTING PRINCIPLE 70
RECLASSIFICATION OF EXPENSE 70
SUBSEQUENT EVENT 71
REQUIRED SUPPLEMENTARY INFORMATION
BUDGETARY COMPARISON SCHEDULE (LEGALLY ENACTED BASIS) - WATER
OPERATING FUND 73
OTHER POST EMPLOYMENT BENEFITS – SCHEDULE OF FUNDING PROGRESS 74
MUNICIPAL PENSION PLAN – SCHEDULE OF CHANGES IN NET PENSION
LIABILITY 75
MUNICIPAL PENSION PLAN – SCHEDULES OF COLLECTIVE CONTRIBUTIONS
– LAST 10 YEARS 76-77
OTHER SUPPLEMENTARY INFORMATION
BONDED DEBT 79
SUPPLEMENTAL SCHEDULE OF RATE COVENANT COMPLIANCE (LEGALLY ENACTED BASIS) 80
RECONCILIATION OF LEGALLY ENACTED AND GAAP BASIS OPERATING
REVENUES AND EXPENSES 81
CAPITAL IMPROVEMENT PROGRAM BUDGET 82
HISTORICAL OPERATING RESULTS 83

1
The City of Philadelphia Water Department Management Discussion and Analysis
The Philadelphia Water Department is one of the City’s ten operating departments and serves under a dedicated Water Fund established pursuant to the Philadelphia Home Rule Charter. Pursuant to the Charter, the Water Department has the power and duty to operate, maintain, repair, and improve the City’s water system (the “Water System”) and the City’s wastewater system (the “Wastewater System”); together with the Water System, the “Water and Wastewater Systems” or the “Combined System”).
The Water Department’s primary mission is to plan for, operate, and maintain both the infrastructure and the organization necessary to purvey high-quality drinking water, to provide an adequate and reliable water supply for all household, commercial, and community needs, and to sustain and enhance the region’s watersheds and quality of life by managing wastewater effectively.
The Water Department serves the City of Philadelphia and also provides wastewater services to ten wholesale customers and water services to one wholesale water customer. The Water Department operates three drinking water plants which have the capacity to treat and deliver about 522 million gallons per day of top quality drinking water that meets or exceeds all federal, state, and local regulations. Additionally, it operates three water pollution control plants that have the capacity to treat over 1 billion gallons of wastewater per day at a level that meets or exceeds federal and state standards.
The operations of the activity of the Water Department are accounted for with a separate set of balancing accounts that comprise the assets, deferred outflows of resources, liabilities, deferred inflows of resources, net position, revenues, and expenses. The activity of the Water Department is grouped in the financial statements into the broad category referred to as an enterprise fund (the “Water Fund”).
2016 Financial Highlights
The Water Fund met its bond coverage ratios for the year with a revenue bond coverage ratio of 1.24, a total debt service coverage ratio of 1.13, and a net operating revenue bond coverage ratio of 1.23 prior to the inclusion of the transfer from the Rate Stabilization Fund.
At the end of the current fiscal year, the Water Fund’s net position totaled $765.1 million resulting from an excess of its assets and deferred outflows of resources over its liabilities and deferred inflows of resources; its unrestricted net position showed a deficit of $258.2 million. This deficiency will have to be funded from resources generated in future years.
The Water Fund’s net position showed an increase of $55.5 million during the current Fiscal Year compared with a decrease of $260.9 million for the prior fiscal year.
Overview of the Financial Statements
This section serves as an introduction to the Basic Financial Statements. It represents management’s examination and analysis of the Water Fund’s financial condition and performance.
The Financial Statements report information about the Water Fund using the Full Accrual Accounting method as used by similar business activities in the private sector.

2
The Water Fund’s basic financial statements include the statements of net position, statements of revenues, expenses, and changes in net position, statements of cash flows, and notes to the financial statements.
The financial statements are prepared in accordance with accounting principles promulgated by the Governmental Accounting Standards Board (GASB).
Statement of Net Position: The statement of net position presents the financial position of the Water Fund. It presents information on the assets, deferred outflows of resources, liabilities, and deferred inflows of resources with the difference between them reported as net position. Over time, increases or decreases in net position may serve as a useful indicator of whether the financial position of the Water Fund is improving or deteriorating.
Statement of Revenues, Expenses, and Changes in Net Position: The statement of revenues, expenses, and changes in net position presents information showing how the net position changed during the most recent fiscal year. All changes in net position are reported as soon as the underlying event giving rise to the change occurs, regardless of the timing of related cash flows. Revenues are recognized when earned, not when they are received. Expenses are recognized when incurred, not when they are paid. Thus, revenues and expenses are reported in this statement for some items that will result in cash flows in future fiscal periods (e.g. salary and wages payable).
Statement of Cash Flows: The statement of cash flows presents information on the effects changes in assets, liabilities, and operations have on cash during the course of the fiscal year.
The Water Fund’s financial statements can be found following the Management Discussion and Analysis. The Notes provide additional information that is essential to a full understanding of the data provided in the Water Fund financial statements. In addition to the basic financial statements and accompanying notes, government accounting standards require presentation of required supplementary information (“RSI”). Following the RSI, the Fund has presented other supplementary information (“OSI”).
Please see the Comprehensive Annual Financial Report of the City of Philadelphia for complete financial information for the City and its component units, which can be found at http://www.phila.gov/investor/CAFR.html.
3
Financial Analysis
Net Position
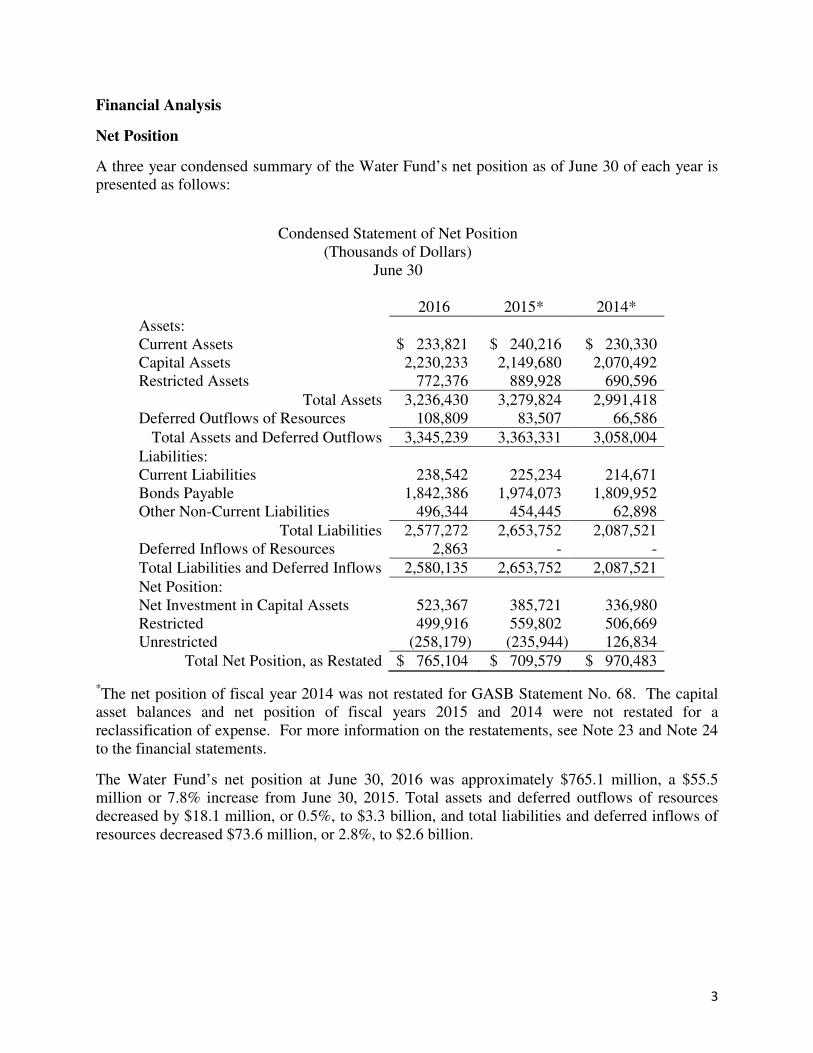
A three year condensed summary of the Water Fund’s net position as of June 30 of each year is presented as follows:
Condensed Statement of Net Position
(Thousands of Dollars) June 30
2016 2015* 2014*
Assets: Current Assets $ 233,821 $ 240,216 $ 230,330 Capital Assets 2,230,233 2,149,680 2,070,492 Restricted Assets 772,376 889,928 690,596
Total Assets 3,236,430 3,279,824 2,991,418 Deferred Outflows of Resources 108,809 83,507 66,586
Total Assets and Deferred Outflows 3,345,239 3,363,331 3,058,004
Liabilities: Current Liabilities 238,542 225,234 214,671 Bonds Payable 1,842,386 1,974,073 1,809,952 Other Non-Current Liabilities 496,344 454,445 62,898
Total Liabilities 2,577,272 2,653,752 2,087,521 Deferred Inflows of Resources 2,863 - -
Total Liabilities and Deferred Inflows 2,580,135 2,653,752 2,087,521
Net Position: Net Investment in Capital Assets 523,367 385,721 336,980 Restricted 499,916 559,802 506,669 Unrestricted (258,179) (235,944) 126,834
Total Net Position, as Restated $ 765,104 $ 709,579 $ 970,483
*The net position of fiscal year 2014 was not restated for GASB Statement No. 68. The capital asset balances and net position of fiscal years 2015 and 2014 were not restated for a reclassification of expense. For more information on the restatements, see Note 23 and Note 24 to the financial statements.
The Water Fund’s net position at June 30, 2016 was approximately $765.1 million, a $55.5 million or 7.8% increase from June 30, 2015. Total assets and deferred outflows of resources decreased by $18.1 million, or 0.5%, to $3.3 billion, and total liabilities and deferred inflows of resources decreased $73.6 million, or 2.8%, to $2.6 billion.

4
The following is a discussion of the more significant changes in assets and deferred outflows of resources, liabilities and deferred inflows of resources, and net position in fiscal year 2016:
• After restatement (see Note 5 and Note 24), capital assets, net of depreciation and amortization, increased by $102.6 million to $2.2 billion, or 4.8% as a result of capital additions of $278.8 million, offset by depreciation of $101.7 million and net retirements of $74.5 million.
• Current assets decreased by $6.4 million to $233.8 million, or 2.7%, due to decreases in accounts receivable.
• Restricted assets decreased by $117.6 million to $772.4 million, or 13.2%, due to decreases in the Water Capital Fund primarily due to capital expenses.
• Deferred outflows of resources increased by $25.3 million to $108.8 million, or 30.3%, due to deferred outflows of resources related to the Water Fund’s net pension liability being recognized during fiscal year 2016, which was partially offset by amortization of the unamortized loss on refunded debt.
• Current liabilities increased by $13.3 million to $238.5 million, or 5.9%, primarily due to an increase in the amount of construction contracts payable.
• Bonds payable decreased by $131.7 million to $1.8 billion, or 6.7%, primarily due to the maturity (pay down) of revenue bonds.
• Other non-current liabilities increased by $41.9 million to $496.3 million, or 9.2%, primarily due to an increase in net pension liability of $40.5 million.
• Deferred inflows of resources increased by $2.9 million to $2.9 million, or 100.0%, due to deferred inflows of resources related to the Water Fund’s net pension liability being recognized during fiscal year 2016.
• The Water Fund’s net position increased by $55.5 million to $765.1 million, or 7.8%, as a result of fiscal year 2016 operations and capital contributions.
• Net investment in capital assets increased by $137.6 million, or 35.7%, to $523.4 million.
• Unrestricted net position decreased by $22.2 million, or 9.4%, to a deficit of $258.2 million. The unrestricted component of net position represents the net amount of total assets, deferred outflows of resources, total liabilities, and deferred inflows of resources that are not included in the determination of net investment in capital assets or restricted components of net position. The $22.2 million change is primarily due to a prior period adjustment (see Note 24) of $22.0 million, which relates to items that were capitalized and should have been expensed in prior years.

5
Changes in Net Position
A condensed summary of the Water Fund’s Statement of Revenues, Expenses, and Changes in Net Position for the years ended June 30 is presented as follows:
Condensed Statement of Revenues, Expenses, and Changes in Net Position (Thousands of Dollars)
Year Ended June 30
2016 2015* 2014*
Operating Revenues: Charges for Goods and Services $ 659,583 $ 667,699 $ 630,429 Miscellaneous Operating Revenues 10,367 8,261 8,146 Operating Grants 870 907 1,399
Total Operating Revenues 670,820 676,867 639,974
Operating Expenses: Operating Expenses excluding Depreciation and Amortization 382,272
376,528
354,686
Depreciation and Amortization 101,711 103,763 90,523
Total Operating Expenses 483,983 480,291 445,209
Operating Income (Loss) 186,837 196,576 194,765
Nonoperating Revenues (Expenses): Federal, State, & Local Grants 250 - - Interest Income 5,600 3,732 4,207 Net Pension Obligation - - (17,712) Debt Service – Interest (82,659) (65,933) (77,561) Other Expenses (2,339) (3,993) (2,971)
Total Nonoperating Revenues (Expenses) (79,148) (66,194) (94,037)
Increase in Net Position before Transfers 107,689 130,382 100,728 Transfers Out (31,622) (30,258) (28,333) Capital Contributions 1,506 1,337 -
Change in Net Position 77,573 101,461 72,395 Net Position – Beginning of Period, Before Restatement 709,579 970,483 898,088 Cumulative Effect of Change in Accounting Principle - (362,365) - Reclassification of Expense (22,048) - -
Net Position – Beginning of Period, as Restated* 687,531 608,118 898,088
Net Position – Ending of Period $ 765,104 $ 709,579 $ 970,483
*The net position of fiscal year 2014 was not restated for GASB Statement No. 68. The net position of fiscal years 2015 and 2014 was not restated for a reclassification of expense. For more information on the restatements, see Note 23 and Note 24 to the financial statements.
• Operating revenues decreased by $6.0 million to $670.8 million due to a reduction in charges for goods and services.
• Operating expenses increased by $3.7 million to $484.0 million due primarily to increases in employee benefits and indemnities, partially offset by a reduction in purchased services, materials and supplies, and depreciation expense.
• Non-operating expenses increased by $13.0 million to $79.1 million. The increase in non-operating expenses is due primarily to the debt service interest expense increase of $16.7 million, partially offset by the $1.7 million decrease in other expenses and $1.9 million increase in interest income.

6
Capital Assets and Debt Administration
Capital Assets
Investment in capital assets, net of accumulated depreciation, amounted to $2.2 billion as of June 30, 2016. This represented an increase of $102.6 million, or 4.8% over the previous year’s total of $2.1 billion. Capital assets consist primarily of land, infrastructure, construction in progress, buildings, and equipment. Infrastructure consists of water and wastewater transmission and distribution lines. The following is a summary of capital assets as of June 30:
Capital Asset Activity
(Thousands of Dollars) June 30
2016 2015* 2014*
Land $ 5,919 $ 5,919 $ 5,919 Construction in Progress 296,254 303,005 361,592 Infrastructure 2,466,451 2,422,387 2,269,015 Buildings and Equipment 1,768,387 1,667,810 1,623,520 Accumulated Depreciation (2,306,778) (2,249,441) (2,189,554)
Total Capital Assets, net $ 2,230,233 $ 2,149,680 $ 2,070,492
*The capital assets of 2015 and 2014 were not restated for a reclassification of expense. For more information on the restatements, see Note 23 and Note 24 to the financial statements.
Long-Term Debt
As of June 30, 2016, the Water Fund had $2.3 billion of non-current liabilities outstanding. This was a decrease of $89.8 million or 3.7% from the previous year. The following is a summary of the non-current liability outstanding as of June 30:
Non-Current Liability Activity (Thousands of Dollars)
June 30 2016 2015 2014
Revenue Bonds – Net $ 1,842,386 $ 1,974,073 $ 1,809,952 Derivative Instrument 1,508 3,289 5,711 Other Non-Current Liabilities 38,995 35,829 30,514 Net Pension Obligation 455,841 415,327 26,673
Total Non-Current Liabilities $ 2,338,730 $ 2,428,518 $ 1,872,850
The following details activity to debt during 2016: (Thousands of Dollars)
Beginning balance at July 1, 2015 $ 2,110,797 Debt issued 5,823 Less principal payments and amortization (149,506)
Ending balance at June 30, 2016 $ 1,967,114
More detailed information concerning long-term debt activity and capital asset activity is disclosed in Note 14 and Note 5, respectively, of the financial statements.

7
Budgetary Highlights
Please see the supplementary Budgetary Comparison Schedule located in the Required Supplementary Information section.
Requests for Information This financial report is designed to provide a general overview of the City of Philadelphia Water Department’s finances for all interested parties. Questions concerning any of the information provided in this report, or requests for additional information, should be addressed to the Philadelphia Water Department, Finance Division, Aramark Tower, 5th Floor, 1101 Market Street, Philadelphia, Pennsylvania 19107.

CITY OF PHILADELPHIA WATER DEPARTMENT
STATEMENTS OF NET POSITION
JUNE 30, 2016 AND 2015
2016 2015*
ASSETS:
Current Assets:
Cash on Deposit and on Hand 30$ 30$
Equity in Treasurer's Account 79,044 80,040
Due from Other Governments 125 -
Accounts Receivable 152,588 158,975
Allowance for Doubtful Accounts (13,007) (12,399)
Inventories 14,915 13,323
Receivables 126 247
Total Current Assets 233,821 240,216
Noncurrent Assets:
Restricted Assets:
Equity in Treasurer's Account 550,746 668,043
Sinking Funds and Reserves 220,890 221,198
Receivables 740 687
Total Restricted Assets 772,376 889,928
Capital Assets:
Land 5,919 5,919
Infrastructure 2,466,451 2,422,387
Construction in Progress 296,254 303,005
Buildings and Equipment 1,768,387 1,667,810
Accumulated Depreciation (2,306,778) (2,249,441)
Total Capital Assets 2,230,233 2,149,680
Total Noncurrent Assets 3,002,609 3,039,608
Total Assets 3,236,430 3,279,824
DEFERRED OUTFLOWS OF RESOURCES:
Deferred Outflow - Fin. Instruments 1,508 3,289
Deferred Outflow - Net Pension Liability 59,042 24,374
Deferred Outflow - Unamortized Loss on Refunded Debt 48,259 55,844
Total Deferred Outflows of Resources 108,809 83,507
LIABILITIES:
Current Liabilities:
Vouchers Payable 6,635 10,798
Accounts Payable 11,939 12,339
Salaries & Wages Payable 6,598 5,582
Construction Contracts Payable 42,880 21,911
Accrued Expenses 33,215 23,554
Due to Other Components 918 3,041
Due to Other Funds 103 -
Unearned Revenue 9,785 8,905
Funds Held in Escrow 1,741 2,380
Current Portion of Long Term Obligations 124,728 136,724
Total Current Liabilities 238,542 225,234
Noncurrent Liabilities:
Bond Payable - Net 1,842,386 1,974,073
Derivative Instrument Liability 1,508 3,289
Other Noncurrent Liabilities 38,995 35,829
Net Pension Liability 455,841 415,327
Total Noncurrent Liabilities 2,338,730 2,428,518
Total Liabilities 2,577,272 2,653,752
DEFERRED INFLOWS OF RESOURCES:
Deferred Inflow - Net Pension Liability 2,863 -
Total Deferred Inflows of Resources 2,863 -
NET POSITION:
Net Investment in Capital Assets 523,367 385,721
Restricted For:
Capital Projects 73,266 132,157
Debt Service 220,889 221,198
Rate Stabilization 205,761 206,447
Unrestricted (258,179) (235,944)
Total Net Position 765,104$ 709,579$
* The capital asset balances and the net position of fiscal year 2015 were not restated for a reclassification of expense.
The accompanying notes are an integral part of the financial statements. 8
(Thousands of Dollars)
June 30

CITY OF PHILADELPHIA WATER DEPARTMENT
STATEMENTS OF REVENUES, EXPENSES AND CHANGES IN NET POSITION
FOR FISCAL YEAR ENDED JUNE 30, 2016 AND 2015
2016 2015*
Operating Revenues:
Charges for Goods and Services 659,583$ 667,699$
Miscellaneous Operating Revenues 10,367 8,261
Operating Grants 870 907
Total Operating Revenues 670,820 676,867
Operating Expenses:
Personal Services 122,873 121,770
Purchase of Services 97,409 104,444
Materials and Supplies 36,376 37,382
Employee Benefits 117,394 108,914
Indemnities and Taxes 8,220 4,018
Depreciation and Amortization 101,711 103,763
Total Operating Expenses 483,983 480,291
Operating Income 186,837 196,576
Nonoperating Revenues (Expenses):
Federal, State, & Local Grants 250 -
Interest Income 5,600 3,732
Debt Service - Interest (82,659) (65,933)
Other Expenses (2,339) (3,993)
Total Nonoperating Expenses (79,148) (66,194)
Increase in Net Position before Transfers 107,689 130,382
Transfers Out (31,622) (30,258)
Capital Contributions 1,506 1,337
Change in Net Position 77,573 101,461
Net Position - Beginning of Year, Before Restatement 709,579 970,483
Cumulative Effect of Change in Accounting Principle - (362,365)
Reclassification of Expense (22,048) -
Net Position - Beginning of Year, as Restated (Note 23) 687,531 608,118
Net Position - End of Year 765,104$ 709,579$
* The net position of fiscal year 2015 was not restated for a reclassification of expense.
The accompanying notes are an integral part of the financial statements. 9
(Thousands of Dollars)
Year Ended June 30

CITY OF PHILADELPHIA WATER DEPARTMENT
STATEMENTS OF CASH FLOWS
FOR FISCAL YEAR ENDED JUNE 30, 2016 AND 2015
2016 2015
Cash Flows from Operating Activities:
Receipts from Customers 677,061$ 675,466$
Payments to Suppliers (143,758) (141,177)
Payments to Employees (230,376) (222,723)
Claims Paid (5,441) (4,018)
Net Cash Provided by Operating Activities 297,486 307,548
Cash Flows from Non-Capital Financing Activities:
Operating Grants Received 1,120 907
Operating Subsidies and Transfers to Other Funds (31,622) (30,258)
Net Cash Used by Non-Capital Financing Activities (30,502) (29,351)
Cash Flows from Capital & Related Financing Activities:
Proceeds from Capital Debt 5,823 300,758
Acquisition and Construction of Capital Assets (175,797) (174,135)
Interest Paid on Capital Debt (82,250) (78,951)
Principal Paid on Capital Debt (136,712) (121,848)
Other Receipts (Payments) 33 -
Net Cash Used by Non-Capital Financing Activities (388,903) (74,176)
Cash Flows from Investing Activities:
Interest and Dividends 3,626 2,186
Net Cash Provided by Investing Activities 3,626 2,186
Net (Decrease) Increase in Cash & Cash Equivalents (118,293) 206,207
Balances - Beginning of the Year 748,113 541,906
Balances - End of the Year 629,820$ 748,113$
Reconciliation of Operating Income to
Net Cash Provided by Operating Activities:
Operating Income 186,837 196,576
Adjustments to Reconcile Operating Income to Net Cash
Provided (Used) by Operating Activities:
Depreciation and Amortization Expense 101,711 103,763
Change in Assets and Liabilities:
Receivables, Net 4,220 (1,382)
Inventories (1,593) 100
Accounts and Other Payables 2,265 3,196
Accrued Expenses 3,166 5,314
Unearned Revenue 880 (19)
Net Cash Provided by Operating Activities 297,486$ 307,548$
Reconciliation of Cash and Cash Equivalents to Statement of Net Position
Cash on Deposit and on Hand 30 30
Equity in Treasurer's Account - Current Portion 79,044 80,040
Equity in Treasurer's Account - Noncurrent Portion 550,746 668,043
Total Cash and Cash Equivalents 629,820$ 748,113$
The accompanying notes are an integral part of the financial statements. 10
(Thousands of Dollars)
Year Ended June 30

11
PHILADELPHIA WATER DEPARTMENT
NOTES TO THE FINANCIAL STATEMENTS
JUNE 30, 2016 AND 2015
NOTE 1: REPORTING ENTITY
The City of Philadelphia was founded in 1682 and was merged with the county in 1854. Since 1951 the City has been governed largely under the Philadelphia Home Rule Charter. However, in some matters, including the issuance of short-term and long-term debt, the City is governed by the laws of the Commonwealth of Pennsylvania.
The Philadelphia Water Department serves the City of Philadelphia by providing an integrated water and wastewater system. The utility's primary mission is to plan for, operate and maintain both the infrastructure and the organization necessary to purvey high quality drinking water, to provide an adequate and reliable water supply for all household, commercial, and community needs, and to sustain and enhance the region's watersheds and quality of life by managing wastewater and stormwater effectively.
In order to accomplish its mission, the Water Department has the power and duty to operate, maintain, repair and improve the City’s water and wastewater systems. The Water Department is managed by a Commissioner who is appointed by the City’s Managing Director with the approval of the Mayor.
The operations of the Water Department are accounted for in separate balancing accounts that comprise its assets, deferred outflows of resources, liabilities, deferred inflows of resources, net position, revenues and expenses. The activity of the Water Department is grouped in the financial statements into the broad category referred to as an enterprise fund (“Water Fund”). Such activities are used to account for operations (1) that are financed and operated in a manner similar to private business enterprises – where the intent of the government body is that costs (expenses, including depreciation) of providing goods and services to the general public on a continuous basis be recovered primarily through user charges or (2) where the government body has decided that periodic determination of revenues earned, expenses occurred, and/or net income is appropriate for capital maintenance, public policy, management’s control of accountability, and other purposes.
The activities of the Water Fund are segregated as follows:
• The Operating Fund is used to account for the operations of the water and wastewater systems.
• The Revenue Bond Sinking Fund is used to account for the payment of interest of the outstanding debt.

12
PHILADELPHIA WATER DEPARTMENT
NOTES TO THE FINANCIAL STATEMENTS
JUNE 30, 2016 AND 2015
NOTE 1: REPORTING ENTITY (CONTINUED)
• The Debt Reserve Fund is funded from the proceeds of each series of Water and Wastewater Revenue Bonds; provided, however, that if the Supplemental Ordinance authorizing a series of Water and Wastewater Revenue Bonds shall so authorize, the deposit to the Debt Reserve Account in respect of such Water and Wastewater Revenue Bonds may be accumulated from project revenues over a period of not more than three fiscal years after the issuance and delivery of such Water and Wastewater Revenue Bonds. The moneys and investments in the Debt Reserve Account are held and maintained in an amount equal at all times to the Debt Reserve Requirement. If at any time the moneys in the Debt Service Account of the Sinking Fund shall be insufficient to pay as and when due the principal of (and premium, if any) or interest on any Water and Wastewater Revenue Bonds or other obligations payable from the Debt Service Account (including obligations arising in connection with Qualified Swap Agreements and Credit Facilities), the fiscal agent is required to pay over from the Debt Reserve Account the amount of such deficiency for deposit in the Debt Service Account. With respect to any issue of Water and Wastewater Revenue Bonds, in lieu of the required deposit into the Debt Reserve Account, the City may cause to be deposited into the Debt Reserve Account a surety bond, an insurance policy or an irrevocable letter of credit meeting the requirements of the General Ordinance and the Bond Committee Determination relating to such issue.
The Debt Reserve Account Amendment authorizes (i) the Director of Finance to apply moneys currently on deposit in the Debt Reserve Account to purchase a surety bond or insurance policy complying with the terms of the General Ordinance (described below), (ii) the transfer of the resulting excess moneys in the Debt Reserve Fund to the Revenue Fund and from there, upon compliance with the provisions of the General Ordinance to a new account in the Residual Fund called the Special Water Infrastructure Account and (iii) the application of the moneys deposited in the Special Water Infrastructure Account to the cost of renewals, replacements and improvements to the water and wastewater systems.
• The Rate Stabilization Fund was created with the sale of the Series 1993 Revenue Bonds on August 20, 1993. The purpose of the Fund is to maintain assets to be drawn down to offset future deficits (and corresponding rate increase requirements) in the Water Department Operating Fund.
During Fiscal 2016, the fund had the following activity:
Balance at July 1, 2015 $ 206,446,966 Transfer to Operating Fund (1,629,332) Interest Earnings 942,994
Balance at June 30, 2016 $ 205,760,628

13
PHILADELPHIA WATER DEPARTMENT
NOTES TO THE FINANCIAL STATEMENTS
JUNE 30, 2016 AND 2015
NOTE 1: REPORTING ENTITY (CONTINUED)
During Fiscal 2015, the fund had the following activity:
Balance at July 1, 2014 $184,795,581 Deposit from Operating Fund 21,456,199 Interest Earnings 195,186
Balance at June 30, 2015 $206,446,966
• The Residual Fund was created with the sale of the Series 1993 Revenue Bonds on August 20, 1993. The purpose of the Fund is to maintain the remaining assets after payment of all operating expenses, payment of all debt service obligations including payments under a swap agreement, scheduled transfers to the Rate Stabilization Fund, and required deposits to the Capital Account of the Construction Fund. The balance of the Residual Fund was $15,188,580 at June 30, 2016 and $14,993,329 at June 30, 2015.
NOTE 2: SUMMARY OF SIGNIFICANT ACCOUNTING POLICIES
The accompanying financial statements include all funds which are controlled by the City of Philadelphia, on behalf of the Water Fund. The financial statements have been prepared in accordance with Generally Accepted Accounting Principles as they apply to governmental units. The Governmental Accounting Standards Board (GASB) of the American Institute of Certified Public Accountants is the accepted standard setting body for establishing governmental accounting and financial reporting principles. The following is a summary of the significant accounting policies.
A. Basis of Accounting
The financial statements are reported using the economic resources measurement focus and the accrual basis of accounting. Revenues are recorded when earned and expenses are recorded when a liability is incurred, regardless of timing of related cash flows. Grants and similar items are recognized as revenues as soon as all eligibility requirements imposed by the provider have been met.
Operating revenues and expenses are distinguished from non-operating items in the statement of revenues, expenses and changes in net position. Operating revenues and expenses result from providing services in connection with the Water Department’s principle ongoing operations. Principal operating revenues of the Water Department are charges to customers for water use and wastewater collection, transmission and treatment. When calculating user fees charged to customers, the Water Department includes a component for the repayment of principal on the Water Department’s outstanding debt.

14
PHILADELPHIA WATER DEPARTMENT
NOTES TO THE FINANCIAL STATEMENTS
JUNE 30, 2016 AND 2015
NOTE 2: SUMMARY OF SIGNIFICANT ACCOUNTING POLICIES
(CONTINUED)
A. Basis of Accounting (Continued)
Operating expenses include the cost of providing water and watershed services, administrative expenses and depreciation on capital assets. All revenues and expenses not meeting this definition are reported as non-operating revenues and expenses. The principal non-operating revenues of the Water Department are interest and grants. The principal non-operating expenses of the Water Department include interest expense and other miscellaneous expenses.
B. Capital Assets
Capital assets are defined by the City as assets with an initial individual cost of more than $5,000 and an estimated useful life in excess of three years. Capital assets are reported at cost including any liability for contract retainage and construction costs payable. Assets acquired by gift or bequest are recorded at their acquisition price at the date of the gift. Upon sale or retirement, the cost of the assets and the related accumulated depreciation, if any, are removed from the accounts. Maintenance and repair costs are charged to operations. Renewals and betterments are capitalized and depreciated based upon the expected life of such improvements.
The Water Fund transfers construction in progress to one or more of the major asset classes when they are considered substantially complete.
Cost of construction includes all direct contract costs plus overhead charges. Overhead costs include direct and indirect engineering costs and interest incurred during the construction period on projects financed with tax-exempt debt. The amount of interest to be capitalized is calculated by offsetting interest expense incurred from the date of the borrowing until completion of the project with interest on invested proceeds over the same period. Capitalization of interest during construction for Fiscal Year 2016 was $6,212,946 and for Fiscal Year 2015 was $7,685,673.
Depreciation on the capital assets is provided on the straight-line method over their estimated useful lives: computer equipment – 3 years; automotive – 5 years; leasehold improvements – 8 years; general and monitoring equipment – 10 - 20 years; buildings – 40 years; reconstructed transmission and distribution lines – 40 years; and new transmission and distribution lines – 50 years.
C. Bonds and Related Premiums, Discounts, and Issuance Costs
Bond premiums and discounts are deferred and amortized over the life of the bonds using the effective interest method. For financial reporting purposes, bond discounts and premiums are offset against bonds payable. Bond issuance costs are recognized as an expense and reported in the period incurred.

15
PHILADELPHIA WATER DEPARTMENT
NOTES TO THE FINANCIAL STATEMENTS
JUNE 30, 2016 AND 2015
NOTE 2: SUMMARY OF SIGNIFICANT ACCOUNTING POLICIES
(CONTINUED)
D. Inventories
The materials and supplies inventory is priced using the “moving average cost” method.
E. Accounts Receivables
Accounts receivable consist of billed retail and wholesale water and sewer charges that have not been collected as of June 30. The City evaluates the collection of individual account balances and if necessary, records an allowance for doubtful accounts. The City’s policy is to file a lien against the respective property for delinquent water, sewer, and storm water customers. The City’s policy regarding its water customers is to discontinue services for those that refuse to pay, but only as a last resort. As of June 30, 2016 and 2015 the allowance for doubtful accounts was $13,006,803 and $12,399,107 respectively.
F. Unbilled Revenue
The City bills residential water and sewer customers on a monthly basis and wholesale water and sewer customers on a monthly basis. Revenue earned for services provided through June 30 but unbilled is included in accounts receivable on the accompanying financial statements.
G. Insurance
The City, except for the Airport and certain other properties, is self-insured for most fire and casualty losses to its structures and equipment and provides statutory workers’ compensation, unemployment benefits, and health and welfare to its employees through a self-insured plan. Construction contractors are required to carry protective general liability insurance indemnifying the City and the Contractor.
H. Cash and Investments
The Water Fund’s cash and investments are held in segregated operating and capital accounts. Sinking funds and reserves are maintained in segregated investment accounts to comply with reserve and other requirements of the bond covenants.
All highly liquid investments (except for Repurchase Agreements) with a maturity of three months or less when purchased are considered to be cash equivalents.
The investments of the City are reported at fair value. Short-term investments are reported at cost, which approximates fair value. Securities traded on national or international exchanges are valued at the last reported sales price. The fair value of real estate investments is based on independent appraisals. Investments, which do not have an established market, are reported at estimated fair value.
16
PHILADELPHIA WATER DEPARTMENT
NOTES TO THE FINANCIAL STATEMENTS
JUNE 30, 2016 AND 2015
NOTE 2: SUMMARY OF SIGNIFICANT ACCOUNTING POLICIES
(CONTINUED)
H. Cash and Investments (Continued)
Statutes authorize the City to invest in obligations of the Treasury, agencies, and instruments of the United States, repurchase agreements, collateralized certificates of deposit, bank acceptance or mortgage obligations, certain corporate bonds, and money market funds. The Pension Trust Fund also is authorized to invest in corporate bonds rated AA or better by Moody’s Bond Ratings, common stocks, and real estate.
I. Restricted Assets
Restricted assets represent revenues set-aside for liquidation of specific obligations, as detailed in Note 8.
J. Unearned Revenues
Unearned revenues represent funds received in advance of being earned. In the Water Fund, unearned revenues relate principally to over paid water and sewer bills.
K. Payment to City
In accordance with an agreement between the Finance Director and the Water Department, the Finance Director may transfer to the General Fund up to a limit of $4,994,000 in any fiscal year in “excess interest earnings” as defined by the Rate Covenants under the Ordinance. In Fiscal Years 2016 and 2015, excess interest earnings of $1,555,702 and $745,585, respectively, were transferred to the General Fund of the City.
L. Transfers for Long Term Contracts
In addition to the transfer of funds to the General Fund of the City, the Water Fund had operating transfers of $30,066,352 and $29,512,785 in Fiscal Years 2016 and 2015, respectively, to the Philadelphia Municipal Authority (“PMA”) for the long-term contracts described in Notes 19 A, B, and C.

17
PHILADELPHIA WATER DEPARTMENT
NOTES TO THE FINANCIAL STATEMENTS
JUNE 30, 2016 AND 2015
NOTE 2: SUMMARY OF SIGNIFICANT ACCOUNTING POLICIES
(CONTINUED)
M. Net Position
GASB requires the classification of net position into three components – net investment in capital assets; restricted; and unrestricted. These classifications are defined as follows:
Net Investment in Capital Assets – This component of net position consists of capital assets, net of accumulated depreciation, reduced by the outstanding balances of bonds, mortgages, notes, or other borrowings that are attributable to the acquisition, construction, or improvement of those assets. Deferred outflows of resources and deferred inflows of resources that are attributable to the acquisition, construction, or improvement of those assets or related debt are included.
Restricted – This component of net position consists of restricted assets and deferred outflows of resources reduced by liabilities and deferred inflows of resources related to those assets. The restrictions would be imposed by external parties including creditors, grantors, contributors, or laws or regulations of other governments and restrictions imposed by law through constitutional provisions or enabling legislation.
Unrestricted – This component of net position consists of the net amount of the assets, deferred outflows of resources, liabilities, and deferred inflows of resources that are not included in the determination of net investment in capital assets or the restricted component of net position.
When both restricted and unrestricted resources are available for use, it is the City’s policy to use restricted resources first, then unrestricted resources, as needed.
N. Deferred Outflows / Inflows of Resources
The statement of net position reports a separate section for deferred outflows of resources. This separate financial statement element represents a consumption of net position that applies to future period(s) and so will not be recognized as an outflow of resources (expense) until then. The Water Fund has three items that qualify for reporting in this category. The statement of net position reports a deferred outflow for refunded debt, a deferred outflow related to pensions, and a deferred outflow from its hedging derivative instrument.
The deferred outflows of resources related to the hedging derivative instrument represent the cumulative change in fair value. Deferred outflows of resources on refunded debt is the result of differences in the carrying value of refunded debt and its reacquisition price. The amount is deferred and amortized over the shorter of the life of the refunded and refunding debt. Deferred outflows of resources related to pensions are discussed in Note 16.

18
PHILADELPHIA WATER DEPARTMENT
NOTES TO THE FINANCIAL STATEMENTS
JUNE 30, 2016 AND 2015
NOTE 2: SUMMARY OF SIGNIFICANT ACCOUNTING POLICIES
(CONTINUED)
N. Deferred Outflows / Inflows of Resources (Continued)
The statement of financial position will sometimes report a separate section for deferred inflows of resources. This separate financial statement element, deferred inflows of resources, represents an acquisition of net position that applies to future period(s) and so will not be recognized as an inflow of resources (revenue) until that time. The Water Fund has one item that qualifies for reporting in this category, a deferred inflow related to pensions. Deferred inflows of resources related to pensions are discussed in Note 16.
O. Accounting Estimates
The preparation of financial statements, in conformity with accounting principles generally accepted in the United States of America, requires management to make estimates and assumptions that affect the reported amounts of assets, deferred outflows of resources, liabilities, deferred inflows of resources and net position and disclosures at the date of the financial statements and the reported amounts of revenues and expenses during the reporting period. Actual results may differ from those estimates.
P. Adoption of Governmental Accounting Standards Board Statements
The Water Fund adopted the requirements of GASB Statement No. 72, “Fair Value
Measurement and Application”. As a result of the adoption of GASB Statement No. 72, the Water Fund has determined and disclosed all fair value measurements.
The Water Fund adopted the requirements of GASB Statement No. 73, “Accounting and
Financial Reporting for Pensions and Related Assets That Are Not within the Scope of GASB
Statement 68, and Amendments to Certain Provisions of GASB Statements 67 and 68”. The adoption of this statement had no effect on previously reported amounts.
The Water Fund adopted the requirements of GASB Statement No. 76, “The Hierarchy of
Generally Accepted Accounting Principles for State and Local Governments”. The adoption of this statement had no effect on previously reported amounts.
Q. Pending Changes in Accounting Principles
In June 2015, the GASB issued Statement No. 74, “Financial Reporting for Postemployment
Benefits Plans Other Than Pension Plans”. The Water Fund is required to adopt the provisions of GASB Statement No. 74 for its fiscal year 2017 financial statements.
In June 2015, the GASB issued Statement No. 75, “Accounting and Financial Reporting for
Postemployment Benefits Other Than Pensions”. The Water Fund is required to adopt the provisions of GASB Statement No. 75 for its fiscal year 2018.

19
PHILADELPHIA WATER DEPARTMENT
NOTES TO THE FINANCIAL STATEMENTS
JUNE 30, 2016 AND 2015
NOTE 2: SUMMARY OF SIGNIFICANT ACCOUNTING POLICIES
(CONTINUED)
Q. Pending Changes in Accounting Principles (Continued)
In August 2015, the GASB issued Statement No. 77, “Tax Abatement Disclosures”. The Water Fund is required to adopt the provisions of GASB Statement No. 77 for its fiscal year 2017 financial statements.
In December 2015, the GASB issued Statement No. 78, “Pensions Provided through Certain
Multiple-Employer Defined Benefit Pension Plans”. The Water Fund is required to adopt the provisions of GASB Statement No. 78 for its fiscal year 2017 financial statements.
In January 2016, the GASB issued Statement No. 79, “Certain External Investment Pools and
Pool Participants”. The Water Fund is required to adopt the provisions of GASB Statement No. 79 for its fiscal year 2017 financial statements.
In January 2016, the GASB issued Statement No. 80, “Blending Requirements for Certain
Component Units – an amendment of GASB Statement No. 14”. The Water Fund is required to adopt the provisions of GASB Statement No. 80 for its fiscal year 2017 financial statements.
In March 2016, the GASB issued Statement No. 81, “Irrevocable Split-Interest Agreements”. The Water Fund is required to adopt the provisions of GASB Statement No. 81 for its fiscal year 2018 financial statements.
In March 2016, the GASB issued Statement No. 82, “Pension Issues – an amendment of GASB
Statements No. 67, No. 68, and No. 73”. The Water Fund is required to adopt the provisions of GASB Statement No. 82 for its fiscal year 2017 financial statements.
In November 2016, the GASB issued Statement No. 83, “Certain Asset Retirement Obligations”. The Water Fund is required to adopt the provisions of GASB Statement No. 83 for its fiscal year 2019 financial statements.
In January 2017, the GASB issued Statement No. 84, “Fiduciary Activities”. The Water Fund is required to adopt the provisions of GASB Statement No. 84 for its fiscal year 2020 financial statements.
The Water Fund has not yet completed the various analyses required to estimate the financial statement impact of these new pronouncements.
NOTE 3: DEPOSITS AND INVESTMENTS
A. Deposits
State statutes require banks to collateralize City deposits at amounts equal to or in excess of the City’s balance. Such collateral is to be held by the Federal Reserve Bank or the trust department of a commercial bank other than the pledging bank. At year end, the bank balances were $621.3 million and $996.5 million for 2016 and 2015, respectively.

20
PHILADELPHIA WATER DEPARTMENT
NOTES TO THE FINANCIAL STATEMENTS
JUNE 30, 2016 AND 2015
NOTE 3: DEPOSITS AND INVESTMENTS (CONTINUED)
B. Investments
The City has established a comprehensive investment policy that covers all funds other than the Municipal Pension Fund, the Philadelphia Gas Works Retirement Reserve, and the Fairmount Park and Free Library Trust Funds. Those funds have separate investment policies designed to meet the long-term goals of the funds.
The City’s investments include all operating, capital, debt service, and debt service reserve accounts of the City’s General Fund, Water Fund, and Aviation Division. All city investments must be in compliance with applicable provisions of the City Code and City bond resolutions, as well as the City’s Investment Policy. The City’s Investment Policy is meant to supplement the applicable provisions supplement the applicable provisions of the City Code and City bond resolutions, and is reviewed and adopted by the City’s Investment Committee. The City’s Investment Committee consists of the Director of Finance, the City Treasurer, and a representative from the Water Department, Aviation Division, and the Philadelphia Gas Works.
As of June 30, 2016 the fair values of the Water Fund’s investments consist of the following:
(Thousands of Dollars)
Classifications Fair Value
Percent of
Total
U.S. Government Securities 366,587$ 53.97%
U.S. Government Agency Securities 236,884 34.88%
Corporate Bonds 24,642 3.63%
Other Bonds and Investments 51,081 7.52%
Grand Total 679,194$ 100.00%
As of June 30, 2015, the fair values of the Water Fund’s investments consist of the following:
(Thousands of Dollars)
Classifications Fair Value
Percent of
Total
U.S. Government Securities 272,600$ 57.98%
U.S. Government Agency Securities 155,901 33.15%
Corporate Bonds 23,947 5.09%
Other Bonds and Investments 17,754 3.78%
Grand Total 470,202$ 100.00%
21
PHILADELPHIA WATER DEPARTMENT
NOTES TO THE FINANCIAL STATEMENTS
JUNE 30, 2016 AND 2015
NOTE 3: DEPOSITS AND INVESTMENTS (CONTINUED)
B. Investments (Continued)
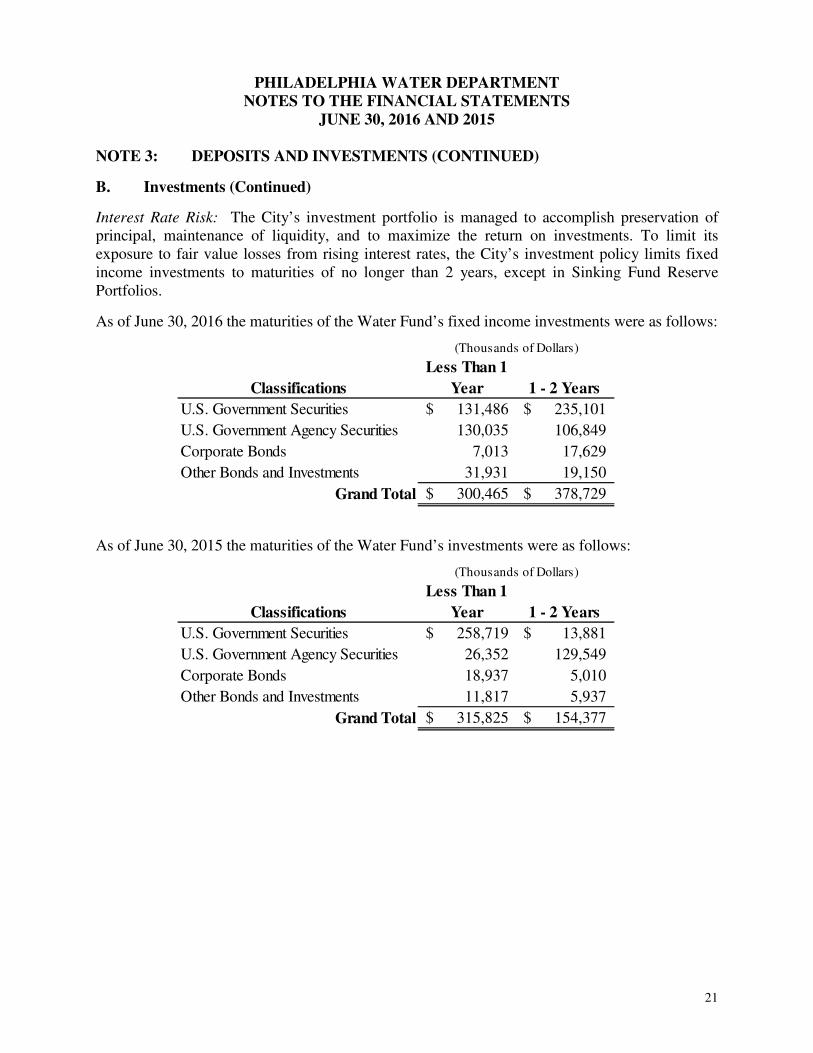
Interest Rate Risk: The City’s investment portfolio is managed to accomplish preservation of principal, maintenance of liquidity, and to maximize the return on investments. To limit its exposure to fair value losses from rising interest rates, the City’s investment policy limits fixed income investments to maturities of no longer than 2 years, except in Sinking Fund Reserve Portfolios.
As of June 30, 2016 the maturities of the Water Fund’s fixed income investments were as follows:
Classifications
Less Than 1
Year 1 - 2 Years
U.S. Government Securities 131,486$ 235,101$
U.S. Government Agency Securities 130,035 106,849
Corporate Bonds 7,013 17,629
Other Bonds and Investments 31,931 19,150
Grand Total 300,465$ 378,729$
(Thousands of Dollars)
As of June 30, 2015 the maturities of the Water Fund’s investments were as follows:
Classifications
Less Than 1
Year 1 - 2 Years
U.S. Government Securities 258,719$ 13,881$
U.S. Government Agency Securities 26,352 129,549
Corporate Bonds 18,937 5,010
Other Bonds and Investments 11,817 5,937
Grand Total 315,825$ 154,377$
(Thousands of Dollars)

22
PHILADELPHIA WATER DEPARTMENT
NOTES TO THE FINANCIAL STATEMENTS
JUNE 30, 2016 AND 2015
NOTE 3: DEPOSITS AND INVESTMENTS (CONTINUED)
B. Investments (Continued)
Credit Risk: The City’s policy is to limit credit risk by limiting the type of allowable investments, as well as setting a maximum percent of the portfolio for each type of investment.
The City’s investments in US Government securities (34.75%) or US Government Agency obligations (29.86%) are allowable up to 100% of the portfolio. The US Government Agency obligations must be rated AAA by Standard & Poor’s Corp. (“S&P”) or Aaa by Moody’s Investor Services (“Moody’s”). All US Government Securities meet the criteria.
The City’s investment in Commercial Paper (18.90%) is limited to 25% of the portfolio, and must be rated A1 by S&P and/or M1G1 by Moody’s and the senior long-term debt of the issuer must not be rated lower than A by S&P and/or Moody’s. All commercial paper investments meet the criteria.
The City’s investments in corporate bonds (10.45%) are limited to 25% of the portfolio, and have a S&P rating of AAA or AA or Moody’s rating of Aa2 or better.
Short Term Investment Pools are rated AAA by S&P and Aaa by Moody’s. The Short Term Investment Pools’ amortized cost-based net asset value per share is the same as the value of the pool shares. Cash accounts are swept nightly and idle cash is invested in money market funds (short term investment pools).
The City limits its foreign currency risk by investing in certificates of deposits and banker’s acceptances issued or endorsed by non-domestic banks that are denominated in US dollars, providing that the banking institution has assets of not less than $100 million and has a Thompson’s Bank Watch Service “Peer Group Rating” not lower than II. At the end of the fiscal year, the City did not have any investments of that nature.
To minimize custodial credit risk, the City’s policy is to select custodian banks that are members of the Federal Reserve System to hold its investments. Delivery of the applicable investment documents to the City’s custodian is required for all investments.
As of June 30, 2016 the fixed income investments of the Water Fund had the following ratings by Moody’s:
Classifications
Credit Quality
Rating
Percent of
Investment Type
U.S. Government Securities AAA 100%
U.S. Government Agency Securities AAA 100%
Corporate Bonds AAA 18%
Corporate Bonds AA1 29%
Corporate Bonds AA2 53%
Other Bonds and Investments AA1 23%
Other Bonds and Investments AA2 65%
Other Bonds and Investments AA3 12%

23
PHILADELPHIA WATER DEPARTMENT
NOTES TO THE FINANCIAL STATEMENTS
JUNE 30, 2016 AND 2015
NOTE 3: DEPOSITS AND INVESTMENTS (CONTINUED)
B. Investments (Continued)
As of June 30, 2015 the fixed income investments of the Water Fund had the following ratings by Moody’s:
Classifications
Credit Quality
Rating
Percent of
Investment Type
U.S. Government Securities AAA 100%
U.S. Government Agency Securities AAA 100%
Corporate Bonds AAA 42%
Corporate Bonds A1 37%
Corporate Bonds AA2 21%
Other Bonds and Investments AA2 100%
C. Fair Value Measurement
The City measures and records its investments using fair value measurement guidelines established by generally accepted accounting principles. These guidelines recognize a three-tiered fair value hierarchy, as follows:
• Level 1: Observable inputs that reflect quoted prices (unadjusted) for identical assets or liabilities in active markets.
• Level 2: Inputs other than quoted prices included in Level 1 that are observable for the asset or liability through corroboration with observable market data.
• Level 3: Unobservable inputs for an asset or liability.
The Water Fund has the following recurring fair value measurements as of June 30, 2016:
• U.S. Treasury securities of $366.6 million are valued using quoted prices from active markets (Level 1).
• U.S. Agency securities of $236.9 million are valued using quoted prices from identical securities that are traded in active markets (Level 2).
• Corporate bonds of $24.6 million and other bonds and investments of $51.1 million are valued using quoted prices for similar securities in active markets and via matrix pricing models (Level 2).

24
PHILADELPHIA WATER DEPARTMENT
NOTES TO THE FINANCIAL STATEMENTS
JUNE 30, 2016 AND 2015
NOTE 4: ACCOUNTS RECEIVABLE
Balances of accounts receivable and allowance for doubtful accounts consisted of the following:
FISCAL YEAR ENDED JUNE 30, 2016
Accounts Receivable Billed in the Last Twelve Months $ 135,402,994 Billed in 15-year Cycle Billing 9,113,657 Penalties on Receivables 7,321,722 Other Receivables 18,736,616
Subtotal $ 170,574,989 Bad Debt Written Off 17,986,820 Total $ 152,588,169
Allowance for Doubtful Accounts $ 13,006,803 FISCAL YEAR ENDED JUNE 30, 2015
Accounts Receivable
Billed in the Last Twelve Months $ 138,612,875 Billed in 15-year Cycle Billing 17,768,214 Penalties on Receivables 22,714,526 Other Receivables 13,524,265
Subtotal $ 192,619,880 Bad Debt Written Off 33,644,769 Total $ 158,975,111
Allowance for Doubtful Accounts $ 12,399,107

25
PHILADELPHIA WATER DEPARTMENT
NOTES TO THE FINANCIAL STATEMENTS
JUNE 30, 2016 AND 2015
NOTE 5: PROPERTY, PLANT AND EQUIPMENT
Property, plant and equipment at June 30, 2016 and 2015 consisted of the following:
Beginning Balance* Additions Dispositions Ending Balance
Fiscal Year Ended June 30, 2016
Capital Assets Not Being Depreciated
Land 5,919,160$ -$ -$ 5,919,160$
Construction in Progress 284,357,128 195,326,061 (183,429,659) 296,253,530
Total Capital Assets Not Being Depreciated 290,276,288$ 195,326,061$ (183,429,659)$ 302,172,690$
Capital Asssets Being Depreciated
Buildings and related improvements 1,590,656,309 102,294,925 (7,938,661) 1,685,012,573
Intangible Assets 14,441,712 741,216 - 15,182,928
Equipment 77,153,927 25,282,377 (19,061,957) 83,374,347
Infrastructure 2,407,945,075 138,637,147 (95,314,493) 2,451,267,729
Total Capital Assets Being Depreciated 4,090,197,023$ 266,955,665$ (122,315,111)$ 4,234,837,577$
Less Accumulated Depreciation For:
Buildings and related improvements (953,842,551) (45,229,475) 5,014,662 (994,057,364)
Intangible Assets (8,760,351) (1,481,232) - (10,241,583)
Equipment (66,265,555) (4,055,849) 735,985 (69,585,419)
Infrastructure (1,223,971,858) (50,944,974) 42,022,956 (1,232,893,876)
Total Accumulated Depreciation (2,252,840,315) (101,711,530) 47,773,603 (2,306,778,242)
Total Capital Assets, Being Depreciated, Net 1,837,356,708 165,244,135 (74,541,508) 1,928,059,335
Total Capital Assets 2,127,632,996$ 360,570,196$ (257,971,167)$ 2,230,232,025$
Beginning Balance Additions Dispositions Ending Balance
Fiscal Year Ended June 30, 2015
Capital Assets Not Being Depreciated
Land 5,919,160$ -$ -$ 5,919,160$
Construction in Progress 361,591,950 176,436,388 (235,023,251) 303,005,087
Total Capital Assets Not Being Depreciated 367,511,110$ 176,436,388$ (235,023,251)$ 308,924,247$
Capital Asssets Being Depreciated
Buildings and related improvements 1,551,979,787 54,426,060 (15,749,538) 1,590,656,309
Intangible Assets 12,973,506 1,468,206 - 14,441,712
Equipment 71,540,266 24,424,780 (18,811,119) 77,153,927
Infrastructure 2,256,041,472 181,231,429 (29,327,826) 2,407,945,075
Total Capital Assets Being Depreciated 3,892,535,031$ 261,550,475$ (63,888,483)$ 4,090,197,023$
Less Accumulated Depreciation For:
Buildings and related improvements (922,843,619) (45,120,983) 14,482,856 (953,481,746)
Intangible Assets (7,389,590) (1,370,761) - (8,760,351)
Equipment (63,231,630) (3,153,513) 119,588 (66,265,555)
Infrastructure (1,196,089,278) (54,117,370) 29,273,624 (1,220,933,024)
Total Accumulated Depreciation (2,189,554,117) (103,762,627) 43,876,068 (2,249,440,676)
Total Capital Assets, Being Depreciated, Net 1,702,980,914 157,787,848 (20,012,415) 1,840,756,347
Total Capital Assets 2,070,492,024$ 334,224,236$ (255,035,666)$ 2,149,680,594$
*Fiscal year 2016 beginning balances have been restated; see Note 24 for additional information.

26
PHILADELPHIA WATER DEPARTMENT
NOTES TO THE FINANCIAL STATEMENTS
JUNE 30, 2016 AND 2015
NOTE 6: LEASES
The Water Fund enters into various operating leases to finance the purchase of photocopier and computer equipment. Leases are defined by the Financial Accounting Standard Board in Statement 13, Accounting for Leases. Lease payments consisted of $1,899,734 in fiscal year 2016, and $1,951,900 in fiscal year 2015. The assets acquired through the leases are shown as equipment within the Capital Asset Note (See Note 5).
NOTE 7: IMPAIRED ASSETS
Government Accounting Standards Board (GASB) Statement 42 requires the disclosure of the impairment of any major capital assets. Over the years, there have been a number of the Water Fund’s assets that were either damaged or destroyed, were abandoned or became functionally obsolete.
No asset impairments occurred during fiscal year 2016 and 2015.
NOTE 8: RESTRICTED ASSETS
Assets whose use is limited to a specific purpose have been classified as “restricted” in the Statement of Fund Net Position. Restricted assets as of June 30, 2016, are comprised of the following:
Cash and
Investments
Accrued
Interest
Amounts Reserved for:
Capital Projects 329,957$ 20$
Rate Stabilization 205,600 160
Residual 15,189 14
Debt Service Reserve 220,890 546
Total 771,636$ 740$
(Thousands of Dollars)

27
PHILADELPHIA WATER DEPARTMENT
NOTES TO THE FINANCIAL STATEMENTS
JUNE 30, 2016 AND 2015
NOTE 8: RESTRICTED ASSETS (CONTINUED)
Restricted assets as of June 30, 2015, are comprised of the following:
Cash and
Investments
Accrued
Interest
Amounts Reserved for:
Capital Projects 446,755$ 106$
Rate Stabilization 206,298 150
Residual 14,990 6
Debt Service Reserve 221,198 425
Total 889,241$ 687$
(T housands of Dollars)
NOTE 9: VACATION LEAVE
Employees are credited with vacation at rates which vary according to length of service. Vacation may be taken or accumulated up to certain limits until paid upon retirement or termination. Employees’ vacation time accrued under Other Noncurrent Liabilities on the Statement of Net Position in Fiscal Year 2016 was $10,793,406 and in Fiscal Year 2015 was $10,133,491. The expense for vacation pay is recognized in the year earned.
NOTE 10: SICK LEAVE
Employees are credited with varying amounts of sick leave according to type of employee and/or length of service. Employees may accumulate unused sick leave to predetermined balances. Non-uniformed employees (upon retirement only) and uniformed employees (upon retirement or in case of death while on active duty) are paid varying amounts ranging from 25% to 50% of unused sick time, not to exceed predetermined amounts. Employees, who separate for any reason other than indicated above, forfeit their entire sick leave. The City budgets for and charges the cost of sick leave as it is taken.
NOTE 11: ACCOUNTING FOR THE NEW RIVER CITY PROJECT FUNDS –
WATER SINKING FUND RESERVE SUBSTITUTION
Pursuant to the Water Department’s General Bond Ordinance, the Sinking Fund Reserve provides a reserve against default of the payment of principal and interest on Water Revenue Bonds when due.

28
PHILADELPHIA WATER DEPARTMENT
NOTES TO THE FINANCIAL STATEMENTS
JUNE 30, 2016 AND 2015
NOTE 11: ACCOUNTING FOR THE NEW RIVER CITY PROJECT FUNDS –
WATER SINKING FUND RESERVE SUBSTITUTION (CONTINUED)
The New River City Ordinance dated January 23, 2007 (Bill No 060005) authorized the purchase and deposit of a surety bond that meets the requirements of the General Ordinance to replace $67,000,000 of the Sinking Fund reserve Balance. The $67,000,000 was used as follows:
Cost of the surety bond $2,010,000 Legal and financial services 290,000 Management fees 375,000 Costs of certain water and sewer infrastructure components of the New River City Program 64,325,000
Total $67,000,000
The prepaid surety bond was recorded as an asset in the Sinking Fund Reserve and amortized over the lives of the outstanding bonds.
In connection with the New River City Program, the City executed a program agreement with Philadelphia Authority for Industrial Development (“PAID”) to provide program management and oversight for the program. To date, twelve projects totaling $83,697,833 have been executed (disbursements were limited to the $64,325,000). As of June 30, 2016, all projects were completed and all of the project funds have been disbursed. The transfer of the water and sewer utilities at Philadelphia Naval Business Center from PAID to the Water Department, including the projects outlined above, and occurred in November, 2009.
NOTE 12: DEFERRED COMPENSATION PLAN
The City offers its employees a deferred compensation plan in accordance with Internal Revenue Code section 457. As required by the Internal Revenue Code and Pennsylvania laws in effect at June 30, 2014, the assets of the plan are held in trust for the exclusive benefit of the participants and their beneficiaries. In accordance with GASB Statement No. 32, Accounting and Financial
Reporting for Internal Revenue Code Section 457 Deferred Compensation Plans, the City does not include the assets or activity of the plan in its financial statements.
NOTE 13: ARBITRAGE REBATE
The City has issued Water and Waste Water Revenue Bonds subject to Federal arbitrage requirements. Federal tax legislation requires the accumulated net excess of interest income on the proceeds of these issues over interest expense paid on the bonds be paid to the federal government at the end of a five- year period. The arbitrage liability was zero as of June 30, 2016 and 2015.

29
PHILADELPHIA WATER DEPARTMENT
NOTES TO THE FINANCIAL STATEMENTS
JUNE 30, 2016 AND 2015
NOTE 14: DEBT PAYABLE
A summary of changes in long-term debt obligations as of June 30, 2016 follows:
Beginning
Balance Additions Reductions Ending Balance
Amounts Due
Within One Year
Water and Sewer Revenue Bonds 1,847,625$ -$ (126,040)$ 1,721,585$ 113,985$
Pennvest Loans 143,583 5,823 (10,667) 138,739 10,743
Unamortized Bond Premium 119,589 - (12,799) 106,790 -
Derivative Instrument Liability 3,289 - (1,781) 1,508 -
Net Pension Liability 415,327 40,514 - 455,841 -
Other Non-Current Liabilities:
Accrued Worker's Compensation 21,990 3,770 (4,042) 21,718 -
Accrued Legal Claims 3,706 8,178 (5,400) 6,484 -
Compensated Absences 10,133 2,505 (1,845) 10,793 -
Total Non-Current Liabilities 2,565,242$ 60,790$ (162,574)$ 2,463,458$ 124,728$
(In Thousands)
A summary of changes in long-term debt obligations as of June 30, 2015 follows:
Beginning
Balance, as
Restated (See
Note 23) Additions Reductions Ending Balance
Amounts Due
Within One Year
Water and Sewer Revenue Bonds 1,698,060$ 417,560$ (267,995)$ 1,847,625$ 126,040$
Pennvest Loans 153,385 758 (10,560) 143,583 10,684
Unamortized Bond Premium 83,807 52,895 (17,113) 119,589 -
Derivative Instrument Liability 5,711 - (2,422) 3,289 -
Net Pension Liability 389,038 26,289 - 415,327 -
Other Non-Current Liabilities:
Accrued Worker's Compensation 16,814 9,038 (3,862) 21,990 -
Accrued Legal Claims 3,529 3,977 (3,800) 3,706 -
Compensated Absences 10,171 2,144 (2,182) 10,133 -
Total Non-Current Liabilities 2,360,515$ 512,661$ (307,934)$ 2,565,242$ 136,724$
(In Thousands)

30
PHILADELPHIA WATER DEPARTMENT
NOTES TO THE FINANCIAL STATEMENTS
JUNE 30, 2016 AND 2015
NOTE 14: DEBT PAYABLE (CONTINUED)
An analysis of debt service requirements to maturity on the long-term obligations follows:
Total Debt
Principal Interest Service
Year Ended June 30: Requirements Requirements Requirements
2017 124.8$ 81.4$ 206.2$
2018 131.4 76.6 208.0
2019 86.7 72.1 158.8
2020 79.5 68.4 147.9
2021 83.4 65.0 148.4
2022 - 2026 338.7 276.6 615.3
2027 - 2031 300.9 212.8 513.7
2032 - 2036 238.5 148.9 387.4
2037 - 2041 257.2 92.5 349.7
2042 - 2046 219.2 25.1 244.3
1,860.3$ 1,119.4$ 2,979.7$
(In Millions)
Pertinent information regarding long-term debt obligations outstanding is presented below:
Date of
Issue
Amount of Original
Issue Purpose
Balance Outstanding at:
June 30, 2016 June 30, 2015
1997 $78,500,000 Water and Wastewater Revenue Bonds, Variable Rate Series of 1997B, issued for various capital projects, to fund the Debt Reserve Account, and to pay the costs of issuance related to the bond issue at a variable rate. $56,900,000 $60,400,000
1999 6,700,000 Pennsylvania Infrastructure Investment Authority Loan of 1999, issued for various capital projects at a rate of 1.41% - 2.73%. 246,933 329,633

31
PHILADELPHIA WATER DEPARTMENT
NOTES TO THE FINANCIAL STATEMENTS
JUNE 30, 2016 AND 2015
NOTE 14: DEBT PAYABLE (CONTINUED)
Date of
Issue
Amount of Original
Issue Purpose
Balance Outstanding at:
June 30, 2016 June 30, 2015
2005 $250,000,000 Water and Wastewater Revenue Bonds, Series of 2005A, issued for various capital projects, to fund the Debt Reserve Account of the Sinking Fund, and to pay the costs of issuance related to the bond issue at a rate of 3% - 5.25%. $ - $ 5,810,000
2005 83,665,000 Water and Wastewater Revenue Refunding Bonds, Variable Rate Series of 2005B, issued for defeasing a portion of the Series of 1995 Bonds, and to pay the costs of issuance related to the bond issue at a variable rate. 35,325,000 51,640,000
2007 345,035,000 Water and Wastewater Revenue Refunding Bonds, Series of 2007A and 2007B, issued for defeasing the Series of 1997A and Series of 2001A Bonds, and to pay the costs of issuance related to the bond issue at a rate of 4% - 5%. 241,375,000 241,630,000
2009 140,000,000 Water and Wastewater Revenue Bonds, Series of 2009A, issued for various capital projects, issued for funding the Debt Reserve Account of the Sinking Fund, and to pay the costs of issuance related to the bond issue at a rate of 4% - 5.75%. 140,000,000 140,000,000
2009 22,828,000 Pennsylvania Infrastructure Investment Authority Loan of 2009 (B), issued for various capital projects at a rate of 1.193% - 2.107%. 21,464,949 22,966,665
2009 35,667,000 Pennsylvania Infrastructure Investment Authority Loan of 2009 (C), issued for various capital projects at a rate of 1.193% - 2.107%. 35,528,947 33,427,837
2009 64,380,000 Pennsylvania Infrastructure Investment Authority Loan of 2009 (D), issued for various capital projects at a rate of 1.193% - 2.107%. 56,396,744 60,356,734
32
PHILADELPHIA WATER DEPARTMENT
NOTES TO THE FINANCIAL STATEMENTS
JUNE 30, 2016 AND 2015
NOTE 14: DEBT PAYABLE (CONTINUED)
Date of
Issue
Amount of Original
Issue Purpose
Balance Outstanding at:
June 30, 2016 June 30, 2015
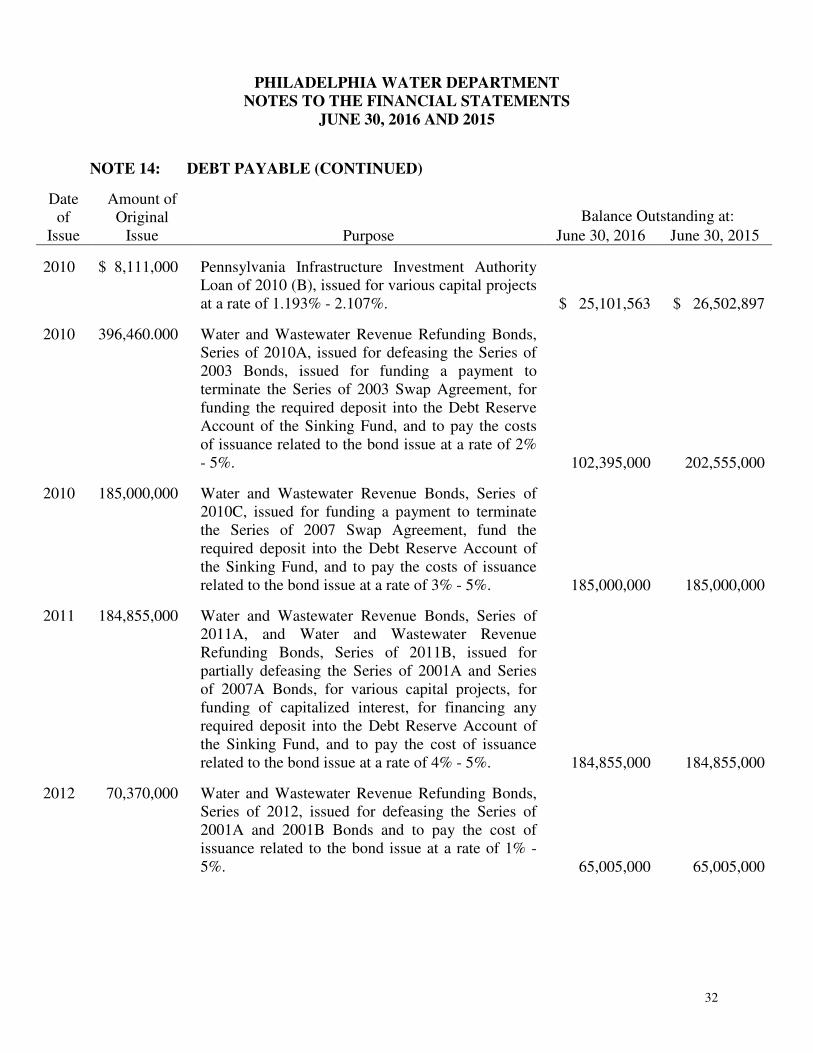
2010 $ 8,111,000 Pennsylvania Infrastructure Investment Authority Loan of 2010 (B), issued for various capital projects at a rate of 1.193% - 2.107%. $ 25,101,563 $ 26,502,897
2010 396,460.000 Water and Wastewater Revenue Refunding Bonds, Series of 2010A, issued for defeasing the Series of 2003 Bonds, issued for funding a payment to terminate the Series of 2003 Swap Agreement, for funding the required deposit into the Debt Reserve Account of the Sinking Fund, and to pay the costs of issuance related to the bond issue at a rate of 2% - 5%. 102,395,000 202,555,000
2010 185,000,000 Water and Wastewater Revenue Bonds, Series of 2010C, issued for funding a payment to terminate the Series of 2007 Swap Agreement, fund the required deposit into the Debt Reserve Account of the Sinking Fund, and to pay the costs of issuance related to the bond issue at a rate of 3% - 5%. 185,000,000 185,000,000
2011 184,855,000 Water and Wastewater Revenue Bonds, Series of 2011A, and Water and Wastewater Revenue Refunding Bonds, Series of 2011B, issued for partially defeasing the Series of 2001A and Series of 2007A Bonds, for various capital projects, for funding of capitalized interest, for financing any required deposit into the Debt Reserve Account of the Sinking Fund, and to pay the cost of issuance related to the bond issue at a rate of 4% - 5%. 184,855,000 184,855,000
2012 70,370,000 Water and Wastewater Revenue Refunding Bonds, Series of 2012, issued for defeasing the Series of 2001A and 2001B Bonds and to pay the cost of issuance related to the bond issue at a rate of 1% - 5%. 65,005,000 65,005,000

33
PHILADELPHIA WATER DEPARTMENT
NOTES TO THE FINANCIAL STATEMENTS
JUNE 30, 2016 AND 2015
NOTE 14: DEBT PAYABLE (CONTINUED)
Date of
Issue
Amount of Original
Issue Purpose
Balance Outstanding at:
June 30, 2016 June 30, 2015
2013 $170,000,000 Water and Wastewater Revenue Bonds, Series of 2013A, issued to finance capital improvements, finance a deposit to the Debt Reserve Account, and to pay the cost of issuance related to the bond issue at a rate of 3% to 5.125%. $ 170,000,000 $ 170,000,000
2014 123,170,000 Water and Wastewater Revenue Bonds, Series of 2014A, issued to advance refund a portion of the Series of 2005A Bonds, to finance capital improvements, finance a deposit to the Debt Reserve Account, and to pay the cost of issuance related to the bond issue at a rate of 3% to 5%. 123,170,000 123,170,000
2015 417,560,000 Water and Wastewater Revenue Bonds, Series of 2015A and 2015B, issued to finance capital improvements, finance a deposit to the Debt Reserve Account, current refund a portion of the Series of 2005 A Bonds, advance refund a portion of the Series of 2007A Bonds, and pay the cost of issuance related to the bond issue at a rate of 3.45% to 5.00%. 417,560,000 417,560,000
$1,860,324,136 $1,991,208,766
The Water Fund has defeased certain bonds by placing the proceeds of new bonds in irrevocable trusts to provide for all future debt service payments on old bonds. Accordingly, the trust account assets and the liability for the defeased bonds are not included in the Water Fund’s financial statements. As of June 30, 2016, $70.3 million of bonds outstanding were considered defeased. As of June 30, 2015 $283.2 million of bonds outstanding were considered defeased.

34
PHILADELPHIA WATER DEPARTMENT
NOTES TO THE FINANCIAL STATEMENTS
JUNE 30, 2016 AND 2015
NOTE 14: DEBT PAYABLE (CONTINUED)
Pennvest Loans
In July 2010, the Water Department received approval from the Pennsylvania Infrastructure Investment Authority (“PENNVEST”) for the Green Infrastructure Project (Series 2010B), bringing the total financing from PENNVEST to $214.9 million. During fiscal year 2016 and 2015, PENNVEST drawdowns totaled $5,823,347 and $758,160, respectively, which represent an increase in bond issuances. The funding is through low interest loans of 1.193% during the construction period and for the first five years of amortization (interest only payment are due during the construction period up to three years) and 2.107% for the remaining fifteen years.
Individual loan information as of June 30, 2016 is as follows:
Date Series Maximum
Loan Amount Approved
Project Costs
Amount Requested
through 6/30/16
Amount Received Yes/No
October 2009 2009B $ 42,886,030 $ 42,339,199 $ 29,432,930 Yes October 2009 2009C 57,268,193 56,264,382 46,699,887 Yes March 2010 2009D 84,759,263 84,404,754 71,956,891 Yes July 2010 2010B 30,000,000 31,376,846 28,500,000 Yes
Totals $214,913,486 $214,385,181 $176,589,708
Individual loan information as of June 30, 2015 is as follows:
Date Series Maximum
Loan Amount Approved
Project Costs
Amount Requested
through 6/30/15
Amount Received Yes/No
October 2009 2009B $ 42,886,030 $ 42,339,199 $ 28,790,697 Yes October 2009 2009C 57,268,193 56,264,382 41,771,895 Yes March 2010 2009D 84,759,263 84,404,754 71,703,769 Yes July 2010 2010B 30,000,000 31,376,846 28,500,000 Yes
Totals $214,913,486 $214,385,181 $170,766,361

35
PHILADELPHIA WATER DEPARTMENT
NOTES TO THE FINANCIAL STATEMENTS
JUNE 30, 2016 AND 2015
NOTE 15: DERIVATIVE INSTRUMENT
City of Philadelphia, 2005 Water & Sewer Swap
Objective: In December 2002, the City entered into a swaption that provided the City with an up-front payment of $4.0 million. As a synthetic refunding of all or a portion of its 1995 Bonds, this payment approximated the present value savings, as of December 2002, of a refunding on May 4, 2005. The swaption gave Citigroup (formerly of Salomon Brothers Holding Company, Inc.), the option to enter into an interest rate swap to receive fixed amounts and pay variable amounts.
Terms: Citigroup exercised its option to enter into a swap May 4, 2005, and the swap commenced on that date. Under the terms of the swap, the City pays a fixed rate of 4.53% and receives a variable payment computed as the actual bond rate or the alternatively, 68.5% of one month LIBOR, in the event the average rate on the Bonds as a percentage of the average of one month LIBOR has exceeded 68.5% for a period of more than 180 days. Citigroup is currently paying 68.5% of one month LIBOR under the swap. The payments are based on an amortizing notional schedule (with an initial notional amount of $86.1 million), and when added to an assumption for remarketing, liquidity costs and cost of issuance were expected to approximate the debt service of the refunded bonds at the time the swaption was entered into.
In May 2013, the City and Water Department converted the original variable rate bonds associated with the swap to an index-based rate, terminating the existing letter of credit in the process.
As of June 30, 2016, the swap had a notional amount of $35.33 million and the associated variable rate bond had a $35.33 million principal amount. The bonds’ variable rate coupons are based on the same index as the receipt on the swap. The bonds mature on August 1, 2018 and the related swap agreement terminates on August 1, 2018.
Fair value: As of June 30, 2016, the swap had a negative fair value of ($1.51 million). This means that the Water Department would have to pay this amount if the swap terminated. The fair value of the swap was measured using the income approach and is categorized within Level 2 of the fair value hierarchy.
Risk: As of June 30, 2016, the City is not exposed to credit risk because the swap had a negative fair value. Should interest rates change and the fair value of the swap become positive, the City would be exposed to credit risk in the amount of the swap’s fair value. Since the City is now receiving 68.5% of one month LIBOR, and paying 68.5% of one month LIBOR plus a fixed spread, the City is no longer exposed to basis risk or tax risk. The swap includes an additional termination event based on credit ratings. The swap may be terminated by the City if the ratings of Citigroup or its Credit Support Provider fall below A3 or A-, or by Citigroup if the rating of the City’s Water and Wastewater Revenue Bonds falls below A3 or A-. There are 30-day cure periods to these termination events. However, because the City’s swap payments are insured by Assured Guaranty Municipal Corporation (formerly FSA), no termination event based on the City’s Water and Wastewater Revenue Bond ratings can occur as long as Assured is rated at least A or A2.
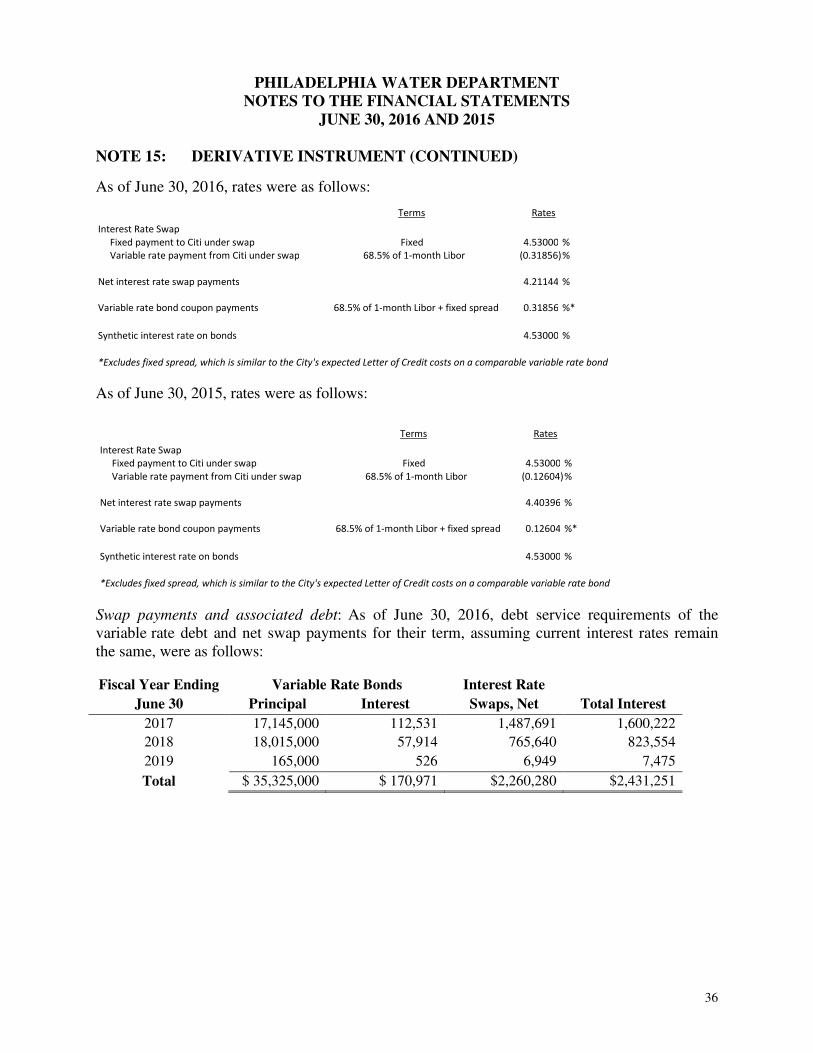
36
PHILADELPHIA WATER DEPARTMENT
NOTES TO THE FINANCIAL STATEMENTS
JUNE 30, 2016 AND 2015
NOTE 15: DERIVATIVE INSTRUMENT (CONTINUED)
As of June 30, 2016, rates were as follows:
As of June 30, 2015, rates were as follows:
Swap payments and associated debt: As of June 30, 2016, debt service requirements of the variable rate debt and net swap payments for their term, assuming current interest rates remain the same, were as follows:
Fiscal Year Ending Variable Rate Bonds Interest Rate
June 30 Principal Interest Swaps, Net Total Interest
2017 17,145,000 112,531 1,487,691 1,600,222
2018 18,015,000 57,914 765,640 823,554
2019 165,000 526 6,949 7,475
Total $ 35,325,000 $ 170,971 $2,260,280 $2,431,251
Terms Rates
Interest Rate Swap
Fixed payment to Citi under swap Fixed 4.53000 %
Variable rate payment from Citi under swap 68.5% of 1-month Libor (0.31856)%
Net interest rate swap payments 4.21144 %
Variable rate bond coupon payments 68.5% of 1-month Libor + fixed spread 0.31856 %*
Synthetic interest rate on bonds 4.53000 %
*Excludes fixed spread, which is similar to the City's expected Letter of Credit costs on a comparable variable rate bond
Terms Rates
Interest Rate Swap Fixed payment to Citi under swap Fixed 4.53000 %
Variable rate payment from Citi under swap 68.5% of 1-month Libor (0.12604)%
Net interest rate swap payments 4.40396 %
Variable rate bond coupon payments 68.5% of 1-month Libor + fixed spread 0.12604 %*
Synthetic interest rate on bonds 4.53000 %
*Excludes fixed spread, which is similar to the City's expected Letter of Credit costs on a comparable variable rate bond
37
PHILADELPHIA WATER DEPARTMENT
NOTES TO THE FINANCIAL STATEMENTS
JUNE 30, 2016 AND 2015
NOTE 16: CITY PENSION PLAN
The City maintains two single employer defined benefit plans for its employees and several of its component units. The two plans maintained by the City are the City Plan and the Philadelphia Gas Works (the “PGW”) Plan. In addition to the City, the three other quasi-governmental agencies that participate in the City Plan are the Philadelphia Parking Authority (the “PPA”), the Philadelphia Municipal Authority (the “PMA”), and the Philadelphia Housing Development Corporation (the “PHDC”).
The Water Fund is included within the City’s pension plan. The Water Fund represents 7.44 percent of the City’s net pension liability, deferred outflows of resources, and deferred inflows of resources under the plan. This is based on the pensionable salaries related to the Water Fund.
Effective with Fiscal Year 2015, the City implemented GASB Statement No. 68, “Accounting
and Financial Reporting for Pensions – an amendment of GASB Statement No. 27”. This statement revises existing standards for measuring and reporting pension liabilities for pension plans. GASB Statement No. 68 defines a single employer as the primary government and its component units. All three quasi-governmental agencies that participate in the City Plan were determined to be component units of the City. Therefore, the City Plan meets the definition of a single employer plan.
The note disclosures and Required Supplementary Information required by GASB Statement No. 67, “Financial Reporting for Pension Plans – an amendment of GASB Statement No. 25”, are presented in separately issued audited financial statements of the City plan and PGW plan. Copies of these financial statements may be obtained by contacting the Director of Finance of the City of Philadelphia.
A. Plan Administration
The Philadelphia Board of Pensions and Retirement (the “Board”) administers the City of Philadelphia Municipal Pension Fund (the “Pension Fund”), a single employer defined benefit pension plan with a small but increasing defined contribution component, which provides pensions for all officers and employees of the City, as well as those of three quasi-governmental agencies (per applicable enabling legislation and contractual agreements). The Board was established by section 2-308 of the 1952 Philadelphia Home Rule Charter. Its actions in administering the Retirement System are governed by Title 22 of the Philadelphia Code.
The Board consists of nine voting members – four elected by the active members within the civil service, and the City’s Controller, Solicitor, Managing Director, Personnel Director, and Director of Finance, who serves as the Chair.

38
PHILADELPHIA WATER DEPARTMENT
NOTES TO THE FINANCIAL STATEMENTS
JUNE 30, 2016 AND 2015
NOTE 16: CITY PENSION PLAN (CONTINUED)
B. Plan Membership
At July 1, 2015, the date of the most recent actuarial valuation, pension plan membership consisted of the following:
Actives 27,951 Terminated Vested 1,334 Disabled 4,016 Retirees 22,245 Beneficiaries 8,566 DROP 1,784 Total City Members 65,896 Annual Salaries $1,597,848,869 Average Salary per Active Member $57,166 Annual Retirement Allowances $719,580,951 Average Retirement Allowance $20,662
C. Contributions
Per Title 22 of the Philadelphia Code, members contribute to the System at various rates based on bargaining unit, uniform status, and entry date into the System. As of July 1, 2015 members contribute at one of the following rates:
Employee Class Plan 67 Plan 87 Plan 10
Uniform 6.00% 5.00% or 6.00% 5.50%
Non-Uniform 3.75, 4.25%, 5.62%, 6.00%, or 6.50%
1.97%, 2.47%, 2.64%, 3.14%, 3.29%, 3.47%,
or 4.14%
3.16%
Elected Officials N/A 8.48%, 9.11%, 9.48%, or 10.11%
3.16%
Employer contributions are made by the City throughout each fiscal year (which ends June 30) and by three (3) quasi-governmental agencies on a quarterly basis. These contributions, determined by an annual actuarial valuation report (“AVR”), when combined with plan member contributions, are expected to finance the cost of benefits earned by plan members during the year, with an additional amount to finance any unfunded accrued liability.
Within the AVR, two contribution amounts are determined based upon two different sets of rules for determining the way the unfunded actuarial liability is funded.

39
PHILADELPHIA WATER DEPARTMENT
NOTES TO THE FINANCIAL STATEMENTS
JUNE 30, 2016 AND 2015
NOTE 16: CITY PENSION PLAN (CONTINUED)
C. Contributions (Continued)
The first method is defined in accordance with Act 205 and defines the Minimum Municipal Obligation (“MMO”), which is the City’s minimum required contribution under Pennsylvania state law.
The second method is in accordance with the City’s Funding Policy which predates the Act 205 rules and calls for contributions that are greater than the MMO until the initial unfunded liability determined in 1984 is fully funded.
Under both funding methods there are two components: the normal cost and the amortized unfunded actuarial liability. The actuarial unfunded liability is the amount of the unfunded actuarial liability that is paid each year based upon the given or defined amortization periods. The amortization periods are different under the MMO and City’s Funding Policy.
D. Funding Policy
The initial July 1, 1985 unfunded actuarial liability (“UAL”) is amortized over 34 years ending June 30, 2019 with payments increasing at 3.3% per year, the assumed payroll growth. Other charges in the actuarial liability are amortized in level-dollar payments as follows:
• Actuarial gains and losses – 20 years beginning July 1, 2009. Prior gains and losses were amortized over 15 years.
• Assumptions changes – 15 years beginning July 1, 2010. Prior changes were amortized over 20 years.
• Plan changes for active members – 10 years.
• Plan changes for inactive members – 1 year.
• Plan changes mandated by the State – 20 years.
In fiscal year 2016, the City and other employers’ contributions of $660.2 million was less than the actuarially determined employer contribution (ADEC) of $846.2 million. In the event that the City contributes less than the funding policy, an experience loss will be created that will be amortized in accordance with funding policy over 20 years.
The Schedule of Employer Contributions (based on the City’s Funding Policy) is included as Required Supplemental Information and provides a 10-year presentation of employer contributions.
E. Minimum Municipal Obligation
For the purposes of the MMO under Act 205 reflecting the fresh start amortization schedule, the July 1, 2009 UAL was “fresh started” to be amortized over 30 years ending June 30, 2039. This is a level dollar amortization of the UAL. All future amortization periods will follow the City’s Funding Policies as outlined above.

40
PHILADELPHIA WATER DEPARTMENT
NOTES TO THE FINANCIAL STATEMENTS
JUNE 30, 2016 AND 2015
NOTE 16: CITY PENSION PLAN (CONTINUED)
E. Minimum Municipal Obligation (Continued)
In fiscal year 2016, the City and other employers’ contributions of $660.2 million exceeded the Minimum Municipal Obligation of $598.5 million.
The Schedule of Employer Contributions (based on the MMO Funding Policy) is included as Required Supplemental Information and provides a 10-year presentation of employer contributions.
F. Investment Policy
The Pension Board’s Investment Policy Statement provides, in part:
The overall investment objectives and goals should be achieved by use of a diversified portfolio, with safety of principal a primary emphasis. The portfolio policy should employ flexibility by prudent diversification into various asset classes based upon the relative expected risk-reward relationship of the asset classes and the expected correlation of their returns.
The Fund seeks an annual total rate of return of not less than 7.75% over a full market cycle. It is anticipated that this return standard should enable the Fund to meet its actuarially assumed earnings projection (currently 7.75%) over a market cycle. The investment return assumption was reduced by the Board from 7.80% to 7.75%. The Fund’s investment program will pursue its afore-stated total rate of return by a combination of income and appreciation, relying upon neither exclusively in evaluating a prospective investment for the Fund.
All investments are made only upon recommendation of the Fund’s Investment Committee and approval by a majority of the Pension Board. In order to document and communicate the objectives, restrictions, and guidelines for the Fund’s investment staff and investments, a continuously updated Investment Policy Statement will be maintained. The Investment Policy Statement will be updated (and re-affirmed) each year at the January Board meeting.

41
PHILADELPHIA WATER DEPARTMENT
NOTES TO THE FINANCIAL STATEMENTS
JUNE 30, 2016 AND 2015
NOTE 16: CITY PENSION PLAN (CONTINUED)
F. Investment Policy (Continued)
The following was the Board’s approved asset allocation policy as of June 30, 2016:
Asset Class Target Allocation
US Equity 29.8% Non-US Equity – Developed 16.8% Non-US Equity – Emerging 5.2% Fixed Income – Investment Grade 19.0% Fixed Income – Non-Investment Grade 7.5% Real Assets – Private Real Estate 2.6% Real Assets – Public Real Estate 1.4% Real Assets – MLP’s 1.9% Private Equity 9.1% Private Debt 1.9% Hedge Funds 3.7% Cash & Other 1.1% Total 100.0%
Money Weighted Rate of Return: For the year ended June 30, 2016, the annual money-weighted of return on pension plan investments, net of pension plan investment expense, was -3.20%. The money-weighted rate of return expresses investment performance, net of investment expense, adjusted for changing amounts actually invested.
G. Benefits
The Pension Fund provides retirement, disability, and death benefits according to the provisions of Title 22 of the Philadelphia Code. These provisions prescribe retirement benefit calculations, vesting thresholds, and minimum retirement ages, that vary based on bargaining unit, uniform/non-uniform status, and entry date into the System.
Non-uniform employees may retire at either age 55 with up to 80% of average final compensation (“AFC”) or may retire at either age 60 with up to 100% or 25% of AFC, depending on entry date into the System. Uniform employees may retire at either age 45 with up to 100% of AFC or age 50 with up to either 100% or 35% of AFC, depending on entry date into the System. Survivorship selections may result in an actuarial reduction to the calculated benefit.
Members may qualify for service-connected disability benefits regardless of length of service. Service-connected disability benefits are equal to 70% of a member’s final rate of pay, and are payable immediately without an actuarial reduction. These applications require approval by the Board.

42
PHILADELPHIA WATER DEPARTMENT
NOTES TO THE FINANCIAL STATEMENTS
JUNE 30, 2016 AND 2015
NOTE 16: CITY PENSION PLAN (CONTINUED)
G. Benefits (Continued)
Eligibility to apply for non-service-connected disability benefits varies by bargaining unit and uniform/non-uniform status. Non-service connected disability benefits are determined in the same manner as retirement benefits, and are payable immediately.
Service connected death benefits are payable to:
1) surviving spouse/life partner at 60% of final rate of pay plus up to 2 children under age 18 at 10% each of final rate of pay (maximum payout: 80%);
2) if no surviving spouse/life partner, up to 3 children under age 18 at 25% each of final rate of pay (maximum payout 75%); or
3) if no surviving spouse/life partner or children under age 18, up to 2 surviving parents at 15% each of final rate of pay (maximum payout 30%).
Non-service connected deaths are payable as a lump sum payment, unless the deceased was either vested or had reached minimum retirement age for their plan, in which case the beneficiary(s) may instead select a lifetime monthly benefit, payable immediately with an actuarial reduction.
A Pension Adjustment Fund (“PAF”) is funded with 50% of the excess earnings that are between 1% and 6% above the actuarial assumed earnings rate. Each year within sixty days of the end of the fiscal year, by majority vote of its members, the Board of Directors of the Fund (the “Board”) shall consider whether sufficient funds have accumulated in the PAF to support an enhanced benefit distribution (which may include, but is not limited to, a lump sum bonus payment, monthly pension payment increases, ad-hoc cost-of-living adjustments, continuous cost-of-living adjustments, or some other form of increase in benefits as determined by the Board) to retirees, their beneficiaries and their survivors. As of July 1, 2015, the date of the most recent actuarial valuation, there was $38,198,762 in the PAF and the Board voted to make distributions of $30,004,292 during the fiscal year ended June 30, 2016.
The Fund includes a Deferred Retirement Option Plan (DROP Plan). The DROP Plan allows a participant to declare that they will retire within 4 years. During the 4-year period, the City will make no further contributions for the participant. The participant would continue to work and to receive their salary; however, any increases would not be counted towards their pension benefit. During the 4-year period the individual participates in the DROP Plan, their pension benefits will be paid into an escrow account in the participant's name. After the 4-year period, the participant would begin to receive their pension benefits and the amount that has been accumulated in the escrow account in a lump sum payment. The balance in the DROP Plan as of June 30, 2016 is $113.9 million.

43
PHILADELPHIA WATER DEPARTMENT
NOTES TO THE FINANCIAL STATEMENTS
JUNE 30, 2016 AND 2015
NOTE 16: CITY PENSION PLAN (CONTINUED)
H. Net Pension Liability
The components of the net pension liability for the pension plan as of June 30, 2016 were as follows:
Total Pension Liability $10,877,209,958 Plan Fiduciary Net Position 4,357,975,073 Net Pension Liability $ 6,519,234,885
Plan Fiduciary Net Position as a Percentage of the Total Pension Liability is 40.1%.
I. Actuarial Assumptions
The total pension liability was determined by an actuarial valuation as of July 1, 2015 and was rolled forward to June 30, 2016. The July 1, 2015 actuary valuation used the following actuarial assumptions, applied to all periods including the measurement period:
Actuarial Cost Method: Entry Age Normal Investment Rate of Return: 7.75% compounded annually, net of expenses Salary Increases: Age Based Table
* The investment return assumption was changed from 7.80% from the prior year valuation to 7.75 percent for the current year valuation.
*To recognize the expense of the benefits payable under the Pension Adjustment Fund, the actuarial liabilities have been increased 0.54%. This estimate is based on the statistical average expected value of the benefits.
*The mortality rates were based on the RP 2000 Healthy Annuitant Mortality Table for males and females with adjustments for mortality improvements using Scale AA with five years set-back for Municipal males and females and a 2 year set-back for Police and Fire males and females.
The measurement date for the net pension liability is June 30, 2016. Measurements are based on the fair value of assets as of June 30, 2016 and the Total Pension Liability as of the valuation date, July 1, 2015 updated to June 30, 2016. The roll-forward procedure included the addition of service cost and interest cost offset by actual benefit payments. There were actuarial experience losses during the year of approximately $152 million, which includes the loss due to the Pension Adjustment Fund payment of $30 million. In addition, the Board adopted recommended assumption changes, including:
Decrease in the expected long-term return on assets from 7.80% to 7.75% Increase the load on valuation pay from 4% to 6% for Police participants to account for stress pay and for Fire participants to account for premium pay.
The combined effect of these assumption changes increased the total pension liability by approximately $85 million as a year-end value. The pension plan’s fiduciary net position has been determined on the same basis used by the pension plan.

44
PHILADELPHIA WATER DEPARTMENT
NOTES TO THE FINANCIAL STATEMENTS
JUNE 30, 2016 AND 2015
NOTE 16: CITY PENSION PLAN (CONTINUED)
I. Actuarial Assumptions (Continued)
The long-term rate of return on pension plan investments was determined using a building-block method in which best-estimate ranges of expected future real rates of return (expected returns, net of pension plan investment expense and inflation) are developed for each major asset class. These ranges are combined to produce the long-term expected rate of return by weighting the expected future real rates of return by the target asset allocation percentage and by adding expected inflation.
Best estimates of geometric real rates of return for each major asset class included in the pension plan’s target asset allocation as of June 30, 2016 (see discussion of pension plan’s investment policy) are summarized in the following table:
Asset Class Long-Term Expected Real Rate of Return
US Equity 7.90%
Non-US Equity – Developed 7.60%
Non-US Equity – Emerging 7.20%
ACWI Ex-US 7.30%
Broad Fixed Income 2.80%
Global Aggregate 1.70%
Emerging Market Debt 5.80%
High Yield 5.20%
Universal 3.20%
91 Day T-bills 0.20%
Bank Loans 4.70%
Opportunistic Credit 2.05%
Real Assets – Public REITS 7.20%
Real Assets – Private Real Estate 12.70%
Real Assets – MLP’s 7.80%
Private Equity 10.95%
Hedge Funds 5.50%
The above table reflects the expected (7-10 year) real rate of return for each major asset class. The expected inflation rate is projected 0.84% for the same time period.
The discount rate used to measure the total pension liability was 7.75 percent. The projection of cash flows used to determine the discount rate assumed that plan member contributions will be made at the current contribution rate and the participating governmental entity contributions will be made at rates equal to the difference between the actuarial determined contribution rates and the member rate. Based on those assumptions, the pension plan’s fiduciary net position was projected to be available to make all projected future benefit payments of current plan members. Therefore, the long-term expected rate of return on pension plan investments was applied to all on project benefit payment to determine the total pension liability.
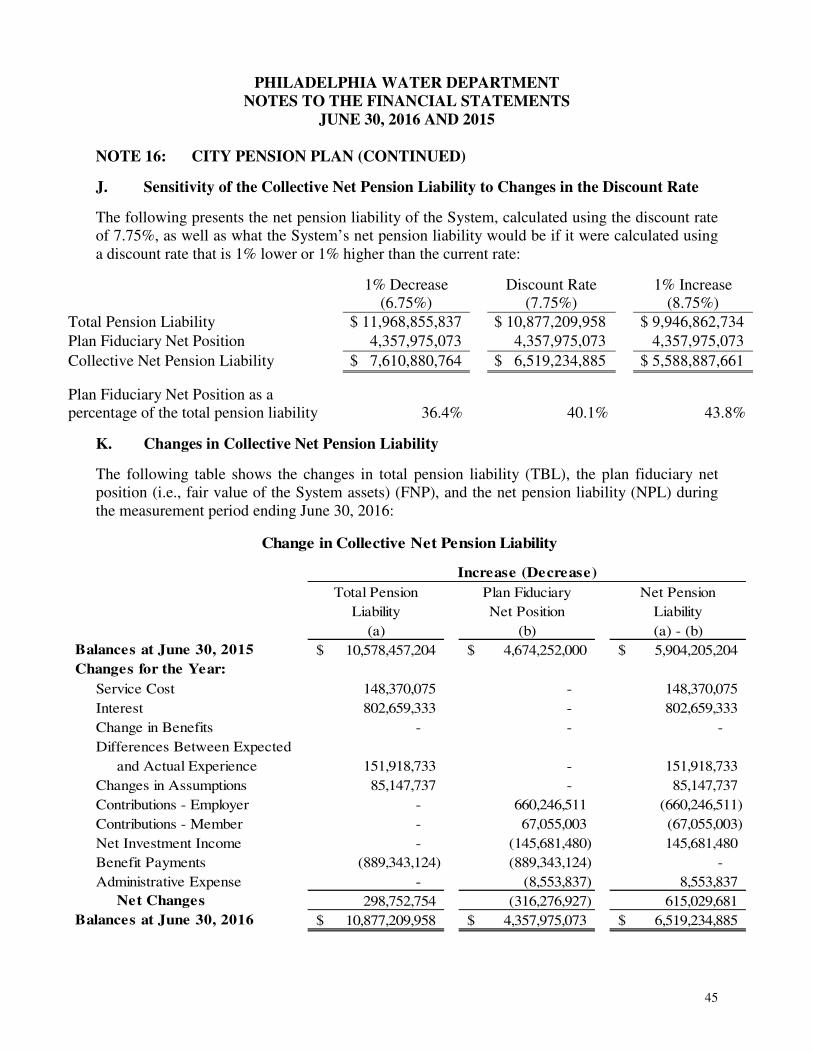
45
PHILADELPHIA WATER DEPARTMENT
NOTES TO THE FINANCIAL STATEMENTS
JUNE 30, 2016 AND 2015
NOTE 16: CITY PENSION PLAN (CONTINUED)
J. Sensitivity of the Collective Net Pension Liability to Changes in the Discount Rate
The following presents the net pension liability of the System, calculated using the discount rate of 7.75%, as well as what the System’s net pension liability would be if it were calculated using a discount rate that is 1% lower or 1% higher than the current rate:
1% Decrease (6.75%)
Discount Rate (7.75%)
1% Increase (8.75%)
Total Pension Liability $ 11,968,855,837 $ 10,877,209,958 $ 9,946,862,734
Plan Fiduciary Net Position 4,357,975,073 4,357,975,073 4,357,975,073
Collective Net Pension Liability $ 7,610,880,764 $ 6,519,234,885 $ 5,588,887,661
Plan Fiduciary Net Position as a percentage of the total pension liability
36.4%
40.1%
43.8%
K. Changes in Collective Net Pension Liability
The following table shows the changes in total pension liability (TBL), the plan fiduciary net position (i.e., fair value of the System assets) (FNP), and the net pension liability (NPL) during the measurement period ending June 30, 2016:
Total Pension Plan Fiduciary Net Pension
Liability Net Position Liability
(a) (b) (a) - (b)
Balances at June 30, 2015 10,578,457,204$ 4,674,252,000$ 5,904,205,204$
Changes for the Year:
Service Cost 148,370,075 - 148,370,075
Interest 802,659,333 - 802,659,333
Change in Benefits - - -
Differences Between Expected
and Actual Experience 151,918,733 - 151,918,733
Changes in Assumptions 85,147,737 - 85,147,737
Contributions - Employer - 660,246,511 (660,246,511)
Contributions - Member - 67,055,003 (67,055,003)
Net Investment Income - (145,681,480) 145,681,480
Benefit Payments (889,343,124) (889,343,124) -
Administrative Expense - (8,553,837) 8,553,837
Net Changes 298,752,754 (316,276,927) 615,029,681
Balances at June 30, 2016 10,877,209,958$ 4,357,975,073$ 6,519,234,885$
Change in Collective Net Pension Liability
Increase (Decrease)

46
PHILADELPHIA WATER DEPARTMENT
NOTES TO THE FINANCIAL STATEMENTS
JUNE 30, 2016 AND 2015
NOTE 16: CITY PENSION PLAN (CONTINUED)
L. Employers’ Proportionate Share
GASB 68 requires that the proportionate share for each employer be determined based upon the employer’s projected long-term contribution effort to the pension, as compared to the total long-term contribution effort of all employers. In addition to the City, three quasi-governmental agencies currently participate in the system, PHDC, PPA, and PMA. The method of allocation is based on the ratio of quasi-governmental agency contributions in proportion to total contributions of the plan.
The following schedule presents the pension amounts for each participating employer: Philadelphia Parking Authority (PPA), Philadelphia Municipal Authority (PMA), Philadelphia Housing Development Corporation (PHDC), and the City of Philadelphia (City):
For the
Year Ended PPA PMA PHDC City Total
Collective Pension Expense 25,387,890$ 358,942$ 2,451,900$ 760,854,021$ 789,052,753$
Change in Proportion 10,414,416 282,118 712,826 (11,409,360) -
Contribution Difference 2,932,864 18,215 204,649 (3,155,728) -
Employer Pension Expense 38,735,170 659,275 3,369,375 746,288,933 789,052,753
Net Pension Liability 06/30/15 145,684,531 1,486,220 15,315,633 5,741,718,820 5,904,205,204
Net Pension Liability 06/30/16 209,757,354 2,965,619 20,257,849 6,286,254,060 6,519,234,882
Change in Net Pension Liability 64,072,823 1,479,399 4,942,216 544,535,240 615,029,678
Deferred Outflows 06/30/15 12,276,927 106,529 1,161,645 340,540,743 354,085,844
Deferred Outflows 06/30/16 65,741,046 1,275,353 5,267,031 806,510,385 878,793,815
Change in Deferred Outflows 53,464,119 1,168,824 4,105,386 465,969,642 524,707,971
Deferred Inflows 06/30/15 - - - (3,908,051) (3,908,051)
Deferred Inflows 06/30/16 - - - (42,392,584) (42,392,584)
Change in Deferred Inflows - - - (38,484,533) (38,484,533)
Employer Contributions 28,126,464 348,700 2,532,545 629,238,802 660,246,511
Employer Pension Expense 38,735,170 659,275 3,369,375 746,288,933 789,052,753
Schedule of Pension Amounts by Employer

47
PHILADELPHIA WATER DEPARTMENT
NOTES TO THE FINANCIAL STATEMENTS
JUNE 30, 2016 AND 2015
NOTE 16: CITY PENSION PLAN (CONTINUED)
M. Reconciliation of Net Pension Liability
The following table reconciles the Collective Net Pension Liability to the amount reported in the Statement of Net Position included in the City of Philadelphia’s Comprehensive Annual Financial Report:
(Amounts in Thousands of USD)
Discretely City and
Presented Blended
Proportionate Component Component
Municipal Pension Fund Share of NPL Units Units
City 6,286,254$ -$ 6,286,254$
PPA 209,757 209,757 -
PMA 2,966 - 2,966
PHDC (1) 20,258 20,258 -
Collective Net Pension Liability 6,519,235 230,015 6,289,220
State Pension Fund
PICA 1,236
City's Primary Government Net Pension Liability 6,290,456$
(1) PHDC does not appear in the Component Unit Financial Statements (Exhibit XI Statement of Net Position
and Exhibit XII Statement of Activities) in the City of Philadelphia's Comprehensive Annual Financial Report
due to immateriality.
Reconciliation of Collective Net Pension Liability to the Primary Government Net Pension Liability
N. Deferred Outflows and Inflows by Employer
The following table summarizes the deferred outflows allocated to each employer for experience, assumption changes, investment returns, and contribution differences:
PPA PMA PHDC City Total
Proportionate Shares 3.22% 0.05% 0.31% 96.43% 100.00%
Experience 4,227,615$ 59,771$ 408,293$ 126,698,103$ 131,393,782$
Assumption Changes 2,829,290 40,001 273,246 84,791,466 87,934,003
Investment Returns 19,854,430 280,709 1,917,492 595,020,815 617,073,446
Proportion Change 31,243,249 846,353 2,138,476 - 34,228,078
Contribution Differences 7,586,463 48,519 529,524 - 8,164,506
65,741,047$ 1,275,353$ 5,267,031$ 806,510,384$ 878,793,815$
Schedule of Employers' Deferred Outflows

48
PHILADELPHIA WATER DEPARTMENT
NOTES TO THE FINANCIAL STATEMENTS
JUNE 30, 2016 AND 2015
NOTE 16: CITY PENSION PLAN (CONTINUED)
N. Deferred Outflows and Inflows by Employer (Continued)
The following table summarizes the deferred inflows allocated to each employer for experience, assumptions changes, investment return, and contribution differences:
PPA PMA PHDC City Total
Proportionate Shares 3.22% 0.05% 0.31% 96.43% 100.00%
Experience -$ -$ -$ -$ -$
Assumption Changes - - - - -
Investment Returns - - - - -
Proportion Change - - - (34,228,078) (34,228,078)
Contribution Differences - - - (8,164,506) (8,164,506)
-$ -$ -$ (42,392,584)$ (42,392,584)$
Schedule of Employers' Deferred Inflows
The following table shows the net amount of deferred outflows and inflows to be recognized by each participating employer in each of the next five years and the total thereafter:
O. Summary of Significant Accounting Policies
Basis of Presentation
Financial statements of the Fund are prepared using the accrual basis of accounting. Member contributions are recognized in the period in which the contributions are due. Employer contributions are recognized when due and the employer has made a formal commitment to provide the contributions. Benefits and refunds of contributions are recognized when due and payable in accordance with the terms of the Fund.
For Year Ending PPA PMA PHDC City Total
2017 21,464,807$ 415,101$ 1,701,446$ 228,710,459$ 252,291,813$
2018 21,464,807 415,102 1,701,447 228,710,457 252,291,813
2019 19,584,595 399,528 1,552,498 209,991,227 231,527,848
2020 3,226,838 45,622 311,640 96,705,657 100,289,757
2021 - - - - -
Thereafter - - - - -
Total 65,741,047$ 1,275,353$ 5,267,031$ 764,117,800$ 836,401,231$
Schedule of Employers' Recognition of Deferred Outflows and Inflows

49
PHILADELPHIA WATER DEPARTMENT
NOTES TO THE FINANCIAL STATEMENTS
JUNE 30, 2016 AND 2015
NOTE 16: CITY PENSION PLAN (CONTINUED)
O. Summary of Significant Accounting Policies (Continued)
New GASB Pronouncement
In February 2015, the GASB issued Statement No. 72, “Fair Value Measurement and
Application”. This Statement addresses accounting and financial reporting issues related to fair value measurements, and provides guidance for determining a fair value measurement for financial reporting purposes. This Statement also provides guidance for applying fair value to certain investments and disclosures related to all fair value measurements. The requirements of this Statement become effective for fiscal periods beginning after June 15, 2015.
Methods Used to Value Investments
The Pension Fund’s investments are reported at fair value. Fair value is the amount that the Pension Fund can reasonably expect to receive for an investment in a current sale between a willing buyer and a willing seller, that is, other than in a forced or liquidation sale. Fixed income securities and common and preferred stocks are generally valued based on published market prices and quotations from national security exchange or security pricing services. Securities which are not traded on a national security exchange are valued by the respective fund manager or other third parties based on similar sales.
Directly-owned real estate investments are primarily valued based on appraisals performed by independent appraisers and for properties not appraised, the present value of the projected future net income stream is used.
For private market investments which include private equity, private debt, venture capital, hedge funds and equity real estate investments where no readily ascertainable market value exists, management, in consultation with the general partner and investment advisors, has determined the fair values for the individual investments based upon the partnership’s most recent available financial information. Futures contracts, foreign exchange contracts, and options are marked-to-market daily with changes in market value recognized as part of net appreciation/depreciation in the fair value of investments. Initial margin requirements for such financial instruments are provided by investment securities pledged as collateral or by cash.
Investment expenses consist of investment manager fees and investment consultant fees related to the traditional investments only, and not those fees related to the alternative investments. Unsettled investment sales are reported as Accrued Interest and Other Receivable, and unsettled investment purchases are included in Accrued Expenses and Other Liabilities.
Dividend income is recorded on the ex-dividend date. Interest income is recorded as earned on an accrual basis.

50
PHILADELPHIA WATER DEPARTMENT
NOTES TO THE FINANCIAL STATEMENTS
JUNE 30, 2016 AND 2015
NOTE 16: CITY PENSION PLAN (CONTINUED)
O. Summary of Significant Accounting Policies (Continued)
Income Taxes
The Pension Fund qualifies under Section 401(a) of the Internal Revenue Code (IRC) and is exempt from income taxation as allowed by Section 501(a) of the IRC.
Related Parties
The City's Department of Finance provides cash receipt and cash disbursement services to the Pension Fund. The City's Solicitor's office provides legal services to the Pension Fund. Other administrative services are also provided by the City.
Use of Estimates in Preparing Financial Statements
The preparation of financial statements in conformity with accounting principles generally accepted in the United States requires management to make estimates and assumptions that affect the reported amounts of assets, liabilities and changes therein, and disclosure of contingent assets and liabilities. Actual results could differ from those estimates.
Risks and Uncertainties
The Fund invests in various investment securities. Investment securities are exposed to various risks such as interest rate, market, and credit risks. Due to the level of risk associated with certain investment securities, it is at least reasonably possible that changes in the values of investment securities will occur in the near term and that such changes could materially affect the amounts reported in the Pension Fund’s Statement of Fiduciary Net Position.
Contributions are calculated based on certain assumptions pertaining to interest rates, inflation rates, and employee demographics, all of which are subject to change. Due to uncertainties inherent in the estimation and assumption process, it is at least reasonably possible that changes in these statements and assumptions in the near term would be material to the financial statements.
Administrative Expenses
Administrative expenses of the Pension Fund are paid for by the Pension Fund.
P. Cash Deposits, Investments, and Securities Lending
Legal Provisions
The Pension Fund is authorized to invest in "prudent investments," including obligations of the U.S. Treasury, agencies and instrumentalities of the United States, investment grade corporate bonds, common stock, real estate, private market, etc. City ordinances contain provisions which preclude the Pension Fund from investing in organizations that conduct business in certain countries and also impose limitations on the amounts invested in certain types of securities.

51
PHILADELPHIA WATER DEPARTMENT
NOTES TO THE FINANCIAL STATEMENTS
JUNE 30, 2016 AND 2015
NOTE 16: CITY PENSION PLAN (CONTINUED)
P. Cash Deposits, Investments, and Securities Lending (Continued)
Interest Rate Risk
Interest rate risk is the largest risk faced by an investor in the fixed income market. The price of a fixed income security generally moves in the opposite direction of the change in interest rates. Securities with long maturities are highly sensitive to interest rate changes.
Duration is a measure of the approximate sensitivity of a bond’s value to interest rate changes. The higher the duration, the greater the changes in fair value when interest rates change. The Pension Fund measures interest rate risk using option-adjusted duration, which recognizes the fact that yield changes may change the expected cash flows due to embedded options.
This chart details the exposure to interest rate changes based on maturity dates of the fixed income securities:
Custodial Credit Risk
In the event of counter-party failure, the Pension Fund may not be able to recover the value of its investment or collateral securities that are in the possession of an outside party. Investment securities are exposed to custodial credit risk if the securities held by the counterparty or counterparty’s trust department, are uninsured and are not registered in the name of the Pension Fund. The Pension Fund requires that all investments be clearly marked as to ownership, and to the extent possible, be registered in the name of the Pension Fund. Certain investments may be held by the managers in the Pension Fund’s name.
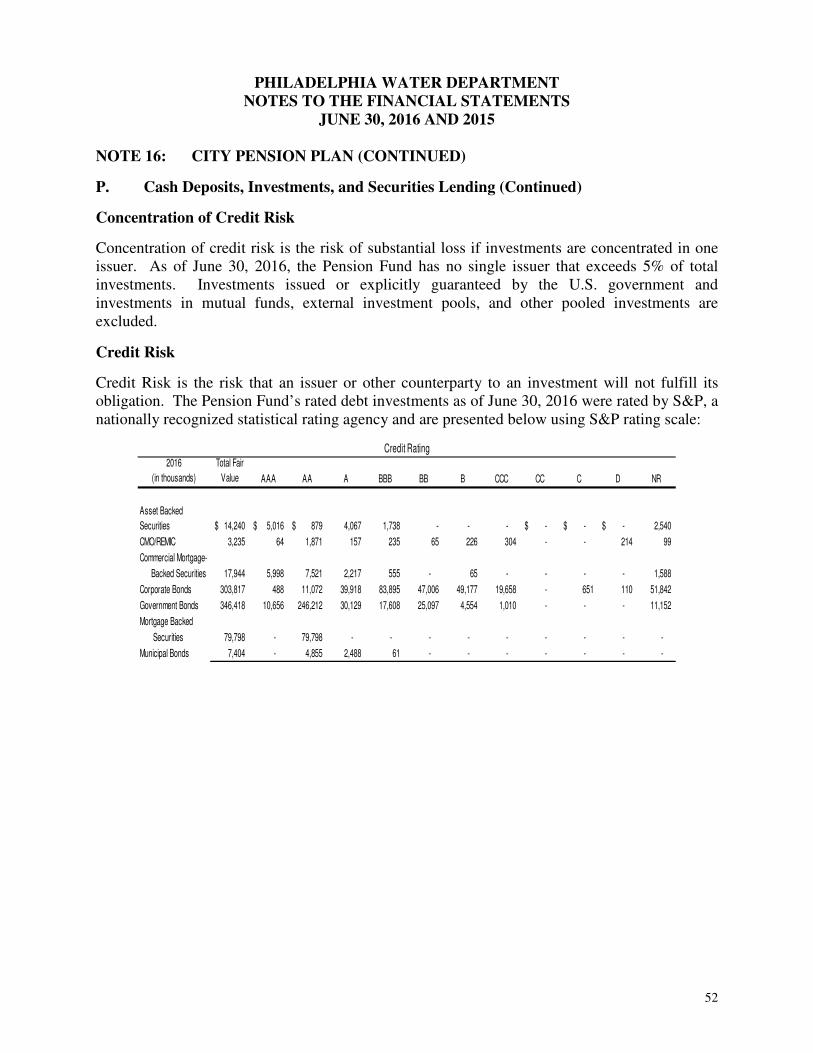
52
PHILADELPHIA WATER DEPARTMENT
NOTES TO THE FINANCIAL STATEMENTS
JUNE 30, 2016 AND 2015
NOTE 16: CITY PENSION PLAN (CONTINUED)
P. Cash Deposits, Investments, and Securities Lending (Continued)
Concentration of Credit Risk
Concentration of credit risk is the risk of substantial loss if investments are concentrated in one issuer. As of June 30, 2016, the Pension Fund has no single issuer that exceeds 5% of total investments. Investments issued or explicitly guaranteed by the U.S. government and investments in mutual funds, external investment pools, and other pooled investments are excluded.
Credit Risk
Credit Risk is the risk that an issuer or other counterparty to an investment will not fulfill its obligation. The Pension Fund’s rated debt investments as of June 30, 2016 were rated by S&P, a nationally recognized statistical rating agency and are presented below using S&P rating scale:
2016
(in thousands)
Total Fair
Value AAA AA A BBB BB B CCC CC C D NR
Asset Backed
Securities 14,240$ 5,016$ 879$ 4,067 1,738 - - - -$ -$ -$ 2,540
CMO/REMIC 3,235 64 1,871 157 235 65 226 304 - - 214 99
Commercial Mortgage-
Backed Securities 17,944 5,998 7,521 2,217 555 - 65 - - - - 1,588
Corporate Bonds 303,817 488 11,072 39,918 83,895 47,006 49,177 19,658 - 651 110 51,842
Government Bonds 346,418 10,656 246,212 30,129 17,608 25,097 4,554 1,010 - - - 11,152
Mortgage Backed
Securities 79,798 - 79,798 - - - - - - - - -
Municipal Bonds 7,404 - 4,855 2,488 61 - - - - - - -
Credit Rating

53
PHILADELPHIA WATER DEPARTMENT
NOTES TO THE FINANCIAL STATEMENTS
JUNE 30, 2016 AND 2015
NOTE 16: CITY PENSION PLAN (CONTINUED)
P. Cash Deposits, Investments, and Securities Lending (Continued)
Foreign Currency Risk
The Pension Fund’s exposure to foreign currency risk derives from its position in foreign currency-denominated cash and investments in fixed income, equities, and derivatives. The foreign currency investment in equity securities is 36% of the total investment in equities.
Municipal Pension Fund - Assets subject to foreign currency risk (in thousands)
Currency Cash
Fixed
Income Equities Derivatives Total
Euro 2,052$ 8,774$ 191,517$ (345)$ 201,998$
Japa nese Yen 12,120 - 138,058 - 150,178
Pound Sterl ing 878 8,604 129,033 1 138,516
Hong Kong Dol la r 149 - 69,215 - 69,364
Swiss Fra nc 349 - 65,112 - 65,461
Canadi an Dol lar 5,553 206 45,669 (13) 51,415
Austra l ian Dol la r 183 11,102 36,791 - 48,076
South Korean Won - - 42,867 - 42,867
Mexica n Peso 8 24,391 8,292 (20) 32,671
Brazi l i an Real 9 9,611 14,855 (23) 24,452
South African Rand - 5,310 13,870 21 19,201
Mala ys ian Ringgit 7 6,832 6,814 - 13,653
Indones ian Rupiah 22 7,115 5,922 - 13,059
Swedish Krona 142 - 11,929 (404) 11,667
Da nish Krone 58 - 8,540 - 8,598
Singapore Dol lar 578 - 6,234 - 6,812
New Zeal and Dol lar 28 5,578 879 - 6,485
Pol ish Zloty 2 3,590 2,419 - 6,011
Phi l i ppine Peso - 919 4,824 - 5,743
Hungarian Forint - 4,838 579 (5) 5,412
Thai Ba ht 2 - 5,340 - 5,342
Chi lean Peso - - 3,298 276 3,574
Al l Others 2,572 4,694 11,673 (90) 18,849
24,712$ 101,564$ 823,730$ (602)$ 949,404$

54
PHILADELPHIA WATER DEPARTMENT
NOTES TO THE FINANCIAL STATEMENTS
JUNE 30, 2016 AND 2015
NOTE 16: CITY PENSION PLAN (CONTINUED)
P. Cash Deposits, Investments, and Securities Lending (Continued)
Derivatives
The Pension Fund may invest in derivatives as permitted by guidelines established by the Pension Board. Pursuant to such authority, the Pension Fund may invest in foreign currency forward contracts, options, futures (S&P Fund) and swaps. No derivatives were purchased with borrowed funds.
Derivatives are generally used to provide market exposure in the equity portfolio and to hedge against foreign currency risk and changes in interest rates, improve yield and adjust the duration of the Pension Fund’s fixed income portfolio. These securities are subject to changes in value due to changes in interest rates or currency valuations. Credit risk for derivatives results from the same considerations as other counterparty risk assumed by the Pension Fund, which is the risk that the counterparty might be unable to meet its obligations.
Derivative instruments such as swaps, options, futures and forwards are often complex financial arrangements used by governments to manage specific risks or to make investments. By entering into these arrangements, governments receive and make payments based on market prices without actually entering into the related financial or commodity transactions. Derivative instruments associated with changing financial and commodity prices result in changing cash flows and fair values that can be used as effective risk management or investment tools. Derivative instruments, however, also can expose governments to significant risks and liabilities.
The Pension Fund enters into a variety of financial contracts, which include options, futures, forwards and swap agreements to gain exposure to certain sectors of the equity and fixed income markets; collateralized mortgage obligations (CMOs); other forward contracts, and U.S. treasury strips. The contracts are used primarily to enhance performance and reduce the volatility of the portfolio. The Pension Fund is exposed to credit risk in the event of non-performance by counterparties to financial instruments. The Pension Fund generally enters into transactions only with high quality institutions. Legal risk is mitigated through selection of executing brokers and review of all documentation. The Pension Fund is exposed to market risk, the risk that future changes in market conditions may make an instrument less valuable. Exposure to market risk is managed in accordance with risk limits set by senior management, through buying or selling instruments or entering into offsetting positions. The notional or contractual amounts of derivatives indicate the extent of the Pension Fund’s involvement in the various types and uses of derivative financial instruments and do not measure the Pension Fund’s exposure to credit or market risks and do not necessarily represent amounts exchanged by the parties. The amounts exchanged are determined by reference to the notional amounts and the other terms of the derivatives.

55
PHILADELPHIA WATER DEPARTMENT
NOTES TO THE FINANCIAL STATEMENTS
JUNE 30, 2016 AND 2015
NOTE 16: CITY PENSION PLAN (CONTINUED)
P. Cash Deposits, Investments, and Securities Lending (Continued)
Derivative Instruments
The following table summarizes aggregate notional or contractual amounts for the Pension Fund’s derivative financial instruments at June 30, 2016 in addition to the fair value and change in the fair value of derivatives.
A Derivatives Policy Statement identifies and allows common derivative investments and strategies, which are consistent with the Investment Policy Statement of the City of Philadelphia Municipal Pension Fund. The guidelines identify transaction-level and portfolio-level risk control procedures and documentation requirements. Managers are required to measure and monitor exposure to counterparty credit risk. All counterparties must have credit ratings available from nationally recognized rating institutions such as Moody, Fitch, and S&P. The details of other risks and financial instruments in which the Fund involves are described below:
Credit risk. The Fund is exposed to credit risk on hedging derivative instruments that are in asset positions. To minimize its exposure to loss related to credit risk, it is the Fund’s policy to require counterparty collateral posting provisions in its non-exchange-traded hedging derivative instruments. These terms require full collateralization of the fair value of hedging derivative instruments in asset positions (net of the effect of applicable netting arrangements) should the counterparty’s credit rating fall below AA as issued by Fitch Ratings and Standard & Poor’s or Aa as issued by Moody’s Investors Service. Collateral posted is to be in the form of U.S. Treasury securities held by a third-party custodian. The city has never failed to access collateral when required.
It is the Fund’s policy to enter into netting arrangements whenever it has entered into more than one derivative instrument transaction with counterparty. Under the terms of these arrangements, should one party become insolvent or otherwise default on its obligations, close-out netting provisions permit the non-defaulting party to accelerate and terminate all outstanding transactions and net the transactions’ fair values so that a single sum will be owed by, or owed to, the non-defaulting party.
List of Derivatives Aggregated by Investment Type
Notional
Classification
Investment Derivatives:
Forwards Currency Net appreciation/(depreciation) $ (1,280,269) Accrued interest and $ (588,465) $ 105,832,201
Contracts in Investments other receivables
Futures Net appreciation/(depreciation) in $ (93,192) Accrued expenses $ (141,531) $ 113
Grand Totals $ (1,373,461) $ (729,996) $ 105,832,314
Change in Fair Value Fair Value at June 30, 2016
56
PHILADELPHIA WATER DEPARTMENT
NOTES TO THE FINANCIAL STATEMENTS
JUNE 30, 2016 AND 2015
NOTE 16: CITY PENSION PLAN (CONTINUED)
P. Cash Deposits, Investments, and Securities Lending (Continued)
Derivative Instruments (Continued)
Swap agreements. These derivative instruments provide for periodic payments at predetermined future dates between parties based on the change in value of underlying securities, indexes or interest rates. Under fixed interest rate type swap arrangements, the Pension Fund receives the fixed interest rate on certain equity or debt securities or indexes in exchange for a fixed charge. There were not any total receive fixed interest Swaps during 2016. On its pay-variable, received-fixed interest rate swap, as LIBOR increases, the Fund’s net payment on the swap increases. Alternatively, on its pay-fixed, receive-variable interest rate swap, as LIBOR or the SIFMA swap index decreases, the Pension Fund’s net payment on the swap increases.
Futures contracts. These derivative instruments are types of contracts in which the buyer agrees to purchase and the seller agrees to make delivery of a specific financial instrument at a predetermined date and price. Gains and losses on futures contracts are settled daily based on a notional (underlying) principal value and do not involve an actual transfer of the specific instrument. Futures contracts are standardized and are traded on exchanges. The exchange assumes the risk that counterparty will not pay and generally requires margin payments to minimize such risk. In addition, the Pension Fund enters into short sales, sales of securities it does not presently own, to neutralize the market risk of certain equity positions. Initial margin requirements on futures contracts and collateral for short sales are provided by investment securities pledged as collateral and by cash held by various brokers. Although the Pension Fund has the right to access individual pledged securities, it must maintain the amount pledged by substituting other securities for those accessed. The realized gain from Futures contracts was ($425,537). The Pension Fund has cash collateral of $971,025. Futures contracts are valued using a matrix pricing model (Level 2 inputs).
Forward contracts. The Pension Fund is exposed to basis risk on its forward contracts because the expected funds purchase being hedged will price based on a pricing point different than the pricing point at which the forward contract is expected to settle. The realized gain from Forward contracts was $944,312.
Termination risk. The Pension Fund or its counterparties may terminate a derivative instrument if the other party fails to perform under the terms of the contract. In addition, the Pension Fund is exposed to termination risk on its receive-fixed interest rate swap. The Pension Fund is exposed to termination risk on its rate cap because the counterparty has the option to terminate the contract if the SIFMA swap index exceeds 12 percent. If at the time of termination, a hedging derivative instrument is in a liability position, the City would be liable to the counterparty for a payment equal to the liability, subject to netting arrangements.

57
PHILADELPHIA WATER DEPARTMENT
NOTES TO THE FINANCIAL STATEMENTS
JUNE 30, 2016 AND 2015
NOTE 16: CITY PENSION PLAN (CONTINUED)
P. Cash Deposits, Investments, and Securities Lending (Continued)
Derivative Instruments (Continued)
Rollover risk. The Pension Fund is exposed to rollover risk on hedging derivative instruments that are hedges of debt that mature or may be terminated prior to the maturity of the hedged debt. When these hedging derivative instruments terminate, or in the case of a termination option, if the counterparty exercises its option, the Pension Fund will be re-exposed to the risks being hedged by the hedging derivative instrument.
Fair Value Measurement
The Municipal Pension Fund has the following recurring fair value measurement as of June 30, 2016:
Equity securities classified in Level 1 of the fair value hierarchy are valued using quoted market prices. Debt securities classified in Level 2 of the fair value hierarchy are valued using a matrix pricing technique. Mortgage and Asset backed securities and Corporate bonds in Level 3 are valued using discounted cash flow techniques.
Quoted
Prices in
Active Significant
Markets for Other Significant
Identical Observable Unobservable
Assets Inputs Inputs
6/30/2016 (Level 1) (Level 2) (Level 3)
Investments by fair value level
U.S. Treasury Securities 174,835,825$ -$ 174,835,825$ -$
Agency Bonds 40,428,452 - 40,428,452 -
Asset Backed Securities 14,241,090 - 14,241,085 5
Corporate Bonds 304,026,106 - 303,847,733 178,373
Government Bonds 118,483,977 - 118,483,977 -
Mortgage Backed Securities 100,998,630 - 98,931,992 2,066,638
Municipal Bonds 7,403,777 - 7,403,777 -
Sovereign Debt 12,438,505 - 12,438,505 -
Equity 2,257,989,112 2,256,503,492 - 1,485,620
Total Investments by fair value level 3,030,845,474$ 2,256,503,492$ 770,611,346$ 3,730,636$
Investments measured at the net asset value (NAV)
Credit Distressed Hedge Fund 65,082,999
Equity Long/Short hedge funds 21,306,534
Real Estate 229,875,204
Private Equity 437,907,757
Fixed Income Funds 337,486,107
Equity Funds 75,354,026
Total Investments measured at the NAV 1,167,012,627
Total Investments measured at fair value 4,197,858,101$
Investment derivative instruments
Equity index Futures (Liabilities) (141,531)$ (141,531)$ -$
Forward Currency Contracts (Assets) 368,133 - 368,133
Forward Currency Contracts (Liabilities) (956,598) - (956,598)
Total Investment derivative instruments (729,996)$ (141,531)$ (588,465)$
Fair Value Measurements Using
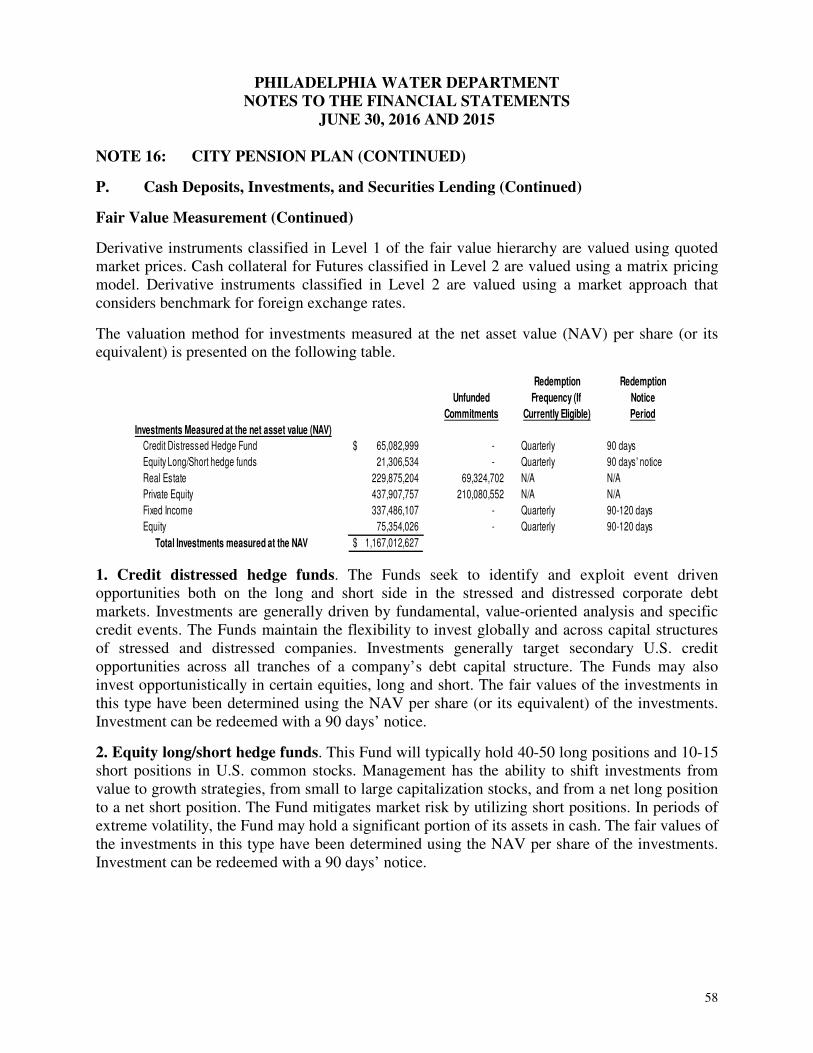
58
PHILADELPHIA WATER DEPARTMENT
NOTES TO THE FINANCIAL STATEMENTS
JUNE 30, 2016 AND 2015
NOTE 16: CITY PENSION PLAN (CONTINUED)
P. Cash Deposits, Investments, and Securities Lending (Continued)
Fair Value Measurement (Continued)
Derivative instruments classified in Level 1 of the fair value hierarchy are valued using quoted market prices. Cash collateral for Futures classified in Level 2 are valued using a matrix pricing model. Derivative instruments classified in Level 2 are valued using a market approach that considers benchmark for foreign exchange rates.
The valuation method for investments measured at the net asset value (NAV) per share (or its equivalent) is presented on the following table.
1. Credit distressed hedge funds. The Funds seek to identify and exploit event driven opportunities both on the long and short side in the stressed and distressed corporate debt markets. Investments are generally driven by fundamental, value-oriented analysis and specific credit events. The Funds maintain the flexibility to invest globally and across capital structures of stressed and distressed companies. Investments generally target secondary U.S. credit opportunities across all tranches of a company’s debt capital structure. The Funds may also invest opportunistically in certain equities, long and short. The fair values of the investments in this type have been determined using the NAV per share (or its equivalent) of the investments. Investment can be redeemed with a 90 days’ notice.
2. Equity long/short hedge funds. This Fund will typically hold 40-50 long positions and 10-15 short positions in U.S. common stocks. Management has the ability to shift investments from value to growth strategies, from small to large capitalization stocks, and from a net long position to a net short position. The Fund mitigates market risk by utilizing short positions. In periods of extreme volatility, the Fund may hold a significant portion of its assets in cash. The fair values of the investments in this type have been determined using the NAV per share of the investments. Investment can be redeemed with a 90 days’ notice.
Redemption Redemption
Unfunded Frequency (If Notice
Commitments Currently Eligible) Period
Investments Measured at the net asset value (NAV)
Credit Distressed Hedge Fund 65,082,999$ - Quarterly 90 days
Equity Long/Short hedge funds 21,306,534 - Quarterly 90 days' notice
Real Estate 229,875,204 69,324,702 N/A N/A
Private Equity 437,907,757 210,080,552 N/A N/A
Fixed Income 337,486,107 - Quarterly 90-120 days
Equity 75,354,026 - Quarterly 90-120 days
Total Investments measured at the NAV 1,167,012,627$

59
PHILADELPHIA WATER DEPARTMENT
NOTES TO THE FINANCIAL STATEMENTS
JUNE 30, 2016 AND 2015
NOTE 16: CITY PENSION PLAN (CONTINUED)
P. Cash Deposits, Investments, and Securities Lending (Continued)
Fair Value Measurement (Continued)
3. Real estate funds. This type includes funds that invest in U.S. and Non-U.S. commercial and residential real estate. The fair values of the investments in this type have been determined using the NAV per share (or its equivalent) of the Plan’s ownership interest in partners’ capital. These investments can never be redeemed with the funds. Distributions from each fund will be received as the underlying investments of the funds are liquidated. However, the individual investments that will be sold have not yet been determined. Because it is not probable that any individual investment will be sold, the fair value of each individual investment has been determined using the NAV per share (or its equivalent) of the Plan’s ownership interest in partners’ capital. Once it has been determined which investments will be sold and whether those investments will be sold individually or in a group, the investments will be sold in an auction process. The investee fund’s management is required to approve of the buyer before the sale of the investments can be completed. It is expected that the underlying assets of the funds will be liquidated over the next seven to 10 years.
4. Private equity funds. The primary goal of these Funds is to generate returns for investors that exceed private equity industry benchmarks and are commensurate with asset class risk through the construction of a portfolio of opportunistic, highly performing private equity investments. Investments that the fund may undertake include early-stage venture capital, later-stage growth financings, leveraged buyouts of medium and large-sized companies, mezzanine investments, PIPES and investments in companies that are being taken private. These investments can never be redeemed with the funds. Instead, the nature of the investments in this type is that distributions are received through the liquidation of the underlying assets of the fund. If these investments were held, it is expected that the underlying assets of the fund would be liquidated over five to 10 years. The fair values of the investments in this type have been determined using recent observable transaction information for similar investments and nonbinding bids received from potential buyers of the investments. Once a buyer has been identified, the investee fund’s management is required to approve of the buyer before the sale of the investments can be completed.
5. Fixed Income funds. The primary goal of these Funds is to create alpha by sourcing proprietary opportunities, avoiding capital loss, buying securities below their intrinsic value and selling securities above their intrinsic value. Firms look for opportunities that are currently mispriced, based on fundamentals or potentially an event that may improve the price of the holding.
6. Equity funds. The primary goal of these Funds is employ a private equity approach to public market investing which seeks to deliver superior returns through a value-oriented investment strategy focusing on companies that are (or should be) implementing strategic change.

60
PHILADELPHIA WATER DEPARTMENT
NOTES TO THE FINANCIAL STATEMENTS
JUNE 30, 2016 AND 2015
NOTE 16: CITY PENSION PLAN (CONTINUED)
P. Cash Deposits, Investments, and Securities Lending (Continued)
Securities Lending Program
The Pension Fund, pursuant to a Securities Lending Authorization Agreement, has authorized J.P. Morgan Bank and Trust Company (J.P. Morgan) to act as the Pension Fund’s agent in lending the Pension Fund’s securities to approved borrowers. J.P. Morgan, as agent, enters into Securities Loan Agreements with borrowers.
During the fiscal year, J.P. Morgan lent, on behalf of the Pension Fund, certain securities of the Pension Fund held by J.P. Morgan chase bank, N.A. as custodian and received cash or other collateral including securities issued or guaranteed by the United States, U.K., and Eurozone governments. J.P. Morgan does not have the ability to pledge or sell collateral securities delivered absent a borrower default. Borrowers were required to deliver collateral for each loan equal to at least 102% or 105% of the market value of the loaned securities.
Pursuant to the Securities Lending Authorization Agreement, J.P. Morgan had an obligation to indemnify the Pension Fund in the event of default by a borrower. There were no failures by any borrowers to return loaned securities or pay distributions thereon during the fiscal year that resulted in a declaration or notice of default of the borrower.
During the fiscal year, the Pension Fund and the borrowers maintained the right to terminate securities lending transactions upon notice. The cash collateral received on each loan was invested in a separately managed account based upon the investment guidelines established by the Pension Fund. As of June 30, 2016 the weighted average maturity was 48 days and the final maturity was 351 days.
Because the securities lending transactions were terminable at will, their duration did not generally match the duration of the investments made with the cash collateral received from the borrower.
On June 30, 2016, the Pension Fund had no credit risk exposure to borrowers.
As of June 30, 2016, the fair value of securities on loan was $323.5 million. Associated collateral totaling $331.3 million was comprised of cash which was invested in a separately managed account based upon the investment guidelines established by the Pension Fund. As of June 30, 2016, the invested cash collateral was $331.0 million and is valued at amortized cost.
Q. Investment Advisors
The Pension Fund utilizes investment advisors to manage long-term debt, real estate, private market, and equity portfolios. To be eligible for consideration, investments must meet criteria set forth in governing laws and regulations.

61
PHILADELPHIA WATER DEPARTMENT
NOTES TO THE FINANCIAL STATEMENTS
JUNE 30, 2016 AND 2015
NOTE 16: CITY PENSION PLAN (CONTINUED)
R. Guarantee of Benefits
Benefits under the Pension Fund are guaranteed by statute. In the event that employee contributions do not equal required benefits, the City’s General Fund must provide any shortfall.
S. Participation in the Pension Fund
The trustees for the Pension Fund are also members of the Pension Fund and as such, are subject to the provisions of the Pension Fund as described in the notes to these financial statements.
T. Subsequent Events
Management evaluated subsequent events through January 11, 2017 the date the financial statements were available to be issued. Events or transactions occurring after June 30, 2016, but prior to January 11, 2017 that provided, additional evidence about conditions that existed at June 30, 2016, have been recognized in the financial statements for the year ended June 30, 2016. Events or transactions that provided evidence about conditions that did not exist at June 30, 2016, but arose before the financial statements were available to be issued have not been recognized in the financial statements for the year ended June 30, 2016.
NOTE 17: OTHER POST EMPLOYMENT BENEFITS
A. Plan description
The City of Philadelphia self-administers a single employer, defined benefit plan and provides health care for five years subsequent to separation for eligible retirees. Certain union represented employees may defer their coverage until a later date, but the amount that the City pays for their health care is limited to the amount that the City would have paid at the date of their retirement. The City also provides lifetime insurance coverage for all eligible retirees. Firefighters are entitled to $7,500 coverage and all other employees receive $6,000 in coverage. The plan does not issue stand alone financial statements, and the accounting for the plan is reported within the financial statements of the City of Philadelphia.
B. Funding Policy
The City funding policy is to pay the net expected benefits for the current retirees. To provide health care coverage, the City pays a negotiated monthly premium for retirees covered by union contracts and is self insured for non-union employees. The City’s contributions are estimated to be about $107.2 million for fiscal year ending June 30, 2016.

62
PHILADELPHIA WATER DEPARTMENT
NOTES TO THE FINANCIAL STATEMENTS
JUNE 30, 2016 AND 2015
NOTE 17: OTHER POST EMPLOYMENT BENEFITS (CONTINUED)
C. Annual OPEB Cost and Net OPEB Obligation
The City’s annual other post employment benefit (OPEB) expense is calculated based on the annual required contribution of the employer (ARC), an amount actuarially determined in accordance with the parameters of GASB Statement No. 45. The ARC represents a level of funding, which if paid on an ongoing basis, is projected to cover normal cost each year and amortize any unfunded actuarial liabilities over a period not to exceed thirty (30) years. The following table shows the components of the City’s annual OPEB cost for the year, the amount actually contributed to the plan, and changes in the net OPEB obligation:
(Thousands of Dollars) Annual Required Contribution $ 136,268 Interest on Net OPEB Liability 11,317 Adjustment to Annual Required Contribution (10,197) Annual OPEB Cost 137,388 Payments Made (107,200) Increase in Net OPEB Obligation 30,188 Net OPEB Obligation - beginning of year 266,286 Net OPEB Obligation - end of year $ 296,474
The City of Philadelphia’s annual OPEB cost, the percentage of annual OPEB cost contributed to the Plan, and the net OPEB obligation for the fiscal year ended June 30, 2016 was as follows:
Fiscal Annual Percentage of Net
Year OPEB Annual OPEB OPEB
Ended Cost Contributed Obligation
6/30/2016 137,388$ 78% 296,474$
6/30/2015 133,052 72% 266,286
6/30/2014 129,318 52% 228,533
(Thousands of Dollars)
D. Funded Status and Funding Progress
As of July 1, 2015, the most recent actuarial valuation date, the City is funding OPEB on a pay as you go basis and accordingly, the unfunded actuarial accrued liability for benefits was $1.77 billion. The covered annual payroll was $1.54 billion and the ratio of the UAAL to the covered payroll was 114.8%.
63
PHILADELPHIA WATER DEPARTMENT
NOTES TO THE FINANCIAL STATEMENTS
JUNE 30, 2016 AND 2015
NOTE 17: OTHER POST EMPLOYMENT BENEFITS (CONTINUED)
D. Funded Status and Funding Progress (Continued)
The required schedule of funding progress immediately following the notes to the financial statements presents multi-year trend information about whether the actuarial value of the plan assets is increasing or decreasing over time relative to the actuarial accrued liability for benefits.
The projections of future benefit payments for an ongoing plan obligation involves estimates of the value of reported amounts and assumptions about the probability of occurrence of events far into the future. Amounts determined regarding the funded status of the obligation and the contributions of the employer are subject to continual revision as actual results are compared with past expectations and new estimates are made about the future.
E. Actuarial Methods and Assumptions
Projections of costs for financial reporting purposes are based on the types of benefits provided under the terms of the substantive plan at the time of each valuation and on the pattern of sharing costs between the employer and plan members to that point.
Costs were determined according to the individual entry age actuarial cost method with the attribution period ending at each decrement age. This is consistent with the cost method used for the City of Philadelphia Municipal Retirement System. The City uses a level percent open approach as its method of amortization. Unfunded liabilities are funded over a 30 year period as a level percentage of payroll, which is assumed to increase at a compound annual rate of 4.25% per year. The current plan incorporates the following assumptions: a 3.30% Rate of Salary increases and a 4% Ultimate Rate of Medical Inflation.
NOTE 18: CLAIMS, LITIGATION, AND CONTINGENCIES
Generally, claims against the City are payable out of the General Fund, except claims against the City Water Department, City Aviation Division, or Component Units which are paid out of their respective funds and only secondarily out of the General Fund which is then reimbursed for the expenditure. Unless specifically noted otherwise, all claims hereinafter discussed are payable out of the Water Fund.
The Act of October 5, 1980, P.L. 693, No. 142, known as the “Political Subdivision Tort Claims Act,” established a $500,000 aggregate limitation on damages arising from the same cause of action, transaction, occurrence, or series of causes of action, transactions or occurrences with respect to governmental units in the Commonwealth such as the City. The constitutionality of that aggregate limitation has been upheld by the United States Supreme Court. There is no such limitation under federal law.

64
PHILADELPHIA WATER DEPARTMENT
NOTES TO THE FINANCIAL STATEMENTS
JUNE 30, 2016 AND 2015
NOTE 18: CLAIMS, LITIGATION, AND CONTINGENCIES (CONTINUED)
Various claims have been asserted against the Water Department and in some cases lawsuits have been instituted. Many of these claims are reduced to judgment or otherwise settled in a manner requiring payment by the Water Department. As of June 30, 2016 and 2015, the aggregate estimate of loss deemed to be probable is $28.2 million and $25.7 million, respectively. This amount has been included on the Statement of Net Position under Other Long-Term Liabilities.
In addition to the above, there are certain lawsuits against the City for which an additional loss is reasonably possible. These lawsuits relate to General Fund and Enterprise Fund operations. The aggregate estimate of the loss, which could result if unfavorable legal determinations were rendered against the City with respect to these lawsuits is approximately $63.5 million to the General Fund and $9.7 million to the Enterprise Funds as of June 30, 2016, and approximately $72.9 million to the General Fund and $9.6 million to the Enterprise Funds as of June 30, 2015.
NOTE 19: LONG TERM AGREEMENTS
The City has entered into several long term agreements with third parties through the Philadelphia Municipal Authority as follows:
A. Automatic Meter Reading
In September 1997, the Water Department and the Water Revenue Bureau began the implementation of the Automatic Meter Reading Program (the “AMR Program”) involving the replacement of all residential water meters with new meters equipped with radio transmitter endpoint reading devices (“ERT”). Installation commenced on schedule on September 11, 1997. By June 30, 2012, more than 482,841 new meters had been installed. From 2011 through 2013, as required in the long-term meter reading contract, the service provider (ITRON) conducted battery replacement of the vast majority of customer ERTs, thus enabling the battery capability of the existing population through 2025. The Water Department is also working on the purchase and installation of upgraded AMR devices for all commercial customers that have ERTs. The AMR Program agreement term ends in 2017. The Department has two one-year renewal options, and is in the process of exercising the first one year extension.
Under the agreement ITRON is paid a fixed amount for each monthly meter reading actually obtained. The Water Department paid ITRON, through the Philadelphia Municipal Authority (“PMA”), $1,689,812 and $1,971,888 in Fiscal Year 2016 and Fiscal Year 2015, respectively for meter reads. Additionally, the Water Department paid ITRON, through PMA, $2,158,001 and $2,745,479 in Fiscal Year 2015 and Fiscal Year 2016, respectively, for the purchase of meters.

65
PHILADELPHIA WATER DEPARTMENT
NOTES TO THE FINANCIAL STATEMENTS
JUNE 30, 2016 AND 2015
NOTE 19: LONG TERM AGREEMENTS (CONTINUED)
B. Biosolids Treatment and Utilization
In 2008, the City entered into a long-term contract and lease with the Philadelphia Municipal Authority (the “PMA”) for the PMA to operate the Water Department’s existing Biosolids Recycling Center (the “BRC”). The PMA and Philadelphia Biosolids Services, LLC (“PBS”) entered into a Service Agreement (the “PBS Service Contract”), pursuant to which PBS designed and built, and currently operates, a facility at the BRC to heat dry and dispose of biosolids captured during wastewater treatment. The PMA is required to make annual payments to PBS for operating the BRC. Pursuant to a Service Agreement between the PMA and the City (the “City Service Contract”), the City assumed all of PMA’s obligations under the PBS Service Contract. The obligations under the City Service Contract constitute operating expenses of the Water Department. In Fiscal Years 2015 and 2016, the City paid to PMA, from revenues generated by the Water Department, $20,496,326 and $20,074,514, respectively. The City Service Contract contains adjusters for the Consumer Price Index, Producer Price Index, and fluctuations in fuel prices, among others; thus, expenditures under the City Service Contract may vary over time. The contract expires on October 13, 2028, and contains the possibility of a five-year renewal term at the option of the City. In addition to facilitating compliance with various state and federal environmental regulations, including the Clean Air Act, the PBS Service Contract has produced cost savings for the Water Department.
C. Northeast Water Pollution Control Plant Digester Gas Cogeneration Facility
In 2011, the City entered into a long-term contract and lease with the PMA for the PMA to arrange the construction, financing, maintenance and sublease of a digester gas cogeneration facility at the Northeast Water Pollution Control Plant. The PMA entered into a lease (the “Lease”) with BAL Green Biogas I, LLC, a special purpose entity of Bank of America (the “Lessor”), which requires the PMA to make certain lease payments to the Lessor. Pursuant to a sublease dated December 23, 2011 (the “Sublease”), the City assumed all of the PMA’s obligations under the Lease. The obligations under this contract constitute operating expenses of the Water Department. In Fiscal Year 2015 and Fiscal Year 2016, the City paid to the Lessor from revenues generated from the Water Department, $4,886,570 and $5,556,547, respectively. The Sublease expires on September 25, 2029, unless renewed by PMA for an additional term of eighteen months.
D. Laurel Street Combined Sewer Overflow
On June 7, 2011 the City of Philadelphia entered into an Amended and Restated Development and Tax and Claim Settlement Agreement (the “agreement”) with Sugarhouse HSP Gaming, L.P. (HSP). In accordance with the agreement, HSP is required to fund development and expansion of the Laurel Street combined sewer overflow. As compensation, HSP is allotted a five year credit against its real estate taxes and settlement payments otherwise due to the City of Philadelphia. This credit is equal to 28 percent of the amount expended on the Laurel Street Combined Sewer Overflow project. If the credit exceeds the amount of real estate taxes and settlement payments due to the City, the credit carries over to the following year.

66
PHILADELPHIA WATER DEPARTMENT
NOTES TO THE FINANCIAL STATEMENTS
JUNE 30, 2016 AND 2015
NOTE 19: LONG TERM AGREEMENTS (CONTINUED)
D. Laurel Street Combined Sewer Overflow (Continued)
As the Laurel Street Combined Sewer Overflow is a capital asset of the Water Department, the Water Department is required to make payments to the General Fund of the City in the amount of the credit allotted to HSP. The credit is approximately $3.5 million per year during fiscal year 2014 through 2018. During fiscal year 2015, the Water Department made payments to the General Fund of the City totaling $7,028,842, of which $3,514,421 represents a payment for fiscal year 2014. The fiscal year 2016 payment totaled $3,514,421.
NOTE 20: COMBINED SEWER OVERFLOW PROGRAM
The PaDEP and the City signed the Consent Order and Agreement on June 1, 2011 that allowed the City to officially to embark on the implementation of its strategy known as the Green City, Clean Waters Program to use green and traditional infrastructure investments to substantially mitigate combined sewer overflows (“CSOs”) and enhance the quality of local waterways over 25 years.
The Water Department anticipates that over the next twenty years, compliance with the COA will significantly increase capital expenditures related to the Green City, Clean Waters Program.
In its current form, the COA adopts the presumption approach to the management of CSOs. The goal under the presumption approach is to eliminate and remove by 2036 (year 25 of the COA) the mass of pollutants that otherwise would be removed by the capture of 85% by volume city-wide of the combined sewage otherwise collected in the City’s combined sewer system during precipitation events. To ensure this ultimate goal is met, the COA requires interim milestones at the end of the fifth, tenth, fifteenth and twentieth years. The interim milestones require the City to achieve specific targets in four categories: (1) Total Greened Acres; (2) Overflow Reduction Volume; (3) Miles of Interceptor Lined; and (4) Wastewater Treatment Plant Upgrades: Design and Construction. The COA includes financial protections in the event that the costs of complying with the COA exceed the Water Department’s projections. Should the costs of complying with the COA increase to the extent that the wastewater component of a customer’s bill exceeds 2.27% of median household income, the City may petition the PaDEP for an extension of time to satisfy the requirements of the COA so that the financial burden does not become excessive on ratepayers. The COA also includes significant penalties for non-compliance with the various 5-year milestone targets. Penalties start at $25,000 per month for each violation (for the first 6 months) and increase up to $100,000 monthly for uncured violations of 13 months or more.

67
PHILADELPHIA WATER DEPARTMENT
NOTES TO THE FINANCIAL STATEMENTS
JUNE 30, 2016 AND 2015
NOTE 20: COMBINED SEWER OVERFLOW PROGRAM (CONTINUED)
The Water Department has completed its fifth year of the 25 year COA. 1,310 additional greened acres and 334 million gallons of combined sewer overflow reduction are required over the next 5 years for a total of 2,148 greened acres and 2,044 million gallons of combined sewer overflow reduction by the end of year 10.
On December 31, 2015, the Water Department received an information request from the EPA, pursuant to Section 308 of the Clean Water Act, which was revised on November 9, 2016, the Water Department. While the revised information request extends the deadline for submission of the alternative analysis from January 1, 2017 to April 30, 2017 and contains fewer requirements than the prior information request, it obligates the Water Department to perform an analysis that is inconsistent with its approved COA. For example, the revised information request directs the Water Department to analyze the controls necessary to achieve 85% capture in each of its CSO receiving streams, rather than 85% capture based on a citywide average, as stated in the Water Department’s approved COA. The Water Department currently is evaluating whether such information request exceeds the EPA’s authority and whether a challenge is warranted. The Water Department also intends to seek reconsideration and withdrawal of the request from the newly appointed head of Region III. Should that be unsuccessful, the Water Department will request a meeting with EPA officials in Washington, D.C. Once these meetings have concluded and depending on the outcome, the Water Department will determine whether to challenge the Section 308 request in federal court, among other courses of action.
NOTE 21: PLEDGE OF REVENUES
Section 4.02 and 4.04 of the Water bond ordinance of 1989, as amended in 1993, which authorized the issuance of Water and Sewer Revenue Bonds, pledges and assigns to the Fiscal Agent for the security and payment of all bonds, a lien on and security interest in all project revenues and amounts on deposit in or standing to the credit of the: 1) Revenue Fund; 2) Sinking Fund et.al.; 3) Subordinated Bond Fund: 4) Rate Stabilization Fund; 5) Residual Fund; and 6) Construction Fund et al. The fiscal agent shall hold and apply the security interest granted in trust for the holders of bonds listed above without preference, priority, or distinction; provided however, that the pledge of this ordinance may also be for the benefit of a credit facility and qualified swap, or any other person who undertakes to provide moneys for the account of the City for the payment of principal or redemption price and interest on any series of bonds (other than subordinated bonds), on an equal and ratable basis with bonds, to the extent provided by any Supplemental Ordinance or Determination. The amount of this pledge is the equal to the remaining principal and interest outstanding on the Water and Sewer Revenue Bonds. The purpose for the debt secured by the pledge can be found in Note 14 to the financial statements.

68
PHILADELPHIA WATER DEPARTMENT
NOTES TO THE FINANCIAL STATEMENTS
JUNE 30, 2016 AND 2015
NOTE 21: PLEDGE OF REVENUES (CONTINUED)
The following chart displays information related to the pledge as of June 30, 2016:
Water and Sewer Revenue Bonds
Pledged Revenue Required for Principal and Interest Payments $2,979.7 million Term of Pledge 2046 Percentage of Revenue Pledged 100% Current Year Pledged Revenue $676.7 million Current Year Principal and Interest Paid $219.3 million
The following chart displays information related to the pledge as of June 30, 2015: Water and Sewer Revenue Bonds
Pledged Revenue Required for Principal and Interest Payments $3,191.5 million Term of Pledge 2046 Percentage of Revenue Pledged 100% Current Year Pledged Revenue $680.6 million Current Year Principal and Interest Paid $344.5 million
NOTE 22: RISK MANAGEMENT
The City is exposed to various risks of loss related to torts; theft of, damage to, and destruction of assets; errors and omissions; injuries to employees; and natural disasters. The City (except for Aviation Fund operations, the Municipal Authority, and PICA) is self-insured for fire damage, casualty losses, public liability, Workers’ Compensation and Unemployment Compensation. The Aviation Fund is self-insured for Workers' Compensation and Unemployment Compensation and insured through insurance carriers for other coverage. The City is self-insured for medical benefits provided to employees in the Fraternal Order of Police, its city-administered health plan, the International Association of Fire Fighters, and District Council 47.
The City covers all claim settlements and judgments, except for those discussed above, out of the resources of the fund associated with the claim. Claims expenditures and liabilities are reported when it is probable that a loss has occurred and the amount of the loss can be reasonably estimated. These losses include: an estimate of claims that have been incurred but not reported; the effects of specific, incremental claims adjustment expenditures, salvage, and subrogation; and unallocated claims adjustment expenditures.

69
PHILADELPHIA WATER DEPARTMENT
NOTES TO THE FINANCIAL STATEMENTS
JUNE 30, 2016 AND 2015
NOTE 22: RISK MANAGEMENT (CONTINUED)
At June 30, 2016 the amount of these liabilities was $350.3 million for the City. This liability is the City’s best estimate based on available information. Changes in the reported liability since June 30, 2014 resulted from the following:
Amounts in Millions of USD
Fiscal Years Ending June 30
Beginning Liability
Current Year Claims and Changes in
Estimates Claim
Payments Ending Liability
2014 $356.1 $244.0 $(250.8) $349.3 2015 349.3 296.0 (291.7) 353.6 2016 353.6 216.2 (219.5) 350.3
The City's Unemployment Compensation and Workers’ Compensation coverages are provided through its General Fund. Unemployment Compensation and Workers’ Compensation coverages are funded by a pro rata charge to the various funds. Payments for the year were $2.8 million for Unemployment Compensation claims and $65.3 million for Workers’ Compensation claims.
The City’s estimated outstanding workers’ compensation liabilities are $271.5 million discounted at 3.5%. On an undiscounted basis, these liabilities total $353.1 million. These liabilities include provisions for indemnity, medical and allocated loss adjustment expense (ALAE). Excluding the ALAE, the respective liabilities for indemnity and medical payments relating to workers’ compensation total $245.8 million (discounted) and $321.5 million (undiscounted). The Water Fund’s accrued liability for workers compensation was $21.7 million and $22.0 million at June 30, 2016 and 2015, respectively.
During the last five (5) fiscal years, no claim settlements have exceeded the level of insurance coverage for operations using third party carriers. None of the City's insured losses have been settled with the purchase of annuity contracts.

70
PHILADELPHIA WATER DEPARTMENT
NOTES TO THE FINANCIAL STATEMENTS
JUNE 30, 2016 AND 2015
NOTE 23: RESTATEMENT OF NET POSITION / CHANGE IN ACCOUNTING
PRINCIPLE
In June 2015, the GASB issued Statement No. 68, “Accounting and Financial Reporting for
Pensions – an amendment of GASB Statement No. 27”, an accounting pronouncement that revised existing standards for measuring and reporting of pension liabilities for pension plans. One of the objectives of this accounting standard is to require governmental agencies to recognize the difference between the actuarial total pension liability and the pension plan’s fiduciary net position as the net pension liability on the statement of net position. In addition to the benefits earned each year, the annual pension expense will also include interest on the total pension liability and the impacts of changes in benefit terms, projected investment earnings and other plan net position changes. The adoption of this accounting standard had a material impact on recorded pension liabilities compared to the application of prior standards. As a result of this change in accounting principle, a net pension liability was established which required the beginning net position as of July 1, 2014 to be adjusted to reflect the change.
The following reconciliation provides the cumulative effect of the change in accounting principle to the net position at July 1, 2014 for the Water Fund:
(Thousands of Dollars)
Net Position – July 1, 2014 as originally stated $ 970,483 Cumulative effect of change in accounting principle (362,365) Net Position – July 1, 2014 restated $ 608,118
NOTE 24: RECLASSIFICATION OF EXPENSE
The following amounts have been restated for fiscal year ending June 30, 2016:
(Thousands of Dollars)
Net Position – July 1, 2015 as originally stated $ 709,579 Reclassification of Expense (22,048) Net Position – July 1, 2015 restated $ 687,531
Capital Assets – July 1, 2015 as originally stated $2,149,680 Reclassification of Capital Asset (22,048) Capital Assets – July 1, 2015 as restated $2,127,632
The 2015 financial statements have not been restated to reflect the changes.

71
PHILADELPHIA WATER DEPARTMENT
NOTES TO THE FINANCIAL STATEMENTS
JUNE 30, 2016 AND 2015
NOTE 25: SUBSEQUENT EVENT
A) In October 2016, the City and the Water Department issued Series 2016 Water and Wastewater Revenue Refunding Bonds in the amount of $192,680,000, to advance refund a portion of the Series 2007A Water and Wastewater Revenue Refunding Bonds, Series of 2009A Water and Wastewater Revenue Bonds, and Series of 2010C Water and Wastewater Revenue Bonds, and to pay the costs related to issuance of the bonds. The debt service requirements of the Water Fund following the issuance of the Series 2016 Water and Wastewater Revenue Refunding Bonds are detailed in the Other Supplementary Information section.
B) Through December 2016, the City and the Water Department had drawdowns totaling $2,457,889, which represent new loans from the Pennsylvania State Infrastructure Financing Authority (“PENNVEST”) for water treatment and sewer piping replacement.
C) The City of Philadelphia (the “City”), through the Procurement Department, Water Department (“PWD” or “Department”) and the Water Revenue Bureau, are soliciting proposals from qualified vendors to provide an advanced metering infrastructure (“AMI”) system for water meters. The project will include: providing project management; installation of new AMI meter interface units (“MIUs”); fixed data collection units or other methods to retrieve the data transmitted from the MIUs; software to manage the data and make it available to the City’s Basis2 customer information and billing system as well as City employees and customers; integration of that software with the City’s existing systems; training, documentation, and product support. The City does not intend to replace all of the water meters during the initial installation phase of the new AMI system; however, the City may replace some of the existing water meters as needed. PWD expects the initial installation phase to be three years and the field deployment period to take 24 months. The project may also include the provision of hosted and managed services over several years.

Required Supplementary Information

CITY OF PHILADELPHIA WATER DEPARTMENT
BUDGETARY COMPARISON SCHEDULE
Water Operating Fund
For the Fiscal Year Ended June 30, 2016
(Legally Enacted Basis)
Final Budget
Revenues to Actual
Positive
Original Final Actual (Negative)
Locally Generated Non-Tax Revenue 630,701$ 630,979$ 643,035$ 12,056$
Revenue from Other Governments 975 744 744 -
Revenue from Other Funds 105,638 87,233 36,756 (50,477)
Total Revenues 737,314$ 718,956$ 680,535$ (38,421)$
Expenditures and Encumbrances
Personal Services 126,121 126,131 118,415 7,716
Pension Contributions 57,800 59,115 59,115 -
Other Employee Benefits 53,115 51,790 47,276 4,514
Sub-Total Employee Compensation 237,036 237,036 224,806 12,230
Purchase of Services 177,090 177,090 148,989 28,101
Materials and Supplies 49,037 48,849 42,799 6,050
Equipment 5,407 5,595 2,722 2,873
Contributions, Indemnities and Taxes 6,605 6,605 5,441 1,164
Debt Service 227,139 227,139 219,133 8,006
Payments to Other Funds 65,000 65,000 60,733 4,267
Advances and Other Miscellaneous Payments - - - -
Total Expenditures and Encumbrances 767,314 767,314 704,623 62,691
Operating Surplus (Deficit) for the Year (30,000)$ (48,358)$ (24,088)$ 24,270$
Fund Balance Available, July 1, 2015 - - - -
Operations in Respect to Prior Fiscal Years
Commitments Cancelled - Net 30,000 30,000 24,088 (5,912)
Prior Period Adjustments - - - -
Adjusted Fund Balance, July 1, 2015 30,000 30,000 24,088 (5,912)
Fund Balance Available, June 30, 2016 -$ (18,358)$ -$ 18,358$
73
(Thousands of Dollars)
Budgeted Amounts

74
CITY OF PHILADELPHIA OTHER POST EMPLOYMENT BENEFITS SCHEDULE OF FUNDING PROGRESS FISCAL YEAR ENDED JUNE 30, 2016 (Amounts in Millions of USD)
Actuarial
Valuation
Date
Actuarial
Value of
Assets
Actuarial
Accrued
Liability
(AAL)
Unfunded
AAL
(UAAL)
Funded
Ratio
Covered
Payroll
UAAL as a
Percentage
of Covered
Payroll
(a) (b) (b - a) (a / b) (c) (b - a) / c
City of Philadelphia Other Post Employment Benefits
07/01/2008 - $ 1,156.0 $ 1,156.0 0.00% $ 1,456.5 79.37% 07/01/2009 - 1,119.6 1,119.6 0.00% 1,461.7 76.60% 07/01/2010 - 1,169.5 1,169.5 0.00% 1,419.5 82.39% 07/01/2011 - 1,212.5 1,212.5 0.00% 1,469.2 82.53% 07/01/2012 - 1,511.9 1,511.9 0.00% 1,371.6 110.23% 07/01/2013 - 1,703.6 1,703.6 0.00% 1,416.9 120.23% 07/01/2014 - 1,732.1 1,732.1 0.00% 1,495.1 115.85% 07/01/2015 - 1,772.6 1,772.6 0.00% 1,544.5 114.80%
This schedule represents the other post employment benefits plan of the City of Philadelphia. The
Water Department is a department of the City of Philadelphia.

MUNICIPAL PENSION PLAN
Schedule of Changes in Net Pension Liability
Fiscal Year Ending June 30, 2016, 2015, and 2014
June 30, 2016 June 30, 2015 June 30, 2014Total Pension Liability
Service Cost (MOY) 148,370,075$ 143,556,347$ 136,986,515$ Interest (Includes Interest on Service Cost) 802,450,569 791,298,503 774,518,750 Changes of Benefit Terms - - - Differences Between Expected and Actual Experience 151,918,733 34,909,464 - Change of Assumptions 85,147,737 48,146,352 213,156,725 Benefit Payments, Including Refund of Member Contributions (889,343,124) (881,464,964) (808,597,357)
Net Change in Total Pension Liability 298,543,990$ 136,445,702$ 316,064,633$ Total Pension Liability - Beginning 10,578,665,968 10,442,220,266 10,126,155,633
Total Pension Liability - Ending 10,877,209,958$ 10,578,665,968$ 10,442,220,266$
Plan Fiduciary Net Position
Contributions - Employer 660,246,511$ 577,195,412$ 553,178,927$ Contributions - Member 67,055,003 58,657,817 53,722,275 Net Investment Income (145,681,480) 13,838,367 681,469,584 Benefit Payments, Including Refunds of Member Contributions (889,343,124) (881,666,036) (808,597,357) Administrative Expense (8,553,837) (10,478,541) (8,291,820)
Net Change in Plan Fiduciary Net Position (316,276,927)$ (242,452,981)$ 471,481,609$ Plan Fiduciary Net Position - Beginning 4,674,252,416 4,916,705,397 4,445,223,788
Plan Fiduciary Net Position - Ending 4,357,975,073$ 4,674,252,416$ 4,916,705,397$
Net Pension Liability - Ending 6,519,234,885$ 5,904,413,552$ 5,525,514,869$
Plan Fiduciary Net Position as a Percentage of the Total Pension Liability 40.07% 44.19% 47.08%
Covered-Employee Payroll 1,676,411,925$ 1,597,848,869$ 1,556,660,223$
Net Pension Liability as a Percentage of Covered-Employee Payroll 388.88% 369.52% 354.96%
This schedule represents the changes in net pension liability of the Municipal Pension Plan. The entities within the Municipal Pension Plan are the City of Philadelphia, the Philadelphia Parking Authority, Philadelphia Municipal Authority, and the Philadelphia Housing Development Corporation.The Water Department is a department of the City of Philadelphia.
75
Schedule of Changes in Net Pension Liability
Fiscal Year Ending

MUNICIPAL PENSION PLAN
Schedules of Collective Contributions - Last 10 Years
FYE 2016 FYE 2015 FYE 2014 FYE 2013 FYE 2012 FYE 2011 FYE 2010 FYE 2009 FYE 2008 FYE 2007
Actuarially Determined Contribution 594,975$ 556,030$ 523,368$ 727,604$ 534,039$ 463,375$ 297,446$ 438,522$ 412,449$ 400,256$
Contributions in Relation to the Actuarially
Determined Contribution 660,246 577,195 553,179 781,823 555,690 470,155 312,556 455,389 426,934 432,267
Contribution Deficiency/(Excess) (65,271)$ (21,165)$ (29,811)$ (54,219)$ (21,651)$ (6,780)$ (15,110)$ (16,867)$ (14,485)$ (32,011)$
Covered-Employee Payroll* 1,676,412$ 1,597,849$ 1,495,421$ 1,429,723$ 1,372,174$ 1,371,274$ 1,421,151$ 1,463,260$ 1,456,520$ 1,351,826$
Contributions as a Percentage of
Covered-Employee Payroll 39.38% 36.12% 36.99% 54.68% 40.50% 34.29% 21.99% 31.12% 29.31% 31.98%
FYE 2016 FYE 2015 FYE 2014 FYE 2013 FYE 2012 FYE 2011 FYE 2010 FYE 2009 FYE 2008 FYE 2007
Actuarially Determined Contribution 846,283$ 798,043$ 823,885$ 738,010$ 722,491$ 715,544$ 581,123$ 539,464$ 536,874$ 527,925$
Contributions in Relation to the Actuarially
Determined Contribution 660,247 577,195 553,179 781,823 555,690 470,155 312,556 455,389 426,934 432,267
Contribution Deficiency/(Excess) 186,036$ 220,848$ 270,706$ (43,813)$ 166,801$ 245,389$ 268,567$ 84,075$ 109,940$ 95,658$
Covered-Employee Payroll* 1,676,412$ 1,597,849$ 1,495,421$ 1,429,723$ 1,372,174$ 1,371,274$ 1,421,151$ 1,463,260$ 1,456,520$ 1,351,826$
Contributions as a Percentage of
Covered-Employee Payroll 39.38% 36.12% 36.99% 54.68% 40.50% 34.29% 21.99% 31.12% 29.31% 31.98%
This schedule represents the collective contributions of the Municipal Pension Plan. The entities within the Municipal Pension Plan are the City of Philadelphia, the Philadelphia Parking Authority, Philadelphia Municipal Authority, and the Philadelphia Housing
Development Corporation. The Water Department is a department of the City of Philadelphia.
76
Schedule of Collective Contributions (Based on Minimum Municipal Obligation)
(Thousands of Dollars)
Schedule of Collective Contributions (Based on Funding Policy)
(Thousands of Dollars)
Last 10 Fiscal Years
Last 10 Fiscal Years

MUNICIPAL PENSION PLAN
Schedules of Collective Contributions - Last 10 Years
Notes to Schedules of Collective Contributions
Valuation Date July 1, 2014
Timing Actuarially determined contribution rates are calculated based on the actuarial valuation two years prior to the beginning of the plan year
Key Methods and Assumptions Used to Determine Contribution Rates
Actuarial Cost Method Entry AgeAsset Valuation Method Ten-year smoothed market
Amortization Method Gain/Losses are amortized over closed 20-year periods, assumption changes over 15 years, benefit changes for actives over 10 years,
benefit changes for inactives members over 1 year, plan changes mandated by the State over 20 years
Under the City's Funding Policy, the initial July 1, 1985 unfunded actuarial liability (UAL) is amortized over a 34 year period ending
June 30, 2019 with payments increasing 3.3% per year, the assumed payroll growth
Under the MMO Funding Policy, the July 1, 2009 unfunded actuarial liability (UAL) was "fresh started" to be amortized over a
30 year period, ending June 30, 2039. This is a level dollar amortization of the UAL.
Discount Rate 7.80%
Amortization Growth Rate 3.30%
Salary Increases Age based salary scaleMortality Sex distinct RP-2000 Combined Mortality with adjustments and improvements using Scale AA
A complete description of the methods and assumptions used to determine contribution rates for the year ending June 30, 2016 can be found in the July 1, 2014 actuarial valuation report.
77

Other Supplementary Information
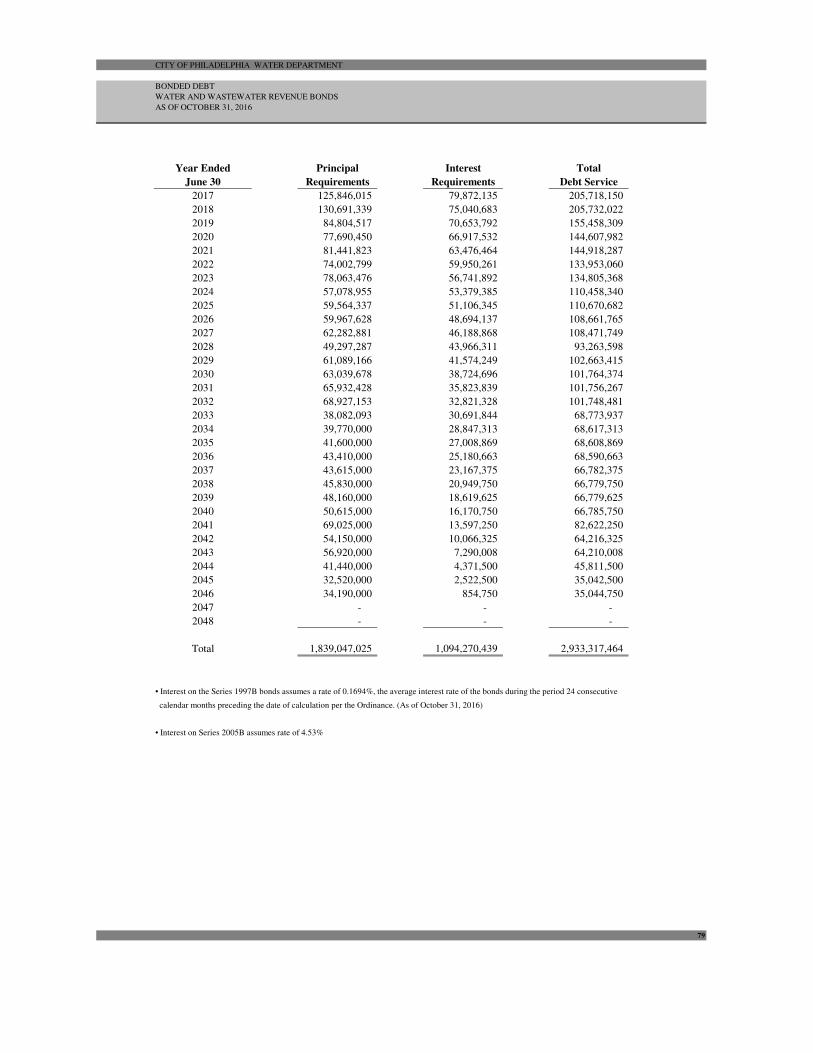
CITY OF PHILADELPHIA WATER DEPARTMENT
BONDED DEBT
WATER AND WASTEWATER REVENUE BONDS
AS OF OCTOBER 31, 2016
Year Ended Principal Interest Total
June 30 Requirements Requirements Debt Service
2017 125,846,015 79,872,135 205,718,150
2018 130,691,339 75,040,683 205,732,022
2019 84,804,517 70,653,792 155,458,309
2020 77,690,450 66,917,532 144,607,982
2021 81,441,823 63,476,464 144,918,287
2022 74,002,799 59,950,261 133,953,060
2023 78,063,476 56,741,892 134,805,368
2024 57,078,955 53,379,385 110,458,340
2025 59,564,337 51,106,345 110,670,682
2026 59,967,628 48,694,137 108,661,765
2027 62,282,881 46,188,868 108,471,749
2028 49,297,287 43,966,311 93,263,598
2029 61,089,166 41,574,249 102,663,415
2030 63,039,678 38,724,696 101,764,374
2031 65,932,428 35,823,839 101,756,267
2032 68,927,153 32,821,328 101,748,481
2033 38,082,093 30,691,844 68,773,937
2034 39,770,000 28,847,313 68,617,313
2035 41,600,000 27,008,869 68,608,869
2036 43,410,000 25,180,663 68,590,663
2037 43,615,000 23,167,375 66,782,375
2038 45,830,000 20,949,750 66,779,750
2039 48,160,000 18,619,625 66,779,625
2040 50,615,000 16,170,750 66,785,750
2041 69,025,000 13,597,250 82,622,250
2042 54,150,000 10,066,325 64,216,325
2043 56,920,000 7,290,008 64,210,008
2044 41,440,000 4,371,500 45,811,500
2045 32,520,000 2,522,500 35,042,500
2046 34,190,000 854,750 35,044,750
2047 - - -
2048 - - -
Total 1,839,047,025 1,094,270,439 2,933,317,464
• Interest on the Series 1997B bonds assumes a rate of 0.1694%, the average interest rate of the bonds during the period 24 consecutive
calendar months preceding the date of calculation per the Ordinance. (As of October 31, 2016)
• Interest on Series 2005B assumes rate of 4.53%
79

CITY OF PHILADELPHIA WATER DEPARTMENT
SUPPLEMENTAL SCHEDULE OF RATE COVENANT COMPLIANCE FOR FISCAL YEARS ENDED
JUNE 30, 2016, 2015, AND 2014 (Legally Enacted Basis)
(amounts in thousands)
LINE
NO. 2016 2015 2014
1. Total Revenue 678,906$ 676,846$ 643,019$
2. Net Operating Expense (433,025) (426,767) (410,797)
2a Commitments Cancelled (formerly fund balance) 24,088 19,389 37,436
2b Adjustment between Debt Service and Net Operating Expenses due to timing differences 339 4,470 -
3. Transfer (To) From Rate Stabilization Fund 1,629 (21,456) (22,925)
4. Net Revenues 271,937 252,482 246,733
5. Revenue Bonds Outstanding (219,304) (205,270) (201,710)
6. General Obligation Bonds Outstanding - - -
7. Pennvest Loan - - -
8. Total Debt Service (219,304) (205,270) (201,710)
9. Net Revenue after Debt Service 52,633 47,212 45,023
10. Transfer to General Fund - - -
11. Transfer to Capital Fund (21,497) (20,705) (20,194)
12. Transfer to Residual Fund (31,136) (26,507) (24,829)
13. Total Transfers (52,633) (47,212) (45,023)
14. Net Operating Balance for Current Year -$ -$ -$
The rate covenant contained in the General Ordinance requires the City to establish rates and charges for the use of the Water and Wastewater Systems
sufficient to yield Net Revenues, as defined therein, in each fiscal year at least equal to 120%(coverage A) of the Debt Service Requirements for such fiscal year
(excluding debt service due on any Subordinated Bonds). In addition, Net Revenues, in each fiscal year, must equal at least 100%(coverage B) of : (i) the Debt Service
Requirements (including Debt Service Requirements in respect of Subordinated Bonds) payable is such fiscal year; (ii) amounts required to be deposited
of Subordinated Bonds payable in such fiscal year; (ii) amounts required to be deposited into the Debt Reserve Account during such fiscal year;
(iii) debt service on all General Obligations Bonds issued for the Water and Wastewater Systems payable is such fiscal year; (iv) debt service payable on
Interim Debt in such fiscal year; and (v) the Capital Account Deposit Amount for such fiscal year, less amounts transferred from the Residual Fund
to the Capital Account during such fiscal year. To insure compliance with the rate covenant, the General Ordinance requires that the City review its rates,
rents, fees, and charges at least annually.
Additional Rate Covenant. As long as the Insured Bonds are outstanding, the City covenants to establish rates and charges for the use of the
System sufficient to yield Net Revenues (excluding amounts transferred from the Rate Stabilization Fund into the Revenue Fund during, or as
of the end of, such fiscal year) at least equal to 90% (coverage C) of the Debt Service Requirements (excluding debt service on any Subordinated Bonds)
in such fiscal year.
COVERAGE A:
2016 2015 2014
Line 4 271,937$ 252,482$ 246,733$
/ Line 5 219,304$ 205,270$ 201,710$
= COVERAGE A: 1.24 1.23 1.22
2016 2015 2014
Line 4 271,937$ 252,482$ 246,733$
/ Line 8 + Line 11 240,801$ 225,975$ 221,904$
= COVERAGE B: 1.13 1.12 1.11
2016 2015 2014
Line 4 - Line 3 270,308$ 273,938$ 269,658$
/ Line 5 219,304$ 205,270$ 201,710$
= COVERAGE C: 1.23 1.33 1.34
80
COVERAGE B:
COVERAGE C:
YEAR ENDED JUNE 30

CITY OF PHILADELPHIA WATER DEPARTMENT
RECONCILIATION OF LEGALLY ENACTED AND GAAP BASIS OPERATING REVENUES
AND EXPENSES
JUNE 30, 2016
(amounts in thousands)
Legal Basis of Accounting Revenues
Legal Basis Revenues 680,535$
GAAP Adjustments
Reverse Fiscal Year 2015 Accounts Receivable Accrual (37,898)
Record Fiscal Year 2016 Accounts Receivable Accrual 38,015
Accounts Receivable Adjustment (7,919)
Allowance for Doubtful Accounts Adjustment (72)
Record Fiscal Year 2016 Grants Receivable Accrual 125
Reclassification of Interest Income to Nonoperating Revenue (1,966)
Total GAAP Adjustments (9,715)
Total GAAP Basis Operating Revenues 670,820$
Legal Basis of Accounting Expenses
Legal Basis Expenses 704,623$
GAAP Adjustments
Expense in Fiscal Year 2016, included in Fiscal Year 2015
for Legal Basis 30,526
Encumbrances in Fiscal Year 2016, included in Fiscal Year 2016
for Legal Basis (59,747)
Depreciation on Capital Assets, not included for Legal Basis 105,111
Payments among Water Department Funds, netted for GAAP Basis (60,733)
Accrual of Probable Indemnities and Worker's Compensation Expenses 2,507
Reclassification of Transfers Out to Nonoperating Expenses (27,321)
Allocation of Interfund Activity 8,100
Allocation of Accrued Expenses (1,425)
Change in Inventory Balance as of June 30, 2016 (1,593)
Elimination of Legal Basis Net Position Adjustments 760
Net Pension Expense, included in GAAP Basis 8,709
Removal of Debt Service Principal Payments, included in Legal Basis (219,133)
Net Adjustments from Capitalization of Capital Assets (3,586)
Removal of Legal Basis Compensated Absences Expense and
Increase in Compensated Absence Liability 343
Amortization of Prepaid Surety Bond Insurance 180
Refund of Prior Year Revenue (Capital Fund) 62
Total GAAP Adjustments (217,240)
Total GAAP Basis Operating Expenses 487,383$
81

CITY OF PHILADELPHIA WATER DEPARTMENT
CAPITAL IMPROVEMENT PROGRAM BUDGET FOR FISCAL
YEARS ENDED JUNE 30, 2018 THROUGH JUNE 30, 2023 (Legally Enacted Basis)
Capital Budget Summary 2018 2019 2020 2021 2022 2023 Total
Collector System/Flood Relief 51,560,000$ 51,560,000$ 51,560,000$ 66,560,000$ 66,560,000$ 66,560,000$ 354,360,000$
Collector System COA LTCP Related 56,340,000 56,340,000 56,340,000 61,600,000 77,390,000 77,390,000 385,400,000
Conveyance System 75,060,000 77,060,000 79,060,000 61,060,000 63,060,000 65,060,000 420,360,000
Engineering Admin. & Material Support 50,698,000 51,769,000 52,872,000 54,008,000 55,178,000 56,384,000 320,909,000
Water & Wastewater Facilities 100,000,000 100,000,000 100,000,000 100,000,000 100,000,000 100,000,000 600,000,000
Wastewater Treatment Facilities COA LTCP Related 20,000,000 20,000,000 20,000,000 20,000,000 20,000,000 20,000,000 120,000,000
Sub Total Non COA LTCP 277,318,000 280,389,000 283,492,000 281,628,000 284,798,000 288,004,000 1,695,629,000
Sub Total COA LTCP 76,340,000 76,340,000 76,340,000 81,600,000 97,390,000 97,390,000 505,400,000
Total 353,658,000$ 356,729,000$ 359,832,000$ 363,228,000$ 382,188,000$ 385,394,000$ 2,201,029,000$
COA = Consent Order & Agreement
LTCP = Long Term Control Plan
82
YEAR ENDED JUNE 30
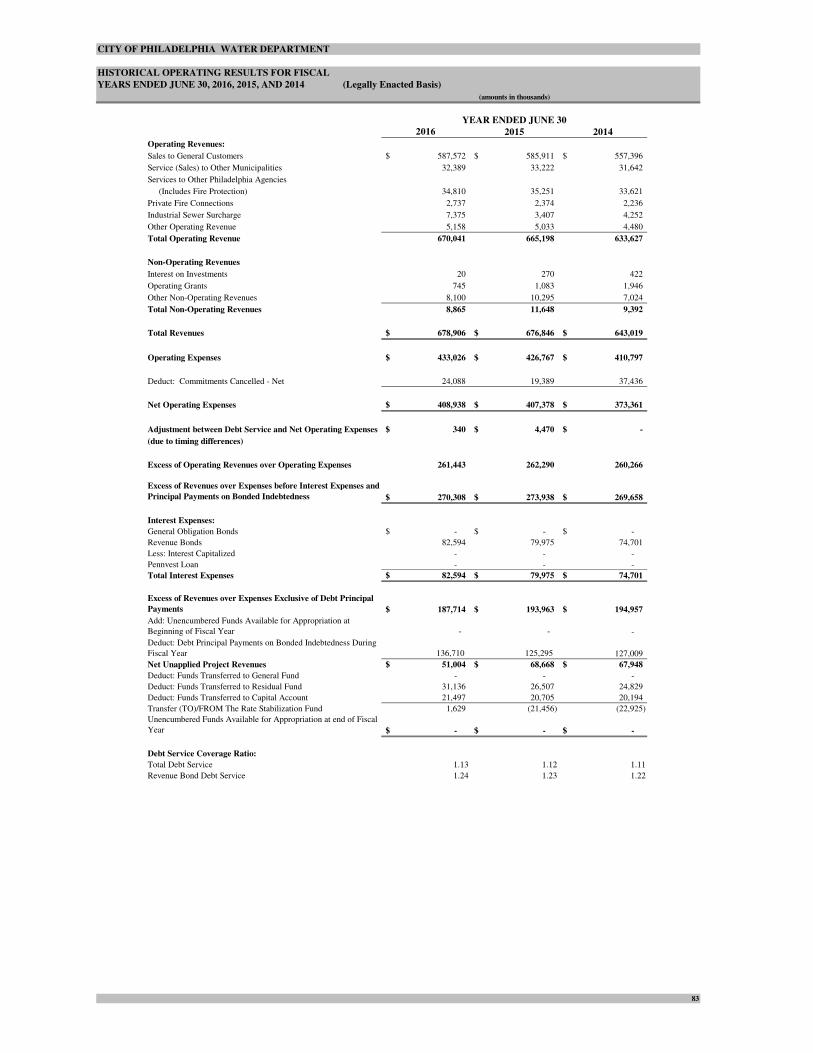
CITY OF PHILADELPHIA WATER DEPARTMENT
HISTORICAL OPERATING RESULTS FOR FISCAL
YEARS ENDED JUNE 30, 2016, 2015, AND 2014 (Legally Enacted Basis)
(amounts in thousands)
2016 2015 2014
Operating Revenues:
Sales to General Customers 587,572$ 585,911$ 557,396$
Service (Sales) to Other Municipalities 32,389 33,222 31,642
Services to Other Philadelphia Agencies
(Includes Fire Protection) 34,810 35,251 33,621
Private Fire Connections 2,737 2,374 2,236
Industrial Sewer Surcharge 7,375 3,407 4,252
Other Operating Revenue 5,158 5,033 4,480
Total Operating Revenue 670,041 665,198 633,627
Non-Operating Revenues
Interest on Investments 20 270 422
Operating Grants 745 1,083 1,946
Other Non-Operating Revenues 8,100 10,295 7,024
Total Non-Operating Revenues 8,865 11,648 9,392
Total Revenues 678,906$ 676,846$ 643,019$
Operating Expenses 433,026$ 426,767$ 410,797$
Deduct: Commitments Cancelled - Net 24,088 19,389 37,436
Net Operating Expenses 408,938$ 407,378$ 373,361$
Adjustment between Debt Service and Net Operating Expenses 340$ 4,470$ -$
(due to timing differences)
Excess of Operating Revenues over Operating Expenses 261,443 262,290 260,266
Excess of Revenues over Expenses before Interest Expenses and
Principal Payments on Bonded Indebtedness 270,308$ 273,938$ 269,658$
Interest Expenses:
General Obligation Bonds -$ -$ -$
Revenue Bonds 82,594 79,975 74,701
Less: Interest Capitalized - - -
Pennvest Loan - - -
Total Interest Expenses 82,594$ 79,975$ 74,701$
Excess of Revenues over Expenses Exclusive of Debt Principal
Payments 187,714$ 193,963$ 194,957$
Add: Unencumbered Funds Available for Appropriation at
Beginning of Fiscal Year - - -
Deduct: Debt Principal Payments on Bonded Indebtedness During
Fiscal Year 136,710 125,295 127,009
Net Unapplied Project Revenues 51,004$ 68,668$ 67,948$
Deduct: Funds Transferred to General Fund - - -
Deduct: Funds Transferred to Residual Fund 31,136 26,507 24,829
Deduct: Funds Transferred to Capital Account 21,497 20,705 20,194
Transfer (TO)/FROM The Rate Stabilization Fund 1,629 (21,456) (22,925)
Unencumbered Funds Available for Appropriation at end of Fiscal
Year -$ -$ -$
Debt Service Coverage Ratio:
Total Debt Service 1.13 1.12 1.11
Revenue Bond Debt Service 1.24 1.23 1.22
83
YEAR ENDED JUNE 30