city of lodi, california comprehensive annual financial ... · city of lodi, california...
TRANSCRIPT

CITY OF LODI, CALIFORNIA
COMPREHENSIVE ANNUAL FINANCIAL REPORT
Year Ended June 30, 2017
DOUG KUEHNE, MAYOR
ALAN NAKANISHI, MAYOR PRO TEM
MARK CHANDLER, COUNCILMEMBER
BOB JOHNSON, COUNCILMEMBER
JOANNE MOUNCE, COUNCILMEMBER
STEVE SCHWABAUER, CITY MANAGER
Prepared by the Financial Services Division
Derrick Cotten, Financial Services Manager
Robin Xiang, Supervising Accountant

INTRODUCTORY SECTION

CITY OF LODICOMPREHENSIVE ANNUAL FINANCIAL REPORTFOR THE YEAR ENDED JUNE 30, 2017
TABLE OF CONTENTS
i
INTRODUCTORY SECTIONTable of Contents iLetter of Transmittal vCertificate of Achievement for Excellence in Financial Reporting xivOrganization Chart of the City of Lodi xvDirectory of Officials and Advisory Bodies xvi
FINANCIAL SECTIONIndependent Auditor's Report 1
MANAGEMENT'S DISCUSSION AND ANALYSIS 3
BASIC FINANCIAL STATEMENTSGovernment-wide Financial Statements:
Statement of Net Position 17Statement of Activities 18
Fund Financial Statements: 19Balance Sheet – Governmental Funds 23Reconciliation of the Balance Sheet of Governmental Funds to the Statement of Net Position 24Statement of Revenues, Expenditures, and Changes in Fund Balances – Governmental Funds 25Reconciliation of the Statement of Revenues, Expenditures, and Changes in Fund Balances of Governmental Funds to the Statement of Activities 26Statement of Net Position – Proprietary Funds 27Statement of Revenues, Expenses, and Changes in Net Position – Proprietary Funds 28Statement of Cash Flows – Proprietary Funds 29Statement of Fiduciary Net Position – Fiduciary Funds 31Statement of Change in Fiduciary Net Position - Private-Purpose Trust Funds 32
Notes to Basic Financial Statements 33
REQUIRED SUPPLEMENTARY INFORMATIONSchedule of Changes in Net Pension Liability and Related Ratios - Miscellaneous Plan 87Schedule of Changes in Net Pension Liability and Related Ratios - Safety Plan 88Schedule of Pension Contributions 89Schedule of Funding Progress – OPEB Plan 90Schedule of Revenues, Expenditures, and Changes in Fund Balance – Budget and Actual – General Fund 91Schedule of Revenues, Expenditures, and Changes in Fund Balance – Budget and Actual – Streets Fund 92Note to the Required Supplementary Information 93

CITY OF LODICOMPREHENSIVE ANNUAL FINANCIAL REPORTFOR THE YEAR ENDED JUNE 30, 2017
TABLE OF CONTENTS - continued
ii
COMBINING AND INDIVIDUAL FUND STATEMENTS AND SCHEDULESCombining Balance Sheet – Nonmajor Governmental Funds 95Combining Statement of Revenues, Expenditures, and Changes in Fund Balances – Nonmajor Governmental Funds 96Nonmajor Governmental Funds - Special Revenue Funds 97Combining Balance Sheet – Nonmajor Governmental Funds – Special Revenue Funds 99Combining Statement of Revenues, Expenditures, and Changes in Fund Balances – Nonmajor Governmental Funds – Special Revenue Funds 100Schedules of Revenues, Expenditures, and Changes in Fund Balances – Budget and Actual – Nonmajor Governmental Funds – Special Revenue Funds:
Parks, Recreation, and Community Services Fund 101Public Safety Fund 102Community Development Fund 103Transportation Fund 104HOME Program and Community Development Block Grants Fund 105
Nonmajor Governmental Funds - Capital Project Funds 107Combining Balance Sheet – Nonmajor Governmental Funds – Capital Project Funds 108Combining Statement of Revenues, Expenditures, and Changes in Fund Balances – Nonmajor Governmental Funds – Capital Project Funds 109Internal Service Funds 111Combining Statement of Net Position - Internal Service Funds 112Combining Statement of Revenues, Expenses, and Changes in Net Position – Internal Service Funds 113Combining Statement of Cash Flows - Internal Service Funds 114Combining Statement of Fiduciary Net Position - Private-Purpose Trust Funds 115Combining Statement of Changes in Fiduciary Net Position - Private-Purpose Trust Funds 116Statement of Changes in Assets and Liabilities - Agency Fund 117

CITY OF LODICOMPREHENSIVE ANNUAL FINANCIAL REPORTFOR THE YEAR ENDED JUNE 30, 2017
TABLE OF CONTENTS - continued
iii
STATISTICAL SECTION (UNAUDITED) 119Government-wide information:
Net Position by Component - Last Ten Fiscal Years 120Changes in Net Position - Last Ten Fiscal Years 121
Fund information:Fund Balances, Governmental Funds - Last Ten Fiscal Years 123Changes in Fund Balances of Governmental Funds - Last Ten Fiscal Years 124
Tax Revenues by Source, Governmental Funds - Last Ten Fiscal Years 126Assessed Value and Estimated Actual Value of Taxable Property - Last Ten Fiscal Years 127Direct and Overlapping Property Tax Rates - Last Ten Fiscal Years 128Principal Property Taxpayers -Current Year and Nine Years Ago 129Property Tax Levies and Collections - Last Ten Fiscal Years 130Electricity Sold by Type of Customer - Last Ten Fiscal Years 131Ratios of Outstanding Debt by Type - Last Ten Fiscal Years 132Ratios of General Bonded Debt Outstanding- Last Ten Fiscal Years 133Legal Debt Margin Information - Last Ten Fiscal Years 134Direct and Overlapping Governmental Activities Debt 135Pledged-Revenue Coverage - Last Ten Fiscal Years 136Demographic and Economic Statistics - Last Ten Fiscal Years 139Principal Employers - Current Year and Nine Years Ago 140Full-Time Equivalent City Government Employees By Department - Last Ten Fiscal Years 141Operating Indicators by Function/Program/Department - Last Ten Fiscal Years 142Capital Asset Statistics by Function/Program/Department - Last Ten Fiscal Years 144
SINGLE AUDIT REPORTSIndependent Auditor's Report on Internal Control Over Financial Reporting and on Compliance and Other Matters Based on an Audit of Financial Statements Performed in Accordance With Government Auditing Standards 147Independent Auditor's Report on Compliance for the Major Federal Program and Report on Internal Control Over Compliance Required by the Uniform Guidance 149Schedule of Expenditures of Federal Awards 151Notes to the Schedule of Expenditures of Federal Awards 152Schedule of Findings and Questioned Costs 153Summary Schedule of Prior Audit Findings 155
CONTINUING DISCLOSURES (UNAUDITED)Annual Report for Electric Utility 157Annual Report for Wastewater Utility 163Annual Report for the Lodi Public Financing Authority 170Annual Report for Water Utility 173

(This page intentionally left blank.)

v
CITY COUNCIL
DOUG KUEHNE, Mayor ALAN NAKANISHI, Mayor Pro Tempore COUNCILMEMBERS: MARK CHANDLER BOB JOHNSON JOANNE MOUNCE
C I T Y O F L O D I
CITY HALL, 221 WEST PINE STREET P.O. BOX 3006
LODI, CALIFORNIA 95241-1910 (209) 333-6706
FAX (209) 333-6795
STEVE SCHWABAUER City Manager
JENNIFER FERRAIOLO
City Clerk
JANICE MAGDICH City Attorney
December 12, 2017 To the Honorable Mayor, Members of the City Council of the City of Lodi: The Comprehensive Annual Financial Report (CAFR) for the year ended June 30, 2017, is hereby submitted. This report is provided to present the financial position, changes in financial position, and where applicable, cash flows of the City of Lodi (City) as of and for the year ended June 30, 2017, in conformity with accounting principles generally accepted in the United States of America (GAAP). The report conforms to the highest standards of financial reporting as established by the Governmental Accounting Standards Board (GASB), for reporting by state and local governments. The responsibility for the accuracy, fairness and completeness of the report rests with the City. This report consists of management’s representations concerning the finances of the City. Consequently, management assumes full responsibility for the completeness and reliability of all the information presented in this report based on a comprehensive internal control framework established for this purpose. We believe that the information is accurate in all material respects, and that it is presented in a manner designed to fairly present the financial position and changes in financial position of the City. In addition, we believe that all disclosures necessary to enable the reader to gain a full understanding of the City’s financial activities have been included. This letter of transmittal is designed to complement the Management’s Discussion and Analysis (MD&A) and should be read in conjunction with it. The MD&A can be found immediately following the independent auditor’s report. THE REPORTING ENTITY AND SERVICES PROVIDED The funds included in the CAFR are those deemed dependent upon the City and controlled by the City Council and reflect the City’s financial reporting entity in accordance with GASB Statement No.14, as amended by GASB Statement Nos. 61 and 80. The City was incorporated December 6, 1906, as a municipal corporation under the general laws of the State of California. The City operates under a Council-Manager form of government. Under the Council-Manager form of government, policy making and legislative authority are entrusted to the City Council. The City Council consists of five members elected at-large by its voters for four-year terms, with no term limits. Elections are held in November of even-numbered years. Each year the Mayor and Mayor Pro-Tempore are chosen by the members of the City Council. The Mayor presides at Council meetings and acts as the ceremonial head of the City, the Mayor Pro Tempore serves as Mayor in his or her absence. The City

vi
Manager is responsible for carrying out the policies and ordinances of the City Council, for appointing department heads, and overseeing the operations of the City. The City Manager, City Attorney and the City Clerk are appointed by the City Council. The City provides a wide range of municipal services including public protection (police and fire), public utilities services (electric, water, and wastewater), public works, transit services, parks and recreation, library, community development, and general government (City Manager, City Clerk, City Attorney, human resources, information systems, financial services, and budget and treasury). Several municipal services are provided through other government agencies, private companies or public utility companies, including: Number of Facilities Elementary and Secondary Schools 18 Sanitation (solid waste) and Cable Television 3 Ambulance 1 Gas and Telephone 2 ECONOMIC CONDITION AND OUTLOOK The City of Lodi is located in California’s fertile San Joaquin Valley, adjacent to State Highway Route 99, between Stockton, 10 miles to the south, and Sacramento, 35 miles to the north. The City population is estimated to be approaching 65,000 and is contained in an area of 13.98 square miles. The City has grown steadily since incorporation in 1906. The City’s growth is provided for in both the General Plan and the City’s Growth Management Allocation Ordinance that allows an increase in population of 2% per year until the growth limits are reached. The City is built on a strong and diverse local economy. Lodi is best known for its Zinfandel wines; however, Lodi is an authentic and dynamic wine region with more than 80 wineries within 10 miles of downtown. The City’s employment base is just as diverse with industry that includes agribusiness, biotechnology, distribution, food and beverage product manufacturing, general service, government, health care, heavy manufacturing, and ,of course, wine based tourism and lodging. In addition, the City has a wide range of small, financially sound businesses that add to the economic strength of the City. These companies range in size from 10 to 150 employees and produce a wide variety of products, services and commodities. The City is growing and over the last few years it has seen significant new commercial, industrial and residential development projects come to fruition. Hundreds of new homes have already been constructed and hundreds more are entitled. The City’s first market rate apartment complex in over 25 years is being completed along with an age restricted apartment complex. Combined with the ever growing strength of the wine grape and tourism industries is a positive indicator for the City moving forward. The City’s focus on economic development, compact development and quality of life has encouraged these investments within the City, collectively creating hundreds of new employment and housing opportunities.

vii
The most difficult budget issue facing the City is the California Public Employees’ Retirement System (CalPERS) funding crisis. The City is well aware of this challenge and is taking aggressive steps to address this concern. More details can be found in the Economic Factors and Next Year’s Budget section of the Management’s Discussion and Analysis in this report. Economic Development The City continues to be committed to promoting economic development (business retention and attraction) and expanding the tax base to fund City services rather than increase taxes to pay for these services. The City has provided for additional retail sales and commercial activity with approval of new retail developments adjacent to Highway 99 and Harney Lane in the southeast corner of the City, and with a large retail development in the southwest corner of the City. In 2017, steady progress toward buildout and occupancy of the new retail development has occurred and that is expected to continue into 2018. Tourism continues to be a major driving factor of the local economy. The City currently has three approved hotel sites, one with an issued building permit, and the two others with permits ready or near ready for issuance. Additional progress on all three projects is expected in 2018. MAJOR GOALS, OBJECTIVES AND PROJECTS To assist the citizens of the City in understanding where the City intends to allocate available resources, the City Council, the City Manager and Department Heads established in 2004 a hierarchy of major aspirational goals, objectives and major projects that support and re-enforce the City’s mission statement. Council then set project specific goals at a series of workshops in 2016. 1.) Aspirational Goals Four major City goals were established as policy direction and focal points for the efforts of City staff. These goals include: Ensure a High Quality of Life and a Safe Environment for Citizens Ensure Efficient and Productive City Organization Ensure Public Trust, and Ensure the Development of the Lodi Economy for a Fiscally Sound City Organization City Council, the City Manager and Department Heads established nineteen major City objectives: Maintain City’s Sense of Community Provide Employee Training and Education Provide for a Balanced Community Evaluate Telecommunications Opportunities Enhance Access through Implementation of IT Strategic Plan Provide Resources to Maintain City’s Infrastructure Promote Urban Forestry Promote Public Relations and Marketing Efforts Attract, Retain and Invest in a Quality City Work Force Ensure Open and Accessible Public Meetings Encourage Public Arts, Cultural and Recreational Opportunities Pursue Efforts to be Entrepreneurial Provide Appropriate and Sufficient City Facilities Improve Customer Service Develop Short and Long Range Operational Plans Continue to use Partnerships to Advance City’s Objectives Develop Effective Records Management Program Provide a Balanced Budget and Adhere to Adopted Policies Promote Commercial/Industrial Base

viii
2.) Project Specific Goals Projects represent the foundation of the planning statements for the City. These projects are designed to accomplish specific objectives and become the focus for organization-wide effort. Council set the following priorities and categories in 2016: Economic development for “shovel ready” land Economic development and incentive program to focus on underutilized parcels Public Safety, Gang Reduction Intervention Program, training and increase in staffing Fiscal sustainability, asset preservation, CALPERS and Other Postemployment Benefits East side rehabilitation, incentive programs and infrastructure Additional priorities that did not fit into the above categories include 1) addressing homelessness issues, 2) providing downtown Wi-Fi and music and 3) beautification of highway overpasses. As discussed above, economic revitalization continued to be an active focal point of the City in fiscal year 2016-17. The following projects are underway and will see significant progress or be completed in 2018. Harney Lane Union Pacific Railroad Grade Separation (UPRR) This project consists of widening and realignment of Harney Lane including the construction of a new three-span approximately 248 feet long and 88 feet wide to grade separate Harney Lane at the Union Pacific Railroad track. It also includes signal modifications, drainage and utility installation, street lighting, landscaping, construction of raised medians, curb gutter and sidewalk. Estimated cost to complete this project is $16.0 million and is funded by State and Federal grants. Residential Development The City has nine residential development projects that have been approved and total about 1,500 dwelling units. Dwelling units are fairly evenly divided among low, medium and high density units. Sales in four of the nine projects are ongoing. Construction is proceeding in seven of the nine projects this year and the remaining two are expected to begin construction in 2018. In addition, the City’s first market rate apartment complex in over 25 years and a new age restricted apartment complex should open in 2018. Industrial Reuse MHA construction, an international modular wall construction company in the multi-family segment recently acquired the majority of a long closed auto dealership bringing thirty to eighty new jobs to Lodi by full build out. Lodi is also seeing growth at the former Blue Shield call center which was acquired by Cepheid, a leader in infectious disease diagnosis products. Water Meters and Water Infrastructure. Under state law, all residential housing must be billed for water usage on a metered basis by 2025. The City has embarked on a program to install meters on approximately 14,000 parcels over an eight year period. A portion of this project will also include moving mains and service connections from alleys and rear yards to streets and front yards. Additionally, the City will be appropriately sizing water mains as part of this project. Construction began during fiscal year 2009-10 and will continue through fiscal year 2017-18. To date, approximately 14,400 meters have been installed. Estimated cost for the complete program is $42.5 million.

ix
Library Roof Repairs and Teen Scene Upgrade The library’s roof, installed in the mid 1980’s, reached its useful life and needed replacement. The replacement project was approved and completed in November 2017. The repair of $420,000 will enhance the usability and reduce liability at the library while ensuring it will be useful for years to come. The library continues to remake itself into a modern space in an attempt to attract patrons from all demographics within the City. The Teen Scene is the first dedicated teen space (2,500 square feet) in the library. The project is estimated at just shy of $1 million, with approximately $300,000 donated by the Lodi Public Library Foundation, which continues to be a strong contributor to the success of the City’s library. FINANCIAL INFORMATION, MANAGEMENT AND CONTROL A detailed understanding of the financial position and change in financial position of the City is provided in the following sections of this report. The following is a brief description of the City’s financial condition, management practices and control techniques. Basis of Accounting Basis of accounting refers to the policy as to when revenues, expenditures or expenses are recognized in the financial accounts and reported in the financial statements. The City’s accounting records for general government operations are maintained on a modified accrual basis. Revenues are recorded when available and measurable. Expenditures are recorded when the services or goods are received and the liability incurred. For proprietary fund types, the City uses the accrual basis of accounting. As such, the measurement focus is on operating income in addition to financial position and changes in financial position. Revenues are recognized when earned and expenses are recognized as the liability is incurred. We believe that the City’s internal accounting controls adequately safeguard assets and provide reasonable assurance of proper recording of financial transactions. Accounting System and Budgetary Control In developing the City’s accounting system, consideration is given to the adequacy of the internal controls. The objective of the City’s internal accounting controls is to provide reasonable, but not absolute, assurance that the assets are safeguarded against loss from unauthorized use or disposition; and to ensure that transactions are properly recorded to permit the preparation of financial statements in accordance with GAAP. The concept of reasonable assurance recognizes that the cost of the controls should not exceed the benefits likely to be derived and that management estimates and judgments are required in evaluating these costs and benefits. In addition, the City maintains budgetary controls. The objective of these controls is to ensure compliance with legal provisions embodied in the annual appropriated budget approved by the City Council. The City Manager is responsible for the preparation of the budget and its implementation after adoption. The City Council has the authority to amend the budget at any time during the year. The City Manager has the authority to make adjustments to the budget as long as those changes will not have a significant policy impact nor affect budgeted year-end fund balances. During fiscal year 2016-17, the City Council and City Manager made several supplemental appropriations for operating budgets and capital projects. Long Term Financial Planning The City has implemented a long-term financial planning practice to review the impact of current decisions on the City’s General Fund. This analysis can be found in the City’s budget document beginning in fiscal year 2017-18 and includes assumptions, revenue, expenditures, and fund balance

x
projections. In addition, there is discussion of risks and opportunities not modeled. The tool is a baseline projection that provides management and policy makers a view of what the City’s financial condition may be if current operations are maintained and a reasonable set of economic assumptions are made. This plan is updated periodically as new information is available that will materially impact the projection. Fund Balance It is the City's goal to target and maintain an unassigned fund balance in the General Fund of at least 16% of revenues and working capital balances in the Water and Wastewater enterprise funds, and at least 25% of operating expenses. Based on a reserve policy adopted in March 2014, the target for the Electric enterprise fund working capital is $22.8 million for fiscal year 2016-17. The goals allow for variations from year-to-year to account for economic and fiscal changes. The General Fund maintained an unassigned fund balance of $11,447,985, or 25.89% of revenues at the end of fiscal year 2016-17. Cash Management The City has written investment policies that address a wide range of investments. These policies describe the City’s investment objectives, investment authority, allowable investment vehicles, maturity terms and eligible financial institutions. They also describe the City’s capital preservation and cash management objectives. As provided in the policy, investments are intended to be held until maturity and investment terms are to be consistent with the City’s cash flow needs. Investment reports are issued quarterly to the City Manager and City Council to provide detailed information regarding the City's investments and compliance with City policy and state law. An important objective of the City’s investment policy is to achieve a reasonable rate of return on public funds while minimizing risks and preserving capital. In evaluating the performance of the City's investment portfolio, investments are expected to yield a rate of return that regularly meets or exceeds an average rate of return on a one-year U.S. Treasury Bill. Appropriation Limitation Article XIII B of the Constitution of the State of California (Proposition 4) provides for the limitation of expenditures by state and local governments. Under the provisions of this article, City appropriations funded through tax sources may not exceed Fiscal Year 1979 appropriation levels except as adjusted for increases in population and the growth in the California per capita income or non-residential assessed valuation due to new construction within the City. Excluded from the limitation are appropriations funded through charges for services, fines and forfeitures, grants, transfers of service responsibilities between government agencies and indebtedness incurred prior to Fiscal Year 1979. Pursuant to subsequent legislation adopted after Article XIII B, the City is required to annually establish and adopt its appropriations limit by resolution. For fiscal year 2016-17, the City's appropriations subject to limit were $37,281,365 and the appropriation limit was $95,607,750, leaving appropriations at $58,326,385 below the limit. Debt Administration At June 30, 2017, the City had outstanding Certificates of Participation and Revenue Bonds of $156,945,920. These liabilities are discussed in Note 8 of the Basic Financial Statements and summarized below. In 1999, the Electric Utility issued $43.96 million Certificates of Participation (COPs) to finance the costs of certain improvements to the distribution and transmission facilities of the City’s electric system. These COPs were refunded by the issuance of the 2002 Electric Systems Revenue Certificates of Participation. The 2002 COPs were refunded with the 2008 Electric Systems Revenue Certificates of Participation thereby eliminating a variable rate obligation.

xi
In 2004, the City issued $27,360,000 in Wastewater Certificates of Participation (2004A) to finance the costs of improvements to the wastewater collection, treatment and disposal system. These bonds were partially refunded with the 2012 Refunding Wastewater Revenue Bonds, Series A. In 2007, the City issued $30,320,000 in Wastewater Certificates of Participation (2007A) to finance Phase III of the wastewater improvements and to refund the 1991 Certificates of Participation. These bonds were partially refunded with the 2016 Refunding Wastewater Revenue Bonds, Series A. On July 24, 2008, the City issued the $60,685,000 2008 Electric System Revenue Certificates of Participation to provide funds to currently refund the outstanding $46,760,000 principal amount of the Electric System Revenue Certificates of Participation 2002 Series A Variable Rates Certificates (Refunded 2002 Certificates); and to pay certain costs relating to the termination of a swap agreement relating to the Refunded 2002 Certificates.
On October 1, 2010, the City issued $9,015,000 Water Revenue Certificates of Participation, 2010 Series A and $29,650,000 Water Revenue Bonds, 2010 Series B (Federally taxable - Build America Bonds) to finance the construction of the Surface Water Treatment Facility, which is designed to pump water from the Mokelumne River, treat and deliver it to the City’s water distribution system. On September 1, 2012, the City issued $19,080,000 Refunding Lease Revenue Bonds (2012 LRB) to prepay and cause the immediate defeasance of the outstanding $21,025,000 Certificates of Participation (2002 COP). The 2002 COP were issued in January 2002 to provide funds to finance the costs of constructing, furnishing and equipping a new police building and jail for the City, to finance portions of certain other projects and to refund the outstanding 1995 and 1996 Certificates of Participation.
The City also issued the $17,105,000 2012 Refunding Wastewater Revenue Bonds (2012 Bonds) in September 2012 to advance refund the $17,115,000 principal amount of the 2004 Wastewater Revenue Certificates of Participation (2004 COP). The 2004 COP were issued to provide funds to finance the costs of certain improvements to the wastewater collection, treatment and disposal system of the City. On March 10, 2016, the City issued the $20,295,000 2016 Refunding Wastewater Revenue Bonds, Series A (2016 Bonds) to partially refund $21,415,000 outstanding principal of the 2007A COP. The City's debt management policy includes a commitment to monitor all forms of debt annually during the preparation of the City’s Financial Plan and Budget to ensure compliance. Also, the City will generally conduct financing on a competitive basis, will seek an investment grade rating on any direct debt and will obtain credit enhancements such as letters of credit or insurance when necessary for marketing purposes, availability and cost effectiveness. Interim Financial Reporting Monthly financial reports are prepared to present the City’s financial condition and changes in financial position. These executive reports are organized using the “pyramid” approach. As such, the highest level of summary data is presented first, followed by progressively greater levels of detail. The reports provide current period and year to date revenues, expenditures and encumbrances for all activities and funds, including year- to- date estimates and variances. The reports are available to all departments.

xii
Single Audit The City is subject to financial and compliance reporting required by the Single Audit Act Amendments of 1996 and the Uniform Guidance, which is a requirement of all local and state governments expending in excess of $750,000 of federal financial awards annually. As part of the Single Audit, tests are made to determine the adequacy of internal controls, including that portion related to federal financial awards, as well as to determine that the City has complied with certain applicable laws and regulations governing federal funds. The Single Audit report is published as part of the annual financial statements for easy reference. Competitive Bidding Policy All required purchases for materials, equipment and services during fiscal year 2016-17 were made pursuant to competitive bidding procedures as established under the City’s purchasing ordinance. Contracts for construction projects were awarded pursuant to competitive bidding procedures established by the State of California for projects in excess of $5,000. Risk Management The City is self-insured for dental care, long-term disability, workers’ compensation, general liability and unemployment insurance. General liability and workers’ compensation are administered by outside agencies. The City administers unemployment insurance and long-term disability. Self-insurance transactions are accounted for under the Insurance Funds. At June 30, 2017, the Insurance Fund had a net position of $4,571,274. INDEPENDENT AUDIT The City Council requires an annual audit of the records and accounts of the City by an independent certified public accountant. To ensure proper internal control, periodically the City conducts a request for proposal (RFP) process for auditing services. The accounting firm of Macias Gini & O’Connell LLP was selected to perform this audit. The independent auditor’s report precedes the basic financial statements and concludes that the City’s basic financial statements are presented fairly, in all material respects, in accordance with GAAP. CERTIFICATES OF ACHIEVEMENT The Government Finance Officers Association of the United States and Canada (GFOA) awarded a Certificate of Achievement for Excellence in Financial Reporting to the City for its Comprehensive Annual Financial Report (CAFR) for the year ended June 30, 2016. These Certificates of Achievement are prestigious national award recognizing conformance with the highest standards for preparation of state and local government financial reports. In order to be awarded a Certificate of Achievement, a governmental unit must publish an easily readable and efficiently organized CAFR, whose contents conform to program standards. The CAFR must satisfy both generally accepted accounting principles and applicable legal requirements. A Certificate of Achievement is valid for a period of one year only. The City has received a Certificate of Achievement for the last twenty-four consecutive years. We believe our current report continues to conform to the Certificate of Achievement program requirements and we are submitting it to GFOA this year.
(This page intentionally left blank.)

xiv

xv

xvi
DIRECTORY OF OFFICIALS AND ADVISORY BODIES CITY COUNCIL Doug Kuehne Mayor Alan Nakanishi Mayor Pro Tempore Mark Chandler Council Member Bob Johnson Council Member JoAnne Mounce Council Member ADVISORY BODIES Planning Commission Lodi Improvement Committee Library Board Lodi Arts Commission Recreation Commission Youth Commission Site Plan and Architectural Review Committee Lodi Senior Citizens’ Commission PRINCIPAL ADMINISTRATIVE OFFICERS Steve Schwabauer City Manager Andrew Keys Deputy City Manager Janice Magdich City Attorney Jennifer Ferraiolo City Clerk Dean Gualco Library Services Director Larry Rooney Fire Chief Jeff Hood Parks, Recreation & Cultural Services Director Charles Swimley Public Works Director Elizabeth Kirkley Electric Utility Director Steve Schwabauer Community Development Director Tod Patterson Police Chief

FINANCIAL SECTION The Financial Section is comprised of the Independent Auditor’s Report, Management’s Discussion and Analysis, Basic Financial Statements, including the notes, Required Supplementary Information, and Supplementary Information which includes Combining and Individual Fund Statements and Schedules.
www.mgocpa.com Macias Gini & O’Connell LLP 3000 S Street, Suite 300 Sacramento, CA 95816
1
Independent Auditor’s Report
The Honorable Members of City Council
City of Lodi, California
Report on the Financial Statements
We have audited the accompanying financial statements of the governmental activities, the business-type activities, each major fund, and the aggregate remaining
fund information of the City of Lodi, California (City), as of and for the year ended June 30, 2017, and the related notes to the financial statements, which
collectively comprise the City’s basic financial statements as listed in the table of contents.
Management’s Responsibility for the Financial Statements
Management is responsible for the preparation and fair presentation of these financial statements in accordance with accounting principles generally accepted in
the United States of America; this includes the design, implementation, and maintenance of internal control relevant to the preparation and fair presentation of
financial statements that are free from material misstatement, whether due to fraud or error.
Auditor’s Responsibility
Our responsibility is to express opinions on these financial statements based on our audit. We conducted our audit in accordance with auditing standards
generally accepted in the United States of America and the standards applicable to financial audits contained in Government Auditing Standards, issued by the
Comptroller General of the United States. Those standards require that we plan and perform the audit to obtain reasonable assurance about whether the financial
statements are free from material misstatement.
An audit involves performing procedures to obtain audit evidence about the amounts and disclosures in the financial statements. The procedures selected depend
on the auditor’s judgment, including the assessment of the risks of material misstatement of the financial statements, whether due to fraud or error. In making
those risk assessments, the auditor considers internal control relevant to the entity’s preparation and fair presentation of the financial statements in order to design
audit procedures that are appropriate in the circumstances, but not for the purpose of expressing an opinion on the effectiveness of the entity’s internal control.
Accordingly, we express no such opinion. An audit also includes evaluating the appropriateness of accounting policies used and the reasonableness of significant
accounting estimates made by management, as well as evaluating the overall presentation of the financial statements.
We believe that the audit evidence we have obtained is sufficient and appropriate to provide a basis for our audit opinions.
Opinions
In our opinion, the financial statements referred to above present fairly, in all material respects, the respective financial position of the governmental activities,
the business-type activities, each major fund, and the aggregate remaining fund information of the City, as of June 30, 2017, and the respective changes in
financial position, and, where applicable, cash flows thereof for the year then ended in accordance with accounting principles generally accepted in the United
States of America.

2
Other Matters
Required Supplementary Information
Accounting principles generally accepted in the United States of America require that the management’s discussion and analysis, the schedules of changes in net
pension liability and related ratios, the schedule of pension contributions, the schedule of funding progress for the OPEB plan, and the schedules of revenues,
expenditures, and changes in fund balance – budget and actual – for the General and Streets funds as listed in the table of contents be presented to supplement the
basic financial statements. Such information, although not a part of the basic financial statements, is required by the Governmental Accounting Standards Board
who considers it to be an essential part of financial reporting for placing the basic financial statements in an appropriate operational, economic, or historical
context. We have applied certain limited procedures to the required supplementary information in accordance with auditing standards generally accepted in the
United States of America, which consisted of inquiries of management about the methods of preparing the information and comparing the information for
consistency with management’s responses to our inquiries, the basic financial statements, and other knowledge we obtained during our audit of the basic
financial statements. We do not express an opinion or provide any assurance on the information because the limited procedures do not provide us with sufficient
evidence to express an opinion or provide any assurance.
Other Information
Our audit was conducted for the purpose of forming opinions on the financial statements that collectively comprise the City’s basic financial statements. The
introductory section, combining and individual fund statements and schedules, statistical section, and continuing disclosures section are presented for purposes of
additional analysis and are not a required part of the basic financial statements. The schedule of expenditures of federal awards is presented for purposes of
additional analysis as required by Title 2 U.S. Code of Federal Regulations Part 200, Uniform Administrative Requirements, Cost Principles, and Audit
Requirements for Federal Awards, and is also not a required part of the basic financial statements.
The combining and individual fund statements and schedules and the schedule of expenditures of federal awards are the responsibility of management and were
derived from and relate directly to the underlying accounting and other records used to prepare the basic financial statements. Such information has been
subjected to the auditing procedures applied in the audit of the basic financial statements and certain additional procedures, including comparing and reconciling
such information directly to the underlying accounting and other records used to prepare the basic financial statements or to the basic financial statements
themselves, and other additional procedures in accordance with auditing standards generally accepted in the United States of America. In our opinion, the
combining and individual fund statements and schedules and the schedule of expenditures of federal awards are fairly stated, in all material respects, in relation
to the basic financial statements as a whole.
The introductory, statistical, and continuing disclosures sections have not been subjected to the auditing procedures applied in the audit of the basic financial
statements and, accordingly, we do not express an opinion or provide any assurance on them.
Other Reporting Required by Government Auditing Standards
In accordance with Government Auditing Standards, we have also issued our report dated December 12, 2017 on our consideration of the City’s internal control
over financial reporting and on our tests of its compliance with certain provisions of laws, regulations, contracts, and grant agreements and other matters. The
purpose of that report is solely to describe the scope of our testing of internal control over financial reporting and compliance and the results of that testing, and
not to provide an opinion on the effectiveness of the City’s internal control over financial reporting or on compliance. That report is an integral part of an audit
performed in accordance with Government Auditing Standards in considering the City’s internal control over financial reporting and compliance.
Sacramento, California
December 12, 2017

3
MANAGEMENT’S DISCUSSION AND ANALYSIS
This section of the Comprehensive Annual Financial Report is presented as discussion and analysis of the financial performance of the City of Lodi (City) for the year ended June 30, 2017. FINANCIAL HIGHLIGHTS
• The assets and the deferred outflows of resources of the City exceeded its liabilities and the deferred inflows of resources at the close of the fiscal year by $205,057,018 (net position). Of this amount, $60,699,266 is unrestricted deficit.
• The City’s total net position increased by $17,086,030 in fiscal year 2017.
• As of June 30, 2017, the City’s governmental funds reported combined ending fund balances of $30,232,042, an increase of $3,117,069 in
comparison with the prior year. Of this amount, $11,447,985 is available for spending at the City’s discretion (unassigned fund balance).
• At the close of the fiscal year, fund balance for the General Fund was $14,968,357, of which $11,447,985 is unassigned or 25.89% of total general fund revenues of $44,221,656.
• The City’s total long-term liabilities increased by $14,262,311 (4.63%) during the current fiscal year.
OVERVIEW OF THE FINANCIAL STATEMENTS This discussion and analysis is intended to serve as an introduction to the City’s basic financial statements. The City’s basic financial statements are comprised of three components: (1) Government-wide financial statements, (2) Fund financial statements, and (3) Notes to Basic Financial Statements. This report also includes required supplementary information and combining and individual fund statements and schedules in addition to the basic financial statements. Government-wide Financial Statements The government-wide financial statements are designed to provide readers with a broad overview of the City’s finances, in a manner similar to a private-sector business. The statement of net position presents information on all of the City’s assets, deferred outflows of resources, and liabilities, with the difference reported as net position. Over time, increases or decreases in net position may serve as a useful indicator of whether or not the financial position of the City is improving or deteriorating. The statement of activities presents information showing how the City’s net position changed during the most recent fiscal year. All changes in net position are reported as soon as the underlying event giving rise to the change occurs, regardless of the timing of related cash flows. Thus, revenues and expenses are reported in this statement for some items that will only result in cash flows in future fiscal periods, such as revenues pertaining to uncollected taxes and expenses pertaining to earned but unused vacation and sick leave.

4
Both of the government-wide financial statements distinguish functions of the City that are principally supported by taxes and intergovernmental revenues (governmental activities) from other functions that are intended to recover all or a significant portion of their costs through users fees and charges (business-type activities). The governmental activities of the City include general government, public protection, public works, community development, library, parks and recreation. The business-type activities of the City include electric operations, wastewater operations, water operations and public transit operations. Fund Financial Statements The fund financial statements are designed to report information about groupings of related accounts, which are used to maintain control over resources that have been segregated for specific activities or objectives. The City, like other state and local governments, uses fund accounting to ensure and demonstrate compliance with finance-related legal requirements. All of the funds of the City can be divided into the following three categories: Governmental funds, Proprietary funds, and Fiduciary funds. Governmental Funds. Governmental funds are used to account for essentially the same functions reported as governmental activities in the government-wide financial statements. Most of the City’s basic services are reported in governmental funds. These statements, however, focus on (1) how cash and other financial assets can readily be converted to available resources and (2) the balances left at year-end that are available for spending. Such information may be useful in determining financial resources available in the near future to finance City programs. Because the focus of governmental funds is narrower than that of the government-wide financial statements, it is useful to compare the information presented for governmental funds with similar information presented for governmental activities in the government-wide financial statements. By doing so, readers may better understand the long-term impact of the government’s near-term financing decisions. Both the governmental funds balance sheet and the governmental funds statement of revenues, expenditures, and changes in fund balances provide a reconciliation to facilitate this comparison between governmental funds and governmental activities. The City maintains several individual governmental funds organized according to their type (general, special revenue, capital projects and debt service). Information is presented separately in the governmental funds balance sheet and in the governmental funds statement of revenues, expenditures, and changes in fund balances for the General Fund and Streets Fund which are considered major funds. Data from the remaining governmental funds are combined into a single, aggregated presentation. Individual fund data for each of the non-major governmental funds is provided in the form of combining statements elsewhere in this report. The City adopts an annual budget for its General Fund and special revenue funds. Budgetary comparison schedules have been provided for the General Fund and the special revenue funds to demonstrate compliance with this budget. Proprietary Funds. Proprietary funds are generally used to account for services for which the City charges customers, either outside customers, or internal units or departments of the City. Proprietary funds provide the same type of information as shown in the government-wide financial statements, only in more detail. The City maintains the following two types of proprietary funds:
• Enterprise funds are used to report the same functions presented as business-type activities in the government-wide financial statements. The City uses enterprise funds to account for the operations of the Electric, Wastewater, Water, all of which are considered to be major funds and the Transit system, which is considered to be a non-major enterprise fund.
5
• Internal Service funds are used to report activities that account for various employee benefits, self-insurance, and fleet activities of the City. Because these activities predominantly benefit governmental rather than business-type functions, they have been included within the governmental activities in the government-wide financial statements.
Fiduciary funds. Fiduciary funds are used to account for resources held for the benefit of parties outside the City. The activities of the Industrial Way-Beckman special assessment and various landscape and lighting districts are accounted for and reported under the fiduciary funds. The activities of the Private-Purpose Trust and the Hutchins Street Square Bequest are also accounted for under the fiduciary funds. Since the resources of these funds are not available to support the City’s own programs, they are not reflected in the government-wide financial statements. The accounting used for fiduciary funds is much like that used for proprietary funds. Notes to the Basic Financial Statements The notes to the basic financial statements provide additional information that is essential to a full understanding of the data provided in the government-wide and fund financial statements. Required Supplementary Information In addition to the basic financial statements and accompanying notes, this report presents certain required supplementary information concerning changes in net pension liability and related ratios for the City’s Miscellaneous and Safety pension plans, contributions to the pension plans the City’s progress in funding its obligation to provide other postemployment benefits (OPEB) to its employees, and schedules comparing budget to actual amounts for the General Fund and Streets Fund. Combining Statements and Schedules The combining statements and schedules in connection with non-major governmental funds, internal service funds and fiduciary funds are presented immediately following the required supplementary information.

6
GOVERNMENT-WIDE FINANCIAL ANALYSIS As noted earlier, net position may serve over time as a useful indicator of a government’s financial position. The City’s assets and deferred outflows of resources exceeded liabilities and deferred inflows of resources by $205,057,018 at the close of the current fiscal year. City of Lodi's Net Position Governmental Business-type Activities Activities Total
2017
2016 2017 2016 2017 2016 Assets: Current and other assets $ 53,240,280 48,517,710 87,988,072 86,936,283 $ 141,228,352 135,453,993 Capital assets 136,432,091 131,759,274 241,202,789 238,195,394 377,634,880 369,954,668 Total assets 189,672,371 180,276,984 329,190,861 325,131,677 518,863,232 505,408,661 Deferred outflows of resources 17,821,434 7,165,075 11,812,878 9,090,899 29,634,312 16,255,974 Liabilities: Long-term net OPEB obligation 8,939,061 7,560,300 8,939,061 7,560,300 Long-term net pension liability 95,864,664 81,024,186 22,155,886 17,099,298 118,020,550 98,123,484 Other long-term liabilities 36,067,833 37,183,278 159,181,909 165,079,980 195,249,742 202,263,258 Other liabilities 8,215,297 7,098,373 9,572,998 10,485,032 17,788,295 17,583,405 Total liabilities 149,086,855 132,866,137 190,910,793 192,664,310 339,997,648 325,530,447 Deferred inflows of resources 2,828,147 6,392,888 614,731 1,770,312 3,442,878 8,163,200 Net position: Net investment in capital assets 117,196,121 111,255,993 129,085,926 121,468,454 246,282,047 232,724,447 Restricted 15,545,059 13,911,366 3,929,138 3,892,388 19,474,197 17,803,754 Unrestricted (77,162,377) (76,984,325) 16,463,151 14,427,112 (60,699,226) (62,557,213) Total net position $ 55,578,803 48,183,034 149,478,215 139,787,954 $ 205,057,018 187,970,988
Assets. The City’s total assets increased by $13,454,571. The increase is primarily due to the following: Governmental activities. Total assets for the governmental activities had an increase of $9,395,387 or 5.21%. Current and other assets increased by $4,722,570 primarily resulting from the increase in cash and investments, $7,881,471; offset by the decrease in due from other

7
governmental agencies, $2,621,133, and accounts receivables, $738,621. Capital assets increased by $4,672,817 largely from construction in progress. Other insignificant activities make up the difference. Business-type activities. Total assets for the business-type activities had an increase of $4,059,184. Current and other assets increased by $1,051,789 primarily due to increases in advance receivable of $1,252,823. Capital assets increased by $3,007,395 largely from machinery and equipment. Other insignificant activities contributed to the difference. Deferred outflows of resources. The increase in deferred outflows of resources of $13,378,338 is primarily from changes in various pension components related to the Miscellaneous and Safety Plans per the CalPERS valuation reports and current pension contributions made after the measurement date of June 30, 2016. Liabilities. The City’s total liabilities increased by $14,467,201 or 4.44%. The increase is primarily due to the following: Governmental activities. Total liabilities for the governmental activities had a significant increase of $16,220,718 or 12.21%, primarily from the net pension liability and the net OPEB obligation. Business-type activities. Total liabilities for the business-type activities decreased by $1,753,517 or 0.91%. The decrease is primarily attributable to the principal payments on long-term debt offset by an increase in pension liability. Other insignificant activities offset the difference. Deferred inflows of resources. The decrease in deferred inflows of resources of $4,720,322 represents changes in various pension components related to the Miscellaneous and Safety Plans per the CalPERS valuation reports. Net position. The City’s overall financial position increased by $17,086,030, or 9.09%, during the fiscal year. The largest portion ($246,282,047) of the City’s net position reflects its investment in capital assets net of any associated depreciation (e.g., land, buildings and improvements, machinery and equipment); less any related debt used to acquire those assets that is still outstanding plus debt related deferred outflows of resources. The City uses these capital assets to provide services to citizens; consequently, these assets are not available for future spending. Although the City’s investment in its capital assets is reported net of related debt and deferred outflows of resources, it should be noted that the resources needed to repay this debt must be provided from other sources, since the capital assets themselves cannot be used to liquidate these liabilities. An additional portion of the City’s net position, $19,474,197 (9.50%) represents resources that are subject to external restrictions on how they may be used. The remaining balance of unrestricted net position amounts to a deficit of $60,699,226. At the end of the current fiscal year, the City is able to report positive balances in two categories of net position for the City as a whole. Unrestricted net position is negative for the governmental-type activities primarily due to recording a net OPEB obligation and a net pension liability.

8
City of Lodi’s Change in Net Position
Governmental Business-type
Activities Activities Total 2017 2016 2017 2016 2017 2016 Revenues Program revenues: Charges for services $ 9,775,083 6,956,105 93,647,907 94,838,592 $ 103,422,990 101,794,697 Operating grants and contributions 2,391,015 2,595,874 4,513,922 5,088,818 6,904,937 7,684,692 Capital grants and contributions 12,830,462 10,558,743 7,972,612 2,860,171 20,803,074 13,418,914 General revenues: Property taxes 14,859,923 13,919,218 14,859,923 13,919,218 Other taxes 11,684,301 11,407,984 11,684,301 11,407,984 Grants and contributions not restricted to specific programs 11,777,544 11,834,331 11,777,544 11,834,331 Litigation – environmental lawsuits proceeds 100,000 100,000 Rent 1,954,385 4,200 1,958,585 Other 978,931 1,043,915 3,601,914 4,908,960 4,580,845 5,952,875 Total revenues 64,297,259 60,270,555 109,736,355 107,800,741 174,033,614 168,071,296 Expenses General government 9,650,423 10,368,800 9,650,423 10,368,800 Public protection 33,238,886 31,394,604 33,238,886 31,394,604 Public works 10,614,158 10,326,560 10,614,158 10,326,560 Community development 1,709,246 1,792,520 1,709,246 1,792,520 Library 1,252,743 1,389,105 1,252,743 1,389,105 Parks and recreation 3,663,013 4,262,128 3,663,013 4,262,128 Interest on long-term debt 824,021 821,768 824,021 821,768 Electric 62,790,906 61,764,151 62,790,906 61,764,151 Wastewater 16,317,764 14,023,975 16,317,764 14,023,975 Water 11,960,786 10,967,387 11,960,786 10,967,387 Transit 4,925,638 4,414,594 4,925,638 4,414,594 Total expenses 60,952,490 60,355,485 95,995,094 91,170,107 156,947,584 151,525,592 Changes in net position before transfers 3,344,769 (84,930) 13,741,261 16,630,634 17,086,030 16,545,704 Transfers 4,051,000 4,469,495 (4,051,000) (4,469,495) Changes in net position 7,395,769 4,384,565 9,690,261 12,161,139 17,086,030 16,545,704 Net position at beginning of year 48,183,034 43,798,469 139,787,954 127,616,815 187,970,988 171,425,284 Net position at end of year $ 55,578,803 48,183,034 149,478,215 139,787,954 $ 205,057,018 187,970,988
Analysis of Changes in Net Position Governmental activities Net position for the governmental activities increased by $7,395,769 in the current fiscal year, which is an increase of $3,011,204 relative to last year’s increase of $4,384,565.

9
The key factors impacting this increase are: Revenues increased $4,026,704 from the prior fiscal year. Key elements of this increase are:
• Capital grants and contributions increased by $2,271,719 or 21.52% from the prior fiscal year. The increase in capital contributions was mainly attributable to state and federal funds used for the Harney Lane grade separation project, $3,242,603; offset by a decrease in development impact fees collected, $963,121. The difference is offset by other insignificant increases.
• Property taxes increased by $940,705 or 6.76% compared to prior year. The economy continues to show evidence of positive movement particularly in the housing market. Home prices continue to rise coupled with record low mortgage rates are helping the process to generate sales, resulting in an increase in property tax revenues in the current year.
• Charges for services increased by $2,818,978 from the prior fiscal year. The increase is due to $2,135,227 of rent previously recorded as general revenues. The difference is due to various fees and services provided during the fiscal year.
Expenses for governmental functions totaled $60,952,490, an increase of $597,005 or 0.99% relative to the prior fiscal year. Transfers from business-type activities decreased by $418,495, primarily due to contributions from the enterprise funds for various capital projects in prior year. Business-type activities Business-type activities increased the City’s net position by $9,690,261 in the current year, which is a decrease of $2,470,878 from last year’s increase of $12,161,139. The key elements of this decrease are:
• Transfers to the governmental activities for various capital projects decreased by $418,495 in comparison to the prior year. • Charges for services in the Electric Fund decreased by $1,659,598 primarily from the decline in commercial customer revenue, offset by
the increase in Wastewater Fund by $146,676, and the increase in the Water Fund by $312,490. • Increase in the greenhouse gas allowance (GHG) of $798,871 in the Electric Fund related to Assembly Bill 32: Global Warming Act,
which set the 2020 greenhouse gas emissions reduction into law and also adopted a regulation that established a system of market-based declining annual aggregate emission limits for sources or categories of sources that emit greenhouse gases. In 2011, the California Air Resources Board (ARB) adopted the cap-and-trade regulation. This program covers major sources of GHG emissions in the State such as refineries, power plants, industrial facilities, and transportation fuels. The cap-and-trade program includes an enforceable emissions cap that will decline over time. The State distributes allowances, which are tradable permits, equal to emissions allowed under the cap.
• Operating grants in the Transit fund declined by $1,373,107 primarily from a decline in Article 8 operating funds. • Capital contributions increased by $5,112,441, primarily from the water meter project phase 5, Reynolds Ranch subdivision and the Lodi
Shopping Center. • Other revenues decreased by $1,176,150 primarily from work for others in the Electric Fund triggered by new residential and commercial
developments in the prior year. • Increase in pension expense by $2,889,123 as the result of increasing pension cost. Other salary and benefits increased by $460,288. • Bulk power cost decreased by $2,138,616 compared to the prior year primarily attributable to overall decrease in generation and in third
party revenues offset by an increase in transmission, management services costs paid to NCPA. • Supplies, materials and services increased by $4,071,668 primarily due to Wastewater and Transit maintenance and repair projects, the
Public benefits program, and various increases in supplies and services.
10
FINANCIAL ANALYSIS OF THE CITY’S FUNDS Governmental Funds The focus of the City’s governmental funds is to provide information on near-term inflows, outflows, and balances of spendable resources. Such information is useful in assessing the City’s financing requirements. In particular, unassigned fund balance may serve as a useful measure of a government’s net resources available for spending at the end of the fiscal year. Types of governmental funds reported by the City include the General Fund, special revenue funds, debt service fund and capital projects funds. At the end of the current fiscal year, the City’s governmental funds reported combined ending fund balances of $30,232,042. This represents an increase of $3,117,069, an increase of $438,457 in comparison to the prior year increase of $2,678,612 resulting from the increase in total revenues, increase in total expenditures and decrease in net transfers in. The General Fund is the chief operating fund of the City. At the end of the current fiscal year, unassigned fund balance of the General Fund was $11,447,985 while total fund balance was $14,968,357. As a measure of the General Fund’s liquidity, it may be useful to compare both unassigned fund balance and total fund balance to total fund expenditures. Unassigned fund balance and total fund balance represent 28.80% and 37.66% of total General Fund expenditures, respectively. The fund balance of the General Fund increased by $1,721,164 during the current fiscal year, an increase of $952,524 from last year’s increase of $768,640. Key factors in this increase are:
• Total revenues increased by $1,078,435, primarily from the net increase in secured property tax of $592,976, increase in vehicle license
fee of $331,980; and, increase in business license tax of $140,585. Other insignificant increases and decreases offset the difference. • Total expenditures increased by $1,290,734 primarily from increase in salaries and wages for the vacancies filled during the current year
and the increases approved in labor negotiations, and increases related to OPEB and pensions. Other insignificant increases and decreases offset the difference.
• Net transfers out decreased by $1,164,823 primarily due to less transfers out to the Capital Outlay Reserve Fund for construction of fire station #2.
Total fund balance of the Streets Funds was $5,223,958. Intergovernmental revenues of $9,883,250 offset by capital expenditures of $8,092,111 were the largest components that resulted in the increase of $1,649,442 to fund balance. Proprietary Funds The City’s proprietary funds provide the same type of information found in the government-wide financial statements, but in more detail. Unrestricted net position at the end of the year for the Electric Fund was $5,072,853, Wastewater Fund was $8,570,542, Water Fund was $(419,781), Transit Fund was $3,239,537, and the Internal Service Funds unrestricted net position was $5,476,259. Other factors concerning the finances of these funds are discussed in the City’s business-type activities.

11
GENERAL FUND BUDGETARY HIGHLIGHTS Differences between the original budget and the final budget in the General Fund were a net increase in appropriations of $2,871,141. The increase in appropriations can be briefly summarized as follows:
• $2,841,486 increase in general government and $40,931 increase in library are primarily the result of the City amending its budget to establish a pension stabilization account.
Significant differences between the final budget and the actual revenues and expenditures can be briefly summarized as follows:
• Taxes – a favorable variance of $780,549 was primarily due to positive variances in property tax ($247,045), transient occupancy tax ($198,735), business license tax ($217,739), and sales and use tax ($223,897), offset by a negative variance in in-lieu of vehicle license fees ($20,307).
• For expenditures, a favorable variance between the final budget and actual expenditures of $1,967,542 was primarily due to savings from vacancies and the continued overall effort to reduce spending and costs.
CAPITAL ASSETS AND DEBT ADMINISTRATION Capital assets The City’s investment in capital assets for its governmental and business-type activities as of June 30, 2017, amounts to $377,634,880 (net of accumulated depreciation). This investment in capital assets includes land, buildings and improvements, machinery and equipment, vehicles, infrastructure, works of art, and construction in progress. The total increase in the City’s investment in capital assets for the current fiscal year was $7,680,212, a 2.08% increase (a 3.55% increase in governmental activities and 1.26% increase in business-type activities) as shown in the table below.
Changes in Capital Assets, Net of Depreciation Governmental Activities Business-type Activities Total 2017 2016 2017 2016 2017 2016 Land $ 24,947,834 24,947,834 5,535,718 5,535,718 $ 30,483,552 30,483,552 Construction in Progress 18,416,565 11,116,297 15,409,186 14,596,259 33,825,751 25,712,556 Buildings and Improvements 41,234,529 43,090,432 27,924,759 29,067,978 69,159,288 72,158,410 Machinery and Equipment 1,166,057 613,979 187,261,549 183,903,354 188,427,606 184,517,333 Vehicles 2,694,344 2,135,160 5,071,577 5,092,085 7,765,921 7,227,245 Infrastructure 47,667,855 49,550,665 47,667,855 49,550,665 Work of Art 304,907 304,907 304,907 304,907 Total $ 136,432,091 131,759,274 241,202,789 238,195,394 $ 377,634,880 369,954,668 An increase in construction in progress compared to prior year was primarily from the Harney Lane grade separation project. Additional information on the City’s capital assets can be found in Note 6 on pages 53-55 of this report.

12
Long-term debt At the end of the current fiscal year, the City had total bonded debt outstanding of $156,945,920. Of this amount, $18,752,590 is the outstanding balance of the bonds issued to fund the new public safety building, refinancing of the performing arts center and the downtown and Cherokee Lane improvements. The total of $138,193,330 from the business-type activities consists of $34,083,105 for the Water Fund; $45,441,595 for the Wastewater Fund; and $58,668,630 for the Electric Fund.
City of Lodi's Outstanding Debt Governmental Business-type Activities Activities Total Certificates of Participation and Revenue Bonds
$ 18,752,590 138,193,330 156,945,920
The City’s total bonded debt decreased by $6,107,968 during the current fiscal year due to principal payments and amortization of issuance premiums. Bond Rating There have been no changes to the City’s bond ratings since the previous report. In October 2016, Fitch Rating Services affirmed its ‘A-’ rating with a stable outlook on outstanding electric utility debt instruments given the improved financial profile in fiscal year 2016 as rate increases, relatively stable sales and reduction in debt service payments have bolstered operating margins and coverage levels. In July 2016, Fitch Rating Services affirmed its rating of ‘AA-’ on the outstanding public improvement bonds with a stable outlook. Fitch also affirmed the issuer default rating (IDR) for the City of Lodi at ‘AA’. The ‘AA’ IDR reflects the City’s solid expenditure control, low long-term debt, strong reserves and gap-closing capacity. Revenue performance has steadily increased in recent years, but the City’s limited legal ability to raise revenues presents an ongoing challenge. In February 2016, Fitch Rating Services also assigned an ‘AA-‘ to the 2016 refunding wastewater revenue bonds and in addition, affirmed the ‘AA’ ratings with a stable outlook on the 2004 and 2007 wastewater system revenue certificates, and the 2012 refunding wastewater revenue bonds. The system continues to demonstrate sound debt service coverage, strong liquidity, and reasonable multi-year projections. Standard & Poor’s Rating Services also raised its long-term rating and underlying rating to ‘AA-‘ from ‘A+’ on the wastewater system parity-lien obligations and assigned its ‘AA-‘ long-term rating to the 2016 refunding wastewater revenue bonds with a stable outlook. The raised ratings reflect the City’s comprehensive management practices, good transparency and disclosure, and consistently strong and improved financial performance. Additional information on the City’s long-term debt can be found in Note 8 on pages 56-62 of this report.

13
ECONOMIC FACTORS AND NEXT YEAR’S BUDGET Economic indicators continue to be positive, leading to growth in sales and tourism occupancy taxes. General Fund revenue growth is projected at 7.4% from the fiscal year 2016/17 budgeted revenue and transfers in, totaling $50,388,780. The City added to its reserve balance again in fiscal year 2016/17 and is projecting a balanced budget in the General Fund in fiscal year 2017/18. The City’s General Fund reserves are healthy for now, but there is a projected CalPERS contribution increase of approximately $10 million City-wide and over $7 million in the General Fund between now and 2022/23, it is apparent that caution is required. The General Fund continues to be of the greatest focus. It funds all of the core municipal services including police, fire, administration, economic development, transfers to the parks and library funds and other essential public services. The General Fund houses the great majority of City employees. It is also the most impacted by the cost increases imposed on the City by CalPERS (see below). The City has maintained its workforce over the past three years with strategic reductions to capture cost savings and recognize efficiencies. The City reduced a net of 4 positions this year, adding a new accountant and eliminating the following full time equivalents: two in the library, one in Parks, Recreation and Cultural Services, one in the electric utility and one in the water/wastewater utility. The City will continue its capital efforts in the coming year. Significant projects expected to be undertaken include various electrical system maintenance projects, water meter and water system maintenance projects, various wastewater system maintenance projects, including a recycled wastewater storage facility that is funded by a state grant, and street maintenance. Balancing the fiscal year 2017/18 budget involves balancing several critical issues: employee costs and retirement contributions; capital programs; and cost increases beyond the City’s control that were either imposed by external entities. Employee costs and retirement contributions – The primary challenge facing the City stems from the CalPERS funding crisis. The City’s combined funded status for the Safety and Miscellaneous employee plans is approximately 63% as of the most recent June 30, 2016, actuarial report. Staff estimates that the City’s combined CalPERS bill will increase from approximately $10 million per year in fiscal year 2015/16 to between $16.5 million and $17.8 million by fiscal year 2022/23 when CalPERS implements the phased discount rate reduction from 7.5% to 7.0% as is the current policy. The funded status of the City’s plans is expected to decrease over that span, despite the increased contribution requirements as the discount rate drops. The City has already taken four major steps to address these increased pension funding demands. They are as follows:
1.) The City Council created a Pension Stabilization Fund (PSF) via a Section 115 Trust with Public Agency Retirement Services (PARS) at the close of fiscal year 2016/17. Initial General Fund funding for the PSF came in the form of reserves over policy of $2.8 million.
2.) The City acted again during fiscal year 2017/18 budgeting for additional monthly contributions from the General Fund to the City’s PSF totaling $2,019,230.
3.) The City acted a third time in fiscal year 2017/18 by electing to make its Unfunded Accrued Liability (UAL) payment in full in July 2017, realizing a 3.6% savings on the annual CalPERS UAL bill as compared to the monthly billing option, which was used as the basis for the fiscal year 2017/18 budget.
4.) The fourth major action on pension stabilization came in the form of Council adopting a Pension Stabilization policy on December 6, 2017, that invests all General Fund reserves in excess of the 16% reserve policy in the PSF until such time as the City’s pension system is 80% funded. Funded status is calculated by comparing total accrued liabilities to combined CalPERS and PSF

14
assets. Other funds are similarly required to make contributions to the PSF on a prorated basis to the General Fund contribution based on the current year’s total CalPERS budget for that fund. Implementation of that policy will result in additional funding to the PSF of $3.4 million from the General Fund in fiscal year 2017/18 and another $1.3 million from operations outside the General Fund.
Based on a combination of these actions, by the end of fiscal year 2017/18, total funding in the PSF is estimated as follows: General Fund: $8.2 million; Other Funds $2.9 million. Current labor agreements with all City bargaining units expire on December 31, 2017. Current negotiations are proceeding favorably, maintaining the tradition of strong labor-management relationships. There are no tentative agreements at this time. Capital programs – The City continues to utilize one-time funds for capital maintenance, rather than ongoing operations. The Library and Parks, Recreation and Cultural Services (PRCS), are strategically using resources from vacant positions to add to fund balances and deploying reserves to capital projects as necessary. This strategy resulted in funding for the roof repair and teen center project at the library that will be completed in late 2017. With the failure of Measure R, a 1/8 cent sales tax measure for PRCS capital, the PRCS department has begun scrutinizing operations and capturing budget savings caused primarily by vacancy and utilizing that funding for needed capital replacement and repairs at various facilities City wide. Imposed costs – The primary concern to the City’s budget is the imposed cost increases by CalPERS related to the discount rate reduction from 7.5% to 7.0%. CalPERS’ board is currently considering its Asset Liability Management and Amortization policies, which may have an impact on the discount rate or on the phased in approach currently adopted by the board to implement the discount rate reduction. Management is aggressively implementing solutions to counter the imposed costs from the currently approved reduction. A further discount rate reduction or modification to the amortization policy would have significant impacts on the City’s ability to fund current operations and require difficult service level and service priority discussions. Rapidly increasing health care costs continue to be a concern. While the City has negotiated a medical insurance cap with its bargaining units, costs are expected to increase and impact the net pay of the workforce and possibly the City’s competitiveness in the labor marketplace. Staff has managed the impact of the Affordable Care Act, and through prudent management of part-time hours, has allowed the City to avoid an economic impact. A third cost increase that is a cause of concern is worker’s compensation. The City is self-funded for worker’s compensation costs. Lodi’s claim experience has ebbed and flowed since a spike in fiscal year 2008/09. Current loss experience is relatively level with costs trending upward with the settlement of old claims. The City has funded its actuarial liability at more than the 90 percent confidence level. Staff continues to manage the program and provide education to employees to minimize injuries and work time losses. Economic Development The City continues its commitment to promoting economic development (business retention and attraction) and expanding the tax base to fund City services. The City has provided for additional retail sales and commercial activity with approval of new retail developments adjacent to Highway 99 and Harney Lane in the southeast corner of the City, and with a large retail development in the southwest corner of the City. In 2017, steady progress toward buildout and occupancy of the new retail development has occurred and that is expected to continue into 2018.

15
Tourism continues to be a major driving factor of the local economy. The City currently has three approved hotel sites, one with an issued building permit, and the two others with permits ready or near ready for issuance. Additional progress on all three projects is expected in 2018. In addition, the City has a wide range of small, financially sound businesses that add to the economic strength of the City. These companies range in size from 10 to 150 employees and produce a wide variety of products, services and commodities. The City is growing and over the last few years it has seen significant new commercial, industrial and residential development projects come to fruition. Hundreds of new homes have already been constructed and hundreds more are entitled. The City’s first market rate apartment complex in over 25 years is being completed along with an age restricted apartment complex. The combined ever-growing strength of the wine grape and tourism industries is a positive indicator for the City moving forward. The City’s focus on economic development, compact development and quality of life has encouraged these investments within the City, collectively creating hundreds of new employment and housing opportunities. The City’s unemployment rate is roughly 0.5 percent lower than that of San Joaquin County. The City’s diversified economic base contributes to this relatively stronger employment market and continues to help the City maintain its revenue base. Lodi is best known for its Zinfandel wines; however, Lodi is an authentic and dynamic wine region with more than 80 wineries within 10 miles of downtown. The City’s employment base is just as diverse with industry that includes agribusiness, biotechnology, distribution, food and beverage product manufacturing, general service, government, health care, heavy manufacturing, and, of course, wine based tourism and lodging.
Lodi Unified School District, Adventist Health Lodi Memorial Hospital, Pacific Coast Producers, Blue Shield and Tree House Foods have the highest year-round employment in the City. Large national and international manufacturers such as Dart Container Corporation and North American Specialty Products find the City an attractive base for their West Coast operations. Cepheid, a Sunnyvale, California-based biotech company with a growing manufacturing presence in Lodi since 2012, continues to invest in Lodi and increase production of its proprietary molecular diagnostic product and the expansion is expected to create hundreds of additional jobs over the next few years. Mitsui Home America (MHA) has begun tenant improvements at the former Plummer auto dealership/Calturas wine and beer center, and expects to open December 2017 with approximately 30 employees, with a build-out of approximately 80 employees. MHA provides pre-fabricated lumber wall systems for commercial buildings, including the Rubicon Apartment complex under construction in Reynolds Ranch. MHA’s parent company is Japan’s Mitsui, one of the world’s largest conglomerates, that dates its origins to the 17th century.
REQUEST FOR INFORMATION This financial report is designed to provide citizens, taxpayers, customers, investors and creditors with a general overview of the City’s finances and to demonstrate the City’ accountability for the money it receives. If you have any questions about this report or need additional information, contact the Financial Services Division of the City of Lodi at 310 W. Elm Street, Lodi, California, 95240.

(This page intentionally left blank.)

BASIC FINANCIAL STATEMENTS The Government-wide Financial Statements provide a broad overview of the City’s financial position and operating results. Information is grouped by governmental activities or business-type activities. The Fund Financial Statements report information about the City’s Governmental Funds, Proprietary Funds, and the Fiduciary Funds. The notes have an integral role in disclosing information essential to the fair presentation of the Basic Financial Statements.

GOVERNMENT-WIDE FINANCIAL STATEMENTS

The notes to financial statements are an integral part of this statement. 17
Governmental Activities
Business-type Activities Total
ASSETSCash and investments 45,533,596$ 37,089,489$ 82,623,085$ Accounts receivable, net 6,274,726 8,244,517 14,519,243 Property tax receivable 41,462 - 41,462 Interest receivable 53,962 70,776 124,738 Internal balances (1,088,311) 1,088,311 - Due from other governmental agencies 2,176,149 1,375,170 3,551,319 Restricted cash and investments - 27,805,247 27,805,247 Advance receivable - 9,082,666 9,082,666 Inventory 145,776 3,231,896 3,377,672 Other assets 102,920 - 102,920 Capital assets: Nondepreciable 43,669,306 20,944,904 64,614,210 Depreciable, net 92,762,785 220,257,885 313,020,670
Total assets 189,672,371 329,190,861 518,863,232
DEFERRED OUTFLOWS OF RESOURCESUnamortized losses on defeasance 381,590 7,066,131 7,447,721 Related to pensions 17,439,844 4,746,747 22,186,591
Total deferred outflows of resources 17,821,434 11,812,878 29,634,312
LIABILITIESAccounts payable and accrued liabilities 7,056,501 6,358,186 13,414,687 Accrued salaries and wages 827,017 - 827,017 Accrued interest 207,343 2,063,378 2,270,721 Unearned revenue 124,436 1,151,434 1,275,870 Long-term liabilities: Due within one year 5,050,076 6,626,520 11,676,596 Due in more than one year 31,017,757 152,555,389 183,573,146 Other long-term obligations: Net OPEB obligation 8,939,061 - 8,939,061 Net pension liability 95,864,664 22,155,886 118,020,550
Total liabilities 149,086,855 190,910,793 339,997,648
DEFERRED INFLOWS OF RESOURCESRelated to pensions 2,828,147 614,731 3,442,878
NET POSITIONNet investment in capital assets 117,196,121 129,085,926 246,282,047 Restricted for:
Road-related projects 5,286,754 - 5,286,754 Capital projects 5,071,616 - 5,071,616 Debt service - 3,929,138 3,929,138 Home and CDBG program 69,932 - 69,932 Public safety 428,841 - 428,841 Community development 3,892,405 - 3,892,405 Parks, recreation, and community services 795,511 - 795,511
Unrestricted (77,162,377) 16,463,151 (60,699,226) Total net position 55,578,803$ 149,478,215$ 205,057,018$
City of LodiStatement of Net Position
June 30, 2017

The notes to financial statements are an integral part of this statement. 18
Functions/Programs Expenses Charges for ServicesOperating Grants and
ContributionsCapital Grants and
ContributionsGovernmental
ActivitiesBusiness-type
Activities TotalPrimary government:Governmental activities:
General government 9,650,423$ 3,246,136$ 60,464$ -$ (6,343,823)$ -$ (6,343,823)$ Public protection 33,238,886 779,223 1,217,559 121,826 (31,120,278) - (31,120,278) Public works 10,614,158 1,209,311 1,045,712 12,367,232 4,008,097 - 4,008,097 Community development 1,709,246 2,838,343 32,604 - 1,161,701 - 1,161,701 Library 1,252,743 42,616 34,676 - (1,175,451) - (1,175,451) Parks and recreation 3,663,013 1,659,454 - 341,404 (1,662,155) - (1,662,155) Interest on long-term debt 824,021 - - - (824,021) - (824,021)
Total governmental activities 60,952,490 9,775,083 2,391,015 12,830,462 (35,955,930) - (35,955,930)
Business-type activities:Electric 62,790,906 65,847,581 2,369,725 553,776 - 5,980,176 5,980,176 Wastewater 16,317,764 15,106,432 - 4,029,314 - 2,817,982 2,817,982 Water 11,960,786 12,473,676 616,366 1,427,149 - 2,556,405 2,556,405 Transit 4,925,638 220,218 1,527,831 1,962,373 - (1,215,216) (1,215,216)
Total business-type activities 95,995,094 93,647,907 4,513,922 7,972,612 - 10,139,347 10,139,347 Total 156,947,584$ 103,422,990$ 6,904,937$ 20,803,074$ (35,955,930) 10,139,347 (25,816,583)
14,859,923 - 14,859,923 9,099,494 - 9,099,494 1,736,072 - 1,736,072
848,735 - 848,735 11,777,544 - 11,777,544
257,356 816,433 1,073,789 721,575 2,785,481 3,507,056
4,051,000 (4,051,000) - 43,351,699 (449,086) 42,902,613
7,395,769 9,690,261 17,086,030
48,183,034 139,787,954 187,970,988
55,578,803$ 149,478,215$ 205,057,018$ Net position - ending
Transient occupancy taxGrants and contributions not restricted to specific programsInvestment earningsOther
TransfersTotal general revenues and transfers
General revenues:Property taxes
Change in net position
Franchise taxesBusiness license tax
Net position - beginning
City of LodiStatement of Activities
For the Year Ended June 30, 2017
Net (Expense) Revenue and Changes in Net PositionProgram Revenues

FUND FINANCIAL STATEMENTS

19
FUND FINANCIAL STATEMENTS
Governmental Fund Types
Governmental funds consist of the General Fund, special revenue funds, debt service fund and capital projects funds. Major Governmental Funds:
General Fund
This fund is maintained to account for all financial resources that are not restricted as to their use. This includes property and sales taxes, business tax receipts, franchise taxes and various subventions such as Motor Vehicle In-Lieu fees received from the State of California. With the exception of grant programs, General Fund resources can be utilized for any legitimate governmental purpose.
Streets Fund This fund was established to account for the following: Gas Tax
To account for revenues and expenditures apportioned to the City under the Streets and Highway Code. Portions of the tax rate levied by the State of California on all gasoline purchases are allocated to cities throughout the State on a population basis. These funds are restricted for expenditure by the State of California for street related purposes only.

20
Development Impact Mitigation Fees To account for impact fees charged to provide for the building of various storm drains and street improvements needed to serve new development. The fees are calculated on a per acre basis and are collected at subdivision final map approval or with building permit stage effective November 4, 1991.
Measure K Sales Tax
To account for revenues and expenditures apportioned to the City for sales tax collections under Measure K. Expenditures for administration, maintenance and construction must be for street-related projects.
Intermodal Surface Transportation Efficiency Act (ISTEA) To account for revenues from the federal highway administration for programs including surface transportation program (STP) for streets and roads, congestion mitigation and air quality program (CMAQ) and hazard elimination safety (HES) for street lighting projects. Proprietary Fund Types
Proprietary funds consist of the enterprise funds and the internal service funds. Major Enterprise Funds include:
Electric Fund The City established this fund in order to account for the provision of electric services to the residents of the City. All activities necessary to provide such services are accounted for in this fund, including but not limited to, source of supply, overhead, systems maintenance, customer service, engineering, administration, capital improvements maintenance and debt service.
Wastewater Fund
This fund was established by the City in order to account for the provision of wastewater collection and treatment services to the residents of the City. All activities necessary to provide such services are accounted for in this fund, including, but not limited to, administration, operations, maintenance, improvements and debt service.

21
Water Fund
This fund was established by the City in order to account for the provision of water to the residents of the City as well as some customers in the County. All activities to provide such services are accounted for in this fund, including, but not limited to administration, operations, distribution, maintenance, capital improvements and debt service.
Nonmajor Enterprise Fund: Transit Fund This fund is used to account for the operations of the Dial-A-Ride and the Grapeline bus system. Fiduciary Fund Types
Private-purpose Trust Funds These funds are used to account for assets held by the Library Board as trustee of the Lodi Public Library and for assets held by the City in accordance with the trust agreement on behalf of the Hutchins Street Square.
Agency Fund This fund was established to account for special assessments collected on the property tax roll by the City on behalf of the property owners within the Industrial Way Beckman Districts and the Downtown and Cherokee Lane Districts and various landscape and lighting districts around the City.

(This page intentionally left blank.)

The notes to financial statements are an integral part of this statement. 23
General StreetsOther Governmental
FundsTotal Governmental
FundsASSETSCash and investments 15,550,701$ 4,091,482$ 11,564,016$ 31,206,199$ Accounts receivable, net 5,253,103 735,748 253,367 6,242,218 Property tax receivable 41,462 - - 41,462 Interest receivable 12,861 6,600 13,519 32,980 Due from other funds - - 195,698 195,698 Due from other governmental agencies - 1,668,789 507,360 2,176,149 Inventory - - 1,355 1,355
Total assets 20,858,127$ 6,502,619$ 12,535,315$ 39,896,061$
LIABILITIESAccounts payable and other liabilities 4,716,588$ 1,222,421$ 940,641$ 6,879,650$ Accrued salaries and wages 827,017 - - 827,017 Due to other funds - - 195,698 195,698 Advances from other funds - - 1,088,311 1,088,311 Unearned revenue 78,632 - 45,804 124,436
Total liabilities 5,622,237 1,222,421 2,270,454 9,115,112
DEFERRED INFLOWS OF RESOURCESUnavailable revenue 267,533 56,240 225,134 548,907
FUND BALANCESNonspendable Inventory - - 1,355 1,355 Restricted for:
Road-related projects - 5,223,958 6,556 5,230,514 Capital projects - - 4,891,259 4,891,259 Home and CDBG program - - 25,225 25,225 Public safety - - 428,841 428,841 Community development - - 3,892,405 3,892,405 Parks, recreation and community services - - 794,086 794,086
CommittedPension 2,941,844 - - 2,941,844 Video - related capital projects 578,528 - - 578,528
Unassigned 11,447,985 - - 11,447,985 Total fund balances 14,968,357 5,223,958 10,039,727 30,232,042
Total liabilities, deferred inflows of resources, and fund balances 20,858,127$ 6,502,619$ 12,535,315$ 39,896,061$
City of LodiBalance Sheet
Governmental Funds June 30, 2017

The notes to the financial statements are an integral part of this statement. 24
Fund balances - total governmental funds $ 30,232,042
Amounts reported for governmental activities in the statement of net position are different because:
Capital assets used in governmental activities are not financialresources and, therefore, are not reported in the funds.
Nondepreciable capital assets 43,669,306 Depreciable capital assets, net 92,738,182
Deferred outflows of resources related to pensions are not reported in governmental funds. 17,439,844 Deferred inflows of resources related to pensions are not reported in governmental funds. (2,828,147)
Long-term liabilities and related accounts are not due and payable in the current periodand therefore are not reported in the governmental funds as follows:
Compensated absences (7,475,155) Long-term debt (18,854,970) Issuance premium (to be amortized as interest expense) (762,590) Unamortized losses on defeasance (to be amortized as interest expense) 381,590 Accrued interest (207,343) Net pension liability (95,864,664) Net OPEB obligation (8,939,061)
Other long-term assets are not available to pay for current period expenditures and,therefore, are deferred in the funds. 548,907
Internal service funds are used by management to charge the costs of generalliability insurance, workers' compensation insurance, health benefits insurance,other insurance, employee benefits and the cost of operating and maintaining theCity's fleet to individual funds. The assets and liabilities of the internal service funds are included in governmental activities in the statement of net position 5,500,862
Net position of governmental activities $ 55,578,803
June 30, 2017
City of LodiReconciliation of the Balance Sheet of Governmental Funds
to the Statement of Net Position

The notes to financial statements are an integral part of this statement. 25
General StreetsOther Governmental
FundsTotal Governmental
FundsREVENUESTaxes 26,490,919$ -$ -$ 26,490,919$ Licenses and permits 86,844 - 1,928,188 2,015,032 Intergovernmental revenues 12,830,329 9,883,250 1,261,109 23,974,688 Charges for services 1,852,855 1,095,631 2,773,823 5,722,309 Fines, forfeits, and penalties 906,563 - - 906,563 Investment and rental income 1,734,773 22,325 562,188 2,319,286 Miscellaneous revenue 319,373 156,149 342,105 817,627
Total revenues 44,221,656 11,157,355 6,867,413 62,246,424
EXPENDITURESCurrent:
General government 6,926,368 - 2,572,511 9,498,879 Public protection 29,969,781 - 231,516 30,201,297 Public works 1,698,518 2,036,612 872,730 4,607,860 Community development - - 1,650,876 1,650,876 Library 1,152,721 - - 1,152,721 Parks and recreation - - 2,377,753 2,377,753 Capital outlay - 8,092,111 3,500,259 11,592,370
Debt service:Interest - - 858,182 858,182 Principal retirement - - 1,240,417 1,240,417
Total expenditures 39,747,388 10,128,723 13,304,244 63,180,355
Excess (deficiency) of revenues over (under) expenditures 4,474,268 1,028,632 (6,436,831) (933,931)
OTHER FINANCING SOURCES (USES)Transfers in 3,952,000 620,810 7,149,774 11,722,584 Transfers out (6,705,104) - (966,480) (7,671,584)
Total other financing sources (uses) (2,753,104) 620,810 6,183,294 4,051,000
Changes in fund balances 1,721,164 1,649,442 (253,537) 3,117,069
Fund balances - beginning 13,247,193 3,574,516 10,293,264 27,114,973 Fund balances - ending 14,968,357$ 5,223,958$ 10,039,727$ 30,232,042$
City of LodiStatement of Revenues, Expenditures, and Changes in Fund Balances
Governmental FundsFor the Year Ended June 30, 2017

The notes to the financial statements are an integral part of this statement. 26
Changes in fund balances - total governmental funds $ 3,117,069
Amounts reported for governmental activities are different because:Governmental funds report capital outlays as expenditures. However, in thestatement of activities the cost of those assets is allocated over their estimateduseful lives and reported as depreciation expense. In addition, contributed capitalassets do not impact the governmental funds however they are reported in the statement of activities.Capital outlays, capital asset contributions, and depreciation expense are as follows:
Capital outlays 11,592,370 Capital asset contributions 1,489,658 Depreciation expense (8,391,791)
The statement of activities reports gain and losses arising from the disposal of exisiting capital assets. However, in the governmental funds, any proceeds from the sale of disposed capital assets increases financial resources. Thus, the changein net position differs from the change in fund balance by the book value of the disposed capital assets. (15,973)
Repayments of the principal are expenditures in the governmental funds, but the repaymentsreduce long-term liabilities in the statement of net position.
Principal payment 1,240,417
Internal service funds are used by management to charge the costs of generalliability insurance, workers' compensation insurance, health benefits insurance,other insurance, employee benefits and the cost of operating and maintaining theCity's fleet to individual funds. The net loss of the internal servicefunds are reported with governmental activities. (383,166)
Other expenses in the statement of activities that do not use current financial resources are not reported as expenditures in the governmental funds.
Change in compensated absences 180,027 Amortization of loss on defeasance (26,936) Amortization of bond premium 53,830 Change in unavailable revenue 504,200 Change in accrued interest 7,267 Change in net pension liability and related amounts (592,442) Change in OPEB obligation (1,378,761)
Change in net position of governmental activities $ 7,395,769
City of LodiReconciliation of the Statement of Revenues,
Expenditures, and Changes in Fund Balances of Governmental Fundsto the Statement of Activities
For the Year Ended June 30, 2017

The notes to financial statements are an integral part of this statement. 27
Governmental Activities
Electric Wastewater WaterNonmajor Fund
Transit Total Enterprise Funds Internal Service FundsASSETSCurrent assets:
Cash and investments 14,037,173$ 16,381,062$ 4,558,222$ 2,113,032$ 37,089,489$ 14,327,397$ Restricted cash and investments - - 13,844,773 - 13,844,773 - Restricted cash and investments with fiscal agents 9,286,277 150,376 2,353,971 - 11,790,624 - Accounts receivable, net 4,641,286 1,192,200 1,103,131 1,307,900 8,244,517 32,508 Interest receivable 20,173 23,307 24,207 3,089 70,776 20,982 Due from other funds - - - - - 27,692 Due from other governmental agencies - - 55,170 1,320,000 1,375,170 - Advance receivable 9,082,666 - - - 9,082,666 - Inventory 2,853,310 86,412 292,174 - 3,231,896 144,421 Other assets - - - - - 102,920
Total current assets 39,920,885 17,833,357 22,231,648 4,744,021 84,729,911 14,655,920
Noncurrent assets:Restricted assets with fiscal agents - 2,169,850 - - 2,169,850 - Advances to other funds - 64,286 1,024,025 - 1,088,311 - Capital assets: Nondepreciable 763,785 9,960,740 6,793,737 3,426,642 20,944,904 - Depreciable, net 39,064,648 79,079,382 88,712,787 13,401,068 220,257,885 24,603
Total noncurrent assets 39,828,433 91,274,258 96,530,549 16,827,710 244,460,950 24,603 Total assets 79,749,318 109,107,615 118,762,197 21,571,731 329,190,861 14,680,523
DEFERRED OUTFLOWS OF RESOURCESUnamortized losses on defeasance 4,524,834 2,541,297 - - 7,066,131 - Related to pensions 2,576,364 1,820,983 216,508 132,892 4,746,747 -
Total deferred outflows of resources 7,101,198 4,362,280 216,508 132,892 11,812,878 -
LIABILITIESCurrent liabilities:
Accounts payable and other liabilities 2,948,660 696,251 2,297,372 415,903 6,358,186 176,851 Accrued interest 1,437,118 458,122 168,138 - 2,063,378 - Due to other funds - - - - - 27,692 Unearned revenue - - 660,104 491,330 1,151,434 - Loans payable 204,432 - - - 204,432 - Self-insurance liability - - - - - 2,365,077 Accrued compensated absences 322,597 207,201 19,760 18,392 567,950 29,371 Certificates of participation and revenue bonds payable 2,534,909 1,949,529 969,700 - 5,454,138 - Pollution remediation obligation - - 400,000 - 400,000 -
Total current liabilities 7,447,716 3,311,103 4,515,074 925,625 16,199,518 2,598,991
Noncurrent liabilities:Self-insurance liability - - - - - 6,477,321 Accrued compensated absences 791,348 900,695 - 74,258 1,766,301 103,349 Certificates of participation and revenue bonds payable 56,133,721 43,492,066 33,113,405 - 132,739,192 - Loans payable 1,095,888 - - - 1,095,888 - Net pension liability 12,025,422 8,499,611 1,010,570 620,283 22,155,886 - Pollution remediation obligation - - 16,954,008 - 16,954,008 -
Total noncurrent liabilities 70,046,379 52,892,372 51,077,983 694,541 174,711,275 6,580,670 Total liabilities 77,494,095 56,203,475 55,593,057 1,620,166 190,910,793 9,179,661
DEFERRED INFLOWS OF RESOURCESRelated to pensions 333,654 235,828 28,039 17,210 614,731 -
NET POSITIONNet investment in capital assets 20,776 48,460,050 63,777,390 16,827,710 129,085,926 24,603 Restricted for:
Debt service 3,929,138 - - - 3,929,138 - Unrestricted 5,072,853 8,570,542 (419,781) 3,239,537 16,463,151 5,476,259
Total net position 9,022,767$ 57,030,592$ 63,357,609$ 20,067,247$ 149,478,215$ 5,500,862$
Business-type Activities
City of LodiStatement of Fund Net Position
Proprietary Funds June 30, 2017

The notes to financial statements are an integral part of this statement. 28
Governmental Activities
Electric Wastewater WaterNonmajor Fund
Transit Total Enterprise Funds Internal Service FundsOPERATING REVENUESCharges for services 65,847,581$ 15,106,432$ 12,473,676$ 220,218$ 93,647,907$ 13,699,647$
OPERATING EXPENSESPersonnel services 7,591,106 4,501,156 2,998,026 407,518 15,497,806 1,669,133 Supplies, materials and services 13,955,262 4,828,494 3,468,229 3,023,866 25,275,851 8,935,742 Utilities 35,706,710 798,452 453,488 59,071 37,017,721 14,327 Depreciation 2,357,261 4,078,389 2,989,058 1,435,183 10,859,891 1,447 Claims - - - - - 3,687,649
Total operating expenses 59,610,339 14,206,491 9,908,801 4,925,638 88,651,269 14,308,298
Operating income (loss) 6,237,242 899,941 2,564,875 (4,705,420) 4,996,638 (608,651)
NONOPERATING REVENUES (EXPENSES)Investment income 151,112 510,079 132,364 22,878 816,433 72,950 Interest expense (3,180,567) (2,111,273) (2,051,985) - (7,343,825) - Operating grants - - 616,366 1,527,831 2,144,197 - Greenhouse gas allowance 2,369,725 - - - 2,369,725 - Other revenues 1,732,614 511,689 395,390 145,788 2,785,481 152,535
Total nonoperating revenues (expenses) 1,072,884 (1,089,505) (907,865) 1,696,497 772,011 225,485
Income (loss) before contributions and transfers 7,310,126 (189,564) 1,657,010 (3,008,923) 5,768,649 (383,166)
Capital contributions 553,776 4,029,314 1,427,149 1,962,373 7,972,612 - Transfers out (2,137,000) (1,101,000) (813,000) - (4,051,000) -
Changes in net position 5,726,902 2,738,750 2,271,159 (1,046,550) 9,690,261 (383,166)
Total net position - beginning 3,295,865 54,291,842 61,086,450 21,113,797 139,787,954 5,884,028 Total net position - ending 9,022,767$ 57,030,592$ 63,357,609$ 20,067,247$ 149,478,215$ 5,500,862$
Business-type Activities
City of LodiStatement of Revenues, Expenses, and Changes in Fund Net Position
Proprietary FundsFor the Year Ended June 30, 2017

The notes to financial statements are an integral part of this statement. 29
Governmental Activities
Electric Wastewater WaterNonmajor Fund
Transit Total Enterprise Funds Internal Service FundsCASH FLOWS FROM OPERATING ACTIVITIES
Cash receipts from customers 65,920,109$ 15,584,448$ 12,780,899$ 366,006$ 94,651,462$ 168,737$ Cash receipts from interfund services provided 110,921 - - - 110,921 13,699,647 Payments to suppliers (49,808,279) (4,702,935) (5,037,345) (2,844,072) (62,392,631) (12,280,677) Payments to employees (7,779,075) (3,932,675) (2,765,598) (375,885) (14,853,233) (1,671,760) Payments for interfund services provided (4,543) (723,228) (429,573) (48,231) (1,205,575) -
Net cash provided (used) by operating activities 8,439,133 6,225,610 4,548,383 (2,902,182) 16,310,944 (84,053)
CASH FLOWS FROM NONCAPITAL FINANCING ACTIVITIESOperating grants - - 616,366 3,002,049 3,618,415 - Repaid advance from other funds (576,378) - - - (576,378) - Repaid advance to other funds - 128,571 626,378 - 754,949 - Received - greenhouse gas allowance 2,369,725 - - - 2,369,725 - Transfers out (2,137,000) (1,101,000) (813,000) - (4,051,000) -
Net cash provided (used) by noncapital financing activities (343,653) (972,429) 429,744 3,002,049 2,115,711 -
CASH FLOWS FROM CAPITAL AND RELATED FINANCING ACTIVITIESFees received for water meter installations - - 19,255 - 19,255 - Acquisition and construction of capital assets (1,057,594) (2,038,749) (4,477,695) (1,445,603) (9,019,641) - Fees received from developers 83,914 579,311 206,847 - 870,072 - Capital grants received - 273,267 - 1,956,104 2,229,371 - Principal payments on debt (2,589,680) (1,575,000) (915,000) - (5,079,680) - Interest payments on debt (2,941,434) (1,913,522) (2,055,106) - (6,910,062) -
Net cash provided (used) by capital and related financing activities (6,504,794) (4,674,693) (7,221,699) 510,501 (17,890,685) -
CASH FLOWS FROM INVESTING ACTIVITIESInterest on investments 118,564 203,047 106,571 21,527 449,709 66,459
Net increase (decrease) in cash and cash equivalents 1,709,250 781,535 (2,137,001) 631,895 985,679 (17,594)
Balances - beginning of year 21,614,200 15,749,903 22,893,967 1,481,137 61,739,207 14,344,991 Balances - end of the year 23,323,450$ 16,531,438$ 20,756,966$ 2,113,032$ 62,724,886$ 14,327,397$
(continued)
Business-type Activities - Enterprise Funds
City of LodiStatement of Cash Flows
Proprietary FundsFor the Year Ended June 30, 2017
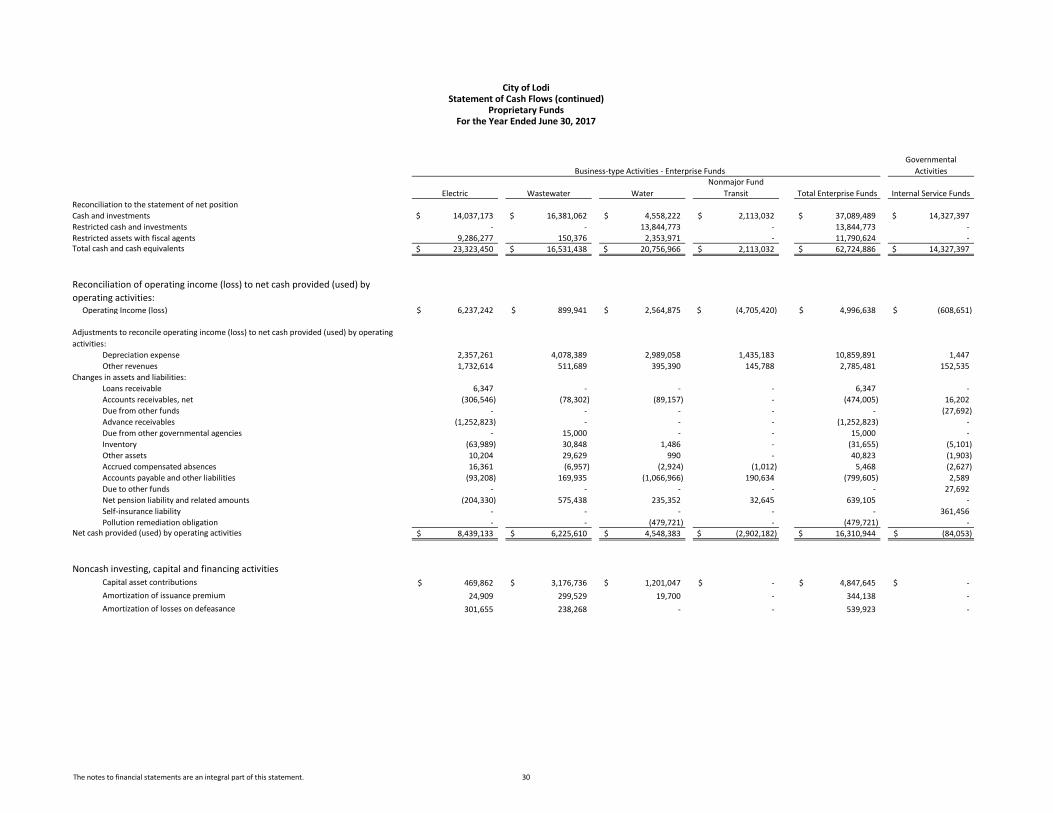
The notes to financial statements are an integral part of this statement. 30
Governmental Activities
Electric Wastewater WaterNonmajor Fund
Transit Total Enterprise Funds Internal Service FundsReconciliation to the statement of net positionCash and investments 14,037,173$ 16,381,062$ 4,558,222$ 2,113,032$ 37,089,489$ 14,327,397$ Restricted cash and investments - - 13,844,773 - 13,844,773 - Restricted assets with fiscal agents 9,286,277 150,376 2,353,971 - 11,790,624 - Total cash and cash equivalents 23,323,450$ 16,531,438$ 20,756,966$ 2,113,032$ 62,724,886$ 14,327,397$
Reconciliation of operating income (loss) to net cash provided (used) by operating activities:
Operating Income (loss) 6,237,242$ 899,941$ 2,564,875$ (4,705,420)$ 4,996,638$ (608,651)$
Adjustments to reconcile operating income (loss) to net cash provided (used) by operating activities:
Depreciation expense 2,357,261 4,078,389 2,989,058 1,435,183 10,859,891 1,447 Other revenues 1,732,614 511,689 395,390 145,788 2,785,481 152,535
Changes in assets and liabilities:Loans receivable 6,347 - - - 6,347 - Accounts receivables, net (306,546) (78,302) (89,157) - (474,005) 16,202 Due from other funds - - - - - (27,692) Advance receivables (1,252,823) - - - (1,252,823) - Due from other governmental agencies - 15,000 - - 15,000 - Inventory (63,989) 30,848 1,486 - (31,655) (5,101) Other assets 10,204 29,629 990 - 40,823 (1,903) Accrued compensated absences 16,361 (6,957) (2,924) (1,012) 5,468 (2,627) Accounts payable and other liabilities (93,208) 169,935 (1,066,966) 190,634 (799,605) 2,589 Due to other funds - - - - - 27,692 Net pension liability and related amounts (204,330) 575,438 235,352 32,645 639,105 - Self-insurance liability - - - - - 361,456 Pollution remediation obligation - - (479,721) - (479,721) -
Net cash provided (used) by operating activities 8,439,133$ 6,225,610$ 4,548,383$ (2,902,182)$ 16,310,944$ (84,053)$
Noncash investing, capital and financing activitiesCapital asset contributions 469,862$ 3,176,736$ 1,201,047$ -$ 4,847,645$ -$ Amortization of issuance premium 24,909 299,529 19,700 - 344,138 - Amortization of losses on defeasance 301,655 238,268 - - 539,923 -
For the Year Ended June 30, 2017
Business-type Activities - Enterprise Funds
City of LodiStatement of Cash Flows (continued)
Proprietary Funds

The notes to financial statements are an integral part of this statement. 31
Private-Purpose Trust Funds Agency Fund
ASSETSCash and investments 236,118$ 406,729$ Interest receivable 2 590
Total assets 236,120 407,319
LIABILITIESAgency obligations - 407,319
NET POSITION - EXPENDABLE 236,120$ -$
City of LodiStatement of Fiduciary Net Position
June 30, 2017Fiduciary Funds

The notes to financial statements are an integral part of this statement. 32
ADDITIONSInvestment and rental income 10,301$
DEDUCTIONSCurrent: Library 9,410
Changes in net position 891
Net position -- beginning 235,229 Net position -- end 236,120$
City of LodiStatement of Changes in Fiduciary Net Position
For the Year Ended June 30, 2017Private-Purpose Trust Funds

NOTES TO BASIC FINANCIAL STATEMENTS

CITY OF LODI Notes to Basic Financial Statements
June 30, 2017
33
(1) SUMMARY OF SIGNIFICANT ACCOUNTING POLICIES
(a) The Financial Reporting Entity
The City of Lodi (City) was incorporated on December 6, 1906, as a municipal corporation under the General Laws of the State of California. The City operates under a Council-Manager form of government and provides the following services: general government, public works, community development, public protection (police and fire), public utilities, library, parks and recreation. The accounting policies of the City conform to generally accepted accounting principles (GAAP) as applicable to governments in the United States of America. The Governmental Accounting Standards Board (GASB) is the accepted standard setting body for governmental accounting and financial reporting principles. An elected five-member council governs the City of Lodi. As required by GAAP, these financial statements present the City and its component units, entities for which the City is considered to be financially accountable. The component units, although legally separate entities, are, in substance, part of the City’s operations and therefore, their activities are blended with data of the City.
Blended Component Units
The blended component units of the City are as follows:
The Lodi Public Improvement Corporation (LPIC) was formed on April 26, 1988, for the purpose of rendering financial assistance to the City in the issuance of the 1988 Certificates of Participation (refunded by the issuance of the 1991 Certificates of Participation) to finance the expansion of the City's White Slough Pollution Control Facility. Since then, several Certificates of Participation were issued to finance various major projects (See Note 8). The City Council constitutes the Board of Directors of LPIC. The funds of LPIC have been included in the Enterprise (Electric and Wastewater) Funds and in the other governmental funds in the accompanying basic financial statements. The Lodi Financing Corporation (LFC) was formed on October 12, 1999, for the purpose of assisting the City with the financing of the costs of its environmental abatement program and enhancing the water supply of the City for the use, benefit and enjoyment of the citizens served by the City. The City Council is the Board of Directors of LFC. The funds of LFC are included in the Water Fund in the accompanying basic financial statements. The Lodi Public Financing Authority (LPFA) was created by a Joint Exercise of Powers Agreement between the City and the Industrial Development Authority (IDA) on July 21, 2010, for the purpose of assisting the City in the financings of public capital improvements. The 2010 Water Revenue Bonds Series A and B were issued in October 2010 to provide funds for a new water treatment facility. On September 1, 2012, the $19,080,000 Refunding Lease Revenue Bonds (2012 LRB) were issued to prepay and cause the immediate defeasance of the outstanding $21,025,000 Certificates of Participation (2002 COP). The 2002 COP were issued in January 2002 to provide funds to finance the costs of

CITY OF LODI Notes to Basic Financial Statements (continued)
June 30, 2017
34
constructing, furnishing and equipping a new police building and jail for the City, to finance portions of certain other projects and to refund the outstanding 1995 and 1996 Certificates of Participation. The $17,105,000 2012 Refunding Wastewater Revenue Bonds (2012 Bonds) were also issued in September 2012 to advance refund the $17,115,000 principal amount of the 2004 Wastewater Revenue Certificates of Participation (2004 COP). The 2004 COP were issued to provide funds to finance the costs of certain improvements to the wastewater collection, treatment and disposal system of the City. The 2016 Refunding Wastewater Revenue Bonds (2016 Bonds) were issued to refinance $21,415,000 principal amount of the 2007 Wastewater System Revenue Certificates of Participation (2007 COP). The City Council constitutes the Board of Directors of LPFA. The funds of LPFA have been included in the governmental activities and Enterprise (Wastewater and Water) Funds and in the accompanying basic financial statements. (b) Government-Wide and Fund Financial Statements
The government-wide financial statements (i.e., the statement of net position and the statement of activities) report information on all of the non-fiduciary activities of the primary government and its component units. For the most part the effect of interfund activity has been removed from these statements. Governmental activities, which normally are supported by taxes and intergovernmental revenues, are reported separately from business-type activities that rely, to a significant extent, on fees and charges for support. The statement of activities demonstrates the degree to which the direct expenses of a given function are offset by program revenues. Direct expenses are those that are clearly identifiable with a specific function or segment. Program revenues include (1) charges to customers or applicants who purchase, use, or directly benefit from goods, services, or privileges provided by a given function or segment and (2) grants and contributions that are restricted to meeting the operational or capital requirements of a particular function. Taxes and other items not properly included among program revenues are reported instead as general revenues. Separate financial statements are provided for governmental funds, proprietary funds, and fiduciary funds, even though the latter are excluded from the government-wide financial statements. Major individual governmental funds and major individual enterprise funds are reported as separate columns in the fund financial statements. (c) Measurement Focus, Basis of Accounting, and Financial Statement Presentation The government-wide financial statements are reported using the economic resources measurement focus and accrual basis of accounting, as are the proprietary fund and private-purpose trust fund financial statements. Revenues are recorded when earned and expenses are recorded when a liability is incurred, regardless of the timing of related cash flows. Property taxes are recognized as revenues in the year for which they are levied. Grant and similar items are recognized as revenue as soon as all eligibility requirements have been met. Agency funds use the accrual basis of accounting, but they do not have a measurement focus.

CITY OF LODI Notes to Basic Financial Statements (continued)
June 30, 2017
35
Governmental fund financial statements are reported using the current financial resources measurement focus and the modified accrual basis of accounting. Revenues are recognized as soon as they are both measurable and available. Revenues are considered to be available when they are collectible within the current period or soon enough thereafter to pay liabilities of the current period. The City considers property tax revenues to be available if they are collected within 60 days of the end of the current fiscal year. All other revenues are considered to be available if they are generally collected within 120 days of the end of the current fiscal period. Expenditures generally are recorded when a liability is incurred, as under accrual accounting. However, debt service expenditures, as well as expenditures related to vacation, sick leave, claims and judgments, are recorded only when payment is due. Property taxes, other local taxes, licenses, intergovernmental revenues, and interest associated with the current fiscal period are all considered susceptible to accrual and so have been recognized as revenues of the current fiscal period. All other revenues are considered to be measurable and available when the City receives cash. The City reports the following major governmental funds:
The General Fund is the City’s primary operating fund. It accounts for all financial resources of the City except those required to be accounted for in another fund.
The Streets Fund accounts for Gas Tax revenues apportioned to the City under the State Streets and Highway Code, impact fees charged to provide for the building of various storm drains and street improvements needed to serve new developments, and to account for funds apportioned to the City for sales tax collections under Measure K.
The City reports the following major proprietary (enterprise) funds:
The Electric Fund accounts for the provision of electric services to the residents of the City. All activities necessary to provide such services are accounted for in this fund, including but not limited to, source of supply, overhead, systems maintenance, customer service, engineering, administration, capital improvements, and maintenance and debt service.
The Wastewater Fund accounts for the provision of wastewater collection and treatment services to the residents of the City. All activities necessary to provide such services are accounted for in this fund, including, but not limited to, administration, operations, maintenance, improvements and debt service.
The Water Fund accounts for the provision of water to the residents of the City as well as some customers in the San Joaquin County (County). All activities to provide such services are accounted for in this fund, including, but not limited to administration, operations, distribution, maintenance, capital improvements and debt service.

CITY OF LODI Notes to Basic Financial Statements (continued)
June 30, 2017
36
Additionally, the City reports the following fund types:
The Internal Service Funds account for the City’s claims, benefits and fleet services.
The Fiduciary Funds account for assets held in trust for other agencies.
Private-Purpose Trust Funds are used to account for trust agreements under which the principal and income benefit individuals, private organizations or other governments. They were established to account for assets held and invested by the Library Board as trustee; and to account for assets held by the City in accordance with a trust agreement on behalf of the Hutchins Square. These funds can only be spent in accordance with the trust agreements. Agency Fund account for assets held by the City as a trustee or as an agent for individuals, private organizations, related organizations and/or other governmental units. This fund was established to account for special assessments collected on the property tax roll by the City on behalf of the property owners within the Industrial Way/Beckman Districts, the Downtown/Cherokee Lane Districts and various landscape and lighting districts around the City.
The effect of interfund activity has been eliminated from the government-wide financial statements. Exceptions to this rule are charges to other City departments from the Electric, Wastewater, Water and Transit Funds. These charges have not been eliminated because elimination would distort the direct costs and program revenues reported in the statement of activities. Proprietary funds distinguish operating revenues and expenses from nonoperating items. Operating revenues and expenses generally result from providing services in connection with the fund’s principal ongoing operations. The principal operating revenues of the City’s enterprise funds and internal service funds are charges for customer services including: electric, wastewater, water and public transportation fees. Operating expenses for enterprise funds and internal service funds include the cost of services, administrative expenses, and depreciation on capital assets. All revenues and expenses not meeting this definition are reported as nonoperating revenues and expenses.
(d) Cash and Investments
The City maintains a cash and investment pool that is available for all funds of the City for the purpose of increasing interest earnings through investment activities. Investments are generally stated at fair value with the exception of guaranteed investment contracts, which are stated at cost. Income earned or losses arising from the investment of pooled cash are allocated to various funds based on month-end cash balances in accordance with California Government Code Section 53647. Changes in fair value of investments are recognized as a component of investment income.

CITY OF LODI Notes to Basic Financial Statements (continued)
June 30, 2017
37
(e) Restricted Cash and Investments
The City accounts for certain settlement payments for environmental remediation as restricted with the understanding that these funds will be used exclusively for environmental clean up, investigation or remediation expenses incurred by the City in the specified areas and that they will not be used for the payment of legal or technical fees. These funds are accounted for in the Water Fund. (f) Restricted Cash and Investments with Fiscal Agents Restricted assets represent the proceeds from debt and other cash and investments held by fiscal agents by agreement that meet the definition of cash and cash equivalents, with the exception of a $2,169,850 guaranteed investment contract held in the Wastewater Fund which is a long-term investment. In the Electric Fund, restricted assets represent the proceeds of the 2008 Certificates of Participation restricted for debt service. In the Wastewater Fund, the restricted assets represent the proceeds of the 2004A, the 2007A Certificates of Participation and the 2016A Refunding Wastewater Revenue Bonds, issued for improvements to the City’s wastewater collection, treatment and disposal system. In the Water Fund, restricted assets represent the proceeds of the 2010A and 2010B Revenue Bonds issued for the purpose of providing funds to pay the cost of a new Water Treatment Facility.
(g) Property Taxes
The County is responsible for assessing, collecting and distributing property taxes in accordance with enabling legislation. Revenue received is based on an allocation factor calculated by the County under the provisions of Proposition 13, plus a percentage of the increase in market value in specific areas. The City's property tax lien is based on the assessed value listed as of the prior January 1st for all real and personal property located in the City. Property sold after the assessment date (January 1st) is reassessed and the amount of property tax assessed is prorated. The assessed value at January 1, 2017, upon which the 2016-17 levy was based, was $5,860,269,629. Secured property taxes are levied on October 1 and are due in two installments on November 1 and February 1. The tax becomes delinquent after December 10 and April 10, respectively. Unsecured property tax is levied on July 1, due on July 31 and becomes delinquent after August 31. Property taxes levied for the year ended June 30, 2017, are recorded as receivables. Property taxes paid to the City by the County within 60 days of the fiscal year-end are considered "available" and are, therefore, recognized as revenue in governmental funds.

CITY OF LODI Notes to Basic Financial Statements (continued)
June 30, 2017
38
In 1993, the City made an agreement with the San Joaquin County to participate in the Teeter Plan. The Teeter plan is an alternative method of apportioning property tax money. The City receives 95% of the property taxes in advance from the County and the 5% remaining after reconciling the City’s balance at June 30. As part of the agreement, the County keeps the penalties and interest on the delinquent taxes. (h) Due From/Due To Other Funds, Advances To/Advances From Other Funds, and Internal Balances
During the course of operations, numerous transactions occur between individual funds for goods provided or services rendered. In the fund financial statements, these receivables and payables are classified as “due from other funds” or “due to other funds.” Long-term interfund loans receivable are reported as “advances to other funds.” The corresponding long-term interfund loans payable are reported as “advances from other funds.” In the government-wide financial statements, these receivables and payables are eliminated within the governmental activities and business-type activities columns. Receivables and payables between the governmental activities and the business-type activities are classified as internal balances. (i) Transfers
In the fund financial statements, interfund transfers are recorded as transfers in (out) except for transactions that are described below:
Charges for services are recorded as revenues of the performing fund and expenditures/expenses of the requesting fund. Unbilled costs are recognized as an asset of the performing fund at the end of fiscal year. Reimbursements for expenditures/expenses, initially made by one fund that is properly applicable to another fund, are recorded as expenditures/expenses in the reimbursing fund and as a reduction of expenditures/expenses in the fund that is reimbursed. .
(j) Long-term Obligations
In the government-wide financial statements and in the proprietary fund financial statements, long-term debt and other long-term obligations are reported as liabilities in the applicable governmental activities, business-type activities, or proprietary fund statement of net position. Bond premiums are deferred and amortized over the life of the bonds. Bonds payable are reported net of the applicable bond premium. Losses occurring from advance refunding are reported as deferred outflows of resources and amortized as an expense for both governmental and business-type activities.

CITY OF LODI Notes to Basic Financial Statements (continued)
June 30, 2017
39
(k) Loans Receivable
Loans receivable reported in the HOME Program and Community Development Block Grants Special Revenue Fund represent funds loaned to first-time homebuyers. Loans receivable in the Electric Enterprise Fund represent loans to eligible industrial and commercial customers participating in the Lodi Energy Efficiency Financing Pilot Project. In December 2009, the City entered into a contractual relationship with the California Department of Housing and Community Development (HCD) to administer a First-time Homebuyers Program. The loan program is intended to provide deferred down-payment assistance to first-time homebuyers who are at or below 80% of the median income, for the purchase of homes within Lodi. The loan bears 2% interest and is due and payable 30 years from close of escrow, upon transfer of the property or when the home is no longer owner-occupied, whichever comes first. At June 30, 2017, the outstanding balance of these loans amounted to $44,707, which the City included in due from other governmental agencies. In December 2012, the City increased the loan funds in its public benefits program from which G2, G3, G4, G5 or I1 electric utility rate commercial and industrial customers may borrow money to implement energy conservation projects in their facilities. The loan is at zero interest rate payable in two years capped at $150,000 per customer. As of June 30, 2017, a total of twenty-three loans to industrial and commercial customers have been approved. At June 30, 2017, there were no outstanding loans, however, twenty-three loans had been approved. (l) Advance Receivable Advance receivable reported in the Electric Enterprise Fund represents the City’s portion of the Northern California Power Agency’s (NCPA) General Operating Reserve that is refundable upon demand by the City (See Note 12). (m) Inventory Other governmental funds inventories are recorded at cost and are recognized as expenditures when consumed rather than when purchased. For the proprietary fund types, inventories are recorded at cost using the weighted average cost method, which approximates market, and expense is recognized when inventories are consumed in operations. (n) Deferred Outflows and Inflows of Resources Unamortized Losses on Defeasance Deferred outflows of resources reported in the Electric Enterprise Fund and business-type activities include the refunding loss incurred in connection with the issuance of the 2008 Certificates of Participation Series A amortized over 24 years. The deferred outflows of resources reported in the Wastewater Enterprise Fund and business-type activities include the refunding loss incurred on the issuance of the 2007A Certificates of Participation amortized over 20 years, the 2012 Refunding Revenue Bonds amortized over 11 years, and the 2016 Refunding

CITY OF LODI Notes to Basic Financial Statements (continued)
June 30, 2017
40
Revenue Bonds amortized over 21 years. Deferred outflows of resources reported in the governmental activities represent the refunding loss incurred with the issuance of the 2012 Refunding Lease Revenue Bonds. Related to Pensions Pension contributions made in the current year are reported as deferred outflows of resources per GASB Statement No. 71 as the CalPERS’ valuation measurement date is June 30, 2016. Those contributions will be recognized as a reduction of the net pension liability in the year ending June 30, 2018. Plan earnings in excess of earnings projected, changes in assumptions, differences between expected and actual experience in the CalPERS actuarial report are reported as deferred outflows or inflows of resources. Unavailable Revenue The unavailable revenue in the governmental funds is related to the HCD’s First-time Homebuyers Program, Development Impact Fees, Fines, forfeits, and penalties, and miscellaneous revenue for various projects. All fees are expected to be repaid in full. (o) Capital Assets
Capital assets, which include land, works of art, buildings and improvements, machinery and equipment, vehicles, infrastructure (e.g., streets, streetlights, traffic signals, sidewalks, and bridges), and electric lines, wastewater lines and storm drains are reported in the applicable governmental or business-type activities columns in the government-wide financial statements and in the proprietary funds financial statements. Capital assets are defined by the City as assets with individual cost of $10,000 or more and have an estimated useful life in excess of two years. Such assets are recorded at historical cost. Donated capital assets are recorded at acquisition value at the date of donation. Capital outlay is recorded as expenditures in the General and other governmental funds and as assets in the government-wide financial statements to the extent the City’s capitalization threshold is met. The cost of normal maintenance and repairs that do not add to the value of the asset or materially extend asset useful lives are not capitalized. As required by the Governmental Accounting Standards Board Statement No. 34, beginning July 1, 2002, the City has capitalized infrastructure, primarily its network of streets, as part of the capital assets shown in the governmental activities column on the government-wide statement of net position. This capitalization included infrastructure that could be identified and has been acquired since July 1, 1980. Depreciation of capital assets is provided on the straight-line basis over the following estimated useful lives: Years
Buildings and improvements 3 - 40 Machinery and equipment 2 - 40 Vehicles 5 - 15 Infrastructure 10 - 50

CITY OF LODI Notes to Basic Financial Statements (continued)
June 30, 2017
41
(p) Compensated Absences/Vacation and Sick Leave
The City accrues for compensated absences, in the government-wide financial statements and the proprietary funds financial statements, to pay its employees for the unused vacation, compensatory time, and miscellaneous leave. The City is not obligated to pay for unused sick leave if employees terminate prior to retirement. (q) Pensions For purposes of measuring the net pension liability, deferred outflows of resources and deferred inflows of resources related to pensions, and pension expense, information about the fiduciary net position of the Miscellaneous and Safety Plans (Plans) and additions to/deductions from the Plans’ fiduciary net position have been determined on the same basis as they are reported by the CalPERS Financial Office. For this purpose, benefit payments (including refunds of employee contributions) are recognized when currently due and payable in accordance with the benefit terms. Investments are reported at fair value.
GASB Statement No. 68 requires that the reported results must pertain to liability and asset information within certain defined timeframes. For this report, the following timeframes are used:
Valuation Date: June 30, 2015, rolled forward to June 30, 2016 Measurement Date: June 30, 2016 Measurement Period: July 1, 2015 to June 30, 2016
(r) Self-Insurance The City is self-insured for general liability, workers' compensation, dental benefits, unemployment and long-term disability. Various City funds are charged premiums for the City's self-insurance liability, which is accounted for in an internal service fund. The accrued liability for estimated self-insured claims represents an estimate of the eventual loss on claims arising prior to year-end including claims incurred but not reported.

CITY OF LODI Notes to Basic Financial Statements (continued)
June 30, 2017
42
(s) Net Position In the government-wide and proprietary funds financial statements, net position is reported in one of three categories: Net Investment in Capital Assets – This category consists of capital assets net of accumulated depreciation and reduced by deferred
outflows of resources and outstanding debt that is attributed to the acquisition, construction, or improvement of the assets. Restricted Net Position – Assets restricted by external creditors, grantors, contributors, enabling legislation or laws or regulations of other governments reduced by liabilities related to those assets. Unrestricted Net Position – This category consists of all net position that does not meet the definition of net investment in capital assets or restricted net position.
(t) Fund Balance
Fund balances presented in the governmental fund financial statements represent the difference between assets, liabilities and deferred inflows of resources. GASB Statement No. 54, Fund Balance Reporting and Governmental Fund Type Definitions, establishes the criteria for classifying fund balances into specifically defined classifications and clarifies definitions for governmental funds. GASB Statement No. 54 requires that the fund balances be classified in categories based upon the type of constraints imposed on the use of funds. The City evaluated each of its funds at June 30, 2017 and classified fund balances into the following five categories:
Nonspendable – Amounts that cannot be spent because they are (1) not in spendable form, such as prepaid items, inventories and long-term receivables for which the payment of proceeds are not restricted or committed with respect to the nature of the specific expenditures of that fund or (2) legally or contractually required to remain intact. Restricted – Amounts that are restricted by external parties such as creditors or imposed by grants, laws or regulations of other governments or imposed by law through constitutional provisions or enabling legislation. The City has legislative restrictions on amounts collected and reported in the City’s various governmental funds. Committed – Amounts that can only be used for specific purposes pursuant to constraints imposed by a formal action by the City’s “highest level of decision-making authority”, which the City considers to be an ordinance passed by the Lodi City Council. Assigned – Amounts that have been allocated by action of the Lodi City Council in which the City’s intent is to use the funds for a specific purpose. Once assigned, funds may only be released by resolution of the City Council.

CITY OF LODI Notes to Basic Financial Statements (continued)
June 30, 2017
43
Unassigned – Amounts that constitute the residual balances that have no restrictions placed upon them and are reported in the General Fund. For other governmental funds, as restrictions exceed available resources only deficit amounts are reported in the unassigned category.
When both restricted and unrestricted resources are available for use, it is the City’s policy to use restricted resources first, and then unrestricted resources as they are needed.
The City does not have a policy on the order of spending unrestricted amounts when an expenditure is incurred for which amounts in any of the unrestricted fund balance classifications could be used. Therefore, by default under GASB Statement No. 54, the City uses committed resources first, then assigned resources and unassigned resources last as they are needed. It is the City's policy to maintain an unassigned fund balance in the General Fund of at least 16% of revenues and working capital balances in the Water and Wastewater enterprise funds of at least 25% of operating expenses and the target for the Electric Enterprise Fund working capital is $22.8 million. The policy allows for variations from year-to-year to account for economic and fiscal changes. The City Council also adopted a policy to establish the following reserves: Catastrophic reserve – To maintain the ability of the City to meet operational costs during times of declared emergency or major catastrophe, the City shall designate General Fund balance of a minimum of 8% of annual General Fund revenues reported as unassigned fund balance. This reserve may only be drawn upon pursuant to an emergency as declared under the Municipal Code.
Economic reserve – To maintain the City’s economic viability and to meet seasonal cashflow shortfalls, the City shall designate General Fund economic reserve balance of a minimum of 8% of annual General Fund revenues reported as unassigned fund balance. Funding the economic reserve will begin in the fiscal year following full funding of the catastrophic reserve. Funding may only be disbursed upon a resolution of the City Council. Once fully funded, if these reserves fall below 5% of annual revenues, the City Manager shall prepare a plan within three months of approval of the City’s financial statements. This plan will restore the 5% within 12 months and the 8% within 24 months. (u) Statement of Cash Flows A statement of cash flows is presented for proprietary fund types. For purposes of reporting cash flows, the City considers all highly liquid investments with maturities of three months or less when purchased and investments maintained in the pool to be cash equivalents.

CITY OF LODI Notes to Basic Financial Statements (continued)
June 30, 2017
44
(v) Use of Estimates
The preparation of financial statements in conformity with GAAP requires management to make estimates and assumptions that affect certain reported amounts and disclosures. Actual results could differ from those estimates.
(w) Future Implementation of New Governmental Accounting Standards The City is currently analyzing its accounting practices to determine the potential impact on the financial statements for the following GASB Statements: In June 2015, GASB issued Statement No. 75, Accounting and Financial Reporting for Postemployment Benefits Other Than Pensions. This statement addresses reporting by governments that provide other postemployment benefits (OPEB) to their employees and for governments that finance OPEB for employees of other governments. The requirements of this statement are effective for the City’s year ending June 30, 2018. In March 2016, the GASB issued Statement No. 81, Irrevocable Split-Interest Agreements. This statement requires that a government that receives resources pursuant to an irrevocable split-interest agreement recognize assets, liabilities, and deferred inflows of resources at the inception of the agreement. It further requires that a government recognize assets representing its beneficial interests in irrevocable split-interest agreements that are administered by a third party, if the government controls the present service capacity of the beneficial interests. It also requires the recognition of revenue when the resources become applicable to the reporting period. The requirements of this statement are effective for the City’s year ending June 30, 2018. In November 2016, the GASB issued Statement No. 83, Certain Asset Retirement Obligations. This statement addresses accounting and financial reporting for certain asset retirement obligations (AROs). An ARO is a legally enforceable liability associated with the retirement of a tangible capital asset. This statement establishes criteria in determining the timing and pattern of recognition of a liability and a corresponding deferred outflow of resources for AROs and requires that recognition occur when the liability is both incurred and reasonably estimable. The requirements of this statement are effective for the City’s year ending June 30, 2019. In January 2017, GASB issued Statement No. 84, Fiduciary Activities. This statement is to improve guidance regarding the identification of fiduciary activities for accounting and financial reporting purposes and how those activities should be reported. The requirements of this statement are effective for the City’s year ending June 30, 2020. In March 2017, GASB issued Statement No. 85, Omnibus. This statement is to address practice issues that have been identified during implementation and application of certain GASB Statements. This statement addresses a variety of topics including issues related to blending component units, goodwill, fair value measurement and application, and postemployment benefits (pensions and other postemployment benefits). The requirements of this statement are effective for the City’s year ending June 30, 2018.

CITY OF LODI Notes to Basic Financial Statements (continued)
June 30, 2017
45
In May 2017, GASB issued Statement No. 86, Certain Debt Extinguishment Issues. This statement is to improve consistency in accounting and financial reporting for in-substance defeasance of debt by providing guidance for transactions in which cash and other monetary assets are placed in an irrevocable trust for the sole purpose of extinguishing debt. The requirements of this statement are effective for the City’s year ending June 30, 2018. In June 2017, GASB issued Statement No. 87, Leases. This statement is to recognize in the financial statements certain lease assets and liabilities for leases that previously were classified as operating leases and recognized as inflows of resources or outflows of resources based on the payment provisions of the contract. The requirements of this statement are effective for the City’s year ending June 30, 2021.
(2) CASH AND INVESTMENTS
Cash and investments as of June 30, 2017 are classified in the accompanying financial statements as follows:
Government-wide statement of net position: Cash and investments $ 82,623,085 Restricted cash and investments 27,805,247 Fiduciary funds cash and investments: Private-purpose trust funds 236,118 Agency fund 406,729 Total cash and investments $ 111,071,179
Cash and investments as of June 30, 2017 consist of the following:
Cash on hand $ 3,496 Deposits with financial institutions 14,020,374 Investments 97,047,309 Total cash and investments $ 111,071,179

CITY OF LODI Notes to Basic Financial Statements (continued)
June 30, 2017
46
(a) Authorized Investments The City has adopted an investment policy pursuant to Government Code Section 53601, which authorizes the City to invest in obligations of the U.S. Treasury, U.S Government agency securities and instruments, bankers' acceptances, certificates of deposit, negotiable certificates of deposit, commercial paper, State of California Local Agency Investment Fund (LAIF), Investment Trust of California (CALTRUST),Certificate of Deposit Account Registry Service (CDARS), mutual funds that invest in eligible securities, supranationals and medium term notes as permitted by the Government Code. The City is not authorized to enter into reverse repurchase agreements and repurchase agreements, which are permitted by the Government Code. The City selects its investments based on safety, liquidity and yield. The following table identifies the permitted investment types authorized per the City’s investment policy. The table also identifies certain provisions that address interest rate risk and concentration of credit risk.
Maximum Maximum % of Maximum Investment Permitted Investments/Deposits Maturity Portfolio in One issuer
U.S. Treasury Obligations 5 years 100% U.S. Agency Securities 5 years 100% Banker's Acceptances 180 days 40% 25% Certificates of Deposit 5 years 100% Negotiable Certificates of Deposit 5 years 30% Commercial Paper 270 days 40% California State Local Agency Investment Fund (LAIF) Indefinite 100% $50m per account Passbook Deposits Indefinite 100% Money Market Mutual Funds Indefinite 20% Medium term Notes 5 years 30% Investment Trust of California (CALTRUST) Indefinite 100% Certificate of Deposit Account Registry Service (CDARS) 5 years 30% Supranational Obligations 5 years 30%
The City has established a pension stabilization account with Public Agency Retirement Services (PARS), which invests in a Balanced Index PLUS Fund.

CITY OF LODI Notes to Basic Financial Statements (continued)
June 30, 2017
47
(b) Investments Authorized by Debt Agreements
Investments of debt proceeds held by bond trustee are governed by the provisions of the debt agreements as to the extent that they are permissible investments of funds of the City. (c) Interest Rate Risk Interest rate risk is the risk that changes in market interest rates will adversely affect the fair value of an investment. Generally, the longer the maturity of an investment, the greater the sensitivity its fair value is to changes in market interest rates. Information about the sensitivity of the fair values of the City’s investments to market interest rate fluctuations is provided by the following table that shows the maturity date of each investment:
Maturity Less Maturity One Maturity Investment as of June 30, 2017 than One Year to Five Years Over 5 Years Total
LAIF $ 34,541,910 $ 34,541,910 CALTRUST 44,372,255 44,372,255 PARS 3,938,615 3,938,615 Money Market Mutual Funds 110,845 110,845 Held by bond trustee: Negotiable Certificates of Deposit 1,357,233 3,185,093 4,542,326 U.S. Agency Securities 1,621,954 1,621,954 LAIF 969,760 969,760 Money Market Mutual Funds 4,656,592 4,656,592 Guaranteed investment contracts 2,169,850 2,169,850 Total investments subject to interest rate risk $ 45,574,955 49,179,302 2,169,850 96,924,107 Equities and options 123,202
Total investments $ 97,047,309
Investments in equities and options are shares of stock received by the Library as an endowment from a private citizen.

CITY OF LODI Notes to Basic Financial Statements (continued)
June 30, 2017
48
(d) Credit Risk
Generally, credit risk is the risk that an issuer of an investment will not fulfill its obligation to the holder of the investment. This is measured by the assignment of a rating by a nationally recognized statistical rating organization. The U.S. Agency Securities have a rating by S&P of AA+. The money market mutual funds are registered under the Federal Investment Company Act of 1940, whose shares are registered under the Federal Securities Act of 1933, and have a rating by S&P of “AAA-m.” The PARS Balanced Index PLUS fund, GICs, and LAIF do not have a rating provided by a nationally recognized statistical rating organization. The CALTRUST Short- term fund is rated “AAf” by S&P while the CALTRUST Medium-term fund is rated “A+f” by S&P. The negotiable certificates of deposit are all rated AAA. In accordance with the City’s investment policy in selecting authorized investments, consideration must be given to credit ratings and collateralization of applicable instruments, however, the City does not have a minimum credit rating limitations policy. (e) Concentration of Credit Risk
The investment policy of the City contains certain limitations on the amount that can be invested in any one issuer beyond that stipulated by the California Government Code. Investments in LAIF, CALTRUST, and money market mutual funds are not subject to the concentration of credit risk disclosure. There are no investments with any one issuer greater than 5% of total investments. (f) Custodial Credit Risk
Custodial credit risk for deposits is the risk that, in the event of the failure of a depository financial institution, a government will not be able to recover collateral securities that are in the possession of an outside party. The California Government Code and the City’s investment policy do not contain legal or policy requirements that would limit the exposure to custodial risk for deposits, other than the following provision for deposits: The California Government Code requires that a financial institution secure deposits made by state or local governmental units by pledging securities in an undivided collateral pool held by a depository regulated under state law. The market value of the pledged securities in the collateral pool must equal at least 110% of the total amount deposited by the public agencies. California law also allows financial institutions to secure City deposits by pledging first trust deed mortgage notes having a value of 150% of the secured deposits. $14,213,135 of the City’s deposits with financial institutions, which exceeded federal depository insurance limits, was collateralized in this fashion.
The custodial credit risk for investments is the risk that, in the event of the failure of the counterparty (e.g., broker-dealer) to a transaction, a government will not be able to recover the value of the investment or collateral securities that are in the possession of another party. The California Government Code and the City’s investment policy do not contain legal or policy requirements that would limit the exposure to custodial credit risk for investments. With respect to investments, custodial credit risk generally applies only to direct investments in marketable securities. Custodial credit risk does not apply to a local government’s indirect investment in securities through the use of mutual funds or government investment pools such as LAIF.

CITY OF LODI Notes to Basic Financial Statements (continued)
June 30, 2017
49
(g) Investments in Investment Pools The City is a voluntary participant in the Local Agency Investment Fund (LAIF) that is regulated by the California Government Code under the oversight of the Treasurer of the State of California. The fair value of the City’s investment in this pool is reported in the accompanying financial statements at amounts based upon the City’s pro-rata share of the fair value provided by LAIF for the entire LAIF portfolio (in relation to the amortized cost of that portfolio). The balance available for withdrawal is based on the accounting records maintained by LAIF, which are recorded on an amortized cost basis.
The total amount invested by all public agencies in LAIF at June 30, 2017 was $22.8 billion. LAIF is part of the California Pooled Investment Account (PMIA), which at June 30, 2017 had a balance of $77.6 billion. Of this amount, 2.89% was invested in medium-term and short-term structured notes and asset-backed securities. PMIA is not SEC-registered, but is required to invest according to California State Code. The average maturity of PMIA investments was 194 days as of June 30, 2017. The Local Investment Advisory Board has oversight responsibility for LAIF. The Board consists of five members as designated by state statute. The value of the pool of shares in LAIF, which may be withdrawn, is determined on an amortized cost basis, which is different than the fair value of the City’s portion of the pool. Withdrawals from LAIF are done on a dollar for dollar basis. In accordance with GASB Statement 31, investments are marked to fair value annually and an adjustment is made to each fund accordingly. However, actual daily activity is done on a dollar to dollar basis and only a withdrawal from the pool size that jeopardizes pool participants would cause the withdrawal to be done at market value. The City is also a participant in the Investment Trust of California Joint Powers Authority Pool (CALTRUST). At June 30, 2017, the City’s investment in CALTRUST is $44.4 million. CALTRUST is an innovative partnership between the CSAC Finance Corporation and the League of California Cities to provide a convenient method for local agencies to pool their assets for investment. The weighted average to maturity of CALTRUST investments was as follows: CALTRUST Short-term, 11 months and CALTRUST Medium-term, 24 months. The Board of Trustees, which is made up of experienced local treasurers and investment officers has oversight responsibility for CALTRUST. The value of the pool shares in CALTRUST, which may be withdrawn, is determined on a fair value basis, which may be different than the amortized cost of the City’s portion of the pool. The total amount invested in CALTRUST by California public agencies, as of June 30, 2017 was divided among the following asset classes: CALTRUST Short-term was $1.5 billion and CALTRUST Medium-term was $1.1 billion.

CITY OF LODI Notes to Basic Financial Statements (continued)
June 30, 2017
50
(h) Fair Value Measurements In accordance with GASB Statement 72, fair value is the price that would be received to sell an asset or paid to transfer a liability in an orderly transaction between market participants at the measurement date. Fair value is a market-based measurement for a particular asset or liability based on assumptions that market participants would use in pricing the asset or liability. Valuation inputs are assumptions that market participants use in pricing an asset or liability. The hierarchy of inputs used to generate the valuation is classified into three different levels.
• Level 1 inputs are quoted prices (unadjusted) in active markets for identical assets or liabilities at the measurement date. • Level 2 inputs include quoted prices for similar assets or liabilities in markets that are active; quoted prices for identical or similar assets
or liabilities in markets that are not active; and inputs other than quoted prices that are observable for an asset, either directly or indirectly.
• Level 3 inputs are unobservable inputs from the asset or liability where there is very little market activity and they should be used only when relevant Level 1 and Level 2 inputs are unavailable.
The City has the following fair value measurements as of June 30, 2017:
Fair Value
Measurements
Investment Type
Total
Using Level 1 Using Level 2 Negotiable Certificates of Deposit $ 4,542,326 $ 4,542,326 U. S. Agency Securities
1,621,954
1,621,954
Money Market Mutual Funds
4,767,437
4,767,437 Equities and Options
123,202
123,202
Total investments subject to fair value hierarchy
11,054,919
123,202 $ 10,931,717
Investments not subject to fair value hierarchy:
LAIF
35,511,670
CALTRUST
44,372,255
PARS 3,938,615
Guaranteed Investment Contracts
2,169,850
Total investments $ 97,047,309

CITY OF LODI Notes to Basic Financial Statements (continued)
June 30, 2017
51
(3) ALLOWANCE FOR UNCOLLECTIBLE ACCOUNTS
Receivables of the General Fund, Electric, Wastewater and Water funds are reported net of uncollectible amounts. Total allowance provided for uncollectible amounts related to receivables of the current period are as follows:
Uncollectibles related to late charges and services $ 24,527 Uncollectibles related to electric sales and services 179,865 Uncollectibles related to wastewater services 73,924 Uncollectibles related to water sales and services 74,806 Total uncollectibles of the current fiscal year $ 353,122
(4) INTERFUND RECEIVABLES/PAYABLES
Interfund receivables and payables at June 30, 2017 are as follows:
Due from Due to Amount Other governmental Other governmental $ 195,698 Internal Service Internal Service 27,692 $ 223,390
“Due to” and “due from” balances are recorded primarily when funds overdraw their share of pooled cash or when there are short-term loans between funds. The $195,698 and $27,692 represents cash deficits in other governmental funds and internal service funds.
Advances from Advances to Amount Wastewater Other governmental $ 64,286 Water Other governmental 1,024,025 $ 1,088,311
The $64,286 advance from the Wastewater Fund was used for the Grape Bowl Improvements – Phase 3 and is being repaid with annual payments through fiscal year 2017-18. The advances from the Water Fund were used for the construction of Fire Station #4, $1,024,025 and have no defined repayment terms; however, the City is repaying as funds are available.

CITY OF LODI Notes to Basic Financial Statements (continued)
June 30, 2017
52
(5) TRANSFERS
Transfers for the year ended June 30, 2017, are summarized as follows:
Transfers in Other Transfers out: General Streets Governmental Total General $ 620,810 6,084,294 $ 6,705,104 Other governmental 966,480 966,480 Electric 2,104,000 33,000 2,137,000 Wastewater 1,068,000 33,000 1,101,000 Water 780,000 33,000 813,000 Total $ 3,952,000 620,810 7,149,774 $ 11,722,584
During the year, various interfund transfers were made to finance expenditures, subsidize operating losses and service debt. Transfers out of $2,104,000 from the Electric Fund, $1,068,000 from the Wastewater Fund, and $780,000 from the Water Fund represent operating contributions to the General Fund. The transfer of $6,084,294 from the General Fund to other governmental funds represents transfer of $1,100,294 to the Debt Service Fund for the interest required to pay the 2012 Refunding Lease Revenue Bonds; $3,949,800 to Parks, Recreation, and Community Services Fund for operating costs; $165,000 to Community Development Fund for operating costs; $434,200 to the Vehicle and Equipment Fund for vehicle replacements and computer replacements; and $435,000 to the Capital Outlay Reserve Fund for various capital projects. The transfer of $620,810 from the General Fund to the Streets Fund is for operations and for various streets projects. The transfer out of $966,480 from other governmental funds to other governmental funds includes $655,750 transferred from Parks, Recreation, and Community Services Fund to the Debt Service Fund for the interest required to pay the 2012 Refunding Lease Revenue Bonds, transfer of $234,430 from Parks, Recreation, and Community Services Fund to Parks Capital Fund for park-related capital projects, and transfer of $21,000 from the Community Development Fund, and $55,300 from the Parks, Recreation, and Community Services Fund to the Vehicle and Equipment Fund for fleet replacement. The transfer out from the Electric Fund of $33,000, transfer out from Wastewater Fund for $33,000, and Water Fund for $33,000 to other governmental funds represent transfers to the Vehicle and Equipment Fund for the various projects.

CITY OF LODI Notes to Basic Financial Statements (continued)
June 30, 2017
53
(6) CAPITAL ASSETS Capital assets activity of the primary government for the year ended June 30, 2017, was as follows: Balance Balance Governmental activities June 30, 2016 Increases Decreases June 30, 2017 Capital assets, not being depreciated: Land $ 24,947,834 $ 24,947,834 Work of art 304,907 304,907 Construction in progress 11,116,297 8,416,011 (1,115,743) 18,416,565 Total capital assets, not being depreciated 36,369,038 8,416,011 (1,115,743) 43,669,306 Capital assets, being depreciated: Buildings and improvements 77,227,603 286,446 77,514,049 Machinery and equipment 11,982,247 806,383 12,788,630 Vehicles 10,775,826 1,156,008 (129,635) 11,802,199 Infrastructure 146,034,325 3,532,923 149,567,248 Total capital assets, being depreciated 246,020,001 5,781,760 (129,635) 251,672,126 Less accumulated depreciation for:
Buildings and improvements 34,137,171 2,142,349 36,279,520 Machinery and equipment 11,368,268 254,305 11,622,573 Vehicles 8,640,666 580,851 (113,662) 9,107,855 Infrastructure 96,483,660 5,415,733 101,899,393 Total accumulated depreciation 150,629,765 8,393,238 (113,662) 158,909,341 Total capital assets, being depreciated, net 95,390,236 (2,611,478) (15,973) 92,762,785 Governmental activities capital assets, net $ 131,759,274 5,804,533 (1,131,716) $ 136,432,091

CITY OF LODI Notes to Basic Financial Statements (continued)
June 30, 2017
54
Balance Balance Business-type activities June 30, 2016 Increases Decreases June 30, 2017 Capital assets, not being depreciated: Land $ 5,535,718 $ 5,535,718 Construction in progress 14,596,259 2,904,670 (2,091,743) 15,409,186 Total capital assets, not being depreciated 20,131,977 2,904,670 (2,091,743) 20,994,904 Capital assets, being depreciated: Buildings and improvements 48,417,000 164,775 48,581,775 Machinery and equipment 274,314,918 11,620,723 285,935,641 Vehicles 12,187,896 1,268,861 (12,702) 13,444,055 Total capital assets, being depreciated 334,919,814 13,054,359 (12,702) 347,961,471 Less accumulated depreciation for: Buildings and improvements 19,349,022 1,307,994 20,657,016 Machinery and equipment 90,411,564 8,262,528 98,674,092 Vehicles 7,095,811 1,289,369 (12,702) 8,372,478 Total accumulated depreciation 116,856,397 10,859,891 (12,702) 127,703,586 Total capital assets, being depreciated, net 218,063,417 2,194,468 220,257,885 Business-type activities capital assets, net $ 238,195,394 5,099,138 (2,091,743) $ 241,202,789
.
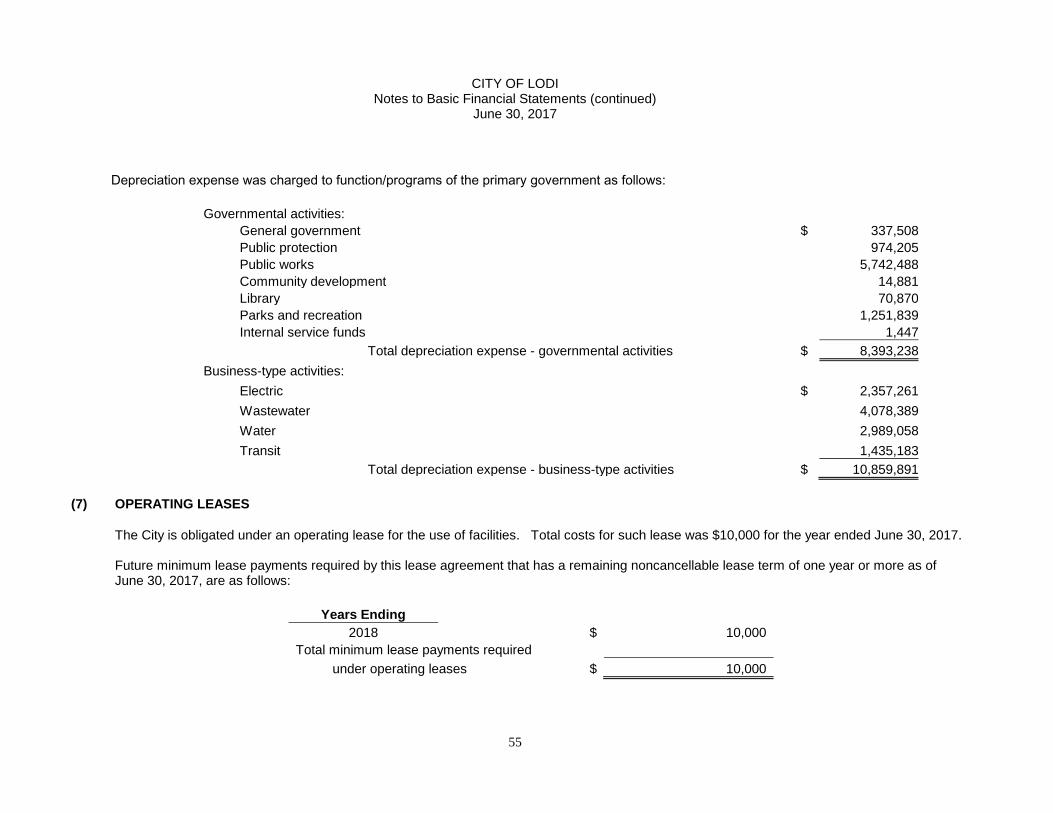
CITY OF LODI Notes to Basic Financial Statements (continued)
June 30, 2017
55
Depreciation expense was charged to function/programs of the primary government as follows: Governmental activities: General government $ 337,508 Public protection 974,205 Public works 5,742,488 Community development 14,881 Library 70,870 Parks and recreation 1,251,839 Internal service funds 1,447 Total depreciation expense - governmental activities $ 8,393,238 Business-type activities: Electric $ 2,357,261 Wastewater 4,078,389 Water 2,989,058 Transit 1,435,183 Total depreciation expense - business-type activities $ 10,859,891
(7) OPERATING LEASES
The City is obligated under an operating lease for the use of facilities. Total costs for such lease was $10,000 for the year ended June 30, 2017. Future minimum lease payments required by this lease agreement that has a remaining noncancellable lease term of one year or more as of June 30, 2017, are as follows:
Years Ending
2018 $ 10,000 Total minimum lease payments required under operating leases $ 10,000

CITY OF LODI Notes to Basic Financial Statements (continued)
June 30, 2017
56
(8) LONG-TERM LIABILITIES The following is a summary of long-term liability transactions of the City for the year ended June 30, 2017:
Amounts Due
Interest Rates
June 30, 2016
Additions
Reductions
June 30, 2017
Within One Year
Governmental activities:
Compensated absences
$
7,790,529
2,361,031
(2,543,685) $ 7,607,875 $ 1,602,385
2012 Revenue Bonds 2.0-5.0%
18,820,000
(830,000)
17,990,000
860,000
Issuance premium
816,420
(53,830)
762,590
53,830
Total
19,636,420
(883,830)
18,752,590
913,830
Note payable 6.00%
245,000
(245,000)
Loan payable 1.93%
468,000
(89,989)
378,011
91,775
Capital lease 2.08%
562,387
(75,428)
486,959
77,009
Self-insurance liability
8,480,942
2,365,077
(2,003,621)
8,842,398
2,365,077
Governmental activities long-term liabilities
$
37,183,278
4,726,108
(5,841,553) $ 36,067,833 $ 5,050,076

CITY OF LODI Notes to Basic Financial Statements (continued)
June 30, 2017
57
Amounts Due
Interest Rates
June 30, 2016
Additions
Reductions
June 30, 2017
Within One Year
Business-type activities:
Compensated absences
$ 2,328,783
988,580
(983,112) $ 2,334,251 $ 567,950
Pollution remediation obligation
17,833,729
(479,721)
17,354,008
400,000
Loan payable 2.30%
1,500,000
(199,680)
1,300,320
204,432
Certificates of Participation and Revenue Bonds:
2010 Revenue Bonds A & B 2.50-6.637%
34,545,000
(915,000)
33,630,000
950,000
Issuance premium
472,805
(19,700)
453,105
19,700
Total
35,017,805
(934,700)
34,083,105
969,700
2008 Certificates of Participation A 3.85-5.05%
60,685,000
(2,390,000) 58,295,000
2,510,000
Issuance premium
398,539
(24,909)
373,630
24,909
Total
61,083,539
(2,414,909)
58,668,630
2,534,909
2004 Certificates of Participation A 2.0-5.5%
2,070,000
2,070,000
2007 Certificates of Participation A 4.0-5.0%
7,890,000
(160,000)
7,730,000
175,000
Issuance premium
47,538
(2,237)
45,301
2,237
Total
7,937,538
(162,237)
7,775,301
177,237
2012 Revenue Bonds A 2.0-5.0%
13,090,000
(1,415,000)
11,675,000
1,475,000
Issuance premium
1,205,773
(166,313)
1,039,460
166,313
Total
14,295,773
(1,581,313)
12,714,460
1,641,313
2016 Revenue Bonds A 2.0-3.25%
20,295,000
20,295,000
Issuance premium
2,717,813
(130,979)
2,586,834
130,979
Total
23,012,813
(130,979)
22,881,834
130,979
Total Certificates of Participation and Revenue Bonds
143,417,468
(5,224,138)
138,193,330
5,454,138
Business-type activities long-term liabilities
$ 165,079,980
988,580
(6,886,651) $ 159,181,909 $ 6,626,520

CITY OF LODI Notes to Basic Financial Statements (continued)
June 30, 2017
58
Long-term debt payable at June 30, 2017, comprised of the following individual issues:
Loans Payables In August 2015, the City obtained a loan in the amount of $1.5 million to finance the Electric Enterprise Fund’s LED Street Light Retrofit project. Annual principal and interest payment is approximately $235,000 with final payment due December 1, 2022. The annual payments will be paid from the Greenhouse Gas Free Allowance proceeds. In September 2015, the City obtained a loan in the amount of $468,000 to finance the purchase of a fire engine. Annual principal and interest payment is $99,172 with final payment due on December 1, 2020. The annual payments will be paid from Fire department appropriations.
Annual debt service requirements to maturity of the loans payables are as follows:
Year Ending Governmental Activities
June 30, Principal Interest 2018 $ 91,775 $ 7,397 2019 93,571 5,601 2020 95,402 3,770 2021 97,263 1,908 Total $ 378,011 $ 18,676
Year
Ending Business-type Activities June 30, Principal Interest
2018 $ 204,432 $ 30,323 2019 209,200 25,555 2020 214,078 20,677 2021 219,027 15,728 2022 224,178 10,577
Thereafter 229,405 5,350 Total $ 1,300,320 $ 108,210
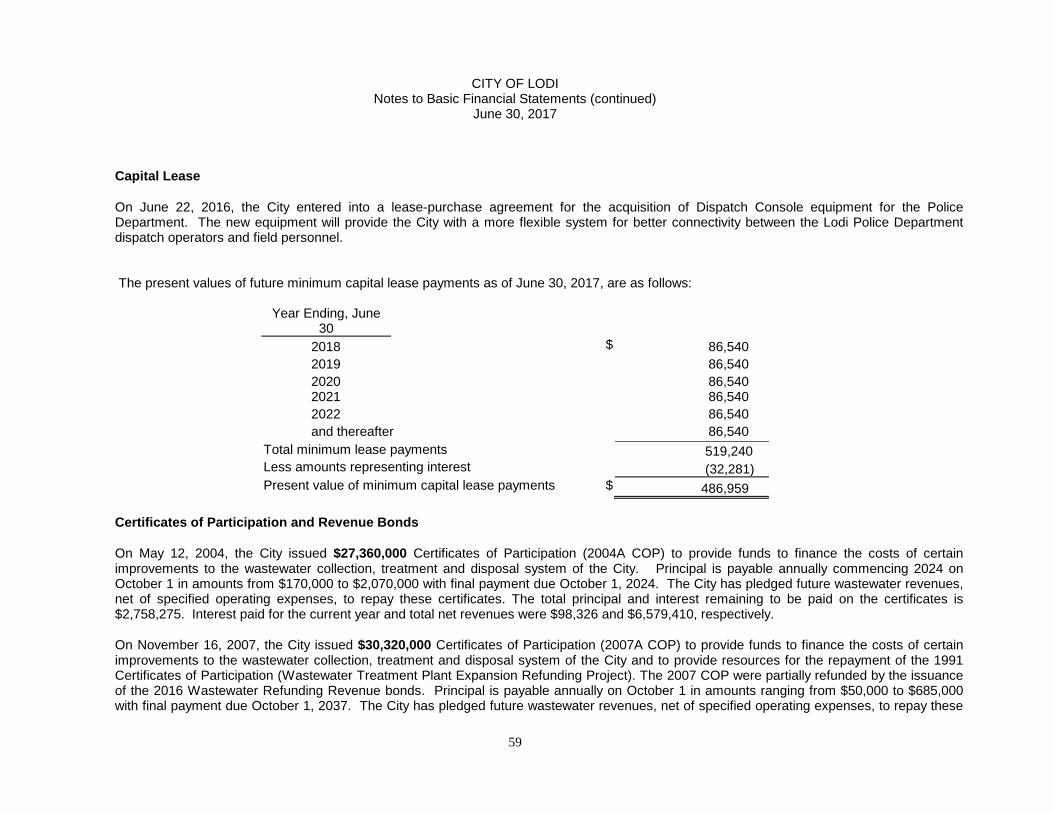
CITY OF LODI Notes to Basic Financial Statements (continued)
June 30, 2017
59
Capital Lease On June 22, 2016, the City entered into a lease-purchase agreement for the acquisition of Dispatch Console equipment for the Police Department. The new equipment will provide the City with a more flexible system for better connectivity between the Lodi Police Department dispatch operators and field personnel. The present values of future minimum capital lease payments as of June 30, 2017, are as follows:
Year Ending, June
30
2018 $ 86,540 2019 86,540 2020 86,540 2021 86,540 2022 86,540 and thereafter 86,540 Total minimum lease payments 519,240
Less amounts representing interest (32,281) Present value of minimum capital lease payments $ 486,959
Certificates of Participation and Revenue Bonds On May 12, 2004, the City issued $27,360,000 Certificates of Participation (2004A COP) to provide funds to finance the costs of certain improvements to the wastewater collection, treatment and disposal system of the City. Principal is payable annually commencing 2024 on October 1 in amounts from $170,000 to $2,070,000 with final payment due October 1, 2024. The City has pledged future wastewater revenues, net of specified operating expenses, to repay these certificates. The total principal and interest remaining to be paid on the certificates is $2,758,275. Interest paid for the current year and total net revenues were $98,326 and $6,579,410, respectively. On November 16, 2007, the City issued $30,320,000 Certificates of Participation (2007A COP) to provide funds to finance the costs of certain improvements to the wastewater collection, treatment and disposal system of the City and to provide resources for the repayment of the 1991 Certificates of Participation (Wastewater Treatment Plant Expansion Refunding Project). The 2007 COP were partially refunded by the issuance of the 2016 Wastewater Refunding Revenue bonds. Principal is payable annually on October 1 in amounts ranging from $50,000 to $685,000 with final payment due October 1, 2037. The City has pledged future wastewater revenues, net of specified operating expenses, to repay these

CITY OF LODI Notes to Basic Financial Statements (continued)
June 30, 2017
60
certificates. The total principal and interest remaining to be paid on the unrefunded certificates is $13,150,634. Principal and interest paid for the current year and total net revenues were $547,613 and $6,579,410, respectively. On July 24, 2008, the City issued $60,685,000 Certificates of Participation (2008A COP) to allow the City to prepay and cause the immediate defeasance of the outstanding $46,760,000 Certificates of Participation (Electric System Revenue Certificates of Participation 2002 Series A Variable Rate Certificates) and to pay $8,979,000 for the termination of a swap agreement related to the refunded 2002 certificates. Principal is payable annually on July 1 in amounts ranging from $2,390,000 to $5,090,000 beginning in 2016 with final payment due in 2032. The City has pledged future electric revenues, net of specified operating expenses, to repay these certificates. The total principal and interest remaining to be paid on the certificates is $82,714,350. Principal and interest paid for the current year and total net revenues were $5,288,025 and $15,556,473, respectively. On October 1, 2010, the City issued $9,015,000 Water Revenue Bonds, 2010 Series A and $29,650,000 Water Revenue Bonds, 2010 Series B (Federally taxable - Build America Bonds) (2010 Bonds) to finance the construction of the Surface Water Treatment Facility which is designed to pump water from the Mokelumne River, treat and deliver it to the City’s water distribution system. Principal is payable annually on June 1 in amounts ranging from $775,000 to $2,210,000 with final payment due June 1, 2040. The City has pledged future water revenues, net of operation and maintenance costs, to repay these certificates. The total principal and interest remaining to be paid on the certificates is $63,328,484. Principal and interest paid for the current year and total net revenues were $2,308,061 and $6,111,155, respectively. On September 1, 2012, the City issued $19,080,000 Refunding Lease Revenue Bonds (2012 LRB) to allow the City to prepay and cause the immediate defeasance of the outstanding $21,025,000 Certificates of Participation (2002 COP). The 2002 COP were issued in January 2002 to provide funds to finance the costs of constructing, furnishing and equipping a new police building and jail for the City, to finance portions of certain other projects and to refund the outstanding 1995 and 1996 Certificates of Participation. As of June 30, 2016, there are no outstanding balances of these refunded Certificates. The 1995 Certificates of Participation (1995 COP) were sold in October 1995 to finance the City Downtown Revitalization and the Cherokee Lane Beautification projects. The 1996 Certificates of Participation (1996 COP) were sold in August 1996 to finance the construction of the Hutchins Square Conference and Performing Arts Center. The total principal and interest remaining to be paid on the 2012 LRB is $24,700,482. Principal is payable annually on October 1 in amounts ranging from $260,000 to $1,605,000 beginning in 2016 with final payment due in 2031. Interest paid for the current year was $824,562. On August 16, 2012, the City issued $17,105,000 2012 Refunding Wastewater Revenue Bonds (2012 Bonds) to advance refund the $17,115,000 principal amount of the 2004 Wastewater Revenue Certificates of Participation. Principal is payable annually on October 1 in amounts ranging from $1,280,000 to $1,885,000 beginning in 2013 with final payment due in 2023. The City pledged future wastewater revenues, net of specified operating expenses, to repay these certificates. The total principal and interest remaining to be paid on the 2012 Bonds is $13,605,750. Principal and interest paid for the current year and total net revenues were $1,947,100 and $6,579,410, respectively.
On March 10, 2016, the City issued $20,295,000 2016 Refunding Wastewater Revenue Bonds (2016 Bonds) for an advance refunding of the $21,415,000 principal amount of the 2007 Wastewater Revenue Certificates of Participation. Principal is payable annually on October 1 in

CITY OF LODI Notes to Basic Financial Statements (continued)
June 30, 2017
61
amounts ranging from $110,000 to $2,175,000 beginning in 2018 with final payment due in 2037. The City pledged future wastewater revenues, net of specified operating expenses, to repay these certificates. The total principal and interest remaining to be paid on the 2016 bonds is $31,886,856. Interest paid for the current year and total net revenues were $474,109 and $6,579,410, respectively. At June 30, 2017, the remaining balance of the refunded debt is $21,415,000. The various indentures contain significant limitations and restrictions on annual debt service requirements, maintenance of and flow of moneys through various restricted accounts and minimum revenue bond coverage. The City is in compliance with all such significant limitations and restrictions. Annual debt service requirements to maturity for certificates of participation and bonds are as follows:
Year Ending Governmental Activities Business-type Activities June 30, Principal Interest Principal Interest
2018 $ 860,000 $ 794,913 $ 5,110,000 $ 6,558,519 2019 900,000 755,213 5,285,000 6,332,319 2020 930,000 721,087 5,510,000 6,099,019 2021 965,000 685,337 5,745,000 5,852,969 2022 1,020,000 635,712 6,005,000 5,613,650 2023-2027 5,905,000 2,329,313 35,870,000 23,173,021 2028-2032 7,410,000 788,907 37,395,000 13,676,417 2033-2037 24,160,000 5,502,862 2038-2040 8,615,000 940,573
Total $ 17,990,000 $ 6,710,482 $ 133,695,000 $ 73,749,349
Industrial Development Bonds The City of Lodi has lent its name to the City of Lodi Industrial Development Authority for the purpose of issuing the following industrial development bonds: Minton Corporation $5,000,000; Dart Corporation $8,000,000; Wallace Computer Services $3,000,000; and Luster-Cal Nameplate Corporation $3,000,000. These bonds are special obligation bonds only, payable solely out of the bond revenues or other sources of the above companies and are not a pledge of the general credit of the City. The City is not obligated for the redemption or administration of these industrial development bonds.

CITY OF LODI Notes to Basic Financial Statements (continued)
June 30, 2017
62
Woodbridge Irrigation District Bonds On October 8, 2003, the City lent its name to the Woodbridge Irrigation District (the “District”) in the procurement of $11.745 million 2003 Revenue Certificates of Participation, to provide funds to finance the costs of construction of a new diversion dam on the Mokelumne River and related facilities of the water district. A significant portion of the District’s sources of payment for the 2003 Certificates are expected to be derived from amounts to be received by the District from the City of Lodi pursuant to an Agreement for the purchase of water from the District by the City of Lodi, dated May 13, 2003 (the “Lodi Water Sales Agreement”). Under the agreement, the City will purchase 6,000 acre feet of water per annum from the District for 40 years.
(9) PENSION PLAN
Plan Descriptions
All qualified permanent and probationary employees are eligible to participate in the City’s separate Miscellaneous and Safety Plans (Plans), agent multiple-employer defined benefit pension plans administered by the California Public Employees’ Retirement System (CalPERS), which acts as a common investment and administrative agent for its participating member employers. Benefit provisions under the Plans are established by State statute and City resolution. CalPERS issues publicly available reports that include a full description of the pension plans regarding benefit provisions, assumptions and membership information that can be found on the CalPERS website.
Benefits Provided
CalPERS provides service retirement and disability benefits, annual cost of living adjustments and death benefits to plan members, who must be public employees and beneficiaries. Benefits are based on years of credited service, equal to one year of full time employment. Members with five years of total service are eligible to retire at age 50 with statutorily reduced benefits. All members are eligible for non-duty disability benefits after 10 years of service. The death benefit is one of the following: the Basic Death Benefit, the 1957 Survivor Benefit, or the Optional Settlement 2W Death Benefit. The cost of living adjustments for each plan are applied as specified by the Public Employees’ Retirement Law.

CITY OF LODI Notes to Basic Financial Statements (continued)
June 30, 2017
63
The Plans’ provisions and benefits in effect at June 30, 2017, are summarized as follows:
Miscellaneous Plan
Prior to
On or after
Hire date
January 1, 2013
January 1, 2013 Benefit formula
2% @ 55
2% @ 62
Benefit vesting schedule
5 years of service
5 years of service Benefit payments
monthly for life
monthly for life
Retirement age
50-67
52-67 Monthly benefits, as a % of eligible compensation
1.426%-2.418%
1% to 2.5%
Required employee contribution rates
7%
6.75% Required employer contribution rates
21.797%
21.797%
Safety Plan
Prior to
December 22, 2012 to
On or after
Hire date
December 22, 2012
December 31, 2012
January 1, 2013 Benefit formula
3% @ 50
3% @ 55
2.7% @ 57
Benefit vesting schedule
5 years of service
5 years of service
5 years of service Benefit payments
monthly for life
monthly for life
monthly for life
Retirement age
50-55
50-55
50-57 Monthly benefits, as a % of eligible compensation
3%
2.4% to 3%
2% to 2.7%
Required employee contribution rates
9%
9%
11.25% Required employer contribution rates
44.754%
44.754%
44.754%

CITY OF LODI Notes to Basic Financial Statements (continued)
June 30, 2017
64
Employees Covered
At June 30, 2016, the most recent actuarial valuation available, the following employees were covered by the benefits of the City’s Plans:
Miscellaneous Plan
Safety Plan
Inactive employees or beneficiaries currently receiving benefits 395
183 Inactive employees entitled to but not yet receiving benefits
125
24
Active employees
258
118 Total
778
325
Contributions
For the year ended June 30, 2017, the City’s actuarially determined contributions were as follows:
Miscellaneous
Safety
Plan
Plan
Actuarially determined contribution $ 3,880,495
$ 5,136,610 Contributions in relation to the actuarially
determined contribution (3,880,495)
(5,136,610) Contribution deficiency (excess) $
$
Covered employee payroll $ 17,802,886
$ 11,477,432 Contributions as a percentage of covered
employee payroll 21.797%
44.754%
Section 20814(c) of the California Public Employees’ Retirement Law requires that the employer contribution rates for all public employers be determined on an annual basis by the actuary and shall be effective on the July 1 following notice of a change in the rate. Funding contributions for both Plans are determined annually on an actuarial basis as of June 30 by CalPERS. The actuarially determined rate is the estimated amount necessary to finance the costs of benefits earned by employees during the year, with an additional amount to finance any unfunded accrued liability. The City is required to contribute the difference between the actuarially determined rate and the contribution rate of employees.

CITY OF LODI Notes to Basic Financial Statements (continued)
June 30, 2017
65
Net Pension Liability
The City’s net pension liability for each Plan is measured as the total pension liability, less the pension plan’s fiduciary net position. The net pension liability of each of the Plans is measured as of June 30, 2016, using an annual actuarial valuation as of June 30, 2015 rolled forward to June 30, 2016 using standard update procedures. Actuarial Assumptions
The total pension liabilities in the June 30, 2015 actuarial valuations were determined using the following actuarial assumptions:
Miscellaneous Plan Safety Plan Valuation Date June 30, 2015 June 30, 2015 Measurement Date June 30, 2016 June 30, 2016 Actuarial Cost Method Entry-Age Normal Cost Method Actuarial Assumptions:
Discount Rate 7.65% 7.65% Inflation 2.75% 2.75% Investment Rate of Return 7.65% (1) 7.65% (1) Mortality Based on rates of CalPERS Experience Study
(1) Net of pension plan investment expenses, including inflation
The underlying mortality assumptions and all other actuarial assumptions used in the June 30, 2015 valuation were based on the 2014 CalPERS Experience Study for the period from 1997 to 2011. Further details of the Experience Study can be found on the CalPERS website. Discount Rate
The discount rate used to measure the total pension liability was 7.65% for each Plan. To determine whether the municipal bond rate should be used in the calculation of a discount rate for each plan, CalPERS stress tested plans that would most likely result in a discount rate that would be different from the actuarially assumed discount rate. Based on the testing, none of the tested plans run out of assets. Therefore, the current 7.65% discount rate is adequate and the use of the municipal bond rate calculation is not necessary. The long-term expected discount rate of 7.65% will be applied to all plans in the Public Employees Retirement Fund (PERF). The stress test results are presented in a detailed report that can be obtained from the CalPERS website.
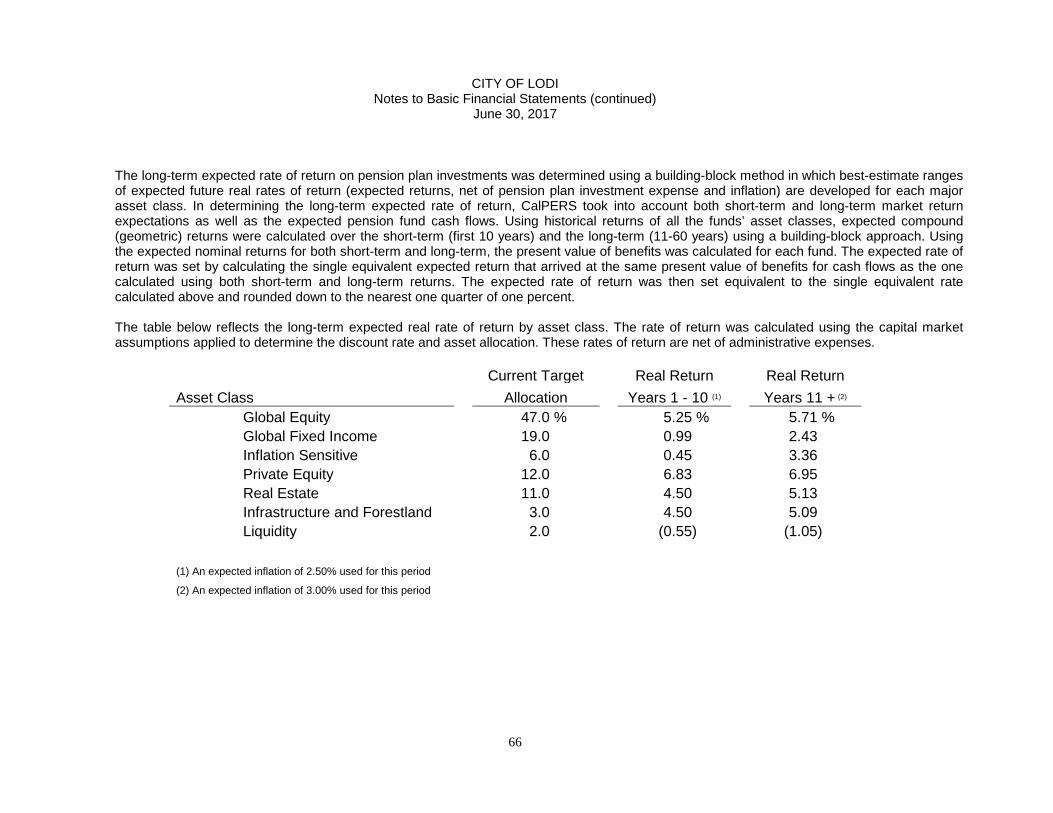
CITY OF LODI Notes to Basic Financial Statements (continued)
June 30, 2017
66
The long-term expected rate of return on pension plan investments was determined using a building-block method in which best-estimate ranges of expected future real rates of return (expected returns, net of pension plan investment expense and inflation) are developed for each major asset class. In determining the long-term expected rate of return, CalPERS took into account both short-term and long-term market return expectations as well as the expected pension fund cash flows. Using historical returns of all the funds’ asset classes, expected compound (geometric) returns were calculated over the short-term (first 10 years) and the long-term (11-60 years) using a building-block approach. Using the expected nominal returns for both short-term and long-term, the present value of benefits was calculated for each fund. The expected rate of return was set by calculating the single equivalent expected return that arrived at the same present value of benefits for cash flows as the one calculated using both short-term and long-term returns. The expected rate of return was then set equivalent to the single equivalent rate calculated above and rounded down to the nearest one quarter of one percent. The table below reflects the long-term expected real rate of return by asset class. The rate of return was calculated using the capital market assumptions applied to determine the discount rate and asset allocation. These rates of return are net of administrative expenses.
Current Target
Real Return
Real Return
Asset Class
Allocation
Years 1 - 10 (1)
Years 11 + (2)
Global Equity
47.0 %
5.25 %
5.71 %
Global Fixed Income
19.0
0.99
2.43
Inflation Sensitive
6.0
0.45
3.36
Private Equity
12.0
6.83
6.95
Real Estate
11.0
4.50
5.13
Infrastructure and Forestland
3.0
4.50
5.09
Liquidity
2.0
(0.55)
(1.05)
(1) An expected inflation of 2.50% used for this period (2) An expected inflation of 3.00% used for this period

CITY OF LODI Notes to Basic Financial Statements (continued)
June 30, 2017
67
Changes in the Net Pension Liability
The changes in the Net Pension Liability for each Plan follows:
Miscellaneous Plan:
Increase (Decrease)
Total Pension
Plan Fiduciary Net
Net Pension
Liability
Position
Liability
Balance at June 30, 2015 (1)
$ 166,801,735
$ 126,077,924
$ 40,723,811 Changes in the year:
Service cost
2,464,894
2,464,894 Interest on the total pension liability
12,565,553
12,565,553
Differences between expected and actual experience
542,177
542,177 Contribution - employer
3,500,179
(3,500,179)
Contribution - employee
1,241,136
(1,241,136) Net investment income (2)
643,509
(643,509)
Benefit payments, including refunds of employee contributions
(8,641,550)
(8,641,550) Other changes in fiduciary net position
(76,838)
76,838
Net changes during measurement period
6,931,074
(3,333,564)
10,264,638
Balance at June 30, 2016
$ 173,732,809
$ 122,744,360
$ 50,988,449

CITY OF LODI Notes to Basic Financial Statements (continued)
June 30, 2017
68
Safety Plan:
Increase (Decrease)
Total Pension
Plan Fiduciary Net
Net Pension
Liability
Position
Liability
Balance at June 30, 2015 (1)
$ 163,858,600
$ 106,458,927
$ 57,399,673 Changes in the year:
Service cost
2,890,607
2,890,607 Interest on the total pension liability
12,357,788
12,357,788
Differences between expected and actual experience
600,847
600,847 Contribution - employer
4,660,278
(4,660,278)
Contribution - employee
1,062,984
(1,062,984) Net investment income (2)
558,434
(558,434)
Benefit payments, including refunds of employee contributions
(8,730,081)
(8,730,081) Other changes in fiduciary net position
(64,882)
64,882
Net changes during measurement period
7,119,161
(2,513,267)
9,632,428
Balance at June 30, 2016
$ 170,977,761
$ 103,945,660
$ 67,032,101
(1) The fiduciary net position includes receivables for employee service buybacks, deficiency reserves, fiduciary self-insurance and OPEB expense.
(2) Net of administrative expenses.

CITY OF LODI Notes to Basic Financial Statements (continued)
June 30, 2017
69
Sensitivity of the Net Pension Liability to Changes in the Discount Rate
The following presents the net pension liability of the City for each Plan, calculated using the discount rate for each Plan, as well as what the City’s net pension liability would be if it were calculated using a discount rate that is 1-percentage point lower or 1-percentage point higher than the current rate:
Miscellaneous Plan
Safety Plan
1% Decrease
6.65%
6.65% Net Pension Liability
$ 73,487,124
$ 90,056,143
Current Discount Rate
7.65%
7.65% Net pension Liability
$ 50,988,449
$ 67,032,101
1% Increase
8.65%
8.65% Net Pension Liability
$ 32,339,982
$ 48,112,131
Pension Plan Fiduciary Net Position
Detailed information about each pension plan’s fiduciary net position is available in the separately issued CalPERS financial reports
Pension Expense and Deferred Outflows/Inflows of Resources Related to Pensions
For the year ended June 30, 2017, the City recognized pension expense of $3,919,916 and $6,247,800 for the Miscellaneous and Safety Plans, respectively.

CITY OF LODI Notes to Basic Financial Statements (continued)
June 30, 2017
70
At June 30, 2017, the City reported deferred outflows of resources and deferred inflows of resources related to pensions from the following sources:
Miscellaneous Plan
Safety Plan
Deferred
Deferred
Deferred
Deferred
Outflows of
Inflows of
Outflows of
Inflows of
Resources
Resources
Resources
Resources
Pension contributions subsequent to measurement date $ 3,880,495 $
$ 5,136,610 $
Changes of assumptions
901,089
1,539,493 Difference between expected and
actual experience
355,219
513,624
457,788
488,672 Net differences between projected
and actual earnings on plan investments
6,688,211
5,668,268
Total $ 10,923,925 $
1,414,713 $ 11,262,666 $ 2,028,165
The $3,880,495 and $5,136,610 reported as deferred outflows of resources related to contributions subsequent to the measurement date will be recognized as a reduction of the net pension liability in the year ending June 30, 2018. Other amounts reported as deferred outflows and deferred inflows of resources related to pensions will be recognized as pension expense as follows:
Year Ending
Miscellaneous
Safety June 30
Plan
Plan
2018 $ (321,458) $ 1,537 2019
1,074,556
1,539
2020
3,110,803
2,577,085 2021
1,764,816
1,517,730
Total $ 5,628,717 $ 4,097,891

CITY OF LODI Notes to Basic Financial Statements (continued)
June 30, 2017
71
(10) POSTEMPLOYMENT BENEFITS OTHER THAN PENSIONS
(a) Plan Description The City sponsors a single-employer defined-benefit postemployment healthcare plan (Retiree Health Plan) to provide medical insurance benefits to eligible retired employees and their spouses. The Plan does not issue a publicly available financial report. Medical coverage is provided through CalPERS healthcare program. Employees who retire from the City and receive a CalPERS pension are eligible for postemployment medical benefits. The City contributes the minimum amount provided under Government Code Section 22825 of the Public Employees Medical and Hospital Care Act. In general, retirees must contribute any premium amounts in excess of the City contribution. However, as described below, a closed group of active employees and retirees receive additional postemployment benefits. Employees hired prior to the dates shown in the following table are allowed to convert their accumulated sick leave into postemployment medical benefits at retirement as long as they have ten or more years of service with the City.
Group Hired prior to: Executive Management July 1, 1994 Mid-Management July 1, 1994 Fire Mid-Management December 6, 1995 Police Mid-Management July 1, 1994 General Services July 1, 1995 IBEW July 1, 1995 Maintenance and Operators July 1, 1995 Dispatchers July 9, 1994 Police October 10, 1994 Fire December 6, 1995
The most widely elected options are the “Bank” option and the “Conversion” option. Under the “Bank” option, accumulated sick leave amounts are translated by specified formulas into a bank amount that is then used to pay postemployment healthcare premiums until the “Bank” is exhausted. Under the “Conversion” option, the accumulated sick leave hours are converted by specified formulas into a period of time during which the retiree will receive postemployment benefits. The number of hours is multiplied by 50% and converted to days. The City pays one month’s premium for employee and dependents for each day after conversion. For each year of employment in excess of ten years, 2.5% is added to the 50% before conversion. The amount of premium paid will be the same as the premium paid by the City at the time of retirement. In the event that the premium increases, the retiree pays the difference.
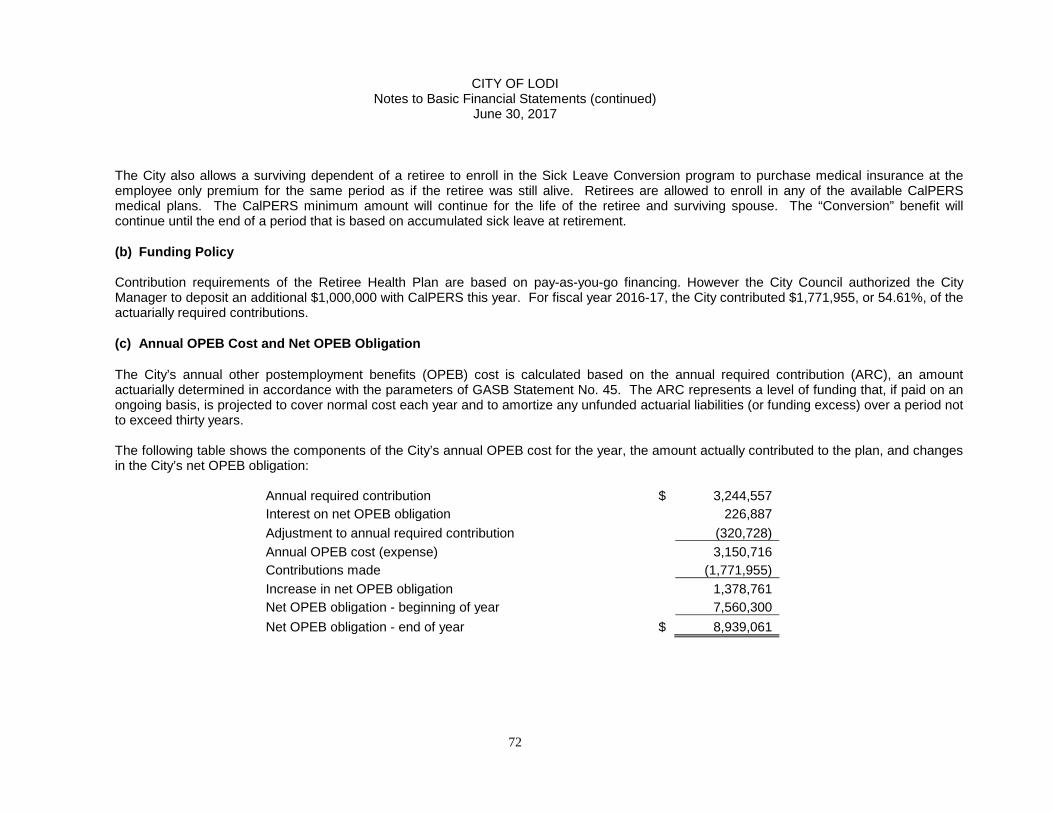
CITY OF LODI Notes to Basic Financial Statements (continued)
June 30, 2017
72
The City also allows a surviving dependent of a retiree to enroll in the Sick Leave Conversion program to purchase medical insurance at the employee only premium for the same period as if the retiree was still alive. Retirees are allowed to enroll in any of the available CalPERS medical plans. The CalPERS minimum amount will continue for the life of the retiree and surviving spouse. The “Conversion” benefit will continue until the end of a period that is based on accumulated sick leave at retirement. (b) Funding Policy Contribution requirements of the Retiree Health Plan are based on pay-as-you-go financing. However the City Council authorized the City Manager to deposit an additional $1,000,000 with CalPERS this year. For fiscal year 2016-17, the City contributed $1,771,955, or 54.61%, of the actuarially required contributions. (c) Annual OPEB Cost and Net OPEB Obligation
The City’s annual other postemployment benefits (OPEB) cost is calculated based on the annual required contribution (ARC), an amount actuarially determined in accordance with the parameters of GASB Statement No. 45. The ARC represents a level of funding that, if paid on an ongoing basis, is projected to cover normal cost each year and to amortize any unfunded actuarial liabilities (or funding excess) over a period not to exceed thirty years. The following table shows the components of the City’s annual OPEB cost for the year, the amount actually contributed to the plan, and changes in the City’s net OPEB obligation:
Annual required contribution $ 3,244,557 Interest on net OPEB obligation 226,887 Adjustment to annual required contribution (320,728) Annual OPEB cost (expense) 3,150,716 Contributions made (1,771,955) Increase in net OPEB obligation 1,378,761 Net OPEB obligation - beginning of year 7,560,300 Net OPEB obligation - end of year $ 8,939,061

CITY OF LODI Notes to Basic Financial Statements (continued)
June 30, 2017
73
The City’s annual OPEB cost, the percentage of annual OPEB cost contributed to the plan, and the net OPEB obligation, are as follows: (d) Funding Status and Funding Progress As of January 1, 2016, the most recent actuarial valuation date, the funded status of the Retiree Health Plan was as follows:
Actuarial accrued liability (AAL) $ 39,041,375 Actuarial value of plan assets Unfunded actuarial accrued liability (UAAL) $ 39,041,375 Funded ratio (actuarial value of plan assets/AAL) 0% Annual covered payroll (active plan members) $ 35,498,642 UAAL as percentage of annual covered payroll 110%
The schedule of funding progress, presented as RSI following the notes to the basic financial statements, presents multi-year trend information about whether the actuarial value of plan assets is increasing or decreasing over time relative to the actuarial accrued liability of benefits. (e) Actuarial Methods and Assumptions
Actuarial valuations of an ongoing plan involve estimates of the value of reported amounts and assumptions about the probability of occurrence of events far into the future. Examples include assumptions about future employment, mortality, and the healthcare cost trend. Amounts determined regarding the funded status of the plan and the annual required contribution of the employer are subject to continual revision as actual results are compared with past expectations and new estimates are made about the future.
Percentage of Net Year Annual Annual OPEB OPEB
ended OPEB Cost Cost Contributed Obligation 06/30/2015 $ 1,276,201 54.83% $ 5,343,727 06/30/2016 3,024,169 26.70% 7,560,300 06/30/2017 3,150,716 56.24% 8,939,061

CITY OF LODI Notes to Basic Financial Statements (continued)
June 30, 2017
74
Projections of benefits for financial purposes are based on the substantive plan (the plan as understood by the employer and plan members) and include types of benefits provided at the time of each valuation and the historical pattern of sharing benefit costs between the employer and the plan members to that point. The actuarial methods and the assumptions used include techniques that are designed to reduce short-term volatility in actuarial accrued liabilities and the actuarial value of assets, consistent with the long-term perspective of the calculations. In the January 1, 2016 actuarial valuation, the entry age normal cost method was used. The actuarial assumptions included a 3.5% discount rate to calculate the present value of future benefit payments; a 2.75% inflation rate; an annual healthcare cost trend rate of 7.25% for calendar year 2016, decreasing to 6.75% for calendar year 2017, then gradually decreasing to 5.3% for calendar year 2019 and beyond; the CalPERS minimum benefit will increase 4% per year; a 3.00% annual rate of increase in payroll; assumed that 100% of future eligible retirees will elect to maintain their enrollment in a CalPERS medical plan and qualify for the City’s minimum contribution; 75% of future retirees will enroll a spouse; and also assumed that 100% of General Services, Maintenance and Operators and Dispatchers will elect the conversion option and 50% of Executive Management, Mid Management and Police will elect the option. The conversion option is not available to IBEW and Fire retirees. The unfunded actuarial accrued liability is amortized as a level percentage of expected payroll over a closed thirty year period. As of June 30, 2017, the remaining amortization period is 22 years. The City’s unfunded actuarial accrued liability (UAAL) increased from $16,879,493 as of January 1, 2014 to $39,041,375 as of June 1, 2016. Approximately $18 million of this change was due to the addition of the implicit subsidy liability. When premiums for retirees are determined using a blend of active employee and retiree experience, it creates an implicit subsidy to the retirees. Revised Actuarial Standard Practice No. 6 (ASOP 6) effectively requires most public agencies to calculate an implicit subsidy liability whenever their retirees participate in the group medical plans but only pay the same premiums as active employees. ASOP 6 is effective for all actuarial valuations with a measurement date on or after March 31, 2015. Prior to this new standard, many public agencies did not report an implicit subsidy liability because of the “community rating” exemption for employers participating in large pooled health plans like CalPERS.
(11) CLAIMS AND BENEFITS
The City is exposed to various risks of loss related to torts; theft of, damage to and destruction of assets; errors and omissions; injuries to employees; and natural disasters. The City is self-insured as discussed in the following paragraphs for which liabilities are recorded in the Internal Service Fund-Insurance Fund.
The City is self-insured for general liability up to the first $500,000 per occurrence with claims from $500,000 to $40,000,000 per occurrence and in the aggregate insured through the California Joint Powers Risk Management Authority. The City has not had any settlements that exceeded its general liability insurance coverage (See Note 13). The City is self-insured for workers’ compensation up to the first $250,000 per claim. Any claims of $250,000 up to California statutory limits are covered under a purchased policy through the membership with the Local Agency Workers’ Compensation Excess Joint Powers Authority with

CITY OF LODI Notes to Basic Financial Statements (continued)
June 30, 2017
75
coverage up to $300,000,000 in the current year. The City has not had any settlements that exceeded its workers’ compensation insurance coverage (See Note 13). The City is fully self-insured for dental and unemployment for its employees.
General liability and workers’ compensation claims are administered by an outside agency and all other claims are administered by the City. The City has accrued a liability of $8,842,398 at June 30, 2017, for all self-insured claims in the Internal Service Fund-Insurance Funds that includes an amount for incurred but not reported claims. The liability amount is based on the requirements of GASB Statement No. 62, which requires that a liability for claims be reported if information prior to the issuance of the financial statements indicates that it is probable that a liability has been incurred at the date of the financial statements and the amount of the loss can be reasonably estimated. In the opinion of the City, the amounts accrued are adequate to cover claims incurred but not reported in addition to known claims. Changes in the self-insurance liability for the years ended June 30, 2017 and 2016 are as follows:
Current-Year Claims and Changes Claim Beginning in Estimates Payments Ending
FY 15-16 $ 8,305,887 $ 2,118,423 $ (1,943,368) $ 8,480,942 FY 16-17 8,480,942 2,365,077 (2,003,621) 8,842,398 (12) PARTICIPATION IN JOINT VENTURES Northern California Power Agency
The City, along with thirteen other public agencies, is a member of the Northern California Power Agency (NCPA) that was formed in 1968 as a joint powers agency. Its membership consists of eleven cities with publicly owned electric utility distribution systems, one irrigation district, one public utility district, one port authority and three other associate member entities. NCPA is generally empowered to purchase, generate, transmit, distribute and sell electrical energy. Members participate in the projects of NCPA on an elective basis. A commission comprising of one representative from each member organization governs NCPA. The commission is responsible for the general management of the affairs, property and business of NCPA. Under the direction of the general manager, the staff of NCPA is responsible for providing various administrative, operating and planning services for NCPA and its associated power corporations.

CITY OF LODI Notes to Basic Financial Statements (continued)
June 30, 2017
76
Project Financing and Construction NCPA’s project construction and development programs have been individually financed by project revenue bonds collateralized by NCPA’s assignment of all payments, revenues and proceeds associated with its interest in each project. Each Project Participant has agreed to pay its proportionate share of debt service and other costs of the related project, notwithstanding the suspension, interruption, interference, reduction or curtailment of output from the project for any reason. Certain of the revenue bonds are additionally supported by municipal bond insurance credit enhancements. Increase in Non-defaulting Project Participant’s Original Project Entitlement Percentage Upon the failure of any Project Participant to make any payment, which failure constitutes a default under the Member Agreement for the projects, and except as sales and transfers are made pursuant thereto, the Member Agreements provide that Project Entitlement for each non-defaulting Project Participant shall be automatically increased for the remaining term of the Member Agreement; pro rata with those of the non-defaulting Project Participant thereunder; provided, however, that the sum of such increase for any non-defaulting Project Participant shall not exceed, without written consent of such non-defaulting Project Participant, an accumulated maximum of 25% of the non-defaulting Project Participant’s original Project Entitlement Percentage Share. General Operating Reserve with NCPA Members of NCPA established a general operating reserve in 1992 for the purposes of providing a vehicle to fund reasonably foreseeable contingent liabilities. It was set up primarily to provide the following advantages: minimizes the number and dollar amount of reserve that might otherwise be funded separately in connection with NCPA’s individually financed operating plants, projects and programs; provides each member with flexibility and unilateral control over the determination of what they will fund, how they will fund it and what expenditures from the reserve will be made on their individual behalf. It provides funding for contingent liabilities that are not budgeted but that may require significant future expenditures. The reserve is segregated by participant and is refundable on demand by the participant. As of June 30, 2017, the City’s balance in the NCPA General Operating Reserve, which has been credited with annual interest earnings and settlements, is $9,082,666.

CITY OF LODI Notes to Basic Financial Statements (continued)
June 30, 2017
77
Project Participation The NCPA members and their percentage share at June 30, 2017, which is the most recent available data, are as follows:
Hydro Combustion Multiple Lodi Geothermal Electric Turbine Capital Transmission Energy NCPA MEMBERS Project Project Project #1 Facilities Project Center
Alameda 16.8825 % 10.00 % 21.820 % 19.00 % 30.7802 % Bay Area Rapid Transit 6.6000 % Biggs 0.2270 0.197 0.3446 0.2679 Gridley 0.3360 0.350 0.6248 1.9643 Healdsburg 3.6740 1.66 5.833 6.6947 1.6428 Lodi 10.2800 10.37 13.393 39.50 20.6077 9.5000 Lompoc 3.6810 2.30 5.833 5.00 6.7101 2.0357 Palo Alto 22.92 Plumas-Sierra Rural Electric Coop 0.7010 1.69 1.817 1.3112 0.7857 Roseville 7.8830 12.00 36.50 13.0846 Santa Clara 44.3905 37.02 41.667 25.7500 Ukiah 5.6145 2.04 9.090 10.2315 1.7857 OTHER PARTICIPANTS Azusa 2.7857 California Department of Water Resources 33.5000 Modesto Irrigation District 10.7143 Power & Water Resources Pooling Agency 2.6679 Turlock Irrigation District 6.3305 9.6106
Bulk power purchased by the City through NCPA amounted to $35,649,861 during the year ended June 30, 2017 and is reflected in utilities expense in the Electric Enterprise Fund.

CITY OF LODI Notes to Basic Financial Statements (continued)
June 30, 2017
78
NCPA Geothermal Project A purchase power agreement with NCPA obligates the City for a 10.28% share of the operating costs and debt service of two of NCPA’s 110- megawatt (MW) steam powered plants, Project Number 2 and Project Number 3. Outstanding long-term debt related to this project was approximately $33 million at June 30, 2017. In addition to federal geothermal leasehold, steam wells, gathering system and related facilities, the project consists of two electric generating stations (Plant 1 and Plant 2). Each plant has two 55 MW turbine generator units utilizing low temperature geothermal steam; associated electrical, mechanical and control facilities; a heat dissipation system; a steam gathering system; a transmission tapline; and, other related facilities. Geothermal steam for the project is derived from the geothermal property, which includes wellpads, access roads, steam wells and reinjection wells.
Calaveras Hydroelectric Project
NCPA contracted to finance, manage, construct and operate Hydroelectric Project Number One for the licensed owner, Calaveras County Water District. In exchange, NCPA has the right to the electric output of the project for 50 years from February 1982. NCPA has also the option to purchase power from the project in excess of the District’s requirements for the subsequent 50 years, subject to regulatory approval.
Under a power purchase agreement, the City is obligated to pay 10.37% of the debt service and operating costs. At June 30, 2017, approximately $354 million in long-term debt used to finance this project was outstanding.
NCPA Combustion Turbine Project #1
The project consists of five combustion turbine units; each nominally rated at 25 MW. Two such units are located in Roseville, two in Alameda and one in Lodi. The project provides capacity during peak load periods and emergency capacity reserves. Excess capacity and energy from the project are also sold to other entities from time to time. Under the NCPA power agreement, the City is obligated to pay 13.393% of the debt service and operating costs. At June 30, 2017, there was no outstanding long-term debt related to this project. Capital Facilities Project The Project consists of one 49.9 MW natural gas-fired steam injected combustion turbine generator unit located in Lodi, California. Wastewater is reclaimed from the City of Lodi’s White Slough water pollution control facility, processed to eliminate contaminants, and used in the turbine to produce steam for power enhancement and emissions control. Under a power purchase agreement, the City is obligated to pay 39.5% of the debt service and operating costs. At June 30, 2017, approximately $38 million in long-term debt was outstanding.

CITY OF LODI Notes to Basic Financial Statements (continued)
June 30, 2017
79
Transmission Project The project was undertaken to meet certain obligations of NCPA under the NCPA/PG & E Interconnection Agreement. The project includes an ownership interest in PG & E’s 230kv Castle Rock to Lakeville Substation Transmission Line in Sonoma County, additional firm transmission rights in that Transmission Line, and a central scheduling and dispatch facility in service at the NCPA headquarters in Roseville, California. Under a power purchase agreement, the City is obligated to pay 20.6077% of the debt service and operating costs. At June 30, 2017, there was no outstanding long-term debt related to this project. Lodi Energy Center The Lodi Energy Center project is a 280 MW base load, combined cycle, natural gas-fired, combustion turbine generating station (one gas turbine and one steam turbine) built in Lodi on city property. Under a power purchase agreement, the City is obligated to pay 17.03% of the debt service and 9.5% of operating costs. At June 30, 2017, approximately $351 million in long-term debt was outstanding. The following are the most recent available audited condensed financial statements of NCPA:
Condensed Statement of Net Position June 30, 2017 (in thousands)
Assets and Deferred Outflows of Resources Liabilities, Deferred Inflows of Resources and Net Position Current assets $ 88,453 Long-term debt, net $ 737,022 Restricted assets 221,783 Current liabilities 101,550 Electric plant, net 559,841 Non-current liabilities 218,427 Other assets 236,269 Deferred inflows of resources 76,899 Total assets 1,106,346 Net position 34,060
Deferred outflows of resources 61,612 Total liabilities, deferred inflows of resources and net position $ 1,167,958
Total assets and deferred outflows of resources $ 1,167,958

CITY OF LODI Notes to Basic Financial Statements (continued)
June 30, 2017
80
Condensed Statement of Revenues, Expenses and Changes in Net Position Combined Statement of Cash Flows
Year ended June 30, 2017 Year ended June 30, 2017 (in thousands) (in thousands)
Sales for resale $ 466,738 Net cash from operating activities $ 78,989 Operating expenses (418,307) Net from investing activities 10,963 Other expenses (21,561) Net cash from capital and related Future recoverable costs (13,274) financing activities (75,649) Net revenues before refunds 13,596 Net cash from noncapital Refunds to participants (7,499) and related financing activities 5,430 Increase in net position 6,097 Increase in cash and cash equivalents 19,733 Net position, beginning of year 27,963 Cash and cash equivalents, beginning of year 106,311 Net position, end of year $ 34,060 Cash and cash equivalents end of year $ 126,044
At June 30, 2017, NCPA’s total net outstanding long-term debt was $776,517,000 at an average interest rate of 5%. The current portion of long-term debt at June 30, 2017, was $39,495,000. Complete financial information for NCPA may be obtained at the following administration office:
Northern California Power Agency 651 Commerce Drive
Roseville, CA 95678-6411 Transmission Agency of Northern California
The Transmission Agency of Northern California (TANC) was organized under the California Government Code pursuant to a joint powers agreement entered into by fifteen Northern California utilities including the City of Lodi. The purpose of TANC is to provide electric transmission or other facilities for the use of its members through its authority to acquire, construct, finance, operate and maintain facilities for electric power transmission. The joint powers agreement provides that the costs of TANC’s activities can be financed or recovered through assessment of its members or user charges through transmission contracts with its members. Each TANC member has agreed to pay a pro rata share of the costs to operate TANC and has the right to participate in future project agreements. The joint powers agreement remains in effect until debt obligations and interest thereon have been paid, unless otherwise extended by the members.

CITY OF LODI Notes to Basic Financial Statements (continued)
June 30, 2017
81
Increase in Non-defaulting Project Participant’s Original Project Entitlement Percentage
Upon the failure of any Project Participant to make any payment, which failure constitutes a default under the Member Agreement for the projects, and except as sales and transfers are made pursuant thereto, the Member Agreements provide that Project Entitlement for each non-defaulting Project Participant shall be automatically increased for the remaining term of the Member Agreement; pro rata with those of the non-defaulting Project Participant thereunder; provided, however, that the sum of such increase for any non-defaulting Project Participant shall not exceed, without written consent of such non-defaulting Project Participant, an accumulated maximum of 25% of the non-defaulting Project Participant’s original Project Entitlement Percentage Share. California-Oregon Transmission Project
The project is a 340-mile long, 500-kilovolt alternating current transmission project between Southern Oregon and Central California. The project is operated in coordination with the Pacific AC Intertie as a part of the California-Oregon Intertie (COI) within the Western Electricity Coordinating Council (WECC) region. The WECC approved rating of the COI is 4,800 MW. TANC, Western Area Power Authority (WAPA), and five other parties have agreed to an Interim Participation Agreement (IPA) under which each project participant is granted a percentage entitlement in project transfer capability and is required to pay a percentage of the costs. Pursuant to the IPA and a subsequent agreement with WAPA, and the purchase of entitlement, rights and title, and interest in the City of Vernon’s share of the project transmission assets, TANC is entitled to use approximately 1,362 MW, and is obligated to pay an average of approximately 80 percent of the operating costs associated with the project. Under the TANC joint powers agreement, the City is obligated to pay 1.89% of its debt service and operating costs. At June 30, 2016, approximately $216 million in long-term debt was outstanding of which $8 million is considered current. Effective July 1, 2016, the City laid off and relinquished its interest and obligations in the California-Oregon Transmission Project to other TANC members for 25 years. Complete financial information for TANC may be obtained at the following administration office:
Transmission Agency of Northern California 35 Iron Point Circle, Suite 255 Folsom, CA 95630

CITY OF LODI Notes to Basic Financial Statements (continued)
June 30, 2017
82
(13) MEMBERSHIP IN INSURANCE POOLS California Joint Powers Risk Management Authority
The City is a member, along with sixteen other individual cities and 4 joint powers authorities, of California Joint Powers Risk Management Authority (CJPRMA) organized under a Joint Powers Agreement pursuant to the California Government Code for the purpose of sharing the risk of catastrophic general liability, automobile liability and public officials' errors and omissions losses. CJPRMA has a twenty-one member Board of Directors, including a director from the City of Lodi. The Board members elect officers of CJPRMA every two years. The ultimate cost of the program to the City depends on the catastrophic losses of all members, as well as the City's own loss experience and will be determined through an actuarial analysis of loss history during the ten-year period preceding the three years prior to the end of the current program year. The City periodically pays premiums to the CJPRMA. These premiums are recorded as expenses in the year paid, as they are a reasonable estimate of the actual cost of the program. During the year ended June 30, 2017, premiums of $148,370 were paid to CJPRMA for the liability program. The participants at June 30, 2017, are as follows: Alameda, Chico, Fairfield, Fremont, Livermore, Lodi, Northern California Cities Self Insurance Fund, Petaluma, Redding, Redwood Empire Municipal Insurance Fund, Richmond, Roseville, San Leandro, San Rafael, Santa Rosa, Small Cities Organized Risk Effort, Stockton, Sunnyvale, Vacaville, Vallejo, and Yolo County Public Agencies Risk Management Insurance Authority. Complete financial information for CJPRMA may be obtained at the following administration office: California Joint Powers Risk Management Authority 3252 Constitution Dr.
Livermore, CA 94551
Local Agency Workers' Compensation Excess Joint Powers Authority
The City, along with thirty-three other public agencies, is a member of the Local Agency Workers' Compensation Excess Joint Powers Authority (LAWCX), which was formed July 1992, for the purpose of sharing the risk of workers' compensation losses. LAWCX offers $150,000, $250,000, $350,000, $500,000 and $1 million self-insured retentions (SIR) or a member can attach directly to the purchased excess insurance. LAWCX covers the layer above the member SIR up to $5 million. The City’s self-insured retention is $250,000. LAWCX participates in the California State Association of Counties Excess Insurance Authority (CSAC-EIA) to obtain coverage up to statutory limits. The City paid $406,344 in premiums to LAWCX during the year ended June 30, 2017. The participants at June 30, 2017, are as follows: City of Alameda, Association of Bay Area Governments Shared Risk Pool (ABAG SHARP), Bay Cities Joint Powers Insurance Authority (BCJPIA), City of Benicia, Central Contra Costa County Transit Agency (CCCTA), California Housing

CITY OF LODI Notes to Basic Financial Statements (continued)
June 30, 2017
83
Workers’ Compensation Authority (CHWCA), Central San Joaquin Valley Risk Management Authority (CSJVRMA), City of Clovis, City of Coronado, City of Encinitas, Fire Agencies Self Insurance System (FASIS), City of Gilroy, City of Livermore, City of Lodi, Town of Los Gatos, City of Merced, Monterey County Local Agencies Insurance Authority (MCLAIA), City of Morgan Hill, City of Newark, City of Placentia, City of Pleasanton, Public Agency Risk Sharing Authority of California (PARSAC), City of Roseville, Public Entity Risk Management Authority (PERMA), City of San Leandro, City of Santa Maria, City of Santee, Small Cities Organized Risk Effort (SCORE), City of South Lake Tahoe, City of Suisun City, City of Vacaville, City of Vallejo, Vector Control Joint Powers Agency (VCJPA) and City of Vista. Complete financial information for LAWCX may be obtained at the following administration office:
Local Agency Workers’ Compensation Excess Joint Powers Authority 1750 Creekside Oaks Drive, Suite 200 Sacramento, California 95833
California Transit Insurance Pool The City, along with thirty-three other public agencies is a member of the California Transit Insurance Pool (CalTIP), a joint powers insurance authority which was formed for the purpose of sharing the risk of property damage, bodily injury, personal injury and public officials errors and omissions losses for public transit systems. Liability protection coverage is provided under two programs:
Program I applies to members who choose to utilize CalTIP’s claims administrator services. Program II applies to members with self-insured retentions who choose to provide their own claims administrator services.
CalTIP purchases excess insurance over its $1,000,000 retention up to $20 million per occurrence. Each member is provided with $4 million in excess of the pooled retention for a total of $5 million in coverage and has the option to choose one or both of two additional layers for the full $20 million. CalTIP also provides physical damage coverage to its members. This coverage program is optional for all members and offers damage or loss protection for transit, staff and maintenance vehicles to transit operators. CalTIP self-insures up to $100,000, under which members have the option of five levels of deductible ranging from $500 to $10,000 per vehicle. Claims are administered by the CalTIP’s adjuster. The City paid $111,238 in premiums to CalTIP during the year ended June 30, 2017. There have been no reductions in insurance coverage from the prior year and there were no insurance settlements in excess of insurance coverage in any of the last three years.

CITY OF LODI Notes to Basic Financial Statements (continued)
June 30, 2017
84
Self-
Insured Limit Physical Program Retention (in millions) Damage
City of Lodi Transit System I Prefunded 20 Yes
Complete financial information for CalTip may be obtained at the following administration office: California Transit Insurance Pool 1750 Creekside Oaks Drive, Suite 200 Sacramento, California 95833 (14) DEFICIT IN FUND EQUITY
Internal Service Funds – Fleet Services Fund– A deficit in fund equity in the amount of $24,033 at June 30, 2017, is attributed to the increase in personnel expenses. The City will evaluate the rates charged to departments to eliminate the deficit during the budget process.
(15) POLLUTION REMEDIATION OBLIGATION
The City relies on groundwater for its drinking water and in the late 1980’s, PCE and TCE pollution was discovered in several municipal water supply wells. Investigations conducted by the California Regional Water Quality Control Board (RWQCB) in the early 1990’s under the Well Investigation program revealed numerous areas where TCE was discharged, or where PCE from dry cleaning operations was discharged to the sewer system. In 1997, the Department of Toxic Substances Control (DTSC) and the City entered into a cooperative agreement whereby the City assumed a lead role in the cleanup and agreed to pursue legal action against potentially responsible parties (PRPs). The City’s estimate of the pollution remediation obligation was $70 million. The City has settled with all the involved parties. The City received a draft cleanup and abatement order to investigate the discharges of waste, clean up the waste and abate the effects of the discharges of waste in conformance with the State Water Resources Control Board’s (SWRCB) Resolution No. 92-49 Policies and Procedures for Investigation and Cleanup and Abatement of Discharges Under the Water Code Section 13304 and with the RWQCB’s Water Quality Control Plan for the Sacramento River and San Joaquin River. The City then engaged the services of Treadwell and Rollo to advise the City on courses of action in the preparation of feasibility studies, remedial design, and remedial action plan to comply with the technical and reporting requirements of the SWRCB. The City’s estimated total pollution remediation obligation as of June 30, 2017, is $17,354,008. This amount is an estimate and subject to changes resulting from price increases or reductions, technology, or changes in applicable laws or regulations.

CITY OF LODI Notes to Basic Financial Statements (continued)
June 30, 2017
85
(16) COMMITMENTS AND CONTINGENCIES
Litigation and claims – The City from time to time is a party to various claims, legal actions, and complaints arising in the ordinary course of business. In the opinion of the City’s administration, the various claims, legal actions, and complaints resulting from such litigation not covered by the City’s self-insurance program (see Note 11) would not materially affect the financial position of the City. Water Purchase Agreement with Woodbridge Irrigation District – The City obtains its municipal water supply from wells located within the City, extracting water from the underground aquifer, which is replenished in part by flows of the Mokelumne River. To avoid being wholly dependent upon wells and the possible impacts of eventual overdraft of the groundwater supply, the City made a commitment in 2003 to purchase surface water supply from Woodbridge Irrigation District for 40 years beginning in 2003. The agreement provides for the purchase of 6,000 acre feet per year and the City pays the District $1.2 million annually. Effective January 1, 2010, the amount payable to the District shall be increased by two percent (2%) per year or by the change in the Consumer Price Index whichever is higher but shall not exceed five percent (5%). Arbitrage Earnings Rebate Liability – Arbitrage earnings are defined as income earned on the unexpended tax-exempt certificate proceeds in excess of that which would have been earned had the moneys been invested in securities with a yield of the effective rate of the certificates. Currently, arbitrage earnings must be rebated to the United States Treasury every five years. There is no cumulative arbitrage liability as of June 30, 2017, for any of the City’s outstanding Certificates of Participation and Revenue Bonds. Construction and Other Significant Commitments – Commitments are existing arrangements to enter into future transactions or events, such construction contracts for ongoing projects and long-term contractual obligations with suppliers for future purchases at specified prices and sometimes specified quantities. Significant commitments as of June 30, 2017 are as follows:
Governmental Activities:
Business-type Activities:
General Fund $ 37,669
Electric Fund $ 642,535
Other governmental funds
5,925,061
Wastewater Fund
1,409,378
Water Fund
4,846,473
Transit Fund
623,993
Total governmental activities $ 5,962,730
Total business-type activities $ 7,522,379

CITY OF LODI Notes to Basic Financial Statements (continued)
June 30, 2017
86
(17) SUBSEQUENT EVENTS
On December 6, 2017, the City Council formally approved the City’s Pension Stabilization policy that invests all General Fund reserves in excess of the 16% reserve policy in the pension stabilization account until such time as the City’s pension system is 80% funded. Funded status is calculated by comparing total accrued liabilities to combined CalPERS and pension stabilization account assets. Other funds are similarly required to make contributions to the pension stabilization account on a prorated basis to the General Fund contribution based on the current year’s total PERS budget for that fund. On December 6, 2017, the Lodi Public Financing Authority (PFA) of the City issued refunding bonds in an amount of $7,555,000 for the purpose of refunding the outstanding Wastewater System Revenue Certificates of Participation, 2007 Series A.
REQUIRED SUPPLEMENTARY INFORMATION

87
Measurement Period 2015-16 (1) 2014-15 (1) 2013-14 (1)
Total Pension LiabilityService Cost 2,464,894$ 2,358,112$ 2,478,901$ Interest 12,565,553 12,061,399 11,705,179 Differences Between Expected and Actual Experience 542,177 (1,655,012) Changes of Assumptions (2,903,507) Benefit Payments, Including Refunds of Employee Contributions (8,641,550) (8,208,103) (7,729,680)
Net Change in Total Pension Liability 6,931,074 1,652,889 6,454,400 Total Pension Liability - Beginning 166,801,735 165,148,846 158,694,446 Total Pension Liability - Ending (a) 173,732,809 166,801,735 165,148,846
Plan Fiduciary Net PositionContributions - Employer 3,500,179 2,994,958 2,694,850 Contributions - Employee 1,241,136 1,183,452 1,237,916 Net Investment Income (2) 643,509 2,829,910 19,249,151 Benefit Payments, Including Refunds of Employee Contributions (8,641,550) (8,208,103) (7,729,680) Other Changes in Fiduciary Net Position (76,838) (145,538)
Net Change in Fiduciary Net Position (3,333,564) (1,345,321) 15,452,237 Plan Fiduciary Net Position - Beginning 126,077,924 127,423,245 111,971,008 Plan Fiduciary Net Position - Ending (b) 122,744,360 126,077,924 127,423,245 Plan Net Pension Liability - Ending (a) - (b) 50,988,449$ 40,723,811$ 37,725,601$
Plan Fiduciary Net Position as a Percentage of the Total Pension Liability 70.65% 75.59% 77.16%
Covered Payroll 17,423,446$ 16,572,579$ 16,669,363$
Plan Net Pension Liability as a Percentage of Covered Payroll 292.64% 245.73% 226.32%
(1) Historical information is required only for measurement periods for which GASB 68 is applicable.(2) Net of administrative expenses.
Notes to Schedule:
Information in this schedule is not available prior to fiscal year 2013-14 measurement period. Additional years will be added to this schedule until 10 years of data is presented.
Changes of Assumptions: In fiscal year 2015-16, there were no changes. In fiscal year 2014-15, the discount rate was changed from 7.5 percent (net of administrative expense) to 7.65 percent.
Benefit Changes: There have been no changes in benefit terms. The figures above do not include any liability impact thatmay have resulted from plan changes which occurred after June 30, 2015. This applies for voluntary benefit changes aswell as any offers to Two Years Additional Service Credits (a.k.a. Golden Handshakes).
CITY OF LODIREQUIRED SUPPLEMENTARY INFORMATION
SCHEDULE OF CHANGES IN NET PENSION LIABILITY AND RELATED RATIOSMISCELLANEOUS PLAN

88
Measurement Period 2015-16 (1) 2014-15 (1) 2013-14 (1)
Total Pension LiabilityService Cost 2,890,607$ 2,968,819$ 3,048,048$ Interest 12,357,788 11,827,918 11,390,793 Changes of Benefit TermsDifferences Between Expected and Actual Experience 600,847 (932,918) Changes of Assumptions (2,939,033) Benefit Payments, Including Refunds of EmployeeBenefit Payments, Including Refunds of Employee Contributions (8,730,081) (8,134,067) (7,448,361)
Net Change in Total Pension Liability 7,119,161 2,790,719 6,990,480 Total Pension Liability - Beginning 163,858,600 161,067,881 154,077,401 Total Pension Liability - Ending (a) 170,977,761 163,858,600 161,067,881
Plan Fiduciary Net PositionContributions - Employer 4,660,278 4,176,197 4,106,044 Contributions - Employee 1,062,984 1,007,876 1,058,376 Net Investment Income (2) 558,434 2,397,191 16,070,261 Benefit Payments, Including Refunds of Employee Contributions (8,730,081) (8,134,067) (7,448,361) Other Changes in Fiduciary Net Position (64,882) (119,971) -
Net Change in Fiduciary Net Position (2,513,267) (672,774) 13,786,320 Plan Fiduciary Net Position - Beginning 106,458,927 107,131,701 93,345,381 Plan Fiduciary Net Position - Ending (b) 103,945,660 106,458,927 107,131,701 Plan Net Pension Liability - Ending (a) - (b) 67,032,101$ 57,399,673$ 53,936,180$
Plan Fiduciary Net Position as a Percentage of the Total Pension Liability 60.79% 64.97% 66.51%
Covered Payroll 11,106,615$ 11,293,867$ 11,194,123$
Plan Net Pension Liability as a Percentage of Covered Payroll 603.53% 508.24% 481.83%
(1) Historical information is required only for measurement periods for which GASB 68 is applicable.(2) Net of administrative expenses.
Notes to Schedule:
Information in this schedule is not available prior to fiscal year 2013-14 measurement period. Additional years will be added to this schedule until 10 years of data is presented.
Changes of Assumptions: In fiscal year 2015-16, there were no changes. In fiscal year 2014-15, the discount rate was changed from 7.5 percent (net of administrative expense) to 7.65 percent.
Benefit Changes: There have been no changes in benefit terms. The figures above do not include any liability impact thatmay have resulted from plan changes which occurred after June 30, 2015. This applies for voluntary benefit changes aswell as any offers to Two Years Additional Service Credits (a.k.a. Golden Handshakes).
CITY OF LODIREQUIRED SUPPLEMENTARY INFORMATION
SCHEDULE OF CHANGES IN NET PENSION LIABILITY AND RELATED RATIOSSAFETY PLAN

89
2016-17 2015-16 2014-15 2013-14Miscellaneous Plan:Actuarially Determined Contributions 3,880,495$ 3,500,179$ 2,994,958$ 2,694,850$ Contributions in Relation to the Actuarially Determined Contributions (3,880,495) (3,500,179) (2,994,958) (2,694,850)
Contribution Deficiency -$ -$ -$ -$
Covered Payroll 17,802,886$ 17,423,446$ 16,572,579$ 16,669,363$
Contributions as a Percentage of Covered Payroll 21.80% 20.09% 18.07% 16.17%
Safety Plan:Actuarially Determined Contributions 5,136,610$ 4,660,278$ 4,176,197$ 4,106,044$ Contributions in Relation to the Actuarially Determined Contributions (5,136,610) (4,660,278) (4,176,197) (4,106,044)
Contribution Deficiency -$ -$ -$ -$
Covered Payroll 11,477,432$ 11,106,615$ 11,293,867$ 11,194,123$
Contributions as a Percentage of Covered Payroll 44.75% 41.96% 36.98% 36.68%
Notes to Schedule:
Actuarial Cost Method Entry Age NormalAmortization Method/PeriodAsset Valuation Method Market value of assets.Inflation 2.75%Salary Increases Varies by Entry Age and ServicePayroll Growth 3.00%Investment Rate of Return 7.50% Net of Pension Plan Investment and Administrative Expenses; includes Inflation.Retirement Age
Mortality
Changes of Assumptions: In fiscal year 2016-17, the probabilities of mortality were updated to include the 2014 CalPERS Experience Study through 2011, and mortality rates were changed from 5 years of projected mortality improvement using Scale AA to 20 years of projected on-going mortality improvement using Scale BB. In fiscal year 2015-16, the asset valuation method was changed to market value of assets from actuarial value of assets. No change in assumptions for fiscal year 2014-15.
The probabilities of mortality are based on the 2014 CalPERS Experience Study for the period from 1997 to2011. Pre-retirement and Post-retirement mortality rates include 20 years of projected on-going mortalityimprovement using Scale BB published by the Society of Actuaries.
The probabilities of Retirement are based on the 2014 CalPERS Experience Study for the period from 1997 to2011.
CITY OF LODIREQUIRED SUPPLEMENTARY INFORMATION
SCHEDULE OF PENSION CONTRIBUTIONS
The actuarial methods and assumptions used to set the actuarially determined contributions for Fiscal Year 2016-17 were from the June 30, 2014public agency funding valuations.
Level percent of payroll over 30 years.

90
Unfunded Actuarial
Actuarial Actuarial Accrued Annual UAAL As aActuarial Value Accrued Liability Funded Covered Percentage ofValuation of Assets Liability (UAAL) Ratio Payroll Covered Payroll
Date (A) (B) [(B) - (A)] [(A) / (B)] (C) {[(B) – (A)]/(C)}
1/1/2012 $ 0 $ 17,011 $ 17,011 0% $ 7,305 233%1/1/2014 0 16,879 16,879 0% 5,697 296%1/1/2016 0 39,041 39,041 0% 35,499 110%
City of LodiRequired Supplementary Information
Schedule of Funding Progress – OPEB Plan (in thousands of dollars)

The note to the required supplementary information is an integral part of this schedule. 91
Variance withOriginal Final Actual Final Budget
REVENUESTaxes 25,710,370$ 25,710,370$ 26,490,919$ 780,549$ Licenses and permits 95,280 95,280 86,844 (8,436) Intergovernmental revenues 12,582,190 12,582,190 12,830,329 248,139 Charges for services 1,296,580 1,296,580 1,852,855 556,275 Fines, forfeits, and penalties 1,489,500 1,489,500 906,563 (582,937) Investment and rental income 1,562,360 1,562,360 1,734,773 172,413 Miscellaneous revenue 233,100 233,100 319,373 86,273
Total revenues 42,969,380 42,969,380 44,221,656 1,252,276
EXPENDITURESCurrent:
General government: City Manager 1,067,720 1,067,720 1,029,783 37,937 City Clerk 686,170 686,170 640,511 45,659 City Attorney 530,830 539,830 532,270 7,560 Human Resources 505,040 540,836 533,195 7,641 Information Systems 1,249,800 1,249,800 1,069,401 180,399 Financial Services 1,805,250 1,795,250 1,781,234 14,016 Budget and Treasury 266,740 266,740 265,803 937 Non Departmental 1,140,130 3,946,820 3,904,381 42,439
Total general government 7,251,680 10,093,166 9,756,578 336,588
Public protection: Police 19,583,220 19,574,248 18,843,212 731,036 Fire 11,391,860 11,389,556 11,126,569 262,987
Total public protection 30,975,080 30,963,804 29,969,781 994,023
Public works 2,173,770 2,173,770 1,698,518 475,252
Library 1,314,400 1,355,331 1,193,652 161,679
Total expenditures 41,714,930 44,586,071 42,618,529 1,967,542
Excess (deficiency) of revenues over (under) expenditures 1,254,450 (1,616,691) 1,603,127 3,219,818
OTHER FINANCING SOURCES (USES)Transfers in 3,952,000 3,952,000 3,952,000 - Transfers out (6,705,840) (6,705,840) (6,705,104) 736
Total other financing sources (uses) (2,753,840) (2,753,840) (2,753,104) 736
Changes in fund balance (budgetary basis) (1,499,390) (4,370,531) (1,149,977) 3,220,554$
Basis adjustment:Pension set aside 2,871,141
Changes in fund balance (GAAP basis) 1,721,164
Fund balances - beginning 13,247,193 13,247,193 13,247,193 Fund balances - ending 11,747,803$ 8,876,662$ 14,968,357$
Budgeted Amounts
City of LodiSchedule of Revenues, Expenditures, and Changes in Fund Balance – Budget and Actual - General Fund
For the Year Ended June 30, 2017
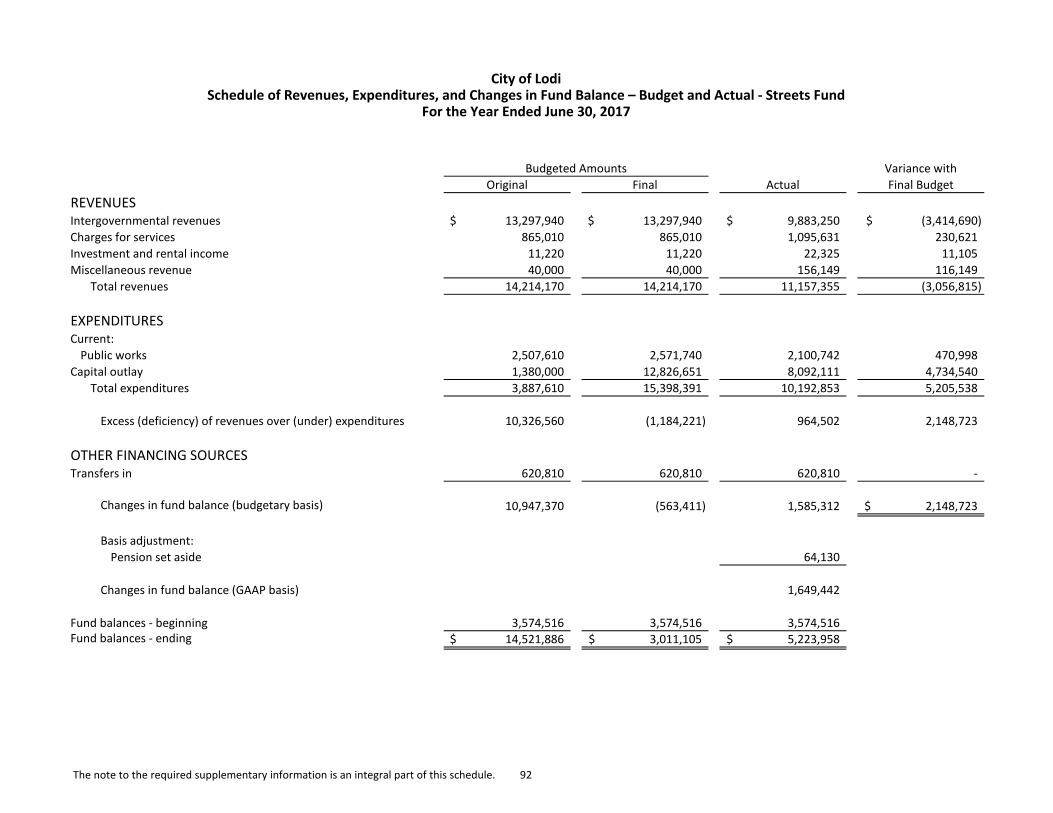
The note to the required supplementary information is an integral part of this schedule. 92
Variance withOriginal Final Actual Final Budget
REVENUESIntergovernmental revenues 13,297,940$ 13,297,940$ 9,883,250$ (3,414,690)$ Charges for services 865,010 865,010 1,095,631 230,621 Investment and rental income 11,220 11,220 22,325 11,105 Miscellaneous revenue 40,000 40,000 156,149 116,149
Total revenues 14,214,170 14,214,170 11,157,355 (3,056,815)
EXPENDITURESCurrent:
Public works 2,507,610 2,571,740 2,100,742 470,998 Capital outlay 1,380,000 12,826,651 8,092,111 4,734,540
Total expenditures 3,887,610 15,398,391 10,192,853 5,205,538
Excess (deficiency) of revenues over (under) expenditures 10,326,560 (1,184,221) 964,502 2,148,723
OTHER FINANCING SOURCESTransfers in 620,810 620,810 620,810 -
Changes in fund balance (budgetary basis) 10,947,370 (563,411) 1,585,312 2,148,723$
Basis adjustment:Pension set aside 64,130
Changes in fund balance (GAAP basis) 1,649,442
Fund balances - beginning 3,574,516 3,574,516 3,574,516 Fund balances - ending 14,521,886$ 3,011,105$ 5,223,958$
Budgeted Amounts
City of LodiSchedule of Revenues, Expenditures, and Changes in Fund Balance – Budget and Actual - Streets Fund
For the Year Ended June 30, 2017

93
CITY OF LODI Note to the Required Supplementary Information
June 30, 2017
Budgetary Data
The City adopts an annual budget for the General Fund and special revenue funds. These budgets are prepared in accordance with generally accepted accounting principles with the exception of deposits into the pension stabilization account that the City budgeted for as expenditures in the General; Streets; Parks, Recreation, and Community Services; and Community Development funds. As part of the City’s internal controls, the City maintains budgetary controls. The objective of these budgetary controls is to ensure compliance with the legal provisions embodied in the annual appropriated budget approved by the City Council. The budgetary comparison schedules present budget and actual data only of funds for which an annual budget was adopted. The budgets for capital projects are primarily "long-term" budgets that emphasize the major programs and capital project plans extending over a number of years. Due to the long-term nature of these projects, "annual" budget and actual comparisons are not considered meaningful. Formal budgetary integration is not employed for debt service funds since effective budgetary control is alternatively achieved through the bond indenture provisions. Accordingly, no budgetary information is included in the combining and individual fund statements and schedules for capital projects and debt service funds.
The City Council follows the following procedures in establishing the budgetary data reflected in the accompanying required supplementary information and in the budgetary comparison schedules for nonmajor special revenue funds:
Original Budget
On or prior to the first regular Council meeting in June of each year, the City Manager submits to the City Council a proposed Financial Plan and Budget for the fiscal year commencing July 1. The budget includes proposed expenditures and the means of financing them. Budgeted revenues are adopted by the City Council at the time the budget is approved. Budgeted revenues are modified when the tax base changes, when fees are modified or when new revenue sources are identified. Public hearings are conducted during meetings of the City Council to obtain citizens' comments. Prior to July 1, the budget is legally enacted through passage of a resolution.

94
Final Budget
The final budgetary data presented in the required supplementary information and in the budgetary comparison schedules for nonmajor special revenue funds reflects the following changes to the original budget:
• Budgeted expenditures represent original appropriations adjusted by budget transfers and appropriation amendments.
The legal level of budgetary control (that is, the level at which expenditures can not legally exceed the appropriated amount) is at the department level. The operating budget is prepared and controlled at the department level (e.g., city clerk, city manager, etc.) for the General Fund. Special revenue fund expenditures, including transfers out, are approved by Council at the fund level.
• The City Manager may transfer appropriations from one activity to another within a department without approval from the
City Council. All other appropriation adjustments during the year, whether transfers, increases or decreases, require City Council approval.

COMBINING AND INDIVIDUAL FUND STATEMENTS
AND SCHEDULES

NONMAJOR GOVERNMENTAL FUNDS Nonmajor Governmental Funds include:
Special Revenue Funds account for the proceeds of specific revenue sources that are restricted or committed by law or administrative action to expenditures for specified purposes, other than those for major capital projects;
Debt Service Fund account for the accumulation of resources for the repayment of principal and interest on general long-term debt;
Capital Projects Funds account for the financial resources to be used for the acquisition or construction of major capital facilities, other than those financed by proprietary funds.

95
Special Revenue Funds Capital Projects FundsTotal Other
Governmental FundsASSETSCash and investments 4,786,535$ 6,777,481$ 11,564,016$ Accounts receivable, net 77,675 175,692 253,367 Interest receivable 7,169 6,350 13,519 Due from other funds 195,698 - 195,698 Due from other governmental agencies 507,360 - 507,360 Inventory 1,355 - 1,355
Total assets 5,575,792$ 6,959,523$ 12,535,315$
LIABILITIESAccounts payable and other liabilities 141,045$ 799,596$ 940,641$ Due to other funds 195,698 - 195,698 Advances from other funds - 1,088,311 1,088,311 Unearned revenue 45,804 - 45,804
Total liabilities 382,547 1,887,907 2,270,454
DEFERRED INFLOWS OF RESOURCESUnavailable revenue 44,777 180,357 225,134
FUND BALANCESNonspendable Inventory 1,355 - 1,355 Restricted for:
Road-related projects 6,556 - 6,556 Capital projects - 4,891,259 4,891,259 Home and CDBG program 25,225 - 25,225 Public safety 428,841 - 428,841 Community development 3,892,405 - 3,892,405 Parks, recreation and community services 794,086 - 794,086
Total fund balances 5,148,468 4,891,259 10,039,727
Total liabilities, deferred inflows of resources, and fund balances 5,575,792$ 6,959,523$ 12,535,315$
City of LodiCombining Balance Sheet
Nonmajor Governmental Funds June 30, 2017

96
Special Revenue Funds Debt Service Fund Capital Projects FundsTotal Other
Governmental FundsREVENUESLicenses and permits 1,928,188$ -$ -$ 1,928,188$ Intergovernmental revenues 1,261,109 - - 1,261,109 Charges for services 2,669,401 - 104,422 2,773,823 Investment and rental income 535,792 - 26,396 562,188 Miscellaneous revenue 112,294 - 229,811 342,105
Total revenues 6,506,784 - 360,629 6,867,413
EXPENDITURESCurrent:
General government 2,518,139 - 54,372 2,572,511 Public protection 231,516 - - 231,516 Public works 872,730 - - 872,730 Community development 1,650,876 - - 1,650,876 Parks and recreation 2,377,753 - - 2,377,753
Capital outlay 76,022 - 3,424,237 3,500,259 Debt service:
Interest 11,112 836,055 11,015 858,182 Principal retirement 75,428 919,989 245,000 1,240,417
Total expenditures 7,813,576 1,756,044 3,734,624 13,304,244 Deficiency of revenues under expenditures (1,306,792) (1,756,044) (3,373,995) (6,436,831)
OTHER FINANCING SOURCES (USES)Transfers in 4,114,800 1,756,044 1,278,930 7,149,774 Transfers out (966,480) - - (966,480)
Total other financing sources (uses) 3,148,320 1,756,044 1,278,930 6,183,294
Changes in fund balances 1,841,528 - (2,095,065) (253,537) Fund balances - beginning 3,306,940 - 6,986,324 10,293,264 Fund balances - ending 5,148,468$ -$ 4,891,259$ 10,039,727$
City of LodiCombining Statement of Revenues, Expenditures, and Changes in Fund Balances
Nonmajor Governmental FundsFor the Year Ended June 30, 2017

NONMAJOR GOVERNMENTAL FUNDS
SPECIAL REVENUE FUNDS

97
NONMAJOR SPECIAL REVENUE FUNDS
Parks, Recreation, and Community Services This fund was established to account for the revenues and expenditures related to the activities of the Hutchins Street Square and Performing Arts Theater and the wide-range of parks and recreation activities and programs offered to the public
Public Safety This fund was established to account for the revenues and expenditures related to the City's share of property forfeited by persons convicted of possession and selling illegal drugs and the State of California auto theft prosecution monies along with State and Federal grants related to public safety operations.
Community Development This fund was established to account for development planning and project review services including land use entitlements, permit processing and review/inspection of public improvements to ensure orderly physical growth and development of the City.
Transportation This fund was established to account for the receipt of moneys from the State of California apportioned to the City for transportation purposes. The State has designated 1/4% of the 6% sales tax levied statewide for local transportation purposes. Funding for this program was provided during the 1971 legislative session with the enactment of the Transportation Development Act, which extended the 6% sales tax to include purchases of gasoline. Revenues allocated to the City of Lodi under this program are divided into two categories: Article 8 funds, which are restricted for the improvement and maintenance of street systems; and Article 4 funds, which are restricted for public transit systems.
HOME Program and Community Development Block Grants This fund was established to account for the City’s HOME Program that provides adequate and affordable housing for low and very low-income residents, and Community Development Block Grants provided to the City principally for low and moderate income residents to develop a suitable living environment and expand economic opportunities.

(This page intentionally left blank.)

99
Parks, Recreation, and Community Services Public Safety
Community Development Transportation
HOME Program and Community
Development Block Grants
Total Nonmajor Special Revenue Funds
ASSETSCash and investments 762,130$ 349,466$ 3,674,939$ -$ -$ 4,786,535$ Accounts receivable, net 62,439 - - 15,236 - 77,675 Interest receivable 963 592 5,545 (13) 82 7,169 Due from other funds - - 195,698 - - 195,698 Due from other governmental agencies - 93,585 32,604 - 381,171 507,360 Inventory 1,355 - - - - 1,355
Total assets 826,887$ 443,643$ 3,908,786$ 15,223$ 381,253$ 5,575,792$
LIABILITIESAccounts payable and other liabilities 31,376$ -$ 16,381$ -$ 93,288$ 141,045$ Due to other funds - - - 8,667 187,031 195,698 Unearned revenue - 14,802 - - 31,002 45,804
Total liabilities 31,376 14,802 16,381 8,667 311,321 382,547
DEFERRED INFLOWS OF RESOURCESUnavailable revenue 70 - - - 44,707 44,777
FUND BALANCESNonspendable Inventory 1,355 - - - - 1,355 Restricted for:
Road-related projects - - - 6,556 - 6,556 Public safety - 428,841 - - - 428,841 Home and CDBG program - - - - 25,225 25,225 Community development - - 3,892,405 - - 3,892,405 Parks, recreation and community services 794,086 - - - - 794,086
Total fund balances 795,441 428,841 3,892,405 6,556 25,225 5,148,468
Total liabilities, deferred inflows of resources, and fund balances 826,887$ 443,643$ 3,908,786$ 15,223$ 381,253$ 5,575,792$
City of LodiCombining Balance Sheet
Nonmajor Governmental Funds - Special Revenue Funds June 30, 2017

100
Parks, Recreation, and Community Services Public Safety
Community Development Transportation
HOME Program and Community
Development Block Grants
Total Nonmajor Special Revenue Funds
REVENUESLicenses and permits -$ -$ 1,928,188$ -$ -$ 1,928,188$ Intergovernmental revenues 46,023 270,136 32,604 15,236 897,110 1,261,109 Charges for services 1,759,246 - 910,155 - - 2,669,401 Investment and rental income 514,463 2,362 18,591 52 324 535,792 Miscellaneous revenue 25,914 - 86,380 - - 112,294
Total revenues 2,345,646 272,498 2,975,918 15,288 897,434 6,506,784
EXPENDITURESCurrent:
General government 2,518,139 - - - - 2,518,139 Public protection - 231,516 - - - 231,516 Public works - - - - 872,730 872,730 Community development - - 1,650,876 - - 1,650,876 Parks and recreation 2,377,753 - - - - 2,377,753
Capital outlay 46,023 - - 29,999 - 76,022 Debt service:
Interest - 11,112 - - - 11,112 Principal retirement - 75,428 - - - 75,428
Total expenditures 4,941,915 318,056 1,650,876 29,999 872,730 7,813,576
Excess (deficiency) of revenues over (under) expenditures (2,596,269) (45,558) 1,325,042 (14,711) 24,704 (1,306,792)
OTHER FINANCING SOURCES (USES)Transfers in 3,949,800 - 165,000 - - 4,114,800 Transfers out (945,480) - (21,000) - - (966,480)
Total other financing sources (uses) 3,004,320 - 144,000 - - 3,148,320
Changes in fund balances 408,051 (45,558) 1,469,042 (14,711) 24,704 1,841,528
Fund balances - beginning 387,390 474,399 2,423,363 21,267 521 3,306,940 Fund balances - ending 795,441$ 428,841$ 3,892,405$ 6,556$ 25,225$ 5,148,468$
City of LodiCombining Statement of Revenues, Expenditures, and Changes in Fund Balances
Nonmajor Governmental Funds - Special Revenue FundsFor the Year Ended June 30, 2017

101
Variance withOriginal Final Actual Final Budget
REVENUESIntergovernmental revenues -$ 46,000$ 46,023$ 23$ Charges for services 1,820,180 1,822,180 1,759,246 (62,934) Investment and rental income 463,920 481,920 514,463 32,543 Miscellaneous revenue 7,500 27,730 25,914 (1,816)
Total revenues 2,291,600 2,377,830 2,345,646 (32,184)
EXPENDITURESCurrent:
General government 2,868,280 2,888,280 2,618,907 269,373 Parks and recreation 2,549,110 2,649,878 2,377,753 272,125
Capital outlay - 49,289 46,023 3,266 Total expenditures 5,417,390 5,587,447 5,042,683 544,764
Deficiency of revenues under expenditures (3,125,790) (3,209,617) (2,697,037) 512,580
OTHER FINANCING SOURCES (USES)Transfers in 3,949,800 3,949,800 3,949,800 - Transfers out (875,250) (1,020,480) (945,480) 75,000
Total other financing sources (uses) 3,074,550 2,929,320 3,004,320 75,000
Changes in fund balance (budgetary basis) (51,240) (280,297) 307,283 587,580$
Basis adjustment:Pension set aside 100,768
Changes in fund balance (GAAP basis) 408,051
Fund balances - beginning 387,390 387,390 387,390 Fund balances - ending 336,150$ 107,093$ 795,441$
Budgeted Amounts
City of LodiSchedule of Revenues, Expenditures, and Changes in Fund Balance – Budget and Actual - Parks, Recreation, and Community Services Fund
For the Year Ended June 30, 2017

102
Variance withOriginal Final Actual Final Budget
REVENUESIntergovernmental revenues 349,280$ 713,280$ 270,136$ (443,144)$ Fines, forfeits, and penalties 3,000 3,000 - (3,000) Investment and rental income 1,700 1,700 2,362 662 Miscellaneous revenue - 562,387 - (562,387)
Total revenues 353,980 1,280,367 272,498 (1,007,869)
EXPENDITURESCurrent:
Public protection 378,250 1,391,933 231,516 1,160,417 Debt service:
Interest 11,112 11,112 11,112 - Principal retirement 75,428 75,428 75,428 -
Total expenditures 464,790 1,478,473 318,056 1,160,417
Changes in fund balance (24,270) (111,566) (45,558) 66,008$
Fund balances - beginning 474,399 474,399 474,399 Fund balances - ending 450,129$ 362,833$ 428,841$
Budgeted Amounts
City of LodiSchedule of Revenues, Expenditures, and Changes in Fund Balance – Budget and Actual - Public Safety Fund
For the Year Ended June 30, 2017

103
Variance withOriginal Final Actual Final Budget
REVENUESLicenses and permits 1,203,200$ 1,203,200$ 1,928,188$ 724,988$ Intergovernmental revenues 362,000 362,000 32,604 (329,396) Charges for services 529,300 529,300 910,155 380,855 Investment and rental income 8,640 8,640 18,591 9,951 Miscellaneous revenue 100,620 100,620 86,380 (14,240)
Total revenues 2,203,760 2,203,760 2,975,918 772,158
EXPENDITURESCurrent:
Community development 2,171,120 2,238,682 1,718,438 520,244
Excess (deficiency) of revenues over (under) expenditures 32,640 (34,922) 1,257,480 1,292,402
OTHER FINANCING SOURCES (USES)Transfers in 165,000 165,000 165,000 - Transfers out (21,000) (21,000) (21,000) -
Total other financing sources (uses) 144,000 144,000 144,000 -
Changes in fund balance (budgetary basis) 176,640 109,078 1,401,480 1,292,402$
Basis adjustment:Pension set aside 67,562
Changes in fund balance (GAAP basis) 1,469,042
Fund balances - beginning 2,423,363 2,423,363 2,423,363 Fund balances - ending 2,600,003$ 2,532,441$ 3,892,405$
Budgeted Amounts
City of LodiSchedule of Revenues, Expenditures, and Changes in Fund Balance – Budget and Actual - Community Development Fund
For the Year Ended June 30, 2017

104
Variance withOriginal Final Actual Final Budget
REVENUESIntergovernmental revenues 47,100$ 47,100$ 15,236$ (31,864)$ Investment and rental income - - 52 52
Total revenues 47,100 47,100 15,288 (31,812)
EXPENDITURESCapital outlay 30,000 30,000 29,999 1
Changes in fund balance 17,100 17,100 (14,711) (31,811)$
Fund balances - beginning 21,267 21,267 21,267 Fund balances - ending 38,367$ 38,367$ 6,556$
Budgeted Amounts
City of LodiSchedule of Revenues, Expenditures, and Changes in Fund Balance – Budget and Actual - Transportation Fund
For the Year Ended June 30, 2017

105
Variance withOriginal Final Actual Final Budget
REVENUESIntergovernmental revenues 1,128,620$ 1,128,620$ 897,110$ (231,510)$ Investment and rental income - - 324 324
Total revenues 1,128,620 1,128,620 897,434 (231,186)
EXPENDITURESCurrent:
Public works 1,128,620 1,128,620 872,730 255,890
Changes in fund balance - - 24,704 24,704$
Fund balances - beginning 521 521 521 Fund balances - ending 521$ 521$ 25,225$
Budgeted Amounts
City of LodiSchedule of Revenues, Expenditures, and Changes in Fund Balance – Budget and Actual - HOME Program and Community Development Block
Grants FundFor the Year Ended June 30, 2017

(This page intentionally left blank.)

NONMAJOR GOVERNMENTAL FUNDS
CAPITAL PROJECT FUNDS

107
NONMAJOR CAPITAL PROJECT FUNDS
Vehicle and Equipment This fund was established to account for the financing and replacement of vehicles and equipment for all funds of the City with the exception of the Enterprise Funds. Financing is primarily provided through transfers from other funds, interest earnings and sales of surplus property.
Library This fund is used to account for the acquisition, construction and installation of capital facilities for the Library.
Hutchins Street Square When the old Lodi High School burned down, the City purchased the property and renamed it Hutchins Street Square. The Old Lodi High Site Foundation was established which organizes events to raise money for the capital restoration of Hutchins Street Square.
Capital Outlay Reserve This fund was established to account for the entire City's construction projects and capital purchases in excess of $10,000 with the exception of
those funded through Enterprise Funds. Financing is provided primarily through transfers from other funds and from State and Federal grants.
Parks Capital This fund was established to account for the acquisition, construction and installation of capital facilities for the various City parks.

108
Vehicle and Equipment Library Hutchins Street Square Capital Outlay Reserve Parks Capital
Total Nonmajor Capital Projects Funds
ASSETSCash and investments 2,092,941$ 14,567$ 3,290$ 3,725,303$ 941,380$ 6,777,481$ Accounts receivable, net - - - 175,692 - 175,692 Interest receivable - - 2 4,998 1,350 6,350
Total assets 2,092,941$ 14,567$ 3,292$ 3,905,993$ 942,730$ 6,959,523$
LIABILITIESAccounts payable and other liabilities 57,038$ -$ -$ 713,268$ 29,290$ 799,596$ Advances from other funds - - - 1,024,025 64,286 1,088,311
Total liabilities 57,038 - - 1,737,293 93,576 1,887,907
DEFERRED INFLOWS OF RESOURCESUnavailable revenue - - - 180,357 - 180,357
FUND BALANCESRestricted for: Capital projects 2,035,903 14,567 3,292 1,988,343 849,154 4,891,259
Total liabilities, deferred inflows of resources, and fund balances 2,092,941$ 14,567$ 3,292$ 3,905,993$ 942,730$ 6,959,523$
City of LodiCombining Balance Sheet
Nonmajor Governmental Funds - Capital Projects Funds June 30, 2017

109
Vehicle and Equipment Library Hutchins Street Square Capital Outlay Reserve Parks CapitalTotal Nonmajor Capital
Projects FundsREVENUESCharges for services -$ -$ -$ 104,422$ -$ 104,422$ Investment and rental income - - 6 20,609 5,781 26,396 Miscellaneous revenue 91,366 - - - 138,445 229,811
Total revenues 91,366 - 6 125,031 144,226 360,629
EXPENDITURESCurrent:
General government 54,372 - - - - 54,372 Capital outlay 1,060,375 310,927 - 1,769,720 283,215 3,424,237 Debt service:
Interest - - - 11,015 - 11,015 Principal retirement - - - 245,000 - 245,000
Total expenditures 1,114,747 310,927 - 2,025,735 283,215 3,734,624 Excess (deficiency) of revenues over (under) expenditures (1,023,381) (310,927) 6 (1,900,704) (138,989) (3,373,995)
OTHER FINANCING SOURCESTransfers in 609,500 - - 435,000 234,430 1,278,930
Changes in fund balances (413,881) (310,927) 6 (1,465,704) 95,441 (2,095,065)
Fund balances - beginning 2,449,784 325,494 3,286 3,454,047 753,713 6,986,324 Fund balances - ending 2,035,903$ 14,567$ 3,292$ 1,988,343$ 849,154$ 4,891,259$
City of LodiCombining Statement of Revenues, Expenditures, and Changes in Fund Balances
Nonmajor Governmental Funds - Capital Projects FundsFor the Year Ended June 30, 2017

INTERNAL SERVICE FUNDS

111
INTERNAL SERVICE FUNDS
Internal Service Funds are maintained to account for the internal transfer of services between operating units of the City and to achieve a
level of operating efficiency that may not be available if the same activities were performed by multiple organizations.
Fleet Services This fund is used to account for the operation, maintenance and timely replacement of the City’s fleet of vehicles which serve the transportation needs of all city departments.
Benefits This fund is used to account for the following employee benefits:
Dental Employee assistance program Chiropractic Employee recognition program Life/accidental insurance Unemployment insurance Medical Flexible spending program Vision Long Term Disability
Insurance This fund is used to account for the following insurances:
General Liability Workers’ Compensation Other Insurance

112
Fleet Services Benefits InsuranceTotal Internal Service
FundsASSETSCurrent assets:
Cash and investments -$ 899,735$ 13,427,662$ 14,327,397$ Accounts receivable, net 723 31,785 - 32,508 Interest receivable (144) 1,320 19,806 20,982 Due from other funds - - 27,692 27,692 Inventory 144,421 - - 144,421 Other assets - 102,920 - 102,920
Noncurrent assets: Capital assets:
Depreciable, net 24,603 - - 24,603 Total assets 169,603 1,035,760 13,475,160 14,680,523
LIABILITIESCurrent liabilities:
Accounts payable and other liabilities 33,224 82,139 61,488 176,851 Due to other funds 27,692 - - 27,692 Self-insurance liability - - 2,365,077 2,365,077 Accrued compensated absences 29,371 - - 29,371
Noncurrent liabilities:Self-insurance liability - - 6,477,321 6,477,321 Accrued compensated absences 103,349 - - 103,349
Total liabilities 193,636 82,139 8,903,886 9,179,661
NET POSITIONNet investment in capital assets 24,603 - - 24,603 Unrestricted (48,636) 953,621 4,571,274 5,476,259
Total net position (24,033)$ 953,621$ 4,571,274$ 5,500,862$
City of LodiCombining Statement of Fund Net Position
Internal Service Funds June 30, 2017

113
Fleet Services Benefits InsuranceTotal Internal Service
FundsOPERATING REVENUESCharges for services 1,590,782$ 8,015,168$ 4,093,697$ 13,699,647$
OPERATING EXPENSESPersonnel services 826,538 705,653 136,942 1,669,133 Supplies, materials and services 900,417 6,816,310 1,219,015 8,935,742 Utilities 13,657 - 670 14,327 Depreciation 1,447 - - 1,447 Claims 34,200 1,288,372 2,365,077 3,687,649
Total operating expenses 1,776,259 8,810,335 3,721,704 14,308,298
Operating income (loss) (185,477) (795,167) 371,993 (608,651)
NONOPERATING REVENUESInvestment income (1,240) 7,380 66,810 72,950 Other revenues 43,209 31,811 77,515 152,535
Total nonoperating revenues 41,969 39,191 144,325 225,485
Changes in net position (143,508) (755,976) 516,318 (383,166)
Total net position - beginning 119,475 1,709,597 4,054,956 5,884,028 Total net position - ending (24,033)$ 953,621$ 4,571,274$ 5,500,862$
City of LodiCombining Statement of Revenues, Expenses, and Changes in Fund Net Position
Internal Service FundsFor the Year Ended June 30, 2017
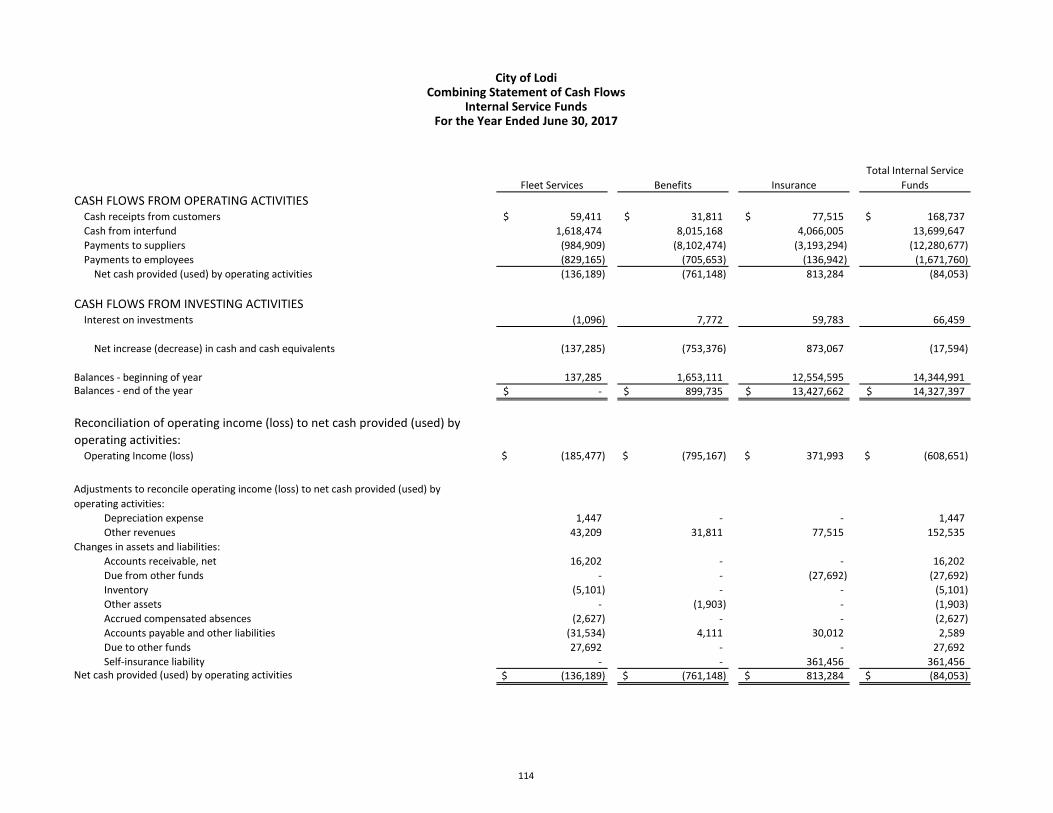
114
Fleet Services Benefits InsuranceTotal Internal Service
FundsCASH FLOWS FROM OPERATING ACTIVITIES
Cash receipts from customers 59,411$ 31,811$ 77,515$ 168,737$ Cash from interfund 1,618,474 8,015,168 4,066,005 13,699,647 Payments to suppliers (984,909) (8,102,474) (3,193,294) (12,280,677) Payments to employees (829,165) (705,653) (136,942) (1,671,760)
Net cash provided (used) by operating activities (136,189) (761,148) 813,284 (84,053)
CASH FLOWS FROM INVESTING ACTIVITIESInterest on investments (1,096) 7,772 59,783 66,459
Net increase (decrease) in cash and cash equivalents (137,285) (753,376) 873,067 (17,594)
Balances - beginning of year 137,285 1,653,111 12,554,595 14,344,991 Balances - end of the year -$ 899,735$ 13,427,662$ 14,327,397$
Reconciliation of operating income (loss) to net cash provided (used) by operating activities:
Operating Income (loss) (185,477)$ (795,167)$ 371,993$ (608,651)$
Adjustments to reconcile operating income (loss) to net cash provided (used) by operating activities:
Depreciation expense 1,447 - - 1,447 Other revenues 43,209 31,811 77,515 152,535
Changes in assets and liabilities:Accounts receivable, net 16,202 - - 16,202 Due from other funds - - (27,692) (27,692) Inventory (5,101) - - (5,101) Other assets - (1,903) - (1,903) Accrued compensated absences (2,627) - - (2,627) Accounts payable and other liabilities (31,534) 4,111 30,012 2,589 Due to other funds 27,692 - - 27,692 Self-insurance liability - - 361,456 361,456
Net cash provided (used) by operating activities (136,189)$ (761,148)$ 813,284$ (84,053)$
City of LodiCombining Statement of Cash Flows
Internal Service FundsFor the Year Ended June 30, 2017

FIDUCIARY FUNDS
Private-Purpose Trust Funds
These funds are used to account for trust agreements under which the principal and income benefit individuals, private
organizations or other governments.
Agency Fund This fund was established to account for special assessments collected on the property tax roll by the City on behalf of the property owners within the Industrial Way Beckman Districts and the Downtown and Cherokee Lane Districts.

115
LibraryHutchins Street Square
Bequest Total ASSETSCash and investments 234,575$ 1,543$ 236,118$ Interest receivable - 2 2
Total assets 234,575 1,545 236,120
NET POSITION - EXPENDABLE 234,575$ 1,545$ 236,120$
City of LodiCombining Statement of Fiduciary Net Position
Private-Purpose Trust Funds June 30, 2017

116
LibraryHutchins Street Square
Bequest Total ADDITIONS
Investment and rental income 10,293$ 8$ 10,301$
DEDUCTIONSCurrent: Library 9,410 - 9,410
Changes in net position 883 8 891
Net position -- beginning 233,692 1,537 235,229 Net position -- end 234,575$ 1,545$ 236,120$
City of LodiCombining Statement of Changes in Fiduciary Net Position
Private-Purpose Trust FundsFor the Year Ended June 30, 2017

117
Balance Balance July 1, 2016 Additions Deductions June 30, 2017
ASSETSCash and investments 422,207$ 36,575$ 52,053$ 406,729$ Interest receivable 440 590 440 590
Total assets 422,647$ 37,165$ 52,493$ 407,319$
LIABILITIESAgency obligations 422,647$ -$ 15,328$ 407,319$
City of Lodi Statement of Changes in Assets and Liabilities
Agency FundFor the Year Ended June 30, 2017
Special Assessments

(This page intentionally left blank.)

STATISTICAL SECTION UNAUDITED

119
STATISTICAL SECTION
The Statistical Section provides detailed information as a framework for understanding the information in the financial statements, notes and required supplementary information. This section presents additional data and analysis that may provide the reader with valuable insight regarding the demographics and the overall health of the City. Contents Pages Financial Trends These schedules contain trend information to help the reader understand how the City’s financial performance and well-being has changed over time. 120-125 Revenue Capacity These schedules contain information to help the reader assess the factors affecting the City’s most significant local revenue source, the property tax. 126-131 Debt Capacity These schedules present information to help the reader assess the affordability of the City’s current levels of outstanding debt and the City’s ability to issue additional debt in the future. 132-138 Demographic and Economic Information These schedules offer demographic and economic indicators to help the reader understand the environment within which the City’s financial activities take place and to help make comparisons over time and with other governments. 139-141 Operating Information These schedules contain information about the City’s operations and resources to help the reader understand how the City’s financial information relates to the services the city provides and the activities it performs. 142-146 Sources Unless otherwise noted, the information in these schedules are derived from the comprehensive annual financial report.

120
2017 2016 2015 (1) 2014 2013 2012 2011 2010 2009 2008
Governmental activities:
Net investment in capital assets 117,196$ 111,256$ 105,944$ 105,462$ 106,828$ 107,587$ 114,165$ 113,308$ 115,036$ 107,874$
Restricted 15,545 13,911 12,001 11,809 12,601 16,176 14,894 13,233 13,492 15,043
Unrestricted (77,162) (76,984) (74,146) 2,551 1,157 (3,606) (5,148) (6,110) (3,462) (4,162)
Total governmental activities net position 55,579$ 48,183$ 43,799$ 119,822$ 120,586$ 120,157$ 123,911$ 120,431$ 125,066$ 118,755$
Business-type activities:
Net investment in capital assets 129,086$ 121,468$ 119,924$ 116,156$ 113,008$ 109,582$ 104,858$ 100,233$ 95,533$ 98,109$
Restricted 3,929 3,893 6,810 6,703 6,600 6,533 5,303 8,657
Unrestricted 16,463 14,427 892 16,535 14,827 (34,563) (34,129) (28,591) (35,448) 26,460
Total business-type activities net position 149,478$ 139,788$ 127,626$ 139,394$ 134,435$ 81,552$ 76,032$ 71,642$ 60,085$ 133,226$
Primary government:
Net investment in capital assets 246,282$ 232,724$ 225,868$ 221,618$ 219,836$ 217,169$ 219,023$ 213,541$ 210,569$ 205,983$
Restricted 19,474 17,804 18,811 18,512 19,201 22,709 20,197 13,233 13,492 23,700
Unrestricted (60,699) (62,557) (73,254) 19,086 15,984 (38,169) (39,277) (34,701) (38,910) 22,298
Total primary government net position 205,057$ 187,971$ 171,425$ 259,216$ 255,021$ 201,709$ 199,943$ 192,073$ 185,151$ 251,981$
Source: City of Lodi Financial Services Division
(1) Fiscal year 2015 beginning net position was restated due to the implementation of GASB 68.
CITY OF LODI
NET POSITION BY COMPONENT LAST TEN FISCAL YEARS
(Dollar amounts in thousands)
Fiscal Year

121
2017 2016 2015 2014 2013 2012 2011 2010 2009 2008
9,650$ 10,369$ 9,109$ 9,580$ 8,943$ 9,381$ 8,262$ 8,749$ 9,451$ 8,307$ 33,239 31,395 27,426 27,884 25,930 25,432 25,113 27,186 27,110 25,531 10,614 10,326 10,281 10,644 10,546 10,248 9,305 10,462 10,464 12,224
1,709 1,792 1,165 1,174 1,050 1,003 973 1,114 1,323 2,027 1,253 1,389 1,324 1,282 1,342 1,381 1,355 1,440 1,495 1,696 3,663 4,262 3,116 3,164 2,933 2,913 5,778 5,077 4,609 4,414
824 822 818 825 416 1,033 1,075 1,105 1,134 1,166 60,952 60,355 53,239 54,553 51,160 51,391 51,861 55,133 55,586 55,365
Business-type activities: 62,791 61,764 64,367 61,974 61,106 62,599 63,399 64,364 73,358 65,201 16,318 14,024 12,912 12,527 13,423 17,441 11,687 11,289 10,940 12,227 11,961 10,967 9,905 11,014 (34,877) 7,953 8,188 6,148 9,604 9,920
4,925 4,415 4,134 3,834 4,141 4,256 4,132 4,785 4,832 3,908 Total business-type activities expenses 95,995 91,170 91,318 89,349 43,793 92,249 87,406 86,586 98,734 91,256 Total primary government expenses 156,947$ 151,525$ 144,557$ 143,902$ 94,953$ 143,640$ 139,267$ 141,719$ 154,320$ 146,621$
Governmental activities:Charges for services:
General government 3,246$ 1,490$ 1,971$ 1,955$ 2,337$ 1,718$ 1,793$ 2,184$ 1,631$ 1,544$ Public protection 779 740 609 582 538 500 643 714 844 837 Public works 1,209 734 832 415 224 166 356 326 358 755 Community development 2,838 2,292 1,378 1,219 1,458 993 1,601 786 749 1,085 Library 43 63 43 43 44 43 47 48 44 53 Parks and recreation 1,660 1,637 1,360 1,479 1,404 1,241 1,245 1,269 1,158 851
Operating grants and contributions 2,391 2,596 3,369 2,686 2,341 2,300 2,236 1,927 1,951 2,305 Capital grants and contributions 12,830 10,559 3,131 5,359 4,216 5,025 6,737 5,122 10,822 4,717
Total governmental activities program revenues 24,996 20,111 12,693 13,738 12,562 11,986 14,658 12,376 17,557 12,147
Business-type activities: Charges for services:
Electric 65,848 67,507 65,237 64,693 63,230 64,251 62,167 69,664 74,000 69,284 Wastewater 15,106 14,960 14,714 14,305 13,747 13,280 13,090 11,513 9,276 9,091 Water 12,474 12,161 12,723 12,756 12,441 12,083 11,940 11,716 11,787 11,350 Transit 220 210 230 203 185 186 195 217 251 278
Operating grants and contributions 4,514 5,089 5,186 4,431 5,178 4,214 3,983 3,449 3,653 3,381 Capital grants and contributions 7,972 2,860 5,284 2,846 4,715 3,206 5,150 1,408 5,774 8,064
106,134 102,787 103,374 99,234 99,496 97,220 96,525 97,967 104,741 101,448 Total primary government program revenues 131,130$ 122,898$ 116,067$ 112,972$ 112,058$ 109,206$ 111,183$ 110,343$ 122,298$ 113,595$
Net (Expense)/Revenue Governmental activities (35,956)$ (40,244)$ (40,546)$ (40,815)$ (38,598)$ (39,405)$ (37,203)$ (42,757)$ (38,029)$ (43,218)$ Business-type activities 10,139 11,617 12,056 9,885 55,703 4,971 9,119 11,381 6,007 10,192 Total primary government net expense (25,817)$ (28,627)$ (28,490)$ (30,930)$ 17,105$ (34,434)$ (28,084)$ (31,376)$ (32,022)$ (33,026)$
CITY OF LODI
CHANGES IN NET POSITIONLAST TEN FISCAL YEARS
(Dollar amounts in thousands)
General government
Fiscal Year
ExpensesGovernmental activities:
Parks and recreation
Public works
Library
Total governmental activities expenses
Community development
Public protection
Wastewater
Interest and fiscal charges
Program Revenues
Electric
WaterTransit
(Continued)
Total business-type activities program revenues

122
2017 2016 2015 2014 2013 2012 2011 2010 2009 2008General Revenues and Other Changes in Net Position:Governmental activities:
Taxes:Property 14,860$ 13,919$ 13,502$ 12,758$ 12,218$ 12,103$ 12,698$ 12,836$ 13,564$ 13,838$ Franchise taxes 9,099 9,073 8,976 8,838 8,735 8,712 8,692 8,658 8,357 9,338 Business license tax 1,736 1,552 1,486 1,528 1,524 1,628 1,246 1,242 1,190 1,140 Transient occupancy tax 849 783 666 594 546 486 426 382 405 396
11,778 11,834 10,651 10,138 9,382 9,277 8,954 7,064 8,249 9,593 257 326 145 203 44 132 133 155 467 1,008
1,954 1,942 1,906 1,370 722 719 605 528 610 2,052 1,556 1,917 2,382 1,077
321 4,051 4,469 7,514 4,792 5,682 1,261 6,657 5,868 5,368 3,693
43,352 44,629 45,487 41,285 40,111 35,651 40,683 38,122 39,982 40,083
Business-type activities:Investment earnings 816 952 632 757 497 566 575 731 1,385 2,028
100 1,107 300 2,010 8,892 Rent 4 4 4
2,786 3,957 2,745 2,370 1,258 1,244 1,353 923 1,891 2,717 (8,979)
Transfers (4,051) (4,469) (7,514) (4,792) (5,682) (1,261) (6,657) (5,868) (5,368) (3,693) Total business-type activities (449) 544 (4,133) (1,661) (2,820) 549 (4,729) (3,914) (9,061) 9,944
42,903$ 45,173$ 41,354$ 39,624$ 37,291$ 36,200$ 35,954$ 34,208$ 30,921$ 50,027$
Change in Net PositionGovernmental activities 7,396$ 4,385$ 4,941$ 470$ 1,513$ (3,754)$ 3,480$ (4,635)$ 1,953$ (3,135)$ Business-type activities 9,690 12,161 7,923 8,224 52,883 5,520 4,390 7,467 (3,054) 20,136 Total primary government 17,086$ 16,546$ 12,864$ 8,694$ 54,396$ 1,766$ 7,870$ 2,832$ (1,101)$ 17,001$
Source: City of Lodi Financial Services Division
Special item-gain on sale of parkland
LAST TEN FISCAL YEARS
Rent
CITY OF LODI
Grants and contributions not restricted to specific programs
(Dollar amounts in thousands)
Other
Total governmental activities
Litigation- environmental lawsuits proceeds
Other
Fiscal Year
Transfers
Total primary government
Special item-swap termination
Investment earnings
CHANGES IN NET POSITION (Continued)

123
2017 2016 2015 2014 2013 2012 2011 2010 2009 2008General Fund
Reserved $ $ $ $ $ $ $ 389$ 383$ 1,150$ Unreserved 3,896 3,383 4,159Nonspendable 33 10 9 6 357Committed 3,520 465 345 301 277Assigned 1,564 26 29 65 50 136Unassigned 11,448 11,185 12,107 9,134 7,614 6,233 5,654
Total General Fund 14,968$ 13,247$ 12,478$ 9,474$ 7,965$ 6,289$ 6,147$ 4,285$ 3,766$ 5,309$
All other governmental fundsReserved $ $ $ $ $ $ $ 7,801$ 1,487$ 1,932$ Unreserved, reported in:
Special revenue funds 963 6,540 7,433 Capital projects funds 3,649 5,217 5,504
Nonspendable 1 1 1 4 3 1Restricted 15,263 13,867 11,957 11,764 12,556 15,017 13,786Unassigned (99) (512) (863) (846)
Total all other governmental funds 15,264$ 13,868$ 11,958$ 11,669$ 12,047$ 14,155$ 12,940$ 12,413$ 13,244$ 14,869$
30,232$ 27,115$ 24,436$ 21,143$ 20,012$ 20,444$ 19,087$ 16,698$ 17,010$ 20,178$
Implemented GASB 54 during the 2011 fiscal year changing the presentation of fund balance.
Source: City of Lodi Financial Services Division
CITY OF LODI
FUND BALANCES, GOVERNMENTAL FUNDSLAST TEN FISCAL YEARS
(Dollar amounts in thousands)
Fiscal Year

124
2017 2016 2015 2014 2013 2012 2011 2010 2009 2008Revenues:
Taxes 26,491$ 25,327$ 24,631$ 23,719$ 23,022$ 22,928$ 23,061$ 23,118$ 23,516$ 24,712$ Licenses and permits 2,015 1,646 967 852 921 686 954 520 431 683 Intergovernmental revenues 23,975 21,083 17,557 17,392 14,625 15,289 16,865 12,579 13,229 14,980 Charges for services 5,722 5,830 3,827 3,558 3,880 3,427 3,946 4,116 3,329 4,757 Fines, forfeits, and penalties 906 1,495 1,573 1,557 1,632 1,357 1,407 1,444 1,416 1,321 Investment and rental income 2,319 2,155 2,029 2,025 1,389 1,264 817 923 922 1,312 Contributions and donations 818 282 1,003 689 Miscellaneous revenue 1,116 538 1,078 813 799 1,093 1,762 822
Total revenues 62,246 58,652 51,404 50,106 46,547 45,764 48,538 43,793 44,605 48,587
Expenditures:Current:
General government 9,499 9,360 9,151 9,019 8,522 8,820 7,667 7,666 8,431 9,545 Public protection 30,201 28,821 26,646 27,093 26,282 25,249 24,489 24,466 24,716 23,979 Public works 4,608 4,070 4,508 4,393 4,532 4,174 3,715 4,383 4,657 5,842 Community development 1,651 1,601 1,226 1,192 1,111 1,037 969 1,013 1,341 2,006 Library 1,153 1,153 1,311 1,268 1,411 1,381 1,357 1,322 1,500 1,673 Parks and recreation 2,378 2,369 2,145 2,299 2,370 2,254 4,127 4,180 3,776 3,826
Capital outlay 11,592 13,117 9,842 7,652 6,271 2,961 9,377 5,108 6,791 4,207 Debt service:
Interest 858 847 845 851 483 1,039 1,081 1,110 1,139 1,170 Principal payments 1,240 260 245 630 752 725 789 898 Advance refunding escrow 1,689
Total expenditures 63,180 61,598 55,674 53,767 52,916 47,545 53,534 49,973 53,140 53,146 Excess (deficiency) of revenues
over (under) expenditures (934) (2,946) (4,270) (3,661) (6,369) (1,781) (4,996) (6,180) (8,535) (4,559)
(Continued)
(Dollar amounts in thousands)
CITY OF LODI
CHANGES IN FUND BALANCES OF GOVERNMENTAL FUNDSLAST TEN FISCAL YEARS
Fiscal Year

125
2017 2016 2015 2014 2013 2012 2011 2010 2009 2008Other financing sources (uses):
Transfers in 11,723 13,310 15,599 11,596 12,546 14,486 11,881 11,173 10,609 7,058 Transfers out (7,672) (8,716) (8,036) (6,804) (6,864) (11,348) (5,224) (5,305) (5,242) (3,365) Proceeds from sale of land 98 Refunding bonds issued 20,103 Payment to refunded bond escrow agent (19,848) Capital lease proceeds 563 Loan proceeds 468
Total other financing sources (uses) 4,051 5,625 7,563 4,792 5,937 3,138 6,755 5,868 5,367 3,693
Special item- sale of parkland 630
Net change in fund balances 3,117 2,679 3,293 1,131 (432) 1,357 2,389 (312) (3,168) (866) Fund balances, beginning of year 27,115 24,436 21,143 20,012 20,444 19,087 16,698 17,010 20,178 21,044 Fund balances, end of year 30,232$ 27,115$ 24,436$ 21,143$ 20,012$ 20,444$ 19,087$ 16,698$ 17,010$ 20,178$
4.1% 2.3% 1.8% 1.8% 5.2% 3.7% 4.2% 4.1% 4.2% 4.2%
Source: City of Lodi Finance Services Division
Fiscal Year
CITY OF LODI
Debt service as a percentage of noncapital expenditures
CHANGES IN FUND BALANCES OF GOVERNMENTAL FUNDS (continued)LAST TEN FISCAL YEARS
(Dollar amounts in thousands)

Source: City of Lodi Financial Services Division126
2017 2016 2015 2014 2013 2012 2011 2010 2009 2008% Change
2008 to 2017
Property 9,744$ 9,151$ 8,810$ 8,314$ 7,955$ 7,861$ 8,285$ 8,342$ 8,887$ 9,210$ 6%Sales and Use 11,750 11,809 10,625 10,111 9,350 9,246 8,663 6,873 8,028 9,296 26%Transient Occupancy 849 783 666 594 545 486 426 382 405 396 114%Franchise 1,915 1,990 1,942 1,862 1,758 1,734 1,715 1,681 1,415 976 96%Documentary Transfer 240 223 159 155 120 91 95 117 114 125 92%Motor Vehicle in Lieu 4,904 4,572 4,533 4,289 4,143 4,151 4,317 4,377 4,784 4,797 2%Public Protection 378 365 362 341 325 295 250 267 296 338 12%Business License 1,736 1,552 1,133 1,220 1,187 1,182 958 962 1,038 1,140 52%In Lieu Franchise 7,131 7,082 7,033 6,977 6,977 6,977 6,977 6,977 6,942 8,362 -15%
Totals 38,647$ 37,527$ 35,263$ 33,863$ 32,360$ 32,023$ 31,686$ 29,978$ 31,909$ 34,640$ 12%
Note: General governmental tax revenues are included in taxes, licenses and permits, intergovernmental revenues and miscellaneous revenues.
City of Lodi
TAX REVENUES BY SOURCE, GOVERNMENTAL FUNDSLAST TEN FISCAL YEARS
(Dollar amounts in thousands)
Fiscal Year
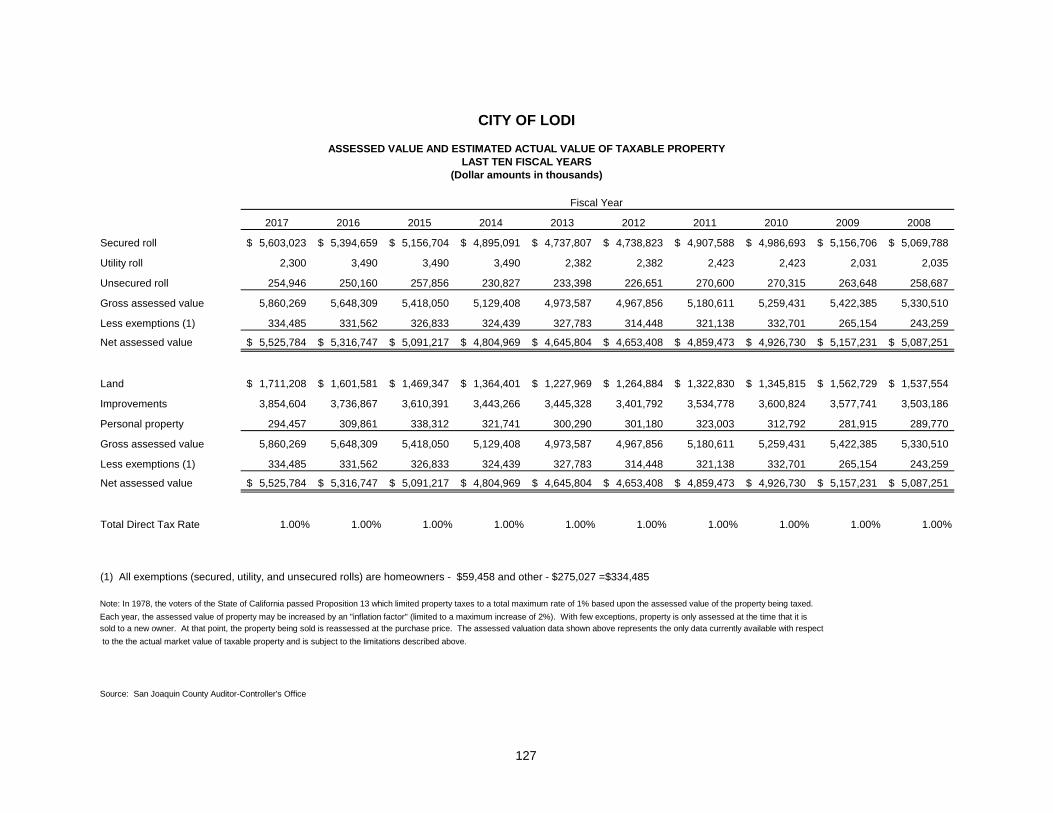
127
2017 2016 2015 2014 2013 2012 2011 2010 2009 2008
Secured roll 5,603,023$ 5,394,659$ 5,156,704$ 4,895,091$ 4,737,807$ 4,738,823$ 4,907,588$ 4,986,693$ 5,156,706$ 5,069,788$
Utility roll 2,300 3,490 3,490 3,490 2,382 2,382 2,423 2,423 2,031 2,035
Unsecured roll 254,946 250,160 257,856 230,827 233,398 226,651 270,600 270,315 263,648 258,687
Gross assessed value 5,860,269 5,648,309 5,418,050 5,129,408 4,973,587 4,967,856 5,180,611 5,259,431 5,422,385 5,330,510
Less exemptions (1) 334,485 331,562 326,833 324,439 327,783 314,448 321,138 332,701 265,154 243,259
Net assessed value 5,525,784$ 5,316,747$ 5,091,217$ 4,804,969$ 4,645,804$ 4,653,408$ 4,859,473$ 4,926,730$ 5,157,231$ 5,087,251$
Land 1,711,208$ 1,601,581$ 1,469,347$ 1,364,401$ 1,227,969$ 1,264,884$ 1,322,830$ 1,345,815$ 1,562,729$ 1,537,554$
Improvements 3,854,604 3,736,867 3,610,391 3,443,266 3,445,328 3,401,792 3,534,778 3,600,824 3,577,741 3,503,186
Personal property 294,457 309,861 338,312 321,741 300,290 301,180 323,003 312,792 281,915 289,770
Gross assessed value 5,860,269 5,648,309 5,418,050 5,129,408 4,973,587 4,967,856 5,180,611 5,259,431 5,422,385 5,330,510
Less exemptions (1) 334,485 331,562 326,833 324,439 327,783 314,448 321,138 332,701 265,154 243,259
Net assessed value 5,525,784$ 5,316,747$ 5,091,217$ 4,804,969$ 4,645,804$ 4,653,408$ 4,859,473$ 4,926,730$ 5,157,231$ 5,087,251$
Total Direct Tax Rate 1.00% 1.00% 1.00% 1.00% 1.00% 1.00% 1.00% 1.00% 1.00% 1.00%
(1) All exemptions (secured, utility, and unsecured rolls) are homeowners - $59,458 and other - $275,027 =$334,485
Note: In 1978, the voters of the State of California passed Proposition 13 which limited property taxes to a total maximum rate of 1% based upon the assessed value of the property being taxed.Each year, the assessed value of property may be increased by an "inflation factor" (limited to a maximum increase of 2%). With few exceptions, property is only assessed at the time that it issold to a new owner. At that point, the property being sold is reassessed at the purchase price. The assessed valuation data shown above represents the only data currently available with respect to the the actual market value of taxable property and is subject to the limitations described above.
Source: San Joaquin County Auditor-Controller's Office
CITY OF LODI
ASSESSED VALUE AND ESTIMATED ACTUAL VALUE OF TAXABLE PROPERTYLAST TEN FISCAL YEARS
(Dollar amounts in thousands)
Fiscal Year

128
Fiscal Year
Basic Countywide
Levy School All Other Total
2017 1.0000 0.0551 0.0000 1.0551
2016 1.0000 0.0599 0.0000 1.0599
2015 1.0000 0.0658 0.0000 1.0658
2014 1.0000 0.0574 0.0000 1.0574
2013 1.0000 0.0646 0.0000 1.0646
2012 1.0000 0.0658 0.0000 1.0658
2011 1.0000 0.0626 0.0000 1.0626
2010 1.0000 0.0575 0.0000 1.0575
2009 1.0000 0.0517 0.0000 1.0517
2008 1.0000 0.0478 0.0000 1.0478
Source: San Joaquin County Tax Collector
CITY OF LODI
DIRECT AND OVERLAPPING PROPERTY TAX RATESLAST TEN FISCAL YEARS
(Rate per $100 of assessed value)
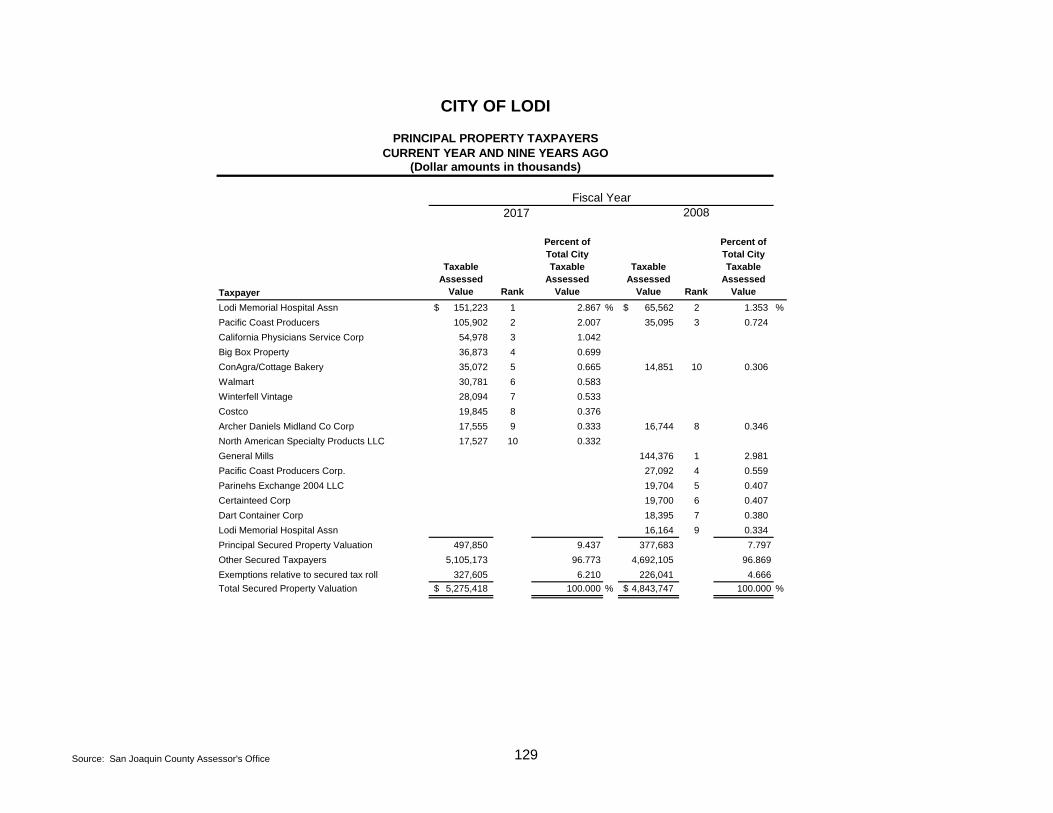
Source: San Joaquin County Assessor's Office 129
2017 2008
Taxpayer
Taxable Assessed
Value Rank
Percent of Total City Taxable
Assessed Value
Taxable Assessed
Value Rank
Percent of Total City Taxable
Assessed Value
Lodi Memorial Hospital Assn 151,223$ 1 2.867 % 65,562$ 2 1.353 %Pacific Coast Producers 105,902 2 2.007 35,095 3 0.724 California Physicians Service Corp 54,978 3 1.042Big Box Property 36,873 4 0.699ConAgra/Cottage Bakery 35,072 5 0.665 14,851 10 0.306 Walmart 30,781 6 0.583Winterfell Vintage 28,094 7 0.533Costco 19,845 8 0.376Archer Daniels Midland Co Corp 17,555 9 0.333 16,744 8 0.346 North American Specialty Products LLC 17,527 10 0.332General Mills 144,376 1 2.981 Pacific Coast Producers Corp. 27,092 4 0.559 Parinehs Exchange 2004 LLC 19,704 5 0.407 Certainteed Corp 19,700 6 0.407 Dart Container Corp 18,395 7 0.380 Lodi Memorial Hospital Assn 16,164 9 0.334 Principal Secured Property Valuation 497,850 9.437 377,683 7.797Other Secured Taxpayers 5,105,173 96.773 4,692,105 96.869Exemptions relative to secured tax roll 327,605 6.210 226,041 4.666Total Secured Property Valuation 5,275,418$ 100.000 % 4,843,747$ 100.000 %
Fiscal Year
CITY OF LODI
PRINCIPAL PROPERTY TAXPAYERSCURRENT YEAR AND NINE YEARS AGO
(Dollar amounts in thousands)

130
Amount
Percent of
Levy (1) Amount
Percent of
Levy
2017 9,821$ 9,821$ 100.0% 9,821$ 100.0%
2016 9,117 9,117 100.0% 9,117 100.0%
2015 8,742 8,742 100.0% 8,742 100.0%
2014 8,353 8,353 100.0% 8,353 100.0%
2013 7,865 7,865 100.0% 7,865 100.0%
2012 7,754 7,754 100.0% 7,754 100.0%
2011 8,143 8,143 100.0% 8,143 100.0%
2010 8,291 8,291 100.0% 8,291 100.0%
2009 7,966 7,966 100.0% 7,966 100.0%
2008 8,167 8,167 100.0% 8,167 100.0%
1) Per agreement with San Joaquin County, the County provides the City of Lodi with 100% of the amount owed to the City for secured properties, regardless of collection status. In exchange, the County is entitled to 100% of revenues collected for interest and penalties. This agreement is commonly referred to as the Teeter Plan.
CITY OF LODI
PROPERTY TAX LEVIES AND COLLECTIONSLAST TEN FISCAL YEARS
(Dollar amounts in thousands)
Source: San Joaquin County Auditor/Controller’s Office
Total Collectionsto Date
Collected Within the Fiscal Year of the Levy
Taxes Levied for the Fiscal
YearFiscal Year

131
Type of Customer2017 2016 2015 2014 2013 2012 2011 2010 2009 2008
City Accounts 217 213 212 207 204 195 197 189 189 187Contract Large Industrial 5Contract Medium Industrial 1Contract Small Industrial 1Domestic Residential 21,917 22,497 22,393 22,623 22,541 22,361 22,360 22,525 22,506 22,510Domestic Mobile Home Park 13 13 13 13 13 13 13 13 13 13Dusk to Dawn 85 85 88 89 88 92 89 89 92 92Large Commercial 355 348 337 339 344 336 350 357 377 380Large Industrial 35 44 41 39 40 38 40 39 37 32Medium Industrial 10 11 12 11 11 9 9 9 8 8Residental Low Income 2,669 2,688 2,798 2,788 2,582 2,531 2,258 2,193 1,847 1,943Small Commerical 3,434 3,416 3,332 3,367 3,358 3,340 3,324 3,280 3,249 3,199Small Industrial 10 11 7 8 9 11 11 10 10 9Total 28,745 29,326 29,233 29,484 29,190 28,926 28,651 28,704 28,328 28,380
Source: City of Lodi Financial Services Division
CITY OF LODIELECTRICITY SOLD BY TYPE OF CUSTOMER
LAST TEN FISCAL YEARS
Billed Accounts

132
FiscalYear
Lease Revenue Bonds
LoanPayable
NotesPayable
CapitalLease
TotalGovernmental
Activities
Certificates of Participation and Revenue Bonds
Notes/ Loan
Payable
TotalBusiness-type
Activities
TotalPrimary
GovernmentPer
Capita (1)
2017 18,753$ 378$ 487$ 19,618$ 138,193$ 1,300$ 139,493$ 159,111$ 6.41 % 2,484$
2016 19,637 468 245 562 20,912 143,417 1,500 144,917 165,829 7.49 2,603
2015 19,950 245 20,195 149,767 149,767 169,962 7.67 2,667
2014 20,004 245 20,249 157,297 157,297 177,546 8.45 2,789
2013 20,058 245 20,303 167,743 167,743 188,046 9.63 2,988
2012 21,025 245 21,270 173,241 173,241 194,511 10.07 3,096
2011 21,655 245 21,900 178,827 178,827 200,727 10.67 3,213
2010 22,265 245 22,510 144,165 1,409 145,574 168,084 8.49 2,645
2009 22,855 245 23,100 148,529 1,585 150,114 173,214 8.81 2,736
2008 23,420 94 245 23,759 140,640 1,755 142,395 166,154 8.99 2,622
Percent of Personal Income (1)
Governmental Activities Business-type Activities
Details regarding the City's outstanding debt can be found in Note 8 of these financial statements.
(1) See Demographic and Economic Statistics table for personal income and population.
Source: City of Lodi Financial Services Division
(Dollar amounts in thousands, except per capita)
CITY OF LODI
RATIOS OF OUTSTANDING DEBT BY TYPELAST TEN FISCAL YEARS

133
Fiscal Year
Lease Revenue Bonds
Less Amounts Available for Debt Service Net
Percent ofAssessed
Value (1) ofProperty
PerCapita
2017 18,753$ 18,753$ 0.3 % 292.74$ 2016 19,637 19,637 0.4 310.62 2015 19,950 19,950 0.4 313.09 2014 20,004 20,004 0.4 314.28 2013 20,058 10$ 20,048 0.4 318.58 2012 21,025 1,692 19,333 0.4 307.73 2011 21,655 1,692 19,963 0.4 319.55 2010 22,265 1,692 20,573 0.4 323.73 2009 22,855 1,692 21,163 0.4 334.26 2008 23,420 1,692 21,728 0.4 342.92
Source: City of Lodi Financial Services Division
(1) Assessed value has been used because the actual value of taxable property is not readily available in the State ofCalifornia.
General bonded debt is debt payable with governmental fund resources and general obligation bonds recorded in enterprise funds (of which, the City has none).
CITY OF LODI
RATIOS OF GENERAL BONDED DEBT OUTSTANDINGLAST TEN FISCAL YEARS
(Dollar amounts in thousands, except per capita)

134
2017 2016 2015 2014 2013 2012 2011 2010 2009 2008
Assessed valuation (1) 5,585,242$ 5,377,266$ 5,152,666$ 4,867,731$ 4,709,916$ 4,718,766$ 4,926,130$ 4,995,362$ 5,227,580$ 5,159,269$
Conversion percentage 25% 25% 25% 25% 25% 25% 25% 25% 25% 25%
Adjusted assessed valuation 1,396,311 1,344,317 1,288,167 1,216,933 1,177,479 1,179,692 1,231,533 1,248,841 1,306,895 1,289,817
Debt limit percentage 15% 15% 15% 15% 15% 15% 15% 15% 15% 15%
Debt Limit 209,447 201,647 193,225 182,540 176,622 176,954 184,730 187,326 196,034 193,473
Total net debt applicable to limit 18,753 19,637 19,950 20,004 20,048 19,333 19,963 20,573 21,163 21,728
Legal debt margin 190,694$ 182,010$ 173,275$ 162,536$ 156,574$ 157,621$ 164,767$ 166,753$ 174,871$ 171,745$
Total net debt applicable to the limit as a percent of debt limit 9.0% 9.7% 10.3% 11.0% 11.4% 10.9% 10.8% 11.0% 10.8% 11.2%
Source: San Joaquin County Auditor-Controller's Office
The Government Code of the State of California provides for a legal debt limit of 15% of gross assessed valuation. However, this provision was enacted when assessed valuation was based upon 25% of market value. Effective with the 1982 fiscal year, each parcel isnow assessed at 100% of market value (as of the most recent change in ownership for that parcel). The computation shown above reflect a conversion of assessed valuation data for each fiscal year from the current full valuation perspective to the 25% level that was ineffect at the time the legal debt margin was enacted by the State of California for local governments located within the state.
(1) Reflects City assessed valuation with other exemptions of $275,027 deducted for 2017.
CITY OF LODI
LEGAL DEBT MARGIN INFORMATIONLAST TEN FISCAL YEARS
(Dollar amounts in thousands)
FISCAL YEAR

135
Percentage City's ShareTotal Debt Applicable (1) of Debt
OVERLAPPING DEBT:San Joaquin Community College District $ 126,614,970 7.695 % $ 9,743,022Lodi Unified School District 161,955,000 35.945 58,214,725San Joaquin County Certificates of Participation 124,925,000 8.402 10,496,199Lodi Unified School District Certificates of Participation 24,735,000 35.945 8,890,996 SUBTOTAL OVERLAPPING DEBT 87,344,941DIRECT DEBT:City of Lodi Lease Revenue Bonds 18,752,590 100.00 18,752,590City of Lodi - Loan payable 378,011 100.00 378,011City of Lodi -Capital lease 486,959 100.00 486,959 SUBTOTAL DIRECT DEBT 19,617,560 TOTAL DIRECT AND OVERLAPPING DEBT(2) 106,962,501$
2016-17 Gross Assessed Valuation 5,860,269,000$
2016-17 Population 64,058 Per Capita Value
DEBT RATIOS Total Gross Debt $ 106,962,501 $ 1,670 1.83%
(1) Percent of overlapping agency's assessed valuation located within the boundaries of the City.(2) Excludes tax and revenue anticipation notes, enterprise revenue, mortgage revenue and tax allocation bonds and non-bonded capital lease obligations.
SOURCE: California Municipal Statistics, San Francisco, CA San Joaquin County Auditors-Controller Office State of California, Department of Finance, Demographic Research Unit
CITY OF LODIDIRECT AND OVERLAPPING GOVERNMENTAL ACTIVITIES DEBT
June 30, 2017

Source: City of Lodi Financial Services Division136
Less:Adjusted Adjusted Net
Fiscal Annual Operating Available Debt ServiceYear Revenues (1) Expenses (2) Revenue Principal Interest Total Coverage
Electric Revenue Certificates of Participation
2017 67,815$ 52,259$ 15,556$ 2,390$ 2,898$ 5,288$ 2.94
2016 70,440 51,205 19,235 5,195 3,094 8,289 2.32
2015 67,132 52,116 15,016 4,960 3,358 8,318 1.81
2014 67,144 50,349 16,795 4,750 3,606 8,356 2.01
2013 63,974 51,209 12,765 4,575 3,839 8,414 1.52
2012 65,220 50,164 15,056 3,270 4,021 7,291 2.07
2011 63,307 48,397 14,910 3,080 4,152 7,232 2.06
2010 70,288 49,949 20,339 2,920 4,274 7,194 2.83
2009 75,195 58,370 16,825 5,240 4,720 9,960 1.69
2008 74,923 54,437 20,486 2,305 3,961 6,266 3.27
(continued)
CITY OF LODI
PLEDGED-REVENUE COVERAGE LAST TEN FISCAL YEARS
(Dollars amounts in thousands)

Source: City of Lodi Financial Services Division137
Less:Adjusted Adjusted Net
Fiscal Annual Operating Available Debt ServiceYear Revenues (1) Expenses (2) Revenue Principal Interest Total Coverage
Wastewater Certificates of Participation and Revenue Bonds
2017 16,707$ 10,128$ 6,579$ 1,575$ 1,492$ 3,067$ 2.15
2016 16,941 7,237 9,704 1,535 2,131 3,666 2.65
2015 15,845 6,335 9,510 1,500 2,172 3,672 2.59
2014 15,186 6,003 9,183 4,610 2,294 6,904 1.33
2013 14,305 5,674 8,631 1,500 2,560 4,060 2.13
2012 13,787 6,659 7,128 1,430 2,688 4,118 1.73
2011 16,508 5,972 10,536 1,370 2,748 4,118 2.56
2010 12,284 6,180 6,104 1,320 2,832 4,152 1.47
2009 10,764 5,921 4,843 1,270 2,882 4,152 1.17
2008 10,530 6,189 4,341 1,355 2,334 3,689 1.18
(continued)
CITY OF LODI
PLEDGED-REVENUE COVERAGE (continued)LAST TEN FISCAL YEARS
(Dollars amounts in thousands)

Source: City of Lodi Financial Services Division138
Less:Adjusted Adjusted Net
Fiscal Annual Operating Available Debt ServiceYear Revenues (1) Expenses (2) Revenue Principal Interest (3) Total Coverage
Water Revenue Bonds2017 13,844$ 7,733$ 6,111$ 915$ 1,393$ 2,308$ 2.65
2016 13,025 6,801 6,224 870 1,482 2,352 2.65
2015 13,370 5,815 7,555 850 1,506 2,356 3.21
2014 14,166 6,835 7,331 825 1,530 2,355 3.11
2013 13,367 6,899 6,468 800 1,535 2,335 2.77
2012 13,275 5,392 7,883 775 1,530 2,305 3.42
2011 14,051 5,662 8,389 1,409 874 2,283 3.67
Includes all nongeneral obligation long-term debt backed by pledged revenues.Details regarding the City's outstanding debt can be found in Note 8 to the basic financial statements.(1) Total operating revenues including investment earnings, operating grants, capital contributions
and other revenue.(2) Total operating expenses including cost of services paid to the General Fund and excluding in-lieu fees,
depreciation and amortization.(3) Net of Build America Bonds interest subsidy.
PLEDGED-REVENUE COVERAGE (continued)LAST TEN FISCAL YEARS
(Dollars amounts in thousands)
CITY OF LODI

139
Personal PerPopulation San Joaquin Population Rank in Size Income Capita
Fiscal Square City Percent County Percent of California (millions of Personal UnemploymentYear Miles Population Change Population of County Cities dollars) Income Rate2017 13.98 64,058 0.7% 746,868 8.6% 139 $ 2,483 38,769$ 6.9%2016 13.98 63,219 0.7% 733,383 8.6% 139 2,284 36,136 7.8%2015 13.98 63,719 0.4% 719,511 8.9% 138 2,215 34,755 7.8%2014 13.98 63,651 0.2% 710,731 9.0% 135 2,102 33,024 8.8%2013 13.98 62,930 0.2% 698,414 9.0% 137 1,952 31,013 9.0%2012 13.98 62,825 0.8% 695,750 9.0% 136 1,931 30,732 11.3%2011 13.92 62,473 0.6% 690,899 9.0% 135 1,882 30,132 13.4%2010 13.92 63,549 0.6% 694,293 9.2% 136 1,980 31,166 13.3%2009 13.92 63,313 -0.1% 689,480 9.2% 135 1,967 31,071 12.2%2008 13.92 63,362 -0.1% 685,600 9.2% 133 1,849 29,178 7.1%
Personal income is the income received by all persons from all sources. Personal income is the sum of net earnings by place of residence, rental income of persons, personal dividend income, personal interest income, and personal current transfer receipts.
Per capita personal income is calculated as the personal income of residents of a given area divided by the resident population of the area. In computing per capita personal income, Bureau of Economic analysis uses the Census Bureau's annual midyear population estimates.
Source: State of California, Department of Finance, Demographic Reseach Unit and Department of Labor.
LAST TEN FISCAL YEARSDEMOGRAPHIC AND ECONOMIC STATISTICS
CITY OF LODI
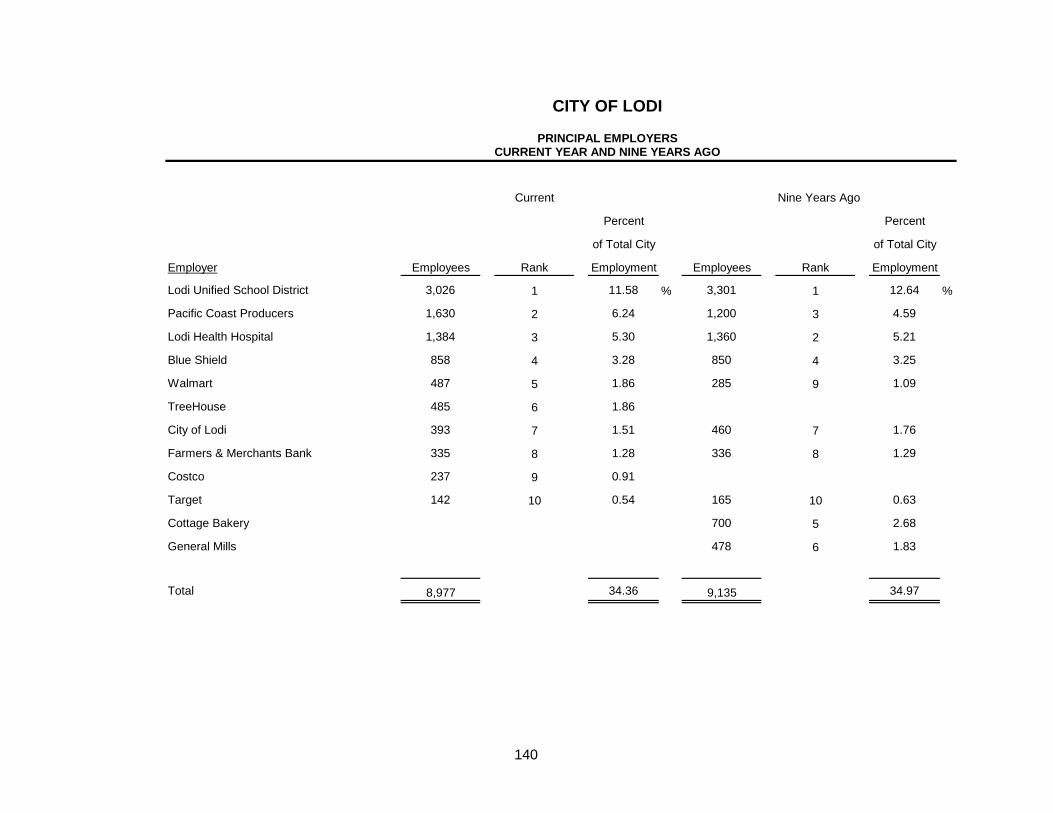
140
Current Nine Years Ago
Percent Percent
of Total City of Total City
Employer Employees Rank Employment Employees Rank Employment
Lodi Unified School District 3,026 1 11.58 % 3,301 1 12.64 %
Pacific Coast Producers 1,630 2 6.24 1,200 3 4.59
Lodi Health Hospital 1,384 3 5.30 1,360 2 5.21
Blue Shield 858 4 3.28 850 4 3.25
Walmart 487 5 1.86 285 9 1.09
TreeHouse 485 6 1.86
City of Lodi 393 7 1.51 460 7 1.76
Farmers & Merchants Bank 335 8 1.28 336 8 1.29
Costco 237 9 0.91
Target 142 10 0.54 165 10 0.63
Cottage Bakery 700 5 2.68
General Mills 478 6 1.83
Total 8,977 34.36 9,135 34.97
CITY OF LODI
PRINCIPAL EMPLOYERSCURRENT YEAR AND NINE YEARS AGO

141
2017 2016 2015 2014 2013 2012 2011* 2010 2009 2008
Department:Administration 10 10 10 10 10 12 13 31 32 19Community Development 11 11 11 9 9 9 13 13 13 14Electric 51 49 44 43 40 40 41 51 50 48Financial Services 24 26 39Fire 54 54 57 53 53 54 64 64 64 64Internal Services 32 31 31 31 31 29 35Library 7 10 11 10 11 12 14 14 14 14Parks and Recreation 31 31 30Parks, Recreation and Cultural Services 24 26 28 27 27 29 37Police 103 102 107 104 104 103 125 125 125 125Public Works 101 100 97 95 92 93 98 102 102 107
Total 393 393 396 382 377 381 440 455 457 460
* Community Center, Human Resources and Information Systems were previously included in Administration. Budget, Financial Services, Human Resourcesand Information Services are now Internal Services. Community Center, Parks & Recreation are now Parks, Recreation and Cultural Services.
Source: City of Lodi Budget Document
CITY OF LODIFULL-TIME EQUIVALENT CITY GOVERNMENT EMPLOYEES
BY DEPARTMENT - LAST TEN FISCAL YEARS
Fiscal Year

142
2017 2016 2015 2014 2013 2012 2011 2010 2009 2008General government:
Building permits issued 2,447 2,482 2,404 2,404 1,578 1,461 2,022 1,709 1,754 1,851 Business tax certificates:
Retail sales and service 2,443 2,288 2,281 2,281 2,526 2,485 2,530 2,406 2,496 2,442 Manufacturers and processors 76 78 23 23 78 77 76 80 82 78 Professions 308 316 323 323 362 364 371 373 380 398 Miscellaneous contractors, peddlers, delivery vehicles, etc. 949 1,268 1,256 1,256 1,456 1,362 1,357 1,312 1,411 1,063
Utility billing/customer service:Number of customers 26,018 26,034 25,912 25,912 23,927 23,761 23,575 25,573 25,555 25,555 Energy sales (KWH) 425,410,574 437,246,335 438,780,911 438,780,911 435,822,465 435,655,731 421,130,329 434,200,987 452,075,554 450,407,709 Peak demand (MW) 129 124 134 134 122 116 116 120 134 134
Public safety:Police:
Major reported crimes 2,025 3,068 2,268 2,268 2,643 3,573 2,885 2,377 2,454 2,993 Total arrests 4,226 4,083 3,690 3,690 3,825 4,350 4,410 4,238 4,646 5,590 Dispatched calls for service 37,866 40,390 35,992 35,992 50,124 46,756 52,061 51,870 56,391 55,911
Fire:Interior structure fire calls 51 33 32 32 67 57 56 47 69 88 Non-structural fire calls 177 154 143 143 209 163 121 123 123 160 Hazardous materials calls 90 73 65 65 58 41 69 70 70 35 Emergency medical calls 3,572 3,123 3,418 3,418 3,882 3,820 3,752 3,494 3,364 3,420 Total emergency calls 5,869 5,238 3,666 3,666 5,823 5,620 5,753 5,385 5,392 5,346 Total number of units dispatched 7,225 7,430 5,727 5,727 7,954 7,855 7,835 7,390 7,038 7,841
Public works:Miles of streets resurfaced 6 6 6 6 6 6 6 3 6 5 Fleet job orders completed 2,129 2,162 2,500 2,500 1,803 1,953 2,810 3,303 3,921 3,520 Trees planted 135 135 135 135 131 131 96 130
Water utility:New connections 205 69 8 8 8 7 8 17 17 35 Water main breaks 2 3 16 16 14 10 8 6 4 4
Wastewater utility:Average daily treatment (million gal/day) 4.65MG 4.6MG 4.6MG 4.6MG 5.10MG 5.5MG 6.5MG 6.5MG 6.5MG 6.5MG
Library:Registered borrowers 64,742 60,362 58,824 58,824 51,594 47,147 43,927 39,199 53,530 48,969 Circulation of library materials 187,853 199,096 197,673 197,673 215,293 217,742 248,250 251,967 219,711 280,466 Reference, research and informational questions answered 9,695 11,109 13,189 13,189 16,270 14,463 16,234 16,501 15,379 19,257 Annual attendance at libraries 231,602 245,936 224,762 222,148 210,279 207,123 n/a 296,793 Number of programs offered 764 456 432 432 407 432 388 344 316 348 Annual attendance at programs 23,960 15,452 12,888 12,888 14,443 12,993 13,133 10,676 8,765 11,242 Public access computer usage 31,205 34,071 34,071 41,180 45,871 47,428 58,990 52,124 38,388 38,999
Fiscal Year
(Continued)
CITY OF LODI
OPERATING INDICATORS BY FUNCTION/PROGRAM/DEPARTMENTLAST TEN FISCAL YEARS

143
2017 2016 2015 2014 2013 2012 2011 2010 2009 2008Community center:
Community center bookings 597 758 794 769 718 698 926 789 475 494 Instructional classes 554 518 500 553 580 307 536 583 507 530 Registered students 3,010 2,744 2,586 3,269 2,819 3,713 3,438 3,525 3,316 5,550 Yearly attendance 13,925 13,925 13,925 13,925 13,925 13,925 14,217 13,355 14,050 14,410
Parks and recreation:After school program registration (number of participants/sites) 1,617/17 19,800/17 315,140/19 254,096/20 1,715/20 3,232/20 1,920/4 1,920/4 1,920/4 3,014/4Adult sports
Program/Participation 14,887 14,673 15,285 2,082 2,246 2,420 2,528 2,528 2,284 28,000 Programs offered 14 15 18 17 16 15 16 16 13 11 Partnerships 2 2 2 2 2 3 5 5 1 3 Tournaments 6 8 10 5 6 12 7 7 10 10
Program attendance 3,496 3,652 3,621 3,672 3,643 3,889 4,251 4,251 215,000 195,000 Programs offered 18 18 18 18 19 24 16 16 24 14
AquaticsProgram attendance 28,974 28,195 28,009 27,731 23,414 34,366 32,566 32,566 2,433 50,000 Number of programs 14 14 15 13 13 25 13 13 6 3
Source: City of Lodi
Youth/Teen sports
CITY OF LODI
OPERATING INDICATORS BY FUNCTION/PROGRAM/DEPARTMENT - (continued)LAST TEN FISCAL YEARS
Fiscal Year

144
2017 2016 2015 2014 2013 2012 2011 2010 2009 2008General government:
Total square miles 13.98 13.98 13.98 13.98 13.98 13.98 13.92 13.92 13.92 13.92Public safety:
Police:Facilities:
Stations 1 1 1 1 1 1 1 1 1 1Animal control facility 1 1 1 1 1 1 1 1 1 1Police training facility (pistol range) 1 1 1 1 1 1 1 1 1 1
Vehicles:Marked patrol cars 23 23 23 23 23 23 23 23 25 25Motorcycles and scooters 7 7 7 5 5 5 5 5 5 5Animal control vehicles 2 2 2 2 2 2 2 2 2 2Other automobiles 37 37 37 37 37 37 37 37 38 40
Fire:Facilities:
Fire stations 4 4 4 4 4 4 4 4 4 4Vehicles:
Fire engines 7 6 6 6 6 6 7 7 7 6Trucks/Trailers 8 6 6 6 6 5 5 6 6 9Other automobiles 5 11 11 11 11 9 8 10 12 7
Public works:Miles of streets 202 202 202 202 202 202 202 202 202 200Miles of alley ways 16 16 16 16 16 16 16 16 16 16Traffic signals 68 67 67 67 67 67 67 62 62 64Street lights 7,270 7,270 7,270 7,270 7,270 7,270 7,270 7,270 7,270 7,270
(Continued)
Fiscal Year
CITY OF LODI
CAPITAL ASSET STATISTICS BY FUNCTION/PROGRAM/DEPARTMENTLAST TEN FISCAL YEARS

145
2017 2016 2015 2014 2013 2012 2011 2010 2009 2008Parks and recreation:
Parks and squares 26 26 26 26 26 26 26 26 26 23Park acreage 361 361 361 361 361 373 373 373 371 275Boating facilities - launch lanes 1 1 1 1 1 1 1 1 1 1Senior center 1 1 1 1 1 1 1 1 1 1Community Centers 1 1 1 1 1 1 1 1 1 1Swimming pools 4 4 4 4 4 4 4 4 4 3Baseball/softball diamonds 20 20 20 20 20 24 24 24 24 26Tennis courts 11 11 11 11 11 11 11 11 11 11Skateboard park 1 1 1 1 1 1 1 1 1 1Playgrounds 20 20 20 20 20 22 25 25 25 22Ballpark 24 24 24 24 24 24 24 24 24 26Soccer Field 22 22 22 22 22 22 22 22 22 22Football Field 1 1 1 1 1 1 1 1 1 3Handball/Basketball/Volleyball Courts/Bocce Courts 12 12 12 12 12 10 10 10 10 8Horseshoe Pits 8 8 8 8 8 8 6 6 6 7
Library:Central library 1 1 1 1 1 1 1 1 1 1Total items in collection 125,730 130,657 119,554 148,287 149,243 135,113 134,804 130,530 135,197 142,885Integrated library system 1 1 1 1 1 1 1 1 1 1Microfilm readers 0 0 1 1 1 1 1 1 1 1Microfilm readers/printers 1 1 1 1 1 1 1 1 1 1Self check out machines 3 3 2 2 2 2 2 2 2 0
Electric utility:Overhead lines 12kv (miles) 117 117 117 117 133 133 133 130 130 130Overhead lines 60kv (miles) 14 14 14 14 14 14 13 13 13 13Underground lines (miles) 123 121 118 115 159 159 157 155 154 153
Fiscal Year
CITY OF LODI
CAPITAL ASSET STATISTICS BY FUNCTION/PROGRAM/DEPARTMENT - (continued)LAST TEN FISCAL YEARS
(Continued)

146
2017 2016 2015 2014 2013 2012 2011 2010 2009 2008Water utility:
Water main lines 243 240 236 236 236 236 236 237 233 233Water storage capacity (gallons) 4,100,000 4,100,000 4,100,000 4,100,000 4,100,000 1,100,000 1,100,000 1,100,000 1,100,000 1,100,000Water wells 28 28 28 28 28 27 27 26 26 26Water reservoirs 3 3 3 3 3 2 2 2 2 2Water Treatment Plant 1 1
Wastewater utility:Wastewater main lines (miles) 196 196 196 196 196 196 196 191 194 194Treatment capacity 8.5MG 8.5 MG 8.5 MG 8.5 MG 8.5 MG 8.5 MG 8.5 MG 8.5 MG 8.5 MG 8.5 MGWastewater treatment plant 1 1 1 1 1 1 1 1 1 1Wastewater Pump Stations 9 9
Stormwater utility:Stormwater main drain lines (miles) 128 126 124 124 124 124 124 124 161 119Stormwater pump stations 16 16 14 14 14 14 14 14 14 14
Central parking district:Parking structure 1 1 1 1 1 1 1 1 1 1Parking spaces 2,450 2,450 2,450 2,450 2,453 2,453 2,453 2,453 2,453 2,453Parking lots 25 25 25 25 25 25 25 25 25 25
Source: City of Lodi Departments
LAST TEN FISCAL YEARS
CITY OF LODI
CAPITAL ASSET STATISTICS BY FUNCTION/PROGRAM/DEPARTMENT - (continued)
Fiscal Year

SINGLE AUDIT REPORTS

www.mgocpa.com Macias Gini & O’Connell LLP 3000 S Street, Suite 300 Sacramento, CA 95816
147
Independent Auditor’s Report on Internal Control Over Financial Reporting and on Compliance and Other Matters
Based on an Audit of Financial Statements Performed in Accordance With Government Auditing Standards
The Honorable Members of City Council
City of Lodi, California
We have audited, in accordance with the auditing standards generally accepted in the United States of America and the standards applicable to financial audits
contained in Government Auditing Standards issued by the Comptroller General of the United States, the financial statements of the governmental activities, the
business-type activities, each major fund, and the aggregate remaining fund information of the City of Lodi, California (City), as of and for the year ended June
30, 2017, and the related notes to the financial statements, which collectively comprise the City’s basic financial statements, and have issued our report thereon
dated December 12, 2017.
Internal Control over Financial Reporting
In planning and performing our audit of the financial statements, we considered the City’s internal control over financial reporting (internal control) to determine
the audit procedures that are appropriate in the circumstances for the purpose of expressing our opinions on the financial statements, but not for the purpose of
expressing an opinion on the effectiveness of the City’s internal control. Accordingly, we do not express an opinion on the effectiveness of the City’s internal
control.
A deficiency in internal control exists when the design or operation of a control does not allow management or employees, in the normal course of performing
their assigned functions, to prevent, or detect and correct, misstatements on a timely basis. A material weakness is a deficiency, or a combination of deficiencies,
in internal control, such that there is a reasonable possibility that a material misstatement of the entity’s financial statements will not be prevented, or detected
and corrected on a timely basis. A significant deficiency is a deficiency, or a combination of deficiencies, in internal control that is less severe than a material
weakness, yet important enough to merit attention by those charged with governance.
Our consideration of internal control over financial reporting was for the limited purpose described in the first paragraph of this section and was not designed to
identify all deficiencies in internal control over financial reporting that might be material weaknesses or significant deficiencies. Given these limitations, during
our audit we did not identify any deficiencies in internal control that we consider to be material weaknesses. However, material weaknesses may exist that have
not been identified.
Compliance and Other Matters
As part of obtaining reasonable assurance about whether the City’s financial statements are free from material misstatement, we performed tests of its compliance
with certain provisions of laws, regulations, contracts, and grant agreements, noncompliance with which could have a direct and material effect on the
determination of financial statement amounts. However, providing an opinion on compliance with those provisions was not an objective of our audit, and
accordingly, we do not express such an opinion. The results of our tests disclosed no instances of noncompliance or other matters that are required to be reported
under Government Auditing Standards.

148
Purpose of the Report
The purpose of this report is solely to describe the scope of our testing of internal control and compliance and the results of that testing, and not to provide an
opinion on the effectiveness of the entity’s internal control or on compliance. This report is an integral part of an audit performed in accordance with
Government Auditing Standards in considering the entity’s internal control and compliance. Accordingly, this communication is not suitable for any other
purpose.
Sacramento, California
December 12, 2017

www.mgocpa.com Macias Gini & O’Connell LLP 3000 S Street, Suite 300 Sacramento, CA 95816
149
Independent Auditor’s Report on Compliance for the Major Federal Program and Report on
Internal Control Over Compliance Required by the Uniform Guidance
The Honorable Members of City Council
City of Lodi, California
Report on Compliance for the Major Federal Program
We have audited the City of Lodi’s (City) compliance with the types of compliance requirements described in the OMB Compliance Supplement that could have
a direct and material effect on the City’s major federal program for the year ended June 30, 2017. The City’s major federal program is identified in the summary
of auditor’s results section of the accompanying schedule of findings and questioned costs.
Management’s Responsibility
Management is responsible for compliance with federal statutes, regulations, and the terms and conditions of its federal awards applicable to its federal programs.
Auditor’s Responsibility
Our responsibility is to express an opinion on compliance for the City’s major federal program based on our audit of the types of compliance requirements
referred to above. We conducted our audit of compliance in accordance with auditing standards generally accepted in the United States of America; the standards
applicable to financial audits contained in Government Auditing Standards, issued by the Comptroller General of the United States; and the audit requirements of
Title 2 U.S. Code of Federal Regulations Part 200, Uniform Administrative Requirements, Cost Principles, and Audit Requirements for Federal Awards
(Uniform Guidance). Those standards and the Uniform Guidance require that we plan and perform the audit to obtain reasonable assurance about whether
noncompliance with the types of compliance requirements referred to above that could have a direct and material effect on a major federal program occurred. An
audit includes examining, on a test basis, evidence about the City’s compliance with those requirements and performing such other procedures as we considered
necessary in the circumstances.
We believe that our audit provides a reasonable basis for our opinion on compliance for the major federal program. However, our audit does not provide a legal
determination of the City’s compliance.
Opinion on Major Federal Program
In our opinion, the City complied, in all material respects, with the types of compliance requirements referred to above that could have a direct and material
effect on its major federal program for the year ended June 30, 2017.
150
Report on Internal Control Over Compliance
Management of the City is responsible for establishing and maintaining effective internal control over compliance with the types of compliance requirements
referred to above. In planning and performing our audit of compliance, we considered the City’s internal control over compliance with the types of requirements
that could have a direct and material effect on the major federal program to determine the auditing procedures that are appropriate in the circumstances for the
purpose of expressing an opinion on compliance for the major federal program and to test and report on internal control over compliance in accordance with the
Uniform Guidance, but not for the purpose of expressing an opinion on the effectiveness of internal control over compliance. Accordingly, we do not express an
opinion on the effectiveness of the City’s internal control over compliance.
A deficiency in internal control over compliance exists when the design or operation of a control over compliance does not allow management or employees, in
the normal course of performing their assigned functions, to prevent, or detect and correct, noncompliance with a type of compliance requirement of a federal
program on a timely basis. A material weakness in internal control over compliance is a deficiency, or combination of deficiencies, in internal control over
compliance, such that there is a reasonable possibility that material noncompliance with a type of compliance requirement of a federal program will not be
prevented, or detected and corrected, on a timely basis. A significant deficiency in internal control over compliance is a deficiency, or a combination of
deficiencies, in internal control over compliance with a type of compliance requirement of a federal program that is less severe than a material weakness in
internal control over compliance, yet important enough to merit attention by those charged with governance.
Our consideration of internal control over compliance was for the limited purpose described in the first paragraph of this section and was not designed to identify
all deficiencies in internal control over compliance that might be material weaknesses or significant deficiencies. We did not identify any deficiencies in internal
control over compliance that we consider to be material weaknesses. However, material weaknesses may exist that have not been identified.
The purpose of this report on internal control over compliance is solely to describe the scope of our testing of internal control over compliance and the results of
that testing based on the requirements of the Uniform Guidance. Accordingly, this report is not suitable for any other purpose.
Sacramento, California
December 12, 2017

Federal Grantor Federal Passed
Pass-through Grantor or Direct CFDA Grant/Project Through to Federal
Program or Cluster Title Number Number Subrecipients Expenditures
U.S. Department of Housing and Urban Development
Direct:
Community Development Block Grants/Entitlement Grants 14.218 B-13-MC-06-0038 -$ 48,275$
Community Development Block Grants/Entitlement Grants 14.218 B-14-MC-06-0038 - 346,485
Community Development Block Grants/Entitlement Grants 14.218 B-15-MC-06-0038 - 316,035
Community Development Block Grants/Entitlement Grants 14.218 B-16-MC-06-0038 76,158 161,935
Total Community Development Block Grants/Entitlement Grants 76,158 872,730
U.S. Department of Transportation
Direct:
Federal Transit - Formula Grants 20.507 CA-2017-102 - 1,320,000
Passed through California Department of Transportation:
Highway Planning and Construction 20.205 STPL-5154(040) - 367,664
Passed through California Office of Traffic Safety:
Minimum Penalties for Repeat Offenders for Driving While Intoxicated 20.608 PT1644 - 26,892
Minimum Penalties for Repeat Offenders for Driving While Intoxicated 20.608 PT1762 - 50,145
Passed through City of Stockton:
Minimum Penalties for Repeat Offenders for Driving While Intoxicated 20.608 AL1642 - 1,757
Total Minimum Penalties for Repeat Offenders for Driving While Intoxicated - 78,794
Total U.S. Department of Transportation - 1,766,458
U.S. Environmental Protection Agency
Direct:
Brownfields Assessment and Cleanup Cooperative Agreements 66.818 99T30201 - 32,604
Total Expenditures of Federal Awards 76,158$ 2,671,792$
CITY OF LODI
SCHEDULE OF EXPENDITURES OF FEDERAL AWARDS
FOR THE YEAR ENDED JUNE 30, 2017
See accompanying notes to the schedule of expenditures of federal awards.
151
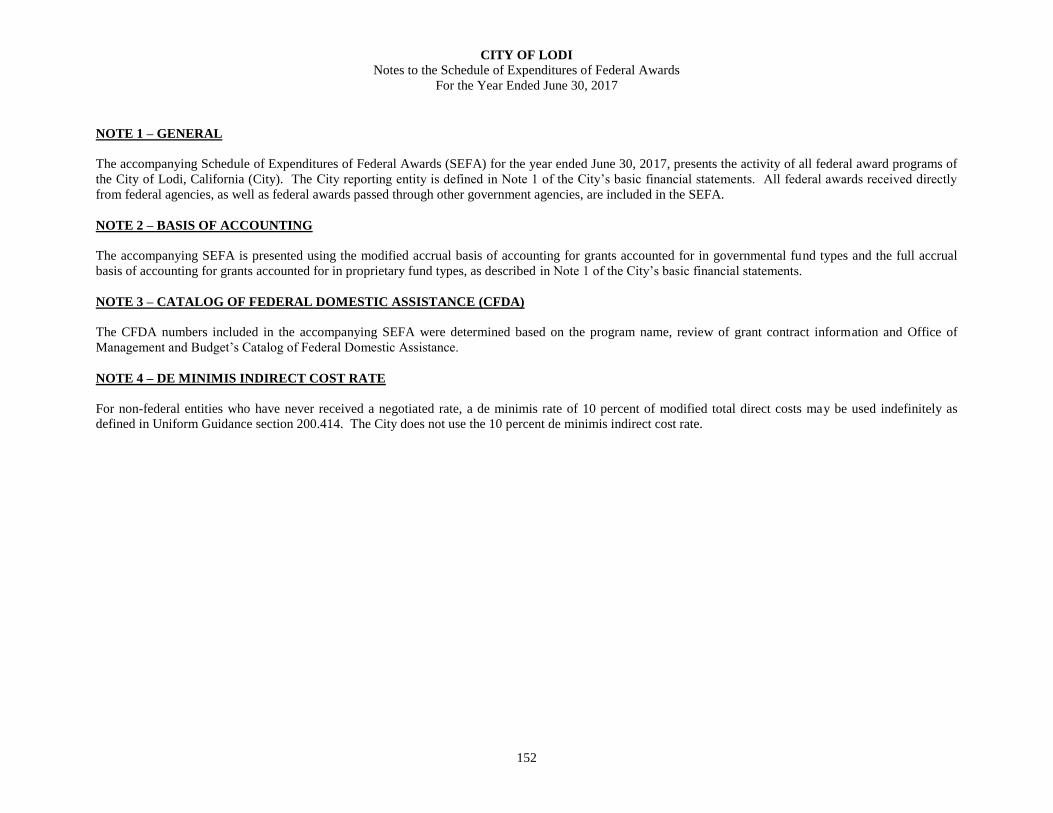
CITY OF LODI
Notes to the Schedule of Expenditures of Federal Awards
For the Year Ended June 30, 2017
152
NOTE 1 – GENERAL
The accompanying Schedule of Expenditures of Federal Awards (SEFA) for the year ended June 30, 2017, presents the activity of all federal award programs of
the City of Lodi, California (City). The City reporting entity is defined in Note 1 of the City’s basic financial statements. All federal awards received directly
from federal agencies, as well as federal awards passed through other government agencies, are included in the SEFA.
NOTE 2 – BASIS OF ACCOUNTING
The accompanying SEFA is presented using the modified accrual basis of accounting for grants accounted for in governmental fund types and the full accrual
basis of accounting for grants accounted for in proprietary fund types, as described in Note 1 of the City’s basic financial statements.
NOTE 3 – CATALOG OF FEDERAL DOMESTIC ASSISTANCE (CFDA)
The CFDA numbers included in the accompanying SEFA were determined based on the program name, review of grant contract information and Office of
Management and Budget’s Catalog of Federal Domestic Assistance.
NOTE 4 – DE MINIMIS INDIRECT COST RATE
For non-federal entities who have never received a negotiated rate, a de minimis rate of 10 percent of modified total direct costs may be used indefinitely as
defined in Uniform Guidance section 200.414. The City does not use the 10 percent de minimis indirect cost rate.

CITY OF LODI
Schedule of Findings and Questioned Costs
For the Year Ended June 30, 2017
153
Section I – Summary of Auditor’s Results
Financial Statements:
Type of report the auditor issued on whether the financial statements
audited were prepared in accordance with GAAP: Unmodified
Internal control over financial reporting:
Material weakness(es) identified? No
Significant deficiency(ies) identified? None reported
Noncompliance material to financial statements noted? No
Federal Awards:
Internal control over major federal programs:
Material weakness(es) identified? No
Significant deficiency(ies) identified? None reported
Type of auditor’s report issued on compliance for major federal programs: Unmodified
Any audit findings disclosed that are required to be reported in
accordance with 2 CFR 200.516(a)? No
Identification of major federal program:
Name of Federal Program or Cluster CFDA Number
Community Development Block Grants/Entitlement Grants 14.218
Dollar threshold used to distinguish between type A and type B programs: $750,000
Auditee qualified as low-risk auditee? Yes

CITY OF LODI
Schedule of Findings and Questioned Costs (Continued)
For the Year Ended June 30, 2017
154
Section II – Financial Statement Findings
None
Section III – Federal Award Findings and Questioned Costs
None

CITY OF LODI
Summary Schedule of Prior Audit Findings
For the Year Ended June 30, 2017
155
There were no audit findings reported for the year ended June 30, 2016.

(This page intentionally left blank.)

CONTINUING DISCLOSURES
UNAUDITED
CONTINUING DISCLOSURE REQUIREMENTS FOR THE CITY OF LODI, THE LODI PUBLIC IMPROVEMENT CORPORATION
AND THE LODI PUBLIC FINANCING AUTHORITY
Fiscal Year 2016-17 The City of Lodi has executed Continuing Disclosure Certificates associated with the various debt issues outstanding by the Electric Utility, Wastewater Utility, Water Utility, the Lodi Public Improvement Corporation and the Lodi Public Financing Authority. These Certificates were executed to satisfy provisions of Securities and Exchange Commission Rule 15c2-12(b) (5). The material provided herein applies to the various debt issues as noted. Data for each utility is shown separately. This Bond Disclosure Section included within the City’s Comprehensive Annual Financial Report (CAFR) provides the information required by the Continuing Disclosure Certificates. The CAFR, in turn, will be filed with the Municipal Securities Rulemaking Board. The CAFR may also be found on the City’s website at www.lodi.gov.

157
ANNUAL REPORT FOR ELECTRIC UTILITY The Lodi Electric Utility has Continuing Disclosure requirements associated with its 2008 Series A Certificates of Participation. The annual report includes, by reference, the audited financial statement of the City of Lodi (including the Electric Utility). The annual report also contains the following five (5) tables as required in the Certificates:
1. A table setting forth the City’s power supply resources for the most recently completed fiscal year. 2. A table showing the average number of customers, sales, revenues and demand for the past five fiscal years. 3. A table showing the outstanding debt of joint powers agencies in which Lodi participates and the City of Lodi share of that debt for the most
recent fiscal year. 4. A table showing a summary of Operating Results for the past five fiscal years. 5. A table showing Lodi Electric Utility Department Rate Changes since November 1996 (applicable only to the 2002 Series C and D issues).
Reporting of Significant Events The Certificates identify eleven (11) specific events that require special reporting. As of June 30, 2017, none of the specified events have occurred. Further, there is no knowledge on the part of the City Council, officers or employees of the City of any impending Significant Event that would require disclosure under the provisions of the Certificates.

158
Table 1 A table setting forth the City’s power supply resources.
CITY OF LODI ELECTRIC UTILITY DEPARTMENT
POWER SUPPLY RESOURCES
Source
Capacity Available (MW)(1)(4)
Actual Energy (MWh)
% of Total Energy
Purchased Power(2): Western 7.2 34,137 7.7% NCPA Geothermal Project 11.5 83,576 19.0 Hydroelectric Project 26.2 95,710 21.7 Combustion Turbine Project No. 1 9.5 1,721 0.4 Capital Facilities, Unit One 19.6 1,836 0.4 Lodi Energy Center 26.6 28,554 6.5 Contracts and Exchanges(3) 37.3 195,483 44.3 Total 137.8 441,017(4) 100.00% Total Capacity and Energy Sold at Wholesale N/A 3,355 City System Requirement for Retail Load(5) 128.7 437,662
(1) Source: NCPA Annual Resource Adequacy Filings. (2) Entitlements, firm allocations and contracts. (3) Includes participation in Astoria 2 Solar Project, Seattle City Light Exchange, and NCPA contracts. (4) Includes supply from exchanges and line losses. (5) NCPA All Resources Bill.
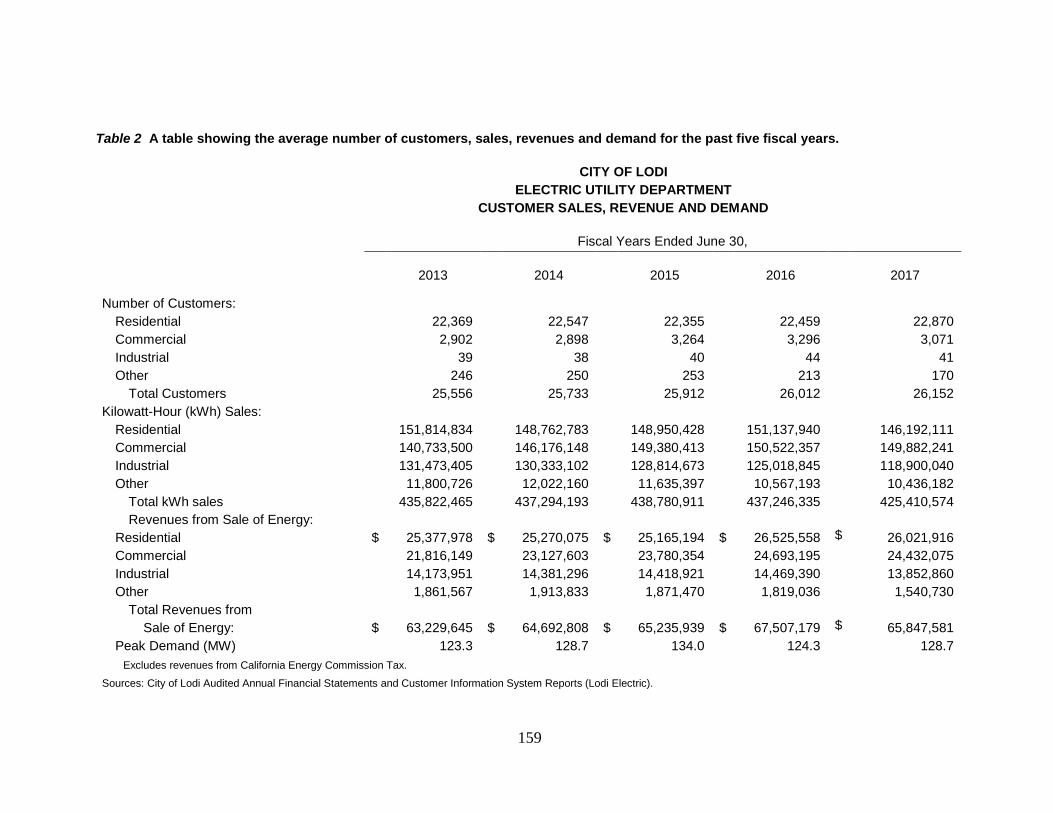
159
Table 2 A table showing the average number of customers, sales, revenues and demand for the past five fiscal years.
CITY OF LODI ELECTRIC UTILITY DEPARTMENT CUSTOMER SALES, REVENUE AND DEMAND
Fiscal Years Ended June 30,
2013 2014 2015 2016
2017
Number of Customers:
Residential 22,369 22,547 22,355 22,459 22,870 Commercial 2,902 2,898 3,264 3,296 3,071 Industrial 39 38 40 44 41 Other 246 250 253 213 170
Total Customers 25,556 25,733 25,912 26,012 26,152 Kilowatt-Hour (kWh) Sales:
Residential 151,814,834 148,762,783 148,950,428 151,137,940 146,192,111 Commercial 140,733,500 146,176,148 149,380,413 150,522,357 149,882,241 Industrial 131,473,405 130,333,102 128,814,673 125,018,845 118,900,040 Other 11,800,726 12,022,160 11,635,397 10,567,193 10,436,182
Total kWh sales 435,822,465 437,294,193 438,780,911 437,246,335 425,410,574 Revenues from Sale of Energy:
Residential $ 25,377,978 $ 25,270,075 $ 25,165,194 $ 26,525,558 $ 26,021,916 Commercial 21,816,149 23,127,603 23,780,354 24,693,195 24,432,075 Industrial 14,173,951 14,381,296 14,418,921 14,469,390 13,852,860 Other 1,861,567 1,913,833 1,871,470 1,819,036 1,540,730
Total Revenues from Sale of Energy: $ 63,229,645 $ 64,692,808 $ 65,235,939 $ 67,507,179 $ 65,847,581
Peak Demand (MW) 123.3 128.7 134.0 124.3 128.7 Excludes revenues from California Energy Commission Tax.
Sources: City of Lodi Audited Annual Financial Statements and Customer Information System Reports (Lodi Electric).

160
Table 3 A table showing the outstanding debt of joint powers agencies in which Lodi participates.
CITY OF LODI ELECTRIC UTILITY DEPARTMENT
OUTSTANDING DEBT OF JOINT POWERS AGENCIES (Dollar Amounts in Millions)
Outstanding Debt(1)
Lodi’s Participation(2)
Lodi’s Share of Outstanding
Debt NCPA Geothermal Project Three $ 32.8 10.28% $ 3.4 Hydroelectric Project 343.8 10.60(3) 36.4 Capital Facilities Project Unit One 37.4 39.50 14.8 Lodi Energy Center Project 230.4 17.03 39.2
TOTAL* $ 644.4 14.56% $ 93.8 * Columns may not add to totals due to independent rounding.
(1) Source: NCPA. Outstanding debt does not include unamortized premium/discount. (2) Participation obligation is subject to increase upon default of another project participant. Such increase shall not exceed, without the written Consent of a non-defaulting participant, an accumulated maximum of 25% of such non-defaulting participant’s original participation. (3) Participation obligation combined percentage of Generation Entitlement Share adjusted for other NCPA member opt-out and subsequent defeasance.

161
Table 4 A table showing a summary of operating results for the past five fiscal years. CITY OF LODI
ELECTRIC SYSTEM SUMMARY OF OPERATING RESULTS (1)
Ending Fiscal Year June 30 (Dollars in 000s) Actual 2013 Actual 2014 Actual 2015 Actual 2016 Actual 2017 Operating Revenues Rate Revenue $ 61,888 $ 61,837 $ 63,370 $ 65,265 $ 64,114 ECA Revenue 1,341 2,856 1,867 2,242 1,734 Other Revenue 745 2,451 1,895 2,933 1,967 Total Operating Revenue 63,974 67,144 67,132 70,440 67,815 Operating Expenses Purchased Power 39,191 37,303 38,512 37,788 35,650 Non-Power Costs (2) 12,018 13,046 13,604 13,417 16,609 Total Operating Expenses 51,209 50,349 52,116 51,205 52,259 Net Revenue Available for Debt Service 12,765 16,795 15,016 19,235 15,556 Parity Debt Service 2002 C & D, 2008 A Bonds 8,414 8,356 8,318 8,289 5,288 Total Net Debt Service 8,414 8,356 8,318 8,289 5,288 Debt Service Coverage 1.52 2.01 1.81 2.32 2.94 Remaining Revenue Available for Other Purposes 4,351 8,439 6,698 10,946 10,268 Non-Operating Revenue/Expenses Greenhouse gas allowance 2,018 453 2,323 1,571 2,370 In-Lieu Transfer to General Fund (6,977) (6,977) (7,033) (7,082) (7,131) Net Cash Flow Before Capital Expenditures (608) 1,915 1,988 5,435 5,507 Beginning General Operating Reserve 30,384 31,082 33,850 36,583 42,891 Changes in General Operating Reserve 1,306 942 745 873 1,253 Net Deposit/Withdrawal from Reserve (608) 1,915 1,988 5,435 5,507 Ending General Operating Reserve $ 31,082 $ 33,939 $ 36,583 $ 42,891 $ 49,651
Source: City of Lodi (1) As defined in the Installment Purchase Contract, this may or may not be on the same basis as Generally Accepted Accounting Principles. (2) Non-power costs include cost of services provided by other departments and does not include depreciation and amortization expense.

162
Table 5 A table showing Lodi Electric Utility Department Rate Changes since November 1996.
CITY OF LODI ELECTRIC UTILITY DEPARTMENT
RATE CHANGES Effective Date Percent Change July 2017 November 2016 September 2015
Average 2% increase across all rate classes Electric Vehicle rate restructure replacing minimum charge with customer charge; aligning energy charges with residential rates City rate restructure replacing minimum charge with customer charge Residential rate restructure replacing minimum charge with customer charge; reduction to 3 energy tiers Mobile home park rate restructure replacing minimum charge with customer charge; reduction to 3 energy tiers; reduction of pad discount Extended Economic Development Rates
January 2015 Average 5% increase across all rate classes July 2013 April 2009 December 2007
Established Electric Vehicle and Industrial Equipment Charging Rates Established Economic Development Rates updated July 2013 Established Solar Initiative Surcharge of $0.00125 per kilowatt-hour
August 2007 Implemented monthly Energy Cost Adjustment December 2005 Average 17% increase across all rate classes December 2002 4.5% average rate increase August 2001 Increased MCA for all but contract customers: 10% to 12% rate change June 2001 Implemented MCA for residential and small commercial: 8% to 10% rate change December 1998 5.00% rate decrease for small commercial/industrial customers May 1998 2.50% general rate increase to fund public benefit programs September 1997 4.5 to 5.5 cents per kilowatt-hour, non-demand, non-time-use, contract rate available for new large commercial/industrial loads December 1996 10% to 40% economic development discount on new small to medium commercial/industrial electric loads November 1996 Economic Stimulus Rate Credit increased to 1.262 cents per kilowatt-hour from 0.4 cents per kilowatt-hour for largest primary service customers (estimated 19% reduction) Source: Lodi Electric Utility

163
ANNUAL REPORT FOR WASTEWATER UTILITY The Lodi Wastewater Utility has Continuing Disclosure requirements associated with its 2004 Series A Certificates of Participation, 2007 Series A Certificates of Participation, 2012 Refunding Wastewater Revenue Bonds and the 2016 Refunding Wastewater Revenue Bonds. The annual report includes, by reference, the audited financial statements of the City of Lodi (including the Wastewater Utility). The annual report also contains the following five (5) tables as required in the Certificates:
1. A table setting forth the City’s number of connections by user type for the past five fiscal years. 2. A table showing the proportion of service charge revenue by class of user for the most recent fiscal year (applicable only to the 2004 Series
A issue). 3. A table showing the largest users by service charge revenues for the most recent fiscal year. 4. A table showing a schedule of service charges. 5. A table showing a summary of historic operating results and debt service coverage for the past five fiscal years. 6. A table showing historical reserve balances for the past four fiscal years.
Additionally, the Certificate for the 2007 Series A issue requires a description of any additional indebtedness incurred during the prior fiscal year which is payable from the system net revenues on a parity with the installment payments. Reporting of Significant Events The Certificates identify eleven (11) specific events that require special reporting. As of June 30, 2017, none of the specified events have occurred. Further, there is no knowledge on the part of the City Council, officers or employees of the City of any impending Significant Event that would require disclosure under the provisions of the Certificates.

164
Table 1 A table setting forth the City’s number of connections by user type for the past five fiscal years.
City of Lodi Wastewater System
Number of Connections by User Type as of June 30
and Percentage of Fiscal Year 2016-17 Service Charge Revenue by User Type % of FY 16/17 Service Charge User Type 2013 2014 2015 2016 2017 Revenue Residential 21,959 22,076 21,920 21,700 21,891 78% Commercial/Industrial 1,851 1,851 1,876 1,909 2,001 22% Total All Users 23,810 23,927 23,796 23,609 23,892 100%
Source: City of Lodi

165
Table 2 A table showing the proportion of service charge revenue by class of user for the most recent fiscal year.
City of Lodi Wastewater System
Proportion of Service Charge Revenues by Class of User Fiscal Year 2016-17
Percentage of Total Annual Service Charge Revenue
User Type
Single Family Residential 60% Multiple Family Residential 18% Commercial/Industrial 22% Total 100%
Source: City of Lodi

166
Table 3 A table showing the largest users by service charge revenue for the most recent fiscal year. City of Lodi Wastewater System Largest Users by Service Charge Revenues Fiscal Year 2016-17
Percentage of
Total Service Charge Annual Service
User Type of Business Revenue Charge Revenue TreeHouse Foods Specialty bakery, frozen dough $ 483,808 3.20% Lodi Unified School District K-12, adult education 336,671 2.23 City of Lodi Government 68,305 .45 Pacific Coast Producers Private label fruit canning 49,932 .33 Blue Shield of California Health insurance 43,854 .29 Casa de Lodi Mobile home park 40,749 .27 Lodi Memorial Hospital Health care 38,112 .25 Archer Daniels Midland Agricultural processor 35,876 .24 Miller Packing Company Hot dog producer 34,419 .23 Tokay Villa Apartments Apartment complex 25,947 .17 Total top ten users $ 1,157,603 7.66%
Total System $ 15,106,432 100.00%

167
Table 4 A table showing the schedule of service charges. City of Lodi Wastewater System Schedule of Wastewater Service Charges
Service Charge (effective July 1,
2013)
Service Charge (effective July 1,
2014
Service Charge (effective July 1,
2015)
Service Charge (effective July 1,
2016) For Residential Users (flat rate per month): 1 Bedroom………………………… $25.83 $26.48 $27.22 $27.90 2 Bedrooms………………………. 34.44 35.30 36.29 37.20 3 Bedrooms………………………. 43.05 44.13 45.36 46.49 4 Bedrooms………………………. 51.66 52.95 54.43 55.79 5 Bedrooms………………………. 60.27 61.78 63.51 65.09 6 Bedrooms………………………. 68.88 70.60 72.58 74.39 7 Bedrooms………………………. 77.49 79.43 81.65 83.69 For Residential Users (usage based rate per month): Monthly Usage Charge ($/CCF) (1) $2.68 $2.75 $2.82 $2.89 ¾” Meter Charge 23.52 24.11 24.78 25.40 For Commercial/Industrial Users: Moderate Strength (annual per Sewage Service Unit (SSU)…….. $413.28 $423.61 $423.61 $446.40 High Strength: Flow (annual per MG)…………………………………….. 3,487.41 3,574.60 3,674.68 3,730.00 BOD (annual per 1,000 lbs.)……………………………… 575.51 589.90 606.41 616.00 SS (annual per 1,000 lbs.)………………………………. 359.85 368.85 379.17 385.00 Grease Interceptor/Septic Holding Tank Waste within City Limits (per 1,000 gal.)………………………………. 304.72 312.34 321.00 326.00 Septic Holding Tank Waste Outside City Limits (per 1,000 gal.)………………………………………………….. 646.89 663.06 482.00 489.00 Disposal to Storm Drain System (per MG)…………….. 320.09 328.09 328.09 Disposal to Industrial System: Flow (per MG, annual basis)……………….. BOD (per 1,000 lbs., annual basis)………… Winery Waste (per 1,000 gallons)………………………. 301.04 301.04 301.00 306.00
(1) Winter water usage determined as average monthly usage from
December through February
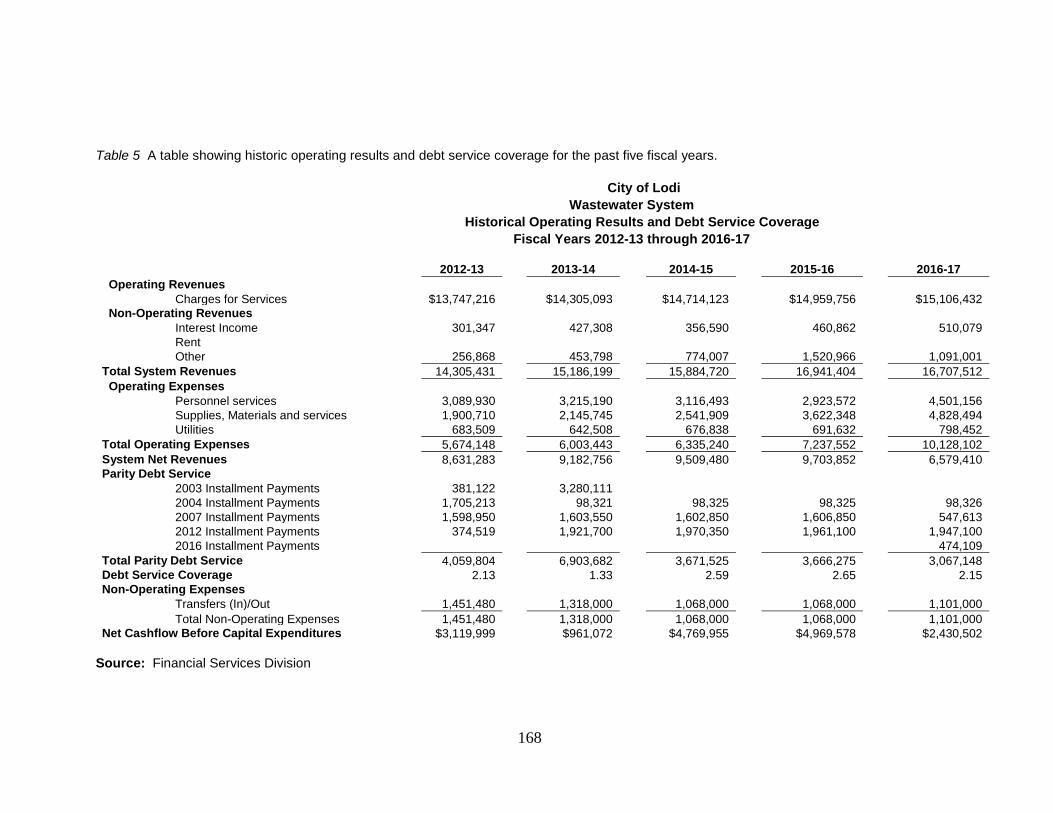
168
Table 5 A table showing historic operating results and debt service coverage for the past five fiscal years. City of Lodi Wastewater System Historical Operating Results and Debt Service Coverage Fiscal Years 2012-13 through 2016-17 2012-13 2013-14 2014-15 2015-16 2016-17 Operating Revenues Charges for Services $13,747,216 $14,305,093 $14,714,123 $14,959,756 $15,106,432 Non-Operating Revenues Interest Income 301,347 427,308 356,590 460,862 510,079 Rent Other 256,868 453,798 774,007 1,520,966 1,091,001 Total System Revenues 14,305,431 15,186,199 15,884,720 16,941,404 16,707,512 Operating Expenses Personnel services 3,089,930 3,215,190 3,116,493 2,923,572 4,501,156 Supplies, Materials and services 1,900,710 2,145,745 2,541,909 3,622,348 4,828,494 Utilities 683,509 642,508 676,838 691,632 798,452 Total Operating Expenses 5,674,148 6,003,443 6,335,240 7,237,552 10,128,102 System Net Revenues 8,631,283 9,182,756 9,509,480 9,703,852 6,579,410 Parity Debt Service 2003 Installment Payments 381,122 3,280,111 2004 Installment Payments 1,705,213 98,321 98,325 98,325 98,326 2007 Installment Payments 1,598,950 1,603,550 1,602,850 1,606,850 547,613 2012 Installment Payments 374,519 1,921,700 1,970,350 1,961,100 1,947,100 2016 Installment Payments 474,109 Total Parity Debt Service 4,059,804 6,903,682 3,671,525 3,666,275 3,067,148 Debt Service Coverage 2.13 1.33 2.59 2.65 2.15 Non-Operating Expenses Transfers (In)/Out 1,451,480 1,318,000 1,068,000 1,068,000 1,101,000 Total Non-Operating Expenses 1,451,480 1,318,000 1,068,000 1,068,000 1,101,000 Net Cashflow Before Capital Expenditures $3,119,999 $961,072 $4,769,955 $4,969,578 $2,430,502
Source: Financial Services Division
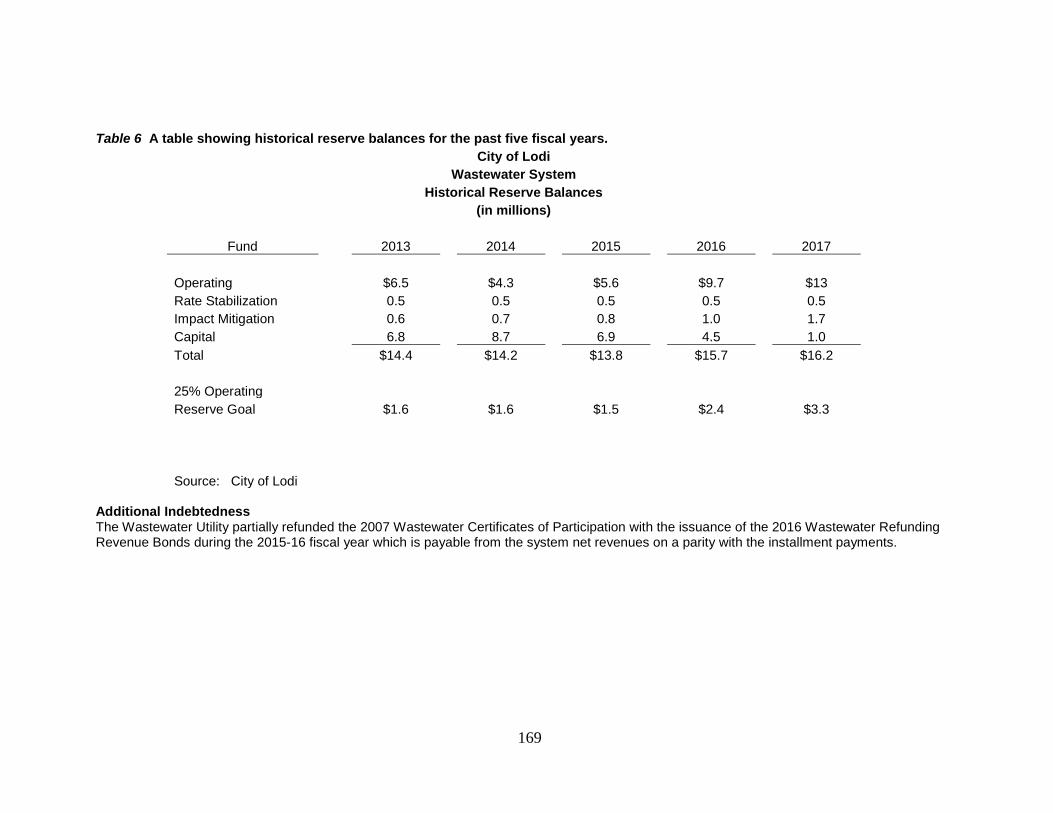
169
Table 6 A table showing historical reserve balances for the past five fiscal years.
City of Lodi
Wastewater System
Historical Reserve Balances
(in millions)
Fund
2013
2014
2015
2016
2017
Operating
$6.5
$4.3
$5.6
$9.7
$13
Rate Stabilization
0.5
0.5
0.5
0.5
0.5
Impact Mitigation
0.6
0.7
0.8
1.0
1.7
Capital
6.8
8.7
6.9
4.5
1.0
Total
$14.4
$14.2
$13.8
$15.7
$16.2
25% Operating
Reserve Goal
$1.6
$1.6
$1.5
$2.4
$3.3
Source: City of Lodi
Additional Indebtedness The Wastewater Utility partially refunded the 2007 Wastewater Certificates of Participation with the issuance of the 2016 Wastewater Refunding Revenue Bonds during the 2015-16 fiscal year which is payable from the system net revenues on a parity with the installment payments.

170
ANNUAL REPORT FOR THE LODI PUBLIC FINANCING AUTHORITY The Lodi Public Financing Authority has Continuing Disclosure requirements associated with its 2012 Refunding Lease Revenue Bonds. The annual report includes, by reference, the audited financial statements of the City of Lodi. The annual report also contains the following six (6) tables as required in the Certificates:
1. A table setting forth the approved budget and actual results for the most recent fiscal year. 2. A table showing the comparative statements of revenue, expenditures and changes in fund balance for the general fund for the past five
fiscal years. 3. A table showing the assessed valuations for the last five fiscal years. 4. A table showing the secured property tax collections for the past ten fiscal years. 5. A table showing the ten largest locally secured taxpayers for the last fiscal year. 6. A table showing the Employee-paid and City-paid employee portion of the retirement plan.
Reporting of Significant Events The Certificates identify sixteen (16) specific events that require special reporting. As of June 30, 2017, none of the specified events have occurred. Further, there is no knowledge on the part of the City Council, officers or employees of the City of any impending Significant Event that would require disclosure under the provisions of the Certificates. Table 1 A table setting forth the approved budget and actual results for the most recent fiscal year. Please refer to the Schedule of Revenues, Expenditures and Changes in Fund Balance – Budget and Actual on page 92 of this Comprehensive Annual Financial Report.

171
Table 2 A table showing the comparative statements of revenue, expenditures and changes in fund balance for the general fund for the past five fiscal years.
STATEMENT OF REVENUES, EXPENDITURES AND CHANGES IN FUND BALANCES GENERAL FUND
LAST FIVE FISCAL YEARS
2013 2014 2015 2016 2017 Revenues: Taxes $ 23,022,370 23,718,396 24,630,745 25,327,203 26,490,919 Licenses and permits 62,582 83,420 87,908 92,702 86,844 Intergovernmental revenues 10,531,871 11,319,708 12,642,107 12,887,767 12,830,329 Charges for services 1,105,178 1,025,851 1,482,448 1,437,440 1,852,855 Fines, forfeits and penalties 1,628,870 1,552,531 1,573,071 1,494,758 906,563 Investment and rental income 979,100 1,548,787 1,546,845 1,554,198 1,734,773 Miscellaneous revenue 393,299 352,331 290,951 349,153 319,373 Total revenues 37,723,270 39,601,024 42,254,075 43,143,221 44,221,656 Expenditures: Current: General government 5,943,192 6,482,226 6,490,907 6,824,884 6,926,368 Public protection 25,920,654 26,470,110 26,388,172 28,612,592 29,969,781 Public works 1,555,833 1,554,939 1,882,250 1,866,277 1,698,518 Library 1,410,657 1,267,850 1,311,367 1,152,901 1,152,721 Total expenditures 34,830,336 35,775,125 36,072,696 38,456,654 39,747,388 Excess of revenues over expenditures 2,892,934 3,825,899 6,181,379 4,686,567 4,474,268 Other financing sources (uses): Transfers in 5,367,990 3,952,000 3,952,000 3,952,000 3,952,000 Transfers out (6,584,665) (6,269,351) (7,128,586) (7,869,927) (6,705,104) Total other financing sources (uses) (1,216,675) (2,317,351) (3,176,586) (3,917,927) (2,753,104) Net change in fund balance 1,676,259 1,508,548 3,004,793 768,640 1,721,164 Fund balance, beginning of year 6,288,953 7,965,212 9,473,760 12,478,553 13,247,193 Fund balance, end of year $ 7,965,212 9,473,760 12,478,553 13,247,193 14,968,357

172
Table 3 A table showing the assessed valuations for the last ten fiscal years. Please refer to the table shown in the Statistical Section on page 128. Table 4 A table showing the secured property tax collections for the past ten fiscal years. Please refer to the table shown in the Statistical Section on page 131. Table 5 A table showing the ten largest locally secured taxpayers for the last fiscal year. Please refer to the table shown in the Statistical Section on page 130. Table 6 A table showing the Employee-paid and City-paid employee portion of the retirement plan.
Pension Contributions As of Fiscal Year Ended June 30, 2017
Bargaining Units Employee Paid* City Paid Total Employee Share Council appointees 7.0% % 7.0% Executive management 7.0 7.0 Confidential mid-management 7.0 7.0 Confidential 7.0 7.0 Fire mid-management 9.0 9.0 Fire 9.0 9.0 Mid-management 7.0 7.0 General services 7.0 7.0 Maintenance and operators 7.0 7.0 IBEW 7.0 7.0 Police mid-management 9.0 9.0 Police 9.0 9.0 Dispatchers 7.0 7.0 *PEPRA Miscellaneous Employees 6.75 6.75 *PEPRA Safety Employees 11.25 11.25

173
ANNUAL REPORT FOR WATER UTILITY The Lodi Water Utility has Continuing Disclosure requirements associated with its 2010 Series A and B Certificates of Participation. The annual report includes, by reference, the audited financial statements of the City of Lodi (including the Water Utility). The annual report also contains the following four (4) tables as required in the Certificates:
1. A table setting forth the City’s number of accounts and revenues by user type for the past five fiscal years. 2. A table showing the largest users by service charge revenues for the most recent fiscal year. 3. A table showing a schedule of selected rates effective January 1, 2016. 4. A table showing a summary of historic operating results and debt service coverage for the past five fiscal years.
Additionally, the Certificate for the 2010 Series A issue requires a description of any additional indebtedness incurred during the prior fiscal year which is payable from the system net revenues on a parity with the installment payments. Reporting of Significant Events The Certificates identify eleven (11) specific events that require special reporting. As of June 30, 2017, none of the specified events have occurred. Further, there is no knowledge on the part of the City Council, officers or employees of the City of any impending Significant Event that would require disclosure under the provisions of the Certificates.

174
Table 1 A table showing number of accounts and revenues by user type. CITY OF LODI WATER SYSTEM Number of Accounts and Revenues by User Type Commercial/Industrial/ Municipal Residential
Year Ending December 31
Number of Accounts Revenue
Number of Accounts Revenue
2007 1,445 $ 2,043,731 21,533 $ 8,715,928 2008 1,470 2,184,496 21,449 9,429,594 2009 1,382 2,188,486 21,577 9,600,129
2010 1,383 2,097,001 21,622 9,604,412 2011 1,396 2,169,967 21,593 9,706,537
2012 1,432 2,329,957 23,399 8,411,315 2013 1,415 2,436,777 21,717 10,353,374 2014 1,435 2,534,741 21,722 10,359,235 2015 1,524 2,830,790 21,387 9,410,460 2016 1,821 2,991,610 21,683 9,500,400 Source: City of Lodi
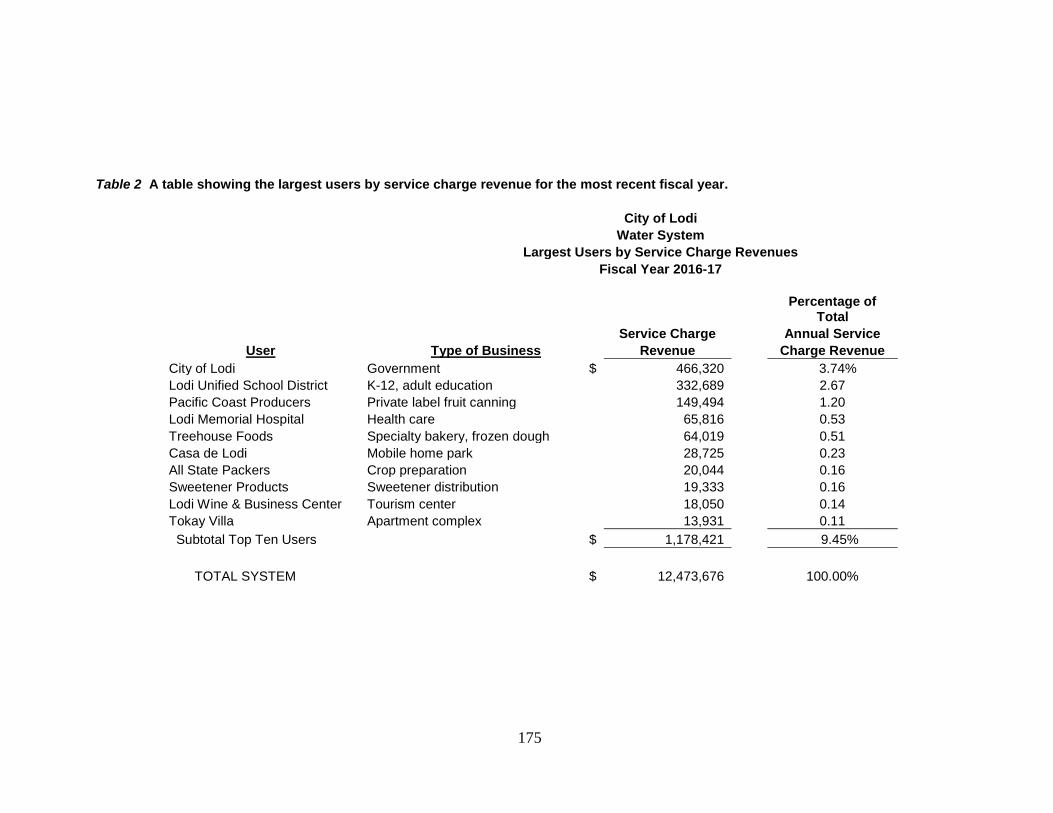
175
Table 2 A table showing the largest users by service charge revenue for the most recent fiscal year.
City of Lodi Water System Largest Users by Service Charge Revenues Fiscal Year 2016-17
Percentage of
Total Service Charge Annual Service
User Type of Business Revenue Charge Revenue City of Lodi Government $ 466,320 3.74% Lodi Unified School District K-12, adult education 332,689 2.67 Pacific Coast Producers Private label fruit canning 149,494 1.20 Lodi Memorial Hospital Health care 65,816 0.53 Treehouse Foods Specialty bakery, frozen dough 64,019 0.51 Casa de Lodi Mobile home park 28,725 0.23 All State Packers Crop preparation 20,044 0.16 Sweetener Products Sweetener distribution 19,333 0.16 Lodi Wine & Business Center Tourism center 18,050 0.14 Tokay Villa Apartment complex 13,931 0.11 Subtotal Top Ten Users $ 1,178,421 9.45% TOTAL SYSTEM $ 12,473,676 100.00%

176
Table 3 A table showing selected rates effective January 1, 2017. CITY OF LODI WATER SYSTEM Selected Rates Effective January 1, 2017 Percent Increase Current Flat Rates ($/month) Single Family Residential Unit ($/month) 1 Bedroom $32.84 2 Bedroom $39.44 3 Bedroom $47.27 Metered Water Rates Service Charge ($/month) Single Family Residential Up to 3/4" Meter $21.87 Multi-Family and Non-Residential 1" Meter $34.34 1 1/2" Meter $65.25 2" Meter $102.52 Water Usage rates ($/CCF) Single Family Residential Tier 1 - 0 to 10 CCF/month $0.97 Tier 2 - 11 to 50 CCF/month $1.29 Tier 3 - Over 50CCF/month $1.60 Multi-Family and Non-Residential All Water Usage $1.15 Source: City of Lodi.

177
Table 4 A table showing historic operating results and debt service coverage for the past five fiscal years.
CITY OF LODI WATER SYSTEM Historical Operating Results and Debt Service Coverage Fiscal Years 2012-13 through 2016-17
2012-13 2013-14 2014-15 2015-16 2016-17 Gross Revenues Water Sales (1) $ 12,441,039 $ 12,756,076 $ 12,722,619 $ 12,161,186 $ 12,473,676 Investment Earnings 67,982 118,799 87,211 166,791 132,364 Water Impact Mitigation Fees 2,529 60,000 20,299 332,765 206,847 Meter Retrofit Installation Charges 585,965 405,677 56,052 76,103 19,255 Other Revenues (2) 269,335 825,314 483,710 287,839 1,011,756
Total Gross Revenues 13,366,850 14,165,866 13,369,891 13,024,684 13,843,898 Operating and Maintenance Expenses Personnel Services 2,272,568 2,392,611 2,316,305 2,515,542 2,998,026 Supplies, Materials and Services 2,882,547 3,014,227 2,139,014 3,008,676 3,468,229 Utilities 683,635 648,233 579,774 496,316 453,488 Administrative Overhead 1,060,120 780,000 780,000 780,000 813,000
Total O & M Expenses 6,898,870 6,835,071 5,815,093 6,800,534 7,732,743 Net Revenue Available for Debt Service 6,467,980 7,330,795 7,554,798 6,224,150 6,111,155 Debt Service 2010 Bonds (3) 2,335,360 2,355,230 2,356,141 2,351,580 2,308,061
Total Net Debt Service 2,335,360 2,355,230 2,356,141 2,351,580 2,308,061 Debt Service Coverage (4) Debt Service Coverage 2.77 3.11 3.21 2.65 2.65 Debt Service Coverage (excluding impact mitigation fees) 2.77 3.09 3.20 2.51 2.56 Net Remaining Revenues Available for Capital 4,132,620 4,975,565 5,198,657 3,872,570 3,803,094

178
Capital Improvement Projects Meter Retrofit Program (5) 6,536,687 6,891,350 4,841,932 1,606,734 4,589,636 Other Water System Improvements (6) 1,144,363 380,675 267,902 9,097 330,380 Total Capital Improvement Projects 7,681,050 7,272,025 5,109,834 1,615,831 4,920,016 Net Change in Reserve (3,548,430) (2,296,460) 88,823 2,256,739 (1,116,922) Water Enterprise Fund (7) Beginning Cash Balance 12,465,350 9,044,659 7,027,567 6,755,522 6,270,786 Ending Cash Balance $ 9,044,659 $ 7,027,567 $ 6,755,522 $ 6,270,786 $ 4,558,222
(1) Water sales reflect Council-adopted rate increases effective January 1, 2015. (2) Includes rent, sales of City property, discounts, water reimbursements, and damage to property, water tap fees, DBCP reimbursements,
and other miscellaneous revenues. DBCP reimbursements are expected to decline beginning in Fiscal Year 2012-13 as new plant becomes operational and groundwater draws diminish.
(3) Reflects total debt service for the 2010 Water Revenue Bonds net of the 35% interest rate subsidy for the Series 2010B bonds. (4) Coverage calculated based on Net Revenues divided by net Debt Service and Net Revenues less mitigation fees divided by Net Debt
Service. (5) Annual capital costs of transition to water meters. Program expected to be completed in Fiscal Year 2017-18. (6) Excludes costs of the Project to be funded from proceeds of the Series 2010 Bonds. (7) Water Enterprise Fund balance includes both operating and capital reserves and is presented on a cash basis. Cash position is expected
to increase substantially upon completion of the water meter installation program. Source: City of Lodi