city of kerman - california department of - … of kerman 2010 urban water management plan 1 1....
TRANSCRIPT
CITY OF KERMAN 2010 URBAN WATER MANAGEMENT PLAN
1
1. INTRODUCTION This document constitutes the 2010 Urban Water Management Plan for the City of Kerman (City), prepared and adopted in compliance with the California Water Code and the Urban Water Management Plan Act (UWMPA) of 1983. The City of Kerman services more than the minimum of 3,000 customers and delivers more than the minimum 3,000 acre-feet of water annually as determined by the UWMPA as basis for the required preparation of this document, referred to as “Plan” hereinafter. The purpose of the Plan is to serve as a planning tool for the City of Kerman, as a water provider and management agency, and to provide a general framework for action both currently and in the future to ensure the adequate and efficient use of water and delivery to its customers, to protect existing and projected supplies, promote conservation through programs, policies and education, outline methods of securing and making available additional water supply through exchange and recycling efforts, and provide a mechanism for response during conditions of supply shortage and drought. This report marks the first UWMP for the City of Kerman and will be updated in 2015 to comply with the UWMPA requirement that water suppliers amend their Plans in years ending in Five and Zero. Senate Bills 610 and 221 required that additional information be included in the UWMP and identified the UWMP as a source document that may be used by water agencies to fulfill the water supply assessment and verification requirements. The UWMPA also requires a 20-year projection, through 2030 for the 2010 UWMP, for supply and demand details provided in the UWMP. Public Participation A public notice was published in the Kerman News (see Appendix A) on March 14th and 21st, 2012 informing the public of the preparation of this 2010 Urban Water Management Plan and announcing its inclusion in the agenda of an upcoming City Council Hearing open to the public. The Plan was made available to the general public for viewing and comments were welcomed and invited. Plan Adoption This Plan is the second UWMP prepared and submitted by the City of Kerman. The City prepared a 2005 UWMP in early 2010 that was not completed and approved by California Water Resources prior to the time that an update to the 2010 UWMP format was required. This Plan was approved and adopted by Kerman City Council on April 4th, 2012 and submitted to California Water Resources within 30 days of Council approval. In addition, within 30 days of Council approval, this Plan was submitted to the California State Library and the County of Fresno, and was posted at Kerman City Hall available for public viewing. This Plan includes all information sufficient to meet the requirements of California Water Code Division 6, Part 2.6 (Urban Water Management Planning). Agency Coordination California Water Code 10620(d)(2) states, “Each urban water supplier shall coordinate the preparation of its plan with other appropriate agencies in the area, including other water suppliers that share a common source, water management agencies, and relevant public agencies, to the extent practicable.” The office of the City Engineer drafted this Plan with Ken Moore, Public Works Director of the City of Kerman and Doug Herald, Water Distribution Manager aiding in its preparation.

CITY OF KERMAN 2010 URBAN WATER MANAGEMENT PLAN
2
2. SUPPLIER AND SERVICE AREA INFORMATION / SYSTEM DESCRIPTION Location The City of Kerman is located approximately fifteen miles west of the City of Fresno and fifteen miles south of the City of Madera. State Highway 145 runs north and south through the City and is a popular route for travelers heading for the central coast of California. See Appendix F for vicinity map. Climate The climate in the City of Kerman is a Central Valley desert climate characterized by hot, dry summers and cold and humid winters with frequent fog conditions. Most of the annual rainfall occurs during the months of November through April. The average annual temperature is 62.1 degrees Fahrenheit, but the temperature can frequently top 100°F during the summer months and drop below 20°F during the winter. Average evapotranspiration in Table 3.1 is per the State of California’s CIMIS website and average rainfall and temperature is per the NOAA Western Regional Climate Center website. Table 2.1 – Service Area Climate – Jan-Jun
Climate Jan Feb Mar Apr May Jun Standard Monthly Average ETo 1.26 1.96 3.41 5.10 6.82 7.80 Average Rainfall (inches) 2.0 1.93 1.78 1.08 0.40 0.10 Average Temperature (Fahrenheit) 44.9 50.2 54.5 60.3 67.7 74.3
Table 2.1 – Service Area Climate – Jul-Dec
Climate (cont.) Jul Aug Sept Oct Nov Dec Standard Monthly Average ETo 8.06 7.13 5.40 3.72 1.80 0.93 Average Rainfall (inches) 0.01 0.02 0.14 0.58 1.18 1.74 Average Temperature (Fahrenheit) 79.9 78.1 73.0 64.1 52.9 45.4
Table 2.1 – Service Area Climate
Climate (cont.) Annual Standard Monthly Average ETo 53.3 Average Rainfall (inches) 10.97 Average Temperature (Fahrenheit) 62.1
Projected Population Kerman was founded in 1910 when William G. Kerckhoff and Jacob Manson of Los Angeles purchased the property that is now the City of Kerman from the insolvent Bank of California. Between 1910 and 1914, the town grew to a population of 400 residents. The City of Kerman was incorporated in 1946 with a population of 1,050. A population of 13,551 was reported in the year 2010 and the City has assumed a population growth trend of 2.5% annually based on yearly growth to date. The following 20-year projection of population complies with requirements of the UWMPA.

CITY OF KERMAN 2010 URBAN WATER MANAGEMENT PLAN
Table 2.2 – Current and Projected Population
2005 2010 2015 2020 2025 2030 Service Area Population 10,985 13,551 15,179 17,173 19,430 21,983
Figure 2.1 - Map of City of Kerman
3

CITY OF KERMAN 2010 URBAN WATER MANAGEMENT PLAN
4
3. SYSTEM DEMANDS Baselines and Targets This section will establish the baseline (base daily per capita daily) water use and interim and urban water use targets for the City of Kerman using data from a 10-year period beginning year 2001 and ending year 2010. Table 3.1 establishes the base period. No recycled water deliveries were made in the year 2008, hence the 10-year period was implemented rather than a 15-year period. Table 3.2 calculates the baseline usage by averaging the daily per capita use over the 10-year period. Method 1 is used to determine the Urban Water Use Target by taking 80% of the 10-year Baseline Use. This target is confirmed by comparing it to 95% of the calculated Baseline Use for a 5-year period (the second half of the 10-year period). The calculated value for the Urban Water Use Target is less than 95% of the 5-year baseline and governs. The Interim Urban Water Use Target is determined by averaging the Base Daily Per Capita Water Use with the Urban Water Use Target and is listed in Table 3.5. All past and current water use and population values are per City records. Table 3.1 – Base Period Ranges
BASE PARAMETER VALUE UNITS
10-YEAR BASE PERIOD
2008 total water deliveries 1,272.8 MGY 2008 total volume of delivered recycled water 0 MGY 2008 recycled water as a percent of total deliveries 0 % Number of years in base period 10 Year beginning base period range 2001 Year ending base period range 2010
Table 3.2 – Base Daily Per Capita Use – 10-Year Range
Base Period Year Distribution System Population
Daily System Gross Water Use (mgd)
Annual Daily per Capita Water Use (gpcd) Sequence
Year Calendar Year
1 2001 8,717 2.155 247 2 2002 9,416 2.512 267 3 2003 9,792 2.582 264 4 2004 10,350 2.705 261 5 2005 10,985 2.714 247 6 2006 12,062 2.792 231 7 2007 12,571 3.467 276 8 2008 12,841 3.487 272 9 2009 13,286 3.288 247
10 2010 13,551 2.956 218 Base Daily Per Capita Water Use (10-yr) 253
Table 3.3 – Urban Water Use Target
Base Daily Per Capita Use Target Determination Method 1 Urban Water Use Target 253 gpcd Baseline x 80% 202 gpcd

CITY OF KERMAN 2010 URBAN WATER MANAGEMENT PLAN
5
Table 3.4 – Base Daily Per Capita Use – 5-Year Range
Base Period Year Distribution System Population
Daily System Gross Water Use (mgd)
Annual Daily per Capita Water Use (gpcd) Sequence Year Calendar
Year 1 2006 12,062 2.792 231 2 2007 12,571 3.467 276 3 2008 12,841 3.487 272 4 2009 13,286 3.288 247 5 2010 13,551 2.956 218
Base Daily Per Capita Water Use (5-yr) 249 Table 3.5 – Interim Urban Water Use Target
Urban Water Use Target Baseline Use (5-yr) Interim Urban Water Use Target 202 249 202+249 / 2 = 226 gpcd
Water Demands Recorded and projected water system demands for the City of Kerman are listed in the following tables. Projected demands based on an annual 2.5% growth rate, as determined by recently recorded population growth trends for the City of Kerman. Table 3.6 – Water Deliveries – Actual, 2010
2010 Metered Not Metered Total
Water Use Sectors # of accounts Deliveries AFY # of accounts Deliveries AFY Volume Single Family 2,003 1,255.7 1,423 Multi Family 24 181.2 25 Commercial 126 98.1 73 Industrial 11 18.2 1 Institutional 12 74.6 4 Landscape 33 176.8 0 Agriculture 0 0 0
Total 2,209 1,804.6 1,526 1,506.4 3,311 Table 3.7 – Water Deliveries – Projected, 2015
2015 Metered Not Metered Total
Water Use Sectors # of accounts Deliveries AFY # of accounts Deliveries AFY Volume Single Family 3,165 1984.2 712 Multi Family 43 324.7 13 Commercial 189 147.2 37 Industrial 13 21.5 1 Institutional 16 99.5 2 Landscape 37 198.2 0 Agriculture 0 0 0

CITY OF KERMAN 2010 URBAN WATER MANAGEMENT PLAN
6
Total 3,463 2,775.2 765 1,390.8 4,166 Table 3.8 – Water Deliveries – Projected, 2020, 2025 and 2030
2020 2025 2030 Metered Metered Metered
Water Use Sectors # of accounts Deliveries AFY # of accounts Deliveries
AFY # of accounts Deliveries AFY
Single Family 4,386 2749.6 4962 3110.7 5614 3519.5 Multi Family 63 475.7 71 536.1 80 604.0 Commercial 255 198.5 288 224.2 326 253.8 Industrial 15 24.8 17 28.1 20 33.1 Institutional 20 124.3 23 143.0 26 161.6 Landscape 42 225.0 48 257.2 54 289.3 Agriculture 0 0 0 0 0 0
Total 4,781 3,798.0 5,409 4,299.3 6,120 4,861.3 Water use Reduction Plan The City of Kerman is currently implementing a program in which all flat-rate and un-metered customers are converted to metered supplies. The water meter retro-fits are completed at no cost to the customer and it is expected that individual customer usage will reduce as a result of the new fee structure. This program was begun in 2010 and is roughly 50% complete. It is projected that 50% of remaining un-metered customers will have meters installed by January 1st, 2015, and that all customers are expected to be metered by January 1st, 2020. The City of Kerman has recorded a reduction in total demand over the last two years of greater than 11 percent and attributes this in large part to the meter installation program. The City anticipates a continuing trend of a roughly 10% reduction in water demand once all customers are metered. In addition, the City is in the process of converting all traffic median island landscaping from turf, which uses broadcast irrigation, to drought-tolerant shrubs, further reducing water consumption in the City. Based on these projections, it is anticipated that the interim and urban water use targets will be met, solely driven by reduced usage as a result of the meter installation program. Wholesale Water Demand Projections The City of Kerman generates 100% of its own water supply and does not rely on purchases or supply contributions from wholesale agencies, or provide water to outside agencies, retail or wholesale.

CITY OF KERMAN 2010 URBAN WATER MANAGEMENT PLAN
7
4. SYSTEM SUPPLIES
Water Supply Sources Table 4.1 below represents the current and projected total water supply available. The City of Kerman currently obtains 100% of its water supply from groundwater. The City has recently begun to provide recycled water to agricultural customers for irrigation of non-edible crops and it is assumed that the total volume of recycled water dedicated to this use will increase by 5% per year over the next 20 years. Table 4.1 - Current and Planned Water Supplies (AF/Y)
Water Supply Sources 2011 2015 2020 2025 2030 Purchased from USBR Purchased from DWR Purchased from wholesaler City-produced groundwater 9,194 11,130 13,065 15,001 15,001 City-produced surface water Transfers Exchanges Recycled water (non-edible crop irrigation) 296 360 459 586 748
Recycled water used for recharge (less evaporation) (adds to gw supply) 834 931
1,002
1,067 1,122
Total in AFY (Acre-Feet per Year) 10,324 12,421 14,526 16,654 16,871 Groundwater The City of Kerman is a participant in the Fresno Area Regional Groundwater Management Plan. The Plan Area is located within the Kings Groundwater Sub-basin, also identified as Sub-basin 5-22.08 of the Tulare Lake Hydrologic Basin. Records indicate that this basin in NOT adjudicated and no limits or conditions have been placed on the removal or pumping of groundwater from this basin. DWR Bulletin 118-80, published in 1980, identified the Tulare Lake Basin as being in a “critical condition of overdraft.” The 2003 update to Bulletin 118 does not specifically identify or update the 1980 list of basins in critical condition of overdraft, but instead leaves it to the individual urban water suppliers to make this determination. The City of Kerman currently has six (6) wells operating with a production capacity of 8.21 million gallons per day (MGD), or 9,194 acre-feet per year (AFY). Table 4.2 to 4.4 shows individual well production, historical and projected groundwater production, and historical and projected well capacities. The City’s Waste Water Treatment Plant adds to the groundwater supply through its recharge ponds. The current demand on the system is roughly 1,100 million gallons per year or 3,300 AFY.
CITY OF KERMAN 2010 URBAN WATER MANAGEMENT PLAN
8
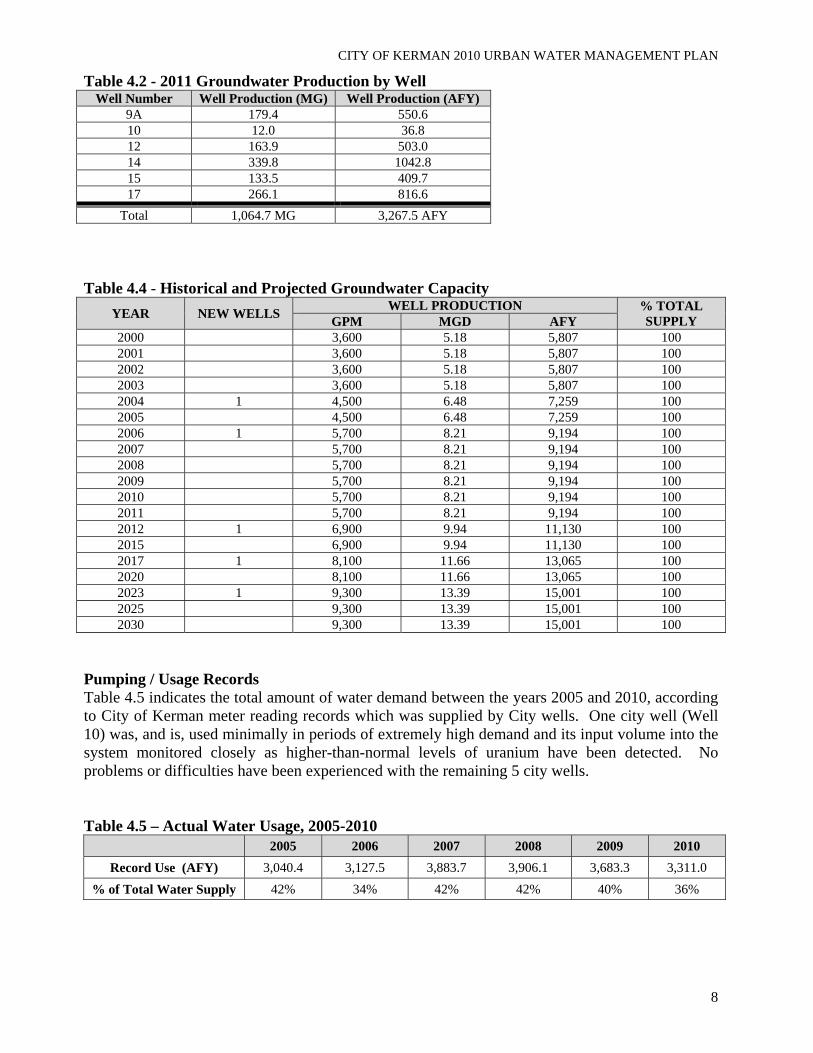
Table 4.2 - 2011 Groundwater Production by Well Well Number Well Production (MG) Well Production (AFY)
9A 179.4 550.6 10 12.0 36.8 12 163.9 503.0 14 339.8 1042.8 15 133.5 409.7 17 266.1 816.6
Total 1,064.7 MG 3,267.5 AFY Table 4.4 - Historical and Projected Groundwater Capacity
YEAR NEW WELLS WELL PRODUCTION % TOTAL SUPPLY GPM MGD AFY
2000 3,600 5.18 5,807 100 2001 3,600 5.18 5,807 1002002 3,600 5.18 5,807 1002003 3,600 5.18 5,807 1002004 1 4,500 6.48 7,259 1002005 4,500 6.48 7,259 1002006 1 5,700 8.21 9,194 1002007 5,700 8.21 9,194 1002008 5,700 8.21 9,194 1002009 5,700 8.21 9,194 1002010 5,700 8.21 9,194 1002011 5,700 8.21 9,194 1002012 1 6,900 9.94 11,130 1002015 6,900 9.94 11,130 1002017 1 8,100 11.66 13,065 1002020 8,100 11.66 13,065 1002023 1 9,300 13.39 15,001 1002025 9,300 13.39 15,001 1002030 9,300 13.39 15,001 100
Pumping / Usage Records Table 4.5 indicates the total amount of water demand between the years 2005 and 2010, according to City of Kerman meter reading records which was supplied by City wells. One city well (Well 10) was, and is, used minimally in periods of extremely high demand and its input volume into the system monitored closely as higher-than-normal levels of uranium have been detected. No problems or difficulties have been experienced with the remaining 5 city wells. Table 4.5 – Actual Water Usage, 2005-2010
2005 2006 2007 2008 2009 2010 Record Use (AFY) 3,040.4 3,127.5 3,883.7 3,906.1 3,683.3 3,311.0
% of Total Water Supply 42% 34% 42% 42% 40% 36%

CITY OF KERMAN 2010 URBAN WATER MANAGEMENT PLAN
9
Projected Water Production According to population and demand projections, new city wells are planned to be constructed and online in each of the following years as shown in Table 4.4; years 2012, 2017, and 2023. Table 4.6 indicates the amount of groundwater anticipated to be produced by City wells in the future. Table 4.6 – Projected Production, 2015-2030
2015 2020 2025 2030 Projected Production (AFY) 11,130 13,065 15,001 15,001 % of Total Water Supply (AFY) 100% 100% 100% 100%
Transfer / Exchange Opportunities The City of Kerman is currently in the process of reaching an agreement with the Fresno Irrigation District to establish a Water Transfer Program. However at the time this UWMP was prepared the City and FID had not finalized the agreement. Development of Desalinated Water The City of Kerman is located in the Central San Joaquin Valley, which eliminates possibility of developing procedures for incorporating desalinated ocean water into its supply. In addition, the current groundwater source is of sufficient quality and desalinization is not required or necessary. Anticipated Future Supply Sources/Water Projects The City of Kerman currently utilizes six City wells to produce 100% of its supply from groundwater. The City plans to construct new wells in future years to accommodate the projected increase in demand. Table 6.1 indicates the current and planned City Wells. Table 4.7 - Future Water Projects
Project Name
Projected Start
Projected Completion
Normal Year
Single Dry Year Yield
Multiple Dry Years Year 1 Year 2 Year 3
New City Well
2012 2012 11,130 11,130 11,130 11,130 11,130 2017 2017 13,065 13,065 13,065 13,065 13,065 2023 2023 15,001 15,001 15,001 15,001 15,001
Water Recycling - Wastewater System Description The present WWTP in the City of Kerman consists of a Headwork with auger for solids grinding, a Parshall Flume flow meter, a lift station with pumps, a primary aeration pond (CM), three secondary aeration ponds (PM), three settling ponds, and three disposal ponds, and concrete control structures for controlling and delivering wastewater flows between treatment units. The City has plans for expansion to the WWTP. Proposed are an upgraded headworks and influent pump station. The Parshall Flume flow meter will be replaced by a magnetic flow meter. A new Biolac System, which extends the aeration process with diffused fine bubble aeration, will replace the mechanical surface aerated pond system. Two new clarifiers and a sludge press have been constructed, with one acre of new drying beds to be constructed by 2013. The existing storage ponds and disposal ponds were significantly expanded, and a new 5,000 gallon storage tank for receiving domestic septic was installed. This expansion to the existing WWTP was completed in 2011, increasing the capacity of the plant from 1.34 MGD to 2.0 MGD. Future expansion will increase the capacity to 3.3 MGD by 2025. The amount of wastewater collected and treated, both current and projected, is shown in Table 5.10 below.

CITY OF KERMAN 2010 URBAN WATER MANAGEMENT PLAN
10
Table 4.8 - Wastewater Collection and Treatment - AFY
Method of Disposal 2010 2015 2020 2025 2030 Wastewater collected and treated (AFY) 1,270 1,431 1,601 1,793 2,010 Volume That Meets Recycled Water Standards 0 0 0 0 0
Treatment Process The present Kerman Treatment facilities consists of the headworks, a complete mixed lagoon, 3 partially suspended lagoons, 2 settling lagoons, 2 oxidation ponds, and concrete control structures for controlling and diverting wastewater flows between the treatment units. Wastewater Disposal and Recycled Water Uses Treated water from the WWTP currently is directed to recharge basins where it percolates into the soil and recharges the groundwater table. Table 4.9 - Disposal of Wastewater (non-recycled) - AFY
Method of Disposal Treatment Level 2010 2015 2020 2025 2030 Agriculture Reclamation 296 360 459 586 748 Groundwater Recharge Percolation 834 931 1,002 1,067 1,122 Ponds and Lagoons Evaporation 140 140 140 140 140
Table 4.10 - Recycled Water Uses-Actual and Potential - AFY
User Type Treatment Level 2010 2015 2020 2025 2030 Agriculture Reclamation 296 360 459 586 748 Landscape N/A Wildlife Habitat N/A Wetlands N/A Industrial N/A Groundwater Recharge Percolation 834 931 1,002 1,067 1,122 Ponds and Lagoons Evaporation 140 140 140 140 140
Potential and Projected Use The City of Kerman has begun providing treated effluent to local area farmers for irrigation of non-edible crops. The current percentage of the total effluent produced by the plant supplied for irrigation is roughly 23%. Table 4.11 - Projected Future Use of Recycled Water in Service area - (AF/Y)
User Type Treatment Level 2010 2015 2020 2025 2030 Agriculture Reclamation 296 360 459 586 748 Groundwater Recharge Percolation 834 931 1,002 1,067 1,122 Ponds and Lagoons Evaporation 140 140 140 140 140
Recycled Water Use Incentives

CITY OF KERMAN 2010 URBAN WATER MANAGEMENT PLAN
11
As part of Kerman’s Sewer Master Plan, along with the planned expansion of the treatment plant percolation ponds, the City intends to continue with expansion of the non-potable water distribution system that was begun recently, which distributes recycled water to agricultural customers directly adjacent to the plant. The non-potable distribution system will be expanded to reach other out-lying agricultural customers in the vicinity of the treatment plant. To encourage the local farmers to utilize recycled water for their non-edible crop irrigation purposes, in lieu of pumping groundwater in competition with the City wells, the City is offering this treated effluent for irrigation purposes at no charge. Optimization Plan Current practices optimize recycling of treated domestic wastewater.

CITY OF KERMAN 2010 URBAN WATER MANAGEMENT PLAN
12
5. WATER SUPPLY RELIABILITY AND WATER SHORTAGE CONTINGENCY PLAN Water Supply Reliability The City of Kerman has five (5) wells currently online capable of discharging 5,700 gallons per minute, and one well on stand-by status capable of producing 1,500 gpm. The City also has two water storage tanks with a combined volume of 1.5 million gallons and booster pumps that are capable of adding an additional 4,000 gpm to the system. The City of Kerman currently does not import water for domestic or other use and does not have any plans to pursue import sources in the foreseeable future. Water supply reliability typically is considered as it relates conditionally to climate and periods of mild or severe drought. Three scenarios are considered; a normal water year, single dry water year, and multiple dry water years. These scenarios are defined as follows:
• Average Water Year: The average year is a year in the historical sequence that most clearly represents median runoff levels and patterns.
• Single Dry Water Year: This is the year with the lowest usable water supply. • Multiple Dry Years: This is the multiple-year period (3 years or more) with the
consecutive lowest usable supply. The City of Kerman relies solely on groundwater for its water supply. Groundwater supplies are not as vulnerable to drought periods as surface water supplies would be. The steady supply of groundwater available to the City is not expected to vary significantly in relation to wet or dry years. Groundwater levels may decline in extended periods of severe drought and will require more aggressive demand management practices during those periods. Table 5.1 – Supply Reliability
Average Water Year Single Dry Water Year Year 1 Year 2 Year 3 7,259 7,259 9,193 9,193 9,193
% of Normal 100% 100% 100% 100% Table 5.2 – Basis of Water Year Data
Average Water Year 2005 Single-Dry Water Year 1977
Multiple-Dry Water Year 1987-1992
Water Shortage Contingency Planning - Stages of Action This UWMP is required by the UWMPA to include an urban water shortage contingency plan that covers specific issues. 10632 The plan shall provide an urban water shortage contingency analysis which includes each of the following elements which are within the authority of the urban water supplier: 10632 (a) Stages of action to be undertaken by the urban water supplier in response to water supply shortages, including up to a 50 percent reduction in water supply and an outline of specific water supply conditions which are applicable to each stage.

CITY OF KERMAN 2010 URBAN WATER MANAGEMENT PLAN
13
Water supply agencies such as the City of Kerman which rely solely on groundwater are much less likely to experience shortage conditions than those relying on surface water deliveries. Refer to Table 4.4 in Section 4 for details. The City of Kerman has developed a 3-stage water rationing plan that will be enacted during declared shortages. Each stage includes a water reduction objective as a percentage of normal demand. The rationing plan is dependent on the cause, severity and anticipated duration of the water supply shortage. Response actions become effective when the Director of Public Works declares that the City is unable to provide sufficient water supply to meet demand, including insufficient supply for human consumption, sanitation and fire protection. This will be based on the Director’s judgment as to the degree of the immediate or future supply shortage. Table 5.3 below indicates the goal in demand reduction of each shortage stage. A combination of voluntary and mandatory measures would be undertaken to reduce water usage to meet the reduction goals in the event of shortages. Table 5.2 describes the conditions used as a guide for declaring each stage of shortage. Table 5.3 - Guide for Declaring Shortage Stage
Stage Condition I • Below average rainfall in the previous 12-24 months
• 20 percent or more of municipal wells out of service • Warm weather patterns typical of summer months
II • Below average rainfall in the previous 24-36 months • Prolonged periods of low water pressure • 20 percent or more of municipal wells out of service • Warm weather patterns typical of summer months
III • Below average rainfall in the previous 36 months • Prolonged periods of low water pressure • 20 percent or more of municipal wells out of service • Warm weather patterns typical of summer months

CITY OF KERMAN 2010 URBAN WATER MANAGEMENT PLAN
Table 5.4 - Water Shortage Contingency Plan
STAGE WATER SUPPLY CONDITION % SHORTAGE VOLUNTARY/MANDATORY
PROHIBITION PENALTIES
All conditions in City's water wasting Ordinance (See App. A) included but not limited to watering schedule for odd and even number (see App. B attachment A) , outdoor watering must be use through hose and attended, or manually control, no street washing, no wasting water intentionally, restriction on carwash and swimming pool
Declare water shortage alert through mass mailing, public announcement and notice publish at least 3 consecutive time. Stage designated shall become effective immediately
Volunteer water conservation encourage
Continue public awareness and water conservation education message through TV, bill insert, newspaper and school
All require in Stage I remain in effect
Mandatory water use reductionCarwash allow at commercial establishmentLandscape (except residential) to eliminate watering of ornamental turf, water only actively used turf no more twice per week, trees and shrubs may be watered only a hand held hose or drip irrigation systemsResidential landscapes twice per week using only hand held hoseLimit or prohibit pool and ornamental fountain refill
All require in Stage I & II remain in effect
No landscape irrigationNon-portable water or reclaim on construction siteNo new connection service
Critical Shortage Potential 35%-50% Same as Stage IIII
II Moderate Shortage Potential
20%-35% Same as Stage I
I Minor Shortage Potential 10%-20%
3 warning citations within 12 months install water meter on premises at violator's expense, if meter exist on premises a $30 fine on third violation and for each additional violation
14
CITY OF KERMAN 2010 URBAN WATER MANAGEMENT PLAN
15
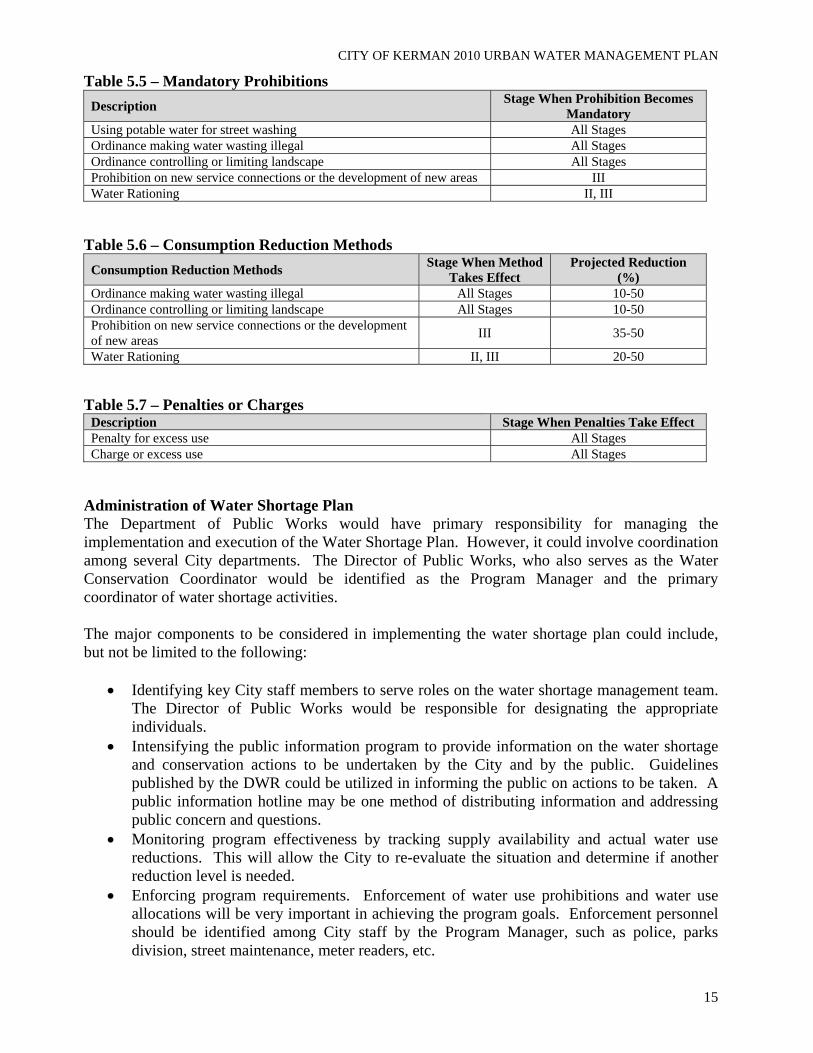
Table 5.5 – Mandatory Prohibitions Description Stage When Prohibition Becomes
Mandatory Using potable water for street washing All Stages Ordinance making water wasting illegal All Stages Ordinance controlling or limiting landscape All Stages Prohibition on new service connections or the development of new areas III Water Rationing II, III
Table 5.6 – Consumption Reduction Methods
Consumption Reduction Methods Stage When Method Takes Effect
Projected Reduction (%)
Ordinance making water wasting illegal All Stages 10-50 Ordinance controlling or limiting landscape All Stages 10-50 Prohibition on new service connections or the development of new areas III 35-50
Water Rationing II, III 20-50 Table 5.7 – Penalties or Charges
Description Stage When Penalties Take Effect Penalty for excess use All Stages Charge or excess use All Stages
Administration of Water Shortage Plan The Department of Public Works would have primary responsibility for managing the implementation and execution of the Water Shortage Plan. However, it could involve coordination among several City departments. The Director of Public Works, who also serves as the Water Conservation Coordinator would be identified as the Program Manager and the primary coordinator of water shortage activities. The major components to be considered in implementing the water shortage plan could include, but not be limited to the following:
• Identifying key City staff members to serve roles on the water shortage management team. The Director of Public Works would be responsible for designating the appropriate individuals.
• Intensifying the public information program to provide information on the water shortage and conservation actions to be undertaken by the City and by the public. Guidelines published by the DWR could be utilized in informing the public on actions to be taken. A public information hotline may be one method of distributing information and addressing public concern and questions.
• Monitoring program effectiveness by tracking supply availability and actual water use reductions. This will allow the City to re-evaluate the situation and determine if another reduction level is needed.
• Enforcing program requirements. Enforcement of water use prohibitions and water use allocations will be very important in achieving the program goals. Enforcement personnel should be identified among City staff by the Program Manager, such as police, parks division, street maintenance, meter readers, etc.
CITY OF KERMAN 2010 URBAN WATER MANAGEMENT PLAN
16
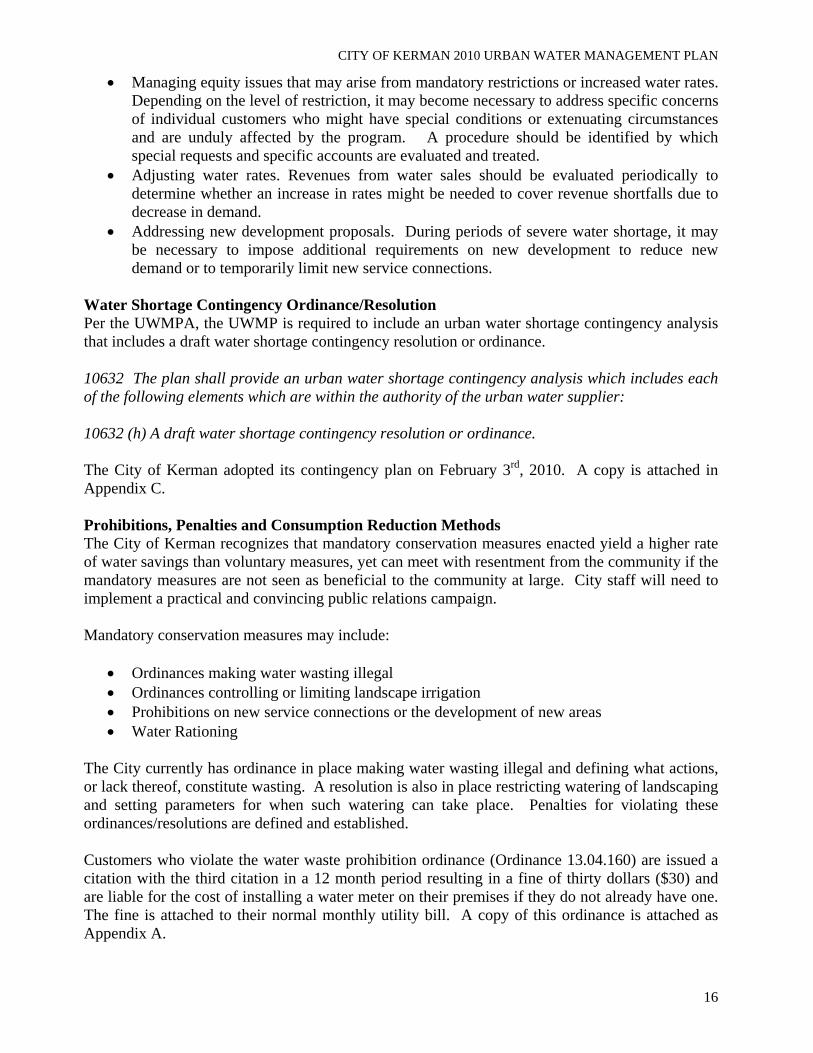
• Managing equity issues that may arise from mandatory restrictions or increased water rates. Depending on the level of restriction, it may become necessary to address specific concerns of individual customers who might have special conditions or extenuating circumstances and are unduly affected by the program. A procedure should be identified by which special requests and specific accounts are evaluated and treated.
• Adjusting water rates. Revenues from water sales should be evaluated periodically to determine whether an increase in rates might be needed to cover revenue shortfalls due to decrease in demand.
• Addressing new development proposals. During periods of severe water shortage, it may be necessary to impose additional requirements on new development to reduce new demand or to temporarily limit new service connections.
Water Shortage Contingency Ordinance/Resolution Per the UWMPA, the UWMP is required to include an urban water shortage contingency analysis that includes a draft water shortage contingency resolution or ordinance. 10632 The plan shall provide an urban water shortage contingency analysis which includes each of the following elements which are within the authority of the urban water supplier: 10632 (h) A draft water shortage contingency resolution or ordinance. The City of Kerman adopted its contingency plan on February 3rd, 2010. A copy is attached in Appendix C. Prohibitions, Penalties and Consumption Reduction Methods The City of Kerman recognizes that mandatory conservation measures enacted yield a higher rate of water savings than voluntary measures, yet can meet with resentment from the community if the mandatory measures are not seen as beneficial to the community at large. City staff will need to implement a practical and convincing public relations campaign. Mandatory conservation measures may include:
• Ordinances making water wasting illegal • Ordinances controlling or limiting landscape irrigation • Prohibitions on new service connections or the development of new areas • Water Rationing
The City currently has ordinance in place making water wasting illegal and defining what actions, or lack thereof, constitute wasting. A resolution is also in place restricting watering of landscaping and setting parameters for when such watering can take place. Penalties for violating these ordinances/resolutions are defined and established. Customers who violate the water waste prohibition ordinance (Ordinance 13.04.160) are issued a citation with the third citation in a 12 month period resulting in a fine of thirty dollars ($30) and are liable for the cost of installing a water meter on their premises if they do not already have one. The fine is attached to their normal monthly utility bill. A copy of this ordinance is attached as Appendix A.

CITY OF KERMAN 2010 URBAN WATER MANAGEMENT PLAN
17
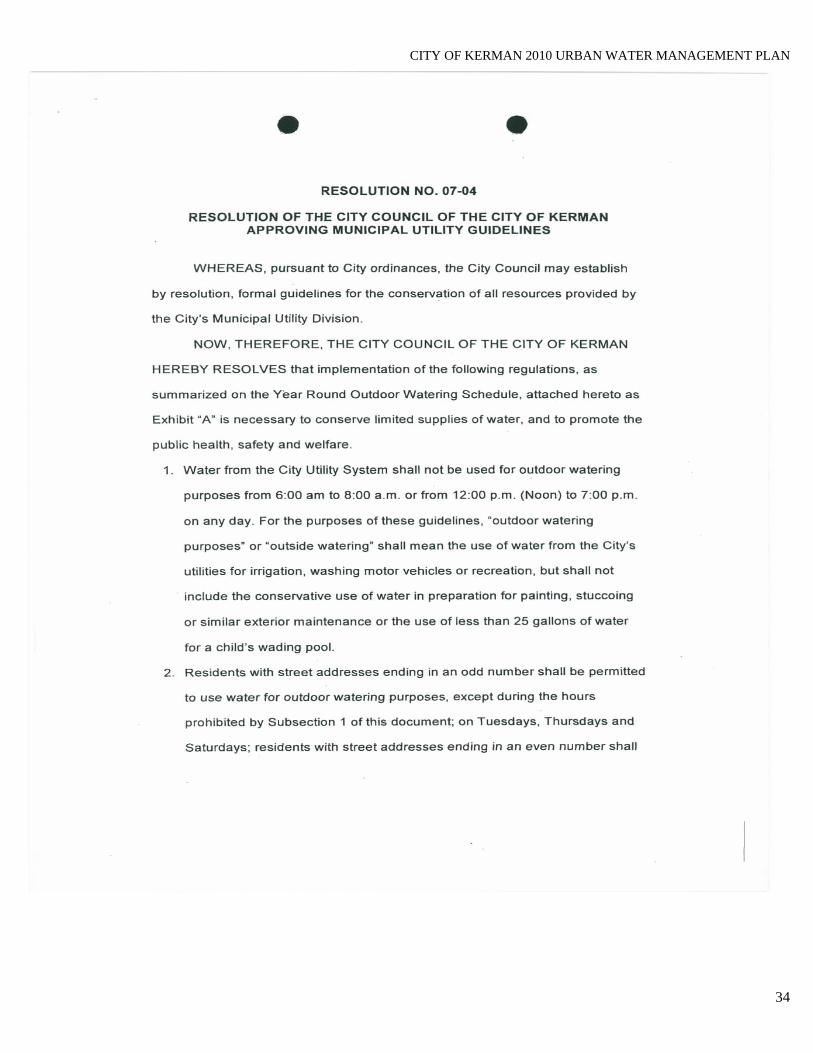
Similar penalties result from violation of the resolution (Res. No. 07-04) restricting landscape irrigation. A copy of this Resolution is attached as Appendix B. Review Process Any customer that has been assessed a penalty for violation of Ordinance 13.04-160 or Resolution No. 07-04 or believes that the provisions of the Ordinance and/or Resolution will cause unnecessary hardship or harm may appeal to the Program Manager. Should the Program Manager not provide satisfactory relief, he will inform the City Council of the issue in writing so that a public hearing can be held. Upon conclusion of the hearing, Council will present its findings and the resulting decision will be final. Revenue Impact Analysis of Reduced Sales The majority of operating costs for most water agencies are fixed rather than a function of the amount of water sold. As a result, when significant conservation programs are implemented, it is frequently necessary to raise water rates because the revenue generated is based on lower consumption while the revenue required is fixed. Table 7.3 indicates the percentages by which rates are to be increased based on the shortage stage declared. Table 5.8 – Water Rate Increases
Stage Rate Adjustment I 25 percent increase over pre-shortage rates II 50 percent increase over pre-shortage rates III 100 percent increase over pre-shortage rates End of Shortage *15 percent increase in pre-shortage rates
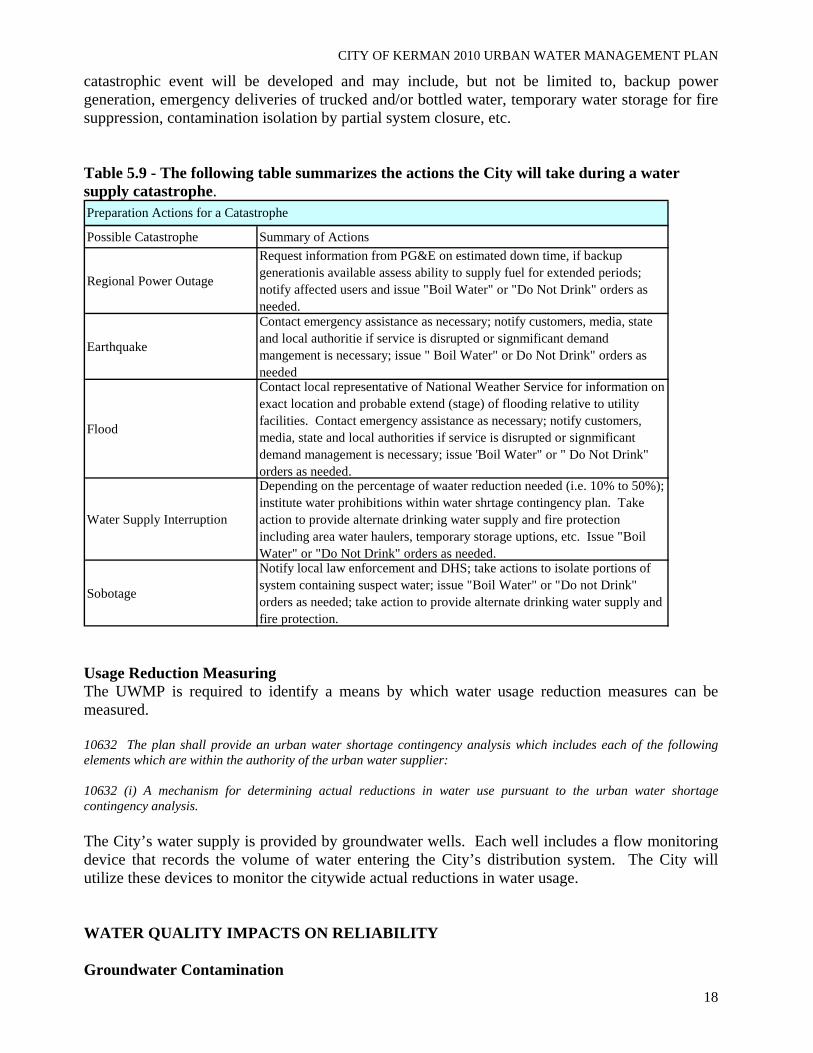
* This rate increase in implemented based on historical information from communities that experienced water shortage and found that consumption rate (gpcd) did not return to pre-shortage levels. In anticipation of reduced sales, the City should be prepared for one year at 115 percent of the pre-shortage rates. This rate increase should be re-evaluated every two years. Catastrophic Water Supply Interruption Plan The UWMPA requires the urban water shortage contingency plan to address a catastrophic interruption of water supply. 10632 The plan shall provide an urban water shortage contingency analysis which includes each of the following elements which are within the authority of the urban water supplier: 10632 (c) Actions to be undertaken by the urban water supplier to prepare for, and implement during, a catastrophic interruption of water supplies including, but not limited to, a regional power outage, an earthquake, or other disaster. Even though the City primary source of water come from the groundwater, catastrophic event such as regional power outage, an earthquake, major fire emergencies, sabotage or flooding can reduced water supplies or interrupted services. The Public Works Director, acting as the Program Manager, will assemble and oversee a water shortage management team that will include City staff members from public works, fire protection, planning, health, and emergency services. Actions and procedures for implementation during a
CITY OF KERMAN 2010 URBAN WATER MANAGEMENT PLAN
catastrophic event will be developed and may include, but not be limited to, backup power generation, emergency deliveries of trucked and/or bottled water, temporary water storage for fire suppression, contamination isolation by partial system closure, etc. Table 5.9 - The following table summarizes the actions the City will take during a water supply catastrophe.
Possible Catastrophe Summary of Actions
Regional Power Outage
Request information from PG&E on estimated down time, if backup generationis available assess ability to supply fuel for extended periods; notify affected users and issue "Boil Water" or "Do Not Drink" orders as needed.
Earthquake
Contact emergency assistance as necessary; notify customers, media, state and local authoritie if service is disrupted or signmificant demand mangement is necessary; issue " Boil Water" or Do Not Drink" orders as needed
Flood
Contact local representative of National Weather Service for information on exact location and probable extend (stage) of flooding relative to utility facilities. Contact emergency assistance as necessary; notify customers, media, state and local authorities if service is disrupted or signmificant demand management is necessary; issue 'Boil Water" or " Do Not Drink" orders as needed.
Water Supply Interruption
Depending on the percentage of waater reduction needed (i.e. 10% to 50%); institute water prohibitions within water shrtage contingency plan. Take action to provide alternate drinking water supply and fire protection including area water haulers, temporary storage uptions, etc. Issue "Boil Water" or "Do Not Drink" orders as needed.
Sobotage
Notify local law enforcement and DHS; take actions to isolate portions of system containing suspect water; issue "Boil Water" or "Do not Drink" orders as needed; take action to provide alternate drinking water supply and fire protection.
Preparation Actions for a Catastrophe
Usage Reduction Measuring The UWMP is required to identify a means by which water usage reduction measures can be measured. 10632 The plan shall provide an urban water shortage contingency analysis which includes each of the following elements which are within the authority of the urban water supplier: 10632 (i) A mechanism for determining actual reductions in water use pursuant to the urban water shortage contingency analysis. The City’s water supply is provided by groundwater wells. Each well includes a flow monitoring device that records the volume of water entering the City’s distribution system. The City will utilize these devices to monitor the citywide actual reductions in water usage.
WATER QUALITY IMPACTS ON RELIABILITY Groundwater Contamination
18

CITY OF KERMAN 2010 URBAN WATER MANAGEMENT PLAN
19
Currently, one City well has produced high uranium readings and has been on stand-by status. It production capabilities are approximately 1,500 gpm. However this has not been factored into previous figures and tables regarding current or projected production. All other City wells continuously meet minimum standard requirements for domestic water quality and remain online.
Water Service Reliability Current and projected water supply and demand are compared in tables 5.10 through 5.12 and would indicate that even in years with supply reductions of up to 60%, there would be enough supply to provide service and meet projected demand. The calculated Interim Urban Water Use Target is implemented in year 2020 and the calculated Urban Water Use Target is implemented in years 2025 and 2030. Table 5.10 - Projected Normal Water Year Supply - (AFY)
2015 2020 2025 2030 Supply 11,130 13,065 15,001 15,001 % of Normal Year 100% 100% 100% 100%
Table 5.11 - Projected Normal Water Year Demand - (AFY)
2015 2020 2025 2030 Demand 4,166 3,798 4,299 4,861 % of Year 2005 (3,040 AF) 137% 125% 141% 160%
Table 5.12 - Projected Normal Year Supply and Demand Comparison - (AFY)
2015 2020 2025 2030 Supply Totals 11,130 13,065 15,001 15,001 Demand Totals 4,166 3,798 4,299 4,861 Difference 6,964 9,267 10,702 10,140 Difference as % of Supply 63% 71% 71% 68% Difference as % of Demand 167% 244% 249% 209%
Projected Single-Dry-Year Supply and Demand Comparison In a single dry year, reductions in available groundwater supply are not anticipated. It is expected that well production will be equal in a single dry year to production in a normal water year. The City will, however, carefully manage water supply in any one dry year. Table 5.13 - Projected Single-Dry-Year Water Supply - (AFY)
2015 2020 2025 2030 Supply 11,130 13,065 15,001 15,001 % of Projected Normal 100% 100% 100% 100%
Table 5.14 - Projected Single-Dry-Year Water Demand - (AFY)
2015 2020 2025 2030 Demand 4,166 3,798 4,299 4,861 % of Projected Normal 100% 100% 100% 100%
CITY OF KERMAN 2010 URBAN WATER MANAGEMENT PLAN
20
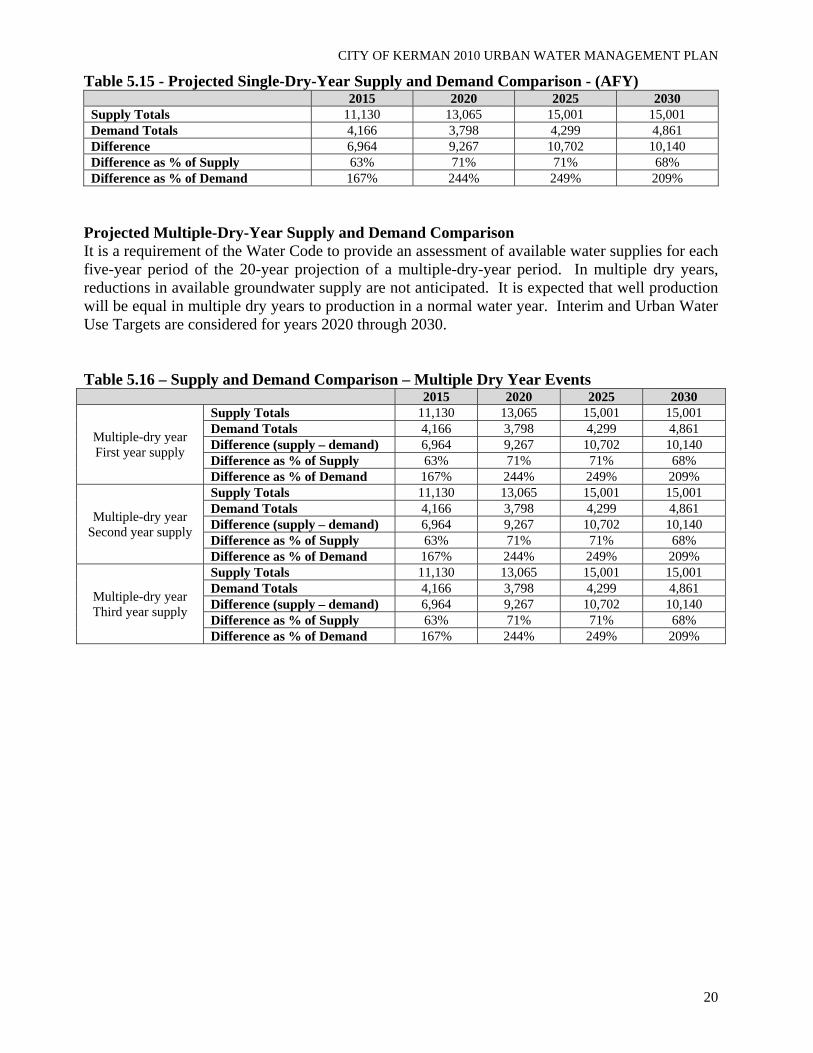
Table 5.15 - Projected Single-Dry-Year Supply and Demand Comparison - (AFY) 2015 2020 2025 2030 Supply Totals 11,130 13,065 15,001 15,001 Demand Totals 4,166 3,798 4,299 4,861 Difference 6,964 9,267 10,702 10,140 Difference as % of Supply 63% 71% 71% 68% Difference as % of Demand 167% 244% 249% 209%
Projected Multiple-Dry-Year Supply and Demand Comparison It is a requirement of the Water Code to provide an assessment of available water supplies for each five-year period of the 20-year projection of a multiple-dry-year period. In multiple dry years, reductions in available groundwater supply are not anticipated. It is expected that well production will be equal in multiple dry years to production in a normal water year. Interim and Urban Water Use Targets are considered for years 2020 through 2030. Table 5.16 – Supply and Demand Comparison – Multiple Dry Year Events 2015 2020 2025 2030
Multiple-dry year First year supply
Supply Totals 11,130 13,065 15,001 15,001 Demand Totals 4,166 3,798 4,299 4,861 Difference (supply – demand) 6,964 9,267 10,702 10,140 Difference as % of Supply 63% 71% 71% 68% Difference as % of Demand 167% 244% 249% 209%
Multiple-dry year Second year supply
Supply Totals 11,130 13,065 15,001 15,001 Demand Totals 4,166 3,798 4,299 4,861 Difference (supply – demand) 6,964 9,267 10,702 10,140 Difference as % of Supply 63% 71% 71% 68% Difference as % of Demand 167% 244% 249% 209%
Multiple-dry year Third year supply
Supply Totals 11,130 13,065 15,001 15,001 Demand Totals 4,166 3,798 4,299 4,861 Difference (supply – demand) 6,964 9,267 10,702 10,140 Difference as % of Supply 63% 71% 71% 68% Difference as % of Demand 167% 244% 249% 209%

CITY OF KERMAN 2010 URBAN WATER MANAGEMENT PLAN
21
6. WATER DEMAND MANAGEMENT MEASURES (DMM’s) The Urban Water Management Plan Act (UWMPA) identifies fourteen Demand Management Measures (DMM’s) for urban water suppliers to address. The fourteen measures are taken from the Best Management Practices (BMP’s) established in the UWMPA and the “Memorandum of Understanding (MOU) Regarding Urban Water Conservation in California.” The City of Kerman is a member of the California Urban Water Conservation Council (CUWCC) and a signatory to the MOU but will address the fourteen DMM’s as outlined by the California Water Code; 10631 (f) Provide a description of the supplier’s water demand management measures. This description shall include all of the following: (1) A description of each water demand management measure that is currently being implemented, or scheduled for implementation, including the steps necessary to implement any proposed measures, including but not limited to all of the following: (A) Water survey programs for single-family residential and multifamily residential customers. (B) Residential plumbing retrofit. (C) System water audits, leak detection, and repair. (D) Metering with commodity rates for all new connections and retrofit of existing connections. (E) Large landscape conservation programs and incentives. (F) High-efficiency washing machine rebate program. (G) Public information programs. (H) School education programs. (I) Conservation programs for commercial, industrial, and institutional accounts. (J) Wholesale agency programs. (K) Conservation pricing. (L) Water conservation coordinator. (M) Water waste prohibition. (N) Residential ultra-low-flush toilet replacement programs. For each of the fourteen DMM’s, this UWMP will describe the management measure including if and how it is being implemented and monitored by the City. DMM A: Water Survey Programs for Single and Multifamily Residential Customers Implementation Description Retail water agencies are to provide a water conservation survey, water efficiency suggestions and interior and exterior inspections. Provide plumbing retrofit and improvement recommendation. The City has begun a city-wide residential and commercial retro-fit water meter installation program. Currently, all new construction is required to install meters and Ultra-Low Flush Toilets (ULFT). Installation and implementation of a new monitoring software program has accompanied the retro-fit program. The monitoring software not only records usage by volume for each account but detects leaks by flagging accounts that do not record a 1-hour period with zero flow. City personnel then contact the customer to aid in diagnosing and repairing the leak(s). Implementation Schedule The program started January 1, 2010, and it is estimated the City will have installed 100% of the meters by January 1, 2015. Currently, the City does not have a record of the number of accounts

CITY OF KERMAN 2010 URBAN WATER MANAGEMENT PLAN
that have been flagged for possible leaks or how many surveys have been performed. In the future, the City intends to keep thorough record of the assistance provided to the customers. DMM B: Residential Plumbing Retrofit Implementation Description The City is required to identify residences constructed prior to 1992 elligible to be retrofit with low-flow showerheads, toilet flappers, faucet aerators and others fixtures with their low flow counterparts. Currently there are 1280 single-family and 20 multi-family residences that would benefit from this implementation. However, the City does not currently have a program to retroactively replace plumbing fixtures and appliances for residential customers. Cost/Benefit Analysis The cost/benefit analysis assumed that retrofitting a single family and multi-family residence will cost an estimated $300/unit1 and that it will take approximately six years to complete the retrofit. The total annual water usage for year 2010 was 1,367.3 million gallons. By implementing this DMM the City assumed the new parts will reduced the water usage/leakage by 20%. Table 6.1 - B/C Residential Plumbing Retrofit
Footnotes:
Total Costs $390,000Total Benefits (yr) $80,300
Discount Rate 6.40%B/C 0.21
Time Horizon (yr) 6Cost of Water (AF) $276
Water Saving (AFY) 291
Reisdential Plumbing Retrofit Cost Effectiveness Summary
1Base on study done by similar City, City of San Joaquin. The B/C ratio for this DMM is less than 1.0. It does not benefit the City of Kerman to implement this program at present time. Future Schedule When more financing becomes available, the City should consider implementing this DMM. The City of Kerman is one of the fastest growing cities in California. The water demand will likely increase as the City continues to expand. DMM C: System Water Audits, Leak Detection, and Repair Implementation Description A Water Audit is a process of reviewing water use throughout a water system in order to quantify the volume of water not accounted for by the metering system of the water customers, which is typically the difference between metered well production, in the case of the City of Kerman, and metered usage on a system-wide basis.
22

CITY OF KERMAN 2010 URBAN WATER MANAGEMENT PLAN
Implementation Schedule The City monitors its water mains during daily activities. City staff observes the condition of the pavement in places where water mains are known to be located. Detection of leaks in the water system is typically observed through localized deterioration of pavement adjacent to the problem water main. The City will conduct formal water audits of the distribution system starting 2015 when all of the meters are expected to be installed at all the residences. Methods of Evaluating Effectiveness The City staff will monitor the total well production and customer meter readings daily. Each month the City staff will determine the meter readings as a percentage of well production. The loss should be maintained at 10% maximum. If the loss percentages exceed 10%, the City should determine where the loss has originated and rectify the problem immediately. DMM D: Metering with Commodity Rates Implementation Description This DMM requires water meters for all new construction, the establishment of a retrofit program for existing un-metered connections, and billing by volume of use. The City has established commodity rates that became effective September 1, 2010. For customers that were un-metered (Flat Rate), the fee rate increased from $24.55 to $26.22; an increase of $1.67, based on an estimate of approximately 19,000 gallons per average household. The rate for previously metered customers increased from $24.55 to $24.97, an increase of $0.42, based on usage of 16,000 gallons per average household. The commodity fee rates vary widely, from $22.27 to $40.27 (Table 6.2) for residential families depending on usage.
Table 6.2 - City of Kerman Water Service Commodity Rates
$27.67 Single-Family Residential (per customer)$22.32 Multi-Family Residential (per unit)$27.67 Commercial (per account)
METER RATE $0.765 per 1000 Gallon$13.14 3/4" Meter$20.46 1" Meter$38.74 1.5" Meter$89.94 2" Meter
$166.75 3" Meter$404.10 4" Meter$550.78 6" Meter
TYPE OF SERVICE CONNECTION MONTHLY CHARGE
METER SERVICE CONNECTION MONTHLY BASE CHARGEa
NON-METERED RATES
Footnotes: aApply to metered residential, commercial, industrial, institutional and landscape.
23

CITY OF KERMAN 2010 URBAN WATER MANAGEMENT PLAN
24
Implementation Schedule The City of Kerman is currently executing a retrofit water meter installation program and has been requiring meter installation on all new construction as state law has mandated. According to 2010 records provided by the City, there are 3,735 service connection accounts and out of those, 2,209 accounts are metered. Effective September 1, 2010, all metered accounts are billed according to their water usage. Un-metered accounts continue to be billed a flat rate until such time that a meter is installed. The number of meters being installed will vary year by year, depending on availability of funds. However, it is planned that by January 1, 2020 all customers will have meters. Methods of Evaluating Effectiveness Currently, it would be difficult to determine the water usage of metered customers as compared to un-metered customers, until all customers are metered. The City has been keeping historical data of water usage by un-metered customers. When all customers are ultimately fitted with meters, the City can compare the water usage and be able to determine how much water is being saved. This will also help reduce the water demand. DMM E: Landscape Water Conservation and Incentives Implementation Description This DMM calls for agencies to assign reference evapotranspiration-based (ETo) water budgets to accounts with dedicated irrigation meters and provide water-use audits to accounts with mixed-use meters. Targeted user types are multi-family complexes, parks, golf-courses, etc. if not already monitored by the City. Implementation Schedule The City currently has 22 large landscape accounts (not including parks) that are not metered and 146 commercial, Industrial and Institutional accounts that are metered. However, the City does not closely monitor the water usage for large landscape areas such as parks because the City is the owner/operator of these recreational facilities. The City plans to perform irrigation system checks on recreational facilities and measure areas for all customers with large landscapes within the next five years. The City will keep data of their water usage to assist those customers in determining the most efficient way to minimize their individual water usage. Methods of Evaluating Effectiveness By keeping historical data, reviewing water bills, promoting education, and assisting customers who exceed their water usage allowance, the City will be able to determine how effectively the program is working. Conservation Savings By implementing this DMM the City is expected to reduce, at a minimum, 15% of its water consumption. If this program fails to produce this result, the City will need to revisit the methods and procedures.
CITY OF KERMAN 2010 URBAN WATER MANAGEMENT PLAN
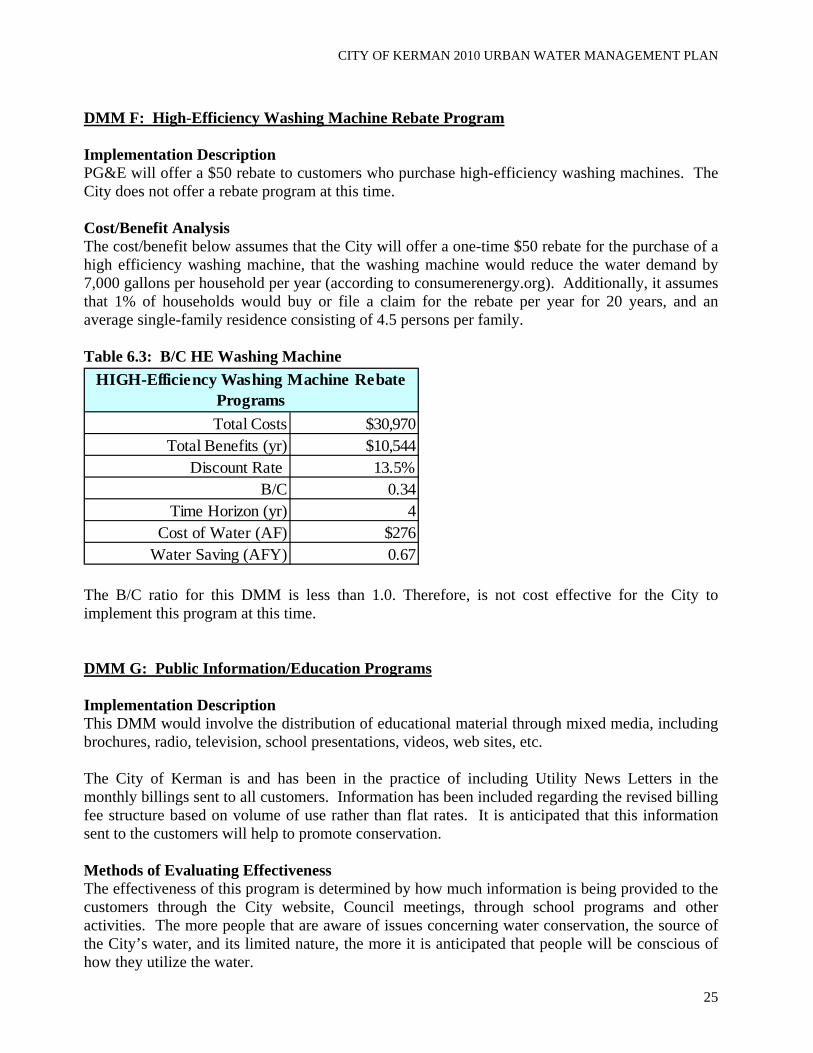
DMM F: High-Efficiency Washing Machine Rebate Program Implementation Description PG&E will offer a $50 rebate to customers who purchase high-efficiency washing machines. The City does not offer a rebate program at this time. Cost/Benefit Analysis The cost/benefit below assumes that the City will offer a one-time $50 rebate for the purchase of a high efficiency washing machine, that the washing machine would reduce the water demand by 7,000 gallons per household per year (according to consumerenergy.org). Additionally, it assumes that 1% of households would buy or file a claim for the rebate per year for 20 years, and an average single-family residence consisting of 4.5 persons per family. Table 6.3: B/C HE Washing Machine
Total Costs $30,970Total Benefits (yr) $10,544
Discount Rate 13.5%B/C 0.34
Time Horizon (yr) 4Cost of Water (AF) $276
Water Saving (AFY) 0.67
HIGH-Efficiency Washing Machine Rebate Programs
The B/C ratio for this DMM is less than 1.0. Therefore, is not cost effective for the City to implement this program at this time. DMM G: Public Information/Education Programs Implementation Description This DMM would involve the distribution of educational material through mixed media, including brochures, radio, television, school presentations, videos, web sites, etc. The City of Kerman is and has been in the practice of including Utility News Letters in the monthly billings sent to all customers. Information has been included regarding the revised billing fee structure based on volume of use rather than flat rates. It is anticipated that this information sent to the customers will help to promote conservation. Methods of Evaluating Effectiveness The effectiveness of this program is determined by how much information is being provided to the customers through the City website, Council meetings, through school programs and other activities. The more people that are aware of issues concerning water conservation, the source of the City’s water, and its limited nature, the more it is anticipated that people will be conscious of how they utilize the water.
25

CITY OF KERMAN 2010 URBAN WATER MANAGEMENT PLAN
26
DMM H: School Education Programs Implementation Description This management measure facilitates school educational programs including discussion on the natural water cycle, the reclamation process, and the encouragement and promotion of conservation principles. Periodically, City staff makes presentations at the City’s elementary schools to inform students about the City’s water system. These presentations are made upon request by the individual school or the school district. One item discussed is the water cycle, including where the City’s water originates, water conservation topics, and how the City’s water is conserved through reclamation of treated wastewater. Methods of Evaluating Effectiveness The effectiveness of this program will be determined by how many schools/classes include the City’s presentation as part of their science curriculum. The City will keep a record of the number of presentations made, hand out pamphlets, survey students and educators for the materials they are interested in and would like to know more about. The materials included in the presentation and pamphlet should follow state education framework requirements. Conservation Savings The City has not determined if implementing this DMM would noticeably produce greater water conservation, but the City believes that these presentations help encourage students and parents alike to conserve water or at least become more aware of how they utilize water. DMM I: Commercial and Industrial and Institutional Conservation Programs Implementation Description The City currently has a water conservation ordinance and program for all customers (see Appendices). The City does not currently have a program that will provide a water use survey or incentives such as rebates for commercial, industrial, and institutional accounts to conserve water. There are 199 commercial, 16 institutional, and 12 industrial accounts within the City. These accounts are either currently metered and charged in accordance with the quantity of water used or are on a flat rate to be converted to usage-based metering and billing by 2015. Cost/Benefit Analysis The B/C analysis below made several assumptions: The cost of City staff performing surveys for commercial and institutional accounts would cost approximately $500 per customer, and for industrial accounts, approximately $1000 per customer. Based on information from the California Water Resource website, water system leakage constitutes on average about 10% of total loss of water supplied by the provider. Currently, the City has approximately 225 commercial/institutional accounts, and 12 industrial accounts.

CITY OF KERMAN 2010 URBAN WATER MANAGEMENT PLAN
Table 6.4: B/C Conservation Program for Commercial/Industrial and Institution
Total Costs $77,000Total Benefits (yr) $48,290
Discount Rate 16.50%B/C 0.63
Time Horizon (yr) 2Cost of Water (AF) $294
Water Saving (AFY) 165
Conservation Programs for Commerical, Industrail & Institutional
The B/C ratio for this DMM is less than 1.0; it is not cost effective for the City to implement this procedure at this time. Methods of Evaluating Effectiveness After all meters are installed, the City should consider keeping record of all CII account water usage to assist the customers in water conservation by providing billing comparisons from month to month and/or leakage surveys upon request. DMM J: Wholesale Agency Programs This applies to wholesale agencies, defining their role in terms of financial, technical, and programmatic assistance to retail agencies. The City of Kerman is not a wholesale agency. DMM K: Conservation Pricing Implementation Description The City of Kerman has adopted new commodity rates for un-metered and metered customers, which took affect on September 1, 2010. By 2020 all the customers should be metered and the flat rate will be eliminated. The tables below show the detailed breakdown for both metered and un-metered accounts for the previous rate schedule and as well as the price increase. The metered fee rate is heavily based on the water usage. Table 6.5: Commodity Fee Rate UNMETERED (FLAT RATE) FOR RESIDENTIAL DESCRIPTION 2009 2010
WATER $24.55 $26.22SEWER $23.50 $24.01STORM DRAIN $1.26 $1.35
MONTHLY CHARGE (BASED ON 19,000 GAL. USUAGE)
27

CITY OF KERMAN 2010 URBAN WATER MANAGEMENT PLAN
Table 6.6: B/C Breakdown of Commodity Fee Rate METERED CUSTOMERS
GALLONS OF WATER USED
2009 2010 X1000$22.27 10$24.97 16$26.32 19$33.97 36$40.27 50$32.71 10$35.41 16$39.01 24$44.11 36$50.71 50
$134.50 16$138.10 24$143.50 36$149.80 50$172.30 100$404.10 24$415.80 50$438.30 100$483.30 200$843.30 1000
SEWER $24.55 $24.97STORM DRAIN 1.25 1.35
MONTHLY CHARGE
WATER
DESCRIPTION
3/4" METER
1" METER
2" METER
4" METER
$24.55
Methods of Evaluating Effectiveness The price rate based on the water usage will encourage customer from wasting water, give customer incentives to practice water conservation. However conservation is limited by people basic need for daily function. Implementation Schedule Water conservation due to pricing increases and changes are difficult to realize at present time since the new meters are not 100% installed and the City has only recently implemented the new commodity rates at the time that this UWMP was prepared. Once the planned meter installation is complete, the City can more precisely monitor system-wide usage, rather than a small percentage of it as meters are added each year, and offer more effective assistance to customers that grossly exceed the estimated average usage to help them stay within range and budget. DMM L: Water Conservation Coordinator
28

CITY OF KERMAN 2010 URBAN WATER MANAGEMENT PLAN
The Water Conservation Coordinator for the City of Kerman, unofficially, is Ken Moore, the Director of Public Works. As Public Works Director, he is responsible for the efficient operation of the water system. In carrying out these duties, water conservation and water waste issues are addressed on a daily basis. DMM M: Water Waste Prohibition The City of Kerman has passed an ordinance prohibiting water waste. A copy of this Ordinance is attached as Appendix B. Any consumer allowing water to be wasted is issued a warning citation. Any violator with three warnings issued within a twelve-month period will be fined and have that fine added to the monthly utility charges applicable to the property as defined by the ordinance. DMM N: Ultra-Low-Flush Toilet Replacement Program Implementation Description Beginning January 1, 1992 California State legislation required all new construction to install Ultra-Low-Flush Toilet and that the ULFT manufactured after January 1, 1994 must use no more than 1.6 gallons per flush.. Subsequently, homes constructed since 1994 in the City of Kerman have installed ULFT system. The City does not currently have a rebate program for toilet replacements on homes built prior to 1994, of which there are currently 1,292 single family homes and 8 multi-family homes within the City of Kerman. Cost/Benefit Analysis The B/C analysis below assumes that the pre-1992 toilet uses 3.5 gallons per flush, there are 4 people in an average household, each person in the house flushes approximately 5 times on a daily basis, and that the sewer and water combined cost is $3.23 per 1,000 gallons. Table 6.7: Ultra-Low-Flush Toilet
Total Costs $356,720Total Benefits (yr) $62,080
Discount Rate 1.25%B/C 0.17
Time Horizon (yr) 6Cost of Water (AF) $1,052
Water Saving (AFY) 59
ULFT Cost Effectiveness Summary
The B/C ratio for this DMM is less than 1.0; it is not cost effective for the City to implement this procedure at this time. Implementation Schedule The City will not be implementing this DMM at this time.
29

CITY OF KERMAN 2010 URBAN WATER MANAGEMENT PLAN
30
APPENDIX A Public Notice
And City of Kerman Water Wasting Ordinance
CITY OF KERMAN 2010 URBAN WATER MANAGEMENT PLAN
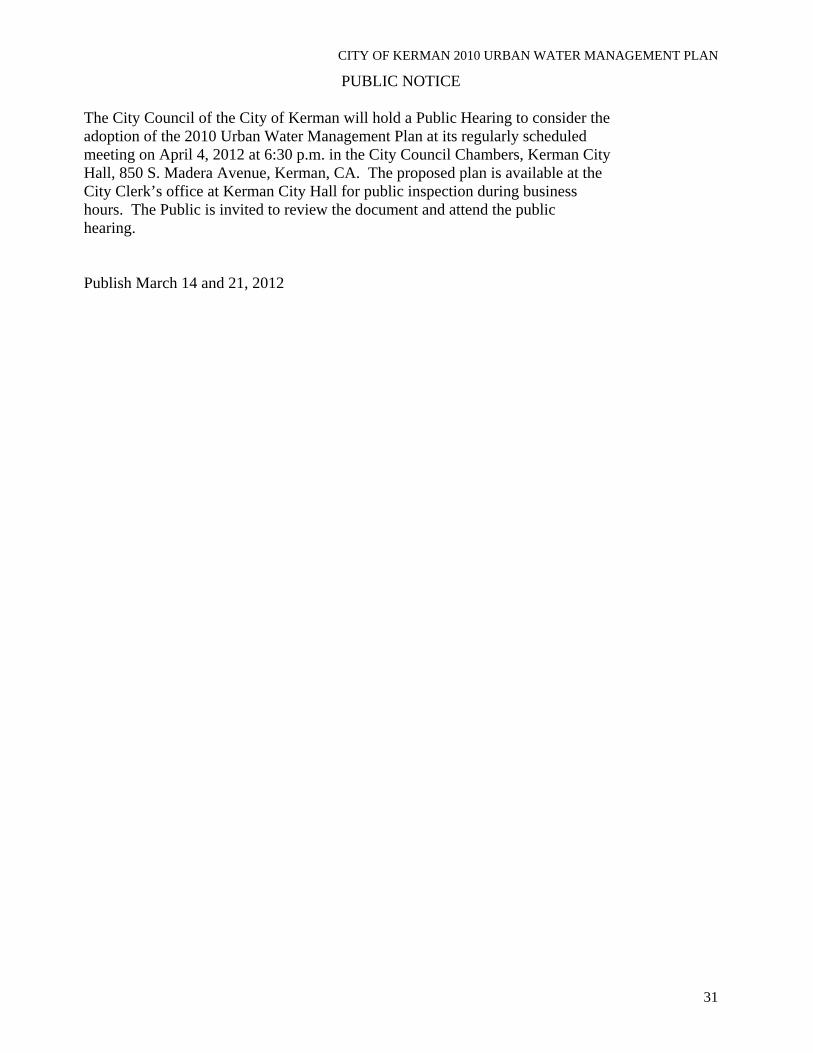
PUBLIC NOTICE
The City Council of the City of Kerman will hold a Public Hearing to consider the adoption of the 2010 Urban Water Management Plan at its regularly scheduled meeting on April 4, 2012 at 6:30 p.m. in the City Council Chambers, Kerman City Hall, 850 S. Madera Avenue, Kerman, CA. The proposed plan is available at the City Clerk’s office at Kerman City Hall for public inspection during business hours. The Public is invited to review the document and attend the public hearing. Publish March 14 and 21, 2012
31

CITY OF KERMAN 2010 URBAN WATER MANAGEMENT PLAN
32
From the City of Kerman Municipal Code
13.04.160 Water wasting violations. A. In the use of water supplied by the city, no person shall do or permit any of the following:
1. Use of water through a hose, pipe or other discharge for the purpose of watering gardens, trees, lawns, flowers, or other plants or other irrigation purposes without the use of a restricting nozzle or sprinkling device or unless such use is manually controlled and attended; or 2. Keep, maintain, operate or use any water connection, hose, faucet, hydrant, pipe, outlet or plumbing fixture which is not tight and free from leakage; or 3. Willfully or negligently waste water; or 4. Allow any water supplied by the city to flow from the premises of the use onto other premises or onto the public streets or thoroughfares in excessive or unusual amount; or 5. Flood any part of the user’s premises or the premises of another; or 6. Sprinkle or irrigate any yard, ground, premises or vegetation unless the watering device used is controlled by on automatic shutoff device or a person is in immediate attendance of the hose or water device.
B. Other outside use of water. Outside use of water for purposes other than irrigation is allowable during any hour of the day and within the following guidelines:
1. Washing the house windows and vehicles is permissible if a water flow control device is attached to the end of the hose and water does not waste excessively onto the street or adjacent property; 2. Nonprofit organizations may conduct car wash fundraisers under the same guidelines; 3. Washing down of exterior walls of buildings is permissible only for cleaning purposes in preparation for painting, stucco or other maintenance; 4. Portable wading pools are allowed with adult supervision and no waste or water; 5. No continuous flow of water is permissible for recreation activity; 6. Businesses which sell ready-to-eat foods, drinks or automotive fuels may use water for health and sanitary cleanup purposes only when mopping is inadequate; 7. Wash down of driveways, parking lots, walks or paved areas at businesses or residences is prohibited during April through October; 8. Wash down of street and gutters is prohibited year-round. 9. Swimming pools may occasionally be emptied for maintenance which cannot be accomplished when full of water. A pool may not be emptied and refilled more than twice between May 1 and September 30; more frequent refilling will be a violation and subject to the same citations or surcharges in effect for other water waste. Pools must be equipped with filtration systems in good working order.
C. Other water and energy conservation measures (such as: hours and days for watering of lawns and landscaping; restrictions on time of day for washing of automobiles including but not limited to, home and commercial car washes; or restrictions on industrial water usage) may be imposed in time of extreme emergency, shortage or demand, as set forth from time to time by resolution of the city council of the city of Kerman.
D. Violations of this section shall be termed "water wasting violations". Any person violating this section shall be issued a warning citation. Any person receiving three warning citations within twelve consecutive calendar months will be required by a resolution and an order of the director of public works to install a water meter on the premises for which city water is requested, at violator’s expense, as a condition precedent to continued water service. Where a water meter already exists upon the premises, any person receiving a third citation within twelve consecutive calendar months shall be subjected to a fine in the amount of thirty dollars for the third violation and for each additional violation. The amount of any fine shall be added to and collected with the utility charges applicable to the property. (Ord. 01-01 § 1 (part), 2001)
CITY OF KERMAN 2010 URBAN WATER MANAGEMENT PLAN
APPENDIX B
City of Kerman Resolution No. 07-04 To Adopt Irrigation Guidelines
33
CITY OF KERMAN 2010 URBAN WATER MANAGEMENT PLAN
34

CITY OF KERMAN 2010 URBAN WATER MANAGEMENT PLAN
35

CITY OF KERMAN 2010 URBAN WATER MANAGEMENT PLAN
36

CITY OF KERMAN 2010 URBAN WATER MANAGEMENT PLAN
37
CITY OF KERMAN 2010 URBAN WATER MANAGEMENT PLAN
APPENDIX C
City of Kerman Council Resolution No. 12-20 To Adopt Water Shortage Contingency Plan
38

CITY OF KERMAN 2010 URBAN WATER MANAGEMENT PLAN
39

CITY OF KERMAN 2010 URBAN WATER MANAGEMENT PLAN
40
CITY OF KERMAN 2010 URBAN WATER MANAGEMENT PLAN
APPENDIX D
Water Shortage Contingency Plan For the City of Kerman
41
CITY OF KERMAN 2010 URBAN WATER MANAGEMENT PLAN
WATER SHORTAGE CONTINGENCY PLAN FOR THE CITY OF KERMAN Section 1. Declaration of Policy. California Water Code Section 375 et. seq. permits public entities that supply water at retail to adopt and enforce a water conservation program to reduce the quantity of water used by the people therein for the purpose of conserving the water supplies of such public entity. The City Council of Kerman (Council) herby establishes a water conservation program pursuant to California Water Code Sections 375 et. seq. based upon the need to conserve water supplies and to avoid or minimize the effects of future storage. Section 2. Findings. The council finds and determines that certain conditions could occur in the City to require that the water sources available be placed to maximum beneficial use to the extent to which they are capable, and that the waste or unreasonable use or unreasonable method of use of water be prevented, and that the conservation of such water be encouraged with a view to the maximum reasonable and beneficial use thereof in the interest of the people and for the public welfare. Section 3. Application. The provisions of this policy shall apply to all water served to persons, customers and property by the City. Section 4. Authorization. The Program Manager (Director of Public Works) or a designated representative is hereby authorized to implement the provisions of this policy as directed by the Council. Additionally, the Program Manager designated representative is herby authorized to make minor and limited exceptions to prevent undue hardship or unreasonable restrictions, provided that water shall not be wasted or used unreasonably and the purpose of this policy can be accomplished. Section 5. Water Conservation Stages. No persons shall knowingly use water or permit the use of water supplied by the City for commercial, industrial, agricultural, governmental or any other purpose in a manner contrary to the provisions of this policy. At no time shall water be wasted or used unreasonably. The following stages shall take effect upon declaration as herein provided: a) Stage 1 - Enforcement Required – Minor Shortage Potential Stage 1 applies during periods that the City determines that water usage should be reduced approximately 10%-20% in order to meet all of the water demands of its customers, either now or in the foreseeable future. Implementation of Stage 1 should result in a minimum of 10% reduction in water use from a base period to be determined at the time of declaration.
42

CITY OF KERMAN 2010 URBAN WATER MANAGEMENT PLAN
b) Stage 2 – Enforcement Required – Moderate Shortage Potential Stage 2 applies during periods when the City determines that water usage should be reduced by approximately 20%-35% in order to meet all of the water demands of its customers now or in the foreseeable future, Implementation of Stage 2 should result in a minimum of 20% reduction in water used from a base period to be determined at the time of declaration. c) Stage 3 – Enforcement Required – Critical Shortage Potential Stage 3 applies during periods when the City determines that water usage should be reduced by approximately 35%-50% in order to meet all of the water demands of its customers now or in the foreseeable future, Implementation of Stage 3 should result in a minimum of 35% reduction in water used from a base period to be determined at the time of declaration. Specific mandated restrictions in water use for Stages 1, 2, and 3 shall be determined by the Council and may include, but not be limited to: 1) Landscape (except residential) – Eliminate watering of ornamental turf areas. Water only actively used turf areas no more than twice per week. Trees and shrubs may be watered only twice per week using a hand-held hose with a positive shutoff nozzle or drip irrigation systems. Use of reclaimed water, however, is exempt. 2) Household and household members (residential landscapes) – Water no more than twice per week using only a hand-held hose with positive shutoff nozzle or drip irrigation systems. Eliminate sprinkler use. 3) Construction Usage – All construction water must be reclaimed or no potable. Issuance of construction meters will be only for testing and disinfection of potable water lines. 4) Development Construction – Prior to the issuance of any building permit, the developer will be required to certify that a reduction (20% for Stage 1, 35% for Stage 2, and 50% for Stage 3) of the projected water usage for that development shall be achieved. Section 6. Implementation of Conservation Stages. The City shall monitor the projected supply and demand for water by its customers on a daily basis. The Program Manager shall recommend to the Council the extent of the conservation required through implementation and/or termination of particular conservation stages in order for the City to prudently plan for and supply water to its customers. Thereafter, the Council may order that the appropriate stage of water conservation be implanted or terminated in accordance with the applicable provisions of this policy. The declaration of any stage shall be done by mass mailing, and a public announcement and notice shall be published a minimum of three (3) consecutive
43

CITY OF KERMAN 2010 URBAN WATER MANAGEMENT PLAN
44
times in a newspaper of general circulation. The stage designated shall become effective immediately upon announcement. Section 7. Violations, Notices, Penalties. The violations of any provisions in this policy are subject to the penalties specified in the Kerman Municipal Code.

CITY OF KERMAN 2010 URBAN WATER MANAGEMENT PLAN
APPENDIX E
City of Kerman Council Resolution No. 12-___ To Adopt 2010 Urban Water Master Plan
45

CITY OF KERMAN 2010 URBAN WATER MANAGEMENT PLAN
46

CITY OF KERMAN 2010 URBAN WATER MANAGEMENT PLAN
47

CITY OF KERMAN 2010 URBAN WATER MANAGEMENT PLAN
48
APPENDIX F
Vicinity Map of the City of Kerman