city of healdsburg
TRANSCRIPT

City of HealdsburgCalifornia
Comprehensive Annual Financial Report
For the Year Ended June 30, 2003


CITY OF HEALDSBURGCOMPREHENSIVE ANNUAL FINANCIAL REPORT
FOR THE YEAR ENDED JUNE 30, 2003
TABLE OF CONTENTS
PageINTRODUCTORY SECTION Number
Transmittal Letter iGFOA Certificate of Achievement ivCSMFO Certificate of Award for Outstanding Financial Reporting vOrganization Chart viList of Elected and Appointed Officials vii
FINANCIAL SECTION
Independent Auditor s Report 1Management s Discussion and Analysis 3Basic Financial Statements:
Government-wide Financial Statements:Statement of Net Assets 15Statement of Activities 16
Fund Financial Statements:Balance Sheet Governmental Funds 18Reconciliation of the Statement of Governmental Funds Balance Sheet to the Statement of Net Assets 21Statement of Revenues, Expenditures, and Changes in Fund Balances-Governmental Funds 22 Reconciliation of the Statement of Revenues, Expenditures, and Changes in Fund Balances of Governmental Funds to the Statement of Activities 25Statement of Net Assets Proprietary Funds 26Statement of Revenues, Expenses, and Changes in Fund Net Assets Proprietary Funds 28Statement of Cash Flows - Proprietary Funds 30Statement of Fiduciary Net Assets Fiduciary Funds 32Statement of Changes in Fiduciary Net Assets Fiduciary Funds 33
Notes to the Basic Financial Statements 34Required Supplementary Information:Budgetary Comparison Schedules Budget and Actual- General Fund 61Combining and Individual Fund Statements and Schedules:Combining Balance Sheet Nonmajor Governmental Funds 64Combining Statement of Revenues, Expenditures, and Changes in Fund Balances Nonmajor Funds 65Combining Balance Sheet Nonmajor Special Revenues 68Combining Statement of Revenues, Expenditures and Changes in Fund Balances Nonmajor Special Revenue Funds 72

Schedule of Revenues, Expenditures, and Changes in Fund Balances Budget and Actual:Gas Tax Special Revenue Fund 76Airport Grant Special Revenue Fund 77Park Fees Special Revenue Fund 78TDA Special Revenue Fund 79Community Redevelopment Agency UDAG Loan Special Revenue Fund 80Area A Lighting and Landscaping District Special Revenue Fund 81Benjamin Way Maintenance District Special Revenue Fund 82Public Safety Special Revenue Fund 83Nonmajor General Debt Service Fund 86Community Redevelopment Agency Debt Service Fund 87Special Assessment Debt Service Fund 88
Combining Statement of Net Assets Nonmajor Enterprise Funds 90Combining Statement of Revenues, Expenses, and Changes In Fund Net Assets Nonmajor Enterprise Funds 92Combining Statement of Cash Flows Nonmajor Enterprise Funds 94Combining Statement of Net Assets Internal Service Funds 98Combining Statement of Revenues, Expenses, and Changes In Fund Net Assets Internal Service Funds 100Combining Statement of Cash Flows Internal Service Funds 102Combining Statement of Fiduciary Net Assets 106Combining Statement of Changes in Fiduciary Net Assets 107
STATISTICAL SECTION
Government-wide Expenses by Program-Current Fiscal Year S-2Government-wide Revenues by Source- Current Fiscal Year S-5Governmental Revenues by Source S-6Governmental Expenditures by Function S-6Property Tax Levies and Collections - Last Ten Fiscal Years S-8Assessed Valuation of Taxable Property - Last Ten Fiscal Years S-9Property Tax Rates - Direct and Overlapping Governments Last Ten Fiscal years S-10Ratio of General Bonded Debt to Assessed Valuation and Per Capita -
Last Ten Fiscal Years S-12Special Assessment Billings and Collections - Last Ten Fiscal Years S-13Computation of Legal Debt Margin S-14Computation of Direct and Overlapping Debt S-15Ratio of Annual Debt Service Expenditures for General Bonded
Debt to Total General Expenditures - Last Ten Fiscal Years S-16Demographic Statistics - Last Ten Years S-17Schedule of Revenue Bond Coverage - Last Ten Fiscal Years S-18Construction, Bank Deposits and Property Value - Last Ten Years S-20Sotoyome Redevelopment Project Area Largest Secured Property
Tax Payers S-22Schedule of Insurance and Surety Bonds S-23Miscellaneous Statistical Information S-24

Other:Schedule of Ten Major Businesses S-25Schedule of Schools Average Daily Attendance - Last Ten Fiscal Years S-27Schedule of Net Income (Loss) -
Water Fund S-28Schedule of Cash Flows - Water Fund S-30Schedule of Water Sold and Revenue per Hundred Cubic Feet S-32Schedule of Net Income (Loss) -
Sewer Fund S-34Schedule of Cash Flows - Sewer Fund S-36Schedule of Net Income (Loss) -
Electrical Fund S-38Schedule of Cash Flows - Electric Fund S-40Schedule of Electric Utility Customers, Sales and Revenue -
Last Ten Fiscal Years S-42Schedule of Electricity Sold and Revenue per Megawatt Hours Last Ten Fiscal Years S-44Schedule of Electricity Purchased - Last Ten Fiscal Years S-46Schedule of Proportional Share - NCPA Debt Service S-48Sotoyome Redevelopment Project Area Taxable Value and Tax
Increments S-50Sotoyome Redevelopment Project Area Tax Increment/Tax Reserves S-52

i
December 31, 2003
To the Honorable Mayor, Members of the City Council, and Citizens of the City of Healdsburg:
We are pleased to submit to you the Comprehensive Annual Financial Report (CAFR) of the City of Healdsburg for the fiscal year ended June 30, 2003. This report is published in accordance with local ordinance and state law requirements that financial statements be presented in conformity with accounting principles generally accepted in the United States of America and audited in accordance with auditing standards generally accepted in the United States of America by a firm of licensed certified public accountants.
For the fiscal year ended June 30, 2003, the City of Healdsburg has complied with recent pronouncements of the Governmental Accounting Standards Board (GASB), including GASB Statement 34. Statement 34 established a new financial reporting model for state and local governments incorporating government-wide financial statements in addition to the customary fund statement presentation. Reconciliations of the fund financial statements to the Statement of Net Assets and Statement of Activities are provided in the financial section of this report.
The new reporting model provides financial report users with a narrative introduction, overview, and analysis to accompany the basic financial statements in the form of Management s Discussion and Analysis (MD&A). This letter of transmittal is designed to complement the MD&A and should be read in conjunction with it. The City of Healdsburg s MD&A can be found in the financial section immediately following the report of the independent auditors.
This report consists of management s representations concerning the finances of the City of Healdsburg. Consequently, management assumes full responsibility for the completeness and reliability of all of the information presented in this report. To provide a reasonable basis for making these representations, management of the City of Healdsburg has established a comprehensive internal control framework that is designed both to protect the government s assets from loss, theft, or misuse and to compile sufficient reliable information for the preparation of the City of Healdsburg s financial statements. Because the cost of internal controls should not outweigh their benefits, the City of Healdsburg s comprehensive framework of internal controls has been designed to provide reasonable rather than absolute assurance that the financial statements will be free from material misstatement. As management, we assert that, to the best of our knowledge and belief, this financial report is complete and reliable in all material respects.
Diehl, Evans & Company, LLP, a firm of licensed certified public accountants, has audited the City of Healdsburg s financial statements. The goal of the independent audit was to provide reasonable assurance that the financial statements of the City of Healdsburg for the fiscal year ended June 30, 2003 are free of material misstatement. The independent audit involved examining, on a test basis, evidence supporting the amounts and disclosures in the financial statements; assessing the accounting principles used and significant estimates made by management; and evaluating the overall financial statement presentation.
CITY OF HEALDSBURGADMINISTRATION
401 Grove StreetHealdsburg, CA 95448-4723
Phone: (707) 431-3317Fax: (707) 431-3321
Visit us at www.ci.healdsburg.ca.us

ii
The independent auditor concluded that there was a reasonable basis for rendering an unqualified opinion that the City of Healdsburg s financial statements for the fiscal year ended June 30, 2003, are fairly presented in conformity with accounting principles generally accepted in the United States of America The independent auditor s report is presented as the first component of the financial section of this report.
The City of Healdsburg was not required to undergo an annual single audit in conformity with the provisions of the Single Audit Act of 1984 and the U.S. Office of Management and Budget s Circular A-133, Audits of State and Local Governments.
CITY OF HEALDSBURG PROFILE
The City of Healdsburg, incorporated in 1867, is located in Sonoma County, the center of California snorth coast premium wine growing region. Healdsburg continues to show strength as a region retail, service and tourist destination.
The City operates under the Council-Manager form of government. Policymaking and legislative authority are vested in the City Council, which consists of a Mayor and a four member Council. The governing council is responsible for the City s ordinances, operating resolutions, adoption of the annual budget, appointing commissions and committees and hiring the City Manager, City Clerk and City Attorney. The City Manager is responsible for implementing the policies, ordinances and directives of the City Council, for overseeing the day-to-day operations of the City and for appointing the Assistant City Manager and the Directors of the City s departments. Council members are elected to four-year terms. Each year the mayor is elected by a majority vote of the City Council.
The City provides a full range of services and activities which is summarized as follows:
General Government Activities Enterprise Activities
Police and fire protection Water Utility, including production andNon-Enterprise capital projects distribution
Sewer Utility, including collection and treatmentof sanitary and storm drain waste water
Redevelopment Activities Electric UtilityPlanning and Building operations
Economic development and Transit operationsbusiness expansion Airport operationsPreservation of low and moderate Meeting Center Enterprise (Villa) andincome housing and neighborhoods School ServicesAssistance toward development of Parks and recreation, including aaffordable housing municipal golf course and poolDowntown revitalization and Maintenance of streets and roadsbusiness retentionProject Area drainage, water andstreet projects
FACTORS AFFECTING FINANCIAL CONDITION
Annual budget. The City of Healdsburg operates on a fiscal year basis, beginning July 1 and ending June 30. The budget is prepared under the supervision of the City Manager and transmitted to the City Council


vi
City of HealdsburgOrganization Chart
City AttorneyKen Wilson
Special ProjectsBenefits AdministrationLabor NegotiationsPersonnelAnimal Shelter Administration
Assistant City ManagerBarbara Jason-white
City ClerkMaria Curiel
Parks & RecreationSenior CenterVilla Meeting CenterMunicipal Pool ContractGolf Course ContractPark PlanningSpecial EventsTourism & PromotionTransit OperationsMuseumAirport Operations
Community ServicesDirector
Robin Goodman
Electric Utility OperationsStreet LightsTraffic SignalsMaintenanceElectrical ContructionVehicle Services
Electric Utility DirectorWilliam Duarte
PurchasingPayrollTreasury ManagementInformation ServicesCommunicationsAccounts PayableFinancial ReportingBudget DevelopmentUtility Billing
Finance DirectorGreg Rogers
Fire ProtectionNuisance AbatementHazardous MaterialEnforcementDisaster PreparednessCSA 24 Fire Contract
InterimFire ChiefRandy Collins
Planning & BuildingInspectionRedevelopment
Planning & BuildingDirector
Richard Spitler
Police ProtectionAnimal Control
Police ChiefSusan Jones
EngineeringWater Utility OperationsSewer Utility OperationsDrainage SystemStreets & Roads
Public WorksDirector
George Hicks
City ManagerChet Wystepek
Airport CommissionPlanning Commision
Recreation & Parks CommissionSenior Citizen Advisory Commission
Mayor Leah GoldVice Mayor Lisa Schaffner
Council Member Jason Liles, Council Member Kent MitchellCouncil Member Mark Gleason
Citizens of Healdsburg

CITY OF HEALDSBURG
JUNE 30, 2003
Elected Officials
Leah Gold Mayor
Lisa W. Schaffner Kent MitchellVice Mayor Council Member
Jason Liles Mark GleasonCouncil Member Council Member
Appointed Officials
Chet J. Wystepek Kenneth A. WilsonCity Manager City Attorney
Barbara Jason-White Greg RogersAssistant City Manager Finance Director
Robin Goodman Maria CurielCommunity Services Director City Clerk
Bill Duarte George HicksElectric Utility Director Public Works Director
Susan Jones Randy CollinsPolice Chief Interim Fire Chief
Richard SpitlerPlanning and Building Director
vii

(This page left intentionally blank).
viii


See independent auditors report.- 3 -
MANAGEMENT S DISCUSSION AND ANALYSIS
As management of the City of Healdsburg (City), we offer readers of the City s financial statements this narrative overview and analysis of the financial activities of the City for the fiscal year ended June 30, 2003. We encourage readers to consider the information presented here in conjunction with additional information that we have furnished in our letter of transmittal, which can be found in the Introductory Section of this report.
FINANCIAL HIGHLIGHTS
City assets exceeded its liabilities at the close of fiscal year 2002-03 by $117.6 million (net assets). Of this amount, $24.8 million (unrestricted net assets) may be used to meet the government s ongoing obligations to citizens and creditors.
City total net assets increased by $6 million during the fiscal year, which was provided from revenues being greater than operating expenses.
At the close of fiscal year 2002-03, City governmental funds reported combined ending fund balance of $48.5 million, an increase of $12.1 million.
At the end of fiscal year 2002-03, unreserved fund balance for the General Fund was $3.7 million, or 76 percent of total General Fund expenditures.
Total City debt (excluding capitalized leases, compensated absences and claims liabilities) increased by $17.8 million (.53 percent increase) during fiscal year 2002-03. Changes in debt consisted of a new loan funded at $19.3 million to the Community Redevelopment Agency for financing activities/projects within the project area, and $1.2 million in principal reduction payments.
OVERVIEW OF THE FINANCIAL STATEMENTS
This discussion and analysis are intended to serve as an introduction to the City s basic financial statements. The City s basic financial statements are comprised of three components: 1) government-wide financial statements, (2) fund financial statements, and (3) notes to the basic financial statements. This report also contains other supplementary information in addition to the basic financial statements themselves.

See independent auditors report.- 4 -
Government-wide financial statements
The government-wide financial statements are designed to provide readers with a broad overview of the City s finances, in a manner similar to a private-sector business.
The statement of net assets presents information on all of the City s assets and liabilities, with the difference between the two reported as net assets. Over time, increases or decreases in net assets may serve as a useful indicator of whether the financial position of the City is improving or deteriorating.
The statement of activities presents information showing how the City s net assets changed during the most recent fiscal year. All changes in net assets are reported as soon as the underlying event giving rise to the change occurs, regardless of the timing of related cash flows. Thus, all of the current year s revenues and expenses are taken into account regardless of when cash is received or paid (e.g., uncollected taxes or earned but unused vacation leave).
Government-wide financial statements distinguish City governmental activities that are principally supported by taxes and intergovernmental revenues from other business-type activities that are intended to recover all or a significant portion of their costs through user fees and charges. Governmental activities of the City and the Healdsburg Community Redevelopment Agency, a blended component unit, include general government, public safety, culture and recreation and community development. Business type activities of the city include water utility, sewer utility, electric utility, streets, community services and other programs.
The government-wide financial statements can be found on pages 15 17 of this report.
Fund financial statements
Fund financial statements are designed to report information about groupings of related accounts used to maintain control over resources that have been segregated for specific activities or objectives. The City, like other state and local governments, uses fund accounting to ensure and demonstrate compliance with finance-related legal requirements. City funds can be divided into three categories: governmental funds, proprietary funds and fiduciary funds.
Governmental funds are used to account for essentially the same functions reported as governmental activities in the government-wide financial statements. However, unlike the government-wide financial statements, governmental fund financial statements focus on near-term inflows and outflows of spendable resources, as well as

See independent auditors report.- 5 -
on balances of spendable resources available at the end of the fiscal year. Such information may be useful in evaluating a government s near-term financing requirements.
Because the focus of governmental funds is narrower than that of the government-wide financial statements, it is useful to compare the information presented for governmental funds with similar information presented for governmental activities in the government-wide financial statements. By doing so, readers may better understand the long-term impact of the government s near-term financing decisions. Both the governmental fund balance sheet and the governmental fund statement of revenues, expenditures and changes in fund balances provide a reconciliation to facilitate this comparison between governmental funds and governmental activities.
The City maintains several individual governmental funds organized by their type (special revenue, debt service, capital projects and permanent funds). Information is presented separately in the governmental fund balance sheet and in the governmental fund statement of revenues, expenditures, and changes in fund balances for the General, Community Redevelopment Agency Debt Service, Special Assessment Debt Service, Community Redevelopment Commercial/Industrial, Community Redevelopment Low/Moderate Income and General Capital Projects which are considered to be major funds. Data from the remaining governmental funds are combined into a single, aggregated presentation. Individual fund data for each of the non-major governmental funds is provided in the form of combining statements beginning on page 64 of this report.
The City adopts an annual appropriated budget for its General Fund, certain special revenue funds and debt service funds. Budgetary comparison statements have been provided to demonstrate compliance with this budget. These statements begin on page 61 of this report.
The basic governmental fund financial statements can be found on pages 18 25 of this report.
Proprietary funds are generally used to account for services for which the City charges outside customers, or internal departments of the City. Proprietary funds provide the same type of information as shown in the government-wide statements, only in more detail. The City maintains the following two types of proprietary funds:
Enterprise funds are used to report the same functions presented as business-type activities in the government-wide financial statements. The City uses an enterprise fund to account for the operations of water, sewer, electric, streets and community services and other programs.

See independent auditors report.- 6 -
Internal service funds are used to report activities that provide internal services for the City. The City uses internal service funds to account for its insurance and benefits, vehicle service and replacement, information systems and equipment and government buildings. Because internal service funds predominantly benefit governmental rather than business-type functions, they have been included within governmental activities in the government-wide financial statements.The internal service funds are combined into a single, aggregated presentation in the proprietary fund financial statements. Individual fund data for the internal service funds is provided in the form of combining statements beginning on page 97 of this report.
The basic proprietary fund financial statements can be found on pages 26-31 of this report.
Fiduciary funds are used to account for resources held for the benefit of parties outside the government. Fiduciary funds are not reflected in the government-wide financial statement because the resources of those funds are not available to support the City s own programs.
The basic fiduciary fund financial statements can be found on page 32 of this report.
Notes to the basic financial statements
The notes provide additional information that is essential to a full understanding of the data provided in the government-wide and fund financial statements. The notes to the basic financial statements can be found on pages 34-60 of this report.
Other information
In addition to the basic financial statements and accompanying notes, this report also presents certain required supplementary information which includes a Budgetary Comparison Schedules for the General Fund. Required supplementary information can be found on page 61 of this report.
Combining statements for non-major governmental funds, internal service funds, and budgetary comparison schedules for certain individual funds are presented immediately following the required supplementary information. Combining financial statements and schedules can be found on pages 64 107 of this report.
GOVERNMENT-WIDE FINANCIAL ANALYSIS
This is the first year that the City has presented its financial statements under the new reporting model required by the Governmental Accounting Standards Board Statement No. 34 (GASB 34), Basic Financial Statements and Management s Discussion and Analysis (MD&A) for State and Local Governments. Because this reporting model

See independent auditors report.- 7 -
significantly changes both the recording and presentation of financial data, the City has not restated prior fiscal years for the purpose of providing comparative information for MD&A. In future years when prior-year information is available, a comparative analysis of government-wide data will be included in this report.
As noted earlier, net assets may serve over time as a useful indicator of a government s financial position. City assets exceeded liabilities by $117.6 million at the close of fiscal year 2002-03 as summarized below:
Statement of Net Assets*June 30, 2003
Governmental Business-typeActivities Activities Total
Assets:Current and other assets $ 59,640,886 $ 34,803,351 $94,444,237 Capital assets (net of Depreciation) 28,090,419 73,674,433 101,764,852
Total assets 87,731,305 108,477,784 196,209,089
Liabilities:Current and other liabilities 6,545,641 1,917,824 8,463,465 Long-term liabilities Outstanding 51,650,017 18,491,372 70,141,389
Total liabilities 58,195,658 20,409,196 78,604,854
Net assets: Invested in capital assets, net of related debt 9,518,006 60,799,542 70,317,548 Restricted 16,274,710 6,241,488 22,516,198 Unrestricted 3,742,931 21,027,558 24,770,489
Total net assets $29,535,647 $88,068,588 $117,604,235
* A more detailed statement of net assets is shown on page 15.

See independent auditors report.- 8 -
The largest portion (59.7 percent) of the City s net assets reflects its investment of$70.3 million in capital assets (land, buildings and improvements, equipment, infrastructure, and construction in progress, net of accumulated depreciation), less any related outstanding debt used to acquire those assets. The City uses these capital assets to provide services to citizens; consequently, these assets are not available for future spending. Although the City s investment in its capital assets is reported net of related debt, resources needed to repay this debt must be provided from other sources, since the capital assets themselves cannot be used to liquidate these liabilities.
Another portion of the City s net assets ($22.5 million or 19.1 percent) represents resources that are subject to external restrictions on how they may be used. The remaining balance of unrestricted net assets, $24.5 million (21 percent) may be used to meet the government s ongoing obligations to citizens, creditors, and to meet City imposed designations (e.g., reserves, pending litigations, contingencies, capital projects).
At the close of fiscal year 2002-03, the City shows positive balances in all three categories of net assets, both for the government as a whole, as well as for its separate governmental activities and business-type activities.
Statement of Activities
The statement of activities shows how the government s net assets changed during fiscal year 2002-03. Following on page 9 is a summary of changes in net assets. As with the preceding statement, this is the first year to report on the new standard and comparison to the prior year is not possible. In subsequent years, this section will discuss and analyze significant differences.
The City s net assets increased overall by $6.1 million during the current fiscal year.
Governmental activities increased the City s net assets by $1.1 million before transfers primarily due to revenues being greater than spending. Community development is the largest expense function (42 percent), followed by public safety (37.3 percent), interest on long-term debt (13.5 percent), general government (6.6 percent), culture and recreation (.2 percent) and unallocated depreciation (.4 percent). General revenues such as property and sales tax are not shown by program, but are effectively used to support program activities citywide.Business-type activities increased the City s net assets by $5 million before transfers. As shown on page 9, the Electric Fund had total expenses of $8.5 million. The Electric utility fees provide the largest share of revenues (46 percent).

See independent auditors report.- 9 -
Statement of Activities*Year Ended 6/30/2003
Governmental Business-typeActivities Activities Total
Revenues:Program revenues:
Charges for services $ 861,409 $ 18,592,862 $ 19,454,271Operating grants and contributions 1,496,470 757,715 2,254,185 Capital grants and contributions 136,029 2,286,306 2,422,335
General Revenues 11,826,951 561,115 12,388,066
Total Revenues 14,320,859 22,197,998 36,518,857
Expenses:General government 877,928 - 877,928Public safety 4,940,266 - 4,940,266 Community development 5,551,403 - 5,551,403 Culture and recreation 27,167 - 27,167Unallocated infrastructure depreciation 22,870 - 22,870Interest on long-term debt 1,790,296 - 1,790,296 Water - 3,082,159 3,082,159Sewer - 2,483,558 2,483,558Electric - 8,547,494 8,547,494Street - 1,193,051 1,193,051Other programs - 1,863,390 1,863,390
Total Expenses 13,209,930 17,169,652 30,379,582
Increase in net assets before transfers 1,110,929 5,028,346 6,139,275 Transfers (24,511,154) 24,511,154 -
Increase (decrease) in net assets (23,400,225) 29,539,500 6,139,275
Net assets - 6/30/02 52,935,872 58,529,088 111,464,960
Net assets - 6/30/03 $29,535,647 $88,068,588 $117,604,235
* A more detailed statement of activities is shown on pages 16 17.

See independent auditors report.- 10 -
FINANCIAL ANALYSIS OF CITY FUNDS
As noted earlier, the City uses fund accounting to ensure and demonstrate compliance with finance-related legal requirements.
Governmental funds
The focus of the City s governmental funds is to provide information on near-term inflows, outflows and balances of spendable resources. Such information is useful in assessing the City s financing requirements. In particular, unreserved fund balance may serve as a useful measure of a government s net resources available for spending at the end of the fiscal year. Refer to pages 18 23 for more detail of governmental funds.
As of June 30, 2003, the City s governmental funds reported combined ending fund balances of $48.5 million, an increase of 12.1 million in comparison with the prior year. Of the $48.5 million, $7.5 million, or 15 percent, constitutes unreserved fund balance. The remainder of fund balance is reserved to indicate that it is not available for new spending because it has already been committed to pay for debt service of $4 million, redevelopment projects from bond funding of $32.4 million and for a variety of other purposes.
The major factors in governmental fund balance growth of $12.1 million are as follows:
The Community Redevelopment Agency issued $19.3 million in additional tax allocation bonds.
The Community Redevelopment Agency Capital projects recognized a $360 thousand increase due to tax increment.
The General Fund recognized $400 thousand in revenues greater than expenditures.
Refer to page 11 for General Fund financial and budgetary highlights.
Proprietary funds
Unrestricted net assets of the Water Enterprise Fund amounted to $.5 million, Sewer Enterprise Fund amounted to $6.3 million, Electric Enterprise Fund amounted to $11 million, Street Enterprise Fund amounted to $2.9 million and the Internal Service Funds had unrestricted net assets of $3.2 million. Total growth in net assets for

See independent auditors report.- 11 -
proprietary funds was approximately $3 million before capital contribution transfers. Proprietary funds financial statements can be found on pages 26 31.
GENERAL FUND FINANCIAL AND BUDGETARY HIGHLIGHTS
The General Fund is the chief operating fund of the City. At June 30, 2003, unreserved fund balance was $3.7 million. Note that unreserved fund balance includes amounts set-aside for City designations such as City s reserve policy. Unreserved fund balance, which includes designated funds, represents 76 percent of total General Fund expenditures
During the year, with the recommendation from the City s staff, the City Council revised the City budget several times. The major mid-year adjustment was to move appropriations for Community Services activities form the General Fund to the Community Services fund to reflect the voter approved dedication of transient occupancy taxes to Community Services activities. All amendments that either increase or decrease appropriations must be approved by the City Council.
For the City s General Fund, actual ending revenues of $5.5 million were $.52 million more than the final budgeted revenues. The majority of the variance was in sales tax, which was budgeted to come in at $3.2 million; however, the actual was $3.5 million. The other significant variance was in intergovernmental revenues, which includes the motor vehicle license fee subvention. The City budgeted $.89 million, and the actual was $.95 million.
Investments continue to decrease as interest rates continue to fall.
During the year a new Community Services enterprise was created and separated from the General Fund. The budget was moved to the new enterprise resulting in a smaller final budget in the General Fund. Public safety increased appropriations to purchase equipment including grant funds with guaranteed reimbursements from the State.
CAPITAL ASSET AND DEBT ADMINISTRATION
Capital assets:
Capital investment in capital assets for its governmental and business-type activities as of June 30, 2003 amounted to $101.8 million (net of accumulated depreciation). This investment in capital assets includes land, buildings & improvements, equipment, infrastructure, and construction in progress. The total increase in capital assets for fiscal year 2002-03 was $10.3 million or 10 percent, which represents a 18.2 percent

See independent auditors report.- 12 -
decrease for governmental activities and 6.8 percent increase for business-type activities.
Additional information on the City s capital assets can be found on Note 4 in the notes to the basic financial statements. Capital assets are summarized below.
City of HealdsburgCapital Assets (net of accumulated depreciation)
June 30, 2003
Governmental Business-typeActivities Activities Total
Land $ 8,442,782 $ 3,830,804 $ 12,273,586 Right of way 6,681,379 - 6,681,379Construction in progress 3,854,387 11,025,350 14,879,737Buildings 5,712,275 3,350,574 9,062,849 Streets - 16,388,109 16,388,109Utility Systems - 33,180,372 33,180,372Drainage - 4,190,727 4,190,727Machinery and equipment 2,451,354 922,162 3,373,516 Operations - 786,335 786,335Infrastructure 948,242 - 948,242
Total capital assets, net $ 28,090,419 $ 73,674,433 $ 101,764,852
Major capital asset events during fiscal year 2002-03 included the following:
City transferred $22 million in capital assets (net of accumulated depreciation) from governmental activities to a new streets and community services enterprise funds.Purchased land for $1,550,000 on West Grant Street for low to moderate income housing.
Long-term debt:
At the close of fiscal year 2002-03, the City had total debt (excluding compensated absences and claims liabilities) outstanding of $69 million. Outstanding debt is

See independent auditors report.- 13 -
summarized as follows, and additional information can be found on Note 7 in the notes to the basic financial statements.
City of Healdsburg Outstanding Debt
June 30, 2003
Governmental Business-typeActivities Activities Total
General obligation $5,720,000 $ - $5,720,000Tax allocation bonds payable 42,420,000 - 42,420,000 Certificates of participation - 18,665,000 18,665,000Special assessments 2,230,000 - 2,230,000
Total outstanding debt $50,370,000 $18,665,000 $69,035,000
The City s total debt increased by $23 million, or .50 percent, during fiscal year 2002-03. The change in debt consisted of the following:
In April 2003 the Community Redevelopment Agency issued $19 million of tax allocation bonds.In October 2002 the City Of Healdsburg issued $5.5 million of certificates of participation for improvements on the water system. Ongoing debt service payments reduced total debt by $1.8 million.
ECONOMIC FACTORS AND NEXT YEAR S BUDGETS AND RATES
In preparing the budget for 2003-2004, management looked at the following economic factors:
State budget crisis: Currently, California is in a budget crisis that may take several years to resolve. The City does not know the extent of impact that the budget crisis will have on property taxes and motor vehicle license taxes, two of the largest revenues sources for the City. The City s 2003-2004 budget reflects an anticipated continuation of existing revenue sources.Public Employee Retirement System Costs: Cost for the City contribution to the retirement plans for City employees are increasing significantly due to lower than projected earnings by the State run retirement system. The higher pension costs will be a problem over the next several years.The slowing of sales tax revenue growth due to a weaker economy is expected to continue over the next several years.

See independent auditors report.- 14 -
Motor Vehicles License fee is currently being back filled by the State General Fund, which could be eliminated in the State s budget process. This could cause a reduction in General Fund revenues for the City in an amount estimated at $.5 million.
Compared to prior year s budget, the City s General Fund expenditures are projected to increase. Staff salaries and benefits increased due to the annual CPI increase of 2.75%, a 10% increase in health care premium, higher retirement contribution rates, and the upgrading of the Public Safety retirement plan.
The City continues to grow with new hotels, and other commercial development, construction of street improvements, park construction, and various other projects. The 2003-2004 budget is a reflection of the City s commitment to the residents of Healdsburg. The City s conservative approach has provided for a consistent high level of services. The City has made a commitment to allocate resources for public safety, cultural/social programs, and infrastructure improvements. A copy of the City s 2003-2004 budget can be obtained by contacting the City s finance department (See below).
This financial report is designed to provide our citizens, taxpayers, customers, and investors and creditors with a general overview of the City s finances and to show the City s accountability for the money it receives.
Declining interest rates were experienced in fiscal year 2002-03 with the City average annual interest rate dropping from 3.8 percent to 2.4 percent. The reduction in investment revenue is expected to continue and was considered in preparing the fiscal year 2003-04 budgets of $1.03 million.
REQUESTS FOR INFORMATION
This financial report is designed to provide a general overview of City finances for all those with an interest in the government s finances. If you have questions about this report or need additional financial information, contact the City s Finance Department at City of Healdsburg offices at 401 Grove Street, Healdsburg, California or by calling (707) 431-3310.

Governmental Business-typeActivities Activities Total
ASSETS:Cash and investments (Note 2) 16,340,454$ 23,516,361$ 39,856,815$Receivables:
Interest 70,270 - 70,270Accounts 1,008,392 2,371,954 3,380,346Taxes 1,001,086 - 1,001,086Loans 1,687,110 - 1,687,110Special assessments 2,230,000 - 2,230,000Notes 32,528 132,282 164,810Due from other governments 32,950 - 32,950
Internal balances 234,185 (234,185) -Inventory 30,609 1,361,223 1,391,832Prepaid items 1,527,095 509,144 2,036,239Deferred charges 413,080 904,904 1,317,984Restricted assets:
Cash and investment (Note 2) 35,033,127 6,241,668 41,274,795Capital assets (Note 4):
Land 8,442,782 3,830,804 12,273,586Right of way 6,681,379 - 6,681,379Infrastructure, net 948,242 - 948,242Depreciable buildings, net 5,712,275 3,350,574 9,062,849Depreciable streets, net - 16,388,109 16,388,109Depreciable utility systems, net - 33,180,372 33,180,372Depreciable drainage, net - 4,190,727 4,190,727Depreciable machinery and equipment, net 2,451,354 922,162 3,373,516Depreciable operations, net - 786,335 786,335Construction in progress 3,854,387 11,025,350 14,879,737
TOTAL ASSETS 87,731,305 108,477,784 196,209,089
LIABILITIES:Accounts payable and accrued liabilities 2,128,331 1,261,050 3,389,381Deposits payable 48,765 656,774 705,539Deferred revenue 4,184,565 - 4,184,565Claims payable 183,980 - 183,980Noncurrent liabilities (note 5):
Due within one year 2,680,012 460,000 3,140,012Due in more than one year 48,970,005 18,031,372 67,001,377
TOTAL LIABILITIES 58,195,658 20,409,196 78,604,854
NET ASSETS:Invested in capital assets, net of related debt 9,518,006 60,799,542 70,317,548Restricted for:
Debt service 4,198,650 - 4,198,650Capital projects - 6,241,488 6,241,488Community development 11,821,155 - 11,821,155Public safety 22,229 - 22,229Culture and recreation 232,676 - 232,676
Unrestricted 3,742,931 21,027,558 24,770,489
TOTAL NET ASSETS 29,535,647$ 88,068,588$ 117,604,235$
See independent auditors' report and notes to basic financial statements.
CITY OF HEALDSBURG
STATEMENT OF NET ASSETS
June 30, 2003
- 15 -

Charges Operating Capitalfor Grants and Grants and
Expenses Services Contributions Contributions
Governmental activities:General government 877,928$ 461,841$ 2,223$ -$Public safety 4,940,266 386,010 292,020 -Culture and recreation 27,167 13,118 9,443 117,451Community development 5,551,403 440 1,192,784 18,578Unallocated infrastructure
depreciation 22,870 - - -Interest on long-term debt 1,790,296 - - -
Total governmental activities 13,209,930 861,409 1,496,470 136,029
Business-type activities:Water 3,082,159 3,782,580 - 21,161Sewer 2,483,558 4,080,199 - 47,261Electric 8,547,494 8,568,880 15,000 191,082Street 1,193,051 989,229 - 1,929,472Other programs 1,863,390 1,171,974 742,715 97,330
Total business-type activities 17,169,652 18,592,862 757,715 2,286,306
TOTAL PRIMARY GOVERNMENT 30,379,582$ 19,454,271$ 2,254,185$ 2,422,335$
General revenues:Taxes:
Property taxes, levied for general purposesFranchise taxesSales taxTransient occupancy taxMotor vehicle in-lieu
Other revenuesInvestment earnings
Transfers
Total general revenues and transfers
Change in net assets
Net assets - Beginning of year
Net assets - End of year
See independent auditors' report and notes to basic financial statements.
- 16 -
Functions/programs
Program Revenues
CITY OF HEALDSBURG
STATEMENT OF ACTIVITIES
For the year ended June 30, 2003

Governmental Business-typeActivities Activities Total
(413,864)$ -$ (413,864)$(4,262,236) - (4,262,236)
112,845 - 112,845(4,339,601) - (4,339,601)
(22,870) - (22,870)(1,790,296) - (1,790,296)
(10,716,022) - (10,716,022)
- 721,582 721,582- 1,643,902 1,643,902- 227,468 227,468- 1,725,650 1,725,650- 148,629 148,629
- 4,467,231 4,467,231
(10,716,022) 4,467,231 (6,248,791)
6,834,236 - 6,834,236322,529 - 322,529
2,792,855 - 2,792,85594,110 - 94,110
661,106 - 661,106390,255 - 390,255731,860 561,115 1,292,975
(24,511,154) 24,511,154 -
(12,684,203) 25,072,269 12,388,066
(23,400,225) 29,539,500 6,139,275
52,935,872 58,529,088 111,464,960
29,535,647$ 88,068,588$ 117,604,235$
- 17 -
Changes in Net AssetsNet (Expense) Revenue and
Community SpecialRedevelopment Assessment
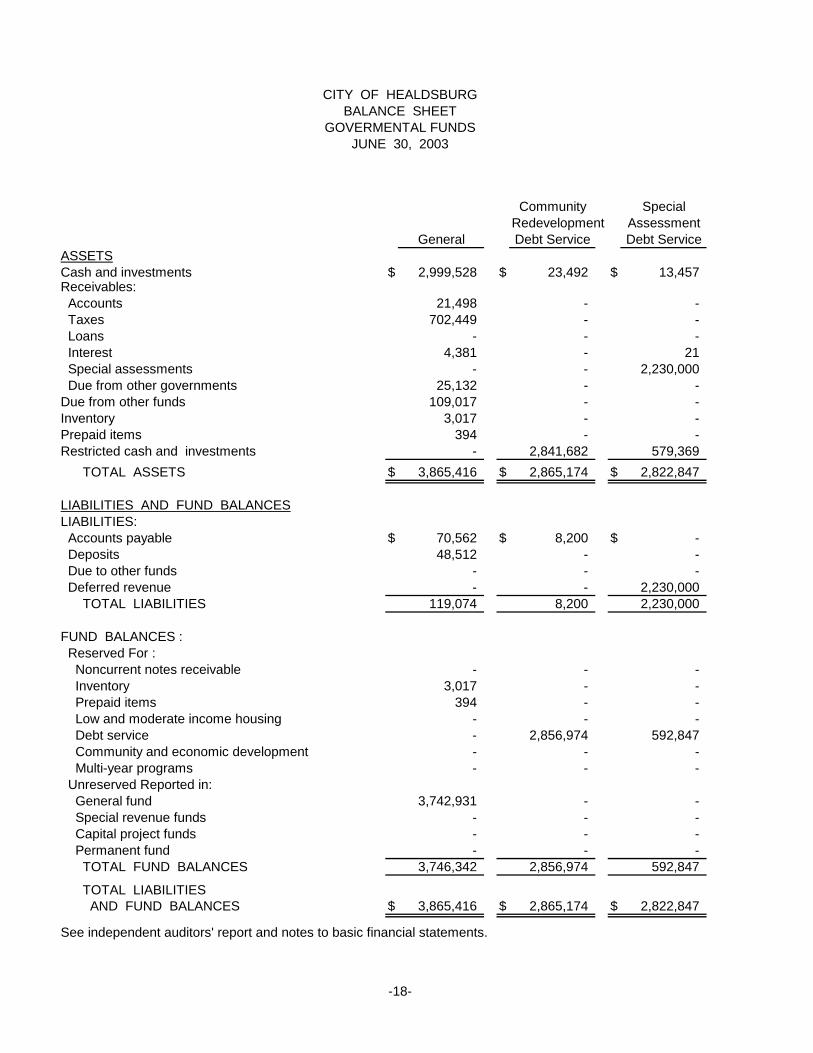
General Debt Service Debt ServiceASSETSCash and investments $ 2,999,528 $ 23,492 $ 13,457Receivables: Accounts 21,498 - - Taxes 702,449 - - Loans - - - Interest 4,381 - 21 Special assessments - - 2,230,000 Due from other governments 25,132 - -Due from other funds 109,017 - -Inventory 3,017 - -Prepaid items 394 - -Restricted cash and investments - 2,841,682 579,369
TOTAL ASSETS $ 3,865,416 $ 2,865,174 $ 2,822,847
LIABILITIES AND FUND BALANCESLIABILITIES: Accounts payable $ 70,562 $ 8,200 $ - Deposits 48,512 - - Due to other funds - - - Deferred revenue - - 2,230,000 TOTAL LIABILITIES 119,074 8,200 2,230,000
FUND BALANCES : Reserved For : Noncurrent notes receivable - - - Inventory 3,017 - - Prepaid items 394 - - Low and moderate income housing - - - Debt service - 2,856,974 592,847 Community and economic development - - - Multi-year programs - - - Unreserved Reported in: General fund 3,742,931 - - Special revenue funds - - - Capital project funds - - - Permanent fund - - - TOTAL FUND BALANCES 3,746,342 2,856,974 592,847
TOTAL LIABILITIES AND FUND BALANCES $ 3,865,416 $ 2,865,174 $ 2,822,847
See independent auditors' report and notes to basic financial statements.
CITY OF HEALDSBURGBALANCE SHEET
GOVERMENTAL FUNDSJUNE 30, 2003
-18-

GeneralLow/Moderate Capital
Projects
$ 2,012,629 $ 912,035 $ 1,110,019 $ 4,003,011 $ 11,074,171
433,577 - 71,020 87,110 613,205142,449 35,214 - 120,974 1,001,086
- 383,169 - 1,687,107 2,070,27626,987 5,794 2,134 8,906 48,223
- - - - 2,230,000- - - 29,868 55,000- - - - 109,017- - - - 3,017
1,500,394 - - - 1,500,78821,859,939 9,697,653 - 54,484 35,033,127
$ 25,975,975 $ 11,033,865 $ 1,183,173 $ 5,991,460 $ 53,737,910
$ 16,826 $ 5,416 $ 841,645 $ 1,340 $ 943,989253 - - - 48,765
- - - 86,620 86,6201,715,746 - - 238,819 4,184,5651,732,825 5,416 841,645 326,779 5,263,939
- - - 1,537,107 1,537,107- - - - 3,017
1,500,394 - - - 1,500,788- 1,330,796 - - 1,330,796- - - 748,829 4,198,650
21,859,939 9,697,653 - - 31,557,592882,817 - - - 882,817
- - - - 3,742,931- - - 3,264,774 3,264,774- - 341,528 17,428 358,956- - - 96,543 96,543
24,243,150 11,028,449 341,528 5,664,681 48,473,971
$ 25,975,975 $ 11,033,865 $ 1,183,173 $ 5,991,460 $ 53,737,910
Community
Income
CommunityTotal
Governmental Other
GovernmentalFunds
-19-
Funds
RedevelopmentCommercial/
Industrial
Redevelopment

(This page left intentionally blank).
- 20 -

Fund equity - total governmental funds 48,473,971$
Amounts reported for governmental activities in the statement of net assets are different because:
Capital assets used in governmental activities are not current financial resourcesand therefore are not reported in the governmental funds balance sheet. 25,849,904
Internal service funds are used by management to charge the costs ofself-insurance and capital replacements to individual funds. The assetsand liabilities of the internal service funds are included in governmentalactivities in the statement of net assets. 5,476,724
Internal balances included in internal service funds which are receivable from theenterprise funds. 211,788
Long-term liabilities are not due and payable in the current period and, accordingly,are not reported as fund liabilities. All liabilities, both current and long-term arereported in the Statement of Net Assets:
General obligation bonds (5,720,000)$Tax allocation bonds payable (42,420,000)Bond discount 239,995Deferred charges for issuance costs 413,080Special assessment bonds payable (2,230,000)
Total long-term liabilities (49,716,925)
Interest on long-term debt is not accrued in governmental funds, but rather is recognized as an expenditure when due. (759,815)
Net assets of governmental activities 29,535,647$
See independent auditors' report and notes to basic financial statements.
- 21 -
CITY OF HEALDSBURG
RECONCILIATION OF THE GOVERNMENTAL FUNDSBALANCE SHEET TO THE STATEMENT OF NET ASSETS
For the year ended June 30, 2003

Community SpecialRedevelopment Assessment
General Debt Service Debt ServiceRevenues: Property taxes 607,747 - - Special assessments - - 323,632 Sales and other taxes 3,515,406 - - Charges for services 283,063 - - Intergovernmental revenues 954,478 - - Development fees and permits - - - Investment income 51,338 10,465 11,990 Miscellaneous fees and charges 93,044 - - Other revenues 4,222 - - Total revenues 5,509,298 10,465 335,622
Expenditures: Current: General government 376,027 - - Public safety 4,566,617 - - Culture and recreation 3,011 - - Community development - - - Capital outlay - - - Debt service: Principal retirement - 845,000 230,000 Interest and fees - 993,661 177,792 Bond issue costs - 282,344 - Total expenditures 4,945,655 2,121,005 407,792
Excess of revenues over
(under) expenditures 563,643 (2,110,540) (72,170)
Other financing sources (uses): Transfers in - 1,827,576 - Transfers out (145,400) (11,505,000) - Bond discount - (162,500) - Proceeds from long-term debt - 13,000,000 -
Total other financing sources (uses) (145,400) 3,160,076 -
Net change in fund balances 418,243 1,049,536 (72,170)
Fund balances , beginning of year 3,328,099 1,807,438 665,017
Fund balances, end of year $ 3,746,342 $ 2,856,974 $ 592,847
See independent auditors' report and notes to basic financial statements.
CITY OF HEALDSBURGSTATEMENT OF REVENUES, EXPENDITURES AND CHANGES IN FUND BALANCES
GOVERMENTAL FUNDSFOR THE YEAR ENDED JUNE 30, 2003
- 22 -

General OtherLow/Moderate Capital Governmental
Projects Funds
$ 4,407,195 $ 1,101,911 $ - $ 717,384 $ 6,834,237- - - - 323,632- - - - 3,515,406- - - - 283,063- - - 879,153 1,833,631- - - 119,203 119,203
255,094 167,534 25,005 146,391 667,817- - - - 93,044
390,253 - 7,167 214,547 616,1895,052,542 1,269,445 32,172 2,076,678 14,286,222
3,656 - 1,987 305,582 687,252- - - 6,036 4,572,653- - - 24,156 27,167
2,303,506 332,655 - 46,001 2,682,162- - 5,628,557 - 5,628,557
- - - 225,000 1,300,000- - - 291,213 1,462,666- 134,402 - - 416,746
2,307,162 467,057 5,630,544 897,988 16,777,203
2,745,380 802,388 (5,598,372) 1,178,690 (2,490,981)
12,185,424 - 4,327,504 726,000 19,066,504(4,518,436) (1,382,856) (2,565,410) (3,455,421) (23,572,523)
- (79,625) - - (242,125)- 6,370,000 - - 19,370,000
7,666,988 4,907,519 1,762,094 (2,729,421) 14,621,856
10,412,368 5,709,907 (3,836,278) (1,550,731) 12,130,875
13,830,782 5,318,542 4,177,806 7,215,412 36,343,096
$ 24,243,150 $ 11,028,449 $ 341,528 $ 5,664,681 $ 48,473,971
Community
Income
CommunityTotal
GovernmentalFunds
RedevelopmentCommercial/
Industrial
-23-
Redevelopment

(This page left intentionally blank).
- 24 -

Net change in fund balances - total governmental funds 12,130,875$
Amounts reported for governmental activities in the statement of activities are different because:
Governmental funds report capital outlays as expenditures. However, in the statementof activities, the cost of those assets is allocated over their estimated useful livesas depreciation expense. This is the amount by which capitalizable capital outlays($2,761,400 ) exceeded depreciation ( $308,696 ) in the current period. 2,452,706
Governmental contributions of capital assets to proprietary funds are notreported as expenditures. However, in the statement of activities the cost of these assets are reported as transfers. (20,141,576)
The issuance of long-term debt provides current financial resources togovernmental funds, while the repayment of the principal of long-term debtconsumes the current financial resources of governmental funds. Neithertransaction, however, has any effect on net assets. Also, governmental fundsreport the effect of issuance costs, premiums, discounts, and similar itemswhen debt is first issued, whereas these amounts are deferred and amortized in the statement of activities. These amounts are the net effect of thesedifferences in the treatment of long-term debt:
Debt issued or incurred:Issuance of tax allocation bonds (19,370,000)$Bond issuance costs 416,746Bond discount 242,125Principal payments 1,300,000
(17,411,129)
Some expenses reported in the statement of activities do not require the use ofcurrent financial resources and therefore are not reported as expenditures inthe governmental funds:
Accrued interest (317,934)Amortization of issuance costs (3,666)Amortization of bond discount (2,130)
(323,730)
Internal service funds are used by management to charge the costs of self-insuranceand capital replacements to individual funds. A portion of the net loss of theinternal service funds is reported with governmental activities. (107,371)
Change in net assets of governmental activities (23,400,225)$
See independent auditors' report and notes to basic financial statements.
- 25 -
CITY OF HEALDSBURG
RECONCILIATION OF THE STATEMENT OF REVENUES, EXPENDITURESAND CHANGES IN FUND BALANCES OF GOVERNMENTAL FUNDS
For the year ended June 30, 2003
TO THE STATEMENT OF ACTIVITIES

Water Sewer ElectricFund Fund Fund
ASSETS:Current assets:
Cash and investments 4,641,800$ 6,528,795$ 7,622,395$ Accounts receivable 613,561 465,111 1,273,731Notes receivable 14,617 18,110 20,681Due from other funds - - 87,008Inventory 74,921 793 1,266,291Prepaid items 1,058 394 507,662
Total current assets 5,345,957 7,013,203 10,777,768Noncurrent assets:
Deferred issuance cost 770,087 134,817 -Restricted cash and investments 5,335,973 905,695 -Capital assets:
Land 285,780 682,880 48,360Building 1,449,918 206,166 447,835Streets - - -Utility systems 15,432,764 14,955,451 13,004,052Drainage - 8,664,262 -Machines and equipment 391,211 289,295 291,637Operations - - -Construction in progress 3,969,094 3,264,073 1,053,026 Less accumulated depreciation (4,111,946) (6,375,260) (5,539,795)
Total capital assets (net of accumulated depreciation) 17,416,821 21,686,867 9,305,115Total noncurrent assets 23,522,881 22,727,379 9,305,115
TOTAL ASSETS 28,868,838 29,740,582 20,082,883LIABILITIES:
Current liabilities:Accounts payable and accrued liabilities 287,341 560,097 258,236Deposits from others 5,245 - 385,941Due to other funds - - -Claims payable - - -Compensated absences - - -Certificates of participation 395,000 65,000 -
Total current liabilities 687,586 625,097 644,177Noncurrent liabilities:
Certificates of participation 14,740,446 3,290,926 -
TOTAL LIABILITIES 15,428,032 3,916,023 644,177
NET ASSETS:Invested in capital assets, net of related debt 7,617,168 18,611,539 9,305,115Restricted for capital projects 5,335,793 905,695 -Unrestricted 487,845 6,307,325 10,133,591
TOTAL NET ASSETS 13,440,806$ 25,824,559$ 19,438,706$ Adjustment to reflect the consolidation of internal service fund activities related to enterprise funds.Net assets of business-type activities
See independent auditors' report and notes to basic financial statements.
Business-type Activities - Enterprise Funds
- 26 -
STATEMENT OF NET ASSETSCITY OF HEALDSBURG
PROPRIETARY FUNDSJUNE 30, 2003

Governmental Activities-
Other Totals InternalStreets Community Enterprise Enterprise ServiceFund Services Funds Funds Funds
3,080,825$ 708,700$ 933,846$ 23,516,361$ 5,266,283$ 4,619 1,218 13,714 2,371,954 12,018
- 78,874 - 132,282 32,528- - - 87,008- - 19,218 1,361,223 27,592- - 30 509,144 26,307
3,085,444 788,792 966,808 27,977,972 5,364,728
- - - 904,904 -- - - 6,241,668 -
2,461,978 351,806 3,830,804 -- 2,434,040 1,380,863 5,918,822 -
21,124,674 - 20,000 21,144,674 -- - - 43,392,267 -- - - 8,664,262 -
10,739 281,822 307,693 1,572,397 4,757,218- - 1,195,526 1,195,526 -
2,544,316 181,446 13,395 11,025,350 -(4,757,103) (1,258,472) (1,027,093) (23,069,669) (2,516,703)
18,922,626 4,100,814 2,242,190 73,674,433 2,240,51518,922,626 4,100,814 2,242,190 80,821,005 2,240,515
22,008,070 4,889,606 3,208,998 108,798,977 7,605,243
102,168 24,401 28,807 1,261,050 424,527101,165 5,066 159,357 656,774 -
- - 109,405 109,405 -- - - - 183,980- - - - 1,520,012- - - 460,000 -
203,333 29,467 297,569 2,487,229 2,128,519
- - - 18,031,372 -
203,333 29,467 297,569 20,518,601 2,128,519
18,922,626 4,100,814 2,242,190 60,799,452 2,240,515- - - 6,241,488 -
2,882,111 759,325 669,239 21,239,436 3,236,209
21,804,737$ 4,860,139$ 2,911,429$ 88,280,376 5,476,724$ (211,788)
88,068,588$
-27-

Water Sewer ElectricFund Fund Fund
Operating revenues:Charges for services 3,444,666$ 3,128,820$ 8,391,718$ Development fees 322,990 874,065 158,659Rental income - - -Miscellaneous 14,924 77,314 18,503
Total operating revenues 3,782,580 4,080,199 8,568,880
Operating expenses:Purchased power - - 5,626,154Operations 1,517,772 806,290 1,241,154Administrative 536,962 958,426 1,227,609Insurance premiums - - -Depreciation 326,350 462,182 343,468
Total operating expenses 2,381,084 2,226,898 8,438,385
Operating income (loss) 1,401,496 1,853,301 130,495
Nonoperating revenues (expenses)Taxes - - -Intergovernmental grant - - 15,000Investment earnings 124,305 131,172 186,073Loss on disposal of assets - - (640)Interest expense (620,906) (182,045) (5,981)
Total nonoperatingrevenues ( expenses) (496,601) (50,873) 194,452
904,895 1,802,428 324,947
Capital contributions 21,161 47,261 191,082Transfers in 353,281 3,282 -Transfers out (535,042) (85,042) (180,727)
Changes in net assets 744,295 1,767,929 335,302
Total net assets - beginning of year 12,696,511 24,056,630 19,103,404
Total net assets- end of year 13,440,806$ 25,824,559$ 19,438,706$
Adjustment to reflect the consolidation of internal service fund activities related to enterprise funds.Change in net assets of business - type activities
See independent auditors' report and notes to basic financial statements.
- 28 -
CITY OF HEALDSBURGSTATEMENT OF REVENUES, EXPENSES AND CHANGES IN FUND NET ASSETS
PROPRIETARY FUNDS
Income (loss) before transfers and capital contributions
Business-type Activities - Enterprise Funds
For the year ended June 30, 2003

Governmental Activities-
Other Total InternalStreet Community Enterprise Enterprise ServiceFund Services Funds Funds Funds
140,510$ 2,925$ 172,600$ 15,281,239$ 5,006,228$ 193,174 - 544,169 2,093,057 -
- 5,205 311,589 316,794 -655,545 45,380 90,106 901,772 150,096
989,229 53,510 1,118,464 18,592,862 5,156,324
- - - 5,626,154 -701,382 478,032 823,003 5,567,633 1,656,81937,321 201,469 153,641 3,115,428 88,451
- - - - 3,455,212412,072 90,384 62,853 1,697,309 531,201
1,150,775 769,885 1,039,497 16,006,524 5,731,683
(161,546) (716,375) 78,967 2,586,338 (575,359)
- 742,715 - 742,715 -- - - 15,000 -
48,177 4,517 14,636 508,880 86,874- - - (640) (3,028)- - (4,260) (813,192) -
48,177 747,232 10,376 452,763 83,846
(113,369) 30,857 89,343 3,039,101 (491,513)
18,106,166 4,062,852 - 22,428,522 -3,816,894 1,191,900 149,543 5,514,900 172,354
(4,954) (425,470) - (1,231,235) -
21,804,737 4,860,139 238,886 29,751,288 (319,159)
- - 2,672,543 58,529,088 5,795,883
21,804,737$ 4,860,139$ 2,911,429$ 5,476,724$
(211,788)88,068,588$
-29-

Water Sewer ElectricCASH FLOWS FROM OPERATING ACTIVITIES:
Receipts from customers $ 3,798,823 $ 3,950,855 $ 8,744,863Payments to suppliers (1,281,674) (550,646) (7,128,496)Payments to employees (952,830) (730,037) (1,302,451)
Net cash provided (used) by operating activities 1,564,319 2,670,172 313,916
CASH FLOWS FROM NONCAPITAL FINANCING ACTIVITIES:Taxes - - -Cash received from other funds 353,281 3,282 47,327Cash paid to other funds (535,042) (85,042) (180,727)
Net cash provided (used) by non-capital financing activities (181,761) (81,760) (133,400)
CASH FLOWS FROM CAPITAL AND RELATED FINANCING ACTIVITIES:Acquisition of capital assets:
Developer financed - - (465,719)Capital replacement (1,363,437) (1,339,677) -
Capital contributions 21,161 47,261 191,082Certificates of participation proceeds 5,510,000 - -Retirement of debt (280,000) (60,000) (165,000)Interest paid (759,269) (175,953) -
Net cash provided (used) by capital and related financing activities 3,128,455 (1,528,369) (439,637)
CASH FLOWS FROM INVESTING ACTIVITIES:Investment income 136,982 142,556 208,156Loans repaid - - -
Net cash provided (used) by investing activities 136,982 142,556 208,156
Net increase (decrease) in cash and cash equivalents 4,647,995 1,202,599 (50,965)
Cash and cash equivalents at beginning of year 5,329,778 6,231,891 7,673,360
Cash and cash equivalents at end of year $ 9,977,773 $ 7,434,490 $ 7,622,395
Operating income (loss) $ 1,401,496 $ 1,853,301 $ 130,495
Adjustments to reconcile operating income (loss) to net cashprovided (used) by operating activities:
Depreciation expense 326,350 462,182 343,468(Increase) decrease in accounts receivable 16,243 (129,344) 175,983(Increase) decrease in inventory (10,228) (126) (125,070)(Increase) decrease in prepaid items (1,058) (394) (429,786)Increase (decrease) in accounts payable (160,088) 485,153 230,134Increase (decrease) in deposits (8,396) (600) (11,308)Increase (decrease) in other accrued liabilities - - -
Total adjustments 162,823 816,871 183,421
Net cash provided (used) by operating activities $ 1,564,319 $ 2,670,172 $ 313,916
Noncash capital and related financing activitiesContribution of capital assets $ - $ - $ -
See independent auditors' report and notes to basic financial statements.
- 30 -
Business-type Activities - Enterprise Funds
RECONCILIATION OF OPERATING INCOME TO NET CASH PROVIDED (USED) BY OPERATING ACTIVITIES:
CITY OF HEALDSBURGSTATEMENT OF CASH FLOWS
PROPRIETARY FUNDSFOR THE YEAR ENDED JUNE 30, 2003

Governmental
Community Streets Services Funds
$ 988,722 $ 52,677 $ 1,116,581 $ 18,652,521 $ 5,160,822(70,734) (357,543) (469,976) (9,859,069) (4,595,532)
(464,636) (292,491) (523,745) (4,266,190) (333,897)
453,352 (597,357) 122,860 4,527,262 231,393
- 742,715 - 742,715 -3,816,894 1,191,900 149,543 5,562,227 172,354
(4,954) (504,344) (4,100) (1,314,209) -
3,811,940 1,430,271 145,443 4,990,733 172,354
(3,158,644) - - (3,624,363) -- (225,676) (91,291) (3,020,081) (249,315)
-1,930,112 97,330 - 2,286,946 -
- - - 5,510,000 -- - - (505,000) -- - (4,260) (939,482) -
(1,228,532) (128,346) (95,551) (291,980) (249,315)
44,065 4,132 16,343 552,234 99,936- - - - 14,182
44,065 4,132 16,343 552,234 114,118
3,080,825 708,700 189,095 9,778,249 268,550
- - 744,751 19,979,780 4,997,733
$ 3,080,825 $ 708,700 $ 933,846 $ 29,758,029 $ 5,266,283
$ (161,546) $ (716,375) $ 78,967 $ 2,586,338 $ (575,359)
412,072 90,384 62,853 1,697,309 531,201(507) (833) (1,883) 59,659 4,498
- - (4,821) (140,245) (13,188)- - 1,243 (429,995) (6,272)
102,168 24,401 (5,163) 676,605 33,350101,165 5,066 (8,336) 77,591 -
- - - - 257,163614,898 119,018 43,893 1,940,924 806,752
$ 453,352 $ (597,357) $ 122,860 $ 4,527,262 $ 231,393
$ 16,176,054 $ 3,965,522 $ - $ 20,141,576 $ -
TotalEnterpriseEnterprise
Funds
-31-
Activities-
FundsServiceInternalOther

ASSETSCash and investments $ 835,796Interest receivable 1,301
TOTAL ASSETS 837,097
LIABILITIES Accounts payable 98 Deposits 2,206 TOTAL LIABILITIES 2,304
NET ASSETSHeld in trust for other purposes $ 834,793
See independent auditors' report and notes to basic financial statements.
Trust Funds
-32-
CITY OF HEALDSBURGSTATEMENT OF FIDUCIARY NET ASSETS
FIDUCIARY FUNDS
Private
JUNE 30, 2003
Purpose

ADDITIONS Contributions $ 27,440 Investment income 15,252 Fees and charges 34,131 Total additions 78,893
DEDUCTIONS Community development 118,931
Additions (Deductions) before Transfers (40,038) Transfers in 50,000
Change in net assets 9,962
Net assets - beginning 824,831
Net assets - ending $ 834,793
See independent auditors' report and notes to basic financial statements.
CITY OF HEALDSBURGSTATEMENT OF CHANGES IN FIDUCIARY NET ASSETS
FIDUCIARY FUNDSFOR THE YEAR ENDED JUNE 30, 2003
PurposeTrust Funds
Private
-33-

34
CITY OF HEALDSBURGNOTES TO BASIC FINANCIAL STATEMENTS
JUNE 30, 2003
1. SIGNIFICANT ACCOUNTING POLICIES
Description of the Reporting Entity - The basic financial statements of the City of Healdsburg (City) include the financial activities of the City and its component units: the Healdsburg Community Redevelopment Agency (CRA), Healdsburg Financing Authority (HFA) and the Healdsburg Public Improvement Corporation (HPIC).
The criteria used in determining the scope of the reporting entity are based on the provisions of Governmental Accounting Standards Board Statement (GASB) 14. The City of Healdsburg is the primary government unit. Component units are those entities which are financially accountable to the primary government, either because the City appoints a voting majority of the component unitsBoard, or because the component unit will provide a financial benefit or impose a financial burden on the City.
The component s units have been accounted for as "blended" component units of the City. Despite being legally separate, these entities are so intertwined with the City that they are, in substance, part of the City's operations. Accordingly, the balances and transactions of these component units are reported within the funds of the City. Balances for the CRA are reported as separate funds in the Special Revenue, Debt Service, Capital Projects and Fiduciary Funds. HPIC transactions are included in the Water and Electric Enterprise Funds. HFA transactions are recorded in the Community Redevelopment Agency Debt Service Fund. The following criteria were used in determining that the component units were blended:
The members of the City Council or other members appointed by the City Council act as governing bodies of the CRA, HPIC and HFA. In addition, the CRA, HPIC and HFA provide services, which benefit the City.
The City and the CRA are financially interdependent, and the governing bodies of the city and CRA are the same.
The CRA and HFA are financially interdependent. The CRA makes annual payments to HFA, which are used for debt service on bonds issued by HFA.
The City and HPIC are financially interdependent. The City makes annual lease payments to HPIC, which are used for debt service on the certificates issued by HPIC.
Separate financial statements for the CRA and HPIC are available at the City's Administrative Offices.
Description of Joint Powers Authorities Participation - The City participates in two joint Powers activities and a pooled arrangement through formally organized and separate entities. The financial activities of the Northern California Power Agency, the Redwood Empire Financing Authority and the Redwood Empire Municipal Insurance Fund are not included in the accompanying basic financial statements as they are administered by boards separate from and independent of the City. (See Notes 9 and 10)
Government-Wide and Fund Financial Statements - The government-wide financial statements (i.e., the statement of net assets and the statement of changes in net assets) report information about the reporting government as a whole, except for its fiduciary activities. Governmental activities,
35
which normally are supported by taxes and intergovernmental revenues, are reported separately from business-type activities, which rely to a significant extent on fees and charges for support. Likewise, the primary government (including its blended component units) is reported separately from discretely presented component units for which the primary government is financially accountable. The City has no discretely presented component units. For the most part, the effect of interfund activity has been removed from these statements.
The statement of activities demonstrates the degree to which the direct expenses of a given function or segment are offset by program revenues. Direct expenses are those that are clearly identifiable with a specific function or segment. Program revenues include 1) charges to customers or applicants who purchase, use, or directly benefit from goods, services, or privileges provided by a given function or segment and 2) grants and contributions that are restricted to meeting the operational or capital requirements of a particular function or segment. Taxes and other items not properly included among program revenues are reported instead as general revenues.
The underlying accounting system of the City is organized and operated on the basis of separate funds, each of which is considered to be a separate accounting entity. The operations of each fund are accounted for with a separate set of self-balancing accounts that comprise its assets, liabilities, fund equity, revenues and expenditures or expenses, as appropriate. Governmental resources are allocated to and accounted for in individual funds based upon the purposes for which they are to be spent and the means by which spending activities are controlled.
Separate Financial Statements for the government s governmental, proprietary, and fiduciary funds are presented after the Government-wide Financial Statements. These statements display information about major funds individually and nonmajor funds in the aggregate for governmental and proprietary funds. Fiduciary statements, even though excluded from the government-wide financial statements includes financial information that primarily represent assets held by the City in a custodial capacity for other individuals or organizations.
Measurement Focus, Basis of Accounting, and Financial Statement Presentation - The government-wide financial statements are reported using the economic resources measurement focus and the accrual basis of accounting, as are the proprietary fund and fiduciary fund financial statements. Under the economic resources measurement focus, all assets and liabilities (whether current or noncurrent) associated with their activity are included on their balance sheets. Operating statements present increases (revenues) and decreases (expenses) in total net assets. Under the accrual basis of accounting, revenues are recorded when earned and expenses are recorded when a liability is incurred, regardless of the timing of related cash flows. Proprietary funds distinguish operating revenues and expenses from nonoperating items. Operating revenues and expenses generally result from providing services and producing and delivering goods in connection with a proprietary fund s principal ongoing operations. Nonexchange transactions, in which the City gives (or receives) value without directly receiving (or giving) equal value in exchange include property taxes, grants, entitlements, and donations. On an accrual basis, revenue from property taxes is recognized in the fiscal year which the taxes are levied. Revenue from grants, entitlements, and donations is recognized in the fiscal year in which all the eligibility requirements have been satisfied. Operating expenses for proprietary funds include the cost of sales and services, administrative expenses, and depreciation on capital assets. All revenues and expenses not meeting this definition are reported as nonoperating revenues and expenses.
When both restricted and unrestricted resources are available for use, it is the government s policy to use restricted resources first, then unrestricted resources, as they are needed.

36
Governmental fund financial statements are reported using the current financial resources measurement focus and the modified accrual basis of accounting. Under the current financial resources measurement focus, only current assets and current liabilities are generally included on their balance sheets. The reported fund balance (net current assets) is considered to be a measure of available spendable resources . Governmental fund operating statements present increases
(revenues and other financing sources) and decreases (expenditures and other financing uses) in net current assets. Accordingly, they are said to present a summary of sources and uses of available spendable resources during a period. Noncurrent portions of long-term receivables due to governmental funds are reported on their balance sheets in spite of their spending measurement focus. However, special reporting treatments are used to indicate that they should not be considered available spendable resources since they do not represent net current assets. Recognition of
governmental fund type revenue represented by noncurrent receivables is deferred until they become current receivables. Noncurrent portions of other long-term receivables are offset by fund balance reserve accounts.
Under the modified accrual basis of accounting, revenues are considered to be available when they are collectible within the current period or soon enough thereafter to pay liabilities of the current period. For this purpose, the government considers revenues to be available if they are collected within 60 days of the end of the current fiscal period. Expenditures generally are recorded when a liability is incurred, except for principal and interest on general long-term liabilities, claims payable, and compensated absences which are recognized as expenditures to the extent they have matured. General capital asset acquisitions are reported as expenditures in governmental funds. Proceeds of general long-term liabilities are reported as other financing sources.
Property taxes, franchise taxes, licenses, and interest associated with the current fiscal period are all considered to be susceptible to accrual and so have been recognized as revenues of the current fiscal period. Only the portion of special assessments receivable due within the current fiscal period is considered to be susceptible to accrual as revenue of the current period. All other revenue items are considered to be measurable and available only when cash is received by the government.
All government-wide, business-type activities and proprietary funds of the City follow FASB Statements and Interpretations issued on or before November 30, 1989, Accounting Principles Board Opinions and Accounting Research Bulletins, unless those pronouncements conflict with GASB pronouncements.
Fund Classifications- The funds designated as major funds are determined by a mathematical calculation consistent with GASB Statement No. 34.
Major Governmental Funds
The General Fund is the primary operating fund of the City. It is used to account for all revenues and expenditures that are not required to be accounted for in another fund.
The Community Redevelopment Debt/Service Fund accounts for the resources accumulated and payments made for principal and interest on long-term obligations of the Community Redevelopment Agency.
The Special Assessment Debt Service Fund accounts for the resources accumulated and payments made for principle and interest of the City s special assessment districts.
The Community Redevelopment Commercial/Industrial Fund accounts for revenues received from tax increments redevelopment projects.

37
The Community Redevelopment Low/Moderate Income Fund accounts for revenues received from tax increments for low to moderate income housing projects.
The General Capital Projects Fund accounts for non-enterprise projects acquired by the City.
Major Enterprise Funds
The Water Fund accounts for the activities of water utility to the residents of the city.
The Sewer Fund accounts for the activities of sewer utility to the residents of the city.
The Electric Fund accounts for the activities of the government s electric distribution operations.
The Streets Fund accounts for the activities of the government s street maintenance operations.
The Community Services Fund accounts for the activities of the government s parks maintenance and community cultural activity operations.
The City s fund structure also includes the following fund types:
Governmental Fund Types
The Special Revenue Funds are used to account for revenues derived from specific revenue sources. These funds are required by statute or ordinance to finance particular functions or activities of government.
The Debt Service Funds are used to account for accumulation of resources for the payment of long-term debt principal and interest.
The Capital Projects Funds are used to account for resources used for the acquisition of capital facilities by a government, except for those capital facilities financed by Enterprise Funds.
The Permanent Fund type is used to report resources that are legally restricted to the extent that only earnings, and not principal, are used for the benefit of the City.
Proprietary Fund Type
The Enterprise Funds are used to account for operations that are financed and operated in a manner similar to private business enterprises- where the intent of the governing body is that the costs (expenses including depreciation) of providing goods or services to the general public on a continuing basis be financed or recovered primarily through user charges.
The Internal Service Funds are used to account for the financing of special activities that provide services within the City. These activities include Insurance and benefits, Vehicle maintenance, Information services and Building maintenance.
Fiduciary Fund Type
Private Purpose Trust Funds are used to report trust arrangements under which principal and income benefits to support private organizations or other governments.

38
Budgets and Budgetary Accounting - The City operates under the general laws of the State of California and annually adopts a budget to be effective July 1st for the ensuing fiscal year for certain governmental funds. From the effective date of the budget, which is adopted and controlled at the fund level, the amounts stated therein as proposed expenditures become appropriations to the City's various departments. The City Manager is authorized to transfer budgeted amounts between functional categories. The City Council may amend the budget by resolution during the fiscal year. All annual appropriations lapse at year-end.
Budget information is presented for the General, certain Special Revenue Funds and Debt Service Funds budgeted on a basis consistent with generally accepted accounting principles. No budgetary comparisons are presented for certain Special Revenue Funds, Capital Projects funds and the Permanent Fund as these funds do not have budgets adopted or the budgets adopted are primarily long-term budgets which emphasize capital outlay plans extending over one year. The City prefers to leave its original budget unaltered during the year. This enables the effectiveness of individual departments in meeting budget objectives to be evaluated, and the adequacy of the budget itself to be judged. The only exceptions to this are the appropriations of unanticipated revenues, the revision of appropriations to reflect major economic events materially affecting estimated revenues, and the refocusing of particular programs requiring the reallocation of existing resources. Several supplemental appropriations were approved during the course of the year. Expenditures in excess of budgeted amounts are allowed by law but must be approved individually by the City Council.
Special Revenue Funds not budgeted are:North AreaMedia CenterCommunity Redevelopment Agency Housing BondStreet Development FeesStreet MaintenanceOther
Encumbrance Accounting is employed as an extension of the budgetary process. This method records purchase orders, contracts and other commitments for the expenditure of funds in order to reserve that portion of the applicable appropriation. The City Council honors encumbrances outstanding at year-end.
Capital Assets (including infrastructure) are recorded at cost where historical records are available and at an estimated original cost where no historical records exist. Contributed capital assets are valued at their estimated fair market value at the date of contribution. Generally, capital asset purchases in excess of $5,000 are capitalized if they have an expected useful life of 3 year(s)or more.
Capital assets include additions to public domain (infrastructure) which includes certain improvements including pavement, curb and gutter, sidewalks, traffic control devices, bridges and right-of-way corridors within the City. The City has valued and recorded all infrastructure asset data as of June 30, 2003.
Capital assets used in operations are depreciated over their estimated useful lives using the straight-line method in the Government-wide Financial Statements and in the Fund Financial Statements of the Proprietary Funds. Depreciation is charged as an expense against operations and accumulated depreciation is reported on the respective balance sheet. The lives used for depreciation purposes of each capital asset class are:

39
Buildings 10 to 30 yearsImprovements other than buildings 10 yearsWater distribution lines 10 to 50 yearsVehicles 3 to 15 yearsMachinery and equipment 10 yearsOffice furniture, computers and equipment 3 to 10 yearsLeased property 5 to 10 yearsInfrastructure 50 years
Inventory is valued at cost using the first-in, first-out (FIFO) method. Inventory of the General Fund consists of expendable supplies held for consumption. The cost is recorded as an expenditure in the General Fund at the time individual inventory items are consumed rather than when purchased. Inventory of the Enterprise Funds consist principally of materials and supplies for utility operations.
Cash and Investments are pooled by the City for investment purposes. Investments are stated at fair value. Fair value is the value at which a financial instrument could be exchanged in a current transaction between willing parties, other than in a forced or liquidation sale.
Vested Vacation and Sick Leave obligations are fully funded and recorded in the Insurance and Benefit Internal Service Fund as accrued compensated absences.
Property Tax Levy, Collection and Maximum Rates The State of California (State) Constitution Article XIII A provides that the combined maximum property tax rate on any given property may not exceed one percent of its assessed value unless an additional amount for general obligation debt has been approved by voters. Assessed value is calculated at 100 percent of market value as defined by Article XIII A and may be adjusted by no more than two percent per year unless the property is sold or transferred. The State Legislature has determined the method of distribution of receipts from a one percent tax levy among the counties, cities, school districts and other districts.
Sonoma County assesses properties, bills for and collects secured and unsecured property taxes as follows:
Secured Unsecured
Lien dates January 1 January 1Levy dates July 1 July 1Due dates 50% on November 1 July 1
50% on February 1Delinquent as of December 10 (for November) August 31
April 10 (for February)
The term "unsecured" refers to taxes on personal property. These taxes are secured by liens on the property being taxed.
The City accrues only those taxes, which are levied for the tax year and received within sixty days after year-end.
Statement of Cash Flows For the purpose of the statements of cash flows, cash and cash equivalents include highly liquid investments with original maturities of three months or less, including investments in the California Local Agency Investment Fund and Sonoma County Investment Fund.

40
Claims Payable - The City reports its risk activities in the Insurance and Benefit Service Fund. When it is probable that a claim liability has been incurred at year-end, and the amount of the loss can be reasonably estimated, the City records the estimated loss, net of any insurance coverage under its self-insurance program. Estimated claims losses, if any, include an accrual for IBNR ("incurred but not reported") claims. Small dollar claims are recorded as expenditures when paid.
Use of Estimates - The preparation of financial statements in conformity with accounting principles generally accepted in the United States of America requires management to make estimates and assumptions that affect the reported amounts of assets and liabilities and disclosure of contingent assets and liabilities at the date of the financial statements and the reported amounts of revenues and expenditures during the reporting period. Specifically, the City has made certain estimates and assumptions relating to the collectibility of its receivables (including accounts receivable, and notes receivable, the valuation of property held for resale, valuation of capital assets and depreciation expense, and the ultimate outcome of claims payable. Actual results could differ from those estimates and assumptions.
2. CASH AND INVESTMENTS:
Cash and investments at June 30, 2003 consisted of the following:
FiduciaryGovernment Fund
Wide Statement ofStatement of Assets andNet Assets Liabilities Total
Unrestricted assets:Cash and investments $ 39,856,815 $ 835,796 $ 40,692,611
Restricted assets:Cash and investments 41,274,795 - 41,274,795
TOTAL CASH AND INVESTMENTS $ 81,131,610 $ 835,796 $ 81,967,406
Authorized Investments:
Under provisions of the City's Investment Policy, bond indentures, related trust agreements and in accordance with Section 53601 of the California Government Code, the City may invest in the following types of instruments:
a. Securities of the U.S. Government, or its agenciesb. Negotiable Certificates of Depositc. Bankers Acceptances d. Commercial Papere. Local Agency Investment Fund (State Pool)f. Sonoma County Investment Fund (County Pool)g. Medium Term Corporate Notes having a rating by Moodys or Standard & Poors of A or better
with maturities of five years or lessh. Tax Anticipation Notes of the Redevelopment Agencyi. Repurchase Agreementsj. Mutual Funds

41
The City is a voluntary participant in the Local Agency Investment Fund (LAIF) that is regulated by California Government Code Section 16429 under the oversight of the Treasurer of the State of California. The fair value of the City's investment in this pool is reported in the accompanying financial statements at amounts based upon the city's pro-rata share of the fair value provided by LAIF for the entire LAIF portfolio (in relation to the amortized cost of that portfolio). The balance available for withdrawal is based on the accounting records maintained by LAIF, which are recorded on an amortized cost basis. Included in LAIF's investment portfolio are collateralized mortgage obligations, mortgage-backed securities, other asset-backed securities, and floating rate securities issued by federal agencies, government-sponsored enterprises, and corporations.
The City is a voluntary participant in the Sonoma County Investment Fund (County Pool) that is regulated by California Government Code Section 16429 under the oversight of the Treasurer of the County of Sonoma. The fair value of the City's investment in this pool is reported in the accompanying financial statements at amounts based upon the city's pro-rata share of the fair value provided by the County for the entire County portfolio (in relation to the amortized cost of that portfolio). The balance available for withdrawal is based on the accounting records maintained by the County, which are recorded on an amortized cost basis. Included in Sonoma County s investment portfolio are collateralized mortgage obligations, mortgage-backed securities, other asset-backed securities, and floating rate securities issued by federal agencies, government-sponsored enterprises, and corporations.
Classification of Deposits and Investments By Credit Risk:
In accordance with GASB Statement No. 3, deposits are classified as to credit risk by three categories as follows:
Category 1 - Insured or collateralized with securities held by the City or by its agent in the City s name.
Category 2 - Collateralized with securities held by the pledging financial institution s trust department or agent in the City s name.
Category 3 - Uncollateralized
Investments that are represented by specific identifiable investment securities are classified as to credit risk by three categories as follows:
Category 1 - Insured or registered, or securities held by the City or its agent in the City s name.
Category 2 - Uninsured and unregistered with securities held by the counterparty s trust department or agent in the City s name.
Category 3 - Uninsured and unregistered with securities held by the counterparty, or by its trust department or agent but not in the City s name.
Investments Not Subject to Categorization:
Investments in the California Local Agency Investment Fund, Sonoma County Pooled Investment Fund, and Mutual Funds are not categorized, as Governmental Accounting Standards Board Statement No. 3 does not require the categorization of Mutual Funds or investment pools managed by another government.

42
(This page left intentionally blank).

43
Deposits and investments were categorized as follows at June 30, 2003:
Category Bank Carrying1 2 3 Balances Amount
Deposits:Demand accounts $ 101,350 $ 654,707 $ 27,725 $ 783,782 $ 546,952
Total Deposits $ 101,350 $ 654,707 $ 27,725 $ 783,782 546,952
Category Not Fair 1 2 3 Categorized Value
InvestmentsFederal Agencies $ 30,428,694 $ - $ - $ - $ 30,428,694Commercial Paper 9,990,090 - - - 9,990,090U.S. Treasury Bills 9,995,593 - - - 9,995,593Bankers Acceptance 2,997,841 - - - 2,997,841Mutual Funds - - - 16,119,470 16,119,470California Local Agency Investment Fund - - - 1,459,891 1,459,891Sonoma Co. Investment Pool - - - 233,965 233,965
Investments w/Fiscal AgentSonoma County - - 579,369 - 579,369
Mutual Funds - - - 9,615,541 9,615,541
Total Investments $ 53,412,218 $ - $ 579,369 $ 27,428,867 81,420,454
TOTAL DEPOSITS AND INVESTMENTS $81,967,406
3. INTERFUND RECEIVABLES/PAYABLES AND TRANSFERS:
Due to and from other funds at June 30, 2003 are as follows:
Receivable Fund Payable Fund AmountGeneral Fund Other Governmental Funds $ 13,620
Other Enterprise Funds 95,397
Electric Enterprise Fund Other Governmental Funds 73,000Other Enterprise Funds 14,008
Total $ 196,025
The amounts loaned from the General and Electric Enterprise funds to the various funds are to provide short-term loans to fund operations.
The compositions of the City s interfund transfer balances as of June 30, 2003 are as follows:

44
In the Fund Financial Statements, total transfers out of $24,803,758 are greater than transfers in of $24,753,758 because of treatment of transfers from other governmental to fiduciary funds in the amount of $50,000.
The General Fund transferred monies to the Internal Service Fund to fund the maintenance of Public Safety Buildings, Capital Projects fund capital purchases of new equipment for public safety.
Community Redevelopment Debt Service transferred monies from bond proceeds to the Community Redevelopment Commercial/Industrial Fund.
All other monies transferred were used to fund capital purchases.
Transfers Out
Transfers In General Fund
Community Redevelopment
Debt Service
Community Redevelopment
Commercial/Industrial
Community Redevelopment Low/Moderate
Income
General Capital Projects
Community Redevelopment Debt Service $ - $ - $ 1,508,694 $ 318,882 $ -
Community Redevelopment Commercial/Industrial - 11,505,000 - - 229,958
General Capital Projects 30,000 - 2,276,242 1,057,411 216,670
Water - - - 3,281 -
Sewer - - - 3,282 -
Streets - - - - 1,960,341
Other Enterprise Funds 100,400 - 733,500 -
Internal Service Funds 15,000 - - - 71,441 Other Governmental Funds - - - - 87,000
Totals $ 145,400 $ 11,505,000 $ 4,518,436 $ 1,382,856 $ 2,565,410

45
Other Governmental
Funds Water Sewer Electric StreetsCommunity
Services Total
$ - $ - $ - $ - $ - $ - $ 1,827,576
- 250,000 35,042 - 4,954 160,470 12,185,424
317,325 285,042 50,000 94,814 - - 4,327,504
350,000 - - - - - 353,281
- - - - - - 3,282
1,856,553 - - - - - 3,816,894
507,543 - - - - - 1,341,443
- - - 85,913 - - 172,354
374,000 - - - - 265,000 726,000
$ 3,405,421 $ 535,042 $ 85,042
$ 180,727 $ 4,954 $ 425,470 $ 24,753,758
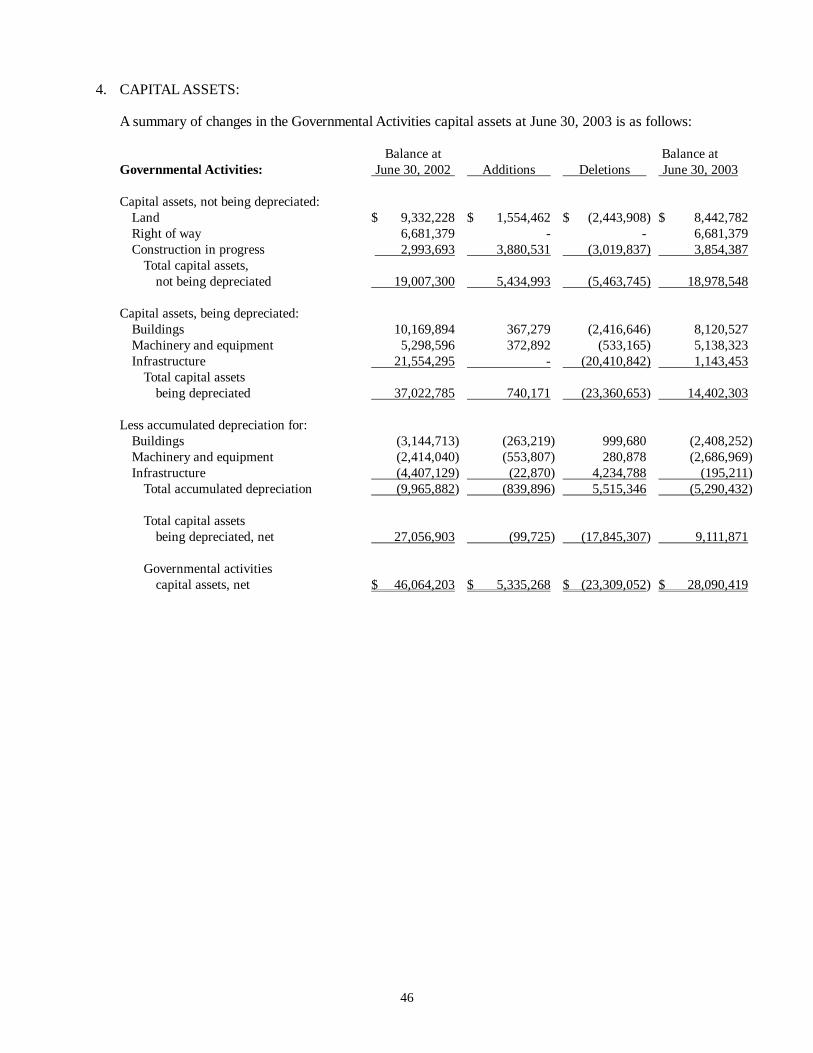
46
4. CAPITAL ASSETS:
A summary of changes in the Governmental Activities capital assets at June 30, 2003 is as follows:
Balance at Balance atGovernmental Activities: June 30, 2002 Additions Deletions June 30, 2003
Capital assets, not being depreciated:Land $ 9,332,228 $ 1,554,462 $ (2,443,908) $ 8,442,782Right of way 6,681,379 - - 6,681,379Construction in progress 2,993,693 3,880,531 (3,019,837) 3,854,387
Total capital assets,not being depreciated 19,007,300 5,434,993 (5,463,745) 18,978,548
Capital assets, being depreciated:Buildings 10,169,894 367,279 (2,416,646) 8,120,527Machinery and equipment 5,298,596 372,892 (533,165) 5,138,323Infrastructure 21,554,295 - (20,410,842) 1,143,453
Total capital assetsbeing depreciated 37,022,785 740,171 (23,360,653) 14,402,303
Less accumulated depreciation for:Buildings (3,144,713) (263,219) 999,680 (2,408,252)Machinery and equipment (2,414,040) (553,807) 280,878 (2,686,969)Infrastructure (4,407,129) (22,870) 4,234,788 (195,211)
Total accumulated depreciation (9,965,882) (839,896) 5,515,346 (5,290,432)
Total capital assetsbeing depreciated, net 27,056,903 (99,725) (17,845,307) 9,111,871
Governmental activitiescapital assets, net $ 46,064,203 $ 5,335,268 $ (23,309,052) $ 28,090,419

47
A summary of changes in the Business-type Activities capital assets at June 30, 2003 is as follows:
Balance at Balance atBusiness-type Activities: June 30, 2002 Additions Deletions June 30, 2003
Capital assets, not being depreciated:Land and land rights $ 3,812,734 $ 18,070 $ - $ 3,830,804Construction in progress 9,947,999 3,095,053 (2,017,702) 11,025,350
Total capital assets,not being depreciated 13,760,733 3,113,123 (2,017,702) 14,856,154
Capital assets, being depreciated:Buildings 5,901,428 17,394 - 5,918,822Streets 20,430,847 713,827 - 21,144,674Utility Systems 40,738,827 2,653,253 - 43,392,080Drainage 8,617,341 46,921 - 8,664,262Machinery and equipment 1,468,064 104,520 - 1,572,584Operations 1,088,633 106,893 - 1,195,526
Total capital assetsbeing depreciated 78,245,140 3,642,808 - 81,887,948
Less accumulated depreciation for:Buildings (2,396,640) (171,608) - (2,568,248)Streets (4,345,030) (411,535) - (4,756,565)Utility Systems (9,451,058) (760,650) - (10,211,708)Drainage (4,208,530) (265,005) - (4,473,535)Machinery and equipment (580,372) (70,050) - (650,422)Operations (390,354) (18,837) - (409,191)
Total accumulated depreciation (21,371,984) (1,697,685) - (23,069,669)
Total capital assetsbeing depreciated, net 56,873,156 1,945,123 - 58,818,279
Business-type activitiescapital assets, net $ 70,633,889 $ 5,058,246 $ (2,017,702) $ 73,674,433
Beginning balance of capital assets of business-type activities include $22,045,527 of capital assets contributed by government activities.
Depreciation expense was charged to functions/programs of the primary government as follows:
Governmental Activities:General government $ 103,135Public safety 176,703Community development 5,988Unallocated infrastructure depreciation 22,870Capital assets held by the government s internal
service funds are charged to the various functionsbased on their usage of the assets 531,201
Total depreciation expense - governmental activities $ 839,897

48
Business-type Activities:
Water $ 326,350 Sewer 462,182 Electric 343,468 Street 412,072 Community Services 90,384 Other 62,853
Total Depreciation expense - business-type activities $ 1,697,309
5. LONG-TERM LIABILITIES:
The following is a summary of long-term liability transactions for the year ended June 30, 2003:
Governmental ActivitiesBalance at
June 30, 2002Additions Reductions Balance at
June 30, 2003Current Portion
General Obligation (GO)1998 Refunding $ 2,255,000 $ - $ (120,000) $ 2,135,000 $ 120,0001993 Refunding 3,690,000 - (105,000) 3,585,000 115,000Total GO Bonds 5,945,000 - (225,000) 5,720,000 235,000
Tax Allocation Bonds (TAB):1995 Series 3,555,000 - (65,000) 3,490,000 70,0002002 Series A 14,290,000 - (260,000) 14,030,000 270,0002002 Series C 5,630,000 - (100,000) 5,530,000 100,0002003 Series A - 13,000,000 - 13,000,000 210,0002003 Series B - 6,370,000 - 6,370,000 125,000Total TAB Bonds 23,475,000 19,370,000 (425,000) 42,420,000 775,000
Certificates of Participation (COP)REFA Series II 130,000 - (130,000) - -REFA Series III 290,000 - (290,000) - -Total COP Bonds 420,000 - (420,000) - -
Special Assessments:Foss Creek 410,000 - (100,000) 310,000 50,000Area A 2,050,000 - (130,000) 1,920,000 100,000Total Special Assessments 2,460,000 - (230,000) 2,230,000 150,000
Compensated Absences 1,285,823 235,745 (1,556) 1,520,012 1,520,012Bond Discount (242,125) 2,130 (239,995) -
Governmental Activities Long Term Liabilities $ 33,585,823 $ 19,363,620 $ (1,299,426) $ 51,650,017 $ 2,680,012

49
Business-type ActivitiesBalance at
June 30, 2002Additions Reductions Balance at
June 30, 2003Current Portion
Certificate of Participation1992 Electric Improvements $ 165,000 $ - $ (165,000) $ - $ -1996 Sewer Improvements 875,000 - (20,000) 855,000 20,0002000 B CSCDA Water 3,080,000 - (50,000) 3,030,000 55,0002000 B CSCDA Sewer 2,565,000 - (40,000) 2,525,000 45,0002001 A CSCDA Water 6,975,000 - (230,000) 6,745,000 230,0002003 C CSCDA
Water/Wastewater - 5,510,000 - 5,510,000 110,00013,660,000 5,510,000 (505,000) 18,665,000 460,000
Bond Discount (130,631) (56,674) 13,677 (173,628) -Business-type Activities Long Term Liabilities $ 13,529,369 $ 5,453,326 $ (491,323) $ 18,491,372 $ 460,000
Governmental Activities
a.1998 General Obligation Refunding Bonds:
In March 1998, the City issued $2,675,000 in General Obligation Refunding Bonds to advance refund $2,410,000 of outstanding 1990 Series B General Obligation Bonds. The net proceeds were deposited in an irrevocable trust with an escrow agent to provide for all future debt service payments on the 1990 Series B bonds. As a result, the 1990 Series B bonds are considered to be defeased, and the liability for those bonds has been removed from the long term liabilities. Interest on bonds varies from 3.80% to 5.05% with semi-annual debt service payments on August 1 and February 1 of each year with principal maturing August 1, 1998 through August 1, 2015. Debt service payments are made from property tax levy authorized by the voters. The 1990 B General Obligation were redeemed on August 1, 2000.
b. 1993 General Obligation Refunding Bonds:
In December 1993, the City issued $4,175,000 in General Obligation Refunding Bonds to advance refund the 1990 Series A General Obligation Bonds. The proceeds from the refunding issue were placed in an irrevocable trust with an escrow agent to provide the remaining debt service payments on the refunded debt. Accordingly, the trust account assets and the liability for the defeased bonds are not included in the City s financial statements. Interest on the bonds varies between 4.3% to 5.375% with semi-annual debt service payments on February 1 and August 1 of each year with principal maturing August 1, 1994 through August 1, 2015. Debt service payments are made from property taxes levy authorized by the voters. The 1990 Series A General Obligation bonds were redeemed on August 1, 2000.
c. Tax Allocation Bonds:
1995 Series In December 1995, the Agency issued $3,900,000 1995 Tax Allocation Bonds. The Bonds were issued to finance improvements in the Sotoyome Project Area. Interest on the bonds varies from 4.20% to 7.50% with semi-annual debt service payments on June 1, and December 1 of each year with principal maturing annually December 1, 1996 through December 2025. Debt Service payments will be made from tax increment revenue received by the Agency.
2002 Series A 2002 Series A In March 2002, the Healdsburg Financing Authority issued $14,290,000 in Tax Allocation Bonds on behalf of the Agency. The bonds were issued to finance improvements in the Sotoyome Project Area and to advance refund the 1993 Series A Certificates of Participation. Interest on the bonds varies from 1.7% to 5.125 % with semi-annual debt service payments on February 1 and August 1 of each year with principal maturing

50
annually August 1, 2002 through August 2031. Debt service payments will be made from tax increment revenue received by the Agency.
The amount of defeased 1993 Series A Certificates of Participation outstanding at June 30, 2003 was $2,460,000.
2002 Series C In March 2002, the Healdsburg Financing Authority issued on behalf of the Agency $5,630,000 in Tax Allocation Bonds. The Bonds were issued to finance low and moderate income housing land acquisition and improvements in the Sotoyome Project Area. Interest on the bonds varies from 1.7% to 5.125% with semi-annual debt service payments on February 1, and August 1 of each year with principal maturing annually August 1, 2002 through August 2031. Debt Service payments will be made from tax increment revenue received by the Agency.
2003 Series A In April 2003, the Agency issued $13,000,000 Series A 2003 Tax Allocation Bonds. The Bonds were issued to finance certain redevelopment activities within or to the benefit of the Agency s Sotoyome Project Area, fund a reserve account and pay for costs of issuance of the Bonds. Interest on the bonds varies from 1.46% to 4.45% with semi-annual debt service payments on February 1 and August 1 of each year with principal maturing annually August 1, 2003 through 2031. Debt service payments will be made from tax increment revenue received by the Agency.
2003 Series B In April 2003, the Agency issued $6,370,000 Series B 2003 Tax Allocation Bonds. The Bonds were issued to finance certain redevelopment activities within or to the benefit of the Agency s Sotoyome Project Area, fund a reserve account and pay for costs of issuance of the Bonds. Interest on the bonds varies from 1.46% to 4.45% with semi-annual debt service payments on February 1 and August 1 of each year with principal maturing annually August 1, 2003 through 2031. Debt service payments will be made from tax increment revenue received by the Agency and allocated to the Low/Moderate Income Housing Fund.
d. Certificates of Participation:
The City and Redevelopment Agency have financed various capital improvements through lease purchase contracts utilizing Certificates of Participation as a source of funds. The certificates represent interests of the owners in lease payments to be made by the City or Redevelopment Agency.
Series II - The Certificates were authorized and issued in the amount of $1,135,000 in March 1983 to provide funds for the improvement of the City's drainage system. Interest on the Certificates varies from 7.0% to 9.0% with semi-annual debt service payments on March 1 and September 1 of each year with principal maturing annually beginning March 1, 1994 through March 1, 2003. Debt Service payments are made from the Redevelopment Agency Debt Service Funds. These Certificates were redeemed in fiscal year 2002 2003.
Series III - 1992 Refunding - The Certificates were authorized and issued in the amount of $810,000 in June 1992 to provide funds to defease the Series III Certificates issued in 1987. The Series III Certificates have been paid in full. Interest on the Certificates varies from 3.75% to 6.40% with semi-annual debt service payments due on May 1 and November 1 of each year with principal maturing annually beginning November 1, 1993 through November 1, 2005. Debt service payments will be made from the General City and Redevelopment Agency Debt Service Funds. These Certificates were redeemed in fiscal year 2002 2003.

51
e. Special Assessment Debt with Government Commitment:
Proceeds from the assessment bonds issued for each district were used to constructimprovements that benefited the property owners in that district. Debt service payments are made from special assessment taxes collected from property owners by the County of Sonoma. The City has recorded the bonds as a liability because they may make temporary advance payment of debt service if sufficient funds have not been collected. Also, the assessments receivable have been recorded in a Debt Service Fund offset by an equal amount of deferred revenues in accordance with the provisions of GASB Statement 6.
f. Debt Service Requirements:
Annual debt service requirements, which include principal and interest of $93,282,682 to maturity for Governmental Activity Long Term Liabilities, are as follows:
Year Ending June 30
General Obligation Bonds Special Assessment Bonds Tax Allocation Bonds
Interest Principal Interest Principal Interest Principal2004 $278,035 $235,000 $153,043 $155,000 $1,864,998 $780,0002005 267,039 255,000 141,420 180,000 2,110,387 845,0002006 255,028 275,000 127,511 210,000 2,089,688 865,0002007 241,951 295,000 111,776 215,000 2,064,427 880,0002008 227,523 325,000 98,700 140,000 2,034,941 905,000
2009 2013 849,978 2,215,000 325,886 855,000 9,592,046 5,000,0002014 2018 182,687 2,120,000 41,066 475,000 8,266,553 6,140,0002019 2023 - - - - 6,436,380 7,750,0002024 2028 - - - - 4,054,278 9,730,0002029 2033 - - - - 1,097,343 9,525,000
$ 2,302,241 $ 5,720,000 $ 999,402 $ 2,230,000 $39,611,041 $ 42,420,000
BUSINESS-TYPE ACTIVITIES
g. 1992 Electric Improvement Certificates:
The Certificates were authorized and issued by the Healdsburg Public Improvement Corporation in the amount of $250,000 in March 1992 to provide funds for capital improvements to the City's electric system. The interest rate on the Certificates varies from 4.25% to 6.85% with semi-annual debt service payments payable on March 1, and September 1 in each year commencing September 1, 1992. Principal on the Certificates is payable annually from March 1, 1993 through March 1, 2012. Revenues from the operation of the electric utility system will be used to make the debt service payments. In a subsequent action, the City Council authorized the use of the funds for the City s contribution to the NCPA Lake County effluent pipeline project to enhance geothermal project efficiency. These Certificates were redeemed in fiscal year 2002 2003.
h. 1996 Sewer Improvement Certificates
The Certificates were authorized and issued by the Healdsburg Public Improvement Corporation in the amount of $950,000 to provide funds for capital improvements to the City s sewer system. The interest on the Certificates varies from 4.50% to 8.50% with semi-annual debt service payments payable on June 1 and December 1 commencing June 1, 1997. Principal on the

52
certificates is payable annually from December 1, 1997 through December 1, 2026. Revenues from the operation of the sewer utility will be used to make the debt service payments.
i. 2000 Water and Sewer CSCDA Certificates
The bonds were authorized and issued on July 25, 2000 by the California Statewide Communities Development Authority in the amount of $3,130,000 for water and $2,605,000 for sewer totaling $5,735,000 to provide funds for capital improvements.
The interest on the bond varies from 4.10% to 5.15% with semi-annual debt service payments payable on April 1 and October 1 commencing October 1, 2000 through October 1, 2030. Revenues from the operation of the water and sewer utilities will be used to make debt service payments.
j. 2001 Water CSCDA Certificates
The bonds were authorized and issued by the California Statewide Communities Development Authority in the amount of $7,170,000 of refunding revenue bonds on March 1, 2001. The interest on the bonds varies from 2.9% to 4.5% with semi-annual debt service paymentspayable on April 1 and October 1 of each year commencing October 1, 2001. Principal on the bonds is payable annually from October 1, 2001 through October 1, 2026. Revenues from the operation of the water utility will be used to make the debt service payments. The proceeds of $6,886,409 (after the bond discount and payment of underwriter fees, insurance and other issuance costs of $283,590) plus the debt service reserves of the refunded issues was used to purchase State and Local Government Securities (SLGS). These securities were deposited in an irrevocable trust with an escrow agent to provide for all future debt service payments for the following Certificates of Participation - 1992 Water, 1993 REFA Series C, 1995 Water and 1996 Water. All of these above-mentioned certificates are considered defeased and the liability for these have been removed from long-term debt. As of June 30, 2002, $6,880,000 remained outstanding on these refunded issues.
k. 2003 Water CSCDA Certificates
The Bonds were authorized and issued by the California Statewide Communities Development Authority on behalf of the City in the amount of $5,510,000 in October 2002. The proceeds are to be used for water improvement projects. The interest on the bonds varies from 2.0% to 3.6% with semi-annual debt service payments payable on April 1 and October 1 commencing April 1, 2003. Principal on bonds is payable annually from October 1, 2003 through October 1, 2032.Revenues from the operation of the water utility will be used to make the debt service payments.

53
l. Annual Debt Service Requirements:
Annual debt service requirements to maturity for proprietary long-term liabilities, including interest of $32,857,704 are as follows:
Year Ending June 30
Certificates of Participation
Interest Principal
2004 $ 848,653 $ 460,0002005 833,603 470,0002006 818,341 480,0002007 802,170 505,0002008 785,104 505,000
2009 2013 3,619,553 2,880,0002014 2018 2,994,279 3,095,0002019 2023 2,137,176 3,940,0002024 2028 1,088,327 3,825,0002029 2033 265,498 2,505,000
$ 14,192,704 $ 18,665,000
6. CONDUIT DEBT
Total bonds outstanding related to special facility revenue bonds is $5,870,000 at June 30, 2003. These bonds were issued to provide hospital facilities. The City is not liable for repayment of the special facility revenue bonds, and accordingly, they are not reflected in the accompanying basic financial statements.
7. EMPLOYEES' RETIREMENT PLAN
Plan Description
The City of Healdsburg contributes to the California Public Employees' Retirement System (PERS), an agent multiple-employer public employee defined benefit pension plan. PERS provides retirement and disability benefits, annual cost-of-living adjustments, and death benefits to plan members and beneficiaries. PERS acts as a common investment and administrative agent for participating public entities within the State of California. Benefit provisions and all other requirements are established by state statute and City Ordinance. Copies of PERS annual financial report may be obtained from their executive office: 400 P Street, Sacramento, CA 95814.
Funding Policy
The City is required to contribute at an actuarially determined rate; the current rate is 1.091% for miscellaneous employees and 1.558% for safety employees of annual covered payroll. The contribution requirements of plan members and the City are established and may be amended by PERS. The City, due to a collective bargaining agreement, also has a legal obligation to contribute 7% (9% for safety employees) of each participant s annual covered salary.
Annual Pension Cost
For 2003, the City s annual pension cost of $677,861 for PERS was equal to the City s required and actual contributions. The required contribution was determined as part of the June 30, 2001, actuarial valuation using the entry age normal actuarial cost method. The actuarial assumptions included (a) 8.25% investment rate of return (net of administrative expenses), (b) projected annual
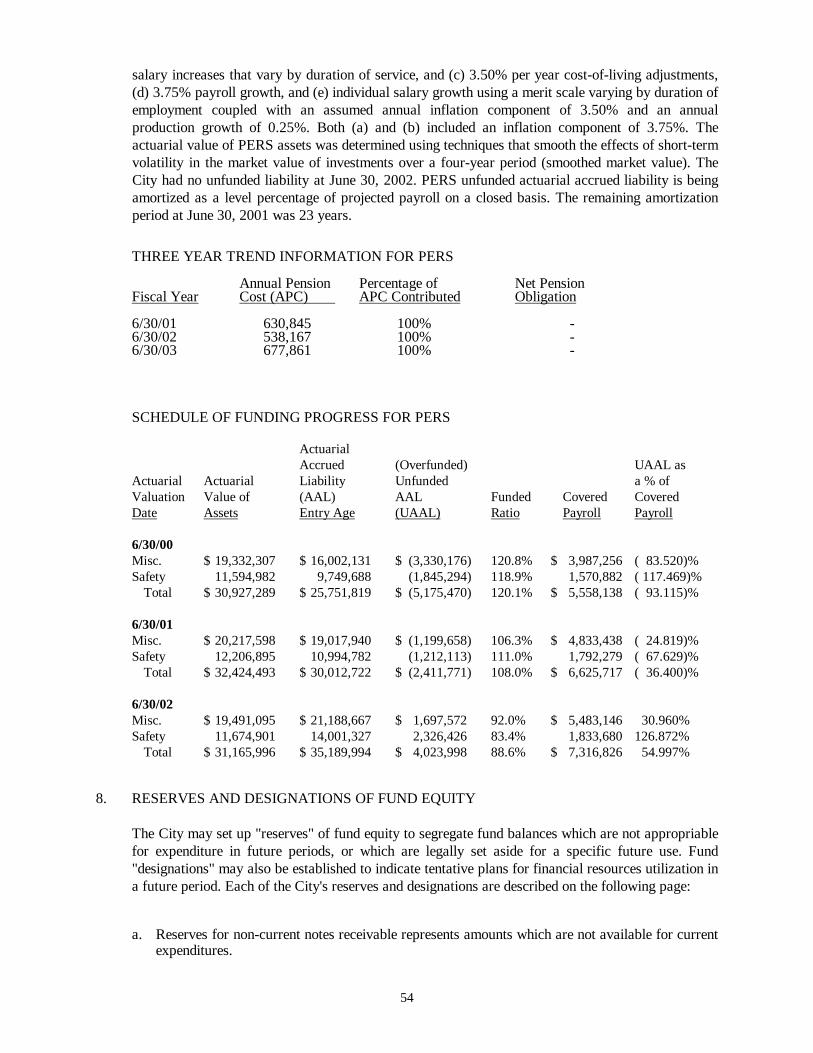
54
salary increases that vary by duration of service, and (c) 3.50% per year cost-of-living adjustments, (d) 3.75% payroll growth, and (e) individual salary growth using a merit scale varying by duration of employment coupled with an assumed annual inflation component of 3.50% and an annual production growth of 0.25%. Both (a) and (b) included an inflation component of 3.75%. The actuarial value of PERS assets was determined using techniques that smooth the effects of short-term volatility in the market value of investments over a four-year period (smoothed market value). The City had no unfunded liability at June 30, 2002. PERS unfunded actuarial accrued liability is being amortized as a level percentage of projected payroll on a closed basis. The remaining amortization period at June 30, 2001 was 23 years.
THREE YEAR TREND INFORMATION FOR PERS
Annual Pension Percentage of Net PensionFiscal Year Cost (APC) APC Contributed Obligation
6/30/01 630,845 100% -6/30/02 538,167 100% -6/30/03 677,861 100% -
SCHEDULE OF FUNDING PROGRESS FOR PERS
ActuarialAccrued (Overfunded) UAAL as
Actuarial Actuarial Liability Unfunded a % ofValuation Value of (AAL) AAL Funded Covered CoveredDate Assets Entry Age (UAAL) Ratio Payroll Payroll
6/30/00Misc. $ 19,332,307 $ 16,002,131 $ (3,330,176) 120.8% $ 3,987,256 ( 83.520)%Safety 11,594,982 9,749,688 (1,845,294) 118.9% 1,570,882 ( 117.469)%
Total $ 30,927,289 $ 25,751,819 $ (5,175,470) 120.1% $ 5,558,138 ( 93.115)%
6/30/01Misc. $ 20,217,598 $ 19,017,940 $ (1,199,658) 106.3% $ 4,833,438 ( 24.819)%Safety 12,206,895 10,994,782 (1,212,113) 111.0% 1,792,279 ( 67.629)%
Total $ 32,424,493 $ 30,012,722 $ (2,411,771) 108.0% $ 6,625,717 ( 36.400)%
6/30/02Misc. $ 19,491,095 $ 21,188,667 $ 1,697,572 92.0% $ 5,483,146 30.960%Safety 11,674,901 14,001,327 2,326,426 83.4% 1,833,680 126.872%
Total $ 31,165,996 $ 35,189,994 $ 4,023,998 88.6% $ 7,316,826 54.997%
8. RESERVES AND DESIGNATIONS OF FUND EQUITY
The City may set up "reserves" of fund equity to segregate fund balances which are not appropriable for expenditure in future periods, or which are legally set aside for a specific future use. Fund "designations" may also be established to indicate tentative plans for financial resources utilization in a future period. Each of the City's reserves and designations are described on the following page:
a. Reserves for non-current notes receivable represents amounts which are not available for current expenditures.

55
b. Reserve for inventory and prepaid items represents amounts, which are not available to meet current expenditures.
c. Reserve for low and moderate income housing represents amounts setaside in the Community Redevelopment Low/Moderate Income Capital Projects Fund.
d. Reserves for debt service represent amounts accumulated in accordance with bond indenture or similar covenant.
e. Reserve for Community and Economic Development has been established to reflect bond proceeds restricted for Capital Improvements.
f. Reserve for multi-year programs reserves are amounts set aside for long-term capital projects.
9. NORTHERN CALIFORNIA POWER AGENCY
The City is a member of Northern California Power Agency (NCPA), which operates under a joint powers agreement among fourteen public agencies consisting of eleven cities with publicly owned electric distribution systems, one irrigation district, one public utility district, one port authority and four associate member entities. The purpose of NCPA is to use the combined strength of its members to purchase, generate, sell, and interchange electric energy and capacity through the acquisition and use of electrical generation and transmission facilities. Each NCPA member has agreed to fund a pro rata share of certain assessments by NCPA and enter into power supply contracts with NCPA to purchase power in support of bearing the costs of NCPA operations, energy and facilities. While governed by its members, none of NCPA's obligations are those of its members unless expressly assumed by them. Amounts paid by the City to NCPA during the year ended June 30, 2003, were as follows:
Purchased power (reported as an expense of the Electric Fund) $ 4,870,163Advances and assessments, net of refunds 755,991Total $ 5,626,154
The City s interest in NCPA projects and reserves, as computed by NCPA, was $1.6 million at June 30, 2003. This amount represents the City s portion of funds which resulted from the reconciliations of several prior years budgets for programs. It is recognized that all the funds credited to the City are linked to the collection of revenue from the City s ratepayers, or to the settlement of disputes relating to electric power supply and that the money was collected from the City s ratepayers to pay power bills. Additionally, the NCPA Commission identified and approved the funding of specific reserves for working capital, accumulated employee s post-retirement medical benefits, and billed property taxes for the geothermal project. The Commission also identified a number of contingent liabilities that may or may not be realized, the cost of which in most cases is difficult to estimate at this time. One such contingent liability is the steam field depletion which will require funding to cover debt service and operational costs in excess of the expected value of the electric power. The General Operating Reserve is intended to minimize the number and amount of individual reserves needed for each project, protect NCPA s financial condition and maintain its credit worthiness. These funds are available on demand but the City has left them with NCPA as a reserve against these contingencies identified by NCPA.
Members of NCPA may participate in an individual project of NCPA without obligation for any other project. Member assessments collected for one project may not be used to finance other projects of NCPA without the member s permission.
The City additionally purchased energy directly from the Western Area Power Administration totaling $613,721 and paid assessments totaling $106,760.

56
NCPA Geothermal Project
A purchase power agreement with NCPA obligates the City for a 3.31% share of the operating costs and debt service of two of NCPA's 110-megawatt steam powered generating plants, Project Number 2 and Project Number 3. Total outstanding debt of the NCPA Geothermal Project at June 30, 2003 is $261,200 thousand.
NCPA s Geothermal project has experienced a greater than originally anticipated decline in steam production from geothermal wells on its leasehold property. Results of the continuing well analysis program indicate that the potential productive capacity of the geothermal steam reservoir is less than originally estimated. Therefore, NCPA has modified the operations of the Geothermal Project to reduce the average annual output from past levels. As a result, the per unit cost of energy generated by the projects will be higher than anticipated.
NCPA will continue to monitor the wells while pursuing alternatives for improving and extending reservoir performance, including supplemental water reinjection, plant equipment modifications, and changes in operating methodology. NCPA, along with other steam field operators, has observed a substantial increase in steam production in the vicinity of reinjection wells and is attempting to increase water reinjection at strategic locations. NCPA, other steam developers, and the Lake County Sanitation District constructed a wastewater pipeline project that greatly increased the amount of water available for reinjection.
Calaveras Hydroelectric Project
In July 1981 NCPA agreed with the Calaveras County Water District to purchase the output of the North Fork Stanislaus River Hydroelectric Development Project and to finance its construction. Debt service payments began in February 1990 when the operating portions were declared substantially complete. Under a power purchase agreement with NCPA, the City is obligated to pay 1.66% of the debt service and operating costs. At June 30, 2003 approximately $505,840 thousand in long-term debt used to finance this project was outstanding. NCPA has initiated a series of restructurings and early calls which will reduce annual debt service and comparative cost of energy from this resource. The City chose to lower debt service payment obligations by making a $1,603,580 debt reduction payment in early 2002.
NCPA Combustion Turbine Project
In October 1984, NCPA financed a five-unit, 125-megawatt combustion turbine project. The project, built in three member cities, began full commercial operation in June 1986, providing reserve and peaking power. Under the NCPA power purchase agreement, the City is obligated to pay 3.5% of the debt service and operating costs. The Combustion Turbine Project was completed in June 1990. Project participation costs are substantially less than the cost of power which would otherwise be purchased. At June 30, 2003 approximately $27,790 thousand in long-term debt related to this project was outstanding.
Geothermal Public Power Line
NCPA has entered into interest rate swaps and related agreements related to its hydro electric project. Additional information regarding NCPA debt is disclosed in NCPA s financial statements. In 1983, NCPA, Sacramento Municipal Utility District, Santa Clara, and the Modesto Irrigation District (joint owners) initiated studies for a Geothermal Public Power Line. The transmission line

57
will carry power generated at several existing and planned geothermal plants in the Geysers area to a location where the joint owners can receive it for transmission to their load centers. NCPA has an 18.5% share of the project. The City has a 6.61% participation in NCPA's share. In 1989, the construction of the proposed Geothermal Public Power Line was discontinued. In December 1998, NCPA issued $10 million in revenue bonds to defease the remaining variable rate refunding bonds used to finance this project. At June 30, 2003, approximately $6,120 thousand in long-term debt related to this project was outstanding.
NCPA Condensed Financial Information
The information below summarizes NCPA's audited financial statements as of and for the year ended June 30, 2003 (in thousands):
Total assets $1,044,856Total liabilities (excluding long-term debt) 172,686Long-term debt 811,767Accumulated net revenues 18,498Revenues 230,452Expenses (including refunds) 230,269Increase in accumulated net revenues 183
Maturities (Principal) of NCPA's long-term debt as of June 30, 2003 are as follows (in thousands) (audited):
2004 $ 52,9352005 54,5552005 56,5052007 36,0952008 37,0602009 and after 631,725Less: unamortized net discount and premium (4,173) Current portion (52,935)
Total $ 811,767
The City does not include its net investment in NCPA in the proprietary fund financial statements because it is a separate legal entity and the JPA s obligations and liabilities are not those of the City.
NCPA Financial Information
NCPA S financial statements can be obtained from NCPA, 180 Cirby Way, Roseville, CA 95678.
10. FINANCING AUTHORITY AND POOLED ARRANGEMENT
In addition to NCPA, the City participates in a Financing Authority and a pooled insurance arrangement. A description of these agencies follows:Redwood Empire Financing Authority (REFA) was created in 1982 to purchase and acquire, through lease purchases, installment sale agreements, or other means, such real and personal property necessary or convenient for the operation of its members. Its members consist of the cities of Arcata, Cloverdale, Healdsburg, Sonoma, Sebastopol and Ukiah. Through participation in REFA, the City acquired and constructed certain improvements to the City's electrical, water and sewer enterprises, improved streets and drainage, as well as partial land acquisition and construction. The City's portion of REFA obligations are reported in the appropriate funds.

58
Redwood Empire Municipal Insurance Fund (REMIF) is a governmental self-insurance cooperative organized under a joint powers agreement by certain California cities to provide liability coverage to its members as allowed under the California Government Code. REMIF is a risk sharing pool , which pools risks and funds and which shares in the cost of losses. REMIF provides and administers liability coverage programs for seven member and nine associate member cities. Members and associate members have the option, with approval by the Board of Directors, of participating in any or all of seven programs which provide workers compensation, general liability, property, health, dental, vision, and auto physical damage coverage.
The Redwood Empire Municipal Insurance Fund is in turn a member of the California Joint Powers Insurance Authority, a super self-insurance and insurance procurement joint powers authority.
The activities of REMIF include setting and collecting premiums for each program, negotiating excess insurance coverage administering and paying claims and related expenses, and investing each program s assets. REMIF engages the services of independent actuaries and claims administrators to assist in performing some of these activities.
The information below summarizes the audited financial statements as of and for the year ended June 30, 2003, for the Financing Authority and pooled arrangement in which the City participates.
Redwood Redwood Empire Empire MunicipalFinancing Authority Insurance Fund
Total Assets $ 8,112,405 $ 13,808,100Total Liabilities 8,112,744 11,608,132Total Equity (339) 2,199,968Total Revenues 569,244 6,602,917Total Expenditures/Expenses 574,810 5,639,811Increase (Decrease) in Equity (5,566) (1,044,585)Total Long-Term Debt 8,065,000 8,762,911
11. SELF-INSURANCE PLANS
The City is a member of Redwood Empire Municipal Insurance Fund (REMIF) as described in Note 10. The City s general liability and workers compensation claims are covered as a member of REMIF. REMIF has a risk sharing arrangement for each insurance program. Each member participating in each program assumes its own losses up to its retention level. The City has a $5,000 retention level for general liability and workers compensation. The excess amounts presently insured to statutory requirements of the State of California for workers compensation and $10,000,000 for general liability through a pooled program. Each program s pool is funded by all of the members participating in that program through cash premiums. Excess losses up to the state limits are covered by commercial carriers or other agencies, which REMIF contracts for that purpose. Losses exceeding these excess coverage limits for each program are the responsibility of the individual member for which the loss or claim originated. Claims have not exceeded insurance coverage amounts over the last three fiscal years and there has been no reduction in insurance coverage since the last fiscal year.
12. INDIVIDUAL FUND DISCLOSURES
a. Funds which have deficit fund balances/retained earnings at June 30, 2003 were as follows:
Special Revenue Funds:North Area $ 67,892

59
The City plans on removing the deficit in the North Area Special Revenue Fund through future development contributions and benefit assessments.
b. Funds where expenditures exceeded appropriations:
Special RevenueGas Tax $ 140,671Park Fees 199TDA 1Benjamin Way Maintenance District 436
Debt Service FundCommunity Redevelopment Agency 369,275Special Assessment 59,102
13. COMMITMENTS AND CONTINGENCIES
There are pending claims and litigation against the City, which are considered normal to the City's operation. City management is of the opinion that potential claims against the City not covered by insurance resulting from such litigation would not materially affect the general purpose financial statements of the City beyond funded reserves.
The City has entered into long-term electric power purchase and electric transmission contracts. These contracts were entered into by Northern California Power Agency (NCPA) on behalf of various members (see Note 9) including the City. Under the terms of its NCPA joint venture agreement, the City is contingently liable for a portion of the bonded indebtedness issued by these agencies under take-or-pay or similar agreements. The City s estimated share of such debt outstanding at June 30, 2003 was $29 million. Under certain circumstances, the City may also be responsible for a portion of the costs of operating these entities. Under certain circumstances, such as default or bankruptcy of other participants, the City may also be liable to pay a portion of the debt of these joint ventures on behalf of the other participants.
Seattle City Light
NCPA has negotiated a 21-year seasonal power exchange agreement with Seattle City Light for 60 MW of summer capacity and 90,580 MWh of energy and a return of 46 MW of capacity and 108,696 of energy in the winter. The City s share of the summer capacity is 1.6 MW. The net cost to the City is mitigated by the cost difference between supplying energy and receiving free capacity.
California-Oregon Transmission Project
The City is a member of the Transmission Agency of Northern California (TANC), a California joint powers agency. TANC, a combination of cities, Western and four other California Districts and authorities are participants in the California-Oregon Transmission Project (COTP). The COTP is a transmission project between southern Oregon and Central California. COTP provides a transmission path between the electric systems of the Pacific Northwest and those in California. The members of NCPA are entitled to 30.4 percent of the transfer capacity of COTP. The City s share is .21 percent. Each member of NCPA is responsible for developing its own uses for its share of the COTP transfer capability.

60
Western Area Power Administration
In addition to commitments for power purchase through NCPA, the City has entered into a contract with Western Area Power Administration (Western). Western is a federal Power Management Agency of the U.S. Department of Energy, which among other things is responsible for marketing electricity generated by the Central Valley Project. The contract with Western expires December 31, 2004 and the estimated annual commitment over the next two years for purchasing power is $80,390. A supplemental agreement allows the City to utilize less than its contractual entitlement. NCPA on behalf of the City is negotiating a new agreement under Western s 2005 Monitoring Plan.
Other Energy Contracts
The City, through NCPA and its member cities, has also arranged to procure additional power by participating in a contract with CalPine Corporation. The contract, which started in 2002 and expires in December 2011, provides 3 Megawatts of capacity at an average cost of $63 per mwh.
14. FACTORS AFFECTING THE UTILITY INDUSTRY
Assembly Electric Bill 1890
In August 1996, the California legislature unanimously passed a bill related to the restructuring of certain elements of the electric utility industry for Investor Owned Utilities (IOUs). The bill was signed by the governor in September 1996. The bill codifies parts of the California Public Utility Commission s (CPUC) December 20, 1995 policy relating to restructuring, including implementation of direct access, establishment of an Independent System Operations (ISO) and Power Exchange (PX), recovery of competitive transition costs, and funding for public purpose programs. The bill also relates to and affects publicly owned electric utilities, utilities not subject to the CPUC sjurisdiction. The City of Healdsburg is a publicly owned utility under AB 1890 as the City Council retains autonomy and local control. Each publicly owned utility was given the choice of whether or not it would open its service territory to new generation suppliers. The California energy crisis that developed during 2000 has caused a suspension of any consideration of a competitive transition.
Financial Difficulties at Investor-Owned Utilities
In early 2001, Pacific Gas and Electric Corporation (PG&E), the major investor-owned power utility in Northern California declared bankruptcy. The City of Healdsburg Electric Utility does not have direct financial exposure to PG&E, however, because of the existing interconnection agreement through NCPA, there was risk that PG&E would not perform transmission service as called for in the agreement. The City, through NCPA, was able to replace the PG&E Interconnection Agreement with a new Transmission Agreement with the California ISO. The agreement became effective on October 1, 2002.

Variance withFinal Budget
Original Final PositiveBudget Budget Actual (Negative)
Revenues: Property taxes $ 486,097 $ 486,097 $ 607,747 $ 121,650 Sales and other taxes 3,919,313 3,231,633 3,515,406 283,773 Charges for services 225,162 222,162 283,063 60,901 Intergovernmental revenues 849,362 872,762 954,478 81,716 Investment income 90,000 90,000 51,338 (38,662) Miscellaneous fees and charges 86,592 81,957 93,044 11,087 Other revenues 2,237 2,237 4,222 1,985 Total revenues 5,658,763 4,986,848 5,509,298 522,450
Expenditures: Current: General government 458,707 378,905 376,027 2,878 Public safety 4,502,591 4,658,601 4,566,617 91,984 Culture and recreation 636,640 - 3,011 (3,011) Community development 4,146 - - - Public works 12,000 12,000 - 12,000 Total expenditures 5,614,084 5,049,506 4,945,655 103,851
Excess of revenues over (under) expenditures 44,679 (62,658) 563,643 626,301
Other financing sources (uses): Transfers in 721 721 - (721) Transfers out (45,400) (145,400) (145,400) -
Total other financing sources (uses) (44,679) (144,679) (145,400) (721)
Net change in fund balance - (207,337) 418,243 625,580
Fund balance, beginning of year 3,328,099 3,328,099 3,328,099 -
Fund balance, end of year $ 3,328,099 $ 3,120,762 $ 3,746,342 $ 625,580
- 61 -
CITY OF HEALDSBURGBUDGETARY COMPARISON SCHEDULE
GENERAL FUNDFOR THE YEAR ENDED JUNE 30, 2003

(This page left intentionally blank).
- 62 -

1) Special Revenue Funds -
2) General Debt Service Fund- is used to account for the long-term debt service of the City.
3) Area A Special Assessment District Capital Projects Fund -
4) Permanent Fund - is used to account and administer funds of the Cultural Center.
NONMAJOR GOVERNMENTAL FUNDS
- 63 -
are used to account for revenues derived from specific revenue sources. These funds are required by statute or ordinance to finance particular functions or activities of government.
is used to account for revenues received from a prospective sale of assessment land and oversizing advances from Enterprise funds.

Area A
General District TotalSpecial Debt Capital Nonmajor
Revenue Service Project Permanent GovernmentalFunds Fund Fund Fund Funds
ASSETSCash and investments 3,289,158$ 602,570$ 14,897$ 96,386$ 4,003,011$Receivables: Accounts 84,603 - 2,507 - 87,110 Taxes 29,874 91,100 - - 120,974 Loan 1,687,107 - - - 1,687,107 Interest 8,050 675 24 157 8,906 Due from other governments 29,868 - - - 29,868Restricted cash and investments - 54,484 - - 54,484
TOTAL ASSETS 5,128,660$ 748,829$ 17,428$ 96,543$ 5,991,460$
LIABILITIES AND FUND BALANCESLIABILITIES: Accounts payable 1,340$ -$ -$ -$ 1,340$ Due to other funds 86,620 - - - 86,620 Deferred revenue 238,819 - - - 238,819 TOTAL LIABILITIES 326,779 - - - 326,779
FUND BALANCES : Reserved for : Reserved for debt service - 748,829 - - 748,829 Noncurrent notes receivable 1,537,107 - - - 1,537,107 Unreserved Reported in: Special revenue funds 3,264,774 - 3,264,774 Capital project funds - - 17,428 - 17,428 Permanent fund - - - 96,543 96,543 TOTAL FUND BALANCES 4,801,881 748,829 17,428 96,543 5,664,681
TOTAL LIABILITIES AND FUND BALANCES 5,128,660$ 748,829$ 17,428$ 96,543$ 5,991,460$
- 64 -
CITY OF HEALDSBURGCOMBINING BALANCE SHEET
NONMAJOR GOVERMENTAL FUNDSJUNE 30, 2003
Assessment

Area A Asessment
General District TotalSpecial Debt Capital Nonmajor
Revenue Service Project Permanent GovernmentalFunds Fund Fund Fund Funds
.Revenues: Property taxes -$ 717,384$ -$ -$ 717,384$ Intergovernmental revenues 879,153 - - - 879,153 Development fees and permits 119,203 - - - 119,203 Investment income 134,319 9,958 279 1,835 146,391 Other revenues 214,547 - - - 214,547 Total revenues 1,347,222 727,342 279 1,835 2,076,678
Expenditures: Current: General government 305,561 - 21 - 305,582 Public safety 6,036 - - - 6,036 Culture and recreation 20,711 - - 3,445 24,156 Community development 46,001 - - - 46,001 Debt service: Principal retirement - 225,000 - - 225,000 Interest and fees - 291,213 - - 291,213 Total expenditures 378,309 516,213 21 3,445 897,988
Excess of revenues over
(under) expenditures 968,913 211,129 258 (1,610) 1,178,690
Other financing sources (uses): Transfers in 726,000 - - - 726,000 Transfers out (3,455,421) - - - (3,455,421)
Total other financing sources (uses) (2,729,421) - - - (2,729,421)
Net change in fund balances (1,760,508) 211,129 258 (1,610) (1,550,731)
Fund balances , beginning of year 6,562,389 537,700 17,170 98,153 7,215,412
Fund balances, end of year 4,801,881$ 748,829$ 17,428$ 96,543$ 5,664,681$
- 65 -
CITY OF HEALDSBURGCOMBINING STATEMENT OF REVENUES, EXPENDITURES AND CHANGES IN FUND BALANCES
NONMAJOR GOVERNMENTAL FUNDSFOR THE YEAR ENDED JUNE 30, 2003

(This page left intentionally blank).
- 66 -
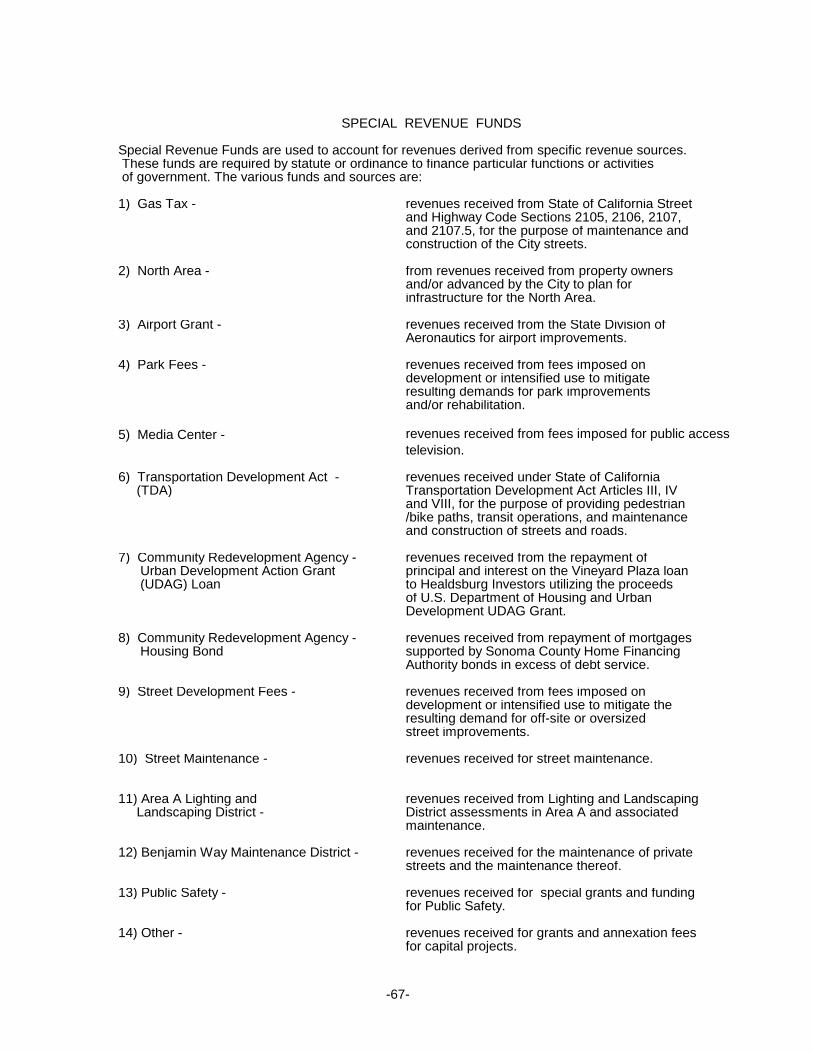
Special Revenue Funds are used to account for revenues derived from specific revenue sources. These funds are required by statute or ordinance to finance particular functions or activities of government. The various funds and sources are:
1) Gas Tax - revenues received from State of California Street and Highway Code Sections 2105, 2106, 2107, and 2107.5, for the purpose of maintenance andconstruction of the City streets.
2) North Area - from revenues received from property owners and/or advanced by the City to plan for infrastructure for the North Area.
3) Airport Grant - revenues received from the State Division ofAeronautics for airport improvements.
4) Park Fees - revenues received from fees imposed on development or intensified use to mitigate resulting demands for park improvements and/or rehabilitation.
5) Media Center -
6) Transportation Development Act - revenues received under State of California (TDA) Transportation Development Act Articles III, IV
and VIII, for the purpose of providing pedestrian/bike paths, transit operations, and maintenanceand construction of streets and roads.
7) Community Redevelopment Agency - revenues received from the repayment of Urban Development Action Grant principal and interest on the Vineyard Plaza loan (UDAG) Loan to Healdsburg Investors utilizing the proceeds
of U.S. Department of Housing and UrbanDevelopment UDAG Grant.
8) Community Redevelopment Agency - revenues received from repayment of mortgages Housing Bond supported by Sonoma County Home Financing
Authority bonds in excess of debt service.
9) Street Development Fees - revenues received from fees imposed ondevelopment or intensified use to mitigate the resulting demand for off-site or oversizedstreet improvements.
10) Street Maintenance - revenues received for street maintenance.
11) Area A Lighting and revenues received from Lighting and Landscaping Landscaping District - District assessments in Area A and associated
maintenance.
12) Benjamin Way Maintenance District - revenues received for the maintenance of privatestreets and the maintenance thereof.
13) Public Safety - revenues received for special grants and fundingfor Public Safety.
14) Other - revenues received for grants and annexation feesfor capital projects.
SPECIAL REVENUE FUNDS
-67-
revenues received from fees imposed for public access television.

CITY OF HEALDSBURGCOMBINING BALANCE SHEET
NONMAJOR SPECIAL REVENUE FUNDSJUNE 30, 2003
ASSETSCash and investments $ 30,455 $ 5,073 $ 112 $ 134,097 $ 264,003Receivables: Accounts - 82,208 - - 2,395 Taxes 24,307 - - - - Loans - - - - - Interest 175 35 - 214 344 Due from other governments - - - - - TOTAL ASSETS $ 54,937 $ 87,316 $ 112 $ 134,311 $ 266,742
LIABILITIES AND FUND BALANCESLIABILITIES Accounts payable $ - $ - $ - $ - $ - Due to other funds - 73,000 - - - Deferred revenue - 82,208 - - - TOTAL LIABILITIES - 155,208 - - -
FUND BALANCES (DEFICITS): Reserved: Noncurrent notes receivable - - - - - Unreserved, undesignated 54,937 (67,892) 112 134,311 266,742 TOTAL FUND BALANCES (DEFICITS) 54,937 (67,892) 112 134,311 266,742
TOTAL LIABILITIES AND FUND BALANCES $ 54,937 $ 87,316 $ 112 $ 134,311 $ 266,742
Gas Tax Grant Park FeesMedia CenterNorth Area
Airport
- 68 -

$ - $ 2,250,182 $ 20,819 $ 16,361 $ - $ 127,557
- - - - - -- - - - - 5,567- 1,537,107 150,000 - - -3 5,046 1 1,324 - 213
22,050 - - - - -$ 22,053 $ 3,792,335 $ 170,820 $ 17,685 $ - $ 133,337
$ - $ - $ - $ - $ - $ 1,34013,620 - - - - -6,611 - 150,000 - - -
20,231 - 150,000 - - 1,340
- 1,537,107 - - - -1,822 2,255,228 20,820 17,685 - 131,9971,822 3,792,335 20,820 17,685 - 131,997
$ 22,053 $ 3,792,335 $ 170,820 $ 17,685 $ - $ 133,337
Development
Area ALighting and
StreetMaintenanceFees District
LandscapingStreet
Housing BondTDA
CommunityRedevelopment
AgencyUDAG Loan
CommunityRedevelopment
Agency
- 69 -(Continued)

(This page left intentionally blank).
- 70 -

CITY OF HEALDSBURGCOMBINING BALANCE SHEET
NONMAJOR SPECIAL REVENUE FUNDS(CONTINUED)
JUNE 30, 2003
Maintenance Special Revenue
ASSETSCash and investments $ 3,002 $ 18,783 $ 418,714 $ 3,289,158Receivables: Accounts - - - 84,603 Taxes - - - 29,874 Loans - - - 1,687,107 Interest 5 35 655 8,050 Due from other governments - - 7,818 29,868 TOTAL ASSETS $ 3,007 $ 18,818 $ 427,187 $ 5,128,660
LIABILITIES AND FUND BALANCESLIABILITIES Accounts payable $ - $ - $ - $ 1,340 Due to other funds - - - 86,620 Deferred revenue - - - 238,819 TOTAL LIABILITIES - - - 326,779
FUND BALANCES (DEFICITS): Reserved: Noncurrent notes receivable - - - 1,537,107 Unreserved, undesignated 3,007 18,818 427,187 3,264,774 TOTAL FUND BALANCES (DEFICITS) 3,007 18,818 427,187 4,801,881
TOTAL LIABILITIES AND FUND BALANCES $ 3,007 $ 18,818 $ 427,187 $ 5,128,660
TotalNonmajor
Funds
Benjamin Way
OtherDistrictPublicSafety
- 71 -(Concluded)

CITY OF HEALDSBURGCOMBINING STATEMENT OF REVENUES, EXPENDITURES AND
CHANGES IN FUND BALANCES - NONMAJOR SPECIAL REVENUE FUNDSFOR THE YEAR ENDED JUNE 30, 2003
Airport MediaGas Tax North Area Grant Center
Revenues: Intergovernmental revenues $ 226,421 $ - $ 10,000 $ - $ - Development fees and permits - 18,578 - 99,437 - Investment income 2,045 410 - 2,505 4,030 Other revenues - - - 1,114 129,404 Total revenues 228,466 18,988 10,000 103,056 133,434
Expenditures: General government 140,671 32 - 199 845 Public safety - - - - - Culture and recreation - - - - - Community development - - - - 46,001 Total expenditures 140,671 32 - 199 46,846
Excess of revenues over (under) expenditures 87,795 18,956 10,000 102,857 86,588
Other financing sources (uses): Transfers in - - - 276,000 25,000 Transfers out (520,490) - (10,000) (367,000) -
Total other financing sources (uses) (520,490) - (10,000) (91,000) 25,000
Net change in fund balances (432,695) 18,956 - 11,857 111,588
Fund balances (deficits), beginning of year 487,632 (86,848) 112 122,454 155,154
Fund balances (deficits), end of year $ 54,937 $ (67,892) $ 112 $ 134,311 $ 266,742
- 72 -
Park Fees

Community Community Area ARedevelopment Redevelopment Lighting and
Agency Agency Development LandscapingTDA UDAG Loan Housing Bond District
$ 139,543 $ - $ - $ - $ - 122,058 $ -- - - - - - -
30 99,141 6 15,517 - 2,496 56- 73,589 - - - - 440
139,573 172,730 6 15,517 - 124,554 496
3 6,713 150,000 1,233 - 5,219 4- - - - - - -- - - - - 20,711 -- - - - - - -3 6,713 150,000 1,233 - 25,930 4
139,570 166,017 (149,994) 14,284 - 98,624 492
- - 150,000 10,000 - 265,000 -(139,543) (425,000) - (1,093,317) (228,659) (315,000) -
(139,543) (425,000) 150,000 (1,083,317) (228,659) (50,000) -
27 (258,983) 6 (1,069,033) (228,659) 48,624 492
1,795 4,051,318 20,814 1,086,718 228,659 83,373 2,515
$ 1,822 $ 3,792,335 $ 20,820 $ 17,685 $ - 131,997 $ 3,007
- 73 -(Continued)
MaintenanceDistrict
BenjaminStreet
FeesStreet
Maintenance
Way

(This page left intentionally blank).
- 74 -

Public Special RevenueSafety Other
Revenues: Intergovernmental revenues $ - $ 381,131 $ 879,153 Development fees and permits 1,188 - 119,203 Investment income 407 7,676 134,319 Other revenues - 10,000 214,547 Total revenues 1,595 398,807 1,347,222
Expenditures: General government 32 610 305,561 Public safety 6,036 - 6,036 Culture and recreation - - 20,711 Community development - - 46,001 Total expenditures 6,068 610 378,309
Excess of revenues over (under) expenditures (4,473) 398,197 968,913
Other financing sources (uses): Transfers in - - 726,000 Transfers out - (356,412) (3,455,421)
Total other financing sources (uses) - (356,412) (2,729,421)
Net change in fund balances (4,473) 41,785 (1,760,508)
Fund balances (deficits), beginning of year 23,291 385,402 6,562,389
Fund balances (deficits), end of year $ 18,818 $ 427,187 $ 4,801,881
(Concluded)- 75 -
CITY OF HEALDSBURGCOMBINING STATEMENT OF REVENUES, EXPENDITURES AND
CHANGES IN FUND BALANCES - NONMAJOR SPECIAL REVENUE FUNDS(CONTINUED)
TotalNonmajor
Funds
FOR THE YEAR ENDED JUNE 30, 2003

FinalBudget Actual
Revenues: Intergovernmental revenues $ 137,580 $ 137,580 $ 226,421 $ 88,841 Investment income - - 2,045 2,045 Total revenues 137,580 137,580 228,466 90,886
Expenditures: General government - - 140,671 (140,671)
Excess of revenues over expenditures 137,580 137,580 87,795 (49,785)
Other financing sources (uses): Transfers out - - (520,490) (520,490)
Net change in fund balance 137,580 137,580 (432,695) (570,275)
Fund balance, beginning of year 487,632 487,632 487,632 -
Fund balance, end of year $ 625,212 $ 625,212 $ 54,937 $ (570,275)
Final BudgetPositive
FOR THE YEAR ENDED JUNE 30, 2003
- 76 -
Variance with
(Negative)OriginalBudget
CITY OF HEALDSBURGSCHEDULE OF REVENUES, EXPENDITURES AND CHANGES IN FUND BALANCE
BUDGET AND ACTUALGAS TAX SPECIAL REVENUE FUND

Original FinalBudget Budget Actual
Revenues: Intergovernmental revenues $ 10,000 $ 10,000 $ 10,000 $ - Total revenues 10,000 10,000 10,000 -
Other financing sources (uses): Transfers out (10,000) (10,000) (10,000) -
Total other financing sources (uses) (10,000) (10,000) (10,000) -
Net change in fund balance - - - -
Fund balance, beginning of year 112 112 112 -
Fund balance, end of year $ 112 $ 112 $ 112 $ -
FOR THE YEAR ENDED JUNE 30, 2003
- 77 -
CITY OF HEALDSBURGSCHEDULE OF REVENUES, EXPENDITURES AND CHANGES IN FUND BALANCE
BUDGET AND ACTUALAIRPORT GRANT SPECIAL REVENUE FUND
Variance withFinal Budget
Positive(Negative)

Revenues: Development fees and permits $ 82,280 $ 82,280 $ 99,437 $ 17,157 Investment income 3,000 3,000 2,505 (495) Other revenues - - 1,114 1,114 Total revenues 85,280 85,280 103,056 17,776
Expenditures: General government - - 199 (199)
Excess of revenues over expenditures 85,280 85,280 102,857 17,577
Other financing sources (uses): Transfers in - - 276,000 276,000 Transfers out - - (367,000) (367,000)
Total other financing sources (uses) - - (91,000) (91,000)
Net change in fund balance 85,280 85,280 11,857 (73,423)
Fund balance, beginning of year 122,454 122,454 122,454 -
Fund balance, end of year $ 207,734 $ 207,734 $ 134,311 $ (73,423)
Actual
Variance withFinal Budget
Positive(Negative)
Final
FOR THE YEAR ENDED JUNE 30, 2003
- 78 -
CITY OF HEALDSBURGSCHEDULE OF REVENUES, EXPENDITURES AND CHANGES IN FUND BALANCE
BUDGET AND ACTUALPARK FEES SPECIAL REVENUE FUND
Original Budget Budget

Original FinalBudget Budget Actual
Revenues: Intergovernmental revenues $ - $ 139,573 $ 139,543 $ (30) Investment income - - 30 30 Total revenues - 139,573 139,573 -
Expenditures: General government - 2 3 (1)
Excess of revenues over expenditures - 139,571 139,570 (1)
Other financing sources (uses): Transfers out (165,082) (165,082) (139,543) 25,539
Total other financing sources (uses) (165,082) (165,082) (139,543) 25,539
Net change in fund balance (165,082) (25,511) 27 25,538
Fund balance, beginning of year 1,795 1,795 1,795 -
Fund balance (deficit), end of year $ (163,287) $ (23,716) $ 1,822 $ 25,538
- 79 -
CITY OF HEALDSBURGSCHEDULE OF REVENUES, EXPENDITURES AND CHANGES IN FUND BALANCE
BUDGET AND ACTUALTDA SPECIAL REVENUE FUND
FOR THE YEAR ENDED JUNE 30, 2003
Variance withFinal Budget
Positive(Negative)

Original FinalBudget Budget Actual
Revenues: Investment income $ 133,000 $ 133,000 $ 99,141 $ (33,859) Other revenues 160,000 160,000 73,589 (86,411) Total revenues 293,000 293,000 172,730 (120,270)
Expenditures: General government 203,125 203,125 6,713 196,412
Excess of revenues over expenditures 89,875 89,875 166,017 76,142
Other financing sources (uses): Transfers out - - (425,000) (425,000)
Net change in fund balance 89,875 89,875 (258,983) (348,858)
Fund balance, beginning of year 4,051,318 4,051,318 4,051,318 -
Fund balance, end of year $ 4,141,193 $ 4,141,193 $ 3,792,335 $ (348,858)
FOR THE YEAR ENDED JUNE 30, 2003
- 80 -
CITY OF HEALDSBURGSCHEDULE OF REVENUES, EXPENDITURES AND CHANGES IN FUND BALANCE
BUDGET AND ACTUALCOMMUNITY REDEVELOPMENT AGENCY UDAG LOAN SPECIAL REVENUE FUND
Variance withFinal Budget
Positive(Negative)

Original FinalBudget Budget Actual
Revenues: Intergovernmental revenues $ 133,024 $ 133,024 $ 122,058 $ (10,966) Investment income 2,285 2,285 2,496 211 Total revenues 135,309 135,309 124,554 (10,755)
Expenditures: General government 28,635 28,635 5,219 23,416 Culture and recreation 56,104 56,104 20,711 35,393 Total expenditures 84,739 84,739 25,930 58,809
Excess of revenues over expenditures 50,570 50,570 98,624 48,054
Other financing sources (uses): Transfers in - - 265,000 265,000 Transfers out (50,000) (50,000) (315,000) (265,000)
Total other financing sources (uses) (50,000) (50,000) (50,000) -
Net change in fund balance 570 570 48,624 48,054
Fund balance, beginning of year 83,373 83,373 83,373 -
Fund balance, end of year $ 83,943 $ 83,943 $ 131,997 $ 48,054
FOR THE YEAR ENDED JUNE 30, 2003
-81 -
CITY OF HEALDSBURGSCHEDULE OF REVENUES, EXPENDITURES AND CHANGES IN FUND BALANCE
BUDGET AND ACTUALAREA A LIGHTING AND LANDSCAPING DISTRICT SPECIAL REVENUE FUND
Variance withFinal Budget
Positive(Negative)

Original FinalBudget Budget Actual
Revenues: Investment income $ - $ - $ 56 $ 56 Other revenues 440 440 440 - Total revenues 440 440 496 56
Expenditures: General government 440 440 4 (436)
Excess of revenues over expenditures - - 492 (380)
Fund balance, beginning of year 2,515 2,515 2,515 -
Fund balance, end of year $ 2,515 $ 2,515 $ 3,007 $ (380)
- 82 -
Variance withFinal Budget
Positive(Negative)
FOR THE YEAR ENDED JUNE 30, 2003
CITY OF HEALDSBURGSCHEDULE OF REVENUES, EXPENDITURES AND CHANGES IN FUND BALANCE
BUDGET AND ACTUALBENJAMIN WAY MAINTENANCE DISTRICT SPECIAL REVENUE FUND

Original FinalBudget Budget Actual
Revenues: Development fees and permits $ - $ - $ 1,188 $ 1,188 Investment income - - 407 407 Total revenues - - 1,595 1,595
Expenditures: General government - - 32 (32) Public safety 19,765 19,765 6,036 13,729 Total expenditures 19,765 19,765 6,068 13,697
Excess of revenues over expenditures (19,765) (19,765) (4,473) 15,292
Fund balance, beginning of year 23,291 23,291 23,291 -
Fund balance, end of year $ 3,526 $ 3,526 $ 18,818 $ 15,292
FOR THE YEAR ENDED JUNE 30, 2003
- 83 -
CITY OF HEALDSBURGSCHEDULE OF REVENUES, EXPENDITURES AND CHANGES IN FUND BALANCES
BUDGET AND ACTUALPUBLIC SAFTEY FUND SPECIAL REVENUE FUND
Variance withFinal Budget
Positive(Negative)

(This page left intentionally blank).
- 84 -

Debt Service Funds account for the accumulation of resources for, and the payment of long-term debt principal and interest. The various Debt Service Funds are:
Nonmajor Debt Service Fund:1) General Debt Service to account for long-term debt service of the City.
Major Debt Service Funds:2) Community Redevelopment Agency to account for the long-term debt service of the Debt Service Community Redevelopment Agency.
3) Special Assessment Debt Service to account for the long-term debt service of the City's special assessment districts.
DEBT SERVICE FUNDS
- 85 -

Original FinalBudget Budget Actual
Revenues: Property taxes $ 565,000 $ 565,000 $ 717,384 $ 152,384 Investment income 4,000 4,000 9,958 5,958 Total revenues 569,000 569,000 727,342 158,342
Expenditures: Principal retirement 260,500 260,500 225,000 35,500 Interest and fees 308,500 308,500 291,213 17,287 Total expenditures 569,000 569,000 516,213 52,787
Excess of revenues over (under) expenditures - - 211,129 211,129
Fund balance, beginning of year 537,700 537,700 537,700 -
Fund balance, end of year $ 537,700 $ 537,700 $ 748,829 $ 211,129
- 86 -
CITY OF HEALDSBURGSCHEDULE OF REVENUES, EXPENDITURES AND CHANGES IN FUND BALANCE
BUDGET AND ACTUALNONMAJOR GENERAL DEBT SERVICE FUND
FOR THE YEAR ENDED JUNE 30, 2003
Final BudgetPositive
Variance with
(Negative)

CITY OF HEALDSBURGSCHEDULE OF REVENUES, EXPENDITURES AND CHANGES IN FUND BALANCE
BUDGET AND ACTUALCOMMUNITY REDEVELOPMENT AGENCY DEBT SERVICE FUND
FOR THE YEAR ENDED JUNE 30, 2003
Original FinalBudget Budget Actual
Revenues: Investment income $ 40,000 $ 40,000 $ 10,465 $ (29,535)
Expenditures: Principal retirement 1,074,160 1,074,160 845,000 229,160 Interest and fees 677,570 677,570 993,661 (316,091) Bond issue costs - - 282,344 (282,344) Total expenditures 1,751,730 1,751,730 2,121,005 (369,275)
Excess of revenues over (under) expenditures (1,711,730) (1,711,730) (2,110,540) (398,810)
Other financing sources: Transfers in 1,717,974 1,717,974 1,827,576 109,602 Transfers out - - (11,505,000) (11,505,000) Bond discount - - (162,500) (162,500) Proceeds from long-term debt - - 13,000,000 13,000,000
Total other financing sources 1,717,974 1,717,974 3,160,076 1,442,102
Net change in fund balance 6,244 6,244 1,049,536 1,043,292
Fund balance, beginning of year 1,807,438 1,807,438 1,807,438 -
Fund balance, end of year $ 1,813,682 $ 1,813,682 $ 2,856,974 $ 1,043,292
- 87 -
Final BudgetPositive
Variance with
(Negative)

Original FinalBudget Budget Actual
Revenues: Special assessments $ 328,690 $ 328,690 $ 323,632 $ (5,058) Investment income 20,000 20,000 11,990 (8,010) Total revenues 348,690 348,690 335,622 (13,068)
Expenditures: Principal retirement 165,000 165,000 230,000 (65,000) Interest and fees 183,690 183,690 177,792 5,898 Total expenditures 348,690 348,690 407,792 (59,102)
Excess of revenues over (under) expenditures - - (72,170) (72,170)
Fund balance, beginning of year 665,017 665,017 665,017 -
Fund balance, end of year $ 665,017 $ 665,017 $ 592,847 $ (72,170)
- 88 -
CITY OF HEALDSBURGSCHEDULE OF REVENUES, EXPENDITURES AND CHANGES IN FUND BALANCE
BUDGET AND ACTUALSPECIAL ASSESSMENT DEBT SERVICE FUND
FOR THE YEAR ENDED JUNE 30, 2003
Final BudgetPositive
Variance with
(Negative)

Enterprise Funds account for the financing of self-supporting activities which render services to the general public on a user charge basis or a fixed payment schedule. All activities necessary toprovide such services are accounted for in these funds, including, but not limited to, operations,maintenance, financing and related debt service, and billings and collections. The variousEnterprise Funds are:
1) Planning & Building to account for the provision of planning and building developmentwithin the City.
2) Transit to account for the provision of public transit service to theresidents of the City.
3) Airport to account for the operation of the City airport.
4) Meeting Center to account for the provision of group meeting and conference facilities to the residents of the City wherein the primary revenue sources are rental fees and service charges.
5) School Services to account for the provision of services to the Healdsburg Schools.
NONMAJOR ENTERPRISE FUNDS
- 89 -

Planning & Building Transit Airport
ASSETS:Current assets:
Cash and investments 619,476$ 13,346$ 240,459$ Accounts receivable 812 - 6,813Notes receivable, net - - -Inventory - - 19,218Prepaid costs 30 - -
Total current assets 620,318 13,346 266,490Assets:
Capital assetsLand 119,834Building - - 186,452Streets - - -Machines and equipment - - 209,509Operations - - 1,195,526Construction in progress - - 13,395Debt less accumulated depreciation - - (644,978)
Total capital assets (net of accumulated depreciation) - - 1,079,738Total noncurrent assets - - 1,079,738
TOTAL ASSETS 620,318 13,346 1,346,228
LIABILITIES:Current liabilities:
Accounts payable and accrued liabilities 12,467 70 6,331Deposits from others 34,149 315 10,800Due to other funds - - 14,008
TOTAL CURRENT LIABILITIES 46,616 385 31,139
NET ASSETS:Invested in capital assets, net of related debt - - 1,079,738Unrestricted 573,702 12,961 235,352
TOTAL NET ASSETS 573,702$ 12,961$ 1,315,090$
-90-
COMBINING STATEMENT OF NET ASSETSCITY OF HEALDSBURG
NONMAJOR ENTERPRISE FUNDSJUNE 30,2003

Meeting SchoolCenter Services Total
27,574$ 32,991$ 933,846$ 6,037 52 13,714
- - -- - 19,218- - 30
33,611 33,043 966,808
231,972 - 351,8061,194,411 - 1,380,863
20,000 - 20,00098,184 - 307,693
- - 1,195,526- - 13,395
(382,115) - (1,027,093)
1,162,452 - 2,242,1901,162,452 - 2,242,190
1,196,063 33,043 3,208,998
6,630 3,310 28,808114,093 - 159,35795,397 - 109,405
216,120 3,310 297,570
1,162,452 - 2,242,190(182,509) 29,733 669,239
979,943$ 29,733$ 2,911,429$
-91-

Transit AirportOperating revenues: Charges for services $ - $ 15,510 $ 95,235 Development fees 544,169 - - Rental income - - 95,435 Other revenues 61,409 - 10 Total operating revenues 605,578 15,510 190,680
Operating expenses: Operations 342,892 117,296 107,139 Administrative 77,145 37,757 15,818 Depreciation - - 32,397 Total operating expenses 420,037 155,053 155,354
Operating income (loss) 185,541 (139,543) 35,326
Nonoperating revenues (expenses): Investment income 9,519 - 4,093 Interest expense - - (4,260) Total nonoperating revenues (expenses) 9,519 - (167)
Income (loss) before transfers andcapital contributions 195,060 (139,543) 35,159 Transfers in - 139,543 10,000 Transfers out - - - Capital Contributions - - -
Change in net assets 195,060 - 45,159
Total net assets - beginning of year 378,642 12,961 1,269,931
Total net assets - end of year $ 573,702 $ 12,961 $ 1,315,090
Planning
COMBINING STATEMENT OF REVENUES, EXPENSES ANDCITY OF HEALDSBURG
CHANGES IN NET ASSETS - NONMAJOR ENTERPRISE FUNDSFOR THE YEAR ENDED JUNE 30, 2003
- 92 -
& Building

Meeting SchoolCenter Services
$ - $ 61,855 $ 172,600- - 544,169
209,812 6,342 311,58928,687 - 90,106
238,499 68,197 1,118,464
197,820 57,856 823,00310,913 12,008 153,64130,456 - 62,853
239,189 69,864 1,039,497
(690) (1,667) 78,967
415 609 14,636- - (4,260)
415 609 10,376
(275) (1,058) 89,343- - 149,543- - -- - -
(275) (1,058) 238,886
980,218 30,791 2,672,543
$ 979,943 $ 29,733 $ 2,911,429
- 93 -
Total

Building Transit AirportCASH FLOWS FROM OPERATING ACTIVITIES:
Receipts from customers $ 605,578 $ 15,510 $ 190,159Payments to suppliers (170,971) (37,100) (127,162)Payments to employees (242,004) (118,334) (15,414)
Net cash provided (used) by operating activities 192,603 (139,924) 47,583
CASH FLOWS FROM NON-CAPITAL FINANCING ACTIVITIES:Cash received from other funds - 139,543 10,000Cash paid to other funds - - (4,100)
Net cash provided (used) by non-capital financing activities - 139,543 5,900
CASH FLOWS FROM CAPITAL AND RELATED FINANCING ACTIVITIES:Acquisition of capital assets - - (91,291)Interest paid - - (4,260)
Net cash provided (used) by capital and related financing activities - - (95,551)
CASH FLOWS FROM INVESTING ACTIVITIES:Investment income 10,948 - 4,326
Net cash provided (used) by investing activities 10,948 - 4,326
Net increase (decrease) in cash and cash equivalents 203,551 (381) (37,742)
Cash and cash equivalents at beginning of year 415,925 13,727 278,201
Cash and cash equivalents at end of year $ 619,476 $ 13,346 $ 240,459
Operating income (loss) $ 185,541 $ (139,543) $ 35,326
Adjustments to reconcile operating income (loss) to net cashprovided (used) by operating activities:
Depreciation - - 32,397(Increase) decrease in accounts receivable - - (521)(Increase) decrease in inventory - - (4,821)(Increase) decrease in prepaid costs 1,243 - -Increase (decrease) in accounts payable 12,467 (150) (11,847)Increase (decrease) in deposits (6,648) (231) (2,951)
Total adjustments 7,062 (381) 12,257
Net cash provided (used) by operating activities $ 192,603 $ (139,924) $ 47,583
Noncash capital and related financing activitiesContribution of capital assets from government $ - $ - $ -
RECONCILIATION OF OPERATING INCOME TO NET CASH PROVIDED (USED) BY OPERATING ACTIVITIES:
- 94 -
CITY OF HEALDSBURGCOMBINING STATEMENT OF CASH FLOWS
NONMAJOR ENTERPRISE FUNDSFOR THE YEAR ENDED JUNE 30, 2003
Planning &

Meeting SchoolCenter Services
$ 237,137 $ 68,197 $ 1,116,581(73,911) (60,832) (469,976)
(136,032) (11,961) (523,745)
27,194 (4,596) 122,860
- - 149,543- - (4,100)
- - 145,443
- - (91,291)- - (4,260)
- - (95,551)
380 689 16,343380 689 16,343
27,574 (3,907) 189,095
- 36,898 744,751
$ 27,574 $ 32,991 $ 933,846
$ (690) $ (1,667) $ 78,967
30,456 - 62,853(1,362) - (1,883)
- - (4,821)- - 1,243
(2,704) (2,929) (5,163)1,494 - (8,336)
27,884 (2,929) 43,893
$ 27,194 $ (4,596) $ 122,860
$ - $ - $ -
- 95 -
Total

(This page left intentionally blank).
- 96 -
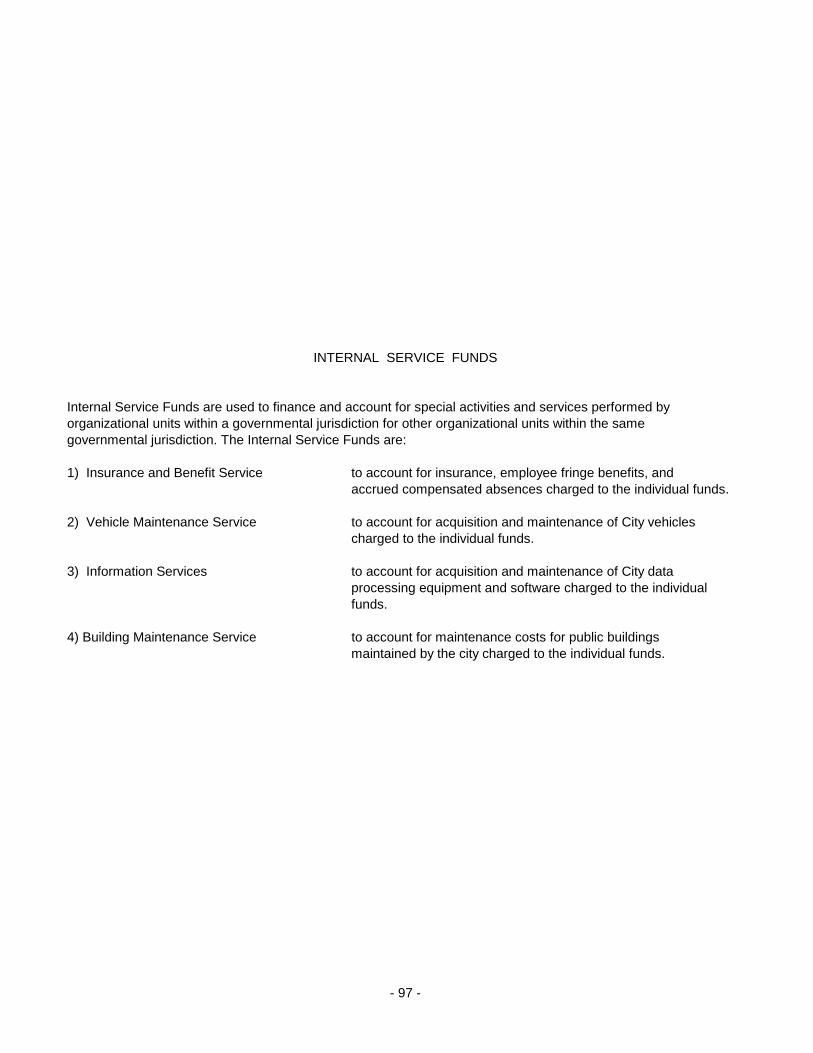
Internal Service Funds are used to finance and account for special activities and services performed by organizational units within a governmental jurisdiction for other organizational units within the same governmental jurisdiction. The Internal Service Funds are:
1) Insurance and Benefit Service to account for insurance, employee fringe benefits, and accrued compensated absences charged to the individual funds.
2) Vehicle Maintenance Service to account for acquisition and maintenance of City vehiclescharged to the individual funds.
3) Information Services to account for acquisition and maintenance of City dataprocessing equipment and software charged to the individualfunds.
4) Building Maintenance Service to account for maintenance costs for public buildings maintained by the city charged to the individual funds.
INTERNAL SERVICE FUNDS
- 97 -

Insurance Vehicle Informationand Benefit Maintenance Services
ASSETSCurrent assets:
Cash and investments 2,647,908$ 1,542,886$ 982,344$ Accounts receivable 7,751 2,378 1,364Notes receivable - - 32,528Inventory - 26,359 1,233Prepaid items - - -
Total current assets 2,655,659 1,571,623 1,017,469Noncurrent assets:
Capital assetsEquipment - 3,648,527 1,108,691 Less accumulated depreciation - (1,841,886) (674,817)
Total capital assets (net of accumulated depreciation) - 1,806,641 433,874Total noncurrent assets - 1,806,641 433,874
TOTAL ASSETS 2,655,659 3,378,264 1,451,343
LIABILITIESCurrent liabilities:
Accounts payable and accrued liabilities 315,782 21,146 21,538Claims payable 183,980 - -Accrued compensated absences 1,520,012 - -
TOTAL NONCURRENT LIABILITIES 2,019,774 21,146 21,538
NET ASSETSInvested in capital assets - 1,806,641 433,874Unrestricted 635,885 1,550,477 995,931
TOTAL NET ASSETS 635,885$ 3,357,118$ 1,429,805$
-98-
COMBINING STATEMENT OF NET ASSETSCITY OF HEALDSBURG
INTERNAL SERVICE FUNDSJUNE 30, 2003

BuildingMaintenance Total
93,145$ 5,266,283$ 525 12,018
- 32,528- 27,592
26,307 26,307119,977 5,364,728
- 4,757,218- (2,516,703)
- 2,240,515- 2,240,515
119,977 7,605,243
66,061 424,527- 183,980- 1,520,012
66,061 2,128,519
- 2,240,51553,916 3,236,209
53,916$ 5,476,724$
-99-

Insurance Vehicle Informationand Benefit Maintenance Services
Operating revenues:Charges for services 3,055,937$ 386,917$ 438,843$ Replacement fees - 204,930 292,369Miscellaneous 127,653 1,918 -
Total operating revenues 3,183,590 593,765 731,212
Operating expenses:Operations - 355,893 668,182Administrative 10,999 13,277 59,456Insurance costs 3,455,212 - -Depreciation - 398,264 132,937
Total operating expenses 3,466,211 767,434 860,575
Operating income (loss) (282,621) (173,669) (129,363)
Nonoperating revenues (expenses):Investment earnings 43,230 27,661 15,983Gain (loss) on sale of assets - 2,289 (5,317)
Total nonoperatingrevenues (expenses) 43,230 29,950 10,666
(239,391) (143,719) (118,697)
Transfers in - 85,913 71,441
Changes in net assets (239,391) (57,806) (47,256)
Total net assets - beginning of year 875,276 3,414,924 1,477,061
Total net assets - end of year 635,885$ 3,357,118$ 1,429,805$
-100-
CITY OF HEALDSBURGCOMBINING STATEMENT OF REVENUES, EXPENSES AND CHANGES IN FUND NET ASSETS
INTERNAL SERVICE FUNDS
Income (loss) before transfers
FOR THE YEAR ENDED JUNE 30, 2003

BuildingMaintenance Total
627,232$ 4,508,929$ - 497,299
20,525 150,096
647,757 5,156,324
632,744 1,656,8194,719 88,451
- 3,455,212- 531,201
637,463 5,731,683
10,294 (575,359)
- 86,874- (3,028)
- 83,846
10,294 (491,513)
15,000 172,354
25,294 (319,159)
28,622 5,795,883
53,916$ 5,476,724$
-101-

Insurance Vehicle Information and Benefit Maintenance Services
CASH FLOWS FROM OPERATING ACTIVITIES:
Receipts from customers $ 3,185,202 $ 594,125 $ 734,263Payments to suppliers (3,213,425) (205,704) (575,543)Payments to employees - (165,055) (161,213)
Net cash provided (used) by operating activities (28,223) 223,366 (2,493)
CASH FLOWS FROM NON-CAPITAL FINANCING ACTIVITIES:Cash received from other funds - 85,913 71,441
Net cash provided by non-capital financing activities - 85,913 71,441
CASH FLOWS FROM CAPITAL AND RELATED FINANCING ACTIVITIES:
Acquisition of capital assets - (174,172) (75,143)Net cash (used) by capital and related financing activities - (174,172) (75,143)
CASH FLOWS FROM INVESTING ACTIVITIES:Investment income 49,681 31,767 18,488Loan proceeds - - 14,182
Net cash provided (used) by investing activities 49,681 31,767 32,670
Net increase (decrease) in cash and cash equivalents 21,458 166,874 26,475
Cash and cash equivalents at beginning of year 2,626,450 1,376,012 955,869
Cash and cash equivalents at end of year $ 2,647,908 $ 1,542,886 $ 982,344
Operating income (loss) $ (282,621) $ (173,669) $ (129,363)
Adjustments to reconcile operating income (loss) to net cashprovided by operating activities:
Depreciation - 398,264 132,937(Increase) decrease in accounts receivable 1,612 360 3,051(Increase) decrease in inventory - (14,093) 905(Increase) decrease in prepaid costs - - 1,589Increase (decrease) in accounts payable (4,377) 12,504 (11,612)Increase (decrease) in other accrued liabilities 257,163 - -
Total adjustments 254,398 397,035 126,870
Net cash provided (used) by operating activities $ (28,223) $ 223,366 $ (2,493)
CITY OF HEALDSBURGCOMBINING STATEMENT OF CASH FLOWS
INTERNAL SERVICE FUNDSFOR THE YEAR ENDED JUNE 30, 2003
- 102 -
RECONCILIATION OF OPERATING INCOME TO NET CASH PROVIDED (USED) BY OPERATING ACTIVITES:

$ 647,232 $ 5,160,822(600,860) (4,595,532)
(7,629) (333,897)
38,743 231,393
15,000 172,35415,000 172,354
- (249,315)- (249,315)
- 99,936- 14,182- 114,118
53,743 268,550
39,402 4,997,733
$ 93,145 $ 5,266,283
$ 10,294 $ (575,359)
- 531,201(525) 4,498
- (13,188)(7,861) (6,272)36,835 33,350
- 257,163
28,449 806,752
$ 38,743 $ 231,393
MaintenanceBuilding
Total
- 103 -

(This page left intentionally blank).
- 104 -

The Trust Funds are used to account for assets held by the City in a fiduciary capacity for individuals, governmental entities and others. Such funds are operated by carrying out the specificationsof trust indentures, statutes, ordinances or other governing regulations. The various funds are:
Private Purpose Trusts:
1) Industrial Development Authority to account for and administer funds of the IndustrialDevelopment Authority.
2) Community Redevelopment Agency to account for and administer funds of the Downtown Downtown Business District (DBD) Business District.
3) Senior Center Trust to account for and administer funds of the Senior CenterTrust.
4) Community Benefit Trust to account for and administer funds of the Community Benefit Trust.
5) Plaza Flowers Veterans Trust to account for and administer funds for purchasing flowersfor the Plaza to honor Veterans.
- 105 -
FIDUCIARY FUNDS

Industrial Community Senior Community Development Redevelopment Benefit
Authority Agency DBD TrustASSETSCash and investments $ 5,178 $ 29,227 $ 112,106 $ 685,496 $ 3,789 $ 835,796Receivables: Interest 8 17 172 1,098 6 1,301
TOTAL ASSETS 5,186 29,244 112,278 686,594 3,795 837,097
LIABILITIES Accounts payable - - - 98 - 98 Deposits - 2,206 - - - 2,206 TOTAL LIABILITIES - 2,206 - 98 - 2,304
NET ASSETSHeld in trust for other purposes $ 5,186 $ 27,038 $ 112,278 $ 686,496 $ 3,795 $ 834,793
VeteransTrust
Plaza
CITY OF HEALDSBURGCOMBINING STATEMENT OF FIDUCIARY NET ASSETS
JUNE 30, 2003
- 106 -
CenterTrust Total
Flowers
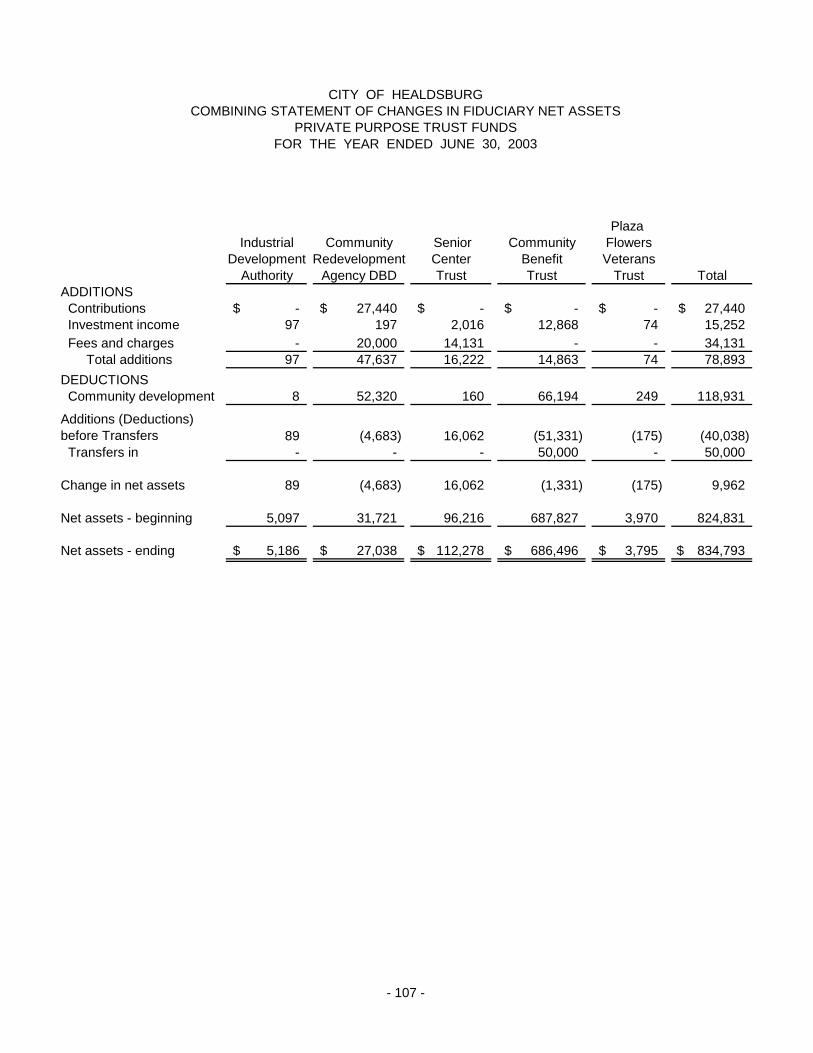
Industrial Senior Development Redevelopment
AuthorityADDITIONS Contributions $ - $ 27,440 $ - $ - $ - $ 27,440 Investment income 97 197 2,016 12,868 74 15,252 Fees and charges - 20,000 14,131 - - 34,131 Total additions 97 47,637 16,222 14,863 74 78,893
DEDUCTIONS Community development 8 52,320 160 66,194 249 118,931
Additions (Deductions) before Transfers 89 (4,683) 16,062 (51,331) (175) (40,038) Transfers in - - - 50,000 - 50,000
Change in net assets 89 (4,683) 16,062 (1,331) (175) 9,962
Net assets - beginning 5,097 31,721 96,216 687,827 3,970 824,831
Net assets - ending $ 5,186 $ 27,038 $ 112,278 $ 686,496 $ 3,795 $ 834,793
- 107 -
Plaza
CITY OF HEALDSBURGCOMBINING STATEMENT OF CHANGES IN FIDUCIARY NET ASSETS
PRIVATE PURPOSE TRUST FUNDSFOR THE YEAR ENDED JUNE 30, 2003
CommunityCommunity
Agency DBDCenterTrust
BenefitTotal
FlowersVeterans
TrustTrust

(This page left intentionally blank).
- 108 -

STATISTICAL SECTION
S - 1

Culture Unallocated Interest onFiscal General Public and Community Infrastructure Long-termYear Government Safety Recreation Development Depreciation Debt
2002 - 03 877,928$ 4,940,266$ 27,117$ 5,551,453$ 22,870$ 1,790,296$
Source: City Finance Department
S-2
This is the first year of implementation of the government-wide expenses by program. Current year totals will continue to be added to this schedule until a total of ten years are listed.
CITY OF HEALDSBURG
GOVERNMENT-WIDE EXPENSES BY PROGRAM
Current Fiscal Year

OtherWater Sewer Electric Street Programs Total
3,082,159$ 2,483,558$ 8,547,494$ 1,193,051$ 1,863,390$ 30,379,582$
S-3

(This page left intentionally blank).
S-4


1993-94 1994-95 1995-96 1996-97REVENUES
Property taxes $ 595,776 $ 583,291 $ 591,724 $ 628,493Special assessments 148,298 7,626 181,942 217,145Sales and franchise taxes 2,394,469 2,520,291 2,714,278 2,839,887Development fees & permits 247,864 909,905 841,895 1,359,596Investment income 311,381 295,005 368,447 340,793Intergovernmental revenues 750,633 947,203 987,498 840,506Charges for services 143,544 78,772 118,135 151,192Other revenue 471,587 813,962 1,370,155 49,554 Subtotal 5,063,552 6,156,055 7,174,074 6,427,166Debt financing 4,175,000 - 2,612,701 1,280,266
Total Revenues $ 9,238,552 $ 6,156,055 $ 9,786,775 $ 7,707,432
1993-94 1994-95 1995-96 1996-97EXPENDITURES
General government $ 242,993 $ 176,826 $ 204,107 $ 282,285Public safety 2,322,796 2,610,168 2,756,034 2,933,313Community development 316,208 464,233 267,373 391,317Public works 151,206 102,397 136,947 147,750Cultural and recreation 385,841 232,370 286,133 307,626Capital outlay 1,974,087 1,682,696 2,072,609 3,735,970Debt service (Including note redemption) 4,856,200 710,013 802,172 851,263Other expenditures 510,057 1,020,484 440,082 886,985 Total Expenditures $ 10,759,388 $ 6,999,187 $ 6,965,457 $ 9,536,509
* Includes all governmental fund types of the City, except for the revenues and expenditures of the Community Redevelopment Agency and Expendable Trust Funds.
Source: The City's annual financial statements.
CITY OF HEALDSBURGGOVERNMENTAL REVENUES BY SOURCE*
LAST TEN FISCAL YEARS
S-6
GENERAL EXPENDITURES BY FUNCTION*LAST TEN FISCAL YEARS

1997-98 1998-99 1999-00 2000-01 2001-02 2002-03
$ 636,989 $ 681,395 $ 976,372 $ 1,094,489 $ 1,270,617 1,325,131287,436 471,013 425,696 385,152 424,321 323,632
2,869,372 2,897,593 3,328,149 3,697,606 3,915,318 3,515,406790,474 1,074,368 1,376,556 564,113 142,675 119,203288,123 290,052 425,102 798,823 316,559 135,577
1,071,011 1,515,698 1,339,619 1,570,120 2,073,657 1,833,631108,686 118,930 290,240 264,751 270,913 283,063704,619 1,129,076 495,107 699,103 905,273 245,391
6,756,710 8,178,125 8,656,841 9,074,157 9,319,333 7,781,0342,675,000 - - - - -
$ 9,431,710 $ 8,178,125 $ 8,656,841 $ 9,074,157 $ 9,319,333 $ 7,781,034
1997-98 1998-99 1999-00 2000-01 2001-02 2002-03
$ 301,790 $ 347,728 $ 353,450 $ 465,798 $ 733,522 369,8843,262,318 3,479,962 3,531,101 3,833,197 4,058,757 4,572,653
553,352 598,295 510,129 8,893 5,180 -151,934 150,897 511,008 551,717 584,390 -370,477 408,636 475,404 534,290 576,737 27,167342,721 824,417 2,327,136 2,132,504 2,172,396 5,628,557
980,651 878,738 983,690 937,439 1,040,942 1,127,0053,632,620 933,824 - - -
$ 9,595,863 $ 7,622,497 $ 8,691,918 $ 8,463,838 $ 9,171,924 $ 11,725,266
S-7

CITY OF HEALDSBURGPROPERTY TAX LEVIES AND COLLECTIONS
LAST TEN FISCAL YEARS
Code Area Secured Secured Percent TotalFiscal Tax Taxes Current of Levy TaxesYear Rate Levied Collections Collected Collected
93-94 1.0594% 533,663 * 533,663 100.0% 727,34994-95 1.0582% 535,241 535,241 100.0% 564,27595-96 1.1105% 544,779 544,779 100.0% 573,06996-97 1.1086% 558,520 558,520 100.0% 583,18097-98 1.1421% 579,792 579,792 100.0% 651,94998-99 1.1357% 607,717 607,717 100.0% 714,57999-00 1.1446% 797,403 797,403 100.0% 997,57600-01 1.1410% 860,290 860,290 100.0% 1,120,64001-02 1.1420% 950,940 950,940 100.0% 1,293,26802-03 1.1520% 979,373 979,373 100.0% 1,342,911
Note:
* Total secured levy of $948,982.37 less redevelopment levy of $413,622,44
Source: County of Sonoma, Auditor
Proposition 13 limits cities to levying a tax rate for bonded indebtedness only after 1978.
S - 8

CITY OF HEALDSBURGASSESSED VALUATION OF TAXABLE PROPERTY
LAST TEN FISCAL YEARS
Net Net Net NetFiscal Secured Unsecured Public Total TaxableYear Property Property Utility Exemptions Value
93-94 503,928,809 37,467,326 1,655,285 13,921,600 543,051,42094-95 541,953,376 38,359,095 1,345,723 9,680,587 581,658,19495-96 558,520,102 37,953,190 1,380,877 11,042,980 597,854,16996-97 569,511,034 38,728,964 1,380,877 13,889,167 609,620,87597-98 572,653,669 35,438,083 - 14,800,591 608,091,75298-99 603,410,485 40,247,869 - 15,021,297 643,658,35499-00 651,239,458 49,434,716 - 15,925,564 700,674,17400-01 720,440,878 56,070,265 - 14,401,380 776,511,14301-02 840,902,505 55,848,269 - 14,726,600 896,750,77402-03 1,036,261,702 65,944,750 - 14,726,600 1,102,206,452
Source: County of Sonoma, Auditor
S - 9

CITY OF HEALDSBURGPROPERTY TAX RATES - DIRECT AND OVERLAPPING GOVERNMENTS
LAST TEN FISCAL YEARS
CountyFiscal City Prop. 13 School Dist.Year Debt Service Tax Rate Debt Service
93-94 0.0500 1.0 0.003494-95 0.0500 1.0 0.002295-96 0.0500 1.0 0.054696-97 0.0500 1.0 0.052697-98 0.0500 1.0 0.086298-99 0.0500 1.0 0.079799-00 0.0700 1.0 0.068600-01 0.0700 1.0 0.065001-02 0.0700 1.0 0.065002-03 0.0600 1.0 0.0850
Tax rate is per $100 assessed valuation.
Source: County of Sonoma, Auditor
S - 10

Coyote ValleyRussian River Dam Land
Project Improvement Total
0.0060 % 0.0005 % 1.0599 %0.0060 0.0004 1.05860.0060 0.0001 1.11070.0060 0.0000 1.10850.0060 0.0000 1.14210.0060 0.0000 1.13560.0060 0.0000 1.14460.0060 0.0000 1.14100.0070 0.0000 1.14200.0070 0.0000 1.1520
S - 11

CITY OF HEALDSBURGRATIO OF GENERAL BONDED DEBT TO ASSESSED VALUATION AND PER CAPITA
LAST TEN FISCAL YEARS
Fiscal Outstanding Percent of Per CapitaYear Principal Valuation Debt
93-94 6,775,000 1.248 % 690.0694-95 6,670,000 1.147 % 681.4595-96 6,570,000 1.099 % 685.3796-97 6,460,000 1.060 % 671.1797-98 * 6,615,000 1.080 % 667.9198-99 6,470,000 1.005 % 645.9099-00 6,310,000 0.901 % 604.9900-01 6,135,000 0.790 % 572.1901-02 5,945,000 0.663 % 526.3902-03 5,720,000 0.519 % 499.56
* Refunded and reissued
Source: City of Healdsburg, Finance Department
S - 12

CITY OF HEALDSBURGSPECIAL ASSESSMENT BILLINGS AND COLLECTIONS
LAST TEN FISCAL YEARS
Fiscal Special Assessment Special AssessmentYear Billings Collected (1)
93-94 141,289 138,46594-95 75,107 7,62695-96 108,424 108,42496-97 271,614 208,95397-98 362,651 275,11398-99 362,749 339,13599-00 364,539 341,26600-01 345,395 321,39501-02 325,856 390,24901-02 339,133 322,172
(1) Includes prepayments and foreclosures.
Source: County of Sonoma, Special Assessments
S - 13
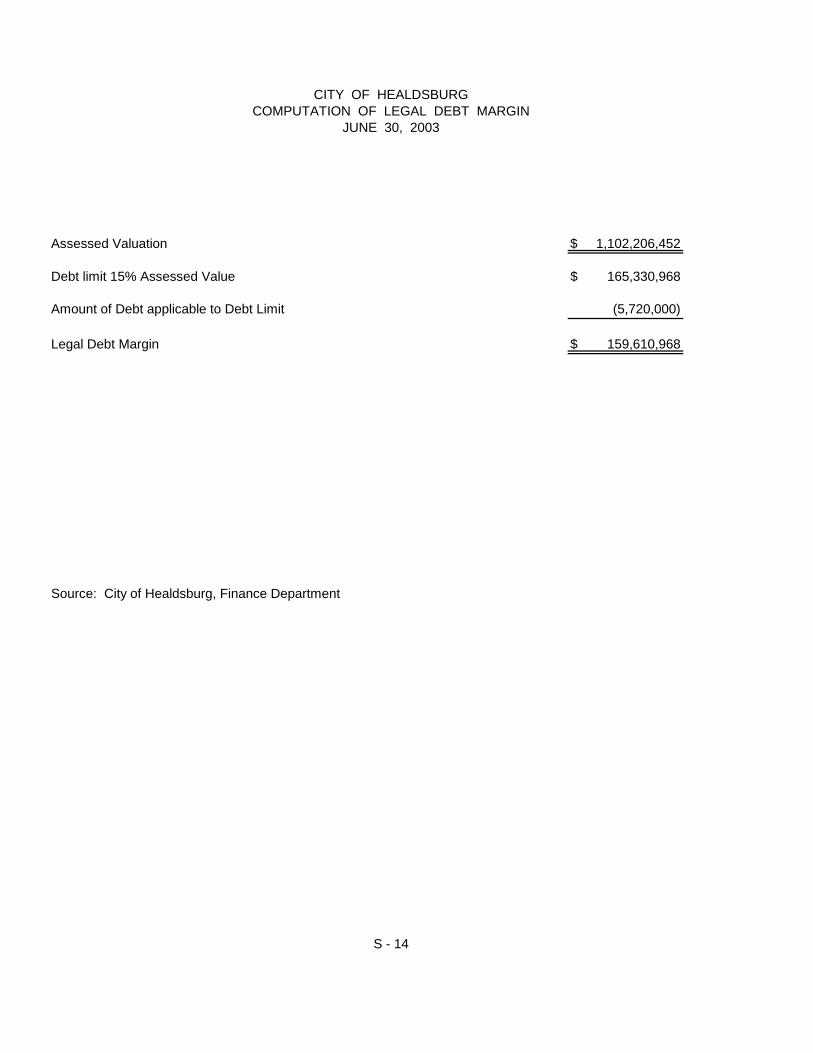
CITY OF HEALDSBURGCOMPUTATION OF LEGAL DEBT MARGIN
JUNE 30, 2003
Assessed Valuation $ 1,102,206,452
Debt limit 15% Assessed Value $ 165,330,968
Amount of Debt applicable to Debt Limit (5,720,000)
Legal Debt Margin $ 159,610,968
Source: City of Healdsburg, Finance Department
S - 14

CITY OF HEALDSBURGCOMPUTATION OF DIRECT AND OVERLAPPING DEBT
JUNE 30, 2003
Percentage City ofGross Debt Applicable Healdsburg
Jurisdiction Outstanding to Healdsburg Share of Debt
City of Healdsburg 1991 Series A&B City of Healdsburg GO Bond $ 5,720,000 100.0% $ 5,720,000
Total Direct Debt $ 5,720,000
City of Healdsburg Public Improvement Corporation 855,000 100.0% $ 855,000
Total Overlapping Debt $ 855,000
Total Direct and Overlapping Debt $ 6,575,000
Source: City of Healdsburg, Finance Department
S - 15

CITY OF HEALDSBURGRATIO OF ANNUAL DEBT SERVICE EXPENDITURES FOR
GENERAL BONDED DEBT TO TOTAL GENERAL EXPENDITURESLAST TEN FISCAL YEARS
Total Ratio of DebtFiscal Total Debt General Service to GeneralYear Principal Interest Service Expenditures Expenditures
1993-94 5,000 342,073 347,073 10,759,388 3.2 %1994-95 105,000 388,585 493,585 6,999,187 7.1 %1995-96 100,000 382,758 482,758 6,965,457 6.9 %1996-97 110,000 375,273 485,273 9,536,509 5.1 %1997-98 110,000 367,409 477,409 9,595,863 5.0 %1998-99 145,000 308,439 453,439 7,619,774 6.0 %1999-00 160,000 312,042 472,042 8,692,362 5.4 %2000-01 175,000 347,850 522,850 8,463,838 6.2 %2001-02 190,000 297,284 487,284 9,171,924 5.3 %2002-03 225,000 288,234 513,234 11,725,266 4.4 %
Source: City of Healdsburg, Finance Department
S - 16

CITY OF HEALDSBURGDEMOGRAPHIC STATISTICS
LAST TEN YEARS
CityPopulation Sonoma Population
Percent County PercentYear Population Change Population of County
1994 9,818 0.6 % 422,090 2.3 %1995 9,788 -0.3 % 431,034 2.3 %1996 9,586 -2.1 % 421,429 2.3 %1997 9,625 0.4 % 426,934 2.3 %1998 9,904 2.9 % 437,112 2.3 %1999 10,017 1.1 % 443,669 2.3 %2000 10,430 4.1 % 450,100 2.3 %2001 10,722 2.8 % 458,614 2.3 %2002 11,294 5.3 % 471,041 2.4 %2003 11,450 1.4 % 472,700 2.4 %
Source: Sonoma County Planning Department State of California Department of Finance
S - 17

CITY OF HEALDSBURGSCHEDULE OF REVENUE BOND COVERAGE
LAST TEN FISCAL YEARS
Net RevenueFiscal Gross Available forYear Revenue (1) Expenses (2) Debt Service
1993-94 $ 8,637,837 $ 6,951,458 $ 1,686,3791994-95 8,437,499 6,896,626 1,540,8731995-96 8,994,691 7,040,064 1,954,6271996-97 * 10,840,631 8,206,544 2,634,0871997-98 11,555,853 8,463,920 3,091,9331998-99 12,082,470 8,064,099 4,018,3711999-00 12,728,691 9,148,735 3,579,9562000-01 15,499,925 12,207,107 3,292,8182001-02 15,919,780 14,246,511 1,673,2692002-03 16,873,209 14,987,299 1,885,910
Source: The City's Annual Financial Statements
(1) Gross revenues include operating income and interest income from the Water and Electric Enterprise utilities.
(2) Expenses include total operating expenses less depreciation for the Water and
Electric Enterprise utilities.
* Starting in 1996-97 the Sewer Enterprise is included with Water and Electric Enterprises.
S - 18

eDEBT SERVICE REQUIREMENTS Percent Coverage
Principal Interest Total (in hundreds)
$ 70,000 $ 156,622 $ 226,622 7.44 %120,000 234,683 354,683 4.34 %130,000 348,596 478,596 4.08 %140,000 449,446 589,446 4.47 %200,000 520,493 720,493 4.29 %225,000 508,041 733,041 5.48 %185,000 488,032 673,032 5.32 %190,000 647,403 837,403 3.93 %295,000 674,936 969,936 1.73 %350,000 808,933 1,158,933 1.63 %
S - 19

CITY OF HEALDSBURGCONSTRUCTION, BANK DEPOSITS, AND PROPERTY VALUE
LAST TEN FISCAL YEARS
Commercial Construction Residential ConstructionFiscal Number NumberYear of Units Value of Units Value
1993-94 24 2,094,220 112 4,513,9291994-95 37 628,105 123 5,414,0191995-96 60 1,203,883 191 1,750,5461996-97 70 2,662,227 219 7,057,7561997-98 89 3,190,278 174 1,866,6991998-99 78 2,849,299 370 25,186,3711999-00 114 6,191,231 315 28,870,2902000-01 71 4,988,305 224 16,342,2212001-02 3 6,377,177 16 3,902,6762002-03 7 9,411,711 25 7,967,449
Federal Deposit Insurance Corporation
Note: Bank deposits are FDIC deposits only.
S - 20
Source: City of Healdsburg - Building Department

TotalBank Deposits Property Value(in thousands) (in thousands)
$ 177,338 $ 543,051176,162 581,658175,421 597,854218,200 609,621226,742 608,092396,441 643,658226,292 700,674238,507 776,511269,177 896,751297,638 1,102,206
S - 21

CITY OF HEALDSBURGHEALDSBURG COMMUNITY REDEVELOPMENT AGENCY
SOTOYOME REDEVELOPMENT PROJECT AREALARGEST SECURED PROPERTY TAX PAYERS
FISCAL YEAR 2002-2003
Tax Payer Type of Business
Brush James E. and Nancy B. Trust Housing
Destruel Properties LLC Housing
Dry Creek Inn LTD Partnership Hotel
Healdsburg Investors LTD Shopping Center
Mascherini, Carole A. Trust Hardware Store
Seghesio Wineries Inc. Winery
Shami, Mitri & Saud Trust Housing
Simi Winery Inc. Winery
Syar Industries Inc. Rock and Gravel MFG.
Terradev Hotel Manager LLC Hotel
Source: County of Sonoma Assessor's Office
S - 22

CITY OF HEALDSBURGSCHEDULE OF INSURANCE AND SURETY BONDS
2002-2003 Summary of Policies
Company Limits/Coverage Cost
LIABILITYCalifornia Joint Powers Risk $4,500,000 xs $500,000. Bodily Injury. Property Damage, Errors $ 669,071 ** Management Authority* and Omissions, Personal Injury. (07/01/02 - 06/30/03)
USAIG #360AC-28694 $ 27,000
WORKERS' COMPENSATIONUnited States Fidelity and Guaranty Co. $1,700,000 xs $300,000 S.I.REmployers' Liability #DRE3601100 (09/13/00 - 07/01/03)
United States Fidelity & Guaranty Statutory xs $300,000 S.I.R. $ 93,555 ***#DRE3601100 (09/13/00 - 07/01/2003)
PROPERTYCHUBB $145,000,000 xs $5,000,000 all risk (excluding earthquake $ 125,176#6607494 and flood). (07/01/02 - 07/01/03)
USF & G $5,000,000 xs $25,000 S.I.R. (07/01/01 - 07/01/03)DRE1540399
Hartford Steam Boiler Ins. Co. $19,995,000 xs $1,000 S.I.R., Boiler/Machinery - Mechanical $ 37,594FBP4909988 breakdown to boilers and other pressure vessels - Fixed rate
per City**** (07/01/02 - 07/01/03)
Fireman's Fund $ 67,893#S95MXX80799295 off premises $1,490,000 xs $10,000 S.I.R.
(07/01/02 - 07/01/03)
BONDSFidelity & Deposit Companies $1,975,000 xs $25,000 S.I.R., Honesty Blanket $ 29,282#CCP0044417 Bond and Forgery Coverage (10/01/99 - 10/01/2002)
$990,000 - $10,000 - REMIF., Treasurer/C.E.O. Bond $ 1,572(10/01/02 - 10/01/2005)
* Risk Sharing Self-Funded Pool *** Subject to Payroll Audit** Contribution **** S.I.R. and Limits Different for Healdsburg and Ukiah
Electrical SubstationsNote: Earthquake/Flood Coverage is Purchased Separate of the REMIF Pool.Source: Redwood Empire Municipal Insurance Fund
S - 23
$5,000,000 - No S.I.R., Non-Owned Aircraft (03/01/03 - 03/01/04)
Automobile Physical Damage Coverage, damage to vehicles

CITY OF HEALDSBURGMISCELLANEOUS STATISTICAL INFORMATION
JUNE 30, 2003
Date Incorporated - February 20 1867Type of City - General LawForm of Government - Council/City Manager
Police Services - 1 Station- 17 Sworn Officers- 12 Reserves/Volunteer
Fire Services - 1 Station- 9 Personnel- 40 Reserves/Volunteer
Cultural/Recreational - 1 Museum- 1 Library- 1 Senior Center- 7 Parks- 1 Golf Course- 1 Swimming Pool
City Personnel - 106 Full-Time- 17 Part Time- 52 Reserve/Volunteer- 2 Seasonal Workers- 10 Temporary
NOTE: Positions listed are authorized/budgeted positions and are not necessarily filled.
Source: City of Healdsburg, Personnel Department
S - 24

CITY OF HEALDSBURGSCHEDULE OF TEN MAJOR BUSINESSES
JUNE 30, 2003
Name Type of Business
Garrett Hardware & Plumbing Hardware
Healdsburg Lumber Company Lumber Products
Longs Drug Stores Retail Store
McConnell Chevrolet/Olds/Geo Car Dealer
Opperman & Son Used Trucks Car Dealer
Safeway Stores Grocery Store
Silveira Pontiac/Buick/GMC Car Dealer
Syar Industries Building Materials
Vintage Water Works Supply Building Materials
W.C. Sanderson Ford Car Dealer
Listed in alphabetical order, ranked by State Sales Tax, Gross Retail Sales.
Source: State Board of Equalization
S - 25

(This page left intentionally blank).
S - 26

CITY OF HEALDSBURGSCHEDULE OF SCHOOLS AVERAGE DAILY ATTENDANCE
LAST TEN FISCAL YEARS
Fiscal Elementary Junior High Senior HighYear K - 6 7 - 8 9 - 12
1993-94 1,376 521 1,3491994-95 1,341 490 1,3811995-96 1,313 474 1,2571996-97 1,315 469 1,1561997-98 1,262 484 1,0971998-99 1,169 445 9081999-00 1,210 430 9752000-00 1,269 452 9672001-02 1,262 457 9682002-03 1,151 459 949
Source: Healdsburg Unified School District
S - 27

2003 2002 2001 2000Operating Revenues:
Utility service charges $ 3,444,666 $ 2,909,292 $ 2,671,027 $ 2,455,946Other 337,914 117,311 550,220 11,590Total Operating Revenues 3,782,580 3,026,603 3,221,247 2,467,536
Operating Expenses:Operations 1,517,772 1,354,427 1,660,270 1,083,534General and administrative 536,962 433,550 509,320 438,603Depreciation 326,350 297,844 292,935 302,469Miscellaneous - - - - Total Operating Expenses 2,381,084 2,085,821 2,462,525 1,824,606
Income (Loss) from Operations 1,401,496 940,782 758,722 642,930
Non-operating Revenues (Expenses):Intergovernmental grant - - - -Investment income 124,305 202,237 547,840 225,955Interest expense (620,906) (472,959) (451,480) (420,335)Loss in disposal of assets - - (128,719) (23,622)Other expenses - - - - Total Non-operating Revenues (Expenses) (496,601) (270,722) (32,359) (218,002)
Income (Loss) Before Operating Transfers and Capital Contributions 904,895 670,060 726,363 424,928
Operating Transfers In (Out) (181,761) 282,014 375,850 (98,200)
Net Income Before Capital Contributions 723,134 952,074 1,102,213 326,728
Capital Contributions 21,161 233,840 202,854 -
Net Income (Loss) $ 744,295 $ 1,185,914 $ 1,305,067 $ 326,728
Source: City of Healdsburg, Finance Department
CITY OF HEALDSBURGSCHEDULE OF NET INCOME
WATER FUND
S -28
FOR THE YEARS ENDED JUNE 30, 1994-2003

1999 1998 1997 1996 1995 1994
$ 2,224,131 $ 1,860,618 $ 1,743,286 $ 1,555,991 $ 1,359,348 $ 1,429,10923,796 45,768 293 1,623 524 3,084
2,247,927 1,906,386 1,743,579 1,557,614 1,359,872 1,432,193
1,102,837 814,111 834,368 695,562 708,933 693,377476,717 493,428 403,615 347,497 300,950 313,231266,307 223,450 205,798 175,892 166,095 160,946
- - - - - -1,845,861 1,530,989 1,443,781 1,218,951 1,175,978 1,167,554
402,066 375,397 299,798 338,663 183,894 264,639
2,183 15,155 371 29,049 78,981 -203,983 353,151 348,861 291,015 218,504 94,946
(437,190) (471,541) (396,073) (324,277) (207,803) (130,308)(9,865) (100,292) (150) (2,000) - -
- - (480) - (169,163) (96,454)(240,889) (203,527) (47,471) (6,213) (79,481) (131,816)
161,177 171,870 252,327 332,450 104,413 132,823
- - - - - -
161,177 171,870 252,327 332,450 104,413 132,823
- - - - - -
$ 161,177 $ 171,870 $ 252,327 $ 332,450 $ 104,413 $ 132,823
S -29

Cash flows from operating activities:Operating income (loss) $ 1,401,496 $ 940,782 $ 758,722
Adjustments to reconcile operating income to net cashprovided (used) by operating activities:
Depreciation 326,350 297,844 292,935Other revenue (expense) - - -Changes in operating assets and liabilities:
(Increase) decrease in accounts receivable 16,243 (44,799) (110,651)(Increase) decrease in due from other governments - - -(Increase) decrease in inventory (10,228) 11,098 (21,087)(Increase) decrease in prepaid costs (1,058) 349 (23)Increase (decrease) in accounts payable (160,088) 113,979 194,320Increase (decrease) in other accrued liabilities - - -Increase (decrease) in deposits (8,396) 3,900 3,859 Total adjustments 162,823 382,371 359,353Net cash provided (used) by operating activities 1,564,319 1,323,153 1,118,075
Cash flows from non-capital financing activities:Intergovernmental grant - - -(Increase) decrease in due from other funds - - -Increase (decrease) in due to other funds 353,281 - -Operating transfers in (out) (535,042) 282,014 375,850
Net cash provided (used) by non-capital financing activities (181,761) 282,014 375,850
Cash flows from capital and related financing activities:Acquisition of capital assets
Developer financed - - -Capital replacement (1,363,437) (3,456,560) (1,003,448)Capacity expansion - - -
Contributed capitalDevelopment/connection/annexation fees 21,161 233,840 202,854Contributed - other fundsResidual equity transfer - - -Developer contributions - - -
Certificates of participation proceeds 5,510,000 - 10,136,304Retirement of debt (280,000) (244,287) (7,135,000)Certificate issuance cost - - -Interest expense (759,269) (467,993) (812,483)
Net cash provided (used) by capital and related financing activities 3,128,455 (3,935,000) 1,388,227
Cash flows from investing activities:Investment income 136,982 280,893 505,175(Increase) decrease in investments - (357,562) (1,480,698)(Increase) decrease in loans - - 39,410
Net cash provided (used) by investing activities 136,982 (76,669) (936,113)
Net increase in cash and cash equivalents 4,647,995 (2,406,502) 1,946,039
Cash and cash equivalents at beginning of year 5,329,778 2,946,999 1,000,960
Cash and cash equivalents at end of year $ 9,977,773 $ 540,497 $ 2,946,999Noncash capital and related financing activities
Acquisition of capital assets - - (128,719)Contributed capital by developer - - -
Net noncash capital and related financing activities $ - $ - $ (128,719)
Source: City of Healdsburg, Finance Department
2001
SCHEDULE OF CASH FLOWSWATER FUND
FOR THE YEARS ENDED JUNE 30 1994-2003
S - 30
20022003

1994
$ 642,930 $ 402,066 $ 375,397 $ 313,527 $ 338,663 $ 183,894 $ 264,639
302,469 266,307 223,450 205,798 175,892 166,095 160,946- - - (480) - (169,163) (96,454)
(51,580) (123,531) 4,893 (47,849) (58,449) (2,642) (3,766)61,653 27,009 (73,824) 13,327 69,871 (98,036) -(5,964) (485) 6,878 (7,136) 9,365 3,959 (4,624)
(10) (13) (7) (296) - - -(21,771) (152,361) 144,952 16,085 73,448 (11,482) 43,736
- - - - - - -(2,700) 3,115 882 1,362 (234) 485 220
282,097 20,041 307,224 180,811 269,893 (110,784) 100,058925,027 422,107 682,621 494,338 608,556 73,110 364,697
- 2,183 - 371 29,049 78,981 -190,000 350,000 15,155 - - - -
- - (540,000) - - - -(98,200) - - - - - -91,800 352,183 (524,845) 371 29,049 78,981 -
- (1,177,121) - - - (9,430) -(994,589) - (1,095,076) (710,448) (203,264) (161,661) (177,085)
- - (2,558,019) (809,647) (497,677) (601,388) (341,042)
808,451 630,774 - 525,703 319,028 9,430 53,112468,544 - - 379,389 -
- - - - - - -- - - - - 450 -- - (137,145) 2,256,982 (86,497) 1,871,100 2,672,237
(155,144) (162,144) - (1,272) - (90,005) (38,786)- - - (128,231) - (97,852) (81,938)
(405,496) (422,330) (456,722) (396,073) (359,428) (207,803) (130,308)(746,778) (1,130,821) (3,778,418) 737,014 (827,838) 1,092,230 1,956,190
206,284 227,923 352,539 335,308 266,241 214,347 95,804(500,000) (505) (145,777) (390,632) (730,283) 24,458 (194,633)
(54,027) - - - - - -(347,743) 227,418 206,762 (55,324) (464,042) 238,805 (98,829)
(77,694) (129,113) (3,413,880) 1,176,399 (654,275) 1,483,126 2,222,058
1,078,654 1,207,767 4,621,647 3,445,248 4,099,523 2,616,397 394,339
$ 1,000,960 $ 1,078,654 $ 1,207,767 $ 4,621,647 $ 3,445,248 $ 4,099,523 $ 2,616,397
(23,622) (100,291) - - - -- - - - - - -
$ (23,622) $ - $ (100,291) $ - $ - $ - $ -
S - 31
19951998 19962000 1999 1997

Water Sold/Hundred Cubic Feet 1993-94 1994-95 1995-96 1996-97
July 110,956 118,685 108,472 122,066August 123,944 113,624 114,116 131,962September 120,511 120,337 131,329 121,255October 91,758 96,208 96,509 101,461November 66,644 66,631 86,171 80,801December 48,514 46,518 61,056 49,770January 45,314 42,918 44,547 47,217February 41,170 39,739 42,181 41,516March 42,028 41,429 40,255 47,892April 56,115 45,163 47,948 63,923May 64,899 51,226 72,286 83,648June 87,231 79,329 86,467 104,167
Total 899,084 861,807 931,337 995,678
Total Billings 1993-94 1994-95 1995-96 1996-97
July $ 160,111 $ 169,240 $ 154,609 $ 188,123August 179,462 163,483 162,825 203,078September 172,440 170,528 182,462 188,169October 139,196 142,559 157,302 165,211November 109,147 108,038 143,281 136,543December 86,207 83,686 110,599 95,532January 82,616 79,645 89,569 97,292February 78,285 75,546 85,528 88,334March 78,831 78,031 83,723 98,801April 94,024 81,736 94,013 124,611May 105,626 88,924 123,635 153,486June 130,922 120,108 142,433 183,860
Total $ 1,416,867 $ 1,361,524 $ 1,529,979 $ 1,723,040
Revenue/Hundred Cubic Feet 1993-94 1994-95 1995-96 1996-97
July $ 1.443 $ 1.426 $ 1.425 $ 1.541August 1.448 1.439 1.426 1.539September 1.431 1.417 1.389 1.552October 1.517 1.482 1.629 1.629November 1.638 1.621 1.663 1.690December 1.777 1.799 1.811 1.920January 1.823 1.856 2.010 2.061February 1.902 1.901 2.027 2.128March 1.876 1.883 2.079 2.063April 1.676 1.810 1.960 1.949May 1.628 1.736 1.710 1.835June 1.501 1.514 1.647 1.765
Average $ 1.576 $ 1.580 $ 1.643 $ 1.731
Source: City of Healdsburg - Utility Department
S-32
CITY OF HEALDSBURGSCHEDULE OF WATER SOLD AND REVENUE PER HUNDRED CUBIC FEET
LAST TEN FISCAL YEARS

1997-98 1998-99 1999-00 2000-01 2001-02 2002-03
119,625 94,098 124,006 120,565 122,998 129,426139,487 135,762 125,072 119,845 120,704 134,202112,813 119,448 103,036 217,593 128,824 132,10792,941 103,846 103,860 8,651 96,824 105,64675,646 76,280 77,746 71,730 70,075 88,51445,455 48,932 50,628 151,493 48,562 47,08044,931 52,084 55,095 47,985 49,833 48,90539,433 38,840 44,171 42,371 43,534 44,14938,803 39,852 34,009 42,520 46,318 39,68140,930 46,017 61,625 56,940 54,006 64,94950,155 64,504 75,098 82,539 84,024 48,94863,595 104,760 96,390 127,578 117,528 102,559
863,814 924,423 950,736 1,089,810 983,230 986,166
1997-98 1998-99 1999-00 2000-01 2001-02 2002-03
$ 208,061 $ 203,715 $ 277,183 $ 290,991 $ 316,829 $ 377,692236,396 277,541 284,246 292,455 314,358 388,593201,602 249,641 232,324 540,325 328,654 383,287196,647 228,998 247,081 18,874 271,307 335,532165,812 181,375 201,201 201,770 213,148 296,673114,830 131,430 145,122 154,596 168,193 185,751115,288 138,061 145,569 155,795 174,432 203,678108,191 113,418 131,064 140,012 161,461 187,490106,582 118,801 128,168 143,159 167,578 181,951113,351 128,293 169,873 169,252 189,216 255,351128,089 163,752 194,035 224,054 258,382 212,741148,085 238,927 239,254 317,661 336,732 352,706
$ 1,842,934 $ 2,173,952 $ 2,395,120 $ 2,648,944 $ 2,900,290 $ 3,361,445
1997-98 1998-99 1999-00 2000-01 2001-02 2002-03
$ 1.739 $ 2.165 $ 2.235 $ 2.414 $ 2.575 $ 2.9181.695 2.044 2.273 2.440 2.604 2.8961.787 2.090 2.255 2.483 2.551 2.9012.116 2.205 2.379 2.182 2.802 3.1762.192 2.378 2.588 2.813 3.041 3.3522.526 2.686 2.866 1.020 3.463 3.9452.566 2.651 2.642 3.247 3.500 4.1652.744 2.920 2.967 3.304 3.708 4.2472.747 2.981 3.769 3.367 3.617 4.5852.769 2.788 2.757 2.972 3.503 3.9322.554 2.539 2.584 2.715 3.075 4.3462.329 2.281 2.482 2.490 2.865 3.440
$ 2.133 $ 2.352 $ 2.519 $ 2.431 $ 2.950 $ 3.409
S-33

2003 2002 2001 2000Operating Revenues:
Utility service charges $ 3,128,820 $ 2,826,766 $ 2,461,635 $ 2,142,903Other 951,379 446,407 790,121 642Total Operating Revenues 4,080,199 3,273,173 3,251,756 2,143,545
Operating Expenses:Operations 806,290 699,797 682,268 801,228General and administrative 958,426 853,289 746,544 443,019Depreciation 462,182 461,567 434,226 475,136 Total Operating Expenses 2,226,898 2,014,653 1,863,038 1,719,383
Income (Loss) from Operations 1,853,301 1,258,520 1,388,718 424,162
Non-operating Revenues (Expenses):Intergovernmental grant - - - -Investment income 131,172 191,295 501,221 178,311Interest expense (182,045) (185,189) (178,442) (50,490)Loss in disposal of assets - - (190,477) (39,624)Other expenses - - - - Total Non-operating Revenues (Expenses) (50,873) 6,106 132,302 88,197
Income (Loss) Before Operating and Transfers and Capital Contributions 1,802,428 1,264,626 1,521,020 512,359
Operating Transfers In (Out) (81,760) (337,942) (325,400) 434,800
Net Income Before Capital Contributions 1,720,668 926,684 1,195,620 947,159
Capital Contributions 47,261 410,448 440,261 -
Net Income (Loss) $ 1,767,929 $ 1,337,132 $ 1,635,881 $ 947,159
Source: City of Healdsburg, Finance Department
FOR THE YEARS ENDED JUNE 30, 1994-2003
S -34
CITY OF HEALDSBURGSCHEDULE OF NET INCOME
SEWER FUND

1999 1998 1997 1996 1995 1994
$ 1,882,704 $ 1,585,660 $ 1,373,948 $ 1,141,300 $ 1,039,003 $ 1,053,00942,902 91,628 14,092 - - -
1,925,606 1,677,288 1,388,040 1,141,300 1,039,003 1,053,009
848,612 647,522 535,866 633,629 530,317 519,153500,628 443,145 405,181 375,655 344,987 309,144418,628 366,880 340,035 308,598 293,756 288,246
1,767,868 1,457,547 1,281,082 1,317,882 1,169,060 1,116,543
157,738 219,741 106,958 (176,582) (130,057) (63,534)
93 1,405 16 31,774 23,303 -75,980 179,167 38,765 40,921 59,214 23,804
(52,082) (218,657) (31,532) - - (44)(8,616) (1,573) (152,018) (3,282) (10,163) (295)
- - 7,159 - (39,658) -15,375 (39,658) (137,610) 69,413 32,696 23,465
173,113 180,083 (36,521) (107,169) (97,361) (40,069)
- - - - - -
173,113 180,083 (36,521) (107,169) (97,361) (40,069)
- - - - - -
$ 173,113 $ 180,083 $ (36,521) $ (107,169) $ (97,361) $ (40,069)
S -35

2003 2002 2001Cash flows from operating activities:
Operating income (loss) $ 1,853,301 $ 1,258,520 $ 1,388,718Adjustments to reconcile operating income to net cashprovided (used) by operating activities:
Depreciation 462,182 461,567 434,226Other revenue (expenses)Changes in operating assets and liabilities:
(Increase) decrease in accounts receivable (129,344) 523 (33,873)(Increase) decrease in due from other governments - - -(Increase) decrease in inventory (126) 254 40(Increase) decrease in prepaid costs (394) 349 (23)Increase (decrease) in accounts payable 485,153 2,067 (103,690)Increase (decrease) in deposits (600) - - Total adjustments 816,871 464,760 296,680Net cash provided (used) by operating activities 2,670,172 1,723,280 1,685,398
Cash flows from non-capital financing activities:Intergovernmental grant - - -(Increase) decrease in due from other funds 3,282 - -Operating transfers in (out) (85,042) (337,942) (325,400)
Net cash provided (used) by non-capital financing activities (81,760) (337,942) (325,400)
Cash flows from capital and related financing activities:Acquisition of capital assets
Developer financed - - -Capital replacement (1,339,677) (1,647,554) (2,348,656)Capacity expansion - - -
Contributed capitalConstruction reimbursement 47,261 410,448 440,261Dev./connection/annexation fees - - -Contributed - other funds - - -Certificates of participation proceeds - - 2,572,497Certificate issuance cost - - -Interest paid (175,953) (180,010) (263,346)Residual equity transfer - - -
Retirement of debt (60,000) (54,090) -Interest expense - - -
Net cash provided (used) by capital and related financing activities (1,528,369) (1,471,206) 400,756Cash flows from investing activities:
Investment income 142,556 267,700 451,788(Increase) decrease in investments - (222,875) (1,245,880)(Increase) decrease in loans - - 7,066
Net cash provided (used) by investing activities 142,556 44,825 (787,026)
Net increase in cash and cash equivalents 1,202,599 (41,043) 973,728
Cash and cash equivalents at beginning of year 6,231,891 1,214,913 241,185
Cash and cash equivalents at end of year $ 7,434,490 $ 1,173,870 $ 1,214,913
Noncash capital and related financing activitiesAcquisition of capital assets - - (190,477)Contributed capital - other funds - - -Contributed capital by developer - - -
Net noncash capital and related financing activities $ - $ - $ (190,477)
Source: City of Healdsburg, Finance Department
SCHEDULE OF CASH FLOWSSEWER FUND
FOR THE YEARS ENDED JUNE 30 1994-2003
S - 36

2000 1999 1998 1997
$ 424,162 $ 157,738 $ 219,741 $ 115,407 $ (176,582) $ (130,057) $ (63,534)
475,136 418,628 366,880 340,035 308,598 293,756 288,246- - - (7,159) - (39,658) -
(41,075) (42,437) (45,837) (3,860) (32,412) (9,639) (3,248)12,866 10,895 (12,445) 18,052 10,544 (39,912) -
23 52 (95) 1,808 (1,694) 368 54(10) (13) (7) (296) -
(91,780) 253,582 (115,265) 88,851 4,862 (7,301) (68,558)782 - (182) - - - -
355,942 640,707 193,049 437,431 289,898 197,614 216,494780,104 798,445 412,790 552,838 113,316 67,557 152,960
- 93 1,405 16 31,774 23,303 -(190,000) - - - - - -434,800 (350,000) 540,000 - - - -244,800 (349,907) 541,405 16 31,774 23,303 -
- (436,504) - - - (35,120) -(417,787) - (239,048) (1,539,799) (914,135) (109,725) (312,331)
- - (2,137,278) (1,480,888) (169,580) (326,088) (155,365)
1,478,099 879,194 1,276,075 2,184,670 - 35,120 -- - - - 380,855 413,522 83,982- - - - - 140,717 170,173
(14,684) (14,683) (14,683) 940,658 - - -- - - (67,097) - - -
(48,215) (49,808) (216,382) (31,532) - - -- - - - - - -- - - - - (109) (1,349)- - - - - - (44)
997,413 378,199 (1,331,316) 6,012 (702,860) 118,317 (214,934)
145,594 68,256 178,994 40,298 42,410 55,459 32,495(2,986,273) (602,993) 3,681 (1,041) 299,219 147,950 (449,809)
(25,176) - - - - - -(2,865,855) (534,737) 182,675 39,257 341,629 203,409 (417,314)
(843,538) 292,000 (194,446) 598,123 (216,141) 412,586 (479,288)
1,084,723 792,723 987,169 389,046 738,027 325,441 804,729
$ 241,185 $ 1,084,723 $ 792,723 $ 987,169 $ 521,886 $ 738,027 $ 325,441
(39,624) (8,616) (1,573) - (2,473,636) (140,717) -- - - - 2,473,636 140,717 -- - - - - - -
$ (39,624) $ (8,616) $ (1,573) $ - $ - $ - $ -
1995 19941996
S - 37

2003 2002 2001 2000Operating Revenues:
Utility service charges $ 8,391,718 $ 8,239,704 $ 7,357,293 $ 7,034,610Other 177,162 148,242 85,163 6,577Total Operating Revenues 8,568,880 8,387,946 7,442,456 7,041,187
Operating Expenses:Electric procurement 5,626,154 8,597,303 5,684,650 4,631,989Operations 1,241,154 1,122,220 1,204,423 859,526General and administrative 1,227,609 1,185,925 901,891 890,836Depreciation 343,468 311,980 274,093 262,526 Total Operating Expenses 8,438,385 11,217,428 8,065,057 6,644,877
Income (Loss) from Operations 130,495 (2,829,482) (622,601) 396,310
Non-operating Revenues (Expenses):Intergovernmental grant 15,000 69,500 - -Investment income 186,073 259,678 535,405 672,157Interest expense (5,981) (12,688) (13,138) (13,813)Loss in disposal of assets (640) - (174,726) (76,820)Other expenses - - - - Total Non-operating Revenues (Expenses) 194,452 316,490 347,541 581,524
Income (Loss) Before Operating and Transfers and Capital Contributions 324,947 (2,512,992) (275,060) 977,834
Operating Transfers In (Out) (180,727) (2,942) (875,400) (273,350)
Net Income Before Capital Contributions 144,220 (2,515,934) (1,150,460) 704,484
Capital Contributions 191,082 552,848 771,208 -
Net Income (Loss) $ 335,302 $ (1,963,086) $ (379,252) $ 704,484
Source: City of Healdsburg, Finance Department
FOR THE YEARS ENDED JUNE 30, 1994-2003
S - 38
CITY OF HEALDSBURGSCHEDULE OF NET INCOME (LOSS)
ELECTRIC FUND

1999 1998 1997 1996 1995 1994
$ 7,016,103 $ 6,916,923 $ 6,768,072 $ 6,693,616 $ 6,444,853 $ 6,714,6518,331 3,436 1,519 4,796 15,826 1,142
7,024,434 6,920,359 6,769,591 6,698,412 6,460,679 6,715,793
3,827,387 4,583,568 4,631,057 4,618,668 4,629,267 4,669,318777,565 655,861 728,524 678,568 647,378 622,247836,624 826,285 709,120 699,769 610,098 653,285276,846 273,224 262,436 265,513 260,591 275,031
5,718,422 6,338,938 6,331,137 6,262,518 6,147,334 6,219,881
1,306,012 581,421 438,454 435,894 313,345 495,912
- - - 35,690 26,666 -604,540 519,502 551,795 447,650 398,444 394,905(16,347) (19,166) (21,841) (24,319) (26,880) (28,778)(41,747) (4,662) (34,968) - (148) (37)
- - (84) - (64,667) -546,446 495,674 494,902 459,021 333,415 366,090
1,852,458 1,077,095 933,356 894,915 646,760 862,002
- - - - - -
1,852,458 1,077,095 933,356 894,915 646,760 862,002
- - - - - -
$ 1,852,458 $ 1,077,095 $ 933,356 $ 894,915 $ 646,760 $ 862,002
S -39

Cash flows from operating activities:Operating income (loss) $ 130,495 $ (2,829,482) $ (622,602)Adjustments to reconcile operating income to net cashprovided (used) by operating activities:
Depreciation 343,468 311,980 274,093Other revenue (expenses) - - -Changes in operating assets and liabilities:
(Increase) decrease in accounts receivable 175,983 (160,500) (181,460)(Increase) decrease in due from other governments - - -(Increase) decrease in inventory (125,070) 32,177 60,245(Increase) decrease in prepaid costs (429,786) (55,155) 403,247Increase (decrease) in accounts payable 230,134 (187,026) 101,177Increase (decrease) in deposits (11,308) (572,476) (432,978) Total adjustments 183,421 (631,000) 224,324Net cash provided (used) by operating activities 313,916 (3,460,482) (398,278)
Cash flows from non-capital financing activities:Intergovernmental grant - 69,500 -(Increase) decrease in due from other funds 47,327 87,034 (1,726,953)
Operating transfers in (out) (180,727) (2,942) (875,400)Net cash provided (used) by non-capital financing activities (133,400) 153,592 (2,602,353)
Cash flows from capital and related financing activities:Acquisition of capital assets
Developer financed (465,719) (834,684) (792,389)Capital replacement - - -Capacity expansion - - -
Contributed capitalConstruction reimbursement 191,082 552,848 771,208Dev./connection/annexation feesContributed - other funds - - -Residual equity transfer - - -
Certificates of participation proceedsRetirement of debt (165,000) (9,750) (9,750)Certificate issuance cost - - -Advances to other fundsInterest paid - (11,861) (12,310)
Net cash provided (used) by capital and related financing activities (439,637) (303,447) (43,241)
Cash flows from investing activities:Investment income 208,156 359,161 589,907(Increase) decrease in investments - 245,225 3,572,392(Increase) decrease in loan receivables - - 4,247
Net cash provided (used) by investing activities 208,156 604,386 4,166,546
Net increase in cash and cash equivalents (50,965) (3,005,951) 1,122,674
Cash and cash equivalents at beginning of year 7,673,360 3,206,038 2,059,564
Cash and cash equivalents at end of year $ 7,622,395 $ 200,087 $ 3,182,238
Noncash capital and related financing activitiesAcquisition of capital assets - - (174,726)
Net noncash capital and related financing activities $ - $ - $ (174,726)
2001
FOR THE YEARS ENDED JUNE 30 1994-2003
2002
S - 40
2003
SCHEDULE OF CASH FLOWSELECTRIC FUND

$ 396,310 $ 1,306,012 $ 581,421 $ 457,465 $ 435,894 $ 313,345 $ 495,912
262,526 276,846 273,224 262,436 265,513 260,591 275,031- - - (84) - (64,667) -
(145,072) (95,880) 7,504 35,087 (148,922) (56,412) 114,49011,215 8,111 (6,355) 22,832 3,609 (39,412) 13,000
(392,202) 10,300 (56,342) (69,472) 40,097 (24,504) (7,079)(425,652) 348,391 (348,411) (298) - - -
14,464 (132,193) 160,201 (2,302) 35,344 4,549 (6,335)3,026 (1,097) (6,440) (5,964) (5,839) 635 5,320
(671,695) 414,478 23,381 242,235 189,802 80,780 394,427(275,385) 1,720,490 604,802 699,700 625,696 394,125 890,339
- - - - 35,690 26,666 -(478,399) 5,989 359,701 (299,003) 60,660 311,364 (388,873)(273,350) - - - - - -(751,749) 5,989 359,701 (299,003) 96,350 338,030 (388,873)
(371,383) (1,014,041) (361,656) (200,353) (61,289) (72,828) (50,259)- - (206,271) (195,464) (56,752) (296,262) (258,215)- - (235,529) (272,970) (375,819) (78,008) (109,111)
632,651 977,900 687,039 491,647 43,422 122,276 42,353195,590 105,481 100,924
- - - - - - -- - - - - - (54,254)- - - (40,000) (36,750) - -
(9,750) (42,748) (42,750) 827 (31,069) (28,750) (28,750)- - - - - 827 -- - - - - (26,880) -
(12,986) (15,520) (18,338) (21,591) - - (27,951)238,532 (94,409) (177,505) (237,904) (322,667) (274,144) (385,263)
619,909 590,543 505,422 545,931 428,916 394,333 381,931(5,224,626) (1,102,150) - 1,028,197 118,193 (515,475) (783,216)
(24,928) 1,698,679 1,151 2,676 3,425 97,432(4,629,645) (511,607) 2,204,101 1,575,279 549,785 (117,717) (303,853)
(5,418,247) 1,120,463 2,991,099 1,738,072 949,164 340,294 (187,650)
7,477,811 6,357,348 3,366,249 1,628,177 679,013 338,719 (1,039,000)
$ 2,059,564 $ 7,477,811 $ 6,357,348 $ 3,366,249 $ 1,628,177 $ 679,013 $ (1,226,650)
(76,820) (41,747) (4,662) - - - -
$ (76,820) $ (41,747) $ (4,662) $ - $ - $ - $ -
2000 1999 1998 1997 199419951996
S - 41

1993-94 1994-95 1995-96 1996-97Number of Customers
Residential 3,759 3,771 3,833 3,892
Industrial and Heavy Commercial 72 69 75 70
Commercial 764 768 767 760
Municipal 58 62 57 54
Outside Lighting 40 44 40 40
Total 4,693 4,714 4,772 4,816
Energy Sales (MWH)
Residential 21,339 21,698 22,111 22,389
Industrial and Heavy Commercial 3,034 2,231 2,830 2,351
Commercial 33,479 31,913 32,291 33,222
Municipal 3,989 4,044 5,152 4,852
Outside Lighting 506 586 587 585
Total 62,347 60,472 62,971 63,399
Operating Billings (in millions)
Residential $2.509 $2.473 $2.484 $2.660
Industrial and Heavy Commercial 0.336 0.271 0.318 0.217
Commercial 3.593 3.379 3.406 3.466
Municipal 0.329 0.311 0.385 0.370
Outside Lighting 0.037 0.037 0.037 0.037
Total $6.804 $6.471 $6.630 $6.750
Source: City of Healdsburg - Utility Department
CITY OF HEALDSBURGSCHEDULE OF ELECTRIC UTILITY CUSTOMERS, SALES AND REVENUE
LAST TEN FISCAL YEARS
S-42

1997-98 1998-99 1999-00 2000-01 2001-02 2002-03
3,933 3,872 4,192 4,351 4,381 4,387
83 87 80 78 100 89
781 819 834 817 855 865
65 64 66 74 72 77
41 42 60 43 20 19
4,903 4,884 5,232 5,363 5,428 5,437
22,822 23,552 23,446 25,028 24,596 25,015
2,676 3,485 3,197 3,695 3,142 2,945
34,764 34,323 33,417 35,099 34,326 35,676
4,754 4,959 4,975 4,540 4,794 4,628
584 585 585 583 585 583
65,600 66,904 65,620 68,945 67,443 68,847
$2.749 $2.891 $2.883 $3.073 $3.154 $3.200
0.296 0.377 0.342 0.393 0.378 0.367
3.667 3.679 3.632 3.801 4.013 4.148
0.375 0.407 0.401 0.375 0.434 0.418
0.039 0.042 0.041 0.040 0.042 0.042
$7.126 $7.396 $7.299 $7.682 $8.021 $8.175
S-43

MWH Sold 1993-94 1994-95 1995-96 1996-97July 5,323 5,023 5,136 5,633August 5,672 4,975 5,552 5,545September 5,763 5,668 5,819 5,671October 5,382 5,108 5,137 5,485November 5,132 5,108 5,509 5,255December 5,073 5,222 5,214 5,054January 5,819 5,479 5,294 5,501February 4,820 4,846 5,292 5,068March 5,071 4,702 4,911 4,938April 4,597 5,035 4,809 4,908May 4,714 4,348 5,175 4,945June 4,986 4,958 5,122 5,403
Total 62,352 60,472 62,970 63,406
Total Billings 1993-94 1994-95 1995-96 1996-97July $ 644,304 $ 590,827 $ 563,683 $ 625,541August 686,071 573,984 649,474 638,438September 690,447 642,293 683,515 644,785October 638,202 597,238 605,405 617,658November 615,465 594,360 630,650 621,274December 521,568 510,614 500,712 517,247January 581,173 535,067 522,973 567,330February 467,775 473,886 493,159 519,189March 490,828 457,477 464,377 414,694April 440,875 481,677 449,782 468,136May 446,715 429,937 481,428 480,457June 580,575 584,555 585,331 645,139
Total $ 6,803,998 $ 6,471,915 $ 6,630,489 $ 6,759,888
Revenue/KWH 1993-94 1994-95 1995-96 1996-97July $ 0.12104 $ 0.11762 $ 0.10975 $ 0.11105August 0.12096 0.11537 0.11698 0.11513September 0.11981 0.11332 0.11746 0.11370October 0.11858 0.11692 0.11785 0.11261November 0.11993 0.11636 0.11448 0.11830December 0.10281 0.09778 0.09603 0.10234January 0.09988 0.09766 0.09879 0.10313February 0.09705 0.09779 0.09319 0.10244March 0.09679 0.09729 0.09456 0.08398April 0.09590 0.09567 0.09353 0.09538May 0.09476 0.09888 0.09303 0.09716June 0.11644 0.11790 0.11428 0.11940
Average $ 0.10912 $ 0.10702 $ 0.10530 $ 0.10661
Source: City of Healdsburg - Utility Department
S - 44
CITY OF HEALDSBURGSCHEDULE OF ELECTRICITY SOLD AND REVENUE PER MEGAWATT HOURS
LAST TEN FISCAL YEARS

1997-98 1998-99 1999-00 2000-01 2001-02 2002-035,711 5,562 5,648 5,939 5,956 6,2295,867 6,421 5,649 6,085 5,359 6,1995,937 6,358 4,870 6,319 5,957 6,1685,642 5,444 5,595 5,903 5,661 5,9375,541 5,604 5,585 5,759 5,305 5,9325,331 5,522 5,175 5,756 5,545 5,1765,635 5,903 6,243 5,942 6,340 6,2035,318 5,305 5,192 5,710 5,476 5,4445,127 5,096 5,219 5,131 5,260 4,7804,880 5,438 5,480 5,166 5,159 6,1195,193 4,948 5,328 5,186 5,438 4,9345,417 5,303 5,636 6,053 5,985 5,726
65,599 66,904 65,620 68,949 67,441 68,847
1997-98 1998-99 1999-00 2000-01 2001-02 2002-03$ 656,462 $ 671,528 $ 692,743 $ 722,003 $ 780,420 $ 807,825
699,997 780,065 688,545 735,508 697,647 800,312699,392 749,469 585,033 773,672 786,546 804,981665,868 670,085 685,507 724,567 732,969 760,045650,609 668,750 670,965 694,730 689,792 778,722514,425 549,073 529,404 584,830 593,797 552,882572,904 608,149 642,128 599,428 690,829 673,403522,153 514,981 520,977 578,460 593,782 582,690509,542 510,713 527,653 518,509 566,423 503,378474,375 542,747 537,206 508,492 544,544 649,836510,582 486,301 518,346 504,507 563,299 516,598648,465 644,267 699,600 736,195 781,609 743,948
$ 7,124,774 $ 7,396,128 $ 7,298,107 $ 7,680,901 $ 8,021,657 $ 8,174,620
1997-98 1998-99 1999-00 2000-01 2001-02 2002-03$ 0.11495 $ 0.12074 $ 0.12270 $ 0.12156 $ 0.13103 $ 0.12969
0.11931 0.12147 0.12190 0.12087 0.13018 0.129100.11780 0.11788 0.12010 0.12243 0.13203 0.130510.11802 0.12309 0.12250 0.12274 0.12947 0.128020.11742 0.11933 0.12020 0.12063 0.13002 0.131280.09650 0.09943 0.10230 0.10160 0.10708 0.106820.10167 0.10302 0.10290 0.10087 0.10896 0.108510.09819 0.09707 0.10030 0.10130 0.10843 0.107030.09938 0.10022 0.10110 0.10105 0.10768 0.105310.09721 0.09981 0.09800 0.09843 0.10555 0.106200.09832 0.09828 0.09730 0.09728 0.10358 0.104700.11971 0.12149 0.12410 0.12162 0.13059 0.12993
$ 0.10861 $ 0.11055 $ 0.11122 $ 0.11140 $ 0.11894 $ 0.11874
S-45
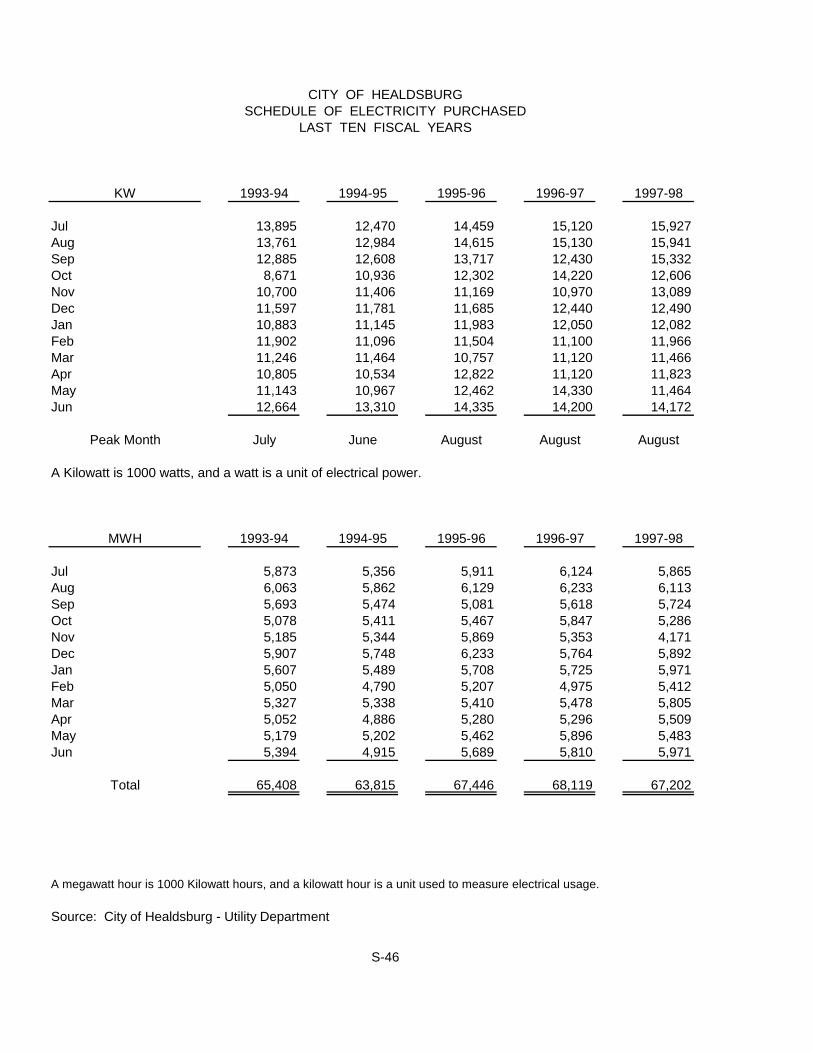
KW 1993-94 1994-95 1995-96 1996-97 1997-98
Jul 13,895 12,470 14,459 15,120 15,927Aug 13,761 12,984 14,615 15,130 15,941Sep 12,885 12,608 13,717 12,430 15,332Oct 8,671 10,936 12,302 14,220 12,606Nov 10,700 11,406 11,169 10,970 13,089Dec 11,597 11,781 11,685 12,440 12,490Jan 10,883 11,145 11,983 12,050 12,082Feb 11,902 11,096 11,504 11,100 11,966Mar 11,246 11,464 10,757 11,120 11,466Apr 10,805 10,534 12,822 11,120 11,823May 11,143 10,967 12,462 14,330 11,464Jun 12,664 13,310 14,335 14,200 14,172
Peak Month July June August August August
A Kilowatt is 1000 watts, and a watt is a unit of electrical power.
MWH 1993-94 1994-95 1995-96 1996-97 1997-98
Jul 5,873 5,356 5,911 6,124 5,865Aug 6,063 5,862 6,129 6,233 6,113Sep 5,693 5,474 5,081 5,618 5,724Oct 5,078 5,411 5,467 5,847 5,286Nov 5,185 5,344 5,869 5,353 4,171Dec 5,907 5,748 6,233 5,764 5,892Jan 5,607 5,489 5,708 5,725 5,971Feb 5,050 4,790 5,207 4,975 5,412Mar 5,327 5,338 5,410 5,478 5,805Apr 5,052 4,886 5,280 5,296 5,509May 5,179 5,202 5,462 5,896 5,483Jun 5,394 4,915 5,689 5,810 5,971
Total 65,408 63,815 67,446 68,119 67,202
A megawatt hour is 1000 Kilowatt hours, and a kilowatt hour is a unit used to measure electrical usage.
Source: City of Healdsburg - Utility Department
CITY OF HEALDSBURGSCHEDULE OF ELECTRICITY PURCHASED
LAST TEN FISCAL YEARS
S-46

1998-99 1999-00 2000-01 2001-02 2002-03
16,258 17,714 16,315 17,445 18,42817,417 15,742 16,545 16,262 17,55314,856 14,970 16,820 13,207 16,53911,768 13,657 12,778 15,572 14,71011,688 11,953 12,639 11,926 11,21912,307 12,739 12,700 11,630 11,79712,156 12,741 12,610 12,172 11,74611,901 11,836 12,214 11,729 11,59711,958 11,683 11,343 11,039 11,00911,590 11,699 11,890 11,926 10,92514,900 16,766 17,156 15,228 15,60514,700 16,971 15,800 17,741 18,173
August July May June July
1998-99 1999-00 2000-01 2001-02 2002-03
6,442 5,631 6,344 6,100 6,2296,679 7,174 6,814 6,822 6,1996,072 7,344 6,501 6,198 6,1685,990 5,486 6,249 6,215 5,9375,619 4,327 6,003 5,737 5,9326,169 6,278 6,322 6,297 5,1766,111 5,983 6,333 6,391 6,2035,441 5,394 5,576 5,468 5,4445,905 5,727 5,771 5,856 4,7805,450 5,535 5,471 5,765 6,1196,121 6,102 6,243 6,132 4,9346,032 6,073 6,139 6,505 5,726
72,031 71,054 73,766 73,486 68,847
S-47

Hydroelectric Geothermal Transmission Comb. Turbine TotalBond 1998 Rfdg 1998 Rfdg 1989 Ref. 1989 Ref. Debt BondYear Series A Series A Series A Series A Service Year
1 499,462 2,036,351 62,987 154,516 2,753,316 12 454,816 2,307,420 60,462 149,437 2,972,135 23 455,214 2,227,968 60,362 149,226 2,892,770 34 455,800 3,505,696 60,196 149,319 4,171,011 45 456,186 2,144,237 60,569 149,256 2,810,248 56 462,481 2,040,140 60,301 149,313 2,712,235 67 462,460 113,219 60,516 149,303 785,498 78 462,454 635,311 60,331 149,325 1,307,421 89 329,959 684,962 60,270 149,215 1,224,406 9
10 425,393 5,022 12,434 442,849 1011 425,498 425,498 1112 596,382 596,382 1213 596,431 596,431 1314 596,422 596,422 1415 596,414 596,414 1516 596,415 596,415 1617 596,453 596,453 1718 381,777 381,777 1819 381,868 381,868 1920 381,906 381,906 2021 383,031 383,031 2122 443,679 443,679 2223 658,779 658,779 2324 381,797 381,797 2425 381,756 381,756 2526 381,739 381,739 2627 381,714 381,714 2728 381,731 381,731 2829 381,792 381,792 2930 381,755 381,755 3031 381,746 381,746 31
TOTAL $ 14,153,310 $ 15,695,304 $ 551,016 $ 1,361,344 $ 31,760,974
FIGURES REPRESENT GROSS ANNUAL DEBT SERVICE.
Source: NCPA Financial Advisory Report
S - 48
CITY OF HEALDSBURGSCHEDULE OF PROPORTIONAL SHARE
NCPA DEBT SERVICE

S - 49
(This page left intentionally blank.)

1994 1995 1996 1997 1998 1999Total Assessed Valuation (Gross) $ 378,702 $ 391,898 $ 399,303 $ 405,026 $ 413,121 $ 436,239
Net Secured 338,107 352,601 361,192 366,872 378,356 396,553
Net Public Utility 1,655 1,845 1,345 1,381 - -
Net Unsecured 31,761 30,254 29,539 29,519 27,538 32,431
Exemptions (7,177) (7,194) (7,225) (7,254) (7,227) (7,255)
Total AssessedValuation (Net) 371,524 384,701 392,077 397,772 405,894 428,984
Gross Tax Increment 2,762,758 2,885,571 2,970,700 3,001,463 3,148,209 3,495,808
Source : Finance Department
S - 50
CITY OF HEALDSBURGHEALDSBURG COMMUNITY REDEVELOPMENT AGENCY
SOTOYOME REDEVELOPMENT PROJECT AREATAXABLE VALUE AND TAX INCREMENTS
FOR FISCAL YEARS ENDED JUNE 30, 1994 THROUGH 2003

2000 2001 2002 2003
$ 473,223 $ 514,651 $ 566,710 $ 685,633
420,831 454,487 504,194 616,609
- - - -
45,144 52,959 55,391 61,936
(7,248) (7,205) (7,125) (7,088)
465,975 507,446 559,585 678,545
3,849,868 4,322,409 4,725,371 5,509,106
S - 51

CITY OF HEALDSBURGHEALDSBURG COMMUNITY REDEVELOPMENT AGENCY
SOTOYOME REDEVELOPMENT PROJECT AREATAX INCREMENT / TAX REVENUES
FOR FISCAL YEARS ENDED JUNE 30, 1994 THROUGH 2003
Pass Thru Pass Thru Low/ Moderate Net IncrementFiscal Year Gross Increment to County ERAF Set - Aside to Agency
1994 $ 2,762,758 $ 549,695 $ 96,955 $ 553,266 $ 1,562,842
1995 2,885,571 584,490 96,978 577,114 1,626,989
1996 2,970,700 615,603 - 594,140 1,760,957
1997 3,001,463 626,285 - 600,293 1,774,886
1998 3,148,209 661,687 - 629,642 1,856,881
1999 3,495,808 736,221 - 699,162 2,060,425
2000 3,849,868 837,550 - 769,918 2,242,400
2001 4,322,409 958,585 - 864,538 2,499,286
2002 4,725,371 1,045,140 - 945,074 2,735,157
2003 5,509,106 1,185,671 144,620 1,101,911 3,076,904
Source: Finance Department
S - 52