city of hamilton solid waste management master plan … · 1.1 solid waste management master plan...
TRANSCRIPT

Appendix “A” PW12004a
Final Report
March 2012
City of Hamilton Solid Waste
Management Master Plan Review
2012 Solid Waste Management Master Plan
Appendix “A” PW12004a
This Project has been delivered with the assistance of Waste Diversion Ontario's Continuous
Improvement Fund, a fund financed by Ontario municipalities and stewards of blue box waste in Ontario.
Notwithstanding this support, the views expressed are the views of the author(s), and Waste Diversion
Ontario and Stewardship Ontario accept no responsibility for these views.

2012 Solid Waste Management Master Plan
i
TABLE OF CONTENTS
Table of Contents ........................................................................................................................................... i
Glossary of Acronyms ................................................................................................................................... v
Executive Summary ...................................................................................................................................... vi
1 Introduction .......................................................................................................................................... 1
1.1 Solid Waste Management Master Plan Review ............................................................................ 1
1.2 Looking back: The 2001 Solid Waste Management Master Plan ................................................. 1
2 Planning Process ................................................................................................................................... 2
2.1 Process Overview .......................................................................................................................... 2
2.1.1 Phase 1: Design of the Stakeholder Participation Process ................................................... 2
2.1.2 Phase 2: Develop Guiding Principles ..................................................................................... 2
2.1.3 Phase 3: Determine and Evaluate Needs .............................................................................. 3
2.1.4 Phase 4: Identifying and Evaluating Options ........................................................................ 3
2.1.5 Phase 5: Prepare the SWMMP Document ............................................................................ 3
2.2 Summary of Consultation Activities .............................................................................................. 4
2.2.1 Overview ............................................................................................................................... 4
2.2.2 Feedback on Guiding Principles, Goals and Objectives ........................................................ 6
2.2.3 Feedback on Waste Options ................................................................................................. 7
2.2.4 Feedback on SWMMP Directions.......................................................................................... 8
2.2.5 Feedback on Draft SWMMP .................................................................................................. 9
2.2.5.1 Guiding Principles.............................................................................................................. 9
2.2.5.2 Proposed Directions .......................................................................................................... 9
2.2.5.3 Recommended Approach ............................................................................................... 10
2.2.5.4 Disposal ........................................................................................................................... 10
2.2.5.5 General Comments ......................................................................................................... 10
3 Looking Forward: Waste Management in Hamilton 2010 .................................................................. 12
3.1 Overview of Available Waste Collection and Diversion Programs in Hamilton .......................... 12
3.1.1 Recycling Program ............................................................................................................... 12
3.1.2 Organic Waste (Food and Kitchen Waste) .......................................................................... 12
3.1.3 Leaf and Yard Waste ........................................................................................................... 13
3.1.4 Municipal Household Special Waste and Electronic Equipment ........................................ 13
2012 Solid Waste Management Master Plan
ii
3.1.5 Bulk Goods .......................................................................................................................... 13
3.1.6 White Goods (Appliances) and Scrap Metal ....................................................................... 14
3.1.7 Garbage ............................................................................................................................... 14
3.1.8 Industrial, Commercial and Institutional (ICI) Waste .......................................................... 14
3.1.9 Illegal Dumping ................................................................................................................... 15
3.2 Hamilton’s Waste Management Facilities .................................................................................. 15
3.2.1 Materials Recycling Facility ................................................................................................. 16
3.2.2 Central Composting Facility ................................................................................................ 17
3.2.3 Leaf and Yard Waste Composting Facility ........................................................................... 18
3.2.4 Transfer Stations/Community Recycling Centres and Tipping Fees ................................... 19
3.2.5 Glanbrook Landfill ............................................................................................................... 19
3.3 Results of Gap Analysis ............................................................................................................... 20
3.3.1 Waste System Performance ................................................................................................ 20
3.3.2 Waste Characterization ....................................................................................................... 21
3.3.3 Potential for additional Diversion ....................................................................................... 22
4 2012 Solid Waste Management Master Plan ..................................................................................... 24
4.1 Guiding Principles ....................................................................................................................... 24
4.2 Goals and Objectives ................................................................................................................... 26
4.2.1 The Society Pillar ................................................................................................................. 26
4.2.2 The Environment Pillar ........................................................................................................ 27
4.2.3 The Economy Pillar .............................................................................................................. 27
4.3 Overview of Strategic Directions ................................................................................................ 28
4.3.1 Education and Enforcement ............................................................................................... 28
4.3.2 Service Level Modifications................................................................................................. 29
4.3.3 Waste Minimization and Diversion Opportunities ............................................................. 29
4.3.4 Multi-Municipal Collaboration ............................................................................................ 30
4.3.5 Disposal ............................................................................................................................... 31
4.4 System Analysis Summary........................................................................................................... 31
4.4.1 Approach to Waste Diversion ............................................................................................. 32
4.4.1.1 Status Quo ....................................................................................................................... 32
4.4.1.2 Enhanced Approach ........................................................................................................ 34

2012 Solid Waste Management Master Plan
iii
4.4.1.3 Maximized Approach ...................................................................................................... 38
4.4.1.4 Preferred Approach to Waste Diversion ......................................................................... 41
4.4.2 Approach to Waste Disposal ............................................................................................... 41
4.4.2.1 Glanbrook Landfill Disposal Scenario .............................................................................. 42
4.4.2.2 Alternative Disposal Technology Scenario ...................................................................... 43
4.4.2.3 Identification of Preferred Disposal Scenario ................................................................. 45
4.5 Preferred Waste Management System ...................................................................................... 46
4.5.1 Life Cycle Observations ....................................................................................................... 47
4.5.1.1 Diversion ......................................................................................................................... 47
4.5.1.2 Disposal ........................................................................................................................... 48
5 Conclusion and Recommendations..................................................................................................... 48
2012 Solid Waste Management Master Plan
iv
List of Figures
Figure 1: Hamilton’s Solid Waste Management Facilities .......................................................................... 16
Figure 2: Projected MRF Processing Tonnage (2010 – 2036) ..................................................................... 17
Figure 3: Projected CCF Processing Tonnage (2010 – 2036) ....................................................................... 18
Figure 4: Projected L&YW Processing Tonnage (2010 – 2036) ................................................................... 18
Figure 5: Hamilton’s Waste Diversion Rate and Disposal Tonnage (2002 – 2010) ..................................... 21
Figure 6: Waste Disposed at Glanbrook Landfill ......................................................................................... 22
Figure 7: Enhanced Approach to Implementation of Directions ................................................................ 35
Figure 8: Maximized Approach to Implementation of Directions .............................................................. 38
Figure 9: Timeline for Facility Review and Development ........................................................................... 50
List of Tables
Table 1: Consultation Activities .................................................................................................................... 5
Table 2: Diversion of Waste Stream Categories ......................................................................................... 20
Table 3: Waste Characterization (2010) ..................................................................................................... 22
Table 4: Potential Additional Diversion of Waste Categories ..................................................................... 23
Table 5: Guiding Principles for Hamilton’s 2012 Solid Waste Management Master Plan .......................... 25
Table 6: Summary of Approaches to SWMMP Directions .......................................................................... 32
Table 7: Materials in Multi-Residential Sector with Highest Potential to Increase Diversion Rate ............ 33
Table 8: Materials in Single-Family Residential Sector with Highest Potential to Increase Diversion Rate 34
Table 9: Potential Diversion Rates from Enhanced Approach Options (Mature System) .......................... 38
Table 10: Diversion Rates from Maximized Approach Options (Mature System) ...................................... 41
Table 11: Preferred Waste Management System ....................................................................................... 46
Table 12: Waste Management System Costs for the 25-Year Planning Period (2012 – 2036) ................... 47

2012 Solid Waste Management Master Plan
v
GLOSSARY OF ACRONYMS
ADT Alternative Disposal Technology
AMO Association of Municipalities of Ontario
CCF Central Composting Facility
CFC Chlorofluorocarbon
CofA Certificate of Approval
CRC Community Recycling Centre
EFW Energy from Waste
EPR Extended Producer Responsibility
FCM Federation of Canadian Municipalities
GHG Greenhouse gas
HDPE High-density polyethylene (a type of plastic)
HUC Hamilton Utilities Corporation
ICI Industrial, Commercial and Institutional
L&YW Leaf and Yard Waste
LCA Life Cycle Assessment
LCBO Liquor Control Board of Ontario
LYWF Leaf and Yard Waste Facility
MRF Materials Recycling Facility
PET Polyethylene terephthalate (a type of plastic)
SSO Source separated organics
SWMMP Solid Waste Management Master Plan
TPD Tonnes per Day
TPY Tonnes per Year
TS/CRC Transfer Station/Community Recycling Centre
WEEE Waste Electrical and Electronic Equipment
WWTP Waste water treatment plant
2012 Solid Waste Management Master Plan
vi
EXECUTIVE SUMMARY
The City of Hamilton’s review of the 2001 Solid Waste Management Master Plan (SWMMP) included
consultation with stakeholders and the public on the guiding principles, goals and objectives and
program options that will guide the City in managing its waste for the next 25 years.
The 2012 SWMMP Guiding Principles build upon those from the 2001 SWMMP and have been updated
to include the community’s philosophy and the provincial waste management value chain of reduce,
reuse, diversion and disposal.
The guiding principles are:
The City of Hamilton must lead and encourage the changes necessary to adopt the principle of Waste
Minimization.
The Glanbrook Landfill is a valuable resource. The City of Hamilton must minimize residual waste and
optimize the use of the City’s diversion and disposal facilities.
The City of Hamilton must maintain responsibility for the residual wastes generated within its
boundaries. Inter-regional facilities will be considered.
The review showed that the City of Hamilton has a robust residential solid waste management system
that at status quo should achieve a 55% waste diversion rate by 2021 as existing programs mature.
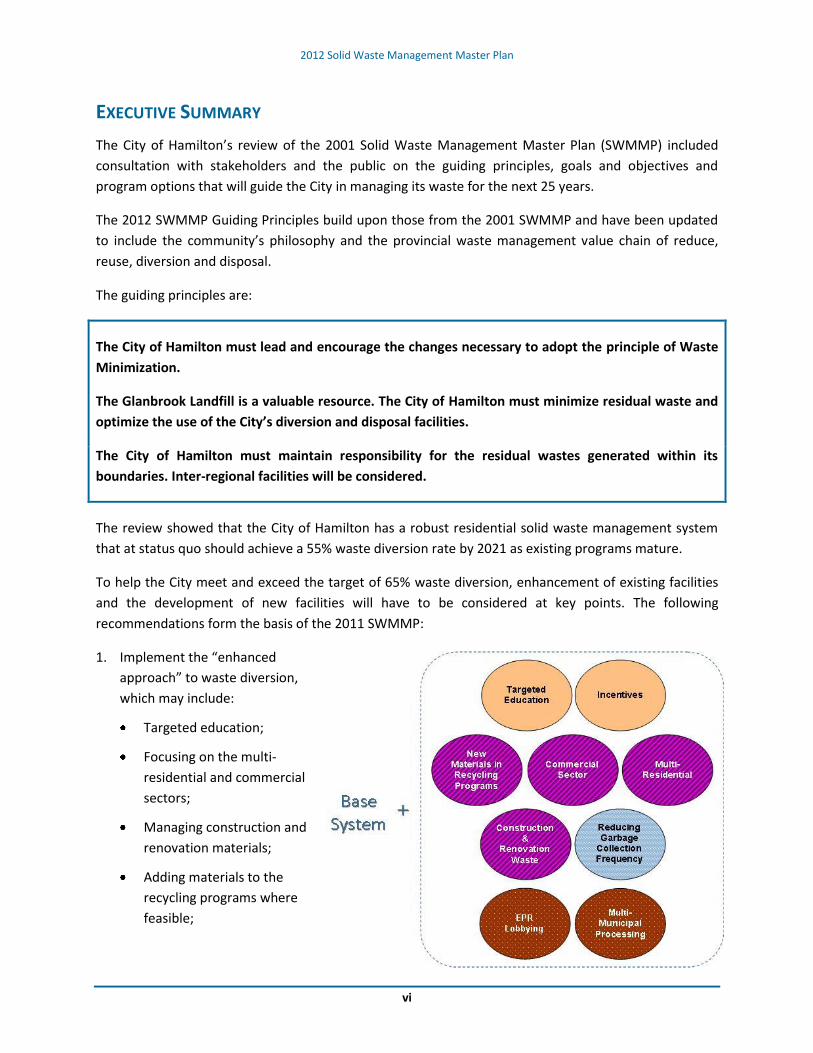
To help the City meet and exceed the target of 65% waste diversion, enhancement of existing facilities
and the development of new facilities will have to be considered at key points. The following
recommendations form the basis of the 2011 SWMMP:
1. Implement the “enhanced
approach” to waste diversion,
which may include:
Targeted education;
Focusing on the multi-
residential and commercial
sectors;
Managing construction and
renovation materials;
Adding materials to the
recycling programs where
feasible;

2012 Solid Waste Management Master Plan
vii
Continued lobbying for Extended Producer Responsibility;
Municipal processing partnerships; and
Reduced garbage collection frequency in 2020.
2. Undertake a feasibility study in 2013 of expanding capacity at the Central Composting Facility (CCF).
3. Undertake a feasibility study in 2017 of Single Stream processing and expansion of capacity at the
Materials Recycling Facility (MRF).
4. Undertake an operational review and needs analysis in 2017 of Transfer Stations and Community
Recycling Centres.
5. Undertake a Five Year Review of the SWMMP in 2017.
6. Use the Glanbrook Landfill for disposal for 5 years, and consider alternative disposal capacity in the
next SWMMP review in 5 years.
7. Merge the advisory roles of the SWMMP Steering Committee and the Waste Reduction Task Force.
8. In the implementation of these recommendations, consideration will be given to the potential
impacts on illegal dumping.
This report documents the process followed and rationale for the 2012 SWWMP.
Thanks are extended to all those who contributed ideas and information.

2012 Solid Waste Management Master Plan
1
1 INTRODUCTION
1.1 SOLID WASTE MANAGEMENT MASTER PLAN REVIEW
The 2001 Solid Waste Management Master Plan (SWMMP) and its recommendations provided the
blueprint for the City’s current residential solid waste management program, including blue box
recycling, source separated (green cart) organics, yard waste, household hazardous waste, garbage,
public education, and other waste management programs.
Initiated in 2010, the City of Hamilton has now completed a review of its 2001 SWMMP. The review
assessed the status of the City’s current (2010) waste management system and, with input from the
public, identified a path forward in managing the City’s residential solid waste to 2036.
This report documents the review process and the outcomes. Section 2 outlines the planning and
consultation process followed, while Section 3 provides a snapshot of Hamilton’s current waste
management system. Section 4 documents the 2012 SWMMP guiding Principles, goals and objectives,
and the recommended directions for managing Hamilton’s residential solid waste into the future.
Section 5 presents the conclusions and recommendations from the review.
1.2 LOOKING BACK: THE 2001 SOLID WASTE MANAGEMENT MASTER PLAN
The 2001 SWMMP included 19 recommendations, including two Guiding Principles, seven system
recommendations, and 10 recommendations concerning sustainable development.
Many of the 2001 recommendations have been implemented and have contributed to Hamilton’s waste
diversion successes, including:
The preservation of landfill capacity through improvements to landfill operations and increased
diversion, which has increased the life expectancy of the Glanbrook Landfill from 15 years
remaining in 2001 to 34 years from 2010, or a predicted 2044 closure.
The City’s residential waste diversion rate has more than doubled from 17% in 2001 to 49% in
2010.
The establishment of the Central Composting Facility (CCF), upgrades to the Materials Recycling
Facility (MRF) and the creation of three Community Recycling Centres (CRCs) (one with a reuse
centre).
3-stream collection system, supported by a comprehensive public education program that
includes annual waste collection calendars, brochures, advertising, a booklet on the City’s waste
management programs, and the Gold Box recognition program.
Lobbying provincial and federal levels of government in partnership with a variety of industry
organizations and municipal organizations such as the Association of Municipalities of Ontario,
the Regional Public Works Commissioners of Ontario, the Municipal Waste Association, the

2012 Solid Waste Management Master Plan
2
Ontario Waste Management Association and the Federation of Canadian Municipalities on such
matters as the Waste Diversion Act and Extended Producer Responsibility (EPR).
Recommendations that are outstanding from the 2001 SWMMP include:
Long term landfill capacity – while Hamilton has a significant amount of landfill capacity
available at the Glanbrook Landfill, it faces future pressures such as tighter export regulations,
diminishing landfill capacity in Ontario as a whole, difficulty with siting new disposal facilities
and the higher cost of alternative disposal methods.
65% diversion target – Hamilton’s waste diversion programs have generated positive results, but
the City has not yet achieved the 65% waste diversion target, originally set for 2008 and then
extended to 2011.
State-of-the-art Materials Recycling Facility – while the City’s MRF is not fully state of the art,
the equipment is generally functioning well.
Energy from Waste (EFW) - EFW has been investigated in the Hamilton-Niagara WastePlan
process (2005 – 2009) and recently in the Hamilton Utilities Corporation (HUC) Integration Study
(2010); however, it has also been included in this SWMMP review for consideration.
User Pay - User pay systems have been considered as a means of increasing waste diversion but
have not been implemented.
2 PLANNING PROCESS
2.1 PROCESS OVERVIEW
The review process included the following five key phases. Throughout the process, public consultation
was a key component (see Section 2.2).
2.1.1 PHASE 1: DESIGN OF THE STAKEHOLDER PARTICIPATION PROCESS
The first phase of this project involved the development of the review’s public consultation plan. This
plan was presented to the public, proposing ways in which the public and other stakeholders would be
engaged throughout the process and seeking input on how they wished to be consulted.
2.1.2 PHASE 2: DEVELOP GUIDING PRINCIPLES
During this phase, the project team consulted with the public and other stakeholders to update the
guiding principles, goals and objectives from the 2001 SWMMP, with the intent of reflecting the needs,
concerns and vision of the community as a whole for the next planning period.
On January 24, 2011, a public workshop was held on this topic. Those unable to attend were encouraged
to view the workshop materials on the project website and submit comments by e-mail or mail. An
overview of the feedback received can be found in Section 2.2. The updated guiding principles, goals
and objectives are presented in Sections 4.1 and 4.2. The study report Guiding Principles, Goals and

2012 Solid Waste Management Master Plan
3
Objectives: Guiding Principles, Goals and Objectives for the 2012 City of Hamilton Solid Waste
Management Master Plan documents the feedback received during this phase.
2.1.3 PHASE 3: DETERMINE AND EVALUATE NEEDS
In Phase 3 of the review, the project team assessed the gap between the City’s current waste
management activities and the goals and objectives identified in Phase 2. This assessment included the
review of the City’s current facilities, services and programs provided by both the City, its contractors or
organizations that help the City manage residential waste. Research was conducted to identify the City’s
future waste management needs. Future needs were then compared against existing and planned
services, programs and facilities to determine service or processing gaps. An overview of Hamilton’s
waste characteristics is provided in Section 3.3 and discussed in full in the study report Gap Analysis.
2.1.4 PHASE 4: IDENTIFYING AND EVALUATING OPTIONS
After assessing the City’s waste management needs in Phase 3, a range of options was explored and
evaluated for moving the City forward and achieving its waste management goals and objectives.
This phase was divided into two parts. In part A, the project team researched and identified a broad
suite of options, approaches and technologies to manage solid waste in the future. Environmental, social
and economic benefits and issues of each option were also identified. The long list of options is
discussed in the study report Brief on Waste Diversion and Disposal Options.
A workshop was held on April 28, 2011 to present the results of the needs assessment and to discuss
potential waste management options for the City of Hamilton. Feedback was also requested of
stakeholders and visitors to the project website. Input received from the public is presented in Section
2.2. The results of the April 28th workshop are provided in the study report Public Workshop #2: Gap
Analysis, Needs Assessment and Preliminary Discussion on Options.
Part B of this phase included a more detailed evaluation of the short-listed options using a Triple Bottom
Line approach, which considered the environmental, economic and social effects of the various options.
The options were grouped into various diversion and disposal systems, and the systems were evaluated
to identify a preferred long-term waste management system for the City. The systems are identified and
presented in the study report Evaluation of Waste Systems.
2.1.5 PHASE 5: PREPARE THE SWMMP DOCUMENT
Once the preferred directions for waste management were confirmed in Phase 4, a draft SWMMP
report was prepared to document the preferred initiatives and associated capital and operating
expenditures required over the planning period. The draft SWMMP was made available for public review
and comment from January 17, 2012 and into March 2012.
Study reports prepared during the course of this process that contributed to the SWMMP include:
Guiding Principles, Goals and Objectives: Guiding Principles, Goals and Objectives for the 2012
City of Hamilton Solid Waste Management Master Plan;
2012 Solid Waste Management Master Plan
4
Public Workshop #2: Gap Analysis, Needs Assessment and Preliminary Discussion on Options;
Gap Analysis;
Brief on Waste Diversion and Disposal Options;
Evaluation of Waste Systems; and
Online Feedback: Operational Suggestions and Web Survey Results.
2.2 SUMMARY OF CONSULTATION ACTIVITIES
2.2.1 OVERVIEW
Throughout the process, opportunities were provided to encourage the public to provide input and to
comment on draft SWMMP materials. At key points, additional activities were carried out to encourage
participation. Consultation activities included:
Conducting an early stakeholder scan with key stakeholders to identify issues, opportunities and
the most effective methods for engaging the public.
Development of a project website (www.hamiltonwastereview.ca) to inform stakeholders about
the project, disseminate information, and provide a means for the public to provide electronic
feedback. The website included an overview of the process, a document library, advertised
workshop dates, an online survey on guiding principles, and contact information.
Meetings with neighbourhood associations in Phase 2 to introduce the groups to the process
and to encourage their involvement and the involvement of their members.
Establishment of a stakeholder contact list to distribute notices and updates about workshops,
posting of materials for public review and comment, and opportunities for consultation.
Public and stakeholder workshop in Phase 2 to identify draft guiding principles, goals and
objectives for the 2012 SWMMP. Results of the workshop and draft guiding principles, goals
and objectives were posted on project website for public review and comment.
Public and stakeholder workshop in Phase 4 to review results of gap analysis and to discuss
potential options for the 2012 SWMMP. The results of workshop were posted on website for
review and comment.
Workshop with Hamilton staff to review potential options for the 2012 SWMMP.
Presentations and discussions with Waste Reduction Task Force on proposed SWMMP
directions.
Staffing a display at the Hamilton Fall Garden & Chrysanthemum Show and discussing the
proposed SWMMP directions with show visitors.
Meetings with neighbourhood associations and community groups in Phases 4 and 5 to review
and obtain feedback on the proposed SWMMP directions and the draft SWMMP.
Placing the draft SWMMP on the project website for review.
Conducting an online survey to obtain feedback on the draft SWMMP.
Setting up a display poster about the draft SWMMP at the February 2012 Upwind Downwind
Conference.
2012 Solid Waste Management Master Plan
5
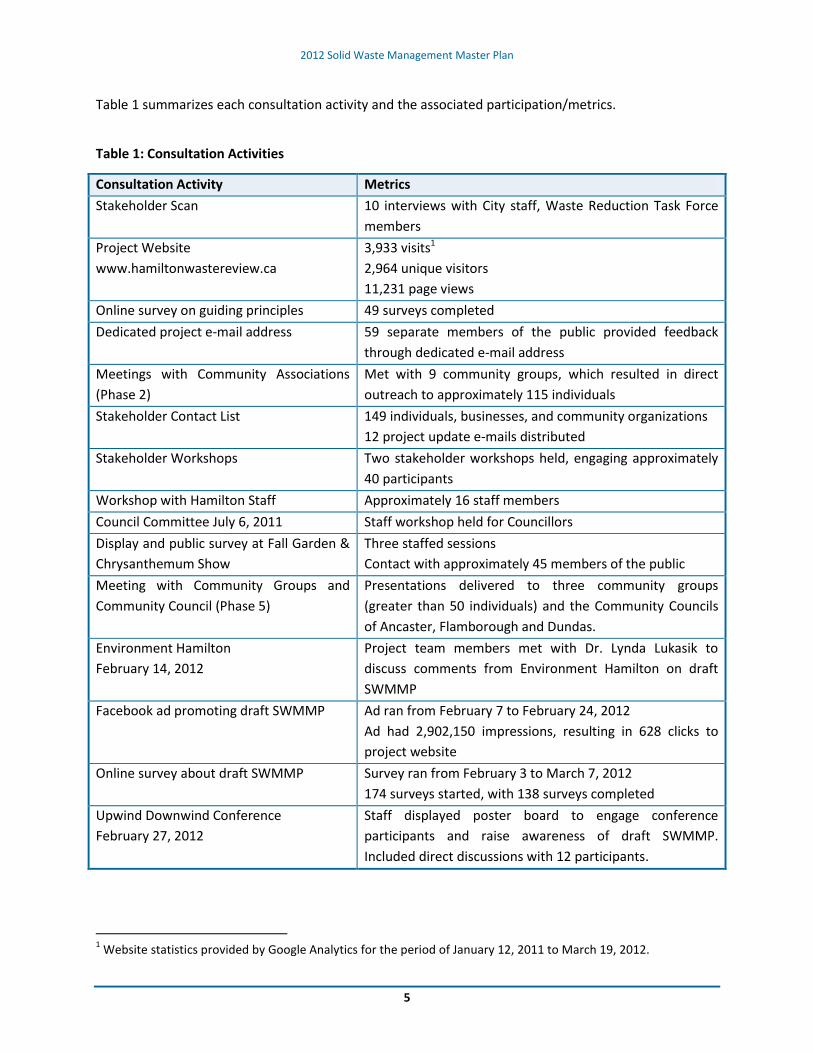
Table 1 summarizes each consultation activity and the associated participation/metrics.
Table 1: Consultation Activities
Consultation Activity Metrics
Stakeholder Scan 10 interviews with City staff, Waste Reduction Task Force
members
Project Website
www.hamiltonwastereview.ca
3,933 visits1
2,964 unique visitors
11,231 page views
Online survey on guiding principles 49 surveys completed
Dedicated project e-mail address 59 separate members of the public provided feedback
through dedicated e-mail address
Meetings with Community Associations
(Phase 2)
Met with 9 community groups, which resulted in direct
outreach to approximately 115 individuals
Stakeholder Contact List 149 individuals, businesses, and community organizations
12 project update e-mails distributed
Stakeholder Workshops Two stakeholder workshops held, engaging approximately
40 participants
Workshop with Hamilton Staff Approximately 16 staff members
Council Committee July 6, 2011 Staff workshop held for Councillors
Display and public survey at Fall Garden &
Chrysanthemum Show
Three staffed sessions
Contact with approximately 45 members of the public
Meeting with Community Groups and
Community Council (Phase 5)
Presentations delivered to three community groups
(greater than 50 individuals) and the Community Councils
of Ancaster, Flamborough and Dundas.
Environment Hamilton
February 14, 2012
Project team members met with Dr. Lynda Lukasik to
discuss comments from Environment Hamilton on draft
SWMMP
Facebook ad promoting draft SWMMP Ad ran from February 7 to February 24, 2012
Ad had 2,902,150 impressions, resulting in 628 clicks to
project website
Online survey about draft SWMMP Survey ran from February 3 to March 7, 2012
174 surveys started, with 138 surveys completed
Upwind Downwind Conference
February 27, 2012
Staff displayed poster board to engage conference
participants and raise awareness of draft SWMMP.
Included direct discussions with 12 participants.
1 Website statistics provided by Google Analytics for the period of January 12, 2011 to March 19, 2012.

2012 Solid Waste Management Master Plan
6
2.2.2 FEEDBACK ON GUIDING PRINCIPLES, GOALS AND OBJECTIVES
In Phase 2, residents were asked if the guiding principles from the 2001 SWMMP still applied and/or if
they should be changed. Guiding principles had been defined as the values and philosophy that would
guide the development and operation of the City’s waste management program. Feedback from the
public suggested that the guiding principles should remain, although some felt that Guiding Principle #1
should be updated. Suggested changes or considerations for Guiding Principle #1 included:
The term “residual waste” should include that from all sectors within Hamilton and not just
residential waste;
The term “responsibility” is ambiguous and should be clarified in terms of ownership of the
waste and maintaining it within the City’s boundaries;
The term “diversion” should be removed from the phrase “inter-regional diversion facilities will
be considered” to avoid restricting Hamilton from future opportunities.
At the workshop and through other comments received, there was general agreement with Guiding
Principle #2 and that the Glanbrook landfill remains a valuable resource. There were divergent opinions
regarding the consideration of Energy-from-Waste (EFW). Some felt it should be considered, while
others spoke against it. It was suggested that there should be more emphasis on waste diversion and
that falling short of the existing 65% waste diversion target is not a sufficient reason to adopt EFW.
Alternatively, it was noted that Guiding Principle #2 should incorporate other components, including
EFW that would maximize the usable life of the Glanbrook landfill.
Feedback was sought on the waste diversion target of 65%. The general response was that the 65%
waste diversion target should stay, although some thought that the target should be higher.
Feedback was also sought and received on other guiding principles that should be considered for the
updated SWMMP. Suggestions were grouped according to the three pillars of sustainability: Society, the
Environment and the Economy. These included:
Society
Hamilton’s waste management solutions will not cause any human harm.
The City of Hamilton will demonstrate waste management leadership and innovation by
example to its residents and other jurisdictions.
Information about Hamilton’s solid waste management programs must be clear and accessible
to all residents.
A successful responsible municipal solid waste management system requires participation of the
entire community.
Waste management systems should not be viewed as a cause of illegal dumping.
Hamilton has a diverse community with different communication and program accessibility
needs.

2012 Solid Waste Management Master Plan
7
The Environment
Hamilton’s approach to waste management should follow the waste management hierarchy:
first reduce, then reuse and recycle (including compost) and then disposal.
The SWMMP is one part of a greater environmental vision for Hamilton.
The net environmental impacts should consider waste diversion and processing, landfill impacts
and collection efficiencies.
The Economy
Costs for solid waste management remain affordable for the planning period.
Responsible solid waste management provides economic opportunities for Hamiltonians.
Revenue generation is an integral part of the waste management system.
The public also provided a broad suite of suggestions on what should be included in the goals and
objectives of the SWMMP. The goals and objectives were also organized according to the three pillars of
sustainability: society, environment, and economy.
Many of the social goals and objectives related to equity of access to programs and effective
communications.
Feedback about the environmental goals and objectives concerned waste generated and
disposed and the environmental footprint of managing that waste.
Suggestions regarding goals and objectives under the economic pillar were concerned with
product stewardship, system efficiencies and economic opportunities.
In addition to feedback on the guiding principles, goals and objectives, participants provided additional
suggestions for operational improvements.
The guiding principles, goals and objectives for the 2012 SWMMP are discussed in Sections 4.1 and 4.2.
The study report Guiding Principles, Goals and Objectives: Guiding Principles, Goals and Objectives for
the 2012 City of Hamilton Solid Waste Management Master Plan documents the feedback received from
the public on this topic.
2.2.3 FEEDBACK ON WASTE OPTIONS
During Phase 4, the public was asked to provide input into the types of options Hamilton should include
in its waste management system. Specifically, residents were asked at a workshop and through the
website:
How can Hamilton and its residents minimize (i.e. reduce and reuse) the amount of waste
created?
How can the City divert more of the materials currently accepted in its programs?
How can the City divert materials currently not accepted in its programs?
What does the City do with the material that is left?

2012 Solid Waste Management Master Plan
8
The feedback received from the public on waste minimization and diversion was organized into three
key categories:
Increasing Waste Minimization - Feedback on how the City could encourage waste minimization
among the residents of Hamilton included:
o Education – increased and targeted promotion of waste reduction and reuse opportunities;
o Programs and Policies – additional reuse centres and the adoption of policies that drive
waste reduction, reuse and diversion ; and
o Producer Responsibility – influencing the practices of manufacturers.
Increasing Diversion in Existing Programs - Feedback on how the City could increase diversion
of materials using the City’s existing programs included:
o Education and Enforcement – Increased efforts to ensure residents understand how to
participate properly in diversion programs;
o Technical/Physical Improvements – using equipment to make source separation easier or to
process waste after it has been collected; and
o City Programs and Policies – enhancements to existing programs, material bans, and
adjustments to planning/building controls.
Increasing Diversion of Non-Program Materials - Feedback on how to increase the diversion of
those materials for which no diversion program is currently available included:
o Promotion and Education – increased promotion of alternatives; and
o New Municipal Programs - such as diaper recycling or the recycling and reuse of
construction and renovation waste.
There was no consensus on what should be done with the waste remaining after diversion for disposal,
but suggested options included continuing to landfill, Energy-from-Waste and using private landfills.
Feedback received from the public during the Phase 4 workshop is provided in the study report Public
Workshop #2: Gap Analysis, Needs Assessment and Preliminary Discussion on Options.
2.2.4 FEEDBACK ON SWMMP DIRECTIONS
A consultation document describing the proposed SWMMP directions was prepared to inform the public
on the proposed directions and to encourage public feedback. The consultation document was
distributed to stakeholder groups and resident associations and made available on the project website.
Presentations were also given at meetings for three neighbourhood associations. The feedback received
on the proposed directions indicated that they are a positive step forward to manage solid waste in
Hamilton. A common point of positive feedback was that waste minimization has been included in the
guiding principles and directions. There were concerns expressed about how the options would be
implemented, whether the potential for illegal dumping would increase if garbage collection was
reduced to every other week, and how enforcement of the waste management bylaw would be
conducted.

2012 Solid Waste Management Master Plan
9
2.2.5 FEEDBACK ON DRAFT SWMMP
PW Information Report PW12004, containing the 2012 SWMMP Draft Report, was posted on the project
website for public review. A facebook advertisement and notices distributed to stakeholders (including
community groups and residential associations) encouraged the public and other stakeholders to review
the draft and provide comment. In addition to receiving comments through e-mail or mail, an online
survey was also posted to collect feedback from residents. The survey sought confirmation on the
guiding principles and the proposed waste diversion directions, the preferred “enhanced” approach to
waste management as recommended in the draft SWMMP, and the recommended approach to
disposal.
2.2.5.1 Guiding Principles
The majority of survey respondents agreed with the following statements regarding the guiding
principles:
a) These guiding principles will help guide the future management of Hamilton’s residential solid
waste in a way that is environmentally, socially and economically sustainable (79% agree, 10%
disagree).
b) The guiding principles will help Hamilton reach its waste diversion target (58% agree, 19%
disagree).
c) The guiding principles will help to maximize the disposal capacity of the Glanbrook landfill site
(69% agree, 15% disagree).
d) The guiding principles are consistent with my own principles on how residential solid waste
should be managed (72% agree, 17% disagree).
e) The guiding principles provide flexibility for Hamilton’s residential solid waste management
system to adapt potential regulatory changes (59% agree, 16% disagree).
It is important to note that, while respondents said they agreed with statements “b” and “e” less than
the other statements, those statements also received higher responses for “don’t know/no opinion”
than the others (23% replied “don’t know/no opinion” for statement “b”, while 25% responded same for
statement “e”).
Overall, the majority of respondents generally agreed with the statements on the guiding principles, as
71% of respondents agreed with three or more of the statements, while 13% disagreed.
2.2.5.2 Proposed Directions
The majority of survey respondents agreed with the following statements about the proposed waste
diversion directions:
a) The directions move Hamilton in the right direction in regards to waste management (72%
agree, 15% disagree).
b) The directions will help the residents of Hamilton recycle and compost more and send less
waste for disposal (69% agree, 21% disagree).

2012 Solid Waste Management Master Plan
10
c) The directions will help Hamilton reach its waste diversion target of 65% (52% agree, 22%
disagree).
d) The directions will help Hamilton deliver its waste management programs in a way that is
equitable for its residents (64% agree, 18% disagree).
e) The directions will help to foster more environmentally sustainable lifestyles in Hamilton (65%
agree, 22% disagree).
While statement “c” had the lowest number of respondents who agreed with that statement, it also had
the highest number of responses for “don’t know/no opinion” (26%).
Overall, the majority of respondents generally agreed with the statements on the proposed directions,
as 63% of respondents agreed with three or more of the statements, while 19% disagreed.
2.2.5.3 Recommended Approach
While the majority (77%) of respondents indicated that they wish to see the City of Hamilton expand its
efforts on waste diversion, almost half (47%) of the respondents said that they would prefer the City
adopt the maximized approach, while 30% said they agreed with the recommended enhanced
approach. About 15% said the City should continue with the Status Quo.
2.2.5.4 Disposal
The majority of respondents agreed with the draft SWMMP proposed approach on waste disposal:
76% agreed that Hamilton should continue to use the Glanbrook landfill for the disposal of the
City’s garbage, while 13% disagreed.
85% agreed that the City should re-examine alternative disposal capacity/methods in the next
SWMMP review in 2016, while 8% disagreed.
2.2.5.5 General Comments
The survey also invited respondents to provide an open-ended comment. A total of 68 comments were
submitted. The comments consisted of the following types:
Support for additional enforcement (15%)2;
Support for use of alternative disposal technologies (15%);
Support for additional promotion and education (12%);
Against the use of alternative disposal technologies (9%);
Support for increased diversion among the business sector (9%);
General comments on the survey itself (7%);
General support for the SWMMP and changes to the waste management system (6%);
Support for increased waste diversion in the multi-residential sector (4%);
Support of introduction of bag tags (4%);
Support for bi-weekly garbage collection (4%);
2 Percentages are of the 68 comments received, not of all respondents who participated in the survey.
2012 Solid Waste Management Master Plan
11
Support for the maximized approach (4%); and
Concern that the Glanbrook landfill would be accepting garbage from other municipalities (3%).
In addition to comments on the SWMMP, 13% of the comments were addressing Council’s discussions
on the solid waste management collections contract that was voted on in February 2012.
Although operational issues were not a part of this review, a number of comments were received on
operational issues and these have been documented in the study summary document Online Feedback:
Operational Suggestions and Web Survey Results.
2012 Solid Waste Management Master Plan
12
3 LOOKING FORWARD: WASTE MANAGEMENT IN HAMILTON 2010
3.1 OVERVIEW OF AVAILABLE WASTE COLLECTION AND DIVERSION PROGRAMS IN HAMILTON
In 2010, the City of Hamilton’s population was 504,559. The City provides waste collection and diversion
programs to 207,349 households, of which 159,392 are single family homes and 47,957 are multi-
residential units. The City provides garbage, blue box, organics, leaf and yard waste, and bulk goods
curbside collection services for its residents. The City also has three Community Recycling Centres (CRCs)
where residents can drop off household hazardous materials, recyclables, leaf and yard waste, scrap
metal, electronics, tires, wood and appliances. Residents are also encouraged to use backyard
composting, grass cycling, and public space recycling receptacles for further diversion. Curbside
collection is provided once weekly for garbage, blue box materials and organics, with leaf and yard
waste collection in the spring and fall.
3.1.1 RECYCLING PROGRAM
The curbside Blue Box and multi-residential cart collection for recycling is contracted to Green for Life
Environmental Corporation East, while BFI is contracted to collect recyclable material at the City’s three
CRCs. Hamilton has a two-stream recycling system, whereby recyclables are source-separated into a
fibres stream and a containers stream. These items are collected weekly for single family units and on
designated days for multi-residential units. Curbside collection participants are allowed to use blue
boxes, comparably-sized containers and/or clear bags to set out their recyclables. There is no limit on
the quantity of recycling material that can be set out for collection, although there is a maximum weight
of 13.6 kgs per container. Residents in multi-residential buildings collect their recyclables in reusable
blue bags and take them to their designated recycling areas, where they then empty their recyclables
into large bins typically provided by the building manager. The multi-residential recycling program is also
two-stream and residents must separate their recyclables into fibres and container streams.
Hamilton’s current recycling program accepts the following materials:
Fibre: newspaper (dailies, weeklies, other), mixed fine paper, telephone books and directories,
magazines and catalogues, books, corrugated cardboard, boxboard, molded pulp.
Containers: composite cans, gable top cartons, aseptic containers, PET, HDPE, polystyrene
packaging, wide mouth tubs and lids, PE plastic bags and film, aluminum (food and beverage
cans, foil, trays), steel (food and beverage cans, aerosol cans, paint cans) and glass (LCBO clear,
LCBO coloured, clear and coloured).
3.1.2 ORGANIC WASTE (FOOD AND KITCHEN WASTE)
The City of Hamilton launched its full organics (i.e., food and kitchen waste) collection program in 2006,
first for single-family residential units and in more recent years for multi-residential complexes (by 2010,
98% of multi-residential buildings in Hamilton had access to the organics diversion program). Organics
(food/kitchen waste and some yard waste) is contracted for weekly collection by Green for Life
2012 Solid Waste Management Master Plan
13
Environmental Corporation East in the City’s “B-Zones” for collection, while City crews collect from the
“A-Zones”.
Green carts have been provided to all residents and residents can set out one green cart and up to two
containers of leaf and yard waste. Residents are not allowed to use plastic bags to hold organic material
and are encouraged to use compostable bags and/or paper as a liner. The collected materials are
processed at the City’s Central Composting Facility (CCF), where an aerobic process is used to convert
the materials into compost.
3.1.3 LEAF AND YARD WASTE
Leaf and yard waste collection is contracted for seasonal bi-weekly collection by Green for Life
Environmental Corporation East in the City’s “B-Zones” for collection, while City crews collect from the
“A-Zones”.
Leaf and yard waste consists of branches, twigs, brush, house and garden plants, leaves and Christmas
trees. The City provides a separate seasonal bi-weekly collection during the spring and fall of unlimited
leaf and yard waste. Leaf and yard waste will only be collected in certain containers, such as paper bags
(available at local retail stores at a cost to the resident) and well labelled, rigid reusable containers.
Plastic bags, cardboard boxes and blue boxes are not acceptable containers. Residents are also
encouraged to use backyard composters to divert organic waste (including both food and kitchen waste
and leaf and yard waste). Residents can drop off L&YW at the three CRCs free of charge. Flamborough
residents can also drop off L&YW at the Carlisle Depot during certain days of the year.
Leaf and yard waste collected in the program is processed at an open windrow composting facility
located at the Glanbrook Landfill site.
The City holds compost sales and giveaways to raise funds for charity and to provide residents with an
opportunity to retrieve compost from their efforts of diverting L&YW.
3.1.4 MUNICIPAL HOUSEHOLD SPECIAL WASTE AND ELECTRONIC EQUIPMENT
Hazardous materials and electronic equipment are only accepted by the City at CRCs. This service is
provided free of charge for residents of Hamilton. There is a limit of 40 kgs for hazardous waste, 40
litres for liquid hazardous waste, eight fluorescent tubes and one thermostat per visit. Needles and
syringes must be placed in plastic or metal containers with a lid. This service is not available to
commercial, industrial and institutional properties.
3.1.5 BULK GOODS
The collection of bulk goods is contracted for seasonal bi-weekly collection by Green for Life
Environmental Corporation East in the City’s “B-Zones” for collection, while City crews collect from the
“A-Zones”.
Collection takes place weekly and seasonally in the summer and winter when leaf and yard waste is not
collected.

2012 Solid Waste Management Master Plan
14
Items such as mattresses and box springs, couches, long pieces of carpet and other similar materials are
too large for and not compatible with standard garbage trucks. For these items, residents are
encouraged to try and reuse the items, donate them or recycle them. If this is not possible and the
items need to be disposed, the City provides a bulk goods collection service during certain months of the
year. Residents must call at least one week in advance to schedule a pickup. There is a limit of four
items per pickup and the weight of each item must be less than 90 kgs. All bulk goods are sent to
landfill.
3.1.6 WHITE GOODS (APPLIANCES) AND SCRAP METAL
Scrap metal and appliances are not picked up at the curb by the City of Hamilton. Because some
appliances contain chlorofluorocarbons (CFCs), which are harmful to the environment, they must be
collected and disposed of separately. Residents are encouraged to make arrangements with local
charitable organizations if the appliance is serviceable or try and sell the item before considering
disposal. A number of businesses offer pickup of such items for a small fee. Alternatively, residents can
drop these items off at any of the three CRCs free of charge. Residents with scrap metal follow the same
procedure.
3.1.7 GARBAGE
The City provides weekly curbside garbage collection for single family units and garbage bin collection
for multi-residential complexes. All garbage collected is sent to the Glanbrook Landfill Site, where the
operation is contracted to Waste Management Inc. Single residential units are provided with garbage
collection weekly, with a one container limit that must be under 23kgs. Some grace periods exist for
seasonal holidays allowing residents to put out up to three containers of garbage. Residents can drop
off excess waste at their local recycling centre/ transfer station for a fee based on weight.
A special consideration policy has been developed for those with special medical circumstances, families
with three children or more under the age of five, agricultural businesses and registered home day care
centres. After applying and being approved for special consideration, these households are eligible to
set-out up to three containers of garbage at the curb every week.
3.1.8 INDUSTRIAL, COMMERCIAL AND INSTITUTIONAL (ICI) WASTE
Certain businesses, defined as ‘eligible properties’ under the City’s Solid Waste Management By-Law 09-
067, are qualified to receive waste collection services by the City and are required to comply with a six
container limit for garbage, unless they obtain special policy approval. There are no limits on the
amount of recycling or organics containers they can set out. All other businesses and institutions
contract services with the private sector, although they are mandated by provincial law to establish
recycling programs.
The vast majority of ICI waste generated in the City of Hamilton (about 60%) is not managed by the City,
but by private contractors using private facilities. Many of these private facilities are located outside of
the City, and some are in the United States. Although this practice is expected to continue through the
SWMMP planning period, municipalities fortunate enough to have their own landfills need to be

2012 Solid Waste Management Master Plan
15
cognizant of the potential for the border to close to the export of waste from Ontario and the significant
impacts this may have on all landfills and alternative disposal facilities in Ontario.
3.1.9 ILLEGAL DUMPING
Illegal dumping is an undesirable activity that has been associated with the City’s waste collection
program and more particularly the one container limit for garbage. However, the materials collected
from illegal dumping are a mix of bulk waste, construction and demolition waste, leaf and yard waste,
litter and escaped debris and household garbage.
Illegal dumping can occur when new waste management programs are introduced. Past experiences in
municipal programs have shown that this behaviour is usually temporary as individuals adapt to the
program changes. Hamilton's recent experiences with illegal dumping are unusual in this regard, and
future program changes should be monitored to assess their impact on illegal dumping. As new
programs are introduced, it will be important to continue considering their potential effect on illegal
dumping and to allow for additional resources as required to address any clean-up or enforcement
issues.
A number of initiatives are being implemented to curb illegal dumping, including:
An initial spring clean-up of areas difficult to access;
Integration of efforts to address illegal dumping into the Clean City Strategy;
An increase of 12 amnesty days for 2012-13;
Adjustments to garbage collection services for 2013-20;
Instituting a fee for habitual offenders of curbside waste collection programs;
Improvements to how illegal dumping is monitored and tracked.
Although it is recognized that illegal dumping is a behavioural issue, and that these activities are carried
out by a few individuals with disregard for the community and the environment, it is preferable that
waste management programs including diversion programs be undertaken in a way that does not
aggravate the situation.
3.2 HAMILTON’S WASTE MANAGEMENT FACILITIES
The City has a number of facilities in its waste management system, including:
Materials Recycling Facility (MRF);
Central Composting Facility (CCF);
Leaf and Yard Waste Composting Facility (LYWF)3;
Three Transfer Stations/Community Recycling Centres (TS/CRC); and
Glanbrook Landfill.
3 Located at the Glanbrook Landfill site
2012 Solid Waste Management Master Plan
16
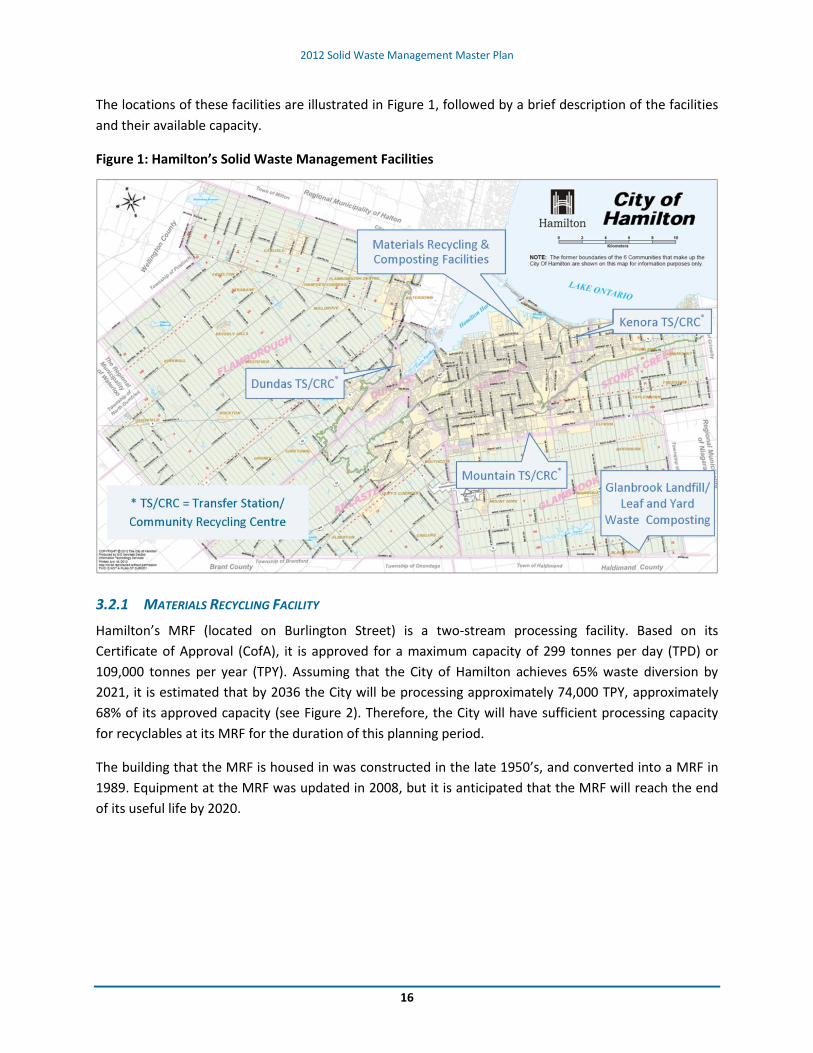
The locations of these facilities are illustrated in Figure 1, followed by a brief description of the facilities
and their available capacity.
Figure 1: Hamilton’s Solid Waste Management Facilities
3.2.1 MATERIALS RECYCLING FACILITY
Hamilton’s MRF (located on Burlington Street) is a two-stream processing facility. Based on its
Certificate of Approval (CofA), it is approved for a maximum capacity of 299 tonnes per day (TPD) or
109,000 tonnes per year (TPY). Assuming that the City of Hamilton achieves 65% waste diversion by
2021, it is estimated that by 2036 the City will be processing approximately 74,000 TPY, approximately
68% of its approved capacity (see Figure 2). Therefore, the City will have sufficient processing capacity
for recyclables at its MRF for the duration of this planning period.
The building that the MRF is housed in was constructed in the late 1950’s, and converted into a MRF in
1989. Equipment at the MRF was updated in 2008, but it is anticipated that the MRF will reach the end
of its useful life by 2020.

2012 Solid Waste Management Master Plan
17
Figure 2: Projected MRF Processing Tonnage (2010 – 2036)
-
20
40
60
80
100
120
2010 2021 2036
Ton
ne
s p
er Y
ear
(1,
000'
s)
Year
Material Recycling Facility
Tonnes per Year
Capacity
3.2.2 CENTRAL COMPOSTING FACILITY
Hamilton’s CCF (located on Burlington Street) is used to process both the City’s green cart organics, as
well as organics from other municipalities. The facility’s CofA approves it to process 90,000 TPY.
In 2010, the facility processed approximately 38,000 tonnes of green cart organics from Hamilton plus
another 39,000 tonnes from Simcoe County and Halton Region. As Hamilton’s organics program
matures, the amount of processing capacity required will increase. Based on 65% waste diversion by
2021, it is estimated that by 2036 the City’s organics program will divert about 79,000 TPY, which would
exceed the CCF’s approved processing capacity. The waste collection system approved for 2013 to 2020
will divert a significant amount of the leaf and yard from the CCF to the composting facility at the
Glanbrook landfill. Alternatively with the shortage of capacity for processing organics in Ontario, an
option would be to consider expansion as a means of ensuring capacity and maintaining revenues (see
Figure 3).

2012 Solid Waste Management Master Plan
18
Figure 3: Projected CCF Processing Tonnage (2010 – 2036)
-10 20 30 40 50 60 70 80 90
100
2010 2021 2036
Ton
ne
s p
er Y
ear
(1,
000'
s)
Year
Central Composting Facility
Tonnes per Year (Other Municipalities)
Tonnes per Year (Hamilton)
Capacity
3.2.3 LEAF AND YARD WASTE COMPOSTING FACILITY
Hamilton’s Leaf and Yard Waste Composting Facility is located at the Glanbrook Landfill Site and has an
approximate capacity of 25,000 TPY. In 2010, the facility processed 13,254 tonnes of leaf and yard
waste. Assuming the City achieves 65% waste diversion by 2021, the Leaf and Yard Waste Composting
Facility will be processing an estimated 15,500 TPY by 2036, or 62% of the facility’s capacity (see Figure
4). However, the compost pad will need to be relocated within next 10 years, as it is currently located in
the Stage 3 Disposal Area of the Glanbrook Landfill Site which will need to be utilized eventually for
disposal.
Figure 4: Projected L&YW Processing Tonnage (2010 – 2036)
-
5
10
15
20
25
30
2010 2021 2036
Ton
ne
s p
er Y
ear
(1,
000'
s)
Year
Leaf and Yard Waste Composting
Tonnes per Year
Capacity

2012 Solid Waste Management Master Plan
19
3.2.4 TRANSFER STATIONS/COMMUNITY RECYCLING CENTRES AND TIPPING FEES
Hamilton’s waste management system has three TS/CRC facilities, each of varying capacities:
Mountain TS/CRC: CofA approves the facility to receive 770 TPD of material, including L&YW.
Dundas TS/CRC: CofA approves the City to receive 650 TPD of municipal solid waste plus 120
TPD of L&YW. The facility has storage capacity for a total of 830 tonnes of material.
Kenora TS/CRC: CofA approves the facility to receive 1,420 TPD of municipal solid waste plus 120
TPD of L&YW. The facility has storage capacity for a total of 1,530 tonnes4.
The combined total approved capacity of the three facilities is approximately 1.01 Million TPY (based on
the daily capacities). All curbside collected waste and self-hauled (i.e., drop-off) waste goes through
TS/CRC facilities. In 2010, the facilities handled about 37,000 tonnes. Assuming the City achieves 65%
waste diversion by 2021, the TS/CRC facilities will be handling an estimated 53,000 TPY by 2036, or
about 5% of their collective capacity.
While the sites have sufficient approved capacity for handling the waste material, space constraints
have been noted by staff relating to the logistics of how waste is dropped off and managed at the
TS/CRC’s. For example staff has reported that on busy days police are required to direct traffic in and
out of the facilities. Also, when staff previously considered introducing drywall recycling only one TS/CRC
had sufficient space available to accept drywall. As part of its regular operations, City staff are
considering a review of the TS/CRC’s, which would include an assessment on appropriate locations for
potential future CRC’s5.
In January and February 2012, staff reports PW11030d and PW11030e provided information on tipping
fees and the potential cost impacts of reducing them relative to concerns about illegal dumping. It was
determined that the budget impacts were significant and that this would not be pursued further at the
present time. Reduced tipping fees would also likely add to the congestion occurring at the CRCs.
However, a further review of tipping fees could be undertaken as part of an operational review of the
TS/CRCs.
3.2.5 GLANBROOK LANDFILL
At the start of 2011, the Glanbrook Landfill had an estimated 5,038,900 tonnes of capacity remaining,
based on current compaction rates. The rate at which this capacity will be used is a function of the total
amount of waste generated in Hamilton and the City’s residential waste diversion rate. Using the
current waste generation rate and assuming population growth consistent with the City’s Growth
Related Integrated Development Strategy, GRIDS, the Glanbrook Landfill should have enough capacity to
4 Based on Certificate of Approvals.
5 City of Hamilton Public Works Department. Budget Report on Follow-up to Options for Increasing Diversion and
Landfill Capacity -Additional Diversion Options to Reach 65% Waste Diversion (PW07151d). February 7, 2011.

2012 Solid Waste Management Master Plan
20
last until between 2036 (no increase in diversion) and 2044 (65% waste diversion by 2021)6. For more
discussion on potential diversion rates and their effect on the landfill’s lifespan, please see Section 4.4.
3.3 RESULTS OF GAP ANALYSIS
3.3.1 WASTE SYSTEM PERFORMANCE
In 2010, the City of Hamilton’s residential sector generated 216,848 tonnes of solid waste. The Gap
Analysis7 showed that 83% of this waste was generated by Hamilton’s single-family sector and 17% by
the multi-residential sector. The analysis also showed that the single-family residential sector diverted
an estimated 55% of its waste from disposal in 2010, while the multi-residential sector diverted 21%.
Combined, the total residential sector diverted an estimated 49% of its waste from disposal. Table 2
summarizes the diversion rates for each waste stream category by residential sector.
Table 2: Diversion of Waste Stream Categories
Waste Stream Category Diversion Rate (2010)
Total Residential Sector (Single-Family + Multi-Residential)
Single Family Multi-Residential
Paper 83.4% 88.6% 56.3%
Paper Packaging 51.2% 56.1% 29.8%
Plastics 29.1% 33.6% 12.1%
Metals 50.9% 53.8% 37.5%
Glass 74.2% 78.0% 61.2%
Household Special Waste 48.4% 47.7% 51.1%
Organics 67.9% 75.3% 12.5%
Other Materials 4.1% 4.6% 2.4%
Waste Electrical and
Electronic Equipment
18.9% 15.3% 29.7%
Total 49.0% 54.5% 21.3%
Compared to 2002, the City of Hamilton has significantly increased the percentage of waste it diverts
and decreased the amount of residential solid waste it disposes. As Figure 5 illustrates, the City’s
residential solid waste diversion rate has more than doubled since 2002, while the amount of waste
being sent for disposal has been more than halved (down from 225,599 tonnes in 2002 to 110,666
tonnes in 2010).
6 Currently, most of the business sector waste in Hamilton is managed by the private sector and disposed of in
private sector landfill sites. See Section 3.1.8. 7 Presented in the study report Gap Analysis.

2012 Solid Waste Management Master Plan
21
Figure 5: Hamilton’s Waste Diversion Rate and Disposal Tonnage (2002 – 2010)
21%
24%
28%30%
40%42%
44%
47%49%
0%
5%
10%
15%
20%
25%
30%
35%
40%
45%
50%
0
50,000
100,000
150,000
200,000
250,000
2002 2003 2004 2005 2006 2007 2008 2009 2010
Was
te D
ive
rsio
n R
ate
Ton
ne
s o
f W
aste
Dis
po
sed
Waste Diversion Rate vs. Tonnes Disposed
Diversion Disposed
3.3.2 WASTE CHARACTERIZATION
Table 3 shows a summary of waste characterization for Hamilton’s 2010 waste stream, including both
single-family and multi-residential sectors. The largest categories in the residential waste stream in 2010
were organics (36.2%), other materials (22.6%), paper (11.9%) and paper packaging (10.3%).

2012 Solid Waste Management Master Plan
22
Table 3: Waste Characterization (2010)
Waste Category Total Residential Sector Single Family Multi-
Residential
Total Waste
Generated for
Each Waste
Category
(tonnes)
% of Total Waste
Stream (for each
waste category)
% of Total
Waste Stream
(for each waste
category)
% of Total
Waste Stream
(for each waste
category)
Paper 25,702 11.9% 11.9% 11.5%
Paper Packaging 22,238 10.3% 10.0% 11.5%
Plastics 18,726 8.6% 8.2% 10.8%
Metals 8,244 3.8% 3.7% 4.1%
Glass 9,131 4.2% 3.9% 5.7%
Household Special Waste 1,929 0.9% 0.9% 1.1%
Organics 78,551 36.2% 38.4% 25.3%
Other Materials 48,921 22.6% 21.5% 27.6%
Waste Electronics and
Electrical Equipment (WEEE)
3,406 1.6% 1.4% 2.3%
Total 216,848
As noted, the focus of the SWMMP Review is on Hamilton’s residential solid waste stream, which makes
up 81% of the solid waste going into the Glanbrook Landfill. The landfill also receives waste from
Hamilton’s Industrial, Commercial and Institutional (ICI) sector (most of the waste from this sector in
Hamilton is managed by private disposal facilities), as well as grit from the Waste Water Treatment
Plant, and street sweepings. The proportions of these materials disposed in the Glanbrook Landfill for
2010 are illustrated in Figure 6.
Figure 6: Waste Disposed at Glanbrook Landfill
Wastewater Treatment Plant
Grit, 2%
Streetsweepings, 5%
ICI, 12%
Residential, 81%
Waste Disposed at Glanbrook Landfill (2010) - 136,653 tonnes
3.3.3 POTENTIAL FOR ADDITIONAL DIVERSION
In the Gap Analysis, an assessment was completed of how much additional material could be diverted if
under-performing materials were captured more fully over the existing capture rate (i.e. system

2012 Solid Waste Management Master Plan
23
optimization). Target capture rates (which refer to how much of a specific waste material that could be
captured for diversion) were assigned for blue box recyclables, organics, and other divertible materials 8.
The materials already achieving greater than the target capture rates were assumed to maintain the
same level of diversion in the future. Through the assessment, it was found that (based on 2010
tonnages) optimization of Hamilton’s existing waste management programs and achievement of the
target capture rates could potentially:
Divert approximately 21,400 more tonnes of material in the single-family residential sector and
contribute an additional 9.85 percentage points to the City’s overall diversion rate;
Divert approximately 12,700 more tonnes of material in the multi-family residential sector and
contribute an additional 5.85 percentage points to the City’s overall diversion rate;
For the residential sector overall, divert approximately 34,100 more tonnes of material and
contribute an additional 15.70 percentage points to the City’s overall diversion rate, raising it to
about 65%.
This does not include the potential diversion of materials for which City diversion programs do not
currently exist (e.g., carpeting, durable plastic products, construction and renovation waste, etc).
Table 4 summarizes the amount of additional diversion estimated to be available through program
optimization (note that this does not include potential diversion of materials for which there is currently
no City program, such as drywall, shingles or diapers).
Table 4: Potential Additional Diversion of Waste Categories
Total Residential Sector Single Family Multi Family
Waste Stream Category
Possible Additional Tonnage
Increased Diversion
Above Existing Diversion Rate
(Percentage Points)
Corre-sponding
Additional Tonnage
Increased Diversion
Above Existing Diversion Rate
(Percentage Points)
Corre-sponding
Additional Tonnage
Increased Diversion
Above Existing Diversion Rate
(Percentage Points)
Paper 2,212 1.02% 1,049 0.48% 1,163 0.54%
Paper Packaging 7,370 3.40% 5,124 2.36% 2,246 1.04%
Plastics 3,389 1.56% 2,224 1.03% 1,145 0.53%
Metals 2,850 1.31% 2,134 0.98% 715 0.33%
Glass 280 0.13% 0 0 280 0.13%
Household Special Waste
229 0.11% 200 0.09% 29 0.01%
Organics 15,741 7.26% 9,059 4.18% 6,683 3.08%
Other Materials 71 0.03% 32 0.01% 40 0.02%
WEEE 1,910 0.88% 1,524 0.70% 386 0.18%
Total 34,052 15.70% 21,365 9.85% 12,687 5.85%
8 Under-performing materials are considered those with current diversion options available and which are
achieving a capture rate less than either 85% in the blue box program, 85% in organics and 75% in other diversion programs. The 85% blue box target was selected to match the Waste Diversion Ontario recommended blue box material capture rate target for large urban municipalities.
2012 Solid Waste Management Master Plan
24
The SWMMP and Vision 2020
The SWMMP is one aspect of the overall structure that
allows Hamilton to function as a thriving City. The other
components (including other municipal services)
operate under the umbrella of Vision 2020, which
presents a view of a Hamilton that is strong, healthy
and sustainable. It contains the principle of
sustainability, and it states that consideration of the
economic, social, and environmental effects on our
decisions is critical, as a decision in one area (or pillar)
can affect the progress of other areas. As the SWMMP
falls under the Vision 2020 umbrella, the principle of
sustainability is understood to be inherent, and this is
reflected through the 2012 SWMMP’s goals and
objectives. For more information on Vision 2020, visit
www.hamilton.ca/ProjectsInitiatives/V2020.
4 2012 SOLID WASTE MANAGEMENT MASTER PLAN
The SWMMP is intended to provide the City of Hamilton with a roadmap for how it should manage the
City’s residential solid waste over the next 25 years. This section begins with the updated principles that
will be used to guide how the City manages its waste, followed by goals and the objectives that will help
to measure success. Finally, the strategic directions that the City will use to achieve these goals and
objectives are then discussed, including how they can work together as a system.
During the planning process for this SWMMP, it was suggested that the City of Hamilton should consider
the principle of Zero Waste. For a community to achieve Zero Waste, a number of conditions are
required, particularly:
Waste generators (i.e., residents/consumers) make consumer decisions about products that
minimize product packaging waste and waste from the product’s end-of-life;
Programs are in place to receive and divert unwanted products and packaging from disposal
(e.g., municipal recycling and composting programs, industry stewardship programs,
opportunities for the reuse of durable goods9, etc); and
Product manufacturers design products and packaging to minimize packaging waste and to
make sure the products can be easily recycled at the end of their useful life.
The adoption of a policy of Zero waste is
viewed as a goal, recognizing that there
are many factors outside of the City’s
control. This SWMMP has, however, been
designed to help the City and its partners
in solid waste management10 move
Hamilton closer to this philosophy.
4.1 GUIDING PRINCIPLES
In 2001, the City of Hamilton and the
SWMMP Public Advisory Committee
prepared two guiding principles for the
2001 SWMMP. As described in Section
2.2, the public was asked in this current
process if the 2001 SWMMP guiding
principles still applied today, if they need
to be changed and what they would be. In
general, the public response has been that
9 “Durable goods” are those materials that are long lasting and can be reused once the original purchaser no longer
wants the item. 10
The City of Hamilton’s partners in solid waste management includes its contractors, and the residents of Hamilton, other tiers of government, product producers, and Hamilton’s ICI community.

2012 Solid Waste Management Master Plan
25
the original guiding principles from the 2001 SWMMP are still applicable and should be kept, with some
updating.
Feedback from the public also indicated that the waste management hierarchy should be reflected in
the guiding principles. The waste management hierarchy organizes the main waste strategies in order of
importance or desirability, placing waste reduction and reuse as preferred waste management
strategies before recycling. To reflect this, the public suggested a third Guiding Principle based on the
understanding that the City’s current waste management program incorporates all major waste
diversion activities, and therefore the next major step is to also place emphasis on waste minimization.
The Guiding Principles for the City of Hamilton’s 2012 SWMMP are provided in Table 5.
Table 5: Guiding Principles for Hamilton’s 2012 Solid Waste Management Master Plan
1. The City of Hamilton must lead and encourage the changes necessary to adopt the principle of
Waste Minimization.
The need for the City of Hamilton to place more emphasis on waste minimization (i.e., waste
reduction and reuse) was commonly heard from process participants. While it is important to have
programs in place that can divert solid waste from disposal, it is also important to shift the public
mindset to one that seeks to avoid generating waste in the first place.
2. The Glanbrook Landfill is a valuable resource. The City of Hamilton must minimize residual waste
and optimize the use of the City’s diversion and disposal facilities.
The second guiding principle continues to recognize that the Glanbrook Landfill is a valuable
resource for the City and its residents. It has been updated to reflect the community’s desire to
minimize the amount of residual waste requiring disposal, as well as to optimize how the City uses
both its diversion and disposal facilities. Optimization of the facilities includes not just their overall
capacity to manage Hamilton’s waste, but also economic optimization as well.
3. The City of Hamilton must maintain responsibility for the residual wastes generated within its
boundaries. Inter-regional facilities will be considered.
While the third guiding principle continues to recognize that the City must maintain responsibility for
the residual wastes generated by Hamiltonians, it acknowledges that opportunities may arise in the
future that provide Hamilton with responsible alternatives to managing either its divertible material
or residual wastes with partners possibly outside of Hamilton’s borders.
2012 Solid Waste Management Master Plan
26
Goals
Broad, high level
statements that
outline what the
program is trying to
achieve.
Objectives
Measureable, defined
statements that
describe specific,
tangible outcomes.
4.2 GOALS AND OBJECTIVES
During the review, the public contributed to the goals and objectives of
the 2012 SWMMP. The SWMMP goals and objectives are organized
according to the three pillars of sustainability - society, the
environment, and the economy.
4.2.1 THE SOCIETY PILLAR
The 2012 SWMMP goals within the society pillar include three broad,
over-reaching goals:
1. The City of Hamilton presents a consistent message to increase
awareness and understanding.
2. The City of Hamilton provides convenient access to programs to
ensure everyone is able to participate.
3. The residents of Hamilton consistently participate in the City’s solid waste management
programs.
Subsequent goals drawn from the themes of these over-reaching goals include:
Message
4. Information about Hamilton’s programs is clear and accessible to its diverse community.
5. The City of Hamilton provides a consistent message regarding waste minimization through its
various sustainability-related initiatives (e.g., Vision 2020, etc).
6. The residents of Hamilton have a high awareness of waste management issues (in particular, its
cost and value) and available programs.
Access
7. Components of the SWMMP are adaptable enough to accommodate Hamilton’s various local
geographical and sociological characteristics.
8. Hamiltonians have access to waste diversion programs regardless of where they are - at home11,
at work or at play.
9. There is access to a consistent level of waste diversion services available across Hamilton.
Participation
10. Participation in waste minimization and diversion activities among other sectors (e.g., business,
education, community events, etc) is maximized.
11. Participation in waste minimization and diversion activities/programs is maximized for both
single-family and multi-family households.
11
Including both single-family and multi-residential (e.g., apartments and condominiums) households.

2012 Solid Waste Management Master Plan
27
The ultimate outcome of these goals is:
12. Attaining a culture of waste minimization and diversion that is commonplace and mainstream
throughout Hamilton.
Objectives to help measure these goals include:
a. There is an earned Gold Box in front of every curbside household in Hamilton.
b. Accesses to communication materials about Hamilton’s waste management programs are
available in all of the City’s main languages.
c. Participation in the City’s main waste diversion programs is maintained at 90%.
d. 100% of Hamilton’s eligible businesses have a waste diversion plan in place as required under
Ontario Regulation 103/94.
e. The number of people reached through the City’s waste management education and outreach
activities expands year over year from 2010 levels.
4.2.2 THE ENVIRONMENT PILLAR
Goals within the environment pillar include:
1. Illegal dumping and litter is reduced.
2. Hamilton’s waste management system will reduce the City’s overall per capita environmental
footprint on air, water and land.
3. The total amount of waste generated by the residents of Hamilton is reduced.
4. The diversion of solid waste generated is maximized.
Objectives to help measure these goals include:
a. A waste diversion target of 65%.
b. Capture rates of recyclable material meet or exceed Waste Diversion Ontario’s capture rate
standards.
c. A 50% reduction in the amount of residuals (e.g., contamination) collected through the waste
diversion programs.
d. Waste generated is reduced through awareness of waste minimization practices.
4.2.3 THE ECONOMY PILLAR
Goals within the economy pillar include:
1. Lobby efforts encourage greater adoption of less wasteful product packaging.
2. There is an increase of Extended Producer Responsibility within the City of Hamilton.
3. Energy recovery options are explored at the Glanbrook Landfill.
4. Existing markets for recyclable materials are expanded and diversified.
5. Hamilton’s waste management resources are used efficiently, costs are being contained, and
economies of scale are being realized where possible.
6. Revenues from the City’s diversion facilities are maximized.

2012 Solid Waste Management Master Plan
28
7. All of the City’s inter-regional partnerships provide economic benefits to all partners.
Objectives to help measure these goals include:
a. Additional materials are included for diversion.
b. Costs are reduced, diversion revenues are increased, and efficiency and effectiveness are
increased.
4.3 OVERVIEW OF STRATEGIC DIRECTIONS
This section describes the five key strategic directions for Hamilton’s 2012 SWMMP. The directions
address all facets of Hamilton’s waste management system, build on the input that was received
throughout the process, and are consistent with the Ministry of the Environment’s (MOE) Waste Value
Chain (i.e. the hierarchy of waste management – reduce, reuse, recycle, dispose). Section 4.4 describes
how the directions could be integrated and their potential for diversion, estimated costs, and effect on
the estimated lifespan of the Glanbrook Landfill.
4.3.1 EDUCATION AND ENFORCEMENT
Promotion and education are key components of any successful waste management program. Not only
must program users be made aware of the programs and how to use them, but they must also be
reminded and motivated to do so. The most effective kind of promotion and education works in two
directions, in effect forming a dialogue between the municipality and those using its waste management
programs. Not only would residents be receiving information on programs, but they are also
communicating back what works well and is understood, as well as what does not work well and areas
of confusion.
While promotion and education can be effective at encouraging participation, some residents will
continue to place their divertible waste in the garbage. Currently, the City’s Solid Waste By-Law 09-067
prescribes acceptable and unacceptable garbage. If promotion and education is found not to work in
some cases, enforcement of these by-laws may be used to encourage participation.
Examples of options that would fall under this direction include:
Targeted Educational Materials and Initiatives: The City’s existing education and outreach
program is well established for targeting specific materials, diversion programs, specific
behaviour or attitude changes, or geographic areas. Emphasis could be placed on topics such as
waste minimization (i.e., waste reduction and reuse), illegal dumping, and on the use of social
media (such as Facebook and Twitter).
Adopt Zero Waste Policy at Municipal Events and Buildings: A zero-waste policy could be
encouraged at municipal events and buildings, such as libraries, civic centres, city hall, fire
stations and community centres.
Incentives and Recognition for Good Diversion Behaviour: In addition to the “Gold Box”
program, other incentives or rewards could include diversion credits (e.g.,

2012 Solid Waste Management Master Plan
29
www.recyclebank.com), tax incentives or compost giveaways could be used to motivate greater
participation.
Enforcement of Solid Waste By-laws: The City of Hamilton has a municipal solid waste by-law
that prohibits placing recyclable materials in with regular garbage. Enforcement of the by-law
could be considered as needed (in conjunction with education) to ensure recyclable,
compostable and hazardous materials are kept out of landfill and that illegal dumping is
reduced.
4.3.2 SERVICE LEVEL MODIFICATIONS
Over time, the waste management needs of residents and the dynamics of how waste is diverted can
change. In response to these changes, the City may need to modify how it delivers waste management
services (e.g., collection of recyclables, organics and garbage) to its customers, the residents of
Hamilton. Modifications to how the City delivers these services can help to encourage diversion,
increase cost-effectiveness, or both.
Two examples of options that would fall under this direction include:
Bi-weekly Garbage Collection: With recycling and organics collection occurring weekly, the
frequency of garbage collection could be reduced from weekly to every other week (bi-weekly).
This would encourage residents to maximize use of available diversion programs. It would also
reduce collection costs and air emissions. It is recognized that the waste collection system for
2013 to 2020 is based on weekly collection of garbage and bi-weekly garbage collection could
only be considered in the next collection period.
Automated Single Stream Recycling Collection: Currently, the City collects recyclable fibres and
containers in separate recycling streams. Switching to automated single-stream collection of
recyclables would make recycling easier and could improve collection efficiency and increase the
amount of recyclables collected. This may involve the use of larger containers such as wheeled
carts and a collection truck equipped with a mechanical tipper. Materials collected at curbside
would then be sorted at a City facility. This would require the City’s MRF to include equipment
able to accept single-stream recyclables. There is an opportunity to review single stream
processing and collection during the recycling review scheduled to take place before the 2020
waste collection contracts and the expiration of the current MRF processing contract.
4.3.3 WASTE MINIMIZATION AND DIVERSION OPPORTUNITIES
Currently, the City has a wide variety of waste diversion programs available to residents and provides
information resources for waste reduction and reuse (i.e. waste minimization) on its website. In moving
forward, the City will work to foster a wider culture of waste minimization and to provide more
opportunities for diverting the waste that is generated.
Examples of options that would fall under this direction include:
Addition of New Materials to Existing Recycling Programs: New material (e.g., mixed plastics,
carpet, etc.) could be added to the City’s recycling programs as it becomes economically feasible

2012 Solid Waste Management Master Plan
30
to do so (e.g., if the City can process them and if markets are available). Opportunities for
diversion may arise as new processing techniques are developed and markets are established
for materials currently difficult to recycle.
Additional Re-use Centres: Currently, the City operates a re-use centre at its Mountain CRC. The
City could consider the feasibility of additional re-use centres at CRCs, other locations or
partnering with other existing organizations/ charities that reuse materials.
Commercial Sector Recycling and Composting: The City collects some waste from small
businesses. The City could work with these small businesses to encourage greater diversion
from the City’s small business sector, such as through green cart composting or educational
support. The educational support could also be extended to businesses that are not customers
of Hamilton’s waste management services.
Construction and Demolition Re-use and Recycling: The City could promote and/or provide for
the re-use and recycling of residential construction and renovation materials such as wood,
nails, screws, drywall, carpeting, and general construction material.
Event Days: Event Days in communities across Hamilton could encourage residents without easy
access to a CRC or reuse organization to donate or obtain materials suitable for reuse.
Waste Diversion in Multi-Residential Buildings: A targeted emphasis on recycling and
composting in multi-residential buildings could help to overcome residents’ waste diversion
challenges and increase diversion.
4.3.4 MULTI-MUNICIPAL COLLABORATION
While Hamilton has control over how it manages waste generated within its borders, influencing how
manufacturers and producers design their products and packaging is more difficult. However, the City
can continue its efforts to work with other municipalities, other levels of government, community
groups and other stakeholders to encourage greater producer stewardship and more waste conscious
product design.
Hamilton can also work with its neighbours to make waste diversion more cost-efficient. Processing
recyclables and organics could be done on a regional scale instead of by municipality. This can reduce
costs by increasing economies of scale through sharing of facilities, which can be very expensive to build
and operate. This allows some municipalities to find less expensive ways to process their materials,
while providing others with a source of revenue, all of which benefits taxpayers.
Examples of options that would fall under this direction include:
Extended Producer Responsibility: The City could continue its efforts to lobby for greater
producer stewardship. The City could also consider establishing and promoting retail “Take it
Back” initiatives, where manufacturers and suppliers take back products after their use.
Multi-Municipal Processing: Hamilton’s recycling and composting facilities could be used to
process materials from other municipalities. This type of partnership allows other municipalities
to increase their diversion rate while providing revenue for Hamilton. This may require future
studies to assess material processing capabilities and capacity issues.

2012 Solid Waste Management Master Plan
31
4.3.5 DISPOSAL
After Hamilton’s residential solid waste has been reused, recycled and composted to the extent
possible, a portion of waste will remain that requires disposal. Currently, the City of Hamilton uses the
Glanbrook Landfill for the disposal of this waste. Based on 2010 disposal rates, the Glanbrook Landfill
has enough capacity to remain in operation until about 2036, although this lifespan will extend as
diversion is increased (see next section).
It is anticipated that the life of the Glanbrook Landfill will extend beyond the end of this Review’s
planning period (i.e. 2036). As such, it is recommended that the Glanbrook Landfill continue to be used
as the City’s means for disposing of its waste. However, it is acknowledged that the landfill is a finite
resource that will someday close and so another means of disposing the City’s residual waste will be
required. It is therefore also recommended that the City consider alternative disposal capacity no later
than in the next SWMMP review. Staff should also continue to monitor emerging alternative disposal
technologies. The options for alternative disposal capacity could be either a replacement for the
Glanbrook Landfill or as a means of complementing and extending the useful life of Glanbrook. As time
progresses, the following technologies amongst other new processes will continue to improve:
Energy from waste (e.g. incineration, gasification, pyrolysis, etc.);
Waste stabilization (a process where the waste sent for disposal is run through a process similar
to composting and made inert, which reduces leachate and minimizes landfill gas);
Mechanical separation (where waste sent for disposal is sorted before going into to landfill, so
that recyclable and compostable materials can be extracted); and
Other technologies, processes and opportunities that may arise before the next review period.
4.4 SYSTEM ANALYSIS SUMMARY
The amount of waste diverted and the cost of programs arising from the 2012 SWMMP will depend on
the directions implemented and the level of waste diversion they achieve. The assessment of the
directions examined the current system (Status Quo) as a baseline and then considered the results of
both moderate (an enhanced approach over Status Quo) and an aggressive (maximized approach)
implementation of the directions.
Table 6 summarizes the estimated change to costs for implementing the various waste management
scenarios, which are discussed in greater detail in the sections that follow.

2012 Solid Waste Management Master Plan
32
Table 6: Summary of Approaches to SWMMP Directions
Scenario Diversion
Rate
(by 2021)
Estimated Change Relative
to Status Quo Annual
Waste Management
Operations Budget
Estimated
Glanbrook
Landfill Closure
Date
Total Cost 25-Year Net
Present
Value
Diversion
Status Quo 55% - 2040 $642 M $425 M
Enhanced 65% Savings of $2.4 Million 2044 $733 M $483 M (a)
Maximized 75% Savings of $4.5 Million 2048 $749 M $496 M (a)
Disposal
ADT by 2027
Assumed 65% by 2021
- 2053 $583 M $390 M
Status Quo (Glanbrook Landfill)
Assumed 65% by 2021
- 2044 $501 M $344 M
(a) While the enhanced and maximized scenarios provide operational savings, the overall system costs will increase as diversion
increases because the cost to process diverted waste is greater than the cost for disposal.
4.4.1 APPROACH TO WASTE DIVERSION
4.4.1.1 Status Quo
In assessing the Status Quo, the project team considered Hamilton’s current waste management system
and projected its results over the planning period. In 2010, the City’s residential diversion rate was 49%.
Experience with other waste management systems in Ontario show that systems tend to mature over
time, as residents better understand and more fully participate in programs. For example, the organics
program is expected to mature in Ontario municipalities over the next decade just as the blue box
program did in the 1990’s.
In 2010, the capture rate in the City of Hamilton for food waste was 58.3%, leaf and yard waste was
94.8% and tissue/towelling was 16.7%, for an overall organics capture rate of 63.6%. This rate is quite
high compared to other municipalities in Ontario, especially for a relatively new curbside organics
collection and composting program. Most organics programs experience capture rates of 30% to 50%
upon program initiation. Comparatively, established Blue Box recycling programs in Ontario experience
capture rates of 80% to 90%. It is expected that Hamilton’s residential diversion rate could rise from the
current 49% to 55% by 2021 as the organics program continues to mature, without any major
modifications to the current system (i.e. maintaining the status quo).
In this scenario, the Glanbrook Landfill would reach capacity by 2040 and another means of disposing of
the City’s garbage would be required at that time. The total estimated cost of the Status Quo system
over 25 years (including diversion and disposal) is $1.234 B (with a Net Present Value of $826 M). This
includes current operating costs and planned capital costs and studies, which include among other
items:
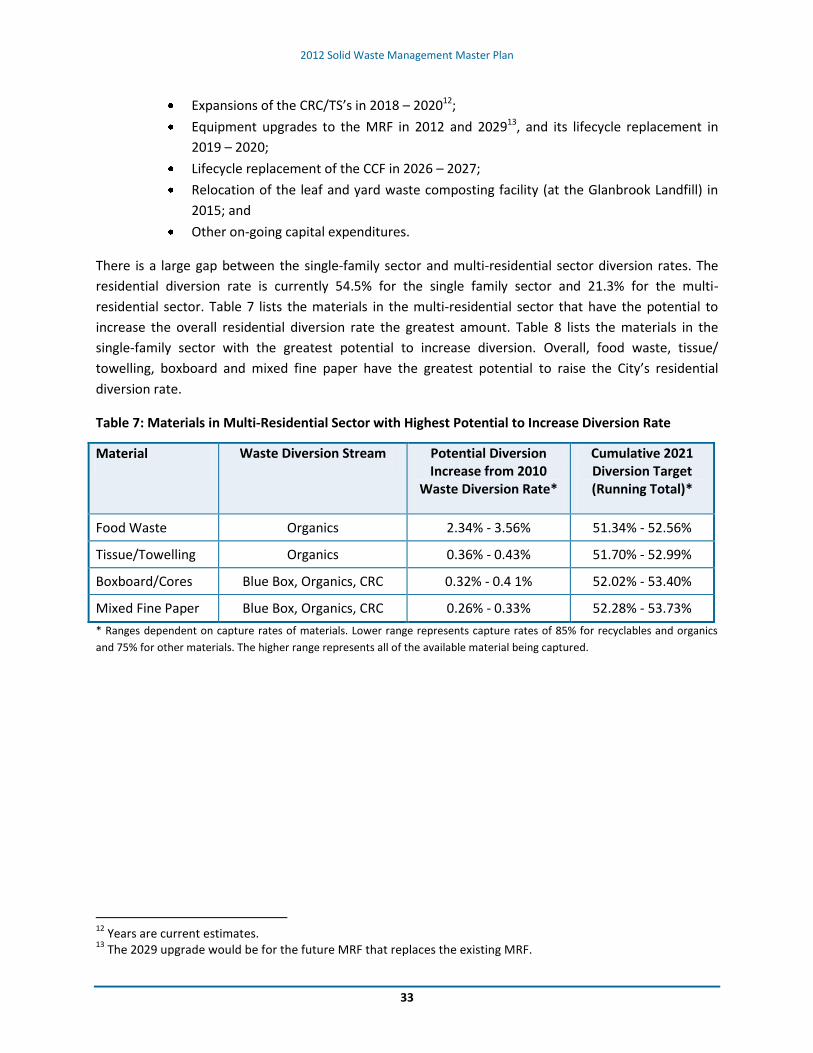
2012 Solid Waste Management Master Plan
33
Expansions of the CRC/TS’s in 2018 – 202012;
Equipment upgrades to the MRF in 2012 and 202913, and its lifecycle replacement in
2019 – 2020;
Lifecycle replacement of the CCF in 2026 – 2027;
Relocation of the leaf and yard waste composting facility (at the Glanbrook Landfill) in
2015; and
Other on-going capital expenditures.
There is a large gap between the single-family sector and multi-residential sector diversion rates. The
residential diversion rate is currently 54.5% for the single family sector and 21.3% for the multi-
residential sector. Table 7 lists the materials in the multi-residential sector that have the potential to
increase the overall residential diversion rate the greatest amount. Table 8 lists the materials in the
single-family sector with the greatest potential to increase diversion. Overall, food waste, tissue/
towelling, boxboard and mixed fine paper have the greatest potential to raise the City’s residential
diversion rate.
Table 7: Materials in Multi-Residential Sector with Highest Potential to Increase Diversion Rate
Material Waste Diversion Stream Potential Diversion Increase from 2010
Waste Diversion Rate*
Cumulative 2021 Diversion Target (Running Total)*
Food Waste Organics 2.34% - 3.56% 51.34% - 52.56%
Tissue/Towelling Organics 0.36% - 0.43% 51.70% - 52.99%
Boxboard/Cores Blue Box, Organics, CRC 0.32% - 0.4 1% 52.02% - 53.40%
Mixed Fine Paper Blue Box, Organics, CRC 0.26% - 0.33% 52.28% - 53.73%
* Ranges dependent on capture rates of materials. Lower range represents capture rates of 85% for recyclables and organics
and 75% for other materials. The higher range represents all of the available material being captured.
12
Years are current estimates. 13
The 2029 upgrade would be for the future MRF that replaces the existing MRF.

2012 Solid Waste Management Master Plan
34
Table 8: Materials in Single-Family Residential Sector with Highest Potential to Increase Diversion Rate
Material Waste Diversion Stream Potential Diversion Increase from 2010
Waste Diversion Rate*
Cumulative 2021 Diversion Target (Running Total)*
Food Waste Organics 4.18% - 7.57% 53.18% - 56.57%
Tissue/Towelling Organics 1.90% - 2.32% 55.08% - 58.89%
Other Metal CRC 0.83% -1.09% 55.9 1% - 59.98%
Polyethylene Plastic Bags & Film - Packaging
Blue Box 0.65% - 0,83% 56.56% - 60.8 1%
Mixed Fine Paper Blue Box, Organics, CRC 0.39% - 0.61% 56.95% - 61.42%
Boxboard/Cores Blue Box, Organics, CRC 0.15% - 0.47% 57.10% - 61.89%
Other Electronics WEEE 0.34% - 0.45% 57.44% - 62.34%
* Ranges dependent on capture rates of materials. Lower range represents capture rates of 85% for recyclables and organics
and 75% for other materials. The higher range represents all of the available material being captured.
4.4.1.2 Enhanced Approach
An enhanced solid waste management system for Hamilton would include a moderate adoption of the
proposed SWMMP principles. The Enhanced Approach focuses on current programs and education
measures to get more out of them. It implements options that have the most capacity for improvement.
For the purpose of this assessment, the following options were added to the City’s current system as an
enhanced system: targeted education, use of incentives, an emphasis on the commercial sector and
multi-residential buildings, diversion of residential construction and renovation waste, adding new
materials to the City’s diversion programs, continued encouragement of EPR, multi-municipal
processing, and reducing garbage collection frequency to bi-weekly (see Figure 7).

2012 Solid Waste Management Master Plan
35
Figure 7: Enhanced Approach to Implementation of Directions
For the most part, all of the options noted above, except for reducing garbage collection frequency to bi-
weekly and multi-municipal processing, do not involve any major changes or additions to the current
system but are generally related to education and promotion. Furthermore, two of the program options
in this scenario do not directly impact the ability to increase the residential diversion rate, which is the
primary measure of the success of increased diversion. For example, additional focus on the City’s
commercial sector can increase the overall diversion rate and reduce disposal requirements but would
not be included as a measure of the residential diversion rate. However, it would be considered in the
City’s overall diversion rate and increase landfill life. Expanding the City’s MRF or CCF to attract and
process recyclables or organic materials from other municipalities will also not increase the City’s
residential or overall diversion rate. In fact, there will likely be a small negative impact on site life at the
Glanbrook Landfill, as the residuals from processing these materials will likely be disposed in the landfill;
however, the impact of this would very small. Although it is recognized that consideration of bi-weekly
garbage collection cannot be considered for implementation before 2020, it would represent the most
significant potential increase in diversion.
Environmental Net Effects
In general, the components of the Enhanced Diversion scenario are related to enhanced education and
promotion. No new facilities are proposed that could have negative impacts on the environment. The
focus of the education programs results in a net positive impact to the environment by increasing the
amount of waste diverted. This reduces the negative impacts associated with obtaining the raw
materials for new products. Increasing the amount of organic material diverted from disposal to
2012 Solid Waste Management Master Plan
36
composting reduces greenhouse gas (GHG) emissions, reduces impacts of landfills by removing organics
that increase leachate strength and returns a beneficial product to the soil.
One option in the enhanced approach - reducing the frequency of garbage collection to bi-weekly - has a
positive net environmental benefit from a number of aspects. A direct positive enhancement is that
there are less collection vehicles on the City road system. This net decrease in vehicles decreases GHG
emissions. Indirectly, reducing garbage collection frequency to bi-weekly would results in increased use
of Blue Box and SSO collection due to convenience, as the collection of these materials remain weekly.
Experience of other municipalities that have implemented bi-weekly garbage collection is that diversion
of SSO and Blue Box materials increases, which results in increased benefits to the environment as
organic material and recyclables are diverted from the landfill. Impacts on landfills are reduced by
removing organics that increase leachate strength, a beneficial product is returned to the soil and GHG
emissions are reduced because of reduced production of new materials.
Social Net Effects
Similar to the natural environment, the social net effects of the Enhanced Diversion scenario are
generally positive. As no new facilities are proposed, there are no negative social effects related to siting
and facility operation. One negative social impact may be the reaction to bi-weekly garbage collection.
Although many municipalities in Ontario have implemented bi-weekly garbage collection to increase
Blue Box and organic collection program participation rates and reduce costs, many municipalities have
experienced an initial negative reaction to the idea from residents due to perceived reduction in service
and concerns such as keeping garbage for two weeks (especially in the summer months), large families
and families with children or adults using disposable diapers, and the potential for increased illegal
dumping. The negative public reaction to bi-weekly garbage collection is often received by the municipal
staff and politicians, which can then negatively impact/raise questions of whether or not such a program
should be implemented.
Economic Net Effects
Considering that there could be a negative reaction to bi-weekly garbage collection, the economic
impact of the enhanced scenario has been considered with and without this option.
The total cost to implement the Enhanced Diversion scenario without bi-weekly garbage collection over
the 25-year planning period is $733 M (with a net present value of $483 M). This is an increase of $91 M
over the Status Quo costs. Of this increase over the 25-year planning period, $15 M (or $615,000 per
year) is attributed to implementation of the various diversion options (not including bi-weekly garbage
collection) and the remainder is attributable to the increase in diversion and managing those materials.
These costs include the planned capital costs described in Section 4.4.1.1 plus a review of the CCF’s
capacity and (if feasible) expansion of the CCF.
In considering an Enhanced Diversion scenario with bi-weekly garbage collection in 2020, it is estimated
that moving to bi-weekly garbage collection could reduce the City’s overall annual collection costs by
10% to 15%. Therefore, including bi-weekly garbage collection in the enhanced approach would result in

2012 Solid Waste Management Master Plan
37
potential overall savings of $2,400,000 per year. The total cost to implement the Enhanced Diversion
scenario with bi-weekly garbage collection over the 25-year planning period is $710 M (with a net
present value of $469 M). This is an increase of $67 M over the Status Quo system (which does not have
bi-weekly garbage collection). This is a significantly lower increase compared to not implementing bi-
weekly garbage collection, as bi-weekly garbage collection will result in savings of $24 M over the 25
year planning period14.
One of the options in the enhanced scenario is to accept recyclable and organic material from other
municipalities to process at the City’s waste diversion facilities (i.e., multi-municipal processing). To
accomplish this may require upgrades/expansions to the MRF and/or the CCF. This will not increase the
City’s diversion rate but could be used as a source of revenue generation for the City. For example, with
the shortage of organics processing capacity currently in the Province, the potential that excess compost
processing capacity could be marketable immediately is high. As noted in Section 3.2.2, the CCF is would
require additional capacity to accommodate new municipal customers. With respect to the recycling, if
upgrades were required to the MRF to process materials from another municipality (e.g., a municipality
with single-stream collection), those upgrades could possibly be included in the specifications of a new
MRF in advance of the end of life of the existing facility and the current waste collection and MRF
processing contracts end (in 2020).
Diversion Implications
For the purpose of this study, the effect on diversion from adopting an enhanced approach is projected
to reach 65% diversion by 2021. This would extend the life of the landfill until about the year 2044. As
noted, some options provide greater opportunity to increase diversion than other options. An important
consideration in determining the impact on diversion of implementing the options in the enhanced
scenario is that the range of diversion impacts is not cumulative. As one option is implemented, it can
affect the diversion potential of another option by managing part or the entire waste stream that the
subsequent option was to address.
14
While the Enhanced approach provides average annual savings of approximately $2,400,000, the planning period system costs are higher than Status Quo because more recyclable and organic material are being processed, which have higher costs than disposal.

2012 Solid Waste Management Master Plan
38
Table 9: Potential Diversion Rates from Enhanced Approach Options (Mature System)
Program Option Range of Residential Diversion Impact*
Targeted education 12.0% to 17.6%
Incentives Unknown
Focus on commercial sector 2% to 3%
Residential C&R materials 0.02% to 3.9%
Focus on multi-residential 5.8% to 8.1%
New materials to programs 5.4% to 16.4%
Continued EPR Minimal
Multi-municipal processing N/A
Reduced Collection Frequency 4.0% to 6.0%
Resulting Maximum Diversion Rate 65% - 70%
* Ranges dependent on capture rates of materials. Lower range represents capture rates of 85% for recyclables and organics
and 75% for other materials. The higher range represents all of the available material being captured.
4.4.1.3 Maximized Approach
Alternatively, the City could take a more aggressive approach to implementing the proposed SWMMP
directions. For the purpose of this assessment, a maximized system would consist of implementing all of
the options listed under the proposed SWMMP directions (see Figure 8).
Figure 8: Maximized Approach to Implementation of Directions
In addition to the continuation and expansion of the existing waste diversion system, the maximized
scenario involves major additions to the current system that could further increase diversion. The three

2012 Solid Waste Management Master Plan
39
components of the maximized scenario that will have a direct impact on increasing the residential
diversion rate would be automated single stream collection, enforcement of waste management by-
laws and providing greater opportunities for the public to divert their waste from disposal. The effect of
the Zero Waste policy at municipal buildings in the Maximized scenario will not be measured in the
residential diversion rate, but will increase the City’s overall diversion rate and reduce waste being
disposed.
Environmental Net Effects
Where the options that would be implemented using an Enhanced Approach are generally expansions of
existing programs, those included in the Maximized Approach are generally new programs that would
require greater resources to implement. With mitigative measures, no negative impacts on the
environment would be expected.
All of the options would increase the amount of waste recycled, which would therefore reduce the
negative impacts associated with obtaining raw resources for new products. Increasing the amount of
organic material diverted (i.e., composting instead of landfilling) reduces GHG emissions, reduces
impacts on the landfill by removing organics that increase leachate strength, and returns a beneficial
product to the soil. One option in the Maximized Approach scenario (the new reuse centre) could have
some potential negative effects on the environment, depending on siting requirements and location
availability. However, through mitigation techniques and proper planning, design, construction best
practices and traffic management, a new reuse centre could result in a low or no net environmental
effect.
The automated single-stream recycling option has a positive net environmental benefit from a number
of aspects. Experience in Ontario municipalities has shown that single-stream recycling increases
program participation and in turn increases waste diverted from landfills. This leads to increased
environmental benefits by reducing the negative impacts associated with obtaining the raw materials
for new products and increasing landfill capacity.
Social Net Effects
Depending on the options selected, the social net effects can be either positive, neutral or negative for
the Maximized scenario.
The additional enforcement of disposal regulations could have negative social net effects as
residents and businesses may perceive this as over-regulation and potentially an invasion of
privacy, depending on the enforcement method used and the consequences applied.
Alternatively, it could also demonstrate positive effects by curbing illegal dumping and
promoting responsibility for managing one’s own waste.
The establishment of a new reuse center/store would have a positive social net effect as it
would increase the level of waste management service for residents, especially if located in an
area currently under-serviced. A potential negative social net effect could be applied to

2012 Solid Waste Management Master Plan
40
residents who are located in the immediate vicinity of such a facility, especially if it is perceived
as a “waste management” facility in its usual negative context. However, it is assumed this could
be mitigated by locating the facility in an area zoned for such a use, and then properly sited,
designed and built.
Automated single-stream recycling should have a positive social net effect, as it would make
recycling even easier for residents by not requiring them to separate recyclables into two
streams, as currently required.
Implementing programs to achieve zero waste at municipal buildings would also have positive
social net effects, as it would also be an educational process applied to municipal employees
and users of the municipal facility, who could then transfer this knowledge and changed
behaviour to their own homes and businesses, thus fostering waste minimization and increasing
diversion.
Economic Net Effects
Similar to the Enhanced Diversion scenario, the economic impact of the Maximized Diversion scenario
has been considered with and without bi-weekly garbage collection. The total cost to implement the
Maximized Diversion scenario without bi-weekly garbage collection over the 25-year planning period is
$750 M (with a net present value of $496 M). This is a $107 M increase over the Status Quo. These costs
include the operating and capital costs included in the Status Quo and Enhanced scenarios, plus capital
costs for:
Implementing a zero waste policy at municipal buildings;
Establishing an additional CRC/Reuse centre; and
Upgrading the replacement MRF for single-stream recycling.
There may be a small increase in cost for disposal as single-stream recycling programs generally
generate higher amounts of process residual (8% to 10%) compared to two-stream approaches (3% to
5%). The total cost to implement the Maximized Diversion scenario with bi-weekly garbage collection
over the 25-year planning period is $726 M (with a net present value of $482 M). This is an $83 M
increase over the Status Quo.
Diversion Implications
For the purpose of this study, the effect on diversion from implementing the maximized scenario is
projected to reach 75% diversion by 2021. This would help extend the life of the Glanbrook Landfill until
about 2048. As noted, some options provide greater opportunity to increase diversion than other
options. Similar to the enhanced scenario, the range of options are not necessarily cumulative. For
example, increased diversion by implementing automated single-stream recycling, could result in less
diversion realized through additional enforcement because it is captured in the automated single-
stream recycling process.
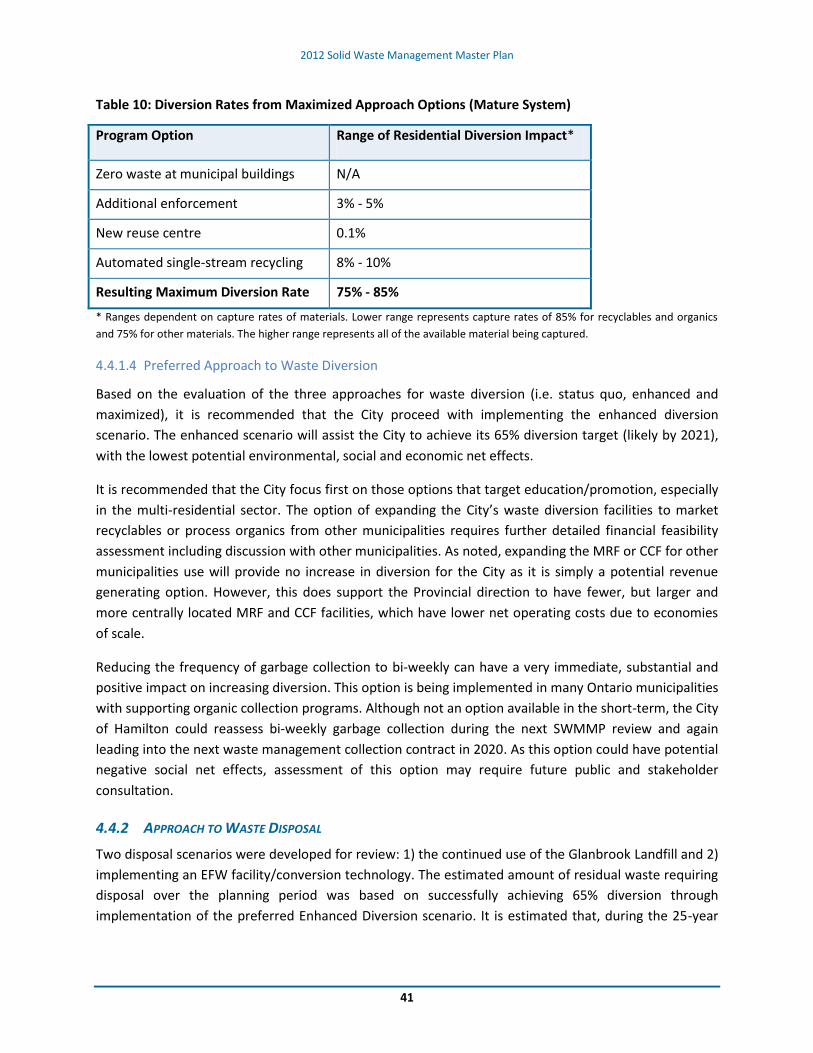
2012 Solid Waste Management Master Plan
41
Table 10: Diversion Rates from Maximized Approach Options (Mature System)
Program Option Range of Residential Diversion Impact*
Zero waste at municipal buildings N/A
Additional enforcement 3% - 5%
New reuse centre 0.1%
Automated single-stream recycling 8% - 10%
Resulting Maximum Diversion Rate 75% - 85%
* Ranges dependent on capture rates of materials. Lower range represents capture rates of 85% for recyclables and organics
and 75% for other materials. The higher range represents all of the available material being captured.
4.4.1.4 Preferred Approach to Waste Diversion
Based on the evaluation of the three approaches for waste diversion (i.e. status quo, enhanced and
maximized), it is recommended that the City proceed with implementing the enhanced diversion
scenario. The enhanced scenario will assist the City to achieve its 65% diversion target (likely by 2021),
with the lowest potential environmental, social and economic net effects.
It is recommended that the City focus first on those options that target education/promotion, especially
in the multi-residential sector. The option of expanding the City’s waste diversion facilities to market
recyclables or process organics from other municipalities requires further detailed financial feasibility
assessment including discussion with other municipalities. As noted, expanding the MRF or CCF for other
municipalities use will provide no increase in diversion for the City as it is simply a potential revenue
generating option. However, this does support the Provincial direction to have fewer, but larger and
more centrally located MRF and CCF facilities, which have lower net operating costs due to economies
of scale.
Reducing the frequency of garbage collection to bi-weekly can have a very immediate, substantial and
positive impact on increasing diversion. This option is being implemented in many Ontario municipalities
with supporting organic collection programs. Although not an option available in the short-term, the City
of Hamilton could reassess bi-weekly garbage collection during the next SWMMP review and again
leading into the next waste management collection contract in 2020. As this option could have potential
negative social net effects, assessment of this option may require future public and stakeholder
consultation.
4.4.2 APPROACH TO WASTE DISPOSAL
Two disposal scenarios were developed for review: 1) the continued use of the Glanbrook Landfill and 2)
implementing an EFW facility/conversion technology. The estimated amount of residual waste requiring
disposal over the planning period was based on successfully achieving 65% diversion through
implementation of the preferred Enhanced Diversion scenario. It is estimated that, during the 25-year

2012 Solid Waste Management Master Plan
42
planning period (2012 to 2036), 3,573,000 tonnes of waste will require management by a disposal
method based on the Enhanced Diversion scenario. This waste includes:
Residential Waste: 2,481,000 tonnes
lCl Waste: 825,000 tonnes; and
Grit and Street Sweepings: 267,000 tonnes.
It is noted that the life of the Glanbrook Landfill is based on the ICI waste generated in the City of
Hamilton continuing to be managed by the private sector throughout the planning period. If
circumstances arose (such as a border closure to export of waste from Ontario) that caused the ICI
sector to lose its sources of disposal at private facilities, thereby putting pressure on municipal disposal
facilities, then the capacity at the landfill could be in jeopardy. In the event of these circumstances, the
City could consider measures to minimize an influx of business waste into the Glanbrook landfill (e.g.,
raising tipping fees for business waste or requiring waste streams to be properly separated).
4.4.2.1 Glanbrook Landfill Disposal Scenario
Under this scenario, the City would continue to dispose of waste at the Glanbrook Landfill. The City
estimated that, at the beginning of 2011, approximately 5,039,000 tonnes of disposal capacity remained
at the Glanbrook Landfill. By achieving the 65% diversion target through implementation of the
Enhanced Diversion scenario, the Glanbrook Landfill could provide disposal capacity for the next 33
years to 2044. This would meet the requirements of the current planning period with an additional 8
year capacity remaining beyond 2036. However, one of the objectives of the City Is to ensure that new
capacity is investigated while there is still adequate time (i.e. there is at least 10 years or more disposal
capacity left at the Glanbrook Landfill). In consideration of a 10-year planning process to establish new
landfill capacity, the City will need to start the process to replace the existing landfill with new landfill
capacity by 2024.
Environmental Net Effects
Since the continued use of the Glanbrook Landfill is the current means of disposing of waste, it in effect
represents the “status quo” disposal scenario. Therefore, the environmental net effects are predictable
and are those as currently known through operation of the existing landfill site. The Glanbrook Landfill
will provide for disposal capacity beyond the current planning period, and therefore, no new
environmental effects would be experienced by having to open a new disposal facility during the
planning period based on this scenario.
Social Net Effects
Similar to the environmental net effects, the social net effects are those currently experienced by the
operation of the Glanbrook Landfill. The site would continue as designed and operated. Although the
Glanbrook Landfill will provide for disposal capacity beyond the current planning period, social net
effects will be experienced as the City begins the process to site a new landfill facility, beginning in 2024,
which is within the current 25-year planning period.
2012 Solid Waste Management Master Plan
43
Economic/Financial Net Effect
The City of Hamilton 2010 Budget (Actual) indicates that the cost for garbage collection (including the
City’s administration costs) was approximately $98/tonne. Similarly, the cost for garbage transfer and
disposal was approximately $58/tonne, for a total of about $156/tonne. The total cost for garbage
collection and transfer and to continue landfilling at the Glanbrook Landfill for the 25-year planning
period while implementing the Enhanced Diversion scenario (i.e. diverting 65% of waste by 2021) is
approximately $501 M (with a net present value of $344 M).
When the cost of disposal is combined with the preferred diversion scenario (enhanced with bi-weekly
collection), the total waste management system cost over the 25-year planning period is about $1.211
Billion, with a net present value of approximately $813 M.
Mechanical/Biological Treatment
One alternative for the Glanbrook landfill operations could be the inclusion of Mechanical/Biological
Treatment (MBT) prior to placement of the waste in the landfill. The MBT process leads to the
stabilization of waste prior to disposal. Stabilizing waste essentially involves a ‘composting’ like process
which results in much lower levels of TOC (Total Organic Carbon), COD (Chemical Oxygen Demand) and
nitrogen content, lower levels of organic matter and less landfill gas production. The City of Hamilton, in
conjunction with Niagara Region and the City of Toronto, undertook a study on landfill stabilization
(March 2007). The study examined stabilized landfills in Europe and Canada.
With respect to incorporating MBT into the current Glanbrook Landfill operations:
• Additional Stabilization “processing capacity” will be required. This could be at the current
Hamilton CCF or a new facility at the Glanbrook Landfill site. Establishing a new facility at the
landfill would reduce transportation/haul costs.
• A significant amount of un-stabilized waste already exists at the Glanbrook Landfill from the
many years of operation. The environmental benefits of implementing MBT/stabilization in the
remaining disposal area would not be realized because of the amount of un-stabilized waste
already in the site.
• Cost estimates from other MBT stabilization/disposal facilities are in the order of $50/tonne.
This would represent a significant increase compared to the cost to currently operate the
Glanbrook Landfill. This could represent an additional $124,000,000 in landfill disposal costs
over the 25-year planning period.
4.4.2.2 Alternative Disposal Technology Scenario
In recent years, the City of Hamilton has undertaken a number of studies to consider the establishment
of an EFW type facility. This has included in the Hamilton-Niagara WastePlan process (2005 to 2009), as
well as most recently, the Hamilton Utilities Corporation (HUC) proposal (2010) to establish an EFW
facility in conjunction with the use of the Glanbrook Landfill. The HUC study has been used as the basis
for determining the net effects of an EFW facility for this disposal scenario, as it was a very recent and
comprehensive report with detailed financial information. A number of different scenarios were
2012 Solid Waste Management Master Plan
44
evaluated in the HUC study that considered facility size, use of ash for landfill cover and aggregate and
for different diversion scenarios. For the purposes of this evaluation, the base case scenario of a 100,000
tonne/year facility with 65% diversion was used, and the evaluation includes a broader range of waste
conversion or Alternative Disposal Technologies (ADT) than simply incineration.
Environmental Net Effects
Net environmental effects would mostly be related to the siting of an ADT facility and potential air
impacts from the facility operation. The Glanbrook Landfill would be used as the disposal site for ash, as
well as process residuals, non-combustibles, street sweepings and waste water treatment plant (WWTP)
grit, material received beyond the ADT facility capacity and for disposal during times of facility
shutdown. The use of the Glanbrook Landfill for the disposal component of the ADT scenario is
considered neutral compared to the status quo disposal scenario of using only the Glanbrook Landfill.
Social Net Effects
One of the major effects from the establishment of an ADT facility/conversion technology is the
potential negative social net effects related to the siting of the facility. The siting of any new waste
management facility can be very controversial and very divisive in the community. There are both real
and perceived negative social net effects through the establishment of an ADT facility. The real effects
can be experienced by residents and businesses in the vicinity of where the facility is proposed and the
introduction of traffic to that facility.
The perceived impacts can be experienced by stakeholders who, although not living/working in the
immediate vicinity of the proposed ADT facility, may be fundamentally opposed to ADT facilities and will
express this during the required planning, approvals and consultation process. Those stakeholders
would also be joined by residents and business owners who may be directly impacted through the siting
process of where a facility may be located.
Economic Net Effects
The HUC study concluded that establishing an EFW facility in conjunction with the continued use of the
Glanbrook Landfill was financially a better option than continuing to use the Glanbrook Landfill only for
disposal. Some of the major conclusions from the HUC study relevant to this system analysis were that:
• The estimated cost to establish and operate a 100,000 tonne/year EFW facility and utilize the
Glanbrook Landfill for ash and other disposal was approximately $168/tonne. However,
significant revenues were identified from greenhouse gas emission credits, energy sales and
metal recovery that decreased the cost to approximately $100/tonne. Relative to the cost for
operating the Glanbrook Landfill, the EFW scenario has a higher net cost.
• The HUC report also identified a significant value in the remaining capacity of the Glanbrook
Landfill. By reducing the volume of material requiring disposal through the incineration process,
the Glanbrook Landfill would last significantly longer. (i.e., more than 100 years capacity). The
HUC report concluded that the economics of the EFW scenario could be further enhanced by

2012 Solid Waste Management Master Plan
45
marketing the excess capacity available beyond that required by the City of Hamilton beyond
2074.
In undertaking this systems analysis, the financial evaluation was revised to consider changes compared
to the HUC study. The HUC study was completed in 2010, yet assumed a facility could be built over 3
years (2011 to 2013) and be operational by 2014. This assumption had a significant bearing on the
feasibility of the HUC proposal because of the assumed remaining disposal capacity that could be
available to market and the value of that capacity. This assumption was based on a site having already
been secured. For the systems evaluation, the following assumptions on timing were considered:
• The planning and approvals process for an ADT would take a minimum seven years to complete.
York-Durham reports that it began its planning process in 1999 and is not expect to have its EFW
facility operational until 2013 (i.e. 14 years).
• The design and construction process will be at least three years.
• It was considered that this process would not begin for five years, until the next SWMMP update
to allow the City to observe how the York-Durham facility was completed, how it is operating for
a few years, and actual cost to construct and operate.
Therefore, for the purposes of this systems evaluation, it was assumed that an ADT facility for Hamilton
could be operational about 2027. This has a significant impact on the value of the remaining capacity of
the Glanbrook Landfill as 13 more years of waste would have been disposed at the site compared to the
HUC study assumptions. The HUC study estimated that 4,600,000 m3 of airspace would remain at the
Glanbrook Landfill at the end of the planning period (i.e. 2036). However, by estimating a date of 2027
for an ADT facility to be operational, the remaining airspace at 2036 is reduced to 1,570,000 m3.
Most of this remaining airspace would be required for the City’s disposal needs for ash, non-combustible
waste, street sweepings and WWTP grit, disposal during ADT facility shutdown/maintenance periods
and for waste requiring disposal beyond the capacity of the ADT facility. The ability to market the excess
Glanbrook Landfill capacity would be eliminated. The estimated cost for the ADT scenario over the
planning period is approximately $583 M (with a net present value of $390 M). This is approximately
$82M higher than the Glanbrook Landfill scenario for the planning period.
When the cost of incorporating an ADT facility into Hamilton’s disposal system (with continued use of
Glanbrook Landfill for ash disposal and non-combustibles) is combined with the preferred diversion
scenario (including bi-weekly garbage collection implemented in 2020), the total waste management
system cost over the 25-year planning period is about $1.293 B (with a net present value of
approximately $859 M).
4.4.2.3 Identification of Preferred Disposal Scenario
The evaluation of the disposal scenarios determined that there were greater net effects from the ADT
scenario than the Glanbrook Landfill scenario. However, the Glanbrook Landfill is a finite resource that
will eventually reach capacity whether it is used with or without an ADT facility. Therefore, the City will
eventually need to consider establishing additional long-term disposal capacity and this process will

2012 Solid Waste Management Master Plan
46
need to begin within the 25-year planning period. By implementing the enhanced diversion scenario,
remaining landfill capacity is in the order of 33 years. Therefore, the immediate ‘need’ for additional
capacity has not been established, especially in the context of Environmental Assessment Act approval
requirements. The preferred disposal scenario resulting from this analysis is only recommended for the
short term (i.e. the next five years) until the next SWMMP update is undertaken.
4.5 PREFERRED WASTE MANAGEMENT SYSTEM
The preferred waste management system recognizes the expressed public desire to continue to move
forward on a path that supports waste diversion and includes the Enhanced waste diversion scenario in
conjunction with the use of the Glanbrook Landfill for disposal for the next 5 years. The public
consultation suggested that the Enhanced Approach to diversion could accomplish this, although it is
recognized that some components of the approach such as bi-weekly garbage collection will not be
realized in the next 5 years. Similarly there are aspects of the Maximized Approach (which received
public support) that could be initiated within the next 5 years. For example, assessing the feasibility of
single-stream recycling could be included in the planned MRF lifecycle replacement process.
Therefore, the study proposes that the Preferred Waste Management System include the components
in the Table 11 15.
Table 11: Preferred Waste Management System
Program Option Range of Residential Diversion Impact
Targeted education 12.0% to 17.6%
Incentives Unknown
Focus on commercial sector 2 to 3%
Residential C&R materials 0.02% to 3.9%
Focus on multi-residential 5.6% to 8.1%
New materials to programs 5.4% to 16.4%
Continued EPR Unknown
Multi-municipal processing (requires CCF capacity review)
N/A
Assessment of MRF capacity and single stream processing
N/A
Resulting Maximum Diversion Rate 65% - 70%
Consideration to expanding the MRF and CCF and attracting recyclable/SSO material from other
municipalities as a revenue generating source requires further evaluation and discussion to determine
the feasibility of this option.
15
It is acknowledged that there are other capital or study initiatives planned by Public Works that will contribute to the Guiding Principles, Goals and Objectives of the SWMMP, such as a review of the Transfer Station/Community Recycling Centres.

2012 Solid Waste Management Master Plan
47
The preferred disposal option is to continue to use the Glanbrook Landfill for the next five-year period.
This recognizes the significant remaining disposal capacity at the site, but also recognizes that this is a
finite resource, and the City will need to plan for future disposal capacity in the near future given the
time it takes to complete the planning and approvals process.
Table 12 outlines the estimated cost to implement the preferred enhanced diversion program (with bi-
weekly garbage collection implemented in 2020) in conjunction with either continuing with the
Glanbrook Landfill for long-term disposal or implementing an ADT facility.
Table 12: Waste Management System Costs for the 25-Year Planning Period (2012 – 2036)
System Component Total Cost Net Present
Value Cost
Enhanced System with Glanbrook Landfill
Enhanced Diversion $733 M $483 M
Glanbrook Landfill $501 M $344 M
Total $1.211 B $813 M
Enhanced System with ADT
Enhanced Diversion $733 M $483 M
ADT $583 M $390 M
Total $1.293 B $859 M
4.5.1 LIFE CYCLE OBSERVATIONS
A life cycle assessment (LCA) is an analytical tool for the evaluation of impacts over the entire life cycle
of a product or process and on the environment as a whole. The following identifies the life cycle
observations relative to the preferred system.
4.5.1.1 Diversion
Broad life cycle impact reductions/improvements can be seen as a result of the Enhanced Diversion
scenario. Recycling and composting materials are better approaches than waste disposal at mitigating
the life cycle environmental impacts associated with products and materials in the waste stream.
Recycling and composting have life cycle benefits such as using less landfill space and decreasing the
production of new materials using raw materials. Recycling and composting also reduce greenhouse gas
emissions (GHGs) and energy consumption resulting from landfill operations and the production of new
materials. Life cycle impacts generally reduce as diversion and capture rates increase. Implementing bi-
weekly garbage collection also reduces overall life cycle impacts by reducing the overall number of
collection vehicles used in the waste collection system.
2012 Solid Waste Management Master Plan
48
4.5.1.2 Disposal
Generally, ADT facilities have fewer life cycle impacts than landfills including impacts from GHGs,
generation of energy and emissions to water. These impact reductions are described below.
4.5.1.2.1 Greenhouse Gas Emissions
In comparison to the Glanbrook Landfill scenario, an ADT facility scenario would produce less net GHGs.
This is because fewer raw materials would be disposed of at the Glanbrook Landfill if ADT were in place,
which could lead to a decrease in the amount of GHG emissions (specifically methane) produced
through anaerobic decomposition of waste within the landfill, even when considering the gas collection
system. In addition, if the ADT were capable of generating energy, GHG reductions would result from
displacing electrical energy production from other sources as well as from the recovery and recycling of
metals salvaged from the bottom ash.
4.5.1.2.2 Generation of Energy
Depending on the technology selected, an ADT facility could potentially produce enough energy to meet
its own internal energy needs and still have additional energy to be able to export energy off-site. This
would also offset the need for energy production from other sources. In addition, some types of ADT
allow for the recovery and recycling of metals salvaged from processing residues (e.g., bottom ash from
waste conversions, recoveries from mechanical waste separators, etc), which would also save the
energy that would otherwise be used in the mining and production processes of new raw materials.
4.5.1.2.3 Emissions to Water
Depending on the technology selected, an ADT facility could potentially reduce the amount of emissions
to water, and would reduce the amount of untreated municipal waste being disposed of via landfill. This
would reduce the likelihood that leachate containing contaminants would be released from the landfill
site. The type of waste residue from the ADT facility would depend on the type of ADT facility used.
5 CONCLUSION AND RECOMMENDATIONS
The City of Hamilton’s review of the 2001 SWMMP was an 18 month process that included consultation
with stakeholders and the public on the guiding principles, goals and objectives and program options
that will guide how the City manages its waste for the next 25 years. The 2012 SWMMP Guiding
Principles build upon those from the 2001 SWMMP and have been updated to include the community’s
philosophy and the provincial waste management value chain of reduce, reuse, diversion and disposal.
The review showed that the City of Hamilton has a robust residential solid waste management system
that currently diverts 49% of waste and at status quo should achieve a 55% waste diversion rate by 2021
as its existing programs mature.
In addition to providing direction on moving the City beyond 65% waste diversion, feedback from the
public and results from the gap analysis will provide City staff with grass-roots suggestions and data to
assist with implementation of the new directions. The goals and objectives developed through this
process will help to ensure that the directions align with the pillars of sustainability (social,

2012 Solid Waste Management Master Plan
49
environmental and economic). They reflect the community’s desire for a waste management system
that is accessible to all Hamiltonians, including how promotion is carried out and how the program is
delivered to households. The goals and objectives also reflect the need for Hamilton’s waste
management system to optimize its economic opportunities and efficiencies.
To help the City meet and exceed the target of 65% waste diversion, enhancement of existing facilities
and the development of new facilities will have to be considered at key points. The following
recommendations form the basis of the 2012 SWMMP:
1. Implement the “enhanced approach” to waste diversion, which may include:
Targeted education;
Focusing on the multi-residential and commercial sectors;
Managing construction and renovation materials;
Adding materials to the recycling programs where feasible;
Continued lobbying for Extended Producer Responsibility;
Municipal processing partnerships; and
Reduced garbage collection frequency in 2020.
2. Undertake a feasibility study in 2013 of expanding capacity at the Central Composting Facility (CCF).
3. Undertake a feasibility study in 2017 of Single Stream processing and expansion of capacity at the
Materials Recycling Facility (MRF).
4. Undertake an operational review and needs analysis in 2017 of Transfer Stations and Community
Recycling Centres.
5. Undertake a Five Year Review of the SWMMP in 2017.
6. Use the Glanbrook Landfill for disposal for 5 years, and consider alternative disposal capacity in the
next SWMMP review in 5 years.
7. Merge the advisory roles of the SWMMP Steering Committee and the Waste Reduction Task Force.
8. In the implementation of these recommendations, consideration will be given to the potential
impacts on illegal dumping.
The proposed timeline for implementing a number of these recommendations is contained in Figure 9.

2012 Solid Waste Management Master Plan
50
Figure 9: Timeline for Facility Review and Development