city of guelph – 2012 community profile...
TRANSCRIPT

City of Guelph 2012 Community Profile
Economic Development, Finance & Enterprise Services City Hall, 1 Carden Street Guelph, ON N1H 3A1 Tel: 519-837-5600 Fax: 519-837-5636 E: [email protected] www: guelph.ca/biz

Table of Contents
Introduction ..................................................................................................................................... 4 Welcome To Guelph .................................................................................................................... 4 A Diverse Community .................................................................................................................. 4 In The Heartland of Canadian Business ....................................................................................... 4
Location .......................................................................................................................................... 5 Distances from Guelph ................................................................................................................ 5
Demographics ................................................................................................................................. 6 Current Population Data .............................................................................................................. 6 Population by Age & Sex ............................................................................................................. 7 Wellington County Map ................................................................................................................ 8 Wellington County Population ...................................................................................................... 8
Education ........................................................................................................................................ 9 Elementary & Secondary School Locations ................................................................................. 9 Post-Secondary Education ........................................................................................................ 10
Housing ......................................................................................................................................... 11 Residential Building Permits ...................................................................................................... 11 Residential Construction Values ................................................................................................ 11 Guelph Housing Stock ............................................................................................................... 11 Private Households .................................................................................................................... 12 Households by Household Size ................................................................................................. 12 New Residential Units ................................................................................................................ 12 Personal Income (Persons 15 Years & Over) ............................................................................ 13 Personal Income Distribution by Income Class .......................................................................... 13 Private Household Income ......................................................................................................... 14 Private Household Income Distribution by Income Class ........................................................... 14
Labour Force ................................................................................................................................. 15 Labour Force by Industry (NAICS) ............................................................................................. 15 Highest Level of Schooling ........................................................................................................ 15 Labour Force by Occupational Category (NOCS) ...................................................................... 16 Labour Force Activity ................................................................................................................. 16 Sample Wages by Hourly Wage and Salary .............................................................................. 17
Transportation ............................................................................................................................... 18 Highway ..................................................................................................................................... 18 Rail ............................................................................................................................................ 18 Air .............................................................................................................................................. 18
Table of Contents
Table of Contents
Water ......................................................................................................................................... 18 Customs .................................................................................................................................... 18
Communications ........................................................................................................................... 18 Services and Facilities ............................................................................................................... 19 Medical Facilities ....................................................................................................................... 19 Police and Fire Protection .......................................................................................................... 19 Religious Services ..................................................................................................................... 19 Shopping Services ..................................................................................................................... 19 Recreation ................................................................................................................................. 19 Culture ....................................................................................................................................... 19
Business Statistics ........................................................................................................................ 20 Major Guelph Employers ........................................................................................................... 20 Distribution of Businesses by Number of Employees ................................................................. 22 Distribution of Businesses by Year Established ......................................................................... 22 Distribution of Businesses by Export Activity .............................................................................. 22 Distribution of Businesses by Industry (NAICS) ......................................................................... 23 Distribution of Manufacturing Businesses by Industry (NAICS) .................................................. 24
Table of Contents

Introduction Welcome To Guelph The City of Guelph is a growing, diverse and vibrant community with a well educated population of over 120,000 people. Guelph citizens take pride in the city’s rich heritage which dates back to the early 1800’s. Historic buildings, museums and heritage homes, located in various neighbourhoods around the city, allow a first hand glimpse at the Royal City’s great history. Today, the City of Guelph is a centre for institutions focusing on agriculture and life sciences, with the advanced manufacturing, technology economy and environmental technology sectors maintaining a strong presence. A Diverse Community A multitude of commercial, industrial and service organizations as well as a number of government and educational facilities make up the city’s economic community. From world leaders in advanced manufacturing to innovative agri-food start-ups, Guelph is host to a variety of successful enterprises. Guelph citizens enjoy the comforts of a small town and the luxuries of a big city. The River Run Centre, the city’s superb performing arts centre, The Sleeman Centre and numerous cultural festivals share the city with golf courses, nature trails and conservation areas. A focus on sustainable growth ensures the city’s prosperity while maintaining a healthy community atmosphere. In The Heartland of Canadian Business The City of Guelph is strategically located in the heart of southern Ontario, only 100 kilometres (60 miles) from the City of Toronto. Guelph features a diversified industrial base including agri-food, life science, IT, environmental enterprise, automotive and advanced high-technology industries. The University of Guelph is world renowned for its research and development facilities including its unique Research Park, a cluster of government and industry focusing on agri-food research. Additionally, a strong service industry sector combines to make Guelph an ideal launch pad to supply goods and services to millions of consumers and businesses in both the Canadian and American markets. Guelph offers many advantages to both new and expanding businesses. The list includes zoned and serviced lands in both the public and private sectors and a supply of existing industrial space. A skilled and productive labour force of over 275,000 people is available from the area at competitive wage rates. Guelph brings together all the advantages of location, resources and quality of life by providing a highly desirable location for business and a great place to enjoy life.
Introduction
3

Location The City of Guelph is located in south central Ontario, 100 kilometres (60 miles) from the City of Toronto. This strategic location provides a convenient launch pad to supply goods and services to millions of consumers in both Canada and the United States. Over 60% of Canadians and 40% of Americans live within 800 kilometres (500 miles) of Guelph. Expressways link Guelph to Highway #401, and Guelph is a single day's drive, or less, to major centres in both countries. Lester B. Pearson International Airport (Toronto International Airport), and the deep water seaports of Toronto and Hamilton, offer easy links to international markets.
Distances from Guelph
Canadian Destinations
Distance U.S. Destinations
Distance
Km Miles Km Miles
Hamilton 37 23 Boston 810 503
Kitchener 23 14 Buffalo 170 105
London 132 82 Chicago 760 472
Montreal 612 380 Cleveland 475 295
Ottawa 467 290 Detroit 315 196
Toronto 100 60 New York 885 550
Windsor 312 194 Pittsburgh 547 340
Location
4

Demographics Current Population Data
Population
2010 Census 121,688
Population Density
Land Area 87.20 Km2
Population Density 1395.4 / Km2 Sources: Statistics Canada 2010 Census
Population Growth & Projections
Year Population Population Change
1971 60,087 --
1976 67,540 7,453
1981 71,207 3,667
1986 78,235 7,028
1991 88,444 10,209
1996 95,821 7,377
2001 106,170 10,390
2006 114,943 8,773
2011 125,770 10,057
2016 137,000 12,000
2021 148,000 11,000
2026 158,000 10,000
2031 169,000 11,000
Projections
Sources: Statistics Canada 2006 Census, City of Guelph Planning Services Projections 2010
Demographics
5

Population by Age & Sex
Age Both Sexes Male Female
Number % of Total Number % of Total Number % of Total
0 to 4 6,875 6.0 3,485 6.2 3,390 5.7 5 to 9 6,960 6.0 3,525 6.3 3,435 5.8
10 to 14 7,335 6.4 3,820 6.8 3,515 6.0 15 to 19 7,565 6.6 3,835 6.8 3,730 6.3 20 to 24 9,190 8.0 4,460 8.0 4,730 8.0 25 to 29 8,555 7.4 4,305 7.7 4,255 7.2 30 to 34 8,470 7.4 4,115 7.4 4,350 7.4 35 to 39 8,620 7.5 4,330 7.7 4,295 7.3 40 to 44 9,550 8.3 4,775 8.5 4,775 8.1 45 to 49 8,960 7.8 4,350 7.8 4,605 7.8 50 to 54 7,555 6.6 3,665 6.6 3,895 6.6 55 to 59 6,440 5.6 3,105 5.6 3,330 5.6 60 to 64 4,615 4.1 2,185 3.9 2,430 4.1 65 to 69 3,575 3.1 1,635 2.9 1,940 3.3 70 to 74 3,330 2.9 1,470 2.6 1,855 3.1 75 to 79 3,145 2.7 1,340 2.4 1,805 3.1 80 to 84 2,395 2.1 925 1.7 1,470 2.5
85 + 1,820 1.5 615 1.1 1,210 2.1
Total 114,945 100.0% 55,940 100.0% 59,015 100.0% Source: Statistics Canada 2006 Census
0
1,000
2,000
3,000
4,000
5,000
0 to 4
5 to 9
10 to 14
15 to 19
20 to 24
25 to 29
30 to 34
35 to 39
40 to 44
45 to 49
50 to 54
55 to 59
60 to 64
65 to 69
70 to 74
75 to 79
80 to 84
85 +
Population Age Range by Sex
Males Females
Demographics
6

Wellington County Map
Wellington County Population
Location Population
Townships
Centre Wellington 26,693
Guelph/Eramosa 12,380
Mapleton 9,989
Puslinch 7,029 Town of Erin 10,770 Town of Minto 8,334 Wellington North 11,477
Towns
Village of Elora 5,500
Town of Fergus 12,500
Town of Mount Forest 5121
Total 85,452 Source: Statistics Canada 2010 Census
Demographics
N
Town of Erin
City of Guelph
Township of Wellington
North
Town of Minto Township of
Mapleton
Township of Centre
Wellington
Township of Guelph-Eramosa
Township of
Puslinch
7

Education Elementary and secondary school education is provided through the Upper Grand District School Board and the Wellington Catholic District School Board. French Immersion programs and preschool facilities - academic, nursery and kindergarten, are also available. Elementary & Secondary School Locations
Legend
Upper Grand District School Board Elementary Schools Secondary Schools
Wellington Catholic District School Board Elementary Schools Secondary Schools
Education
8

Post-Secondary Education University of Guelph
Seven Colleges - Arts, Biological Science, Physical and Engineering Sciences, Social and Applied Human Science, Management and Economics, Ontario Agricultural College and the Ontario Veterinary College. The university has a population of approximately 18,000 undergraduate and 1,900 graduate students, with over 750 faculty members.
University of Waterloo
Six Faculties - Engineering, Mathematics, Science, Environment, Applied Health Sciences, and Arts. U of W has an annual enrolment of approximately 30,000 students and 800 faculty members.
Wilfrid Laurier University
5 Faculties - Arts and Science, Music, Business and Economics, Graduate Studies and Social Work. Current enrolment is approximately 8,600 undergraduates, 500 graduate students, 2,100 part-time students and 365 faculty members.
Other Universities
In addition to the above Universities, five other major Canadian Universities are within an hour's drive of Guelph - McMaster University (Hamilton), University of Western Ontario (London), York University (Toronto), Ryerson Polytechnic University (Toronto) and the University of Toronto.
Conestoga College Institute of Technology & Advanced Learning
The main areas of focus at Conestoga College are Applied Arts, Business, Health Science, Engineering Technology, and Trades. Conestoga offers 120 full time programs, 37 apprenticeships, 3 collaborative degree programs and 7 degree programs. The college has a population of approximately 38,000 part-time students, 8,500 full-time students, and 4000 students in apprenticeship programs. The graduate job placement rate for Conestoga College is an astoundingly high 94.2% six months after graduation. The Guelph Campus of Conestoga College is located in the northwest area of the City.
Education
9
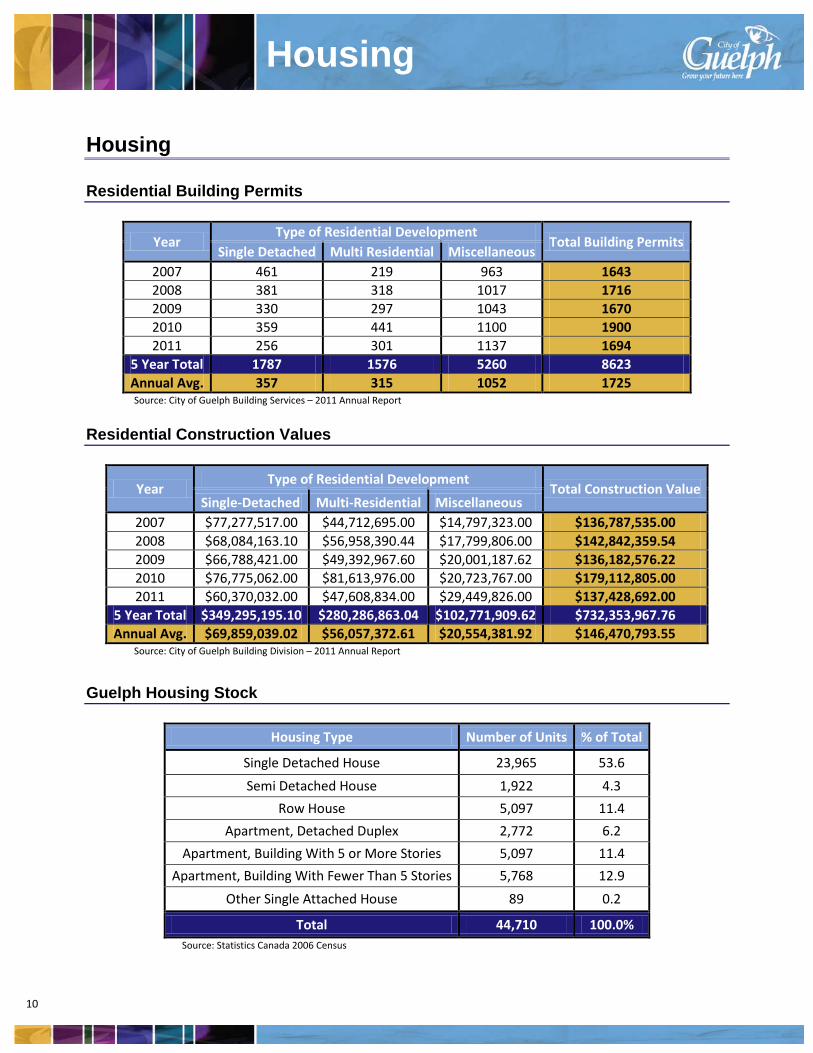
Housing Residential Building Permits
Year Type of Residential Development
Total Building Permits Single Detached Multi Residential Miscellaneous
2007 461 219 963 1643 2008 381 318 1017 1716 2009 330 297 1043 1670 2010 359 441 1100 1900 2011 256 301 1137 1694
5 Year Total 1787 1576 5260 8623 Annual Avg. 357 315 1052 1725 Source: City of Guelph Building Services – 2011 Annual Report
Residential Construction Values
Year Type of Residential Development
Total Construction Value Single-Detached Multi-Residential Miscellaneous
2007 $77,277,517.00 $44,712,695.00 $14,797,323.00 $136,787,535.00 2008 $68,084,163.10 $56,958,390.44 $17,799,806.00 $142,842,359.54 2009 $66,788,421.00 $49,392,967.60 $20,001,187.62 $136,182,576.22 2010 $76,775,062.00 $81,613,976.00 $20,723,767.00 $179,112,805.00 2011 $60,370,032.00 $47,608,834.00 $29,449,826.00 $137,428,692.00
5 Year Total $349,295,195.10 $280,286,863.04 $102,771,909.62 $732,353,967.76 Annual Avg. $69,859,039.02 $56,057,372.61 $20,554,381.92 $146,470,793.55
Source: City of Guelph Building Division – 2011 Annual Report
Guelph Housing Stock
Housing Type Number of Units % of Total
Single Detached House 23,965 53.6
Semi Detached House 1,922 4.3
Row House 5,097 11.4
Apartment, Detached Duplex 2,772 6.2
Apartment, Building With 5 or More Stories 5,097 11.4
Apartment, Building With Fewer Than 5 Stories 5,768 12.9
Other Single Attached House 89 0.2
Total 44,710 100.0% Source: Statistics Canada 2006 Census
Housing
10

Private Households
1996 2001 2006
Private Households 35,805 40,515 44,705
Population in Private Households 94,325 104,530 111,763
Average No. of Persons/ Private Households 2.6 2.6 2.5 Source: Statistics Canada Census 2006 Census
Households by Household Size
Persons in Household Number of Households % of Total
1 Person 11,300 25.3%
2 Persons 12,185 27.3%
3+ Persons 21,225 47.4%
Total 44,710 100.0% Source: Statistics Canada 2006 Census
New Residential Units
Source: City of Guelph Building Division – 2011 Annual Report
0
200
400
600
800
1000
1200
1400
1600
2001 2002 2003 2004 2005 2006 2007 2008 2009 2010 2011
1167 1186
1066
1407
907 860 920
1030
797
1088
627
Housing
11

Income Personal Income (Persons 15 Years & Over)
2001 2006
Average Personal Income $32,909 $38,059
Median Personal Income $27,230 $30,078 Source: Statistics Canada 2006 Census
Personal Income Distribution by Income Class
Income Group 2001 % of Total 2006 % of Total
Under $5,000 9950 10.7% 8905 10.0%
$5,000 - $9,999 8580 9.2% 7660 8.6%
$10,000 - $14,999 8670 9.3% 8085 8.0%
$15,000 - $19,999 7510 8.1% 7370 8.2%
$20,000 - $24,999 6890 7.4% 6310 7.1%
$25,000 - $29,999 6440 6.9% 6200 6.9%
$30,000 - $34,999 7030 7.6% 5910 6.6%
$35,000 - $39,999 6675 7.2% 5540 6.2%
$40,000 - $44,999 6160 6.6% 5585 6.2%
$45,000 - $49,999 3745 4.0% 4835 5.4%
$50,000 - $59,999 5885 6.3% 7290 8.1%
$60,000 and over 11,965 12.9% 15,775 17.6%
Total with Income 89500 96.4% 89,465 96.3%
Without Income 3330 3.6% 3460 3.7%
Total 92830 100.0% 92,930 100.0% Source: Statistics Canada 2006 Census
Income
12

Private Household Income
2001 2006
Average Household Income $66,410 $78,057
Median Household Income $57,523 $64,319 Source: Statistics Canada 2006 Census
Private Household Income Distribution by Income Class
Income Group 2001 % of Total 2006 % of Total
Under $5,000 810 1.8% 845 1.7% $5,000 - $9,999 855 1.9% 935 1.9%
$10,000 - $14,999 1955 4.4% 1635 3.4% $15,000 - $19,999 2150 4.9% 2110 4.3% $20,000 - $24,999 2185 4.9% 1900 3.9% $25,000 - $29,999 1960 4.4% 1905 3.9% $30,000 - $34,999 2240 5.1% 1970 4.1% $35,000 - $39,999 2365 5.4% 1960 4.0% $40,000 - $44,999 2425 5.5% 2175 4.5% $45,000 - $49,999 2055 4.6% 2200 4.5% $50,000 - $59,999 3985 9.0% 4175 8.6% $60,000 - $69,999 4150 9.4% 4195 8.6% $70,000 - $79,999 3555 8.0% 3640 7.5% $80,000 - $89,999 2840 6.4% 3385 7.0% $90,000 - $99,999 2565 5.8% 2920 6.0%
$100,000 - $124,999 4105 9.3% 5505 11.3% $125,000 - $149,999 1910 4.3% 2975 6.1% $150,000 and Over 2090 4.7% 4170 8.6%
Total Households 44,200 100.0% 48,600 100.0% Source: Statistics Canada 2006 Census
Income
13

Labour Force
Highest Level of Schooling 2001 2006
# of People % of Total # of People % of Total
No certificate,diploma or degree 10,751 16.6 18,945 20.4 High School Certificate 17,467 27.0 25,590 27.5
Apprenticeship/trades 6,458 10.0 6,725 7.2
College, CEGEP, or other non-university certificate 11,281 17.4 15,860 17.1
University certificate or diploma below bachelor degree
-- -- 3,230 3.5
University degree 18,849 29.0 22,575 24.3
Total 64,785 100.0% 92,930 100.0% Source: Statistics Canada 2006 Census. 2001 Data is for residents aged 20-64. 2006 Data is for residents aged 15+.
Labour Force by Industry (NAICS)
North American Industry Classification System(NAICS) Category
Number of Workers
% of Labour Force
11 Agriculture, Forestry, Fishing & Hunting 515 0.8% 21 Mining, Oil & Gas Extraction 85 0.1% 22 Utilities 255 0.4% 23 Construction 2660 4.2%
31-33 Manufacturing 15,285 24.3% 41 Wholesale Trade 2975 4.7%
44-45 Retail Trade 6005 9.6% 48-49 Transportation & Warehousing 2210 3.5%
51 Information & Cultural Industries 1165 1.9% 52 Finance & Insurance 2185 3.5% 53 Real Estate, Rental & Leasing 865 1.4% 54 Professional, Scientific & Technical Services 4010 6.4% 55 Management of Companies & Enterprises 45 0.1%
56 Administrative & Support, Waste Management &
Remediation Services 2280 3.6%
61 Educational Services 7120 11.3% 62 Health Care & Social Assistance 5510 8.8% 71 Arts, Entertainment & Recreation 1080 1.7% 72 Accommodation & Food Services 3640 5.8% 81 Other Services (Except Public Administration) 545 0.9% 91 Public Administration 2520 4.0%
N/A Industry - Not Applicable 1920 3.0%
Total Employed Labour Force 62,875 100.0% Source: Statistics Canada 2006 Census.
Labour Force
Highest Level of Schooling
14

Labour Force by Occupational Category (NOCS)
Source: Statistics Canada 2006 Census
Labour Force Activity
Males Females Totals
Population 44,755 48,170 92,930
In Labour Force 34,195 32,185 66,380
- Employed 32,555 30,325 62,875
- Unemployed 1,640 1,860 3,505
Not in Labour Force 10,560 15,985 26,550
Participation Rate 76.4% 66.8% 71.4%
Employment Rate 72.7% 63.0% 67.7%
Unemployment Rate 4.8% 5.8% 5.3%
Source: Statistics Canada 2006 Census
NOCS Category Number of Workers % of Labour Force
A Management 6,130 9.3%
B Business, Finance & Administration 10,600 16.1%
C Natural & Applied Sciences 4,740 7.2%
D Health 3,200 4.9%
E Social Science, Education, Government Services
& Religion 7,150 10.9%
F Art, Culture, Recreation & Sport 1,785 2.7%
G Sales & Service 14,070 21.4%
H Trades, Transport & Equipment Operators 8,245 12.5%
I Primary Industry 970 1.5%
J Processing, Manufacturing & Utilities 8,880 13.5%
Total Labour Force 65,770 100.0%
Labour Force
15

Sample Wages by Hourly Wage and Salary
Occupation Hourly Wages Salaried Wages
Starting Hourly Rate
Actual Cash Hourly Rate
Average Starting Base
Actual Cash Compensation
Administrative Assistant $10.00 $16.00 $36,428 $41,020 CAD/Drafting Technician N/A $24 N/A $48,270 Computer Programmer N/A N/A $57,302 $66,235
Controller N/A N/A $40,101 $88,659 Customer Service - Inbound Agent $15 $18 $32,395 $40,380
Data Entry Operator N/A $14 $22,631 $30,455 Electrician N/A $24 N/A $51,488
Human Resources Manager N/A N/A $72,029 $86,988 Information Technology Manager N/A N/A $70,936 $90,891 Information Technology Systems
Analyst N/A N/A $62,274 $67,841
Machinist N/A $21 N/A $49,323 Maintenance Manager N/A $25 N/A $68,949
Manufacturing Engineer N/A $25 N/A $68,726 Marketing Manager N/A N/A $47,652 $78,888
Materials / Supply Manager N/A $21 $45,173 $60,013 Mechanical Engineer N/A N/A N/A $72,983
Mechanical Technician N/A $25 N/A $54,550 Millwright N/A $24 N/A $52,460
Production - Quality Assurance Manager
N/A N/A $57,030 $77,983
Production Assembler (Non-machine)
$13 $16 N/A $33,993
Production General Labourer $11 $15 N/A $31,895 Production Machine and Tool
Inspector (Set-up) N/A $20 $41,667 $42,800
Production Machine Operator $14 $16 N/A $35,457 Production Manager N/A N/A $49,153 $72,436
Research Lab Technician N/A $21 N/A $44,740 Shipper/Receiver $12 $16 $29,900 $35,523
Tool and Die Maker N/A $25 N/A $51,873 Warehouse Manager N/A N/A $43,346 $58,533
Welder $19 $20 N/A $42,540 Source: Statistics Canada 2006 Census
Labour Force
16

Transportation
The City of Guelph is well served by all modes of transportation - highway, rail, air and water.
Highway Guelph is served by four major highways: MacDonald-Cartier Freeway (Highway #401) and Highways #6, 7 and 124. Highway #401, a ten minute drive from downtown Guelph, provides direct access to London-Windsor/Detroit to the west, and Toronto/Montreal to the east. Highway #6 offers access to the Queen Elizabeth Way connecting with Hamilton-Toronto and Niagara Falls-Buffalo. Both inter-city and local bus services are available.
Rail Guelph is also served by both the Canadian National Railway and the Canadian Pacific Railway.
The City's own Guelph Junction Railway provides industry with freight handling facilities and connections to CNR and CPR. Via Rail provides inter-city passenger rail service. Plans are underway to bring Go Rail commuter service to Guelph.
Air Lester B. Pearson International Airport (Toronto International Airport) is within 65 kilometres
(40 miles) from Guelph via Highway #401, providing passenger and cargo services to most major North American and overseas destinations. John C. Munroe Hamilton International Airport, located 37 kilometres (23 miles) from Guelph offers business, cargo and passenger service to many North American as well as select overseas destinations at a competitive cost. Waterloo Regional Airport provides passenger, cargo and business service to most major Canadian destinations and many small Ontario locations. The Guelph Airpark is capable of servicing smaller private aircraft.
Water Guelph is located 45 kilometres (28 miles) from the Port of Hamilton and 90 kilometres (55 miles) from the Port of Toronto. Full docking, loading and unloading and warehousing facilities are available at both locations. Both ports are located on the St. Lawrence Seaway System providing direct access to worldwide shipping lanes.
Customs
Full custom clearance and bonded warehouse facilities are available for truck, rail or air shipments.
Communications A fully interconnected telecommunications network is available for industrial/ commercial uses. Bell Canada, Rogers and the Canada Post Corporation provide a complete range of telephone, internet and postal services. Guelph is served by its own local daily newspaper and radio station, as well as other regional newspapers, radio and television facilities.
Transportation and Communication
17

Services and Facilities Medical Facilities
The City of Guelph is served by three fully equipped and staffed hospitals offering all necessary medical services. Guelph is also well served by over 150 physicians with general practices and medical specialists.
Police and Fire Protection
Police services are provided by the Guelph Police Service as well as a detachment of the Ontario Provincial Police. Fire Services are provided by The City of Guelph.
Religious Services
Guelph has over 60 churches with all major faiths and denominations represented. Shopping Services
Guelph’s varied shopping venues provide for a wide range of shopping experiences. Stone Road Mall is one of the largest regional malls in Southwestern Ontario. Guelph has two other enclosed shopping malls and numerous open malls and plazas. Guelph’s vibrant downtown core features approximately 500 unique shops and services.
Recreation Guelph offers a variety of active and passive recreation activities. There are over 1,000 hectares of parks and open space and a 70 km network of trails throughout the city. The University’s Arboretum offers over 400 acres of nature trails, gardens and plant collections from around the globe. There are three golf courses within the City and others nearby. The city supports a full range of organized recreation and minor sports programs as well as Junior A and Junior B hockey teams. Guelph Lake Conservation Area, immediately north of the City, is a popular place for camping, boating and sailing.
Culture
Cultural activities take place at numerous locations throughout the city. Guelph is proud of the River Run Centre, a magnificent performing arts and conference centre set along the bank of the Speed River, in the city’s thriving downtown core. The River Run Centre hosts a variety of series and shows ranging from theatre to dance, comedy to lectures and a wide range of vocal and instrumental music. Other cultural venues include the Guelph Little Theatre, The MacDonald-Stewart Art Centre, The Guelph Civic Museum and McCrae House. Guelph is also home to several annual festivals including the Guelph Multicultural Festival as well as a number of other musical and sporting events at the Sleeman Centre, home of the OHL’s Guelph Storm.
Services and Facilities
18

Business Statistics Major Guelph Employers
Company Name Number Of Employees
Linamar Corporation 12000 University of Guelph 3723 Upper Grand District School Board 3400 The Corporation of The City of Guelph 1582 Cargill Meat Solutions 1500 Guelph General Hospital 1150 Polycon Industries 1000 Wellington Catholic District School Board 1000 The Co-operators 843 Blount Canada Ltd. 820 Guelph Tool Inc. 700 The Homewood Corporation 650 Ontario Ministry of Agriculture, Food and Rural Affairs 650 Hitachi Construction Truck Manufacturing Ltd. 450 DENSO Manufacturing Canada 400 Nestle Waters Canada 400 TDL Group 396 Hammond Manufacturing Company Ltd. 380 MacKinnon Transport Inc. 375 Zehrs Markets 332 Hammond Power Solutions 325 McNeil Consumer Healthcare 320 YMCA-YWCA of Guelph 284 Smart!Centres 280 Canadian Solar Solutions Inc. 275 Rowan Williams Davies & Irwin Inc. (RWDI) 268 Reid’s Heritage Group 250 Sleeman Breweries Ltd. 200 Trimaster Manufacturing Limited 200 CanWest Dairy Herd Improvement 200 The Elliott Community 200 Wellington-Dufferin-Guelph Public Health 200 Con Cast Pipe 200 Royal Canin Canada Company 194 Owens-Corning Canada Inc. 175 Walinga Inc. 175 Smurfit-Stone Container Canada 170 Deloitte 170 The Home Depot 160 Family and Children’s Services 155 G & K Services 150 TD Canada Trust 143 Hematite Manufacturing 130
Business Statistics

Company Name Number of Employees Teutech Industries Inc. 130 Execulink Telecom 127 Bird Packaging Limited 125 SYNNEX Canada 125 Guelph Mercury 120 Valcom Manufacturing Group Inc. 120 GE Water & Process Technologies Canada 113 Barzotti Woodworking Limited 110 Guelph Hydro Inc. 107 Bamco Custom Woodworking Inc. 105 Durose Manufacturing Ltd. 103 VIQUA – a Trojan Technologies Company 102 Armtec 100 CGL Manufacturing Inc. 100 Danby Products 100 WAL-MART 100 Alliance Roofing & Sheet Metal 100 Ernst & Young LLP 100 AOC Resins & Coatings Company 98 Eagle’s Flight 95 Tiger Drylac Canada Inc. 95 RBC Royal Bank Commercial & Agribusiness Banking 90 SIHI Pumps 90 Melitron 85 Metalumen Manufacturing Inc. 85 Canadian Tire Corporation 85 Mandel Scientific Company Inc. 80 Unisync Group Ltd. 80 CME Ontario 80 Pricewaterhouse Coopers LLP 80 Barry Cullen Chevrolet Cadillac Limited 78 Holiday Inn Guelph Hotel & Conference 75 AWC Manufacturing Inc. 75 Guelph Food Research Centre 75 Merit Glass 75 Snowbear Limited 75 Mission Aviation Fellowship of Canada 74 Casey's Grill/Bar 73 Guelph Community Health Centre 72 Scotiabank 71 Syngenta 70 TC Industries of Canada Company 70 Accuflex Industrial Hose Ltd. 67 ABS Friction Inc. 65 RLB LLP 65 Delta Guelph Hotel & Conference 60 Gay Lea Foods Co-operative Ltd. 60 ProMinent Fluid Controls Ltd. 60 Source: 2012 CONNECT Business Directory
Business Statistics

Distribution of Businesses by Number of Employees
Employment Range Number of Businesses % of Total
0 - 4 519 42.2% 5 - 9 216 17.6%
10 - 19 176 14.3% 20 - 49 143 11.6% 50 - 99 82 6.7%
100 - 199 39 3.2% 200 - 499 34 2.8%
500 + 20 1.6%
Total 1229 100.0% Source: 2010 Guelph Business Directory
Distribution of Businesses by Year Established
Year Established Number of Businesses % of Total < 1950 84 6.8%
1950 - 1959 41 3.3% 1960 - 1969 69 5.6% 1970 - 1979 148 12.0% 1980 - 1989 250 20.3% 1990 - 1999 351 28.6%
> 1999 286 23.3%
Total 1229 99.9%*
Source: 2010 Guelph Business Directory *Figures have been rounded
Distribution of Businesses by Export Activity
Number of Businesses % of Total
Exporting Businesses 290 23.6% Non-Exporting Businesses
& No Response 939 76.4%
Total Number of Businesses 1229 100.0%
Source: 2010 Guelph Business Directory
Business Statistics
21
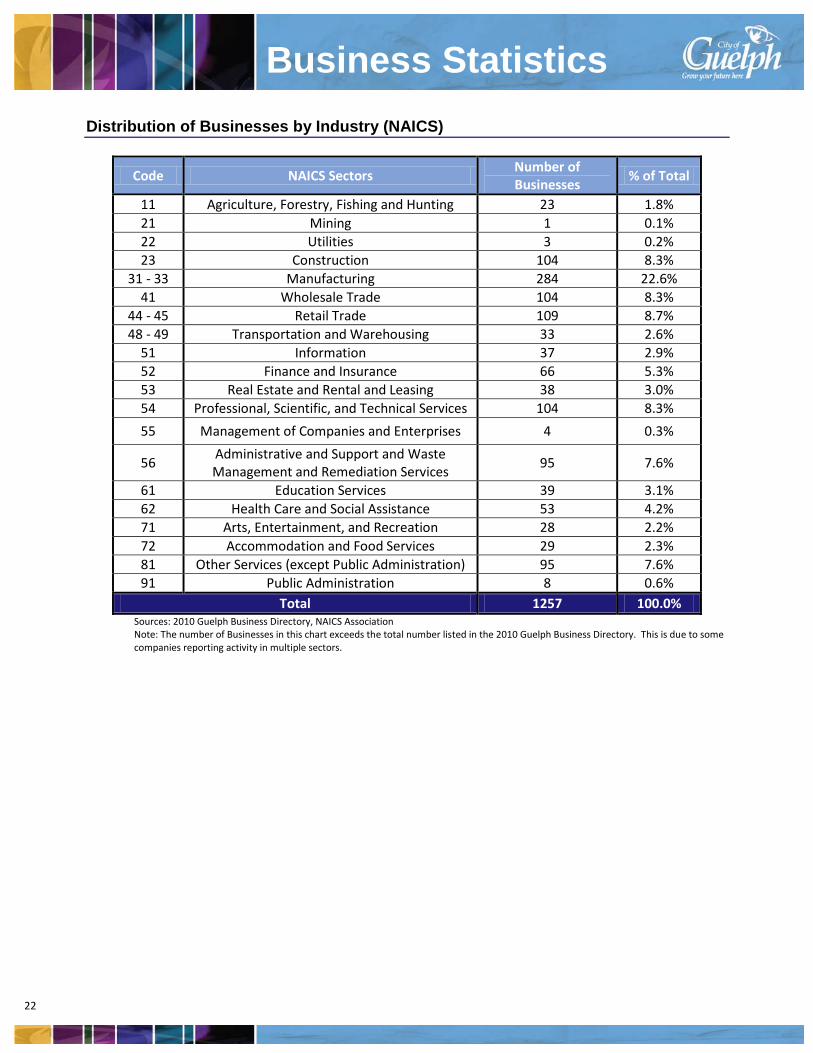
Distribution of Businesses by Industry (NAICS)
Code NAICS Sectors Number of Businesses
% of Total
11 Agriculture, Forestry, Fishing and Hunting 23 1.8% 21 Mining 1 0.1% 22 Utilities 3 0.2% 23 Construction 104 8.3%
31 - 33 Manufacturing 284 22.6% 41 Wholesale Trade 104 8.3%
44 - 45 Retail Trade 109 8.7% 48 - 49 Transportation and Warehousing 33 2.6%
51 Information 37 2.9% 52 Finance and Insurance 66 5.3% 53 Real Estate and Rental and Leasing 38 3.0% 54 Professional, Scientific, and Technical Services 104 8.3%
55 Management of Companies and Enterprises 4 0.3%
56 Administrative and Support and Waste Management and Remediation Services
95 7.6%
61 Education Services 39 3.1% 62 Health Care and Social Assistance 53 4.2% 71 Arts, Entertainment, and Recreation 28 2.2% 72 Accommodation and Food Services 29 2.3% 81 Other Services (except Public Administration) 95 7.6% 91 Public Administration 8 0.6%
Total 1257 100.0% Sources: 2010 Guelph Business Directory, NAICS Association Note: The number of Businesses in this chart exceeds the total number listed in the 2010 Guelph Business Directory. This is due to some companies reporting activity in multiple sectors.
Business Statistics
22

Distribution of Manufacturing Businesses by Industry (NAICS)
Number of Businesses
% of Total Code NAICS Sector
3111 - 3119 Food Manufacturing 14 4.1% 3121 - 3122 Beverage & Tobacco Product Manufacturing 8 2.3% 3133 - 3149 Textile & Fabric Finishing 4 1.2% 3151 - 3159 Clothing Manufacturers 5 1.4% 3161 - 3169 Leather & Allied Product Manufacturing 2 0.6% 3211 - 3219 Wood Product Manufacturing 11 3.2% 3221 -3222 Paper Manufacturing 6 1.7%
3231 Printing & Related Support Activities 34 9.9% 3251 - 3259 Chemical Manufacturing 15 4.3% 3261 - 3262 Plastics & Rubber Products Manufacturing 16 4.6% 3271 - 3279 Non-Metallic Mineral Product Manufacturing 9 2.6% 3311 - 3315 Primary Metal Manufacturing 1 0.3% 3321 - 3329 Fabricated Metal Product Manufacturing 90 26.1% 3331 - 3339 Machinery Manufacturing 44 12.8% 3341 - 3346 Computer & Electronic Product Manufacturing 6 1.7% 3351 - 3359 Electrical Equipment, Appliance & Component Manufacturing 7 2.0% 3361 - 3369 Transportation Equipment Manufacturing 20 5.8% 3371 - 3379 Furniture & Related Product Manufacturing 17 4.9% 3391 - 3399 Miscellaneous Manufacturing 36 10.4%
Total 345 99.9%*
Sources: 2010 Guelph Business Directory, NAICS Association Note: Some manufacturers report activity in multiple NAICS sectors. * Figures have been rounded
23
Business Statistics