city of fresno usbr water management plan
TRANSCRIPT

City of Fresno USBR Water Management Plan
(2011 Criteria)
Draft Report: December 20, 2012
Final Draft Report: May 7, 2013
Final Report: May 15, 2013
Prepared for
City of Fresno Department of Public Utilities
Water Division
Prepared by
West Yost Associates

City of Fresno USBR Water Management Plan
Table of Contents SECTION I: DESCRIPTION OF THE CITY ........................................................................................ 1
A. HISTORY ............................................................................................................................................. 1 B. LOCATION AND FACILITIES .......................................................................................................... 4 C. TOPOGRAPHY AND SOILS.............................................................................................................. 7 D. CLIMATE ............................................................................................................................................ 8 E. NATURAL AND CULTURAL RESOURCES ................................................................................... 8 F. OPERATING RULES AND REGULATIONS ................................................................................... 9 G. WATER MEASUREMENT, PRICING, AND BILLING ................................................................. 10 H. WATER SHORTAGE ALLOCATION POLICIES .......................................................................... 14 I. EVALUATE POLICIES OF REGULATORY AGENCIES AFFECTING THE CONTRACTOR
AND IDENTIFY POLICIES THAT INHIBIT GOOD WATER MANAGEMENT ........................ 14
SECTION II: INVENTORY OF WATER RESOURCES ................................................................... 15
A. SURFACE WATER SUPPLY ........................................................................................................... 15 B. GROUNDWATER SUPPLY ............................................................................................................. 15 C. OTHER WATER SUPPLIES ............................................................................................................. 16 D. SOURCE WATER QUALITY MONITORING PRACTICES ......................................................... 16 E. WATER USES WITHIN THE CITY ................................................................................................ 17 F. OUTFLOW FROM THE DISTRICT (AGRICULTURAL ONLY) .................................................. 20 G. WATER ACCOUNTING (INVENTORY) ........................................................................................ 20
SECTION III: BEST MANAGEMENT PRACTICES FOR AGRICULTURAL CONTRACTORS (NOT APPLICABLE) ............................................................................................... 29
SECTION IV: BEST MANAGEMENT PRACTICES FOR URBAN CONTRACTORS ........... 30
A. URBAN BMPS .................................................................................................................................. 30 Foundational BMPs ................................................................................................................................ 31 Programmatic BMPs ............................................................................................................................... 35
B. PROVIDE A 3-YEAR BUDGET FOR EXPENDITURES AND STAFF EFFORT FOR BMPS .... 38
List of Tables
Table 1. Surface Water Supply ................................................................................................................... 21 Table 2. Ground Water Supply ................................................................................................................... 22 Table 3. Total Water Supply ....................................................................................................................... 23 Table 4. Urban Distribution System ............................................................................................................ 24 Table 5. Crop Water Needs (NOT APPLICABLE) .................................................................................... 25 Table 6. 2011 City Water Inventory ............................................................................................................ 26 Table 7. Influence on Groundwater and Saline Sink (NOT APPLICABLE) .............................................. 27 Table 8. Annual Water Quantities Delivered Under Each Right or Contract ............................................. 28 Table 9. Projected BMP Expenditures and Staff Hours .............................................................................. 39

City of Fresno USBR Water Management Plan
ListofAttachments
Attachment A. City of Fresno Maps
City of Fresno Water Service Area City of Fresno Sphere of Influence (SOI) 2025 Fresno General Plan Land Use and Circulation Map City of Fresno Existing Water Distribution System City of Fresno Existing Recharge Facilities
Attachment B. City of Fresno Water Rules and Regulations
City of Fresno Municipal Code Chapter 6 Article 5 Water Regulations City of Fresno Master Fee Schedule Water Rates
Attachment C. Measurement Device Documentation
Meter Calibration Reports
Attachment D. City of Fresno Sample Bills
Sample Flat Rate Water Bill
Sample Metered Rate Water Bill
Attachment E. City of Fresno Water Shortage Contingency Plan
City of Fresno Water Shortage Contingency Plan, November 2012
Attachment F. Fresno Area Regional Groundwater Management Plan
Fresno Area Regional Groundwater Management Plan, December 2006
Attachment G. Groundwater Banking Plan
The City of Fresno does not currently have a groundwater banking plan.
Attachment H. Annual Potable Water Quality Report
City of Fresno Water Quality Annual Report 2011
Attachment I. Notices of City of Fresno Education Programs and Services Available to Customers
City of Fresno Educational Outreach Materials
Attachment J. District Agricultural Water Order Form (NOT APPLICABLE)
Attachment K. Drainage Problem Area Report (NOT APPLICABLE)
Attachment L. Water Audit Report
City of Fresno Report on Non-Revenue Water, December 2011
Attachment M. CUWCC BMP Reporting
CUWCC BMP Retail Coverage Report 2009-2010 2009 and 2010 BMPs Fresno 2010 Water Audit Final, April 2012
Attachment N. City of Fresno Park Facilities
Attachment O. Wholesale Water Service Agreements
Pinedale County Water District County of Fresno Berans Tract
City of Fresno USBR Water Management Plan
May 2013 Page | 1 o\c\439\02-12-12\wp\112012ap1draftusbrreport
Section I: Description of the City City Name: City of Fresno Contact Name: Ms. Nora Laikam Title: Water Conservation Supervisor Telephone: (559) 621-5305 E-mail: [email protected] Web Address: www.fresno.gov/water
A. History 1. Date City formed: 1885 (City acquired water system in 1931)
Date of first Reclamation contract: 1966 Original size (acres): 24,953 Current year (last complete calendar year): 2011
The City of Fresno was founded in 1885 in the heart of the nation’s richest agricultural county and has been one of the fastest growing cities in the United States. Originally a water stop for the Southern Pacific Railroad, Fresno soon became the Agri-Business Capital of the San Joaquin Valley. Fresno is also the County seat of Fresno County. The City’s original water system began in 1876 as a nonprofit organization inaugurated by a group of public-minded citizens. Initially, the Water System consisted of one pumping station composed of small pumps and two storage tanks located above the second floor of an early store building.
By 1888, the town had grown to a small city which demanded an improved water distribution system. This was necessary because of several large fires, including the destruction of the first permanent courthouse. In 1888, the first pumping station and water tower, of a permanent nature, were constructed. These facilities were designed to be an integral part of a larger and continually expanding water system. This No.1 station was in continuous use until 1959, when it was retired having served its useful purpose. Today, this building is known as the "Water Tower,” and has been declared as a historical structure.
The owner and operator of the system in 1888 was the Fresno Water Company. In 1904, the Fresno Water Company was purchased by Balch, Kerckhoff & Wishon, and was reorganized as the Fresno City Water Company. Several lakes and electrical generating plants located in the Sierra Nevada Mountains east of Fresno also bear the names Balch, Kerckhoff and Wishon. In 1926, the plant and distribution system was purchased by the California Water Service Company. Then in 1931, this Company sold the water system to the City of Fresno, which operated as a municipal utility. It was first managed under an appointed water board, but is now a Division of the City of Fresno Department of Public Utilities.

City of Fresno USBR Water Management Plan
May 2013 Page | 2 o\c\439\02-12-12\wp\112012ap1draftusbrreport
2. Current size, population, and irrigated acres
2011
Size (acres) 110
Population served (urban connections) 505,666 population
127,642 connections(a)
Irrigated acres Not applicable Source: City of Fresno 2010 Urban Water Management Plan, November 2012. (a) Population served (urban connections) does not include 22 connections located within the Pinedale County Water District, which
the City of Fresno serves on a wholesale basis.
See Attachment A City of Fresno Maps:
• Water Service Area (page 1) • City of Fresno Sphere of Influence (page 2)
3. Water supplies received in current year
Water Source AF in 2011
Federal urban water (Tbl 1) (CVP Friant-Kern Canal Class I) 59,849
Federal agricultural water (Tbl 1) 0
State water (Tbl 1) 0
Other Wholesaler (FID Kings River) (Tbl 1) 12,285
Local surface water (Tbl 1) 0
Upslope drain water (Tbl 1) 0
City groundwater (Tbl 2) 119,864
Banked water (Tbl 1) 0
Transferred water (Tbl 1) 0
Recycled water (Tbl 3) (North Fresno Water Reclamation Facility) 63
Other (define) (Tbl 1) 0
Total 192,061 Source: See Tables 1, 2 and 3 in Section II. G

City of Fresno USBR Water Management Plan
May 2013 Page | 3 o\c\439\02-12-12\wp\112012ap1draftusbrreport
4. Annual entitlement under each right and/or contract
AF Source Contract # Availability period(s)
Reclamation Urban AF/Y (CVP Friant-Kern Canal – Class I)
60,000 Friant-Kern Canal San
Joaquin River
14-06-200-8901D
“Water Made Available” and the “Long Term Historic
Average” could affect amount of water delivered. Contractor’s “Water
Conservation Plan,” including water measurement, must be approved to keep contract in
effect.
Reclamation Agriculture AF/Y NOT APPLICABLE
Other AF/Y (Fresno Irrigation District – Kings River)
Varies(a) Fresno Irrigation
District Kings River
6599 Water made available could
affect amount of water delivered
Groundwater AF/Y
Varies(b)
San Joaquin Valley
Groundwater Basin (Kings Subbasin)
NOT APPLICABLE
Available year-round; pumped by 270 City groundwater wells
Source: Nora Laikam, Water Conservation Supervisor, City of Fresno Water Division, November 2012 (a) The quantity of water available to the City of Fresno from FID is not explicitly quantified. On May 25, 1976, the City signed a
contract with FID for delivery of the City’s pro rata share of FID’s water entitlements on the Kings River. The contract specifically excludes any of FID’s Class 2 USBR entitlement and any water stored in Pine Flat Reservoir by FID. The Kings River Water Association (KRWA) allocates entitlements to Kings River contractors on a daily basis; these entitlements are allocated among the contractors using a methodology that estimates the flow in the Kings River before construction of Pine Flat Reservoir (i.e., the project). Once KRWA calculates the “pre-project” entitlement, FID has the option of releasing the entire entitlement for downstream diversion, or storing a portion of the entitlement within Pine Flat Reservoir for use at a later date.
(b) While there is no specific groundwater entitlement, the quantity of groundwater available on an annual basis depends on the assumed natural recharge and the City’s intentional groundwater recharge. See Section II B for additional discussion of the City’s groundwater supply.
5. Anticipated land-use changes. For Ag contractors, also include changes in irrigated acres.
The City is currently in the process of updating its General Plan. Agricultural lands will be converted to urban uses as growth occurs within the City’s Sphere of Influence.
See Attachment A City of Fresno Maps:
• 2025 Fresno General Plan Land Use and Circulation Map (page 3)
6. Cropping patterns (Agricultural only)
NOT APPLICABLE

City of Fresno USBR Water Management Plan
May 2013 Page | 4 o\c\439\02-12-12\wp\112012ap1draftusbrreport
7. Major irrigation methods (by acreage) (Agricultural only)
NOT APPLICABLE
B. Location and Facilities City of Fresno customers receive water on demand (i.e., customer may draw water at any time without notice). Customers currently receive water supplies from groundwater pumped from approximately 270 wells located throughout the City and one surface water treatment facility (Northeast Surface Water Treatment Facility) with a treatment capacity of 30 million gallons of water per day. Potable water is delivered through a grid of transmission and smaller diameter water lines to homes and businesses throughout the City.
See Attachment A City of Fresno Maps:
• Water Service Area (page 1) • City of Fresno Sphere of Influence (page 2) • 2025 Fresno General Plan Land Use and Circulation Map (page 3) • Existing Water Distribution System (page 4) • Existing Recharge Facilities (page 5)
1. Incoming flow locations and measurement methods
Incoming Flows for Treatment and Direct Use:
Incoming flows into the Northeast Surface Water Treatment Facility are measured at the City’s water treatment plant using a Magmeter.
Most of the City’s groundwater wells have meters which measure the actual flow from the well. However, some of the City’s wells do not have meters installed; flow from these wells is estimated based on the time of use and estimated flow rate. The City is currently repairing and replacing existing flow meters based on need, after which they will begin installing flow meters on wells which don’t already have them. The City’s goal is to have flow meters on all of the groundwater wells.
Incoming Flows for Groundwater Recharge
There are a number of groundwater recharge basins in and around the City of Fresno operated by FMFCD, FID, the City of Fresno, and the City of Clovis. The City currently recharges these groundwater basins with surface water using several recharge facilities within its service area. A majority of these facilities are located in the north-central portion of the City, away from future expansion areas, such as the Southeast Growth Area. Additionally, some of the FMFCD basins are actually dual use (recharge and recreation) basins.

City of Fresno USBR Water Management Plan
May 2013 Page | 5 o\c\439\02-12-12\wp\112012ap1draftusbrreport
Flows entering the Fresno Metropolitan Flood Control District (FMFCD) basins area measured using propeller meters. For recharge operations associated with annual use of approximately 70 FMFCD storm-drain basins, propeller meters (similar to Water Specialties Model OFll) are placed in a standpipe connecting pipeline installed between the Fresno Irrigation District (FID) conveyance facility (canal or pipeline) and storm drain basin. Additionally, these types of flowmeters typically exhibit accuracies of ±2 percent. For security and to avoid tampering, the majority of these flow measurement devices are typically installed in standpipes located within the storm drain basin and secured within chain-link enclosures.
Waters delivered to dedicated City Recharge facilities (Leaky Acres, etc.) are typically conveyed via open ditch canals. Waters are typically diverted to these recharge facilities through a single, or series of 'turnout’ structures including gates and pipelines installed at or as near as possible to the recharge facility. Flow measurements to these larger facilities are quantified through noted differentials within long-throated flumes (Replogle Flumes) located just upstream and downstream of the facilities. Long-term accuracies of ±2 percent are reported.
Location Name Physical Location Type of Measurement
Device Accuracy
Northeast Surface Water Treatment Facility
10120 North Chestnut Avenue
Fresno, CA 93730
Magmeter: SITRANS FM MAG 5100 W with a
SITRANS F M MAG 5000 transmitter
Meter: 2% ± 2.5 mm/s Transmitter: ±0.4% of
flowrate
FMFCD Basins
Located in various locations throughout the
City (see Existing Recharge Facilities map
in Attachment A)
Propeller Meters ±2%
Other Groundwater Recharge Facilities
Located in various locations throughout the
City (see Existing Recharge Facilities map
in Attachment A)
Measured as difference between an upstream
weir and a downstream long-throated (Replogle)
flumes
±2%
Groundwater Wells
Located in various locations throughout the City (see Existing Water Distribution System map
in Attachment A)
Varies; most wells have meters; some measured
by time of use and estimated flow rate
±1% Flow Transmitter: 0.4%
±1 mm/s Flow Tube: 0.2% ±2
mm/s Source: Ken Heard and Glenn Knapp, City of Fresno Water Division, November 2012
2. Current year Agricultural Conveyance System
NOT APPLICABLE

City of Fresno USBR Water Management Plan
May 2013 Page | 6 o\c\439\02-12-12\wp\112012ap1draftusbrreport
3. Current year Urban Distribution System
Miles Transite (AC) Pipe Miles Steel Pipe Miles Cast/Ductile Iron
Pipe Miles – Other (PVC, CML, galvanized)
403.85 174.26 708.76 493.06 Source: Bud Tickel, City of Fresno Water Division, March 2013
4. Storage facilities (tanks, reservoirs, regulating reservoirs)
Name Type Capacity (AF) Distribution or Spill
Clearwell at Northeast SWTF Tank 1.5 million gallons Distribution
Southeast Tank (Clovis Avenue and California Avenue) Tank 2 million gallons Distribution
T-3 (located in east Fresno) Tank 3 million gallons Distribution Source: Ken Heard, Chief of Water Operations, City of Fresno Water Division, November 2012
5. Description of the agricultural spill recovery system and outflow points.
NOT APPLICABLE
6. Agricultural delivery system operation (check all that apply)
NOT APPLICABLE
7. Restrictions on water source(s)
Source Restriction Cause of Restriction Effect on Operations
Class I– San Joaquin River
Water unavailable to surface water treatment facility during month of November or December
Fresno Irrigation District canal maintenance
Surface water treatment facility shuts down during November or December
Kings River Water
Limited surface water available from approximately March 1 to September 15
Agriculture use Recharge operations must shut down
Source: Nora Laikam, Water Conservation Supervisor, City of Fresno Water Division, November 2012

City of Fresno USBR Water Management Plan
May 2013 Page | 7 o\c\439\02-12-12\wp\112012ap1draftusbrreport
8. Proposed changes or additions to facilities and operations for the next 5 years
The City has recently completed an update to its Metropolitan Water Resources Management Plan (Metro Plan Update) to provide a plan for providing future water service in the City. The Metro Plan Update includes plans for expansion of the City’s existing Northeast Surface Water Treatment Facility, construction of a new Southeast Surface Water Treatment Facility, reduced use of groundwater and increased groundwater recharge to balance groundwater operations, and expanded use of recycled water to offset potable water demands. The City is planning to begin design of the new Southeast Surface Water Treatment Facility in 2013, with construction to follow in 2015 and 2016. To offset area peak water demand and fire flow requirements until this larger regional facility can be built, the City has recently completed construction of a 3 million gallon (3 MG) water storage tank and a 4 million gallon per day (4 mgd) package surface water treatment facility (T-3 Facility) east of the Fresno International Airport. The surface water treatment component of this site is anticipated to be operate May through October of each year when water demands are highest.
C. Topography and Soils 1. Topography of the City and its impact on water operations and management
The City of Fresno is generally flat. A distinguishing characteristic is its near-central location in the San Joaquin Air Basin, which forms a long bowl or basin about 250 miles long and 120 miles wide. This basin extends from the crest of the Sierra Nevada to the crest of the Coast Range and includes the entire area of the San Joaquin watershed. The water distribution system is divided into four quasi-pressure zones to help regulate minimum and maximum system pressures in the various topographic areas of the City.
Soil types within the City area are as follows:
• Hanford-Delhi-Hesperia association: Deep, somewhat excessively drained and well-drained sands to fine sandy loams; partly wind modified.
• Pachappa-Hesperia association: Well drained and moderately well drained fine sandy loams or loams that are moderately deep or deep to compact silt.
• Greenfield-Atwater association: Well-drained loamy sands and sandy loams that are moderately deep or deep to compact sandy material; partly wind modified.
• San Joaquin-Exeter-Ramona association: Sandy loams to loams that are shallow or moderately deep to a hardpan and deep sandy loams and loams.
2. District soil association map (Agricultural only)
NOT APPLICABLE
3. Agricultural limitations resulting from soil problems (Agricultural only)
NOT APPLICABLE

City of Fresno USBR Water Management Plan
May 2013 Page | 8 o\c\439\02-12-12\wp\112012ap1draftusbrreport
D. Climate 1. General climate of the City service area
Jan Feb Mar Apr May Jun Jul Aug Sep Oct Nov Dec Total
Annual Average Precipitation (inches)
2.09 1.90 1.89 1.03 0.36 0.16 0.01 0.01 0.15 0.53 1.13 1.64 10.9
Average Temperature (°F)
46.1 51.1 55.4 61.2 68.9 76.1 82.0 80.2 75.2 65.4 53.8 46.0 63.4
Maximum Temperature (°F)
54.6 61.5 67.0 74.4 83.5 91.7 98.3 96.4 90.8 79.7 65.3 54.7 76.5
Minimum Temperature (°F)
37.6 40.7 43.8 48.0 54.3 60.5 65.7 64.0 59.7 51.2 42.4 37.3 50.4
Evapo-transpiration (ETo)
0.85 1.63 3.23 5.23 6.96 7.97 8.65 7.64 5.41 3.59 1.68 0.85 53.69
Source: City of Fresno 2010 Urban Water Management Plan, November 2012
Weather station ID: Fresno WSO AP; Period of Record 07/01/1948 to 06/30/2012 (Source: Western Region Climate Center: http://wrcc/dri/edu)
ET Station ID: Station 80 Fresno State; Period of Record 1988 to 2012 (Source: CIMIS Website: wwwcimis.water.ca.gov)
Average annual frost-free days: 289 days (based on 28°F temperature threshold and 90 percent probability) (Source: NOAA National Climatic Data Center Freeze/Frost Data, January 1988).
2. Impact of microclimates on water management within the service area
NOT APPLICABLE
E. Natural and Cultural Resources 1. Natural resource areas within the service area
Name Estimated Acres Description
San Joaquin River Corridor
Approximately 145 acres The San Joaquin River corridor contains the greatest concentration of plant and animal species and sensitive habitat within the Fresno-Clovis Metropolitan Area.
Source: Draft Master Environmental Impact Report for the 2025 Fresno General Plan, May 2002

City of Fresno USBR Water Management Plan
May 2013 Page | 9 o\c\439\02-12-12\wp\112012ap1draftusbrreport
2. Description of City management of these resources in the past or present
Sensitive biological resources are regulated by the California Department of Fish and Game and the U.S. Fish and Wildlife Department. The Federal Endangered Species Act and the California Endangered Species Act prevent the disturbance of identified Threatened and Endangered Species and their habitat.
3. Recreational and/or cultural resources areas within the service area
The City of Fresno has over eighty parks, including three regional parks (Woodward Park, Roeding Park and the Regional Sports Complex). Other recreational resources include the Chaffee Zoo and Rotary Storyland and Playland (source: City of Fresno website www.fresno.gov). A listing of City park facilities is provided in Attachment N.
Cultural resources in the Fresno area consist of remains and sites associated with past human activities. These include prehistoric and proto historic Native American archeological sites, historic archeological sites, and historic sites, buildings, structures, or objects. They also include traditional cultural properties or areas such as Native American sacred sites that have been, and often continue to be, of special economic and/or religious significance (source: Final EIR for Fresno County General Plan Update, February 2000).
F. Operating Rules and Regulations 1. Operating rules and regulations
The City’s water regulations are included in the City of Fresno Municipal Code, Article 1, Water Regulations, Section 6-520.
See Attachment B (page 1) for City Municipal Code Sections related to water
2. Water allocation policy (Agricultural only)
NOT APPLICABLE
3. Official and actual lead times necessary for water orders and shut-off (Agricultural only)
NOT APPLICABLE
4. Policies regarding return flows (surface and subsurface drainage from farms) and outflow (Agricultural only)
NOT APPLICABLE

City of Fresno USBR Water Management Plan
May 2013 Page | 10 o\c\439\02-12-12\wp\112012ap1draftusbrreport
5. Policies on water transfers by the City and its customers
The City periodically transfers portions of its CVP water supplies to other water supply agencies if they are not needed by the City; however, no such transfers were conducted in 2011.
The City does serve a small portion of the Pinedale County Water District (about 28 service connections in the portion east of Highway 41) and a small County of Fresno area known as the Berans Tract (via two service connections). The quantities of potable water sold to these agencies are quite small, constituting less than 0.1 percent of the City’s total water production. These quantities are anticipated to remain essentially the same into the future. Copies of the City’s agreements for providing water service to these areas are provided in Attachment O.
G. Water Measurement, Pricing, and Billing 1. Agricultural Customers
NOT APPLICABLE
2. Urban Customers (for Calendar Year 2011) a. Total number of connections: 127,6421 b. Total number of metered connections: 25,0102 c. Total number of connections not billed by quantity: 102,632 d. Percentage of water that was measured at delivery point: 38% e. Percentage of delivered water that was billed by quantity: 38%3 f. Measurement device table: see next page
1 Does not include 22 connections located in Pinedale County Water District that are provided with water from the City of Fresno system. 2 Metered connections reflects the number of accounts that were billed based on metered consumption in 2011 (includes all non-residential customers and some residential customers). As shown in the table below, the actual number of connections with meters installed (45, 248) is much higher as many customers were still being billed based on a flat rate in 2011. 3 This percentage is based on 2011 conditions when the City was still implementing its residential water metering program. With the exception of some on-going backyard main projects which are scheduled for completion by mid-2013, most of the City’s customers are now metered. As of February 2013, there were 1,658 unmetered connections; these connections will be metered upon completion of the on-going backyard main projects in mid-2013.

City of Fresno USBR Water Management Plan
May 2013 Page | 11 o\c\439\02-12-12\wp\112012ap1draftusbrreport
Meter Size and Type
Number (as of 2011)
Accuracy,* +/-percentage
Reading Frequency,
Days
Calibration Frequency,
Months
Maintenance Frequency,
Months
5/8 and 3/4" 9,493
98.5 – 101.5% 30
As needed; the City tests the meters for the
top 20 commercial
water users on an annual
basis.
As needed
1" 24,455
1 ½" 4,956
2" 5,001
3" 171
4" 753
6" 218
8" 191
10" 10
Total 45,248(a) Totals by Meter Type:
Compound 431 Turbo 406
Other (Positive Displacement) 43,575 Other (Single Jet) 711
Other (FM) 125 (a) Source: Ron Simons, City of Fresno Water Division, November 2012. The total meters shown includes all installed meters as of
2011. This number is larger than the number of metered customers in 2011, as it includes some meters installed for customers who were still billed on a flat rate basis in 2011. With the exception of some on-going backyard main projects which are scheduled for completion by mid-2013, most of the City’s customers are now metered. As of February 2013, there were 1,658 unmetered connections; these connections will be metered upon completion of the on-going backyard main projects in mid-2013.
The City currently does not have a specific calibration schedule or policy for its groundwater well flow meters. However, the City is in the process of identifying wells with flow meter issues and will develop a plan to replace deficient meters. The City is anticipating that meter replacements will be completed by the end of the 2014 calendar year. Until then, meters are calibrated on a case-by-case basis. Customer water service meters are tested in accordance with the requirements specified in AWWA Manual M6 Table 5-3. Copies of the City’s most recent meter calibration tests are provided in Attachment C.
3. Agricultural and Urban Rates (a) Current year agricultural and /or urban water charges - including rate structures and billing
frequency
The City’s water customers are billed monthly (see additional information under Item 3 below).
The current City of Fresno Master Fee Schedule for Water Services is provided in Attachment B (page 43).

City of Fresno USBR Water Management Plan
May 2013 Page | 12 o\c\439\02-12-12\wp\112012ap1draftusbrreport
(a) Annual charges collected from agricultural customers
NOT APPLICABLE
(b) Annual charges collected from urban customers
Until late 2012, single-family residential customers were unmetered and were billed based on a flat rate billing structure, while all other customers were billed based on metered water use. In late 2012, the City essentially completed a residential water metering program. With the exception of some on-going backyard main projects which are scheduled for completion by mid-2013, most of the City’s customers are now metered. As of February 2013, there were 1,658 unmetered connections; these connections will be metered upon completion of the on-going backyard main projects in mid-2013. All non-residential water customers are already metered, so by mid-2013 all of the City’s customers will be metered.
Fixed Charges (Calendar Year 2011)
Charges, $ unit/month
Charge units, $/meter size, etc.
Units billed during year, by meter size, etc.(a)
$ collected, $ times units(b)
Flat Rate ($22.87 for first 6,000 sq ft or less of lot size + $0.228 for each
additional 100 sq ft)
Per Unmetered Single Family Residential
Connection 102,632 $37,430,807
$10.03 ¾-inch or smaller Meter 4,778 $596,874
$13.51 1-inch Meter 5,138 $969,791
$18.89 1 ½-inch Meter 3,661 $831,980
$27.09 2-inch Meter 4,768 $1,546,391
$45.07 3-inch Meter 166 $89,240
$63.02 4-inch Meter 741 $553,511
$99.01 6-inch Meter 210 $240,244
$152.96 8-inch Meter 187 $287,815
$179.83 10-inch Meter 13 $21,580
Total Flat Rate Charges $37,430,807(c)
Total Meter Standby Charges $5,137,426(d)
Total Fixed Charges $42,568,233 (a) Flat rate units from HTE Revenue Report (2011) and Standby Meter Units from Water Meter Size Count as of July 2011 (b) Net amount billed from City’s HTE Revenue Report. $ collected varies due to billing adjustments, differing number of customers
during the year, etc. Total $ collected for Flat Rate customers also depends on the lot size so the total $ collected cannot be simply calculated by multiplying the flat rate charge by the number of connections.
(c) From City of Fresno “HTE Revenue Report—2011.xls”. Net amount billed for Non-Metered Accounts; includes deposits and other charges. Does not include Fixed Charges for Fire Protection Meters ($1,527,124).
(d) From City of Fresno “Billed Cons and Standby by Size—CY11.xls”. Total Standby Charges for Domestic and Irrigation Meters.

City of Fresno USBR Water Management Plan
May 2013 Page | 13 o\c\439\02-12-12\wp\112012ap1draftusbrreport
Volumetric Charges (Calendar Year 2011) (a)
Charges, $ unit
Charge units, $/HCF, etc.
Units billed during year HCF, Kgal, etc.
$ collected, $ times units
$0.610/HCF Single Family Residential ($/HCF) 370,909 HCF $226,254
$0.745/HCF Other than Single Family Residential ($/HCF) 22,694,979 HCF $16,907,759
Total 23,065,888 HCF $17,134,013 (b) (a) Source: City of Fresno “Billed Cons and Standby by Size—CY11.xls”. (b) Total does not exactly match data from City’s HTE System (off by 0.02 percent).
City of Fresno Sample Water Bills for Flat-Rate and Metered Customers are provided in Attachment D.
(c) Describe the contractor’s record management system
The City Water Division keeps water production, distribution and recharge records through computer databases and file records. These records are kept as a history of the City’s water system operations. Most records are currently in Excel and Access. The Division is preparing to for use of the Hansen program for some of its record keeping in the near future. The Division does bill customers for their water service. That service is performed by the City’s Utilities Billing and Collection Division.
Utilities Billing and Collection (UB&C) is a Division of the City’s Department of Public Utilities and is directly responsible for the billing and collection of the City of Fresno’s utilities fees and charges. Specifically, UB&C collects fees for water, sewer, solid waste, and community sanitation.
Customers can access their billing history, payment activity, and service and consumption summaries, either in person, by telephone, or online through Fresno’s Click2Gov software. Billing histories for the last seven years are available to the City’s water customers. UB&C has two office locations for customers to review billing information.
The City’s billing software is SunGard Public Sector. The City has billing data on the system back to 1996 (customers cannot access data back that far, but staff can). The City has 20 billing cycles in order to have groupings to bill every business day in the month for the most part. Once all meters are switched over to AMR meters, existing accounts that we still manually read, they too will be moved into one of the corresponding new cycles. They are all grouped geographically now so that follow-up work can be easily routed. Non-waters are separated into two separate cycles at this point too. All these groupings are billed in segments on a daily basis to allow mailings to go out in a rationed matter and alleviates calls all coming in at one time when customers have questions on their bills and spreads out payments coming back as many pay their bills once they receive them in the mail.
City of Fresno Sample Water Bills for Flat-Rate and Metered Customers are provided in Attachment D.

City of Fresno USBR Water Management Plan
May 2013 Page | 14 o\c\439\02-12-12\wp\112012ap1draftusbrreport
H. Water Shortage Allocation Policies 1. Current year water shortage policies or shortage response plan - specifying how reduced water
supplies are allocated
The City’s Water Shortage Contingency Plan provides a four-stage plan to address water supply shortages of up to 50 percent in the event of a drought or other water supply emergency. Water use restrictions and water consumption reduction methods, including allocation of available supplies in severe water shortages, are described in the plan. The plan is included in Chapter 9 of the City’s Urban Water Management Plan.
The City of Fresno Water Shortage Contingency Plan is provided in Attachment E.
2. Current year policies that address wasteful use of water and enforcement methods
The City prohibits water waste through ordinances found in the City Municipal Code (Section 6-520. Wastage of Water). The City has a water waste hotline and a reporting form on the City website, and keeps records of water waste violations. The ordinance prohibits gutter flooding and single-pass cooling systems in new connections.
Two Water Conservation Representatives monitor customer water waste through field operations. Communication to the City’s diverse customer base is always taken into consideration, so representatives are bilingual, speaking English and either Hmong or Spanish. During the hot season, temporary Water Conservation Representatives are hired to monitor late night and early morning over watering. A seasonal temporary Administrative Clerk is also hired to keep up with the additional paperwork generated. The program is marketed through media, billing inserts, promotional materials, public outreach events, speaker’s bureau, and the City’s web site.
The City of Fresno Water Rules and Regulations are provided in Attachment B.
I. Evaluate Policies of Regulatory Agencies Affecting the Contractor and Identify Policies that Inhibit Good Water Management The City’s ability to use all of its available surface water supplies is limited by its current surface water treatment capacity and the capacity of its intentional recharge facilities. One of the primary objectives of the City’s future water supply plan is to maximize the use of its available surface water supplies either through increased treatment and direct use (through the construction of additional water treatment facilities) and increased intentional recharge (through increased use of existing recharge facilities and construction of new recharge facilities). Maximized use of available surface water supplies will provide the City with greater water supply reliability and operational flexibility and will lessen the City’s dependency on groundwater supplies, thus minimizing further impacts to the underlying groundwater basin.

City of Fresno USBR Water Management Plan
May 2013 Page | 15 o\c\439\02-12-12\wp\112012ap1draftusbrreport
Section II: Inventory of Water Resources
A. Surface Water Supply 1. Surface water supplies in acre feet, imported and originating within the service area, by month
(Table 1).
The City receives surface water supplies from the United States Bureau of Reclamation (Central Valley Project San Joaquin River Class I supplies) and the Fresno Irrigation District (Kings River Class II supplies). 2011 supplies from these sources are shown in Table 1 Surface Water Supply in Section II.G.
2. Amount of water delivered to the City by each of the City sources for the last 10 years
2002 through 2011 supplies from these sources are shown in Table 8 Annual Water Quantities Delivered Under Each Right or Contract in Section II.G.
B. Groundwater Supply 1. Groundwater extracted by the City and delivered, by month (Table 2)
The City currently operates 270 groundwater wells. 2011 groundwater supplies are shown in Table 2 Groundwater Supply in Section II.G.
2. Groundwater basin(s) that underlies the service area
Name Size (Square Miles) Usable Capacity (AF) Safe Yield (AF/Y)
San Joaquin Valley Groundwater Basin (Kings Subbasin) DWR Basin No. 5-22.08
1,530 square miles
Groundwater in storage estimated to be 93,000,000 million acre-feet in 1961 (ref: DWR Bulletin 118-2003)
Estimated Groundwater Yield is 100,000 af/yr based on natural recharge, subsurface inflow and intentional recharge (ref: City of Fresno 2010 UWMP)
Source: DWR Bulletin 118-2003 and City of Fresno 2010 Urban Water Management Plan, November 2012
3. Map of district-operated wells and managed groundwater recharge areas
The City currently operates 270 groundwater wells and a number of groundwater recharge basins.
See Attachment A City of Fresno Maps:
• Existing Water Distribution System (page 4) • Existing Recharge Facilities (page 5)
4. Description of conjunctive use of surface and groundwater
The City of Fresno has an extensive groundwater recharge program consisting of a number of groundwater recharge basins in and around the City of Fresno operated by FMFCD, FID, the City of
City of Fresno USBR Water Management Plan
May 2013 Page | 16 o\c\439\02-12-12\wp\112012ap1draftusbrreport
Fresno, and the City of Clovis. The City currently recharges these groundwater basins with available surface water supplies from the USBR and FID. A majority of these recharge facilities are located in the north-central portion of the City, away from future expansion areas, such as the Southeast Growth Area. Since 1990, the City’s maximum annual recharge has been 62,000 af/yr (in 2003), and has averaged approximately 48,900 af/yr (1990 to 2011 average), with the majority of the recharge occurring at Leaky Acres and the FMFCD facilities (via interties provided by the City to the FMFCD basins).
See Attachment A City of Fresno Maps:
• Existing Recharge Facilities (page 5)
5. Groundwater Management Plan
In 2006, the Fresno Area Regional Groundwater Management Plan (FARGMP) was prepared to comply with AB 3030 and SB 1938. Participating agencies, including the City, adopted the FARGMP in 2006.
A copy of the FARGMP is provided in Attachment F.
6. Groundwater Banking Plan
The City does not participate in groundwater banking at this time. However, the City does have an extensive groundwater recharge program (see #4 above).
C. Other Water Supplies 1. “Other” water used as part of the water supply – Describe supply
The City does not use “other” water supplies (other than the surface water supplies and groundwater supplies described above).
D. Source Water Quality Monitoring Practices 1. Potable Water Quality (Urban only)
Groundwater within the Kings Subbasin generally meets primary and secondary drinking water standards for municipal water use, and is described as being a bicarbonate-type water, including calcium, magnesium, and sodium as the dominant ions. Generally, total dissolved solids (TDS) concentrations rarely exceed 600 mg/L, and typically range from 200 to 700 mg/L. However, the groundwater basin is threatened by chemical contaminants that affect the City’s ability to fully use the groundwater basin resources without some type of wellhead treatment in certain areas. The City has constructed wellhead treatment systems and implemented blending plans for a number of wells.
The City’s SWTF is operated to meet all applicable water quality regulations.
A copy of the City of Fresno 2011 Annual Water Quality Report is provided in Attachment H.

City of Fresno USBR Water Management Plan
May 2013 Page | 17 o\c\439\02-12-12\wp\112012ap1draftusbrreport
2. Agricultural water quality concerns:
NOT APPLICABLE
3. Description of the agricultural water quality testing program and the role of each participant, including the district, in the program
NOT APPLICABLE
4. Current water quality monitoring programs for surface water by source (Agricultural only)
NOT APPLICABLE
5. Current water quality monitoring programs for groundwater by source (Agricultural only)
NOT APPLICABLE
E. Water Uses within the City 1. Agricultural
NOT APPLICABLE
2. Types of irrigation systems used for each crop in current year
NOT APPLICABLE
3. Urban use by customer type in current year
Customer Type Number of Connections in 2011 Water Use in 2011 (AF)
Single-family (metered) 6,621 810
Single-family (unmetered) 99,922 72,597
Multi-family 7,273 19,384
Commercial 8,006 18,873
Industrial 92 5,776
Institutional Included with Commercial
Landscape irrigation 3,040 8,521
Wholesale
Recycled
Other (fire service) 2,710 118
Unaccounted for 14,009
Total 127,664(a) 140,089 Source: City of Fresno 2011 Public Water System Statistics Report (a) Includes 22 connections within the Pinedale County Water District that are provided with water from the City of Fresno water
system.

City of Fresno USBR Water Management Plan
May 2013 Page | 18 o\c\439\02-12-12\wp\112012ap1draftusbrreport
4. Urban Wastewater Collection/Treatment Systems serving the service area
The City’s wastewater is treated at the Regional Wastewater Reclamation Facility (RWRF) and the recently constructed North Fresno Water Reclamation Facility (WRF). The treated wastewater is primarily used for direct use on farmland and percolation to groundwater. No wastewater from the City is discharged to surface water.
Treatment Plant Treatment Level (1, 2, 3) AF in 2011 Disposal to / uses
Regional Wastewater Reclamation Facility Undisinfected Secondary 72,304 Direct use on farmland and
percolation to groundwater
North Fresno Water Reclamation Facility Tertiary 62 Golf Course Irrigation
Total 72,366
Total discharged to ocean and/or saline sink 0 Source: Jim Holmes, Senior Operator, City of Fresno Wastewater Management Division, November 2012
5. Groundwater recharge in current year (Table 6)
There are a number of groundwater recharge basins in and around the City of Fresno operated by FMFCD, FID, the City of Fresno, and the City of Clovis. The City currently recharges these groundwater basins with surface water using several recharge facilities within its service area. A majority of these facilities are located in the north-central portion of the City, away from future expansion areas, such as the Southeast Growth Area. Additionally, some of the FMFCD basins are actually dual use (recharge and recreation) basins.
Recharge Area Method of Recharge AF in 2011 Method of Retrieval Leaky Acres Percolation 10,098 Groundwater pumpage FMFCD Basins Percolation 28,770 Groundwater pumpage Woodward Park Percolation 487 Groundwater pumpage Fresno State Percolation 2,280 Groundwater pumpage Copper River Percolation 98 Groundwater pumpage Big Dry Creek Detention Percolation 473 Groundwater pumpage Chestnut Percolation 1,651 Groundwater pumpage North Central Percolation 2,117 Groundwater pumpage Kearney Percolation 683 Groundwater pumpage Running Horse Percolation 0 Groundwater pumpage Big Dry Creek Sunnyside Percolation 3,865 Groundwater pumpage Delivery System Percolation 679 Groundwater pumpage Fancher Basin Percolation 0 Groundwater pumpage Fancher Creek Percolation 0 Groundwater pumpage
Total 51,201 Source: City of Fresno Water Division Recharge Statistics

City of Fresno USBR Water Management Plan
May 2013 Page | 19 o\c\439\02-12-12\wp\112012ap1draftusbrreport
The total recharge in 2011 is shown in Table 6 2011 City Water Inventory in Section II.G.
6a. Transfers and exchanges into the service area in current year – (Table 1)
There were no transfers or exchanges into the City of Fresno service area in 2011.
6b. Transfers and exchanges out of the service area in current year – (Table 6)
The City considers Pinedale County Water District and Berans Tract as wholesale customers. The Pinedale County Water District and Berans Tract are reselling the finished water that the City provides to them. Water sales to these service areas are tracked by the City as part of its overall water consumption.
• Pinedale County Water District (PCWD): Per an agreement, the City delivers water directly to the customers in the Pinedale area through their mains and services. Then, Pinedale bills the customers the City of Fresno rate and keeps 40% of the proceeds for their costs.
• Berans Tract: Fresno County created a County Service Area (CSA) for this area. The City, by agreement, delivers water through two meters to the customers. The CSA is charged the current water rates less 10% for billing and collections and to maintain their system.
Copies of the City’s agreements with the Pinedale County Water District and the Berans Tract CSA are included in Attachment O. Although, these agreements do not state a maximum amount of water to be provided to these wholesale customers, they do state that, in the event of a water shortage, water deliveries to these wholesale customers would be reduced in proportion to the reduction required for other City water customers. Such reductions in water deliveries would be based on the City’s Water Shortage Contingency Plan (see Attachment E).
The City of Fresno provided water to the Pinedale County Water District and Berans Tract (Fresno County) in 2011 as shown below.
From Whom To Whom AF (a) Use
City of Fresno Pinedale County Water District 26 (b) M&I
City of Fresno Berans Tract (Fresno County) 68 M&I
Total 94 (a) Source: Henry McLaughlin, City of Fresno Water Division, City of Fresno HTE Report for Calendar Year 2011 (b) Transfer to Pinedale County Water District includes metered water consumption (7.48 AF) plus estimated water
consumption for 19 flat rate customers in Pinedale County Water District (assumes 2.9 people/du @ 300 gpcd = 18.5 AF).
The total water transferred to Pinedale County Water District and Berans Tract is shown in Table 6 2011 City Water Inventory in Section II.G.
7. Wheeling, or other transactions in and out of the City boundaries – (Table 6)
There were no wheeling or other transactions in or out of the City boundaries in 2011.
8. Other uses of water
There were no other uses of water by the City of Fresno in 2011.

City of Fresno USBR Water Management Plan
May 2013 Page | 20 o\c\439\02-12-12\wp\112012ap1draftusbrreport
F. Outflow from the District (Agricultural only) NOT APPLICABLE
G. Water Accounting (Inventory) The following water accounting (inventory) tables are provided on the following pages:
• Table 1 Surface Water Supply • Table 2 Ground Water Supply • Table 3 Total Water Supply • Table 4 Urban Distribution System • Table 5 Crop Water Needs (Agricultural only) NOT APPLICABLE • Table 6 2011 City Water Inventory • Table 7 Influence on Groundwater and Saline Sink (Agricultural only) NOT APPLICABLE • Table 8 Annual Water Quantities Delivered Under Each Right or Contract
In 2011, the City prepared a comprehensive water system audit to quantify water produced, used and lost in the system. A copy of the report is provided in Attachment L.

Year of Data 2011 Enter data year here
Table 1
Month (acre-feet) (acre-feet) (acre-feet) (acre-feet) (acre-feet) (acre-feet) (acre-feet)Method M1 M1
January 1,581 0 0 0 0 1,581February 3,365 0 0 0 0 3,365March 3,432 0 0 0 0 3,432April 5,104 0 0 0 0 5,104May 6,994 0 0 3,071 0 0 10,065June 6,536 0 0 3,071 0 0 9,607July 7,657 0 0 3,071 0 0 10,728August 7,954 0 0 3,072 0 0 11,026September 8,890 0 0 0 0 8,890October 5,321 0 0 0 0 5,321November 2,443 0 0 0 0 2,443December 572 0 0 0 0 572TOTAL 59,849 0 0 12,285 0 0 72,134Measurement Method M1 = Measured summation from calibrated measuring devices, accurate to within +/- 6 percent.
Local Water (FID)
Other Water
Transfers into DistrictState Water
Surface Water Supply
2011Federal
Urban Water TotalFederal Ag
Water
City of Fresno

Table 2
Month (acre-feet) *(acre-feet)
Method
M1 (for most wells); C3 (for
some wells)
January 5,594 0February 4,561 0March 6,086 0April 7,892 0May 11,723 0June 12,693 0July 15,830 0August 15,891 0September 13,951 0October 9,965 0November 7,958 0December 7,720 0TOTAL 119,864 0* Normally estimatedMeasurement Method M1 = Measured summation from calibrated measuring devices, accurate to within +/- 6 percent.Measurement Method C3 = Calculated using estimates from pump run-times and pump efficiency
Ground Water Supply
2011City
GroundwaterPrivate Urban Groundwater
City of Fresno

Table 3
Month (acre-feet) (acre-feet) (acre-feet) (acre-feet)Method M1 M1 & C3 M1
January 1,581 5,594 0 7,175February 3,365 4,561 0 7,926March 3,432 6,086 0 9,518April 5,104 7,892 2 12,998May 10,065 11,723 8 21,796June 9,607 12,693 8 22,308July 10,728 15,830 12 26,570August 11,026 15,891 12 26,929September 8,890 13,951 6 22,847October 5,321 9,965 12 15,298November 2,443 7,958 3 10,404December 572 7,720 0 8,292TOTAL 72,134 119,864 63 192,061* Recycled M&I Wastewater is treated urban wastewater that is used for irrigation purposes within City service area.Measurement Method M1 = Measured summation from calibrated measuring devices, accurate to within +/- 6 percent.Measurement Method C3 = Calculated using estimates from pump run-times and pump efficiency
Surface Water Total
City Groundwater
yM&I
WastewaterWater Supply
Total Water Supply
2011
City of Fresno
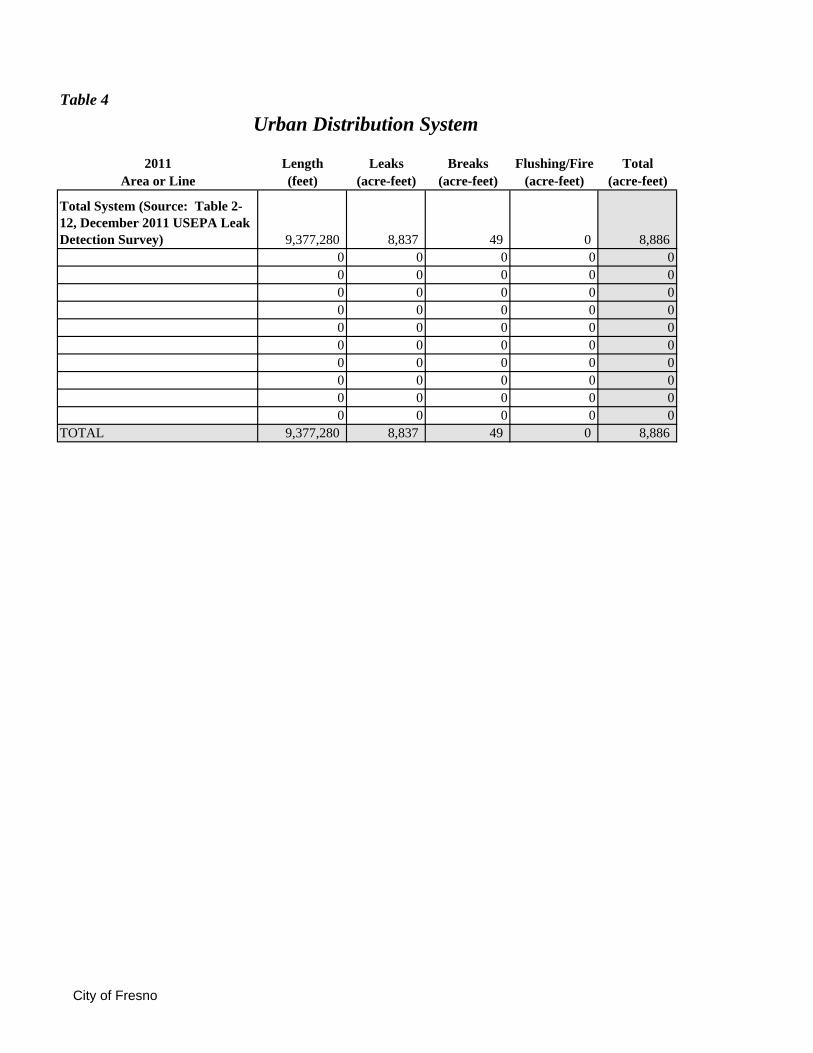
Table 4
Length Leaks Breaks Flushing/Fire Total(feet) (acre-feet) (acre-feet) (acre-feet) (acre-feet)
9,377,280 8,837 49 0 8,8860 0 0 0 00 0 0 0 00 0 0 0 00 0 0 0 00 0 0 0 00 0 0 0 00 0 0 0 00 0 0 0 00 0 0 0 00 0 0 0 0
9,377,280 8,837 49 0 8,886
Total System (Source: Table 2-12, December 2011 USEPA Leak Detection Survey)
TOTAL
2011Area or Line
Urban Distribution System
City of Fresno

Table 5
Crop Water Needs
Agricultural Only--NOT APPLICABLE
City of Fresno

Table 6
2011 City Water Inventory
Water Supply Table 3 192,061Environmental Consumptive Use minus 0Groundwater Recharge minus 51,199Transfers out of District minus 94Flushing / Fire Table 4 minus 0Distribution System Leaks & Breaks Table 4 minus 8,886Water Available for sale to customers 131,882
Actual Water Sales2011 From City Records 126,783Inside Use Feb urban use x 12 66,582Landscape / Outside Use (calculated) 60,201Unaccounted for Water (calculated) 5,099
(Perc ponds & recharge wells)
City of Fresno
Table 7
Influence on Groundwater and Saline Sink
Agricultural Only--NOT APPLICABLE
City of Fresno
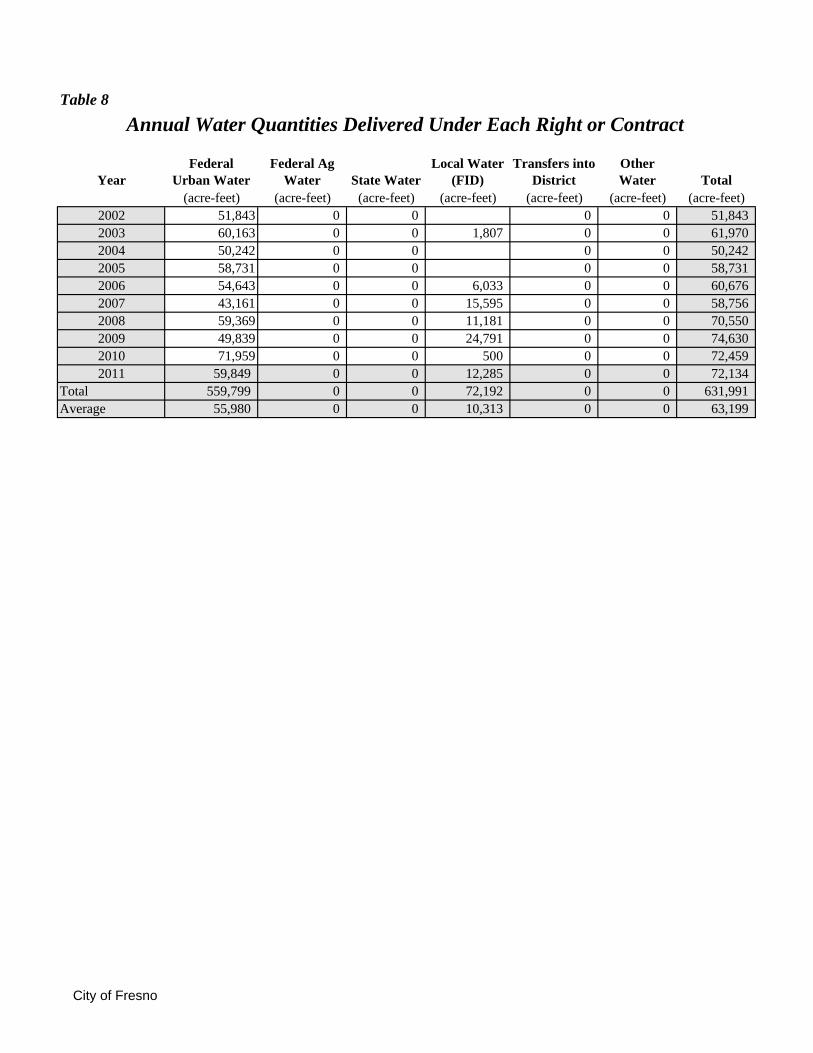
Table 8
Year(acre-feet) (acre-feet) (acre-feet) (acre-feet) (acre-feet) (acre-feet) (acre-feet)
2002 51,843 0 0 0 0 51,8432003 60,163 0 0 1,807 0 0 61,9702004 50,242 0 0 0 0 50,2422005 58,731 0 0 0 0 58,7312006 54,643 0 0 6,033 0 0 60,6762007 43,161 0 0 15,595 0 0 58,7562008 59,369 0 0 11,181 0 0 70,5502009 49,839 0 0 24,791 0 0 74,6302010 71,959 0 0 500 0 0 72,4592011 59,849 0 0 12,285 0 0 72,134
Total 559,799 0 0 72,192 0 0 631,991Average 55,980 0 0 10,313 0 0 63,199
Other Water
Local Water (FID) Total
Federal Urban Water
Annual Water Quantities Delivered Under Each Right or Contract
Transfers into District
Federal Ag Water State Water
City of Fresno
City of Fresno USBR Water Management Plan
May 2013 Page | 29 o\c\439\02-12-12\wp\112012ap1draftusbrreport
Section III: Best Management Practices for Agricultural Contractors (Not Applicable)
City of Fresno USBR Water Management Plan
May 2013 Page | 30 o\c\439\02-12-12\wp\112012ap1draftusbrreport
Section IV: Best Management Practices for Urban Contractors
A. Urban BMPs The City has a long history of water conservation. A letter dated June 20, 1917 from A.G. Wishon, General Manager of the Fresno City Water Company, to water customers stated that employees would patrol neighborhoods and take action against customers who wasted water.
On January 1, 1956, the City adopted an ordinance prohibiting the wastage of water. This was one of the first such ordinances passed in California on a permanent basis. The ordinance included the following provisions:
Section 6-520. Use of Open Hose or Faucet; Wastage of Water
(a) The use of water by means of an open hose or open faucet for irrigation purposes is prohibited. All hose used for irrigation purposes shall have attached thereto a spray nozzle or sprinkling device.
(b) Each consumer of water shall keep all connections, faucets, hydrants, pipes, outlets and plumbing fixtures tight and free from leakage, dripping or waste of water.
(c) The willful waste of water supplied by the City Water Division is prohibited.
(d) The Water Division shall turn off the water connection to any property where any provision of this section is being violated and shall not turn it on again until a fee of five dollars ($5) for reconnection shall have been paid at the Water Division office in the City Hall.
Water conservation in Fresno gained renewed emphasis during the 1976-77 drought. Conservation programs that were started then have continued and since 1981 have been supplemented with additional and expanded programs, as described in this chapter. Excerpts from the City of Fresno’s current Municipal Code regarding water regulations and conservation provisions are included in Attachment B.
The City is also a partner in the U.S. Environmental Protection Agency’s (USEPA) WaterSense program. WaterSense is a voluntary partnership program sponsored by the USEPA with a mission to protect the future of the nation’s water supply by promoting and enhancing the market for water-efficient products and services.
On December 11, 1991, the City became a signatory agency to the CUWCC’s Memorandum of Understanding (MOU) Regarding Urban Water Conservation in California. The purpose of the MOU was to expedite implementation of reasonable water conservation measures in urban areas and to establish appropriate assumptions for use in calculating estimates of reliable future water conservation savings.
With the recently updated CUWCC MOU, the City has an option of meeting coverage requirements by meeting a per capita water use target as defined by the CUWCC. This option is referred to by CUWCC as the GPCD Option. The City has chosen this option for meeting its MOU coverage requirements for the current reporting period. The following table documents the compliance targets required under the CUWCC GPCD compliance option for the City. This table shows the target and the highest acceptable boundary for compliance for each reporting period for the current CUWCC MOU.

City of Fresno USBR Water Management Plan
May 2013 Page | 31 o\c\439\02-12-12\wp\112012ap1draftusbrreport
CUWCC Biennial GPCD Compliance Table for City of Fresno
CUWCC GPCD Option Target Highest Acceptable Bound
Fiscal Year Report % Base gpcd % Base Gpcd
2010 1 96.4% 301 100% 312
2012 2 92.8% 290 96.4% 301
2014 3 89.2% 278 92.8% 290
2016 4 85.6% 267 89.2% 278
2018 5 82.0% 256 82.0% 256
Source: City of Fresno 2010 Urban Water Management Plan, November 2012.
The City’s calculated per capita water use for the year 2010 was 260 gpcd, which met the required 2010 target for coverage compliance with the CUWCC’s MOU (301 gpcd). The City’s calculated per capita water use for the year 2011 was 245 gpcd, which met the required 2012 target for coverage compliance with the CUWCC’s MOU (290 gpcd).
A copy of the City’s CUWCC BMP Retail Coverage Report for 2009-10 is provided in Attachment M.
The following summarizes describes the City’s implementation of the CUWCC Best Management Practices (BMPs) based on information provided in the City’s 2010 Urban Water Management Plan dated November 2012.
Foundational BMPs
1. Utility Operations Programs
1.1 Operations Practices
A.1) Conservation Coordinator
The City has a full-time Water Conservation Supervisor and permanent and contracted support staff. The water conservation coordinator and water conservation staff address the water conservation needs for the City of Fresno.
• Water Conservation Supervisor (Position created August 1988): Ms. Nora Laikam
• Support Staff:
— One Staff Assistant — Four Water Conservation Representatives — Two Landscape Conservation Specialists — One CII Representative — One Management Analyst — One Senior Administrative Clerk — One Administrative Clerk
City of Fresno USBR Water Management Plan
May 2013 Page | 32 o\c\439\02-12-12\wp\112012ap1draftusbrreport
— One Education Coordinator (contracted) — One Landscape Services Coordinator (contracted) — Six seasonal temporary employees hired from April to November
A.2) Water Waste Prevention
The City prohibits water waste through ordinances found in the City Municipal Code (Section 6-520. Wastage of Water) (see Attachment B). The City has a water waste hotline and a reporting form on the City website, and keeps records of water waste violations. The ordinance prohibits gutter flooding and single-pass cooling systems in new connections along with other prohibitions.
Six Water Conservation Representatives monitor customer water waste through field operations. Communication to the City’s diverse customer base is always taken into consideration, so positions are bilingual, speaking English and either Hmong or Spanish and are specifically recruited for those skills. During the warm season, March through November, temporary Water Conservation Representatives are hired to monitor late night and early morning over watering. One of these positions is assigned to keep up with the additional paperwork generated. The program is marketed through media, billing inserts, promotional materials, public outreach events, speaker’s bureau, and the City’s web site.
A.3) Wholesale Agency Assistance Programs
The City functions primarily as a retail water purveyor for the City of Fresno water service area. The City does provide water on a wholesale basis to two limited areas within the City’s water service area:
• Portion of Pinedale County Water District east of Highway 41, and
• Berans Tract portion of Fresno County.
The City provides water on a wholesale basis to a small number of customers located within the portion of the Pinedale County Water District which lies east of Highway 41. This area of Pinedale east of Highway 41 consists of approximately 28 water service connections which are essentially cut off from the remaining Pinedale system by Highway 41 and have no other water supply. These customers are billed by Pinedale, which in turn pays the City for providing the water supply.
The City also provides water on a wholesale basis to the Berans Tract area, a County island which lies at the southeast corner of S. Valentine and W. Muscat. The City serves this area via two water connections from the City.
These wholesale water service arrangements are considered to be a relatively minor part of the City’s overall water system operations. Copies of the City’s water service agreements with these agencies are provided in Attachment O.
1.2 Water Loss Control
In 2011, the City conducted an extensive water audit of water production and consumption within its water distribution system which focused on categorizing, quantifying, and tracking the water produced by the City through existing records and interviews with City staff. The audit identified discrepancies and attempted to locate and quantify the amount of water “lost” in the system. The report used methods

City of Fresno USBR Water Management Plan
May 2013 Page | 33 o\c\439\02-12-12\wp\112012ap1draftusbrreport
proposed in both the “Water Audits and Loss Control Programs – Manual of Water Supply Practices, M36 (3rd Edition), by the American Water Works Association; and the “Control and Mitigation of Drinking Water Losses in Distribution Systems”, by the United States Environmental Protection Agency.
The City also completed an audit for the 2010 calendar year using AWWA’s free audit software. Results from the audit were included in the City’s 2010 reporting to the CUWCC (and are included in Attachment M)4.
The City routinely compiles and compares its water distribution system data to identify any major leaks in the system. Also, the City has conducted some localized leak detection programs:
• In 1998, approximately 60 miles of water mains were tested through a pilot leak detection program. At that time, few leaks were found.
• In 2004, a limited study was conducted in a small area of an older section of Fresno using Permalog. No leaks were detected at that time.
• In late 2011, a leak detection project was conducted on 40 miles of water distribution mains. During that survey, only two small leaks were found.
Staff is available for the timely repair of all reported leaks. The City’s leak detection program will be enhanced with the completion of the Residential Water Metering Program which is anticipated to be complete by late 2012.
1.3. Metering with Commodity Rates for All New Connections and Retrofit of Existing Connections
Historically, Article XII, Section 1225 of the City’s Charter prohibited the installation or required installation of water meters at single-family residential connections, and the billing of single-family residential water consumption at a metered rate. All new single-family residential connections (installed after January 1, 1992) were provided with a meter box and/or meter in accordance with State Water Code Section 525 (adopted by Senate Bill 229 (SB 229) in 1991); however, based on the City Charter, all single-family residential customers have been billed based on a monthly flat rate according to lot size. A discounted flat rate has also been provided for single-family residential customers who are senior citizens.
However, in 2003, Assembly Bill 514 (AB 514) was signed into law. Among other provisions, AB 514 enacted Water Code Section 111 that requires an urban water supplier that receives water from the Federal Central Valley Project to: (1) install water meters on all service connections to residential and non-agricultural commercial buildings located within its service area on or before January 1, 2013; and (2) charge customers for water based on the actual volume of deliveries, as measured by a water meter, on and after March 1, 2013. Compliance with this statute is one of the conditions of the City’s USBR Water Supply Agreement renewal.
4 It should be noted that the City’s AWWA audit for the 2010 calendar year was prepared after the CUWCC posted reporting results on its website, so the CUWCC website reporting does not acknowledge the City’s completion of the 2010 AWWA water audit.

City of Fresno USBR Water Management Plan
May 2013 Page | 34 o\c\439\02-12-12\wp\112012ap1draftusbrreport
The requirements of SB 229 and AB 514 have superseded Article XII, Section 1225 of the City’s Charter, because these state laws address a subject matter of statewide concern. Also, the State Legislature has declared that these requirements supersede and preempt all conflicting enactments of charter cities, including charter provisions.
In response to these requirements, the City implemented a Residential Water Metering Program to install water meters on over 100,000 single-family homes. In late 2012, the City essentially completed the residential water metering program. With the exception of some on-going backyard main projects which are scheduled for completion by mid-2013, most of the City’s customers are now metered. As of February 2013, there were 1,658 unmetered connections; these connections will be metered upon completion of the on-going backyard main projects in mid-2013.
1.4. Retail Conservation Pricing
The City’s single-family residential customers have historically not been metered and have been billed based on a flat rate. It should be noted that per the City’s Master Fee Schedule, the flat rate water service charges for single family residential customers shall sunset as of January 1, 2013 or until all single family residences are metered, whichever comes first.
For the City’s metered customers (including multi-family residential, commercial, industrial, institutional and irrigation), the City has a water rate structure which includes a monthly standby charge based on water meter size, and a uniform monthly quantity use charge based on actual monthly water use.
A copy of the City of Fresno Master Fee Schedule for Water Services is provided in Attachment B.
Upon completion of the Residential Water Metering Program, the City will consider future conversion from uniform metered rates to tiered rates for all metered connections in accordance with the requirements of AB514.
2. Education Programs
2.1. Public Information Programs
The City’s water conservation public information program is managed in-house with the assistance of a contracted public relations firm. The firm’s services include strategic planning, creative concepts, public relations, marketing, promotion, research, advertising, media placement, production and design, copy writing, event production and marketing and online services.
The City’s public information program has many components including multi-media campaigns (paid and public service advertising); customer billing inserts; literature; public outreach activities, speakers bureau and inter-agency partnerships. Many of the City’s water conservation materials are provided in three languages: English, Hmong and Spanish. Bilingual City conservation employees who speak these languages are also available.
The major multi-year media campaign at this time is to educate the public about water meter installation, usage, and free services the City can provide to help the customer save water. After interviewing focus groups, a media campaign was developed to educate the public about water meters and to offer free

City of Fresno USBR Water Management Plan
May 2013 Page | 35 o\c\439\02-12-12\wp\112012ap1draftusbrreport
services to help the customer save water. The campaign incorporated print ads, radio and television, as well as billboards, website, mailers and brochures. A cartoon character family was developed to help convey a friendly message about water meters. The Meter Family (Wally, Mollie and Puddles the dog) are used in many ads. Other outreach included direct contact by staff with customers at outreach events, newsletters, tours and speakers bureau. A City vehicle was also covered with the colorful Meter Family.
The City is a member of the Central Valley Water Awareness Committee (CVWAC), which is comprised of several cities, water utilities, irrigation districts and other groups in the Central Valley. The CVWAC was created to increase the public’s understanding of how water is treated, managed and delivered to customers. The City participates in May Water Awareness Month activities through its affiliation with the CVWAC. The City is also a member of the California Water Awareness Campaign.
In the past, the City has informally kept records of these related public information activities. In 2005, the City began keeping formal and accurate records of these activities for submittal to the CUWCC.
A list of public outreach materials and programs is provided in Attachment I.
2.2. School Education Programs
The City works with schools in the Fresno customer service area through its School Education Program. The Water Education Coordinator is a certified teacher on contract with the City, who has developed the program and is available for presentations to students, teachers and community groups.
In 2011, 31 school presentations were made (reaching 1,681 students), one presentation was made at a community festival, and a school poster contest was held. Four field trips were also conducted with 120 participants.
Programmatic BMPs Since the City of Fresno has chosen the GPCD compliance method for compliance with the CUWCC MOU, the implementation of Programmatic BMPs does not have specific requirements. Therefore, the following data is provided for informational purposes only.
3. Residential
3.1. Residential Assistance Program
Prior to water meter installations, customers paid flat rate water charges and, despite media campaigns, the City received few requests for single-family or multi-family leak surveys. Once the AMR (automatic meter read) meter installation program was announced in 2009 and installation of meters began in mid- 2010, the City began a more aggressive outreach and media campaign to encourage customers to sign up for free water conservation services. This included interior and exterior leak surveys, controller setting, irrigation efficiency evaluation, and landscape and design consultations. The services are popular and response on occasion was overwhelming. The services are highly scored on the written evaluations provided by customers after the service.

City of Fresno USBR Water Management Plan
May 2013 Page | 36 o\c\439\02-12-12\wp\112012ap1draftusbrreport
The City also requires on-site inspections to qualify for high efficiency toilets with the Watersense label ($50) allowing staff an opportunity to enter customer dwellings. At that time, the City offers and performs an interior survey for willing customers. Water efficient literature and hardware is left with the customer, and an offer to perform an exterior survey.
The City provides free low-flow showerheads and faucet aerators to the City’s rate payers. These items are distributed based on customer request and are also available during public outreach events and during interior surveys.
After interviewing focus groups, a media campaign was developed to educate the public about water meters and to offer free services to help the customer save water. The campaign incorporated print ads, radio and television as well as billboards, bus panels, website, Facebook, mailers and brochures. A cartoon character family was developed to help convey a friendly message about water meters. The Meter Family (Wally, Mollie and Puddles the dog) are used in many ads. Other outreach included direct contact by staff with customers at outreach events, newsletters, tours and speakers bureau. A City vehicle was also covered with the colorful Meter Family.
3.2. Landscape Water Survey
The City does aggressively market and perform single-family and multi-family residential exterior water surveys, which have the highest water usage. This program is staffed with two Landscape Water Conservation Specialists, and one contracted Specialist. Surveys are offered and cost-effective measures are recommended. The program is marketed through media, billing inserts, promotional materials, public outreach events, speaker’s bureau, and the City’s web site. The services are popular and response on occasion was overwhelming. The services are highly scored on the written evaluations provided by customers after the service.
During the exterior survey, City staff provides the following services:
• Water –use surveys, exterior leak surveys, controller setting, irrigation efficiency evaluation, landscape tips and design consultations. The irrigation system efficiency rating may use “catch can” distribution uniformity method or in-depth valve observation method, measurement of turf and other landscaped area.
• Water budgeting recommendations specifically for the Fresno area climate and water schedule are developed for the customer. The specialist provides all findings, repairs needed, recommendations, etc., from the survey in a written report for the customer. Free hose nozzles are provided to the customer during exterior surveys.
• Offer to customer to perform interior survey.
3.3. High-Efficiency Clothes Washers (HECWs)
In November 2007, the City implemented a high-efficiency clothes washer rebate program. Residential customers may receive a $50 rebate for purchasing a qualifying high-efficiency clothes washer. Clothes washers qualifying for the rebate must quality as an EnergySTAR labeled appliance and meet the Consortium for Energy Efficiency (CEE) Standards for energy and water consumption standards with a Water Factor (WF) of 6.0 or less.

City of Fresno USBR Water Management Plan
May 2013 Page | 37 o\c\439\02-12-12\wp\112012ap1draftusbrreport
PG&E also has a rebate program which the City’s water customers may be eligible for, depending on what type of washing machine they purchase.
4. Commercial, Industrial, and Institutional (CII)
The City does not receive as many requests regarding interior water conservation surveys for CII accounts as desired. However, the City does conduct exterior surveys for CII accounts upon request, or as a result of routine monitoring. The City expects interior requests to increase due to the filling of the CII position and concentrated communication specifically developed for the CII customer. In 2013 installation of meters with automatic meter reading capability are scheduled for CII customers. CII customer can be better served with staff’s ability to have more detailed meter reading information about their account.
The City does have an ordinance which requires water conservation devices on water-cooled refrigeration units and evaporative coolers, which are primarily associated with CII accounts. The provisions of the ordinance have been incorporated into the City Municipal Code (Section 6-519. Water Conservation Device Required). A copy of the pertinent sections of the City’s Municipal Code are provided in Attachment B.
The City recently implemented a commercial toilet replacement rebate program. This program encourages the installation of High Efficiency Toilets (HETs) with Watersense labels in businesses by offering a rebate for each replaced toilet. As of July 1, 2012, a $50 rebate is available from the City. The program requires a pre-inspection.
5. Landscape
The City has a Large Landscape Conservation Program which is staffed with two Landscape Water Conservation Specialists and one contracted Specialist. Landscape surveys are offered and cost-effective repair or enhancement measures are recommended. The City primarily reaches its customers through routine field monitoring and customer requests. Requesting large accounts are surveyed annually and an irrigation schedule is developed within approved time frames in conjunction with the large landscape water permit program. The City is a resource to customers developing annual water budgets.
The City has also adopted water conserving landscape requirements which are specified in the City Municipal Code (Section 6-522. Water Efficient Landscape Standards). These requirements define standards and procedures for the design, installation and management of landscapes in order to utilize available plant, water, land and human resources to the greatest benefit of the people of the City. A copy of the water conserving landscape requirements is provided in Attachment B.
The City is also a supporting partner in the Clovis Botanical Garden, which serve as a demonstration garden for water conserving landscaping in the region. The City has developed a drip irrigation exhibit in the Garden and City staff holds workshops for visitors. The City has a business friendly and park strip demonstration garden at its facilities. The City has also received a grant to develop a demonstration xeriscape median island on a major street. A brochure was developed related to the project.

City of Fresno USBR Water Management Plan
May 2013 Page | 38 o\c\439\02-12-12\wp\112012ap1draftusbrreport
B. Provide a 3-Year Budget for Expenditures and Staff Effort for BMPs The City’s three-year budget for implementing the BMPs described above is provided on the following table.

1. Amount actually spent during current year
BMP # BMP Name
Projected
Expenditures Staff Hours Activities Included
1 Utilities Operations
1.1 Operations Practices 56,785$ 4,717 Coaching (CO), General Admin Support (GADM), Miscellaneous (MISC), Supervision (SUP)
1.2 Water Loss Control 8,923$ 489 Water Audit‐Multi Units (AM), Water Audit (Residential)
1.3 Metering
1.4 Retail Conservation Pricing
2 Education Programs
2.1 Public Information Programs 372,230$ 10,713 Community Relations (CR), Customer Service (CS)
2.2 School Education Programs 44,238$ 2 Education (ED)
3 Residential 194,429$ 1,083 Clothes Washing Machine Rebate (CW), High Efficiency Toilets‐Residential (HETR), Ulta Low Flush Toilet Rebate (UL)
4 CII 3,810$ 428 Water Audit‐CII (AC), High Efficiency Toilets‐Commercial (HETC)
5 Landscape 26,752$ 1,797 Landscape Audit (LSA)
Total 707,166$ 19,229
2. Projected budget summary for second year (2012)
BMP # BMP Name
Projected
Expenditures Staff Hours Activities Included
1 Utilities Operations
1.1 Operations Practices 58,489$ 4,859 Coaching (CO), General Admin Support (GADM), Miscellaneous (MISC), Supervision (SUP)
1.2 Water Loss Control 9,191$ 504 Water Audit‐Multi Units (AM), Water Audit (Residential)
1.3 Metering
1.4 Retail Conservation Pricing
2 Education Programs
2.1 Public Information Programs 383,397$ 11,034 Community Relations (CR), Customer Service (CS)
2.2 School Education Programs 45,565$ 2 Education (ED)
3 Residential 200,262$ 1,116 Clothes Washing Machine Rebate (CW), High Efficiency Toilets‐Residential (HETR), Ulta Low Flush Toilet Rebate (UL)
4 CII 3,924$ 441 Water Audit‐CII (AC), High Efficiency Toilets‐Commercial (HETC)
5 Landscape 27,554$ 1,851 Landscape Audit (LSA)
Total 728,382$ 19,807
3. Projected budget summary for second year (2013)
BMP # BMP Name
Projected
Expenditures Staff Hours Activities Included
1 Utilities Operations
1.1 Operations Practices 60,243$ 5,004 Coaching (CO), General Admin Support (GADM), Miscellaneous (MISC), Supervision (SUP)
1.2 Water Loss Control 9,467$ 520 Water Audit‐Multi Units (AM), Water Audit (Residential)
1.3 Metering
1.4 Retail Conservation Pricing
2 Education Programs
2.1 Public Information Programs 394,899$ 11,366 Community Relations (CR), Customer Service (CS)
2.2 School Education Programs 46,932$ 2 Education (ED)
3 Residential 206,269$ 1,149 Clothes Washing Machine Rebate (CW), High Efficiency Toilets‐Residential (HETR), Ulta Low Flush Toilet Rebate (UL)
4 CII 4,042$ 455 Water Audit‐CII (AC), High Efficiency Toilets‐Commercial (HETC)
5 Landscape 28,381$ 1,906 Landscape Audit (LSA)
Total 750,233$ 20,402
Year 2011 (actual)
Year 2012 (projected)
Year 2013 (projected)
Three‐Year Budget for Expenditures and Staff Effort for BMPs
Section IV Table ‐ BMP Budgets.xlsx
December 9, 2012 City of Fresno