city of cranston, rhode island comprehensive annual ...€¦ · presentation. the independent...
TRANSCRIPT

CITY OF CRANSTON, RHODE ISLAND
COMPREHENSIVE
ANNUAL FINANCIAL REPORT
FISCAL YEAR ENDED JUNE 30, 2019
PREPARED BY: DEPARTMENT OF FINANCE
ROBERT F. STROM
FINANCE DIRECTOR

CITY OF CRANSTON, RHODE ISLAND TABLE OF CONTENTS JUNE 30, 2019
Introductory Section: Letter of Transmittal i-v Organizational Chart vi Principal Officials vii Certificate of Achievement for Excellence in Financial Reporting viii Financial Section: Independent Auditors’ Report 1-3 Management’s Discussion and Analysis 4-19
Exhibit Basic Financial Statements: Government-Wide Financial Statements: I Statement of Net Position 20-21 II Statement of Activities 22 Fund Financial Statements: III Balance Sheet - Governmental Funds and Reconciliation of Fund Balance to Net Position of Governmental Activities IV Statement of Revenues, Expenditures and Changes in Fund Balances - 23-24 Governmental Funds 25-27 V Statement of Net Position - Proprietary Funds 28-29 VI Statement of Revenues, Expenses and Changes in Net Position - Proprietary Funds 30 VII Statement of Cash Flows - Proprietary Funds 31 VIII Statement of Fiduciary Net Position - Fiduciary Funds 32 IX Statement of Changes in Fiduciary Net Position - Fiduciary Funds 33 Notes to the Financial Statements 34-100
Required Supplementary Information: General Fund:
RSI-1 Schedule of Revenues, Expenditures and Changes in Fund Balance - Budgetary Basis - Budget and Actual
101
RSI-2 Schedule of Revenues, Expenditures and Changes in Fund Balance Budgetary Basis - Budget and Actual - Special Revenue Fund - School Unrestricted 102
RSI-2a Notes to Required Supplementary Information 103 RSI-3 Schedule of Changes in Net Pension/OPEB Liability and Related Ratios -
All Retirement Systems
104-109 RSI-4 Schedule of Contributions - All Retirement Systems 110-115 RSI-5 Schedule of Changes in Net Pension/OPEB Liability and Related Ratios -
OPEB 116-117
RSI-6 Schedule of Contributions - OPEB 118-119 RSI-7 Schedule of Investment Returns - OPEB 120-121 Schedule
Combining and Individual Fund Statements and Schedules:
Nonmajor Governmental Funds: 1 Combining Balance Sheet 122-123 2 Combining Statement of Revenues, Expenditures and Changes in Fund Balances 124-125 3 Nonmajor Budgetary Funds - Schedule of Revenues and Expenditures -
Budgetary Basis - Budget and Actual
126

Proprietary Funds: Enterprise Funds: 4 Combining Statement of Net Position 1275 Combining Statement of Revenues, Expenditures and Changes in Fund Net Position 1286 Combining Statement of Cash Flows - Proprietary Funds 129 Internal Service Funds: 7 Nonmajor Combining Statement of Net Position 1308 Nonmajor Combining Statement of Revenues, Expenditures and Changes in Net Position 1319 Nonmajor Combining Statement of Cash Flows 132 Fiduciary Funds: 10 Combining Statement of Fiduciary Net Position - Pension and OPEB 13311 Combining Statement of Changes in Fiduciary Net Position - Pension and OPEB 13412 Combining Statement of Changes in Assets and Liabilities - Agency Funds 135 Other Schedules: 13 Schedule of Property Taxes Receivable 136-13814 Capital Assets - Schedule of Function by Activity 13915 Capital Assets - Schedule of Changes by Function and Activity 140 Annual Supplementary Transparency Information: Annual Supplementary Transparency Report 141-145 Notes to Annual Supplementary Transparency Report 146-147 Table Statistical Section:
1 Net Position by Component 1482 Changes in Net Position 149-1513 Fund Balances of Governmental Funds 1524 Changes in Fund Balances of Governmental Funds 1535 Assessed Value and Estimated Actual Value of Taxable Property 1546 Principal Property Taxpayers 1557 Tax Rates, Levies and Collections 1568 Ratios of Outstanding Debt by Type 1579 Ratios of General Debt Outstanding 15810 Computation of Legal Debt Margin 15911 Legal Debt Margin Information 16012 Demographic Statistics 16113 Principal Employers 16214 Full-Time Equivalent Employers by Function/Program 16315 Operating Indicators by Function/Program 16416 Capital Asset Statistics by Function/Program 165

Introductory Section
i
Allan W. Fung Robert F. Strom MAYOR FINANCE DIRECTOR
Department of Finance 869 Park Avenue
Cranston, RI 02910-2738 (401) 461-1000
December 24, 2019 Honorable Mayor Allan W. Fung
and Members of the Cranston City Council Cranston, Rhode Island The Finance Department is pleased to present the Comprehensive Annual Financial Report (CAFR) of the City of Cranston, Rhode Island for the year ended June 30, 2019. The report includes the independent auditors' report as required by Rhode Island Statutes. The report is prepared in conformity with generally accepted accounting principles (GAAP) and standards set forth by the Governmental Accounting Standards Board (GASB). Responsibility for both the accuracy of the data, and the completeness and fairness of the presentation, including all disclosures, rests with the management of the City. The City maintains four governmental funds that are annually appropriated. They are the two major funds (General Fund and the School Unrestricted Fund) and two others that are part of Other Governmental Funds (Community Development Block Grant and WIA Job Development). Management of the City is responsible for establishing and maintaining internal controls designed to ensure that the assets of the City are protected from loss, theft or misuse and to ensure that adequate accounting data are compiled to allow for the preparation of financial statements in conformity with generally accepted accounting principles. The internal controls are designed to provide reasonable, but not absolute, assurance that these objectives are met. The concept of reasonable assurance recognizes that: (1) the cost of a control should not exceed the benefits likely to be derived; and (2) the calculation of costs and benefits requires estimates and judgments by management. To the best of our knowledge and belief, the enclosed data are accurate in all material respects and are reported in a manner that presents fairly the financial position and results of operations as measured by the financial activity of its various funds. All disclosures necessary to enable the reader to gain an understanding of the City's financial activities have been included. Blum Shapiro & Company P.C., a public accounting firm fully licensed and qualified to perform audits of municipalities within the State of Rhode Island, has audited the financial statements. The goal of the independent audit was to provide reasonable assurance that the financial statements of the City of Cranston, Rhode Island for the fiscal year ended June 30, 2019, are free of material misstatement. The independent audit involved examining, on a test basis, evidence supporting the amounts and disclosures in the financial statements; assessing the accounting principles used and significant estimates made by management; and evaluating the overall financial statement presentation. The independent auditor concluded, based upon the audit, that there was a reasonable basis for rendering an unmodified opinion that the City of Cranston's financial statements for the fiscal year ended June 30, 2019, are fairly presented in conformity with GAAP. The independent auditors’ report is presented as the first component of the financial section of this report.

ii
GAAP requires that management provide a narrative introduction, overview, and analysis to accompany the basic financial statements in the form of Management's Discussion and Analysis (MD&A). MD&A complement this letter of transmittal and should be read in conjunction with it. MD&A immediately follows the independent auditors’ report.
The independent audit of the financial statements of the City was part of a broader, federally mandated "Single Audit" designed to meet the special needs of federal grantor agencies. The standards governing Single Audit engagements require the independent auditor to report not only on the fair presentation of the financial statements, but also on the audited government's internal controls and compliance with legal requirements, with special emphasis on internal controls and legal requirements involving the administration of federal awards. These reports are available in a separately issued document. PROFILE OF THE CITY OF CRANSTON The City was established as a City in 1754 and incorporated as a City in 1910. With a population of 81,479 as determined by the Rhode Island Economic Development Corporation, the City is the third most populous municipality in the State of Rhode Island (the "State"). Primarily a residential community, the City contains many fine developments. The City operates under a home rule charter adopted in 1962 (the "Charter"), providing for a mayor/council form of government with a nine-member City Council headed by a Council President. The Charter vests all legislative powers of the City in the City Council, including the ordering of any tax, the making of appropriations and the transacting of any other business pertaining to the financial affairs of the City. Cranston is located immediately south of Rhode Island's Capitol. The City covers an area of almost 30 square miles, stretching from Narragansett Bay in the east to the Town of Scituate in the west. It is bordered on the north by Providence and Johnston and on the south by Warwick, West Warwick and Coventry. The two main arteries that pass through the City are Routes 1-95 and 1-295. These interstate multi-lane highways run north-south through the City. They provide direct access to Providence and other major cities such as Boston (45 minutes north) and New York (3.5 hours south). Most of Rhode Island's hundreds of miles of scenic coastline are within a half-hour's drive. The City is also just minutes away from the State's T.F. Green Airport located in the City of Warwick. Howard Industrial Park, located at the interchange of Interstate Route 95 and State Route 37, was the City's major economic development success story of the 1970s and 1980s. This location is home to 38 companies with a workforce of more than 3,000. Premiere national and international companies like Ross Simons and Swarovski help to identify this area as one of the premier industrial parks in the State. Cranston has one of the best educational systems in the state. It has well-maintained housing, modern recreational facilities and active civic organizations. Its reputation as a comfortable, prosperous city makes it one of the most attractive areas in New England for both commercial and residential settlement. LOCAL ECONOMY
Population
Ranked second in population among the 39 cities and towns in the State in 2010, the City experienced a 1.4% increase in population from 2000 to 2010.

iii
LONG-TERM FINANCIAL PLANNING The City of Cranston places a high priority on economic development initiatives in order to solicit and secure new business as well as give continual support to the improvement of the City’s present business community, improving the City’s tax base and the employment opportunities for Cranston residents. The City has successfully implemented aggressive business recruitment and expansion programs and has reinvested in its urban business corridors. Through a variety of forward thinking legislative initiatives, the city offers investment incentives to increase the financial viability of the City’s new and existing development areas. In 2015 the City has passed two new industrial tax incentives for industrial properties. A business expanding or buying a new building spending $12,000,000.00 to $20,000,000.00 will be eligible for a phase in 15 year tax incentive on their improvements. In addition, a business expanding or buying a new building spending over $20,000,000.00 will be eligible for a phase in 20 year tax incentive on their improvements. The City has a commitment to the economic development of all of its available areas and strives to achieve a balance between appropriate land use and bringing higher quality jobs and living standards to its residents. With the assistance of the Department of Economic Development, the City has been a leader in bringing industrial and commercial development to its numerous sites over the past decade. Convenient highway access, ample water and sewer services, and a tradition of excellent municipal services combine to provide the type of environment that the business community seeks when considering expansion or relocation. Industrial Park The Western Cranston Industrial Area – Currently, this is not only Cranston’s but one of the State of Rhode Island’s fastest developing industrial parks, located centrally in the State at the interchange of Interstate 295 and Route 14. This area continues to develop as one of the most important parts of the City’s industrial tax base. National recognized companies like Penske, Cadence Science, Con-Way Trucking, Electro Standards, MPC Corp, Design Fabricators, Jewelry Concepts, TASCA Automotive Parts Warehouse and Bay State Florist are just a few of the industrial tenants that have been attracted to this ever growing industrial area. Garden City Center Garden City Center, Rhode Island’s premiere outdoor shopping venue has been a shopping destination of choice for five generations. The Center opened in 1948 and was the first suburban shopping center in the state with 500,000 square feet of retail and office space. Its well-manicured landscapes and enhanced gardens frame the architecturally unique shops and restaurants. The Center has national retailers such as LL Bean, Fat Face, Pottery Barn, Crate & Barrel, J Crew, LA Fitness, New Balance, Banana Republic, William Sonoma, Ann Taylor Co, Chico’s, Jos A Banks, Talbots, The Container Store, GAP, Anthropologie, Destination Maternity, Soma-Intimates, The Loft, Mel and Me, Clarkes Shoes, L’Occitane, Sephora, White House/Black Market, Anthony’s Cole Fired Pizza and Z-Gallerie. The Center also has regional and local retailers and restaurants such as Providence Diamond Company, Applebee’s, Barrington Books, Edible Arrangements, Ethan Allan Design Center, Bistro 22, Starbucks, B. Goode, Pinkberry, Legal Sea Bar, Tavern in the Square, Tropical Smoothie, The Simple Greek and Whole Foods Market. In addition, Garden City has completed construction of two new buildings under Phase four development consisting of 37,000 square feet of total space.

iv
Chapel View Shopping Center Located directly across from Garden City, a new upscale mixed use shopping group, coupled with the many high quality stores of its next door neighbor, will establish this area of Cranston as one of the leading shopping centers of not only the State but of the Southeastern New England Region. Located on the former site of the State’s Youth Training and Reform School, the developers have used a number of former historic structures, all over one hundred years old, to develop a European Village atmosphere that encompasses upscale condominiums, office space and retail components. Current tenants include Alex & Ani (Retail and Corporate Headquarters) one of the World’s fastest growing companies, The Grille at Chapel View, First Comp a division of Markel Insurance Company, Residential Mortgage Services, Champlain Foundation, Staples, Panera Bread, Massage Envy, Bling Eyewear, Qdoba Mexican Grill, Shaw’s Supermarket, Recreational Equipment Inc. (REI), T.J. Max, Koch Eye Associates, Omaha Steaks and Uptown Burger. Top Golf has signed a lease and is currently in the planning process to open its first location in the State of RI in 2020. Top Golf features fun and competitive golf games for all ages, climate-controlled playing bays for year-round comfort, an impressive food and drink menu, private spaces for groups of any size, HDTVs to watch the big game and a music selection that will make every visit feel like a party. Recent Development Initiatives O’Reilly Auto Parts has open at the former El Tappetio Restaurant site. They re-developed the site for an auto parts store which included a new 7000 sf new building. Cube Smart 950 Phenix Avenue – Mixed use development at the corner of Phenix and Natick has opened. This is also has a multi-use component that include the new home of Little Learners Academy of Cranston. Carpionato Properties has developed the former Cranston Police property on Attwood Avenue. Two buildings have been constructed to include a Dairy Queen, Enterprise Car Rental and Pizza Hut.as the anchors. Dollar General has re-developed the former site on the corner of Dyer and Park Avenues. The Barrett Group has moved their corporate headquarters from Warwick to Cranston on Reservoir Avenue. They will relocate 15 staff members to the new location. Shaws Market has completed a major renovation at Chapel View. Coast to Coast Promotional Products purchased 1081 Pontiac Avenue relocating their front office operations and sample department from Greenville, Rhode Island. They are a full-service distributor for a vast assortment of top-quality gifts and promotional items established in 1973 by Nicholas Ferranti, Jr. Revolving Loan Fund The Revolving Loan Fund is a fixed asset loan program that was established with Federal and matching City Funds approximately 25 years ago. The City’s RLF program offers low interest loans to new as well as expanding businesses located in the City of Cranston. In addition, the RFL fund provides gap financing for companies seeking to purchase equipment, finance renovations, job training and working capital.

v
The fund has distributed over $4 million to companies that have located or expanded. The loans have leveraged over $26 million in additional investments.
Over 18,000 jobs have been created or retained as a result of the program.
The loan portfolio has an average loan amount of $110,000.
Seventy percent of the loans have been made to companies with 25 or fewer employees.
There are 13 current loans in the portfolio. The City recently completed an update to the Revolving Loan Five Year Plan to ensure the continued success of the program.
AWARDS AND ACKNOWLEDGEMENTS The Government Finance Officers Association of the United States and Canada (GFOA) awarded a Certificate of Achievement for Excellence in Financial Reporting to the City of Cranston for its Comprehensive Annual Financial Report for the fiscal year ended June 30, 2018; In order to be awarded a Certificate of Achievement, a government must publish an easily readable and efficiently organized comprehensive annual financial report. This report must satisfy both generally accepted accounting principles and applicable legal requirements. A Certificate of Achievement is valid for a period of one year only. We believe that our current Comprehensive Annual Financial Report continues to meet the Certificate of Achievement Program's requirements and we are submitting it to the GFOA to determine its eligibility for another certificate. I would like to take this opportunity to thank the members of the Finance Department in the Division of Accounting Control, Treasury and Tax Collection, Contract and Purchase, Assessment and Management Information Systems for their diligence and cooperation on a daily basis in carrying out the duties and responsibilities of this department, The success that the Finance Department has enjoyed is due to their efforts. I want to extend the grateful appreciation of all Finance Department employees and to you, Mayor and members of the City Council, for the confidence you have shown in us.
Sincerely,
Robert F. Strom Robert F. Strom, Finance Director

_..___ ._. _Public Libraries .. _..
-.,: ~.~,.:-~~, t --.Pluming.
..r.~~... _.~.....~..~..:....
Aniia~al_Contr
Council Annainhnents:1. Taz Review Board2. Board of Contract and Pw•chuing3. Building Appeals Board4. Persom~el Appeals Hoard5. Hflrbor nfxster6. Sealer of R'eights/measures7. Juvenile Hewing Boar)S. Library Board9. Dlunicipal Conrt Judge10. Probate Judge11. Audit Committee12. Harbor• 111an~gement Plan Commission13. Architects And Engineers14. Industrial Performance
Fc~tl~n~w Peveloument ~ - ~: _~
Fire Deoartrngnt. ,,,~
Flr~ Alartu i
Joinf Annoinhnents:1. Board of Canvassers2. Conservatlon Commission3, Housing BoardJ. Claims Committee5, Charter Review Commission6. Historical Cemeteries Committee7. Housing Aulho~ity8. Zuning Buxrd of Review9. School Building Committee
llevcl opmei;I...,„.,
Mayoral Annoinhnents:1. Parlu & Rec. Adv. Hrd.2. Redevelopment Agency3. Hisfa~ic District Comm.4. Industrial Dev. Comm.5. Investment Committee6. Pawtuxe[ River Autlmrity7. Planning CommissionS. Senior Services Ad~~sory Uaard
vi

vii
CITY OF CRANSTON, RHODE ISLAND
MAYOR
Allan W. Fung
FINANCE DEPARTMENT
Robert F. Strom, Finance Director Michael Igoe, CPA City Controller Mark Capuano Tax Assessor David Capuano City Treasurer Mark Marchesi Purchasing Agent William Aguiar Information Technology Manager
CITY COUNCIL
Michael J. Farina Council President Michael W. Favicchio Council Vice President Christopher G. Paplauskas Lammis J. Vargas John P. Donegan Steven A. Stycos Paul J. McAuley Kenneth J. Hopkins Edward J. Brady

- -------- - - -- - - -- -- ~ - - ------------
' { I ._I
Government Finance Officers Association
Certificate of Achievement for Excellence
in Financial Reporting
Presented to
City of Cranston
Rhode Island
For its Comprehensive Annual Financial Report
for the Fiscal Year Ended
June 30, 2018
Executive Director/CEO

Financial Section

1
Independent Auditors’ Report
Honorable Mayor Allan W. Fung and Members of the Cranston City Council City of Cranston, Rhode Island
Report on the Financial Statements
We have audited the accompanying financial statements of the governmental activities, the business-type activities, each major fund and the aggregate remaining fund information of the City of Cranston, Rhode Island, as of and for the year ended June 30, 2019, and the related notes to the financial statements, which collectively comprise the City of Cranston, Rhode Island’s basic financial statements as listed in the table of contents.
Management’s Responsibility for the Financial Statements
Management is responsible for the preparation and fair presentation of these financial statements in accordance with accounting principles generally accepted in the United States of America; this includes the design, implementation and maintenance of internal control relevant to the preparation and fair presentation of financial statements that are free from material misstatement, whether due to fraud or error.
Auditors’ Responsibility
Our responsibility is to express opinions on these financial statements based on our audit. We conducted our audit in accordance with auditing standards generally accepted in the United States of America and the standards applicable to financial audits contained in Government Auditing Standards, issued by the Comptroller General of the United States. Those standards require that we plan and perform the audit to obtain reasonable assurance about whether the financial statements are free from material misstatement.
An audit involves performing procedures to obtain audit evidence about the amounts and disclosures in the financial statements. The procedures selected depend on the auditors’ judgment, including the assessment of the risks of material misstatement of the financial statements, whether due to fraud or error. In making those risk assessments, the auditors consider internal control relevant to the entity’s preparation and fair presentation of the financial statements in order to design audit procedures that are appropriate in the circumstances, but not for the purpose of expressing an opinion on the effectiveness of the entity’s internal control. Accordingly, we express no such opinion. An audit also includes evaluating the appropriateness of accounting policies used and the reasonableness of significant accounting estimates made by management, as well as evaluating the overall presentation of the financial statements.
We believe that the audit evidence we have obtained is sufficient and appropriate to provide a basis for our audit opinions.
2
Opinions
In our opinion, the financial statements referred to above present fairly, in all material respects, the respective financial position of the governmental activities, the business-type activities, each major fund and the aggregate remaining fund information of the City of Cranston, Rhode Island, as of June 30, 2019 and the respective changes in financial position and, where applicable, cash flows thereof for the year then ended in accordance with accounting principles generally accepted in the United States of America.
Other Matters
Required Supplementary Information
Accounting principles generally accepted in the United States of America require that the management’s discussion and analysis, the budgetary comparison information and the pension and OPEB schedules, as listed on the table of contents, be presented to supplement the basic financial statements. Such information, although not a part of the basic financial statements, is required by the Governmental Accounting Standards Board, which considers it to be an essential part of financial reporting for placing the basic financial statements in an appropriate operational, economic or historical context. We have applied certain limited procedures to the required supplementary information in accordance with auditing standards generally accepted in the United States of America, which consisted of inquiries of management about the methods of preparing the information and comparing the information for consistency with management’s responses to our inquiries, the basic financial statements and other knowledge we obtained during our audit of the basic financial statements. We do not express an opinion or provide any assurance on the information because the limited procedures do not provide us with sufficient evidence to express an opinion or provide any assurance.
Other Information
Our audit was conducted for the purpose of forming opinions on the financial statements that collectively comprise the City of Cranston, Rhode Island’s basic financial statements. The introductory section, combining and individual nonmajor fund financial statements and schedules, statistical section, and Annual Supplemental Transparency Report are presented for purposes of additional analysis and are not a required part of the basic financial statements.
The combining and individual nonmajor fund financial statements and schedules and the Annual Transparency Report are the responsibility of management and were derived from and relate directly to the underlying accounting and other records used to prepare the basic financial statements. Such information has been subjected to the auditing procedures applied in the audit of the basic financial statements and certain additional procedures, including comparing and reconciling such information directly to the underlying accounting and other records used to prepare the basic financial statements or to the basic financial statements themselves, and other additional procedures in accordance with auditing standards generally accepted in the United States of America. In our opinion, the combining and individual nonmajor fund financial statements and schedules and the Annual Transparency Report are fairly stated in all material respects in relation to the basic financial statements as a whole.
The introductory and statistical sections have not been subjected to the auditing procedures applied in the audit of the basic financial statements, and, accordingly, we do not express an opinion or provide any assurance on them.

3
Other Reporting Required by Government Auditing Standards
In accordance with Government Auditing Standards, we have also issued our report dated December 24, 2019 on our consideration of the City of Cranston, Rhode Island’s internal control over financial reporting and on our tests of its compliance with certain provisions of laws, regulations, contracts, and grant agreements and other matters. The purpose of that report is solely to describe the scope of our testing of internal control over financial reporting and compliance and the results of that testing, and not to provide an opinion on the effectiveness of City of Cranston, Rhode Island’s internal control over financial reporting or on compliance. That report is an integral part of an audit performed in accordance with Government Auditing Standards in considering the City of Cranston, Rhode Island’s internal control over financial reporting and compliance.
Cranston, Rhode Island December 24, 2019

4
Allan W. Fung Robert F. Strom MAYOR FINANCE DIRECTOR
Department of Finance 869 Park Avenue
Cranston, RI 02910-2738 (401) 461-1000
MANAGEMENT’S DISCUSSION AND ANALYSIS
FOR THE YEAR ENDED JUNE 30, 2019
As management of the City of Cranston, Rhode Island, we offer readers of the City of Cranston’s financial statements this narrative overview and analysis of the financial activities of the City for the fiscal year ended June 30, 2019. It is designed to assist the reader in focusing on significant financial issues that the City has encountered. Financial Highlights
The liabilities and deferred inflows of resources of the City of Cranston exceeded its assets and deferred outflows of resources at the close of the fiscal year ended June 30, 2019 by $267.8 million (net position).
The net position of the City decreased by $22.7 million (or 9.3%). The governmental net position decreased by
$25.4 million (or 8.2%) and the business-type net position increased by $2.7 million (or 4.3%). The governmental activities revenue increased $3.1 million (or 1.0%) and the net results from activities decreased
from prior year by $35.7 million. In 2019, the results of activities produced a decrease in net position of $(25.4) million and in 2018 the results of activities produced an increase in net position of $10.3 million.
The business-type activities revenue increased by $0.3 million (or 1.0%), and the net results from activities
decreased by $0.7 million (or 20.6%) from the prior year. In 2019, the results of activities produced an increase in business-type net position of $2.7 million, while in 2018 the results of activities also produced an increase of $3.4 million in business-type net position.
The General Fund (the primary operating fund) reflected on a current financial resource basis reports a decrease in
fund balance of $2.0 million (or 9.5%), compared to $0.1 million increase in the prior year.
The City’s total debt increased by $10.4 million. The increase was due primarily to the $27.2 million in new debt offset by principal repayments.
Overview of the Basic Financial Statements This annual report consists of a series of financial statements. The Statement of Net Position (Exhibit I) and the Statement of Activities (Exhibit II) provide information about the activities of the City as a whole and present a longer-term view of the City’s finances. For governmental activities, the fund financial statements tell how these services were financed in the short term as well as what remains for future spending. Fund financial statements also report the City’s operations in more detail than the government-wide financial statements by providing information about the City’s most significant funds. The remaining statements provide financial information about activities for which the City acts solely as a trustee or agent for the benefit of those outside of the government.

5
MANAGEMENT’S DISCUSSION AND ANALYSIS, CONTINUED JUNE 30, 2019 Government-wide Financial Statements Reporting the City as a Whole One of the most important questions asked about the City’s finances is, “Is the City as a whole better off or worse off as a result of the year’s activities?” The Statement of Net Position and the Statement of Activities report information about the City as a whole and about its activities in a way that helps answer this question. These statements include all assets and liabilities using the accrual basis of accounting, which is similar to the accounting used by most private-sector companies. All of the current year’s revenues and expenses are taken into account regardless of when cash is received or paid. These two statements report the City’s net position and changes to net position. You can think of the City’s net position as the difference between assets and liabilities, as one way to measure the City’s financial health, or financial position. Over time, increases or decreases in the City’s net position is one indicator of whether its financial health is improving or deteriorating. You will need to consider other non-financial factors, however, such as changes in the City’s property tax base, to assess the overall health of the City. Government-wide financial statements. The government-wide financial statements are designed to provide readers with a broad overview of the City’s finances, in a manner similar to a private-sector business. The statement of net position presents information on all of the City’s assets and liabilities, with the difference between the two reported as net position. Over time, increases or decreases in net position may serve as a useful indicator of whether the financial position of the City is improving or deteriorating. The statement of activities presents information showing how the City’s net position changed during the most recent fiscal year. All changes in net position are reported as soon as the underlying event giving rise to the change occurs, regardless of the timing of related cash flows. Thus, revenues and expenses are reported in this statement for some items that will only result in cash flows in future fiscal periods (e.g., uncollected taxes and earned but unused vacation leave). Both of the government-wide financial statements distinguish functions of the City of Cranston that are principally supported by taxes and intergovernmental revenues (governmental activities) from other functions that are intended to recover all or a significant portion of their costs through user fees and charges (business-type activities). The governmental activities present the functions of the City that are principally supported by taxes and intergovernmental revenues. The governmental activities of the City include general government, public safety, public works, public libraries, parks and recreation, education, senior services, community development, and interest expense. The business-type activities of the City of Cranston include sewer utilities, the Public Facilities Management Foundation, and the School Lunch Fund. The government-wide financial statements can be found on Exhibits I and II of this report. Fund financial statements. A fund is a grouping of related accounts that is used to maintain control over resources that have been segregated for specific activities or objectives. The City uses fund accounting to ensure and demonstrate compliance with finance-related legal requirements. All of the funds of the City can be divided into three categories: governmental funds, proprietary funds, and fiduciary funds. Governmental funds. Governmental funds are used to account for essentially the same functions reported as governmental activities in the government-wide financial statements. However, unlike the government-wide financial statements, governmental fund financial statements focus on near-term inflows and outflows of spendable resources, as well as on balances of spendable resources available at the end of the fiscal year. Such information may be useful in evaluating a City’s near-term financing requirements. Because the focus of governmental funds is narrower than that of the government-wide financial statements, it is useful to compare the information presented for governmental funds with similar information presented for governmental activities in the government-wide financial statements. By doing so, readers may better understand the long-term impact of the City’s near-term financing decisions. Both the governmental fund balance sheet and the governmental fund statement of revenues, expenditures and changes in fund balances provide a reconciliation to facilitate this comparison between governmental funds and governmental activities.
6
MANAGEMENT’S DISCUSSION AND ANALYSIS, CONTINUED JUNE 30, 2019 The City and School Department maintains 44 and 123 individual governmental funds, respectively. Information is presented separately in the governmental fund balance sheet and in the governmental fund statement of revenues, expenditures and changes in fund balances for both the General Fund and the School Department. For reporting purposes, the amount presented as the General Fund is comprised of the general fund and eight other funds. Similarly for reporting purposes, the amount presented as the School Department is comprised of the school department’s general fund and one other fund. Both the General Fund and School Department are considered to be major funds. Data from the City’s and School Department’s other governmental funds are combined into a single, aggregated presentation titled Other Governmental Funds. Individual fund data for each of the other 156 governmental funds, which are consolidated into 16 funds for reporting purposes, is provided in the form of combining statements elsewhere in this report. Some funds are required to be established by State law and by bond covenants. However, the City Council establishes many other funds to help it control and manage money for particular purposes (like the installation of new science labs into various schools) or to show that it is meeting legal responsibility for using certain taxes, grants and other money (like grants received from the U.S. Department of Housing and Urban Development). The City adopts an annual budget for its General Fund and School Department. A budgetary comparison statement has been provided for each of them as required supplementary information to demonstrate compliance with this budget. Proprietary funds. The City of Cranston maintains two different types of proprietary funds. Enterprise funds are used to report the same functions presented as business-type activities in the government-wide financial statements. The City of Cranston uses enterprise funds to account for its sewer operations, Public Facilities Management Foundation, and its school non-major programs. Internal service funds are an accounting device used to accumulate and allocate costs internally among the City’s various functions. The City of Cranston and School Department uses an internal service fund to account for certain self-insured risks. Because this fund predominantly benefits governmental rather than business-type functions, it has been included within governmental activities in the government-wide financial statements. Proprietary funds provide the same type of information as the government-wide financial statements, only in more detail. The proprietary fund financial statements provide separate information for the sewer utilities fund and the Public Facilities Management Foundation, which are considered to be major funds of the City of Cranston. The school lunch program fund is the sole non-major enterprise fund and is presented separately in the proprietary fund financial statements. The internal service fund is also presented separately in the proprietary fund financial statements. The basic proprietary fund financial statements can be found on Exhibits V, VI, and VII of this report. Fiduciary funds. Fiduciary funds are used to account for resources held for the benefit of parties outside the government. Fiduciary funds are not reflected in the government-wide financial statements because the resources of those funds are not available to support the City’s own programs. The accounting used for fiduciary funds is much like that used for proprietary funds. The basic fiduciary fund financial statements can be found on Exhibits VIII, and IX of this report. Notes to the basic financial statements. The notes provide additional information that is essential to a full understanding of the data provided in the government-wide and fund financial statements. The notes to the financial statements can be found following the Exhibits. Other information. In addition to the basic financial statements and accompanying notes, this report also presents certain required supplementary information concerning budgetary compliance schedules for the General Fund and the Special Revenue Fund-School Unrestricted, as well as the City’s progress in funding its obligation to provide pension and other post-employment benefits to its employees. Required supplementary information can be found following the notes. The combining statements referred to earlier in connection with non-major governmental funds are presented immediately following the required supplementary information.

7
MANAGEMENT’S DISCUSSION AND ANALYSIS, CONTINUED JUNE 30, 2019 GOVERNMENT-WIDE FINANCIAL ANALYSIS Statement of Net Position Included below is a condensed Statement of Net Position for the City of Cranston. The condensed format allows the reader to view the overall financial position of the City.
Condensed Statement of Net Position
As of June 30 (In Millions)
Governmental Activities Business-type Activities Total 2019 2018 2019 2018 2019 2018 Assets: Current and other assets ............ $ 81.1 $ 76.4 $ 26.4 $ 23.3 $ 107.5 $ 99.7 Capital assets ............................. 138.6 125.8 71.2 72.6 209.8 198.4 Total Assets ................................. 219.7 202.2 97.6 95.9 317.3 298.1 Deferred Outflow of Resources ... 57.4 107.1 0.5 0.5 57.9 107.6 Total Assets & Deferred Outflows of Resources .......... 277.1 309.3 98.1 96.4 375.2 405.7 Liabilities: Long-term liabilities outstanding ........................... 555.9 546.7 19.3 20.2 575.2 566.9 Other liabilities ......................... 27.6 24.0 7.8 6.2 35.4 30.2 Total Liabilities ........................... 583.5 570.7 27.1 26.4 610.6 597.1 Deferred Inflows of Resources ... 27.4 47.0 5.0 6.7 32.4 53.7 Total Liabilities & Deferred Inflows of Resources ............ 610.9 617.7 32.1 33.1 643.0 650.8 Net Position: Net investment in capital assets . 40.4 39.3 53.0 71.5 93.4 110.8 Restricted-Debt Service ............. - - 0.4 0.4 0.4 0.4 Unrestricted ............................... (374.2) (347.7) 12.6 (8.6) (361.6) (356.3) Total Net Position ................. $ (333.8) $ (308.4) $ 66.0 $ 63.3 $ (267.8) $ (245.1) The composition of net position and the changes in net position over a period of time serves as a useful indicator of the City’s financial position. The City’s total liabilities at June 30, 2019, exceed assets by $267.8 million and were comprised of $(333.8) million from governmental activities and $66.0 million from business-type activities. For the fiscal year ending June 30, 2019, $(361.6) million of the total $(267.8) million in net position is unrestricted.

8
MANAGEMENT’S DISCUSSION AND ANALYSIS, CONTINUED JUNE 30, 2019 GOVERNMENT-WIDE FINANCIAL ANALYSIS (CONTINUED) Statement of Net Position (Continued) Net investment in capital assets comprises $93.4 and $110.8 million of Net Position at June 30, 2019 and 2018, respectively. This category reflects the total net investment in capital assets (vehicles, equipment, etc.) net of any related debt used to acquire capital assets. These capital assets are used to provide services to citizens and do not represent resources available for future spending. Although the City’s investment in its capital assets is reported net of related debt, it should be noted that the resources needed to repay this debt must be provided from other sources, since the capital assets cannot be used to liquidate these liabilities. The second category of Net Position, restricted Net Position, represents Net Position that are subject to external restriction on how they may be used. Restricted Net Position as of June 30, 2019 totaled $0.4 million for debt service.
Normal Impacts There are six basic (normal) transactions that will affect the comparability of the Net Position summary presentation: Net Results of Activities - which will impact (increase/decrease) current assets and unrestricted net position. Borrowing for Capital - which will increase current assets and long-term debt. Spending Borrowed Proceeds on New Capital - which will reduce current assets and increase capital assets. There is a second impact, an increase in net investment in capital assets and an increase in related net debt which will not change the net investment in capital assets. Spending of Non-borrowed Current Assets on New Capital - which will (a) reduce current assets and increase capital assets and (b) reduce unrestricted net position and increase net investment in capital assets. Principal Payment on Debt - which will (a) reduce current assets and reduce long-term debt and (b) reduce unrestricted net position and increase net investment in capital assets. Reduction of Capital Assets through Depreciation - which will reduce capital assets and net investment in capital assets. Governmental Activities-Condensed Statements of Net Position The category of “Current and Other Assets” was $81.1 million at June 30, 2019. This category consisted primarily of “Cash” of $31.8 million as of June 30, 2019. This balance was attributable to a strong tax collection trend. “Receivables-Property Taxes” of $8.3 million, “Net pension asset” of $15.9 million. “Receivables-Intergovernmental was $19.0 million, “Advanced deposits-hospitalization” was $5.0 million and net other receivables accounted for $1.1 million. “Deferred Outflow of Resources” was $57.4 million at June 30, 2019 and was comprised of $53.4 million related to pensions, $3.5 million related to OPEB and $0.5 million from the deferred charge on refunding. “Total liabilities” at June 30, 2019 were $583.5 million. That included long-term liabilities outstanding of $555.9 million, composed primarily of $103.3 million in general obligation bonds and leases payable (used to fund various capital projects such as school construction and playground construction and improvements), $404.3 million in outstanding pension obligations and $48.3 million in OPEB obligations. Current liabilities total $27.6 million at June 30, 2019 and were composed $10.0 million in accounts payable, $4.3 of accrued liabilities, unearned revenue of $3.8 million, $8.0 million in current portion of long-term debt. $0.7 million due to other funds and claims and judgements of $0.8 million. “Deferred Inflow of Resources” of $27.4 million of which $14.2 million related to the City’s pension liabilities, $5.5 million related to the OPEB liability and $7.7 million related to advanced tax collections. Total net position at June 30, 2019 was $(333.8) million and was comprised of unrestricted of $(374.2) and “Net Investment in Capital Assets” of $40.4 million.

9
MANAGEMENT’S DISCUSSION AND ANALYSIS, CONTINUED JUNE 30, 2019 GOVERNMENT-WIDE FINANCIAL ANALYSIS (CONTINUED) Business-Type Activities-Condensed Statements of Net Position For business-type activities, such as the Sewer Enterprise Fund, “Current and Other Assets” of $26.4 million consisted primarily of $15.8 million in cash which was available to support the current operations of the Enterprise Funds, $1.2 million of restricted cash, $0.4 million of cash held in escrow, receivables of $4.2 million, $4.5 million due from other funds and $0.3 million of other assets. “Deferred Outflow of Resources” was $0.5 million at June 30, 2019 and was comprised of $0.5 million related to pensions. Long-term liabilities of $19.3 million were comprised primarily of $17.2 million of “Long-term liabilities due in more than one year” which represents the non-current portion of long-term liabilities, primarily general obligation bonds used to finance the capital operations of the Sewer Plant as well as SRF (state revolving fund) loan from Rhode Island Infrastructure Bank, $1.9 million of “Net pension liability” and “Net OPEB obligations” of $0.2 million. Other liabilities of $7.8 million consisted primarily of $3.7 million of “Accounts payable”, and $1.1 million for the “Current portion of long-term bonds payable”, “Retainage payable” of $0.8 million, “Accrued interest payable” of $0.2 million and “Unearned revenue” of $2.0 million. “Deferred Inflows of Resources” of $5.0 million represents $4.9 million for the “Deferred sewer lease arrangement” and $0.1 million from resources related to pensions. The total net position for the Business-type Activities as of June 30, 2019 was $66.0 million. Net investment in capital assets was the major component of net position for business-type activities and amounted to $53.0 million at June 30, 2019. As stated above, in the government-wide analysis of the Statement of Net Position $0.4 million was restricted for debt service and $12.6 million was designated “Unrestricted”. Statement of Activities A condensed Statement of Activities for the City of Cranston is presented below listing the major categories of revenues and expenses for the fiscal years ended June 30, 2019 and 2018.
Condensed Statement of Activities Year Ended June 30 (In Millions)
Governmental Activities Business-Type Activities Total 2019 2018 2019 2018 2019 2018 Revenues: Program revenues: Charges for services ............................. $ 19.6 $ 18.7 $26.4 $26.3 $46.0 $ 45.0 Operating grants and contributions ...... 85.5 82.7 2.7 2.6 88.2 85.3 Capital grants and contributions ........... 0.1 0.1 0.2 0.1 0.3 General Revenues: Property taxes ....................................... 187.2 190.1 187.2 190.1 Gain on sale of property ....................... State special funding for pensions ........ 10.3 10.8 10.3 10.8 Motor vehicle phase-out taxes .............. 5.9 3.5 5.9 3.5 Investment income ............................... 1.2 0.8 0.6 0.4 1.8 1.2 Transfers ............................................... - - - - Other ..................................................... 3.0 2.9 0.2 0.2 3.2 3.1 Total revenues .................................. 312.8 309.6 29.9 29.7 342.7 339.3

10
MANAGEMENT’S DISCUSSION AND ANALYSIS, CONTINUED JUNE 30, 2019 GOVERNMENT-WIDE FINANCIAL ANALYSIS (CONTINUED) Statement of Activities (Continued) Governmental Activities Business-Type Activities Total 2019 2018 2019 2018 2019 2018 Program Expenses: General government ............................. $ 17.4 $ 16.0 $ 17.4 $ 16.0 Public safety ......................................... 108.6 75.8 108.6 75.8 Public works ......................................... 16.7 16.7 16.7 16.7 Education .............................................. 180.0 177.3 $6.7 $6.1 186.7 183.4 Parks and recreation ............................. 3.7 3.5 3.7 3.5 Libraries ............................................... 3.8 3.6 3.8 3.6 Senior services ...................................... 3.2 3.0 3.2 3.0 Community development ..................... 1.4 1.3 1.4 1.3 Sewer .................................................... 20.5 20.2 20.5 20.2 Interest and other costs ......................... 3.4 2.1 3.4 2.1 Total expenses .................................. 338.2 299.3 27.2 26.3 365.4 325.6 Change in net position........................... (25.4) 10.3 2.7 3.4 (22.7) 13.7 Net Position – July 1 ............................. (308.4) (318.7) 63.3 59.9 (245.1) (258.8) Net Position – June 30 .......................... $(333.8) $ (308.4) $ 66.0 $ 63.3 $ (267.8) $ (245.1) The Condensed Statement of Net Activities presents revenues, expenses and changes in net position separately for governmental activities and business-type activities. The condensed format allows for presentation of program revenues (charges for services, operating grants and contributions, and capital grants and contributions) followed by a listing of general revenues to support the City’s overall government or business-type activities. Expenses are presented on a functional basis, with depreciation on capital assets directly allocated to the related expense. Governmental Activities-Condensed Statement of Activities General revenues include all revenues not required to be reported as “program revenue”. The total of other “general revenues” for the fiscal years ending June 30, 2019 and 2018 were $207.6 million and $208.1 million, respectively. Included in these totals were $187.2 and $190.1 million in property taxes for the years ended June 30, 2019 and 2018. “Program expenses” are presented in the Condensed Statement of Activities by function and total $338.2 and $299.3 million including interest on long-term debt for the fiscal years June 30, 2019 and 2018, respectively. “Changes in net position” decreased $35.7 million to $(25.4) million from $10.3 million, for the years ended June 30, 2019 and 2018 as restated, respectively. The change resulted primarily from an increase in public safety and education expense related to the recognition of OPEB expenses in the prior fiscal year.
11
MANAGEMENT’S DISCUSSION AND ANALYSIS, CONTINUED JUNE 30, 2019 GOVERNMENT-WIDE FINANCIAL ANALYSIS (CONTINUED) Business-Type Activities – Condensed Statement of Activities Business-Type Activities provided by the City of Cranston consists primarily of the operation of the wastewater facility commonly known as the Sewer Enterprise Fund. Respectively, in fiscal years 2019 and 2018, the City generated $29.6 million in total revenues. The majority of revenues for this fund consist of charges for services of which amounted to $26.4 and $26.3 respectively, of the total revenues. The total amount of expenses for business-type activities were $27.2 and $26.3 million, for the fiscal years ended June 30, 2019 and 2018, respectively. The “Change in Net Position” decreased $0.7 million to $2.7 million from $3.4 million for the fiscal years ended June 30, 2019 and 2018, respectively. This activity increased the “Business-Type Net Position” for the fiscal year ended June 30, 2019 to $66.0 million as compared to $63.3 million for the fiscal year ended June 30, 2018. Financial Analysis of City’s Funds Governmental Funds The City of Cranston’s governmental funds consists of three major funds. The major funds are the City’s General Fund, the School Department unrestricted operating fund and the school department bond fund. Presented below is a condensed Balance Sheet for the three major funds of the Governmental funds. Combined fund balances for all the Governmental Funds was $33.8 million. Fund balance was comprised of $0.3 million “Non-spendable” fund balances, $16.9 million “Restricted” fund balances and $0.9 million “Committed” fund balances and $15.7 million of “Unassigned” fund balances. Under the modified-accrual basis for Fund Financial Statements, the emphasis is on accounting for current financial resources of the City. Assets of $69.7 million include primarily $30.9 million in “Cash”, $5.7 million in “Taxes Receivable”, $19.0 million in “Intergovernmental Receivables”, “Loans” of $2.8 million, “Other Receivables” of $1.8 million, “Prepaid” of $0.9 million, “Advance deposits-hospitalization” of $0.2 million, “Due from Other Funds” of $8.4 million. “Total liabilities and deferred inflows” of $35.8 million consisted of $10.4 million of “Accounts Payable”, $7.5 million in “Due to Other Funds”, $11.5 million in “Unearned Revenue”, $1.4 million of Accrued Payroll and other liabilities and $5.0 million of “Unavailable Revenue”.

12
MANAGEMENT’S DISCUSSION AND ANALYSIS, CONTINUED JUNE 30, 2019
Condensed Balance Sheet As of June 30 (In Millions)
General School School Total Fund Unrestricted Bond Fund Major Funds
2019 2018 2019 2018 2019 2018 2019 2018
Assets: Current and other $39.3 $38.2 $7.5 $7.0 $11.1 $3.2 $57.9 $48.4 Total Assets 39.3 38.2 7.5 7.0 11.1 3.2 57.9 48.4
Liabilities: Other liabilities 20.4 17.2 3.2 1.7 3.1 - 26.7 18.9 Total Liabilities 20.4 17.2 3.2 1.7 3.1 - 26.7 18.9
Fund Balance: Non-spendable 0.2 0.2 0.1 0.1 - - 0.3 0.3 Restricted 0.4 0.5 3.4 4.4 8.0 3.2 11.8 8.1 Committed - - 0.8 0.8 - - 0.8 0.8 Assigned - - - - - - - - Unassigned 18.3 20.3 - - - - 18.3 20.3
Total Fund Balance $18.9 $21.0 $4.3 $5.3 $8.0 $3.2 $31.2 $29.5
General Fund - Condensed Balance Sheet The General Fund’s total assets of $39.3 million consists primarily of $23.7 million in “Cash” $5.7 million of “Taxes Receivable” $6.8 million of “Intergovernmental Receivables”, “Due from Other Funds” of $2.2 million, “Prepaids” of $0.7 million and “Advanced Deposits-hospitalization” of $0.2 million. Total liabilities for the General Fund were $20.4 million. “Accounts Payable” amounted to $2.0 million, $7.8 million represented “Unearned Revenue”, $4.4 million in “Due to Other Funds”, $1.2 million of accrued liabilities and $5.0 million of “Unavailable Revenue”. As of June 30, 2019 the City’s fund balance was $18.9 million of which $0.2 million was “Non-spendable”, $0.4 million was “Restricted”, and $18.3 million was “Unassigned”. School Department - Condensed Balance Sheet The School Department’s total assets were $7.5 million. The majority of that consisted primarily of $6.2 of “Due from Other Funds”, “Prepaid” of $0.1 million and “Other” assets of $1.2 million. Liabilities for the School Department totaled $3.2 million. The majority of that consisted of $3.1 million of “Accounts Payable” and $0.1 million “Due to Other Funds”. For the fiscal year ending June 30, 2019, the School Department had a fund balance of $4.3 million. This was comprised of $0.1 million “Non-spendable”, $3.4 million “Restricted and $0.8 million of “Committed” fund balance. School Bond Fund - Condensed Balance Sheet The School Bond Fund total assets were $11.1 million. This consisted primarily of $11.1 of “Intergovernmental” receivables. Liabilities for the School Bond Fund totaled $3.1 million. The majority of that consisted of $2.8 million of “Accounts Payable” and $0.3 million “Retainage Payable”. For the fiscal year ending June 30, 2019, the School Bond Fund had a fund balance of $8.0 million. The entire balance was classified as “Restricted”.

13
MANAGEMENT’S DISCUSSION AND ANALYSIS, CONTINUED JUNE 30, 2019
Condensed Statement of Revenues, Expenditures and Changes in Fund Balances A condensed Statement of Revenues, Expenditures and Changes in Fund Balances for the City of Cranston is presented below listing the major categories of revenues and expenditures for the fiscal years ended June 30, 2019 and 2018. The major funds for the City of Cranston are the “General Fund”, the “School Department” and the “School Bond Fund”. The fund reporting format, also presented on a functional basis, presented in “Exhibit D - Statement of Revenues, Expenditures and Changes in Fund Balance Governmental Funds” presents all revenue types followed by the expenditures of the City. The fund financial statements report current year capital expenditures and do not report depreciation on capital assets. Likewise, principal payments on long-term liabilities are reported as current year expenditures and are not offset against the related long-term liability as within the Government-wide Financial Statements. The major source of revenues for the City comes from “General Property Taxes”. For the years ending June 30, 2019, and 2018, the City collected $188.1, and $190.0 million of property taxes, respectively. Total revenues for all major governmental funds for the years ended June 30, 2019 and 2018, were $297.2, and $293.6 million, respectively. For the major governmental funds, the total expenditures for the years ending June 30, 2019, and 2018, were $308.6, and $296.1 million, respectively. For the year ended June 30, 2019, General Fund revenues exceeded expenditures by $91.9 million before other financing sources (uses) as compared to $93.7 million for the period ending June 30, 2018.
Condensed Statement of Revenues, Expenditures and Changes in Fund Balances Year Ended June 30
(In Millions)
General School School Total Fund Unrestricted Bond Fund Major Funds
2019 2018 2019 2018 2019 2018 2019 2018
Revenues: General Revenues: Property Taxes 188.1 190.0 - - 188.1 190.0 Intergovernmental 19.7 18.2 61.0 58.2 80.7 76.4 Charges for services 15.4 15.2 1.5 1.3 16.9 16.5 Investment income 0.8 0.4 - 0.8 0.4 State on behalf pension - - 8.1 7.7 8.1 7.7 Other 1.2 $1.2 1.4 1.4 - - 2.6 2.6 Total Revenues 225.2 225.0 72.0 68.6 - - 297.2 293.6
Expenditures: Current: General Government 10.8 10.5 10.8 10.5 Public Safety 85.3 84.0 85.3 84.0 Public Works 15.7 16.3 15.7 16.3 Education - - 167.1 162.5 167.1 162.5 Parks and Recreation 3.7 3.5 3.7 3.5 Public Libraries 3.6 3.5 3.6 3.5 Senior Services 3.2 3.0 3.2 3.0 Other 0.2 0.2 0.2 0.2Debt Service: Principal 7.7 7.3 7.7 7.3 Interest and other costs 3.1 3.0 0.2 0.1 3.3 3.1 Capital expenditures - - - - 8.0 2.2 8.0 2.2 Total Expenditures 133.3 131.3 167.1 162.5 8.2 2.3 308.6 296.1 Excess (deficiency) of revenue over expenditures
91.9
93.7
(95.1)
(93.9)
(8.2)
(2.3)
(11.4)
(2.5)

14
Other Financing Sources (Uses):
Issuance of debt 11.3 5.0 11.3 5.0 Bond premium 1.8 0.4 1.8 0.4 Transfers in 94.1 93.8 94.1 93.8 Transfers out (93.9) (93.6) (93.9) (93.6) Net Other Financing Sources (Uses)
(93.9)
(93.6)
94.1
93.8
13.1
5.4
13.3
5.6
Net change in fund balance (2.0) 0.1 (1.0) (0.1) 4.9 3.1 1.9 3.1 Fund Balance July 1 21.0 20.9 5.3 5.4 3.1 - 29.4 26.3 Fund Balance June 30 19.0 21.0 4.3 5.3 8.0 3.1 31.3 29.4
Review of Governmental Major Funds-Statement of Revenues, Expenditures and Changes in Fund Balances-General Fund The City’s General Fund had revenues of $225.2 million for the fiscal year ended June 30, 2019. This was comprised of $188.1 million in “General Property Taxes”, $19.7 million of “Intergovernmental” revenues, $15.4 million in “Charges for Services”, $0.8 million in “Investment Income”, and $1.2 million in “Other” revenue. Expenditures for the General Fund for fiscal year ended June 30, 2019 were $133.3 million. These expenditures consisted of $10.8 million in “General Government” expenditures, $85.3 million of “Public Safety” expenditures, $15.7 million of “Public Works” expenditures, $3.7 million of “Parks and Recreation” expenditures, $3.6 million of “Public Libraries” expenditures, $3.2 million of “Senior Services” expenditures, $0.2 million of “Other” expenditures, $7.7 million of “Debt Service Principal” expenditures, and $3.1 million of “Interest and Other Costs”. In addition to general operating expenses, the General Fund also had “Net Other Financing Uses” of $ 93.9 million. This was composed of a $(93.9) million of “Transfers Out” to the “School Department” for operations. The net change in fund balances was $(2.0) million for the fiscal year ended June 30, 2019. This decrease resulted primarily from an over expenditures in public services related to a chemical fire that occurred in fiscal year 2019. There were 21 fire fighters injured in this incident. That shortage resulted in increased over-time during their recovery as well as an increase to work-related medical coverage and replacement of damaged equipment. Review of Governmental Major Funds-Statement of Revenues, Expenditures and Changes in Fund Balances-School Department The “School Department” had revenues for the year ended June 30, 2019 of $72.0 million. This was derived from $61.0 million of “Intergovernmental” revenues, $1.5 million of “Charges for Services”, $8.1 million of “State on Behalf Pension Contribution” and $1.4 million of “Other Income”. Expenditures for the School Department totaled $167.1 million. This entire amount represents expenditures related to “Education”. In addition to general operating revenues, the School Department received $94.1 million of “Other Financing Sources”. This amount was comprised of “Transfers In” from the “General Fund” of $93.9 million for operations and $0.2 million from other school special revenue accounts. The net change in fund balance was ($1.0) million for the fiscal year ended June 30, 2019. This was due primarily to use of a capital reserve account for a capital project. Review of Governmental Major Funds-Statement of Revenues, Expenditures and Changes in Fund Balances-School Bond Fund Expenditures for the School Bond Fund totaled $8.2 million. This amount represents $8.0 million in “Capital Expenditures” and $0.2 million in “Interest and Other Costs” related to school construction projects.

15
MANAGEMENT’S DISCUSSION AND ANALYSIS, CONTINUED JUNE 30, 2019 Review of Governmental Major Funds-Statement of Revenues, Expenditures and Changes in Fund Balances-School Bond Fund (Continued) In addition to operating expenditures, the School Bond Fund had “Net Other Financing Sources” of $ 13.1 million. This was composed of $11.3 million of “Issuance of Debt” and $1.8 million of “Bond Premium”. These other financing sources were used to fund school construction projects. The net change in fund balance was $4.9 million for the fiscal year ended June 30, 2019. This was due primarily to the remainder of unspent bond proceeds as of June 30, 2019. Proprietary Funds The Proprietary Funds consist of the Sewer Fund, the Non-Major Programs and the Internal Service Funds. The major source of revenues consists of “Charges for Usage and Service” of $59.2 million. Total operating revenues were $65.6 million. Total operating expenses for the year ending June 30, 2019, for the Proprietary Funds were $63.7 million. The “Health Care Management” of the school department of $24.7 million, the “Contract Payments” of $16.6 million for sewer privatization, “Operation” expense of $6.3 million. “Personnel” cost of $2.3 million, “Claims” of $11.5 million and $2.3 million of “Depreciation” comprise the majority of the expenses. Net Non-Operating Income for the year ending June 30, 2019 was $0.2 million. The Proprietary Funds ended fiscal year 2019 with $2.1 million more in revenues than expenses. Total Net Position was $65.3 million at June 30, 2019, of that “Net Investment in Capital Assets” was $53.0 million, Restricted for Debt Service of $0.4 million and $11.9 million was “Unrestricted”. Total Net Position as of June 30, 2019 increased $2.1 million from $63.2 million to $65.3 million or 3.3%. Analysis of Significant Budget Variations in the General Fund For the year ended June 30, 2019, the General Fund Revenues were under budget projections by $1.0 million or 0.4%. General Fund expenditures were over budget by $0.9 million or 0.3%. This resulted in a $1.9 million deficit for the General Fund for the year ending June 30, 2019. Significant revenue variances include:
General Property Taxes – Favorable variance of $0.8 million due to the implementation of a new software system that allows taxpayers to pay via the internet as either an ACH or credit card payment and the state’s garnishment program of income tax refunds for outstanding motor vehicle taxes.
Intergovernmental – Unfavorable variance of $1.4 million from decrease in the amount budgeted by various departments for grants versus the amount actually received by departments for grants
Most of the departments within the City had minimal surpluses/deficits with regard to their expense budgets. The two exception to that were the law department and the fire department. They had a $0.7 million and a $2.4 million unfavorable variance, respectively. The law department’s over expenditures were related to personnel issues and the fire department’s were due to a chemical fire that occurred during the fiscal year that ended on June 30, 2019. The City was able to reduce these deficit to $0.9 million from savings within other departments.
16
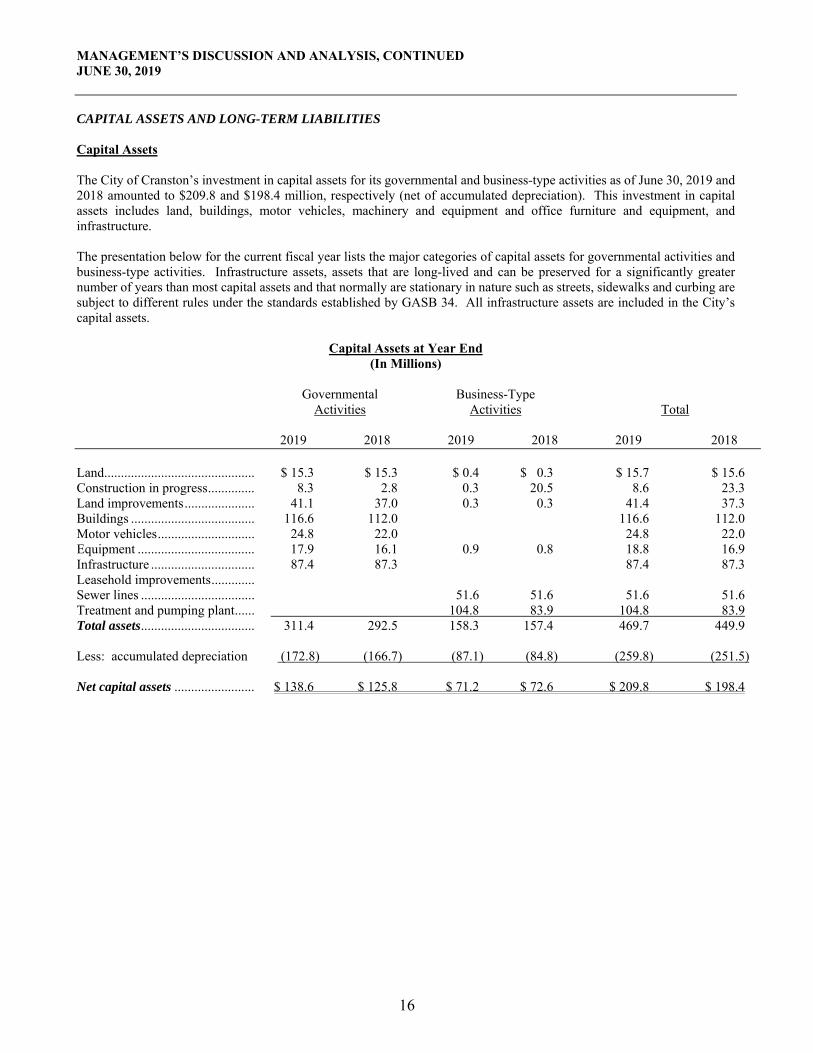
MANAGEMENT’S DISCUSSION AND ANALYSIS, CONTINUED JUNE 30, 2019 CAPITAL ASSETS AND LONG-TERM LIABILITIES Capital Assets The City of Cranston’s investment in capital assets for its governmental and business-type activities as of June 30, 2019 and 2018 amounted to $209.8 and $198.4 million, respectively (net of accumulated depreciation). This investment in capital assets includes land, buildings, motor vehicles, machinery and equipment and office furniture and equipment, and infrastructure. The presentation below for the current fiscal year lists the major categories of capital assets for governmental activities and business-type activities. Infrastructure assets, assets that are long-lived and can be preserved for a significantly greater number of years than most capital assets and that normally are stationary in nature such as streets, sidewalks and curbing are subject to different rules under the standards established by GASB 34. All infrastructure assets are included in the City’s capital assets.
Capital Assets at Year End (In Millions)
Governmental Business-Type Activities Activities Total 2019 2018 2019 2018 2019 2018 Land............................................. $ 15.3 $ 15.3 $ 0.4 $ 0.3 $ 15.7 $ 15.6 Construction in progress .............. 8.3 2.8 0.3 20.5 8.6 23.3 Land improvements ..................... 41.1 37.0 0.3 0.3 41.4 37.3 Buildings ..................................... 116.6 112.0 116.6 112.0 Motor vehicles ............................. 24.8 22.0 24.8 22.0 Equipment ................................... 17.9 16.1 0.9 0.8 18.8 16.9 Infrastructure ............................... 87.4 87.3 87.4 87.3 Leasehold improvements ............. Sewer lines .................................. 51.6 51.6 51.6 51.6 Treatment and pumping plant ...... 104.8 83.9 104.8 83.9 Total assets .................................. 311.4 292.5 158.3 157.4 469.7 449.9 Less: accumulated depreciation (172.8) (166.7) (87.1) (84.8) (259.8) (251.5) Net capital assets ........................ $ 138.6 $ 125.8 $ 71.2 $ 72.6 $ 209.8 $ 198.4

17
MANAGEMENT’S DISCUSSION AND ANALYSIS, CONTINUED JUNE 30, 2019 CAPITAL ASSETS AND LONG-TERM LIABILITIES (CONTINUED) Capital Assets (Continued) The City’s investment in capital assets for its governmental and business-type activities as of June 30, 2019 were $469.7 million less accumulated depreciation of $259.8 million for a net investment in capital assets of $209.8 million. Governmental Activities: Major capital asset additions during the fiscal year ended June 30, 2019 included the following:
$6.2 million in school renovations $1.7 million in recreational facilities and equipment upgrades $9.2 million for road repayment, storm drain repairs and equipment upgrades $0.5 million for library upgrades $0.5 million for bridge infrastructure replacement $5.3 million for fire and police equipment and station upgrades $1.5 million for building improvements
Business-Type Activities: Major capital asset additions during the fiscal year ended June 30, 2019 included the following:
$20.9 million of construction in progress project completed for improvements at the treatment plant
Additional information on the City’s capital assets can be found on Note 3. C. of this report. Long-Term Liabilities As of June 30, 2019, the governmental activities had total long-term obligations of $565.3 million. Of that, $404.4 million was pension related debt, $48.3 million was for post-retirement health benefits $13.8 million of compensated absences and $98.8 million related to bonded debt guaranteed by the City’s assets. Based on an actuarial valuations completed as of July 1, 2019 for governmental activities, the net pension obligation liability for unpaid pension contributions decreased by $0.4 million from $404.8 million at June 30, 2018 to $404.4 million at June 30, 2019. The net other post-employment benefit obligation (OPEB) liability for governmental activities decreased $2.5 million from $50.8 million at June 30, 2018 to $48.3 million at June 30, 2018. Additional information can be found in Note 3.E. The business-type activities had total long-term obligations of $20.4 million. Of that, $18.3 million related to State Revolving Loans (SRF) from Rhode Island Infrastructure Bank (these funds are available for projects related to clean water), $1.9 million in net pension obligations, $0.2 million in net post-retirement health benefit obligations. Based on an actuarial valuations completed as of July 1, 2019 for business-type activities, the net pension obligation liability for unpaid pension contributions increased by $0.1 million from $1.8 million at June 30, 2018 to $1.9 million at June 30, 2019. The net other post-employment benefit obligation (OPEB) liability for business-type activities increased from $0.1 million at June 30, 2018 by $0.1 million to $0.2 million at June30, 2019. Additional information can be found in Note 3.E.

18
MANAGEMENT’S DISCUSSION AND ANALYSIS, CONTINUED JUNE 30, 2019 CAPITAL ASSETS AND LONG-TERM LIABILITIES (CONTINUED) Debt Outstanding For the year ending June 30, 2019, the City had $98.8 million in debt (bonds, notes, etc.) outstanding as compared to $87.3 million at June 30, 2018, a net increase of $11.5 million or 13.2% (considering debt issuances and retirements). The key factors for this increase was the issuance of $15.9 million in general obligation bonds and $11.3 million of school borrowing offset by the principal repayments on outstanding issues. For the year ending June 30, 2019, the Business-Type Activities had $18.3 million in debt (bonds, notes, etc.) outstanding as compared to $19.4 million at June 30, 2018, a net decrease of $1.1 million or 5.7% (considering debt retirements). The key factor for this decrease was principal repayments of $1.1 million.
Outstanding Debt, at June 30 (In Millions)
2019 2018 Governmental: General obligation bonds .......................................................................................... $ 96.4 $73.7 Bond anticipation notes……………………………………………………………. 0.0 10.8 Capital lease ............................................................................................................. 2.4 2.8 Subtotal ................................................................................................................ 98.8 87.3 Business-type: Sewer revolving loans ............................................................................................ 18.3 19.4 Subtotal ................................................................................................................ 18.3 19.4 Total ..................................................................................................................... $ 117.1 $ 106.7 Principal payments of $8.4 million and $1.1 million were made in the governmental and business-type activities, respectively, during fiscal year 2019. Except as explained below, under Rhode Island law the City may not, without special statutory authorization, incur any debt that would increase its aggregate indebtedness not otherwise excepted by law to an amount greater than 3% of the taxable property of the City. Deducted from the computation of aggregate indebtedness is the amount of any borrowing in anticipation of taxes authorized by law and the amount of any sinking funds maintained by the City. There is currently no outstanding debt of the city subject to the 3% debt limit. The current 3% debt limit of the City is $239.2 million based on taxable property as of December 31, 2017, of approximately $8.0 billion. On June 30, 2019, the City had $98.4 million of debt outstanding that is outside the 3% debt limit. The City’s bond ratings are as follows:
Standard & Poor’s : “AA-” Fitch Ratings: “AA-” Moody’s Investors Service : “A1”
Economic Factors and Next Year’s Budget and Rates
As noted previously, the Fiscal Year 2020 operating budget was passed by a majority vote of the City Council. Property tax collections were assumed to be collected at 98.9% of the current levy.
The City budgeted approximately $21.5 million for Police and Fire Pension Fund contributions and $4.5 million for
Other Post-Employment Benefits (OPEB). \

19
MANAGEMENT’S DISCUSSION AND ANALYSIS, CONTINUED JUNE 30, 2019 Unemployment Statistics The table below presents the most recent labor market information summary for not seasonally adjusted unemployment rates for the fiscal years ended June 30th: Annualized 2010 2011 2012 2013 2014 2015 2016 2017 2018 2019
City of Cranston ...................... 11.7% 10.6% 10.4% 9.3% 7.2% 5.9% 5.0% 4.0% 3.7% 3.3% State of Rhode Island .............. 10.9 10.5 10.1 8.9 7.3 5.8 5.0 4.1 3.7 3.3 United States ........................... 9.6 9.3 8.4 7.8 6.3 5.5 5.1 4.5 4.2 3.8 _______________________________________________ Source: Rhode Island Department of Labor and Training. Request for Information This financial report is designed to provide a general overview of the City’s finances for all those with an interest in the City of Cranston’s finances. Questions concerning any of the information provided in this report or request for additional financial information should be addressed to: Finance Director City of Cranston 869 Park Avenue Cranston, RI 02910

Basic Financial Statements

EXHIBIT ICITY OF CRANSTON, RHODE ISLANDSTATEMENT OF NET POSITIONJUNE 30, 2019
Governmental Business-TypeActivities Activities Total
Assets
Current Assets:Cash and cash equivalents $ 31,836,617 $ 15,845,644 $ 47,682,261 Receivables:
Property taxes 8,255,574 8,255,574 Sewer assessments and user fees, net 1,121,884 1,121,884 Intergovernmental 19,029,965 2,965,459 21,995,424 Loans 2,779,666 2,779,666 Other 1,762,025 1,762,025
Prepaids 877,492 45,108 922,600 Advance deposits - hospitalization 4,157,456 4,157,456 Inventory 64,189 64,189 Other assets 3,792 3,792 Due from fiduciary fund 120,000 120,000 Internal balances (4,478,632) 4,478,632 -
Total current assets 64,343,955 24,520,916 88,864,871
Noncurrent Assets: Advance deposits - hospitalization 853,000 853,000 Net pension asset 15,852,374 193,440 16,045,814 Restricted cash - debt service reserve 1,195,219 1,195,219 Held in escrow 418,467 418,467
Total noncurrent assets 16,705,374 1,807,126 18,512,500
Capital Assets: Nondepreciable:
Land 15,299,094 342,712 15,641,806 Construction in progress 8,367,334 319,445 8,686,779
Depreciable (net of accumulated depreciation): Land improvements 24,400,692 3,833 24,404,525 Buildings and leasehold improvements 66,202,766 45,524 66,248,290 Sewer service to customers 71,637 71,637 Treatment and pumping plant 52,947,022 52,947,022 Vehicles 8,140,109 28,565 8,168,674 Machinery, equipment and furniture 3,877,608 312,449 4,190,057 Infrastructure 12,348,490 17,151,508 29,499,998
Total net capital assets 138,636,093 71,222,695 209,858,788
Total noncurrent assets 155,341,467 73,029,821 228,371,288
Total assets 219,685,422 97,550,737 317,236,159
Deferred Outflows of Resources: Deferred charge on refunding 538,908 538,908 Deferred outflows of resources related to pensions 53,442,476 475,381 53,917,857 Deferred outflows of resources related to OPEB 3,452,750 41,475 3,494,225
57,434,134 516,856 57,950,990
Total Assets and Deferred Outflows of Resources $ 277,119,556 $ 98,067,593 $ 375,187,149
(Continued on next page)
20

EXHIBIT ICITY OF CRANSTON, RHODE ISLANDSTATEMENT OF NET POSITION (CONTINUED)JUNE 30, 2019
Governmental Business-TypeActivities Activities Total
Liabilities
Current Liabilities: Accounts payable $ 9,980,140 $ 3,676,355 $ 13,656,495 Accrued liabilities 51,707 51,707 Accrued payroll 1,227,299 1,613 1,228,912 Compensated absences 1,383,607 36,315 1,419,922 Accrued interest payable 1,409,517 172,158 1,581,675 Retainage payable 240,026 808,790 1,048,816 Unearned revenue 3,778,061 1,980,087 5,758,148 Due to fiduciary fund 758,897 758,897 Claims payable 770,448 770,448 Long-term liabilities due within one year 7,995,058 1,091,967 9,087,025
Total current liabilities 27,594,760 7,767,285 35,362,045
Noncurrent Liabilities: Net pension liability 404,354,137 1,946,231 406,300,368 Net OPEB liability 48,257,356 179,552 48,436,908 Long-term liabilities due in more than one year 103,316,762 17,161,033 120,477,795
Total noncurrent liabilities 555,928,255 19,286,816 575,215,071
Total liabilities 583,523,015 27,054,101 610,577,116
Deferred Inflows of Resources: Advanced tax collections 7,681,866 7,681,866 Deferred sewer lease arrangement 4,866,643 4,866,643 Deferred inflows of resources related to pensions 14,157,652 130,148 14,287,800 Deferred inflows of resources related to OPEB 5,546,679 689 5,547,368
27,386,197 4,997,480 32,383,677 Total liabilities and deferred inflows of resources 610,909,212 32,051,581 642,960,793
Net Position: Net investment in capital assets 40,421,468 52,969,695 93,391,163 Restricted for:
Debt Service 418,467 418,467 Unrestricted (374,211,124) 12,627,850 (361,583,274)
Total net position (333,789,656) 66,016,012 (267,773,644)
Total Liabilities, Deferred Inflows of Resources and Net Position $ 277,119,556 $ 98,067,593 $ 375,187,149
The accompanying notes are an integral part of these financial statements
21

EXHIBIT IICITY OF CRANSTON, RHODE ISLANDSTATEMENT OF ACTIVITIES
FOR THE YEAR ENDED JUNE 30, 2019
Operating CapitalCharges for Grants and Grants and Governmental Business-Type
Functions/Programs Expenses Services Contributions Contributions Activities Activities Total
Governmental Activities: General government $ 17,435,819 $ 8,083,806 $ 12,195,457 $ $ 2,843,444 $ $ 2,843,444 Public safety 108,645,221 6,561,184 1,410,056 65,608 (100,608,373) (100,608,373) Public works 16,677,300 1,321,215 32,393 (15,323,692) (15,323,692) Education 179,996,641 1,447,882 70,271,116 (108,277,643) (108,277,643) Parks and recreation 3,716,927 400,370 (3,316,557) (3,316,557) Public libraries 3,740,372 75,000 599,627 (3,065,745) (3,065,745) Senior services 3,202,095 1,727,304 (1,474,791) (1,474,791) Community development 1,425,753 1,020,835 (404,918) (404,918) Interest expense 3,417,594 (3,417,594) (3,417,594)
Total governmental activities 338,257,722 19,616,761 85,529,484 65,608 (233,045,869) - (233,045,869)
Business-Type Activities: Sewer fund 20,543,184 22,816,372 2,273,188 2,273,188 Education 6,664,472 3,618,125 2,755,615 (290,732) (290,732)
Total business-type activities 27,207,656 26,434,497 2,755,615 - - 1,982,456 1,982,456
Totals $ 365,465,378 $ 46,051,258 $ 88,285,099 $ 65,608 (233,045,869) 1,982,456 (231,063,413)
General Revenues: Property taxes 187,181,594 187,181,594
Motor vehicle phase-out taxes 5,915,970 5,915,970 State special funding for pension 10,371,555 137,640 10,509,195 Other income 2,970,801 2,970,801 Investment income 1,198,487 632,767 1,831,254 Total general revenues 207,638,407 770,407 208,408,814 Change in Net Position (25,407,462) 2,752,863 (22,654,599) Net Position - July 1, 2018 (308,382,194) 63,263,149 (245,119,045) Net Position - June 30, 2019 $ (333,789,656) $ 66,016,012 $ (267,773,644)
Program RevenuesNet Revenues (Expenses) and
Changes in Net Position
The accompanying notes are an integral part of these financial statements
22

EXHIBIT IIICITY OF CRANSTON, RHODE ISLAND BALANCE SHEET GOVERNMENTAL FUNDS JUNE 30, 2019
Other TotalGeneral School School Governmental Governmental
Fund Unrestricted Bond Fund Funds Funds
Assets:
Cash $ 23,702,970 $ 1,087 $ $ 7,192,204 $ 30,896,261 Receivables: Property taxes, net 5,711,532 5,711,532 Intergovernmental 6,797,970 11,102,851 1,127,895 19,028,716 Loans 2,779,666 2,779,666 Other 142,002 1,178,333 559,708 1,880,043 Security deposits 9,249 9,249 Prepaids 736,816 135,219 872,035 Advance deposits - hospitalization 207,000 207,000 Due from other funds 2,048,260 6,169,848 64,824 8,282,932
Total Assets $ 39,346,550 $ 7,484,487 $ 11,102,851 $ 11,733,546 $ 69,667,434
Liabilities and Fund Balances
Liabilities:
Accounts payable $ 2,000,561 $ 3,103,577 $ 2,814,774 $ 2,442,148 $ 10,361,060 Accrued payroll 1,120,987 106,317 1,227,304 Accrued liabilities 49,989 1,718 51,707 Retainage payable 240,026 240,026 Due to other funds 4,430,938 99,974 2,946,776 7,477,688 Unearned revenue 3,668,462 3,668,462
Total liabilities 7,602,475 3,205,269 3,054,800 9,163,703 23,026,247
Deferred Inflows: Unavailable revenue - property taxes 5,012,705 5,012,705 Advanced tax collections 7,791,465 7,791,465
Total deferred inflows of resources 12,804,170 - - - 12,804,170
Total liabilities and deferred inflows 20,406,645 3,205,269 3,054,800 9,163,703 35,830,417
Fund Balances: Nonspendable 207,000 135,219 342,219 Restricted 353,193 3,337,595 8,048,051 5,133,786 16,872,625 Committed 44,043 806,404 29,490 879,937 Unassigned 18,335,669 (2,593,433) 15,742,236
Total fund balances 18,939,905 4,279,218 8,048,051 2,569,843 33,837,017
Total Liabilities, Deferred Inflows and Fund Balances $ 39,346,550 $ 7,484,487 $ 11,102,851 $ 11,733,546 $ 69,667,434
(Continued on next page)
23

EXHIBIT IIICITY OF CRANSTON, RHODE ISLANDRECONCILIATION OF FUND BALANCETO NET POSITION OF GOVERNMENTAL ACTIVITIESJUNE 30, 2019
Amounts reported for governmental activities in the statement of net position (Exhibit I) areDifferent from the Governmental Fund Balance Sheet. The Details of this Difference are as follows:
Total Fund Balance (Exhibit III, Page 1) $ 33,837,017
Capital Assets Used In Governmental Activities are not Financial Resources and, Therefore, are not Reported in the Funds:
Total capital assets $ 311,416,264 Accumulated depreciation (172,780,172)
138,636,092
Other Long-Term Assets are not Available to Pay for Current Period Expenditures and, Therefore, are Deferred in the Funds:
Property tax, interest and lien accrual, (net) 2,544,042Unearned tax revenues (net of an allowance for uncollectible) are recorded in the funds, but are not deferred under the measurement focus employed in the Statement of Net Position 5,012,705Net pension asset 15,852,374Deferred charge on refunding 538,908Deferred outflows of net pension 53,442,476 Deferred outflows of net OPEB 3,452,750
Internal Service Fund is Used by Management to Charge the Cost of Self-Insurance to Individual Departments:
The assets and liabilities of the internal service fund are included in governmental
activities in the statement of net position (685,252)
Some Liabilities, Including Bonds Payable, are not Due and Payable in the Current Period and, Therefore, are not Reported in the Funds:
Bonds and notes payable (89,943,000) Capital lease (2,340,000) Unamortized premium on bonds payable (6,470,533) Compensated absences (13,836,066) Deferred salary (105,828) Net pension liability (404,354,137) Net OPEB liability (48,257,356) Deferred inflows of net pension liability (14,157,652) Deferred inflows of net OPEB liability (5,546,679) Accrued interest payable (1,409,517)
Net Position of Governmental Activities $ (333,789,656)
The accompanying notes are an integral part of these financial statements
24

EXHIBIT IVCITY OF CRANSTON, RHODE ISLANDSTATEMENT OF REVENUES, EXPENDITURES AND CHANGES IN FUND BALANCESGOVERNMENTAL FUNDSFOR THE YEAR ENDED JUNE 30, 2019
Other TotalGeneral School School Governmental Governmental
Fund Department Bond Fund Funds Funds
Revenues:General property taxes $ 188,054,377 $ $ $ $ 188,054,377 Intergovernmental 19,660,197 61,037,669 10,813,196 91,511,062 Charges for services 15,413,247 1,447,882 2,755,632 19,616,761 Investment income 757,748 439,468 1,197,216 State on-behalf pension contributions 8,057,883 8,057,883 Other 1,299,174 1,416,687 254,940 2,970,801
Total revenues 225,184,743 71,960,121 - 14,263,236 311,408,100
Expenditures: Current:
General government 10,798,553 663,201 11,461,754 Public safety 85,313,484 2,509,292 87,822,776 Public works 15,673,496 15,673,496 Education 167,055,194 9,099,058 176,154,252 Parks and recreation 3,755,035 4,800 3,759,835 Public libraries 3,581,282 243,153 3,824,435 Senior services 3,213,188 84,460 3,297,648 Community development 1,428,317 1,428,317 Other 220,217 220,217 Debt Service:
Principal 7,694,000 7,694,000 Interest and other costs 3,058,326 201,970 815,602 4,075,898
Capital Outlay: Capital expenditures 8,038,053 9,341,571 17,379,624
Total expenditures 133,307,581 167,055,194 8,240,023 24,189,454 332,792,252
Excess (Deficiency) of Revenues Over Expenditures 91,877,162 (95,095,073) (8,240,023) (9,926,218) (21,384,152)
Other Financing Sources (Uses): Issuance of debt 11,335,000 5,070,000 16,405,000 Bond premium 1,819,237 2,087,142 3,906,379 Transfers in 94,084,926 94,084,926 Transfers out (93,896,822) (188,104) (94,084,926)
Net Other Financing Sources (Uses) (93,896,822) 94,084,926 13,154,237 6,969,038 20,311,379
Net Change in Fund Balances (2,019,660) (1,010,147) 4,914,214 (2,957,180) (1,072,773)
Fund Balances - July 1, 2018 20,959,565 5,289,365 3,133,837 5,527,023 34,909,790
Fund Balances - June 30, 2019 $ 18,939,905 $ 4,279,218 $ 8,048,051 $ 2,569,843 $ 33,837,017
(Continued on next page)
25

EXHIBIT IVCITY OF CRANSTON, RHODE ISLANDRECONCILIATION OF THE STATEMENT OF REVENUES, EXPENDITURES AND CHANGESIN FUND BALANCES OF GOVERNMENTAL FUNDS TO STATEMENT OF ACTIVITIESFOR THE YEAR ENDED JUNE 30, 2019
Amounts reported for Governmental Activities in the Statement of Activities (Exhibit II) are due to:
Net Change in Fund Balances - Total Governmental Funds (Exhibit IV) $ (1,072,773)
Governmental funds report capital outlays as expenditures. However, in the Statement of Activities the cost of those assets is allocated over their estimated useful lives and reported as depreciation expense. This is the amount by which capital outlays exceeded depreciation in the current period:
Capital outlay 20,488,245 Depreciation expense (7,628,598) Loss on disposition of assets (69,291)
Revenues in the Statement of Activities that do not provide current financial resources are not reported as revenues in the funds and revenues recognized in the Fund Financial Statements are not recognized in the Statement of Activities:
Change in unearned tax revenues that are recorded in the funds, but are not
deferred under the measurement employed (684,823) Increase in property tax interest and lien revenue (187,960) Net pension asset 928,961 Changes in deferred outflows related to pensions (49,305,452) Changes in deferred outflows related to OPEB 2,989,875
The issuance of long-term debt (e.g., bonds, leases) provides current financial resources to governmental funds, while the repayment of the principal of long-term debt consumes the current financial resources of governmental funds. Neither transaction, however, has any effect on net position. Also, governmental funds report the effect of issuance costs, premiums, discounts, and similar items when debt is first issued, whereas these amounts are deferred and amortized in the Statement of Activities. The details of these differences in the treatment of long-term debt and related items are as follows:
Accrued interest payable (244,582) Amortization of deferred charge on refunding (265,908) Bond premium incurred (3,906,379) Bond premium amortized 594,794 Debt issuance (16,405,000) Principal payments on bonds and notes 7,828,000 Capital lease payments 440,000
(Continued on next page)
26

EXHIBIT IVCITY OF CRANSTON, RHODE ISLANDRECONCILIATION OF THE STATEMENT OF REVENUES, EXPENDITURES AND CHANGESIN FUND BALANCES OF GOVERNMENTAL FUNDS TO STATEMENT OF ACTIVITIESFOR THE YEAR ENDED JUNE 30, 2019
Some expenses reported in the statement of activities do not require the use of current financial resources and, therefore, are not reported as expenditures in the governmental funds:
Compensated absences $ (48,900) Deferred salary 3,201 Net pension liability 483,948 Net OPEB liability 2,499,336 Changes in deferred inflows related to pensions 22,715,265 Changes in deferred inflows related to OPEB (4,197,062) Insurance claims payable 266,881 Claims and judgements payable 50,000
The net revenue of the activities of the Internal Service Fund is reported with Governmental Activities (679,240)
Change in Net Position of Governmental Activities (Exhibit II) $ (25,407,462)
The accompanying notes are an integral part of the financial statements
27

EXHIBIT VCITY OF CRANSTON, RHODE ISLANDSTATEMENT OF NET POSITIONPROPRIETARY FUNDSJUNE 30, 2019
GovernmentalActivities
Major FundNonmajor Internal Service
Sewer Programs Totals Fund
Assets
Current Assets:Cash and cash equivalents $ 13,948,153 $ 1,897,491 $ 15,845,644 $ 940,356 Prepaid expenses 45,108 45,108 Inventory 64,189 64,189 Receivables:
Sewer assessments and user fees, net 1,121,884 1,121,884 Other - 2,930 Due from other funds 4,465,934 12,698 4,478,632 Intergovernmental 2,818,881 146,578 2,965,459
Claims deposits - 3,950,456 Total current assets 22,354,852 2,166,064 24,520,916 4,893,742
Noncurrent Assets:Advance deposits - medical 853,000 Restricted cash - debt service reserve 1,195,219 1,195,219 Held in escrow 418,467 418,467 Net pension asset 193,440 193,440
Subtotal noncurrent assets 1,613,686 193,440 1,807,126 853,000
Capital Assets:Capital assets, net of accumulated depreciation 70,639,999 582,696 71,222,695
Total noncurrent assets 72,253,685 776,136 73,029,821 853,000
Total assets 94,608,537 2,942,200 97,550,737 5,746,742
Deferred Outflow of Resources:Deferred outflows of resources related to pensions 475,381 475,381 Deferred outflows of resources related to OPEB 41,475 41,475
Total deferred outflow of resources - 516,856 516,856 -
Total Assets and Deferred outflow of Resources $ 94,608,537 $ 3,459,056 $ 98,067,593 $ 5,746,742
(Continued on next page)
Enterprise FundsBusiness-Type Activities
28

EXHIBIT VCITY OF CRANSTON, RHODE ISLANDSTATEMENT OF NET POSITION (CONTINUED)PROPRIETARY FUNDSJUNE 30, 2019
GovernmentalActivities
Major FundNonmajor Internal Service
Sewer Programs Totals Fund
Liabilities
Current Liabilities:Accounts payable $ 3,053,895 $ 622,460 $ 3,676,355 $ 377,970 Accrued payroll 1,613 1,613 Retainage payable 808,790 808,790 Compensated absences 36,315 36,315 Accrued interest 172,158 172,158 Due to other funds - 5,283,576 Claims payable 770,448 Unearned revenue 1,920,000 60,087 1,980,087 Long-term liabilities due within one year 1,091,967 1,091,967
Total current liabilities 7,048,423 718,862 7,767,285 6,431,994
Noncurrent Liabilities:Compensated absences, net of current portion Net OPEB liability 179,552 179,552 Net pension liability 1,946,231 1,946,231 Long-term liabilities due in more than one year 17,161,033 17,161,033
Total noncurrent liabilities 17,161,033 2,125,783 19,286,816 -
Total liabilities 24,209,456 2,844,645 27,054,101 6,431,994
Deferred Inflows of Resources:Deferred inflows of resources related to pensions 130,148 130,148 Deferred inflows of resources related to OPEB 689 689 Deferred sewer lease arrangement 4,866,643 4,866,643
4,866,643 130,837 4,997,480 - Total liabilities and deferred inflow of resources 29,076,099 2,975,482 32,051,581 6,431,994
Net Position:Net Investment in capital assets 52,386,999 582,696 52,969,695 Restricted:
Debt service 418,467 418,467 Unrestricted (deficit) 12,726,972 (99,122) 12,627,850 (685,252)
Total net position 65,532,438 483,574 66,016,012 (685,252)
Total Liabilities, Deferred Inflows of Resources and Net Position $ 94,608,537 $ 3,459,056 $ 98,067,593 $ 5,746,742
The accompanying notes are an integral part of these financial statements
Business-Type ActivitiesEnterprise Funds
29

EXHIBIT VICITY OF CRANSTON, RHODE ISLANDSTATEMENT OF REVENUES, EXPENSES AND CHANGES IN NET POSITIONPROPRIETARY FUNDSFOR THE YEAR ENDED JUNE 30, 2019
Governmental Activities
Major FundNonmajor Internal Service
Sewer Programs Totals Fund
Operating Revenues:Charges for usage and service $ 21,835,857 $ 1,050,764 $ 22,886,621 $ 36,313,266 Grant income 2,666,408 2,666,408 Tuition 2,538,588 2,538,588 On-behalf pension contribution 137,640 137,640 Miscellaneous 980,515 28,773 1,009,288 54,609
Total operating revenues 22,816,372 6,422,173 29,238,545 36,367,875
Operating Expenses:Operations 1,023,822 4,460,326 5,484,148 785,068 Personnel 112,883 2,138,367 2,251,250 Claims - 11,544,134 Contract payments 16,628,715 16,628,715 Health care management - 24,719,184 Depreciation 2,255,687 65,779 2,321,466
Total operating expenses 20,021,107 6,664,472 26,685,579 37,048,386
Operating Income (Loss) 2,795,265 (242,299) 2,552,966 (680,511)
Nonoperating Revenues (Expenses):Interest expense (522,077) (522,077) Investment income 627,318 5,449 632,767 1,271 Grant income 89,207 89,207
Total nonoperating revenues (expenses) 105,241 94,656 199,897 1,271
Change in Net Position 2,900,506 (147,643) 2,752,863 (679,240)
Net Position - July 1, 2018 62,631,932 631,217 63,263,149 (6,012)
Net Position - June 30, 2019 $ 65,532,438 $ 483,574 $ 66,016,012 $ (685,252)
Enterprise FundsBusiness-Type Activities
The accompanying notes are an integral part of these financial statements
30

EXHIBIT VIICITY OF CRANSTON, RHODE ISLANDSTATEMENT OF CASH FLOWSPROPRIETARY FUNDSFOR THE YEAR ENDED JUNE 30, 2019
GovernmentalActivities
Major FundNonmajor Internal Service
Sewer Programs Totals Fund
Cash Flows from Operating Activities:Cash received from customers $ 21,081,738 $ 6,529,663 $ 27,611,401 $ 36,377,115 Cash paid to suppliers (16,628,715) (978,816) (17,607,531) Cash paid to employees (112,852) (1,841,039) (1,953,891) (260) Cash paid for claims - (37,097,331) Cash paid for other operating expenses 278,984 (3,279,671) (3,000,687) (684,731)
Net cash provided by (used in) operating activities 4,619,155 430,137 5,049,292 (1,405,207)
Cash Flows from Noncapital Financing Activities: Non-operating grant 20,700 88,299 108,999 Change in interfund loans (4,751,001) 164,951 (4,586,050) 1,348,873
Net cash provided by (used in) noncapital financing activities (4,730,301) 253,250 (4,477,051) 1,348,873
Cash Flows from Capital and Related Financing Activities: Acquisition of capital assets (534,334) (462,047) (996,381) Principal paid on bonds (1,100,000) (1,100,000) Interest paid on bonds (527,550) (527,550)
Net cash used in capital and related financing activities (2,161,884) (462,047) (2,623,931) -
Cash Flows from Investing Activities: Income from investments 627,318 5,449 632,767 1,271
Net cash provided by investing activities 627,318 5,449 632,767 1,271
Net (Decrease) Increase in Cash (1,645,712) 226,789 (1,418,923) (55,063)
Cash - July 1, 2018 (Including Restricted Cash) 16,789,084 1,670,702 18,459,786 995,419
Cash - June 30, 2019 (Including Restricted Cash) $ 15,143,372 $ 1,897,491 $ 17,040,863 $ 940,356
Reconciliation of Operating Income to Net CashProvided by (Used in) Operating Activities:
Operating income (loss) $ 2,795,265 $ (242,299) $ 2,552,966 $ (680,511) Adjustments to reconcile operating income to net cash
provided by (used in) operating activities:Depreciation 2,255,687 65,779 2,321,466 Increase in net pension asset 2,338 2,338 Increase in deferred outflows related to pension plans 59,981 59,981 Decrease in deferred inflows related to pension plans (30,721) (30,721) (Increase) decrease in accounts receivable 179,716 184,760 364,476 9,240 Increase (Decrease) in claims deposits - (1,037,130) Increase in prepaid expenses (20,804) (20,804) Decrease in inventory (7,147) (7,147) (Increase) decrease in intergovernmental receivables (248,286) 54,368 (193,918) Increase in accounts payable 1,302,806 229,790 1,532,596 230,673 Increase in accrued payroll 31 31 (260) Increase in compensated absences (2,628) (2,628) Increase (decrease) in prepaid assessments 253,936 253,936 Increase in OPEB 48,373 48,373 Increase in deferred outflows related to OPEB (39,673) (39,673) Increase (decrease) in deferred inflows related to OPEB 13 13 Decrease in claims payable - 72,781 (Decrease) increase in unearned revenue (1,920,000) 6,002 (1,913,998) Increase in net pension liability 122,005 122,005
Net Cash Provided by (Used in) Operating Activities $ 4,619,155 $ 430,137 $ 5,049,292 $ (1,405,207)
Enterprise Funds
The accompanying notes are an integral part of these financial statements
31

EXHIBIT VIIICITY OF CRANSTON, RHODE ISLANDSTATEMENT OF FIDUCIARY NET POSITIONFIDUCIARY FUNDSJUNE 30, 2019
Pension and Other PrivateEmployee Benefit Purpose Agency
Trust Fund Trust Fund Funds
Assets:
Cash and cash equivalents $ 2,710,805 $ 113,553 $ 1,251,419
Investments: Guaranteed investment contracts 3,992,508 Real estate investment trust 51,738 Common stock 13,398,152 Pooled equity index funds 342,761 Pooled fixed income index funds 252,221 International equity mutual fund 1,740,209 U.S. equity mutual funds 31,451,587 Fixed income mutual funds 25,307,982
Total investments 76,537,158 - -
Contribution receivable 758,897
Total assets 80,006,860 113,553 1,251,419
Liabilities:Accounts payable 47,466 Due to primary government 120,000 Deposits held in custody for others 1,251,419
Total liabilities 167,466 - 1,251,419
Net Position Restricted for Pensions and OPEB Benefits and Other Purposes $ 79,839,394 $ 113,553 $ -
The accompanying notes are an integral part of these financial statements
32

EXHIBIT IXCITY OF CRANSTON, RHODE ISLAND STATEMENT OF CHANGES IN FIDUCIARY NET POSITION FIDUCIARY FUNDSFOR THE YEAR ENDED JUNE 30, 2019
Pension and Other PrivateEmployee Benefit Purpose
Trust Fund Trust FundAdditions:
Contributions:Employer contributions $ 25,996,524 $ Plan member contributions 1,065,125 4,778 Other 57,856
Total contributions 27,119,505 4,778
Investment Income:Interest and dividends 1,635,524 44 Net appreciation in the fair value of investments 2,920,040
Total investment income 4,555,564 44
Total additions 31,675,069 4,822
Deductions:Benefits 29,844,784 2,926 Administrative expenses 241,481
Total deductions 30,086,265 2,926
Change in Net Position 1,588,804 1,896
Net Position - July 1, 2018 78,250,590 111,657
Net Position - June 30, 2019 $ 79,839,394 $ 113,553
The accompanying notes are an integral part of these financial statements
33

CITY OF CRANSTON, RHODE ISLAND NOTES TO FINANCIAL STATEMENTS JUNE 30, 2019
34
History and Organization
The City of Cranston, Rhode Island (the City) was incorporated in 1910 and covers an area of nearly 30 square miles. The City operates under a Mayor-Council form of government as prescribed by the City’s home rule charter, which was adopted in 1962. The Mayor is elected by the voters of the City to a two-year term limited to four consecutive terms. City Council members are elected to two-year terms, limited to five consecutive terms. The City provides the following services as authorized by its charter: public safety (police and fire), public works (streets and highways), public health and social services, sewers and water, a free public library, and education encompassing grades PreK-12.
1. SUMMARY OF SIGNIFICANT ACCOUNTING POLICIES
A. Reporting Entity
The City of Cranston, Rhode Island, is a municipal corporation governed by an elected mayor and City Council. The accompanying financial statements present the government and its component units, entities for which the government is considered to be financially accountable. Blended component units, although legally separate entities, are, in substance, part of the City’s operations.
Blended Component Units
The Public Facilities Management Foundation (the Foundation), a non-profit corporation, was created by the City on November 28, 2000. The Foundation consists of five members who are elected by or work for the City of Cranston. These members include the President of the Cranston City Council, the City Solicitor, the Director of Public Works, the Director of Finance and the Director of Administration. The Foundation provides exclusive rights, by a term lease as entered into with the City on November 1, 2000, to the use of land and buildings located in the City to be used as a storage and maintenance facility by the Public Works Department. The Foundation is reported as a non-major program of the proprietary funds. By way of a resolution dated May 25, 2017 the Foundations’ Board members dissolved the Foundation. All future activity of the facility will be responsibility of, and be accounted for by, the City of Cranston, Rhode Island.
B. Government-Wide and Fund Financial Statements
The government-wide financial statements (i.e., the statement of net position and the statement of activities) report information on all of the non-fiduciary activities of the City. Governmental activities, which normally are supported by taxes and intergovernmental revenues, are reported separately from business-type activities, which rely to a significant extent on fees and charges for support.
The statement of activities demonstrates the degree to which the direct expenses of a given function or segment is offset by program revenues. Direct expenses are those that are clearly identifiable with a specific function or segment. Program revenues include 1) charges to customers or applicants who purchase, use, or directly benefit from goods, services, or privileges provided by a given function or segment, and 2) grants and contributions that are restricted to meeting the operational or capital requirements of a particular function or segment. Taxes and other items not properly included among program revenues are reported instead as general revenues.
Separate financial statements are provided for governmental funds, proprietary funds and fiduciary funds, even though the latter are excluded from the government-wide financial statements. Major individual governmental funds and major individual enterprise funds are reported as separate columns in the fund financial statements.

CITY OF CRANSTON, RHODE ISLAND NOTES TO FINANCIAL STATEMENTS JUNE 30, 2019
35
C. Measurement Focus, Basis of Accounting, and Financial Statement Presentation
The government-wide financial statements are reported using the economic resources measurement focus and the accrual basis of accounting, as are the proprietary fund and fiduciary fund financial statements. Agency funds do not have a measurement focus but are accounted for on the accrual basis of accounting. Revenues are recorded when earned and expenses are recorded when a liability is incurred, regardless of the timing of related cash flows. Property taxes are recognized as revenues in the year for which they are levied. Grants and similar items are recognized as revenues as soon as all eligibility requirements imposed by the provider have been met.
Governmental fund financial statements are reported using the current financial resources measurement focus and the modified accrual basis of accounting. Revenues are recognized as soon as they are both measurable and available. Revenues are considered to be available when they are collectible within the current period or soon enough thereafter to pay liabilities of the current period. For this purpose, the City considers revenues to be available if they are collected within 60 days of the end of the current fiscal period. Expenditures generally are recorded when a liability is incurred, as under accrual accounting. However, debt service expenditures, as well as expenditures related to compensated absences and claims and judgments, are recorded only when payment is due.
Property taxes, expenditure reimbursement type grants, certain intergovernmental revenues, transfers, and interest associated with the current fiscal period are all considered to be susceptible to accrual and have been recognized as revenues of the current fiscal period. All other revenue items are considered to be measurable and available only when received by the City.
The City reports the following major governmental funds:
The General Fund is the City’s primary operating fund. It accounts for all financial resources of the general government, except those required to be accounted for in another fund.
The School Unrestricted Fund accounts for the financial transactions of the City’s School Department which are not required to be accounted for in another fund. The fund consists of state aid, City appropriation and Medicaid revenues.
The School Bond Fund is for the construction and improvements to school buildings, and for the acquisition of equipment for the Cranston School District.
The City reports the following major proprietary funds:
The Sewer Department Fund accounts for the activities of the City’s sewer operations.
Additionally, the City reports the following fund types:
Special Revenue Funds account for and report the proceeds of revenue sources (other than major capital projects) that are restricted or committed to expenditures for specific purposes.
The Capital Project Funds account for the acquisition of capital assets or construction of major capital projects other than those financed by proprietary funds.
The Internal Service Fund, a proprietary type fund, is used to account for claims made against the City.
The Pension Trust Funds account for the activities of the Cranston Employees’ Retirement System, which accumulates resources for pension benefit payments to qualified employees.

CITY OF CRANSTON, RHODE ISLAND NOTES TO FINANCIAL STATEMENTS JUNE 30, 2019
36
The OPEB Trust Fund accumulates resources for future retiree health benefits and retiree life insurance benefits for eligible teachers and police and fire retirees.
The Private-Purpose Trust Funds are used to account for employee contributions held in trust for qualified medical related plan expenditures. All resources of the fund, including any earnings on invested resources, may not be used to support the City’s activities. There is no requirement that any portion of these resources be preserved as capital.
The Agency Funds account for monies held as a custodian on behalf of students, amounts held for unclaimed estates in probate court and amounts held for performance bonds.
As a general rule, the effect of interfund activity has been eliminated from the government-wide financial statements. Exceptions to this general rule are payments-in-lieu of taxes and other charges between the City’s sewer operations and various other functions of the City. Elimination of these charges would distort the direct costs and program revenues reported for the various functions concerned.
Amounts reported as program revenues include 1) charges to customers or applicants for goods, services, or privileges provided, 2) operating grants and contributions, and 3) capital grants and contributions, including special assessments. Internally dedicated resources are reported as general revenues rather than as program revenues. Likewise, general revenues include all taxes.
Proprietary funds distinguish operating revenues and expenses from nonoperating items. Operating revenues and expenses generally result from providing services and producing and delivering goods in connection with a proprietary fund’s principal ongoing operations. The principal operating revenues of the sewer department enterprise fund and of the City’s internal service funds are charges to customers for sales and services. The sewer department also recognizes as operating revenue the portion of tap fees intended to recover the cost of connecting new customers to the system. Operating expenses for enterprise funds and internal service funds include the cost of sales and services, administrative expenses, and depreciation on capital assets. All revenues and expenses not meeting this definition are reported as nonoperating revenues and expenses.
When both restricted and unrestricted resources are available for use, it is the City’s policy to use restricted resources first, then unrestricted resources as they are needed.
D. Assets, Liabilities, Deferred Outflows/Inflows of Resources, and Net Position/
Fund Balance
Deposits and Investments
Deposits - The City’s cash and cash equivalents consist of cash on hand, demand deposits, money market accounts and short-term investments with original maturities of three months or less from the date of acquisition.
Investments - In general, State of Rhode Island Statutes allow the City to invest in obligations of the United States of America or United States government sponsored corporations, in shares or other interests in any custodial arrangement, pool, or no-load, open-end management type investment company or investment trust (as defined), in obligations of any state or political subdivision rated within the top two rating categories of any nationally recognized rating service, or in obligations of the State of Rhode Island or political subdivision rated within the top three rating categories of any nationally recognized rating service. Investment income is recorded in the fund in which it is earned.

CITY OF CRANSTON, RHODE ISLAND NOTES TO FINANCIAL STATEMENTS JUNE 30, 2019
37
The City’s pension funds are invested in accordance with the Plan’s investment policy, the City has agreements with the investment advisors, who manage the investment portfolios and have full authority for the investment and reinvestment of pension fund assets.
Investments for the City are reported at fair value.
Receivables and Payables
Interfunds
Activity between funds that are representative of lending/borrowing arrangements outstanding at the end of the fiscal year are referred to as either “due to/from other funds” (i.e., the current portion of interfund loans) or “advances to/from other funds” (i.e., the non-current portion of interfund loans). Any residual balances outstanding between the governmental activities and business-type activities are reported in the government-wide financial statements as “internal balances.”
Property Taxes and Other Receivables
In the government-wide financial statements, all trade, property tax, and sewer use amounts are shown net of an allowance for uncollectibles. Allowance percentages range from 10 to 100% of outstanding receivable balances at June 30, 2019 and are calculated based upon prior collection history.
In the fund financial statements, all property taxes receivable at June 30, which have not been collected within sixty days of June 30, have been recorded as deferred inflows, since they are not considered to be available to finance expenditures of the current year. Taxes collected during the sixty day period have been recorded as revenue.
Property taxes are assessed on property as of December 31. Taxes are billed on or about June 1 (for the subsequent fiscal year) based on the assessed value for all real property, tangible property, and motor vehicles located in the City. Taxes are due in four installments in July, October, January and April. Rhode Island general laws restrict the City’s ability to increase either its total tax levy or its tax rates by more than 4.0% over those of the preceding year. Overdue taxes are assessed penalties and will be collected through the sale of tax titles if required.
Inventories and Prepaid Items
All inventories are valued at cost using the first-in, first-out (FIFO) method of valuation.
Certain payments to vendors reflect costs applicable to future accounting periods and are recorded as prepaid items in both the government-wide and fund financial statements. Prepaids are accounted for using the consumption method.
Restricted Assets
The restricted assets for the City are restricted for debt reserve requirements, building improvements and minor maintenance costs associated with the City of Cranston, Rhode Island.
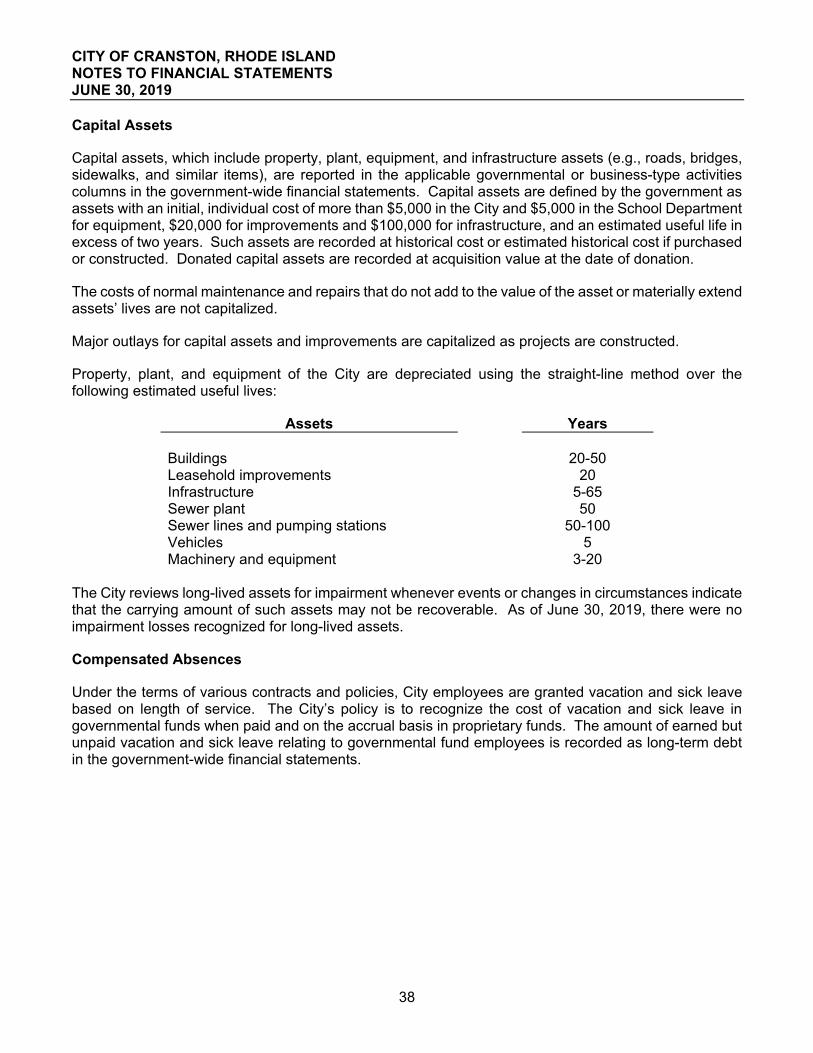
CITY OF CRANSTON, RHODE ISLAND NOTES TO FINANCIAL STATEMENTS JUNE 30, 2019
38
Capital Assets
Capital assets, which include property, plant, equipment, and infrastructure assets (e.g., roads, bridges, sidewalks, and similar items), are reported in the applicable governmental or business-type activities columns in the government-wide financial statements. Capital assets are defined by the government as assets with an initial, individual cost of more than $5,000 in the City and $5,000 in the School Department for equipment, $20,000 for improvements and $100,000 for infrastructure, and an estimated useful life in excess of two years. Such assets are recorded at historical cost or estimated historical cost if purchased or constructed. Donated capital assets are recorded at acquisition value at the date of donation.
The costs of normal maintenance and repairs that do not add to the value of the asset or materially extend assets’ lives are not capitalized.
Major outlays for capital assets and improvements are capitalized as projects are constructed.
Property, plant, and equipment of the City are depreciated using the straight-line method over the following estimated useful lives:
Assets Years Buildings 20-50 Leasehold improvements 20 Infrastructure 5-65 Sewer plant 50 Sewer lines and pumping stations 50-100 Vehicles 5 Machinery and equipment 3-20
The City reviews long-lived assets for impairment whenever events or changes in circumstances indicate that the carrying amount of such assets may not be recoverable. As of June 30, 2019, there were no impairment losses recognized for long-lived assets.
Compensated Absences
Under the terms of various contracts and policies, City employees are granted vacation and sick leave based on length of service. The City’s policy is to recognize the cost of vacation and sick leave in governmental funds when paid and on the accrual basis in proprietary funds. The amount of earned but unpaid vacation and sick leave relating to governmental fund employees is recorded as long-term debt in the government-wide financial statements.

CITY OF CRANSTON, RHODE ISLAND NOTES TO FINANCIAL STATEMENTS JUNE 30, 2019
39
Net Pension Liability
The net pension liability is measured as the portion of the actuarial present value of projected benefits that is attributed to past periods of employee service (total pension liability), net of the pension plans’ fiduciary net position. The pension plans’ fiduciary net position is determined using the same valuation methods that are used by the pension plans for purposes of preparing their statements of fiduciary net position. The net pension liability is measured as of a date (measurement date) no earlier than the end of the employer’s prior fiscal year, consistently applied from period to period.
Net OPEB Liability
The net OPEB liability is measured as the portion of the present value of projected benefit payments to be provided to current active and inactive employees that is attributed to those employees’ past periods of service (total OPEB liability), less the amount of the OPEB plan’s fiduciary net position. The OPEB plan’s fiduciary net position is determined using the same valuation methods that are used by the OPEB plan for purposes of preparing its statement of fiduciary net position. The net OPEB liability is measured as of a date (measurement date) no earlier than the end of the employer’s prior fiscal year, consistently applied from period to period.
Long-Term Obligations
In the Government-wide financial statements, and proprietary fund types in the fund financial statements, long-term debt and other long-term obligations are reported as liabilities in the applicable governmental activities, business-type activities, or proprietary fund type statement of net position. Bond premiums and discounts, as well as issuance costs, are deferred and amortized over the life of the bonds using the effective interest method. Bonds payable are reported net of the applicable bond premium or discount. Bond issuance costs are reported as deferred charges and amortized over the term of the related debt.
In the fund financial statements, governmental fund types recognize bond premiums and discounts, as well as bond issuance costs, during the current period. The face amount of debt issued is reported as other financing sources. Premiums received on debt issuances are reported as other financing sources while discounts on debt issuances are reported as other financing uses. Issuance costs, whether or not withheld from the actual debt proceeds received, are reported as debt service expenditures.
Deferred Outflows
In addition to assets, the statement of net position will sometimes report a separate section for deferred outflows of resources. This separate financial statement element, deferred outflows of resources, represents a consumption of net position or fund balance that applies to a future period or periods and so will not be recognized as an outflow of resources (expense/expenditure) until then. The City reports a deferred charge on refunding and deferred outflows related to pension and OPEB in the government-wide statement of net position. A deferred charge on refunding results from the difference in the carrying value of refunded debt and its reacquisition price. This amount is deferred and amortized over the shorter of the life of the refunded or refunding debt. A deferred outflow of resources related to pension and OPEB results from differences between expected and actual experience and investment gains or losses. These amounts are deferred and included in pension and OPEB expense in a systematic and rational manner over a period equal to the average of the expected remaining service lives of all employees that are provided with benefits through the pension and OPEB plan (active employees and inactive employees). No deferred outflows of resources affect the governmental fund financial statements in the current year.

CITY OF CRANSTON, RHODE ISLAND NOTES TO FINANCIAL STATEMENTS JUNE 30, 2019
40
Deferred Inflows of Resources
In addition to liabilities, the statement of net position will sometimes report a separate section for deferred inflows of resources. This separate financial statement element, deferred inflows of resources, represents an acquisition of net position or fund balance that applies to a future period or periods and so will not be recognized as an inflow of resources (revenue) until that time. The City reports advance property tax collections, a deferred sewer lease arrangement and deferred inflows of resources related to pensions and OPEB in the government-wide statement of net position. A deferred inflow of resources related to pension and OPEB results from differences between expected and actual experience, changes in assumptions or other inputs. These amounts are deferred and included in pension and OPEB expense in a systematic and rational manner over a period equal to the average of the expected remaining service lives of all employees that are provided with benefits through the pension and OPEB plan (active employees and inactive employees). The deferred lease arrangement represents the unamortized portion of an advanced lease payment that the City collected in connection with the lease of the City’s wastewater treatment system. This amount is deferred and recognized ratably over the lease term. Advance property tax collections represent taxes inherently associated with a future period. This amount is recognized during the period in which the revenue is associated. For governmental funds, the City reports unavailable revenue, which arises only under the modified accrual basis of accounting. The governmental funds report unavailable revenues from property taxes. These amounts are deferred and recognized as an inflow of resources (revenue) in the period during which the amounts become available.
Fund Balance and Net Position
Net Position
Net position is classified in the following categories in the government-wide and proprietary fund financial statements:
• Net investment in capital assets - consists of all capital assets including restricted capital assets, net of accumulated depreciation and reduced by the outstanding balances of any bonds, mortgages, notes, or other borrowings that are attributable by the acquisition, construction, or improvement of those assets.
• Restricted net position - consists of net position with constraints placed on the use either by (1) external groups such as creditors, grantors, contributions, or laws or regulations of other governments, or (2) imposed by law through constitutional provisions or enabling legislation.
• Unrestricted net position - all other net position that do not meet the definition of “restricted” or “net investment in capital assets.”
Fund Balance
In the governmental fund financial statements, the City reported the following governmental fund balances:
• Nonspendable Fund Balance - includes amounts that cannot be spent because they are either (a) not in spendable form or (b) legally or contractually required to be maintained intact.
• Restricted Fund Balance - includes amounts that are restricted to specific purposes. Fund balance is reported as restricted when constraints placed in the use of resources are either externally imposed by creditors, grantors, contributors, or laws or regulations of other governments, or imposed by law through constitutional provisions or enabling legislation.

CITY OF CRANSTON, RHODE ISLAND NOTES TO FINANCIAL STATEMENTS JUNE 30, 2019
41
• Committed Fund Balance - includes amounts that can be used only for the specific purposes pursuant to constraints imposed by formal action of the government’s highest level of decision-making authority. Those committed amounts cannot be used for any other purpose unless the government removes or changes the specified use by taking the same type of action it employed to previously commit those amounts. The highest level of decision-making authority for the City of Cranston is the City Council which can commit fund balance through the adoption of resolutions. Similar action must be taken to remove or revise commitments.
• Assigned Fund Balance - includes amounts that are constrained by the government’s intent to be used for specific purposes, but are neither restricted nor committed. The intent should be expressed by (a) the governing body itself or (b) a body (a budget or finance committee) or official to which the governing body has delegated the authority to assign amounts to be used for specific purposes.
• Unassigned Fund Balance - is the residual classification for the General Fund. This classification represents fund balance that has not been assigned to other funds and that has not been restricted, committed, or assigned to specific purposes within the General Fund, and any residual deficit balance of any other governmental funds.
Stabilization Arrangements
• Budget Stabilization Fund - this fund shall be created, into which the City shall transfer such funds as are available to provide for capital expenditures and other one-time expenditures. The fund was established by a City ordinance. Any such transfer shall not create an operating deficit in the General Fund. Any expenditure from or transfer to this fund must first be approved by the City Council. As of June 30, 2019, the remaining fund balance included in this fund was $39,259 and is reported in the totals of the City’s general fund on the governmental funds balance sheet within the committed fund balance.
• Healthcare Budget Stabilization Fund - this fund shall be created, into which the excess of revenues from the various city departments over actual health care claims and related expenses shall be transferred. The fund was established by a City ordinance. Any additions are considered to be approved by the original City ordinance. Any such transfer shall not create an operating deficit in the General Fund. In the event that health care claims and related expenses exceed the budgeted appropriation, then funds may be transferred from the health care budget stabilization fund to cover the deficit. Any expenditure or transfer from this fund must first be approved by the City Council. As of June 30, 2019, the remaining fund balance included in this fund was $4,784 and is reported in the totals of the City’s General Fund on the governmental funds balance sheet within the committed fund balance.
Estimates
The preparation of the financial statements in conformity with accounting principles generally accepted in the United States of America requires management to make estimates and assumptions that affect the reported amounts of assets and liabilities including disclosures of contingent assets and liabilities and reported revenues, expenses and expenditures during the fiscal year. Actual results could differ from those estimates.

CITY OF CRANSTON, RHODE ISLAND NOTES TO FINANCIAL STATEMENTS JUNE 30, 2019
42
2. STEWARDSHIP, COMPLIANCE AND ACCOUNTABILITY
A. Budgets and Budgetary Accounting
It is the responsibility of the Mayor, with the cooperation of the Director of Finance, to submit a proposed budget for the following fiscal year to the City Council not later than the first day of April of each year. The City Council acts on the budget no later than the 15th day of May. Public hearings are conducted on the recommended budget and the final recommended budget is legally enacted through an ordinance at the Financial City Council Meeting. Budget appropriations lapse at the end of the fiscal year, with the exception of capital project funds.
The level of budgetary control for the General Fund (that is, the level at which expenditures cannot legally exceed appropriations) is fixed by resolution as part of the annual budget adoption process at the Financial City Council Meeting. Although the resolution prohibits spending in excess of the authorized budget, it does allow management the right to create intradepartmental transfers at any time during the fiscal year. Interdepartmental transfers and supplemental appropriations are restricted to the fourth quarter and must be approved by the City Council in the form of an ordinance. Interdepartmental transfers reallocate surplus funds from one department to another. Supplemental appropriations increase or decrease both revenue appropriation and expenditure appropriation by an equal amount. During the fiscal year ended June 30, 2019 there was a $307,853 decrease in appropriations.
The budget for the Schools Unrestricted Fund is prepared annually and approved by the School Committee. The amount of the annual transfer from the General Fund is ultimately determined through the adoption of the General Fund budget. This appropriation does not lapse at year end. The City also adopts budgets for two of the non-major special revenue funds.
Encumbrances are recognized as a valid and proper charge against a budget appropriation in the year in which the purchase order, contract or other commitment is issued and, accordingly, encumbrances outstanding at year end are reported in the City’s budgetary reports as expenditures in the current year. The budgetary reports are located in the Required Supplementary Information (RSI). Generally, aside from the Capital Projects Fund, all unencumbered appropriations lapse at year end. Appropriations for capital projects are reissued in the amount available at the end of the fiscal year.

CITY OF CRANSTON, RHODE ISLAND NOTES TO FINANCIAL STATEMENTS JUNE 30, 2019
43
B. Capital Projects Authorizations
The following is a summary of projects recorded in the Capital Projects Fund at June 30, 2019:
Project NameProject
AuthorizationCurrent Year Expenditures
Cumulative Expenditures
Balance June 30, 2019
Governmental Funds:School bond fund 43,465,037$ 8,240,023$ 35,416,986$ 8,048,051$ Police and fire bond fund 15,762,427 2,785,042 15,601,780 160,647 Public building bond fund 2,563,975 610,495 2,521,902 42,073 Recreation bond fund 6,963,109 454,923 6,367,480 595,629 Highway bond fund 23,000,415 5,218,140 25,412,572 (2,412,157) Storm drains bond fund 1,881,893 177,320 1,708,262 173,631 Library bond fund 951,752 241,056 899,157 52,595 Neighborhood infrastructure
fund 3,615,581 667,699 3,324,953 290,628 Open space bond fund 2,491,087 2,498 2,367,721 123,366
Deficits in the capital projects fund will be covered through a bond issuance in the next fiscal year.
C. Deficit Fund Balance
During the year ended June 30, 2019, the City had a deficit fund balance in the following funds:
Non-Major Governmental FundsCommunity Development Block Grant 29,605$ WIOA Job Development Fund 151,671 Highway Bond Fund 2,412,157
Internal Service FundsCity Internal Service Fund 1,840,965$
Non-Major Proprietary FundsCharter School 738,925$
The nonmajor fund deficits will be eliminated through future intergovernmental grant receipts, new bond issuances, Bond Anticipation Notes or inter-fund contributions. The internal service fund deficits will be eliminated through the monitoring of these fund activities and adjusting working rates for healthcare costs.

CITY OF CRANSTON, RHODE ISLAND NOTES TO FINANCIAL STATEMENTS JUNE 30, 2019
44
3. DETAILED NOTES
A. Cash and Investments
Deposits Custodial Credit Risk Custodial credit risk is the risk that, in the event of a bank failure, the City’s deposits may not be returned to it. The City’s deposit policy for custodial credit risk requires that deposits be placed in financial institutions that are FDIC insured up to $250,000 and rated “well capitalized” on the institution’s most recent audited financial statements/SEC filings, if deposits exceed $250,000. As of June 30, 2019, the City’s bank balance of $51,754,017 was insured and collateralized as follows:
Insured $ 8,358,435 Collateralized
Collateral held by Pledging Banks' Trust Department, not in the City's name 43,395,582
Total Amount Subject to Custodial Risk $ 51,754,017
The City’s carrying value of cash and cash equivalents at June 30, 2019 was $52,953,257, and is presented within the following in the financial statements:
Governmental Activities $ 30,896,261 Business Type Activities 17,040,863 Pension Trust Funds 1,389,456 OPEB Trust Funds 1,321,349 Internal Service Funds 940,356 Private Purpose Trust Funds 113,553 Agency Funds 1,251,419
Total $ 52,953,257
Certain investments are covered by the Securities Investor Protection Corporation (SIPC) up to $500,000, including $250,000 of cash from sale or for purchase of investments, but not cash held solely for the purpose of earning interest. SIPC protects securities such as notes, stocks, bonds, debentures, certificates of deposit and money funds.

CITY OF CRANSTON, RHODE ISLAND NOTES TO FINANCIAL STATEMENTS JUNE 30, 2019
45
At June 30, 2019, the City's investments, all of which are in the City’s Pension Trust Funds, (including restricted investments) consisted of the following:
Type of Investment Fair Value N/A Less Than 1 1-5 Years
U.S. Equity Mutual Funds 31,451,587$ 31,451,587$ $ $International Equity Mutual Funds 1,740,209 1,740,209 Common Stock 13,398,152 13,398,152 Guaranteed Investment Contracts 3,992,508 3,992,508 Pooled Equity Index Funds 342,761 342,761 Pooled Fixed Income Index Funds 252,221 252,221 Fixed Income Mutual Funds 25,307,982 25,307,982 Real Estate Investment Trusts 51,738 51,738
Total 76,537,158$ 50,976,955$ 25,560,203$ -$
Maturity
Interest Rate Risk The City does not have a formal investment policy that limits investment maturities as a means of managing its exposure to fair value losses arising from increasing interest rates. These investments do not specify an interest rate rather the rate of return is dependent on operating results and economic conditions. These investments are not rated by Standard & Poor’s as of June 30, 2019.
At June 30, 2019, the City’s investments totaled $76,537,158 (held in Fiduciary Funds) and those investment options representing 5% or more of the total investment balance are as follows:
Investment Percentage Fair ValueRussell US Small Cap Equity CL A 5.27% 4,037,329$
Skybridge Multi-Advisor Hedge Fund PortLLC Ser G 5.22% 3,992,508$
Credit Risk The City has no investment policy that would limit its investment choices due to credit risk other than State Statutes governing investments in obligations of any State or political subdivision or in obligations of the State of Rhode Island or political subdivision.
Custodial Credit Risk The City does not have a formal policy with respect to custodial credit risk. Custodial credit risk is the risk that, in the event of the failure of the counterparty, the City will not be able to recover the value of its investment or collateral securities that are in the possession of an outside party. The City does not believe that it has a significant custodial credit risk as all the investments are registered and held in the name of the City.

CITY OF CRANSTON, RHODE ISLAND NOTES TO FINANCIAL STATEMENTS JUNE 30, 2019
46
Fair Value of Financial Instruments Fair value is defined as the amount at which and asset could be exchanged between knowledgeable and willing parties. GASB 72 establishes a fair value hierarchy for inputs used in measuring fair value that maximizes the use of observable inputs and minimizes the use of unobservable inputs by requiring that the most observable inputs be used when available, of how the market would price the asset or liability. The fair value hierarchy is categorized into three levels based on the inputs as follows:
Level 1 Unadjusted quoted priced in active markets that are accessible at the measurement date for identical assets or liabilities.
Level 2 Inputs other than quoted prices in active markets for identical assets and liabilities that are observable either directly or indirectly for substantially the full term of the asset or liability. Level 2 inputs are valued using multidimensional relational models and matrices that consider benchmark yields, reported trades, broker/dealer quotes, issuer spreads, two-sided markets, benchmark securities, bids, offers and reference data.
Level 3 Unobservable inputs for the asset or liability (supported by little or no market activity). Level 3 inputs include management’s own assumption about the assumptions that market participants would use in pricing the asset or liability (including assumptions about risk).
The asset’s or liability’s fair value measurement level within the fair value hierarchy is based on the lowest level of any input that is significant to the fair value measurement. Valuation techniques maximize the use of relevant observable inputs and minimize the use of unobservable inputs.
Following is a description of the valuation methodologies used for assets measured at fair value. There has been no change in valuation methodology used at 2019.
Description
Quoted Prices In Active
Markets for Identical Assets
(Level 1)
Significant Observable
Inputs (Level 2) Fair Value
June 30, 2019:U.S. Equity Mutual Funds 31,451,587$ $ 31,451,587$ International Equity Mutual Funds 1,740,209 1,740,209 Common Stock 13,398,152 13,398,152 Pooled Equity Index Funds 342,761 342,761 Pooled Fixed Income Index Funds 252,221 252,221 Fixed Income Mutual Funds 25,307,982 25,307,982 Real estate Investment Trusts 51,738 51,738
Total assets in the fair value hierarchy 71,949,668 594,982 72,544,650 Investments measured at net asset value* 3,992,508 Investments at fair value 71,949,668$ 594,982$ 76,537,158$

CITY OF CRANSTON, RHODE ISLAND NOTES TO FINANCIAL STATEMENTS JUNE 30, 2019
47
Redemption Redemption Funding Fair Value Frequency Notice Period Commitments
Hedge Fund 3,992,508$ Quarterly 65 Days None
Investments Measured at Net Asset Value as of June 30, 2019
There were no transfers between any levels during the year ended June 30, 2019.
B. Receivables
Receivables as of year-end for the City’s government-wide financial statements by type, including the applicable allowances for uncollectibles, are as follows:
Taxes Interest & Liens TotalCurrent portion 7,877,532$ 4,288,103$ 12,165,635$ Less allowance for uncollectibles (2,166,000) (1,744,061) (3,910,061)
Total Receivable 5,711,532$ 2,544,042$ 8,255,574$
Property Taxes
Economic Development
LoansCDBG Loans Total
Loans Receivable 609,366$ 2,170,300$ 2,779,666$
Use Charges Interest & Liens TotalCurrent portion $ 1,443,604 694,341$ 2,137,945$ Less allowance for uncollectibles (578,617) (437,444) (1,016,061)
Total Receivable $ 864,987 256,897$ 1,121,884$
Sewer Use Charges
Governmental funds report unearned revenue in connection with receivables for revenues that are not considered to be available to liquidate liabilities of the current period. Governmental funds also defer revenue recognition in connection with resources that have been received, but not yet earned. At the end of the current fiscal year, the various components of unearned revenue reported in the governmental funds were as follows:
Unearned Revenue:Unearned developer security deposits 109,599$ Tax Collections in advance 7,681,866 Grant Draw-downs prior to meeting all eligibility requirements 3,668,462
11,459,927$

CITY OF CRANSTON, RHODE ISLAND NOTES TO FINANCIAL STATEMENTS JUNE 30, 2019
48
C. Capital Assets
Capital asset activity for the year ended June 30, 2019 was as follows:
Balance BalanceJuly 1, 2018 Increases Decreases June 30, 2019
Governmental Activities:
Capital Assets, not being depreciated:Land $ 15,299,094 $ $ $ 15,299,094 Construction in Progress 2,757,598 9,770,224 4,160,488 8,367,334 Total capital assets, not being depreciated 18,056,692 9,770,224 4,160,488 23,666,428
Capital Assets, being depreciated:Land improvements 36,975,485 4,095,393 41,070,878 Buildings 112,061,887 4,539,490 116,601,377 Machinery and equipment 8,613,377 1,733,071 10,346,448 Office furniture and equipment 7,517,254 14,981 7,532,235 Vehicles 21,998,157 4,461,966 1,639,955 24,820,168 Infrastructure 87,345,123 33,608 87,378,731 Total capital assets being depreciated 274,511,283 14,878,509 1,639,955 287,749,837
Total capital assets 292,567,975 24,648,733 5,800,443 311,416,265
Less accumulated depreciation for:Land improvements 15,193,161 1,477,025 16,670,186 Buildings 48,443,229 1,955,382 50,398,611 Machinery and equipment 5,961,959 753,748 6,715,707 Office furniture and equipment 7,142,266 143,102 7,285,368 Vehicles 15,832,667 2,418,056 1,570,664 16,680,059 Infrastructure 74,148,956 881,285 75,030,241
Total accumulated depreciation 166,722,238 7,628,598 1,570,664 172,780,172
Total Capital Assets, being depreciated, net 107,789,045 7,249,911 69,291 114,969,665
Governmental Activities Capital Assets, net 125,845,737$ 17,020,135$ 4,229,779$ 138,636,093$

CITY OF CRANSTON, RHODE ISLAND NOTES TO FINANCIAL STATEMENTS JUNE 30, 2019
49
Balance BalanceJuly 1, 2018 Increases Decreases June 30, 2019
Business-Type Activities:
Capital Assets, not being depreciated:Land $ 342,712 $ $ $ 342,712 Construction in Progress 20,516,606 698,163 20,895,324 319,445 Total capital assets, not being depreciated 20,859,318 698,163 20,895,324 662,157
Capital Assets, being depreciated/amortized:Land improvements 266,795 4,000 270,795 Leasehold improvements 34,476 13,768 48,244 Machinery and equipment 658,257 211,677 869,934 Office furniture and equipment 1,124 1,124 Vehicles 62,838 10,000 72,838 Service to customers 98,337 58,770 157,107 Pumping plant and equipment 3,721,906 501,589 4,223,495 GIS project 1,103,834 1,103,834 Treatment plant and equipment 78,955,615 20,393,735 99,349,350 Infrastructure 51,623,366 51,623,366 Total capital assets, being depreciated/amortized 136,526,548 21,193,539 - 157,720,087
Total capital assets 157,385,866 21,891,702 20,895,324 158,382,244
Less accumulated depreciation/amortization for:Land improvements 266,795 167 266,962 Leasehold improvements 453 2,267 2,720 Machinery and equipment 496,128 61,358 557,486 Office furniture and equipment 1,124 1,124 Vehicles 36,440 7,833 44,273 Service to customers 83,036 2,434 85,470 Pumping plant and equipment 2,313,465 71,184 2,384,649 GIS project 1,103,833 1,103,833 Treatment plant and equipment 46,702,032 1,539,142 48,241,174 Infrastructure 33,834,779 637,079 34,471,858
Total accumulated depreciation/amortization 84,838,085 2,321,464 - 87,159,549
Total Capital Assets, being depreciated/amortized, net 51,688,463 18,872,075 - 70,560,538
Business-Type Activities Capital Assets, net $ 72,547,781 $ 19,570,238 $ 20,895,324 $ 71,222,695

CITY OF CRANSTON, RHODE ISLAND NOTES TO FINANCIAL STATEMENTS JUNE 30, 2019
50
Depreciation expense was charged to functions of the City as follows:
Governmental Activities:General Government 3,759,363$ Public Safety 1,775,718 Public Works 1,029,821 Education 750,938 Parks and Recreation 193,641 Public Libraries 79,979 Senior Services 39,138
Total Depreciation Expense-Governmental Activities 7,628,598$
Depreciation expense was charged to business-type activities as follows:
Business-Type ActivitiesSewer 2,255,686$ Charter School 9,181 School Lunch 56,597
Total Depreciation Expense-Business-Type Activities 2,321,464$
Construction Commitments The City has active construction projects as of June 30, 2019. At year end, the City’s commitments with contractors are as follows:
Project CommitmentGovernmental-Type Activities
School Bond Fund 4,607,291$ Fire Bond Fund 10,000
Total 4,617,291$

CITY OF CRANSTON, RHODE ISLAND NOTES TO FINANCIAL STATEMENTS JUNE 30, 2019
51
D. Interfund Accounts
Interfund Payables and Receivables
A summary of interfund balances as of June 30, 2019 is as follows:
Corresponding Fund Due From Due To
Major FundsGeneral Fund:
School Unrestricted Fund $ $ 1,459,797Emergency Management Fund 230 Community Development Fund 24,651Police Evidence 1,631Economic Development Revolving Loan 5,000Special Police Duty 234,531Special Fire Duty 2,030Senior Services 30Public Libraries 2,280WIOA Job Development Fund 148,585Police Federal Seizure 5,678Police Grants & Donations 829Internal Service Fund 1,632,903Sewer Fund 2,960,723
Total General Fund 2,047,960 4,430,938
School Department Unrestricted:General Fund-City 1,459,798Internal Service Fund 4,710,050Education 87,276Charter School Fund 12,698
Total School Special Revenue Unrestricted 6,169,848 99,974
Proprietary Funds: Sewer Fund General Fund 4,465,934 Charter School Fund School General Fund 12,698
Total Proprietary Funds 4,478,632 -

CITY OF CRANSTON, RHODE ISLAND NOTES TO FINANCIAL STATEMENTS JUNE 30, 2019
52
Corresponding Fund Due From Due To
Nonmajor FundsEducation General Fund 54,406$ 1,026,507$ Emergency Management Fund General FundCommunity Development Block Grant Fund General Fund 24,651Police Evidence General Fund 1,631Economic Development Revolving Loan General Fund 5,000Public Libraries General Fund 2,280Public Services General Fund 236,791 Senior Services General Fund 30 Police Federal Forfeiture-Justice General Fund 5,678Police Grants & Donations General Fund 829 Highway Bond Fund General Fund 1,505,212WIOA Job Development Fund General Fund 148,585
Total Nonmajor Funds 64,824 2,946,776
Internal Service FundSelf Insurance Fund 1,632,903Health Insurance Fund 3,650,673
Total Internal Service Funds - 5,283,576
Total 12,761,264$ 12,761,264$
All interfund balances result from timing between the dates payments occur between funds for short-term internal financing. Interfund Transfer
A summary of interfund transfers as of June 30, 2019 is as follows:
Transfers Out Transfers InGeneral Fund
School Unrestricted Fund $ 93,896,822$
Total General Fund - 93,896,822
School UnrestrictedGeneral Fund 94,084,926 School Education Fund 188,104 Total School Unrestricted 94,084,926 188,104
Grant Total 94,084,926$ 94,084,926$
Transfers are used to account for the financing by the General Fund of various programs and activities in other funds, and administration of other funds by the General Fund.

CITY OF CRANSTON, RHODE ISLAND NOTES TO FINANCIAL STATEMENTS JUNE 30, 2019
53
E. Changes in Long-Term Obligations
Summary of Changes
The following is a summary of changes in long-term obligations during the fiscal year:
Balance Balance
Date of Amount Interest Maturity Outstanding Outstanding Current
Description Issue Issued Rate Date 6/30/18 Additions Retirements 6/30/19 Portion
Governmental ActivitiesGeneral obligation debt:
158 Public Improvements-158 6/16/2008 13,075,000 4.00-5.00% 7/1/2028 $ 615,000 $ $ 615,000 $ - $158a Advance Refunding (158) Public Improvements 6/1/2016 7,840,000 3.00-5.00% 7/1/2028 7,840,000 7,840,000 635,000 160 Public Improvements-160 7/1/2010 3,000,000 2.00-4.30% 7/1/2030 1,950,000 150,000 1,800,000 150,000162A Public Improvements-162A 3/29/2012 3,430,000 2.00-4.37% 2/1/2032 2,555,000 175,000 2,380,000 170,000162B Refunding-162B (Issue 154 and 155) 3/29/2012 15,955,000 2.00-5.00% 7/1/2023 8,470,000 1,410,000 7,060,000 1,415,000163 Public Improvements-163 7/30/2013 10,210,000 3.00-4.75% 8/1/2033 8,320,000 520,000 7,800,000 520,000164 Advance Refunding (156 & 157) Public Improvements-164 7/15/2015 30,715,000 1.25-5.00% 7/15/2035 23,085,000 4,025,000 19,060,000 2,780,000169 Public Improvements-169 7/24/2018 15,910,000 2.00-5.00% 8/1/2036 15,910,000 15,910,000 510,000
52,835,000 15,910,000 6,895,000 61,850,000 6,180,000 Direct borrowings debt:
159a Advance Refunding (159) School Borrowing 8/10/2016 4,335,000 3.25-5.00% 5/15/2029 4,335,000 315,000 4,020,000 330,000161 School Borrowing-161 1/15/2011 700,000 2.00-4.30% 4/1/2021 210,000 70,000 140,000 70,000166 RI Infrastructure Bank-166 4/9/2016 1,755,000 0.40-2.41% 9/1/2035 1,676,000 79,000 1,597,000 80,000 165 School Improvements-RI Infrastructure Bank-165 5/15/2016 4,565,000 2.00-5.00% 5/15/2036 4,230,000 175,000 4,055,000 175,000 167 RI Infrastructure Bank-167 7/15/2016 2,240,000 0.986-2.32% 9/1/2032 2,240,000 134,000 2,106,000 135,000 168 School Improvements-RI Infrastructure Bank-168 7/19/2017 5,000,000 3.00-5.00% 4/1/2038 5,000,000 160,000 4,840,000 165,000 170 School Borrowing-170 4/11/2019 11,335,000 4.00-5.00% 5/15/2040 11,335,000 11,335,000
17,691,000 11,335,000 933,000 28,093,000 955,000 Total general obligation bonds 70,526,000 27,245,000 7,828,000 89,943,000 7,135,000
Bond premiums 3,158,948 3,906,379 594,794 6,470,533 399,475
TOTAL BONDS AND RELATED LIABILITIES 73,684,948 31,151,379 8,422,794 96,413,533 7,534,475
Bond anticipation notes excluded from current liabilities
Capital Project and General Fund Borrowing 8/24/2017 10,840,000 2.00% 9/6/2018 10,840,000 10,840,000
Total Bond Anticipation Notes Payable 10,840,000 - 10,840,000 - -
Capital leaseEnergy Lease Obligation 11/3/2016 3,200,000 0.0173 7/15/2023 2,780,000 440,000 2,340,000 450,000
Total Leases Payable 2,780,000 440,000 2,340,000 450,000
TOTAL BONDS, NOTES AND RELATED LIABILITIES 87,304,948 31,151,379 19,702,794 98,753,533 7,984,475
COMPENSATED ABSENCES 13,787,165 5,276,428 5,227,527 13,836,066 1,383,607
DEFERRED SALARY 109,029 3,201 105,828 10,583
NET PENSION LIABILITYMunicipal employees' retirement system - City of Cranston 17,223,862 776,295 16,447,567 Municipal employees' retirement system - Police 10,862,240 429,542 10,432,698 Employees' retirement system 140,455,819 881,849 141,337,668 Police and Fire employees' retirement system 236,296,164 159,960 236,136,204
NET OPEB LIABILITY - SCHOOL DEPARTMENT 9,559,662 3,546,358 13,106,020
NET OPEB LIABILITY - CITY 41,197,030 6,045,694 35,151,336
CLAIMS AND JUDGMENTS 50,000 50,000 -
Total General Long-Term Obligations $ 556,845,919 $ 40,856,014 $ 32,395,013 $ 565,306,920 $ 9,378,665
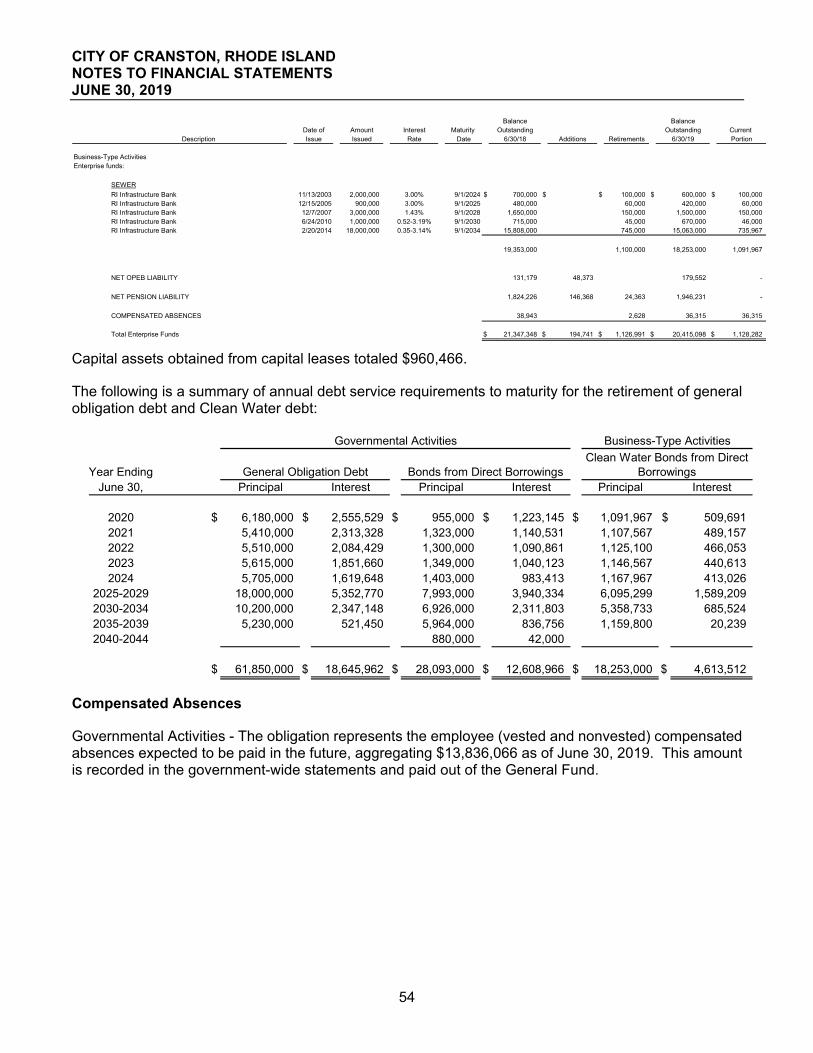
CITY OF CRANSTON, RHODE ISLAND NOTES TO FINANCIAL STATEMENTS JUNE 30, 2019
54
Balance BalanceDate of Amount Interest Maturity Outstanding Outstanding Current
Description Issue Issued Rate Date 6/30/18 Additions Retirements 6/30/19 Portion
Business-Type ActivitiesEnterprise funds:
SEWER
RI Infrastructure Bank 11/13/2003 2,000,000 3.00% 9/1/2024 $ 700,000 $ $ 100,000 $ 600,000 $ 100,000RI Infrastructure Bank 12/15/2005 900,000 3.00% 9/1/2025 480,000 60,000 420,000 60,000RI Infrastructure Bank 12/7/2007 3,000,000 1.43% 9/1/2028 1,650,000 150,000 1,500,000 150,000RI Infrastructure Bank 6/24/2010 1,000,000 0.52-3.19% 9/1/2030 715,000 45,000 670,000 46,000RI Infrastructure Bank 2/20/2014 18,000,000 0.35-3.14% 9/1/2034 15,808,000 745,000 15,063,000 735,967
19,353,000 1,100,000 18,253,000 1,091,967
NET OPEB LIABILITY 131,179 48,373 179,552 -
NET PENSION LIABILITY 1,824,226 146,368 24,363 1,946,231 -
COMPENSATED ABSENCES 38,943 2,628 36,315 36,315
Total Enterprise Funds $ 21,347,348 $ 194,741 $ 1,126,991 $ 20,415,098 $ 1,128,282
Capital assets obtained from capital leases totaled $960,466.
The following is a summary of annual debt service requirements to maturity for the retirement of general obligation debt and Clean Water debt:
Year EndingJune 30, Principal Interest Principal Interest Principal Interest
2020 $ 6,180,000 $ 2,555,529 $ 955,000 $ 1,223,145 $ 1,091,967 $ 509,691 2021 5,410,000 2,313,328 1,323,000 1,140,531 1,107,567 489,157 2022 5,510,000 2,084,429 1,300,000 1,090,861 1,125,100 466,053 2023 5,615,000 1,851,660 1,349,000 1,040,123 1,146,567 440,613 2024 5,705,000 1,619,648 1,403,000 983,413 1,167,967 413,026
2025-2029 18,000,000 5,352,770 7,993,000 3,940,334 6,095,299 1,589,209 2030-2034 10,200,000 2,347,148 6,926,000 2,311,803 5,358,733 685,524 2035-2039 5,230,000 521,450 5,964,000 836,756 1,159,800 20,239 2040-2044 880,000 42,000
$ 61,850,000 $ 18,645,962 $ 28,093,000 $ 12,608,966 $ 18,253,000 $ 4,613,512
General Obligation Debt
Business-Type ActivitiesGovernmental Activities
Clean Water Bonds from Direct BorrowingsBonds from Direct Borrowings
Compensated Absences
Governmental Activities - The obligation represents the employee (vested and nonvested) compensated absences expected to be paid in the future, aggregating $13,836,066 as of June 30, 2019. This amount is recorded in the government-wide statements and paid out of the General Fund.

CITY OF CRANSTON, RHODE ISLAND NOTES TO FINANCIAL STATEMENTS JUNE 30, 2019
55
Lease Commitment
The City is obligated under various operating leases to make the following aggregate annual lease payments:
Year Ended June 30
2020 $ 1,107,359 2021 798,160 2022 747,785 2023 416,829 2024 210,963
$ 3,281,096
Lease expenditures approximated $900,000 for fiscal year ended June 30, 2019.
Statutory Debt Limitations
Debt Limit Except as explained below, under Rhode Island law the City may not, without special statutory authorization, incur any debt which would increase its aggregate indebtedness not otherwise excepted by law to an amount greater than 3% of the taxable property of the City. Deducted from the computation of aggregate indebtedness is the amount of any borrowing in anticipation of taxes authorized by law and the amount of any sinking funds maintained by the City. There is currently no outstanding debt of the City subject to the 3% debt limit. The current 3% debt limit of the City is $239.2 million based on taxable property as of December 31, 2017, of approximately $8.0 billion.
The State of Rhode Island General Assembly (General Assembly) may by special act permit the City to incur indebtedness outside the 3% debt limit. Bonds issued either within the 3% debt limit or by special legislation adopted by the General Assembly authorizing the City to incur debt are subject to referendum by the electors of the City. On June 30, 2019, the City had $89,943,000 of debt outstanding, none of which is subject to the 3% debt limit.
In addition to debt authorized within the 3% debt limit and debt authorized by special act of the General Assembly, Rhode Island General Laws Section 45-12-11 authorizes the State Director of Administration, upon petition by a municipality, to authorize such municipality to incur indebtedness in excess of the 3% debt limit whenever the Director shall determine that the sums appropriated by the municipality or its funds available are insufficient to pay the necessary expenses of the municipality. The City has not requested the State Director of Administration to authorize indebtedness of the City under Section 45-12-11.
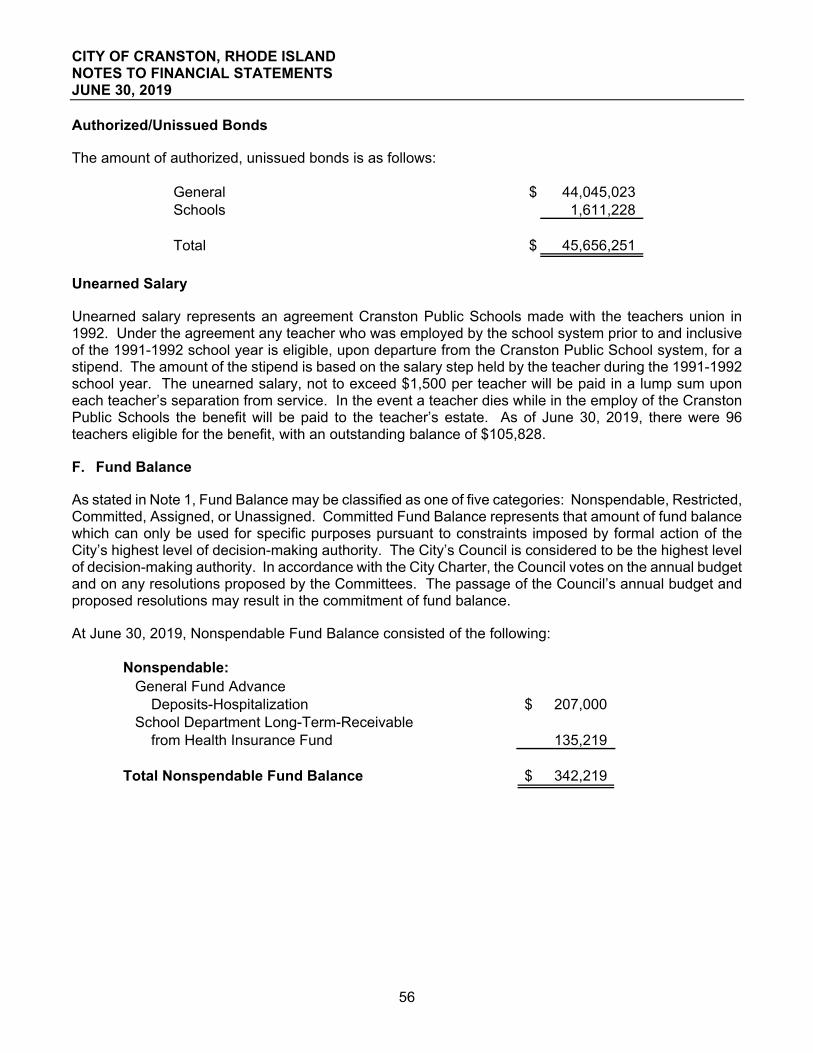
CITY OF CRANSTON, RHODE ISLAND NOTES TO FINANCIAL STATEMENTS JUNE 30, 2019
56
Authorized/Unissued Bonds
The amount of authorized, unissued bonds is as follows:
General $ 44,045,023 Schools 1,611,228
Total $ 45,656,251
Unearned Salary
Unearned salary represents an agreement Cranston Public Schools made with the teachers union in 1992. Under the agreement any teacher who was employed by the school system prior to and inclusive of the 1991-1992 school year is eligible, upon departure from the Cranston Public School system, for a stipend. The amount of the stipend is based on the salary step held by the teacher during the 1991-1992 school year. The unearned salary, not to exceed $1,500 per teacher will be paid in a lump sum upon each teacher’s separation from service. In the event a teacher dies while in the employ of the Cranston Public Schools the benefit will be paid to the teacher’s estate. As of June 30, 2019, there were 96 teachers eligible for the benefit, with an outstanding balance of $105,828.
F. Fund Balance
As stated in Note 1, Fund Balance may be classified as one of five categories: Nonspendable, Restricted, Committed, Assigned, or Unassigned. Committed Fund Balance represents that amount of fund balance which can only be used for specific purposes pursuant to constraints imposed by formal action of the City’s highest level of decision-making authority. The City’s Council is considered to be the highest level of decision-making authority. In accordance with the City Charter, the Council votes on the annual budget and on any resolutions proposed by the Committees. The passage of the Council’s annual budget and proposed resolutions may result in the commitment of fund balance.
At June 30, 2019, Nonspendable Fund Balance consisted of the following:
Nonspendable:General Fund Advance
Deposits-Hospitalization 207,000$ School Department Long-Term-Receivable
from Health Insurance Fund 135,219
Total Nonspendable Fund Balance 342,219$

CITY OF CRANSTON, RHODE ISLAND NOTES TO FINANCIAL STATEMENTS JUNE 30, 2019
57
At June 30, 2019, Restricted Fund Balance consisted of the following:
Restricted:To Fund Future Library Expenses 88,525$ To Fund Education Expenses 2,181,882 To Fund Recreation Bond Expenditures 595,629 To Fund School Bond 8,048,051 To Fund Public Building Bond 42,073 To Fund Future Fire Expenses 171,104 To Fund Library Expenses 52,595 To Fund Police and Fire Capital Projects 160,647 To Fund Storm Drain Projects 173,631 To Fund Neighborhood Infrastructure Capital Projects 290,628 To Fund Open Space 123,366 To Fund Future Community Development Expenditures 1,447,310 To Fund Future Public Service Expenditures 806,123 To Fund Future Senior Services Expenditures 134,901 To Fund Future Ice Rink 93,564 To Fund Future Parks and Recreation Expenditures 1,754 To Fund Future Health Insurance Costs 1,155,713 To Fund Future Grant Expenditures 9,691 To Fund Future Capital Facilities Impact Expenditures 591,667 To Fund Future Cemetery Trust Expenditures 3,497 To Fund Future Historical Record Expenditures 700,274
Total Restricted Fund Balance 16,872,625$
At June 30, 2019, Committed Fund Balance consisted of the following:
Committed:Capital and One-Time Expenditures 39,259$ Self-Insurance Healthcare Reserve Fund 4,784 School Department Grants 29,490 Encumbrances for Education Supplies 806,404
Total Committed Fund Balance 879,937$
The City of Cranston does not currently have a spending policy regarding the order in which restricted, committed, assigned, and unassigned fund balances are spent when more than one amount is available for the expenditures incurred. Accordingly, by default, the City is following the policy prescribed by GASB Statement No. 54 which specifies that fund balance is reduced first by committed, then by assigned, then by unassigned when expenditures are incurred for purposes for which any unrestricted fund balance could be used. In all situations, the City considers restricted fund balance to be used first when available and when expenditures are incurred that meet the requirements of the restricted fund balance.

CITY OF CRANSTON, RHODE ISLAND NOTES TO FINANCIAL STATEMENTS JUNE 30, 2019
58
4. OTHER INFORMATION
A. Risk Management
The City is exposed to various risks of loss related to public official liability, police liability, Board of Education legal liability, theft or impairment of assets, errors and omissions, injury to employees and natural disasters. The City is self-insured in most areas of risk, subject to certain third party “stop loss” coinsurance. Self-insured risks include general liability, property and casualty, workers’ compensation, unemployment and employee health and life insurance claims. Settled claims have not exceeded commercial coverage in any of the past three years, and there have not been any significant reductions in insurance coverage from amounts held in prior years.
The City’s health insurance program provides coverage to the City’s employees and retirees through Healthmate and Blue Cross - Blue Shield of Rhode Island (BC/BS), United Healthcare and Delta Dental of Rhode Island. The City’s program is a self-insured program with BC/BS, United Healthcare and Delta Dental acting as third-party agents for the City in the payment of the various claim plans used by the City.
The City of Cranston contributes to a separate account an amount per covered employee which would otherwise have been paid to an insurance carrier. These amounts are determined by an independent third-party consultant hired by the City of Cranston who works with the provider to examine past experience and determine an adequate amount for each type of plan offered by the City. Factors considered by the plan administrator include the amount of claims paid during the previous year, claims administration costs and projected insurance industry inflation rates. The City of Cranston, including Cranston Public Schools, incurred approximately $37 million for fiscal year 2019 under this plan.
The claims liabilities reported in the general and school department funds are related to the self-insurance program and are based upon the provisions of GASB Statements No. 10 and 30, which require that a liability for estimated claims incurred but not reported (IBNR) be recorded. The amount of claim accrual is based on the ultimate costs of settling the claim, which include past experience data, inflation, and other future economic and societal factors and incremental claim adjustment expenses, net of estimated subrogation recoveries. The claim accrual does not include other allocated or unallocated claims adjustment expenses.
In order to avoid catastrophic losses, the City “reinsures” the program by purchasing insurance known as “stop-loss insurance” from BC/BS Insurance Co. and United Healthcare Services. Two types of “stop-loss insurance” are purchased: 1) individual stop-loss; and 2) aggregate stop-loss, with both provided through the Plan Administrator. Under the individual stop-loss insurance, the City pays the first $200,000/$225,000 of claims for individual employees or dependents. Any charges accrued by an individual in excess of $200,000/$225,000 in a fiscal year are thereafter reimbursed by BC/BS Insurance Co. and United Healthcare Services. The aggregate stop-loss is designed to protect the City for multiple large claims which may not reach the individual stop-loss attachment point ($200,000/$225,000). The aggregate stop-loss limit is $2,000,000/$2,200,000 per claim.
The City is exposed to various risks of loss related to torts, theft of, damage to, and destruction of assets, errors and omissions, injuries to employees, and natural disasters. The City established the Cranston Claims Committee (an internal service fund) to account for and finance its uninsured risks of loss.

CITY OF CRANSTON, RHODE ISLAND NOTES TO FINANCIAL STATEMENTS JUNE 30, 2019
59
The City records liabilities for self-insured claims reported if it is probable that a loss has been incurred and the amount can be reasonably estimated. The City has established a liability based on historical trends of previous years, where available, and attorney’s estimates of pending matters and lawsuits in which the City is involved.
Changes in the self-insurance liability for the fiscal years ended June 30, 2019 are as follows:
2019 2018
July 1 697,667$ 926,280$ Add incurred claims 36,429,454 34,437,678 Less payments of claims attributable to events of both the current and prior fiscal years:
Health and life 36,356,673 34,666,291
Year Ended June 30 770,448$ 697,667$
The liabilities above have not been discounted to their present value. Incurred claims represent the total of a provision for events of the current fiscal year and any change in the provision for events of the prior fiscal years. The liability at June 30, 2019 has been recorded on the statement of net position under the claims payable line, within the government-wide statements ($770,448).
The School Department has chosen to participate in the Health Benefits Project provided by the West Bay Community Health, an independent, non-profit organization. Deposits made to the Collaborative are treated as expenditures when it is probable that a claim has been incurred and include estimated amounts for claims that have been incurred but not reported (IBNR). Claim liabilities are calculated considering the effects of inflation, recent claim and health care trends, and other economic and social factors.
B. Lease of Wastewater Treatment Facility
The City has entered into a Wastewater Treatment Facility Lease and Service Agreement with Triton, LLC/U.S. Filter/Veolia Water (the Company). The terms of the agreement include among others that the City will lease to the Company its Wastewater Treatment System for 25 years. The City will remain owner of the system and will continue to establish and collect all sewer fees. The Company will be responsible for providing wastewater treatment services to the City for that time period; operating and maintaining the City’s wastewater treatment facility, pumping stations, force mains, sewer interceptors and the rest of the collection system; designing, constructing and testing certain system improvements; and administering the City's municipal industrial pre-treatment program (MIPP).
The contract required the Company to pay the City a one-time payment as consideration for the lease. The payment of $48.0 million represents a prepayment of the lease payments due to the City over the next 25 years. These lease payments are “earned” over the life of the lease. Accordingly, unearned revenue has been recorded in the Sewer Enterprise Fund which will be realized on a straight-line basis over the life of the lease (25 years).
At June 30, 2019, the balance of unearned revenue related to this was approximately $6,787,000 which is comprised of a short-term portion of $1,920,000 and a long-term portion of approximately $4,867,000.

CITY OF CRANSTON, RHODE ISLAND NOTES TO FINANCIAL STATEMENTS JUNE 30, 2019
60
During the term of the agreement, the City pays the Company a service fee, which is calculated based on definitive components and amounts, as adjusted in accordance with guidelines established in the agreement. The service fee is generally fixed at the beginning of each fiscal year. During 2019, the City paid service fees totaling approximately $17 million. The City also recognized 4% of the lease payment ($1,920,000) as revenue for the year ended June 30, 2019.
This transaction was financed with conduit debt “1997 Series Bonds” which were advance refunded on February 28, 2017. On January 31, 2017, there was another conduit debt transaction on the “2017 Series Bonds.” This transaction resulted in refunding credit savings of $4,403,930 over the term of the bond which is due September 2022. This debt is not due and payable from the City of Cranston, Rhode Island but they were a party to the transaction.
C. Commitments and Litigation
Construction and other significant commitments have been reported as reserve for commitments in the fund equity section of the balance sheet.
Amounts received or receivable from Federal and State grantor agencies are subject to audit and adjustment by grantor agencies. Any disallowed claims, including amounts already collected, may constitute a liability of the applicable funds. The amount, if any, of expenditures which may be disallowed by the grantor cannot be determined at this time, although the City expects such amounts, if any, to be immaterial.
The City is a defendant in various lawsuits and the outcome of these lawsuits is not presently determinable. In the opinion of the City attorney, the resolution of these matters will not have a material adverse effect on the financial condition of the City.
D. Employee Retirement System
Summary
The City contributes to five defined benefit pension plans - the Police and Fire Employees’ Pension Plan of the City of Cranston (PFERS), a single-employer plan; the Municipal Employees’ Retirement System (MERS), an agent multiple-employer plan; the Employees’ Retirement System of the State of Rhode Island (ERS), a cost-sharing multiple employer plan; the National (Industrial) Pension Plan, a cost-sharing multi-employer defined benefit plan; and the New England Teamsters & Trucking Industry Pension Plan, a cost-sharing multiple-employer plan. The PFERS is presented in the accompanying financial statements as a fiduciary fund. MERS, ERS, the National Industrial Pension Plan and the New England Teamsters & Trucking Industry Pension Plan are not included in the City’s financial statements. Financial information can be obtained for those plans by contacting the State of Rhode Island.
Police and Fire Employees’ Pension Plan of the City of Cranston (PFERS)
Plan Administration The City of Cranston (City) administers the City of Cranston Fire Department and Police Department Pension Plans (Plan), a defined benefit pension plan that provides pensions for all full-time firefighters and policemen of the City. Employees hired after July 1, 1995 become members of the State plan and do not participate in this plan.
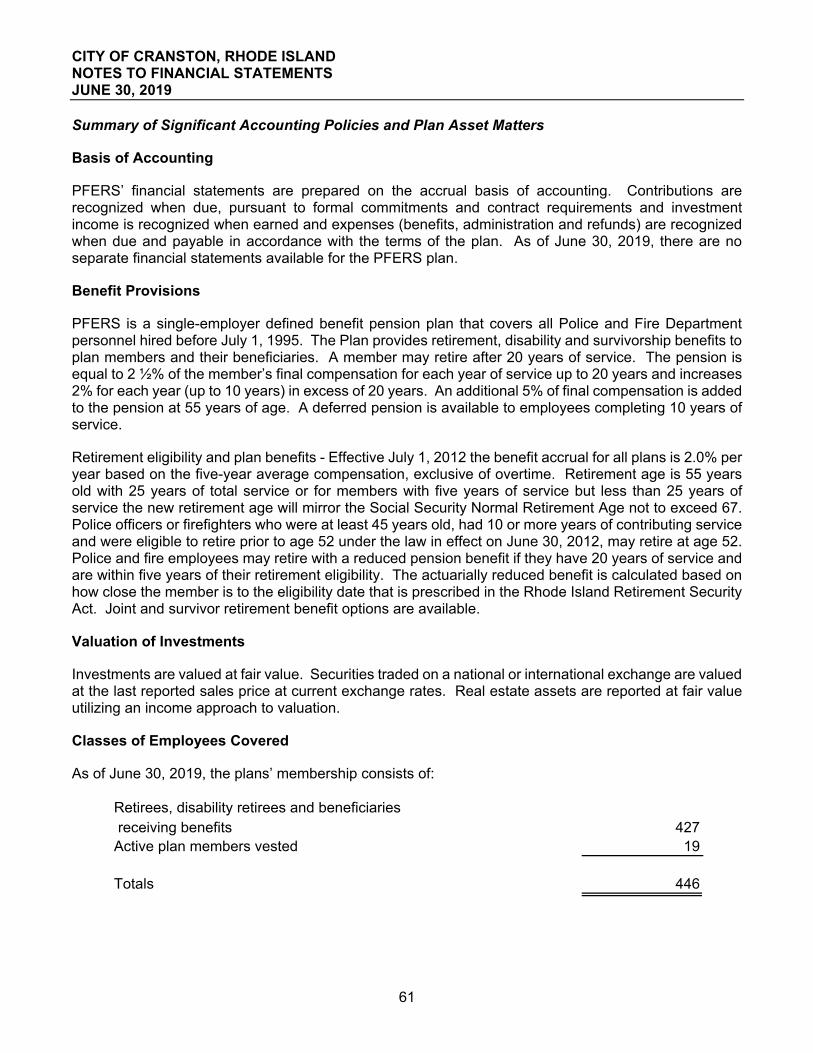
CITY OF CRANSTON, RHODE ISLAND NOTES TO FINANCIAL STATEMENTS JUNE 30, 2019
61
Summary of Significant Accounting Policies and Plan Asset Matters
Basis of Accounting
PFERS’ financial statements are prepared on the accrual basis of accounting. Contributions are recognized when due, pursuant to formal commitments and contract requirements and investment income is recognized when earned and expenses (benefits, administration and refunds) are recognized when due and payable in accordance with the terms of the plan. As of June 30, 2019, there are no separate financial statements available for the PFERS plan.
Benefit Provisions
PFERS is a single-employer defined benefit pension plan that covers all Police and Fire Department personnel hired before July 1, 1995. The Plan provides retirement, disability and survivorship benefits to plan members and their beneficiaries. A member may retire after 20 years of service. The pension is equal to 2 ½% of the member’s final compensation for each year of service up to 20 years and increases 2% for each year (up to 10 years) in excess of 20 years. An additional 5% of final compensation is added to the pension at 55 years of age. A deferred pension is available to employees completing 10 years of service.
Retirement eligibility and plan benefits - Effective July 1, 2012 the benefit accrual for all plans is 2.0% per year based on the five-year average compensation, exclusive of overtime. Retirement age is 55 years old with 25 years of total service or for members with five years of service but less than 25 years of service the new retirement age will mirror the Social Security Normal Retirement Age not to exceed 67. Police officers or firefighters who were at least 45 years old, had 10 or more years of contributing service and were eligible to retire prior to age 52 under the law in effect on June 30, 2012, may retire at age 52. Police and fire employees may retire with a reduced pension benefit if they have 20 years of service and are within five years of their retirement eligibility. The actuarially reduced benefit is calculated based on how close the member is to the eligibility date that is prescribed in the Rhode Island Retirement Security Act. Joint and survivor retirement benefit options are available.
Valuation of Investments
Investments are valued at fair value. Securities traded on a national or international exchange are valued at the last reported sales price at current exchange rates. Real estate assets are reported at fair value utilizing an income approach to valuation.
Classes of Employees Covered
As of June 30, 2019, the plans’ membership consists of:
Retirees, disability retirees and beneficiaries receiving benefits 427Active plan members vested 19
Totals 446

CITY OF CRANSTON, RHODE ISLAND NOTES TO FINANCIAL STATEMENTS JUNE 30, 2019
62
Contributions
Police personnel are required to contribute 10% of their base salary to the pension plan and fire personnel are required to contribute 10.5% of their base salary and longevity to the pension plan.
The City establishes contributions based on an actuarially determined contribution recommended by an independent actuary. The actuarially determined contribution is the estimated amount necessary to finance the costs of benefits earned by plan members during the year, with an additional amount to finance any unfunded accrued liability. For the year ended June 30, 2019, the City contributed $21,569,803 to the Plan, including $0 from the State.
Net Pension Liability
The components of the net pension liability of the plan as of June 30, 2019 (the date of the most recent actuarial valuation) was as follows:
Total Pension Liability 306,705,941$ Plan fiduciary net position 70,569,737 Net Pension Liability (NPL) 236,136,204$ Plan fiduciary net position as a percentage of the total pension liability 23.01%
Covered payroll (active plan members) 2,043,982$
NPL as a percentage of covered payroll 11552.75%
Actuarial valuations of an ongoing plan involve estimates of the value of reported amounts and assumptions about the probability of occurrence of events into the future. Examples include assumptions about future employment, mortality, and the healthcare cost trend. Amounts determined regarding the funded status of the plan and the annual required contributions of the employer are subject to continual revision as actual results are compared with past expectations and new estimates are made about the future. The schedule of funding progress, presented as required supplementary information following the notes to basic financial statements, presents multiyear trend information about whether the actuarial value of plan assets is increasing or decreasing over time relative to the actuarial liabilities for benefits.
Actuarial Assumptions
The historical trend information was determined as part of the actuarial valuation as of the date indicated in the tabulation. Additional information as of the latest valuation is as follows:
The June 30, 2019, total pension liability was determined by rolling forward the June 30, 2018 valuation results, using the following actuarial assumptions, applied to all periods included in the measurement:

CITY OF CRANSTON, RHODE ISLAND NOTES TO FINANCIAL STATEMENTS JUNE 30, 2019
63
Census data was collected as of July 1, 2018. Liabilities measured as of the census date were projected to June 30, 2019 assuming no demographic gains or losses.
Mortality rates for health lives were based on the RP-2000 Combined Mortality Table with Blue Collar Adjustment and improvements projected to 2026 with Scale AA. The same tables were used for disabled lives but set forward three years.
The long-term expected rate of return on pension plan investments was determined using a building-block method in which best-estimate ranges of expected future real rates of return (expected returns, inflation) are developed for each major asset class. These ranges are combined to produce the long-term expected rate of return and by adding expected inflation. Best estimates of rates of return for each major asset class included in the pension plan’s target asset allocation as of June 30, 2019 are summarized in the following table (note that the rates shown below include the inflation component):
Asset Class
Long-Term Expected Rate of
Return Target Allocation
Domestic Equity (large cap) 11.13% 35.00%Domestic Equity (mid cap) 13.16% 5.00%Domestic Equity (small cap) 13.22% 5.00%International Equity 9.86% 15.00%Fixed income 4.16% 35.00%Real estate 8.35% 5.00%
100.00%
Rate of Return For the year ended June 30, 2018, the annual money-weighted rate of return on pension plan investments, net of pension plan investment expense, was 5.64%. The money-weighted rate of return expresses investment performance, net of investment expense, adjusted for the changing amounts actually invested.

CITY OF CRANSTON, RHODE ISLAND NOTES TO FINANCIAL STATEMENTS JUNE 30, 2019
64
Discount Rate
The assumed discount rate used to measure liabilities for valuation purposes is 7.90%. The projection of cash flows used to determine the discount rate for GASB 67 purposes assumed that future City contributions will follow the contribution pattern of the most recent five years (see table below), which results in an assumption that the City will contribute approximately 95.3% of the actuarially determined contributions. Based on these assumptions, the pension plan’s fiduciary net position is projected to fall short of meeting all future benefit obligations to current plan members. From the point where assets are projected to be depleted, a municipal bond rate of 2.71%, based on the S&P Municipal Bond 20 Year High Grade Rate Index, was used in the development of the blended GASB discount rate. The resulting blended rate of 7.90% was used to measure the Plan’s total pension liability.
Changes in Net Pension Liability
Total Pension Liability
Plan Fiduciary Net
PositionNet Pension
LiabilityBalances as of June 30, 2018 301,728,442$ 69,844,258$ 231,884,184$ Changes for the year:
Service cost 434,021 434,021 Interest on the total pension liability 22,902,534 22,902,534 Differences between expected and actual experience 6,629,821 6,629,821 Changes in assumptions - Employer contributions 21,569,803 (21,569,803) Employee contributions 201,448 (201,448) Net investment income 4,016,741 (4,016,741) Benefit payments, including employee refunds (24,988,877) (24,988,877) - Administrative expense (73,636) 73,636 Other changes -
Net changes 4,977,499 725,479 4,252,020
Balances as of June 30, 2019 306,705,941$ 70,569,737$ 236,136,204$
Police and Fire Pension Plan
Increase (Decrease)
Sensitivity of the Net Pension Liability to Changes in the Discount Rate
The following represents the net pension liability, calculated using the discount rate of 7.90%, as well as what the City’s net pension liability would be if it were calculated using a discount rate that is 1 percentage point lower (6.90%) or 1 percentage-point higher (8.90%) than the current rate:
1% DecreaseCurrent Discount
Rate 1% Increase
Net Pension Liability 266,968,794$ 236,136,204$ 210,007,816$

CITY OF CRANSTON, RHODE ISLAND NOTES TO FINANCIAL STATEMENTS JUNE 30, 2019
65
Pension Expense and Deferred Outflows of Resources and Deferred Inflows of Resources Related to Pensions
For the year ended June 30, 2019, the employer recognized pension expense of $26,116,570. The employer reported deferred outflows and inflows of resources related to pensions from the following sources:
Deferred Outflows of Resources
Deferred Inflows of Resources
Net differences between expected and actual earnings 3,630,925$ $
Total 3,630,925$ -$
Year Ending June, 30
Net Deferred Outflows (Inflows)
of Resources
2020 1,668,168$ 2021 1,443,821 2022 244,251 2023 274,685
Total 3,630,925$
Municipal Employees’ Retirement System of the State of Rhode Island (MERS) - General, Police and Fire
Plan Description
The Municipal Employees’ Retirement System (MERS) - an agent multiple-employer defined benefit pension plan - provides certain retirement, disability and death benefits to plan members and beneficiaries. MERS was established under Rhode Island General Law and placed under the management of the Employee’s Retirement System of Rhode Island (ERSRI) Board to provide retirement allowances to employees of municipalities, housing authorities, water and sewer districts, and municipal police and fire persons that have elected to participate. Benefit provisions are subject to amendment by the General Assembly.
MERS issues a publicly available financial report that includes financial statements and required supplementary information. This report may be obtained accessing the ERSRI website at www.ersri.org.

CITY OF CRANSTON, RHODE ISLAND NOTES TO FINANCIAL STATEMENTS JUNE 30, 2019
66
Benefits Provided
General employees, police officers and firefighters employed by electing municipalities participate in MERS. Eligible employees become members at their date of employment. Anyone employed by a municipality at the time the municipality joins MERS may elect not to be covered. Elected officials may opt to be covered by MERS. Employees covered under another plan maintained by the municipality may not become members of MERS. Police officers and/or firefighters may be designated as such by the municipality, in which case the special contribution and benefit provisions described below will apply to them, or they may be designated as general employees with no special benefits. Members designated as police officers and/or firefighters are treated as belonging to a unit separate from the general employees, with separate contribution rates applicable.
Salary: Salary includes the member's base earnings plus any payments under a regular longevity or incentive plan. Salary excludes overtime, unused sick and vacation leave, severance pay, and other extraordinary compensation. Certain amounts that are excluded from taxable wages, such as amounts sheltered under a Section 125 plan or amounts picked up by the employer under IRC Section 414(h), are not excluded from salary.
Service: Employees receive credit for service while a member. In addition, a member may purchase credit for certain periods by making an additional contribution to purchase the additional service. Special rules and limits govern the purchase of additional service and the contribution required.
Final Compensation: Prior to July 1, 2012 and for general employee members eligible to retire as of June 30, 2012, the average was based on the member’s highest three consecutive annual salaries. Effective July 1, 2012, the average was based on the member's highest five consecutive annual salaries. Once a member retires or is terminated, the applicable FAC will be the greater of the member’s highest three year FAC as of July 1, 2012 or the five year FAC as of the retirement/termination date. Monthly benefits are based on one-twelfth of this amount.
General employees
Members with less than five years of contributory service as of June 30, 2012 and members hired on or after that date are eligible for retirement on or after their Social Security normal retirement age (SSNRA).
Members who had at least five years of contributory service as of June 30, 2012 will be eligible for retirement at an individually determined age. This age is the result of interpolating between the member’s prior Retirement Date, described below, and the retirement age applicable to members hired after June 30, 2012 as described above. The interpolation is based on service as of June 30, 2012 divided by projected service at the member’s prior Retirement Date. The minimum retirement age is 59.
Members with 10 or more years of contributory service on June 30, 2012 may choose to retire at their prior Retirement Date if they continue to work and contribute until that date. If this option is elected, the retirement benefit will be calculated using the benefits accrued as of June 30, 2012, i.e., the member will accumulate no additional defined benefits after this date, but the benefit will be paid without any actuarial reduction.
Effective July 1, 2015, members will be eligible to retire with full benefits at the earlier of their current Rhode Island Retirement Security Act (RIRSA) date described above or upon the attainment of age 65 with 30 years of service, age 64 with 31 years of service, age 63 with 32 years of service, or age 62 with 33 years of service.

CITY OF CRANSTON, RHODE ISLAND NOTES TO FINANCIAL STATEMENTS JUNE 30, 2019
67
A member who is within five years of reaching their retirement eligibility date and has 20 or more years of service, may elect to retire at any time with an actuarially reduced benefit.
Prior to July 1, 2012, members were eligible for retirement on or after age 58 if they had credit for 10 or more years of service, or at any age if they had credit for at least 30 years of service. Members eligible to retire before July 1, 2012 were not impacted by the changes to retirement eligibility above.
The annual benefit is equal to 2.00% of the member’s monthly FAC for each year of service prior to July 1, 2012 and 1.00% of the member’s monthly FAC for each year of service from July 1, 2012 through June 30, 2015. For all service after June 30, 2015, the annual benefit is equal to 1.0% per year unless the member had 20 or more years of service as of June 30, 2012 in which case the benefit accrual is 2.0% per year for service after June 30, 2015. The benefit cannot exceed 75% of the member’s FAC. Benefits are paid monthly.
Police and Fire employees Members are eligible to retire when they are at least 50 years old and have a minimum of 25 years of contributing service or if they have 27 years of contributing service at any age. Members with less than 25 years of contributing service are eligible for retirement on or after their Social Security normal retirement age.
Members who, as of June 30, 2012, had at least 10 years of contributing service, had attained age 45, and had a prior Retirement Date before age 52 may retire at age 52.
Active members on June 30, 2012 may choose to retire at their prior Retirement Date if they continue to work and contribute until that date. If option is elected, the retirement benefit will be calculated using the benefits accrued as of June 30, 2012, i.e., the member will accumulate no additional defined benefits after this date, but the benefit will be paid without any actuarial reduction.
A member who is within five years of reaching their retirement eligibility date, as described in this section, and has 20 or more years of service, may elect to retire at any time with an actuarially reduced benefit.
Prior to July 1, 2012, members designated as police officers or firefighters were eligible for retirement at or after age 55 with credit for at least 10 years of service or at any age with credit for 25 or more years of service. Members were also eligible to retire and receive a reduced benefit if they are at least age 50 and have at least 20 years of service. If the municipality elected to adopt the 20-year retirement provisions for police officers and/or firefighters, then such a member was eligible to retire at any age with 20 or more years of service. Members eligible to retire before July 1, 2012 were not impacted by the changes to retirement eligibility above.
A monthly benefit is paid equal to 2.00% of the member’s monthly FAC for each year of service, up to 37.5 years (75% of FAC maximum).
If the optional 20-year retirement provisions were adopted by the municipality prior to July 1, 2012: benefits are based on 2.50% of the member’s FAC for each year of service prior to July 1, 2012 and 2.00% of the member’s FAC for each year of service after July 1, 2012. The benefit cannot exceed 75% of the member’s FAC.
Active members (including future hires), members who retire after July 1, 2015 and after attaining age 57 with 30 years of service will have a benefit equal to the greater of their current benefit described in (a) and (b) above and one calculated based on a 2.25% multiplier for all years of service.

CITY OF CRANSTON, RHODE ISLAND NOTES TO FINANCIAL STATEMENTS JUNE 30, 2019
68
Other benefit provisions Death and disability benefits are also provided to members. A member is eligible for a disability retirement provided he/she has credit for at least five years of service or if the disability is work-related. Members are not eligible for an ordinary disability benefit if they are eligible for unreduced retirement.
Joint and survivor benefit options are available to retirees. For some employees, a Social Security Option is also available where an annuity is paid at one amount prior to age 62, and at a reduced amount after age 62, designed to provide a level total income when combined with the member's age 62 Social Security benefit. Benefits cease upon the member’s death.
Post-retirement benefit increases are paid to members who retire after June 30, 2012. Members will be eligible to receive cost of living increases at the later of the member’s third anniversary of retirement and the month following their SSNRA (age 55 for members designated as police officers and/or firefighters). When a municipality elects coverage, it may elect either COLA C (covering only current and future active members and excluding members already retired) or COLA B (covering current retired members as well as current and future active members).
a. The COLA will be suspended for any unit whose funding level is less than 80%; however, an interim COLA may be granted in four-year intervals while the COLA is suspended. The first interim COLA may begin January 1, 2018. b. Effective July 1, 2015, the COLA is determined based on 50% of the plan's five-year average investment rate of return less 5.5% limited to a range of 0.0% to 4.0%, plus 50% of the lesser of 3.0% or last year's CPI-U increase for a total maximum increase of 3.50%. Previously, it was the plan's five-year average investment rate of return less 5.5% limited to a range of 0.0% to 4.0% c. The COLA will be limited to the first $25,000 of the member's annual pension benefit. For retirees and beneficiaries who retired on or before July 1, 2015, years in which a COLA is payable based on every fourth year provision described in (a) above will be limited to the first $30,000. These limits will be indexed annually to increase in the same manner as COLAs, with the known values of $25,000 for 2013, $25,000 for 2014, $25,168 for 2015, $25,855 for 2016, and $26,098 for 2017. Special Provisions Applying to Specific Units
Prior to July 1, 2012, some units had specific provisions that apply only to that unit. Per section 45-21.2-5 benefits for members eligible to retire prior to June 30, 2012 are preserved for the calculation of the retirement benefits. For service accrued after July 1, 2012, retirement benefits will be calculated in accordance with section 45-21.2-2 and adjustments to benefits will be provided as set forth in 45-21-52. The following summarizes those provisions:
Cranston fire department hired after July 1, 1995 or with less than 5 years of service at that date - Rhode Island General Law § 45-21.2-5 (7) and § 45-21.2-14 9 (e). Under these special provisions, the final compensation for benefit computation is based on the members’ highest year of earnings. In addition, the members shall receive a three percent (3%) escalation of their pension payment compounded each year on January 1st following the year of retirement and continuing on an annual basis on that date. The member contribution rate is 10.00%. Compensation for benefit purposes includes base, longevity, and holiday pay.

CITY OF CRANSTON, RHODE ISLAND NOTES TO FINANCIAL STATEMENTS JUNE 30, 2019
69
Cranston police department hired after July 1, 1995 or with less than 5 years of service at that date - Rhode Island General Law §§ 45-21.2-5 (8) and § 45-21.2-14 (f). Under these special provisions, the final compensation for benefit computation is based on the members’ highest year of earnings. In addition, the members shall receive a three percent (3%) escalation of their pension payment compounded each year on January 1st following the year of retirement and continuing on an annual basis on that date. The member contribution rate is 10.00%. Compensation for benefit purposes includes base, longevity, and holiday pay.
Employees Covered by Benefit Terms
At the June 30, 2017 valuation date, the following employees were covered by the benefit terms:
Municipal Police Fire
Inactive, Nonretired Members 333 10 5 Retirees and Beneficiaries 596 22 17 Active Members 658 144 168
Total 1,587 176 190
Contributions The amount of employee and employer contributions have been established under Rhode Island General Law Chapter 45-21. General employees with less than 20 years of service as of June 30, 2012 are required to contribute 2% of their salaries. General employees with more than 20 years of service as of June 30, 2012 are required to contribute 8.25%. Public safety employees are required to contribute 10% of their salaries. The City of Cranston contributes at a rate of covered employee payroll as determined by an independent actuary on an annual basis. The General Assembly can amend the amount of these contribution requirements. The City of Cranston contributed $2,342,837 in the year ended June 30, 2019 which was 9.66% of annual covered payroll.

CITY OF CRANSTON, RHODE ISLAND NOTES TO FINANCIAL STATEMENTS JUNE 30, 2019
70
Net Pension Liability (Asset)
The total pension liability was determined by actuarial valuations performed as of June 30, 2017 and rolled forward to June 30, 2018, using the following actuarial assumptions, applied to all periods included in the measurement.
Actuarial Cost Method
Amortization Method Level Percent of Payroll-ClosedRemaining Amortization:General & Police Employees 20 YearsFire Employees 24 YearsAsset Valuation Method 5-Year Smooth MarketInvestment Rate of Return 7.5%
Projected Salary Increases:General Employees 3.5%-7.5%Police & Fire Employees 4%-14%Inflation 2.75%
Mortality
Entry Age Normal-the Individual Entry Age Actuarial Cost methodology is used.
Male employees, MERS General and MERS P&F: 115% of RP-2000 Combined Healthy for Males with White Collar adjustments, projected with Scale AA from 2000.
Female Employees, MERS General and MERS P&F: 95% of RP-2000 Combined Healthy for Females with White Collar adjustments, projected with Scale AA from 2000.
The actuarial assumptions used in the June 30, 2017 valuation rolled forward to June 30, 2018 and the calculation of the total pension liability at June 30, 2018 were consistent with the results of an actuarial experience study performed as of June 30, 2016.

CITY OF CRANSTON, RHODE ISLAND NOTES TO FINANCIAL STATEMENTS JUNE 30, 2019
71
The long-term expected rate of return best-estimate on pension plan investments was determined by the actuary using a building-block method. The actuary started by calculating best-estimate future expected real rates of return (expected returns net of pension plan investment expense and inflation) for each major asset class, based on a collective summary of capital market expectations from 35 sources. The June 30, 2018 expected arithmetic returns over the long-term (20 years) by asset class are summarized in the following table:
Type of Investment Target Allocation
Long-Term Expected Real Rate of Return
GrowthGlobal Equity
US Equity 20.80% 6.43%International Developed Equity 14.40% 6.72%Emerging Markets Equity 4.80% 8.90%
Sub-total 40.00%Private EquityPrivate Energy 11.30% 9.08%Non-Core RE 2.20% 5.03%OPP Private Credit 1.50% 9.08%
Sub-total 15.00%Income
High Yield Infrastructure 1.00% 3.81%REITS 1.00% 5.03%Liquid Credit 2.80% 3.81%Private Credit 3.20% 3.81%
Sub-total 8.00%StabilityCrisis Protection Class
Treasury Duration 4.00% 0.61%Systematic Trend 4.00% 4.00%
Sub-total 8.00%Inflation Protection
Core Real Estate 3.60% 5.03%Private Infrastructure 2.40% 5.61%TIPs 1.00% 1.75%Natural Resources 1.00% 3.81%
Sub-total 8.00%Volatility Protection
IG Fixed Income 11.50% 2.14%Absolute Return 6.50% 4.00%Cash 3.00% 0.61%
Sub-total 21.00%100%

CITY OF CRANSTON, RHODE ISLAND NOTES TO FINANCIAL STATEMENTS JUNE 30, 2019
72
These return assumptions are then weighted by the target asset allocation percentage, factoring in correlation effects, to develop the overall medium-term expected rate of return best-estimate on an arithmetic basis.
Discount Rate The discount rate used to measure the total pension liability of the plans was 7.0 percent. The projection of cash flows used to determine the discount rate assumed that contributions from plan members will be made at the current contribution rate and that contributions from the employers will be made at statutorily required rates, actuarially determined. Based on those assumptions, the pension plan’s fiduciary net position was projected to be available to make all projected future benefit payments of current plan members. Therefore, the long-term expected rate of return on pension plan investments was applied to all periods of projected benefit payments to determine the total pension liability.
Changes in the Net Pension Liability (Asset)
Total Pension Liability
Plan Fiduciary Net Position
Net Pension Liability (Asset)
Balances as of June 30, 2017 152,978,001$ 135,607,447$ 17,370,554$ Changes for the year:
Service cost 2,449,869 2,449,869 Interest on the total pension liability 10,473,985 10,473,985 Differences between expected and actual experience (494,724) (494,724) Changes in assumptions - Employer contributions 2,161,301 (2,161,301) Employee contributions 812,598 (812,598) Net investment income 10,452,584 (10,452,584) Benefit payments, including employee refunds (9,149,144) (9,149,144) - Administrative expense (139,150) 139,150 Other changes (57,545) 57,545
Net changes 3,279,986 4,080,644 (800,658)
Balances as of June 30, 2018 156,257,987$ 139,688,091$ 16,569,896$
Municipal Employee's Retirement System - General Employees
Increase (Decrease)

CITY OF CRANSTON, RHODE ISLAND NOTES TO FINANCIAL STATEMENTS JUNE 30, 2019
73
Total Pension Liability
Plan Fiduciary Net Position
Net Pension Liability (Asset)
Balances as of June 30, 2017 49,431,890$ 38,569,650$ 10,862,240$ Changes for the year:
Service cost 2,148,101 2,148,101 Interest on the total pension liability 3,498,259 3,498,259 Differences between expected and actual experience (648,949) (648,949) Changes in assumptions - Employer contributions 1,199,854 (1,199,854) Employee contributions 1,057,127 (1,057,127) Net investment income 3,212,740 (3,212,740) Benefit payments, including employee refunds (1,061,625) (1,061,625) - Administrative expense (42,770) 42,770 Other changes 2 (2)
Net changes 3,935,786 4,365,328 (429,542)
Balances as of June 30, 2018 53,367,676$ 42,934,978$ 10,432,698$
Municipal Employee's Retirement System - PoliceIncrease (Decrease)
Total Pension Liability
Plan Fiduciary Net Position
Net Pension Liability (Asset)
Balances as of June 30, 2017 62,747,004$ 64,140,159$ (1,393,155)$ Changes for the year:
Service cost 2,942,326 2,942,326 Interest on the total pension liability 4,470,059 4,470,059 Differences between expected and actual experience 181,502 181,502 Changes in assumptions - Employer contributions 792,107 (792,107) Employee contributions 1,406,154 (1,406,154) Net investment income 5,312,666 (5,312,666) Benefit payments, including employee refunds (720,365) (720,365) - Administrative expense (70,725) 70,725 Other changes 138,343 (138,343)
Net changes 6,873,522 6,858,180 15,342
Balances as of June 30, 2018 69,620,526$ 70,998,339$ (1,377,813)$
Municipal Employee's Retirement System - FireIncrease (Decrease)

CITY OF CRANSTON, RHODE ISLAND NOTES TO FINANCIAL STATEMENTS JUNE 30, 2019
74
Sensitivity of the Net Pension Liability to Changes in the Discount Rate The following presents the net pension liability (asset) of the employers calculated using the discount rate of 7.0 percent, as well as what the employers’ net pension liability (asset) would be if it were calculated using a discount rate that is 1 percentage point lower or 1 percentage point higher than the current rate.
1% Decrease (6.0%)Current Discount
Rate (7.0%) 1% Increase (8.0%)
General Employe 34,781,029$ 16,569,896$ 3,007,728$ Police 16,415,108 10,432,698 5,979,494 Fire 6,348,578 (1,377,813) (7,128,435)
Pension Plan Fiduciary Net Position Detailed information about the pension plan’s fiduciary net position is available in the separately issued ERSRI financial report.
Pension Expense and Deferred Outflows of Resources and Deferred Inflows of Resources Related to Pensions
For the year ended June 30, 2018 the employer recognized pension expense of $7,676,556. The employer reported deferred outflows and inflows of resources related to pensions from the following sources:
Municipal Police Fire TotalDeferred outflow of resources:
Difference in experience 229,976$ 2,825,333$ 161,746$ 3,217,055$ Difference in assumptions 3,679,919 2,109,585 2,403,834 8,193,338 Excess (deficit) investment returns 1,259,854 15,569 17,025 1,292,448 Contributions subsequent to the measurement date 2,365,565 1,439,364 819,835 4,624,764
Total deferred outflow of resources 7,535,314$ 6,389,851$ 3,402,440$ 17,327,605$
Municipal Police Fire TotalDeferred inflow of resources:
Difference in experience (742,188)$ (632,253)$ (2,522,270)$ (3,896,711)$ Difference in assumptions (352,207) (359,195) (711,402)
Total deferredinflow of resources (742,188)$ (984,460)$ (2,881,465)$ (4,608,113)$
Amounts reported as deferred outflows and inflows of resources related to pensions will be recognized in pension expense as follows:
Year Ending June 30 Municipal Police Fire Total
2020 3,582,827$ 848,000$ 593,092$ 5,023,919$ 2021 2,452,551 530,106 66,962 3,049,619 2022 (1,371,200) 30,526 (759,242) (2,099,916) 2023 (236,617) 338,349 (243,743) (142,011) 2024 432,853 (89,989) 342,864
Thereafter 1,786,193 134,060 1,920,253
Total 4,427,561$ 3,966,027$ (298,860)$ 8,094,728$

CITY OF CRANSTON, RHODE ISLAND NOTES TO FINANCIAL STATEMENTS JUNE 30, 2019
75
General Employee (Non-Certified) Defined Contribution Plan
Certain employees participating in the defined benefit plan, as described above, may also participate in a defined contribution plan authorized by General Law Chapter 36-10.3. The defined contribution plan is established under IRS section 401(a) and is administered by TIAA-CREF. Employees may choose among various investment options available to plan participants. Employees with less than 20 years of service contribute 5% of their annual covered salary. Employers contribute 1.25% for employees with at least 10 years of service but less than 15 years of service as of June 30, 2012 of annual covered salary. Employers contribute 1.50% for employees with at least 15 years of service but less than 20 years of service as of June 30, 2012 of annual covered salary. Employee contributions are immediately vested while employer contributions and any investment earnings thereon are vested after three years of contributory service. Benefit terms and contributions required under the plan by both the employee and employer are established by the General Laws, which are subject to amendment by the General Assembly.
Amounts in the defined contribution plan are available to participants in accordance with Internal Revenue Service guidelines for such plans.
The City of Cranston recognized pension expense of $6,254,968 for the fiscal year ended June 30, 2019.
The System issues a publicly available financial report that includes financial statements and required supplementary information for plans administered by the system. The report may be obtained at http://www.ersri.org.
Employees’ Retirement System of the State of Rhode Island (ERS)
Plan Description Certain employees of the Cranston School District participate in a cost-sharing multiple-employer defined benefit pension plan - the Employees’ Retirement System plan - administered by the Employees’ Retirement System of the State of Rhode Island (System). Under a cost-sharing plan, pension obligations for employees of all employers are pooled and plan assets are available to pay the benefits of the employees of any participating employer providing pension benefits through the plan, regardless of the status of the employers’ payment of its pension obligation to the plan. The plan provides retirement and disability benefits and death benefits to plan members and beneficiaries.
The System issues a publicly available financial report that includes financial statements and required supplementary information for the plans. The report may be obtained at http://www.ersri.org.
Benefit Provisions The level of benefits provided to participants is established by Chapter 36-10 of the General Laws, which is subject to amendment by the General Assembly. Member benefit provisions vary based on service credits accumulated at dates specified in various amendments to the General Laws outlining minimum retirement age, benefit accrual rates and maximum benefit provisions. In general, members accumulate service credits for each year of service subject to maximum benefit accruals of 80% or 75%. For those hired after June 30, 2012, the benefit accrual rate is 1% per year with a maximum benefit accrual of 40%. Members eligible to retire at September 30, 2009 may retire with 10 years of service at age 60 or after 28 years of service at any age. The retirement eligibility age increases proportionately for other members reflecting years of service and other factors until it aligns with the Social Security Normal Retirement Age, which applies to any member with less than 5 years of service as of July 1, 2012. Members are vested after 5 years of service.

CITY OF CRANSTON, RHODE ISLAND NOTES TO FINANCIAL STATEMENTS JUNE 30, 2019
76
The plan provides for survivor’s benefits for service connected death and certain lump sum death benefits. Joint and survivor benefit provision options are available to members.
Cost of living adjustments are provided but are currently suspended until the collective plans administered by ERSRI reach a funded status of 80%. Until the plans reach an 80% funded status, interim cost of living adjustments are provided at four-year intervals commencing with the plan year ending June 30, 2016.
The plan also provides nonservice-connected disability benefits after five years of service and service-connected disability benefits with no minimum service requirement.
Contributions
The funding policy, as set forth in the General Laws, Section 16-16-22, provides for actuarially determined periodic contributions to the plan. For fiscal 2017, Cranston School District teachers were required to contribute 3.75% of their annual covered salary, except for teachers with twenty or more years as of June 30, 2012 must contribute 11% of their annual covered salary. The State and the Cranston School District are required to contribute at an actuarially determined rate, 40% of which is to be paid by the State and the remaining 60% is to be paid by Cranston School Department; the rates were 9.89% and 13.24% of annual covered payroll for the fiscal year ended June 30, 2019 for the State and Cranston School Department, respectively. The School Department contributed $10,119,695, $10,852,160, and $10,742,600 for the fiscal years ended June 30, 2018, 2017, and 2016, respectively, equal to 100% of the required contributions for each year.
Pension Liabilities, Pension Expense, and Deferred Outflows of Resources and Deferred Inflows of Resources
The Cranston School District reported a liability of $143,161,570 for its proportionate share of the net pension liability that reflected a reduction for contributions made by the state. The amount recognized by the Cranston School District as its proportionate share of the net pension liability, the related state support and the total portion of the net pension liability that was associated with the Cranston School District were as follows:
Cranston School District proportionate share of net pension liability: 143,161,570$ State's proportionate share of the net pension liability associated with the Cranston District: 106,788,248
Total net pension liability 249,949,818$
The net pension liability was measured as of June 30, 2018, the measurement date, and the total pension liability used to calculate the net pension liability was determined by an actuarial valuation as of June 30, 2017 rolled forward to June 30, 2018. The Cranston School District proportion of the net pension liability was based on a projection of the Cranston School District’s long-term share of contributions to the pension plan relative to the projected contributions of all participating employers and the state, actuarially determined. At June 30, 2018 the Cranston School District’s proportion was 4.50583532%.

CITY OF CRANSTON, RHODE ISLAND NOTES TO FINANCIAL STATEMENTS JUNE 30, 2019
77
For the year ended June 30, 2019, the Cranston School District recognized gross pension expense of $23,249,829 and revenue of $10,505,395 for support provided by the State. At June 30, 2019 the Cranston School District reported deferred outflows of resources and deferred inflows of resources related to pensions from the following sources:
Deferred outflows of resourcesContributions subsequent to the measurement date: 11,610,646$
Difference between expected and actual experience 2,093,958$ Changes of assumptions 10,399,039 Net difference between projected and actual earnings on pension plan investments: 1,710,006 Changes in proportion and differences between employer contributions and proportionate share of contributions 1,982,349
16,185,352$
Deferred inflows of resourcesDifference between expected and actual experience: 2,730,539$ Changes of assumptions 1,684,712 Changes in proportion and differences between employer contributions and proportionate share of contributions: 2,254,551
Total 6,669,802$
$11,610,646 reported as deferred outflows of resources related to pensions resulting from the Cranston School District contributions in fiscal year 2019 subsequent to the measurement date will be recognized as a reduction of the net pension liability for the year ended June 30, 2019. Other amounts reported as deferred outflows of resources and deferred inflows of resources related to pensions will be recognized in pension expense as follows:
Year Ending June 30
2020 3,856,477$ 2021 2,109,134 2022 (383,524) 2023 1,470,817 2024 1,754,941
Thereafter 707,705
Total 9,515,550$

CITY OF CRANSTON, RHODE ISLAND NOTES TO FINANCIAL STATEMENTS JUNE 30, 2019
78
Actuarial Assumptions The total pension liability was determined using the following actuarial assumptions, applied to all periods included in the measurement:
Inflation 2.50%Salary increases 3.00% to 13.50%Investment rate of return 7.00%
Mortality Variants of the RP-2014 mortality tables - for the improvement scale, update to the ultimate rates of the MP-2016 projection scale. The actuarial assumptions used in the June 30, 2017 valuation rolled forward to June 30, 2018 and the calculation of the total pension liability at June 30, 2018 were consistent with the results of an actuarial experience study performed as of June 30, 2016.
The long-term expected rate of return best-estimate on pension plan investments was determined by the actuary using a building-block method. The actuary started by calculating best-estimate future expected real rates of return (expected returns net of pension plan investment expense and inflation) for each major asset class, based on a collective summary of capital market expectations from 35 sources. The June 30, 2018 expected arithmetic returns over the long-term (20 years) by asset class are summarized in the following table:
Type of Investment Target Allocation
Long-Term Expected Real Rate of Return
GrowthGlobal Equity
US Equity 20.80% 6.43%International Developed Equity 14.40% 6.72%Emerging Markets Equity 4.80% 8.90%
Sub-total 40.00%Private EquityPrivate Energy 11.30% 9.08%Non-Core RE 2.20% 5.03%OPP Private Credit 1.50% 9.08%
Sub-total 15.00%Income
High Yield Infrastructure 1.00% 3.81%REITS 1.00% 5.03%Liquid Credit 2.80% 3.81%Private Credit 3.20% 3.81%
Sub-total 8.00%StabilityCrisis Protection Class
Treasury Duration 4.00% 0.61%Systematic Trend 4.00% 4.00%
Sub-total 8.00%Inflation Protection
Core Real Estate 3.60% 5.03%Private Infrastructure 2.40% 5.61%TIPs 1.00% 1.75%Natural Resources 1.00% 3.81%
Sub-total 8.00%Volatility Protection
IG Fixed Income 11.50% 2.14%Absolute Return 6.50% 4.00%Cash 3.00% 0.61%
Sub-total 21.00%100%

CITY OF CRANSTON, RHODE ISLAND NOTES TO FINANCIAL STATEMENTS JUNE 30, 2019
79
These return assumptions are then weighted by the target asset allocation percentage, factoring in correlation effects, to develop the overall medium-term expected rate of return best-estimate on an arithmetic basis.
Discount Rate The discount rate used to measure the total pension liability was 7.0 percent. The projection of cash flows used to determine the discount rate assumed that contributions from plan members will be made at the current contribution rate and that contributions from the employers will be made at statutorily required rates, actuarially determined. Based on those assumptions, the pension plan’s fiduciary net position was projected to be available to make all projected future benefit payments of current plan members. Therefore, the long-term expected rate of return on pension plan investments was applied to all periods of projected benefit payments to determine the total pension liability.
Sensitivity of the Net Pension Liability (Asset) to Changes in the Discount Rate The following presents the net pension liability (asset) calculated using the discount rate of 7.0 percent as well as what the net pension liability (asset) would be if it were calculated using a discount rate that is 1-percentage-point lower or 1-percentage-point higher than the current rate.
1% Decrease (6.0%)Current Discount
Rate (7.0%)1% Increase
(8.0%)
180,121,775$ 143,161,570$ 115,632,755$
Pension Plan Fiduciary Net Position Detailed information about the pension plan’s fiduciary net position is available in the separately issued ERSRI financial report.
Defined Contribution Plan Description
Employees participating in the defined benefit plan with less than 20 years of service as of June 30, 2012, as described above, also participate in a defined contribution plan authorized by General Law Chapter 36-10.3. The defined contribution plan is established under IRS section 401(a) and is administered by TIAA-CREF. Employees may choose among various investment options available to plan participants. Employees contribute 5% of their annual covered salary and employers contribute between 1% and 1.5% of annual covered salary depending on the employee’s total years of service as of June 30, 2012. Employee contributions are immediately vested while employer contributions and any investment earnings thereon are vested after three years of contributory service. Benefit terms and contributions required under the plan by both the employee and employer are established by the General Laws, which are subject to amendment by the General Assembly.
Amounts in the defined contribution plan are available to participants in accordance with Internal Revenue Service guidelines for such plans.
The Cranston School District recognized pension expense of $12,744,434 for the fiscal year ended June 30, 2019.
The System issues a publicly available financial report that includes financial statements and required supplementary information for plans administered by the system. The report may be obtained at http://www.ersri.org.

CITY OF CRANSTON, RHODE ISLAND NOTES TO FINANCIAL STATEMENTS JUNE 30, 2019
80
Teacher’s Survivors Benefits of the State of Rhode Island (TSB)
Plan Description
Certain employees of the Cranston School Department participate in a cost-sharing multiple-employer defined benefit pension plan - the Teachers’ Survivors Benefit plan - administered by the Employees’ Retirement System of the State of Rhode Island (System). Under a cost-sharing plan, pension obligations for employees of all employers are pooled and plan assets are available to pay the benefits of the employees of any participating employer providing pension benefits through the plan, regardless of the status of the employers’ payment of its pension obligation to the plan. The plan provides a survivor benefit to public school teachers in lieu of Social Security since not all school districts participate in Social Security.
The System issues a publicly available financial report that includes financial statements and required supplementary information for the plans. The report may be obtained at http://www.ersri.org.
Eligibility and Plan Benefits
The plan provides a survivor benefit to public school teachers in lieu of Social Security since not all school districts participate in the plan. Specific eligibility criteria and the amount of the benefit is subject to the provisions of Chapter 16-16 of the Rhode Island General Laws which are subject to amendment by the General Assembly. Spouse, parents, family and children’s benefits are payable following the death of a member. A spouse shall be entitled to benefits upon attaining the age of sixty (60) years. Children’s benefits are payable to the child, including a stepchild or adopted child of a deceased member if the child is unmarried and under the age of eighteen (18) years or twenty-three (23) years and a full-time student, and was dependent upon the member at the time of the member’s death. Family benefits are provided if at the time of the member’s death the surviving spouse has in his or her care a child of the deceased member entitled to child benefits. Parents benefits are payable to the parent or parents of a deceased member if the member did not leave a widow or child who could ever qualify for monthly benefits on the member’s wages and the parent has reached the age of 60 years, has not remarried, and received support from the member.
In January, a yearly cost-of-living adjustment for spouse’s benefits is paid and based on the annual social security adjustment.
Survivors are eligible for benefits if the member has made contributions for at least six months prior to death or retirement.
The TSB plan provides benefits based on the highest salary at the time of retirement of the teacher. Benefits are payable in accordance with the following table:
Highest Annual Salary:Basic Monthly
Spouse's Benefit:
$17,000 or less 750$ $17,001 to $25,000 875$ $25,001 to $33,000 1,000$ $33,001 to $40,000 1,125$ $40,001 and over 1,250$

CITY OF CRANSTON, RHODE ISLAND NOTES TO FINANCIAL STATEMENTS JUNE 30, 2019
81
Benefits payable to children and families are equal to the spousal benefit multiplied by the percentage below:
Parent and One Child
Parent and Two or More Children One Child Alone
Two Children Alone
Three or More Children Alone
Dependent Parent
150% 175% 75% 150% 175% 100% Contributions
The contribution requirements of active employees and the participating school districts were established under Chapter 16-16 of the Rhode Island General Laws, which may be amended by the General Assembly. The cost of the benefits provided by the plan are two percent (2%) of the member’s annual salary up to but not exceeding an annual salary of $9,600; one-half (1/2) of the cost is contributed by the member by deductions from his or her salary, and the other half (1/2) is contributed and paid by the respective school district by which the member is employed. These contributions are in addition to the contributions required for regular pension benefits.
The Cranston School District contributed $122,309, $97,874 and $102,845 for the fiscal years ended June 30, 2019, 2018 and 2017, respectively, equal to 100% of the required contributions for each year.
Pension Liabilities, Pension Expense, and Deferred Outflows of Resources and Deferred Inflows of Resources
At June 30, 2019 the Cranston School District reported an asset of $14,668,001 for its proportionate share of the net pension asset related to its participation in TSB. The net pension asset was measured as of June 30, 2018, the measurement date, and the total pension liability used to calculate the net pension asset was determined by an actuarial valuation as of June 30, 2017 rolled forward to June 30, 2018. The Cranston School District proportion of the net pension asset was based on its share of contributions to the TSB for fiscal year 2018 relative to the total contributions of all participating employers for that fiscal year. At June 30, 2018 the Cranston School District proportion was 16.43854871%.

CITY OF CRANSTON, RHODE ISLAND NOTES TO FINANCIAL STATEMENTS JUNE 30, 2019
82
For the year ended June 30, 2019, the Cranston School District recognized pension expense of $(356,720). At June 30, 2019, the Cranston School District reported deferred outflows of resources and deferred inflows of resources related to pensions from the following sources:
Deferred outflows of resources: Contributions subsequent to the measurement date 123,899$
Difference between expected and actual experience 2,499,162$ Changes in assumptions 1,932,642 Changes in proportion and differences between
employer contributions and proportionate share ofcontributions 274,744
Net difference between projected and actual earningson pension plan investments 332,882
Total 5,039,430$
Deferred inflows of resources: Difference between expected and actual experience (2,461,402)$ Net difference between projected and actual earnings
on pension plan investments Changes in proportion and differences between
employer contributions and proportionate share ofcontributions (548,483)
Total (3,009,885)$
$122,291 reported as deferred outflows of resources related to pensions resulting from the Cranston School District contributions in fiscal year 2019 subsequent to the measurement date will be recognized as an addition to the net pension asset for the year ended June 30, 2019. Other amounts reported as deferred inflows of resources related to pensions will be recognized in pension expense as follows:
Year Ending June 30
2020 1,044,258$ 2021 556,760 2022 (160,422) 2023 236,840 2024 336,139
Thereafter 15,970
Total 2,029,545$
CITY OF CRANSTON, RHODE ISLAND NOTES TO FINANCIAL STATEMENTS JUNE 30, 2019
83
Actuarial Assumptions The total pension liability was determined using the following actuarial assumptions, applied to all periods included in the measurement:
Inflation 2.50%Salary increases 3.00% to 13.00%Investment rate of return 7.00%
Mortality - variants of the RP-2014 mortality tables - for the improvement scale, update to the ultimate rates of the MP-2016 projection scale. Cost of living adjustment - eligible survivors receive a yearly cost of living adjustment based on the annual social security adjustment - for valuation purposes, a 2.5% cost of living adjustment is assumed.
The actuarial assumptions used in the June 30, 2017 valuation and the calculation of the total pension liability at June 30, 2018 were consistent with the results of an actuarial experience study performed as of June 30, 2016.

CITY OF CRANSTON, RHODE ISLAND NOTES TO FINANCIAL STATEMENTS JUNE 30, 2019
84
The long-term expected rate of return best-estimate on pension plan investments was determined by the actuary using a building-block method. The actuary started by calculating best-estimate future expected real rates of return (expected returns net of pension plan investment expense and inflation) for each major asset class, based on a collective summary of capital market expectations from 34 sources. The June 30, 2018 expected arithmetic returns over the long-term (20 years) by asset class are summarized in the following table:
Type of Investment Target Allocation
Long-Term Expected Real Rate of Return
GrowthGlobal Equity
US Equity 20.80% 6.43%International Developed Equity 14.40% 6.72%Emerging Markets Equity 4.80% 8.90%
Sub-total 40.00%Private EquityPrivate Energy 11.30% 9.08%Non-Core RE 2.20% 5.03%OPP Private Credit 1.50% 9.08%
Sub-total 15.00%Income
High Yield Infrastructure 1.00% 3.81%REITS 1.00% 5.03%Liquid Credit 2.80% 3.81%Private Credit 3.20% 3.81%
Sub-total 8.00%StabilityCrisis Protection Class
Treasury Duration 4.00% 0.61%Systematic Trend 4.00% 4.00%
Sub-total 8.00%Inflation Protection
Core Real Estate 3.60% 5.03%Private Infrastructure 2.40% 5.61%TIPs 1.00% 1.75%Natural Resources 1.00% 3.81%
Sub-total 8.00%Volatility Protection
IG Fixed Income 11.50% 2.14%Absolute Return 6.50% 4.00%Cash 3.00% 0.61%
Sub-total 21.00%100%
These return assumptions are then weighted by the target asset allocation percentage, factoring in correlation effects, to develop the overall long-term expected rate of return best-estimate on an arithmetic basis.

CITY OF CRANSTON, RHODE ISLAND NOTES TO FINANCIAL STATEMENTS JUNE 30, 2019
85
Discount Rate The discount rate used to measure the total pension liability was 7.5%. The projection of cash flows used to determine the discount rate assumed that contributions from plan members will be made at the current contribution rate and that contributions from the employers will be made at statutorily required rates, actuarially determined. Based on those assumptions, the pension plan’s fiduciary net position was projected to be available to make all projected future benefit payments of current plan members. Therefore, the long-term expected rate of return on pension plan investments was applied to all periods of projected benefit payments to determine the total pension liability.
Sensitivity of the Net Pension Liability (Asset) to Changes in the Discount Rate The following presents the net pension liability (asset) calculated using the discount rate of 7.0% as well as what the net pension liability (asset) would be if it were calculated using a discount rate that is 1 percentage-point lower or 1 percentage-point higher than the current rate.
1% Decrease (6.0%)
Current Discount Rate
(7.0%)1% Increase
(8.0%)
(10,178,839)$ (14,668,001)$ (18,010,240)$ Pension Plan Fiduciary Net Position Detailed information about the pension plan’s fiduciary net position is available in the separately issued ERSRI financial report.
National (Industrial) Pension Plan
Plan Description
Upon the date of hire, most of the City’s public works' employees and all School Department bus drivers are eligible to participate in the National (Industrial) Pension Fund, a cost-sharing multiple-employer defined benefit plan. The plan also provides the following types of pensions which pay benefits to a retired participant during their lifetime and thereafter pay benefits to the participant’s surviving spouse or other beneficiary: husband-and-wife pension, survivor’s option pension, and 120 certain payments option pension. The Plan also provides for a widow/widower’s pension. Employees who retire at or after age 62 with at least 5 years of pension credit and have earned at least one of the years of pension credit during the period that their employer is contributing to the pension fund are eligible for benefits through the regular pension that is payable monthly for life. The retirement benefit is determined by the highest contribution rate at which the employee earned pension credit and the years of pension credits they have earned (up to a maximum of 30 years of pension credits). The Plan also provides death and disability benefits. Benefits are established by the Board of Trustees of the Pension Fund. Financial statements for the Plan can be obtained by contacting the Laborers’ National (Industrial) Pension Fund, 905 16th Street, N.W., Washington, DC, 20106.
Funding Policy
Covered employees are not required to contribute to the Plan. For Fiscal Year ended June 30, 2019, the City was required to contribute $1.87 per hour, and the School Department was required to contribute $.99 per hour for each hour worked by the employees to the Plan.
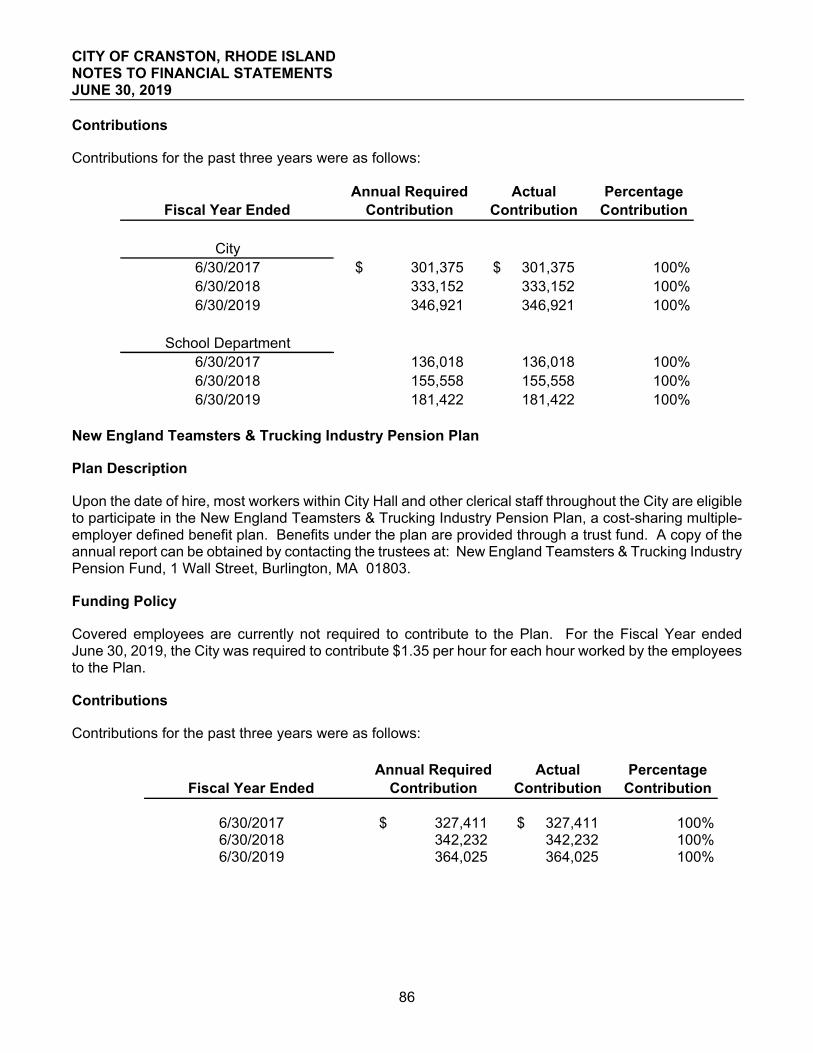
CITY OF CRANSTON, RHODE ISLAND NOTES TO FINANCIAL STATEMENTS JUNE 30, 2019
86
Contributions
Contributions for the past three years were as follows:
Fiscal Year EndedAnnual Required
ContributionActual
ContributionPercentage
Contribution
City6/30/2017 301,375$ 301,375$ 100%6/30/2018 333,152 333,152 100%6/30/2019 346,921 346,921 100%
School Department6/30/2017 136,018 136,018 100%6/30/2018 155,558 155,558 100%6/30/2019 181,422 181,422 100%
New England Teamsters & Trucking Industry Pension Plan
Plan Description
Upon the date of hire, most workers within City Hall and other clerical staff throughout the City are eligible to participate in the New England Teamsters & Trucking Industry Pension Plan, a cost-sharing multiple-employer defined benefit plan. Benefits under the plan are provided through a trust fund. A copy of the annual report can be obtained by contacting the trustees at: New England Teamsters & Trucking Industry Pension Fund, 1 Wall Street, Burlington, MA 01803.
Funding Policy
Covered employees are currently not required to contribute to the Plan. For the Fiscal Year ended June 30, 2019, the City was required to contribute $1.35 per hour for each hour worked by the employees to the Plan.
Contributions
Contributions for the past three years were as follows:
Fiscal Year EndedAnnual Required
ContributionActual
ContributionPercentage
Contribution
6/30/2017 327,411$ 327,411$ 100%6/30/2018 342,232 342,232 100%6/30/2019 364,025 364,025 100%

CITY OF CRANSTON, RHODE ISLAND NOTES TO FINANCIAL STATEMENTS JUNE 30, 2019
87
Other Post-Employment Benefits (OPEB) - Public Safety Employees
Plan Description
The City maintains and administers a single-employer OPEB benefit plan that covers all public safety employees. The plan provides health benefits and life insurance benefits to eligible retired police and fire employees and their beneficiaries. The plans provisions may be amended by the City and the Trustees of the plan. The trust is accounted for as an OPEB trust fund in the City’s financial statements. As of June 30, 2019, there are no separate financial statements available for the Public Safety Employees OPEB plan.
Summary of Significant Accounting Policies and Plan Asset Matters
Basis of Accounting
The OPEB trust fund financial statements are prepared on the accrual basis of accounting. Contributions are recognized when they are due, pursuant to formal commitments and contractual requirements. Investment income is recognized when earned. Expenses (benefits and administration) are recognized when they are due and payable in accordance with terms of the plan.
Valuation of Investments
Investments are valued at fair value. Securities traded on national exchanges are valued at the last reported sales price. There are no investments of 5% or greater in any one organization.
Classes of Employees Covered
As of June 30, 2019 (date of the last actuarial valuation) membership data was as follows:
Active employees 358Retirees 320
Total Plan Members 678
Funding Policy
The City established an Irrevocable Trust Agreement (OPEB Trust) effective July 1, 2006 and has started to pre-fund OPEB liabilities. The City pays certain medical premiums for a retiree and certain dependents until they reach the age of 65 years unless they are not covered by Medicare benefits, in that case, coverage continues for life. If a firefighter dies before reaching normal retirement age, the City pays for the benefit of the firefighter's family, if any, the full cost of family medical coverage (as in effect at the time of the firefighter's death) until the firefighter's normal retirement date. In addition, Police retirees are entitled to a City paid life insurance benefit of $17,000 if they retired after July 1, 1982. Firemen retiring after July 1, 1981 are eligible for the $17,000 benefit. Fire retirees retired between July 1, 2002 and June 30, 2007 are entitled to a City paid life insurance benefit of $20,000 and if a fireman retires after July 1, 2007, a $25,000 life insurance benefit is payable. In addition to the above, firefighters who retire with an occupational injury or illness receive a City paid life insurance benefit of $50,000 if death occurs within 3 years of his/her retirement date.

CITY OF CRANSTON, RHODE ISLAND NOTES TO FINANCIAL STATEMENTS JUNE 30, 2019
88
Investments
Rate of Return For the year ended June 30, 2019, the annual money-weighted rate of return on plan investments, net of investment expense was 5.92%. The Money-weighted rate of return expresses investment performance, net of investment expense, adjusted for the changing amounts of actually invested.
The following was the City’s adopted asset allocation policy and best estimates of arithmetic real rates of return for each major asset class included in the target asset allocation as of June 30, 2019:
Asset Class Target Allocation
Large Cap Core Equities 15.0%Large Cap Value Equities 10.0%Large Cap Growth Equities 10.0%Small/Mid Value Equities 5.0%Small/Mid Growth Equities 5.0%Non-U.S. Equities 15.0%Real Estate Investment Trusts 5.0%Fixed Income 35.0%
100.0%
The long-term expected rate of return on OPEB plan investments was determined using the building-block method in which best-estimate ranges of expected future real rates of return (expected returns, net of investment expense) are developed for each major asset class. These ranges are combined to produce the long-term expected rate of return by weighting the expected future real rates of return by the target asset allocation percentage. These rates do not include inflation assumption which is assumed to be 2%. Best estimates of arithmetic real rates of return for each major class included in the target asset allocation as of June 30, 2019 are summarized in the
Asset Class
Long-Term Expected Rate
of Return
U.S. REIT 7.5%International Stocks 7.0%U.S. Cash 3.0%U.S. Bonds 4.0%U.S. Large Cap 7.5%U.S. Mid Cap 8.0%U.S. Small Cap 8.5%Commodity 5.0%Alternatives 4.2%Emerging Markets 8.5%

CITY OF CRANSTON, RHODE ISLAND NOTES TO FINANCIAL STATEMENTS JUNE 30, 2019
89
Net OPEB Liability
The components of the net OPEB liability of the City of Cranston at June 30, 2019 were as follows:
Total OPEB Liability 43,774,273$ Plan fiduciary net position 8,622,937
City's Net OPEB Liability 35,151,336$
Plan fiduciary net position as percentage of total OPEB liability 19.70%
Actuarial Assumptions
The total OPEB liability was determined by an actuarial valuation as of June 30, 2019, using the following actuarial assumptions applied to all periods included in the measurement, unless otherwise specified:
Investment rate of return 7.1% of 2019, net of investment expense
Healthcare cost trend rates 5% for 2019 and years later Mortality rates for pre-retirement were based on the RP-2000 Blue Collar mortality table with Scale AA improvement to 2026. Post retirement mortality is represented by the RP-2000 White Collar Mortality Table, adjusted 115% for males, 95% for females, with Scale AA improvements on the generational basis. Mortality for disabled members is represented by the RP-2000 Blue Collar Mortality Table with Scale AA adjustment to 2026 and set forward of 3 years.
The actuarial assumptions used in the June 30, 2019 valuation were based on the results of an actual experience study for the period July 1, 2018 - June 30, 2019.
Discount Rate
The discount rate used to measure the total OPEB liability was 7.90 percent. The projection of cash flows used to determine the discount rate assumed that City contributions will be made at rates equal to the actuarially determined contribution rates. Based on those assumptions, the OPEB plan’s fiduciary net position was projected to be available to make all projected future benefit payments of current plan members. Therefore, the long-term expected rate of return on OPEB plan investments was applied to all periods of projected benefit payments to determine the total OPEB liability.
Sensitivity of Net OPEB Liability to Changes in the Discount Rate
The following presents the net OPEB liability of the City, as well as what the City’s net OPEB liability would be if it were calculated using a discount rate that is 1 percentage-point lower or 1 percentage-point higher than the current discount rate:
1% Decrease (6.9%)
Current Discount Rate
(7.9%)1% Increase
(8.9%)
Net OPEB Liability 38,259,285$ 35,151,336$ 32,369,389$

CITY OF CRANSTON, RHODE ISLAND NOTES TO FINANCIAL STATEMENTS JUNE 30, 2019
90
Sensitivity of the net OPEB liability to changes in the healthcare cost trend rates. The following presents the net OPEB liability of the City, as well as the City’s net OPEB liability would be if it were calculated using healthcare cost trend rates that are 1 percentage-point lower or 1 percentage point higher than the current healthcare cost trend rates:
1% Decrease (4.0%)
Current Discount Rate
(5.0%)1% Increase
(6.0%)
Net OPEB Liability 32,190,333$ 35,151,336$ 38,511,937$
Changes in the Net OPEB Liability
Total OPEB Plan Fiduciary Net OPEBLiability Net Position Liability
(a) (b) (a)-(b)
Balances as of June 30, 2018 $ 48,998,289 $ 7,801,259 $ 41,197,030
Changes for the year:Service cost 954,238 954,238 Interest on total OPEB liability 3,776,605 3,776,605 Experience (gain) and loss (5,576,847) (5,576,847) Contributions 4,812,502 (4,812,502) Net investment income (loss) 410,584 (410,584) Benefit payments (4,378,012) (4,378,012) - Administrative expenses (23,396) 23,396
Net changes (5,224,016) 821,678 (6,045,694)
Balances as of June 30, 2019 $ 43,774,273 $ 8,622,937 $ 35,151,336
Increase (Decrease)
OPEB Expense and Deferred Outflows of Resources and Deferred Inflows of Resources Related to OPEB
For the year ended June 30, 2019, the City recognized OPEB expense of $2,476,675. At June 30, 2019, the City reported deferred outflows of resources and deferred inflows of resources related to OPEB from the following sources:
Deferred DeferredOutflows Inflows
Of Resources Of Resources
Differences between expected and actual experience $ $ (5,496,184) Net difference between projected and actual earning on OPEB plan investments 413,045
Total $ 413,045 $ (5,496,184)

CITY OF CRANSTON, RHODE ISLAND NOTES TO FINANCIAL STATEMENTS JUNE 30, 2019
91
Amounts reported as deferred outflows of resources and deferred inflows of resources related to OPEB will be recognized in OPEB expense as follows:
Year Ending June 30
2020 $ (1,259,554) 2021 (1,259,552) 2022 (986,727) 2023 (944,474) 2024 (632,832)
$ (5,083,139)
Other Post-Employment Benefits (OPEB) - School Department Employees
Plan Description
The City maintains and administers a single-employer OPEB benefit plan that covers all School Department employees. The plan provides health benefits and dental insurance benefits to eligible retired employees and their beneficiaries. The plans provisions may be amended by the Cranston School Committee and the Trustees of the plan. The OPEB activity is accounted for in the School Unrestricted Fund in the City’s financial statements. As of June 30, 2019, there are no separate, audited GAAP-basis financial statements available for the Board of Education Employees OPEB plan.
Summary of Significant Accounting Policies and Plan Asset Matters
Basis of Accounting
The OPEB activity is accounted for on the accrual basis of accounting. Contributions are recognized when they are due, pursuant to formal commitments and contractual requirements. Investment income is recognized when earned. Expenses (benefits and administration) are recognized when they are due and payable in accordance with terms of the plan. Administrative costs are generally financed through the School Unrestricted Fund.
Valuation of Investment
Investments are valued at fair value. Securities traded on national exchanges are valued at the last reported sales price. There are no investments of 5% or greater in any one organization.
Classes of Employees Covered
As of July 1, 2017 (date of the last actuarial valuation) membership data was as follows:
Active employees 1,076 Inactive employeesRetirees 106
Total Plan Members 1,182

CITY OF CRANSTON, RHODE ISLAND NOTES TO FINANCIAL STATEMENTS JUNE 30, 2019
92
Funding Policy
The City established an Irrevocable Trust Agreement effective July 1, 2015 and has started to pre-fund OPEB liabilities. The amounts due for these benefits are funded on a pay-as-you-go basis. The School Department pays 100% of the cost of individual health care insurance and dental insurance benefits for all retired eligible employees retiring before September 1, 2005 until the employee reaches the age of 65. Cost shares have been negotiated for teachers (5% of plan cost) for the retirement period September 1, 2005 and August 31, 2009. Teachers retiring between September 1, 2009 and August 31, 2011 are responsible for a 15% cost share of their benefits. Teachers retiring on or after September 1, 2011 are responsible for a 20% cost share of their benefits.
Administrators retiring prior to July 2005 have no cost share. Administrators retiring between July 1, 2005 and June 30, 2008 are responsible for a 10% cost share of their benefits. Administrators retiring between July 1, 2008 and June 30, 2010 are responsible for a 20% cost share of their benefits. Administrators retiring between July 1, 2010 and June 30, 2011 are responsible for a 22% cost share of benefits. Administrators retiring on or after July 1, 2010 are responsible for a 25% cost share of their benefits. No benefits are paid for employees retiring prior to 1988.
The School Department funds post-retirement benefits on a pay-as-you-go basis. Expenditures for the benefits described above for the year ended June 30, 2019 were $662,755.
Investments
Rate of Return
For the year ended June 30, 2019, the annual money-weighted rate of return on plan investments, net of investment expense was 7.14%. The Money-weighted rate of return expresses investment performance, net of investment expense, adjusted for the changing amounts of actually invested.
The following was the City’s adopted asset allocation policy and best estimates of arithmetic real rates of return for each major asset class included in the target asset allocation as of June 30, 2019:
Asset Class Target Allocation
Equity 53%Fixed income 39%Real Estate Investment Trusts 8%
100%

CITY OF CRANSTON, RHODE ISLAND NOTES TO FINANCIAL STATEMENTS JUNE 30, 2019
93
The long-term expected rate of return on OPEB plan investments was determined using building-block method in which best-estimate ranges of expected future real rates of return (expected returns, net of investment expense and inflation) are developed for each major asset class. These ranges are combined to produce the long-term expected rate of return by weighting the expected future real rates of return by the target asset allocation percentage and by adding expected inflation. Best estimates of arithmetic real rates of return for each major class included in the target asset allocation as of June 30, 2019 are summarized in the following table:
Asset Class
Long Term Expected Rate
of ReturnU.S. Equities 7.8%Non-U.S. Equities (Unhedged) 8.2%Global Equities 8.1%U.S. Bonds 3.5%Non-U.S. Bonds (Hedged) 3.0%Global Bonds (Hedged) 3.3%U.S. High Yield Bonds 5.9%Long-Term Credit Bonds 3.9%Long-Term Government/Credit Index 3.6%Intermediate-Term Credit Bonds 4.1%Short-Term Credit Bonds 3.8%Long -Term Treasuries 3.0%Intermediate-Term Treasuries 2.9%Short-Term Treasuries 3.0%Extended Duration 2.4%Treasury 10-Year 2.8%TIPS-Intermediate-Term 2.6%TIPS-Short-Term 2.6%Real Estate Investment Trusts 6.6%Commodities 5.8%Market neutral 4.3%Cash 2.9%Inflation 1.9%
Net OPEB Liability
The following table shows the School Department’s annual OPEB liability as of June 30, 2019.
Total OPEB Liability 13,932,292$ Plan fiduciary net position 646,720
School Department's Net OPEB Liability 13,285,572$
Plan fiduciary net position as a percentage of total OPEB liability 5%

CITY OF CRANSTON, RHODE ISLAND NOTES TO FINANCIAL STATEMENTS JUNE 30, 2019
94
Actuarial Assumptions
The total OPEB liability was determined by an actuarial valuation as of June 30, 2019, using the following actuarial assumptions applied to all periods included in the measurement, unless otherwise specified:
Investment rate of return 7.14% of 2019, net of investment expenseHealthcare cost trend rates 5% for 2019
Mortality rates for pre-retirement and beneficiary mortality is represented by the RP-2014 White Collar Mortality with Scale MP-2016, fully generational. Mortality for disabled members were represented by the RP-2014 Disabled Mortality with Scale MP-2016, full generational.
The actuarial assumptions used in the June 30, 2019 valuation were based on the results of an actual experience study for the period July 1, 2017 - June 30, 2018.
Discount Rate
The discount rate used to measure the total OPEB liability was 3.80 percent. The projection of cash flows used to determine the discount rate assumed that City contributions will be made at rates equal to the actuarially determined contribution rates. Based on those assumptions, the OPEB plan’s fiduciary net position was projected to be available to make all projected future benefit payments of current plan members. Therefore, the long-term expected rate of return on OPEB plan investments was applied to all periods of projected benefit payments to determine the total OPEB liability.
Sensitivity of Net OPEB Liability to Changes in the Discount Rate
The following presents the net OPEB liability of the City, as well as what the City’s net OPEB liability would be if it were calculated using a discount rate that is 1 percentage point lower or 1 percentage point higher than the current discount rate:
1% Decrease (2.8%)
Current Discount Rate
(3.8%)1% Increase
(4.8%)
Net OPEB Liability 14,348,346$ 13,285,572$ 12,256,272$
Sensitivity of the net OPEB liability to changes in the healthcare cost trend rates. The following presents the net OPEB liability of the City, as well as the City’s net OPEB liability would be if it were calculated using healthcare cost trend rates that are 1 percentage-point lower or 1 percentage point higher than the current healthcare cost trend rates:
1% Decrease (4.0%)
Current Trend (5.0%)
1% Increase (6.0%)
Net OPEB Liability 11,588,531$ 13,285,572$ 15,299,742$

CITY OF CRANSTON, RHODE ISLAND NOTES TO FINANCIAL STATEMENTS JUNE 30, 2019
95
Net OPEB Liability
The Board of Education’s annual OPEB cost (expense) is calculated based on the annual required contribution of the employer and employees who elect dependent coverage (ARC), an amount actuarially determined in accordance with the parameters of GASB Statement 45. The ARC represents a level of funding that, if paid on an ongoing basis, is projected to cover normal cost each year and amortize any unfunded actuarial liabilities over a period not to exceed thirty years.
School Charter Total OPEB Plan Fiduciary Net OPEBLiability Liability Liability Net Position Liability
(a) (b) (a)+(b) (c) (a)+(b)-(c)
Balances as of June 30, 2018 $ 10,156,545 $ 139,369 $ 10,295,914 $ 605,073 $ 9,690,841
Changes for the year:Service cost 562,969 7,725 570,694 570,694 Interest on total OPEB liability 395,035 5,421 400,456 400,456 Experience (gain) and loss 3,282,934 45,049 3,327,983 3,327,983 Employer contributions - 449,828 (449,828) Net investment income (loss) - 43,177 (43,177) Benefit payments (653,784) (8,971) (662,755) (449,828) (212,927) Administrative expenses - (1,530) 1,530
Net changes 3,587,154 49,224 3,636,378 41,647 3,594,731
Balances as of June 30, 2019 $ 13,743,699 $ 188,593 $ 13,932,292 $ 646,720 $ 13,285,572
Increase (Decrease)
OPEB Expense and Deferred Outflows of Resources and Deferred Inflows of Resources Related to OPEB
For the year ended June 30, 2019, the City recognized OPEB expense of $48,891. At June 30, 2018, the City reported deferred outflows of resources and deferred inflows of resources related to OPEB from the following sources:
Deferred DeferredOutflows Inflows
Of Resources Of Resources
Differences between expected and actualexperience $ 3,081,179 $
Net difference between projected and actual earning on OPEB plan investments (51,184)
Total $ 3,081,179 $ (51,184)

CITY OF CRANSTON, RHODE ISLAND NOTES TO FINANCIAL STATEMENTS JUNE 30, 2019
96
Amounts reported as deferred outflows of resources and deferred inflows of resources related to OPEB will be recognized in OPEB expense as follows:
Year Ending June 30
2020 $ 380,643 2021 380,645 2022 390,360 2023 395,556 2024 399,597
Thereafter 1,083,194
$ 3,029,995
Actuarial valuations of an ongoing plan involve estimates of the value of reported amounts and assumptions about the probability of occurrence of events far into the future. Examples include assumptions about future employment, mortality, and the healthcare cost trend. Amounts determined regarding the funded status of the plan and the annual required contributions of the employer are subject to continual revision as actual results are compared with past expectations and new estimates are made about the future. The schedule of funding progress, presented as required supplementary information following the notes to basic financial statements, presents multiyear trend information about whether the actuarial value of plan assets is increasing or decreasing over time relative to the actuarial liabilities for benefits.

CITY OF CRANSTON, RHODE ISLAND NOTES TO FINANCIAL STATEMENTS JUNE 30, 2019
97
Combining Schedule of Fiduciary Net Position
City SchoolPension OPEB OPEB
Trust Trust TrustFund Fund Fund Total
Assets:Cash and cash equivalents $ 1,389,456 $ 1,321,349 $ $ 2,710,805
Investments:Guaranteed Investment Contracts 3,992,508 3,992,508 Real Estate Investment Trust 51,738 51,738 Common Stock 13,398,152 13,398,152 Pooled Equity Index Funds 342,761 342,761 Pooled Fixed Income Index Funds 252,221 252,221 International Equity Mutual Funds 1,740,209 1,740,209 U.S. Equity Mutual Funds 28,629,476 2,822,111 31,451,587 Fixed Income Mutual Funds 23,280,445 2,027,537 25,307,982
Total investments 69,300,581 6,589,857 646,720 76,537,158
Contribution receivable 758,897 758,897
Total assets 70,690,037 8,670,103 646,720 80,006,860
Liabilities:Accounts payable 300 47,166 47,466 Due to primary government 120,000 120,000
Total liabilities 120,300 47,166 - 167,466
Net Position Restricted for Pensions and OPEB Benefits and Other Purposes $ 70,569,737 $ 8,622,937 $ 646,720 $ 79,839,394

CITY OF CRANSTON, RHODE ISLAND NOTES TO FINANCIAL STATEMENTS JUNE 30, 2019
98
Combining Schedule of Changes in Fiduciary Net Position
City SchoolPension OPEB OPEB
Trust Trust Trust Fund Fund Fund Total
Additions:Contributions:
Employer contributions $ 21,569,803 $ 4,426,721 $ $ 25,996,524 Plan member contributions 201,448 385,781 477,896 1,065,125 Other 57,856 57,856
Total contributions 21,829,107 4,812,502 477,896 27,119,505
Investment Income: Interest and dividends 1,432,910 159,437 43,177 1,635,524 Net appreciation in the fair value of investments 2,668,893 251,147 2,920,040
Total investment income 4,101,803 410,584 43,177 4,555,564
Total additions 25,930,910 5,223,086 521,073 31,675,069
Deductions: Benefits 24,988,876 4,378,012 477,896 29,844,784 Administrative expenses 216,555 23,396 1,530 241,481
Total deductions 25,205,431 4,401,408 479,426 30,086,265
Change in Net Position 725,479 821,678 41,647 1,588,804
Net Position - July 1, 2018 69,844,258 7,801,259 605,073 78,250,590
Net Position - June 30, 2019 $ 70,569,737 $ 8,622,937 $ 646,720 $ 79,839,394 City of Cranston Defined Contribution Plan
Plan Description
The Plan name is “City of Cranston Defined Contribution Plan“ ID # is 05-6000110, Determination Letter Form 5300 is filed with IRS, and ING Specimen Adoption Agreement for 401(a) Defined Contribution Plan. Defined Contribution Plan for the Teamsters Bargaining Union and Laborers International Union of North America where the employee and the employer contribute 3% of earnings all stated in Form 5300 and the ING Plan Document. Plan based on approved enabling legislation presented in January 2010 and approved in that session. Total employer contributions made to the plan during June 30, 2019 were $90,759. Total employee contributions made to the plan during June 30, 2019 were $90,759.

CITY OF CRANSTON, RHODE ISLAND NOTES TO FINANCIAL STATEMENTS JUNE 30, 2019
99
School Department Defined Contribution Plan
Plan Description
The Plan name is “Cranston Public Schools 401(a) Retirement Plan”. ID # is 801343, effective July 1, 2012. Defined Contribution Plan for the Local Rhode Island 153 Bargaining Union where the employee and employer contribute 3% of earnings all stated in the Security Benefit Plan Document. Total employer contributions made to the plan during the fiscal year ending June 30, 2019 was $33,008. Total employee contributions made to the plan during the fiscal year ending June 30, 2019 was $33,008.
On-Behalf Payments
The amount recognized in the general fund intergovernmental revenues and education expenditures for contributions made by the State on behalf of the City’s teachers to the Employees’ Retirement System of the State of Rhode Island was $8,057,883.
E. Tax Abatements
The City of Cranston enters into tax abatement agreements with local businesses under its Economic Development Tax Incentive Program for Commercially Zoned Property. Under the Program, new businesses locating in commercially zoned property with the City of Cranston or existing businesses that are expanding may qualify for a tax incentive.
For the fiscal year ended June 30, 2019, the City of Cranston abated property taxes totaling $242,885 under this program, including the following tax abatement agreements to new businesses locating in a commercially zoned property or existing businesses that are expanding:
Percentage of taxesabated during the Amount of Taxes Abated
Fiscal Year during the Fiscal Year
Increase size and employment of manufacturing business 11% $ 31,849 Renovation of building for medical device company 5% 6,520 Renovation of Theater 8% 8,404 Warehouse Facility 5% 2,431 Masonry block and steel for yoga studio and wellness center 8% 2,748 Additional manufacturing facility for medical device company 13% 17,732 Renovation of restaurant 6% 1,140 Wholesale distribution facility for restaurant supplies company 46% 60,972 Global Supply Chain and Warehouse (Purchase of Building) 31% 59,103 Increase in employment of services business 69% 51,986
Purpose

CITY OF CRANSTON, RHODE ISLAND NOTES TO FINANCIAL STATEMENTS JUNE 30, 2019
100
F. Subsequent Events
In July 2019, the City of Cranston issued $13,410,000 in general obligation bonds. The proceeds will be used by the City to fund the following: repairs and construction of a fire station; Citywide drainage improvements; roads and sidewalk improvements; and playground and athletic fields repairs. The bonds will be payable over the next 15 years at interest rates between 4.0-5.0%.

Required Supplementary
Information

RSI-1CITY OF CRANSTON, RHODE ISLANDREQUIRED SUPPLEMENTARY INFORMATIONGENERAL FUNDSCHEDULE OF REVENUES, EXPENDITURES AND CHANGES IN FUND BALANCE-BUDGETARY BASISBUDGET AND ACTUALFOR THE YEAR ENDED JUNE 30, 2019
Original Final Favorable/Budget Budget Actual (Unfavorable)
Revenues:General property taxes $ 187,310,663 $ 187,310,663 $ 188,054,377 $ 743,714 Intergovernmental 20,907,218 20,907,218 19,489,696 (1,417,522) Charges for services:
Licenses and permits 3,251,287 3,251,287 3,535,771 284,484 Fines and forfeitures 1,705,000 1,705,000 1,776,431 71,431 Departmental 9,466,203 9,466,203 9,301,463 (164,740)
Investment income 400,000 400,000 756,522 356,522 Education 63,990,522 63,682,669 63,682,669 - Other 2,201,650 2,201,650 1,299,174 (902,476)
Total revenues 289,232,543 288,924,690 287,896,103 (1,028,587)
Expenditures: Current:
Executive 600,788 600,788 562,873 37,915 City Council 288,543 288,543 260,094 28,449 Law 501,125 501,125 1,187,790 (686,665) Personnel 210,947 210,947 168,498 42,449 City Clerk 1,516,542 1,516,542 1,581,810 (65,268) Probate Court 19,339 19,339 18,839 500 Municipal Court 319,023 319,023 379,183 (60,160) Board of Canvassers 411,543 411,543 405,700 5,843 City Planning 989,946 989,946 386,736 603,210 Economic Development 182,168 182,168 177,968 4,200 Inspections 1,022,641 1,022,641 963,275 59,366 Finance 4,748,349 4,748,349 4,705,787 42,562 Fire 30,951,363 30,951,363 33,368,381 (2,417,018) Rescue Fund 2,200,000 2,200,000 1,284,599 915,401 Police 24,947,126 24,947,126 24,659,286 287,840 Long-term debt 25,801,218 25,801,218 25,801,218 - Public works 16,093,916 16,093,916 15,673,496 420,420 Parks and recreation 2,702,508 2,702,508 2,893,308 (190,800) Public libraries 3,542,614 3,542,614 3,542,614 - Senior services 3,195,603 3,195,603 3,213,188 (17,585) Municipal Debt 10,899,438 10,899,438 10,752,326 147,112 Education 157,887,344 157,579,491 157,579,491 - Community Grants 169,500 169,500 194,125 (24,625) Boards and Commissions 25,189 25,189 20,469 4,720 Harbor Master 5,770 5,770 5,623 147
Total Expenditures 289,232,543 288,924,690 289,786,677 (861,987)
Excess (Deficiency) of Budgeted Revenues Over Expenditures - - (1,890,574) (1,890,574)
Net Change in Fund Balance $ - $ - (1,890,574) $ (1,890,574)
Fund Balance - July 1, 2018 20,139,664
Fund Balance - June 30, 2019 $ 18,249,090
101

RSI-2CITY OF CRANSTON, RHODE ISLANDREQUIRED SUPPLEMENTARY INFORMATIONSPECIAL REVENUE FUND - SCHOOL UNRESTRICTEDSCHEDULE OF REVENUES, EXPENDITURES AND CHANGES IN FUND BALANCE-BUDGETARY BASISBUDGET AND ACTUAL FOR THE YEAR ENDED JUNE 30, 2019
Original Final Favorable/Budget Budget Actual (Unfavorable)
Revenues: State aid $ 61,345,522 $ 61,037,669 $ 61,037,669 $ - Federal through State 1,350,000 1,350,000 1,416,687 66,687 Tuition 820,000 820,000 1,108,239 288,239 Miscellaneous 475,000 475,000 305,422 (169,578)
Total revenues 63,990,522 63,682,669 63,868,017 185,348
Expenditures: Salaries 97,642,865 97,062,160 98,290,756 (1,228,596) Employee benefits 38,323,436 37,572,578 36,124,420 1,448,158 Purchased services 17,371,400 16,907,911 17,247,176 (339,265) Supplies and materials 4,194,832 4,151,385 4,166,739 (15,354) Capital outlay 1,887,848 1,795,702 1,458,064 337,638 Other (902,392) 89,755 89,387 368
Total expenditures 158,517,989 157,579,491 157,376,542 202,949
Excess (Deficiency) of Revenues Over Expenditures (94,527,467) (93,896,822) (93,508,525) 388,297
Other Financing Sources: Transfers in City of Cranston 94,527,467 93,896,822 93,896,822 - Transfers from other funds 188,104 188,104
Total other financing sources 94,527,467 93,896,822 94,084,926 188,104
Net Change in Fund Balance $ - $ - 576,401 $ 576,401
Fund Balance - July 1, 2018 4,558,180
Fund Balance - June 30, 2019 $ 5,134,581
102

RSI-2aCITY OF CRANSTON, RHODE ISLANDNOTES TO REQUIRED SUPPLEMENTARY INFORMATIONFOR THE YEAR ENDED JUNE 30, 2019
Budget - GAAP Reconciliation
A reconciliation of revenues, expenditures, and fund balance between the accounting treatment required by GAAP (Exhibit IV), and budgetary requirements (RSI), is as follows:
Revenues Expenditures Fund Balance Revenues Expenditures Fund Balance
Balance, Budgetary Basis, June 30, 2019 $ 287,896,103 $ 289,786,677 $ 18,249,090 $ 63,868,017 $ 157,376,542 $ 5,134,581 Revenues/Expenditures accounted for on the budgetary basis associated with Education funds (63,682,669) (157,579,491) - - Encumbrances outstanding at June 30, 2019charged to budgetary expenditures - (210,698) 210,698 Encumbrances outstanding at June 30, 2018liquidated during the year June 30, 2019 - 691,814 (691,814)Expenditures in the school department capital reserve fund - not budgeted in general fund - 34,221 1,139,653 (1,105,432)Fund balance restricted for capital reserve and other purposes and removed from budgetary fund balance. - 731,185 Opening balances for funds that do not meet the GASB 54 definition for a special revenue fund Deficit reduction payment 819,900 - Current year activity for funds that do not meet the GASB 54 definition for a special revenue fund 971,309 1,100,395 (129,086) - State Teachers' Retirement on-behalf payment - 8,057,883 8,057,883 -
BALANCE, GAAP BASIS, JUNE 30, 2019 $ 225,184,743 $ 133,307,581 $ 18,939,904 $ 71,960,121 $ 167,055,194 $ 4,279,218
General Fund School Unrestricted Fund
103

RSI-3CITY OF CRANSTON, RHODE ISLAND SCHEDULE OF CHANGES IN THE CITY'S NET PENSION LIABILITY AND RELATED RATIOS (1 of 6)CRANSTON RETIREMENT SYSTEM - POLICE AND FIRE PENSION LAST SIX FISCAL YEARS*
2019 2018 2017 2016 2015 2014
A. Total pension liability Service cost $ 434,021 $ 517,492 $ 561,127 $ 550,317 $ 696,010 $ 802,841 Interest on the Total Pension Liability 22,902,534 23,006,008 23,599,906 23,368,984 22,826,090 22,844,850 Changes of benefit termsDifference between expected and actual experience of the Total Pension Liability 6,629,821 (98,273) (5,783,927) 1,233,114 (2,386,467) Changes of assumptions (1,790,318) (4,978,421) (8,277,796) Benefit payments, including refunds of employee contributions (24,988,877) (24,326,796) (23,804,824) (24,053,360) (24,067,694) (23,747,994)
Net change in total pension liability 4,977,499 (901,569) (7,218,036) (3,879,366) (11,209,857) (100,303) Total pension liability - beginning 301,728,442 302,630,011 309,848,047 313,727,413 324,937,270 325,037,573
Total pension liability - ending (a) $ 306,705,941 $ 301,728,442 $ 302,630,011 $ 309,848,047 $ 313,727,413 $ 324,937,270
B. Plan fiduciary net position Contributions - employer $ 21,569,803 $ 22,568,319 $ 21,403,849 $ 21,316,456 $ 21,994,344 $ 21,994,344 Contributions - employee 201,448 240,058 279,548 257,734 336,937 368,575 Net investment income (loss) 4,016,741 5,322,330 5,803,466 (2,072,781) 2,983,286 9,690,430 Benefit payments, including refunds of employee contributions (24,988,877) (24,326,796) (23,804,824) (24,053,360) (24,067,694) (23,747,994) Pension Plan Administrative Expense (73,636) (293,500) (65,569) (598,630) (451,177) (629,880) Other 1 429,963 381,765
Net change in plan fiduciary net position 725,479 3,510,411 3,616,471 (5,150,581) 1,225,659 8,057,240 Plan fiduciary net position - beginning 69,844,258 66,333,847 62,717,376 67,867,957 66,642,298 58,585,058 Plan fiduciary net position - ending (b) 70,569,737 69,844,258 66,333,847 62,717,376 67,867,957 66,642,298
C. Net pension liability - ending (a) - (b) $ 236,136,204 $ 231,884,184 $ 236,296,164 $ 247,130,671 $ 245,859,456 $ 258,294,972
D. Plan fiduciary net position as a percentage of the total pension liability 23.01% 23.15% 21.92% 20.24% 21.63% 20.51%
E. Covered payroll $ 2,043,982 $ 2,403,064 $ 2,697,374 $ 2,663,974 $ 2,940,734 $ 2,905,865
F. Net pension liability as a percentage of covered payroll 11552.75% 9649.52% 8760.23% 9276.77% 8360.48% 8888.75%
* Schedule is intended to show information for 10 years - additional years will be displayed as they become available.
104

RSI-3CITY OF CRANSTON, RHODE ISLANDSCHEDULE OF CHANGES IN THE CITY'S NET PENSION LIABILITY AND RELATED RATIOS (2 of 6)MUNICIPAL EMPLOYEES' RETIREMENT SYSTEM AGENT PLAN - GENERAL EMPLOYEESLAST FOUR FISCAL YEARS*
2018 2017 2016 2015 2014
A. Total pension liabilityService cost $ 2,449,869 $ 2,350,820 $ 2,362,034 $ 2,346,927 $ 2,376,369 Interest on the Total Pension Liability 10,473,985 10,359,681 10,231,218 9,977,843 9,687,460 Changes of benefit terms 2,581,501 Difference between expected and actual experience (494,724) 468,058 (1,706,718) Changes of assumptions 7,489,555 (2,865,321) 233,636 Benefit payments, including refunds of employee contributions (9,149,144) (9,287,558) (9,048,633) (8,291,699) (8,530,234)
Net change in total pension liability 3,279,986 11,380,556 1,837,901 3,749,251 3,767,231 Total pension liability - beginning 152,978,001 141,597,445 139,759,544 136,010,293 132,243,062
Total pension liability - ending (a) $ 156,257,987 $ 152,978,001 $ 141,597,445 $ 139,759,544 $ 136,010,293
B. Plan fiduciary net positionContributions - employer $ 2,161,301 $ 2,342,837 $ 2,403,173 $ 2,479,865 $ 2,276,531 Contributions - employee 812,598 836,339 847,508 488,592 478,002 Net investment income 10,452,584 14,401,043 30,596 3,119,891 18,017,830 Benefit payments, including refunds of employee contributions (9,149,144) (9,287,558) (9,048,633) (8,291,699) (8,530,234) Pension Plan Administrative Expense (139,150) (136,055) (193,515) (124,435) (112,827) Other (57,545) 254,209 28,596 176,372 7,388
Net change in plan fiduciary net position 4,080,644 8,410,815 (5,932,275) (2,151,414) 12,136,690 Plan fiduciary net position - beginning 135,607,447 127,196,632 133,128,907 135,280,321 123,143,631 Plan fiduciary net position - ending (b) 139,688,091 135,607,447 127,196,632 133,128,907 135,280,321
C. Net pension liability - ending (a) - (b) $ 16,569,896 $ 17,370,554 $ 14,400,813 $ 6,630,637 $ 729,972
D. Plan fiduciary net position as a percentage of the total pension liability 89.40% 88.65% 89.83% 95.26% 99.46%
E. Covered payroll $ 24,696,262 $ 24,260,270 $ 24,225,987 $ 24,170,205 $ 23,528,405
F. Net pension liability as a percentage of covered payroll 67.09% 71.60% 59.44% 27.43% 3.10%
* Schedule is intended to show information for 10 years - additional years will be displayed as they become available.
105

RSI-3CITY OF CRANSTON, RHODE ISLANDSCHEDULE OF CHANGES IN THE CITY'S NET PENSION LIABILITY (ASSET) AND RELATED RATIOS (3 of 6)MUNICIPAL EMPLOYEES' RETIREMENT SYSTEM AGENT PLAN - POLICE LAST FIVE FISCAL YEARS*
2018 2017 2016 2015 2014
A. Total pension liabilityService Cost $ 2,148,101 $ 2,014,684 $ 1,964,581 $ 1,375,751 $ 1,316,743 Interest on the Total Pension Liability 3,498,259 3,011,196 2,735,086 2,278,196 2,112,199 Changes of benefit terms 2,566,626 Difference between expected and actual experience of the Total Pension Liability (648,949) 3,152,114 (61,897) Changes of assumptions 2,582,739 386,791 (648,637) Benefit payments, including refunds of employee contributions (1,061,625) (941,558) (1,021,160) (598,672) (594,343)
Net change in total pension liability 3,935,786 9,819,175 3,616,610 6,008,692 2,185,962 Total pension liability - beginning 49,431,890 39,612,715 35,996,105 29,987,413 27,801,451
Total pension liability - ending (a) $ 53,367,676 $ 49,431,890 $ 39,612,715 $ 35,996,105 $ 29,987,413
B. Plan fiduciary net positionContributions - employer $ 1,199,854 $ 1,040,242 $ 1,109,071 $ 857,531 $ 687,959 Contributions - employee 1,057,127 1,099,252 1,087,172 641,751 619,646 Net investment income (loss) 3,212,740 4,095,964 (11,700) 763,454 4,119,654 Benefit payments, including refunds of employee contributions (1,061,625) (941,558) (1,021,160) (598,672) (594,343) Pension Plan Administrative Expense (42,770) (38,697) (31,476) (30,599) (25,797) Other 2 (394,850) (2) 13,001
Net change in plan fiduciary net position 4,365,328 4,860,353 1,131,905 1,646,466 4,807,119 Plan fiduciary net position - beginning 38,569,650 33,709,297 32,577,392 30,930,926 26,123,807 Plan fiduciary net position - ending (b) 42,934,978 38,569,650 33,709,297 32,577,392 30,930,926
C. Net pension liability (asset) - ending (a) - (b) $ 10,432,698 $ 10,862,240 $ 5,903,418 $ 3,418,713 $ (943,513)
D. Plan fiduciary net position as a percentage of the total pension liability 80.45% 78.03% 85.10% 90.50% 103.15%
E. Covered payroll $ 10,571,361 $ 10,872,555 $ 10,494,555 $ 8,021,870 $ 7,745,546
F. Net pension liability as a percentage of covered payroll 98.69% 99.91% 56.25% 42.62% -12.18%
* Schedule is intended to show information for 10 years - additional years will be displayed as they become available.
106

RSI-3CITY OF CRANSTON, RHODE ISLANDSCHEDULE OF CHANGES IN THE CITY'S NET PENSION ASSET AND RELATED RATIOS (4 of 6)MUNICIPAL EMPLOYEES' RETIREMENT SYSTEM AGENT PLAN - FIRELAST FIVE FISCAL YEARS*
2018 2017 2016 2015 2014
A. Total pension liabilityService Cost $ 2,942,326 $ 2,469,994 $ 2,326,126 $ 2,143,259 $ 2,109,017 Interest on the Total Pension Liability 4,470,059 4,169,635 3,925,426 3,436,541 3,126,099 Changes of benefit terms 1,629,797 Difference between expected and actual experience of the Total Pension Liability 181,502 (928,566) (2,398,843) (249,261) Changes of assumptions 3,052,432 (649,235) Benefit payments, including refunds of employee contributions (720,365) (753,251) (583,801) (482,813) (444,721)
Net change in total pension liability 6,873,522 8,010,244 3,268,908 6,477,523 4,141,160 Total pension liability - beginning 62,747,004 54,736,760 51,467,852 44,990,329 40,849,169
Total pension liability - ending (a) $ 69,620,526 $ 62,747,004 $ 54,736,760 $ 51,467,852 $ 44,990,329
B. Plan fiduciary net positionContributions - employer $ 792,107 $ 971,858 $ 991,610 $ 1,226,727 $ 1,006,080 Contributions - employee 1,406,154 1,300,194 1,189,766 943,698 933,528 Net investment income (loss) 5,312,666 6,811,465 (19,290) 1,266,662 6,811,997 Benefit payments, including refunds of employee contributions (720,365) (753,251) (583,801) (482,813) (444,721) Pension Plan Administrative Expense (70,725) (64,352) (51,895) (50,779) (42,657) Other 138,343 297,336 786 830 727
Net change in plan fiduciary net position 6,858,180 8,563,250 1,527,176 2,904,325 8,264,954 Plan fiduciary net position - beginning 64,140,159 55,576,909 54,049,733 51,145,398 42,880,444 Plan fiduciary net position - ending (b) 70,998,339 64,140,159 55,576,909 54,049,723 51,145,398
C. Net pension asset - ending (a) - (b) $ (1,377,813) $ (1,393,155) $ (840,149) $ (2,581,871) $ (6,155,069)
D. Plan fiduciary net position as a percentage of the total pension liability 101.98% 102.22% 101.53% 105.02% 113.68%
E. Covered payroll $ 14,044,515 $ 12,959,047 $ 12,165,930 $ 11,750,323 $ 11,626,334
F. Net pension asset as a percentage of covered payroll -9.81% -10.75% -6.91% -21.97% -52.94%
*Schedule is intended to show information for 10 years - additional years will be displayed as they become available.
107

RSI-3CITY OF CRANSTON, RHODE ISLANDSCHEDULE OF THE CITY'S PROPORTIONATE SHARE OF THE NET PENSION LIABILITY (5 of 6)EMPLOYEES' RETIREMENT SYSTEM - TEACHERSLAST FIVE FISCAL YEARS*
2018 2017 2016 2015 2014
City's proportion of the net pension liability 4.52% 4.51% 4.63% 4.51% 4.52%
City's proportionate share of the net pension liability $ 143,161,570 $ 142,133,353 $ 138,136,783 $ 124,172,981 $ 109,977,503
State's proportionate share of the net pension liability associated with the school district 106,788,248 107,418,666 94,603,413 84,831,083 75,416,640
Total $ 249,949,818 $ 249,552,019 $ 232,740,196 $ 209,004,064 $ 185,394,143
City's covered payroll $ 83,700,855 $ 81,199,212 $ 79,238,665 $ 71,583,452 $ 66,347,524
City's proportionate share of the net pension liabilityas a percentage of its covered payroll 171.04% 175.04% 174.33% 173.47% 165.76%
Plan fiduciary net position as a percentage of the total pension liability 54.30% 54.00% 54.06% 57.55% 61.40%
Note:
*Schedule is intended to show information for 10 years - additional years will be displayed as they become available.
The amounts presented for each fiscal year were determined as of 6/30 measurement date prior to the fiscal year-end.
108
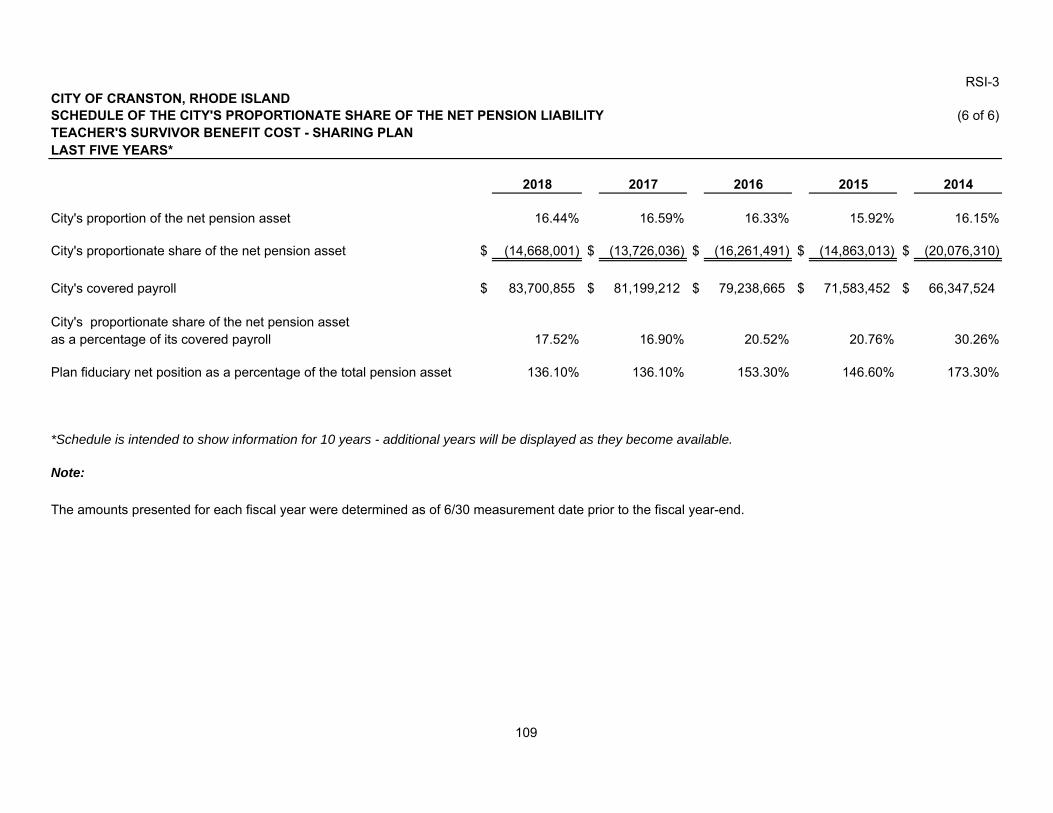
RSI-3CITY OF CRANSTON, RHODE ISLANDSCHEDULE OF THE CITY'S PROPORTIONATE SHARE OF THE NET PENSION LIABILITY (6 of 6)TEACHER'S SURVIVOR BENEFIT COST - SHARING PLANLAST FIVE YEARS*
2018 2017 2016 2015 2014
City's proportion of the net pension asset 16.44% 16.59% 16.33% 15.92% 16.15%
City's proportionate share of the net pension asset $ (14,668,001) $ (13,726,036) $ (16,261,491) $ (14,863,013) $ (20,076,310)
City's covered payroll $ 83,700,855 $ 81,199,212 $ 79,238,665 $ 71,583,452 $ 66,347,524
City's proportionate share of the net pension assetas a percentage of its covered payroll 17.52% 16.90% 20.52% 20.76% 30.26%
Plan fiduciary net position as a percentage of the total pension asset 136.10% 136.10% 153.30% 146.60% 173.30%
Note:
*Schedule is intended to show information for 10 years - additional years will be displayed as they become available.
The amounts presented for each fiscal year were determined as of 6/30 measurement date prior to the fiscal year-end.
109

RSI-4CITY OF CRANSTON, RHODE ISLANDSCHEDULE OF CITY CONTRIBUTIONS (1 of 6)
LAST SIX FISCAL YEARS*
2019 2018 2017 2016 2015 2014
Actuarially determined contribution $ 21,569,803 $ 22,568,319 $ 21,403,849 $ 21,316,456 $ 21,353,591 $ 21,006,057
Contributions in relation to the actuarially determined contribution 21,569,803 22,568,319 21,403,849 21,316,456 22,376,110 22,376,109
Contribution Deficiency (Excess) $ - $ - $ - $ - $ (1,022,519) $ (1,370,052)
Covered payroll $ 2,043,982 $ 2,403,064 $ 2,697,374 $ 2,663,974 $ 2,940,734 $ 2,905,865
Contributions as a percentage of covered payroll 1055.28% 939.15% 793.51% 800.18% 760.90% 770.03%
Notes to Schedule:Valuation date: July 1, 2018Measurement date: June 30, 2019
Actuarial cost method
Remaining amortization periodAsset valuation method Market value of assetsInflationSalary increasesInvestment rate of return 7.90%
Amortization method
Eligible survivors receive a yearly cost of living adjustment based on the annual social security adjustment-for valuation purposes, a 2.75% cost ofCost of living adjustments
Level dollar basis,
beginning with the July 1, 2013 valuation
2.75%3%
Court approved plan: Closed 28-year period beginning with the July 1, 2013 valuation. Opted out of Court approved plan: Closed 23-year period
living adjustments is assumed.
Entry age normal
CRANSTON RETIREMENT SYSTEM - POLICE AND FIRE PENSION
* Schedule is intended to show information for 10 years - additional years will be displayed as they become available.
Actuarially determined contribution rates are calculated as of June 30th of each plan year and effective two years after the actuarial valuation.
Methods and assumptions used to determine contribution rates:
110

RSI-4CITY OF CRANSTON, RHODE ISLANDSCHEDULE OF CITY CONTRIBUTIONS (2 of 6)MUNICIPAL EMPLOYEES' RETIREMENT SYSTEM AGENT PLAN - GENERAL EMPLOYEESLAST FIVE FISCAL YEARS*
2019 2018 2017 2016 2015
Actuarially determined contribution $ 2,161,301 $ 2,342,837 $ 2,403,173 $ 2,479,865 $ 2,276,531
Contributions in relation to the actuarially determined contribution 2,161,301 2,342,837 2,403,173 2,479,865 2,276,531
Contribution Deficiency (Excess) $ - $ - $ - $ - $ -
Covered payroll $ 24,696,262 $ 24,260,270 $ 24,225,987 $ 24,170,205 $ 23,528,405
Contributions as a percentage of covered payroll 8.75% 9.66% 9.92% 10.26% 9.68%
Notes to Schedule:Valuation date: June 30, 2017Measurement date: June 30, 2018
Actuarial cost methodAmortization methodRemaining amortization periodAsset valuation method 5-year smoothed marketInflationSalary Increases
Investment rate of return 7.50%Retirement age
2.75%General Employees - 3.50% to 7.50%Police & Fire Employees - 4.00% to 14.00%
Experience-based table of rates that are specific to the type of eligibility conditions. Last updated for 2014 valuation.Mortality
Males: 115% of PR-2000 Combined Healthy for Males with White Collar adjustments, projected with Scale AA from 2000.
95% of RP-2000 Combined Healthy for Females with White Collar adjustments, projected with Scale AA from 2000.
20 years
* Schedule is intended to show information for 10 years - additional years will be displayed as they become available.
Actuarially determined contribution rates are calculated as of June 30th of each plan year and effective two years after the actuarial valuation.
Methods and assumptions used to determine contribution rates:Entry age normalLevel percentage of payroll, closed
111

RSI-4CITY OF CRANSTON, RHODE ISLANDSCHEDULE OF CITY CONTRIBUTIONS (3 of 6)
LAST FIVE FISCAL YEARS*
2019 2018 2017 2016 2015
Actuarially determined contribution $ 1,199,854 $ 1,040,242 $ 1,109,071 $ 857,531 $ 687,959
Contributions in relation to the actuarially determined contribution 1,199,854 1,040,242 1,109,071 857,531 687,959
Contribution Deficiency (Excess) $ - $ - $ - $ - $ -
Covered payroll $ 10,571,361 $ 10,872,555 $ 10,494,555 $ 8,021,870 $ 7,745,546
Contributions as a percentage of covered payroll 11.35% 9.57% 10.57% 10.69% 8.88%
Notes to Schedule:Valuation date: June 30, 2017Measurement date: June 30, 2018
Actuarial cost methodAmortization methodRemaining amortization periodAsset valuation method 5-year smoothed marketInflationSalary Increases
Investment rate of return 7.50%Retirement age
MortalityMales: 115% of PR-2000 Combined Healthy for Males with White Collar adjustments, projected with Scale AA from 2000.
95% of RP-2000 Combined Healthy for Females with White Collar adjustments, projected with Scale AA from 2000.
Level percentage of payroll, closed20 years
2.75%General Employees - 3.50% to 7.50%Police & Fire Employees - 4.00% to 14.00%
Experience-based table of rates that are specific to the type of eligibility conditions. Last updated for 2014 valuation.
Entry age normal
MUNICIPAL EMPLOYEES' RETIREMENT SYSTEM AGENT PLAN - POLICE
* Schedule is intended to show information for 10 years - additional years will be displayed as they become available.
Actuarially determined contribution rates are calculated as of June 30 of each plan year and effective two years after the actuarial valuation.
Methods and assumptions used to determine contribution rates:
112

RSI-4CITY OF CRANSTON, RHODE ISLANDSCHEDULE OF CITY CONTRIBUTIONS (4 of 6)MUNICIPAL EMPLOYEES' RETIREMENT SYSTEM AGENT PLAN - FIRELAST FIVE FISCAL YEARS*
2019 2018 2017 2016 2015
Actuarially determined contribution $ 792,107 $ 971,858 $ 991,610 $ 1,226,727 $ 1,006,080
Contributions in relation to the actuarially determined contribution 792,107 971,858 991,610 1,226,727 1,006,080
Contribution Deficiency (Excess) $ - $ - $ - $ - $ -
Covered payroll $ 14,044,515 $ 12,959,047 $ 12,165,930 $ 11,750,323 $ 11,626,334
Contributions as a percentage of covered payroll 5.64% 7.50% 8.15% 10.44% 8.65%
Notes to Schedule:
Valuation date: June 30, 2017Measurement date: June 30, 2018
Actuarial cost methodAmortization methodRemaining amortization periodAsset valuation method 5-year smoothed marketInflationSalary Increases
Investment rate of return 7.50%Retirement age
2.75%General Employees - 3.50% to 7.50%Police & Fire Employees - 4.00% to 14.00%
Experience-based table of rates that are specific to the type of eligibility conditions. Last updated for 2014 valuation.Mortality
Males: 115% of PR-2000 Combined Healthy for Males with White Collar adjustments, projected with Scale AA from 2000.
95% of RP-2000 Combined Healthy for Females with White Collar adjustments, projected with Scale AA from 2000.
20 years
* Schedule is intended to show information for 10 years - additional years will be displayed as they become available.
Actuarially determined contribution rates are calculated as of June 30th of each plan year and effective two years after the actuarial valuation.
Methods and assumptions used to determine contribution rates:Entry age normalLevel percentage of payroll, closed
113

RSI-4CITY OF CRANSTON, RHODE ISLANDSCHEDULE OF CITY CONTRIBUTIONS (5 of 6)EMPLOYEES' RETIREMENT SYSTEM - TEACHERSLAST FIVE FISCAL YEARS*
2019 2018 2017 2016 2015
Actuarially determined contribution $ 11,610,057 $ 11,072,615 $ 10,443,656 $ 8,928,408 $ 8,897,203
Contributions in relation to the actuarially determined contribution 11,610,057 11,072,615 10,443,656 8,928,408 8,897,203
Contribution Deficiency (Excess) $ - $ - $ - $ - $ -
Covered payroll $ 83,700,855 $ 81,199,212 $ 79,238,665 $ 65,343,396 $ 75,293,840
Contributions as a percentage of covered payroll 13.87% 13.64% 13.18% 13.66% 11.82%
Notes:
Notes to Schedule:Valuation date: June 30, 2017Measurement date: June 30, 2018
Actuarial cost method Entry age normalAmortization method Level percentage of payroll, closedInflation 2.50%Salary Increases Teachers - 3.0% to 13.0%Investment rate of return 7.00%Mortality
* Schedule is intended to show information for 10 years - additional years will be displayed as they become available.
1) Employers participating in the State Employee's Retirement System are required by RI General Laws, Section 36-10-2, to contribute an actuarially determined contribution rate each year.
Methods and assumptions used to determine contribution rates:
Males: PR-2014 Combined Healthy for Males with White Collar adjustments, projected with Scale Ultimate MP16.
114

RSI-4CITY OF CRANSTON, RHODE ISLANDSCHEDULE OF CITY CONTRIBUTIONS (6 of 6)TEACHERS' SURVIVOR BENEFIT COST-SHARING PLANLAST FIVE FISCAL YEARS*
2019 2018 2017 2016 2015
Actuarially determined contribution $ 122,291 $ 122,140 $ 104,893 $ 96,065 $ 98,373
Contributions in relation to the actuarially determined contribution 122,291 122,140 104,893 96,065 98,373
Contribution Deficiency (Excess) $ - $ - $ - $ - $ -
Covered payroll $ 83,700,855 $ 81,199,212 $ 79,238,665 $ 65,343,396 $ 75,293,840
Contributions as a percentage of covered payroll 0.15% 0.15% 0.13% 0.15% 0.13%
Notes:
Notes to Schedule:Valuation date: June 30, 2017Measurement date: June 30, 2018
Actuarial cost method Entry age normal-the individual Entry Age Actuarial Cost methodology is usedInflation 2.50%Salary Increases 3.0% to 13.0%Investment rate of return 7.00%Mortality
Cost of Living Adjustment Eligible survivors receive a yearly cost of living adjustment based on the annual social security adjustment - for valuation purposes, a 2.50% cost of living adjustment is assumed.
* Schedule is intended to show information for 10 years - additional years will be displayed as they become available.
1) Employers participating in the Teachers'' Survivor Benefit Plan contribute at a rate established by RI General Laws, Section 16-16-35.
Methods and assumptions used to determine contribution rates:
Male Employees, RP-2014 Combined Healthy for Males with White Collar adjustments, projected with Scale Ultimate MP16.
Female Employees, RP-2014 Combined Healthy for Females with White Collar adjustments, projected with Scale Ultimate MP16.
115

RSI-5CITY OF CRANSTON, RHODE ISLANDSCHEDULE OF CHANGES IN THE CITY'S NET OPEB LIABILITY AND RELATED RATIOS (1 of 2)CITY OF CRANSTON PUBLIC SAFETY OPEB TRUST FUNDLAST THREE FISCAL YEARS*
2019 2018 2017
Total OPEB LiabilityService Cost $ 954,238 $ 930,661 $ 890,585 Interest on the total OPEB liability 3,776,605 3,867,250 3,830,040 Differences between expected and actual experience (5,576,847) (1,729,986) Benefit payments (4,378,012) (4,104,990) (4,467,496)
Net change in total OPEB liability (5,224,016) (1,037,065) 253,129 Total OPEB liability - beginning 48,998,289 50,035,354 49,782,225
Total OPEB liability - ending $ 43,774,273 $ 48,998,289 $ 50,035,354
Plan Fiduciary Net PositionContributions - employer $ 4,426,721 $ 5,108,840 $ 5,055,716 Contributions - retired members 385,781 368,718 362,505 Net investment income 410,584 316,629 174,087 Benefit payments (4,378,012) (4,104,989) (4,467,496) OPEB Plan Administrative Expense (23,396) (19,792) (17,471)
Net change in plan fiduciary net position 821,678 1,669,406 1,107,341 Plan fiduciary net position - beginning 7,801,259 6,131,853 5,024,512 Plan fiduciary net position - ending (b) 8,622,937 7,801,259 6,131,853
Net OPEB liability - ending $ 35,151,336 $ 41,197,030 $ 43,903,501
Plan fiduciary net position as a percentage of the total OPEB liability 19.70% 15.92% 12.26%
Covered payroll $ 24,825,724 $ 24,041,185 $ 23,228,198
Net OPEB liability as a percentage of covered payroll -141.59% -171.36% 189.01%
*Schedule is intended to show information for 10 years - additional years will be displayed as they become available.
116

RSI-5CITY OF CRANSTON, RHODE ISLANDSCHEDULE OF CHANGES IN THE CITY'S NET OPEB LIABILITY AND RELATED RATIOS (2 of 2)CRANSTON PUBLIC SCHOOLS OPEB TRUST FUNDLAST THREE FISCAL YEARS*
2019 2018 2017
Total OPEB LiabilityService Cost $ 570,694 $ 546,119 $ 538,422 Interest on the total OPEB liability 400,456 380,630 363,147 Changes of assumptionsDifferences between expected and actual experience 3,327,983 172,483 Benefit payments (662,755) (542,485) (357,642)
Net change in total OPEB liability 3,636,378 556,747 543,927 Total OPEB liability - beginning 10,295,914 9,739,167 9,195,240
Total OPEB liability - ending $ 13,932,292 $ 10,295,914 $ 9,739,167
Plan Fiduciary Net PositionContributions - employer $ 449,828 $ 868,198 $ 512,786 Contributions - retired membersNet investment income 43,177 37,929 49,267 Benefit payments (449,828) (368,198) (512,786) OPEB Plan Administrative Expense (1,530)
Net change in plan fiduciary net position 41,647 537,929 49,267 Plan fiduciary net position - beginning 605,073 67,144 17,877 Plan fiduciary net position - ending (b) 646,720 605,073 67,144
Net OPEB liability - ending $ 13,285,572 $ 9,690,841 $ 9,672,023
Plan fiduciary net position as a percentage of the total OPEB liability 4.64% 5.88% 0.69%
Covered payroll $ 86,830,931 $ 83,894,619 $ 82,578,112
Net OPEB liability as a percentage of covered payroll 15.30% 11.55% 11.71%
*Schedule is intended to show information for 10 years - additional years will be displayed as they become available.
117

RSI-6CITY OF CRANSTON, RHODE ISLANDSCHEDULE OF CITY CONTRIBUTIONS (1 of 2)CITY OF CRANSTON PUBLIC SAFETY OPEB TRUST FUNDLAST THREE FISCAL YEARS*
2019 2018 2017
Actuarially determined contribution (1) $ 4,426,721 $ 5,108,840 $ 5,055,716
Contributions in relation to the actuarially determined contribution 4,426,721 5,108,840 5,055,716
Contribution Deficiency (Excess) $ - $ - $ -
Covered payroll $ 24,825,724 $ 24,041,185 $ 23,228,198
Contributions as a percentage of covered payroll 17.83% 21.25% 21.77%
* Schedule is intended to show information for 10 years - additional years will be displayed as they become available.(1) Actuarially Determined Contributions prior to fiscal year ending June 30, 2016 is based on the Annual Required Contribution (ARC) calculated in accordance
Notes to Schedule:Valuation date: June 30, 2019Measurement date: June 30, 2019
with GASB No. 45
118

RSI-6CITY OF CRANSTON, RHODE ISLANDSCHEDULE OF CITY CONTRIBUTIONS (2 of 2)CRANSTON PUBLIC SCHOOLS OPEB TRUST FUNDLAST THREE FISCAL YEARS*
2019 2018 2017
Actuarially determined contribution (1) $ 449,828 $ 868,198 $ 512,786
Contributions in relation to the actuarially determined contribution 449,828 868,198 512,786
Contribution Deficiency (Excess) $ - $ - $ -
Covered payroll $ 86,830,931 $ 83,894,619 $ 82,578,112
Contributions as a percentage of covered payroll 0.52% 1.03% 0.62%
(1) Actuarially Determined Contributions prior to fiscal year ending June 30, 2016 is based on the Annual Required Contribution (ARC) calculated in accordance with GASB N
Valuation date: July 1, 2017Measurement date: June 30, 2018
* Schedule is intended to show information for 10 years - additional years will be displayed as they become available.
No. 45
119

RSI-7CITY OF CRANSTON, RHODE ISLANDSCHEDULE OF CITY INVESTMENT RETURNS (1 of 2)CITY OF CRANSTON PUBLIC SAFETY OPEB TRUST FUNDLAST TWO FISCAL YEARS*
2019 2018Annual money-weighted rate of return,
net of investment expense 5.92% 6.15%
become available* Schedule is intended to show information for 10 years - additional years will be displayed as they
120

RSI-7CITY OF CRANSTON, RHODE ISLANDSCHEDULE OF CRANSTON PUBLIC SCHOOLS INVESTMENT RETURNS (2 of 2)CRANSTON PUBLIC SCHOOLS OPEB TRUST FUNDLAST TWO FISCAL YEARS*
2019 2018Annual money-weighted rate of return,
net of investment expense 7.14% 6.47%
* Schedule is intended to show information for 10 years - additional years will be displayed as theybecome available.
121

Supplemental, Combining and
Individual Fund Statements and
Schedules

Nonmajor Governmental Funds

NONMAJOR GOVERNMENTAL FUNDS
Special Revenue Funds
Special Revenue Funds are used to account for revenues from specific taxes and other earmarked revenue sources which by law are designated to finance particular functions or activities of government and which, therefore, cannot be diverted to other uses.
Education - This fund accounts for education programs financed with grants from private parties and the federal and state government, which are restricted as governed by the grant agreements.
Community Services - These funds account for various grants and donations that are used throughout the City for the general betterment of the City. Included in this category are the following funds:
• Flood Mitigation - This fund was established to help mitigate flooding in low lying
areas throughout the City.
• UDAG - This fund accounts for the repayment of principal and interest payments from commercial loans funded by a grant from the Department of Housing and Urban Development.
• Economic Development Revolving Loan - This fund accounts for the repayment of
principal and interest payments from commercial loans funded by a grant from the Department of Housing and Urban Development.
• Public Libraries -This fund is used to account for gifts, bequests and grants received
by the library for the betterment of the public library system.
Public Services -These funds account for public safety activities financed by grants, donations and charges received from private parties and federal and state agencies. This category includes the following funds:
Emergency Management Harbor Master Fire Revolving Loan Fund Special Duty Fire Animal Shelter Police Grants/Donations Police Federal Forfeiture-Justice Police Evidence Police State Seizure Police Federal Forfeiture-Treasury Training Academy Special Duty Police

Special Revenue Funds (Continued)
Senior Services -The following funds were established to account for the receipt and disbursement of funds for specific activities sponsored by the Senior Citizens Center:
RSVP Multipurpose Center Adult Day Care Senior Service Special Project Cranston Senior Games
Governmental Special Revenue -This fund accounts for special grants and non-capital projects and includes the following funds:
Connetta Park Parks and Recreation Inaugural Committee Capital Facilities Development Impact Fees Cemetery Trust Historical Records
Community Development Block Grant -This fund accounts for Federal Community Development Block Grants.
WIA Job Development -This fund is a joint venture with the City of Providence to help unemployed and underemployed individuals.
Capital Project Funds The Capital Project Funds account for all resources used for the acquisition and/or construction of capital facilities by the City, except for those financed by the Enterprise Funds.
Police and Fire Bond Fund - This fund accounts for the construction and improvements to police and fire stations and for the acquisition of police and fire equipment.
Public Building Bond Fund - This fund accounts for the construction and improvements of City buildings and the acquisition of equipment for City Hall.
Recreation Bond Fund - This fund accounts for the construction and improvements of the City's recreation facilities and for the acquisition of open space.
Highway Bond Fund - This fund accounts for construction and improvements to roads and highways within the City.
Storm Drains Bond Fund - This fund accounts for the installation and repair of storm drains within the City.
Neighborhood Infrastructure Bond Fund - This fund accounts for neighborhood improvement projects.
Open Space Bond Fund - This fund accounts for the acquisition of open space.

CITY OF CRANSTON, RHODE ISLANDCOMBINING BALANCE SHEETJUNE 30, 2019
SCHEDULE 1
Governmental Community
Community Public Senior Special Revenue Development WIOA Job
Education Services Service Services Funds Block Grant Development
Assets:
Cash and cash equivalents $ 1,046,826 $ 1,473,844 $ 601,017 $ 135,569 $ 1,387,554 $ $ 4,353
Receivables:
Intergovernmental 1,127,895
Loans 609,366 2,170,300
Other 10,249 549,459
Security deposits 9,249
Due from:
Other funds 54,406 2,280 8,138
Total Assets $ 2,248,625 $ 2,085,490 $ 1,158,614 $ 135,569 $ 1,387,554 $ 2,170,300 $ 4,353
Liabilities and Fund Balances
Liabilities:
Accounts payable $ 294,141 $ 23,814 $ 20,620 $ 638 $ 90,362 $ $ 1,156
Accrued payroll 95,080 4,954 6,283
Due to other funds 1,026,507 5,000 236,791 30 24,651 148,585
Unearned revenues 888,796 609,366 2,170,300
Total liabilities 2,209,444 638,180 352,491 668 90,362 2,199,905 156,024
Fund Balances:
Restricted 9,691 1,447,310 806,123 134,901 1,297,192
Committed 29,490
Unassigned (29,605) (151,671) Total fund balances 39,181 1,447,310 806,123 134,901 1,297,192 (29,605) (151,671)
Total Liabilities and Fund Balances $ 2,248,625 $ 2,085,490 $ 1,158,614 $ 135,569 $ 1,387,554 $ 2,170,300 $ 4,353
Special Revenue Funds
(Continued on next page)
122

CITY OF CRANSTON, RHODE ISLANDCOMBINING BALANCE SHEET (CONTINUED)JUNE 30, 2019
SCHEDULE 1
Assets:
Cash and cash equivalents
Receivables:
Intergovernmental
Loans
Other
Security deposits
Due from:
Other funds
Total Assets
Liabilities and Fund Balances
Liabilities:
Accounts payable
Accrued payroll
Due to other funds
Unearned revenues
Total liabilities
Fund Balances:
Restricted
Committed
UnassignedTotal fund balances
Total Liabilities and Fund Balances
Police Public Neighborhood Total Nonmajor
and Fire Building Recreation Highway Storm Drains Library Infrastructure Open Space Governmental
Bond Fund Bond Fund Bond Fund Bond Fund Bond Fund Bond Fund Bond Fund Bond Fund Funds
$ 357,438 $ 120,173 $ 595,629 $ 789,588 $ 213,624 $ 52,595 $ 290,628 $ 123,366 $ 7,192,204
1,127,895
2,779,666
559,708
9,249
64,824
$ 357,438 $ 120,173 $ 595,629 $ 789,588 $ 213,624 $ 52,595 $ 290,628 $ 123,366 $ 11,733,546
$ 196,791 $ 78,100 $ $ 1,696,533 $ 39,993 $ $ $ $ 2,442,148
106,317
1,505,212 2,946,776
3,668,462
196,791 78,100 - 3,201,745 39,993 - - - 9,163,703
160,647 42,073 595,629 173,631 52,595 290,628 123,366 5,133,786
29,490
(2,412,157) (2,593,433)
160,647 42,073 595,629 (2,412,157) 173,631 52,595 290,628 123,366 2,569,843
$ 357,438 $ 120,173 $ 595,629 $ 789,588 $ 213,624 $ 52,595 $ 290,628 $ 123,366 $ 11,733,546
Capital Project Funds
123

CITY OF CRANSTON, RHODE ISLANDCOMBINING STATEMENT OF REVENUES, EXPENDITURES AND CHANGES IN FUND BALANCESFOR THE YEAR ENDED JUNE 30, 2019
SCHEDULE 2
Governmental Community Community Public Senior Special Revenue Development WIOA Job Education Services Service Services Funds Block Grant Development
Revenues:
Intergovernmental $ 9,233,447 $ $ 65,608 $ $ $ 1,020,835 $ 493,306
Charges for services 2,450,901 78,455 226,276
Investment income 19,148 982 279 12,360 406,601 51
Other 41,332 213,608
Total revenues 9,233,447 60,480 2,731,099 78,734 238,636 1,427,436 493,357
Expenditures:
Current: General government 9,297 214,086 439,818
Public safety 2,485,532 23,760
Education 9,099,058
Parks and recreation 4,800
Public libraries 112,583 130,570
Senior services 84,460
Community development 1,428,317
Debt service:
Interest and other costs
Capital:
Capital expenditures
Total expenditures 9,099,058 121,880 2,485,532 84,460 373,216 1,428,317 439,818
Excess (Deficiency) of Revenues Over Expenditures 134,389 (61,400) 245,567 (5,726) (134,580) (881) 53,539
Other Financing Sources (Uses):
Issuance of general obligation bond
Bond premium
Transfer out (188,104)
Net other financing sources (uses) (188,104) - - - - - -
Net Change in Fund Balances (53,715) (61,400) 245,567 (5,726) (134,580) (881) 53,539
Fund Balances - July 1, 2018 92,896 1,508,710 560,556 140,627 1,431,772 (28,724) (205,210)
Fund Balances - June 30, 2019 $ 39,181 $ 1,447,310 $ 806,123 $ 134,901 $ 1,297,192 $ (29,605) $ (151,671)
(Continued on next page)
Special Revenue Funds
124

CITY OF CRANSTON, RHODE ISLANDCOMBINING STATEMENT OF REVENUES, EXPENDITURES AND CHANGES IN FUND BALANCES (CONTINUED)FOR THE YEAR ENDED JUNE 30, 2019
SCHEDULE 2
Revenues:
IntergovernmentalCharges for servicesInvestment incomeOther
Total revenues
Expenditures:Current:
General governmentPublic safetyEducationParks and recreationPublic librariesSenior servicesCommunity development
Debt service:Interest and other costs
Capital:Capital expenditures
Total expenditures
Excess (Deficiency) of Revenues Over Expenditures
Other Financing Sources (Uses):Issuance of general obligation bondBond premiumTransfer out
Net other financing sources (uses)
Net Change in Fund Balances
Fund Balances - July 1, 2018
Fund Balances - June 30, 2019
Police Public Neighborhood Total Nonmajorand Fire Building Recreation Highway Storm Drains Library Infrastructure Open Space Governmental
Bond Fund Bond Fund Bond Fund Bond Fund Bond Fund Bond Fund Bond Fund Bond Fund Funds
$ $ $ $ $ $ $ $ $ 10,813,196 2,755,632 47 439,468 254,940
- - - - - - 47 - 14,263,236
663,201 2,509,292 9,099,058 4,800 243,153 84,460 1,428,317
99,941 30,276 51,540 624,317 6,817 2,711 815,602
2,685,101 580,219 403,383 4,593,823 177,320 234,239 664,988 2,498 9,341,571 2,785,042 610,495 454,923 5,218,140 177,320 241,056 667,699 2,498 24,189,454
(2,785,042) (610,495) (454,923) (5,218,140) (177,320) (241,056) (667,652) (2,498) (9,926,218)
629,250 470,696 3,723,134 246,920 5,070,000 476,101 54,005 258,526 1,247,757 18,362 32,391 2,087,142
(188,104) 1,105,351 54,005 729,222 4,970,891 - 18,362 279,311 - 6,969,038
(1,679,691) (556,490) 274,299 (247,249) (177,320) (222,694) (388,341) (2,498) (2,957,180)
1,840,338 598,563 321,330 (2,164,908) 350,951 275,289 678,969 125,864 5,527,023
$ 160,647 $ 42,073 $ 595,629 $ (2,412,157) $ 173,631 $ 52,595 $ 290,628 $ 123,366 $ 2,569,843
Capital Projects Fund
125

SCHEDULE 3CITY OF CRANSTON, RHODE ISLANDNONMAJOR BUDGETARY FUNDS SCHEDULE OF REVENUES AND EXPENDITURES - BUDGETARY BASISBUDGET AND ACTUALFOR THE YEAR ENDED JUNE 30, 2019
Originally Final Actual VarianceAdopted Approved (Budgetary withBudget Budget Basis) Final Budget
Revenues:Program income $ 160,000 $ 160,000 $ 406,601 $ 246,601
Federal grants 1,306,700 1,306,700 1,020,835 (285,865) Total revenues 1,466,700 1,466,700 1,427,436 (39,264)
Expenditures:
Current:
Program activities 1,466,700 1,466,700 1,428,317 38,383
Excess (Deficiency) of Revenues Over Expenditures $ - $ - $ (881) $ (881)
Originally Final Actual VarianceAdopted Approved (Budgetary withBudget Budget Basis) Final Budget
Revenues:Program income $ 587,650 $ 587,650 $ 493,306 $ (94,344)
Investment income 51 51 Total revenues 587,650 587,650 493,357 (94,293)
Expenditures:
Current: Program activities 587,650 587,650 439,818 147,832
Excess (Deficiency) of Revenues
Over Expenditures $ - $ - $ 53,539 $ 53,539
COMMUNITY DEVELOPMENT BLOCK GRANT
WORKFORCE INVESTMENT ACT
126

Nonmajor Enterprise Funds

NONMAJOR ENTERPRISE FUNDS
The Enterprise Funds are used to account for operations that are financed and operated in a manner similar to private business enterprise or where the City has decided that periodic determination of net income is appropriate for capital maintenance, management control, accountability, public policy or other purposes.
The following is a list of Nonmajor enterprise funds in this section:
School Lunch Fund - This fund accounts for the school lunch program.
Charter School - This fund accounts for the New England Laborers / Cranston Public Schools Construction & Career Academy.
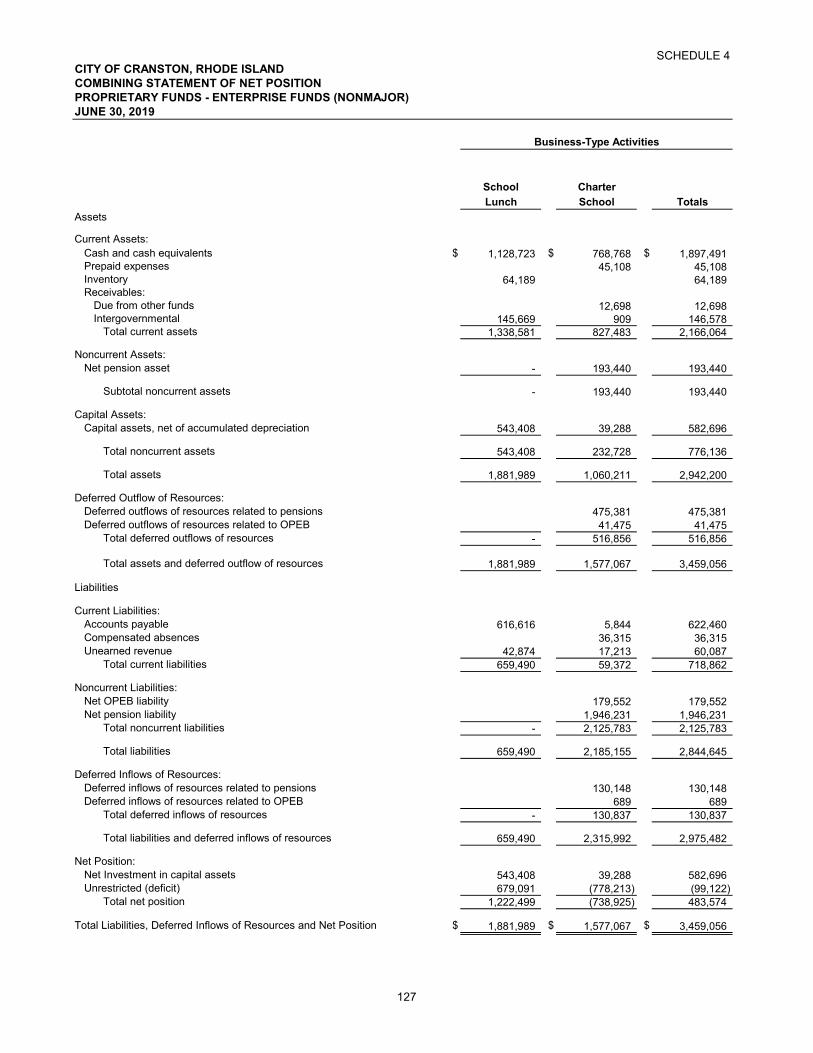
SCHEDULE 4CITY OF CRANSTON, RHODE ISLANDCOMBINING STATEMENT OF NET POSITIONPROPRIETARY FUNDS - ENTERPRISE FUNDS (NONMAJOR)JUNE 30, 2019
School Charter
Lunch School Totals
Assets
Current Assets:Cash and cash equivalents $ 1,128,723 $ 768,768 $ 1,897,491 Prepaid expenses 45,108 45,108 Inventory 64,189 64,189 Receivables:
Due from other funds 12,698 12,698 Intergovernmental 145,669 909 146,578
Total current assets 1,338,581 827,483 2,166,064
Noncurrent Assets:Net pension asset - 193,440 193,440
Subtotal noncurrent assets - 193,440 193,440
Capital Assets:Capital assets, net of accumulated depreciation 543,408 39,288 582,696
Total noncurrent assets 543,408 232,728 776,136
Total assets 1,881,989 1,060,211 2,942,200
Deferred Outflow of Resources:Deferred outflows of resources related to pensions 475,381 475,381 Deferred outflows of resources related to OPEB 41,475 41,475
Total deferred outflows of resources - 516,856 516,856
Total assets and deferred outflow of resources 1,881,989 1,577,067 3,459,056
Liabilities
Current Liabilities:Accounts payable 616,616 5,844 622,460 Compensated absences 36,315 36,315 Unearned revenue 42,874 17,213 60,087
Total current liabilities 659,490 59,372 718,862
Noncurrent Liabilities:Net OPEB liability 179,552 179,552 Net pension liability 1,946,231 1,946,231
Total noncurrent liabilities - 2,125,783 2,125,783
Total liabilities 659,490 2,185,155 2,844,645
Deferred Inflows of Resources:Deferred inflows of resources related to pensions 130,148 130,148 Deferred inflows of resources related to OPEB 689 689
Total deferred inflows of resources - 130,837 130,837
Total liabilities and deferred inflows of resources 659,490 2,315,992 2,975,482
Net Position:Net Investment in capital assets 543,408 39,288 582,696 Unrestricted (deficit) 679,091 (778,213) (99,122)
Total net position 1,222,499 (738,925) 483,574
Total Liabilities, Deferred Inflows of Resources and Net Position $ 1,881,989 $ 1,577,067 $ 3,459,056
Business-Type Activities
127

SCHEDULE 5CITY OF CRANSTON, RHODE ISLAND COMBINING STATEMENT OF REVENUES, EXPENSES AND CHANGES IN NET POSITION PROPRIETARY FUNDS - ENTERPRISE FUNDS (NONMAJOR) FOR THE YEAR ENDED JUNE 30, 2019
School CharterLunch School Totals
Operating Revenues:Charges for usage and service $ 1,050,764 $ $ 1,050,764 Intergovernmental 2,666,408 2,666,408 Tuition 2,538,588 2,538,588 On-behalf pension contribution 137,640 137,640 Miscellaneous 28,773 28,773
Total operating revenues 3,745,945 2,676,228 6,422,173 Operating Expenses:
Operations 3,555,654 904,672 4,460,326 Personnel 64,808 2,073,559 2,138,367 Depreciation 56,598 9,181 65,779
Total operating expenses 3,677,060 2,987,412 6,664,472
Operating Loss 68,885 (311,184) (242,299)
Nonoperating Revenues:
Investment income 32 5,417 5,449 Grant income 89,207 89,207
Total nonoperating revenues 32 94,624 94,656
Change in Net Position 68,917 (216,560) (147,643)
Net Position - July 1, 2018 1,153,582 (522,365) 631,217
Net Position - June 30, 2019 $ 1,222,499 $ (738,925) $ 483,574
Business-Type Activities
128

SCHEDULE 6
CITY OF CRANSTON, RHODE ISLANDCOMBINING STATEMENT OF CASH FLOWSPROPRIETARY FUNDS - ENTERPRISE FUNDS (NONMAJOR)FOR THE YEAR ENDED JUNE 30, 2019
School CharterLunch School Totals
Cash Flows from Operating Activities:Cash received from customers $ 3,822,183 $ 2,707,480 $ 6,529,663 Cash paid to suppliers (978,816) (978,816) Cash paid to employees (64,808) (1,776,231) (1,841,039) Cash paid for other operating expenses (3,279,671) (3,279,671)
Net cash provided by (used in) operating activities 477,704 (47,567) 430,137
Cash Flows from Noncapital Financing Activities: Non-operating grant 88,299 88,299 Advances from interfund loans 164,951 164,951
Net cash provided by (used in) noncapital financing activities - 253,250 253,250
Cash Flows from Capital and Related Financing Activities: Acquisition of capital assets (462,047) - (462,047)
Net cash used in capital and related financing activities (462,047) - (462,047)
Cash Flows from Investing Activities: Income from investments 32 5,417 5,449
Net cash provided by investing activities 32 5,417 5,449
Net Increase in Cash 15,689 211,100 226,789
Cash - July 1, 2018 (Including Restricted Cash) 1,113,034 557,668 1,670,702
Cash - June 30, 2019 (Including Restricted Cash) $ 1,128,723 $ 768,768 $ 1,897,491
Reconciliation of Operating Income to Net Cash Provided by (Used in) Operating Activities:
Operating income (loss) $ 68,885 $ (311,184) $ (242,299) Adjustments to reconcile operating income to net cash provided by (used in) operating activities: Depreciation 56,598 9,181 65,779 Increase in net pension asset 2,338 2,338 Increase in deferred outflows related to pension plans 59,981 59,981 Decrease in deferred inflows related to pension plans (30,721) (30,721) Increase in deferred outflows related to OPEB plans (39,673) (39,673) Decrease in deferred inflows related to OPEB plans 13 13 (Increase) decrease in accounts receivable 11,788 172,972 184,760 Increase in prepaid expenses (20,804) (20,804) Increase in inventory (7,147) (7,147) (Increase) decrease in intergovernmental receivables 54,368 54,368 Increase (decrease) in accounts payable 283,130 (53,340) 229,790 Increase in compensated absences (2,628) (2,628) Increase (decrease) in OPEB 48,373 48,373 Increase in unearned revenue 10,082 (4,080) 6,002 Increase in net pension liability 122,005 122,005
Net Provided by (Used in) Operating Activities $ 477,704 $ (47,567) $ 430,137
Business-Type Activities
129

Internal Service Funds

INTERNAL SERVICE FUNDS
Internal Service Funds are used to account for the financing of goods or services provided by one department or agency to other departments or agencies of the government and to other government units, on a cost-reimbursement basis.
School Department Internal Service Fund -This fund accounts for revenues and expenses related to the School Departments medical self-insurance plan.
City Internal Service Fund -This fund accounts for revenues and expenses related to the City’s self-insurance plans for medical, workers compensation, property and casualty, unemployment and general liability claims.
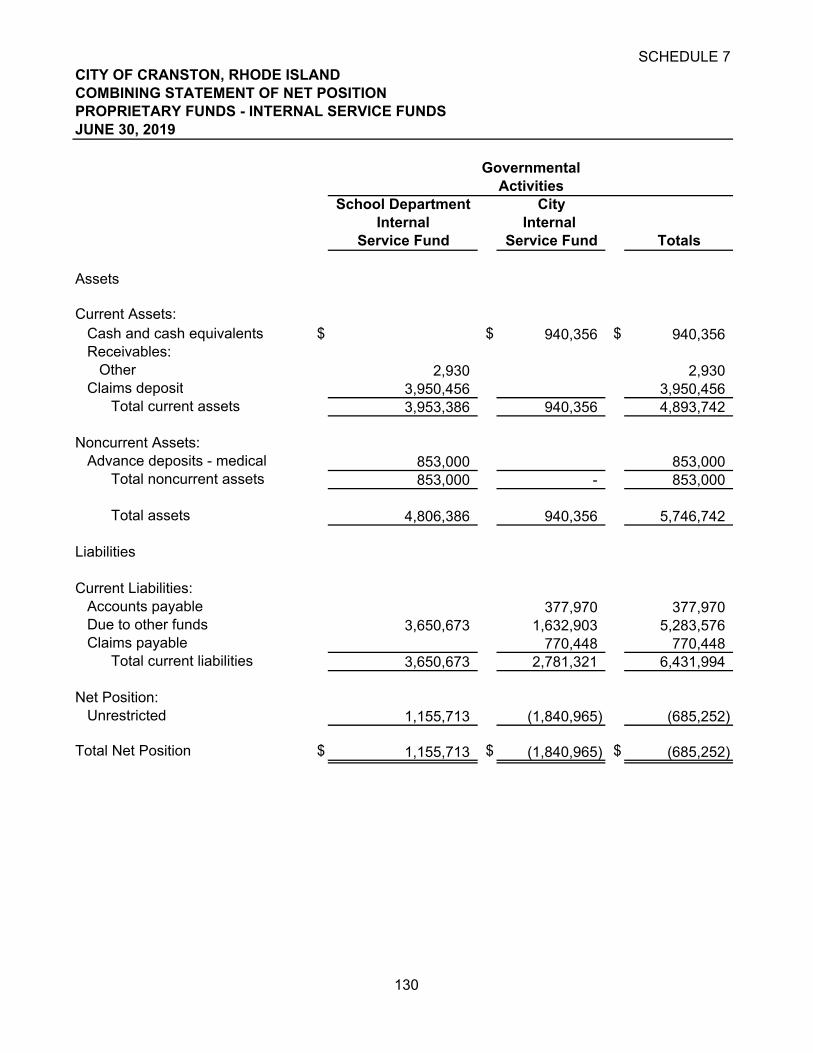
SCHEDULE 7CITY OF CRANSTON, RHODE ISLAND COMBINING STATEMENT OF NET POSITION PROPRIETARY FUNDS - INTERNAL SERVICE FUNDS JUNE 30, 2019
School Department CityInternal Internal
Service Fund Service Fund Totals
Assets
Current Assets:Cash and cash equivalents $ $ 940,356 $ 940,356 Receivables:
Other 2,930 2,930 Claims deposit 3,950,456 3,950,456
Total current assets 3,953,386 940,356 4,893,742
Noncurrent Assets: Advance deposits - medical 853,000 853,000
Total noncurrent assets 853,000 - 853,000
Total assets 4,806,386 940,356 5,746,742
Liabilities
Current Liabilities: Accounts payable 377,970 377,970 Due to other funds 3,650,673 1,632,903 5,283,576 Claims payable 770,448 770,448
Total current liabilities 3,650,673 2,781,321 6,431,994
Net Position: Unrestricted 1,155,713 (1,840,965) (685,252)
Total Net Position $ 1,155,713 $ (1,840,965) $ (685,252)
ActivitiesGovernmental
130

SCHEDULE 8CITY OF CRANSTON, RHODE ISLAND COMBINING STATEMENT OF REVENUES, EXPENDITURES AND CHANGES IN NET POSITION PROPRIETARY FUNDS - INTERNAL SERVICE FUNDS FOR THE YEAR ENDED JUNE 30, 2019
School Department CityInternal Internal
Service Fund Service Fund Totals
Operating Revenues:Charges for usage and service $ 25,370,712 $ 10,942,554 $ 36,313,266 Miscellaneous 54,609 54,609
Total operating revenues 25,370,712 10,997,163 36,367,875 Operating Expenses:
Operations 785,068 785,068 Claims 11,544,134 11,544,134 Health care management 24,719,184 - 24,719,184
Total operating expenses 24,719,184 12,329,202 37,048,386
Operating (Loss) Income 651,528 (1,332,039) (680,511)
Nonoperating Revenues: Investment income 1,271 1,271
Change in Net Position 651,528 (1,330,768) (679,240)
Net Position - July 1, 2018 504,185 (510,197) (6,012)
Net Position - June 30, 2019 $ 1,155,713 $ (1,840,965) $ (685,252)
ActivitiesGovernmental
131

SCHEDULE 9CITY OF CRANSTON, RHODE ISLAND COMBINING STATEMENT OF CASH FLOWS PROPRIETARY FUNDS - INTERNAL SERVICE FUNDS FOR THE YEAR ENDED JUNE 30, 2019
School Department CityInternal Internal
Service Fund Service Fund Totals
Cash Flows from Operating Activities:
Cash received from customers $ 25,379,952 $ 10,997,163 $ 36,377,115 Cash paid to employees (260) (260) Cash paid for claims (25,756,478) (11,340,853) (37,097,331) Cash paid for other operating expenses (684,731) (684,731)
Net cash used in operating activities (376,526) (1,028,681) (1,405,207)
Cash Flows from Noncapital Financing Activities: Change in interfund loans 376,526 972,347 1,348,873
Net cash provided by noncapital financing activities 376,526 972,347 1,348,873
Cash Flows from Investing Activities:
Income from investments - 1,271 1,271
Net Decrease in Cash - (55,063) (55,063)
Cash - July 1, 2018 (Including Restricted Cash) - 995,419 995,419
Cash - June 30, 2019 (Including Restricted Cash) $ - $ 940,356 $ 940,356
Reconciliation of Operating Income to Net Cash Cash Used in Operating Activities:
Operating Income (Loss) $ 651,528 $ (1,332,039) $ (680,511) Adjustments to reconcile operating income (loss) to net
cash used in operating activities: Decrease in accounts receivable 9,240 9,240 Increase (Decrease) in claims deposits (1,037,130) (1,037,130) Decrease in accounts payable (164) 230,837 230,673 Decrease in accrued payroll (260) (260) (Increase) decrease in claims payable 72,781 72,781
Net Cash Used in Operating Activities $ (376,526) $ (1,028,681) $ (1,405,207)
ActivitiesGovernmental
132

Fiduciary Funds

Fiduciary funds are used to account for assets held by the City in a trustee capacity for individuals, private organizations or other governments.
Pension Trust Funds - A fiduciary fund type used to report resources that are required to be held in trust for the members and beneficiaries of defined benefit contribution plans.
Postemployment Healthcare Trust Fund - This fund is used to account for postemployment benefits for public safety employees.
Private-Purpose Trust Funds - A fiduciary trust fund type used to report all trust arrangements, other than those properly reported in pension trust funds or investment trust funds, under which principal and income benefit individuals, private organizations, or other governments.
AGENCY FUNDS
Agency funds were established to function as clearing mechanisms for cash resources which are collected and disbursed to authorized recipients. The following is a list of Agency Funds included in this section:
Unclaimed Estates in Probate -This fund accounts for unclaimed estates that are currently in probate.
Performance Bonds -This fund accounts for deposits received by the City to ensure certain work is completed by various developers. Once the work has been completed to the satisfaction of the Planning Department, the refunds are returned to the developers.
Student Activity Funds -This fund accounts for the receipt and disbursement of school student activity programs.

SCHEDULE 10CITY OF CRANSTON, RHODE ISLANDCOMBINING STATEMENT OF FIDUCIARY NET POSITIONPENSION AND OTHER EMPLOYEE BENEFIT TRUST FUNDSJUNE 30, 2019
City SchoolPension OPEB OPEB
Trust Trust TrustFund Fund Fund Total
Assets:Cash and cash equivalents $ 1,389,456 $ 1,321,349 $ $ 2,710,805
Investments:Guaranteed Investment Contracts 3,992,508 3,992,508 Real Estate Investment Trust 51,738 51,738 Common Stock 13,398,152 13,398,152 Pooled Equity Index Funds 342,761 342,761 Pooled Fixed Income Index Funds 252,221 252,221 International Equity Mutual Funds 1,740,209 1,740,209 U.S. Equity Mutual Funds 28,629,476 2,822,111 31,451,587 Fixed Income Mutual Funds 23,280,445 2,027,537 25,307,982
Total investments 69,300,581 6,589,857 646,720 76,537,158
Contribution receivable 758,897 758,897
Total assets 70,690,037 8,670,103 646,720 80,006,860
Liabilities:Accounts payable 300 47,166 47,466 Due to primary government 120,000 120,000
Total liabilities 120,300 47,166 - 167,466
Net Position Restricted for Pensions and OPEB Benefits and Other Purposes $ 70,569,737 $ 8,622,937 $ 646,720 $ 79,839,394
133

SCHEDULE 11CITY OF CRANSTON, RHODE ISLANDCOMBINING STATEMENT OF CHANGES IN FIDUCIARY NET POSITION PENSION AND OTHER EMPLOYEE BENEFIT TRUST FUNDS FOR THE YEAR ENDED JUNE 30, 2019
City SchoolPension OPEB OPEB
Trust Trust Trust Fund Fund Fund Total
Additions:Contributions:
Employer contributions $ 21,569,803 $ 4,426,721 $ $ 25,996,524 Plan member contributions 201,448 385,781 477,896 1,065,125 Other 57,856 57,856
Total contributions 21,829,107 4,812,502 477,896 27,119,505
Investment Income:Interest and dividends 1,432,910 159,437 43,177 1,635,524 Net appreciation in the fair value of investments 2,668,893 251,147 2,920,040
Total investment income 4,101,803 410,584 43,177 4,555,564
Total additions 25,930,910 5,223,086 521,073 31,675,069
Deductions:Benefits 24,988,876 4,378,012 477,896 29,844,784 Administrative expenses 216,555 23,396 1,530 241,481
Total deductions 25,205,431 4,401,408 479,426 30,086,265
Change in Net Position 725,479 821,678 41,647 1,588,804
Net Position - July 1, 2018 69,844,258 7,801,259 605,073 78,250,590
Net Position - June 30, 2019 $ 70,569,737 $ 8,622,937 $ 646,720 $ 79,839,394
134

SCHEDULE 12CITY OF CRANSTON, RHODE ISLANDCOMBINING STATEMENT OF CHANGES IN ASSETS AND LIABILITIES AGENCY FUNDSFOR THE YEAR ENDED JUNE 30, 2019
Balance BalanceJuly 1, 2018 Additions Deductions June 30, 2019
Unclaimed Estates in Probate Court
ASSETCash $ 96,852 $ 78,147 $ 274 $ 174,725
LIABILITYDeposits Held in Custody for Others $ 96,852 $ 78,147 $ 274 $ 174,725
Performance Bonds
ASSETCash $ 284,280 $ 11,188 $ 18,239 $ 277,229
LIABILITYDeposits Held in Custody for Others $ 284,280 $ 11,188 $ 18,239 $ 277,229
Student Activity Funds
ASSETCash $ 730,288 $ 1,401,668 $ 1,332,491 $ 799,465
LIABILITYDeposits Held in Custody for Others $ 730,288 $ 1,401,668 $ 1,332,491 $ 799,465
Totals
ASSETCash $ 1,111,420 $ 1,491,003 $ 1,351,004 $ 1,251,419
LIABILITYDeposits Held in Custody for Others $ 1,111,420 $ 1,491,003 $ 1,351,004 $ 1,251,419
135

Other Schedules

SCHEDULE 13CITY OF CRANSTON, RHODE ISLAND SCHEDULE OF PROPERTY TAXES RECEIVABLE FOR THE YEAR ENDED JUNE 30, 2019
Property PropertyTaxes Current Transfers Abatements Amount Collections Taxes
Receivable Year Addendums and to be Net of ReceivableYear July 1, 2018 Assessment (Net) Adjustments Collected Refunds June 30, 2019
2019 $ $ 188,499,042 $ $ 437,584 $ 188,061,458 $ 186,142,420 $ 1,919,038 2018 2,243,743 183,501 409,702 2,017,542 1,360,229 657,313 2017 901,490 145,135 17,379 1,029,246 286,229 743,017 2016 720,435 1,993 2,208 720,220 78,795 641,425 2015 808,293 1,070 1,715 807,648 60,768 746,880 2014 803,885 141 516 803,510 54,626 748,884 2013 808,049 2,008 806,041 38,173 767,868 2012 802,577 3,359 799,218 24,251 774,967 2011 905,505 839 317 906,027 27,887 878,140 2010 527,816 506,873 20,943 20,943
Subtotal 8,521,793 $ 188,499,042 $ 332,679 $ 1,381,661 $ 195,971,853 $ 188,094,321 7,877,532
Less estimated allowance for uncollectable accounts 2,085,000 2,166,000
Net property taxes receivable $ 6,436,793 $ 5,711,532
(Continued on next page)
136

SCHEDULE 13CITY OF CRANSTON, RHODE ISLAND SCHEDULE OF PROPERTY TAXES RECEIVABLE (CONTINUED) FOR THE YEAR ENDED JUNE 30, 2019
CollectionsJuly - July -
August 2018 August 2019Collections CollectionsSubject to September - Subject to
60-Day FY18 June 2019 Total FY 2019 60-Day FY19Year Accrual Collections Collections Accrual
2019 $ $ 186,142,420 $ 186,142,420 $ 598,593 2018 608,632 751,597 1,360,229 49,024 2017 61,177 225,052 286,229 19,892 2016 27,905 50,890 78,795 11,882 2015 14,743 46,025 60,768 6,200 2014 9,329 45,297 54,626 4,787 2013 9,812 28,361 38,173 2,372 2012 2,532 21,719 24,251 3,265 2011 3,963 23,924 27,887 3,304 2010 1,170 19,773 20,943 2009
Total $ 739,263 $ 187,355,058 $ 188,094,321 $ 699,319
(Continued on next page)
137

SCHEDULE 13CITY OF CRANSTON, RHODE ISLAND SCHEDULE OF PROPERTY TAXES RECEIVABLE (CONTINUED) FOR THE YEAR ENDED JUNE 30, 2019
Schedule of Net Assessed Property Value by Category Reconciliation of Current Year Property Tax RevenueAssessed December 31, 2018
Description of Property Valuations Levy Current year collections $ 188,094,321
Real property $ 7,480,696,700 $ 161,833,773 Revenue received 60 days subsequent toMotor vehicle 489,018,348 16,396,277 fiscal year ending June 30, 2019 699,319Tangible property 339,223,772 10,268,992 Subtotal 188,793,640
Total 8,308,938,820 188,499,042 Prior year revenue received in current yearExemptions and adjustments 336,429,202 (2018 60 day rule) (739,263)
Net Assessed Value $ 7,972,509,618 $ 188,499,042 Current Year Property Tax Revenue $ 188,054,377
138

SCHEDULE 14CITY OF CRANSTON, RHODE ISLANDCAPITAL ASSETS USED IN THE OPERATION OF GOVERNMENTAL FUNDS SCHEDULE BY FUNCTION AND ACTIVITYFOR THE YEAR ENDED JUNE 30, 2019
Office MachineryLand Furniture And
Land Improvements Infrastructure Buildings Vehicles & Equipment Equipment Total
General government $ 15,299,094 $ 28,991,401 $ 86,658,541 $ 107,688,884 $ 296,566 $ 1,401,993 $ 509,603 $ 240,846,082
Public safety 60,000 17,602 459,423 13,035,986 1,229,810 6,918,405 21,721,226
Public works 11,035,368 98,686 401 5,511,233 34,093 1,179,860 17,859,641
Education 7,679,206 4,662,129 1,211,563 4,200 13,557,098
Parks and recreation 984,109 603,902 263,153 801,952 9,511 1,514,354 4,176,981
Public libraries 444,805 17,458 3,579,902 115,495 4,157,660
Senior services 65,505 494,844 65,363 104,531 730,243
Total $ 15,299,094 $ 41,070,878 $ 87,378,731 $ 116,601,377 $ 24,820,168 $ 7,532,235 $ 10,346,448 $ 303,048,931
139

SCHEDULE 15CITY OF CRANSTON, RHODE ISLANDCAPITAL ASSETS USED IN THE OPERATION OF GOVERNMENTAL FUNDS SCHEDULE OF CHANGES BY FUNCTION AND ACTIVITY FOR THE YEAR ENDED JUNE 30, 2019
Balance Balance July 1, June 30,2018 Additions Retirements 2019
General government $ 239,928,456 $ 951,056 $ 33,430 $ 240,846,082
Public safety 18,470,101 3,887,263 636,138 21,721,226
Public works 13,698,276 4,898,102 736,737 17,859,641
Education 9,673,828 4,010,470 127,200 13,557,098
Parks and recreation 3,672,919 596,232 92,170 4,176,981
Public libraries 3,712,883 444,777 4,157,660
Senior services 653,624 90,899 14,280 730,243
Total Capital Assets $ 289,810,087 $ 14,878,799 $ 1,639,955 $ 303,048,931
140

Annual Supplementary Transparency Report

City of Cranston
Annual Supplemental Transparency Report (MTP2)
Fiscal Year Ended June 30, 2019
Education
REVENUE Municipal Department
Current Year Levy Tax Collection 186,620,937$ -$
Last Year's Levy Tax Collection 920,697 -
Prior Years Property Tax Collection 508,873 -
Interest & Penalty 1,089,022 -
PILOT & Tax Treaty (excluded from levy) Collection 219,399 -
Other Local Property Taxes - -
Licenses and Permits 4,623,696 -
Fines and Forfeitures 687,759 -
Investment Income 757,904 -
Departmental 4,668,794 -
Rescue Run Revenue 4,285,081 -
Police & Fire Detail 2,667,635 -
Other Local Non-Property Tax Revenues 1,188,088 -
Tuition - 1,239,924
Impact Aid - -
Medicaid - 1,416,687
Federal Stabilization Funds - -
Federal Food Service Reimbursement - 2,666,408
CDBG 331,661 -
COPS Grants - -
SAFER Grants - -
Other Federal Aid Funds - 7,996,588
MV Excise Tax Reimbursement 1,042,441 -
State PILOT Program 5,403,870 -
Distressed Community Relief Fund 1,233,378 -
Library Resource Aid 599,627 -
Library Construction Aid - -
Public Service Corporation Tax 1,020,662 -
Meals & Beverage Tax / Hotel Tax 1,992,379 -
LEA Aid - 61,123,935
Group Home - -
Housing Aid Capital Projects - 34,221
Housing Aid Bonded Debt 2,069,711 -
State Food Service Revenue - 22,772
Incentive Aid - -
Property Revaluation Reimbursement - -
Other State Revenue - 663,335
Motor Vehicle Phase Out 4,873,529 -
Other Revenue 970,083 1,717,792
Local Appropriation for Education - 93,896,822
Regional Appropriation for Education - -
Supplemental Appropriation for Education - -
Regional Supplemental Appropriation for Education - -
Other Education Appropriation - -
Rounding - -
Total Revenue 227,775,225$ 170,778,484$
Financing Sources: Transfer from Capital Funds -$ -$
Financing Sources: Transfer from Other Funds - -
Financing Sources: Debt Proceeds - -
Financing Sources: Other - -
Rounding - -
Total Other Financing Sources -$ -$

City of Cranston
Annual Supplemental Transparency Report (MTP2)
Fiscal Year Ended June 30, 2019
General Social Centralized Public Parks and Police
EXPENDITURES Government Finance Services IT Planning Libraries Works Rec Department
Compensation- Group A 1,447,521$ 1,390,888$ 1,535,526$ 433,065$ 1,003,982$ 2,220,699$ 4,475,053$ 1,729,947$ 10,587,678$
Compensation - Group B - - - - - - - - 1,206,549
Compensation - Group C - - - - - - - - -
Compensation -Volunteer - - - - - - - - -
Overtime- Group A 14,965 41,064 23,942 42,181 14,918 27,000 111,068 98,814 1,093,856
Overtime - Group B - - - - - - - - 124,654
Overtime - Group C - - - - - - - - -
Police & Fire Detail - - - - - - - - 2,124,935
Active Medical Insurance - Group A 205,967 208,983 317,220 76,490 206,557 249,365 861,135 281,547 2,150,523
Active Medical Insurance- Group B - - - - - - - - 244,698
Active Medical Insurance- Group C - - - - - - - - -
Active Dental insurance- Group A 10,840 10,999 16,696 4,026 10,871 13,124 45,323 14,818 113,014
Active Dental Insurance- Group B - - - - - - - - 12,879
Active Dental Insurance- Group C - - - - - - - - -
Payroll Taxes 115,157 111,732 115,916 36,131 74,129 131,183 361,363 136,701 358,671
Life Insurance 3,539 4,420 4,984 1,238 3,055 6,336 15,915 4,169 53,926
State Defined Contribution- Group A 11,592 9,969 9,450 3,639 5,610 9,806 41,003 10,822 365,177
State Defined Contribution - Group B - - - - - - - - 11,609
State Defined Contribution - Group C - - - - - - - - -
Other Benefits- Group A 11,883 199,678 29,769 13,384 5,293 16,800 200,501 59,090 2,697,485
Other Benefits- Group B - - - - - - - - -
Other Benefits- Group C - - - - - - - - -
Local Defined Benefit Pension- Group A - - - - - - - - 9,537,542
Local Defined Benefit Pension - Group B - - - - - - - - -
Local Defined Benefit Pension - Group C - - - - - - - - -
State Defined Benefit Pension- Group A 134,640 89,724 85,050 32,747 50,487 165,301 369,029 103,954 1,382,083
State Defined Benefit Pension - Group B - - - - - - - - 92,042
State Defined Benefit Pension - Group C - - - - - - - - -
Other Defined Benefit / Contribution - 75,207 71,289 27,449 42,319 - 309,322 81,641 97,416
Purchased Services 1,291,350 68,277 48,721 - 9,407 - 354,254 79,407 470,971
Materials/Supplies 16,026 128,190 775,929 33,142 3,152 56,990 409,578 165,671 352,388
Software Licenses - - - 164,603 - - - - -
Capital Outlays - - 24,053 54,891 - 43,668 - - 383,729
Insurance 1,000,000 - - - - - - - -
Maintenance - 665 17,552 170,771 - 65,000 9,759 7,032 389,730
Vehicle Operations - - 54,201 - 7,950 2,000 588,553 37,592 243,942
Utilities - - 6,288 209,946 - 110,000 578,264 155,213 64,252
Contingency - - - - - - - - -
Street Lighting - - - - - - 678,206 - -
Revaluation - - - - - - - - -
Snow Removal-Raw Material & External Contracts - - - - - - 766,100 - -
Trash Removal & Recycling - - - - - - 4,628,758 - -
Claims & Settlements - - - - - - - - -
Community Support 3,836 - - - - - - - -
Other Operation Expenditures 1,843,726 60,277 76,602 2,011 90,249 464,010 143,570 788,616 1,678,707
Tipping Fees - - - - - - 662,491 - -
Local Appropriation for Education - - - - - - - - -
Regional Appropriation for Education - - - - - - - - -
Supplemental Appropriation for Education - - - - - - - - -
Regional Supplemental Appropriation for Education - - - - - - - - -
Other Education Appropriation - - - - - - - - -
Municipal Debt- Principal - - - - - - - - -
Municipal Debt- Interest - - - - - - - - -
School Debt- Principal - - - - - - - - -
School Debt- Interest - - - - - - - - -
Retiree Medical Insurance- Total - - - - - - - - -
Retiree Dental Insurance- Total - - - - - - - - -
OPEB Contribution- Total - - - - - - - - -
Rounding - - - - - - - - -
Total Expenditures 6,111,042$ 2,400,074$ 3,213,187$ 1,305,713$ 1,527,979$ 3,581,282$ 15,609,246$ 3,755,035$ 35,838,457$

City of Cranston
Annual Supplemental Transparency Report (MTP2)
Fiscal Year Ended June 30, 2019
EXPENDITURES
Compensation- Group A
Compensation - Group B
Compensation - Group C
Compensation -Volunteer
Overtime- Group A
Overtime - Group B
Overtime - Group C
Police & Fire Detail
Active Medical Insurance - Group A
Active Medical Insurance- Group B
Active Medical Insurance- Group C
Active Dental insurance- Group A
Active Dental Insurance- Group B
Active Dental Insurance- Group C
Payroll Taxes
Life Insurance
State Defined Contribution- Group A
State Defined Contribution - Group B
State Defined Contribution - Group C
Other Benefits- Group A
Other Benefits- Group B
Other Benefits- Group C
Local Defined Benefit Pension- Group A
Local Defined Benefit Pension - Group B
Local Defined Benefit Pension - Group C
State Defined Benefit Pension- Group A
State Defined Benefit Pension - Group B
State Defined Benefit Pension - Group C
Other Defined Benefit / Contribution
Purchased Services
Materials/Supplies
Software Licenses
Capital Outlays
Insurance
Maintenance
Vehicle Operations
Utilities
Contingency
Street Lighting
Revaluation
Snow Removal-Raw Material & External Contracts
Trash Removal & Recycling
Claims & Settlements
Community Support
Other Operation Expenditures
Tipping Fees
Local Appropriation for Education
Regional Appropriation for Education
Supplemental Appropriation for Education
Regional Supplemental Appropriation for Education
Other Education Appropriation
Municipal Debt- Principal
Municipal Debt- Interest
School Debt- Principal
School Debt- Interest
Retiree Medical Insurance- Total
Retiree Dental Insurance- Total
OPEB Contribution- Total
Rounding
Total Expenditures
Fire Centralized Public Safety Education Total Education
Department Dispatch Other Appropriation Debt OPEB Municipal Department
13,473,263$ -$ 174,902$ -$ -$ -$ 38,472,523$ 79,482,570$
808,427 - - - - - 2,014,976 8,196,732
- - - - - - - 15,293,978
- - - - - - - -
5,126,685 - 1,185 - - - 6,595,678 -
304,701 - - - - - 429,354 -
- - - - - - - 426,759
30,027 - - - - - 2,154,962 -
4,266,814 - 33,308 - - - 8,857,909 12,252,245
199,968 - - - - - 444,666 1,028,976
- - - - - - - 5,018,903
177,080 - 1,753 - - - 418,545 667,258
10,525 - - - - - 23,403 59,986
- - - - - - - 298,923
376,299 - 12,895 - - - 1,830,178 2,590,038
63,597 - 774 - - - 161,954 71,024
437,763 - 1,025 - - - 905,856 1,807,118
7,118 - - - - - 18,727 154,465
- - - - - - - 117,249
4,156,332 - - - - - 7,390,214 635,993
- - - - - - - 62,212
- - - - - - - 101,079
12,032,261 - - - - - 21,569,803 -
- - - - - - - -
- - - - - - - 130,809
844,533 - 9,224 - - - 3,266,771 10,508,327
58,711 - 7,732 - - - 158,485 1,050,475
- - - - - - - 1,121,370
- - - - - - 704,644 -
1,301,449 - - - - - 3,623,836 19,474,368
317,434 - 39,476 - - - 2,297,977 1,987,974
- - - - - - 164,603 483,701
200,000 - - - - - 706,341 2,767,980
- - - - - - 1,000,000 858,080
235,981 - 161,762 - - - 1,058,251 1,176,563
201,912 - - - - - 1,136,151 1,184,646
1,109,755 - - - - - 2,233,718 2,451,727
- - - - - - - -
- - - - - - 678,206 -
- - - - - - - -
- - - - - - 766,100 -
- - - - - - 4,628,758 -
- - - - - - - -
- - - - - - 3,836 -
856,046 - 1,000 - - - 6,004,814 239,455
- - - - - - 662,491 -
- - - 93,896,822 - - 93,896,822 -
- - - - - - - -
- - - - - - - -
- - - - - - - -
- - - - - - - -
- - - - 6,924,600 - 6,924,600 -
- - - - 2,446,661 - 2,446,661 -
- - - - 769,400 - 769,400 -
- - - - 611,665 - 611,665 -
- - - - - - - -
- - - - - - - -
- - - - - 4,426,721 4,426,721 477,896
- - - - - - - -
46,596,680$ -$ 445,035$ 93,896,822$ 10,752,326$ 4,426,721$ 229,459,598$ 172,178,878$
Financing Uses: Transfer to Capital Funds -$ -$
Financing Uses: Transfer to Other Funds - -
Financing Uses: Payment to Bond Escrow Agent - -
Financing Uses: Other - -
Total Other Financing Uses -$ -$
Net Change in Fund Balance1(1,684,373) (1,400,394)
Fund Balance1- beginning of year $21,064,396 $6,400,189
Funds removed from Reportable Government Services (RGS) - -
Funds added to Reportable Government Services (RGS) - -
Prior period adjustments - -
Misc. Adjustment - (2,305)
Fund Balance1 - beginning of year adjusted 21,064,396 6,397,884
Rounding
Fund Balance1 - end of year 19,380,023$ 4,997,490$
1 and Net Position if Enterprise Fund activity is included in the transparency portal report.

City of Cranston
Annual Supplemental Transparency Report (MTP2)
Combining Schedule of
Reportable Government Services with
Reconciliation to MTP2
Municipal
Fiscal Year Ended June 30, 2019
Total Other Total Other Net Change Beginning Fund Restated Beginning EndingPer Audited Fund Financial Statements Total Financing Total Financing in Fund Fund Balance1
Prior Period Fund Balance1 Fund Balance1
Fund Description Revenue Sources Expenditures Uses Balance1 (Deficit) Adjustment (Deficit) (Deficit)
Fund Balance1 - per MTP-2 at June 30, 2018 21,064,396$ - 21,064,396$
No funds removed from RGS for fiscal 2018 - - -
No funds added to RGS for Fiscal 2018 - - -
No misc. adjustments made for fiscal 2018 - - -
Fund Balance1 - per MTP-2 at June 30, 2018 adjusted 21,064,396$ - 21,064,396$
General Fund 225,184,743$ -$ 133,307,581$ 93,896,822$ (2,019,660)$ 20,959,564$ -$ 20,959,564$ 18,939,904$
Fire Detail 33,948 - 30,027 - 3,921 5,494 - 5,494 9,415
Police Detail 2,224,874 - 1,893,508 - 331,366 99,339 - 99,339 430,705
CDBG 1,427,436 - 1,428,317 - (881) (28,724) - (28,724) (29,605)
Totals per audited financial statements 228,871,001$ -$ 136,659,433$ 93,896,822$ (1,685,254)$ 21,035,673$ -$ 21,035,673$ 19,350,419$
Reconciliation from financial statements to MTP2
Reclassify transfer of municipal appropriation to Education Department as expenditure on MTP2 -$ -$ 93,896,822$ (93,896,822)$ -$ -$ -$ -$ -$
Community Development Block Grant-To remove loan activity (1,095,774) - (1,096,655) - 881 28,724 - 28,724 29,605
Rounding (2) - (2) - - (1) - (1) (1)
Totals Per MTP2 227,775,225$ -$ 229,459,598$ -$ (1,684,373)$ 21,064,396$ -$ 21,064,396$ 19,380,023$
1 and Net Position if Enterprise Fund activity is included in the transparency portal report.

City of Cranston
Annual Supplemental Transparency Report (MTP2)
Combining Schedule of
Reportable Government Services with
Reconciliation to MTP2
Education Department
Fiscal Year Ended June 30, 2019
Total Other Total Other Net Change Beginning Fund Restated Beginning Ending
Per Audited Fund Financial Statements Total Financing Total Financing in Fund Fund Balance1Prior Period Fund Balance1 Fund Balance1
Fund Description Revenue Sources Expenditures Uses Balance1 (Deficit) Adjustment (Deficit) (Deficit)
Fund Balance1 - per MTP-2 at June 6,400,189$ - 6,400,189$
Miscellaneous variances from 2018 (2,305) - (2,305)
Fund Balance1 - per MTP-2 at June 30, adjusted 6,397,884$ - 6,397,884$
School Unrestricted Fund 71,960,121$ 94,084,926$ 167,055,194$ (1,010,147)$ 5,289,365$ -$ 5,289,365$ 4,279,218$
Enterprise Fund 3,745,977 - 3,677,060 - 68,917 1,153,583 - 1,153,583 1,222,500
School Special Revenue Funds 9,233,447 - 9,099,058 188,104 (53,715) 92,896 - 92,896 39,181
Totals per audited financial statements 84,939,545$ 94,084,926$ 179,831,312$ 188,104$ (994,945)$ 6,535,844$ -$ 6,535,844$ 5,540,899$
Reconciliation from financial statements to MTP2
Municipal appropriation for Education reported as a transfer on financial statements but a
revenue on MTP2 93,896,822$ (93,896,822)$ -$ -$ -$ -$ -$ -$ -$
State contributions on behalf of teacher pensions are reported as revenue and
expenditures on financial statements only (8,057,883) - (8,057,883) - - - - - -
For financial statements, indirect cost charges and recovery are reported in federal grant
funds and also actual expenditures & reimbursement reported in School Unrestricted Fund. - (188,104) - (188,104) - - - - -
Capital purchases in School Lunch Fund reported as an expense on the MPT-2 but recorded
as an asset on the June 30, 2019 financial statements - - 462,046 - (462,046) - - - (462,046)
Capital assets net of accumulated depreciation at June 30, 2018 - - - - - (137,960) - (137,960) (137,960)
Depreciation expense not recorded in UCOA - - (56,598) - 56,598 - - 56,598
Rounding - - 1 - (1) - - - (1)
Totals Per MTP2 170,778,484$ -$ 172,178,878$ -$ (1,400,394)$ 6,397,884$ -$ 6,397,884$ 4,997,490$
Reconciliation from MTP2 to UCOA
No reconciling items from MTP2 to UCOA - -
Totals per UCOA Validated Totals Report 170,778,484$ 172,178,878$
1 and Net Position if Enterprise Fund activity is included in the transparency portal report.

146
Notes to Supplementary Information – Annual Supplemental Transparency Report (MTP2)
NOTE 1. Basis of Presentation
The Annual Supplemental Transparency Report (MTP2) is a supplemental schedule required by the State of Rhode Island General Laws 45-12-22.2 and 44-35-10. This supplementary schedule included within the audit report is part of a broader project to create a municipal transparency portal (MTP) website to host municipal financial information in a centralized location.
The format of the Annual Supplemental Transparency Report (MTP2) was prescribed by the State Department of Revenue (Division of Municipal Finance), Office of the Auditor General, and the Department of Education.
NOTE 2. Reportable Government Services
Data consistency and comparability are among the key objectives of the State‘s Municipal Transparency portal. Consistent with that goal, the State has defined “reportable government services”, RGS, to include those operational revenues, expenditures, and transfers related to activities which are essential to the achievement of municipal operations. The determination of RGS may be different from the activities included within the legally adopted budget of the municipality. In practice, some communities report certain RGS in separate funds (e.g., special revenue funds, enterprise funds) rather than the municipality’s general fund. The Annual Supplemental Transparency Report (MTP2) includes a reconciliation to the fund level statements.
NOTE 3. Allocations
The State reporting requires expenditures to be reported by departments, as defined by the State. Some of the departmental groupings are not consistent with the departments reflected in the City’s (or Town’s) budget and accounting system. To report these costs, the City (or Town) made allocations of costs to the State’s departmental groupings based on a reasonable basis.
NOTE 4. Employee Groups - Compensation and Benefit Costs
Compensation includes salaries, longevity, stipends, clothing allowance/maintenance, shift differential, out-of-rank, holiday pay and bonuses.
For Public Safety departments (i.e., police, fire, and centralized dispatch) and the Education Department, compensation and most benefits costs are reported in the following employee groupings:
Group A: This group consists of employees who serve the primary function of the department. Police Department - police officers (e.g., uniform personnel - including, leadership positions) Fire Department - fire fighters (e.g., uniform personnel - including, leadership positions) Centralized Dispatch Department - civilian dispatchers only Education Department - professional staff providing direct services to students For the remaining departments - all employees’ compensation and benefits are reported under Group A
Group B: For Police and Fire Departments, compensation and benefits paid to its administrative employees and civilian dispatch employees are reported under Group B. The Education Department reports compensation and benefits paid to executive/mid-level educational administration employees under Group B.
Group C: This group is only used for the Education Department and it includes administrative and support staff.
Other post-employment benefits (OPEB) are not reported by employee groups on the MTP2. They are reported in total as either (1) contributions to a qualified OPEB trust or (2) the amount paid for medical and dental insurance for retirees when an OPEB trust fund has not been established. The detail employee group information for the Education Department can be found on the State’s Municipal Transparency portal website.

147
NOTE 5. Education Revenue and Expenditures
The revenues and expenditures presented on the MTP2 under the Education Department is consistent with existing Uniform Chart of Accounts (UCOA) guidelines. Each MTP account code has been mapped to the corresponding UCOA code or group of UCOA codes to facilitate the preparation of the MTP reporting.
Additional guidance and definitions regarding the State’s Municipal Transparency Portal can be found on the State Division of Municipal Finance website: http://www.municipalfinance.ri.gov/.

Statistical Section
Statistical Section Information
The objectives of statistical section information are to provide financial statement users with additional historical perspective, context and detail to assist in using the information in the financial statements, notes to financial statements and required supplementary information to understand and assess economic condition.
Statistical section information is presented in the following categories:
Financial trends information is intended to assist users in understanding and assessing how financial position has changed over time.
Revenue capacity information is intended to assist users in understanding and assessing the factors affecting the ability to generate own-source revenues (property taxes, charges for services, etc.).
Debt capacity information is intended to assist users in understanding and assessing debt burden and the ability to issue additional debt.
Demographic and economic information is intended 1) to assist users in understanding the socioeconomic environment and 2) to provide information that facilitates comparisons of financial statement information over time and among governments.
Operating information is intended to provide contextual information about operations and resources to assist readers in using financial statement information to understand and assess economic condition.
The accompanying tables are presented in the above order. Refer to the Table of Contents for applicable page number locations.
Sources: Unless otherwise noted, the information in the tables is derived from the comprehensive annual financial reports for the relevant year.

CITY OF CRANSTON, RHODE ISLAND
2019 2018 2017 2016 2015 2014 2013 2012 2011 2010(As Restated) (As Restated) (As Restated) (As Restated)
Governmental ActivitiesNet investment in capital assets 40,421,468$ 39,345,605$ 39,483,273$ 32,242,050$ 28,003,223$ 19,411,174$ 49,660,029$ 41,265,304$ 38,755,896$ 36,911,322$ Restricted -- -- -- -- -- -- -- -- -- 2,770,499
Unrestricted (374,211,124) (347,727,799) (358,214,329) (319,188,692) (315,174,995) (320,500,997) (86,076,389) (85,654,610) (81,803,993) (79,180,678)
Total Governmental Activities (333,789,656) (308,382,194) (318,731,056) (286,946,642) (287,171,772) (301,089,823) (36,416,360) (44,389,306) (43,048,097) (39,498,857)
Business-Type ActivitiesNet investment in capital assets 52,969,695 71,468,481 70,956,771 69,185,030 66,195,785 37,961,522 55,410,689 54,943,414 55,835,806 54,279,242 Restricted 418,467 439,167 459,633 2,129,729 8,598,629 -- -- -- -- 501,295
Unrestricted 12,627,850 (8,644,499) (11,507,291) (16,171,019) (22,951,735) 11,138,372 (7,230,976) (9,165,835) (11,349,807) (12,293,232)
Total Business-Type Activities 66,016,012 63,263,149 59,909,113 55,143,740 51,842,679 49,099,894 48,179,713 45,777,579 44,485,999 42,487,305
Total CityNet investment in capital assets 93,391,163 110,814,086 110,440,044 101,427,080 94,199,008 57,372,696 105,070,718 96,208,718 94,591,702 91,190,564 Restricted 418,467 439,167 459,633 2,129,729 8,598,629 -- -- -- -- 3,271,794
Unrestricted (361,583,274) (356,372,298) (369,721,620) (335,359,711) (338,126,730) (309,362,625) (93,307,365) (94,820,445) (93,153,800) (91,473,910)
Total City (267,773,644)$ (245,119,045)$ (258,821,943)$ (231,802,902)$ (235,329,093)$ (251,989,929)$ 11,763,353$ 1,388,273$ 1,437,902$ 2,988,448$
TABLE 1
NET POSITION BY COMPONENT
(UNAUDITED)LAST TEN FISCAL YEARS
FISCAL YEAR
148

CITY OF CRANSTON, RHODE ISLAND
2019 2018 2017 2016 2015 2014 2013 2012 2011 2010(As Restated) (As Restated) (As Restated) (As Restated)
ExpensesGovernmental activities:
General government 17,435,819$ 15,971,432$ 16,186,223$ 13,529,838$ 15,760,616$ 13,331,926$ 13,332,988$ 14,124,547$ 11,681,983$ 11,927,606$ Public safety 108,645,221 75,827,868 123,175,761 77,077,346 76,316,860 76,071,254 80,850,179 76,501,580 74,176,278 75,005,742 Public works 16,677,300 16,701,972 14,976,564 15,878,037 15,539,611 15,709,766 15,002,479 15,167,301 14,162,027 14,132,084 Education 179,996,641 177,339,237 190,115,630 200,479,946 175,923,426 148,510,719 143,177,724 145,560,327 148,737,275 147,353,569 Parks and recreation 3,716,927 3,504,777 3,450,619 3,595,810 3,100,766 2,502,784 2,187,997 2,271,516 1,674,918 1,564,980 Public libraries 3,740,372 3,561,920 3,836,411 3,295,271 3,302,163 3,130,504 3,111,686 3,068,582 2,929,901 2,918,385 Senior services 3,202,095 3,040,817 3,077,015 2,904,766 3,172,283 3,091,950 2,902,182 2,894,707 2,747,580 2,822,873 Community development 1,425,753 1,340,187 1,042,849 1,724,439 1,430,568 716,188 1,240,559 1,467,564 1,560,098 1,981,805 Interest expense 3,417,594 2,052,994 2,609,611 2,778,437 3,245,053 3,659,457 2,887,674 5,143,233 5,003,790 4,985,466
Other -- -- -- -- -- 284,552,076 -- 124,638 119,225 --
Total Governmental Activities 338,257,722 299,341,204 358,470,683 321,263,890 297,791,346 551,276,624 264,693,468 266,323,995 262,793,075 262,692,510
Business-type activities:Sewer 20,543,184 20,196,899 19,111,340 19,788,661 19,809,246 18,636,282 18,184,729 19,076,141 17,604,843 17,312,453 Public Facilities Management Foundation -- -- -- -- -- 92,137 77,010 93,501 200,937 219,337 Charter School Fund -- -- -- -- -- -- 2,648,536 2,710,210 2,960,621 3,090,636 School lunch -- -- -- -- -- 5,581,170 2,867,369 3,073,738 2,565,806 2,721,200
Other 6,664,472 6,119,203 6,129,756 5,835,392 5,698,896 1,526,883 -- -- -- --
Total Business-Type Activities 27,207,656 26,316,102 25,241,096 25,624,053 25,508,142 25,836,472 23,777,644 24,953,590 23,332,207 23,343,626
Total City Expenses 365,465,378 325,657,306 383,711,779 346,887,943 323,299,488 577,113,096 288,471,112 291,277,585 286,125,282 286,036,136
FISCAL YEAR
TABLE 2 (1 OF 3)
CHANGES IN NET POSITION
(UNAUDITED)LAST TEN FISCAL YEARS
149

CITY OF CRANSTON, RHODE ISLAND
2019 2018 2017 2016 2015 2014 2013 2012 2011 2010(As Restated) (As Restated) (As Restated) (As Restated)
Program RevenuesGovernmental activities:
Charges for services:General government 8,083,806$ 7,896,754$ 7,216,284$ 6,900,084$ 6,326,794$ 5,823,451$ 5,623,627$ 5,786,052$ 5,968,476$ 5,726,884$ Public safety 6,561,184 6,121,655 6,116,849 6,432,342 6,257,323 5,597,507 5,256,803 5,512,505 3,893,316 5,575,477 Public works 1,321,215 1,296,471 1,056,208 941,631 1,026,133 747,410 925,173 737,643 681,668 455,374 Education 1,447,882 1,294,881 25,418,622 23,803,519 23,076,779 2,583,038 1,735,671 1,499,384 1,860,578 1,850,584 Parks and recreation 400,370 397,817 355,064 396,967 356,124 345,788 301,996 286,551 266,406 289,310 Public libraries 75,000 95,000 99,100 99,100 87,400 87,400 87,400 87,400 87,400 89,000 Senior services 1,727,304 1,654,979 1,646,558 1,612,507 1,729,051 1,668,453 1,723,744 1,651,421 1,806,092 1,691,795 Other activities -- -- -- -- -- -- -- -- -- --
Operating grants and contributions 85,529,484 82,691,335 85,884,786 81,983,286 79,836,039 76,706,418 74,953,160 61,072,753 59,840,449 63,617,708
Capital grants and contributions 65,608 89,535 77,484 112,842 185,562 218,721 96,781 330,885 638,392 585,627
Total Governmental Activities Program Revenues 105,211,853 101,538,427 127,870,955 122,282,278 118,881,205 93,778,186 90,704,355 76,964,594 75,042,777 79,881,759
Business-type activities:Charges for services:
Sewer 22,816,372 22,857,078 23,182,878 22,192,444 22,135,939 20,565,668 19,341,561 19,359,122 18,876,713 18,640,991 Public Facilities Management Foundation -- -- -- -- -- 26,775 35,300 41,900 136,911 208,574 Non-major funds 3,618,125 3,466,787 3,573,946 3,608,947 3,338,096 3,302,480 3,738,516 4,281,139 3,942,173 4,091,991
Operating grants and contributions 2,755,615 2,603,782 -- 2,483,891 2,420,657 2,441,887 2,256,490 2,225,893 1,787,715 1,538,371
Capital grants and contributions -- 177,000 2,668,371 -- -- -- -- -- -- --
Total Business-Type Activities Program Revenues 29,190,112 29,104,647 29,425,195 28,285,282 27,894,692 26,336,810 25,371,867 25,908,054 24,743,512 24,479,927
Total City Revenues 134,401,965 130,643,074 157,296,150 150,567,560 146,775,897 120,114,996 116,076,222 102,872,648 99,786,289 104,361,686
Net (expenses) revenues:Governmental activities (233,045,869) (197,802,777) (230,599,728) (198,981,612) (178,910,141) (457,498,438) (173,989,113) (189,359,401) (187,750,298) (182,810,751)
Business-type activities 1,982,456 2,788,545 4,184,099 2,661,229 2,386,550 500,338 1,594,223 954,464 1,411,305 1,136,301
Total City Net Expense (231,063,413) (195,014,232) (226,415,629) (196,320,383) (176,523,591) (456,998,100) (172,394,890) (188,404,937) (186,338,993) (181,674,450)
TABLE 2 (2 OF 3)
CHANGES IN NET POSITIONLAST TEN FISCAL YEARS(UNAUDITED)
FISCAL YEAR
150

CITY OF CRANSTON, RHODE ISLAND
2019 2018 2017 2016 2015 2014 2013 2012 2011 2010(As Restated) (As Restated) (As Restated) (As Restated)
General Revenues and other Changes in Net Assets
Governmental activitiesGeneral revenues:
Property taxes and other 187,181,594$ 190,112,694$ 186,383,002$ 186,026,404$ 184,125,495$ 189,420,459$ 177,673,789$ 183,880,964$ 178,871,587$ 172,909,856$ Grants and contributions not restricted
to specific programs -- -- -- -- -- -- -- -- -- -- Gain/(Loss) on sale of assets -- -- -- -- -- -- 1,000,000 -- 662,520 303,537 State special funding for pension 10,371,555 10,838,378 7,816,659 10,167,762 5,169,920 -- -- -- -- -- Unrestricted investment earnings 1,198,487 824,602 772,132 491,493 552,058 252,218 626,522 586,730 577,703 706,945 Transfers -- -- (18,900) (17,889) (25,662) (1,737,409) (20,826) (23,817) 488,880 -- Miscellaneous 2,970,801 2,912,777 3,862,424 2,538,972 3,006,381 4,889,709 2,682,574 3,574,315 3,600,368 2,069,191
Motor vehicle phase-out taxes 5,915,970 3,463,187 -- -- -- -- -- -- -- --
Total Governmental Activities 207,638,407 208,151,638 198,815,317 199,206,742 192,828,192 192,824,977 181,962,059 188,018,192 184,201,058 175,989,529
Business-type activities:State special funding for pension 137,640 133,349 105,988 133,040 -- -- -- -- -- -- Unrestricted investment earnings 632,767 432,142 456,385 488,905 257,825 368,591 363,136 313,299 342,267 389,505 Transfers -- -- 18,900 17,889 25,662 25,218 20,826 23,817 (488,880) --
Miscellaneous -- -- -- -- 72,748 26,035 -- -- -- --
Total Business-Type Activities 770,407 565,491 581,273 639,834 356,235 419,844 383,962 337,116 (146,613) 389,505
Total City 208,408,814 208,717,129 199,396,590 199,846,576 193,184,427 193,244,821 182,346,021 188,355,308 184,054,445 176,379,034
Change in Net AssetsGovernmental activities (25,407,462) 10,348,861 (31,784,411) 225,130 13,918,051 (264,673,461) 7,972,946 (1,341,209) (3,549,240) (6,821,222)
Business-type activities 2,752,863 3,354,036 4,765,372 3,301,063 2,742,785 920,182 1,978,185 1,291,580 1,264,692 1,525,806
Total City Change in Net Assets (22,654,599)$ 13,702,897$ (27,019,039)$ 3,526,193$ 16,660,836$ (263,753,279)$ 9,951,131$ (49,629)$ (2,284,548)$ (5,295,416)$
FISCAL YEAR
(UNAUDITED)
TABLE 2 (3 of 3)
CHANGES IN NET POSITIONLAST TEN FISCAL YEARS
151

CITY OF CRANSTON, RHODE ISLAND
2019 2018 2017 2016 2015 2014 2013 2012 2011 2010(As Restated) (As Restated)
General FundNonspendable 207,000$ 207,000$ 207,000$ 207,000$ 207,000$ 1,706,660$ 5,366,568$ 7,261,553$ 3,264,015$ --$ Restricted 353,193 482,879 468,363 275,374 279,040 256,362 420,657 464,805 -- -- Committed 44,043 44,030 44,025 42,892 2,115,631 1,884,028 1,653,133 2,356,649 6,390,443 -- Assigned -- -- -- -- -- -- -- -- 1,300,761 -- Unassigned 18,335,669 20,225,654 20,149,590 20,220,712 20,452,035 20,934,388 16,714,677 13,545,115 10,423,711 -- Reserved -- -- -- -- -- -- -- -- -- 7,624,361
Unreserved -- -- -- -- -- -- -- -- -- 13,315,506
Total General Fund 18,939,905 20,959,563 20,868,978 20,745,978 23,053,706 24,781,438 24,155,035 23,628,122 21,378,930 20,939,867
All Other Governmental FundsNonspendable 135,219 120,484 116,183 147,689 3,900,353 4,543,783 6,123,093 5,606,358 3,489,492 -- Restricted 16,519,432 11,677,153 11,222,461 16,219,384 9,344,674 12,885,640 8,908,234 8,945,331 8,234,662 -- Committed 835,894 819,031 1,291,734 1,900,091 634,041 320,650 97,321 119,410 92,887 -- Assigned -- -- -- -- -- 11,656 -- -- -- -- Unassigned (2,593,433) 1,333,558 (650,642) (171,829) (152,166) (3,506,353) (8,578,569) (11,865,051) (10,727,614) -- Reserved -- -- -- -- -- -- -- -- -- 2,441,699 Unreserved, designated - school -- -- -- -- -- -- -- -- -- -- Unreserved, reported in:
Special revenue funds -- -- -- -- -- -- -- -- -- (3,378,407)
Capital project funds -- -- -- -- -- -- -- -- -- 2,416,361
Total All Other Governmental Funds 14,897,112 13,950,226 11,979,736 18,095,335 13,726,902 14,255,376 6,550,079 2,806,048 1,089,427 1,479,653
Grand Total 33,837,017$ 34,909,789$ 32,848,714$ 38,841,313$ 36,780,608$ 39,036,814$ 30,705,114$ 26,434,170$ 22,468,357$ 22,419,520$
The General Fund balance decreased $2.0 million or 9.6% for FY19. The decrease was due primarily to cost overruns in the fire department to a severe chemical fire that occurred in the City.All Other Governmental Funds increased $0.9 million or 6.8% for FY19. This was due to the unspent proceed of various capital projects in FY19.
TABLE 3
FUND BALANCES, GOVERNMENTAL FUNDS
(UNAUDITED)LAST TEN FISCAL YEARS
FISCAL YEAR
152

CITY OF CRANSTON, RHODE ISLAND
2019 2018 2017 2016 2015 2014 2013 2012 2011 2010(As Restated)
RevenuesProperty taxes 188,054,377$ 189,995,439$ 187,047,423$ 184,814,710$ 181,540,560$ 180,400,427$ 179,645,778$ 184,783,590$ 178,724,593$ 165,623,300$ Intergovernmental revenue 91,511,062 86,244,057 79,375,874 76,241,305 74,551,512 71,702,358 70,263,785 56,219,867 54,891,645 67,192,078 Charges for services 19,616,761 18,757,557 17,364,637 16,496,783 16,074,252 15,692,399 15,014,414 14,910,956 13,913,936 15,183,424 Licenses and permitsFines and interest on late paymentsInterest on investments 1,197,216 824,527 772,089 491,455 550,694 250,841 624,555 408,711 389,697 529,705 DepartmentalState fiscal stabilization funds -- -- -- -- -- -- -- 2,396 814,266 2,410,080 State on-behalf pension contributions 8,057,883 7,725,441 7,639,642 6,859,907 6,746,731 6,125,457 5,670,313 6,144,339 5,716,721 5,056,767
Other revenues 2,970,801 2,912,778 3,787,970 2,448,080 2,922,776 4,798,810 2,629,867 3,494,320 3,519,553 2,038,060
Total Revenues 311,408,100 306,459,799 295,987,635 287,352,240 282,386,525 278,970,292 273,848,712 265,964,179 257,970,411 258,033,414
ExpendituresCurrent:
General government 11,461,754 11,401,804 10,728,233 9,932,588 9,670,263 10,227,750 9,497,003 10,346,906 8,392,000 7,727,864 Public safety 87,822,776 86,151,898 82,402,327 80,899,232 78,150,559 77,395,466 76,404,816 72,975,293 69,125,309 70,172,182 Public works 15,673,496 16,300,942 14,574,335 15,555,096 15,267,760 15,525,053 14,824,224 15,636,714 14,445,497 13,625,913 Education 176,154,252 170,688,047 168,040,851 160,498,034 155,280,225 148,879,136 145,577,247 144,144,843 143,931,478 147,100,982 Parks and recreation 3,759,835 3,510,882 3,318,164 3,486,804 3,034,746 2,363,957 2,236,847 2,195,590 1,836,292 2,065,678 Public libraries 3,824,435 3,527,320 3,864,354 3,273,998 3,270,495 3,439,402 3,074,267 3,142,384 3,072,541 2,981,728 Senior services 3,297,648 3,103,654 3,045,115 2,908,045 3,119,557 3,084,039 2,872,279 2,911,362 2,754,871 2,780,245 Community development 1,428,317 1,347,154 1,144,284 1,724,439 1,487,068 1,659,368 1,908,299 1,467,564 1,560,098 1,981,805 Other 220,217 157,174 179,589 184,049 178,112 128,974 115,972 124,638 119,225 170,780
Capital outlay 17,379,624 13,695,602 10,211,687 12,091,531 4,455,146 6,069,584 4,196,151 2,268,257 5,063,077 4,853,492 Debt service:
Principal 7,694,000 7,344,000 7,035,000 7,020,000 7,355,000 6,815,000 5,530,000 6,360,000 6,440,000 5,860,000
Interest 4,075,898 3,100,352 2,857,393 3,445,373 3,348,140 3,635,359 3,319,837 4,064,249 4,263,972 4,286,465
Total Expenditures 332,792,252 320,328,829 307,401,332 301,019,189 284,617,071 279,223,088 269,556,942 265,637,800 261,004,360 263,607,134
Excess of Revenues Over Expenditures (21,384,152) (13,869,030) (11,413,697) (13,666,949) (2,230,546) (252,796) 4,291,770 326,379 (3,033,949) (5,573,720)
Other Financing Sources (Uses)
Issuance of debt 16,405,000 15,840,000 5,440,000 37,035,000 -- 10,210,000 -- 19,385,000 3,700,000 -- Bond premium 3,906,379 590,103 -- 2,573,150 -- 111,906 -- 1,066,929 91,420 -- Proceeds from leasing -- -- -- -- -- Transfers in 94,084,926 93,369,185 93,155,894 91,682,652 93,693,519 92,055,646 91,574,333 90,891,152 90,032,050 87,023,036 Repayment of debt to escrow agent -- -- -- (23,862,607) -- -- -- (16,788,678)
Transfers out (94,084,926) (93,369,185) (93,174,794) (91,700,541) (93,719,181) (93,793,055) (91,595,159) (90,914,969) (90,740,684) (87,023,036)
Net Other Financing Sources (Uses) 20,311,379 16,430,103 5,421,100 15,727,654 (25,662) 8,584,497 (20,826) 3,639,434 3,082,786 --
Net Change in Fund Balances (1,072,773)$ 2,561,073$ (5,992,597)$ 2,060,705$ (2,256,208)$ 8,331,701$ 4,270,944$ 3,965,813$ 48,837$ (5,573,720)$
Debt Service as a Percentage ofNoncapital Expenditures 3.8% 3.4% 3.3% 3.7% 3.8% 3.9% 3.4% 4.0% 4.2% 3.9%
(1) This schedule includes expenditures of the General Fund, Special Revenue Funds and Capital Project Funds.
TABLE 4
CHANGES IN FUND BALANCE, GOVERNMENTAL FUNDS
(UNAUDITED)LAST TEN FISCAL YEARS (1)
FISCAL YEAR
153

CITY OF CRANSTON, RHODE ISLAND
Direct Ratio of TotalYear Commercial Direct Tax Rate Direct Assessed to Tota
Ended Assessed Direct Assessed Direct Estimated Assessed Tax Rate Motor Tax Rate Estimated Assessed Estimated EstimatedJune 30, Value (1) Tax Rate Value Tax Rate Actual Value Value (1) Tangible Vehicle Inventory Actual Value Value (1) Actual Value Actual Value
2010 5,670,869,300$ 19 1,352,953,200$ 29 7,023,822,500$ 754,417,429$ 29 42 N/A 754,417,429$ 7,778,239,929$ 7,778,239,929$ 1.000
2011 5,696,562,900$ 20 1,363,784,200$ 29 7,060,347,100$ 781,306,230$ 29 42 N/A 781,306,230$ 7,841,653,330$ 7,841,653,330$ 1.000
2012 5,712,462,800$ 20 1,361,533,300$ 30 7,073,996,100$ 778,330,466$ 30 42 N/A 778,330,466$ 7,852,326,566$ 7,852,326,566$ 1.000
2013 4,857,922,900$ 23 1,333,042,700$ 34 6,190,965,600$ 788,030,196$ 34 42 N/A 788,030,196$ 6,978,995,796$ 6,978,995,796$ 1.000
2014 4,868,431,400$ 23 1,329,501,500$ 34 6,197,932,900$ 786,121,128$ 34 42 N/A 786,121,128$ 6,984,054,028$ 6,984,054,028$ 1.000
2015 4,882,850,900$ 23 1,310,585,835$ 34 6,193,436,735$ 834,519,001$ 34 42 N/A 834,519,001$ 7,027,955,736$ 7,027,955,736$ 1.000
2016 5,127,157,200$ 22 1,331,450,700$ 34 6,458,607,900$ 844,756,803$ 34 42 N/A 844,756,803$ 7,303,364,703$ 7,303,364,703$ 1.000
2017 5,141,214,200$ 22 1,336,494,580$ 34 6,477,708,780$ 880,194,812$ 34 42 N/A 880,194,812$ 7,357,903,592$ 7,357,903,592$ 1.000
2018 5,159,551,900$ 23 1,361,761,380$ 34 6,521,313,280$ 838,596,912$ 34 42 N/A 838,596,912$ 7,359,910,192$ 7,359,910,192$ 1.000
2019 6,000,994,700$ 20 1,479,702,000$ 30 7,480,696,700$ 828,242,120$ 30 42 N/A 828,242,120$ 8,308,938,820$ 8,308,938,820$ 1.000
(1) Gross amount is reflected without deduction for exemptions.
TABLE 5
ASSESSED AND ESTIMATED ACTUAL VALUE OF TAXABLE PROPERTYLAST TEN FISCAL YEARS (1)
TOTALREAL PROPERTY PERSONAL PROPERTY
(UNAUDITED)
154

CITY OF CRANSTON, RHODE ISLAND
Percentage PercentageNature of Assessed Net Taxable Assessed Net Taxable
Name Business Value Rank Grand List (1) Value Rank Grand List (2)
Carpionato Alfred Real Estate Management 127,547,414$ 1 1.54% 104,710,472$ 1 1.35%
Gateway Woodside Inc. Real Estate Management 101,966,860 3 1.23% 76,079,683 2 0.98%
Picerne Properties Real Estate Management 62,658,860 4 0.75% 65,472,408 3 0.84%
National Grid (formerly Narragansett Electric/Prov. Gas) Utility 121,457,848 2 1.46% 58,045,855 4 0.75%
Brewery Parkade Real Estate Management 35,670,866 5 0.43% 34,321,700 5 0.44%
SMC Terraces (formerly Cranston Addison) Real Estate Management 22,357,700 7 0.27%
Swarovski American Industrial Manufacturing 16,822,170 10 0.20%
Cox Communications Inc. Cable Communications 21,086,628 8 0.25% 18,344,399 8 0.24%
Independence Way Real Estate Management 19,686,500 9 0.24% 24,126,300 6 0.31%
Lowes Retail Hardware 0.00% 18,111,755 9 0.23%
Calvi Realty Co., Inc. Real Estate Management 0.00%
Tasca Auto Group Car Dealership 23,356,967 6 0.28% 0.00%
BFMIT II Cranston LLC Real Estate Management 20,865,600 7 0.27%
CRE IP LLC Real Estate Management 16,158,000 10 0.21%
TKG Cranston Development LLC Retail 0.00% -- 0.00%
TOTAL 552,611,813$ 6.65% 436,236,172$ 5.62%
Source: Town Assessor Department.
(1) Based on a net taxable Grand List of $8,308,938,820(2) Based on a net taxable Grand List of $7,778,239,929
2019 2010
TABLE 6
PRINCIPAL PROPERTY TAXPAYERSCURRENT YEAR AND NINE YEARS AGO(UNAUDITED)
GRAND LIST YEAR
155
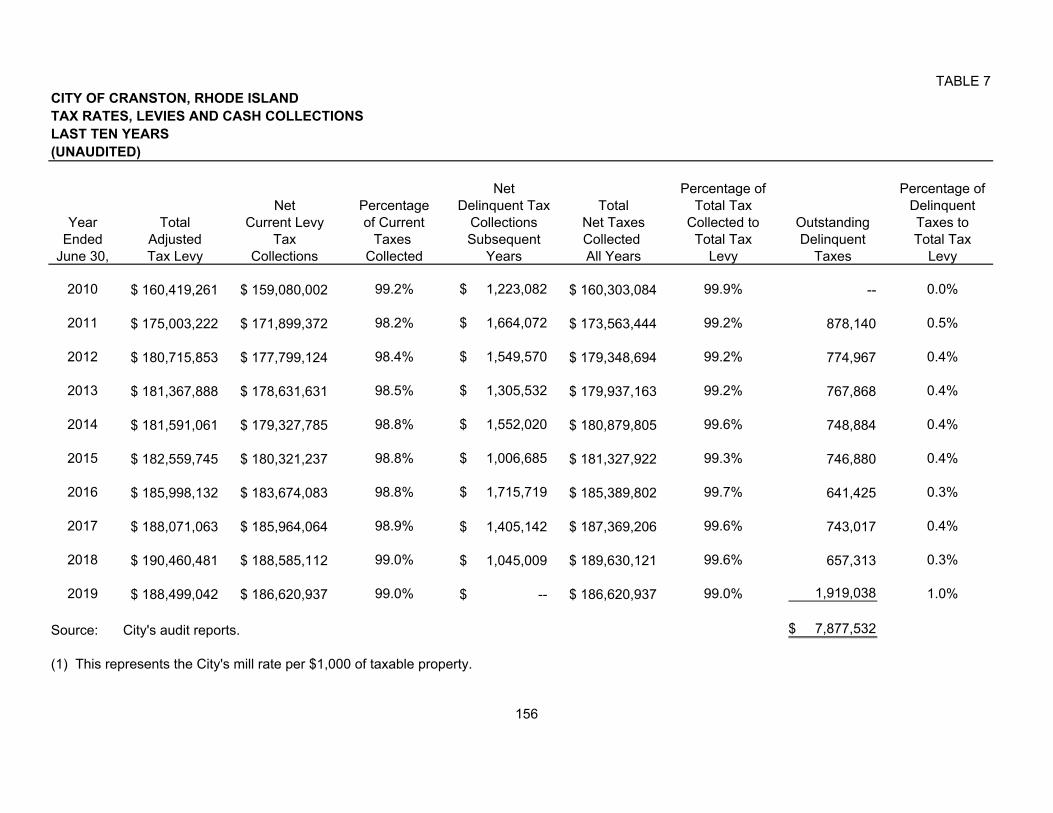
CITY OF CRANSTON, RHODE ISLAND
Net Percentage of Percentage ofNet Percentage Delinquent Tax Total Total Tax Delinquent
Year Total Current Levy of Current Collections Net Taxes Collected to Outstanding Taxes toEnded Adjusted Tax Taxes Subsequent Collected Total Tax Delinquent Total Tax
June 30, Tax Levy Collections Collected Years All Years Levy Taxes Levy
2010 160,419,261$ 159,080,002$ 99.2% 1,223,082$ 160,303,084$ 99.9% -- 0.0%
2011 175,003,222$ 171,899,372$ 98.2% 1,664,072$ 173,563,444$ 99.2% 878,140 0.5%
2012 180,715,853$ 177,799,124$ 98.4% 1,549,570$ 179,348,694$ 99.2% 774,967 0.4%
2013 181,367,888$ 178,631,631$ 98.5% 1,305,532$ 179,937,163$ 99.2% 767,868 0.4%
2014 181,591,061$ 179,327,785$ 98.8% 1,552,020$ 180,879,805$ 99.6% 748,884 0.4%
2015 182,559,745$ 180,321,237$ 98.8% 1,006,685$ 181,327,922$ 99.3% 746,880 0.4%
2016 185,998,132$ 183,674,083$ 98.8% 1,715,719$ 185,389,802$ 99.7% 641,425 0.3%
2017 188,071,063$ 185,964,064$ 98.9% 1,405,142$ 187,369,206$ 99.6% 743,017 0.4%
2018 190,460,481$ 188,585,112$ 99.0% 1,045,009$ 189,630,121$ 99.6% 657,313 0.3%
2019 188,499,042$ 186,620,937$ 99.0% --$ 186,620,937$ 99.0% 1,919,038 1.0%
Source: City's audit reports. 7,877,532$
(1) This represents the City's mill rate per $1,000 of taxable property.
(UNAUDITED)
TABLE 7
TAX RATES, LEVIES AND CASH COLLECTIONSLAST TEN YEARS
156

CITY OF CRANSTON, RHODE ISLAND
TOTAL
Year General Certificates Certificates RI Percentage DebtEnded Obligation Bond Capital of Bond of Infrastructure of Personal Per
June 30, Bonds Premiums Leases Participation Total Premiums Participation Notes Total Total Income Capita
2010 84,585,000$ 2,661,842$ --$ 2,510,000$ 89,756,842$ --$ 2,510,000$ 8,467,917$ 10,977,917$ 100,734,759$ N/A 1,253
2011 82,630,000$ 2,568,449$ --$ 1,725,000$ 86,923,449$ --$ 1,725,000$ 7,510,841$ 9,235,841$ 96,159,290$ N/A 1,195
2012 80,515,000$ 3,459,476$ --$ 1,400,000$ 85,374,476$ 11,199$ 1,400,000$ 6,515,386$ 7,926,585$ 93,301,061$ N/A 1,158
2013 74,320,000$ 3,178,199$ --$ 1,065,000$ 78,563,199$ 7,466$ 1,065,000$ 5,952,516$ 7,024,982$ 85,588,181$ N/A 1,061
2014 78,060,000$ 3,048,679$ --$ 720,000$ 81,828,679$ 3,733$ 720,000$ 23,387,188$ 24,110,921$ 105,939,600$ N/A 1,313
2015 71,060,000$ 2,758,348$ --$ 365,000$ 74,183,348$ --$ 365,000$ 22,818,364$ 23,183,364$ 97,366,712$ N/A 1,207
2016 78,270,000$ 3,451,770$ --$ --$ 81,721,770$ --$ --$ 21,525,000$ 21,525,000$ 103,246,770$ N/A 1,275
2017 73,475,000$ 3,076,397$ 3,200,000$ --$ 79,751,397$ --$ --$ 20,463,267$ 20,463,267$ 100,214,664$ N/A 1,237
2018 71,131,000$ 3,158,949$ 2,780,000$ --$ 77,069,949$ --$ --$ 19,353,000$ 19,353,000$ 96,422,949$ N/A 1,190
2019 89,943,000$ 6,470,534$ 2,340,000$ --$ 98,753,534$ --$ --$ 18,253,000$ 18,253,000$ 117,006,534$ N/A 1,440
NOTE: Details regarding the City's outstanding debt can be found in the notes to the financial statements.
GOVERNMENTAL ACTIVITIES BUSINESS-TYPE ACTIVITIES
TABLE 8
RATIOS OF OUTSTANDING DEBT BY TYPE LAST TEN YEARS(UNAUDITED)
157

CITY OF CRANSTON, RHODE ISLAND
Percentage ofYear General Actual Taxable Debt
Ended Obligation Value of PerJune 30, Bonds Total Property Capita
2010 84,585,000$ 84,585,000$ 1.09% 1,052
2011 82,630,000$ 82,630,000$ 1.05% 1,027
2012 80,515,000$ 80,515,000$ 1.03% 999
2013 74,320,000$ 74,320,000$ 1.06% 921
2014 78,060,000$ 78,060,000$ 1.12% 967
2015 71,060,000$ 71,060,000$ 1.01% 878
2016 78,270,000$ 78,270,000$ 1.07% 966
2017 73,475,000$ 73,475,000$ 1.00% 907
2018 71,131,000$ 71,131,000$ 0.97% 876
2019 89,943,000$ 89,943,000$ 1.08% 1,107
NOTE: Details regarding the City's outstanding debt can be found in the notes to the financial statem
General Debt Outstanding
TABLE 9
RATIOS OF GENERAL DEBT OUTSTANDINGLAST TEN YEARS(UNAUDITED)
158

CITY OF CRANSTON, RHODE ISLAND
Assessed value 8,308,938,820$
Less exemptions (336,429,202)
Net Total Taxable Assessed Value 7,972,509,618$
Debt limit - 3 percent of total assessed value 239,175,289$
Amount of debt applicable to debt limit:
Total bonded debt --
Legal Debt Margin 239,175,289$
Note:
TABLE 10
COMPUTATION OF LEGAL DEBT MARGINJUNE 30, 2019(UNAUDITED)
The City has no debt issues outstanding under the Maximum AggregateIndebtedness provision (3% Debt Limit) - Rhode Island General Law 45-12-2.All other City debt has been incurred through special statutory authority whichconsists of approval by the legislature and voter referendum.
The State Legislature may by special act permit the City to incur indebtednessin excess of the three percent (3%) limit in accordance with Rhode Island GeneralLaw 45-12-11. The City of Cranston has never requested authorization under theAuthority for the issuance of Indebtedness Excess - Rhode Island General Law45-12-11.
159

CITY OF CRANSTON, RHODE ISLAND
Year Net Debt LegalEnded Debt Applicable Debt
June 30, Limit to Limit Margin
2010 219,211,804$ --$ 219,211,804$
2011 227,144,751$ --$ 227,144,751$
2012 227,602,133$ --$ 227,602,133$
2013 202,307,525$ --$ 202,307,525$
2014 202,495,272$ --$ 202,495,272$
2015 203,692,047$ --$ 203,692,047$
2016 211,558,045$ --$ 211,558,045$
2017 213,378,825$ --$ 213,378,825$
2018 212,782,442$ --$ 212,782,442$
2019 239,175,289$ --$ 239,175,289$
TABLE 11
LEGAL DEBT MARGIN INFORMATIONLAST TEN YEARS
160

CITY OF CRANSTON, RHODE ISLAND
EducationYear (4) (1) (1) of Schooling (2) (3)
Ended (1) Median Per Capita Median Level in Years- School UnemploymentJune 30, Population Income Income Age Bachelors Degree Enrollment Percentage
2010 80,387 N/A 21,978$ 39 N/A 10,744 11.7%
2011 80,450 N/A 25,653$ 39 N/A 10,735 10.6%
2012 80,571 N/A 28,496$ 39 N/A 10,685 10.4%
2013 80,701 64,282 28,496$ 39 N/A 10,559 9.3%
2014 80,696 64,282 29,218$ 41 N/A 10,374 7.3%
2015 80,972 64,282 29,218$ 41 N/A 10,271 6.0%
2016 81,014 64,282 29,878$ 40 N/A 10,443 5.1%
2017 81,034 64,282 30,553$ 41 N/A 10,417 4.1%
2018 81,202 64,282 30,553$ 41 N/A 10,365 3.7%
2019 81,274 64,282 31,607$ 41 31.40% 10,324 3.3%
(1) Figures obtained from the Rhode Island Census Data Center derived from the 2006, 2010 and estimated 2017 census data.
(2) Cranston School Department
(3) Rhode Island Department of Labor and Training (as of June 30th).
(4) US Census Bureau
TABLE 12
DEMOGRAPHIC STATISTICSLAST TEN YEARS(UNAUDITED)
161

CITY OF CRANSTON, RHODE ISLAND
Percentage Percentageof Total City of Total City
Employer Employees Rank Employment (1) Employees Rank Employment (2)
State of Rhode Island 5,500 1 14.01% 5,500 1 14.56%
City of Cranston 2,526 2 6.43% 2,173 2 5.75%
Citizens Bank 0.00% 1,601 3 4.24%
Tasca Motor Group 300 9 0.76%
Walmart 310 8 0.79%
Taco, Inc. 376 7 0.96% 380 5 1.01%
CranstonARC 400 6 1.02% 400 4 1.06%
Thielsch Engineering 427 4 1.09% 350 6 0.93%
Swarovski Consumer Goods Ltd. 254 0.65% 300 9 0.79%
The Stop & Shop Co., Inc. 445 3 1.13% 280 10 0.74%
Honeywell Safety Products 300 10 300 7 0.79%
U.S. Security Associates 300 300 8 0.79%
Access Point RI 402 5
The Cedars 260
Total 11,800 26.84% 11,584 30.66%
SOURCE: State Department of Labor(1) Based on 6/30/19 total City employment of 39,268(2) Based on 6/30/10 total City employment of 37,767
2010
TABLE 13
PRINCIPAL EMPLOYERSCURRENT YEAR AND NINE YEARS AGO(UNAUDITED)
2019
162

CITY OF CRANSTON, RHODE ISLAND
Function/Program 2019 2018 2017 2016 2015 2014 2013 2012 2011 2010
General Government Mayor……………………………………… 6 6 6 6 6 6 5 5 5 5Department of Personnel………………… 2 2 0 0 0 1 0 1 1 2City Clerk…………………………………… 6 6 6 6 6 6 6 6 6 8Municipal Court…………………………… 2 2 2 2 3 3 3 3 2 3Board of Canvassers……………………… 3 3 3 3 3 3 3 3 3 3City Planning ……………………………… 4 4 4 4 4 4 4 4 4 5Economic Development…………………… 2 2 2 2 2 2 2 2 2 2Finance …………………………………… 3 3 3 3 3 3 3 2 2 3Division of Accounting & Control ………… 5 5 5 5 5 5 5 5 5 5Division of Assessment …………………… 6 6 6 6 6 6 6 6 6 7Division of Contracts & Purchasing ……… 2 2 2 2 2 2 2 3 3 4Information Technology…………………… 6 6 6 6 6 6 6 6 6 8Division of Treasury & Collection ……… 7 7 6 6 6 7 6 6 6 6
Police
Officers……………………………………… 153 153 153 153 151 152 150 143 140 153Civilians…………………………………… 27 27 27 26 26 26 25 25 25 26Animal Control……………………………… 4 4 4 4 4 4 4 4 4 5
Fire Chief ………………………………………… 1 1 1 1 1 1 1 1 1 1Uniformed…………………………………… 194 194 194 194 193 197 178 178 181 200Civilians…………………………………… 15 15 15 15 15 16 16 16 16 7
Inspections……………………..…………… 11 11 11 10 12 12 11 12 12 14
Public Works Administration……………………………… 3 3 3 3 4 3 3 3 3 4Engineering………………………………… 4 4 4 4 4 4 4 4 4 4Highway…………………………………… 40 40 39 39 38 39 39 38 38 41Building……………………………………… 23 23 23 23 23 24 24 24 24 26Fleet Management………………………… 10 10 10 10 10 10 10 10 10 10Refuse Removal…………………………… 1 1 1 1 1 0 0 0 0 0Traffic Safety……………………………… 1 1 1 1 0 1 1 3 3 4
Parks and Recreation…..………………… 21 21 20 20 20 20 20 20 19 20
Public Libraries…………...………………… 32 32 32 32 32 32 31 32 30 32
Senior Services…………………..………… 25 25 24 24 24 22 23 23 23 30
Community Development…..……………… 3 3 3 3 3 3 3 3 3 4
Other………………………………………… 9 9 9 9 8 8 8 8 8 8
Education…………………………………… 1,530 1,534 1,527 1,462 1,442 1,437 1,431 1,461 1,528 1,523
Total…………………………………………… 2,161 2,165 2,152 2,085 2,063 2,065 2,033 2,060 2,123 2,173
SOURCE: City Budget
Fiscal Year Ended June 30
(UNAUDITED)
TABLE 14
FULL-TIME EQUIVALENT EMPLOYEES BY FUNCTION/PROGRAMLAST TEN YEARS
163

2019 2018 2017 2016 2015 2014 2013 2012 2011 2010Function/Program
Governmental Activities
Public SafetyFire:
Total incidents………………………………………………… 16,629 15,572 15,311 14,203 7,497 12,614 6,859 14,717 14,407 15,111 Rescue/medical calls………………………………………… 10,712 10,247 10,048 9,349 5,466 8,438 5,116 11,327 10,067 9,976 Rescue/non-medical calls…………………………………… 5,917 5,325 5,263 4,854 2,031 4,176 1,743 3,390 4,340 5,135 Fire hydrants………………………………………………… 1,947 1,923 1,923 1,923 1,923 1,923 1,922 1,922 1,922 1,922
Police:Number of calls……………………………………………… 91,258 83,970 81,239 78,896 65,422 66,243 67,937 66,542 66,030 68,620 Total 911 calls received……………………………………… 4,832 6,112 8,864 5,646 5,120 5,327 5,227 5,105 4,786 5,156 Formal investigations………………………………………… 22,949 22,128 23,312 20,039 17,075 16,097 15,150 14,706 14,923 15,920
City ClerkNumber of documents recorded……………………………… 13,690 15,226 15,267 15,036 14,513 15,036 16,381 14,529 14,793 15,683
Health and WelfareNumber of food service facilities inspections……………… N/A N/A N/A N/A N/A N/A N/A N/A N/A N/ANew homes built………………………………………………… 40 33 49 64 20 41 37 26 34 52
Land Use
Total subdivisions approved…………………………………… N/A N/A N/A N/A N/A N/A N/A N/A N/A N/ATotal commercial applications approved…………………… N/A N/A N/A N/A N/A N/A N/A N/A N/A N/A
Building Permits………………………………………………… 1,871 1,890 1,747 1,864 26 48 41 28 39 58
Public WorksHighway department:
Streets (miles): Paved City roads…………………………………………… 318 318 318 318 318 318 318 318 318 318 Paved State roads………………………………………… 69 69 69 69 69 69 69 69 69 69 Private roads………………………………………………… 6 6 6 6 6 6 6 6 6 6 Roads under construction (maintained
by City …………………………………………………… N/A N/A N/A N/A N/A N/A N/A N/A N/A N/ASidewalks (miles) …………………………………………… 64 64 64 64 64 64 64 64 64 64
EducationEnrollment:
High School Grades 9-12………………………………… 3,295 3,319 3,356 3,279 3,213 3,223 3,303 3,504 3,580 3,551 Middle School Grades 6-8………………………………… 2,470 2,478 2,467 1,695 1,661 1,486 1,637 1,482 1,579 1,637 Elementary Schools Grades K-5…………………………… 4,559 4,568 4,594 5,469 5,397 5,665 5,619 5,699 5,576 5,556
10,324 10,365 10,417 10,443 10,271 10,374 10,559 10,685 10,735 10,744
Business-Type Activities
SOURCES: Various City Departments
(1) Information not available due to the construction and consolidation of schools and related grade levels.
N/A - Information not available
Fiscal Year Ended June 30
TABLE 15
LAST TEN YEARS(UNAUDITED)
OPERATING INDICATORS BY FUNCTION/ PROGRAMCITY OF CRANSTON, RHODE ISLAND
164

CITY OF CRANSTON, RHODE ISLAND
Function/Program 2019 2018 2017 2016 2015 2014 2013 2012 2011 2010
Governmental Activities
Parks and RecreationAcreage (includes all open space)Parks and Public Squares……………………… 11 11 11 11 11 11 11 11 11 11 Marinas…………………………………………… 3 3 3 3 3 3 3 3 3 3 Playgrounds……………………………………… 35 35 36 36 35 35 35 35 35 35 Walking tracks……...…………………………… 8 8 8 8 8 8 8 8 8 8 Basketball courts……………………………… 21 21 21 21 21 21 21 21 21 21 Tennis courts…………………………………… 24 24 24 24 24 24 24 24 24 24 Baseball fields…………………………………… 28 28 28 28 27 27 27 27 27 27 Softball fields…………………………………… 12 12 11 11 11 11 11 11 11 11 Other fields……………………………………… 22 22 22 22 22 22 22 22 22 22 Ice Rink………………………………………… 2 2 2 2 2 2 2 2 2 2 Swimming Pool………………………………… 1 1 1 1 1 1 1 1 1 1 Stadium and Field House……………………… 1 1 1 1 1 1 1 1 1 1
Public Safety Fire Stations……………………………………… 6 6 6 6 6 6 6 6 6 6
Fire alarm boxes…………………..………… 37 47 47 120 149 149 149 149 149 149 Fire hydrants…………………..……………… 1,945 1,923 1,923 1,923 1,923 1,923 1,922 1,922 1,922 1,921
Police department: Stations………………………………………… 4 4 3 3 3 3 4 4 4 4 Animal Control Building……………………… 1 1 1 1 1 1 1 1 1 1
Public WorksHighway department:
Streets (miles)………………………………… 324 324 324 324 324 324 324 315 315 315 Sidewalks (miles)…………………………… 64 64 64 64 64 64 64 64 64 64
Public LibrariesNumber of branches…………………………… 6 6 6 6 6 6 6 6 6 6
EducationNumber of High Schools……………………… 2 2 2 2 2 2 2 2 2 2 Number of Middle Schools…………………… 4 4 4 3 3 3 3 3 3 3 Number of Elementary Schools……………… 16 16 16 17 17 17 17 17 17 17 Number of Charter Schools…………………… 1 1 1 1 1 1 1 1 1 1 Number of Adult Education Buildings………… 1 1 1 1 1 1 1 1 1 1
Senior Services
Senior Citizens Center………………………… 1 1 1 1 1 1 1 1 1 1
Community Development Number of loans issued………………………… 18 22 34 24 28 23 27 30 41 53
Business-Type Activities
Sewer FundSewer mains (miles)…………………………… 263 263 263 263 263 263 263 250 250 250 Treatment capacity (thousands of gallons)…. 20,200 20,200 20,200 20,200 20,200 20,200 20,200 20,200 20,200 20,200 Sewerage Disposal Plant……………………… 1 1 1 1 1 1 1 1 1 1 Pumping Stations………...…………………… 22 22 22 22 22 22 22 22 22 22
SOURCES: Various City Departments
N/A - Information not available
Fiscal Year Ended June 30
TABLE 16
CAPITAL ASSET STATISTICS BY FUNCTION/PROGRAMLAST TEN YEARS(UNAUDITED)
165