city of cornwall operating and capital budget 2007 (excluding water and waste water budgets) january...
TRANSCRIPT
City of CornwallCity of Cornwall
Operating and Capital Budget Operating and Capital Budget 20072007
(Excluding water and waste water budgets)(Excluding water and waste water budgets)
January 22nd, 2007

2007 Operating and Capital 2007 Operating and Capital BudgetBudget2007 2006
B udget B udget
Operating Revenues 129,193,808 133,725,494
W ages & benefits (41,165,276) (39,892,884)
P urchases of goods (7,326,866) (7,017,708)
S ervices and rents (16,164,312) (18,656,948)
F inanc ial (55,559,841) (55,669,778)
P olice (14,495,000) (13,542,454)
Corporate cos ts 1,176,395 1,054,278
Net E xpenditures (4,341,092) 0
The operating and capital budgets are The operating and capital budgets are considered the same budget as all considered the same budget as all expenditures are financed from the expenditures are financed from the same source of revenue (tax base)same source of revenue (tax base)
Council will be asked to review and Council will be asked to review and reconsider the “no debt” policy reconsider the “no debt” policy

Major Revenue SourcesMajor Revenue Sources
MCSS $21,427,825M of H 8,745,479MMAH 3,460,420SD&G 11,576,547Tipping Fees 1,341,900Residents 2,348,000Gas Tax 1,246,469Investment Income 1,342,500Taxes 49,217,002Payments in lieu 1,392,335
$102,098,477
Major changes include a reduction in MCFCS revenues by ($1.5M) and best start revenues of ($2.1M), the related expenditure has been reduced by asimilar amount

The tax levy represents the main revenue The tax levy represents the main revenue source (38%) of the 2007 budget.source (38%) of the 2007 budget.
The tax levy is based on the assessment as The tax levy is based on the assessment as provided by MPAC multiplied by the provided by MPAC multiplied by the approved tax rate.approved tax rate.
The 2007 budget is based on the assessment The 2007 budget is based on the assessment @ the tax rate approved in 2006@ the tax rate approved in 2006
Essentially, the tax levy is the net revenue Essentially, the tax levy is the net revenue requirement based on approved requirement based on approved expenditures less known and expected expenditures less known and expected revenuesrevenues

A pproved expenditures 250,000 K nown and es tim ated revenues 150,000 Tax Levy 100,000
A ssessm ent 1,275,000Tax Rate 0.078431
A ssessm ent * tax rate = Tax levy
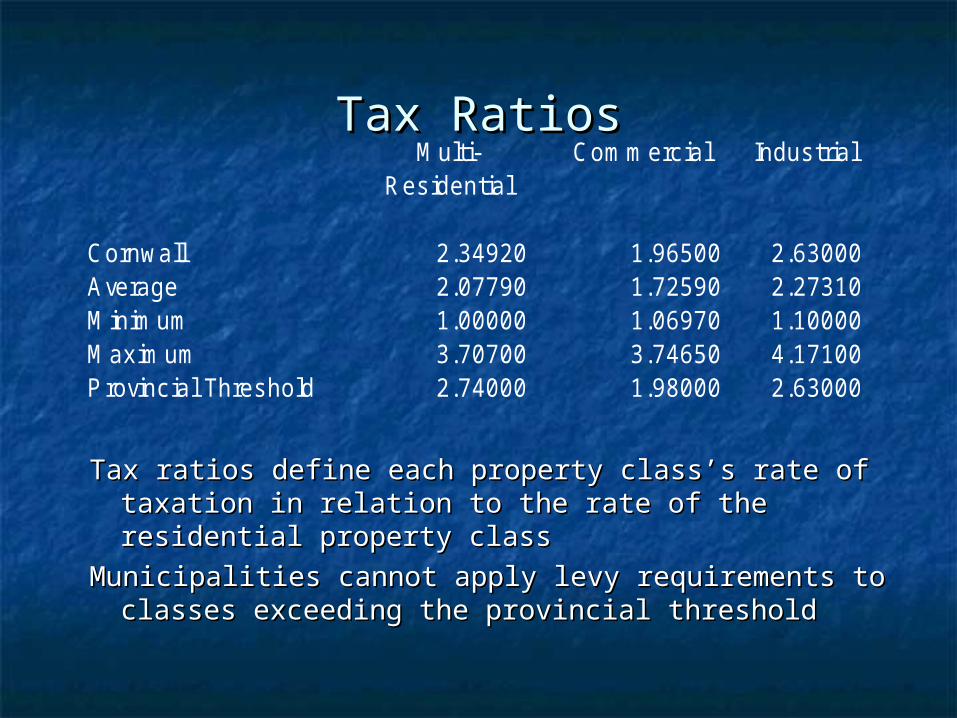
Tax RatiosTax RatiosM ulti- Com m erc ial Indus trial
Res idential
Cornwall 2.34920 1.96500 2.63000A verage 2.07790 1.72590 2.27310M inim um 1.00000 1.06970 1.10000M ax im um 3.70700 3.74650 4.17100P rovinc ial Threshold 2.74000 1.98000 2.63000
Tax ratios define each property class’s rate of Tax ratios define each property class’s rate of taxation in relation to the rate of the residential taxation in relation to the rate of the residential property classproperty class
Municipalities cannot apply levy requirements to Municipalities cannot apply levy requirements to classes exceeding the provincial thresholdclasses exceeding the provincial threshold

Year over year assessment Year over year assessment growthgrowth
Com m erc ial 423,582,003 431,986,315 8,404,312 1.98%Indus trial 79,917,222 78,508,800 -1,408,422 -1.76%M ulti-res idential 121,237,165 121,687,665 450,500 0.37%Res idential 1,539,657,290 1,552,097,699 12,440,409 0.81%
2,164,393,680 2,184,280,479 19,886,799
2006 2007

In the summer of 2006, the Province and MPAC In the summer of 2006, the Province and MPAC agreed to freeze assessment until 2009.agreed to freeze assessment until 2009.
Property values will remain the same unless Property values will remain the same unless major alterations made to the property major alterations made to the property (supplemental)(supplemental)
In 2006 the changes to current value In 2006 the changes to current value assessment (CVA) provided additional tax assessment (CVA) provided additional tax levy allowing for a reduction in the tax rate levy allowing for a reduction in the tax rate (CVA growth of 5.9% and new growth of .9% allowed for a tax (CVA growth of 5.9% and new growth of .9% allowed for a tax rate reduction of 3.4%)rate reduction of 3.4%)
The “net new growth” as represented by the The “net new growth” as represented by the growth of $20M results in $441,054 in new growth of $20M results in $441,054 in new tax levy at 2006 rates.tax levy at 2006 rates.
0
20,000
40,000
60,000
80,000
100,000
120,000
140,000
160,000
180,000
200,000
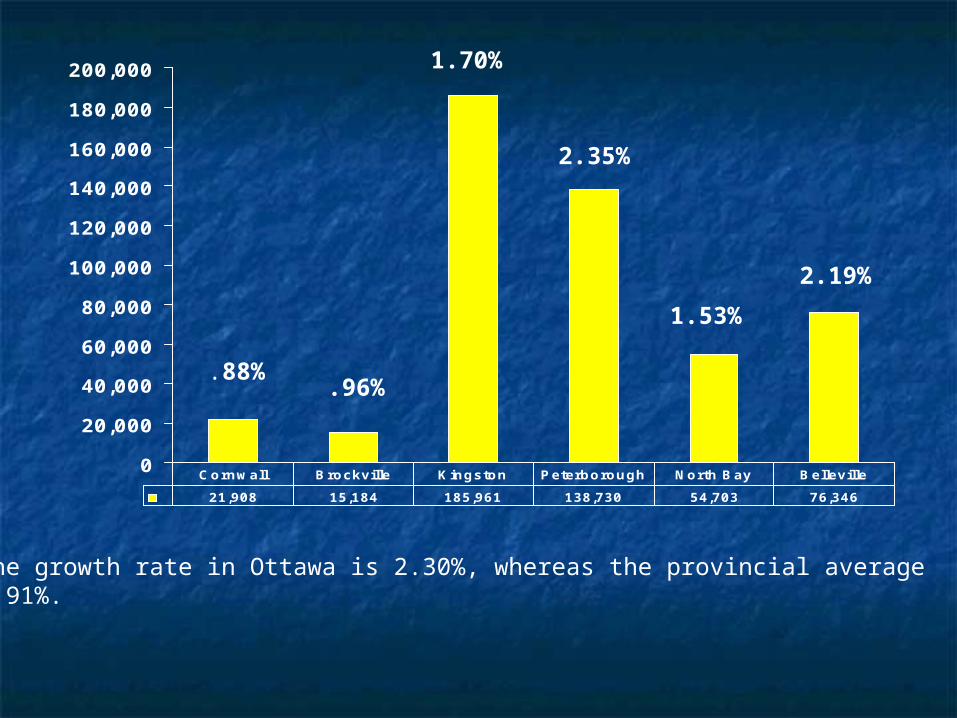
21,908 15,184 185,961 138,730 54,703 76,346
C ornw all B rockville K ingston P eterborough N orth B ay B elleville
.88%
2.19%
.96%
1.70%
2.35%
1.53%
The growth rate in Ottawa is 2.30%, whereas the provincial average 1.91%.

The new growth as identified at .88% The new growth as identified at .88% represents a tax levy increase of represents a tax levy increase of $441,054. $441,054. (new assessment@ 2006 tax rate)(new assessment@ 2006 tax rate)
We are also anticipating supplemental We are also anticipating supplemental taxation of $360,000taxation of $360,000
This can be compared to the general This can be compared to the general increase required for salaries and wages of increase required for salaries and wages of $ 794,000. $ 794,000. (excluding Police and funding from (excluding Police and funding from The Province and SD&G for shared services)The Province and SD&G for shared services)
The budget does not include any additional The budget does not include any additional employees employees
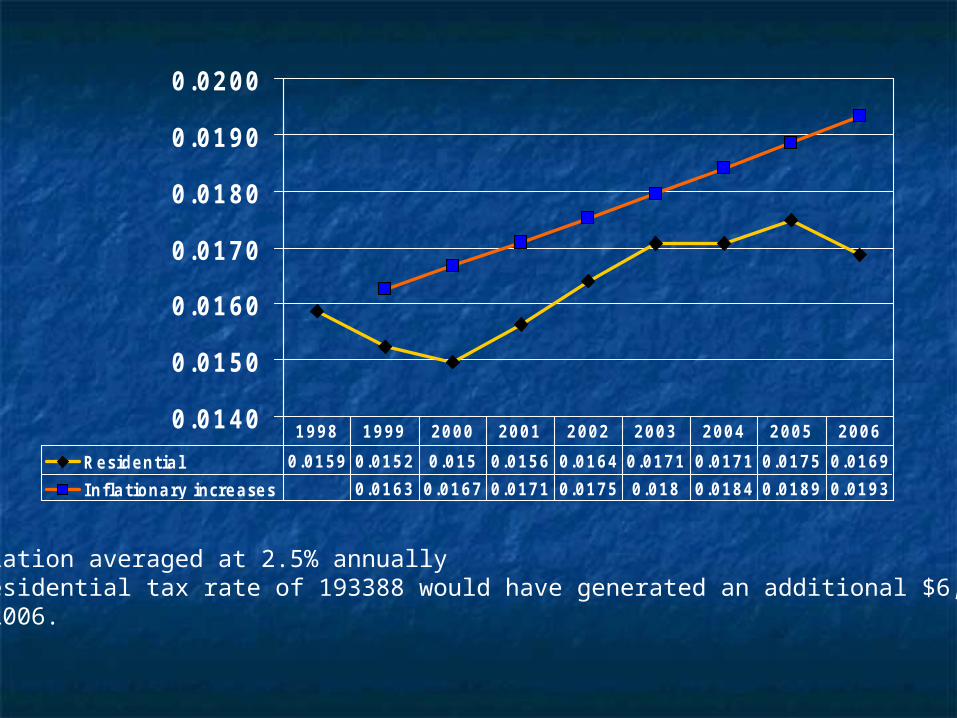
0.0140
0.0150
0.0160
0.0170
0.0180
0.0190
0.0200
Residential 0.0159 0.0152 0.015 0.0156 0.0164 0.0171 0.0171 0.0175 0.0169
Inflationary increases 0.0163 0.0167 0.0171 0.0175 0.018 0.0184 0.0189 0.0193
1998 1999 2000 2001 2002 2003 2004 2005 2006
Inflation averaged at 2.5% annuallyA residential tax rate of 193388 would have generated an additional $6,940M In 2006.

$100,000 prope rty 2006 2007 200748,415,948 52,757,040 49,626,346
Re side ntia l 1,688.03 1,822.78 1,714.61 M ulti-re side ntia l 3,965.52 4,282.07 4,027.97 Com m e rcia l 3,316.98 3,581.76 3,369.21 Industria l 4,439.52 4,793.91 4,509.43
Taxes in 2006 compared to taxes required to balance 2007budget (7.98% tax rate increase) and an inflation adjusted levy increase of 2.5% (1.57% tax rate increase)

Total expenditures of $134,326,290Total expenditures of $134,326,290
Regulated , $87,821,205
Discretionary, $10,018,835
M andatory, $36,486,250
Much of what the City is required to Much of what the City is required to spend is either mandatory or spend is either mandatory or regulated providing council very regulated providing council very little flexibility in determining little flexibility in determining affordable spending levels affordable spending levels (73:27)(73:27)
City council has little if any control City council has little if any control over spending in the following over spending in the following areas:areas:
PolicingPolicing FireFire Social ServicesSocial Services Social HousingSocial Housing Land AmbulanceLand Ambulance Glen Stor Dun Lodge…Glen Stor Dun Lodge…
The City is also mandated to have The City is also mandated to have certain positions and functions, certain positions and functions, Including a clerk, a treasurer, and Including a clerk, a treasurer, and a chief building officiala chief building official

Salaries and wagesSalaries and wages(excludes Police)(excludes Police)
2006 2007S alaries 31,853,208 32,791,577 B enefits 8,039,676 8,373,699
39,892,884 41,165,276
Overall wage and benefit Overall wage and benefit increase is approximately increase is approximately 3.1% 3.1%
Contractual agreements Contractual agreements with unions establish pay with unions establish pay increase of 2.5%increase of 2.5%
Step increases account for Step increases account for additional increments.additional increments.
No new staffNo new staff Staff complement of:Staff complement of:
545 Full Time545 Full Time 130 FTE’s130 FTE’s
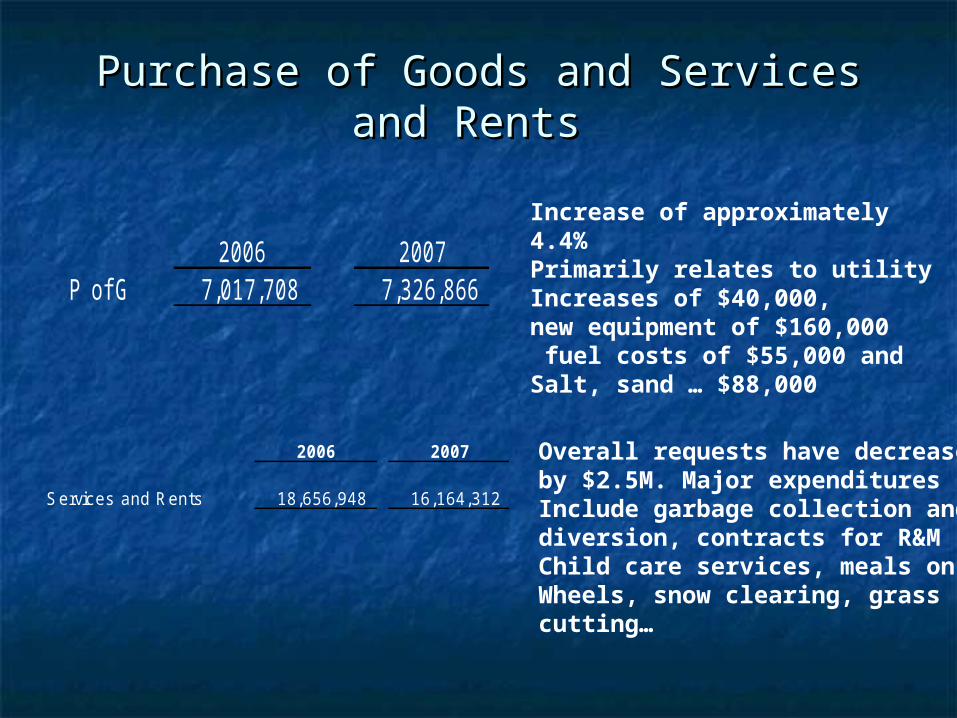
Purchase of Goods and Services and Purchase of Goods and Services and Rents Rents
2006 2007P of G 7,017,708 7,326,866
Increase of approximately4.4%Primarily relates to utilityIncreases of $40,000,new equipment of $160,000 fuel costs of $55,000 andSalt, sand … $88,000
2006 2007
S ervices and Rents 18,656,948 16,164,312
Overall requests have decreasedby $2.5M. Major expendituresInclude garbage collection anddiversion, contracts for R&MChild care services, meals onWheels, snow clearing, grass cutting…

Financial ExpendituresFinancial Expenditures
2006 2007
Financ ial 55,669,778 55,559,841
Expenditures include transfersto Social service recipients ($33M)Contribution to reserves and capital($6M), transfers to housing providers($8.4M) and transfers to Outside Agencies ($3.5M)
The Police Budget is still in draft and is an estimate at this time.The Police Services Board is presently reviewing the budget.Specific documents and the accompanying reports will be submitted at a later date.
Comparative Expenditure Comparative Expenditure GroupingsGroupings
The financial statements provide analysis of The financial statements provide analysis of expenditures based on functional groupingsexpenditures based on functional groupings
The following slides present the 2007 budget The following slides present the 2007 budget requests on a net expenditure basis along with requests on a net expenditure basis along with the 2006 approved budgetsthe 2006 approved budgets

2007 2006
General Governm ent M ayor and Counc il 337,729$ 322,957$ CA O 269,567 266,141 Clerk 667,834 582,814 Hum an Resources 1,200,949 1,140,818 F inance 4,734,770 6,329,903
7,210,849$ 8,642,633$
Overall expenses have decreased primarily due to the reduction inThe cost of servicing debt in 2007 relative to 2006 ($1,824,739)

2007 2006P rotec tion to P roperty and P ersons
Fire 6,333,983$ 6,262,046$ E m ergency M anagem ent S ervices 1,287,073 1,492,353 P olice 14,495,390 13,541,460
22,116,446$ 21,295,859$
The Ministry of Health has increased the level of funding for Land Ambulanceresulting in reductions to the City and County taxpayer.Funding, prior to downloading was shared 50:50.

2007 2006
M unic ipal W ork s and S ervices 6,355,764$ 5,668,356$ Roads , winter c ontrol, traffic… 4,435,732 4,261,765
10,791,496$ 9,930,121$
Capital requests including paving, roof replacements… have resultedIn an addition to capital of $544,000

2007 2006
Trans it 2,590,816 2,565,376
Although total budgeted expenditures are expected to increase by $231,460., it is expected that revenues will increase by $206,020

The large increase is due primarily to the requested increase for capital projects
l
2007 2006E ngineering, E nvironm ental &Cons truc tion S ervices 4,013,058$ 3,229,801$ S olid W as te 2,997,666 2,907,123
7,010,724$ 6,136,924$

2007 2006
S oc ial S upport S ervices 42,983,355 44,897,251
Taxpay er requirem ent 7,332,933 6,379,052
The budgeted increase for Ontario Disability Support Program, cost shared with the province is expected to add $.778M in costs to the taxpayer.The increase in Ontario works is expected to add $.308M

2007 2006
Glen S tor Dun Lodge 9,138,522$ 9,142,359$
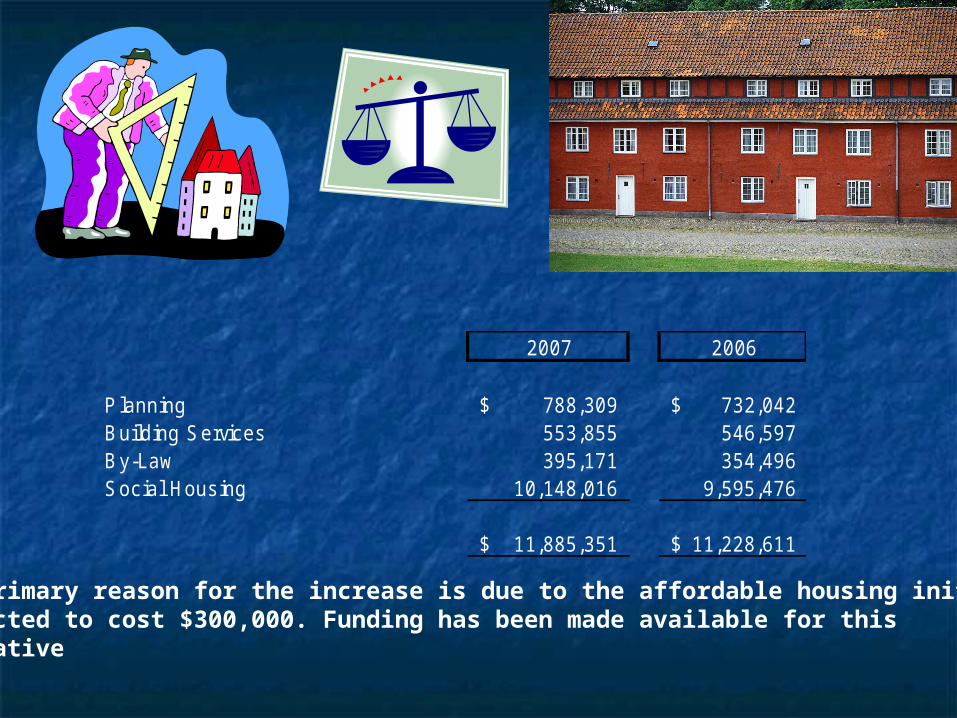
2007 2006
P lanning 788,309$ 732,042$ B uilding S ervices 553,855 546,597 B y -Law 395,171 354,496 S oc ial Hous ing 10,148,016 9,595,476
11,885,351$ 11,228,611$
The primary reason for the increase is due to the affordable housing initiativeProjected to cost $300,000. Funding has been made available for thisInitiative

2007 2006
E conom ic Developm ent 579,282$ 647,406$ Rec reation 7,128,235 8,326,964
7,707,517$ 8,974,370$
A major capital project was budgeted in 2006 for repairs to the Complex.
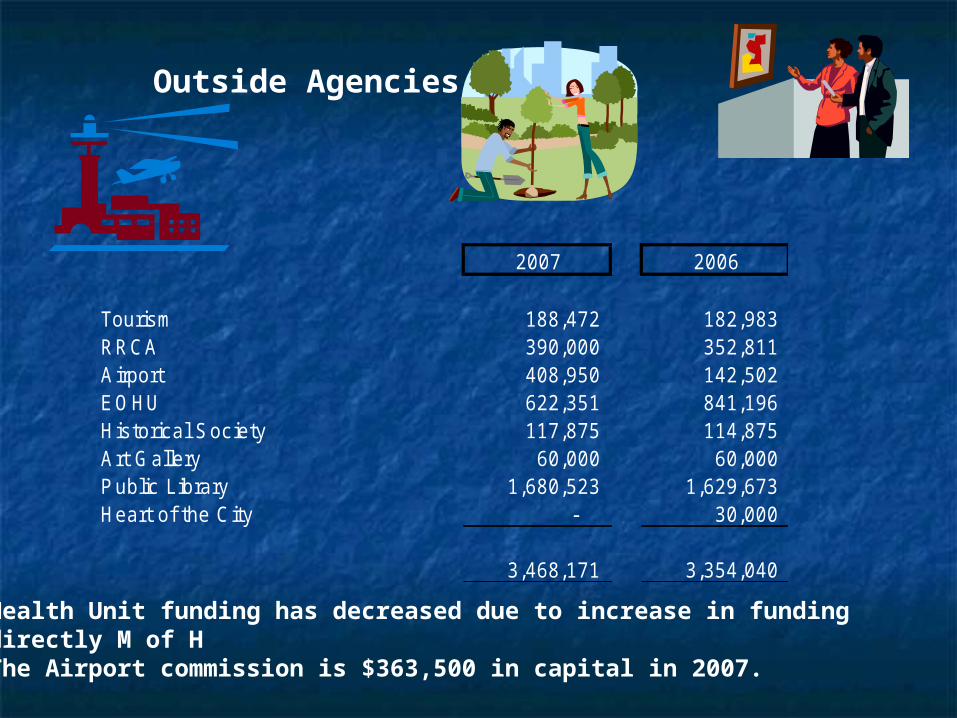
2007 2006 Tourism 188,472 182,983 RRCA 390,000 352,811 A irport 408,950 142,502 E OHU 622,351 841,196 His toric al S oc iety 117,875 114,875 A rt Gallery 60,000 60,000 P ublic Library 1,680,523 1,629,673 Heart of the City - 30,000
3,468,171 3,354,040
Outside Agencies
Health Unit funding has decreased due to increase in funding directly M of H The Airport commission is $363,500 in capital in 2007.

Internal recoveries and Corporate Costs represent internal Internal recoveries and Corporate Costs represent internal charges from service departments to user departmentscharges from service departments to user departments
Net expenditures are allocated to receiving departments Net expenditures are allocated to receiving departments based on a number of drivers including # of employees, % based on a number of drivers including # of employees, % of time spent…of time spent…
This provides the true cost to operate each departmentThis provides the true cost to operate each departmentAllows for meaningful comparisons with other municipalitiesAllows for meaningful comparisons with other municipalitiesSimilar guidelines to those provided by the Ontario Municipal Similar guidelines to those provided by the Ontario Municipal
Bench Marking InitiativeBench Marking Initiativei.e. Human resources provide services to all departments i.e. Human resources provide services to all departments
throughout the Corporation. throughout the Corporation. The City has been doing this for years through Municipal The City has been doing this for years through Municipal
works and equipment rentalworks and equipment rental

Corporate costsCorporate costsCorporate Cos ts Operations 6,578,117$ W ater & S ewer 1,176,395
Internal recoveries 7,754,512$
Operations M inis tries 898,920$ United Counties 264,113
1,163,033$
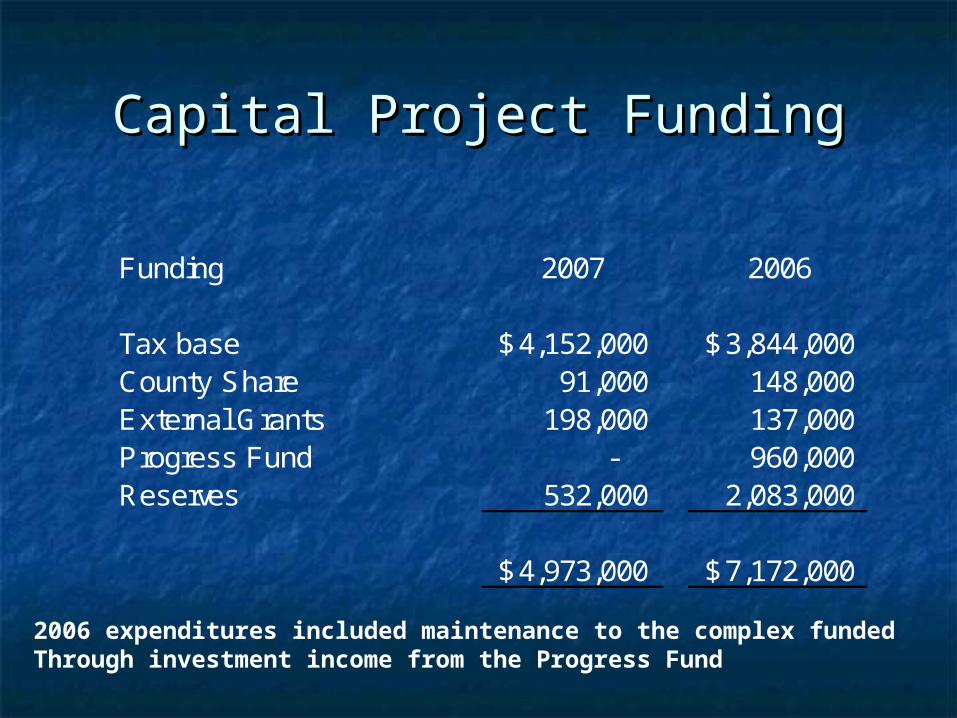
Capital Project FundingCapital Project Funding
Funding 2007 2006
Tax base 4,152,000$ 3,844,000$ County Share 91,000 148,000 External Grants 198,000 137,000 Progress Fund - 960,000 Reserves 532,000 2,083,000
4,973,000$ 7,172,000$
2006 expenditures included maintenance to the complex funded Through investment income from the Progress Fund

Annual Capital ExpendituresAnnual Capital Expenditures
0
1,000
2,000
3,000
4,000
5,000
6,000
7,000
8,000
Annual spending 7,137 4,749 3,284 6,591 5,723 6,247 6,022 4,973
2000 2001 2002 2003 2004 2005 2006 2007
These capital expenditures are exclusive of capital in the Water andWaste water systems
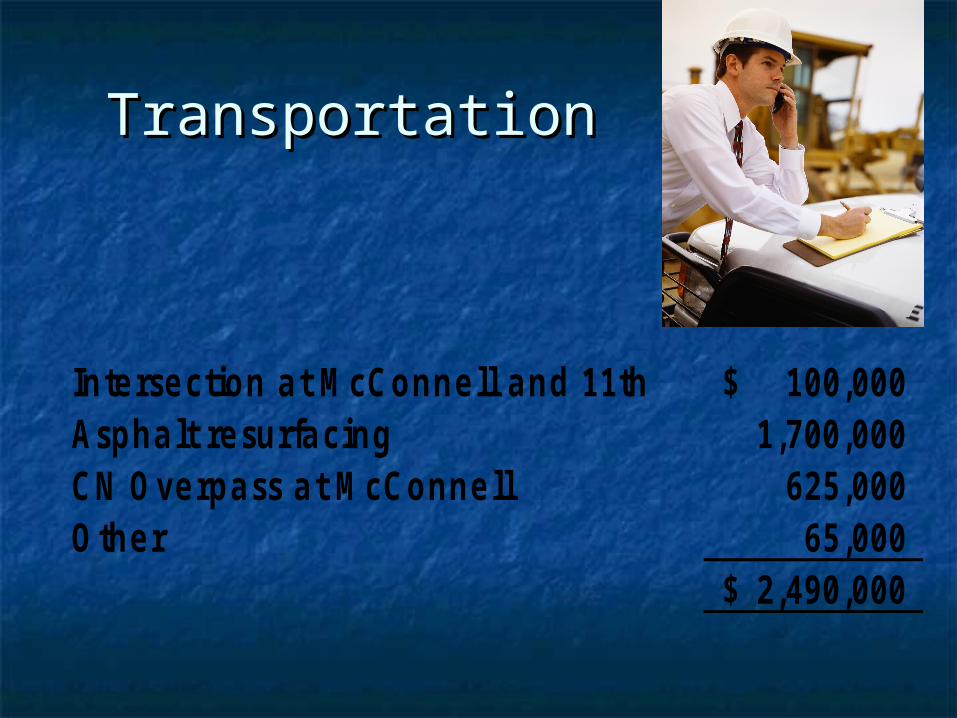
TransportationTransportation
Inte rse ction a t M cConne ll a nd 11th 100,000$ Aspha lt re surfa cing 1,700,000 CN Ove rpa ss a t M cConne ll 625,000 O the r 65,000
2,490,000$
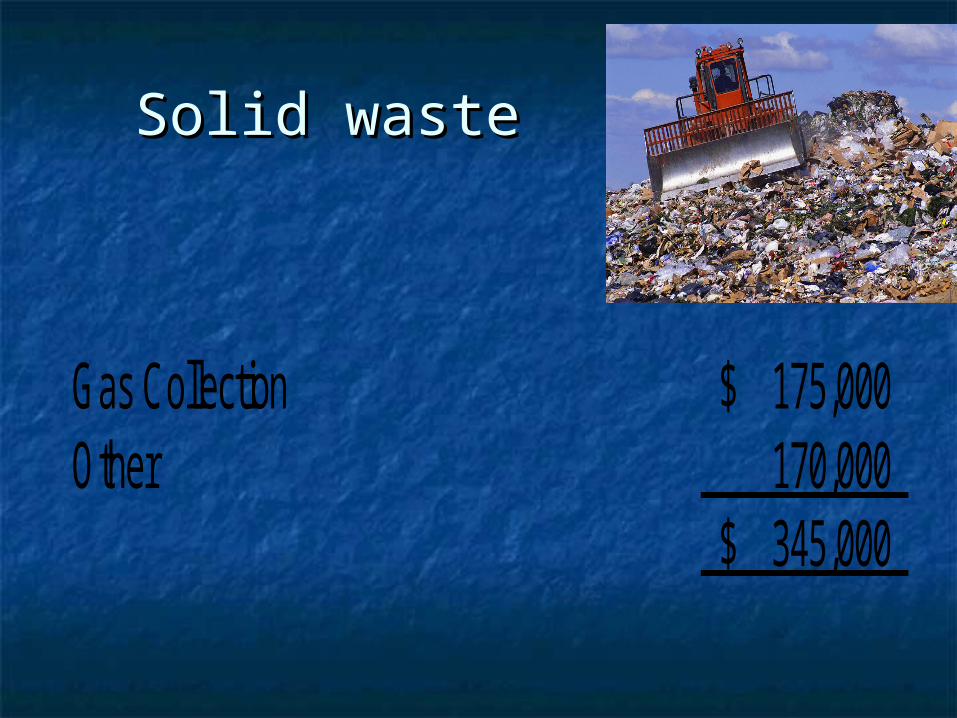
Gas Collection 175,000$ Other 170,000
345,000$
Solid wasteSolid waste

General General Government/ Government/
FacilitiesFacilities
Justice Bldg,City Hall 350,000$ Day Care 120,000 Roof Replacement 120,000 Other 74,000
664,000$
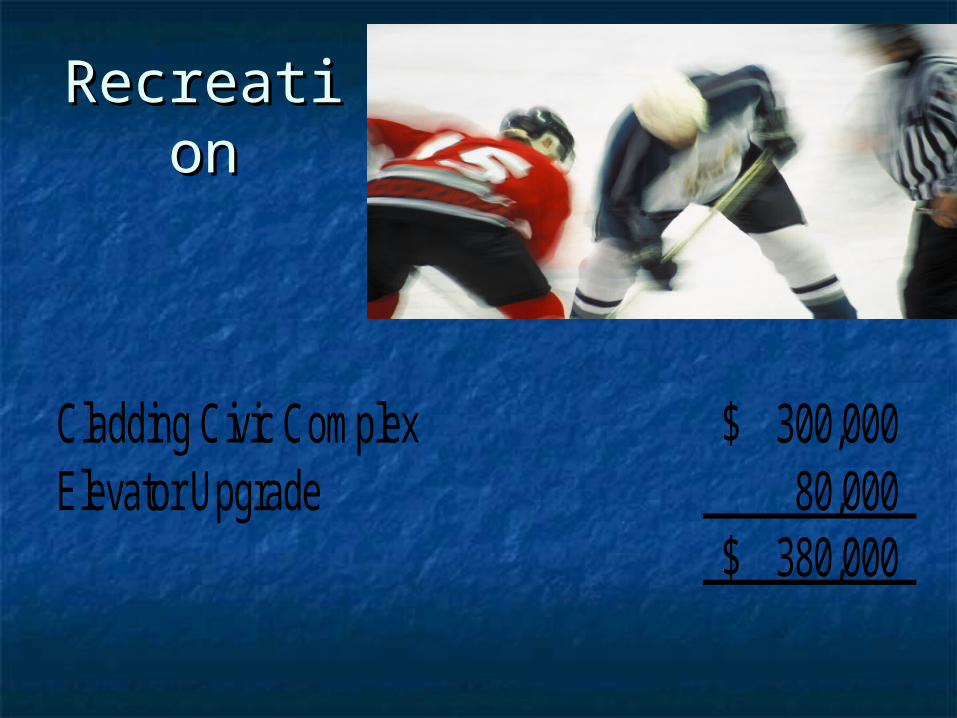
RecreatioRecreationn
Cladding Civic Complex 300,000$ Elevator Upgrade 80,000
380,000$

Glen Stor Dun Glen Stor Dun LodgeLodge
Flooring 94,000$ Furniture 41,000 Other 138,000
273,000$

Municipalities are permitted to establish reserves Municipalities are permitted to establish reserves and reserve funds. The balances can be and reserve funds. The balances can be established to finance future expenditures as well established to finance future expenditures as well as to fund future capital purchases. They can also as to fund future capital purchases. They can also be based on accumulated surplus for use for be based on accumulated surplus for use for stabilization purposes. stabilization purposes.
Reserves and reserve funds are essentially the Reserves and reserve funds are essentially the same with the following differences:same with the following differences:
Reserves Funds are established in separate bank Reserves Funds are established in separate bank accounts or investments and are credited with accounts or investments and are credited with investment earnings and are typically established investment earnings and are typically established by regulation or By-Law by regulation or By-Law

Cornwall has a number of reserves and Cornwall has a number of reserves and reserve funds with the most recognizable reserve funds with the most recognizable being the Progress Fund and Debt being the Progress Fund and Debt Retirement Fund.Retirement Fund.
These were established with the sale of These were established with the sale of Cornwall Electric.Cornwall Electric.
The Progress fund was established to fund The Progress fund was established to fund “Quality of Life” expenditures.“Quality of Life” expenditures.
The debt retirement fund was organized in a The debt retirement fund was organized in a fashion that as debt payments became fashion that as debt payments became due, the investments matured allowing the due, the investments matured allowing the City to fund debt payments from sources City to fund debt payments from sources other then the tax base.other then the tax base.
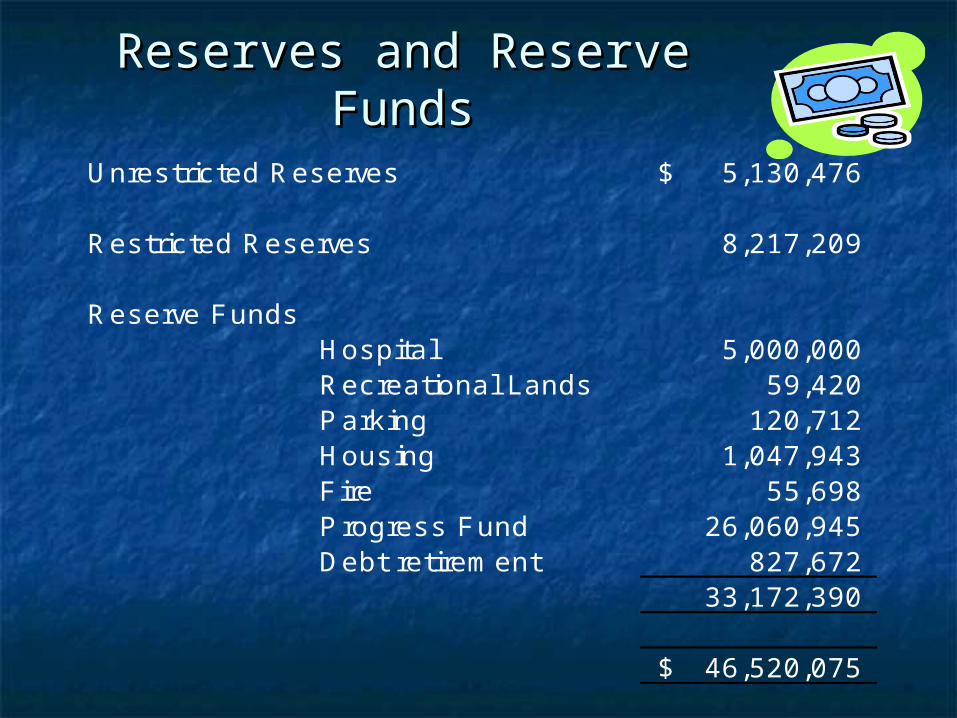
Reserves and Reserve FundsReserves and Reserve Funds
Unres tric ted Reserves 5,130,476$
Res tric ted Reserves 8,217,209
Reserve FundsHospital 5,000,000 Rec reational Lands 59,420 P ark ing 120,712 Hous ing 1,047,943 F ire 55,698 P rogres s Fund 26,060,945 Debt retirem ent 827,672
33,172,390
46,520,075$

P rogress Fund$25,000,000
Interes t 10,798,786
S LRIE S (500,000) Capital (600,000) Com plex (2,803,700) A quatic Centre (5,834,141)
(9,737,841)
B alance Decem ber 31, 2006 $26,060,945
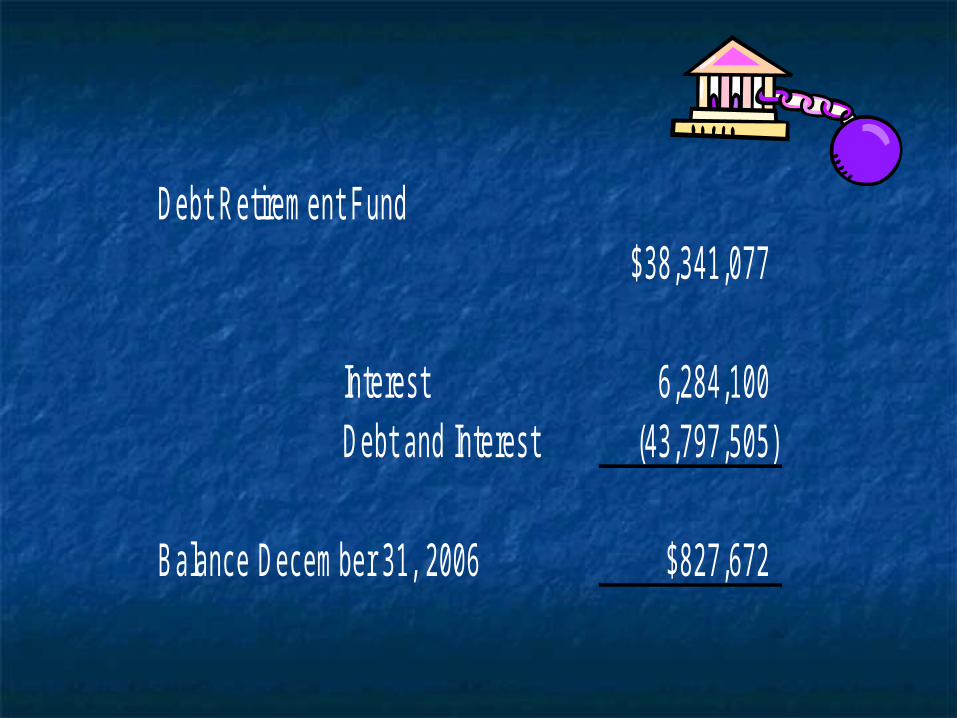
Debt Retirem ent Fund$38,341,077
Interes t 6,284,100 Debt and Interes t (43,797,505)
B alance Decem ber 31, 2006 $827,672

Tax ComparisonsTax Comparisons
The City of Brockville completed an The City of Brockville completed an internally prepared “Tax Study” in internally prepared “Tax Study” in the summer of 2006 and reported the summer of 2006 and reported that the City of Cornwall has the that the City of Cornwall has the highest taxes in the survey. The highest taxes in the survey. The following slides represent the details following slides represent the details of the survey. of the survey.
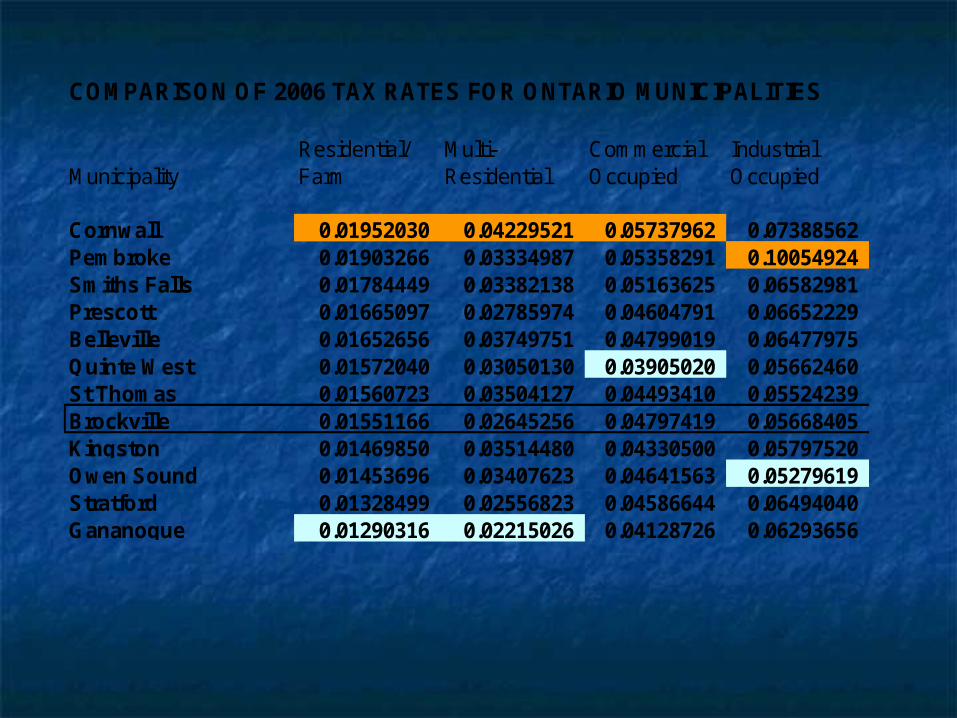
COMPARISON OF 2006 TAX RATES FOR ONTARIO MUNICIPALITIES
Residential/ Multi- Commercial IndustrialMunicipality Farm Residential Occupied Occupied
Cornwall 0.01952030 0.04229521 0.05737962 0.07388562Pembroke 0.01903266 0.03334987 0.05358291 0.10054924Smiths Falls 0.01784449 0.03382138 0.05163625 0.06582981Prescott 0.01665097 0.02785974 0.04604791 0.06652229Belleville 0.01652656 0.03749751 0.04799019 0.06477975Quinte West 0.01572040 0.03050130 0.03905020 0.05662460St Thomas 0.01560723 0.03504127 0.04493410 0.05524239Brockville 0.01551166 0.02645256 0.04797419 0.05668405Kingston 0.01469850 0.03514480 0.04330500 0.05797520Owen Sound 0.01453696 0.03407623 0.04641563 0.05279619Stratford 0.01328499 0.02556823 0.04586644 0.06494040Gananoque 0.01290316 0.02215026 0.04128726 0.06293656
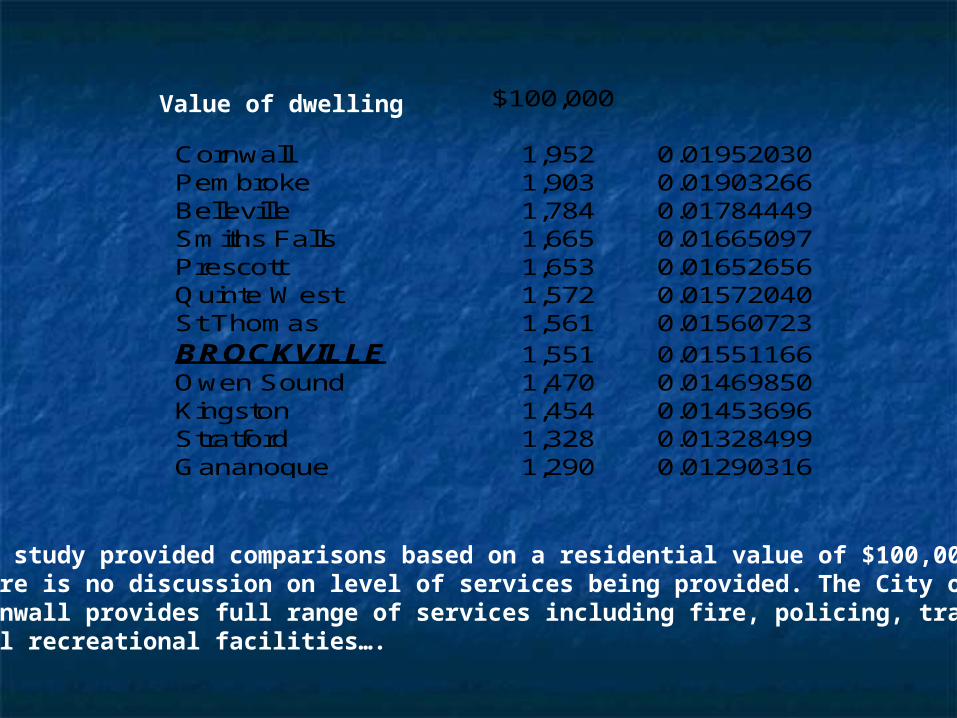
$100,000
Cornwall 1,952 0.01952030Pembroke 1,903 0.01903266Belleville 1,784 0.01784449Smiths Falls 1,665 0.01665097Prescott 1,653 0.01652656Quinte West 1,572 0.01572040St Thomas 1,561 0.01560723BROCKVILLE 1,551 0.01551166Owen Sound 1,470 0.01469850Kingston 1,454 0.01453696Stratford 1,328 0.01328499Gananoque 1,290 0.01290316
The study provided comparisons based on a residential value of $100,000 There is no discussion on level of services being provided. The City ofCornwall provides full range of services including fire, policing, transitfull recreational facilities….
Value of dwelling
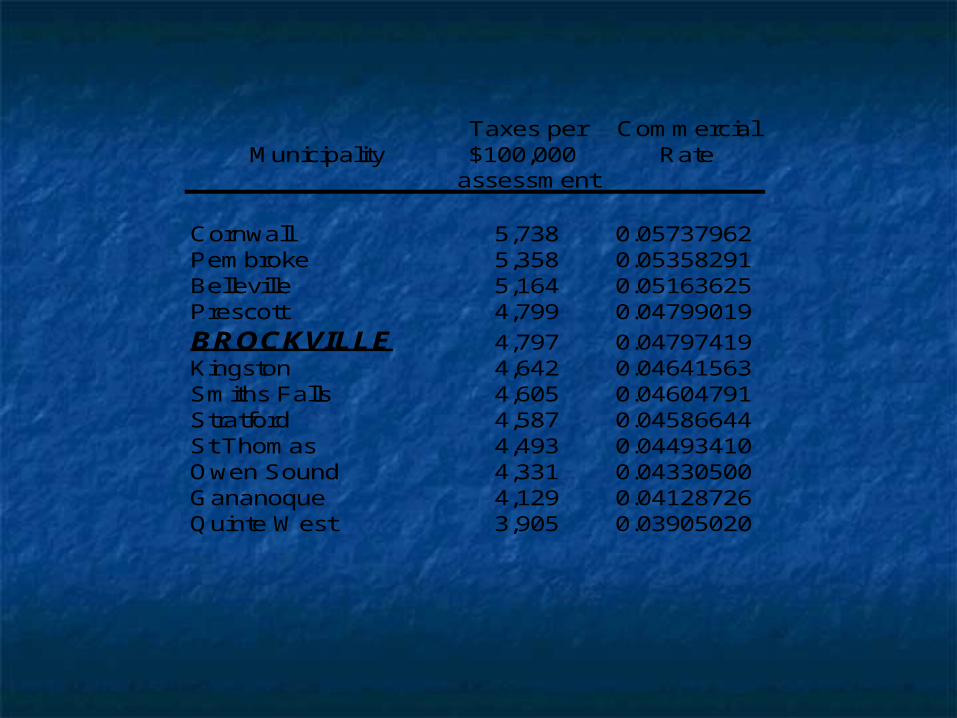
Taxes per CommercialMunicipality $100,000 Rate
assessment
Cornwall 5,738 0.05737962Pembroke 5,358 0.05358291Belleville 5,164 0.05163625Prescott 4,799 0.04799019
BROCKVILLE 4,797 0.04797419Kingston 4,642 0.04641563Smiths Falls 4,605 0.04604791Stratford 4,587 0.04586644St Thomas 4,493 0.04493410Owen Sound 4,331 0.04330500Gananoque 4,129 0.04128726Quinte West 3,905 0.03905020
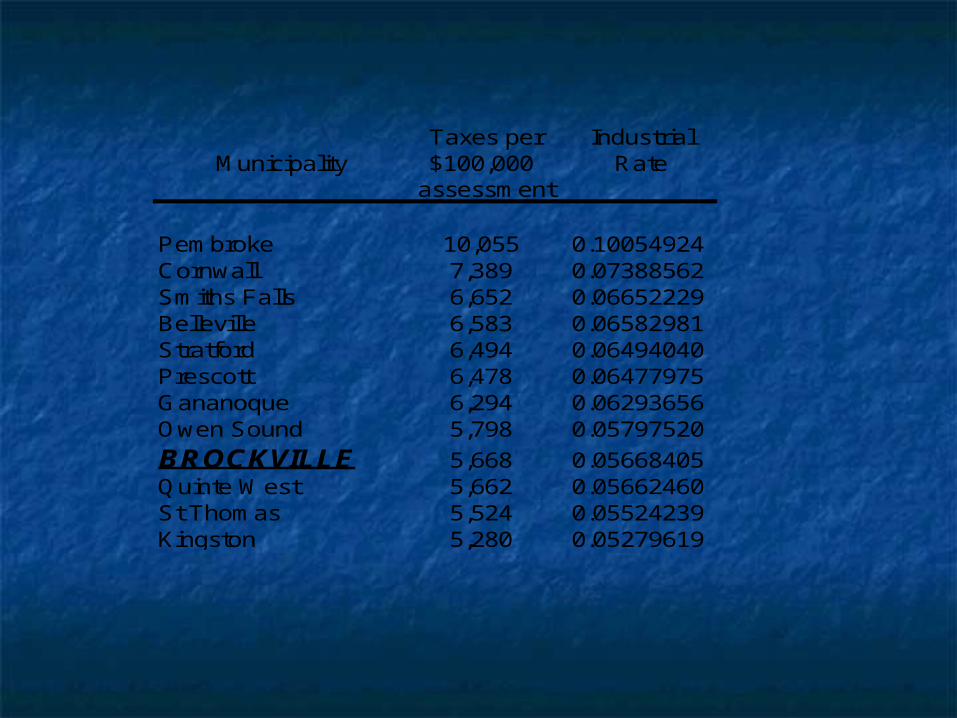
Taxes per IndustrialMunicipality $100,000 Rate
assessment
Pembroke 10,055 0.10054924Cornwall 7,389 0.07388562Smiths Falls 6,652 0.06652229Belleville 6,583 0.06582981Stratford 6,494 0.06494040Prescott 6,478 0.06477975Gananoque 6,294 0.06293656Owen Sound 5,798 0.05797520
BROCKVILLE 5,668 0.05668405Quinte West 5,662 0.05662460St Thomas 5,524 0.05524239Kingston 5,280 0.05279619
0
500
1000
1500
2000
2500
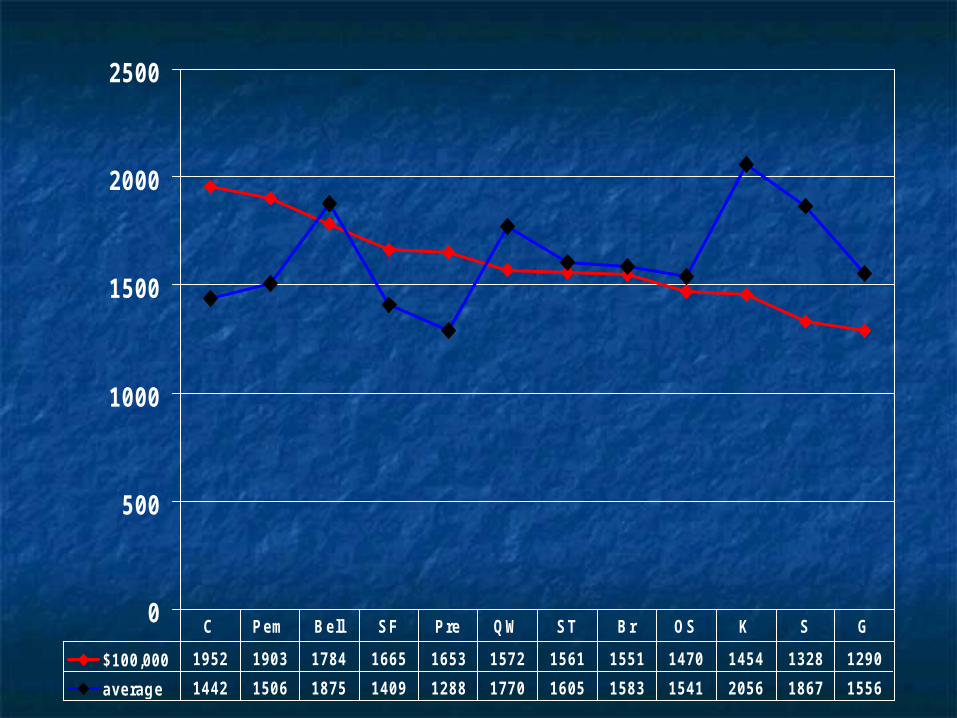
$100,000 1952 1903 1784 1665 1653 1572 1561 1551 1470 1454 1328 1290
average 1442 1506 1875 1409 1288 1770 1605 1583 1541 2056 1867 1556
C P em B ell S F P re QW S T B r OS K S G

BMA Municipal Tax StudyBMA Municipal Tax StudyThe City engaged the services of BMA Management The City engaged the services of BMA Management
Consultants in 2001 to assist the community in Consultants in 2001 to assist the community in understanding the tax burden relative to other understanding the tax burden relative to other communities. The original study provided details communities. The original study provided details related to housing values and costs of related to housing values and costs of comparable services.comparable services.
These consultants increased the scope of work These consultants increased the scope of work across the province and now include 80 Ontario across the province and now include 80 Ontario municipalities representing in excess of 80% of municipalities representing in excess of 80% of the population.the population.
Municipalities included in the analysis include:Municipalities included in the analysis include: Population ranging from 6,300 to 2.4MPopulation ranging from 6,300 to 2.4M Land Mass Area ranging from 16km to 3,400kmLand Mass Area ranging from 16km to 3,400km Population density ranging from 15/km to Population density ranging from 15/km to
4,100/km4,100/km

BMA Municipal Tax StudyBMA Municipal Tax Study
AjaxAjax Innisfil Innisfil Prince Edward CountyPrince Edward County Amherstburg Amherstburg Kawartha Lakes Kawartha Lakes Richmond HillRichmond Hill Aurora Aurora King King SarniaSarnia Barrie Barrie Kingston Kingston Sault Ste. MarieSault Ste. Marie Belleville Belleville Kitchener Kitchener St. CatharinesSt. Catharines Bracebridge Bracebridge Lakeshore Lakeshore St. ThomasSt. Thomas BramptonBrampton Leamington Leamington StratfordStratford Brantford Brantford Lincoln Lincoln SudburySudbury Burlington Burlington London London TayTay Caledon Caledon Markham Markham TecumsehTecumseh Cambridge Cambridge Milton Milton ThoroldThorold Cavan-Millbrook-North Monaghan Cavan-Millbrook-North Monaghan Mississauga Mississauga Thunder BayThunder Bay Central Elgin Central Elgin Newmarket Newmarket TimminsTimmins Chatham-Kent Chatham-Kent Niagara Falls Niagara Falls TorontoToronto Clarington Clarington Niagara-on-the-Lake Niagara-on-the-Lake VaughanVaughan Cobourg Cobourg Norfolk Norfolk WainfleetWainfleet Collingwood Collingwood North Bay North Bay Wasaga BeachWasaga Beach Cornwall Cornwall North Dumfries North Dumfries WaterlooWaterloo East Gwillimbury East Gwillimbury Oakville Oakville WellandWelland Fort Erie Fort Erie Orangeville Orangeville WellesleyWellesley Georgina Georgina Orillia Orillia West LincolnWest Lincoln Gravenhurst Gravenhurst Oshawa Oshawa WhitbyWhitby Grimsby Grimsby Ottawa Ottawa Whitchurch-StouffvilleWhitchurch-Stouffville Guelph Guelph Pelham Pelham WilmotWilmot Halton Hills Halton Hills Peterborough Peterborough WindsorWindsor Hamilton Hamilton Pickering Pickering WoolwichWoolwich Huntsville Huntsville Port ColbornePort Colborne
$0
$50,000
$100,000
$150,000
$200,000
$250,000
$300,000
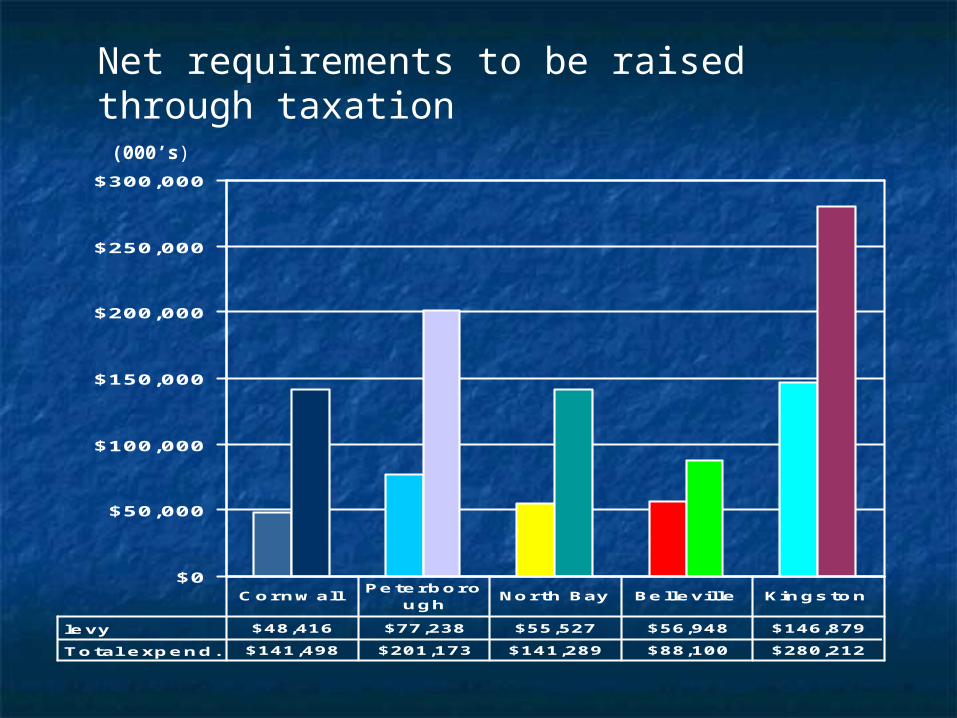
le vy $48,416 $77,238 $55,527 $56,948 $146,879
T o tal e xp e n d . $141,498 $201,173 $141,289 $88,100 $280,212
C o r n w allPe te r b o r o
u g hNo r th Bay Be lle ville Kin g s to n
Net requirements to be raised through taxation
(000’s)

Tax comparisonsTax comparisons
$900
$950
$1,000
$1,050
$1,100
$1,150
$1,200
$1,250
Levy /capita $1,031 $1,015 $1,033 $1,166 $1,213
A verage $1,025 $1,025 $1,025 $1,025 $1,025
CornwallP eterboro
ughNorth B ay B elleville K ings ton
$0
$500
$1,000
$1,500
$2,000
$2,500
Levy/$100 ,000 C VA $2 ,228 $1 ,419 $1 ,711 $1 ,778 $1 ,571
Ave rage $1 ,191 $1 ,191 $1 ,191 $1 ,191 $1 ,191
C ornw a llPe te rbo r
oughN orth bay Be leville K ings ton

Taxes on detached bungalowTaxes on detached bungalow
$2,100
$2,200
$2,300
$2,400
$2,500
$2,600
$2,700
$2,800
$2,900
Detached B ungalow $2,416 $2,852 $2,513 $2,417 $2,611
M edian $2,595 $2,595 $2,595 $2,595 $2,595
C P NB B K
Total municipal taxes on a detachedBungalow. Values range from$101,250to $491,594 in the surveyCornwall is at the mid range of the survey

$0
$200
$400
$600
$800
$1,000
$1,200
$1,400
$1,600
$1,800
$2,000
M ult i-res $1,680 $1,187 $1,403 $1,564 $1,733
M edian $1,289 $1,289 $1,289 $1,289 $1,289
C P NB B K
Total municipal taxes on a walk-up.Properties ranged in value between$26,000 to $85,000 per unitCornwall is at the high end of the survey
Taxes on walk-up apartment

0
0.2
0.4
0.6
0.8
1
1.2
Indus trial 0.74 0.96 0.61 1.04 0.62
Median 0.9 0.9 0.9 0.9 0.9
C P NB B K
0
0.5
1
1.5
2
2.5
3
3.5
Office B ldg 3.19 1.69 1.59 1.43 1.84
M edian 1.39 1.39 1.39 1.39 1.39
C P NB B K
CVA ranged in value from $31 to $165/sq. ftCornwall is at the high end of thesurvey
CVA ranged in value from $17 to$92/sq.ft.Cornwall is at the low end of the survey
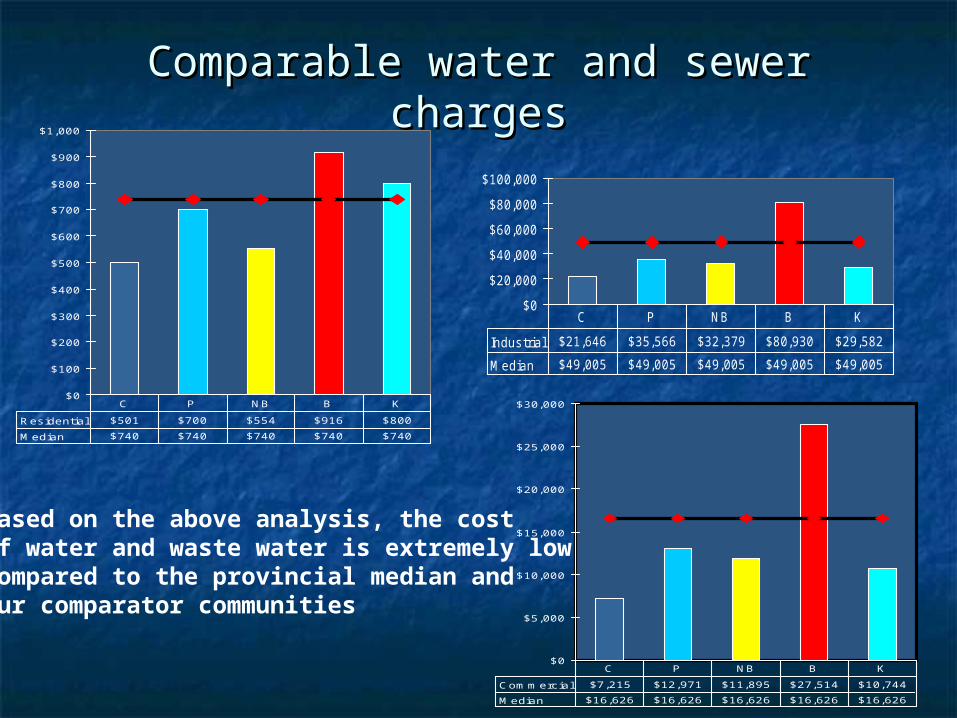
Comparable water and sewer chargesComparable water and sewer charges
$0
$100
$200
$300
$400
$500
$600
$700
$800
$900
$1,000
Res idential $501 $700 $554 $916 $800
M edian $740 $740 $740 $740 $740
C P NB B K
$0
$20,000
$40,000
$60,000
$80,000
$100,000
Indus trial $21,646 $35,566 $32,379 $80,930 $29,582
M edian $49,005 $49,005 $49,005 $49,005 $49,005
C P NB B K
$0
$5,000
$10,000
$15,000
$20,000
$25,000
$30,000
Com m erc ial $7,215 $12,971 $11,895 $27,514 $10,744
M edian $16,626 $16,626 $16,626 $16,626 $16,626
C P NB B K
Based on the above analysis, the costof water and waste water is extremely lowCompared to the provincial median andOur comparator communities

$0
$500
$1,000
$1,500
$2,000
$2,500
$3,000
$3,500
C ost $2,416 $2,718 $2,840 $3,108 $3,128
Median $3,145 $3,145 $3,145 $3,145 $3,145
C ornwall P eterborough North bay B elleville K ingston0.00%
1.00%
2.00%
3.00%
4.00%
5.00%
6.00%
B urden/incom e 4.70% 4.50% 4.90% 5.40% 4.90%
M edian 4.40% 4.40% 4.40% 4.40% 4.40%
CornwallP eterboro
ughNorth B ay
B elleville K ings ton
Total municipal burden as a % of income
Total municipal burdenRelative to average dwelling value

BMA Municipal Tax StudyBMA Municipal Tax Study
When the Province assumed responsibility for education When the Province assumed responsibility for education finance in 1998, it "uploaded" much of the residential finance in 1998, it "uploaded" much of the residential education portion as part of the “Who Does What" education portion as part of the “Who Does What" realignment of services and costs between the two levels of realignment of services and costs between the two levels of government. This allowed the Province to equalize the government. This allowed the Province to equalize the residential education tax rate across the province at a residential education tax rate across the province at a dramatically lower level. This created ‘tax room’ for the dramatically lower level. This created ‘tax room’ for the municipalities which were expected to pay for the services municipalities which were expected to pay for the services they assumed in the realignment—"downloaded" service. they assumed in the realignment—"downloaded" service.
By contrast, business education taxes were not equalized. By contrast, business education taxes were not equalized. They continued to reflect the rates that existed in each They continued to reflect the rates that existed in each municipality while local school boards were setting the municipality while local school boards were setting the rates. rates.

BMA Municipal Tax StudyBMA Municipal Tax StudyEducation RatesEducation Rates
Com m erc ial Indus trial
Cornwall 2.4210% 2.9490%A verage 1.6778% 2.2683%M edian 1.5929% 2.3495%M inim um 0.7910% 0.9715%M ax im um 2.5751% 3.3530%
If the average rate across the Province was made available to If the average rate across the Province was made available to Cornwall commercial and industrial taxpayers, their respective Cornwall commercial and industrial taxpayers, their respective tax bills would be reduced by 30.69% and 23.08% tax bills would be reduced by 30.69% and 23.08% respectively.respectively.
The gross savings would be:The gross savings would be:
Commercial TaxpayersCommercial Taxpayers $3,142,565$3,142,565
Industrial TaxpayersIndustrial Taxpayers $ 523,470$ 523,470
Similarly, the median rate would have resulted in the following:Similarly, the median rate would have resulted in the following:
Commercial TaxpayersCommercial Taxpayers $3,502,477$3,502,477
Industrial TaxpayersIndustrial Taxpayers $ 461,074$ 461,074
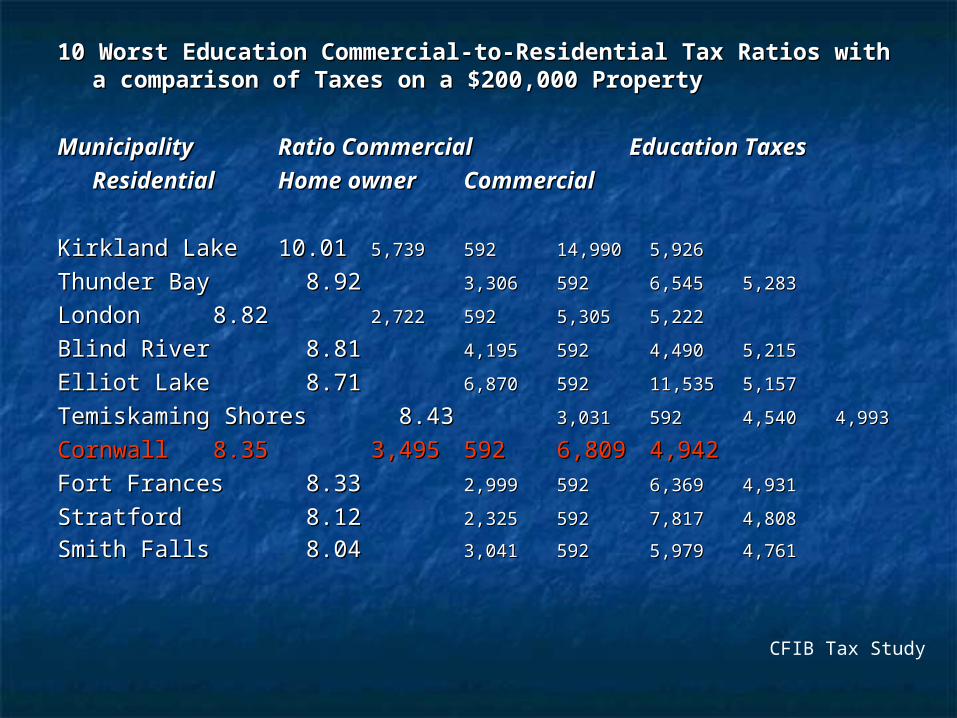
10 Worst Education Commercial-to-Residential Tax Ratios with 10 Worst Education Commercial-to-Residential Tax Ratios with a comparison of Taxes on a $200,000 Propertya comparison of Taxes on a $200,000 Property
Municipality Municipality Ratio Commercial Ratio Commercial Education Taxes Education Taxes
Residential Residential Home ownerHome ownerCommercialCommercial
Kirkland Lake Kirkland Lake 10.0110.01 5,7395,739 592 592 14,99014,990 5,9265,926
Thunder Bay Thunder Bay 8.92 8.92 3,3063,306 592 592 6,5456,545 5,2835,283
LondonLondon 8.82 8.82 2,7222,722 592 592 5,3055,305 5,2225,222
Blind River Blind River 8.81 8.81 4,1954,195 592 592 4,4904,490 5,2155,215
Elliot Lake Elliot Lake 8.71 8.71 6,8706,870 592 592 11,53511,535 5,1575,157
Temiskaming ShoresTemiskaming Shores 8.43 8.43 3,0313,031 592592 4,5404,540 4,9934,993
Cornwall Cornwall 8.35 8.35 3,4953,495 592 592 6,8096,809 4,9424,942
Fort FrancesFort Frances 8.33 8.33 2,9992,999 592 592 6,3696,369 4,9314,931
Stratford Stratford 8.12 8.12 2,3252,325 592 592 7,8177,817 4,8084,808 Smith Falls Smith Falls 8.04 8.04 3,0413,041 592592 5,9795,979 4,7614,761
CFIB Tax Study
Development fees represent the recovery of costs Development fees represent the recovery of costs by Ontario Municipalities for capital infrastructure by Ontario Municipalities for capital infrastructure required to support new growthrequired to support new growth
The City of Cornwall along with Sault Ste. Marie, The City of Cornwall along with Sault Ste. Marie, Thunder Bay, Timmins and the County of Prince Thunder Bay, Timmins and the County of Prince Edward County do not have any development Edward County do not have any development chargescharges
9 additional municipalities do not have industrial 9 additional municipalities do not have industrial development charges and 3 do not have development charges and 3 do not have commercial development chargescommercial development charges

In 2001 the Province introduced the Municipal In 2001 the Province introduced the Municipal Performance Measurement Program as an Performance Measurement Program as an initiative to provide taxpayers with information on initiative to provide taxpayers with information on service deliveryservice delivery
Similar to the University and College comparisons Similar to the University and College comparisons addressed by MacLean’s magazineaddressed by MacLean’s magazine
Annually, municipalities provides relevant financial Annually, municipalities provides relevant financial data to allow comparisons between themselves.data to allow comparisons between themselves.
This data is not truly comparable due to This data is not truly comparable due to discrepancy in accounting and reporting practices discrepancy in accounting and reporting practices used throughout the Provinceused throughout the Province

Operating Net ExpCosts/$1000 per capita
of assessment
Cornwall 2.71 134Average 1.25 98
Fire costs are dependent on a number of factors including:Fire costs are dependent on a number of factors including: Size of municipalitySize of municipality Mix of urban and rural coverageMix of urban and rural coverage Volume of activityVolume of activity Composition of fire servicesComposition of fire services Specialized servicesSpecialized services Accounting and reporting practicesAccounting and reporting practices

Operating Net ExpCosts/ person per $10,000
CVACornwall $277 $600Average $198 $151
Policing costs are dependent on a number of Policing costs are dependent on a number of factors including:factors including:
LocationLocation Incident of serious crimesIncident of serious crimes One-time special eventsOne-time special events Geographic mix (urban vs. rural) Geographic mix (urban vs. rural) Specialized servicesSpecialized services Accounting and reporting practicesAccounting and reporting practices

Operating Net ExpCosts/$1000 per capita
of assessment
Cornwall $1,179 $139Average $2,091 $116
Operating costs for paved roads can be influenced by:Operating costs for paved roads can be influenced by: WeatherWeather Age and condition of networkAge and condition of network Volume and type of trafficVolume and type of traffic Pavement standard’sPavement standard’s Accounting and reporting practicesAccounting and reporting practices

Maintenance Net Expper lane per capita
KM
Cornwall $2,049 $36Average $1,962 $30
The operating costs for winter maintenance can be The operating costs for winter maintenance can be influenced by:influenced by:
WeatherWeather Accounting and reporting practicesAccounting and reporting practices

Net Expper capita
Cornwall $38Average $38
Factors affecting land ambulance service costs:Factors affecting land ambulance service costs: Service levels and standardsService levels and standards DispatchDispatch Urban Vs RuralUrban Vs Rural Age and condition of fleetAge and condition of fleet Accounting and reporting practicesAccounting and reporting practices

Factors that affect General Assistance and Child care:Factors that affect General Assistance and Child care: Number of recipientsNumber of recipients Socio-demographicsSocio-demographics Accounting and reporting practicesAccounting and reporting practices
Net exp per Net Exp $100,000 CVA per capita
Corn GA $498 $231Corn CC $8Ave. GA $197 $138Ave. CC $16