city of colonial heights, virginia heights... · management’s discussion and analysis ... the...
TRANSCRIPT

CITY OF
COLONIAL HEIGHTS,
VIRGINIA
COMPREHENSIVE ANNUAL
FINANCIAL REPORT
ENDING JUNE 30, 2013


CITY OF COLONIAL HEIGHTS, VIRGINIA
COMPREHENSIVE ANNUAL FINANCIAL REPORT
YEAR ENDED JUNE 30, 2013
Prepared by the Department of Financial Administration
William E. Johnson Director of Finance


CITY OF COLONIAL HEIGHTS, VIRGINIATABLE OF CONTENTS
INTRODUCTORY SECTIONPage
Directory of Principal Officials......................................................................................................................... i
Certificate of Achievement for Excellence in Financial Reporting................................................................ ii
Organizational Chart ....................................................................................................................................... iii
Letter of Transmittal........................................................................................................................................ iv
FINANCIAL SECTION
Independent Auditor’s Report...........................................................................................................................1
Management’s Discussion and Analysis ..........................................................................................................4
Basic Financial Statements
Government-wide Financial Statements
Exhibit 1 Statement of Net Position ......................................................................................................6
Exhibit 2 Statement of Activities...........................................................................................................7
Fund Financial Statements
Exhibit 3 Balance Sheet – Governmental Funds...................................................................................8
Exhibit 4 Reconciliation of the Governmental Funds Balance Sheet to the Statement of Net Position..........................................................................................9
Exhibit 5 Statement of Revenues, Expenditures, and Changes inFund Balances – Governmental Funds ........................................................................... 10
Exhibit 6 Reconciliation of the Statement of Revenues, Expenditures, and Changes in Fund Balances to the Statement of Activities.............................................. 11
Exhibit 7 Statement of Net Position – Proprietary Funds.................................................................. 12
Exhibit 8 Statement of Revenues, Expenses, and Changes in FundNet Position – Proprietary Funds .................................................................................... 13
Exhibit 9 Statement of Cash Flows – Proprietary Funds................................................................... 14
Notes to Financial Statements ................................................................................................................. 15
Required Supplementary Information
Exhibit 10 Schedules of Funding Progress........................................................................................... 47
Exhibit 11 Schedule of Revenues, Expenditures and Changes in Fund BalanceBudget and Actual (General Fund) ................................................................................. 48
FINANCIAL SECTION (Continued)
Other Supplementary Information
Exhibit 12 Combining Statement of Net Position – Nonmajor Proprietary Funds............................. 52
Exhibit 13 Combining Statement of Revenues, Expenses and Changes in FundNet Position – Nonmajor Proprietary Funds .................................................................. 53
Exhibit 14 Combining Statement of Cash Flows – Nonmajor Proprietary Funds.............................. 54
Other Supplemental Schedules
Exhibit 15 DPCU – School Board – Balance Sheet – Governmental Fund........................................ 55
Exhibit 16 DPCU – School Board – Schedule of Revenues, Expenditures andChanges in Fund Balance – Governmental Fund........................................................... 56
Exhibit 17 DPCU – School Board – Schedule of Revenues, Expenditures and Changes in Fund Balance – Budget and Actual – School Operating Fund .................................. 57
SUPPORTING SCHEDULE
Schedule 1 Schedule of Expenditures of Federal Awards........................................................................... 59
Notes to Schedule of Expenditures of Federal Awards ................................................................................ 61
STATISTICAL SECTION
Table 1 Net Position by Component....................................................................................................... 63
Table 2 Change in Net Position by Component..................................................................................... 64
Table 3 Fund Balances – Governmental Funds ..................................................................................... 66
Table 4 Changes in Fund Balances – Governmental Funds .................................................................. 67
Table 5 Schedule of Revenues, Resources, Expenditures, Contract Commitments and Unobligated Balance......................................................................................................... 69
Table 6 Assessed Value and Actual Value of Taxable Property ........................................................... 70
Table 7 Direct Property Tax Rates ......................................................................................................... 71
Table 8 Principal Property Taxpayers .................................................................................................... 72
Table 9 Property Tax Levies and Collections ........................................................................................ 73
Table 10 Taxable Sales by Category ........................................................................................................ 74
Table 11 Taxable Sales by Category ........................................................................................................ 75
Table 12 Legal Debt Margin Information ................................................................................................ 76
Table 13 Ratios of Outstanding Debt by Type......................................................................................... 77
Table 14 Demographic Statistics .............................................................................................................. 78
Table 15 Principal Employers................................................................................................................... 79
Table 16 Full-Time Employees ................................................................................................................ 80
Table 17 Operating Indicators by Function/Program............................................................................... 81

COMPLIANCE SECTION
Independent Auditor’s Report on Internal Control over Financial Reporting and onCompliance and Other Matters Based on an Audit of Financial Statements Performed in Accordance with Government Auditing Standards……….................................................. 83
Independent Auditor’s Report on Compliance for Each Major Program and on InternalControl Over Compliance Required by OMB Circular A-133…………………………….……….…..85
Summary of Compliance Matters.................................................................................................................. 87
Schedule of Findings and Questioned Costs ................................................................................................. 88

THIS PAGE INTENTIONALLY BLANK

INTRODUCTORY SECTION
i
CITY OF COLONIAL HEIGHTS, VIRGINIA
DIRECTORY OF PRINCIPAL OFFICIALSJune 30, 2013
CITY COUNCIL
C. Scott Davis, MayorDiane H. Yates, Vice Mayor
Kenneth B. FrenierW. Joe Green, Jr.
T. Gregory KochubaMilton E. Freeland, Jr.
John T. Wood
OTHER OFFICIALS
Thomas L. Mattis.......................................................................City ManagerHugh P. Fisher, III .....................................................................City AttorneyPamela B. Wallace .........................................................................City ClerkWilliam E. Johnson ......................................................... Director of FinanceJeffrey W. Faries .................................................................... Chief of PoliceWilliam E. Henley..................................................Director of Public WorksCraig Skalak .............................................. Director of Recreation and ParksBruce N. Hansen................................................................... Library DirectorDr. Joseph O. Cox ................................................Superintendent of Schools
INDEPENDENT AUDITORS
Brown, Edwards & Company, L.L.P.
ii

iii
iv
Transmittal Letter PBC - See 1200
November 8, 2013
The Honorable Mayor, Members of City Council Colonial Heights, Virginia The Comprehensive Annual Financial Report (CAFR) of the City of Colonial Heights, Virginia (the “City”) for the fiscal year ending June 30, 2013, is transmitted herewith. This report was prepared by the Department of Financial Administration, which assumes full responsibility for the accuracy of data, completeness and the fairness of presentation. We believe the data, as presented, is accurate in all material respects, and that it is presented in a manner designed to fairly set forth the financial position and results as measured by the financial activity of its various governmental activities, business–type activities and funds. All disclosures necessary for a reader to fully understand the City's financial affairs have been included. Upon completing your review of this introductory section, you are encouraged to turn to the narrative introduction, overview, and analysis found in management’s discussion and analysis (MD&A) for a more detailed overview of the City’s financial position. The basic financial statements consist of government-wide and fund financial statements, notes to the basic financial statements and required supplementary information. The Statistical Section, which is unaudited, includes selected financial and demographic information, generally presented on a multi-year basis. Brown Edwards & Company, LLP, Certified Public Accountants have audited the City’s basic financial statements. This independent audit’s yearly goal is to provide reasonable assurance that the basic financial statements are free of material misstatement. The Independent auditors concluded, based upon the audit, that there was reasonable basis for rendering an unmodified opinion that the City’s basic financial statements for the fiscal year ending June 30, 2013, are fairly presented in conformity with generally accepted accounting principals (GAAP). The independent auditors’ report is presented as the first component of the Financial Section. The City is required to undergo an annual single audit in conformity with provisions of the Single Audit Act Amendment of 1996 and the U.S. Office of Management and Budget’s Circular A-133 (Audits of States, Local Governments, and Non-Profit Organizations). The Schedule of Expenditures of Federal Awards and the independent auditors’ reports on internal controls and compliance with applicable laws and regulations are included in the Compliance section of this CAFR.
City of Colonial Heights
Phone 804-520-9332 Fax 804-524-8723 www.colonialheightsva.gov
Thomas L. Mattis City Manager
William E. Johnson Director of Finance
City Hall · 201 James Avenue · P.O. Box 3401 Colonial Heights, Virginia 23834
v
The financial reporting entity includes all funds of the primary government (i.e. the City of Colonial Heights as legally defined), as well as all of its component units. Component units are legally separate entities for which the primary government is financially accountable. The primary government provides a full range of services including general administration, public safety, public works, recreational activities, judicial functions, health and welfare activities, and community development activities.
Discretely presented component units are reported in separate columns in the government-wide financial statements to emphasize that they are legally separate from the primary government and to differentiate their financial position and results of operations from the primary government. The School Board of the City of Colonial Heights is reported as a discretely presented component unit. For additional information on the City’s financial status go to the Management’s Discussion and Analysis section of this report.
ECONOMIC CONDITION AND OUTLOOK
The City, with a land area of 8.14 square miles, is located in southeastern Virginia. The City is strategically located on Interstate 95 near its intersection with interstates, I85 and I64, thus giving the City access to the East Coast's major markets.
The City is less than 20 miles south of Virginia's state capital, Richmond, and 120 miles south of the nation's capital, Washington, D.C. The City of Petersburg lies just across the Appomattox River which bisects the two cities, with Colonial Heights on the north bank. Richmond's deepwater terminal is approximately 15 miles north and the ports at Hampton Roads are some 80 miles to the southeast.
The population of the City is estimated at 17,411 as projected by the Virginia Employment Commission. The City is part of the Richmond Tri-Cities Metropolitan Statistical Area and as such has immediate access to the area’s dynamic business complex. Richmond is a center for manufacturing, distribution and trade. State and Federal offices are located in Richmond and the area houses numerous corporate headquarters.
In the immediate Tri-Cities area (Petersburg, Colonial Heights and Hopewell), government continues to be a major employer. Government facilities include Central State Hospital, Southside Virginia Training Center, Richard Bland College, and the United States Army Quartermaster Center and Fort Lee.
The City has a civilian labor force of 8,911and an unemployment rate of 7.3%. The surrounding labor pool consists of tens of thousands of workers representing the entire spectrum of occupational groups and training opportunities in the area are abundant.
The City’s goal is to promote development and expansion of a diversified business base to enhance the quality and standard of living through expanded job opportunities and tax base.

vi
The City has seen 2.4 million square feet of retail, office and service industry development in the City’s regionally based commercial center area known as “Southpark”. Beginning with the opening of the area’s only regional mall in 1989, the area has become a Mecca for giant retailers, specialty retailers and office seekers. The City currently has seen an additional hotel completed. This area has lost several car dealerships with the past automotive contraction, but this area is showing continued interest to absorb these closures with additional planned retail businesses. Transportation access and diversity have been two key elements of the area’s sustained success. The expansion of Fort Lee continues to reduce the City’s exposure to economic downturns. The City’s older retail areas along the US1/301 corridor continue to benefit from the increased exposure of the City’s regional emphasis.
The City’s Capital Improvement Program is centered on infrastructure improvements to update or expand the current services. Other major projects include the replacement of the current courts building, Modernization of major roadways and the replacement and improvement of other infrastructure.
The closure of the former landfill has been completed and approved by the Virginia Department of Waste Management. This closure has opened additional land for development in the Southpark commercial center, which the City is actively marketing.
The City has endured the past economic challenges by maintaining a good local tax base that softened the effects of the Commonwealth’s budget and economic cutbacks. This year’s financial operations continued to effectively maintain existing service levels while shifting focus to increasing and enhancing service wherever possible. This included a funding increase in operating capital equipment and an increase in full-time employee’s base salaries that was effective October 1, 2011. The City continues to adhere to a conservative budget in order to keep existing programs funded and salaries of public employees competitive while dealing with changing budgetary challenges.
The City’s Fund Balance goal of an unassigned fund balance of 10% had been exceeded in the past years to provide a rainy day fund in case of economic downturns. Due to economic conditions, one percent of this excess was utilized in the Fiscal Year 2010 and again in the Fiscal Year 2011 budget preparations. Normal operations only required the partial use of these reserves in 2010 and none in Fiscal Year 2011. No reserves were utilized in the preparation of the Fiscal Year 2012 or later budgets, and prior levels of unassigned fund balance have been re-established.
ACCOUNTING SYSTEM AND BUDGETARY CONTROLS
In developing and refining the City’s accounting system, consideration is given to the adequacy of internal accounting controls. Internal accounting controls are designed to provide reasonable, not absolute, assurance regarding (a) the safeguarding of assets against loss from unauthorized use or disposition and (b) the reliability of financial records for preparing financial statements and maintaining accountability for assets. The concept of reasonable assurance recognizes that (a) the cost of a control should not exceed the benefits likely to be derived and (b) the evaluation of costs and benefits requires estimates and judgments by management.
vii
All internal control evaluations occur within the above framework. The City’s internal accounting controls adequately safeguard assets and provide reasonable assurance of proper recording of financial transactions.
Budgetary control is maintained at the function line-item level by the encumbrance of estimated purchase amounts prior to the release of purchase orders to vendors. Purchase orders which result in an overrun of line item balances are not released until funds are appropriated or transferred to the specific line item. Open encumbrances are recorded as either committed or assigned fund balances at June 30, 2013.
As required by law, each year the City Manager submits to City Council a recommended budget for the fiscal year beginning July 1. After an extensive budget study process and a public hearing to receive citizen input, City Council makes its decision on the adopted budget.
CAPITAL FINANCING AND DEBT SERVICE
The City’s Financial Management policies were adopted by City Council in 1995 and formally reviewed in 1999, 2003 and 2011. Policies were updated to include new provisions/definitions required by the adoption of GASB 54. Included and maintained in these revised policies are the following debt guidelines: General Fund supported long-term debt will not exceed 4% of assessed value of real estate, General Fund supported long-term debt will not exceed 10% of governmental fund expenditures, and minimum amortization of General Fund supported long-term debt will be 50% within 10 years. The City monitors these ratios to ensure ongoing compliance with the debt policy.
The Constitution of Virginia establishes a debt limit for Virginia cities of 10% of the assessed value of real estate. The City of Colonial Heights could incur debt in the amount of $166,417,662, but has currently utilized 22.26% of its debt obligatory capacity.
Long-term liabilities, excluding notes payable, compensated absences, retirement incentive programs and environmental liabilities, for all funds of the primary government as of June 30, 2013, totaled $37,045,000, of which $798,446 for Enterprise Fund purposes is considered self-supporting and shown only as a liability of the respective fund.
The City’s bonds are rated as follows:
Fitch Moody’sStandard Investors Investor& Poor’s Service Service
AA AA Aa2


THIS PAGE INTENTIONALLY BLANK

FINANCIAL SECTION
1Your Success is Our Focus
124 Newman Avenue • Harrisonburg, VA 22801-4004 • 540-434-6736 • Fax: 540-434-3097 • www.BEcpas.com
INDEPENDENT AUDITOR’S REPORT
To the Honorable Members of City CouncilCity of Colonial Heights, Virginia
Report on the Financial Statements
We have audited the accompanying financial statements of the governmental activities, the business-type activities, the discretely presented component unit, each major fund, and the aggregate remaining fund information of the City of Colonial Heights, Virginia, as of and for the year ended June 30, 2013, and the related notes to the financial statements, which collectively comprise the City’s basic financial statements as listed in the table of contents.
Management’s Responsibility for the Financial Statements
Management is responsible for the preparation and fair presentation of these financial statements in accordance with accounting principles generally accepted in the United States of America; this includes the design, implementation, and maintenance of internal control relevant to the preparation and fair presentation of financial statements that are free from material misstatement, whether due to fraud or error.
Auditor’s Responsibility
Our responsibility is to express opinions on these financial statements based on our audit. We conducted our audit in accordance with auditing standards generally accepted in the United States of America; the standards applicable to financial audits contained in Government Auditing Standards, issued by the Comptroller General of the United States; and the Specifications for Audits of Counties, Cities, and Towns issued by the Auditor of Public Accounts of the Commonwealth of Virginia. Those standards require that we plan and perform the audit to obtain reasonable assurance about whether the financial statements are free from material misstatement.
An audit involves performing procedures to obtain audit evidence about the amounts and disclosures in the financial statements. The procedures selected depend on the auditor’s judgment, including the assessment of the risks of material misstatement of the financial statements, whether due to fraud or error. In making those risk assessments, the auditor considers internal control relevant to the entity’s preparation and fair presentation of the financial statements in order to design audit procedures that are appropriate in the circumstances, but not for the purpose of expressing an opinion on the effectiveness of the entity’s internal control. Accordingly, we express no such opinion. An audit also includes evaluating the appropriateness of accounting policies used and the reasonableness of significant accounting estimates made by management, as well as evaluating the overall presentation of the financial statements.
We believe that the audit evidence we have obtained is sufficient and appropriate to provide a basis for our audit opinions.

2
Opinions
In our opinion, the financial statements referred to above present fairly, in all material respects, the respective financial position of the governmental activities, the business-type activities, the discretely presented component unit, each major fund, and the aggregate remaining fund information of the City, as of June 30, 2013, and the respective changes in financial position and, where applicable, cash flows thereof for the year then ended in accordance with accounting principles generally accepted in the United States of America.
Other Matters
Required Supplementary Information
Accounting principles generally accepted in the United States of America require that the management’s discussion and analysis, budgetary comparison information, and schedules of funding progress, as listed in the table of contents be presented to supplement the basic financial statements. Such information, although not a part of the basic financial statements, is required by the Governmental Accounting Standards Board, who considers it to be an essential part of financial reporting for placing the basic financial statements in an appropriate operational, economic, or historical context. We have applied certain limited procedures to the required supplementary information in accordance with auditing standards generally accepted in the United States of America, which consisted of inquiries of management about the methods of preparing the information and comparing the information for consistency with management’s responses to our inquiries, the basic financial statements, and other knowledge we obtained during our audit of the basic financial statements. We do not express an opinion or provide any assurance on the information because the limited procedures do not provide us with sufficient evidence to express an opinion or provide any assurance.
Other Information
Our audit was conducted for the purpose of forming opinions on the financial statements that collectively comprise the City’s basic financial statements. The introductory section, other supplementary information, other supplementary schedules and statistical section are presented for purposes of additional analysis and are not a required part of the basic financial statements. The schedule of expenditures of federal awards is presented for purposes of additional analysis as required by U.S. Office of Management and Budget Circular A-133, Audits of States, Local Governments, and Non-Profit Organizations, and is also not a required part of the basic financial statements.
The other supplementary information, supplementary schedules, and the schedule of expenditures of federal awards are the responsibility of management and were derived from and relate directly to the underlying accounting and other records used to prepare the basic financial statements. Such information has been subjected to the auditing procedures applied in the audit of the basic financial statements and certain additional procedures, including comparing and reconciling such information directly to the underlying accounting and other records used to prepare the basic financial statements or to the basic financial statements themselves, and other additional procedures in accordance with auditing standards generally accepted in the United States of America. In our opinion, the other supplementary information, supplementary schedules, and the schedule of expenditures of federal awards are fairly stated in all material respects in relation to the basic financial statements as a whole.
The introductory and statistical sections have not been subjected to the auditing procedures applied in the audit of the basic financial statements and, accordingly, we do not express an opinion or provide any assurance on them.

3
Other Reporting Required by Government Auditing Standards
In accordance with Government Auditing Standards, we have also issued our report dated November 8, 2013 on our consideration of the City’s internal control over financial reporting and on our tests of its compliance with certain provisions of laws, regulations, contracts, and grant agreements and other matters. The purpose of that report is to describe the scope of our testing of internal control over financial reporting and compliance and the results of that testing, and not to provide an opinion on internal control over financial reporting or on compliance. That report is an integral part of an audit performed in accordance with Government Auditing Standards in considering the City’s internal control over financial reporting and compliance.
CERTIFIED PUBLIC ACCOUNTANTS Harrisonburg, Virginia November 8, 2013
4a
CITY OF COLONIAL HEIGHTS, VIRGINIAMANAGEMENT’S DISCUSSION AND ANALYSIS
YEAR ENDED JUNE 30, 2013
The following discussion and analysis of the City of Colonial Heights, Virginia (the City) financial performance provides an overview of the City’s financial activities for the fiscal year ended June 30, 2013. It should be read in conjunction with the transmittal letter and the City’s basic financial statements.
FINANCIAL HIGHLIGHTS
The City’s total net position, excluding those of its component unit, on the government-wide basis, totaled $45,264,048 at June 30, 2013. Of this amount, $38,896,824 is net investment in capital assets, $364,421 is restricted for debt service and $329,699 is restricted for public safety and judicial administrative grants, which results in $5,673,104 that may be used to meet ongoing obligations to citizens and creditors. The Code of Virginia requires the School Board to hold title to the capital assets (buildings and equipment) due to their responsibility for maintaining the asset, however in Virginia the School Board does not have taxing authority and, therefore, it cannot incur debt through general obligation bonds to fund the acquisition, construction or improvement to capital assets. This can result in an inequitable distribution of capital assets and corresponding debt presentation in Virginia. See the footnote presentation for further clarification.
On a government-wide basis for governmental activities, the City’s general revenues of $39,912,125, exclusive of transfers were $2,529,124 more than the expenses net of program revenues of $37,383,001.
At June 30, 2013, the City’s governmental funds balance sheet reported fund balances of $16,345,951.Of this amount, $6,837,232 remains in the various governmental funds of the City as unassigned.
OVERVIEW OF THE FINANCIAL STATEMENTS
This discussion and analysis is intended to serve as an introduction to the City’s basic financial statements. The City’s financial statements present two types of statements, each with a different snapshot of the City’s finances. The focus is on both the City as a whole (government-wide) and the fund financial statements. The government-wide financial statements provide both short-term and long-term information about the City’s overall financial status. The fund financials focus on the individual part of City government, reporting the City’s operations in more detail than the government-wide statements, which present a longer-term view. Presentation of both perspectives provides the user a broader overview, enhances the basis for comparisons, and better reflects the City’s accountability.
GOVERNMENT-WIDE FINANCIAL STATEMENTS
The government-wide financial statements include the Statement of Net Position and the Statement of Activities. These statements provide information about the City as a whole using the accrual basis of accounting, which is the method used by most private-sector enterprises. All current year revenues and expenses are reported in the Statement of Activities regardless of when cash is received or paid. These statements allow readers to answer the question, “Is the City’s position, as a whole, better or worse as a result of the year’s activities?”

4b
CITY OF COLONIAL HEIGHTS, VIRGINIAMANAGEMENT’S DISCUSSION AND ANALYSIS
YEAR ENDED JUNE 30, 2013(Continued)
GOVERNMENT-WIDE FINANCIAL STATEMENTS (CONTINUED)
One of the main goals of these two statements is to report the City’s net position and changes that affected net position during the fiscal year. The change in the City’s net position, the difference between assets and liabilities, is one way to measure the City’s financial health, or financial position. Increases or decreases in net position are indicators of whether the City’s financial health is improving or declining. Other nonfinancial factors, such as changes in the City’s property tax base and the condition of the City’s infrastructure should also be considered in assessing the overall financial health of the City.
In the Statement of Net Position and the Statement of Activities, the City’s activity is classified as follows:
Governmental activities – Most of the City’s basic services are reported here, including general government, judicial administration, public safety, public works, health and welfare, parks, recreation and cultural and community development departments. Property taxes, other local taxes, and federal and state grants finance most of these activities.
Business-type activities – The City’s water, sewage and storm water operations are reported here as the City charges a fee to customers designed to cover all of the cost of services it provides.
Component unit – The City includes a discretely presented component unit in this report, the School Board of the City of Colonial Heights. Although legally separate, the component unit is important because the City is financially accountable for it.
FUND FINANCIAL STATEMENTS
Traditional users of governmental financial statements will find the fund financial statement presentation more familiar. The fund financial statements begin on page 8 and provide detailed information about the most significant funds, not the City as a whole. The City has two types of funds:
Governmental funds – Most of the City’s basic services are included with the governmental funds. Fund-based statements focus on how resources flow into and out of those funds and the balances left at year-end that are available for future spending. These funds are reported on the modified accrual basis of accounting, which measures cash and other liquid assets that can readily be converted to cash. The governmental fund statements provide a detailed short-term overview that helps the reader determine the financial resources that can be spent in the near future to finance the City’s programs. The differences between governmental activities as reported in the government-wide and fund financial statements are reconciled in Exhibits 4 and 6 as listed in the table of contents.
Proprietary funds – When the City charges customers for services it provides, whether to outside customers or to other units of the City, these services are generally reported in proprietary funds. Proprietary funds, like the government-wide statements, utilize the accrual basis of accounting, and their statements provide both short and long-term financial information.

4c
CITY OF COLONIAL HEIGHTS, VIRGINIAMANAGEMENT’S DISCUSSION AND ANALYSIS
YEAR ENDED JUNE 30, 2013(Continued)
FUND FINANCIAL STATEMENTS (CONTINUED)
Proprietary funds (continued) –The City’s enterprise funds, one type of proprietary fund, are the same as the government-wide, business-type activities; however, the fund financial statements provide more detail and additional information, such as cash flows. The City’s enterprise funds are the Water, Sewer, and Storm Water Management funds.
The following table presents a condensed comparison of net assets:
Summary Statement of Net PositionJune 30, 2013 and 2012
(In Millions)
TotalGovernmental Business-type Primary Component
Activities Activities Government Unit
2013
2012 2013 2012 2013
2012 2013
2012
Current and Other Assets $ 32.6 $ 42.5 $ 0.8 $ 1.2 $33.4 $ 43.7 $7.5 $ 7.1Capital Assets, net 57.4 45.9 13.4 14.0 70.8 59.9 19.3 19.9Total Assets 90.0 88.4 14.2 15.2 104.2 103.6 26.8 27.0
Other Liabilities 15.6 14.6 0.3 0.3 15.9 14.9 3.3 3.0Non-current Liabilities 41.0 43.2 2.0 2.8 43.0 46.0 2.6 2.1Total Liabilities 56.6 57.8 2.3 3.1 58.9 60.9 5.9 5.1
Net PositionNet Investment in Capital Assets 27.3 22.7 11.6 11.4 38.9 34.1 19.3 19.9
Restricted 0.4 - 0.4 0.4 0.8 0.4 - -Unrestricted 5.7 7.9 (0.1) 0.3 5.6 9.3 1.6 2.0Total Net Position $ 33.4 $ 30.6 $11.9 $ 12.1 $45.3 $ 42.7 $20.9 $ 21.9
The City’s combined net position increased from $42.7 million to $45.3 million. Net position of the governmental activities increased from $30.6 million to $33.4 million. Governmental activities unrestricted net position, the portion of net position that can be used to finance the day-to-day operations of the City, reflect a decrease of $2.2 million. Net investment in capital assets increased $4.6 million. This represents the amount of capital assets owned by the City including infrastructure, net of any outstanding debt used to fund the asset purchase or construction. Net position is reported as restricted when constraints on asset use are externally imposed by creditors, grantors, contributors, regulators, or are imposed by law through constitutional provisions or enabling legislation.

4d
CITY OF COLONIAL HEIGHTS, VIRGINIAMANAGEMENT’S DISCUSSION AND ANALYSIS
YEAR ENDED JUNE 30, 2013(Continued)
FUND FINANCIAL STATEMENTS (CONTINUED)
Proprietary funds (continued) – The component unit net position reflects an increase in City support due to the established funding agreement with the School Board. The City agreement provides that the School system receive 50.73% of specified revenues. The increase also reflects increased amounts being established for pay-as-you-go infrastructure maintenance.
The following table presents a condensed comparison of the changes in net assets:
Summary Statement of Changes in Net PositionYears Ended June 30, 2013 and 2012
(In Millions)
Governmental Business-type Total Primary ComponentActivities Activities Government Unit
2013 2012 2013 2012 2013 2012 2013 2012Revenues:
Program revenues:Charges for services $ 6.9 $ 5.5 $ 4.5 $ 5.7 $ 11.4 $ 11.2 $ 0.6 $ 0.4Operating grants and contributions 5.0 5.4 - - 5.0 5.4 14.6 14.8
Capital grants and contributions 2.4 2.8 - - 2.4 2.8 - -General revenues: Property taxes 21.5 20.8 - - 21.5 20.8 - -Other local taxes 16.3 15.6 - - 16.3 15.6 - -Payment from other governments - - - - - - 19.3 19.0Intergovernmental, non-categorical aid 1.8 1.8 - - 1.8 1.8 - -Use of money and property 0.2 0.2 - - 0.2 0.2 - -Miscellaneous 0.1 0.1 - - 0.1 0.1 0.1 0.4
Total revenues 54.2 52.2 $ 4.5 5.7 58.7 57.9 34.6 34.6
Expenses:General government 8.5 8.4 - - 8.5 8.4 - -Judicial administration 4.7 4.2 - - 4.7 4.2 - -Public safety 9.0 8.9 - - 9.0 8.9 - -Public works 5.3 4.2 - - 5.3 4.2 - -Health and welfare 0.8 0.6 - - 0.8 0.6 - -Parks, recreation and cultural 2.4 2.3 - - 2.4 2.3 - -Community development 0.5 0.5 - - 0.5 0.5 - -Education 19.3 19.0 - - 19.3 19.0 35.6 34.3Interest 1.2 0.9 - - 1.2 0.9 -Water, sewer, solid waste, and stormwater management - - 4.4 5.8 4.4 5.8 -
Total expenses 51.7 49.0 4.4 5.8 56.1 54.8 35.6 34.3
Change in Net Position Before Transfers 2.5 3.2 0.1 (0.1) 2.6 3.1 (1.0) 0.3
Transfers 0.3 (0.1) (0.3) 0.1 - - - -Change in Net Position 2.8 3.1 (0.2) - 2.6 3.1 (1.0) 0.3Net Position, beginning 30.6 27.5 12.1 12.1 42.7 39.6 21.9 21.6Net Position, ending $ 33.4 $ 30.6 $ 11.9 $ 12.1 $ 45.3 $ 42.7 $ 20.9 $ 21.9
CITY OF COLONIAL HEIGHTS, VIRGINIAMANAGEMENT’S DISCUSSION AND ANALYSIS
YEAR ENDED JUNE 30, 2013
FUND FINANCIAL STATEMENTS (CONTINUED)
Proprietary funds (continued) – The property tax classification, which comprised approximatelytotal revenue generated by governmental activities, includes real estate tax, the local portion of personal property tax, and public services corporation for the City totaled $17.9 million. The assessed value of real property in the City decreased overall .7% for the calendar year due to new biannual assessment.
In 1998, the Commonwealth enacted the Personal Property Tax Relief Act (PPTRA). The Commonwealth’s share of personal property taxes allocated to the City was 63% of vehicle loan values for the current fiscal year and is included in the intergovernmental category. Personal property tarevenue, including the Commonwealth share, remained $3.9 million for fiscal year 2013. The net assessed value of taxable personal property decreased $789,396 million or (.6) % from 2012 to 2013 after an increase of $3.5 million from 2011 to 2012.
Sales tax, utility tax, business and professional occupational tax, prepared food and beverage tax, transient room tax, and utility tax comprise the majority of other local taxes collected by the City which comprised approximately 30% of total revenues generat
Operating grants and contributions comprised approximately Street maintenance funds, funding received under House Bill 599 for law enforcement, and reimbursement for shared expenses of the constitutional officers are some of the major sources of revenue included in this category.
Charges for services include items such as EMS transport fees, court fees, inspection fees, reimbursements for housing prisoners, and garbage collection feand increased over 7% over past collections after a 10% increase in fiscal year 2012.
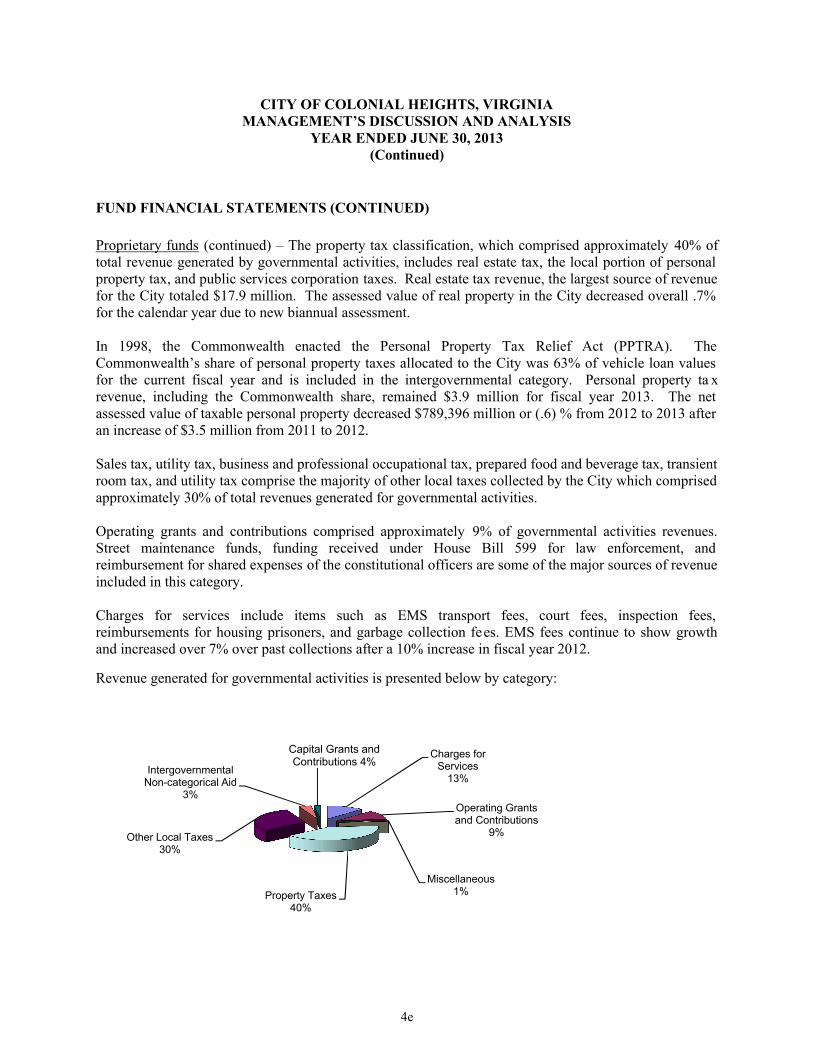
Revenue generated for governmental activities is presented below by category:
Property Taxes40%
Other Local Taxes30%
Intergovernmental Non-categorical Aid
3%
Capital Grants and Contributions 4%
4e
CITY OF COLONIAL HEIGHTS, VIRGINIAMANAGEMENT’S DISCUSSION AND ANALYSIS
YEAR ENDED JUNE 30, 2013(Continued)
MENTS (CONTINUED)
The property tax classification, which comprised approximatelytotal revenue generated by governmental activities, includes real estate tax, the local portion of personal property tax, and public services corporation taxes. Real estate tax revenue, the largest source of revenue for the City totaled $17.9 million. The assessed value of real property in the City decreased overall .7% for the calendar year due to new biannual assessment.
ted the Personal Property Tax Relief Act (PPTRA). The Commonwealth’s share of personal property taxes allocated to the City was 63% of vehicle loan values for the current fiscal year and is included in the intergovernmental category. Personal property tarevenue, including the Commonwealth share, remained $3.9 million for fiscal year 2013. The net assessed value of taxable personal property decreased $789,396 million or (.6) % from 2012 to 2013 after an increase of $3.5 million from 2011 to 2012.
s tax, utility tax, business and professional occupational tax, prepared food and beverage tax, transient room tax, and utility tax comprise the majority of other local taxes collected by the City which comprised
% of total revenues generated for governmental activities.
Operating grants and contributions comprised approximately 9% of governmental activities revenues. Street maintenance funds, funding received under House Bill 599 for law enforcement, and
of the constitutional officers are some of the major sources of revenue
Charges for services include items such as EMS transport fees, court fees, inspection fees, reimbursements for housing prisoners, and garbage collection fees. EMS fees continue to show growth and increased over 7% over past collections after a 10% increase in fiscal year 2012.
Revenue generated for governmental activities is presented below by category:
Charges for Services
13%
Operating Grants and Contributions
9%
Miscellaneous1%
Capital Grants and Contributions 4%
The property tax classification, which comprised approximately 40% of total revenue generated by governmental activities, includes real estate tax, the local portion of personal
taxes. Real estate tax revenue, the largest source of revenue for the City totaled $17.9 million. The assessed value of real property in the City decreased overall .7%
ted the Personal Property Tax Relief Act (PPTRA). The Commonwealth’s share of personal property taxes allocated to the City was 63% of vehicle loan values for the current fiscal year and is included in the intergovernmental category. Personal property ta x revenue, including the Commonwealth share, remained $3.9 million for fiscal year 2013. The net assessed value of taxable personal property decreased $789,396 million or (.6) % from 2012 to 2013 after
s tax, utility tax, business and professional occupational tax, prepared food and beverage tax, transient room tax, and utility tax comprise the majority of other local taxes collected by the City which comprised
% of governmental activities revenues. Street maintenance funds, funding received under House Bill 599 for law enforcement, and
of the constitutional officers are some of the major sources of revenue
Charges for services include items such as EMS transport fees, court fees, inspection fees, es. EMS fees continue to show growth

CITY OF COLONIAL HEIGHTS, VIRGINIAMANAGEMENT’S DISCUSSION AND ANALYSIS
YEAR ENDED JUNE 30, 2013
FUND FINANCIAL STATEMENTS (CONTINUED)
Proprietary funds (continued) –Funding, established by the revenue sharing agreement, of $19.3 million was provided to the City of Colonial Heights School Board to support School operations. This exceeded original budget estimated at $19.1 million, but within revised estimates.
Public Works and Health and Welfare expenses comprised approximately governmental activities expenses. Expenses for Building Maintenance, Street Paving, and Street Maintenance are included in Public Works category. The City experiencand incarceration costs and resulted in a higher unexpended balance than traditionally projected. The Comprehensive Services Act and social services programs incurred the majority of expenses reported in the Health and Welfare category and reflect an increase over last year, but still under projected total expenses. Employee benefits showed unexpected increase due to a change in traditional employee lapse.
Expenses of the governmental activities are shown by functional area
The net position of business-type activities decreased $201,567 during 2013.
The enterprise rate structure was maintained for fiscal year 2013 but was increased 2.5% for Fiscal Year 14. No major changes in operations were experienced. The City’s esfee to deal with operational and capital expenses for State and Federal mandates that had previously been funded by General Fund transfers was also maintained at current levels.
Parks, Recreation and Cultural
5%
Community Development1%
Education37%
Interest 2%
4f
CITY OF COLONIAL HEIGHTS, VIRGINIAMANAGEMENT’S DISCUSSION AND ANALYSIS
YEAR ENDED JUNE 30, 2013(Continued)
MENTS (CONTINUED)
Funding, established by the revenue sharing agreement, of $19.3 million was provided to the City of Colonial Heights School Board to support School operations. This exceeded original budget estimated at $19.1 million, but within revised estimates.
Works and Health and Welfare expenses comprised approximately 10% and 2% respectfully, of governmental activities expenses. Expenses for Building Maintenance, Street Paving, and Street Maintenance are included in Public Works category. The City experienced lower than expected energy and incarceration costs and resulted in a higher unexpended balance than traditionally projected. The Comprehensive Services Act and social services programs incurred the majority of expenses reported in
category and reflect an increase over last year, but still under projected total expenses. Employee benefits showed unexpected increase due to a change in traditional employee lapse.
Expenses of the governmental activities are shown by functional area:
type activities decreased $201,567 during 2013.
The enterprise rate structure was maintained for fiscal year 2013 but was increased 2.5% for Fiscal Year 14. No major changes in operations were experienced. The City’s es tablished Stormwater Management fee to deal with operational and capital expenses for State and Federal mandates that had previously been funded by General Fund transfers was also maintained at current levels.
General Government17%
Judicial Administration9%
Public Safety17%
Public Works10%
Health and Welfare2%Parks, Recreation and
Funding, established by the revenue sharing agreement, of $19.3 million was provided to the City of Colonial Heights School Board to support School operations. This exceeded
% respectfully, of governmental activities expenses. Expenses for Building Maintenance, Street Paving, and Street
ed lower than expected energy and incarceration costs and resulted in a higher unexpended balance than traditionally projected. The Comprehensive Services Act and social services programs incurred the majority of expenses reported in
category and reflect an increase over last year, but still under projected total expenses. Employee benefits showed unexpected increase due to a change in traditional employee lapse.
The enterprise rate structure was maintained for fiscal year 2013 but was increased 2.5% for Fiscal Year tablished Stormwater Management
fee to deal with operational and capital expenses for State and Federal mandates that had previously been

4g
MANAGEMENT’S DISCUSSION AND ANALYSISYEAR ENDED JUNE 30, 2013
(Continued)
FINANCIAL ANALYSIS OF THE CITY’S FUNDS
For the fiscal year ended June 30, 2013, the governmental funds reflect a total fund balance of $16,345,951. Approximately $16.3 million of this amount constitutes fund balances which are available for spending services and capital projects. Restricted, Committed and Assigned fund balances are designated to purchase capital equipment, pay claims, fund future debt service requirements, pay for future years’ capital projects expenditures and encumbrances, which indicates that it has already been committed to liquidate contracts and purchase orders outstanding at year-end.
The General Fund is the chief operating fund of the City. At the end of the current fiscal year, the General Fund spendable fund balance was $10,314,627, while the total fund balance was $10,384,486. As a measure of the General Fund’s liquidity, it may be useful to compare both unassigned fund balance and total fund balance to total fund expenditures. Unassigned fund balance represents approximately 15.6% of the total General Fund expenditures, while total fund balance represents 20.1% of that same amount.
The fund balance of the General Fund reflects an increase of $112,829 during the current fiscal year. The General Fund began Fiscal Year 2013 with budgeted revenue and expenditure amounts that are equal. This includes $55,000 transferred to the Capital Projects fund for a one-time capital projects.
Local taxes generated the majority of General Fund revenue, totaling approximately $37.7 million in fiscal 2013. Increased current collections of food and lodging taxes offset the reduction in personal property collections.
Intergovernmental revenue is the second largest source of General Fund revenues, generating approximately $6.4 million in fiscal year 2013. The majority of this revenue is received from the Commonwealth and includes law enforcement funding received under Virginia House Bill 599, and street maintenance funds. This is a $454,408 decrease from fiscal year 2012. Decrease is due to $599,543 in one-time FEMA funds received in Fiscal Year 2012.
CAPITAL PROJECTS FUND HIGHLIGHTS
The Capital Projects Fund reflects the receipt of $2,450,234 in donations, Federal and State funding for ongoing road and trail projects and transfers of $55,000 and from the General Fund for matching grant in the river trail project. Project expenditures totaled $13,780,361 which resulted in a net decrease in fund balances of $11,330,127 for an ending fund balance of $5,961,465.
4h
CITY OF COLONIAL HEIGHTS, VIRGINIAMANAGEMENT’S DISCUSSION AND ANALYSIS
YEAR ENDED JUNE 30, 2013(Continued)
GENERAL FUND BUDGETARY HIGHLIGHTS
General Fund revenues were over original budgeted revenues by $407,407 and over final budgeted revenues by $201,998 or 0.4%. Reductions in Real Property Taxes and lodging tax revenues were offset by increases in food tax revenues increases. The City raised the Meals Tax from 5% to 6% and raised the Real property rate from $1.10 to $1.14 per hundred on March 1, 2012 to pay for the construction of the new City Court House. Under the Revenue Sharing Agreement with the City’s School System, some revenue surpluses are also shared with the component unit based on their percentage allocation of these revenues. This plan was modified due to the above tax increases for the Courthouse, with any surplus funds generated by these increases being allocated under the original agreement. Fiscal Year 2013 revenues reflect the first full fiscal year of increased collections.
General Fund expenditures and transfers exceeded the original budget by $551,075, and were under the final, amended budget by $173,890 or .3%. During fiscal year 2013, City Council amended the budget to appropriate the awarding of donations and receipt of operational grants.
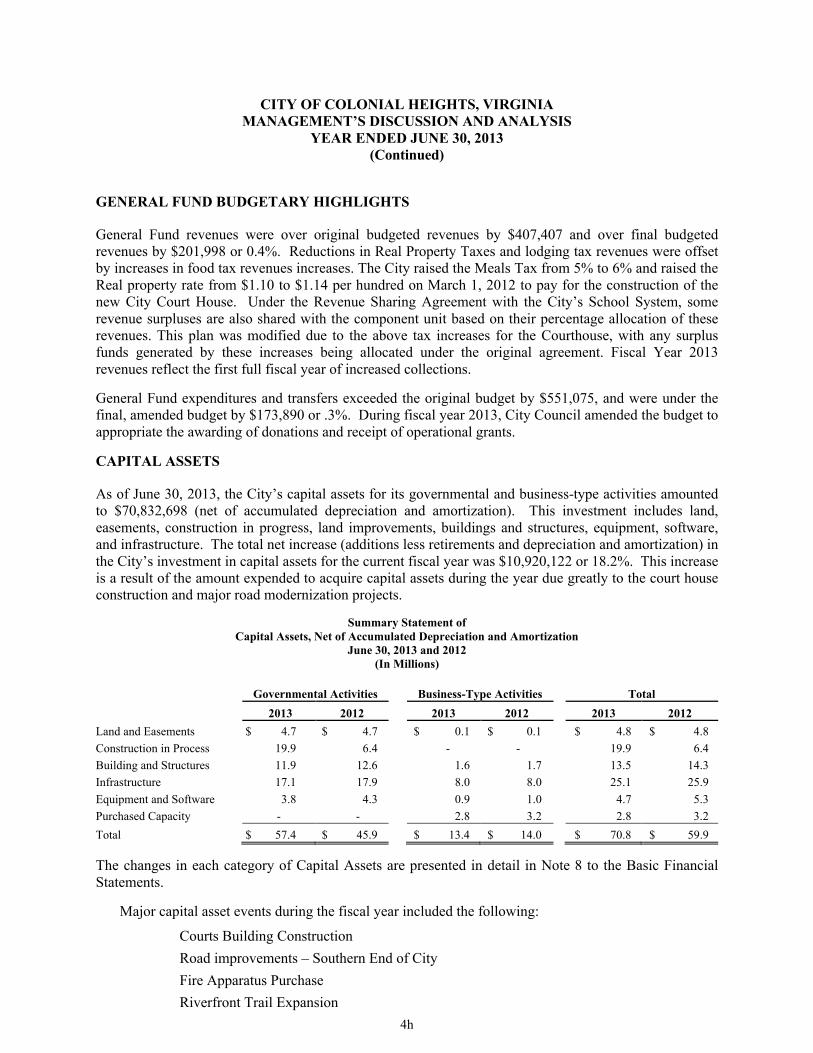
CAPITAL ASSETS
As of June 30, 2013, the City’s capital assets for its governmental and business-type activities amounted to $70,832,698 (net of accumulated depreciation and amortization). This investment includes land, easements, construction in progress, land improvements, buildings and structures, equipment, software, and infrastructure. The total net increase (additions less retirements and depreciation and amortization) in the City’s investment in capital assets for the current fiscal year was $10,920,122 or 18.2%. This increase is a result of the amount expended to acquire capital assets during the year due greatly to the court house construction and major road modernization projects.
Summary Statement ofCapital Assets, Net of Accumulated Depreciation and Amortization
June 30, 2013 and 2012(In Millions)
Governmental Activities Business-Type Activities Total
2013 2012 2013 2012 2013 2012
Land and Easements $ 4.7 $ 4.7 $ 0.1 $ 0.1 $ 4.8 $ 4.8
Construction in Process 19.9 6.4 - - 19.9 6.4
Building and Structures 11.9 12.6 1.6 1.7 13.5 14.3
Infrastructure 17.1 17.9 8.0 8.0 25.1 25.9
Equipment and Software 3.8 4.3 0.9 1.0 4.7 5.3
Purchased Capacity - - 2.8 3.2 2.8 3.2
Total $ 57.4 $ 45.9 $ 13.4 $ 14.0 $ 70.8 $ 59.9
The changes in each category of Capital Assets are presented in detail in Note 8 to the Basic Financial Statements.
Major capital asset events during the fiscal year included the following:
Courts Building Construction
Road improvements – Southern End of City
Fire Apparatus Purchase
Riverfront Trail Expansion

4i
CITY OF COLONIAL HEIGHTS, VIRGINIAMANAGEMENT’S DISCUSSION AND ANALYSIS
YEAR ENDED JUNE 30, 2013(Continued)
LONG-TERM DEBT
At June 30, 2013, the City’s long-term liabilities, including the landfill obligation, OPEB and not including compensated absences, totaled $41,255,043 consisting of $39,351,736 related to governmental activities, and $1,903,307 related to business-type activities. An obligation relating to the purchase of capacity in the South Central Wastewater Authority is detailed in Notes 8 and 9.
The City maintained ratings of AA, AA- and Aa2 from Fitch Investors Service Inc., Standard & Poor’s Rating Service and Moody’s Investor Service, respectively.
The Charter of the City and Code of Virginia limits the City’s net debt to 10% of the assessed valuation of real estate. The City’s entity-wide debt of $37,045,000 is below the legal debt limit of $166,417,662.
The School Board Component Unit relies upon the City to provide full faith and credit for any debt obligations incurred. Therefore, the City reports School Board Component Unit long-term liabilities, other than compensated absences, as its own. In addition to bonded debt, the City’s long-term obligations include compensated absences. Additional information concerning the City’s long-term liabilities is presented in Notes 9, 10, and 13 to the Basic Financial Statements.
ECONOMIC FACTORS AND NEXT YEAR’S BUDGET AND RATES
The unemployment rate for the City at June 30, 2013 was 7.3%, compared to a June 30, 2012 rate of 6.9%. This is above the state average of 5.9% and compares favorably with the national average unemployment rate of 8.1%.
The City had a population of 17,411, according to the 2010 census, an increase of 510 since the 2000 census. Current estimation of the City’s population by the U.S. Census Bureau is 17,749.
Primary revenue sources for the City’s General Fund are property taxes, sales tax, business and occupational licenses, meals tax, and state revenues. In establishing the budget, historical and trend data are analyzed. In addition economic indicators and the impact the economy will have on the historical data is taken into consideration. Throughout the year, management monitors revenues and economic indicators to determine if they are on target with the analysis used to develop the budget. A monthly analysis is prepared for City Council that presents current financial position and a year to date comparison to the prior year’s position.
The adopted fiscal 2014 General Fund budget increased $1,656,433 over 2013 amounts that maintained basic current services to the community and current operating capital investments, while absorbing a reduction in Real Estate tax assessment and providing funding for the issued 2012 General Obligation Bonds. The Solid Waste Management Fund was reclassified back into the General Fund and a full year of increased Real Estate and Meal tax rates for the bond issuance are reflected in this budget. The projected revenues for fiscal 2014 are $52,711,889 or 3.2% greater than fiscal 2013. The projected increase in the major six revenues, minus any rate increases, at budget creation was 1.5% for fiscal 2014. Since its passage, the Commonwealth of Virginia’s estimated funding has been increased slightly due to mostly increases in projected street maintenance revenues.

4j
CITY OF COLONIAL HEIGHTS, VIRGINIAMANAGEMENT’S DISCUSSION AND ANALYSIS
YEAR ENDED JUNE 30, 2013(Continued)
CONTACTING THE CITY’S FINANCIAL MANAGEMENT
This financial report is designed to provide our citizens, taxpayers, customers, investors and creditors with a general overview of the City’s finances and to demonstrate the City’s accountability for the resources it receives and their uses. Questions concerning this report or requests for additional information should be directed to the Director of Finance, P.O. Box 3401, Colonial Heights, Virginia 23834, telephone (804) 520-9332. The City’s website address is www.colonialheightsva.gov.

THIS PAGE INTENTIONALLY BLANK

5
BASIC FINANCIAL STATEMENTS
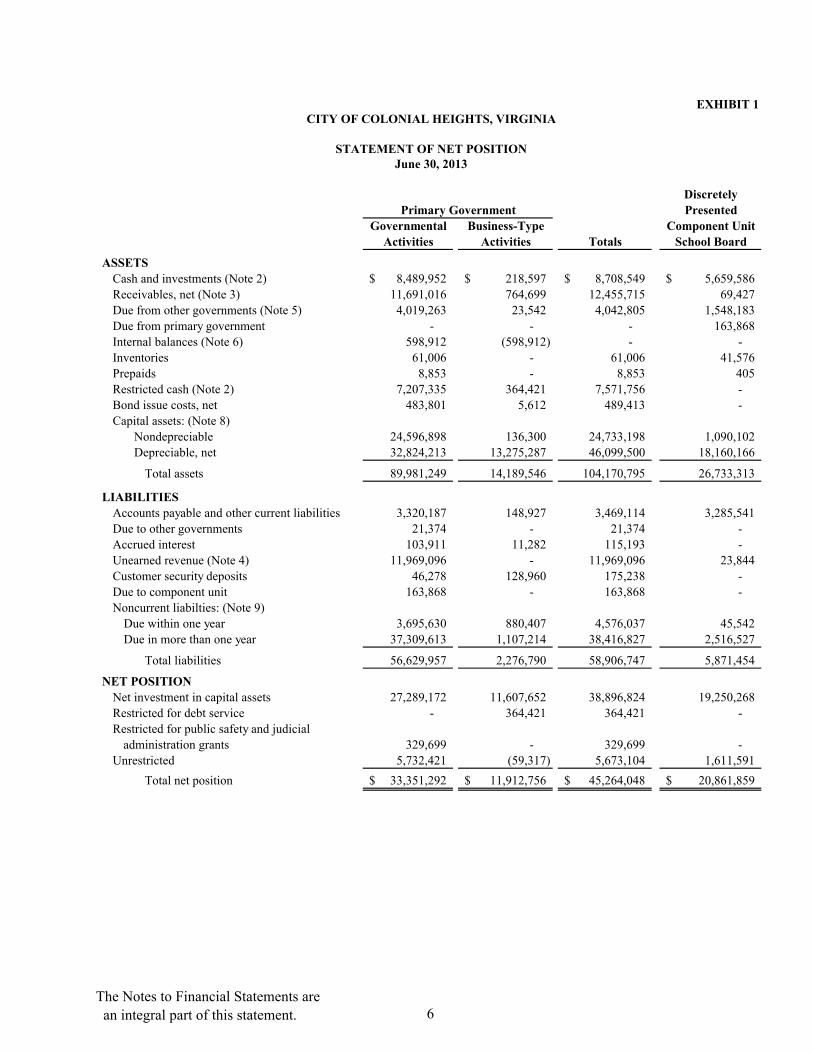
EXHIBIT 1
Discretely
Presented
Governmental Business-Type Component Unit
Activities Activities Totals School Board
ASSETS
Cash and investments (Note 2) 8,489,952$ 218,597$ 8,708,549$ 5,659,586$
Receivables, net (Note 3) 11,691,016 764,699 12,455,715 69,427
Due from other governments (Note 5) 4,019,263 23,542 4,042,805 1,548,183
Due from primary government - - - 163,868
Internal balances (Note 6) 598,912 (598,912) - -
Inventories 61,006 - 61,006 41,576
Prepaids 8,853 - 8,853 405
Restricted cash (Note 2) 7,207,335 364,421 7,571,756 -
Bond issue costs, net 483,801 5,612 489,413 -
Capital assets: (Note 8)
Nondepreciable 24,596,898 136,300 24,733,198 1,090,102
Depreciable, net 32,824,213 13,275,287 46,099,500 18,160,166
Total assets 89,981,249 14,189,546 104,170,795 26,733,313
LIABILITIES
Accounts payable and other current liabilities 3,320,187 148,927 3,469,114 3,285,541
Due to other governments 21,374 - 21,374 -
Accrued interest 103,911 11,282 115,193 -
Unearned revenue (Note 4) 11,969,096 - 11,969,096 23,844
Customer security deposits 46,278 128,960 175,238 -
Due to component unit 163,868 - 163,868 -
Noncurrent liabilties: (Note 9)
Due within one year 3,695,630 880,407 4,576,037 45,542
CITY OF COLONIAL HEIGHTS, VIRGINIA
STATEMENT OF NET POSITIONJune 30, 2013
Primary Government
Due within one year 3,695,630 880,407 4,576,037 45,542
Due in more than one year 37,309,613 1,107,214 38,416,827 2,516,527
Total liabilities 56,629,957 2,276,790 58,906,747 5,871,454
NET POSITION
Net investment in capital assets 27,289,172 11,607,652 38,896,824 19,250,268
Restricted for debt service - 364,421 364,421 -
Restricted for public safety and judicial
administration grants 329,699 - 329,699 -
Unrestricted 5,732,421 (59,317) 5,673,104 1,611,591
Total net position 33,351,292$ 11,912,756$ 45,264,048$ 20,861,859$
The Notes to Financial Statements are
an integral part of this statement. 6

EXHIBIT 2
Operating Capital Business- Discretely PresentedCharges for Grants and Grants and Governmental Type Component Unit
Functions/Programs Expenses Services Contributions Contributions Activities Activities Totals School Board
Primary Government:Governmental activities:
General government 8,513,050$ 3,535,056$ 840,349$ -$ (4,137,645)$ (4,137,645)$ -$ Judicial administration 4,654,684 729,979 700,761 - (3,223,944) (3,223,944) - Public safety 9,019,958 1,261,751 816,261 95,036 (6,846,910) (6,846,910) - Public works 5,340,369 1,224,454 2,290,207 2,318,257 492,549 492,549 - Health and welfare 758,401 - - - (758,401) (758,401) - Parks, recreation, and cultural 2,388,151 182,759 - - (2,205,392) (2,205,392) - Community development 500,588 - - - (500,588) (500,588) - Education 19,296,419 - 323,897 - (18,972,522) (18,972,522) - Interest 1,230,148 - - - (1,230,148) (1,230,148) -
Total governmental activities 51,701,768 6,933,999 4,971,475 2,413,293 (37,383,001) (37,383,001) - Business-type activities:
Water and sewer 4,197,076 4,144,465 - - (52,611)$ (52,611) - Storm water management 257,289 372,312 - - 115,023 115,023 -
Total business-type activities 4,454,365 4,516,777 - - 62,412 62,412 -
Total primary government 56,156,133$ 11,450,776$ 4,971,475$ 2,413,293$ (37,383,001) 62,412 (37,320,589) -
Discretely Presented Component Unit:
School Board 35,569,416$ 573,499$ 14,599,996$ -$ (20,395,921)
General revenues:
Program Revenues
Net (Expense) Revenue and
Changes in Net PositionPrimary Government
CITY OF COLONIAL HEIGHTS, VIRGINIA
STATEMENT OF ACTIVITIES
Year Ended June 30, 2013
The Notes to Financial Statements are
an integral part of this statement. 7
General revenues:
Taxes:
General property taxes 21,512,047 - 21,512,047 -
Other local taxes:
Local sales and use 7,174,334 - 7,174,334 -
Food and lodging 6,930,069 - 6,930,069 -
Consumer utility and communications sales and use 1,676,201 - 1,676,201 -
Other 529,022 - 529,022 -
Payments from City - - - 19,296,419
Intergovernmental, non-categorical aid 1,758,697 - 1,758,697 -
Use of money and property 233,822 - 233,822 -
Miscellaneous 97,933 - 97,933 102,450
Transfers (Note 7) 263,979 (263,979) - -
Total general revenues and transfers 40,176,104 (263,979) 39,912,125 19,398,869
Change in net position 2,793,103 (201,567) 2,591,536 (997,052)
NET POSITION AT JULY 1 30,558,189 12,114,323 42,672,512 21,858,911
NET POSITION AT JUNE 30 33,351,292$ 11,912,756$ 45,264,048$ 20,861,859$
The Notes to Financial Statements are
an integral part of this statement. 7

EXHIBIT 3
Total
Capital Governmental
General Projects Funds
ASSETS Cash and investments 7,394,963$ 1,094,989$ 8,489,952$
Receivables, net 11,691,016 - 11,691,016
Due from other governments 2,716,895 1,302,368 4,019,263
Due from other funds 598,912 - 598,912
Inventories 61,006 - 61,006
Prepaids 8,853 - 8,853
Restricted cash - 7,207,335 7,207,335
Total assets 22,471,645$ 9,604,692$ 32,076,337$
LIABILITIES
Accounts payable and other current liabilities 963,203$ 2,356,984$ 3,320,187$
Due to other governments 21,374 - 21,374
Due to component unit 163,868 - 163,868
Deferred revenue (Note 4) 10,892,436 1,286,243 12,178,679
Customer security deposits 46,278 - 46,278
Total liabilities 12,087,159 3,643,227 15,730,386
FUND BALANCES (Note 14)
Nonspendable 69,859 - 69,859
Restricted 329,699 7,207,335 7,537,034
Committed 327,569 - 327,569
Assigned 1,574,257 - 1,574,257
Unassigned 8,083,102 (1,245,870) 6,837,232
Total fund balances 10,384,486 5,961,465 16,345,951
Total liabilities and fund balances 22,471,645$ 9,604,692$ 32,076,337$
CITY OF COLONIAL HEIGHTS, VIRIGNIA
BALANCE SHEET
GOVERNMENTAL FUNDS
June 30, 2013
The Notes to Financial Statements are
an integral part of this statement. 8

EXHIBIT 4
Total Fund Balance - Governmental Funds 16,345,951$
Amounts reported for governmental activities in the Statement of Net Position
are different because:
Capital assets used in governmental activities are not financial resources,
and, therefore, are not reported in the funds.
Nondepreciable 24,596,898$
Depreciable, net 32,824,213
57,421,111
Bond issuance costs are reported as expenditures in the governmental funds,
but are amortized over the life of the debt in the Statement of Net Position:
Issuance costs 787,138
Accumulated amortization (303,337)
483,801
Certain receivables are not available to pay for current-period expenditures
and therefore are deferred in the funds. 209,583
Long-term liabilities are not due and payable in the current period and
therefore are not reported in the funds.
Bonds payable, including unamortized deferred amounts (37,823,075)
Landfill post-closure liability (356,000)
Compensated absences (1,653,507)
Other post-employment benefits (1,172,661)
Accrued interest payable (103,911)
(41,109,154)
Total Net Position - Governmental Activities 33,351,292$
CITY OF COLONIAL HEIGHTS, VIRIGNIA
RECONCILIATION OF THE GOVERNMENTAL FUNDS BALANCE SHEET
TO THE STATEMENT OF NET POSITION
June 30, 2013
The Notes to Financial Statements are
an integral part of this statement. 9
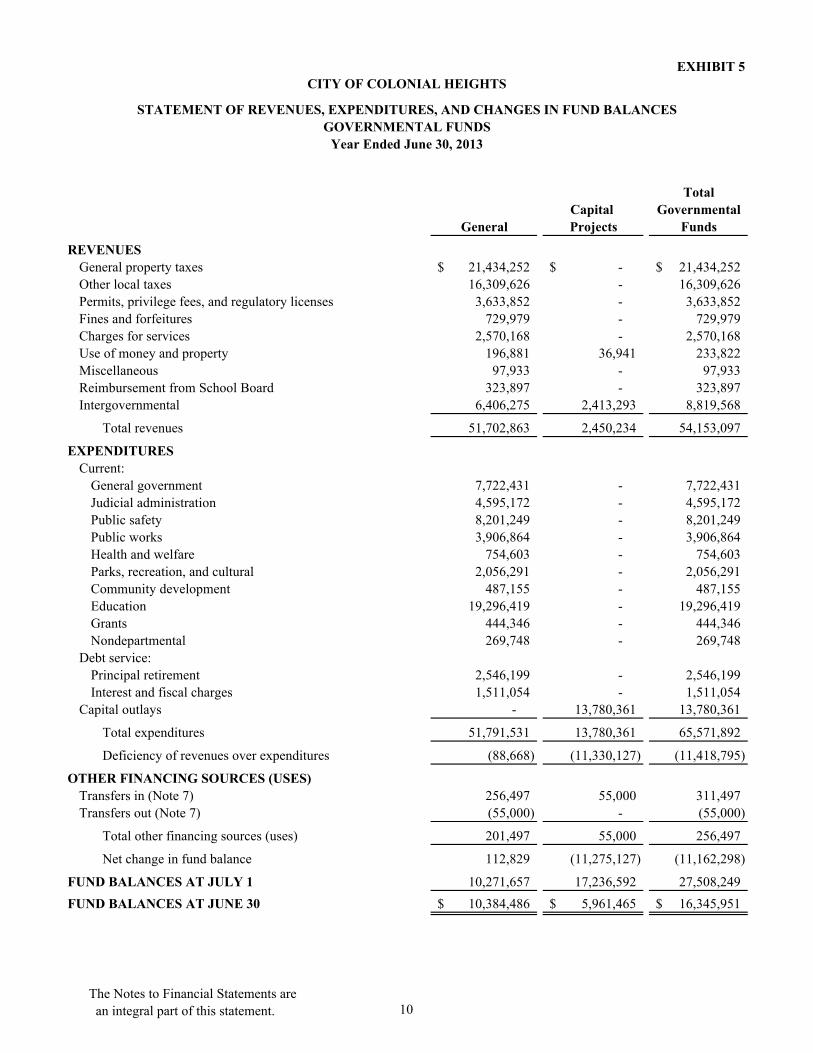
EXHIBIT 5
Total
Capital Governmental
General Projects Funds
REVENUES
General property taxes 21,434,252$ -$ 21,434,252$
Other local taxes 16,309,626 - 16,309,626
Permits, privilege fees, and regulatory licenses 3,633,852 - 3,633,852
Fines and forfeitures 729,979 - 729,979
Charges for services 2,570,168 - 2,570,168
Use of money and property 196,881 36,941 233,822
Miscellaneous 97,933 - 97,933
Reimbursement from School Board 323,897 - 323,897
Intergovernmental 6,406,275 2,413,293 8,819,568
Total revenues 51,702,863 2,450,234 54,153,097
EXPENDITURES
Current:
General government 7,722,431 - 7,722,431
Judicial administration 4,595,172 - 4,595,172
Public safety 8,201,249 - 8,201,249
Public works 3,906,864 - 3,906,864
Health and welfare 754,603 - 754,603
Parks, recreation, and cultural 2,056,291 - 2,056,291
Community development 487,155 - 487,155
Education 19,296,419 - 19,296,419
Grants 444,346 - 444,346
Nondepartmental 269,748 - 269,748
Debt service:
Principal retirement 2,546,199 - 2,546,199
Interest and fiscal charges 1,511,054 - 1,511,054
Capital outlays - 13,780,361 13,780,361
Total expenditures 51,791,531 13,780,361 65,571,892
Deficiency of revenues over expenditures (88,668) (11,330,127) (11,418,795)
OTHER FINANCING SOURCES (USES)
Transfers in (Note 7) 256,497 55,000 311,497
Transfers out (Note 7) (55,000) - (55,000)
Total other financing sources (uses) 201,497 55,000 256,497
Net change in fund balance 112,829 (11,275,127) (11,162,298)
FUND BALANCES AT JULY 1 10,271,657 17,236,592 27,508,249
FUND BALANCES AT JUNE 30 10,384,486$ 5,961,465$ 16,345,951$
CITY OF COLONIAL HEIGHTS
STATEMENT OF REVENUES, EXPENDITURES, AND CHANGES IN FUND BALANCES
GOVERNMENTAL FUNDS
Year Ended June 30, 2013
The Notes to Financial Statements are
an integral part of this statement. 10
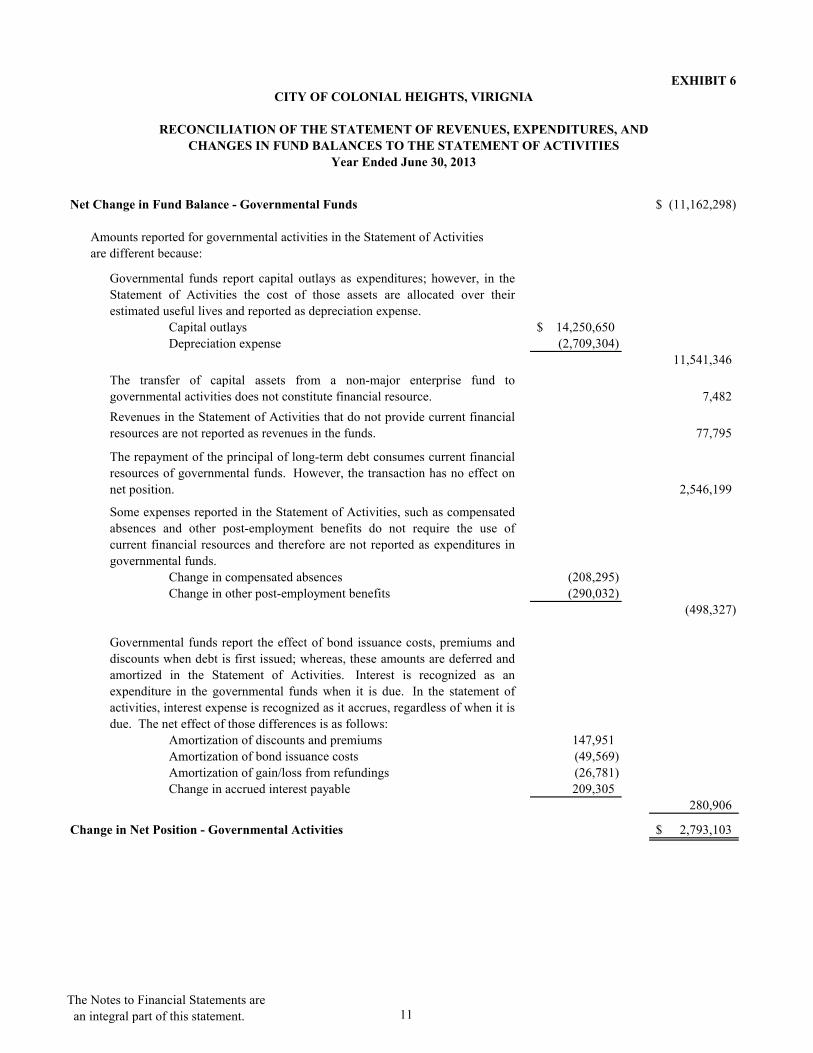
EXHIBIT 6
Net Change in Fund Balance - Governmental Funds (11,162,298)$
Amounts reported for governmental activities in the Statement of Activities
are different because:
Capital outlays 14,250,650$
Depreciation expense (2,709,304)
11,541,346
7,482
77,795
2,546,199
Change in compensated absences (208,295)
Change in other post-employment benefits (290,032)
(498,327)
Amortization of discounts and premiums 147,951
Amortization of bond issuance costs (49,569)
Amortization of gain/loss from refundings (26,781)
Change in accrued interest payable 209,305
280,906
Change in Net Position - Governmental Activities 2,793,103$
The repayment of the principal of long-term debt consumes current financial
resources of governmental funds. However, the transaction has no effect on
net position.
Some expenses reported in the Statement of Activities, such as compensated
absences and other post-employment benefits do not require the use of
current financial resources and therefore are not reported as expenditures in
governmental funds.
Governmental funds report the effect of bond issuance costs, premiums and
discounts when debt is first issued; whereas, these amounts are deferred and
amortized in the Statement of Activities. Interest is recognized as an
expenditure in the governmental funds when it is due. In the statement of
activities, interest expense is recognized as it accrues, regardless of when it is
due. The net effect of those differences is as follows:
CITY OF COLONIAL HEIGHTS, VIRIGNIA
RECONCILIATION OF THE STATEMENT OF REVENUES, EXPENDITURES, AND
CHANGES IN FUND BALANCES TO THE STATEMENT OF ACTIVITIES
Year Ended June 30, 2013
Governmental funds report capital outlays as expenditures; however, in the
Statement of Activities the cost of those assets are allocated over their
estimated useful lives and reported as depreciation expense.
Revenues in the Statement of Activities that do not provide current financial
resources are not reported as revenues in the funds.
The transfer of capital assets from a non-major enterprise fund to
governmental activities does not constitute financial resource.
The Notes to Financial Statements are
an integral part of this statement. 11

EXHIBIT 7
Nonmajor
Water Proprietary
and Sewer Sewer Funds Totals
ASSETS
Current assets:
Cash and investments -$ -$ 218,597$ 218,597$
Receivables, net 694,969 - 69,730 764,699
Due from other governments 23,542 - - 23,542
Total current assets 718,511 - 288,327 1,006,838
Noncurrent assets:
Restricted cash 364,421 - - 364,421
Deferred bond costs, net 5,612 - - 5,612
Capital assets, net 13,267,440 - 144,147 13,411,587
Total noncurrent assets 13,637,473 - 144,147 13,781,620
Total assets 14,355,984 - 432,474 14,788,458
LIABILITIES
Current liabilities:
Accounts payable and other current liabilities 145,122 - 3,805 148,927
Accrued interest 11,282 - - 11,282
Due to other funds 598,912 - - 598,912
Customer security deposits 128,960 - - 128,960
Compensated absences 37,942 - 3,284 41,226
Debt obligations, current 806,623 - 32,558 839,181
Total current liabilities 1,728,841 - 39,647 1,768,488
Noncurrent liabilities:
Compensated absences 40,392 - 2,696 43,088
Other post-employment benefits 86,778 - 6,982 93,760
Debt obligations 970,366 - - 970,366
Total noncurrent liabilities 1,097,536 - 9,678 1,107,214
Total liabilities 2,826,377 - 49,325 2,875,702
NET POSITION
Net investment in capital assets 11,496,063 - 111,589 11,607,652
Restricted for debt service 364,421 - - 364,421
Unrestricted (330,877) - 271,560 (59,317)
Total net position 11,529,607$ -$ 383,149$ 11,912,756$
CITY OF COLONIAL HEIGHTS, VIRGINIA
STATEMENT OF NET POSITIONPROPRIETARY FUNDS
June 30, 2013
Business-Type Activities – Enterprise Funds
The Notes to Financial Statements are
an integral part of this statement. 12

EXHIBIT 8
Nonmajor
Water Proprietary
and Sewer Sewer Funds Totals
OPERATING REVENUES
Charges for services 3,959,568$ -$ 368,829$ 4,328,397$
Connection fees 129,677 - - 129,677
Penalties 52,837 - 3,483 56,320
Miscellaneous 2,383 - - 2,383
Total operating revenues 4,144,465 - 372,312 4,516,777
OPERATING EXPENSES
Personnel 741,305 - 118,607 859,912
Fringe benefits 388,817 - 6,991 395,808
Utilities 87,686 - - 87,686
Repairs and maintenance 31,661 - 1,036 32,697
Materials and supplies 105,331 - 4,541 109,872
Sewage treatment costs 1,130,780 - - 1,130,780
Water purchased for resale 412,489 - - 412,489
Depreciation and amortization 753,762 - 22,112 775,874
Other charges 468,959 - 101,658 570,617
Total operating expenses 4,120,790 - 254,945 4,375,735
Operating income 23,675 - 117,367 141,042
NONOPERATING EXPENSES
Interest expense (76,286) - (2,344) (78,630)
Total nonoperating expenses (76,286) - (2,344) (78,630)
Income (loss) before transfers (52,611) - 115,023 62,412
TRANSFERS IN (Note 7) 8,160,719 - - 8,160,719
TRANSFERS OUT (Note 7) - (8,160,719) (263,979) (8,424,698)
Change in net position 8,108,108 (8,160,719) (148,956) (201,567)
NET POSITION AT JULY 1 3,421,499 8,160,719 532,105 12,114,323
NET POSITION AT JUNE 30 11,529,607$ -$ 383,149$ 11,912,756$
CITY OF COLONIAL HEIGHTS, VIRGINIA
STATEMENT OF REVENUES, EXPENSES, AND CHANGES IN FUND NET POSITION
PROPRIETARY FUNDS
Year Ended June 30, 2013
Business-Type Activities – Enterprise Funds
The Notes to Financial Statements are
an integral part of this statement. 13

EXHIBIT 9
NonmajorWater Proprietary
and Sewer Sewer Funds Totals
OPERATING ACTIVITIES
Receipts from customers 4,160,025$ -$ 370,183$ 4,530,208$
Receipts from other sources 16,738 - - 16,738
Payments to suppliers (2,236,369) - (107,256) (2,343,625)
Payments to employees (1,094,821) - (123,093) (1,217,914)
Net cash provided by operating activities 845,573 - 139,834 985,407
NONCAPITAL FINANCING ACTIVITIES
Transfer of cash to close out fund (Note 7) 364,421 (364,421) (62,897) (62,897)
Interfund borrowing 167,611 - - 167,611
Net cash provided by (used in) noncapital financing activities 532,032 (364,421) (62,897) 104,714
CAPITAL AND RELATED FINANCING ACTIVITIES
Purchases of capital assets (153,527) - - (153,527)
Principal paid (768,892) - (41,932) (810,824)
Interest paid (90,765) - (2,344) (93,109)
Net cash used in capital and related financing activities (1,013,184) - (44,276) (1,057,460)
Net increase (decrease) in cash and cash equivalents 364,421 (364,421) 32,661 32,661
CASH AND CASH EQUIVALENTS
Beginning at July 1 - 364,421 185,936 550,357 Ending at June 30 364,421$ -$ 218,597$ 583,018$
CASH AND CASH EQUIVALENTS AT END OF YEAR
IS COMPRISED OF THE FOLLOWING:
Cash and investments -$ -$ 218,597$ 218,597$
Restricted cash 364,421 - - 364,421
Total 364,421$ -$ 218,597$ 583,018$
RECONCILIATION OF OPERATING INCOME TO
BY OPERATING ACTIVITIESNET CASH PROVIDED BY OPERATING ACTIVITIES
Operating income 23,675$ -$ 117,367$ 141,042$
Adjustments to reconcile operating income to
net cash provided by operating activities:
Depreciation and amortization 753,762 - 22,112 775,874
Change in assets and liabilities:
(Increase) decrease in:
Receivables, net 9,284 - (2,129) 7,155
Due from other governments 14,355 - - 14,355
Increase (decrease) in:
Accounts payable and other current liabilities 2,575 - (21) 2,554
Customer deposits 8,659 - - 8,659
Compensated absences 11,801 - 778 12,579
Other post-employment benefits 21,462 - 1,727 23,189
Net cash provided by operating activities 845,573$ -$ 139,834$ 985,407$
Business-Type Activities – Enterprise Funds
CITY OF COLONIAL HEIGHTS, VIRGINIA
STATEMENT OF CASH FLOWSPROPRIETARY FUNDSYear Ended June 30, 2013
The Notes to Financial Statements are
an integral part of this statement. 14

(Continued) 15
CITY OF COLONIAL HEIGHTS, VIRGINIA
NOTES TO FINANCIAL STATEMENTSJune 30, 2013
Note 1. Summary of Significant Accounting Policies
The financial statements of the City of Colonial Heights, Virginia, (the “City”) conform with accounting principles generally accepted in the United States of America (GAAP) as applied to government units promulgated by the Governmental Accounting Standards Board (GASB). The more significant of the City’s accounting policies are described below.
A. The Financial Reporting Entity
The City of Colonial Heights, Virginia was incorporated in 1948 and its current charter wasgranted in 1960. The City is a political subdivision of the Commonwealth of Virginia operating under a Council/Manager form of government. City Council consists of a mayor and six council members. The City is not part of a county and has taxing powers subject to statewide restrictions and tax limits.
The City provides the full range of municipal services including police and fire, sanitation, health and social services, education, parks and recreation, water, sewer, and trash services. The City provides education through its school system administered by the Colonial Heights School Board.
Discretely Presented Component Unit – School Board
The City of Colonial Heights public school system is responsible for elementary and secondary education within the City. The elected five-member School Board serves staggered four-year terms of office. The School Board functions independently of the City Council, but is required to prepare and submit an annual budget to the City Council for approval. The School Board may not levy taxes or incur indebtedness under Virginia law and, therefore, funds for school operations are provided, in part, by appropriation from the City’s General Fund. Funds for constructingschool facilities are provided by City approved and issued general obligation bonds andappropriations from the City’s General Fund. The School Board is presented as a governmental fund type and consists of one operating fund.
The School Board’s financial reports, herein presented, were prepared by the City’s Financial Administration Office using information provided by the School Board. Details specific to School Board information communicated in the City’s Comprehensive Annual Financial Report may be obtained by contacting the School Board’s administrative offices located at:
City of Colonial Heights School Board512 BoulevardColonial Heights, Virginia 23834

(Continued) 16
CITY OF COLONIAL HEIGHTS, VIRGINIA
NOTES TO FINANCIAL STATEMENTSJune 30, 2013
Note 1. Summary of Significant Accounting Policies (Continued)
B. Government-Wide and Fund Financial Statements
Government-Wide Statements: The Statement of Net Position and the Statement of Activities display information about the primary government (the City) and its component unit. These statements include the financial activities of the overall government. Eliminations have been made to minimize the double-counting of internal activities. Interfund services provided and used are not eliminated in the process of consolidation. These statements distinguish between the governmental and business-type activities of the City. Governmental activities generally are financed through taxes, intergovernmental revenues, and other non-exchange transactions. Business-type activities are financed in whole or in part by fees charged to external parties. Likewise, the primary government is reported separately from the legally separate component unit for which the primary government is financially accountable.
The Statement of Activities presents a comparison between direct expenses and program revenues for the different business-type activities of the City and for each function of the City’s governmental activities. Direct expenses are those that are specifically associated with a program or function and, therefore, are clearly identifiable to a particular function. Indirect expense allocations that have been made in the funds have been reversed for the Statement of Activities. Program revenues include (a) fees, fines, and charges paid by the recipients of goods or services offered by the programs and (b) grants and contributions that are restricted to meeting the operational or capital requirements of a particular program. Revenues that are not classified as program revenues, including all taxes, are presented as general revenues.
Fund Financial Statements: The fund financial statements provide information about the City’s funds. Separate statements for each fund category – governmental and proprietary – arepresented.
C. Measurement Focus, Basis of Accounting, and Financial Statement Presentation
Government-Wide and Proprietary Fund Financial Statements: The government-wide andproprietary fund financial statements are reported using the economic resources measurement focus. The government-wide and proprietary fund financial statements are reported using the accrual basis of accounting. Revenues are recorded when earned and expenses are recorded at the time liabilities are incurred, regardless of when the related cash flows take place. Nonexchange transactions, in which the City gives (or receives) value without directly receiving (or giving) equal value in exchange, include property taxes, grants, entitlements, and donations. On theaccrual basis, revenue from the property taxes is recognized in the fiscal year for which the taxes are levied. Revenue from grants, entitlements, and donations is recognized in the fiscal year in which all eligibility requirements have been satisfied.

(Continued) 17
CITY OF COLONIAL HEIGHTS, VIRGINIA
NOTES TO FINANCIAL STATEMENTSJune 30, 2013
Note 1. Summary of Significant Accounting Policies (Continued)
C. Measurement Focus, Basis of Accounting, and Financial Statement Presentation (Continued)
Governmental Fund Financial Statements. Governmental funds are reported using the current financial resources measurement focus and the modified accrual basis of accounting. Under this method, revenues are recognized when measurable and available. The City considers all revenues reported in the governmental funds to be available if the revenues are collected within 90 days after year-end, except property taxes which are recognized as revenue if they have been collected within 45 days after year-end. Property taxes, sales tax, franchise tax, and interest are considered to be susceptible to accrual. Expenditures are recorded when the related fund liability is incurred, except for principal and interest on general long-term debt, claims and judgments, and compensated absences, which are recognized as expenditures to the extent they have matured. General capital asset acquisitions are reported as expenditures in governmental funds. Proceeds ofgeneral long-term debt, acquisitions under capital leases and sales of capital assets are reported as other financing sources.
Proprietary funds distinguish operating revenues and expenses from nonoperating items.Proprietary fund operating revenues, such as charges for services, result from exchangetransactions associated with the principal activity of the fund. Exchange transactions are those in which each party receives and gives up essentially equal values. Nonoperating revenues, such as subsidies and investment earnings, result from nonexchange transactions or ancillary activities.
Operating expenses include cost of services, administrative expenses and depreciation on capital assets. All expenses not meeting this definition are reported as nonoperating expenses.
The City reports the following major governmental funds:
General Fund. This is the basic operating fund of the City and all regular activities not expressly allocable to another fund are accounted for in this fund.
Capital Projects Fund. This is used to account for financial resources, which have beensegregated for the acquisition or construction of major capital facilities (other than those financed or constructed by the proprietary funds).
The City reports the following major enterprise funds:
Enterprise Funds. The Water and Sewer Fund is used to account for the acquisition, operation and maintenance of facilities which are primarily supported by user charges. This fund accountsfor services to the general public which are financed primarily by charges to users of such services. Prior to 2013, the Water Fund and Sewer Fund were separate and distinct. City Council combined those funds as of July 2, 2012.

(Continued) 18
CITY OF COLONIAL HEIGHTS, VIRGINIA
NOTES TO FINANCIAL STATEMENTSJune 30, 2013
Note 1. Summary of Significant Accounting Policies (Continued)
D. Budgets and Budgetary Accounting
The City adheres to the following procedures in establishing the budgetary data reflected in theComparative Schedule of Revenues and Expenditures – Budget and Actual:
1. At least 60 days prior to June 30, the City Manager submits to City Council a proposed operating budget for the fiscal year commencing on July 1. The operating budget includes proposed expenditures and the means of financing them.
2. The capital projects budget is prepared on a project length basis under which the total outlay for each project is estimated for the length of the project.
3. Public hearings are conducted to obtain citizen comments on the proposed budget. Prior to July 1, the budget is legally adopted at the function level through passage of an appropriation ordinance by City Council.
4. The City Manager is authorized to transfer amounts within functions, with any other transfers being approved by City Council. During the year, $724,965 in supplemental appropriations were approved by City Council. These amendments consisted primarily of appropriations of prior year encumbrances, the appropriation of fund balance, and the appropriation of additional intergovernmental grants received during the year.
5. Actual expenditures and operating transfers out may not legally exceed budget appropriations for each function. City Council legally adopts an annual budget for the General Fund.
E. Assets, Liabilities, and Equity
Investments.
The City considers all highly liquid investments with a maturity of three months or less to be cash equivalents.
Cash and investments include cash on hand, demand deposits, certificates of deposit, moneymarket funds and the State Treasurer’s Local Government Investment Pool (LGIP). Cash resources of the individual funds are combined to form a pool of cash and investments to maximize earnings. All investment earnings are allocated to the various funds based on equity in the investment pool. Investments are stated at fair value based on quoted market prices.
Property Taxes.
Real Property – The City levies real estate taxes on all real estate within its boundaries exceptthose specifically exempted by statute. These levies are assessed on a calendar year basis as ofJanuary 1 on the estimated fair market value of property. The City reassesses real property biennially.
(Continued) 19
CITY OF COLONIAL HEIGHTS, VIRGINIA
NOTES TO FINANCIAL STATEMENTSJune 30, 2013
Note 1. Summary of Significant Accounting Policies (Continued)
E. Assets, Liabilities, and Equity (Continued)
For real estate assessed on January 1, payment is due in two installments on May 15 and November 15 and is considered delinquent if not received by the due date. On January 1, real estate taxes become an enforceable lien on related property. The real estate taxes reported as current year revenue are the second installment (November 15) of the levy on assessed value at January 1 of the prior year and the first installment (May 15) of the levy at January 1 of the current year. The tax rate for calendar year 2012 and 2013 was $1.14 per $100 of assessed value.
Personal Property – The City levies personal property taxes on motor vehicles and personal and business property. These levies are assessed on a calendar year basis as of January 1. Personal property taxes are payable in two installments, which are due on June 5 and December 5. Taxes become delinquent if not received by the due date. On January 1, personal property taxes become an enforceable lien on related property. The personal property taxes reported as revenue are the second installment (December 5) of the levy on assessed value at January 1 of the prior year, and the first installment (June 5) of the levy at January 1 of the current year. The tax rate for calendar year 2013 was $3.50 per $100 of assessed value. Under the provisions of the Personal Property Tax Relief Act of 1998 (PPTRA), the City received $1,753,369 for the State’s share of the local personal property tax payment with the remainder collected from City residents.
Inventories. Inventories are valued at cost and are determined by using the first-in, first-out method. Inventories are accounted for under the consumption method, where inventories are recorded as expenditures when consumed, rather than when purchased.
Capital Assets. Capital assets with a value of $5,000 or greater are recorded in the applicable government or business-type activities columns in the government-wide financial statements. Capital assets belonging to proprietary funds are also reported in the applicable fund financial statements. All purchased capital assets are valued at historical or estimated historical cost if actual historical cost is not available. Donated capital assets are valued at their estimated fair market value on the date donated. Depreciation and amortization has been provided over the estimated useful lives using the straight-line method. No depreciation or amortization expense is recorded for land, easements, or construction-in-progress. Capital assets placed in service during the year will begin depreciation on July 1 of the following year. The estimated useful lives are:
Land improvements 5 – 20 yearsBuildings and structures 20 – 50 yearsIntangibles 5 – 10 yearsEquipment 4 – 20 yearsInfrastructure 30 – 50 years
The City’s capitalized infrastructure includes infrastructure acquired prior to 1980.

(Continued) 20
CITY OF COLONIAL HEIGHTS, VIRGINIA
NOTES TO FINANCIAL STATEMENTSJune 30, 2013
Note 1. Summary of Significant Accounting Policies (Continued)
E. Assets, Liabilities, and Equity (Continued)
The City’s intangible assets consist of easements previously recorded and classified as land; a utility system testing study, previously recorded and classified as infrastructure; and software, which was previously recorded and classified as machinery and equipment.
Compensated Absences Payable. It is the City’s policy to permit employees to accumulate earned but unused compensated absences. For government-wide reporting, a liability is recorded for compensated absences when services are rendered and employees have earned the right to received compensation for such services.
Liabilities for compensated absences are not liquidated until leave is actually taken by employees or leave balances are paid upon termination. Accordingly, in the fund financial statements for governmental funds, no expenditure is reported for compensated absences until they are paid. Compensated absences earned by employees and charged to proprietary funds are expensed and accrued as a liability of the appropriate fund when incurred.
Long-Term Obligations. Long-term debt and other long-term obligations are reported as liabilities in the applicable governmental activities, business-type activity, or proprietary fund type statement of net position. Bond premiums and discounts, gains and losses from refundings, as well as issuance costs, are deferred and amortized over the life of the bonds using the straight-line method. Bonds payable are reported net of the applicable deferred amounts. Bond issuance costs are reported as deferred charges and amortized over the term of the related debt.
Fund Equity. Fund balance is divided into five classifications based primarily on the extent to which the City is bound to observe constraints imposed upon the use of the resources in the governmental funds.
The classifications are as follows:
Nonspendable – Amounts that cannot be spent because they are not in spendable form, or legally or contractually required to be maintained intact. The “not in spendable form” criterion includes items that are not expected to be converted to cash.
Restricted – Amounts constrained to specific purposes by their providers (such as grantors, bondholders, and higher levels of government), through constitutional provisions, or by enabling legislation.
Committed – Amounts constrained to specific purposes by the City, using its highest level of decision making authority; to be reported as committed, amounts cannot be used for any other purposes unless the same highest level of action is taken to remove or change the constraint.
Assigned – Amounts the City intends to use for a specified purpose; intent can be expressed by the governing body or management of the City.
Unassigned – Amounts that are available for any purpose; positive amounts are reported only in the general fund.
(Continued) 21
CITY OF COLONIAL HEIGHTS, VIRGINIA
NOTES TO FINANCIAL STATEMENTSJune 30, 2013
Note 1. Summary of Significant Accounting Policies (Continued)
E. Assets, Liabilities, and Equity (Continued)
Fund Equity. (Continued)
Council establishes fund balance commitments by passage of an ordinance or resolution. This is typically done through adoption and amendment of the budget. Assigned fund balance isestablished by Council through adoption or amendment of the budget as intended for specific purpose (such as the purchase of capital assets, debt service, or for other purposes).
The City applies restricted resources first when expenditures are incurred for purposes for which either restricted or unrestricted (committed, assigned, and unassigned) amounts are available. Similarly, within unrestricted fund balance, committed amounts are reduced first followed by assigned, and then unassigned amounts when expenditures are incurred for purposes for which amounts in any of the unrestricted fund balance classifications could be used.
Minimum Fund Balance Policy
The City’s fund balance policy sets a minimum 10% of the General Fund budget with a desired goal of 12%.
Other governmental funds of the City do not have specified fund balance targets. Recommended levels of committed and/or assigned fund balance will be determined on a case by case basis, based on the needs of each fund and as recommended by officials and approved by Council.
Encumbrances:
Encumbrance accounting, under which purchase orders, contracts, and other commitments for the expenditure of monies are recorded in order to reserve that portion of the appropriation, is employed as an extension of formal budgetary integration in the governmental funds. Significant encumbrances as of June 30 total $277,887 in the general fund and $12,752,244 in the capital projects fund. These encumbrances are listed as committed on Table 5, and are broken out among the various departments.
Net Position. Net position represents the difference between assets and liabilities. Net investmentin capital assets, consists of capital assets, net of accumulated depreciation and amortization, reduced by the outstanding balances of any borrowings used for the acquisition, construction, or improvement of those assets. Net investment in capital assets excludes unspent debt proceeds. Net position is reported as restricted when there are limitations imposed on their use either through the enabling legislation adopted by the City or through external restrictions imposed by creditors, grantors, or laws or regulations of other governments. Restricted net position for public safety and judicial administration represents unspent forfeited assets and fees.
By law, the School Board does not have taxing authority and, therefore, it cannot incur debtthrough general obligation bonds to fund the acquisition, construction, or improvement to itscapital assets. That responsibility lies with the local governing body who issues the debt on behalf of the School Board. However, the Code of Virginia requires the School Board to hold title to the capital assets (buildings and equipment) due to its responsibility for maintaining the asset.

(Continued) 22
CITY OF COLONIAL HEIGHTS, VIRGINIA
NOTES TO FINANCIAL STATEMENTSJune 30, 2013
Note 1. Summary of Significant Accounting Policies (Continued)
E. Assets, Liabilities, and Equity (Continued)
Encumbrances: (Continued)
Net Position. (Continued)
In the Statement of Net Position, this scenario presents a dilemma for the primary government. Debt issued on behalf of the School Board is reported as a liability of the primary government, thereby reducing the net position of the primary government. The corresponding capital assets are reported as assets of the School Board (title holder), thereby increasing the School Board’s net position.
The Virginia General Assembly amended the Code of Virginia to allow a tenancy in common with the School Board whenever the locality incurs a financial obligation which is payable over more than one fiscal year for any school property. The tenancy in common terminates when the associated debt has been paid in full. For financial reporting purposes, the legislation permits the locality to report the portion of the school property related to any outstanding financial obligation, thus eliminating a potential deficit from financing capital assets with debt. The legislation also allows local governments to elect not to acquire a tenancy in common by adopting a resolution to that effect.
The City concluded that, while joint tenancy would resolve a deficit in the primary government’s net position, the continual computation process that would be required to allocate principal, interest, asset amount, and depreciation between the City and the School Board would be cumbersome and not provide any added benefit to the financial statements. Therefore, the City Council adopted a resolution declining tenancy in common for current and future obligations.
F. Use of Estimates
The preparation of financial statements in conformity with accounting principles generallyaccepted in the United States of America requires management to make estimates andassumptions that affect the reported amounts of assets and liabilities and the disclosure ofcontingent assets and liabilities at the date of the financial statements and the reported amounts of revenues and expenditures/expenses during the reporting period. Actual results could differ from those estimates.
Note 2. Deposits and Investments
Deposits
Deposits with banks are covered by the Federal Deposit Insurance Corporation (FDIC) and collateralized in accordance with the Virginia Security for Public Deposits Act (the “Act”) Section 2.2-4400 et. seq. of the Code of Virginia. Under the Act, banks and savings institutions holding public deposits in excess of the amount insured by the FDIC must pledge collateral to the Commonwealth of Virginia Treasury Board. Financial institutions may choose between two collateralization methodologies and depending upon that choice, will pledge collateral that ranges in the amounts from 50% to 130% of excess deposits. Accordingly, all deposits are considered fully collateralized.

(Continued) 23
CITY OF COLONIAL HEIGHTS, VIRGINIA
NOTES TO FINANCIAL STATEMENTSJune 30, 2013
Note 2. Deposits and Investments (Continued)
Investments
Statutes authorize local governments and other public bodies to invest in obligations of the United States or its agencies thereof, obligations of the Commonwealth of Virginia or political subdivisions thereof, obligations of the International Bank for Reconstruction and Development (World Bank), the Asian Development Bank, the African Development Bank, “prime quality” commercial paper and certain corporate notes, bankers’ acceptances, repurchase agreements and the State Treasurer’s Local Government Investment Pool (LGIP).
The LGIP is a professionally managed money market fund which invests in qualifying obligations and securities as permitted by Virginia statutes. Pursuant to Section 2.2-4605 Code of Virginia, the Treasury Board of the Commonwealth sponsors the LGIP and has delegated certain functions to the State Treasurer. The LGIP reports to the Treasury Board at their regularly scheduled monthly meetings. The fair value of the LGIP is the same as the value of the pool shares, i.e., the LGIP maintains a stable net asset value of $1 per share. The LGIP has been assigned an “AAAm” rating by Standard & Poor’s. The maturity of the LGIP is less than one year.
The City has invested bond proceeds subject to rebate of arbitrage earnings in the Virginia State Non-Arbitrage Program (SNAP). SNAP is designed to assist local governments in complying with the arbitrage rebate requirements of the Tax Reform Act of 1986. These programs provide comprehensive investment management, accounting, and arbitrage rebate calculation services for proceeds of general obligation and revenue tax-exempt financing of Virginia local governments. TheSNAP has been assigned an “AAAm” rating by Standard & Poor’s. The maturity of the SNAP is less than one year.
The City’s investment policy only allows investments in types approved by state statutes. The Citywill not invest in any derivatives or securities with maturities over one year.
At June 30, the City’s deposit and investment balances were as follows:
Fair Value
Deposits:Demand deposits $ 844,119Cash held by third-party 364,421Cash on hand 13,400
1,221,940
Investments:Money market funds 20,600Certificate of deposit 10,065LGIP 7,820,365SNAP 7,207,335
Total deposits and investments $ 16,280,305

(Continued) 24
CITY OF COLONIAL HEIGHTS, VIRGINIA
NOTES TO FINANCIAL STATEMENTSJune 30, 2013
Note 2. Deposits and Investments (Continued)
Investments (Continued)
Exhibit 1 total deposits and investments is composed as follows:
Cash and investments $ 8,708,549Restricted cash 7,571,756
Total deposits and investments $ 16,280,305
At June 30, the School Board’s deposit and investment balances were as follows:
Deposits:Demand deposits $ 5,659,586
Credit Risk
As required by state statute, the Policy requires that commercial paper have a short-term debt rating of no less than “A-1” (or its equivalent) from at least two of the following: Moody’s Investors Service, Standard & Poor’s, and Fitch Investors Service, provided that the issuing corporation has a net worth of at least $50 million and its long term debt is rated “A” or better by Moody’s and Standard & Poor’s. Banker’s acceptances and Certificates of Deposit maturing in less than one year must have a short-term debt rating of at least “A-1” by Standard & Poor’s and “P-1” by Moody’s Investors Service.
Restricted Cash
The Capital Projects and Water and Sewer funds have restricted certain cash balances in accordance with debt agreements.
Note 3. Receivables
Receivables at June 30, including applicable allowances for uncollectible accounts, are as follows:
NonmajorStorm Water Component
General Water and Management UnitFund Sewer Fund Fund School Board Total
Taxes 11,424,322$ -$ -$ -$ 11,424,322$ Accounts 460,276 769,969 69,730 - 1,299,975 Other 16,301 - - 69,427 85,728
Gross receivables 11,900,899 769,969 69,730 69,427 12,810,025
Less allowance foruncollectible accounts (209,883) (75,000) - - (284,883)
Net receivables 11,691,016$ 694,969$ 69,730$ 69,427$ 12,525,142$
(Continued) 25
CITY OF COLONIAL HEIGHTS, VIRGINIA
NOTES TO FINANCIAL STATEMENTSJune 30, 2013
Note 3. Receivables (Continued)
The allowance for uncollectibles is based on prior experience with respect to collections. No allowance is recorded for delinquent real estate taxes because of the past history of collections and the City’s ability to sell the related property to collect on its tax lien.
Note 4. Deferred and Unearned Revenue
Governmental funds report deferred revenue in connection with receivables for revenues that are not considered to be available to liquidate liabilities in the current period. Governmental funds also defer revenue recognition in connection with resources that have been received, but not yet earned. At year end, the various components of deferred revenue and unearned revenue were as follows:
Unavailable Unearned
Deferred grant revenue, representing VDOTgrant revenue not yet earned (Capital Projects Fund) $ 1,286,243 $ 1,286,243
Deferred property tax revenue, representinguncollected tax billings (General Fund) 10,289,963 10,080,380
Property taxes paid in advance, representingproperty taxes not yet due (General Fund) 602,473 602,473
Total deferred/unearned revenue $ 12,178,679 $ 11,969,096
Note 5. Due from Other Governmental Units
A summary of funds due from other governmental units is as follows:
Governmental Business-Type SchoolActivities Activities Board
Federal:FEMA $ 217,463 $ - $ -Highway planning and construction 1,213,587 - -Title I - - 327,599Title II - - 110,173IDEA - - 598,738Perkins - - 38,841
Commonwealth of Virginia:Other aid, grants, and
reimbursements 437,183 - -Sales tax 1,190,775 - 445,395PPTRA 960,265 - -
Chesterfield County - 12,313 - Virginia State University - 11,229 -Other governments - - 27,437
$ 4,019,263 $ 23,542 $ 1,548,183

(Continued) 26
CITY OF COLONIAL HEIGHTS, VIRGINIA
NOTES TO FINANCIAL STATEMENTSJune 30, 2013
Note 6. Interfund Obligations
Interfund receivable and payable balances at June 30 are:
Interfund InterfundReceivables Payables
General $ 598,912 $ - Water and Sewer - 598,912
$ 598,912 $ 598,912
The interfund payable represents past and present operational subsidies received. The interfund payable is not expected to be paid back within one year. It will be paid back over several years as cash flows in the Water and Sewer Fund improve.
Note 7. Interfund Transfers
Transfer From
Transfer From Transfer From Solid Waste
General Fund Sewer Fund Fund
Transfer to fund:
General -$ -$ 263,979$
Capital projects 55,000 - -
Water - 8,160,719 -
Total transfers 55,000$ 8,160,719$ 263,979$
The transfer from the General Fund to the Capital Projects Fund was to transfer grant matching funds in the amount of $55,000 for the river trail grant.
The transfer from the Sewer Fund to the Water and Sewer Fund was to close the residual balance of the Sewer Fund and consolidate it with the Water Fund.
The transfer from the Solid Waste Fund to the General Fund was to close the residual balance of the Solid Waste Fund and consolidate it with the General Fund. The transfer in the General Fund does not match the transfer in the Solid Waste Fund by $7,482. This amount represents the net value of capital assets transferred and does not constitute current financial resources; therefore, it is not reported at the fund level.
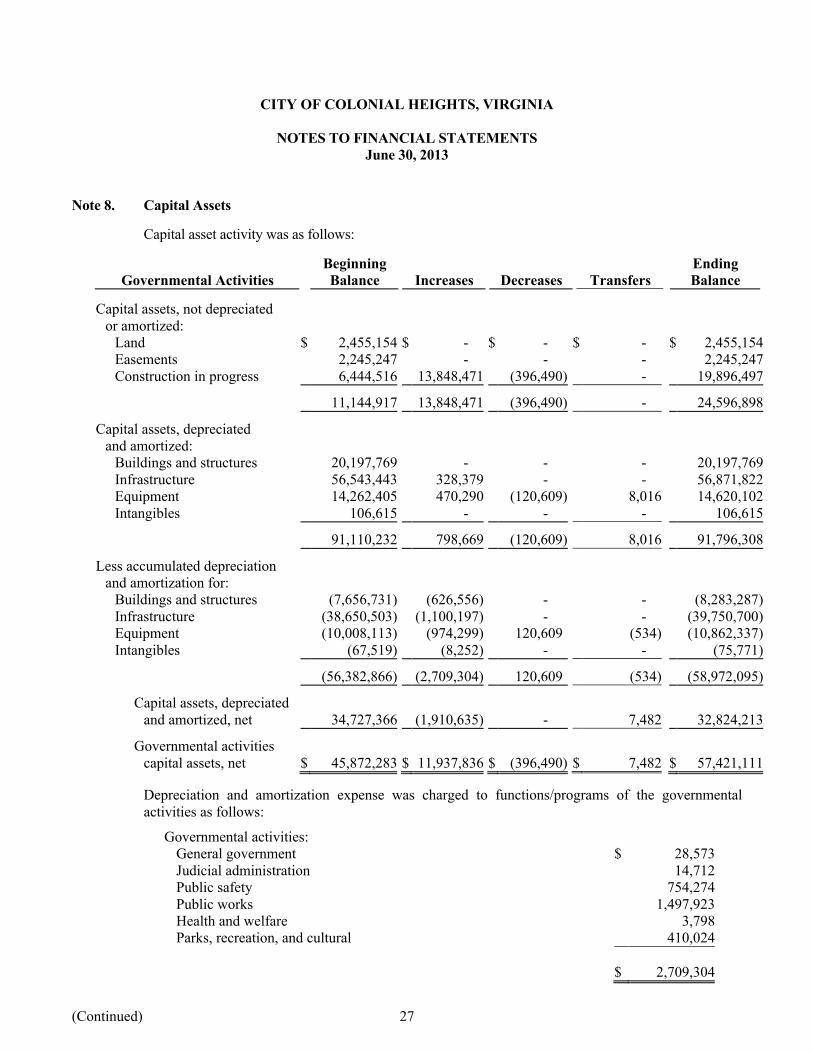
(Continued) 27
CITY OF COLONIAL HEIGHTS, VIRGINIA
NOTES TO FINANCIAL STATEMENTSJune 30, 2013
Note 8. Capital Assets
Capital asset activity was as follows:
Governmental ActivitiesBeginning Balance Increases Decreases Transfers
Ending Balance
Capital assets, not depreciatedor amortized:
Land $ 2,455,154 $ - $ - $ - $ 2,455,154Easements 2,245,247 - - - 2,245,247Construction in progress 6,444,516 13,848,471 (396,490) - 19,896,497
______ ______ ______ ______11,144,917 13,848,471 (396,490) - 24,596,898
______ ______Capital assets, depreciated
and amortized:Buildings and structures 20,197,769 - - - 20,197,769Infrastructure 56,543,443 328,379 - - 56,871,822Equipment 14,262,405 470,290 (120,609) 8,016 14,620,102Intangibles 106,615 - - - 106,615
______ ______ ______ ______91,110,232 798,669 (120,609) 8,016 91,796,308
______ ______Less accumulated depreciation
and amortization for:Buildings and structures (7,656,731) (626,556) - - (8,283,287)Infrastructure (38,650,503) (1,100,197) - - (39,750,700)Equipment (10,008,113) (974,299) 120,609 (534) (10,862,337)Intangibles (67,519) (8,252) - - (75,771)
______ ______ ______ ______(56,382,866) (2,709,304) 120,609 (534) (58,972,095)
______ ______ ______Capital assets, depreciated
and amortized, net 34,727,366 (1,910,635) - 7,482 32,824,213______ ______ ______ ______
Governmental activitiescapital assets, net $ 45,872,283 $ 11,937,836 $ (396,490) $ 7,482 $ 57,421,111
Depreciation and amortization expense was charged to functions/programs of the governmentalactivities as follows:
Governmental activities:General government $ 28,573Judicial administration 14,712Public safety 754,274Public works 1,497,923Health and welfare 3,798Parks, recreation, and cultural 410,024
$ 2,709,304
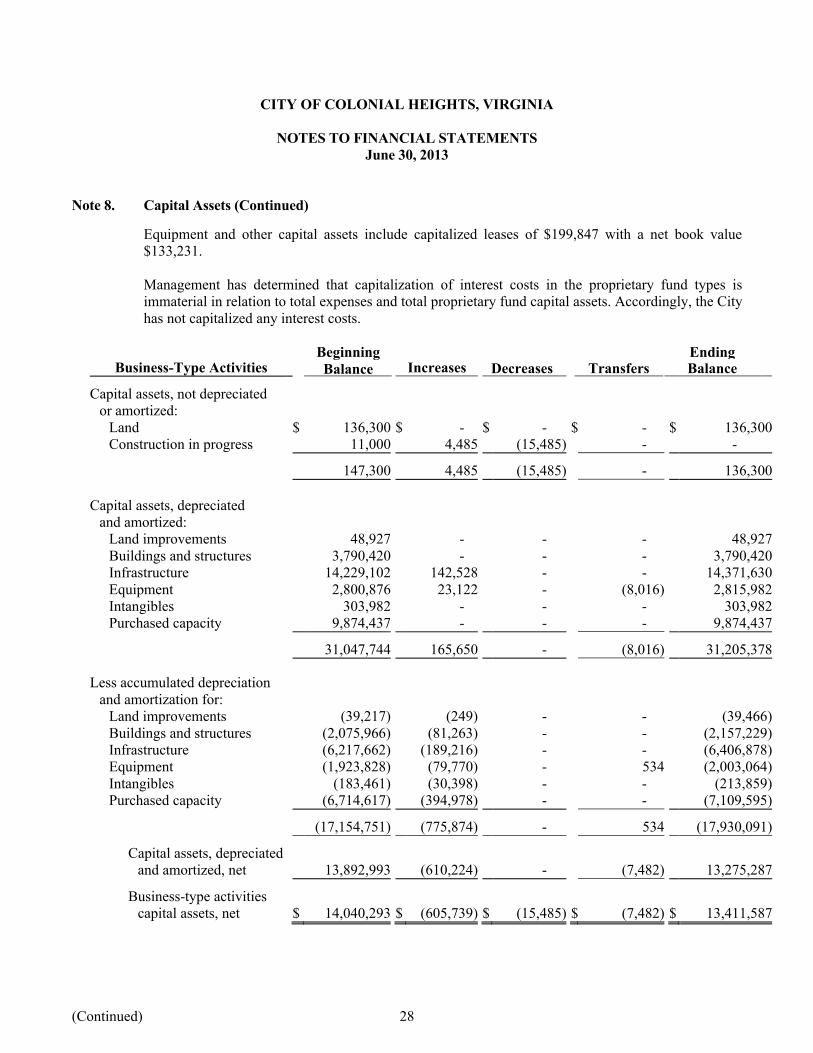
(Continued) 28
CITY OF COLONIAL HEIGHTS, VIRGINIA
NOTES TO FINANCIAL STATEMENTSJune 30, 2013
Note 8. Capital Assets (Continued)
Equipment and other capital assets include capitalized leases of $199,847 with a net book value$133,231.
Management has determined that capitalization of interest costs in the proprietary fund types isimmaterial in relation to total expenses and total proprietary fund capital assets. Accordingly, the Cityhas not capitalized any interest costs.
Business-Type ActivitiesBeginningBalance Increases
EndingDecreases Transfers Balance
Capital assets, not depreciatedor amortized:
Land $ 136,300 $ - $ - $ - $ 136,300Construction in progress 11,000 4,485 (15,485) - -
______ ______ ______147,300 4,485 (15,485) - 136,300
Capital assets, depreciatedand amortized:
Land improvements 48,927 - - - 48,927Buildings and structures 3,790,420 - - - 3,790,420Infrastructure 14,229,102 142,528 - - 14,371,630Equipment 2,800,876 23,122 - (8,016) 2,815,982Intangibles 303,982 - - - 303,982Purchased capacity 9,874,437 - - - 9,874,437
______ ______ ______31,047,744 165,650 - (8,016) 31,205,378
Less accumulated depreciation and amortization for:
Land improvements (39,217) (249) - - (39,466)Buildings and structures (2,075,966) (81,263) - - (2,157,229)Infrastructure (6,217,662) (189,216) - - (6,406,878)Equipment (1,923,828) (79,770) - 534 (2,003,064)Intangibles (183,461) (30,398) - - (213,859)Purchased capacity (6,714,617) (394,978) - - (7,109,595)
______ ______ ______(17,154,751) (775,874) - 534 (17,930,091)
Capital assets, depreciatedand amortized, net 13,892,993 (610,224) - (7,482) 13,275,287
Business-type activitiescapital assets, net $ 14,040,293 $ (605,739) $ (15,485) $ (7,482) $ 13,411,587

(Continued) 29
CITY OF COLONIAL HEIGHTS, VIRGINIA
NOTES TO FINANCIAL STATEMENTSJune 30, 2013
Note 8. Capital Assets (Continued)
Depreciation and amortization expense was charged to functions/programs of the business-typeactivities as follows:
Business-type activities:Water and Sewer $ 753,762Storm Water 22,112
$ 775,874
South Central Wastewater Authority (SCWA) treatment plant rights:
The City and other participating localities have an agreement with SCWA to benefit from a certain wastewater treatment plant of the SCWA. The City and other participating localities are not authorized to hold legal title to the plant; thus SCWA holds title to these assets. Through long-term contracts, the risks and benefits of operating and maintaining the assets have been transferred to the City and other participating localities, and thus have been included in the City’s capital assets as purchased capacity. The City and other participating localities are responsible for a portion of the debt incurred for these facilities.
Beginning EndingComponent Unit – School Board Balance Increases Decreases Balance
Capital assets, not depreciatedor amortized:
Land $ 1,090,102 $ - $ - $ 1,090,102Construction in progress 35,222 - (35,222) -
______ ______ ______ 1,125,324 - (35,222) 1,090,102
Capital assets, depreciatedand amortized:
Buildings and structures 30,703,302 216,930 - 30,920,232Equipment 4,066,891 99,023 - 4,165,914Intangibles 12,155 - - 12,155
______ ______ ______ 34,782,348 315,953 - 35,098,301
Less accumulated depreciation and amortization for:
Buildings and structures (12,771,848) (738,362) - (13,510,210)Equipment (3,257,098) (163,331) - (3,420,429)Intangibles (5,065) (2,431) - (7,496)
______ ______ ______ (16,034,011) (904,124) - (16,938,135)
______ ______ ______ Capital assets, depreciated
and amortized, net 18,748,337 (588,171) - 18,160,166______ ______ ______
School Board capital assets, net $ 19,873,661 $ (588,171) $ (35,222) $ 19,250,268
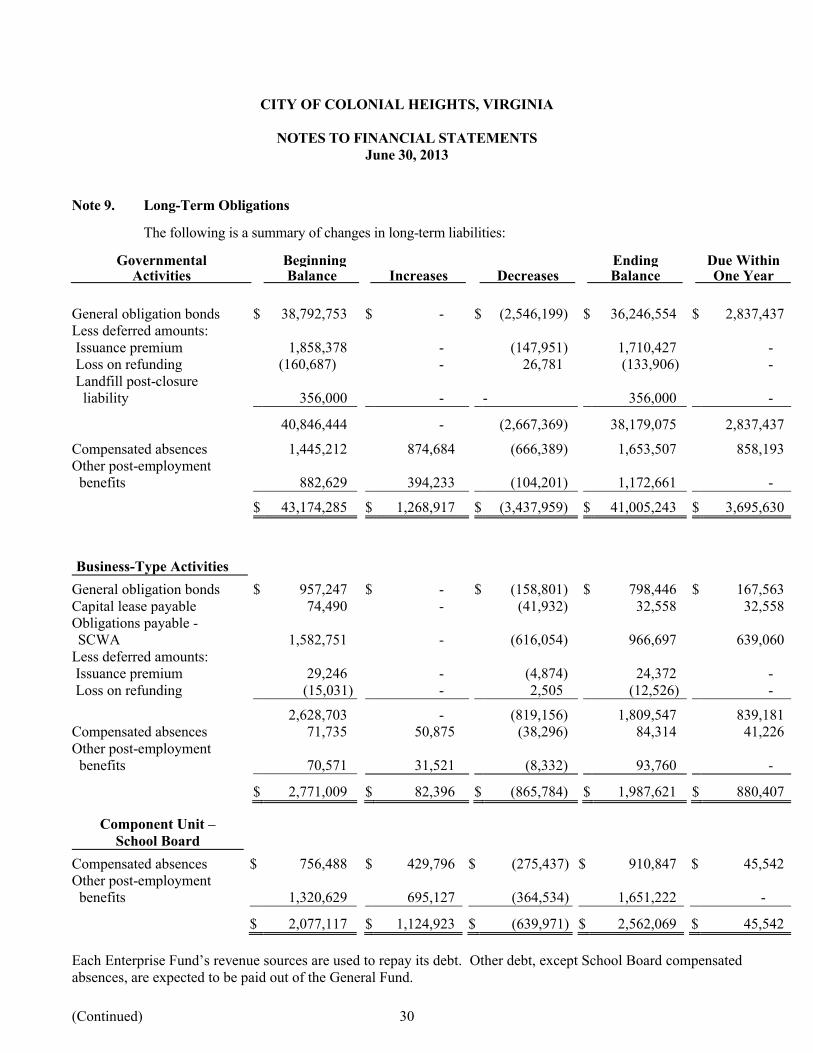
(Continued) 30
CITY OF COLONIAL HEIGHTS, VIRGINIA
NOTES TO FINANCIAL STATEMENTSJune 30, 2013
Note 9. Long-Term Obligations
The following is a summary of changes in long-term liabilities:
Governmental Beginning Ending Due WithinActivities Balance Increases Decreases Balance One Year
General obligation bonds $ 38,792,753 $ - $ (2,546,199) $ 36,246,554 $ 2,837,437Less deferred amounts:Issuance premium 1,858,378 - (147,951) 1,710,427 - Loss on refunding (160,687) - 26,781 (133,906) - Landfill post-closure liability 356,000 - - 356,000 -
______ ______ ______ ______40,846,444 - (2,667,369) 38,179,075 2,837,437
______ ______ ______ ______Compensated absences 1,445,212 874,684 (666,389) 1,653,507 858,193Other post-employment benefits
882,629 394,233 (104,201) 1,172,661 -
______ ______ ______ ______$ 43,174,285 $ 1,268,917 $ (3,437,959) $ 41,005,243 $ 3,695,630
Business-Type Activities
General obligation bonds $ 957,247 $ - $ (158,801) $ 798,446 $ 167,563Capital lease payable 74,490 - (41,932) 32,558 32,558Obligations payable - SCWA 1,582,751 - (616,054) 966,697 639,060
Less deferred amounts:Issuance premium 29,246 - (4,874) 24,372 - Loss on refunding (15,031) - 2,505 (12,526) -
______ ______ ______ ______2,628,703 - (819,156) 1,809,547 839,181Compensated absences 71,735 50,875 (38,296) 84,314 41,226Other post-employment benefits 70,571 31,521 (8,332) 93,760 -
______ ______ ______ ______$ 2,771,009 $ 82,396 $ (865,784) $ 1,987,621 $ 880,407
Component Unit –School Board
Compensated absences $ 756,488 $ 429,796 $ (275,437) $ 910,847 $ 45,542Other post-employment benefits 1,320,629 695,127 (364,534) 1,651,222 -
______ ______ ______ ______$ 2,077,117 $ 1,124,923 $ (639,971) $ 2,562,069 $ 45,542
Each Enterprise Fund’s revenue sources are used to repay its debt. Other debt, except School Board compensated absences, are expected to be paid out of the General Fund.

(Continued) 31
CITY OF COLONIAL HEIGHTS, VIRGINIA
NOTES TO FINANCIAL STATEMENTSJune 30, 2013
Note 9. Long-Term Liabilities (Continued)
Outstanding long-term liabilities at June 30 are as follows:
Year Issued Interest RateAmount
Outstanding
General obligation bonds:General improvement
Series 2004 2004 3.00-3.75 $ 3,430,000Series 2007 2007 4.00 7,985,000Series 2010 2010 2.00-4.00 4,405,000Series 2012 2012 2.50-4.00 21,225,000
Total general obligation bonds $ 37,045,000
Capital lease payable:Storm water truck 2002 3.98% $ 32,558
Obligations payable:SCWA (for purchased capacity) 2003 3.70% $ 966,697
All general obligation bonds are secured by the full faith and credit of the City.

(Continued) 32
CITY OF COLONIAL HEIGHTS, VIRGINIA
NOTES TO FINANCIAL STATEMENTSJune 30, 2013
Note 9. Long-Term Liabilities (Continued)
The annual requirements to amortize certain long-term liabilities are as follows:
General Obligation BondsGovernmental Activities Business-Type Activities
Fiscal YearEnding Principal Interest Principal Interest
2014 $ 2,837,437 $ 1,217,798 $ 167,563 $ 24,9652015 2,600,487 1,127,548 139,513 19,8812016 2,695,670 1,040,211 144,330 15,1592017 2,320,146 953,986 104,854 10,6642018 2,378,700 873,655 116,300 6,860
2019-2023 8,956,894 3,319,250 125,886 4,8492024-2028 8,870,000 1,679,200 - - 2029-2032 5,587,220 425,100 - -
$ 36,246,554 $ 10,636,748 $ 798,446 $ 82,378
Capital Lease PayableObligation Payable –
SCWABusiness-Type Activities Business-type Activities
Fiscal YearEnding Principal Interest Principal Interest
2014 $ 32,558 650 639,060 29,9112015 - - 327,637 6,061
$ 32,558 $ 650 $ 966,697 $ 35,972
Prior Year Defeasance of Debt
In 2012, the City defeased certain bonds by placing the proceeds of new bonds in an irrevocable trust to provide for all future debt service on the refunded bonds through their maturity date. The deferred costs are being amortized over the life of the new bonds as a component of interest expense. As a result, the liability for those bonds has been removed from the financial statements. At June 30, $3,970,000 of these bonds remains outstanding.
Note 10. Environmental Liabilities
State and Federal laws and regulations required the City to place a final cover on each phase of itslandfill site when it stopped accepting waste and to perform certain maintenance and monitoringfunctions at the site for a certain number of years after closure. For purposes of determining therequired years for postclosure testing, the former landfill is treated as a solid waste landfill thatstopped receiving waste prior to the passing of Subtitle D of the Environmental Protection ActRegulations.

(Continued) 33
CITY OF COLONIAL HEIGHTS, VIRGINIA
NOTES TO FINANCIAL STATEMENTSJune 30, 2013
Note 10. Environmental Liabilities (Continued)
The City has completed the process of closing the former City landfill. The post-closure and corrective action costs for the landfill are currently projected to be approximately $356,000 based on a minimum ten years of remaining monitoring and remediation. Actual costs may be higher due to inflation, changes in technology, or changes in regulations.
The City meets all federal laws, regulations, and tests of financial assurance related to the financing of closure and post-closure care.
Note 11. Commitments and Contingent Liabilities
Contingent Liabilities: Various claims and lawsuits are pending against the City. In the opinion of the City management, resolution of these cases would not involve a substantial liability for the City.
The City participates in a number of federally assisted grant programs. Although the City has beenaudited in accordance with the provisions of OMB Circular A-133, these programs are still subject tofinancial and compliance audits by the grantors or their representatives. Such audits could lead torequests for reimbursement to the grantor agency for expenditures disallowed under terms of grants. Based on prior experience, City management believes such disallowances, if any, will be immaterial.
Utility Commitments: The utility department has entered into various contracts for the purchase ofwater and the treatment of sewage. These commitments are considered by the water and sewerdepartment in establishing water and sewer rates.
Construction Commitments: The City has entered into various construction contracts withapproximately $10,500,000 still outstanding to be completed at year-end. These construction commitments are listed on Table 5, and are broken down into four main categories: general government, recreational facilities, educational facilities, and streets and bridges. This includesconstruction of a new courthouse, a multi-phase walking trail along the Appomattox River andvarious street projects.
Health Department Commitments: The City entered into a contract with the Virginia Department of Health to help support the cooperative budget of the Colonial Heights Health Department. The City’s annual payments from this agreement total approximately $181,000.
Note 12. Defined Benefit Pension Plan
Plan Description
Name of Plan: Virginia Retirement System (VRS)
Identification of Plan: Agent and Cost-Sharing Multiple-Employer Defined Benefit Pension Plan
Administering Entity: Virginia Retirement System (System)

(Continued) 34
CITY OF COLONIAL HEIGHTS, VIRGINIA
NOTES TO FINANCIAL STATEMENTSJune 30, 2013
Note 12. Defined Benefit Pension Plan (Continued)
Plan Description (Continued)
The City and School Board contribute to the Virginia Retirement System (VRS), an agent and cost sharing multiple-employer defined benefit pension plan administered by the Virginia Retirement System (the “System”). All full-time, salaried permanent (professional) employees of public school divisions and employees of participating employers are automatically covered by VRS upon employment. Benefits vest after five years of service credit. Members earn one month of service credit for each month they are employed and their employer is paying into the VRS. Members are eligible to purchase prior public service, active duty military service, certain periods of leave and previously refunded VRS service as credit in their plan.
VRS administers two defined benefit plans for local government employees – Plan 1 and Plan 2:
Members hired before July 1, 2010 and who were vested as of January 1, 2013 are covered under Plan 1. Non-hazardous duty members are eligible for an unreduced retirement benefit beginning at age 65 with at least five years of service credit or age 50 with at least 30 years of service credit. They may retire with a reduced benefit as early as age 55 with at least five years of service credit or age 50 with at least 10 years of service credit.
Members hired or rehired on or after July 1, 2010 and Plan 1 members who were not vested on January 1, 2013 are covered under Plan 2. Non-hazardous duty members are eligible for an unreduced benefit beginning at their normal Social Security retirement age with at least five years of service credit or when the sum of their age and service equals 90. They may retire with a reduced benefit as early as age 60 with at least five years of service credit.
Eligible hazardous duty members in Plan 1 and Plan 2 are eligible for an unreduced benefit beginning at age 60 with at least five years of service credit or age 50 with at least 25 years of service credit. These members include sheriffs, deputy sheriffs and hazardous duty employees of political subdivisions that have elected to provide enhanced coverage for hazardous duty service.They may retire with a reduced benefit as early as age 50 with at least five years of service credit. All other provisions of the member’s plan apply.
The VRS Basic Benefit is a lifetime monthly benefit based on a retirement multiplier as a percentage of the member’s average final compensation multiplied by the member’s total service credit. Under Plan 1, average final compensation is the average of the member’s 36 consecutive months of highest compensation. Under Plan 2, average final compensation is the average of the member’s 60 consecutive months of highest compensation. The retirement multiplier for non-hazardous duty members is 1.70%. The retirement multiplier for sheriffs and regional jail superintendents is 1.85%. The retirement multiplier for eligible political subdivision hazardous duty employees other than sheriffs and jail superintendents is 1.70% or 1.85% as elected by the employer. The multiplier for Plan 2 members was reduced to 1.65% effective January 1, 2013 unless they are hazardous duty employees and their employer has elected the enhanced retirement multiplier. At retirement, members can elect the Basic Benefit, the Survivor Option, a Partial Lump-Sum Option Payment (PLOP) or the Advance Pension Option. A retirement reduction factor is applied to the Basic Benefit amount for members electing the Survivor Option, PLOP or Advance Pension Option or those retiring with a reduced benefit.

(Continued) 35
CITY OF COLONIAL HEIGHTS, VIRGINIA
NOTES TO FINANCIAL STATEMENTSJune 30, 2013
Note 12. Defined Benefit Pension Plan (Continued)
Plan Description (Continued)
Retirees are eligible for an annual cost-of-living adjustment (COLA) effective July 1 of the second calendar year of retirement. Under Plan 1, the COLA cannot exceed 5.00%; under Plan 2, the COLA cannot exceed 3.00%. During years of no inflation or deflation, the COLA is 0.00%. The VRS also provides death and disability benefits. Title 51.1 of the Code of Virginia (1950), as amended, assigns the authority to establish and amend benefit provisions to the General Assembly of Virginia.
The System issues a publicly available comprehensive annual financial report (CAFR) that includes financial statements and required supplementary information for the plans administered byVRS. A copy of the most recent report may be obtained from the VRS Web site at http://www.varetire.org/PDF/Publications/2012-Annual-Report.pdf or by writing to the System’s Chief Financial Officer at P.O. Box 2500, Richmond, VA 23218-2500.
Funding Policy
Plan members are required by Title 51.1 of the Code of Virginia (1950), as amended, to contribute 5.00% of their compensation toward their retirement. All or part of the 5.00% member contribution may be assumed by the employer. Beginning July 1, 2012 new employees were required to pay the 5% member contribution. In addition, for existing employees, employers were required to begin making the employee pay the 5% member contribution. This could be phased in over a period of up to five years and the employer is required to provide a salary increase equal to the amount of the increase in the employee-paid member contribution. In addition, the City and the School Board are required to contribute the remaining amounts necessary to fund their participation in the VRS using the actuarial basis specified by the Code of Virginia and approved by the VRS Board of Trustees. For 2013, the contribution rate for the City was 16.80%; for the School Board’s professional employees 11.66% and for the School Board’s non-professional employees 10.33% of the annual covered payroll.
For 2013, 2012, and 2011, total employer and employee contributions made to the VRS statewide teacher cost-sharing pool for professional employees by the School Board were $2,956,379,$2,003,838, and $1,583,810, respectively, and were equal to 100% of the required contribution for professional employees for each year.
Annual Pension Cost
For the fiscal year ended June 30, 2013, the City and the School Board’s annual pension costs were equal to the required and actual contributions.
Three-year trend information for the City is as follows:
Annual Percentage NetPension Of APC Pension
Fiscal Year Ended Cost (APC) Contributed Obligation
June 30, 2013 $ 2,098,674 100% $ - June 30, 2012 2,119,379 100% - June 30, 2011 2,090,751 100% -

(Continued) 36
CITY OF COLONIAL HEIGHTS, VIRGINIA
NOTES TO FINANCIAL STATEMENTSJune 30, 2013
Note 12. Defined Benefit Pension Plan (Continued)
Annual Pension Cost (Continued)
Three-year trend information for the Component Unit – School Board non-professional employees, is as follows:
Annual Percentage NetPension Of APC Pension
Fiscal Year Ended Cost (APC) Contributed Obligation
June 30, 2013 $ 179,758 100% $ - June 30, 2012 147,795 100% - June 30, 2011 144,588 100% -
The FY 2013 required contribution was determined as part of the June 30, 2011 actuarial valuation using the entry age actuarial cost method. The actuarial assumptions at June 30, 2011 included (a) an investment rate of return (net of administrative expenses) of 7.00%, (b) projected salary increases ranging from 3.75% to 5.60% per year for general government employees and 3.75% to 6.20% per year for teachers, and 3.50% to 4.75% per year for employees eligible for enhanced benefits available to law enforcement officers, firefighters, and sheriffs, and (c) a cost-of-living adjustment of 2.50% per year for Plan 1 employees and 2.25% for Plan 2 employees. Both the investment rate of return and the projected salary increases also include an inflation component of 2.50%. The actuarial value of the City and School Board’s assets is equal to the modified market value of assets. This method uses techniques that smooth the effects of short-term volatility in the market value of assets over a five-year period. The City and School Board’s unfunded actuarial accrued liability is being amortized as a level percentage of projected payroll on an open basis. The remaining amortization period at June 30, 2011 for the Unfunded Actuarial Accrued Liability (UAAL) was 30 years.
Funded Status and Funding Progress
As of June 30, 2012, the most recent actuarial valuation date, the City’s plan was 68.42% funded. The actuarial accrued liability for benefits was $61,189,712, and the actuarial value of assets was $41,865,700, resulting in an unfunded actuarial accrued liability (UAAL) of $19,324,012. The covered payroll (annual payroll of active employees covered by the plan) was $11,751,917, and the ratio of the UAAL to the covered payroll was 164.43%.
At June 30, 2012, the most recent actuarial valuation date, the plan for the School Board’snon-professional employees was 77.78% funded. The actuarial accrued liability for benefits was $4,624,589, and the actuarial value of assets was $3,596,870, resulting in an unfunded actuarial accrued liability (UAAL) of $1,027,719. The covered payroll (annual payroll of active employees covered by the plan) was $1,142,241, and the ratio of the UAAL to the covered payroll was 89.97%.
The Schedule of Funding Progress, presented as Required Supplementary Information (RSI)following the notes to the financial statements, presents multiyear trend information about whether the actuarial value of plan assets is increasing or decreasing over time relative to the actuarial accrued liability (AAL) for benefits.

(Continued) 37
CITY OF COLONIAL HEIGHTS, VIRGINIA
NOTES TO FINANCIAL STATEMENTSJune 30, 2013
Note 13. Other Post-employment Benefits
Plan Description
Other post-employment benefits (OPEB) provided by the City and School Board consist ofsingle-employer defined benefit retiree health insurance premium plans.
A City retiree, eligible for the plan, is defined as a full-time employee who retires directly from the City and is eligible to receive an early or regular retirement benefit from the VRS. For pre-Medicare coverage, the City will provide a premium credit toward a retiree’s health insurance premium at a rate of $50.00 per month plus $5.00 per year of service per month not to exceed $100 per month based on 20 years of service in the VRS. For post-Medicare coverage, retirees may participate in an Anthem Advantage plan at full cost. Those with at least 15 years of service in the VRS receive a credit of $1.50 per month of VRS service, to a maximum of $45 per month. The plan was established by City Council and any amendments to the plan must be approved by the Council.
A School Board retiree, eligible for the School Board’s post-retirement medical coverage, is defined as a full-time employee who retires directly from the Schools, and is eligible to receive an early or regular retirement benefit from the VRS. To be eligible for School Credits, the employee must also have participated in the Schools’ health insurance plan for a minimum of five years immediately preceding retirement, and have at least 15 years of VRS Service. For pre-Medicare coverage, retirees may elect to remain on the Schools’ policy and pay the same premium as participants. Retirees with at least 15 years of service receive a School credit of $4.50 per month per year of service to a maximum of $135 per month for their lifetime. This School service credit will supplement any StateHealth Care Credits that the retiree may be eligible for from the State. Post-Medicare retirees may participate in a Medicare supplemental plan at full cost (less any School service credits). The plan was established by the School Board and any amendments to the plan must be approved by the School Board.
The plans do not issue stand-alone financial reports.
Funding Policy
The City’s Council and the School Board establish employer contribution rates for their respective plan participants. The Council and the Board have chosen to fund the healthcare benefits on a pay as you go basis.
Annual OPEB Cost and Net OPEB Obligation
The City and School Board had actuarial valuations of post-employment benefits performed as of July 1, 2011. The annual cost of OPEB under GASB Statement No. 45 is called the annual required contribution or ARC. The estimated pay as you go cost for OPEB benefits for the City’s plan is $112,533 and the annual benefit cost is $425,754. The percentage of annual OPEB cost contributed is 26.43%. The estimated pay as you go cost for OPEB benefits for the School Board’s plan is $364,534and the annual benefit cost is $695,127. The percentage of OPEB cost contributed is 52.44%.

(Continued) 38
CITY OF COLONIAL HEIGHTS, VIRGINIA
NOTES TO FINANCIAL STATEMENTSJune 30, 2013
Note 13. Other Post-employment Benefits
Annual OPEB Cost and Net OPEB Obligation (Continued)
GASB Statement No. 45 does not require prefunding of OPEB liabilities and the City and School Board have elected not to prefund OPEB liabilities at this time. The difference between the OPEB annual expense and cash payments for OPEB benefits is treated as a liability in the financial statements when the liability is not prefunded.
The Annual Required Contribution (ARC) represents a level of funding that, if paid on an ongoing basis is projected to cover normal cost each year and amortize any unfunded actuarial liabilities over a period not to exceed 30 years. The following table shows the components of the annual OPEB costs for the year, the amounts actually contributed for the year, and the changes in the net OPEBobligations.
City School Board
Annual required contribution (ARC) $ 427,354 $ 697,286Interest on net OPEB obligation 38,100 52,825Adjustment to annual required contribution (39,700) (54,984)
Annual OPEB cost 425,754 695,127Estimated contributions made (112,533) (364,534)
Increase in net OPEB obligation 313,221 330,593Net OPEB obligation, beginning of year 953,200 1,320,629
Net OPEB obligation, end of year $ 1,266,421 $ 1,651,222

(Continued) 39
CITY OF COLONIAL HEIGHTS, VIRGINIA
NOTES TO FINANCIAL STATEMENTSJune 30, 2013
Note 13. Other Post-employment Benefits (Continued)
City:
Percentage ofAnnual OPEB
Fiscal Year Annual OPEB Cost Net OPEBEnding Cost Contributed Obligation
June 30, 2013 $ 425,754 26.43% $ 1,266,421June 30, 2012 403,043 22.87% 953,200June 30, 2011 311,670 28.85% 642,348
School Board:Percentage ofAnnual OPEB
Fiscal Year Annual OPEB Cost Net OPEBEnding Cost Contributed Obligation
June 30, 2013 $ 695,127 52.44% $ 1,651,222June 30, 2012 668,173 49.46% 1,320,629June 30, 2011 730,800 58.70% 982,911
Funding Status and Funding Progress
As of July 1, 2011, the most recent actuarial valuation date for the City and School Board, the plans were not funded. The actuarial value of assets was $0 resulting in an unfunded actuarial liability (UAAL) of $3,476,123 for the City’s plan and a UAAL of $7,746,438 for the School Board’s plan.
Actuarial valuations of an ongoing plan involve estimates of the value of reported amounts and assumptions about the probability of occurrence of events far into the future. Examples include assumptions about future employment, mortality, and the healthcare cost trend. Amounts determined regarding the funded status of the plan are compared with past expectations and new estimates are made for the future. The schedules of funding progress, presented as Required Supplementary Information following the notes to the financial statements, presents trend information that shows whether the actuarial value of plan assets is increasing or decreasing over time relative to the actuarial accrued liabilities for benefits.
Actuarial Methods and Assumptions
Projections of benefits for financial reporting purposes are based on the substantive plan (the plan as understood by the employer and the plan members) and include the types of benefits provided at the time of each valuation and the historical pattern of sharing of benefit costs between the employer and plan members at that point. The actuarial methods and assumptions used include techniques that are designed to reduce the effects of short-term volatility in actuarial accrued liabilities and the actuarial value of assets, consistent with the long-term perspective of the calculations.

(Continued) 40
CITY OF COLONIAL HEIGHTS, VIRGINIA
NOTES TO FINANCIAL STATEMENTSJune 30, 2013
Note 13. Other Post-employment Benefits (Continued)
Actuarial Methods and Assumptions (Continued)
The Projected Unit Credit Actuarial Cost Method was used, in the actuarial valuations. The actuarial assumptions include a 4% rate of return and an annual healthcare cost trend rate of 10% initially, reduced by decrements to an ultimate rate of 5% after eight years. The unfunded liability is amortized over a period of 30 years based on a level percent of payroll method on an open basis.
Note 14. Fund Balances
Fund balance is classified as nonspendable, restricted, committed, assigned and/or unassigned based primarily on the extent to which the City is bound to observe constraints imposed upon the use of the resources in the funds. The constraints placed on fund balance are presented below:
CapitalGeneral Fund Projects Fund
Nonspendable:Inventories $ 61,006 $ -
Prepaids 8,853 -
______69,859 -
______Restricted:
Judicial administration 249,750 7,207,335Public safety 79,949 -
______Total restricted 329,699 7,207,335
______Committed:
General government 32,151 -
Judicial administration 90,703 -
Public safety 60,883 -
Public works 117,402 -
Parks, recreation and cultural 21,590 -
Community development 2,980 -
Nondepartmental 1,860 -
______Total committed 327,569 -
______Assigned:
General government 278,793 -
Judicial administration 2,050 -
Public safety 93,713 -
Public works 880,839 -
Parks, recreation and cultural 318,862 -
______ ______Total assigned 1,574,257 -
______ ______Unassigned 8,083,102 (1,245,870)______ ______Total fund balance $ 10,384,486 $ 5,961,465
(Continued) 41
CITY OF COLONIAL HEIGHTS, VIRGINIA
NOTES TO FINANCIAL STATEMENTSJune 30, 2013
Note 15. Risk Management
The City and School Board are exposed to various losses related to torts; theft of, damage to, and destruction of assets; errors and omissions; injuries to employees and others; and natural disasters. The City is covered by property/casualty insurance policies or participation in public entity risk pools on real and personal property, workers’ compensation, public entity and officers’ excess liability, and volunteer liability. There were no material reductions in insurance coverage from coverage in the prior year nor did settlements exceed coverage for any of the past three fiscal years.
Risk Pools:
The City participates in the Commonwealth of Virginia’s Law Enforcement Liability Plan, called VA Risk2, operated by the Division of Risk Management of the Commonwealth’s Department of General Services. It was created in accordance with Sec. 2.1-526.8:l of the Code of Virginia, which says that the State shall have the right and duty to defend any suit seeking damages or compensation against the City’s officials and employees on account of wrongful acts even if any of the allegations of the suits are groundless, false, or fraudulent and may make investigation and settlement of any claims or suit as deemed expedient. The limits of VA Risk2 coverage are $1,000,000 per claim.
Under the provisions of the Virginia Workers’ Compensation Act, the City has secured the payment of compensation benefits and employers’ liability coverage with the Virginia Municipal Group Self Insurance Association (VMGSIA). VMGSIA is a public entity risk pool providing a comprehensive workers’ compensation insurance program and risk management services with emphasis on loss control and claims administration.
The City has secured real and personal property coverage and general liability insurance, including automobiles, with the Virginia Municipal Liability Pool. The pool is a public entity risk pool providing compensative liability coverage risk management services with emphasis on loss control and claims administration.
The School Board carries commercial insurance through Utica National Insurance Group for property, casualty, general liability, and automobile coverage. Workers’ compensation insurance is provided through United Heartland.
Note 16. Jointly Governed Organizations
Riverside Regional Jail Authority:
The Authority was created by Chapter 726 of the 1990 Acts of the General Assembly and was formed on June 21, 1990. The Authority is comprised of the Cities of Colonial Heights, Hopewell and Petersburg and the Counties of Charles City, Chesterfield, Prince George and Surry. The Authority is governed by a seven member board comprised of one member from each participating jurisdiction. Each member must reside in and be appointed by the governing body of their political subdivision.

(Continued) 42
CITY OF COLONIAL HEIGHTS, VIRGINIA
NOTES TO FINANCIAL STATEMENTSJune 30, 2013
Note 16. Jointly Governed Organizations (Continued)
Riverside Regional Jail Authority: (Continued)
The general purpose of the Authority is to acquire, construct, equip, maintain and operate a regional jail facility to meet the needs of the participating jurisdictions for additional jail facilities. The Authority completed the feasibility study and conceptual design of the jail and proceeded with the preparation of the Service Agreement. The Service Agreement is a long-term contract regulating usage of the jail and establishing payment terms applicable to participating jurisdictions. It guarantees that the facility will be used and provides for the issuance of revenue bonds to fund the final design and construction of the regional jail facility. The City’s cost for adult incarceration services for 2013was approximately $2,605,000.
Complete financial statements for the Jail Authority can be obtained from the Jail Authority at 1000 River Road, P.O. Box 1041, Hopewell, Virginia 23860.
Appomattox River Water Authority:
The City, in conjunction with the Counties of Chesterfield, Dinwiddie and Prince George and the City of Petersburg, participated in the creation of the Authority. The Authority, whose five-member board is comprised of one representative from each participating entity, is responsible for providing asupply of filtered water to be purchased by the members of the Authority. In accordance with the joint venture agreement, each participating entity is required to purchase water from the Authority. The City retains an ongoing financial responsibility for the joint venture due to this requirement of the agreement. The City’s purchase of water for 2013 was approximately $412,000. Complete financial statements for the Authority can be obtained from the Authority’s office at 21300 Chesdin Road, Petersburg, Virginia 23803.
South Central Wastewater Authority (SCWWA):
The Authority was created on July 2, 1996, and currently provides wastewater treatment to the Cities of Colonial Heights and Petersburg, the Counties of Chesterfield and Prince George and the Dinwiddie County Water Authority. The City has 4.0 million gallons per day of wastewater treatment capacity reserved at SCWWA’s plant pursuant to a long-term service contract which is further described in Note 8. The City’s cost of wastewater treatment for 2013 excluding debt service was approximately $1,130,000. Complete financial statements for the Authority can be obtained from theAuthority’s office at 900 Magazine Road, Petersburg, Virginia 23803.
Central Virginia Waste Management Authority:
The Authority’s board is comprised of representatives from the Cities of Colonial Heights, Petersburg and Richmond, as well as the Counties of Charles City, Chesterfield, Goochland, Hanover, Henrico, New Kent, Powhatan, Prince George, and the Town of Ashland. The Authority is comprised of a 20-member board with member jurisdictions making at least one but no more than three appointments. The City appoints one board member. The Authority is responsible for creating and implementing recycling and solid waste management programs for member jurisdictions in order to meet waste reduction mandates set by the Virginia General Assembly. Except for contribution requirements and direct payments for special projects, no participant has an ongoing financial interest or responsibility in the Authority. The City’s 2013 contribution requirement and direct payments for special projects totaled approximately $788,000. Complete financial statements for the Authority can be obtained from the Authority’s office at 2100 W. Laburnum Ave., Suite 105, Richmond, Virginia 23227.

(Continued) 43
CITY OF COLONIAL HEIGHTS, VIRGINIA
NOTES TO FINANCIAL STATEMENTSJune 30, 2013
Note 16. Jointly Governed Organizations (Continued)
Virginia Gateway Region Board:
The Virginia Gateway Region Board (VGRB) serves the Cities of Colonial Heights, Hopewell and Petersburg, as well as the Counties of Chesterfield, Dinwiddie and Prince George in their efforts to provide balanced industrialization to corporation members. The City appoints two members of the Appomattox Basin Industrial Development Corporation (ABIDCO) board and contributed approximately $28,000 to ABIDCO during 2013.
Note 17. Related Organization
The City Council is responsible for appointing the members of the Colonial Heights IndustrialDevelopment Authority (Development Authority), but the City Council’s accountability for thisorganization does not extend beyond making the appointments. The Development Authority wasestablished under the Industrial Development and Revenue Act, Code of the Commonwealth ofVirginia. The Development Authority has the responsibility to promote industry and development oftrade by inducing manufacturing, industrial and commercial enterprise to locate or to remain in the City.
Note 18. New Accounting Standards
The Governmental Accounting Standards Board (GASB) has issued the following Statements which are not yet effective.
GASB Statement No. 65, Items Previously Reported as Assets and Liabilities, establishes standards for reclassification of certain item as deferred outflows and inflows of resources that were previously reported as assets and liabilities. The standard limits the items that should be reported as deferred outflows and inflows of resources to items specifically identified in authoritative pronouncements. Additionally, the standard requires that debt issuance costs be recognized as an expense in the period incurred except any portion related to prepaid insurance costs. Prospective application is required. The Statement will be effective for the year ending June 30, 2014.
GASB Statement No. 66, Technical Corrections – 2012 – an amendment of GASB Statements No. 10 and No. 62, was issued to resolve conflicting guidance that resulted from the issuance of two pronouncements. The Statement amends GASB Statement No. 10 by removing the provision that limits fund-based reporting of an entity’s risk financing activities to the general fund and the internal service fund type. The fund classification should be determined based on the nature of the activity to be reported. The Statement also amends GASB Statement No. 62 by modifying the specific guidance on accounting for (1) operating lease payments that vary from a straight-line basis, (2) the difference between the initial investment (purchase price) and the principal amount of a purchased loan or group of loans, and (3) servicing fees related to mortgage loans that are sold when the stated service fee rate differs significantly from a normal servicing fee rate. The Statement will be effective for the year ending June 30, 2014.

(Continued) 44
CITY OF COLONIAL HEIGHTS, VIRGINIA
NOTES TO FINANCIAL STATEMENTSJune 30, 2013
Note 18. New Accounting Standards (Continued)
GASB Statement No. 67, Financial Reporting for Pension Plans replaces the requirements of GASB Statements No. 25 and No. 50 as they relate to pension plans that are administered through trusts or similar arrangements meeting certain criteria. The Statement enhances note disclosures and RSI for both defined benefit and defined contribution pension plans. The Statement also requires the presentation of new information about annual money-weighted rates of return in the notes to the financial Statements and in 10-year RSI schedules. This Statement will be effective for the year ending June 30, 2014.
GASB Statement No. 68, Accounting and Financial Reporting for Pension Plans replaces the requirements of GASB Statements No. 27 and No. 50 as they relate to governments that provide pensions through pension plans administered as trusts or similar arrangements that meet certain criteria. The Statement requires governments providing defined benefit pensions to recognize the long-term obligation for pension benefits as a liability for the first time, and to more comprehensively and comparably measure the annual costs of pension benefits. The Statement also enhances accountability and transparency through revised and new note disclosures and required supplementary information, including disclosing descriptive information about the types of benefits provided, how contributions to the pension plan are determined, and assumptions and methods used to calculate the pension liability. This Statement will be effective for the year ending June 30, 2015.
GASB Statement No. 69, Government Combinations and Disposals of Government Operations was issued to provide governmental guidance on governmental combinations and disposals of governmental operations that does not conflict with GASB Statement No. 34. The objective of this Statement is to improve financial reporting by addressing accounting and financial reporting for government combinations and disposals of government operations. A disposal of a government’s operations results in the removal of specific activities of a government. This Statement requires disclosures to be made about government combinations and disposals of government operations to enable financial Statement users to evaluate the nature and financial effects of those transactions. This Statement will be effective for the year ending June 30, 2015.
GASB Statement No. 70, Accounting and Financial Reporting for Nonexchange Financial Guarantees was issued to improve accounting and financial reporting by state and local governments that extend and receive nonexchange financial guarantees. This Statement requires a government that extends a nonexchange financial guarantee to recognize a liability when qualitative factors and historical data, if any, indicate that it is more likely than not that the government will be required to make a payment on the guarantee. This Statement requires a government that has issued an obligation guaranteed in a nonexchange transaction to recognize revenue to the extent of the reduction in its guaranteed liabilities. This Statement also provides guidance on the accounting for the government if they are the obligor in the transaction and on intra-entity nonexchange financial guarantees involving blended component units. This Statement specifies the information required to be disclosed by governments that extend or receive nonexchange financial guarantees. This Statement will be effective for the year ending June 30, 2014.
Management has not yet evaluated the effects, if any, of adopting these standards.

45
CITY OF COLONIAL HEIGHTS, VIRGINIA
NOTES TO FINANCIAL STATEMENTSJune 30, 2013
Note 19. Subsequent Event
The School Board entered into a lease purchase agreement for school buses on August 1, 2013. The total cost of this contract is $272,877 with an interest rate of 3.50% to be paid in three annual installments starting on the date the agreement was signed.

46
REQUIRED SUPPLEMENTARYINFORMATION

EXHIBIT 10
(a) (b) (b-a) (a/b) (c) ((b-a)/c)
Unfunded
Actuarial
Actuarial Accrued UAAL as a
Actuarial Actuarial Accrued Liability Funded Covered Percentage of
Valuation Date Value of Assets Liability (AAL) (UAAL) Ratio Payroll Covered Payroll
A. City:
June 30, 2010 40,385,200$ 55,723,444$ 15,338,244$ 72.47% 11,591,345$ 132.32%
June 30, 2011 41,493,164$ 58,323,930$ 16,830,766$ 71.14% 11,528,726$ 145.99%
June 30, 2012 41,865,700$ 61,189,712$ 19,324,012$ 68.42% 11,751,917$ 164.43%
B. School Board:
June 30, 2010 3,643,476$ 4,308,209$ 664,733$ 84.57% 1,110,847$ 59.84%
June 30, 2011 3,654,218$ 4,350,069$ 695,851$ 84.00% 1,136,440$ 61.23%
June 30, 2012 3,596,870$ 4,624,589$ 1,027,719$ 77.78% 1,142,241$ 89.97%
A. City:
July 1, 2009 -$ 2,765,044$ 2,765,044$ 0.00% 11,145,672$ 24.81%
July 1, 2011 -$ 3,476,123$ 3,476,123$ 0.00% 11,528,726$ 30.15%
B. School Board:
July 1, 2009 -$ 8,699,403$ 8,699,403$ 0.00% 21,181,247$ 41.07%
OTHER POST-EMPLOYMENT BENEFITS
CITY OF COLONIAL HEIGHTS, VIRGINIA
SCHEDULES OF FUNDING PROGRESS
Year Ended June 30, 2013
VIRGINIA RETIREMENT SYSTEM
July 1, 2009 -$ 8,699,403$ 8,699,403$ 0.00% 21,181,247$ 41.07%
July 1, 2011 -$ 7,746,438$ 7,746,438$ 0.00% 18,437,990$ 42.01%
47

EXHIBIT 11
Variance with
Final Budget
Positive
Original Final Actual (Negative)
Revenues
Revenue from local sources:
General property taxes:
Real property 17,644,960$ 17,644,960$ 17,874,430$ 229,470$
Real and personal public service
corporation property 392,942 392,942 413,770 20,828
Personal property 2,376,522 2,376,522 2,175,776 (200,746)
Delinquent 809,726 809,726 809,919 193 Penalties and interest 205,000 205,000 160,357 (44,643)
Total general property taxes 21,429,150 21,429,150 21,434,252 5,102
Other local taxes:
Communication sales and use 725,000 725,000 712,132 (12,868)
Food and lodging 7,109,326 7,109,326 6,930,069 (179,257)
Consumer utility 975,000 975,000 964,068 (10,932)
Bank stock 315,000 315,000 282,070 (32,930)
Local option sales and use 7,205,239 7,205,239 7,174,335 (30,904) Recordation 180,000 180,000 246,952 66,952
Total other local taxes 16,509,565 16,509,565 16,309,626 (199,939)
Permits, fees, and licenses:
Business and occupational licenses 2,961,341 2,961,341 2,974,529 13,188
Motor vehicle licenses 380,000 380,000 463,987 83,987
Zoning and construction permits 91,000 91,000 99,361 8,361 Other fees 96,825 96,825 95,975 (850)
Total permits, fees, and licenses 3,529,166 3,529,166 3,633,852 104,686
Fines and forfeitures 718,000 718,000 729,979 11,979
Charges for services:
Refuse collection fees 1,146,800 1,146,800 1,125,094 (21,706)
Recreation use charges and fees 257,000 257,000 182,759 (74,241)
Administrative 1,091,175 1,091,175 1,228,667 137,492 Other 13,500 13,500 33,648 20,148
Total charges for services 2,508,475 2,508,475 2,570,168 61,693
Use of money and property:
Interest 15,000 15,000 2,722 (12,278)
Rental of property 125,000 125,000 157,242 32,242 Sale of commodities and property 17,000 17,000 36,917 19,917
Total use of money and property 157,000 157,000 196,881 39,881
Miscellaneous 19,600 52,328 97,933 45,605
Reimbursement from School Board 315,693 315,693 323,897 8,204
Total revenue from local sources 45,186,649 45,219,377 45,296,588 77,211
(Continued)
Year Ended June 30, 2013
Budgeted Amounts
CITY OF COLONIAL HEIGHTS, VIRGINIA
SCHEDULE OF REVENUES, EXPENDITURES, AND
CHANGES IN FUND BALANCE - BUDGET AND ACTUAL
GENERAL FUND
48

EXHIBIT 11
Variance with
Final Budget
Positive
Original Final Actual (Negative)
Year Ended June 30, 2013
Budgeted Amounts
CITY OF COLONIAL HEIGHTS, VIRGINIA
SCHEDULE OF REVENUES, EXPENDITURES, AND
CHANGES IN FUND BALANCE - BUDGET AND ACTUAL
GENERAL FUND
Revenues (Continued)
Intergovernmental:
Revenue from the Commonwealth:
Non-categorical aid:
Personal property tax relief 1,753,369$ 1,753,369$ 1,753,369$ -$
Rolling stock tax 4,160 3,643 5,328 1,685
Total non-categorical aid 1,757,529 1,757,012 1,758,697 1,685
Categorical aid:
Commissioner of Revenue 81,612 81,841 79,908 (1,933)
Treasurer 77,525 77,713 74,556 (3,157)
Circuit Court 243,799 227,211 267,129 39,918
Sheriff 275,000 275,853 275,584 (269)
Commonwealth’s attorney 418,083 438,152 433,632 (4,520)
Law enforcement 498,000 535,675 535,673 (2)
Street construction and maintenance 2,247,322 2,290,207 2,290,207 -
Other 367,858 425,329 478,892 53,563
Total categorical aid 4,209,199 4,351,981 4,435,581 83,600
Total revenue from the Commonwealth 5,966,728 6,108,993 6,194,278 85,285
Revenue from federal government:Categorical aid 142,079 172,495 211,997 39,502
Total intergovernmental 6,108,807 6,281,488 6,406,275 124,787
Total revenue 51,295,456$ 51,500,865$ 51,702,863$ 201,998$
Expenditures
General government:
City council 72,324$ 72,508$ 67,470$ 5,038$
Clerk of council 65,749 68,427 44,113 24,314
City manager 203,126 220,491 218,328 2,163
Human resources 96,879 100,517 94,014 6,503
City attorney 205,536 208,717 202,025 6,692
Real estate assessor 127,585 132,733 134,837 (2,104)
Commissioner of the revenue 195,256 203,426 194,302 9,124
Treasurer 241,481 250,913 245,568 5,345
Finance 484,952 507,135 503,296 3,839
Information technologies 172,061 194,489 168,700 25,789
Auditing 134,262 136,840 125,927 10,913
Purchasing 142,811 168,682 114,807 53,875
Insurance and risk management 548,400 548,400 510,124 38,276
Employee benefits 5,395,472 4,836,728 4,968,431 (131,703)
Board of elections 25,312 25,391 23,640 1,751 Registrar 104,289 108,112 106,849 1,263
Total general government 8,215,495 7,783,509 7,722,431 61,078
(Continued)
49

EXHIBIT 11
Variance with
Final Budget
Positive
Original Final Actual (Negative)
Year Ended June 30, 2013
Budgeted Amounts
CITY OF COLONIAL HEIGHTS, VIRGINIA
SCHEDULE OF REVENUES, EXPENDITURES, AND
CHANGES IN FUND BALANCE - BUDGET AND ACTUAL
GENERAL FUND
Expenditures (Continued)
Judicial administration:
Circuit courts 390,411$ 406,186$ 399,995$ 6,191$
General district court 85,920 86,550 90,918 (4,368)
Probation 6,100 6,100 5,743 357
Commonwealth’s attorney 509,242 534,334 540,292 (5,958)
Sheriff 577,668 606,496 560,618 45,878
Incarceration 2,450,500 2,550,944 2,844,110 (293,166)
Community correction services 98,800 98,800 98,800 - Community diversion services 58,800 58,800 54,696 4,104
Total judicial administration 4,177,441 4,348,210 4,595,172 (246,962)
Public safety:
Bureau of police 3,552,225 3,927,271 3,990,317 (63,046)
Bureau of fire 2,887,547 3,057,146 3,016,655 40,491
Emergency preparedness 43,675 57,643 58,891 (1,248) Communications 1,072,657 1,159,374 1,135,386 23,988
Total public safety 7,556,104 8,201,434 8,201,249 185
Public works:
Adminstration 225,242 235,810 236,265 (455)
Horticulutre 77,800 79,625 73,091 6,534
Engineering division 658,310 695,578 672,574 23,004
Street maintenance 1,242,367 1,384,099 1,259,215 124,884
Building maintenance 498,119 520,282 513,445 6,837
Fleet maintenance 260,215 271,951 259,554 12,397
Solid waste 621,848 621,848 612,644 9,204 Recycling 277,111 277,111 280,076 (2,965)
Toal public works 3,861,012 4,086,304 3,906,864 179,440
Health and welfare:
Health 181,058 181,058 181,058 -
Welfare 325,050 275,050 303,491 (28,441) Comprehensive services 150,000 300,000 270,054 29,946
Total heath and welfare 656,108 756,108 754,603 1,505
Parks, recreation, and cultural:
Parks and recreation 476,814 493,227 453,878 39,349
Parks and grounds 497,169 526,774 505,794 20,980
Agency on aging 261,950 291,524 252,602 38,922
Violet bank museum 85,207 89,472 73,120 16,352
Library 590,054 624,477 620,531 3,946 Recreation trips and classes 240,000 240,000 150,366 89,634
Total parks, recreation, and cultural 2,151,194 2,265,474 2,056,291 209,183
(Continued)
50

EXHIBIT 11
Variance with
Final Budget
Positive
Original Final Actual (Negative)
Year Ended June 30, 2013
Budgeted Amounts
CITY OF COLONIAL HEIGHTS, VIRGINIA
SCHEDULE OF REVENUES, EXPENDITURES, AND
CHANGES IN FUND BALANCE - BUDGET AND ACTUAL
GENERAL FUND
Expenditures: (Continued)
Community development:
Planning 172,898$ 195,501$ 184,784$ 10,717$
Building inspections 213,511 222,843 214,342 8,501 Industrial development 87,000 87,000 88,029 (1,029)
Total community development 473,409 505,344 487,155 18,189
Education:
Payments to School Board 19,132,551 19,132,551 19,296,419 (163,868)
Grants:
Office of youth 135,323 145,480 140,503 4,977
Better beginnings 2,600 2,600 1,591 1,009
Juvenile crime 124,650 128,616 137,679 (9,063)
Victim witness 70,968 73,126 68,832 4,294
CDBG 69,234 69,234 69,239 (5) Kids after school program 28,600 28,600 26,502 2,098
Toal grants 431,375 447,656 444,346 3,310
Nondepartmental:
Contributions and subsidies 204,790 204,790 179,118 25,672 Contingencies and miscellaneous 316,500 146,564 90,630 55,934
Total nondepartmental 521,290 351,354 269,748 81,606
Debt service:
Principal retirement 2,546,199 2,546,199 2,546,199 -
Interest and fiscal charges 1,508,278 1,508,278 1,508,279 (1) Bond issuance costs 10,000 33,000 2,775 30,225
Total debt service 4,064,477 4,087,477 4,057,253 30,224
Total expenditures 51,240,456 51,965,421 51,791,531 173,890
Excess of revenues over (under)
expenditures 55,000 (464,556) (88,668) 375,888
Other financing source (uses):
Transfers in - - 256,497 256,497
Transfers out (55,000) (55,000) (55,000) -
Total other financing sources (uses) (55,000) (55,000) 201,497 256,497
Net change in fund balance -$ (519,556)$ 112,829$ 632,385$
51

EXHIBIT 12
Storm Water
Solid Waste Management Totals
ASSETSCurrent assets:
Cash and investments -$ 218,597$ 218,597$
Receivables, net - 69,730 69,730
Total current assets - 288,327 288,327
Noncurrent assets:
Capital assets, net - 144,147 144,147
Total assets - 432,474 432,474
LIABILITIES
Current liabilities:
Accounts payable and other current liabilities - 3,805 3,805
Compensated absences - 3,284 3,284
Debt obligations, current - 32,558 32,558
Total current liabilities - 39,647 39,647
Noncurrent liabilities:
Compensated absences - 2,696 2,696
Other post-employment benefits - 6,982 6,982
Total noncurrent liabilities - 9,678 9,678
Total liabilities - 49,325 49,325
NET POSITION
Net investment in capital assets - 111,589 111,589
Unrestricted - 271,560 271,560
Total net position -$ 383,149$ 383,149$
CITY OF COLONIAL HEIGHTS, VIRGINIA
COMBINING STATEMENT OF NET POSITION
NONMAJOR PROPRIETARY FUNDS
June 30, 2013
52
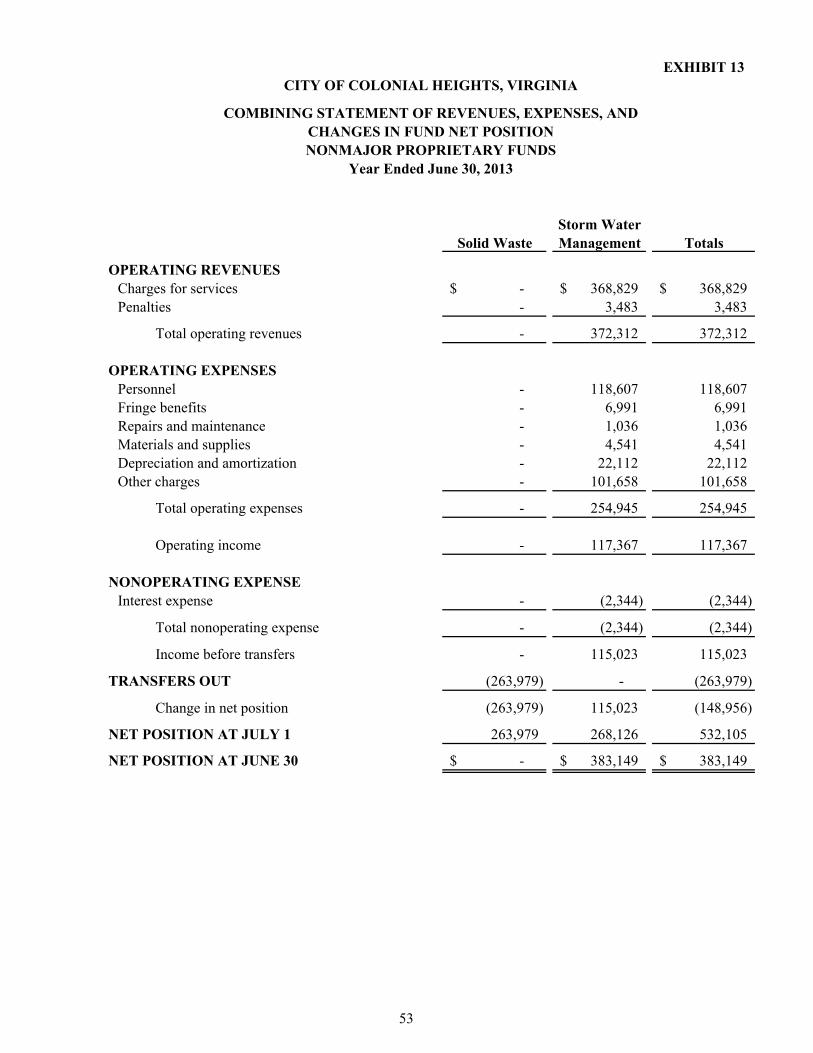
EXHIBIT 13
Storm Water
Solid Waste Management Totals
OPERATING REVENUES
Charges for services -$ 368,829$ 368,829$
Penalties - 3,483 3,483
Total operating revenues - 372,312 372,312
OPERATING EXPENSES
Personnel - 118,607 118,607
Fringe benefits - 6,991 6,991
Repairs and maintenance - 1,036 1,036
Materials and supplies - 4,541 4,541
Depreciation and amortization - 22,112 22,112
Other charges - 101,658 101,658
Total operating expenses - 254,945 254,945
Operating income - 117,367 117,367
NONOPERATING EXPENSE
Interest expense - (2,344) (2,344)
Total nonoperating expense - (2,344) (2,344)
Income before transfers - 115,023 115,023
TRANSFERS OUT (263,979) - (263,979)
Change in net position (263,979) 115,023 (148,956)
NET POSITION AT JULY 1 263,979 268,126 532,105
NET POSITION AT JUNE 30 -$ 383,149$ 383,149$
CITY OF COLONIAL HEIGHTS, VIRGINIA
COMBINING STATEMENT OF REVENUES, EXPENSES, AND
CHANGES IN FUND NET POSITION
NONMAJOR PROPRIETARY FUNDS
Year Ended June 30, 2013
53

EXHIBIT 14
Storm Water
Solid Waste Management Totals
OPERATING ACTIVITIES
Receipts from customers -$ 370,183$ 370,183$
Payments to suppliers - (107,256) (107,256)
Payments to employees - (123,093) (123,093)
Net cash provided by operating activities - 139,834 139,834
NONCAPITAL FINANCING ACTIVITIES
Transfer of cash to close out fund (62,897) - (62,897)
Net cash used in noncapital financing activities (62,897) - (62,897)
CAPITAL AND RELATED FINANCING ACTIVITIES
Principal paid - (41,932) (41,932)
Interest paid - (2,344) (2,344)
Net cash used in capital and related financing activities - (44,276) (44,276)
Net increase (decrease) in cash and cash equivalents (62,897) 95,558 32,661
CASH AND CASH EQUIVALENTS
Beginning 62,897 123,039 185,936
Ending -$ 218,597$ 218,597$
RECONCILIATION OF OPERATING INCOME
TO NET CASH PROVIDED BY OPERATING
ACTIVITIES
Operating income -$ 117,367$ 117,367$
Adjustments to reconcile operating income to net
cash provided by operating activities:
Depreciation and amortization - 22,112 22,112
Change in assets and liabilities:
(Increase) in:
Receivables, net - (2,129) (2,129)
Increase (decrease) in:
Accounts payable and other current liabilities - (21) (21)
Compensated absences - 778 778
Other post-employment benefits - 1,727 1,727
Net cash provided by operating activities -$ 139,834$ 139,834$
CITY OF COLONIAL HEIGHTS, VIRGINIA
COMBINING STATEMENT OF CASH FLOWS
NONMAJOR PROPRIETARY FUNDS
Year Ended June 30, 2013
54
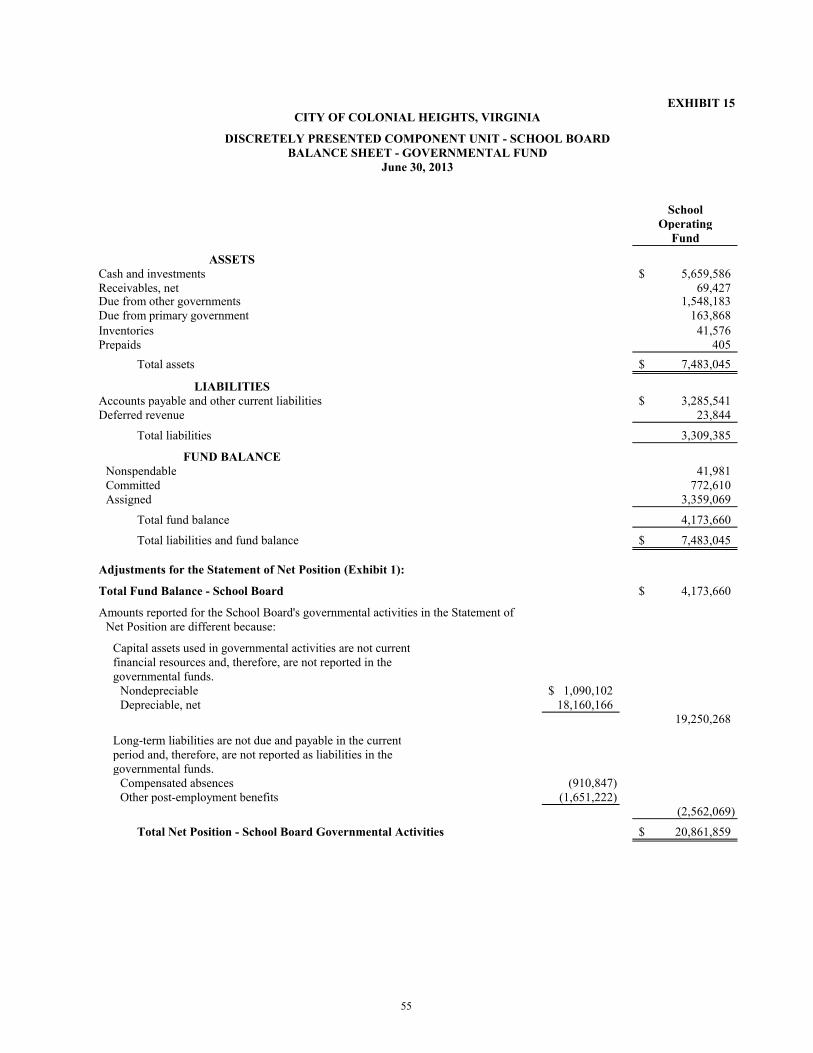
EXHIBIT 15
SchoolOperating
Fund
ASSETSCash and investments 5,659,586$ Receivables, net 69,427 Due from other governments 1,548,183 Due from primary government 163,868 Inventories 41,576 Prepaids 405
Total assets 7,483,045$
LIABILITIESAccounts payable and other current liabilities 3,285,541$ Deferred revenue 23,844
Total liabilities 3,309,385
FUND BALANCENonspendable 41,981 Committed 772,610 Assigned 3,359,069
Total fund balance 4,173,660
Total liabilities and fund balance 7,483,045$
Adjustments for the Statement of Net Position (Exhibit 1):
Total Fund Balance - School Board 4,173,660$
Amounts reported for the School Board's governmental activities in the Statement ofNet Position are different because:
Capital assets used in governmental activities are not currentfinancial resources and, therefore, are not reported in thegovernmental funds.
Nondepreciable 1,090,102$ Depreciable, net 18,160,166
19,250,268
Long-term liabilities are not due and payable in the currentperiod and, therefore, are not reported as liabilities in the governmental funds.
Compensated absences (910,847) Other post-employment benefits (1,651,222)
(2,562,069)
Total Net Position - School Board Governmental Activities 20,861,859$
CITY OF COLONIAL HEIGHTS, VIRGINIA
DISCRETELY PRESENTED COMPONENT UNIT - SCHOOL BOARDBALANCE SHEET - GOVERNMENTAL FUND
June 30, 2013
55

EXHIBIT 16
SchoolOperating
Fund
REVENUESCharges for services 573,499$ Miscellaneous 102,450 Payments from City 19,296,419Intergovernmental 14,599,996
Total revenue 34,572,364
EXPENDITURESEducation:
Administration, attendance and health 1,698,228 Instruction 25,680,661Operation and maintenance 3,382,263 Pupil transportation 828,163 Food service 1,060,445 Facilities 131,797 Technology 1,355,617 Reimbursement to City 323,897
Total expenditures 34,461,071
Net change in fund balance 111,293
FUND BALANCE AT JULY 1 4,062,367
FUND BALANCE AT JUNE 30 4,173,660$
Reconciliation to the Statement of Activities (Exhibit 2):
Net Change in Fund Balance - School Board 111,293$
Governmental funds report capital outlays as expenditures; however, in the Statement of Activities, the cost of those assets are allocated over their estimateduseful lives and reported as depreciation expense.
Capital outlays 280,731$ Depreciation expense (904,124)
(623,393)
Some expenses reported in the Statement of Activities do not requirethe use of current financial resources and, therefore, are not reported asexpenditures in the governmental funds.
Compensated absences (154,359) Other post-employment benefits (330,593)
(484,952)
Change in Net Position - School Board Governmental Activities (997,052)$
CITY OF COLONIAL HEIGHTS, VIRGINIA
DISCRETELY PRESENTED COMPONENT UNIT - SCHOOL BOARDSCHEDULE OF REVENUES, EXPENDITURES, AND
Year Ended June 30, 2013CHANGES IN FUND BALANCE - GOVERNMENTAL FUND
56

EXHIBIT 17
Variance WithOriginal Final Final BudgetBudget Budget Actual Positive (Negative)
REVENUESRevenue from local sources:
Charges for services:Cafeteria 445,609$ 388,922$ 388,922$ -$
Other 171,470 184,577 184,577 -
617,079 573,499 573,499 -
Use of money and property:
Interest on investments 5,125 - - -
Miscellaneous 25,000 102,450 102,450 -
Payments from City 18,920,491 19,296,419 19,296,419 -
Total revenue from local sources 19,567,695 19,972,368 19,972,368 -
Intergovernmental:Revenue from the Commonwealth of Virginia:
Categorical aid:Basic school aid 6,786,479 6,665,951 6,665,951 - State sales tax 2,639,265 2,633,944 2,633,944 - Other 3,606,683 3,512,056 3,512,056 -
13,032,427 12,811,951 12,811,951 -
Revenue from the federal government:Categorical aid:
Title I Grant 288,127 436,731 436,731 - Title VI B Grant 601,298 601,738 601,738 - State Fiscal Stabilization Fund Grant - - - - Other 650,781 700,686 749,576 48,890
1,540,206 1,739,155 1,788,045 48,890
Total intergovernmental 14,572,633 14,551,106 14,599,996 48,890
Total revenues 34,140,328 34,523,474 34,572,364 48,890
EXPENDITURESEducation:
Administration, attendance and health 1,614,862 1,698,488 1,698,228 260 Instruction 26,607,781 25,904,891 25,680,661 224,230 Operation and maintenance 3,401,359 3,533,480 3,382,263 151,217 Pupil transportation 817,957 828,163 828,163 - Food service 987,529 1,005,286 1,060,445 (55,159) Facilities - 131,797 131,797 - Technology 1,321,833 1,355,617 1,355,617 - Contingencies 387,826 1,057,668 - 1,057,668 Reimbursement to City 316,994 323,897 323,897 -
Total expenditures 35,456,141 35,839,287 34,461,071 1,378,216
Net change in fund balance (1,315,813)$ (1,315,813)$ 111,293$ 1,427,106$
CITY OF COLONIAL HEIGHTS, VIRGINIA
DISCRETELY PRESENTED COMPONENT UNIT - SCHOOL BOARDSCHEDULE OF REVENUES, EXPENDITURES, AND CHANGES
IN FUND BALANCE - BUDGET AND ACTUAL - SCHOOL OPERATING FUNDYear Ended June 30, 2013
57

58
SUPPORTING SCHEDULE
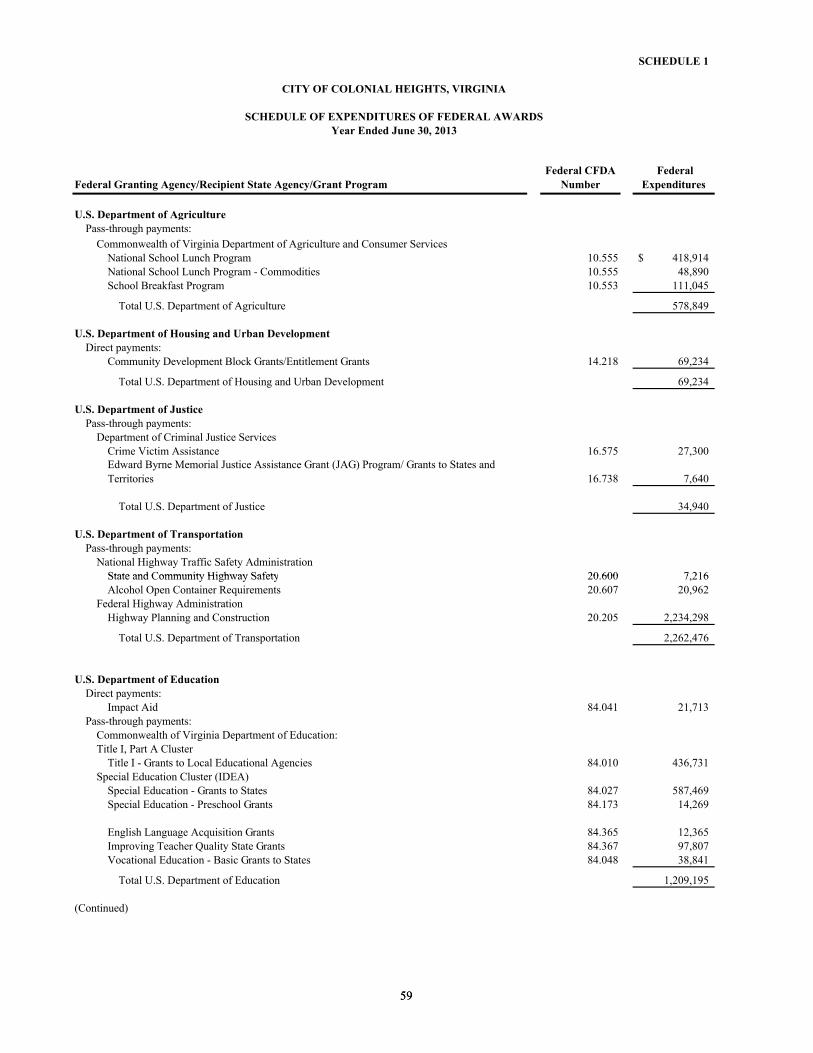
SCHEDULE 1
Federal Granting Agency/Recipient State Agency/Grant Program
Federal CFDA
Number
Federal
Expenditures
U.S. Department of AgriculturePass-through payments:
Commonwealth of Virginia Department of Agriculture and Consumer ServicesNational School Lunch Program 10.555 418,914$ National School Lunch Program - Commodities 10.555 48,890 School Breakfast Program 10.553 111,045
Total U.S. Department of Agriculture 578,849
U.S. Department of Housing and Urban DevelopmentDirect payments:
Community Development Block Grants/Entitlement Grants 14.218 69,234
Total U.S. Department of Housing and Urban Development 69,234
U.S. Department of JusticePass-through payments:
Department of Criminal Justice ServicesCrime Victim Assistance 16.575 27,300 Edward Byrne Memorial Justice Assistance Grant (JAG) Program/ Grants to States and
Territories 16.738 7,640
Total U.S. Department of Justice 34,940
U.S. Department of TransportationPass-through payments:
National Highway Traffic Safety AdministrationState and Community Highway Safety 20.600 7,216
CITY OF COLONIAL HEIGHTS, VIRGINIA
SCHEDULE OF EXPENDITURES OF FEDERAL AWARDSYear Ended June 30, 2013
59
State and Community Highway Safety 20.600 7,216 Alcohol Open Container Requirements 20.607 20,962
Federal Highway AdministrationHighway Planning and Construction 20.205 2,234,298
Total U.S. Department of Transportation 2,262,476
U.S. Department of EducationDirect payments:
Impact Aid 84.041 21,713 Pass-through payments:
Commonwealth of Virginia Department of Education:Title I, Part A Cluster
Title I - Grants to Local Educational Agencies 84.010 436,731 Special Education Cluster (IDEA)
Special Education - Grants to States 84.027 587,469 Special Education - Preschool Grants 84.173 14,269
English Language Acquisition Grants 84.365 12,365 Improving Teacher Quality State Grants 84.367 97,807 Vocational Education - Basic Grants to States 84.048 38,841
Total U.S. Department of Education 1,209,195
(Continued)
59
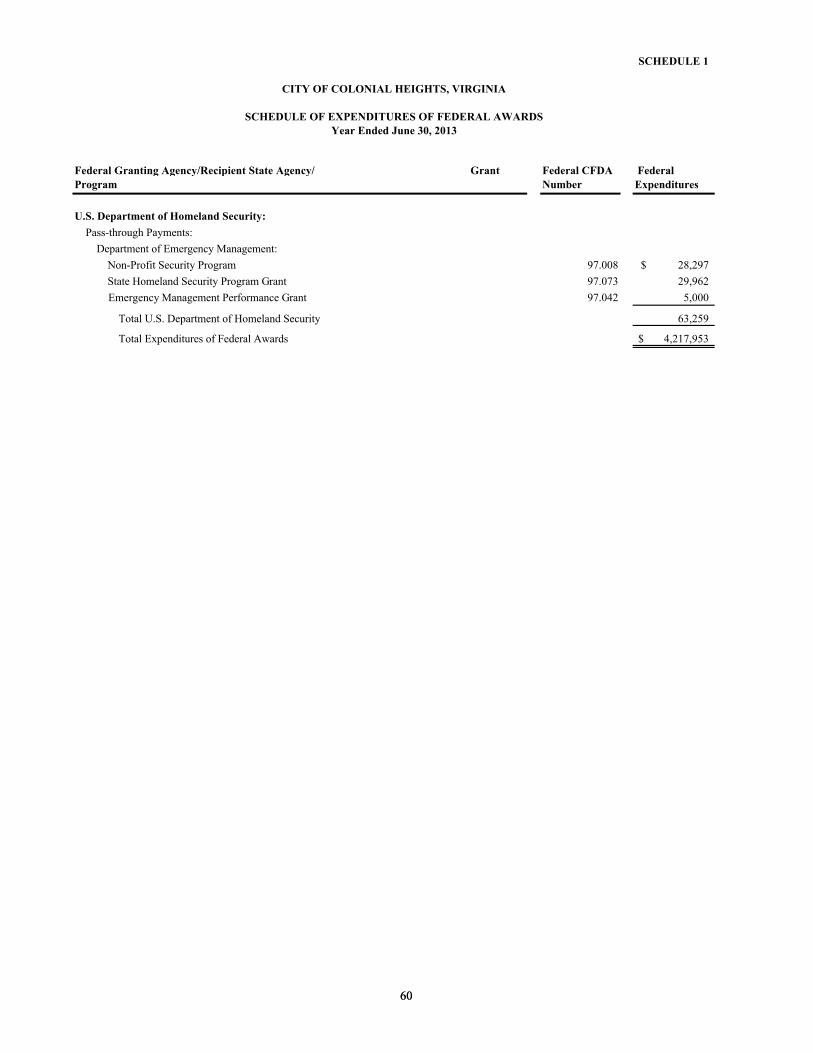
SCHEDULE 1
Federal Granting Agency/Recipient State Agency/ Grant
Program
Federal CFDA
Number
Federal
Expenditures
U.S. Department of Homeland Security:
Pass-through Payments:
Department of Emergency Management:
Non-Profit Security Program 97.008 28,297$
State Homeland Security Program Grant 97.073 29,962
Emergency Management Performance Grant 97.042 5,000
Total U.S. Department of Homeland Security 63,259
Total Expenditures of Federal Awards 4,217,953$
CITY OF COLONIAL HEIGHTS, VIRGINIA
SCHEDULE OF EXPENDITURES OF FEDERAL AWARDSYear Ended June 30, 2013
6060

61
CITY OF COLONIAL HEIGHTS, VIRGINIA
NOTES TO SCHEDULE OF EXPENDITURES OF FEDERAL AWARDSYear Ended June 30, 2013
Note. 1. Basis of Presentation
The accompanying schedule of expenditures of federal awards is presented on the modified accrual basis of accounting as contemplated by generally accepted accounting principles.
The information presented in this Schedule is presented in accordance with OMB Circular A-133, Audits of States, Local Governments, and Non-Profit Organizations. Therefore, some amounts presented in this schedule may differ from amounts presented in, or used in the preparation of the City’s CAFR.
Note. 2. Non-Cash Assistance
The City of Colonial Heights participated in the National School Lunch Program, CFDA Number 10.555, which provides non-cash benefits. The accompanying Schedule of Expenditure of Federal Awards includes commodity distributions of $48,890 from the National School Lunch Program.

THIS PAGE INTENTIONALLY BLANK

62
STATISTICAL SECTION
This part of the report presents detailed information as a context for understanding what the information in the financial statements, note disclosures, and required supplementary information says about the City’s overall financial health.
Contents Table
Financial Trends 1-4These tables contain trend information to help the reader understand how the City’s financial performance and well-being have changed over time.
Revenue Capacity 5-10These tables contain information to help the reader assess the factors affecting the City’s ability to generate its property taxes and utility revenues.
Debt Capacity 11-12These tables present information to help the reader assess the affordability of the City’s current levels of outstanding debt and the City’s ability to issue additional debt in the future.
Demographic and Economic Information 13-14These tables offer demographic and economic indicators to help the reader understand the environment within which the City’s financial activities take place and to help make comparison over time and with other governments.
Operating Information 15-16These schedules contain information about the City’s operations and resources to help the reader understand how the City’s financial information relates to the services the City provides and the activities it performs.
Sources: Unless otherwise noted, the information in these schedules is derived from the Comprehensive Annual Financial Reports for the relevant year.
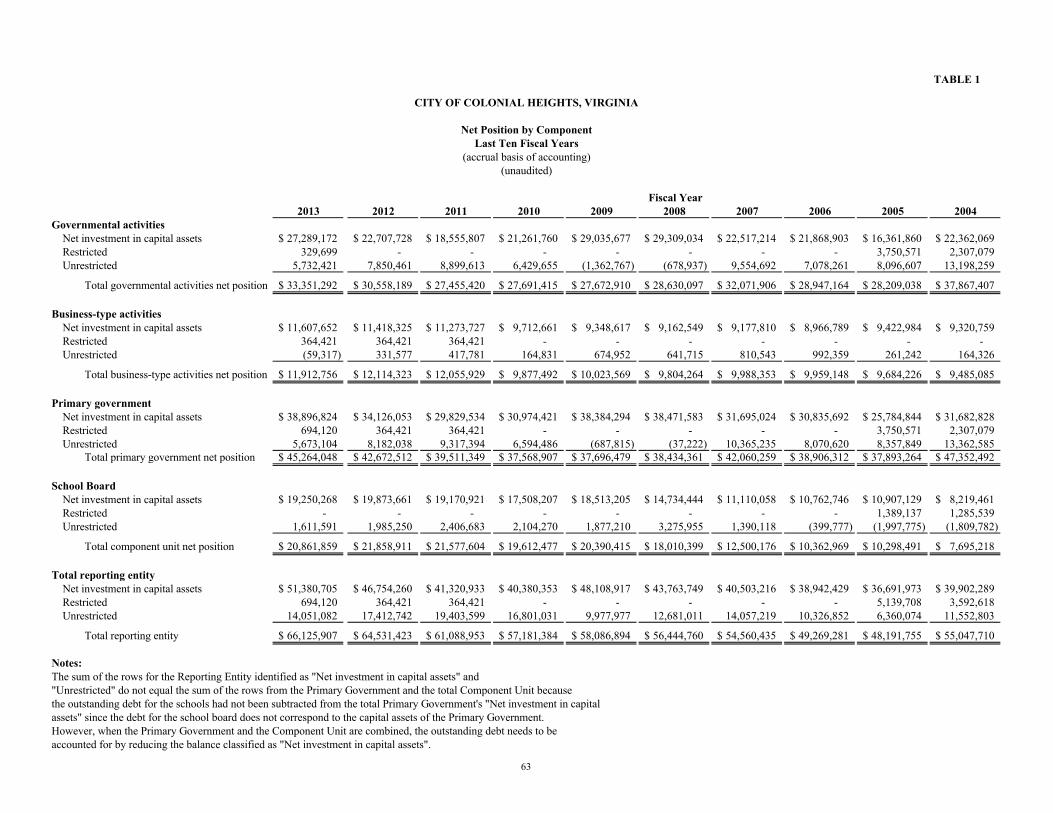
TABLE 1
2013 2012 2011 2010 2009 2008 2007 2006 2005 2004Governmental activities
Net investment in capital assets 27,289,172$ 22,707,728$ 18,555,807$ 21,261,760$ 29,035,677$ 29,309,034$ 22,517,214$ 21,868,903$ 16,361,860$ 22,362,069$ Restricted 329,699 - - - - - - - 3,750,571 2,307,079 Unrestricted 5,732,421 7,850,461 8,899,613 6,429,655 (1,362,767) (678,937) 9,554,692 7,078,261 8,096,607 13,198,259
Total governmental activities net position 33,351,292$ 30,558,189$ 27,455,420$ 27,691,415$ 27,672,910$ 28,630,097$ 32,071,906$ 28,947,164$ 28,209,038$ 37,867,407$
Business-type activitiesNet investment in capital assets 11,607,652$ 11,418,325$ 11,273,727$ 9,712,661$ 9,348,617$ 9,162,549$ 9,177,810$ 8,966,789$ 9,422,984$ 9,320,759$ Restricted 364,421 364,421 364,421 - - - - - - - Unrestricted (59,317) 331,577 417,781 164,831 674,952 641,715 810,543 992,359 261,242 164,326
Total business-type activities net position 11,912,756$ 12,114,323$ 12,055,929$ 9,877,492$ 10,023,569$ 9,804,264$ 9,988,353$ 9,959,148$ 9,684,226$ 9,485,085$
Primary governmentNet investment in capital assets 38,896,824$ 34,126,053$ 29,829,534$ 30,974,421$ 38,384,294$ 38,471,583$ 31,695,024$ 30,835,692$ 25,784,844$ 31,682,828$ Restricted 694,120 364,421 364,421 - - - - - 3,750,571 2,307,079 Unrestricted 5,673,104 8,182,038 9,317,394 6,594,486 (687,815) (37,222) 10,365,235 8,070,620 8,357,849 13,362,585
Total primary government net position 45,264,048$ 42,672,512$ 39,511,349$ 37,568,907$ 37,696,479$ 38,434,361$ 42,060,259$ 38,906,312$ 37,893,264$ 47,352,492$
School BoardNet investment in capital assets 19,250,268$ 19,873,661$ 19,170,921$ 17,508,207$ 18,513,205$ 14,734,444$ 11,110,058$ 10,762,746$ 10,907,129$ 8,219,461$ Restricted - - - - - - - - 1,389,137 1,285,539 Unrestricted 1,611,591 1,985,250 2,406,683 2,104,270 1,877,210 3,275,955 1,390,118 (399,777) (1,997,775) (1,809,782)
Total component unit net position 20,861,859$ 21,858,911$ 21,577,604$ 19,612,477$ 20,390,415$ 18,010,399$ 12,500,176$ 10,362,969$ 10,298,491$ 7,695,218$
Total reporting entityNet investment in capital assets 51,380,705$ 46,754,260$ 41,320,933$ 40,380,353$ 48,108,917$ 43,763,749$ 40,503,216$ 38,942,429$ 36,691,973$ 39,902,289$ Restricted 694,120 364,421 364,421 - - - - - 5,139,708 3,592,618 Unrestricted 14,051,082 17,412,742 19,403,599 16,801,031 9,977,977 12,681,011 14,057,219 10,326,852 6,360,074 11,552,803
Total reporting entity 66,125,907$ 64,531,423$ 61,088,953$ 57,181,384$ 58,086,894$ 56,444,760$ 54,560,435$ 49,269,281$ 48,191,755$ 55,047,710$
The sum of the rows for the Reporting Entity identified as "Net investment in capital assets" and"Unrestricted" do not equal the sum of the rows from the Primary Government and the total Component Unit becausethe outstanding debt for the schools had not been subtracted from the total Primary Government's "Net investment in capitalassets" since the debt for the school board does not correspond to the capital assets of the Primary Government.However, when the Primary Government and the Component Unit are combined, the outstanding debt needs to beaccounted for by reducing the balance classified as "Net investment in capital assets".
Last Ten Fiscal YearsNet Position by Component
CITY OF COLONIAL HEIGHTS, VIRGINIA
Notes:
Fiscal Year
(unaudited)(accrual basis of accounting)
63

TABLE 2
2013 2012 2011 2010 2009 2008 2007 2006 2005 2004Expenses
Governmental activitiesGeneral government 8,513,050$ 8,430,859$ 8,252,642$ 8,420,688$ 8,075,559$ 7,617,133$ 6,631,282$ 6,389,754$ 7,321,447$ 4,852,767$ Judicial administration 4,654,684 4,185,393 4,784,397 4,622,336 4,453,918 4,401,401 3,758,743 3,618,242 3,755,313 3,514,009 Public safety 9,019,958 8,862,843 8,132,209 8,157,263 8,007,156 7,446,556 6,603,707 6,611,272 5,972,139 7,140,873 Public works 5,340,369 4,204,531 4,093,809 4,644,140 3,675,598 3,650,407 3,488,051 3,705,174 4,791,051 4,162,560 Health and welfare 758,401 650,043 564,251 511,097 593,946 716,096 905,641 727,289 571,565 491,837 Parks, recreation, and cultural 2,388,151 2,262,706 2,332,036 2,420,733 2,450,217 2,350,085 1,755,411 2,049,025 600,181 1,778,567 Community development 500,588 468,981 465,764 613,699 571,243 580,574 575,426 367,863 301,989 349,923 Education 19,296,419 18,996,933 19,405,770 18,598,070 20,202,607 23,330,795 16,738,368 15,886,549 15,451,926 14,372,467 Interest 1,230,148 940,076 846,625 996,773 1,181,785 1,136,041 911,350 972,251 790,506 773,455 Grants - - - - - - - - 296,790 281,149 Nondepartmental - - - - - - - - 355,625 469,497
Total governmental activities 51,701,768 49,002,365 48,877,503 48,984,799 49,212,029 51,229,088 41,367,979 40,327,419 40,208,532 38,187,104 Business-type activities
Water and Sewer 4,197,076 - - - - - 3,962,952 3,999,152 3,708,566 3,757,669 Water - 1,599,243 1,599,110 1,692,407 1,625,950 1,610,037 - - - - Sewer - 2,687,436 2,142,288 2,863,099 2,903,274 2,772,254 - - - - Solid Waste - 1,226,034 1,192,142 1,174,794 1,145,197 1,263,794 1,292,339 1,196,750 - - Storm water management 257,289 258,114 231,702 229,545 243,483 - - - - -
Total business-type activities expense 4,454,365 5,770,827 5,165,242 5,959,845 5,917,904 5,646,085 5,255,291 5,195,902 3,708,566 3,757,669 Total primary government expenses 56,156,133 54,773,192 54,042,745 54,944,644 55,129,933 56,875,173 46,623,270 45,523,321 43,917,098 41,944,773
Program revenuesGovernmental activities
Charges for servicesRefuse collection - - - - - - - - 585,869 560,130 Parks and recreation 182,759 150,502 247,439 336,773 254,040 285,497 234,477 290,542 208,188 132,109 Other activities 6,751,240 5,313,067 5,235,500 5,125,656 5,234,826 5,001,743 5,068,830 1,074,769 1,035,840 1,110,040
Operating grants and contributions 4,971,475 5,418,602 4,836,631 5,102,144 5,487,211 5,472,945 4,732,453 4,587,798 5,801,543 4,643,676 Capital grants and contributions 2,413,293 2,809,970 941,115 1,320,778 151,333 - - 190,254 720,042 -
Total governmental activities program
revenues 14,318,767 13,692,141 11,260,685 11,885,351 11,127,410 10,760,185 10,035,760 6,143,363 8,351,482 6,445,955 Business-type activities
Charges for servicesWater and sewer 4,144,465 - - - - - 3,842,186 3,751,822 3,877,189 4,021,033 Water - 1,531,079 1,553,670 1,640,431 1,769,893 1,663,191 - - - - Sewer - 2,696,866 2,675,820 2,740,934 2,892,816 2,523,737 - - - - Solid waste - 1,143,300 1,118,569 1,096,627 1,070,028 1,061,581 1,042,343 816,533 - - Storm water management 372,312 377,976 257,563 - - - - - - -
Total business-type activities program
revenues 4,516,777 5,749,221 5,605,622 5,477,992 5,732,737 5,248,509 4,884,529 4,568,355 3,877,189 4,021,033 Total primary government program
revenues 18,835,544 19,441,362 16,866,307 17,363,343 16,860,147 16,008,694 14,920,289 10,711,718 12,228,671 10,466,988 (Continued)
(accrual basis of accounting)Last Ten Fiscal Years
Change in Net Position by Component
CITY OF COLONIAL HEIGHTS, VIRGINIA
(unaudited)
Fiscal Year
64

TABLE 2
2013 2012 2011 2010 2009 2008 2007 2006 2005 2004
(accrual basis of accounting)Last Ten Fiscal Years
Change in Net Position by Component
CITY OF COLONIAL HEIGHTS, VIRGINIA
(unaudited)
Fiscal Year
Net (expense) revenueGovernmental activities (37,383,001)$ (35,310,224)$ (37,616,818)$ (37,099,448)$ (38,084,619)$ (40,468,903)$ (31,332,219)$ (34,184,056)$ (31,857,050)$ (31,741,149)$Business-type activities 62,412 (21,606) 440,380 (481,853) (185,167) (397,576) (370,762) (627,547) 168,623 263,364
Total primary government net expense (37,320,589) (35,331,830) (37,176,438) (37,581,301) (38,269,786) (40,866,479) (31,702,981) (34,811,603) (31,688,427) (31,477,785)
Governmental activities:Taxes
General property taxes 21,512,047 20,829,561 20,545,422 21,409,820 21,101,105 20,292,300 18,259,813 16,437,184 12,933,385 12,559,770 Local sales and use 7,174,334 7,066,137 6,662,265 6,687,050 6,998,818 7,247,183 7,350,271 7,027,037 6,664,763 6,567,401 Food and lodging 6,930,069 6,338,213 5,509,401 5,105,057 4,813,420 4,622,383 4,335,522 4,241,906 3,682,747 3,416,835 Other taxes 2,205,223 2,183,334 2,288,483 2,151,134 2,097,530 2,211,189 1,983,102 2,017,427 4,980,434 4,594,719
Intergovernmental, non-categorical aid 1,758,697 1,757,530 1,757,878 1,856,496 1,871,849 1,777,424 1,868,699 4,884,469 4,728,775 5,479,791 Use of money and property 233,822 194,826 158,013 47,549 175,942 713,779 692,864 461,199 124,939 125,024 Miscellaneous 97,933 123,392 669,645 195,415 465,376 364,836 334,807 355,460 3,785 31,800 Transfers 263,979 (80,000) (108,566) (334,568) (396,608) (202,000) (368,118) (502,500) - -
Total governmental activities 40,176,104 38,412,993 37,482,541 37,117,953 37,127,432 37,027,094 34,456,960 34,922,182 33,118,828 32,775,340 Business-type activities:
Use of money and property - - 238 1,208 7,864 11,217 31,849 48,233 26,155 9,655 Miscellaneous - - 5,190 - - - - 351,736 4,363 5,348 Transfers (263,979) 80,000 108,566 334,568 396,608 202,000 368,118 502,500 - -
Total business-type activities (263,979) 80,000 113,994 335,776 404,472 213,217 399,967 902,469 30,518 15,003 Total primary government 39,912,125 38,492,993 37,596,535 37,453,729 37,531,904 37,240,311 34,856,927 35,824,651 33,149,346 32,790,343
Changes in Net PositionGovernmental activities 2,793,103 3,102,769 (134,277) 18,505 (957,187) (3,441,809) 3,124,741 738,126 1,261,778 1,034,191 Business-type activities (201,567) 58,394 554,374 (146,077) 219,305 (184,359) 29,205 274,922 199,141 278,367
Total primary government 2,591,536 3,161,163 420,097 (127,572) (737,882) (3,626,168) 3,153,946 1,013,048 1,460,919 1,312,558
Component Unit:Expenses:
Education 35,569,416 34,304,488 33,698,131 34,245,957 34,453,393 33,178,764 29,636,769 28,907,895 27,386,942 24,756,429 Program revenuesCharges for services 573,499 409,019 407,204 432,265 546,183 557,939 563,298 551,513 559,653 541,121 Operating grants and contributions 14,599,996 14,838,115 15,001,600 14,186,550 15,817,225 14,434,911 14,065,197 12,258,200 11,880,916 10,115,226
Total program revenues 15,173,495 15,247,134 15,408,804 14,618,815 16,363,408 14,992,850 14,628,495 12,809,713 12,440,569 10,656,347 Net expense (20,395,921) (19,057,354) (18,289,327) (19,627,142) (18,089,985) (18,185,914) (15,008,274) (16,098,182) (14,946,373) (14,100,082)
General Revenues and Other Changes in Net AssetsContribution from primary government 19,296,419 18,996,933 19,405,770 18,598,070 20,202,607 23,330,795 16,738,367 15,886,549 14,484,413 14,292,025 Use of money and property - 434 2,477 2,885 12,036 97,462 283,982 70,338 22,084 7,948 Miscellaneous 102,450 341,305 278,643 248,429 255,358 267,880 123,132 205,773 218,320 214,614
Total general revenue 19,398,869 19,338,672 19,686,890 18,849,384 20,470,001 23,696,137 17,145,481 16,162,660 14,724,817 14,514,587 Total component unit change in net position (997,052)$ 281,318$ 1,397,563$ (777,758)$ 2,380,016$ 5,510,223$ 2,137,207$ 64,478$ (221,556)$ 414,505$
Notes:In 2006, the activities involved in trash collection were transferred from the General Fund to the Solid Waste Fund.
In 2008, the Water and Sewer Fund was separated into two funds.
In 2009, the Storm Water Management Fund was established as a separate reporting entity.
In 2013, the activities involved in trash collection were transferred from the Solid Waste Fund to the General Fund.
In 2013, the Water and Sewer Fund were combined into one fund.
General Revenues and Other Changes in Net
Position
65

TABLE 3
2013 2012 2011
Post-GASB 54 implementation:General Fund
Nonspendable 69,859$ 67,373$ 109,011$
Restricted 329,699 369,152 350,067
Committed 327,569 484,422 592,493
Assigned 1,574,257 873,226 680,712
Unassigned 8,083,102 8,477,484 7,652,961 Total general fund 10,384,486$ 10,271,657$ 9,385,244$
Capital Projects Fund
Restricted 7,207,335 16,792,519$ -$
Committed - 246,683 957,111
Assigned - 197,390 308,416
Unassigned (1,245,870) Total capital projects fund 5,961,465$ 17,236,592$ 1,265,527$
Pre-GASB 54 implementation: 2010 2009 2008 2007 2006 2005 2004
General Fund
Reserved 56,571$ 45,085$ 54,779$ 50,977$ 42,867$ 907,105$ 868,769$
Unreserved:
Designated 344,001 305,505 720,761 1,251,658 1,386,363 613,229 289,099
Undesignated 7,987,538 8,333,760 9,050,997 8,506,115 7,098,136 6,979,994 6,508,185 Total general fund 8,388,110$ 8,684,350$ 9,826,537$ 9,808,750$ 8,527,366$ 8,500,328$ 7,666,053$
All Other Governmental Funds
Reserved -$ -$ -$ -$ 2,229,837$ 1,149,211$ 1,623,941$
Unreserved:
Designated:
Capital projects fund 1,213,975 2,864,837 612,818 610,283 844,134 544,626 -
Special revenue fund - - - - - - -
Undesignated:
Capital projects fund 1,305,091 758,371 5,208,410 (331,293) 477,883 - (1,202,086) Total all other governmental funds 2,519,066$ 3,623,208$ 5,821,228$ 278,990$ 3,551,854$ 1,693,837$ 421,855$
Note: 2011 was the first year of implementing GASB 54 which revised fund balance classifications.
CITY OF COLONIAL HEIGHTS, VIRGINIA
Fund Balances - Governmental Funds
Last Ten Fiscal Years
(modified accrual basis of accounting)
(unaudited)
66

TABLE 4
2013 2012 2011 2010 2009 2008 2007 2006 2005 2004
RevenuesGeneral property taxes 21,434,252$ 21,405,217$ 21,374,974$ 21,159,849$ 20,897,171$ 19,766,717$ 32,274,076$ 30,234,997$ 28,261,329$ 26,919,287$ Other local taxes 16,309,626 15,587,684 14,460,149 13,943,241 13,909,768 14,080,755 - - - - Permits, fees, and licenses 3,633,852 3,384,894 3,371,767 707,554 731,615 566,042 490,709 371,758 376,808 409,557 Fines and forfeitures 729,979 718,053 747,448 1,433,972 1,283,848 1,274,510 1,511,128 1,365,311 1,829,897 1,802,279 Charges for services 2,570,168 1,360,622 1,363,724 3,320,903 3,473,403 3,446,688 3,301,470 3,027,272 3,132,472 2,875,358 Use of money and property 233,822 194,826 158,013 47,549 175,942 713,779 692,864 461,199 139,710 137,520 Miscellaneous 97,933 123,392 669,645 7,690,484 6,627,145 6,572,855 6,601,152 6,244,696 6,116,070 6,549,877 Reimbursement from component unit 323,897 315,449 314,345 588,934 883,248 677,514 - - - - Intergovernmental 8,819,568 9,670,653 7,221,279 195,415 465,376 364,836 334,807 355,460 1,451,991 391,150
Total revenues 54,153,097 52,760,790 49,681,344 49,087,901 48,447,516 47,463,696 45,206,206 42,060,693 41,308,277 39,085,028
ExpendituresGeneral government 7,722,431 7,560,760 7,330,864 7,423,627 7,229,137 6,742,155 6,239,843 5,843,080 5,665,459 4,858,581 Judicial administration 4,595,172 4,152,036 4,745,029 4,541,636 4,346,342 4,250,944 3,721,203 3,436,278 3,747,335 3,485,152 Public safety 8,201,249 8,261,480 7,439,357 7,433,568 7,261,713 7,162,033 6,332,340 6,043,497 5,846,292 6,482,889 Public works 3,906,864 2,894,228 2,591,213 3,111,361 3,031,589 2,596,771 3,011,234 2,790,479 3,859,187 3,466,254 Health and welfare 754,603 646,245 560,453 507,299 590,148 712,298 729,275 687,192 567,767 495,984 Parks, recreation, and cultural 2,056,291 2,012,473 2,073,329 2,135,270 2,188,202 2,130,976 2,066,166 1,957,122 1,823,671 1,740,889 Community development 487,155 465,879 476,452 522,187 553,966 538,041 436,395 326,325 298,240 253,888 Education 19,296,419 18,996,933 19,405,770 18,598,070 20,202,607 23,330,795 16,738,367 15,886,549 14,554,047 13,810,518 Grants 444,346 433,956 509,570 397,630 435,331 406,310 482,590 353,295 292,285 281,149 Nondepartmental 269,748 361,190 366,238 258,062 279,042 467,976 283,190 286,130 355,625 361,514 Debt service:
Principal retirement 2,546,199 2,028,330 1,968,712 2,185,490 6,082,877 1,672,927 1,678,558 2,325,414 1,823,295 1,665,094 Interest and fiscal charges 1,511,054 788,734 865,566 1,029,750 1,312,510 1,162,817 904,782 786,285 837,357 778,842 Bond issuance costs - 311,693 - - - - - - 3,000 3,000
Capital expenditures 13,780,361 6,230,285 1,496,630 2,430,048 1,847,651 527,628 1,975,789 6,232,656 3,627,702 2,998,913
Total expenditures 65,571,892 55,144,222 49,829,183 50,573,998 55,361,115 51,701,671 44,599,732 46,954,302 43,301,262 40,682,667 Excess of revenues over (under)
expenditures (11,418,795) (2,383,432) (147,839) (1,486,097) (6,913,599) (4,237,975) 606,474 (4,893,609) (1,992,985) (1,597,639)
Other Financing Sources (Uses)Premium on issuance of debt - 1,460,910 - 412,680 - - - - - - Payment to refunded bond escrow agent - (3,970,000) - (7,267,779) - - - - - - Issuance of debt - 21,830,000 - 6,943,864 3,970,000 10,000,000 - 3,970,300 5,655,000 - Transfers in 311,497 366,197 115,000 368,018 933,007 1,200,000 908,500 766,150 80,000 431,788 Transfers out (55,000) (446,197) (223,566) (371,068) (1,329,615) (1,402,000) (1,276,618) (1,268,650) (80,000) (431,788)
Total other financing
sources (uses) 256,497 19,240,910 (108,566) 85,715 3,573,392 9,798,000 (368,118) 3,467,800 5,655,000 - Net change in fund balances (11,162,298)$ 16,857,478$ (256,405)$ (1,400,382)$ (3,340,207)$ 5,560,025$ 238,356$ (1,425,809)$ 3,662,015$ (1,597,639)$
(Continued)
CITY OF COLONIAL HEIGHTS, VIRGINIA
Changes in Fund Balances - Governmental FundsLast Ten Fiscal Years
(modified accrual basis of accounting)(unaudited)
67

TABLE 4
2013 2012 2011 2010 2009 2008 2007 2006 2005 2004
CITY OF COLONIAL HEIGHTS, VIRGINIA
Changes in Fund Balances - Governmental FundsLast Ten Fiscal Years
(modified accrual basis of accounting)(unaudited)
Debt service as a percentage of
noncapital expenditures:
Primary Government
Total debt service 4,057,253$ 2,817,064$ 2,834,278$ 3,215,240$ 7,395,387$ 2,835,744$ 2,583,340$ 3,111,699$ 2,660,652$ 2,443,936$
Total expenditures 65,571,892 55,144,222 49,829,183 50,573,998 55,361,115 51,701,671 44,599,732 46,954,302 43,301,262 40,682,667
Capital expenditures (14,250,650) (6,843,873) (1,772,395) (2,289,455) (3,265,514) (1,518,495) (4,353,934) (6,703,133) (3,226,624) (3,099,812) Non-capital expenditures 51,321,242$ 48,300,349$ 48,056,788$ 48,284,543$ 52,095,601$ 50,183,176$ 40,245,798$ 40,251,169$ 40,074,638$ 37,582,855$
Debt service as a percentage
of non-capital expenditures - primary government only 7.91% 5.83% 5.90% 6.66% 14.20% 5.65% 6.42% 7.73% 6.64% 6.50%
School Board
School expenditures, excluding
City contribution 15,164,652$ 15,708,729$ 15,565,764$ 15,267,683$ 17,417,113$ 13,672,606$ 14,468,036$ 13,021,346$ 12,513,816$ 10,717,984$
Capital expenditures - Public Schools (280,731) (1,550,915) (2,496,489) (626,065) (3,539,692) (4,295,018) (1,017,186) (509,001) (349,214) (683,313) Non-capital expenditures 14,883,921$ 14,157,814$ 13,069,275$ 14,641,618$ 13,877,421$ 9,377,588$ 13,450,850$ 12,512,345$ 12,164,602$ 10,034,671$
Debt service as a percentage
of non-capital expenditures - total reporting entity 6.13% 4.51% 4.64% 5.11% 11.21% 4.76% 4.81% 5.90% 5.09% 5.13%
Notes:In Virginia, the City issues debt to finance school projects because public schools do not have taxing or borrowing authority.Therefore, the debt service payments related to school projects are presented as debt service of the component unit. Debtservice as a percentage of non capital expenditures for the total reporting entity more appropriately reflects the Virginiaschool debt requirement.
68

TABLE 5
Transfers Uncollected Revised Contract Unobligated Prior Years Current In/(Out) Future Budget Prior Years Current Commitment Balance
General Government:Allocable to Incomplete Projects:
Boulevard redevelopment 360,000$ -$ 37$ -$ 360,037$ 360,037$ -$ -$ -$ Fire apparatus 900,000 - (2,052) - 897,948 897,948 - - -
Total 1,260,000 - (2,015) - 1,257,985 1,257,985 - - -
Allocable to Incomplete Projects:Beautification committee/tourism 147,213 - - - 147,213 133,743 - - 13,470 Courts building 19,045,414 - - - 19,045,414 2,539,669 11,202,587 4,201,409 1,101,749 Ambulance replacement 111,025 - - 107,500 218,525 - 189,825 - 28,700
Total 19,303,652 - - 107,500 19,411,152 2,673,412 11,392,412 4,201,409 1,143,919 Total General Government 20,563,652 - (2,015) 107,500 20,669,137 3,931,397 11,392,412 4,201,409 1,143,919
Recreational FacilitiesAllocable to Incomplete Projects:
Facilities master plan 205,000 - - - 205,000 147,762 - - 57,238 Appomatttox River greenway 455,557 198,570 - 428,501 1,082,628 565,410 65,416 56,970 394,832
Total Recreational Facilities 660,557 198,570 - 428,501 1,287,628 713,172 65,416 56,970 452,070
Educational Facilities:Allocable to Complete Projects:
Transfer to School CIP Program 7,500,000 - - - 7,500,000 7,500,000 - - - Total Educational Facilities 7,500,000 - - - 7,500,000 7,500,000 - - -
Streets and Bridges:Allocable to Complete Projects:
Boulevard widening 701,333 - (439) - 700,894 700,894 - - - Boulevard matching grant 366,055 - (74,408) - 291,647 290,175 - 1,472 - Signal coordination temple/sher 340,972 - 1,635 122,865 465,472 465,472 - - - Paving Southpark ARRA 527,413 - - - 527,413 527,413 - - - Safe routes to school 281,600 - - - 281,600 281,600 - - - Traffic signal - Dummock Parkway 221,625 9,810 (29,179) - 202,256 202,256 - - -
Total 2,438,998 9,810 (102,391) 122,865 2,469,282 2,467,810 - 1,472.00 -
Allocable to Incomplete Projects:Safe routes to school - 11,509 - 29,429 40,948 - 11,509 - 29,439 Redevelopment project 53,292 - - - 53,292 33,123 - - 20,169 Highway construction - local share 12,561 - 92,105 - 104,666 - - - 104,666 Bruce Avenue drainage 2,878,586 - - - 2,878,586 2,617,083 1,821 8,476 251,206 Blvd. modernization Dupuy intersection 3,834,114 1,622,022 - 5,824,099 11,280,235 3,152,441 1,900,196 5,660,646 566,952 Temple Avenue turning lane - 10,512 - 444,761 455,273 16,285 11,338 239 427,411 Southpark & Demmock 158,314 7,919 - 10,984 177,217 158,314 - - 18,903 Dupuy Avenue modernization 144,722 200,004 - 3,738,273 4,082,999 144,722 255,304 392,403 3,290,570 Lakeview Ave. modernization 54,343 241,575 - 3,018,082 3,314,000 79,805 202,294 151,194 2,880,707 Temple Avenue/Dummock turning lane - 16,446 - 483,554 500,000 - 8,182 111 491,707 Total 7,135,932 2,109,987 92,105 13,549,192 22,887,216 6,201,773 2,390,644 6,213,069 8,081,730
Total Streets and Bridges 9,574,930 2,119,797 (10,286) 13,672,057 25,356,498 8,669,583 2,390,644 6,214,541 8,081,730
Utility Improvements:Allocable to Incomplete Projects:Boulevard modernization - utility - - - 770,660 770,660 - - - 770,660 Dupuy Avenue modernzation - utility - - - 505,000 505,000 - - - 505,000 Lakeview Ave. modernization - utility - - - 225,000 225,000 - - - 225,000
Total Utility Improvements - - - 1,500,660 1,500,660 - - - 1,500,660
Restricted fund - appratus - - 2,052 - 2,052 - - - 2,052 Non-project related - 36,940 10,249 - 47,189 - - - 47,189
Total Projects 38,299,139$ 2,355,307$ -$ 15,708,718$ 56,363,164$ 20,814,152$ 13,848,472$ 10,472,920$ 11,227,620$
Revenues and Resources Expenditures and Contract Commitments
CITY OF COLONIAL HEIGHTS, VIRGINIA
SCHEDULE OF REVENUES, RESOURCES, EXPENDITURES, CONTRACT COMMITMENTSAND UNOBLIGATED BALANCE
Year Ended June 30, 2013(Unaudited)
69

TABLE 6
Value as a
Total Taxable Actual Percentage of
Fiscal Residential Multi-Family Commercial Public Public Assessed Total Direct Taxable Assessed
Year Property* Property Property Service** Safety Value Tax Rate Value Value
2013 978,270,500$ 95,275,100$ 554,297,500$ 36,333,519$ -$ 1,664,176,619$ 2.52$ 1,664,176,619$ 100.00 %
2012 971,122,700 95,265,700 551,009,900 34,468,630 - 1,651,866,930 2.44 1,651,866,930 100.00
2011 1,033,929,400 96,926,200 552,194,300 32,922,680 - 1,715,972,580 2.44 1,715,972,580 100.00
2010 1,031,967,800 96,461,100 549,782,600 29,896,895 - 1,708,108,395 2.44 1,708,108,395 100.00
2009 1,029,811,100 97,597,000 546,792,700 28,481,719 - 1,702,682,519 2.44 1,702,682,519 100.00
2008 1,025,744,200 97,651,400 530,801,900 26,781,992 - 1,680,979,492 2.44 1,680,979,492 100.00
2007 829,706,600 85,303,900 462,662,600 28,857,670 - 1,406,530,770 2.60 1,406,530,770 100.00
2006 814,763,800 85,367,800 445,687,100 28,182,168 - 1,374,000,868 2.60 1,374,000,868 100.00
2005 693,044,400 42,963,900 399,365,900 30,383,492 3,457,900 1,169,215,592 2.62 1,169,215,592 100.00
2004 681,053,100 42,963,900 384,550,700 31,003,999 3,457,900 1,143,029,599 2.64 1,143,029,599 100.00
CITY OF COLONIAL HEIGHTS, VIRGINIA
ASSESSED VALUE AND ACTUAL VALUE OF TAXABLE PROPERTY
Last Ten Fiscal Years
(unaudited)
* Assessed at 100% of fair market value, which is estimated actual value.
**Based on valuations established by the State Corporation Commission.
Real Property
70

TABLE 7
CITY OF COLONIAL HEIGHTS, VIRGINIA
DIRECT PROPERTY TAX RATES
Last Ten Calendar Years
(rate per $100 of assessed value)
Total
Real Public Public Direct
Year Estate Service Safety Rate
2013 1.14 1.14 0.24 2.52
2012 1.10 1.10 0.24 2.44
2011 1.10 1.10 0.24 2.44
2010 1.10 1.10 0.24 2.44
2009 1.10 1.10 0.24 2.44
2008 1.10 1.10 0.24 2.44
2007 1.18 1.18 0.24 2.60
2006 1.18 1.18 0.24 2.60
2005 1.20 1.18 0.24 2.62
2004 1.20 1.20 0.24 2.64
Note: There is no overlapping government taxation.
(unaudited)
71

TABLE 8
Percentage Percentage
of Total City of Total City
Taxable Taxable
Assessed Assessed Assessed Assessed
Taxpayer Value Rank Value Value Rank Value
Southpark Mall 79,945,659$ 1 4.80% 62,204,500$ 1 4.82%
Roslyn Farms Corp 35,538,900 2 2.14% 29,868,240 2 2.21%
Wal-Mart/Sams 27,810,363 3 1.67% 20,574,590 3 1.52%
Roslyn Farms Associates LP 33,736,916 4 2.03% 18,872,700 4 1.40%
Virginia Electric & Power 14,591,748 5 0.88% 10,111,117 7 0.75%
Colonial Square Associated 13,538,200 6 0.81% 9,535,800 8 0.71%
Dunlop House 13,454,276 7 0.81% - - -
Colonial Heights Operations 12,975,441 8 0.78% - - -
Faison Colonial Heights 12,345,809 9 0.74% 8,842,483 9 0.65%
Southpark Hotel 11,603,645 10 0.70% - - -
Verizon Virginia Inc. - - - 13,500,735 5 1.00%
Home Depot USA - - - 10,149,603 6 0.75%
Dayton-Hudson Corp. – Target - - - 7,538,934 10 0.56%255,540,957 15.26% 191,198,702 14.37%
2013 2004
CITY OF COLONIAL HEIGHTS, VIRGINIA
Principal Property Taxpayers
Current Year and Nine Years Ago
(unaudited)
72

TABLE 9
Calendar
Year Taxes Levied Collections
Ended for the Percentage in Subsequent Percentage
June 30 Year Amount of Levy Years* Amount of Levy
2012 23,148,788$ 22,634,176$ 97.78 % 282,918$ 22,917,094$ 99.00 %
2011 23,066,409 22,500,624 97.55 485,734 22,986,358 99.65
2010 22,920,083 22,666,857 98.90 213,376 22,880,233 99.83
2009 22,923,361 22,705,560 99.05 180,655 22,886,215 99.84
2008 22,871,135 22,536,288 98.54 304,067 22,840,355 99.31
2007 21,303,700 21,063,380 98.87 240,320 21,303,700 100.00
2006 20,214,991 20,031,441 99.09 183,030 20,214,471 100.00
2005 17,928,594 17,764,522 99.08 163,170 17,927,692 99.47
2004 17,300,956 17,138,769 99.06 161,764 17,300,533 100.00
2003 16,419,584 16,249,275 98.96 168,800 16,418,075 99.99
Note: Based on tax year beginning January 1 and ending December 31.
*Does not include penalties and interest.
CITY OF COLONIAL HEIGHTS, VIRGINIA
PROPERTY TAX LEVIES AND COLLECTIONS
Last Ten Calendar Years
Source: Detailed City property tax records.
Total Collections to Date
Collected within the
Year of the Levy
(unaudited)
73
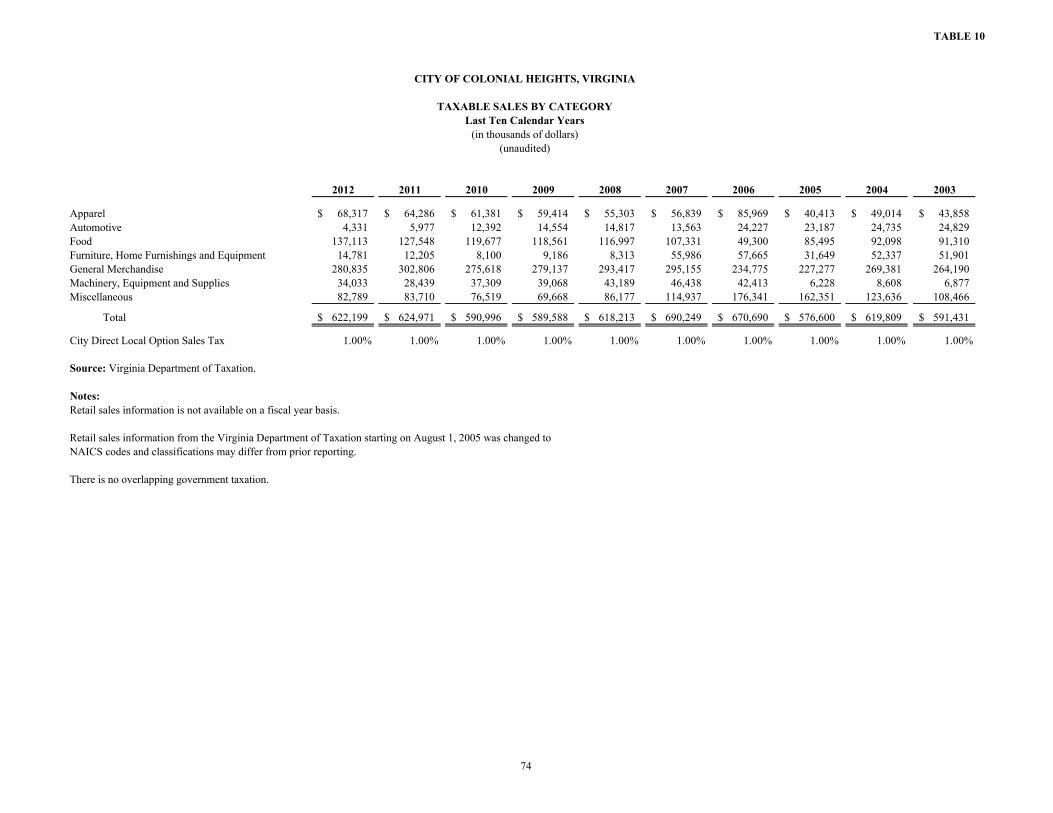
TABLE 10
2012 2011 2010 2009 2008 2007 2006 2005 2004 2003
Apparel 68,317$ 64,286$ 61,381$ 59,414$ 55,303$ 56,839$ 85,969$ 40,413$ 49,014$ 43,858$
Automotive 4,331 5,977 12,392 14,554 14,817 13,563 24,227 23,187 24,735 24,829
Food 137,113 127,548 119,677 118,561 116,997 107,331 49,300 85,495 92,098 91,310
Furniture, Home Furnishings and Equipment 14,781 12,205 8,100 9,186 8,313 55,986 57,665 31,649 52,337 51,901
General Merchandise 280,835 302,806 275,618 279,137 293,417 295,155 234,775 227,277 269,381 264,190
Machinery, Equipment and Supplies 34,033 28,439 37,309 39,068 43,189 46,438 42,413 6,228 8,608 6,877
Miscellaneous 82,789 83,710 76,519 69,668 86,177 114,937 176,341 162,351 123,636 108,466
Total 622,199$ 624,971$ 590,996$ 589,588$ 618,213$ 690,249$ 670,690$ 576,600$ 619,809$ 591,431$
City Direct Local Option Sales Tax 1.00% 1.00% 1.00% 1.00% 1.00% 1.00% 1.00% 1.00% 1.00% 1.00%
Source: Virginia Department of Taxation.
Notes:
Retail sales information is not available on a fiscal year basis.
Retail sales information from the Virginia Department of Taxation starting on August 1, 2005 was changed to
NAICS codes and classifications may differ from prior reporting.
There is no overlapping government taxation.
CITY OF COLONIAL HEIGHTS, VIRGINIA
TAXABLE SALES BY CATEGORY
Last Ten Calendar Years
(in thousands of dollars)
(unaudited)
74

TABLE 11
Number Percentage Taxable Percentage Number Percentage Taxable Percentage
of Filers of Total Sales of Total of Filers of Total Sales of Total
Apparel 65 13.13 % 68,317$ 10.98 % 56 9.27 % 43,858$ 7.42 %
Automotive 9 1.82 4,331 0.70 38 6.29 24,829 4.20
Food 93 18.79 137,113 22.04 100 16.56 91,310 15.44
Furniture, Home Furnishings and Equipment 17 3.43 14,781 2.38 23 3.81 51,901 8.78
General Merchandise 72 14.55 280,835 45.14 56 9.27 264,190 44.67
Machinery, Equipment and Supplies 21 4.24 34,033 5.47 32 5.30 6,877 1.16
Miscellaneous 218 44.04 82,789 13.29 299 49.50 108,466 18.33
Total 495 100.00 % 622,199$ 100.00 % 604 100.00 % 591,431$ 100.00 %
Source: Virginia Department of Taxation.
Notes:
Due to confidentiality issues, the names of the ten largest revenue payers are not available. The categories presented are
intended to provide alternative information regarding the sources of the City’s revenue. Fiscal year information is not available.
CITY OF COLONIAL HEIGHTS, VIRGINIA
TAXABLE SALES BY CATEGORY
Calendar Years 2012 and 2003
(taxable sales in thousands of dollars)
Calendar Year 2012 Calendar Year 2003
(unaudited)
75

TABLE 12
2013 2012 2011 2010 2009 2008 2007 2006 2005 2004
Debt limit 166,417,662$ 165,186,693$ 171,597,258$ 170,810,840$ 170,268,252$ 168,097,949$ 140,653,077$ 137,400,087$ 116,921,559$ 114,302,960$
Total net debt applicable to limit 37,045,000 39,750,000 24,125,000 26,295,000 28,855,000 27,295,000 19,320,000 21,250,000 23,860,000 19,530,000
Legal debt margin 129,372,662$ 125,436,693$ 147,472,258$ 144,515,840$ 141,413,252$ 140,802,949$ 121,333,077$ 116,150,087$ 93,061,559$ 94,772,960$
Total net debt applicable to the limit
as a percentage of debt limit 22.26% 24.06% 14.06% 15.39% 16.95% 16.24% 13.74% 15.47% 20.41% 17.09%
Legal Debt Margin Calculation for Fiscal Year 2013
Assessed value 1,664,176,619$
Debt limit (10% of assessed value) 166,417,662$
Less debt applicable to limit:
General obligation bonds 37,045,000
Legal debt margin 129,372,662$
Note: Assessed value of property can be found in Table 6.
CITY OF COLONIAL HEIGHTS, VIRGINIA
LEGAL DEBT MARGIN INFORMATION
Last Ten Fiscal Years
(unaudited)
76

TABLE 13
Percentage of Lease General Net Actual Value Revenue General Net Total Percentage Debt
Fiscal Obligation Deferred of Taxable Per Note Obligation Deferred Capital Primary of Personal Per
Year Bonds Amounts(1)Property Capita Payable Bonds Amounts(1)
Leases Government Income Capita
2013 36,246,554$ 1,576,521$ 2.27% 2,172$ -$ 798,446$ 11,846$ 32,558$ 38,665,925$ * 2,221
2012 38,792,753 1,697,691 2.45% 2,326 - 957,247 14,215 74,490 41,536,396 * 2,386 2011 22,961,083 357,951 1.36% 1,339 - 1,163,917 16,585 114,795 24,614,331 * 1,414 2010 24,929,795 406,075 1.48% 1,405 - 1,365,205 18,954 181,587 26,901,616 * 1,492
2009 26,855,108 155,712 1.59% 1,527 - 1,999,892 - 245,697 29,256,409 1.08% 1,654 2008 24,997,685 170,672 1.50% 1,414 3,970,300 2,297,315 - 80,618 31,516,590 1.20% 1,771
2007 16,740,612 113,881 1.20% 954 3,970,300 2,579,388 - 105,159 23,509,340 0.93% 1,330 2006 18,361,424 * 1.34% 1,039 4,028,046 2,853,576 * - 25,243,046 1.08% 1,428 2005 20,594,582 * 1.76% 1,172 150,000 3,265,418 * - 24,010,000 1.10% 1,367
2004 16,762,877 * 1.47% 960 - 2,767,123 * - 19,530,000 0.93% 1,118
(1) Net deferred amounts include premiums, discounts and loss on refundings.*Unavailable
CITY OF COLONIAL HEIGHTS, VIRGINIA
RATIOS OF OUTSTANDING DEBT BY TYPELast Ten Fiscal Years
Business-type Activities
(unaudited)
Governmental Activities
77

TABLE 14
Personal Per Capita
Fiscal Income Personal School Unemployment
Year Population (in thousands) Income Enrollment Rate
2013 17,411 * * 2,829 7.30%
2012 17,411 * * 2,972 6.90
2011 17,411 * * 2,891 7.60
2010 18,035 * * 2,836 8.60
2009 17,693 2,704,120 35,052 2,881 8.70
2008 17,796 2,635,768 34,187 2,847 4.80
2007 17,676 2,515,436 32,919 2,856 3.30
2006 17,676 2,328,236 30,652 2,848 3.30
2005 17,567 2,190,000 29,141 2,813 4.00
2004 17,465 2,097,000 28,711 2,754 4.00
Sources:
Weldon Cooper Center for Public Service
Bureau of Econcomic Analysis - combined area of City of Colonial Heights,
City of Petersburg and Dinwiddie County
City of Colonial Heights Public Schools
Virginia Employment Commission
US Census
*Unavailable
(unaudited)
CITY OF COLONIAL HEIGHTS, VIRGINIA
DEMOGRAPHIC STATISTICS
Last Ten Calendar Years
78
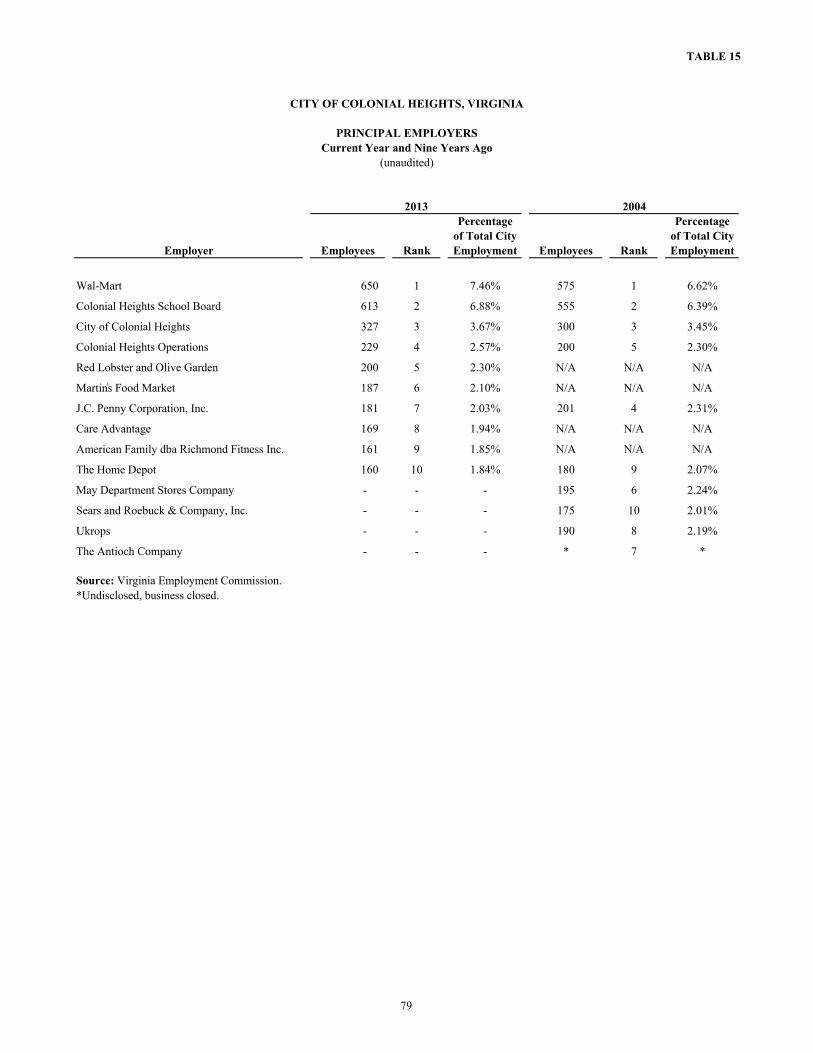
TABLE 15
Percentage Percentage
of Total City of Total City
Employer Employees Rank Employment Employees Rank Employment
Wal-Mart 650 1 7.46% 575 1 6.62%
Colonial Heights School Board 613 2 6.88% 555 2 6.39%
City of Colonial Heights 327 3 3.67% 300 3 3.45%
Colonial Heights Operations 229 4 2.57% 200 5 2.30%
Red Lobster and Olive Garden 200 5 2.30% N/A N/A N/A
Martin̕s Food Market 187 6 2.10% N/A N/A N/A
J.C. Penny Corporation, Inc. 181 7 2.03% 201 4 2.31%
Care Advantage 169 8 1.94% N/A N/A N/A
American Family dba Richmond Fitness Inc. 161 9 1.85% N/A N/A N/A
The Home Depot 160 10 1.84% 180 9 2.07%
May Department Stores Company - - - 195 6 2.24%
Sears and Roebuck & Company, Inc. - - - 175 10 2.01%
Ukrops - - - 190 8 2.19%
The Antioch Company - - - * 7 *
Source: Virginia Employment Commission.
*Undisclosed, business closed.
(unaudited)
20042013
CITY OF COLONIAL HEIGHTS, VIRGINIA
PRINCIPAL EMPLOYERS
Current Year and Nine Years Ago
79

TABLE 16
2013 2012 2011 2010 2009 2008 2007 2006 2005 2004
Function/Program
General government
Management services 6 6 6 6 6 6 6 6 6 6
Tax collections 9 9 11 11 11 11 11 11 11 11
Finance 11 11 9 9 9 9 9 9 9 9
Information technology 2 2 1 2 2 2 2 2 2 2
Board of elections 2 2 2 2 2 2 2 2 2 2
Judicial administration 22 23 21 21 22 22 21 19 19 19
Public safety 114 113 113 114 117 115 115 115 109 108
Public works 45 30 28 29 30 30 31 29 29 29
Parks, recreation, and cultural 25 24 24 25 25 25 25 25 24 24
Community development 5 5 5 5 6 6 5 5 5 5
Grants 4 4 5 5 5 5 5 5 5 5
Education 613 622 627 627 625 576 586 569 578 555
Total 858 851 852 856 860 809 818 797 799 775
Source: City Adopted Budget.
CITY OF COLONIAL HEIGHTS, VIRGINIA
FULL-TIME EQUIVALENT CITY GOVERNMENT EMPLOYEES BY FUNCTION/PROGRAM
Last Ten Fiscal Years
(unaudited)
80
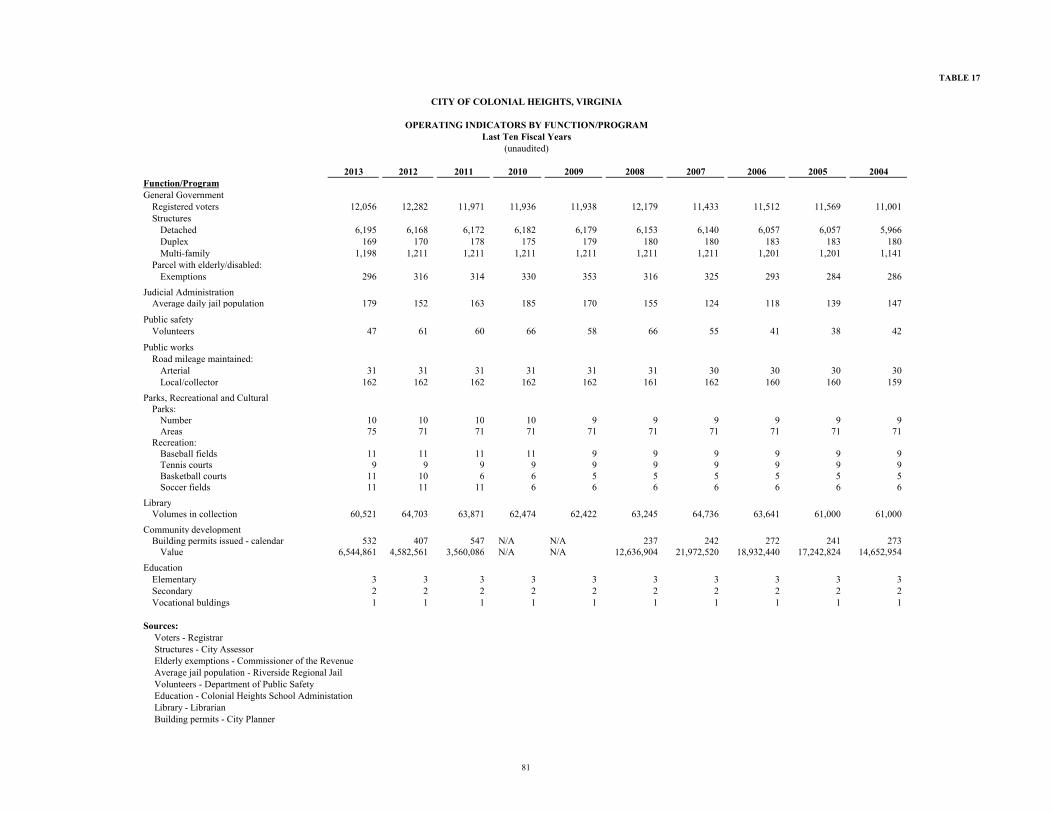
TABLE 17
2013 2012 2011 2010 2009 2008 2007 2006 2005 2004Function/ProgramGeneral Government
Registered voters 12,056 12,282 11,971 11,936 11,938 12,179 11,433 11,512 11,569 11,001 Structures
Detached 6,195 6,168 6,172 6,182 6,179 6,153 6,140 6,057 6,057 5,966 Duplex 169 170 178 175 179 180 180 183 183 180 Multi-family 1,198 1,211 1,211 1,211 1,211 1,211 1,211 1,201 1,201 1,141
Parcel with elderly/disabled:Exemptions 296 316 314 330 353 316 325 293 284 286
Judicial AdministrationAverage daily jail population 179 152 163 185 170 155 124 118 139 147
Public safetyVolunteers 47 61 60 66 58 66 55 41 38 42
Public worksRoad mileage maintained:
Arterial 31 31 31 31 31 31 30 30 30 30 Local/collector 162 162 162 162 162 161 162 160 160 159
Parks, Recreational and CulturalParks:
Number 10 10 10 10 9 9 9 9 9 9 Areas 75 71 71 71 71 71 71 71 71 71
Recreation:Baseball fields 11 11 11 11 9 9 9 9 9 9 Tennis courts 9 9 9 9 9 9 9 9 9 9 Basketball courts 11 10 6 6 5 5 5 5 5 5 Soccer fields 11 11 11 6 6 6 6 6 6 6
LibraryVolumes in collection 60,521 64,703 63,871 62,474 62,422 63,245 64,736 63,641 61,000 61,000
Community developmentBuilding permits issued - calendar 532 407 547 N/A N/A 237 242 272 241 273
Value 6,544,861 4,582,561 3,560,086 N/A N/A 12,636,904 21,972,520 18,932,440 17,242,824 14,652,954
EducationElementary 3 3 3 3 3 3 3 3 3 3 Secondary 2 2 2 2 2 2 2 2 2 2 Vocational buldings 1 1 1 1 1 1 1 1 1 1
Sources: Voters - RegistrarStructures - City AssessorElderly exemptions - Commissioner of the RevenueAverage jail population - Riverside Regional JailVolunteers - Department of Public SafetyEducation - Colonial Heights School AdministationLibrary - LibrarianBuilding permits - City Planner
CITY OF COLONIAL HEIGHTS, VIRGINIA
OPERATING INDICATORS BY FUNCTION/PROGRAMLast Ten Fiscal Years
(unaudited)
81

THIS PAGE INTENTIONALLY BLANK

82
COMPLIANCE SECTION

83Your Success is Our Focus
124 Newman Avenue • Harrisonburg, VA 22801-4004 • 540-434-6736 • Fax: 540-434-3097 • www.BEcpas.com
INDEPENDENT AUDITOR’S REPORT ON INTERNAL CONTROL OVER FINANCIAL REPORTING AND ON COMPLIANCE AND OTHER MATTERS BASED ON AN AUDIT OF
FINANCIAL STATEMENTS PERFORMED IN ACCORDANCE WITH GOVERNMENT AUDITING STANDARDS
To the Honorable Members of City CouncilCity of Colonial Heights, Virginia
We have audited, in accordance with auditing standards generally accepted in the United States of America and the standards applicable to financial audits contained in Government Auditing Standards, issued by the Comptroller General of the United States; and the Specifications for Audits of Counties, Cities, and Towns issued by the Auditor of Public Accounts of the Commonwealth of Virginia, the financial statements of the governmental activities, the business-type activities, the discretely presented component unit, each major fund, and the aggregate remaining fund information of the City of Colonial Heights, Virginia, as of and for the year ended June 30, 2013, and the related notes to the financial statements, which collectively comprise the City’s basic financial statements, and have issued our report thereon dated November 8, 2013.
Internal Control over Financial Reporting
In planning and performing our audit of the financial statements, we considered the City’sinternal control over financial reporting (internal control) to determine the audit procedures that are appropriate in the circumstances for the purpose of expressing our opinions on the financial statements, but not for the purpose of expressing an opinion on the effectiveness of the City’s internal control. Accordingly, we do not express an opinion on the effectiveness of the City’s internal control.
A deficiency in internal control exists when the design or operation of a control does not allow management or employees, in the normal course of performing their assigned functions, to prevent, or detect and correct misstatements on a timely basis. A material weakness is a deficiency, or a combination of deficiencies, in internal control such that there is a reasonable possibility that a material misstatement of the entity’s financial statements will not be prevented, or detected and corrected on a timely basis. A significant deficiency is a deficiency or a combination of deficiencies, in internal control that is less severe than a material weakness, yet important enough to merit attention by those charged with governance.
Our consideration of internal control was for the limited purpose described in the first paragraph of this section and was not designed to identify all deficiencies in internal control that might be material weaknesses or, significant deficiencies and therefore, material weaknesses or significant deficiencies may exist that were not identified. Given these limitations we did not identify any deficiencies in internal control that we consider to be material weaknesses. However, material weaknesses may exist that have not been identified.
84
Compliance and Other Matters
As part of obtaining reasonable assurance about whether the City’s financial statements are free of material misstatement, we performed tests of its compliance with certain provisions of laws, regulations, contracts, and grant agreements, noncompliance with which could have a direct and material effect on the determination of financial statement amounts. However, providing an opinion on compliance with those provisions was not an objective of our audit, and accordingly, we do not express such an opinion. The results of our tests disclosed two instances of noncompliance or other matters that are required to be reported under Government Auditing Standards and which are described in the accompanying schedule of findings and questioned costs as items 13-2 through 13-3.
City of Colonial Height’s Response to Findings
The City’s responses to the findings identified in our audit are described in the accompanying schedule of findings and questioned costs. The City’s responses were not subjected to the auditing procedures applied in the audit of the financial statements and, accordingly, we express no opinion on the response.
Purpose of this Report
The purpose of this report is solely to describe the scope of our testing of internal control and compliance and the results of that testing, and not to provide an opinion on the effectiveness of the entity’s internal control or on compliance. This report is an integral part of an audit performed in accordance with Government Auditing Standards in considering the entity’s internal control and compliance. Accordingly, this communication is not suitable for any other purpose.
CERTIFIED PUBLIC ACCOUNTANTS
Harrisonburg, VirginiaNovember 8, 2013
85Your Success is Our Focus
124 Newman Avenue • Harrisonburg, VA 22801-4004 • 540-434-6736 • Fax: 540-434-3097 • www.BEcpas.com
INDEPENDENT AUDITOR’S REPORT ON COMPLIANCE FOR EACH MAJOR PROGRAM AND ON INTERNAL CONTROL OVER COMPLIANCE REQUIRED BY
OMB CIRCULAR A-133
To the Honorable Members of City CouncilCity of Colonial Heights, Virginia
Report on Compliance for Each Major Federal Program
We have audited the City’s compliance with the types of compliance requirements described in the OMB Circular A-133 Compliance Supplement that could have a direct and material effect on each of the City’s major federal programs for the year ended June 30, 2013. The City’s major federal programs are identified in the summary of auditor’s results section of the accompanying schedule of findings and questioned costs.
Management’s Responsibility
Management is responsible for compliance with the requirements of laws, regulations, contracts, and grants applicable to its federal programs.
Auditor’s Responsibility
Our responsibility is to express an opinion on compliance for each of the City’s major federal programs based on our audit of the types of compliance requirements referred to above. We conducted our audit of compliance in accordance with auditing standards generally accepted in the United States of America; the standards applicable to financial audits contained in Government Auditing Standards, issued by the Comptroller General of the United States; and OMB Circular A-133, Audits of States, Local Governments, and Non-Profit Organizations. Those standards and OMB Circular A-133 require that we plan and perform the audit to obtain reasonable assurance about whether noncompliance with the types of compliance requirements referred to above that could have a direct and material effect on a major federal program occurred. An audit includes examining, on a test basis, evidence about the City’scompliance with those requirements and performing such other procedures as we considered necessary in the circumstances.
We believe that our audit provides a reasonable basis for our opinion on compliance for each major federal program. However, our audit does not provide a legal determination of the City’scompliance.
Opinion on Each Major Federal Program
In our opinion, the City of Colonial Heights, Virginia, complied, in all material respects, with the types of compliance requirements referred to above that could have a direct and material effect on each of its major federal programs for the year ended June 30, 2013.

86
Other Matters
The results of our auditing procedures disclosed an instance of noncompliance, which isrequired to be reported in accordance with OMB Circular A-133 and which is described in the accompanying schedule of findings and questioned costs as item 13-1. Our opinion on each major federal program is not modified with respect to this matter.
The City’s response to the finding identified in our audit is described in the accompanying schedule of findings and questioned costs. The City’s response was not subjected to the auditing procedures applied in the audit of compliance and, accordingly, we express no opinion on the response.
Report on Internal Control Over Compliance
Management of the City is responsible for establishing and maintaining effective internal control over compliance with the types of compliance requirements referred to above. In planning and performing our audit of compliance, we considered the City’s internal control over compliance with thetypes of requirements that could have a direct and material effect on each major federal program to determine the auditing procedures that are appropriate in the circumstances for the purpose of expressing an opinion on compliance for each major federal program and to test and report on internal control over compliance in accordance with OMB Circular A-133, but not for the purpose of expressing an opinion on the effectiveness of internal control over compliance. Accordingly, we do not express an opinion on the effectiveness of the City’s internal control over compliance.
A deficiency in internal control over compliance exists when the design or operation of a control over compliance does not allow management or employees, in the normal course of performing their assigned functions, to prevent, or detect and correct, noncompliance with a type of compliance requirement of a federal program on a timely basis. A material weakness in internal control over compliance is a deficiency, or combination of deficiencies, in internal control over compliance, such that there is a reasonable possibility that material noncompliance with a type of compliance requirement of a federal program will not be prevented, or detected and corrected, on a timely basis. A significant deficiency in internal control over compliance is a deficiency, or a combination of deficiencies, in internal control over compliance with a type of compliance requirement of a federal program that is less severe than a material weakness in internal control over compliance, yet important enough to merit attention by those charged with governance.
Our consideration of internal control over compliance was for the limited purpose described in the first paragraph of this section and was not designed to identify all deficiencies in internal control over compliance that might be material weaknesses or significant deficiencies. We did not identify any deficiencies in internal control over compliance that we consider to be material weaknesses. However, material weaknesses may exist that have not been identified.
The purpose of this report on internal control over compliance is solely to describe the scope of our testing of internal control over compliance and the results of that testing based on the requirements of OMB Circular A-133. Accordingly, this report is not suitable for any other purpose.
CERTIFIED PUBLIC ACCOUNTANTS
Harrisonburg, VirginiaNovember 8, 2013

87
CITY OF COLONIAL HEIGHTS, VIRGINIA
SUMMARY OF COMPLIANCE MATTERS June 30, 2013
As more fully described in the Independent Auditor’s Report on Internal Control over Financial Reporting and on Compliance and Other Matters Based on an Audit of Financial Statements Performed in Accordance with Government Auditing Standards, we performed tests of the City’s compliance with certain provisions of laws, regulations, contracts, and grants shown below:
STATE COMPLIANCE MATTERS Code of Virginia: Budget and Appropriation Laws Cash and Investment Laws Conflicts of Interest Act Debt Provisions Local Retirement Systems Procurement Laws Uniform Disposition of Unclaimed Property Act Sheriff Internal Controls State Agency Requirements: Education Highway Maintenance Funds
FEDERAL COMPLIANCE MATTERS Compliance Supplement for Single Audits of State and Local Governments Provisions and conditions of agreements related to federal programs selected for testing.

88
CITY OF COLONIAL HEIGHTS, VIRGINIA
SCHEDULE OF FINDINGS AND QUESTIONED COSTSJune 30, 2013
A. SUMMARY OF AUDITOR’S RESULTS
1. The auditor’s report expresses an unmodified opinion on the financial statements.
2. No significant deficiencies related to the audit of the financial statements are reported in the Independent Auditor’s Report on Internal Control over Financial Reporting and on Compliance and Other Matters Based on an Audit of Financial Statements Performed in Accordance with Government Auditing Standards.
3. No instances of noncompliance material to the financial statements were disclosed during the audit.
4. No significant deficiencies relating to the audit of the major federal award programs were reported in the Independent Auditor’s Report on Compliance for Each Major Program and on Internal Control over Compliance required by OMB Circular A-133.
5. The auditor’s report on compliance for the major federal award programs expresses an unmodified opinion.
6. The audit disclosed one audit finding relating to major programs.
7. The programs tested as major programs include:
Name of Program: CFDA #
Child Nutrition Cluster 10.553, 10.555
Highway Planning and Construction 20.205
8. The threshold for distinguishing Type A and B programs was $300,000.
9. The City was not determined to be a low-risk auditee.
B. FINDINGS – FINANCIAL STATEMENT AUDIT
None
C. FINDINGS AND QUESTIONED COSTS – MAJOR FEDERAL AWARD PROGRAMS AUDIT
13-1: Weekly Payroll Certification Review – Highway Planning and Construction
Condition:
City personnel did not put steps in place to ensure that the contractor submitted weekly certified payrolls for review with Department of Labor and grant requirements.
Recommendation:
The City should implement a process and controls to ensure that the contractor submits weekly certified payrolls. City personnel should review submitted payrolls for compliance with Department of Labor requirements.
Management Response:
The auditee concurs with the recommendation.

89
CITY OF COLONIAL HEIGHTS, VIRGINIA
SCHEDULE OF FINDINGS AND QUESTIONED COSTSJune 30, 2013
D. FINDINGS AND QUESTIONED COSTS – COMMONWEALTH OF VIRGINIA
13-2: Disclosure Statements
Condition:
Two of the twenty-eight disclosure statements reviewed were not filed by the January 15, 2013 deadline. Twoadditional statements were not filed at all.
Recommendation:
Procedures should be implemented to ensure that all disclosure statements are filed timely.
Management Response:
The auditee concurs with the recommendation.
13-3: General Government Budget Appropriations
Condition:
Judicial administration and health and welfare expenditures exceeded budgeted appropriations.
Recommendation:
Steps should be taken to ensure that excess expenditures over budgeted appropriations be approved by City Council and the budget amended accordingly.
Management Response:
The auditee concurs with the recommendation.