city of coeur d’alene plan update_final.pdf · the city of coeur d'alene's previous...
TRANSCRIPT

City of Coeur d’Alene2012 Water System
Comprehensive Plan UpdateNovember 2012
7825 Meadowlark WayCoeur d’Alene, Idaho 83815208-762-8787www.jub.com


City of Coeur d’Alene i 2012 Water System Comprehensive Plan Update
F:\Projects\JUB\20-12-015_CdA_2012_Wtr_Sys_Comp_Plan_Update\docs\Report\Comp Plan Update_FINAL.docx
Page Volume I – 2012 Water System Comprehensive Plan Update
Executive Summary ............................................................................................................................................ 1
ES-1 Introduction and Purpose ......................................................................................................................... 1 ES-2 Production and Consumption................................................................................................................... 1 ES-3 System Overview ..................................................................................................................................... 3 ES-4 System Analysis ...................................................................................................................................... 7
ES-4.1 Supply......................................................................................................................................... 7 ES-4.2 Storage ....................................................................................................................................... 8 ES-4.3 Distribution .................................................................................................................................. 9
ES-5 Capital Improvement Plan........................................................................................................................ 9 ES-6 Appendices ............................................................................................................................................ 11 ES-7 Financial Plan ........................................................................................................................................ 11 ES-8 Acknowledgments .................................................................................................................................. 11
Chapter 1 – Review Criteria ............................................................................................................................. 1-1
1.1 Introduction ........................................................................................................................................... 1-1 1.2 Regulatory Issues ................................................................................................................................. 1-1
1.2.1 Existing Water Quality ............................................................................................................. 1-1 1.2.2 Source Water Quantity ............................................................................................................ 1-2 1.2.3 Future Regulatory Issues ........................................................................................................ 1-3
1.3 Fire Protection Criteria .......................................................................................................................... 1-4 1.4 Minimum Water Service Criteria ........................................................................................................... 1-5
Chapter 2 – Water Production and Consumption .......................................................................................... 2-1
2.1 Introduction ........................................................................................................................................... 2-1 2.2 Coeur d’Alene Demographics ............................................................................................................... 2-1 2.3 Coeur d’Alene Water Service Boundary ............................................................................................... 2-1 2.4 Water System Growth and Planning Period.......................................................................................... 2-3 2.5 Current and Future Water Consumption Demands ............................................................................... 2-4 2.6 Unaccounted Water .............................................................................................................................. 2-5
Chapter 3 – Description of Existing System .................................................................................................. 3-1
3.1 Introduction ........................................................................................................................................... 3-1 3.2 Water Supply ........................................................................................................................................ 3-1
3.2.1 Upper Zone Wells ................................................................................................................... 3-4 3.2.2 General Zone Wells ................................................................................................................ 3-6

City of Coeur d’Alene ii 2012 Water System Comprehensive Plan Update
F:\Projects\JUB\20-12-015_CdA_2012_Wtr_Sys_Comp_Plan_Update\docs\Report\Comp Plan Update_FINAL.docx
3.2.3 Existing Water Rights .............................................................................................................. 3-7 3.3 Existing Storage .................................................................................................................................... 3-7
3.3.1 Best Hill Tank .......................................................................................................................... 3-8 3.3.2 Tubbs Hill Storage ................................................................................................................... 3-9 3.3.3 Prairie Standpipe ..................................................................................................................... 3-9 3.3.4 Industrial Standpipe ................................................................................................................ 3-9 3.3.5 Stanley Hill Tank ................................................................................................................... 3-10 3.3.6 Blackwell Hill Tank ................................................................................................................ 3-10 3.3.7 Nettleton Gulch Tank ............................................................................................................ 3-10
3.4 Booster Pump Stations ....................................................................................................................... 3-10 3.4.1 Elm Street Booster Station .................................................................................................... 3-12 3.4.2 Blackwell Hill Booster System ............................................................................................... 3-12 3.4.3 Tubbs Hill Booster Station ..................................................................................................... 3-12 3.4.4 Armstrong Park Booster Station ............................................................................................ 3-13
3.5 Existing Distribution System ............................................................................................................... 3-13 3.5.1 Pressure Zones ..................................................................................................................... 3-13 3.5.2 Pipe Network ......................................................................................................................... 3-15
Chapter 4 – Water Supply Evaluation ............................................................................................................. 4-1
4.1 Introduction ........................................................................................................................................... 4-1 4.2 Existing Supply Requirements .............................................................................................................. 4-1 4.3 Future Supply Requirements ................................................................................................................ 4-2 4.4 Boosted Pressure Zones Supply Requirements ................................................................................... 4-4
4.4.1 Stanley Hill Zone ..................................................................................................................... 4-4 4.4.2 Fernan Hill Zone ...................................................................................................................... 4-5 4.4.3 Armstrong Park Zone .............................................................................................................. 4-6 4.4.4 Blackwell Hill Zone .................................................................................................................. 4-7
4.5 Water Supply Recommendations by Pressure Zone ............................................................................ 4-8 4.5.1 Existing Wells .......................................................................................................................... 4-8 4.5.2 New Wells ............................................................................................................................. 4-10
4.6 Proposed Well Locations .................................................................................................................... 4-12 4.7 Ultimate Demand and Water Rights ................................................................................................... 4-12 4.8 Telemetry ............................................................................................................................................ 4-13 4.9 Power Supply and Reliability .............................................................................................................. 4-13 4.10 Water Conservation ............................................................................................................................ 4-14 4.11 Capital Costs ...................................................................................................................................... 4-14
Chapter 5 – Water Storage ............................................................................................................................... 5-1
5.1 Introduction ........................................................................................................................................... 5-1 5.2 Existing and Future Storage Evaluation and Recommendation ............................................................ 5-2
5.2.1 Upper Zone ............................................................................................................................. 5-2 5.2.2 General Zone .......................................................................................................................... 5-3

City of Coeur d’Alene iii 2012 Water System Comprehensive Plan Update
F:\Projects\JUB\20-12-015_CdA_2012_Wtr_Sys_Comp_Plan_Update\docs\Report\Comp Plan Update_FINAL.docx
5.2.3 Stanley Hill .............................................................................................................................. 5-3 5.2.4 Fernan Hill ............................................................................................................................... 5-4 5.2.5 Armstrong Park ....................................................................................................................... 5-4 5.2.6 Blackwell Hill ........................................................................................................................... 5-4 5.2.7 Storage Summary ................................................................................................................... 5-4
5.3 Cost Opinions ....................................................................................................................................... 5-5
Chapter 6 – Distribution System ..................................................................................................................... 6-1
6.1 Distribution System Analysis................................................................................................................. 6-1 6.2 Evaluation of Distribution System ......................................................................................................... 6-1
6.2.1 Existing Demand Conditions ................................................................................................... 6-1 6.2.2 Future Demand Conditions (Build-Out) ................................................................................... 6-2
6.3 Pressure Zone Boundary Analysis ........................................................................................................ 6-5 6.3.1 Upper Zone/General Zone ...................................................................................................... 6-5 6.3.2 Stanley/Fernan Boundary ....................................................................................................... 6-5
6.4 Recommended Improvements .............................................................................................................. 6-5 6.4.1 Upper Zone ............................................................................................................................. 6-5 6.4.2 General Zone .......................................................................................................................... 6-6 6.4.3 Stanley Hill Zone ..................................................................................................................... 6-6 6.4.4 Fernan Hill Zone ...................................................................................................................... 6-6 6.4.5 Armstrong Park Zone .............................................................................................................. 6-6 6.4.6 Blackwell Hill Zone .................................................................................................................. 6-6
Chapter 7 – Capital Improvement Plan ........................................................................................................... 7-1
7.1 Order of Magnitude Cost Estimates ...................................................................................................... 7-1 7.2 Summary of Existing System Deficiencies and Improvements ............................................................. 7-1
7.2.1 Water Supply........................................................................................................................... 7-1 7.2.2 Storage ................................................................................................................................... 7-3 7.2.3 Distribution/Piping ................................................................................................................... 7-4 7.2.4 Additional Improvements ......................................................................................................... 7-8
7.3 Identification and Scheduling of Improvements .................................................................................... 7-8
Appendices Appendix A – Coeur d'Alene Demographics Discussion/Evaluation Appendix B – Water System Conservation Plan Appendix C – Well Data Appendix D – Technical Memorandum, 2012 Fernan Hill Evaluation, August 3, 2012 Appendix E – Technical Memorandum, 2012 Blackwell Hill Zone Analysis, September 26, 2012 Appendix F – Technical Memorandum, 2012 Coeur d'Alene Water Model Analysis, July 12, 2012 Appendix G – Minimum System Development Criteria Appendix H – Capital Improvement Plan

City of Coeur d’Alene iv 2012 Water System Comprehensive Plan Update
F:\Projects\JUB\20-12-015_CdA_2012_Wtr_Sys_Comp_Plan_Update\docs\Report\Comp Plan Update_FINAL.docx
Figures Figure ES-1 – Water Service Area ........................................................................................................................ 2 Figure 2-1 – Existing and Future Service Area Boundaries ................................................................................ 2-2 Figure 2-2 – Diurnal Demand ............................................................................................................................. 2-6 Figure 2-3 – Maximum and Average Day Pumping: 2007-2011 ......................................................................... 2-6 Figure 3-1 – Existing System .............................................................................................................................. 3-2 Figure 3-2 –Zone Boundaries ........................................................................................................................... 3-14 Figure 4-1 – Storage and Capacity Requirements-Upper Zone ......................................................................... 4-3 Figure 4-2 – Storage and Capacity Requirements-General Zone ...................................................................... 4-3 Figure 4-3 – Supply and Capacity Requirements-Stanley Hill Zone ................................................................... 4-5 Figure 4-4 – Storage and Capacity Requirements-Fernan Hill Zone .................................................................. 4-6 Figure 4-5 – Storage and Capacity Requirements-Armstrong Park Zone .......................................................... 4-7 Figure 4-6 – Storage and Capacity Requirements-Blackwell Hill Zone .............................................................. 4-8 Figure 4-7 – Supply and Storage ...................................................................................................................... 4-11 Figure 6-1 – Peak Hour Headloss Gradient (Current System) ........................................................................... 6-3 Figure 6-2 – Peak Hour Head Loss Gradient (Build-Out) without Improvements ............................................... 6-4 Figure 6-3 – Peak Hour Headloss Gradient (Build-Out) with Improvements ...................................................... 6-9 Figure 7-1 – Capital Improvement Projects ...................................................................................................... 7-10
Tables
Table ES-1 – City of Coeur d’Alene Current and Future Water Demand .............................................................. 1 Table ES-2 – Well and Pump Data ........................................................................................................................ 4 Table ES-3 – Summary of Existing Storage .......................................................................................................... 5 Table ES-4 – Summary of Existing Booster Pump Stations .................................................................................. 6 Table ES-5 – Pipe Summary ................................................................................................................................. 7 Table ES-6 – Supply Analysis ............................................................................................................................... 7 Table ES-7 – Storage Analysis .............................................................................................................................. 8 Table ES-8 – City of Coeur d'Alene Schedule of Improvements ......................................................................... 10 Table 1-1 – Summary of Fire Flow Targets ........................................................................................................ 1-4 Table 2-1 – City of Coeur d’Alene Current and Future Water Demand .............................................................. 2-4 Table 3-1 – Well and Pump Data ....................................................................................................................... 3-3 Table 3-2 – Summary of Water Rights ............................................................................................................... 3-7 Table 3-3 – Summary of Existing Storage .......................................................................................................... 3-8 Table 3-4 – Summary of Existing Booster Pump Stations ................................................................................ 3-11 Table 3-5 – Pressure Reducing Valves ............................................................................................................ 3-15 Table 3-6 – Pipe Summary ............................................................................................................................... 3-16 Table 4-1 – Existing Supply Requirements......................................................................................................... 4-1 Table 4-2 – Future Supply Requirements for Planning Period ........................................................................... 4-2 Table 4-3 – Future Supply Trigger Flow Requirements ...................................................................................... 4-4 Table 4-4 – Elm Street Booster Station Demands .............................................................................................. 4-4 Table 4-5 – Fernan Hill Booster Station.............................................................................................................. 4-5 Table 4-6 – Armstrong Park Booster Station ...................................................................................................... 4-6

City of Coeur d’Alene v 2012 Water System Comprehensive Plan Update
F:\Projects\JUB\20-12-015_CdA_2012_Wtr_Sys_Comp_Plan_Update\docs\Report\Comp Plan Update_FINAL.docx
Table 4-7 – Blackwell Hill Booster Station .......................................................................................................... 4-7 Table 4-8 – Upper Zone Wells ............................................................................................................................ 4-9 Table 4-9 – Opinion of Probable Costs-New Supply ........................................................................................ 4-14 Table 4-10 – Opinion of Probable Cost-Miscellaneous Water Supply Projects ................................................ 4-15 Table 4-11 – Opinion of Probable Cost-Booster Station Upgrades .................................................................. 4-15 Table 5-1 – Fire Storage Sizing Criteria ............................................................................................................. 5-1 Table 5-2 – Storage Requirements by Zone....................................................................................................... 5-5 Table 5-3 – Cost Opinions-Storage Recommendation ....................................................................................... 5-5 Table 6-1 – Build-Out Deficiencies ..................................................................................................................... 6-7 Table 7-1 – Water Supply Improvement Costs by Zone ..................................................................................... 7-2 Table 7-2 – Additional Supply Improvements ..................................................................................................... 7-2 Table 7-3 – Booster Station Improvements ........................................................................................................ 7-3 Table 7-4 – Storage Requirements .................................................................................................................... 7-4 Table 7-5 – Build-Out Deficiencies ..................................................................................................................... 7-5 Table 7-6 – Additional Recommended Improvements ........................................................................................ 7-8 Table 7-7 – City of Coeur d'Alene Schedule of Improvements ........................................................................... 7-9 Volume I I – Water Department Financial Plan for Capital Improvements

City of Coeur d’Alene vi 2012 Water System Comprehensive Plan Update
F:\Projects\JUB\20-12-015_CdA_2012_Wtr_Sys_Comp_Plan_Update\docs\Report\Comp Plan Update_FINAL.docx
AC Asbestos-cement (pipe) ADD Average Daily Demand AF Acre-foot (43,560 cubic feet or 325,829 gallons) AI Aggressiveness index Alk Alkalinity APD Aquifer Protection District of Kootenai County ASTM American Society for Testing and Materials C Disinfectant concentration CAMP Comprehensive Aquifer Management Plan cfs Cubic feet per second CT Value time (disinfectant concentration times the contact time) CU Color units CWA Clean Water Act DBP Disinfection byproduct DEQ/IDEQ Idaho Department of Environmental Quality DIC Dissolved inorganic carbon DWR/IDWR Idaho Department of Water Resources EPA/USEPA United States Environmental Protection Agency fps Feet per second GI Gastrointestinal GMA Groundwater Management Area gpcd Gallons per capita per day gpd Gallons per day gpm Gallons per minute GUDI Groundwater Under the Direct Influence (of Surface Water) HAA Halo-acetic acid IOC Inorganic chemicals LSI/LI Langelier saturation index MCL Maximum containment level MCLG Maximum containment level goal MDD Maximum Daily Demand MDL Method detection limit

City of Coeur d’Alene vii 2012 Water System Comprehensive Plan Update
F:\Projects\JUB\20-12-015_CdA_2012_Wtr_Sys_Comp_Plan_Update\docs\Report\Comp Plan Update_FINAL.docx
meq Milliequivalent, 10-3 equivalents mg/l Milligrams per liter = ppm
µg/l Micrograms per liter = ppb mgd Million gallons per day MPA Microscopic Particle Analysis NTU Nephelometric turbidity unit NPDES National Pollutant Discharge Elimination System PHD Peak Hour Demand ppb Parts per billion ppm Parts per million PQL Practical Quantitation Limit PVC Polyvinyl Chloride (pipe) RAFN Reasonably Anticipated Future Needs Provisions of Idaho's Municipal Water Rights Act of 1996 SCADA Supervising control and data acquisition SDWA Safe Drinking Water Act (P.L. 93-523 plus amendments) SMCL Secondary maximum containment level SOC Synthetic organic chemical SVRPA/RPA Spokane Valley-Rathdrum Prairie Aquifer SWTR Surface Water Treatment Rule T Contact time or temperature TDS Total dissolved solids THM Trihalomethane TOC Total organic carbon USGS U.S. Geological Survey UV Ultraviolet VFD Variable frequency drive VOC Volatile organic chemical

Execut ive Summary
City of Coeur d’Alene 1 2012 Water System Comprehensive Plan Update
F:\Projects\JUB\20-12-015_CdA_2012_Wtr_Sys_Comp_Plan_Update\docs\Report\Comp Plan Update_FINAL.docx
ES-1 Introduction and Purpose The City of Coeur d'Alene's previous Water System Comprehensive Plan was completed in 1999. Since that time, the City Water Department has implemented all of the recommended improvements. Remarkably, all of the improvements were paid for from operating revenues without the need to add any debt. This plan update is conceived as the next step in continuing the successful management of the City's water system. The City of Coeur d'Alene, Idaho (City) authorized J-U-B ENGINEERS, Inc. (J-U-B) to update the City’s 1999 Water Comprehensive Plan. This plan update incorporates land use changes and establishes a new planning boundary. Using evaluation criteria approved by the City, the entire system was evaluated to determine the impact of future growth. The resulting recommendations presented in this report are for planning immediate and long-term improvements. This Comprehensive Plan Update focuses on improvements required within the next ten years as well as water demands and the system infrastructure needs expected at system build-out. Reviewing the Comprehensive Plan annually and updating as conditions change from the expectations presented here will help maintain excellent water service throughout the planning period.
ES-2 Production and Consumption The City water system boundary serves approximately 6,400 acres and provides drinking water to close to 20,000 metered connections. Over the 20-year planning period, the current population of 45,000 people is expected to continue growing at an average rate of 2 percent. Table ES-1 includes the projected demands.
Table ES-1 – City of Coeur d’Alene Current and Future Water Demand 2011
(mgd) 2016
(mgd) 2021
(mgd) Build-Out
(mgd) Average Daily Demand 10.05 11.32 12.5 13.8 Maximum Daily Demand 32.19 35.77 39.5 43.6 Peak Hour Demand 57.94 64.38 71.10 78.48
Figure ES-1 shows the existing and future planning boundaries for the Water Department. The planning boundary is consistent with the City's Area of City Impact (ACI) on the north, west, and southwest borders. The water planning boundary to the east and southeast have been reduced from the ACE to encompass areas that are thought to be reasonably serviceable by the current system.


Execut ive Summary
City of Coeur d’Alene 3 2012 Water System Comprehensive Plan Update
F:\Projects\JUB\20-12-015_CdA_2012_Wtr_Sys_Comp_Plan_Update\docs\Report\Comp Plan Update_FINAL.docx
ES-3 System Overview The City of Coeur d'Alene water system is currently in very good condition, which continues to improve through an aggressive replacement program. Water is currently supplied by nine groundwater wells, and storage is provided by seven storage tanks. Six pressure zones are included within the boundary, two of which are served directly by wells and four of which are served by booster stations. The nine wells within the system can provide over 26,000 gpm at the current pump capacities. A summary of these wells is included in Table ES-2. The City has total water rights of 52.4 cfs (23,518 gpm/33.8 mgd), which meets the current maximum day demand. These water rights have been consolidated to a municipal water right and are looked at for the system as a whole, meaning the City can use up to its full water right regardless of which wells are operating. The existing storage tanks are typically located at the periphery of the system. Table ES-3 includes the summary of the existing facilities.

Execut ive Summary
City of Coeur d’Alene 4 2012 Water System Comprehensive Plan Update
F:\Projects\JUB\20-12-015_CdA_2012_Wtr_Sys_Comp_Plan_Update\docs\Report\Comp Plan Update_FINAL.docx
Table ES-2 – Well and Pump Data
Well No.
Original Well Test
Present Pump & Motor
Pump Rated Capacity Normal Operating Point
Auxiliary Power Flow (gpm)
Drawdown (feet)
Flow (gpm)
Head (feet)
Flow (gpm)
System Pressure
(psi)
Well Drawdown
(feet) 1. Atlas 6,000 23.2 600 hp Worthington Model
15HH410-7, 7-stage deep well turbine
4,000 420 4,480 53 14.5 600 hp right angle
diesel drive (b)
2. 4th St. 3,500 20.1 400 hp Byron Jackson 16 GL, 3-stage deep well turbine
3,000 360 2,650 53 15.0 None
3. Hanley 6,000 5.75 500 hp Peerless deep well turbine pump
3,600 410 3,500 65 5.0 None
4. Honeysuckle 2,500 N/A 250 hp Goulds Model 14RJ-DWT, 5-stage deep well turbine
1,650 375 1,600 80 N/A (a) None
5. Linden 3,100 10.7 300 hp Byron Jackson 16 GH 3-stage deep well turbine
2,300 310 2,810 65 13.5 None
6. Locust 3,700 5.9 350 hp Byron Jackson 15 HQ, 6-stage deep well turbine
3,000 350 3,200 55 13.0 None
7. Landings 3,500 14 500 hp Flowserve Model 15EHM/15HZ77, 5-stage deep well turbine
3,000 512 3,100 65 N/A (c) None
8. Prairie 4,000 1 500 hp Flowway Model 16MKM, 6-stage deep well turbine
3,200 380 3,200 59 N/A (a) None
9. Annie 2,500 93 350 hp Peerless Model 16HXB, 5-stage deep well turbine
2,500 429 2,500 N/A (c) 12 None
Total 34,800 26,250 27,040
Firm Capacity 23,040 (a) Not available – The existing well depth gage is not operational. (b) Scheduled to be replaced with standby power generation. (c) No appreciable drawdown at current pumping rates.

Execut ive Summary
City of Coeur d’Alene 5 2012 Water System Comprehensive Plan Update
F:\Projects\JUB\20-12-015_CdA_2012_Wtr_Sys_Comp_Plan_Update\docs\Report\Comp Plan Update_FINAL.docx
Table ES-3 – Summary of Existing Storage
Storage Tank Capacity
(MG)
Operating Characteristics Overflow Elevation
(MSL) Height (feet) Pressure Zone Type of Tank
1. Best Hill 2.0 2,355.35 31.85 General Ground Level (steel)
2. Tubbs Hill 2.0 1.0
2,355.35 2,355.35
24 24
General General
Ground Level (concrete) Ground Level (steel)
3. Prairie Standpipe 2.0 2,430.5 156.5 Upper Standpipe (steel)
4. Industrial Standpipe 2.0 2,430.50 160 Upper Standpipe (steel)
5. Stanley Hill 0.2 2,540.22 31 Stanley Ground Level (steel)
6. Blackwell Hill 0.012 2,400 (a) 10 Blackwell Ground Level (concrete)
7. Armstrong Park 0.16 2,882 (a) 32 Armstrong Park Ground Level (steel)
Total 9.4
(a) Approximate elevation The City also has four major booster stations that supply the areas of higher elevation. These booster stations are summarized in Table ES-4.

Execut ive Summary
City of Coeur d’Alene 6 2012 Water System Comprehensive Plan Update
F:\Projects\JUB\20-12-015_CdA_2012_Wtr_Sys_Comp_Plan_Update\docs\Report\Comp Plan Update_FINAL.docx
Table ES-4 – Summary of Existing Booster Pump Stations
Booster Station
Operating Characteristics
Notes Suction Pressure
Zone Discharge Pressure
Zone Pump
No. HP Capacity
(gpm) TDH (a)
(ft)
1. Elm Street General Stanley 1 2 3
20 50 20
200 500 200
230 230 230
2. Blackwell Hill – Lower (b) General Blackwell 1 2
20 20
90 120
3. Tubbs Hill General Tubbs Hill 1 2 3
1.5 1.5 1.5
30 30 30
158 158 158
4. Armstrong Park General Armstrong Park 1 2
50 50
220 220
560 560
(a) Total dynamic head based on nameplate and original pump curve information. (b) Pump HP and TDH not available for Blackwell Hill Boosters.

Execut ive Summary
City of Coeur d’Alene 7 2012 Water System Comprehensive Plan Update
F:\Projects\JUB\20-12-015_CdA_2012_Wtr_Sys_Comp_Plan_Update\docs\Report\Comp Plan Update_FINAL.docx
The City's water distribution system includes a total of 296 miles of piping. This piping ranges in size and material throughout the system. Table ES-5 includes a summary of the existing piping by diameter and material.
Table ES-5 – Pipe Summary (a)
Material Pipe Length Diameter
Total < 6" 6" 8" 10" 12" 14" 16" 18" 20" 24"
(miles) (miles) (miles) (miles) (miles) (miles) (miles) (miles) (miles) (miles) (miles)
AC 5.7 52.3 25.5 2.2 19.8 0.6 1.1 107 Ductile 0.2 1.4 0.2 1.2 0.2 0.1 0.1 0.7 3.3 7 Galvanized 3.5 3 PVC 1.6 28.0 86.0 4.8 44.3 2.8 0.2 168 Steel 2.0 1.9 0.3
4 Other 2.4 2.3 0.3 0.8 6
Total 15.3 85.8 112.3 7.0 66.1 0.8 4.1 0.2 0.7 3.3 296 (a) Pipe material, length, and sizes were generated from the City’s GIS water system database as of April 2012.
ES-4 System Analysis
ES-4.1 Supply The City's existing supply is both high quality and productive. To help ensure reliable water service, water systems strive to meet maximum day demands through "firm" capacity. The "firm" supply required for the system is the supply required with the largest well out of service. Table ES-6 shows the current firm supply for each of the pressure zones as well as identifies the additional supply that will be required for each of the zones to meet the build-out demands.
Table ES-6 – Supply Analysis
Zone
Current Firm Capacity
MGD (gpm)
Build-Out Required Firm Capacity
MGD (gpm)
Additional Capacity Required
MGD (gpm) Upper 16.40 (11,400) 24.30 (16,900) 7.90 (5,500)
General 15.80 (11,000) 27.40 (19,000) 11.6 (8,000) Stanley Hill 0.60 (418) 1.00 (720) 0.52 (302)
Armstrong Park 0.32 (220) 0.63 (440) 0.31 (220) Blackwell Hill 0.29 (200) 0.89 (620) 0.60 (420) Fernan Hill --- 1.12 (775) 1.12 (776)

Execut ive Summary
City of Coeur d’Alene 8 2012 Water System Comprehensive Plan Update
F:\Projects\JUB\20-12-015_CdA_2012_Wtr_Sys_Comp_Plan_Update\docs\Report\Comp Plan Update_FINAL.docx
In order to meet the future supply requirements, four supply improvements have been scheduled. One additional 4,000 gpm well will be required in the Upper Zone along with increasing the capacity of two existing wells by 750 gpm each. The General Zone will require an additional 8,000 gpm total at build-out, which will be met with the addition of two new 4,000 gpm wells. These wells may be located in either the Upper or General Zone. In addition to the additional supply that will be added to the system, a number of other improvements have been recommended, including the replacement of two wellhouses and upgrades to the disinfection systems, along with regular maintenance items such as pump repairs and control system upgrades. A complete discussion of the recommended improvements can be found in Chapter 4.
ES-4.2 Storage The existing storage facilities are generally in good condition. The storage required for each zone is developed based on the City's criteria described in Chapter 1, which includes storage for equalization, fire, and emergency supplies. Table ES-7 includes the current storage, required capacity, and total deficit by zone.
Table ES-7 – Storage Analysis
Zone
Current Usable Capacity
(MG)
Build-Out Required Firm Capacity
(MG)
Additional Capacity Required
(MG) Upper 2.00 2.90 0.90
General 5.00 4.40 --- Stanley Hill 0.20 0.70 0.50
Armstrong Park 0.16 0.50 0.34 Blackwell Hill 0.00 0.60 0.60 Fernan Hill N/A 0.70 0.70
An additional 1 MG storage tank is recommended in the Upper Zone. Several tanks will also require re-coating within the next five years. Many of the boosted systems will require additional storage as these areas develop further. Since these are largely development driven, the improvements will be driven by development activity in these areas. A complete discussion of the recommended improvements can be found in Chapter 5.

Execut ive Summary
City of Coeur d’Alene 9 2012 Water System Comprehensive Plan Update
F:\Projects\JUB\20-12-015_CdA_2012_Wtr_Sys_Comp_Plan_Update\docs\Report\Comp Plan Update_FINAL.docx
ES-4.3 Distribution The existing distribution system is generally in good condition. The Water Department schedules replacement of 1 to 2 miles of pipelines each year, focusing their program on the areas with old pipe and undersized pipe. This rate of replacement will allow the entire system to be fully replaced every 150 to 300 years. Ideally, full replacement would occur every 100 to 200 years. As the system grows toward build-out of the planning area and the demands increase across the system, moving water from the large supply wells to the remainder of the system becomes more difficult. A number of the recommended improvements are driven by the need to move more water throughout the system. Chapter 6 of the Plan includes a detailed discussion of the recommended improvements.
ES-5 Capital Improvement Plan The recommended improvements for the system are identified in Chapters 4, 5, and 6 and are shown on Figure ES-1. These recommended improvements have been scheduled over the 20-year planning period to meet the system requirements and demands. Table ES-8 shows the phasing of system improvements in 5-year increments.

Execut ive Summary
City of Coeur d’Alene 10 2012 Water System Comprehensive Plan Update
F:\Projects\JUB\20-12-015_CdA_2012_Wtr_Sys_Comp_Plan_Update\docs\Report\Comp Plan Update_FINAL.docx
Table ES-8 – City of Coeur d'Alene Schedule of Improvements
Item Capital Cost Opinion by Year (a)
2013-2017 2018-2022 2023-2027
Supply Improvements
New Wells $3,397,400 $2,434,500
Other Supply Improvements $925,000 $747,700 $1,238,800
Storage Improvements (b)
New Tanks $2,172,700 $508,300
Other Storage Improvements $308,300 $233,300 $476,500
Distribution Improvements (b)
Distribution Improvements $2,073,450 $2,014,078
Annual Water Main Replacement $3,575,000 $3,575,000 $3,575,000
Booster Stations (b)
Booster Station Improvements $185,800 $527,000
Additional Capital Improvements
Additional Improvements $3,000,000
Totals $8,391,500 $19,410,150 $7,812,678
(a) All Opinions of Cost are planning level in 2012 dollars and do not include land purchase costs. (b) Development-driven improvements are included at no cost to the City.
The cost of these improvements is paid for in different ways, depending on the driving factor for the improvement. Facilities located within the existing system that are driven by growth to supply future connections such as the recommended supply wells, new storage, and water transmission improvements are funded by capitalization fees. Projects that are related to regular maintenance or replacement of existing system components are funded by water rates. Projects that specifically serve a single major new development are expected to be fully funded by the development and donated to the City. Table ES-8 includes all of the recommended City-funded improvements. The complete list of projects, including those that are developer-funded, can be found on Table 7-1 to Table 7-6.

Execut ive Summary
City of Coeur d’Alene 11 2012 Water System Comprehensive Plan Update
F:\Projects\JUB\20-12-015_CdA_2012_Wtr_Sys_Comp_Plan_Update\docs\Report\Comp Plan Update_FINAL.docx
ES-6 Appendices The appendices of this report include background and supplementary information:
• Appendix A presents the detailed analysis of the population projections for the Water Department and how the specific growth rate was selected.
• Appendix B incudes the Water Conservation Plan. This Plan fulfills the requirements of the Idaho Department of Water Resources for applying for future water rights.
• Appendix C contains specific information on each of the wells and well pumps.
• Appendix D and Appendix E include memorandums describing the technical components for the future of the Fernan Hill Zone and the Blackwell Hill Zone.
• Appendix F details the technical components that went into the update of the hydraulic water model that was used to evaluate the distribution system.
• Appendix G outlines specific criteria for future developments.
• Appendix H includes the detailed Capital Improvement Plan.
ES-7 Financial Plan A financial plan was prepared for this report and is included as a companion document. This document evaluates the cost of the recommended improvements and evaluates how the City can fund these from existing cash flow without adding debt. As a result of this analysis, it presents recommended rate and capitalization fee increases for the next six years.
ES-8 Acknowledgments Many people were extremely helpful in providing documentation, information, and input. We wish, however, to especially thank the City of Coeur d'Alene Water Department staff who were instrumental in completing this report. Jim Markley, Terry Pickel, Dion Holton, Tom Howard, and Gwain Oka were instrumental in collecting data; presenting improvement ideas; evaluating alternatives; expressing system concerns; and giving timely, pointed feedback. We would also like to thank Dave Yadon, Brian Keating, and Troy Tymesen who all took time to provide planning and financial data as well as give us feedback on specific areas of the Plan. This assistance is gratefully acknowledged.

Review Criteria

Chapter 1 – Review Cri te r ia
City of Coeur d’Alene 1-1 2012 Water System Comprehensive Plan Update
F:\Projects\JUB\20-12-015_CdA_2012_Wtr_Sys_Comp_Plan_Update\docs\Report\Comp Plan Update_FINAL.docx
1.1 Introduction This chapter includes an overview of some of the current and future regulatory requirements facing the Water Department as well as an overall view of the water quality for the City. This chapter also identifies the basic review criteria that will form the basis for this Master Plan Update.
1.2 Regulatory Issues Rules, regulations, and requirements for groundwater systems have not changed significantly since the last Comprehensive Plan in 1999; however, there are some future regulatory requirements that may impact the City. An overview of future regulatory requirements that may affect the City are discussed in this section.
1.2.1 Existing Water Quality The City operates a Public Water System (PWS #ID1280053) that is regulated by the State of Idaho Department of Environmental Quality (IDEQ). As a regulated water system, the City must submit water samples each year to verify the quality of water they serve the public. All nine of the City’s wells draw water from the Spokane Valley-Rathdrum Prairie Aquifer (SVRPA). The aquifer was designated as a “Sole-Source Aquifer” by the Environmental Protection Agency in 1978. It has been further protected by Kootenai County and the Panhandle Health District, which limits septic tank wastewater service to one residential equivalent per five acres. Additionally, the Sensitive Resource Aquifer designation in 1997 by the State of Idaho further protects the SVRPA with Idaho’s only “non-degradation” management standard. Monthly coliform bacteria samples that are representative of water throughout the water system are submitted monthly to the IDEQ. In addition to coliform testing, the City is required to perform regular testing for contaminants, including lead and copper, volatile organic chemicals, synthetic organic chemicals, and inorganic chemicals. Water quality throughout the system is generally very good and rarely elicits customer complaints. The City Water Department performs an excellent job in maintaining the system in good operating order. Water quality reports for the City’s well sources show no detection of most chemical contaminates. Slight levels of nitrate exist within some of the City’s wells. The highest level reported in 2011 was 2.1 mg/L, which is typical of Rathdrum Prairie wells and is well below the maximum contaminant level (MCL) of 10 mg/L. There is also naturally occurring arsenic in the City wells

Chapter 1 – Review Cri te r ia
City of Coeur d’Alene 1-2 2012 Water System Comprehensive Plan Update
F:\Projects\JUB\20-12-015_CdA_2012_Wtr_Sys_Comp_Plan_Update\docs\Report\Comp Plan Update_FINAL.docx
ranging from 1.22 to 37 µg/L, almost all of which is well below the Maximum Containment Level (MCL) of 10 µg/L. The two City wells that are near or exceed the MCL for arsenic set by the Environmental Protection Agency (EPA) include the Hanley and Annie wells. The Hanley Well exceeds the MCL, with arsenic levels ranging from 5 to 37 µg/L. The City limits operation of both the Hanley and Annie wells per the agreement with IDEQ (from July 2006) to achieve an annual exposure of less than 10 µg/L to residents of these areas. The Annie Well has arsenic levels at or slightly less than the MCL limit. The City operates this well as a “last on”/“first off” well. Strong protection measures in place for the Spokane Valley-Rathdrum Prairie Aquifer are expected to maintain water quality within water quality limits well beyond the planning period.
1.2.2 Source Water Quantity The aquifer is supplied by several large surface water sources, including Coeur d’Alene Lake, the Spokane River, Lake Pend Oreille, and Hayden Lake. Other small lake watersheds such as Hauser, Spirit, and Twin Lakes supply the balance of the surface water input to the aquifer. In an average year, precipitation also supplies the aquifer with one quarter of its recharge water. Of course, surface water flows and precipitation are subject to natural variations and will affect aquifer recharge rates. Detailed quantity, flow, and level analyses have been performed on both the Idaho and Washington side of the aquifer as part of the 2007 U.S. Geologic Surveys’ “Bi-State” Study and are available on the IDEQ website. The Spokane Valley-Rathdrum Prairie Aquifer is comprised of a thin layer of soil overlaying 200 to 400 feet of coarse sands and gravels. The alluvial material was deposited by Ice Age floods from Glacial Lake Missoula approximately 12,000 years ago. The 2007 “Bi-State” aquifer study completed by the U.S. Geologic Surveys shows that annual estimated aquifer withdrawals are approximately 22 percent of estimated annual recharge for the aquifer. While adequate aquifer supply appears to exist, pressure has been building from conservation groups to reduce per capita consumption in order to maintain Spokane River flows and water quality. The Spokane Valley-Rathdrum Prairie Aquifer is the largest source of drinking water within the City’s hydrologic area. Treating water from the nearby Spokane River or other surface sources would remove water that recharges the aquifer. It is significantly more costly than continued use of groundwater and could also introduce minimum river flow constraints directly into water supply planning. As a result, it is assumed that the City will continue to use groundwater as its sole water supply. Conserving water is likely the best way the City can reduce its dependence upon the aquifer. The City has been implementing conservation measures over the last few years, including promoting moisture sensors for irrigation systems and xeriscapes, education, ratepayer incentive

Chapter 1 – Review Cri te r ia
City of Coeur d’Alene 1-3 2012 Water System Comprehensive Plan Update
F:\Projects\JUB\20-12-015_CdA_2012_Wtr_Sys_Comp_Plan_Update\docs\Report\Comp Plan Update_FINAL.docx
programs, and 2-block rate structures to promote conservation. Long-term aquifer quantity issues cannot be resolved by the City alone, as it is something that affects all communities located within the hydrologic boundaries of the aquifer.
1.2.3 Future Regulatory Issues Two new drinking water rules are being proposed by the EPA that could potentially impact the City–the revised Total Coliform Rule and the proposed Radon in Drinking Water Regulation. The Total Coliform Rule was effective in 1990, setting health goals and MCLs for total coliform in drinking water. EPA announced intentions to revise the rule in 2003, and proposed revisions were completed in 2010. The revisions to this rule are intended to determine whether a system is vulnerable to microbial contamination and require the problems to be identified and fixed, usually through source protection and disinfection. The rule revisions also allow for reduced monitoring if systems meet specific criteria. Due to the high quality water and substantial protection measures in place for the Spokane Valley-Rathdrum Prairie Sole Source Aquifer, it does not appear likely that groundwater disinfection will be required for systems on the Rathdrum Prairie Aquifer in the immediate future. The City does, however, already provide wellhead chlorination to reduce the likelihood of positive coliform samples. There is the potential that Coeur d’Alene may have to develop a specific wellhead protection program to supplement the Sole Source Aquifer protection program already in place. Although we do not anticipate the need for such a plan, the anticipated groundwater disinfection rule may require that larger municipalities covered under the Sole Source Aquifer generate wellhead protection plans. The second rule that could impact the City is the proposed Radon in Drinking Water Regulation. This rule is intending to address both the issues of radon being released from water and breathed in or consumed while drinking, leading to the rise of lung cancer or stomach cancer, respectively. Monitoring for radon levels and reporting to IDEQ will be the first stage of this regulation. Sampling will be required after the initial year of quarterly monitoring, depending on the average of the levels, to show it compares to the MCL. The MCL is proposed to be 300 picocuries per liter (pCi/L), and the Alternative Maximum Contaminant Level (AMCL) is proposed to be 4,000 pCi/L. Based on historical data from the Rathdrum Prairie Aquifer, it is not expected that the City would have samples exceeding the MCL/AMCL, so the City would likely be eligible for reduced sampling after the initial four consecutive quarterly samples.

Chapter 1 – Review Cri te r ia
City of Coeur d’Alene 1-4 2012 Water System Comprehensive Plan Update
F:\Projects\JUB\20-12-015_CdA_2012_Wtr_Sys_Comp_Plan_Update\docs\Report\Comp Plan Update_FINAL.docx
1.3 Fire Protection Criteria Historically, the City water system has been designed to provide adequate water for domestic use only. Although there is no legal requirement for the water system to provide fire protection, the City has made a policy decision to provide reasonable flows and pressures for fire protection. The current fire protection criteria for the City are based on providing reasonable minimum flows and pressures. Minimum demands that have been placed on the system by existing buildings will be met if possible but will not be the primary focus for any future improvements. Future development will then need to meet the minimum standards established by this Plan. The target minimum flows and pressures are presented in Table 1-1.
Table 1-1 – Summary of Fire Flow Targets
Land Use and Zoning Median Home Size
(square feet)
Operating Characteristics Minimum Flow
Rate (gpm)
Residual System Pressure
(psig) Duration (hours)
Residential (R-1, R-3, R-8, R-12) 3,600 1,000 20 2 3,600-5,000 1,750 (a) 20 2
1. Commercial (C-17, C-34) 3,500 20 3 2. Industrial (LM, M) 3,500 20 3
(a) On a case-by-case basis for structures greater than 5,000 SF In the case of exceptionally high fire flow demands or demands exceeding those in Table 1-1, the property owner will be required to provide onsite fire protection (i.e., storage, pumping, and sprinklers) as necessary to meet the required fire flow. For these cases, the additional requirements will need to be approved by the Water Superintendent and Fire Department, and will be at the property owner’s expense. Due to the distributed nature of the City’s supply, there is a wide variation in system performance between summer and winter. Since all system wells are operating during the peak summer months, available fire flows tend to be much higher than in the winter months when storage is used more heavily. The Water Department and Fire Department have jointly determined that the standard system condition under which sprinkler systems shall be designed and fire flows evaluated will be under low-demand, winter conditions with the Honeysuckle Well and the 4th Street Well operating and tank levels just above the minimum pump start levels.

Chapter 1 – Review Cri te r ia
City of Coeur d’Alene 1-5 2012 Water System Comprehensive Plan Update
F:\Projects\JUB\20-12-015_CdA_2012_Wtr_Sys_Comp_Plan_Update\docs\Report\Comp Plan Update_FINAL.docx
1.4 Minimum Water Service Criteria The City developed service criteria for the 1999 Comprehensive Water Plan Update to meet regulatory requirements, specific performance criteria, and fire flow criteria. City staff have indicated the criteria from the 1999 Plan have worked well. The criteria to be maintained by the City water system are as follows (only some minor changes were made for this update):
• A normal operating pressure range of 50 to 80 psi at the meter.
• Where possible, a maximum system pressure of 90 psi at the meter. If these pressures are to be exceeded, special arrangements will be made to provide an acceptable pressure range.
• Where possible, a minimum pressure of 40 psi.
• Water supply at least equal to the maximum day demand with the largest well out of service.
• Storage capable of meeting the maximum fire demand plus equalization demand with the largest well out of service during the maximum day while maintaining 50 percent storage in reserve.
• Where possible, meet a minimum fire flow of 3,500 gpm in commercial areas; a minimum fire flow of 1,750 gpm in the R-1 and R-3 (or as modified by PUD) zoning districts; and a minimum fire flow of 1,000 gpm in the R-5 through R-12 zoning districts during normal system operation.
• Minimum residual pressure of 20 psi during fires meeting the fire flow criterion.
• Fire flow demands based on the size of the structure and type of construction exceeding these ranges will require that property owners provide onsite fire protection, including, but not limited to, sprinklers.

Water Production and Consumption

Chapter 2 – Water Product ion and Consumpt ion
City of Coeur d’Alene 2-1 2012 Water System Comprehensive Plan Update
F:\Projects\JUB\20-12-015_CdA_2012_Wtr_Sys_Comp_Plan_Update\docs\Report\Comp Plan Update_FINAL.docx
2.1 Introduction Growth in the City of Coeur d’Alene has slowed the last few years, but the overall growth between 2000 and 2011 has been substantial. During this time, the Water Department has been able to keep up with the growth, provide good service, and minimize rate increases.
2.2 Coeur d’Alene Demographics Coeur d’Alene has been growing rapidly over the last decade. U.S. Census data indicates that the City population was 34,514 in 2000 and grew to 44,137 in 2010, an increase of approximately 2.49 percent year-over-year. The Kootenai Metropolitan Planning Organization (KMPO) estimates Coeur d’Alene’s projected average future annual growth rate at 2.5 percent. Avista Utilities uses an average growth rate of 1.5 percent for the next ten years. Discussions with City Planning, the Wastewater Department, and the Water Department resulted in a selected population growth rate of 2 percent for the planning period. A complete discussion of this evaluation is included in Appendix A.
2.3 Coeur d’Alene Water Service Boundary The water service population differs slightly from the City population because the water service boundary and the City boundary are not the same. Several small areas within the limits are served by other water purveyors, including Hoffman Water, Dalton Water Association, Hayden Lake Irrigation District, and Huetter Water. The differences in the City and water service boundaries are shown on Figure 2-1. The existing water service boundary encompasses approximately 6,400 acres. This existing service boundary and future service area boundaries are also included on Figure 2-1. The City Water Department currently has close to 17,000 total metered connections. Using the 2010 Census information of 2.25 persons per household, the population of the service area is approximately 38,250 people.


Chapter 2 – Water Product ion and Consumpt ion
City of Coeur d’Alene 2-3 2012 Water System Comprehensive Plan Update
F:\Projects\JUB\20-12-015_CdA_2012_Wtr_Sys_Comp_Plan_Update\docs\Report\Comp Plan Update_FINAL.docx
2.4 Water System Growth and Planning Period Growth of the water system is restricted on several sides due to adjacent water systems. Adjacent water purveyors exist on the north and west sides of the City along with one small private system within the City. Ross Point Water serves a large portion of the area north of Seltice and west of Huetter, and the Hayden Lake Irrigation District (HLID) borders the City system to the north along Prairie Avenue. The south side of the system is bound by Coeur d’Alene Lake. The majority of the expected growth in the City of Coeur d’Alene is generally progressing toward the east and south with infill in the northwest, as shown on Figure 2-1. Specific areas of growth in the water system include:
• The northwestern portion of town as development fills in toward Prairie Avenue and Huetter
• The portion of town south of Seltice and north of the Spokane River
• The area south of the Spokane River
• The area east of the existing City boundary in the foothills There are also several relatively small areas within the future City water boundary serviced by independent water systems. These specific areas are Hoffman Water, the Kootenai County Fairgrounds, and the USFS Nursery. These water systems may become part of the City system in the future, increasing demands to the City water system. Build-out water demand projections include the incorporation of the USFS Nursery and fairgrounds into the City for planning purposes. Hoffman Water is assumed to remain independent. The equivalent served acreage for the City was estimated by comparing build-out water demands with current water usage for land use areas within the system boundary. Based on this equivalent area, it is assumed that there will be a significant increase in water demands within the current system boundary. The total serviceable area for the build-out scenarios of the water system is approximately 10,600 acres. The anticipated increase in system demand for the water service area is accounted for by applying the growth rate of 2.0 percent for Coeur d’Alene to current peak day flow. Build-out demand for the system was estimated in conjunction with the City Planning Department using current zoning and water demand factors developed for major usage categories and applying these demands to the full build-out acreage. The growth rates were used to estimate approximate timing for service area build-out by projecting flows forward from today's maximum day demand (MDD) at a 2

Chapter 2 – Water Product ion and Consumpt ion
City of Coeur d’Alene 2-4 2012 Water System Comprehensive Plan Update
F:\Projects\JUB\20-12-015_CdA_2012_Wtr_Sys_Comp_Plan_Update\docs\Report\Comp Plan Update_FINAL.docx
percent increase. Future projects described in this Plan include dates for planning purposes; however, observed system demand is the more accurate and critical component to scheduling upgrades. Based on these projections, build-out population is estimated to occur between 2028 and 2032.
2.5 Current and Future Water Consumption Demands Water demands within the City are similar to nearby municipalities, with peak summer demands nearing three times the average daily demand (ADD). The terms below are typically used to define water consumption demands:
Average Day Demand (ADD): The average number of gallons of water consumed per day as calculated over the course of one year.
Maximum Day Demand (MDD): The maximum number of gallons of water used in one day as determined from well production records.
Peak Hour Demand (PHD): The maximum amount of water used in a one-hour period. This number is extrapolated from well production and tank level records.
Daily and hourly pumping records are kept at each well site. The maximum historical recorded peak day demand on July 25, 2006 was 32.2 MG. The observed production has generally declined from 2006 to 2011. This decline is likely a combination of factors, including increased conservation efforts by the City, a new water rate structure, and the economic slowdown. Due to this observed reduction in water use, an average of the observed peaks over the last five years has been used to develop a daily use for projections. The average peak day from 2007 to 2011 is 30.2 MG, with an average MDD per capita water use of 700 gallons per capita per day. This value will be used in combination with the projected growth rate to develop future projected demands. Table 2-1 illustrates current and future water use within the City’s water service area utilizing an annual growth rate of 2.0 percent.
Table 2-1 – City of Coeur d’Alene Current and Future Water Demand 2011
(mgd) 2016
(mgd) 2021
(mgd) Build-Out
(mgd) Average Daily Demand 10.05 11.32 12.5 13.8
Maximum Daily Demand 32.19 35.77 39.5 43.6
Peak Hour Demand 57.94 64.38 71.10 78.48

Chapter 2 – Water Product ion and Consumpt ion
City of Coeur d’Alene 2-5 2012 Water System Comprehensive Plan Update
F:\Projects\JUB\20-12-015_CdA_2012_Wtr_Sys_Comp_Plan_Update\docs\Report\Comp Plan Update_FINAL.docx
The fluctuation in demands over a 24-hour period is demonstrated on Figure 2-2 as a percentage of average over a 24-hour period. The demand fluctuation was developed using hourly SCADA information from the maximum day demand in 2011, taking into account pump run times, starts, and stops. The peak hour demand represents the highest rate of water use occurring in a one-hour period during the maximum day. Observed reservoir level fluctuations and pumping records indicate the PHD is approximately 1.8 times the MDD. This peak hour occurs at approximately 5:00 a.m., with a second lesser peak (1.2) at approximately 8:00 p.m. Demands above the base line show periods when equalization storage would be required if firm production capacity matched the peak day demand. In addition to daily demand fluctuation, domestic water use varies yearly primarily due to irrigation use. Figure 2-3 shows both the peak day and average day pumping values from 2007 through 2011. Comparing the average annual water demand of 10.4 mgd (7,220 gpm) to the maximum day demand of 30.2 mgd (20,970 gpm) yields a peaking factor of 2.9. This peaking factor is assumed to remain consistent through the planning period. In addition to the domestic water use and irrigation, typical system demands include fire flow. Fire flow criteria were established by the City and tabulated in Chapter 1.
2.6 Unaccounted Water The City maintains daily water production records for each well in the system. Comparing water production to individual user meter readings indicates unaccounted water ranges from 6 percent to 17 percent annually. The losses for the City are very low and indicate a well-managed and maintained system. A detailed evaluation of Unaccounted for Water is included in Appendix B (City of Coeur d'Alene Water System Conservation Plan).

Chapter 2 – Water Product ion and Consumpt ion
City of Coeur d’Alene 2-6 2012 Water System Comprehensive Plan Update
F:\Projects\JUB\20-12-015_CdA_2012_Wtr_Sys_Comp_Plan_Update\docs\Report\Comp Plan Update_FINAL.docx
Figure 2-2 – Diurnal Demand
Figure 2-3 – Maximum and Average Day Pumping: 2007-2011
0.0
0.2
0.4
0.6
0.8
1.0
1.2
1.4
1.6
1.8
2.0
Frac
tion
of A
vera
ge W
ater
Use
Time of Day
-
5
10
15
20
25
30
35
2007 2008 2009 2010 2011
MIll
ion
Gal
lons
Year
Max Day
Average Day

Description of
Existing System

Chapter 3 – Descript ion of Exis t ing System
City of Coeur d’Alene 3-1 2012 Water System Comprehensive Plan Update
F:\Projects\JUB\20-12-015_CdA_2012_Wtr_Sys_Comp_Plan_Update\docs\Report\Comp Plan Update_FINAL.docx
3.1 Introduction The Coeur d’Alene water system currently uses groundwater as its primary supply with major storage tanks on Tubbs Hill, Best Hill, Mineral Drive at Wilbur Avenue, and at the Coeur d’Alene Industrial Park. The existing Coeur d’Alene water system utilizes nine groundwater wells for its supply located throughout the City. These wells deliver water directly to the distribution system and also fill six storage tanks. Use of boosters and pressure-reducing valves has created five distinct pressure zones within the system. Figure 3-1 shows a map of the water system wells, tanks, and distribution system. The system is in good condition due to excellent maintenance practices on the major system components.
3.2 Water Supply The municipal water system supply for the City is provided by nine groundwater wells having a combined operating capacity of approximately 37.4 million gallons per day (mgd). A tenth well, the Clayton Well, is currently used for irrigation only at the Fairgrounds. Table 3-1 summarizes the well and pump operating conditions for all of the existing wells. The existing wells utilize line-shaft vertical turbine pumps. Lightning suppression and motor savers are on all pumps. Discharge piping includes check valves and pump control valves. The pump control valves discharge to troughs adjacent to the pump buildings. The condition of all the existing well pumps and housing is excellent due to an aggressive maintenance program by the City Water Department. The wells have historically all utilized downhole chlorination for disinfection, which is mixed in the pump bowls. This was done with a gas chlorination system. The City is currently in the process of converting from gas chlorine to onsite generation of sodium hypochlorite as well as replacing the downhole chlorination with pipeline injection of the disinfectant. Existing autotransformer starters are also being replaced with soft starters. The City is currently operating all of the well pumps based on tank level. The General Zone Wells (Annie, 4th Street, Linden, and Locust) are operated based on levels in the Tubbs Hill Tanks. Two of the Upper Zone Wells (Atlas and Landings) are operated based on levels in the Industrial Park Standpipe, and the other three wells (Honeysuckle, Hanley, and Prairie) operate based on the Prairie Standpipe levels. The Honeysuckle Well is the first on, last off well and is nearly always on.


Chapter 3 – Descript ion of Exis t ing System
City of Coeur d’Alene 3-3 2012 Water System Comprehensive Plan Update
F:\Projects\JUB\20-12-015_CdA_2012_Wtr_Sys_Comp_Plan_Update\docs\Report\Comp Plan Update_FINAL.docx
Table 3-1 – Well and Pump Data
Well No.
Original Well Test
Present Pump & Motor
Pump Rated Capacity Normal Operating Point
Auxiliary Power Flow (gpm)
Drawdown (feet)
Flow (gpm)
Head (feet)
Flow (gpm)
System Pressure
(psi)
Well Drawdown
(feet) 1. Atlas 6,000 23.2 600 hp Worthington Model
15HH410-7, 7-stage deep well turbine
4,000 420 4,480 53 14.5 600 hp right angle
diesel drive (b)
2. 4th St. 3,500 20.1 400 hp Byron Jackson 16 GL, 3-stage deep well turbine
3,000 360 2,650 53 15.0 None
3. Hanley 6,000 5.75 500 hp Peerless deep well turbine pump
3,600 410 3,500 65 5.0 None
4. Honeysuckle 2,500 N/A 250 hp Goulds Model 14RJ-DWT, 5-stage deep well turbine
1,650 375 1,600 80 N/A (a) None
5. Linden 3,100 10.7 300 hp Byron Jackson 16 GH 3-stage deep well turbine
2,300 310 2,810 65 13.5 None
6. Locust 3,700 5.9 350 hp Byron Jackson 15 HQ, 6-stage deep well turbine
3,000 350 3,200 55 13.0 None
7. Landings 3,500 14 500 hp Flowserve Model 15EHM/15HZ77, 5-stage deep well turbine
3,000 512 3,100 65 N/A (c) None
8. Prairie 4,000 1.0 500 hp Flowway Model 16MKM, 6-stage deep well turbine
3,200 380 3,200 59 N/A (a) None
9. Annie 2,500 93 350 hp Peerless Model 16HXB, 5-stage deep well turbine
2,500 429 2,500 N/A (c) 12 None
Total 34,800 26,250 27,040
(a) Not available – The existing well depth gage is not operational. (b) Scheduled to be replaced with standby power generation. (c) No appreciable drawdown at current pumping rates.

Chapter 3 – Descript ion of Exis t ing System
City of Coeur d’Alene 3-4 2012 Water System Comprehensive Plan Update
F:\Projects\JUB\20-12-015_CdA_2012_Wtr_Sys_Comp_Plan_Update\docs\Report\Comp Plan Update_FINAL.docx
The City has two main operational scenarios–one for high flow, summer months and one for winter months. During winter months, the 4th Street and Honeysuckle wells are used as the primary supplies with the Locust and Landings wells as backups. During the summer months, all wells are utilized as needed. The following paragraphs describe the City’s supply wells. Well logs and corresponding pump curves are included in Appendix C. The City also has a surface water source located adjacent to Tubbs Hill. This supply is currently not used due to the high cost of compliance with the Surface Water Treatment Rule (SWTR). Although these pumps are available in the event of an emergency such as groundwater contamination, they are not considered a viable part of the existing system. This report does not examine their use any further.
3.2.1 Upper Zone Wells The following wells are located in the Upper Pressure Zone and are called to run based on the level in either the Prairie or Industrial standpipes. These wells also supply the General Zone indirectly through pressure-reducing valves between the Upper and General Zones.
3.2.1.1 Atlas Well
The Atlas Well is currently the largest well on the system and has a design flow of 4,000 gallons per minute (gpm); however, during peak periods, this well has produced flows of close to 4,500 gpm. This 600 hp well is used during the summer months when demand is at a peak and the well is needed on a continuous basis. The Atlas Well is controlled by the water level in the Industrial Park Standpipe.
3.2.1.2 Hanley Well
The Hanley Well was constructed in 1991 and at the time was the only well on the Upper Pressure Zone. This pump’s nominal capacity is 3,100 gpm, with peaks of up to 3,500 gpm during the maximum day demand (July 28, 1998) conditions. The Hanley Well is controlled by the Prairie Standpipe. This well has had historical operational challenges, which have forced the pump to be pulled from the well on three separate occasions. Power utility work in the vicinity caused a loss of power, resulting in the pump spinning backwards and shorting out when power was restored. The original submersible pump has since been replaced with a deep well turbine pump. In the 1990s, water quality sampling of this well detected low concentrations of a regulated compound-trichloroethylene (TCE). Samples are pulled every month for water quality to verify that the average TCE concentration over four successive quarters is below the maximum contaminant

Chapter 3 – Descript ion of Exis t ing System
City of Coeur d’Alene 3-5 2012 Water System Comprehensive Plan Update
F:\Projects\JUB\20-12-015_CdA_2012_Wtr_Sys_Comp_Plan_Update\docs\Report\Comp Plan Update_FINAL.docx
level of 5 µg/l. Although individual samples have exceeded 5 µg/l, the average TCE level over four successive quarters has not. Although the exact source of TCE contamination is unknown, some potential sources have been identified and are in the process of being remediated. The Water Department continues to use this well since TCE levels appear to be declining and there are no known health impacts at the low contaminant level. The Hanley Well has also exhibited arsenic levels above the MCL of 10 µg/l. Water quality sampling has found arsenic levels of 1.22 µg/l to 37.00 µg/l. To meet requirements of the Safe Drinking Water Act per a written agreement between the City and IDEQ from July 2008, the City currently blends the Hanley Well water with lower arsenic water and limits operation to the summer months, significantly reducing annual exposure to arsenic.
3.2.1.3 Honeysuckle Well
The Honeysuckle Well was constructed in 1996 and has a current capacity of 1,600 gpm. The well capacity is limited due to its proximity to the aquifer boundary. This well is currently utilized by the Department as the first pump on and the last pump off. It is called to service based on the water level in the Prairie Standpipe.
3.2.1.4 Landings Well
The Landings Well was drilled in 2004 and was test pumped at a flow rate of 3,500 gpm with negligible drawdown. The well currently operates at 3,000 gpm and 512 feet TDH, with no measurable drawdown. The well is controlled based on the water level in the Industrial Standpipe.
3.2.1.5 Prairie Well
The Prairie Well was completed in 1999. The operational conditions for the Prairie Well are 3,500 gpm and 450 feet TDH. This well has a 500 hp motor and is controlled off the level in the Prairie Standpipe.
3.2.1.6 Clayton Well
The City owns one additional well in the Upper Zone. The Clayton Well has historically had elevated arsenic levels that were originally detected at the well test pump after drilling. This well site was not completed based on the arsenic levels and does not have a wellhouse or standard, large horsepower pump. The Kootenai Fairgrounds uses this well for irrigation, and the school district may in the future. It is recommended that the City continue to regularly monitor the arsenic level, as it appears to be decreasing over time.

Chapter 3 – Descript ion of Exis t ing System
City of Coeur d’Alene 3-6 2012 Water System Comprehensive Plan Update
F:\Projects\JUB\20-12-015_CdA_2012_Wtr_Sys_Comp_Plan_Update\docs\Report\Comp Plan Update_FINAL.docx
3.2.2 General Zone Wells The following four supply wells are located in the General Zone:
1. Annie Well 2. 4th Street Well 3. Linden Well 4. Locust Well
All four wells are controlled based on the level of the Tubbs Hill Reservoir.
3.2.2.1 Annie Well
The Annie Well was drilled in 2004 and originally test pumped at 2,500 gpm, with 93 feet of drawdown. Additional well development raised production to 2,500 gpm at 12 feet of drawdown. Since its original construction, the well has been re-developed using hydropulse to improve production. The Annie Well’s production zone is relatively fine material that has produced elevated arsenic levels. The average arsenic level for the well is less than the MCL of 10 ppb. Operation of this well is based on a 2008 written agreement with IDEQ.
3.2.2.2 4th Street Well
The 4th Street Well was originally hand dug and wood-lined. This well is currently designed to provide 3,000 gpm of flow at 360 feet of head. Because this well historically has produced some sand, a series of pressure tanks is installed on the discharge that serve as sand traps. This well was also re-developed using Johnson well screens to help eliminate the sand problem. The original design for this well utilized a 2,200 gpm well pump. The total capacity was increased to 3,000 gpm when the pump was replaced in 2007. This well has historically had problems at high flows rates when the well began to pull air into the well, creating taste and odor problems. This air entrainment was partially caused by cascading upper aquifer. A packer was installed to block out the upper aquifer in 1993 to help with the entrainment and taste and odor problems. The packer is no longer in use, and air entrainment, taste, and odor do not appear to be problems.
3.2.2.3 Linden Well
The current Linden Well pump was installed in 1966 and had a design capacity of 3,100 gpm based on the original pump curve. The current pump in the Linden Well provides 2,800 gallons per minute at 310 feet of head. There are no reported issues with this well.

Chapter 3 – Descript ion of Exis t ing System
City of Coeur d’Alene 3-7 2012 Water System Comprehensive Plan Update
F:\Projects\JUB\20-12-015_CdA_2012_Wtr_Sys_Comp_Plan_Update\docs\Report\Comp Plan Update_FINAL.docx
3.2.2.4 Locust Well
The Locust Well currently has a capacity of 3,000 gpm at 349 feet of discharge head. Originally hand·dug in 1955, the well was expanded in 1968 and most recently in 1990. This well has been one of the system's most reliable producers.
3.2.3 Existing Water Rights The City currently has a total of 52.4 cfs in claimed groundwater rights and 27.07 cfs in claimed surface water rights. A summary of the rights and their priority dates is included in Table 3-2.
Table 3-2 – Summary of Water Rights (a)
Right Number Priority Amount
(cfs) Nature of Use Period of Use 95-2111 04/20/1955 3.00 Municipal 1/1 to 12/31
95-2133 07/21/1960 2.27 Municipal 1/1 to 12/31
95-2164 10/03/1964 3.61 Municipal 3/15 to 11/15
95-2198 12/13/1966 5.12 Municipal 1/1 to 12/31
95-7142 05/03/1971 2.45 Municipal 1/1 to 12/31
95-7181 03/14/1972 5.73 Municipal 1/1 to 12/31
95-8565 12/07/1987 7.55 Municipal 1/1 to 12/31
95-8647 03/19/1990 7.30 Municipal 1/1 to 12/31
95-8672 08/27/1990 3.00 Municipal 1/1 to 12/31
95-8938 02/08/1996 4.57 Municipal 1/1 to 12/31
95-9007 01/25/1999 7.80 Municipal 1/1 to 12/31
Total 52.4 (a) The City's rights have been consolidated as municipal water rights and apply to the system as a whole.
3.3 Existing Storage The purpose of water storage in the City is to provide for flow equalization and stabilization of pressures throughout the course of the day as well as to store water for fire flow demands. Tanks also provide emergency storage to alleviate water shortages during water supply interruptions due to mechanical or electrical problems with the existing wells. Six tanks provide storage for the City of Coeur d’Alene. The total storage capacity of these tanks is 9.2 million gallons. However, because the Prairie and Industrial Park standpipes each have approximately 1.0 mg of storage that is too low to provide adequate pressure, the actual usable storage is 7.1 MG. Table 3-3 presents characteristics of each of the storage tanks.

Chapter 3 – Descript ion of Exis t ing System
City of Coeur d’Alene 3-8 2012 Water System Comprehensive Plan Update
F:\Projects\JUB\20-12-015_CdA_2012_Wtr_Sys_Comp_Plan_Update\docs\Report\Comp Plan Update_FINAL.docx
Table 3-3 – Summary of Existing Storage
Storage Tank Capacity
(MG)
Operating Characteristics Overflow Elevation
(MSL) Height (feet) Pressure Zone Type of Tank
1. Best Hill 2.0 2,355.35 31.85 General Ground Level (steel) 2. Tubbs Hill 2.0
1.0 2,355.35 2,355.35
24 24
General General
Ground Level (concrete) Ground Level (steel)
3. Prairie Standpipe 2.0 2,430.5 156.5 Upper Standpipe (steel) 4. Industrial Standpipe 2.0 2,430.50 160 Upper Standpipe (steel) 5. Stanley Hill 0.2 2,540.22 31 Stanley Ground Level (steel) 6. Blackwell Hill 0.012 2,400 (a) 10 Blackwell Ground Level (concrete) 7. Armstrong Park 0.16 2,882 (a) 32 Armstrong Park Ground Level (steel)
(a) Approximate elevation
3.3.1 Best Hill Tank The Best Hill Tank is located in the General Zone on the eastern side of the City and is connected via a 16-inch pipe to the water main in Fifteenth Avenue. This tank was constructed in 1971 and has a nominal capacity of 2 million gallons. The Best Hill Tank water levels typically do not track with the levels in the Tubbs Hill Tanks. Since the Best Hill and Tubbs Hill Tanks are on the same pressure zone, they should “float” at approximately the same level. However, the Best Hill Tank consistently has higher water surface elevation than that of the Tubbs Hill Tanks during peak demands. According to the Water Department, the Best Hill Tank will drop only 6 feet of water elevation when the Tubbs Hill Tank drops 10 feet. Pressure data taken in the vicinity of the Best Hill Tank indicate the system pressures adjacent to this tank are frequently higher than the altitude valve setting on the tank. Based on the tank’s proximity to three major wells (the Linden Well, the Locust Well, and the 4th Street Well), the hydraulic grade is higher at the Best Hill Tank than at the Tubbs Hill Tanks. This results in higher water levels in the Best Hill Tank. Currently, the Best Hill Tank drains most rapidly when the Elm Street Booster is running at maximum capacity. However, this occurs only during maximum day demand. Based on existing system hydraulics, it is unlikely that the Best Hill Tank will function as expected until additional development occurs adjacent to the tank with a higher water demand or changes occur in the distribution piping. The primary concern with the slow tank draining is the potential for water stagnation leading to poor water quality. Water quality testing conducted by City staff has not indicated any increase in
Chapter 3 – Descript ion of Exis t ing System
City of Coeur d’Alene 3-9 2012 Water System Comprehensive Plan Update
F:\Projects\JUB\20-12-015_CdA_2012_Wtr_Sys_Comp_Plan_Update\docs\Report\Comp Plan Update_FINAL.docx
coliform bacteria present or decrease in distribution system chlorine residual on 15th Street. As a result, the slow draining during peak events appears to be primarily an operational issue rather than a potential public health issue.
3.3.2 Tubbs Hill Storage The Tubbs Hill storage system is located in the General Zone and consists of one 2.0 MG concrete tank and one 1.0 MG welded steel tank. The tanks are located on Tubbs Hill in the southern portion of town adjacent to the central business district. They supply a majority of the storage for the General Pressure Zone. The concrete tank is a post-tensioned pre-cast concrete tank and was constructed in 2004. The telemetry for the General Zone is located on this tank. The second Tubbs Hill Tank is a 1 MG steel tank on a concrete foundation constructed in 1948. This tank had a sizeable leak in the base, estimated at approximately 10 to 15 gpm, between the concrete base and tank walls where the existing caulking has failed. The City cut and patched the bottom portion of the tank to weld a steel base to the bottom of the tank in 2004, eliminating the leakage.
3.3.3 Prairie Standpipe The Prairie Standpipe is a 2 MG, 160-foot-tall steel standpipe located in the Upper Zone. This standpipe was constructed in 1992 and primarily supplies water to the Upper Zone but is able to provide the General Pressure Zone through the system PRVs. The tank is located at the northern boundary of the City. The tank is in excellent condition and has had no reported problems since being placed on line. A pressure transducer located at the base of this tank controls pump starts in the High Pressure Zone for the Honeysuckle, Hanley, and Prairie Wells.
3.3.4 Industrial Standpipe The Industrial Standpipe is 160 feet tall and holds 2 million gallons. It is a steel standpipe located on the Upper Pressure Zone. This standpipe was constructed in 1999 and supplies water to the Upper Zone, which can supply the General Pressure Zone via pressure-reducing valves. The tank is located at the northwest boundary of the City. The tank is in excellent condition and has had no reported problems since being placed on line.

Chapter 3 – Descript ion of Exis t ing System
City of Coeur d’Alene 3-10 2012 Water System Comprehensive Plan Update
F:\Projects\JUB\20-12-015_CdA_2012_Wtr_Sys_Comp_Plan_Update\docs\Report\Comp Plan Update_FINAL.docx
A pressure transducer located at the base of this tank controls pump starts in the Upper Pressure Zone. The level in this standpipe is the control variable that calls the Landings and the Atlas Wells to run.
3.3.5 Stanley Hill Tank The Stanley Hill Tank is a 200,000-gallon steel tank that serves the Stanley Hill High Pressure Zone. This tank is located east of the Best Hill Tank. There have been no reported problems with operation of this tank. Access to the tank is difficult. The current approach is through a local farm under agreement with the landowner. The City has no formal easement allowing access to the tank except for the pipeline easement that is impassible by vehicles.
3.3.6 Blackwell Hill Tank The Blackwell Hill Tank is a 12,000-gallon tank located at the top of Blackwell Hill. The tank is rectangular in shape and constructed of cast-in-place concrete. The tank is fed by the Blackwell Booster Station at the bottom of the hill and an intermediate in-line booster, which is currently off line. The Blackwell Hill Tank contains a small booster station that feeds the residents at the top of the system. The tank contains no telemetry back to the booster pumps. Filling of the tank is accomplished through use of a mechanical float valve that opens to allow water to fill the tank and closes when the tank is full. This tank is used as working volume for the residents at the top of the hill and is not available for use by any of the residents below the tank.
3.3.7 Nettleton Gulch Tank The Nettleton Gulch Tank is an 18,000-gallon tank, which is currently off line and has no telemetry. It was removed from service when the Best Hill Tank was constructed and is not in a usable condition. However, its site elevations are compatible with other tanks and may present a potential site for a future tank to serve either the Upper or General Zone.
3.4 Booster Pump Stations The City system currently has four booster pump stations. Table 3-4 summarizes these existing booster stations and their capacities.

Chapter 3 – Descript ion of Exis t ing System
City of Coeur d’Alene 3-11 2012 Water System Comprehensive Plan Update
F:\Projects\JUB\20-12-015_CdA_2012_Wtr_Sys_Comp_Plan_Update\docs\Report\Comp Plan Update_FINAL.docx
Table 3-4 – Summary of Existing Booster Pump Stations
Booster Station
Operating Characteristics
Notes Suction Pressure
Zone Discharge Pressure
Zone Pump
No. HP Capacity
(gpm) TDH (a)
(ft)
1. Elm Street General Stanley 1 2 3
20 50 20
200 500 200
230 230 230
2. Blackwell Hill – Lower (b)
Blackwell Hill - Upper General Blackwell 1
2 20 20
90 120
3. Tubbs Hill General Tubbs Hill 1 2 3
1.5 1.5 1.5
30 30 30
158 158 158
4. Armstrong Park Lower Armstrong Park 1 2
50 50
220 220
560 560
(a) Total dynamic head based on nameplate and original pump curve information. (b) Pump TDH not available for Blackwell Hill Boosters.

Chapter 3 – Descript ion of Exis t ing System
City of Coeur d’Alene 3-12 2012 Water System Comprehensive Plan Update
F:\Projects\JUB\20-12-015_CdA_2012_Wtr_Sys_Comp_Plan_Update\docs\Report\Comp Plan Update_FINAL.docx
3.4.1 Elm Street Booster Station The Elm Street Booster Pump Station consists of two 20 hp, 200 gpm centrifugal booster pump and one 50 hp, 500 gpm centrifugal booster pump manufactured by Byron Jackson. This booster pump station is controlled by levels in the Stanley Hill Tank and serves the Stanley Hill High Pressure Zone. During peak demands, the 20 hp and 50 hp pumps are called to run simultaneously. The design points on the 20 hp and 50 hp pumps have significantly different discharge heads. The 200 gpm pumps have a design head of 230 feet while the 500 gpm pump has a design head of 280 feet. Based on existing SCADA data, the 200 gpm boosters are operating near their shutoff head and discharging very low flows while the 500 gpm booster is operating. Running the 200 gpm booster close to its shutoff head creates premature pump wear and is inefficient.
3.4.2 Blackwell Hill Booster System The Blackwell Hill system was obtained from the Hayden Pines Water Company in 1993 and consists of three booster stations. The lower station has one 90 gpm booster pump and two 120 gpm booster pump. The middle station has a single pump that pumps water to the storage tank at the top of Blackwell Hill. The upper station has two pumps used to fill six pressure tanks to maintain pressure for the five users. Responding to complaints of pressure surges caused by starting and stopping these boosters, the Water Department now operates the smaller pump continuously. During periods of low demand, the pump recirculates water. Although not efficient, this has reduced the number of customer complaints. This system has no usable storage, so the booster pumps are vital for providing water to this system; however, the power supply at the station is adequate to run both larger pumps at one time to provide the required demand. Currently, the boosters are operated solely on system pressure. As noted, the middle booster has no reliability because it utilizes only a single pump. This pump is required only in times of high usage, but in the event of pump failure, residents on the Upper System would need to rely on storage in the Upper Tank until the pump could be replaced.
3.4.3 Tubbs Hill Booster Station The Tubbs Hill Booster Station was replaced in 2004 and includes three 1.5 hp, 30 gpm pumps. The TDH of the pumps at 30 gpm is 158 feet. This station provides service to seven connections located above the service elevations of the Tubbs Hill Tanks.

Chapter 3 – Descript ion of Exis t ing System
City of Coeur d’Alene 3-13 2012 Water System Comprehensive Plan Update
F:\Projects\JUB\20-12-015_CdA_2012_Wtr_Sys_Comp_Plan_Update\docs\Report\Comp Plan Update_FINAL.docx
3.4.4 Armstrong Park Booster Station In 2008, the City replaced the below-grade Armstrong Park Booster Station with a more accessible at-grade facility. The station currently has two 50 hp pumps that pump 220 gpm each and has provisions for a third pump in the future. The flow from the pumps goes directly to a 160,000-gallon storage tank and supplies water to 75 users. The station is designed to supply flow to approximately 150 total connections with the current 2-pump configuration. The pump suction pressure at the station is very low (<20 psi) due to elevation and suction pipe size (6 inches). Provisions for boosting chlorine residual are included in the station but are not currently used.
3.5 Existing Distribution System
3.5.1 Pressure Zones The distribution system, as shown on Figure 3-1, consists of six pressure zones. The purpose of each zone is to maintain working pressures between 50 and 80 psi. The pressure zones are serviced by a combination of wells, water tanks, booster stations, and pressure reducing valves (PRVs). Figure 3-2 shows the six existing zones and one recommended future pressure zone. The two largest pressure zones (the Upper Zone and the General Zone) contain all of the City wells. The four existing booster zones (Stanley Hill, Armstrong Park, Blackwell Hill, and Tubbs Hill) are all supplied by booster pump stations fed from the General Zone.


Chapter 3 – Descript ion of Exis t ing System
City of Coeur d’Alene 3-15 2012 Water System Comprehensive Plan Update
F:\Projects\JUB\20-12-015_CdA_2012_Wtr_Sys_Comp_Plan_Update\docs\Report\Comp Plan Update_FINAL.docx
The Upper Pressure Zone is able to provide water to the General Zone via PRVs to control downstream pressure. The identified connections are summarized in Table 3-5:
Table 3-5 – Pressure Reducing Valves
3.5.2 Pipe Network The City owns and maintains approximately 296 miles of water distribution pipe and transmission mains. Pipe sizes and materials range greatly from 1-inch distribution pipe to 24-inch transmission mains. Transmission mains include 16-inch to 24-inch ductile iron and PVC pipes that route water from wells and storage reservoirs into the distribution system. The distribution system is generally comprised of 10-inch to 12-inch pipes installed in a ½ mile grid, with smaller 8-inch and 6-inch lines providing service to patrons. Pipes smaller than 6 inches remain in service within the system; however, City policy now requires replacement to a minimum of 8-inch PVC. Less than 5 percent of the total system piping is smaller than 6 inches, and 2.8 percent of the total is 4 inches. A summary of these sizes and materials within the system is provided in Table 3-6. Typically, different pipe materials can be dated back to specific periods depending on available material and the City’s preferences at the time.
Name Location Size
(Inches) PRV-1 Abandoned ---
PRV-2 Abandoned ---
PRV-3 Blackwell Hill 8
PRV-4 Atlantic Drive 8
PRV-5 Atlas Road 12
PRV-7 Huetter Road 12
PRV-8 15th 6
PRV-9 Kathleen 6
PRV-10 Costco 6
PRV-11 Appleway 6

Chapter 3 – Descript ion of Exis t ing System
City of Coeur d’Alene 3-16 2012 Water System Comprehensive Plan Update
F:\Projects\JUB\20-12-015_CdA_2012_Wtr_Sys_Comp_Plan_Update\docs\Report\Comp Plan Update_FINAL.docx
Table 3-6 – Pipe Summary (a)
Material Pipe Length Diameter
Total < 6" 6" 8" 10" 12" 14" 16" 18" 20" 24"
(miles) (miles) (miles) (miles) (miles) (miles) (miles) (miles) (miles) (miles) (miles)
AC 5.7 52.3 25.5 2.2 19.8 0.6 1.1 107.2 Ductile 0.2 1.4 0.2 1.2 0.2 0.1 0.1 0.7 3.3 7.4 Galvanized 3.5 3.5 PVC 1.6 28.0 86.0 4.8 44.3 2.8 0.2 167.7 Steel 2.0 1.9 0.3
4.2 Other 2.4 2.3 0.3 0.8 5.8
Total 15.4 85.9 112.3 7.0 66.1 0.8 4.0 0.3 0.7 3.3 295.8
(a) Pipe material, length, and sizes were generated from the City’s GIS water system database as of April 2012.

Water Supply Evaluation

Chapter 4 – Water Supp ly Eva luat ion
City of Coeur d’Alene 4-1 2012 Water System Comprehensive Plan Update
F:\Projects\JUB\20-12-015_CdA_2012_Wtr_Sys_Comp_Plan_Update\docs\Report\Comp Plan Update_FINAL.docx
4.1 Introduction This chapter addresses the system’s ability to match demand requirements with supply. Generally, the system must be able to supply enough water to meet the maximum daily demand (MDD). The supply to each by zone must also meet the MDD with the largest source out of operation for that zone. This Comprehensive Plan Update defines the worst case as the Atlas Well out of service because it is the largest single source of supply and it serves both the Upper and General Zones.
4.2 Existing Supply Requirements The existing water system must be able to supply enough water to meet the current system-wide MDD of 32.2 mgd (22,400 gpm). The total pumping capacity with all wells on line is 38.0 mgd (28,200 gpm). Evaluating the system under the worst case (as defined above) with the Atlas Well out of operation results in a current firm pumping capacity of 32.3 mgd (23,200 gpm). Therefore, the existing City-wide water supply meets the current MDD. The existing supply capacity is summarized in Table 4-1 for comparison with the existing MDD for both the Upper and the General Zones.
Table 4-1 – Existing Supply Requirements
Maximum Day
Demand Current Supply Capacity Reliable Capacity
Largest Pump Off Line (b) City Total 32.2 mgd (22,400 gpm) (a) 38.0 mgd (26,400 gpm) 32.3 mgd (23,200 gpm)
Upper Zone 16.2 mgd (11,200 gpm) 22.2 mgd (15,400 gpm) 16.5 mgd (11,400 gpm)
General Zone 14.8 mgd (10,300 gpm) 15.8 mgd (11,000 gpm) 15.8 mgd (11,000 gpm)
(a) Maximum Day Demand based on Summer, 2011. (b) Atlas Well is assumed off line for both the Upper and General Zones.
All of the City supply is located in the Upper and General Pressure Zones. The Upper Zone can be fed only from wells in the Upper Zone and has a current capacity of 22.2 mgd (15,400 gpm). The General Zone has an available supply of 15.8 mgd (11,000 gpm) and can be fed from wells located in either zone. This analysis assumes that the two zones are independent; however, the ability to feed from the Upper Zone to the General Zone does provide some system flexibility. The three existing boosted zones (Blackwell Hill, Stanley Hill, and Armstrong Park) as well as the future Fernan Hill Zone are all fed from the General Zone. The complete discussion on the future requirements for these zones is

Chapter 4 – Water Supp ly Eva luat ion
City of Coeur d’Alene 4-2 2012 Water System Comprehensive Plan Update
F:\Projects\JUB\20-12-015_CdA_2012_Wtr_Sys_Comp_Plan_Update\docs\Report\Comp Plan Update_FINAL.docx
included in Chapter 6. The supply available in the Upper Zone and the General Zone is adequate to meet the current MDD requirements; however, as the service population increases, additional supply will be necessary.
4.3 Future Supply Requirements Water system growth will require additional supply sources as development occurs. The year-over-year growth rate assumption approximates a build-out supply requirement of 43.6 mgd (30,300 gpm) MDD occurring between 2026 and 2032. Table 4-2 summarizes projected supply requirements for 2017, 2022, and build-out of the system as detailed in previous chapters. Based on current projections, build-out of the system could occur as early as 2026. However, actual system demands should be used to program future upgrades at the times they are required.
Table 4-2 – Future Supply Requirements for Planning Period
Year
Average Day Demand
(mgd)
Average Day Demand
(gpm)
Maximum Day Demand
(mgd)
Maximum Day Demand
(gpm) 2017 11.5 8,000 36.5 25,300 2022 12.7 8,900 40.3 28,000 Build-Out 13.8 9,600 43.6 30,300
As shown, the projected maximum day demand for the planning boundary is 43.6 mgd. As a minimum, this firm supply capacity must be met. In addition, supply can help meet peak demands, reducing the total amount of storage required. Balancing supply and storage to meet both minimum storage criteria and peak system demands results in a total recommended firm supply of 51.7 mgd. Four additional sources of supply are required to meet the increased demand and reliability criteria. Supply from one additional well and additional capacity from an existing well are required in the Upper Zone as well as two new wells in the General Zone to meet this demand. Each future well source is assumed to have a capacity of 4,000 gallons per minute. Figure 4-1 and Figure 4-2 provide a visual comparison of water system demand and firm capacity for both the Upper and General Zones. These figures also demonstrate the relationship between supply and storage. The triggers for adding supply to the system occur when the firm capacity nears the MDD or when the required storage reaches the available storage. Table 4-3 shows the approximate years in which a new well source should be added to the City’s supply system.

Chapter 4 – Water Supp ly Eva luat ion
City of Coeur d’Alene 4-3 2012 Water System Comprehensive Plan Update
F:\Projects\JUB\20-12-015_CdA_2012_Wtr_Sys_Comp_Plan_Update\docs\Report\Comp Plan Update_FINAL.docx
Figure 4-1 – Storage and Capacity Requirements-Upper Zone
Figure 4-2 – Storage and Capacity Requirements-General Zone

Chapter 4 – Water Supp ly Eva luat ion
City of Coeur d’Alene 4-4 2012 Water System Comprehensive Plan Update
F:\Projects\JUB\20-12-015_CdA_2012_Wtr_Sys_Comp_Plan_Update\docs\Report\Comp Plan Update_FINAL.docx
Table 4-3 – Future Supply Trigger Flow Requirements
Need Additional Supply
(gpm) Estimated Year (a) Maximum Daily Demand Trigger Upper Zone Supply 4,000 2013 11,400 gpm in Upper Zone
General Zone Supply 4,000 2017 12,500 gpm in General Zone
Upper Zone Supply 1,500 2020 12,000 gpm in Upper Zone
General Zone Supply 4,000 2022 14,300 gpm in General Zone
(a) Year is approximate based on projected growth rate.
Although Table 4-3 gives estimated years for increasing water supply, new well sources should be added to the system before listed MDD conditions occur. The table provides trigger flows for each zone when additional supply is required. If the MDD increases at a rate that is greater than expected, an additional well should be on line when the demand reaches the limits listed in Table 4-3, regardless of the year.
4.4 Boosted Pressure Zones Supply Requirements
4.4.1 Stanley Hill Zone Elm Street Booster Station The Stanley Hill Zone is supplied by the Elm Street Booster Station and includes the Stanley Hill area in addition to the Fernan area. The long-term plan for the City is to improve pressures in the higher elevations in Fernan Hill by dividing these areas into two separate pressure zones. The Stanley Hill Zone has a current MDD of 577 gpm and a build-out MDD of 762 gpm. The firm capacity of the existing Elm Street Station (418 gpm) is less than the MDD, making the station vulnerable to supply problems. Table 4-4 summarizes the anticipated demands for this zone.
Table 4-4 – Elm Street Booster Station Demands
Year ADD
(MGD) MDD
(MGD) Required Firm System Capacity
(MGD) 2012 0.26 0.83 0.60
2017 (a) 0.22 0.69 0.69
2022 0.29 0.92 0.92
Build-Out 0.35 1.10 1.10
(a) Assumes Fernan Hill Zone served by new Fernan Pump Station
The supply and storage analysis is presented on Figure 4-3.

Chapter 4 – Water Supp ly Eva luat ion
City of Coeur d’Alene 4-5 2012 Water System Comprehensive Plan Update
F:\Projects\JUB\20-12-015_CdA_2012_Wtr_Sys_Comp_Plan_Update\docs\Report\Comp Plan Update_FINAL.docx
4.4.2 Fernan Hill Zone The Fernan Hill Zone is currently part of the Stanley Hill Zone and is supplied by the Elm Street Booster Station. The higher elevations in this area currently have very low system pressures. Splitting these two zones will allow the City to adjust pressures in the area. Low elevation areas will be supplied by the General Zone, and the elevated areas will be divided along French Gulch Road (see Appendix D for more detail). Table 4-5 summarizes the anticipated demands for this zone.
Table 4-5 – Fernan Hill Booster Station
Year ADD
(MGD) MDD
(MGD) Required Firm System Capacity
(MGD) 2012 --- --- ---
2017 0.22 0.69 0.69
2022 0.29 0.92 0.92
Build-Out 0.35 1.10 1.10
The balance of the supply and storage for the zone is demonstrated on Figure 4-4.
Figure 4-3 – Supply and Capacity Requirements-Stanley Hill Zone

Chapter 4 – Water Supp ly Eva luat ion
City of Coeur d’Alene 4-6 2012 Water System Comprehensive Plan Update
F:\Projects\JUB\20-12-015_CdA_2012_Wtr_Sys_Comp_Plan_Update\docs\Report\Comp Plan Update_FINAL.docx
Figure 4-4 – Storage and Capacity Requirements-Fernan Hill Zone
4.4.3 Armstrong Park Zone The existing Armstrong Park Station has two 220 gpm pumps with room for a third pump. The existing demand for this zone is 180 gpm. When this demand approaches 220 gpm, the third pump will need to be added. A summary of the anticipated demands for this zone is included in Table 4-6.
Table 4-6 – Armstrong Park Booster Station
Year ADD
(MGD) MDD
(MGD) Required Firm System Capacity
(MGD) 2012 0.08 0.26 0.32
2017 0.12 0.37 0.63
2022 0.14 0.46 0.63
Build-Out 0.17 0.53 0.63
The supply and storage analysis is demonstrated on Figure 4-5. The storage requirements will be discussed further in Chapter 5.

Chapter 4 – Water Supp ly Eva luat ion
City of Coeur d’Alene 4-7 2012 Water System Comprehensive Plan Update
F:\Projects\JUB\20-12-015_CdA_2012_Wtr_Sys_Comp_Plan_Update\docs\Report\Comp Plan Update_FINAL.docx
4.4.4 Blackwell Hill Zone The current demand for the Blackwell Hill service area is 55 gpm and the firm capacity of the lower station is 80 gpm. The build-out demand for this zone is 618 gpm, which could be met by increasing the capacity in multiple upgrades as the area develops. A summary of the anticipated demands for this zone is included in Table 4-7.
Table 4-7 – Blackwell Hill Booster Station
Year ADD
(MGD) MDD
(MGD) Firm System Capacity
(MGD) 2012 0.02 0.08 0.30
2017 0.13 0.40 0.59
2022 0.21 0.67 0.89
Build-Out 0.28 0.89 0.89
Figure 4-5 – Storage and Capacity Requirements-Armstrong Park Zone

Chapter 4 – Water Supp ly Eva luat ion
City of Coeur d’Alene 4-8 2012 Water System Comprehensive Plan Update
F:\Projects\JUB\20-12-015_CdA_2012_Wtr_Sys_Comp_Plan_Update\docs\Report\Comp Plan Update_FINAL.docx
Balancing the storage and supply will be critical for providing adequate emergency supply and fire storage. This balance is shown on Figure 4-6.
Figure 4-6 – Storage and Capacity Requirements-Blackwell Hill Zone
4.5 Water Supply Recommendations by Pressure Zone
4.5.1 Existing Wells The existing nine wells have been constructed over the life of the water system and while they are in good condition for the most part, there are a number of improvement and maintenance projects that will be required. A summary for each well is included below. Upper Pressure Zone Table 4-8 includes a summary of the casing sizes and current capacity of the Upper Zone wells. The Atlas Well has a right angle drive that will be replaced with a standby electric generator, at which time a soft start will also be added to the systems. The fuel containment area will be removed to make room for a portable generator and expansion of the chlorine room to improve access for onsite sodium hypochlorite generation.

Chapter 4 – Water Supp ly Eva luat ion
City of Coeur d’Alene 4-9 2012 Water System Comprehensive Plan Update
F:\Projects\JUB\20-12-015_CdA_2012_Wtr_Sys_Comp_Plan_Update\docs\Report\Comp Plan Update_FINAL.docx
Table 4-8 – Upper Zone Wells Casing Size (in) Capacity (gpm) Drawdown
Atlas 24 4,000 <1'
Landings 24 3,000 <1'
Prairie 24 3,200 <1'
Both Landings and Prairie Wells have 24-inch casing and the potential for increasing capacity. Increasing the capacity in these wells would involve upsizing electrical components and pumps. An additional 1,500 gpm will be required in the Upper Zone near 2020. It is recommended that this be completed by increasing the capacity of both the Landings and Prairie Wells by 750 gpm. The operation of these wells at the higher flow rates will create an area of high pressure due to the relatively close proximity of the two wells. Balancing the operation of these wells to minimize the times they are operating at the same time will help minimize this problem. The power source at the Landings Well has been problematic in the past, with several outages each year. Provisions for a portable generator to power the Landings Well is recommended to increase reliability in the zone. These provisions could be made at the same time as the pump and electrical upgrades to increase the supply. General Pressure Zone A number of the wells in the General Pressure Zone are on smaller lots in highly developed areas. The City would like to procure additional property at the 4th Street and Locust sites. The buildings at 4th Street and Linden also need to be replaced within the next ten years, which would ideally be staged with obtaining additional property. The boosted zones are all supplied from the General Zone. The demand for these zones is a maximum day demand, and it has been assumed that the booster stations will be designed to supply the MDD and the peak hour demand will be supplied by the storage. Stanley Hill Pressure Zone It is recommended that the Stanley Hill and Fernan Zones are split into two zones to better serve these areas. This improvement will require modifications to the Elm Street Booster Station to supply the two separate zones. A detailed discussion of this analysis is included in Appendix D. The demand for the Stanley Hill Zone is anticipated to go from a current day demand of 577 gpm to a future demand of 760 gpm after splitting the two zones. The firm capacity of the pump station will need to meet the 760 gpm demand. Additional boosters will be required to serve development that occurs in the higher elevations of this planned service area.

Chapter 4 – Water Supp ly Eva luat ion
City of Coeur d’Alene 4-10 2012 Water System Comprehensive Plan Update
F:\Projects\JUB\20-12-015_CdA_2012_Wtr_Sys_Comp_Plan_Update\docs\Report\Comp Plan Update_FINAL.docx
Fernan Hill Pressure Zone The Fernan Booster Station will be located on the same property as the Elm Street Station. Build-out MDD for this zone is expected to be 760 gpm. A triplex station is the recommended layout. Specific options for the station configuration are included in Appendix D. This zone will require an additional station near the tank in order to provide higher elevation properties. Armstrong Park Pressure Zone The current demand for this zone is 180 gpm with a firm capacity of 220 gpm. When the demands near 200 gpm, it is recommended that the third pump be installed at the booster station. This third pump will provide a firm capacity of 440 gpm, which will supply the planned service area demand of 370 gpm. Blackwell Hill Pressure Zone Blackwell Hill has some significant areas within the planning boundary that can be developed over a range of elevations. The final build-out will require several booster stations or PRVs to service this area. A more detailed discussion of this area is included in Appendix E. The current demands of 55 gpm are met by the pumps. Replacement of the station will be required to meet future demands. Additional booster stations will be required to serve upper elevations of this zone.
4.5.2 New Wells Water supply recommendations include installing one new well in 2013 to meet demand and storage requirements. The well should be installed in the Upper Zone to meet the system demands. Placement of future wells will need to take place on the western edge of the City where the aquifer is productive and water quality is best. Building and improving the pipe network to supply the water from the western side of town to the expected areas of growth in the areas east and south of the City will be critical in providing adequate pressures and flow. Figure 4-7 shows proposed locations of the new wells. A total of four new wells will be required to serve the system’s projected build-out (two within the next ten years). Verification of site requirements with IDEQ should be completed prior to final selection of future well sites.


Chapter 4 – Water Supp ly Eva luat ion
City of Coeur d’Alene 4-12 2012 Water System Comprehensive Plan Update
F:\Projects\JUB\20-12-015_CdA_2012_Wtr_Sys_Comp_Plan_Update\docs\Report\Comp Plan Update_FINAL.docx
4.6 Proposed Well Locations There are four supply recommendations for the City. Three of these recommendations are new wells with anticipated capacities of 4,000 gpm. The first well is scheduled to begin construction in 2013. This well project (S-1) will be located north of Hanley and east of Atlas, as shown on Figure 4-3. This well will tie into the 16-inch main on Atlas. The second supply upgrade recommendation is Project S-2 and is a 4,000 gpm well. The recommended location for this well is east of Huetter and south of Kathleen. This well will supply water to the General Zone. Project S-3 includes upgrading two existing wells in the Upper Zone to add 1,500 gpm to the supply. It is recommended that both the Landings and Prairie Wells be upsized to increase flow 750 gpm. This will require upgrading the MCCs and replacing the existing pumps. The fourth project, S-4, will supply water to the General Zone. The recommended location for this well is near that of S-3, east of Huetter and south of Kathleen. This location will allow the well to be easily connected to both the Upper Zone and the General Zone, improving the reliability of the overall system. Should the property locations not become available, an alternate location for Project S-2 or S-4 is the area west of Ramsey and south of Wilbur. This is an area where good water quality is expected and property is likely available. There are a few drawbacks to this location, including the proximity of this location to the General Zone. This location would place a large percentage of the supply wells in the northwest quadrant of the City, requiring more distribution system upgrades to provide southern portions of the City. The other complication to adding another supply to this portion of the City is the creation of high pressure areas, especially if multiple wells are pumping at the same time. This location would require careful programming to alternate operation of the Prairie Well, Landings Well, new well on Atlas (S-1), and new well on Ramsey (S-3).
4.7 Ultimate Demand and Water Rights The projected MDD for the City at build-out is 43.6 mgd (30,300 gpm), as shown in Table 4-1. The immediate demand requirement at that time must actually exceed 51.7 mgd (35,900 gpm) in order to meet peak hour demands. This capacity is achievable by adding three 4,000 gpm wells as well as an additional 1,500 gpm at existing wells to the current firm supply. Criteria dictate that new sources are installed prior to the MDD reaching the City’s firm supply (i.e., total supply with the

Chapter 4 – Water Supp ly Eva luat ion
City of Coeur d’Alene 4-13 2012 Water System Comprehensive Plan Update
F:\Projects\JUB\20-12-015_CdA_2012_Wtr_Sys_Comp_Plan_Update\docs\Report\Comp Plan Update_FINAL.docx
largest source out of service). These criteria will also limit the equalization storage requirements and take advantage of more cost-effective aquifer storage. Based on existing total water rights of 52.4 cfs (33.9 mgd), the City will need a minimum additional instantaneous water right of 27.53 cfs (17.8 mgd), for a total of 79.9 cfs (51.7 mgd). The annual required withdrawal is projected to be 5,037 MG during the current planning period. Additional rights will be required to meet the projected reliable water supply requirement of 79.99 cfs (51.7 mgd). Those rights should be obtained through rights transfers when land with existing rights is annexed into the City and through new water rights applications. New rights should be sought under Idaho Department of Water Resources Reasonably Anticipated Future Needs (RAFN) procedures using this Comprehensive Plan as a basis for the filing. That application should be made within the next five years. Issues related to long-term aquifer capacity are beyond the planning period and beyond the scope of this study. However, aquifer management is inextricably tied to long-range water system planning and operations for all the regional communities relying on the Rathdrum Prairie Aquifer. The City has long been active in aquifer management through membership on IDWR’s Groundwater Management Plan Technical Advisory Committee, Kootenai County’s Aquifer Protection District, and IDWR’s Comprehensive Aquifer Management Plan (CAMP). Continued proactive participation with other water systems, IDEQ, IDWR, and other local municipalities, including Spokane, should help protect the City's rights to adequate water supply.
4.8 Telemetry The current SCADA system appears to be adequate for well and reservoir control and alarm initiation; however, there has been difficulty in obtaining service for this system. It is recommended that this system be replaced with a program that can provide local service. The SCADA should continue to monitor trend lines of pumping and reservoir data to aid staff in troubleshooting and system optimization as well as when to plan specific system improvements.
4.9 Power Supply and Reliability Avista Utilities and Kootenai Electric Cooperative provide power to the City’s wells. Hanley Well and the Landings Well are currently served by Kootenai Electric Cooperative while Avista provides power to the remaining wells. The City can meet the build-out ADD for all zones if KEC has a catastrophic loss of power. This is not true of a catastrophic failure by Avista. It is recommended

Chapter 4 – Water Supp ly Eva luat ion
City of Coeur d’Alene 4-14 2012 Water System Comprehensive Plan Update
F:\Projects\JUB\20-12-015_CdA_2012_Wtr_Sys_Comp_Plan_Update\docs\Report\Comp Plan Update_FINAL.docx
that provisions be included at a minimum of two wells served by Avista for standby power generation in the case of such emergencies.
4.10 Water Conservation The Spokane Valley-Rathdrum Prairie Aquifer is the largest source of drinking water within our hydrologic area. The City has been implementing conservation methods for several years. A complete discussion of these processes is included in the City's Water Conservation Plan included in Appendix B. Pumping water is becoming more expensive as energy costs continue to rise. The conservation program helps reduce the amount of energy the City uses and extends the estimated times for adding new well sources as well as reduces demands on the aquifer. The City implemented a block water rate structure in 2008 to promote equity in water charges and aid conservation. Reevaluating the commodity charge for water use has been an effective tool for water conservation in many areas and should be reviewed by the City. A complete evaluation of the City's water conservation efforts and impacts is included in Appendix B.
4.11 Capital Costs Table 4-9 presents a summary of budget costs for adding system supply to meet build-out demands.
Table 4-9 – Opinion of Probable Costs-New Supply Project No.
Capital Project
Additional Supply (gpm)
Planned Year
Total Estimated Cost (a)
S-1 New Well 4,000 2013/2014 $1,698,700
S-2 New Well 4,000 2017/2018 $1,698,700
S-3 Additional Supply 1,500 2020 $735,800
S-4 New Well 4,000 2022/2023 $1,698,700
Total $5,831,900.00 (a) All opinions of cost are planning level 2012 dollars. (b) Cost of land acquisition not included since property is generally donated to the City.
These costs are based on data from other wells drilled over the aquifer in Kootenai County. Wells constructed in future years must account for inflation as detailed in Chapters 6 and 7. Capital project budgets planned for improving the existing wellhouses and systems are included in Table 4-10.

Chapter 4 – Water Supp ly Eva luat ion
City of Coeur d’Alene 4-15 2012 Water System Comprehensive Plan Update
F:\Projects\JUB\20-12-015_CdA_2012_Wtr_Sys_Comp_Plan_Update\docs\Report\Comp Plan Update_FINAL.docx
Table 4-10 – Opinion of Probable Cost-Miscellaneous Water Supply Projects Project No. Capital Project Planned Year Capital Cost (a) S-5 Linden – Wellhouse Replacement 2020 $522,700
S-6 4th Street – Wellhouse Replacement 2024 $509,800 S-7 Atlas – System Upgrades 2025 $504,000 S-8 Regular Pump Rehabilitation Biennial $75,000 S-9 Onsite Chlorine Regeneration 2013-2015 $80,000 S-10 Soft Starter Replacement Biennial $75,000 S-11 Transfer Surface Water Rights to
Groundwater Rights 2017 $10,000
S-12 Reasonably Anticipated Future Needs 2014 $25,000 S-13 SCADA Conversion 2013 $35,000
Total $1,836,500.00 (a) All opinions of cost are planning level 2012 dollars.
Capital project budgets for improvements to other pressure zone improvements are included in Table 4-11.
Table 4-11 – Opinion of Probable Cost-Booster Station Upgrades
Project No. Capital Project Planned Year
Total Estimated
Cost (a) B-1 Elm Street – Additional Pump 2015 $185,800
B-2 Elm Street – Additional Pump 2021 $64,800 B-3 Fernan Hill – Split with Stanley 2020 $527,000 B-4 Fernan Booster – Additional Pump 2021 $64,800 B-5 Blackwell Hill – New Station 2018 $527,000 B-6 Blackwell Hill – New Station 2025 $527,000 B-7 Armstrong Park – Additional Pump 2016 $64,800
Total $1,961,200.00
(a) All opinions of cost are planning level 2012 dollars. These opinions of cost are budgetary in nature based on manufacturer’s quotations, similar construction projects, discussions with contractors, standard estimating guides, and engineering judgment.

Chapter 4 – Water Supp ly Eva luat ion
City of Coeur d’Alene 4-16 2012 Water System Comprehensive Plan Update
F:\Projects\JUB\20-12-015_CdA_2012_Wtr_Sys_Comp_Plan_Update\docs\Report\Comp Plan Update_FINAL.docx
Preliminary designs of the improvement projects should be used to refine these budgets and update them for current market conditions as each project moves toward construction.

Water Storage

Chapter 5 – Water Sto rage
City of Coeur d’Alene 5-1 2012 Water System Comprehensive Plan Update
F:\Projects\JUB\20-12-015_CdA_2012_Wtr_Sys_Comp_Plan_Update\docs\Report\Comp Plan Update_FINAL.docx
5.1 Introduction The existing water system has historically required less storage than similarly sized systems due to the high volume of groundwater available. When the system is evaluated by zone, additional storage or supply is required to meet future MDD requirements. The emergency storage normally required in a typical system can continue to be provided by adding groundwater wells equipped with emergency generators. Storage will be provided based on Water Department criteria for MDD equalization, fire protection, and emergency storage. Equalization demands vary greatly depending on available supply and MDD. The total storage requirement in a typical water system includes equalization, fire protection, and emergency storage. Equalization storage is the water volume required to meet peak hourly demands in excess of what the system can supply. It is generally more economical to provide water supply to meet the maximum day demand and storage to supplement the supply during peak usage hours. As noted in Chapter 4, however, the City of Coeur d'Alene can most efficiently meet peak demands through a combination of storage and additional supply. Equalization storage can also be used to decrease power costs by allowing pumps to operate at off-peak power demand periods and avoid excessive pump cycling. Figure 2-2 showed the peak hourly demand of 180 percent of maximum day demand occurs around 5:00 a.m. during a “typical” maximum day. The sums of these peak demands comprise the required equalization storage volume. Fire storage is the volume of water that must be stored in excess of available reliable supply to meet fire demands. The required volume was determined by the water system in conjunction with the local fire officials and building code requirements. The maximum fire demand multiplied by the fire duration within each zone determines the total volume. Table 5-1 lists the fire demand criteria and corresponding storage need.
Table 5-1 – Fire Storage Sizing Criteria
Recommended Fire Demand
(gpm) Fire Duration
(hrs)
Recommended Storage (gallons)
Commercial 3,500 3 630,000 Residential 1,750 2 210,000

Chapter 5 – Water Sto rage
City of Coeur d’Alene 5-2 2012 Water System Comprehensive Plan Update
F:\Projects\JUB\20-12-015_CdA_2012_Wtr_Sys_Comp_Plan_Update\docs\Report\Comp Plan Update_FINAL.docx
Emergency Storage is the additional volume of water stored to meet unexpected events such as power outages. The volume of emergency storage provided by the system is a policy decision by the City. The criteria selected for total storage is to meet equalization and fire storage needs while maintaining 50 percent of total storage in reserve. The total storage volume required is dependent on the supply available. Increased supply meets more of the peak demand, reducing the equalization volume required. Optimizing storage and supply volumes can help keep both capital and operation and maintenance costs down. This section balances supply and storage to achieve the lowest overall system cost.
5.2 Existing and Future Storage Evaluation and Recommendation The following sections discuss existing storage as well as future storage requirements for each zone.
5.2.1 Upper Zone The City’s Upper Zone has 4.0 million gallons (MG) of storage, 2.0 MG of which is available elevated storage evenly divided between the Prairie and Industrial Standpipes. Chapter 4 presented the relationships between the amount of supply available and the storage required. This analysis showed that additional storage will be required to meet the City criteria. In order to meet the storage criteria for the Upper Zone, it is recommended that 1.0 MG of storage be added in the northeast quadrant of the City. The addition of storage in this area provides required storage to meet system criteria and improves the hydraulic balance of the pressure zone. Since the majority of the supply is located on the west side of the Upper Zone, peak hour demands on the east side require significant water transmission across US 95. The east side storage will help to attenuate the peak demands and minimize transmission piping upgrades. There are two potential locations for the 1.0 MG tank. A ground level storage tank near the end of Thomas Lane on the hillside is the option included in the Capital Improvement Plan; however, elevated storage near the Honeysuckle Well would also provide the same benefits to the system. The cost of an elevated tank is greater than a ground level tank; however, the City already owns the Honeysuckle property, so it is estimated that the costs for building on these two locations would be similar. One additional option for emergency storage in the Upper Zone is to add a booster station at the Prairie or Industrial Standpipe that would allow the bottom million gallons of water to be utilized. The addition of a booster station to utilize this volume of water would reduce the overall supply needed for the system. It appears to be more cost effective to build a new supply well and utilize

Chapter 5 – Water Sto rage
City of Coeur d’Alene 5-3 2012 Water System Comprehensive Plan Update
F:\Projects\JUB\20-12-015_CdA_2012_Wtr_Sys_Comp_Plan_Update\docs\Report\Comp Plan Update_FINAL.docx
aquifer storage than to construct an emergency supply booster storage; however, if well sites become difficult to identify due to location or water quality, this may be considered.
5.2.2 General Zone The Tubbs Hill Tanks and Best Hill Tank provide a total of 5.0 MG of usable storage to the General Zone. The existing storage in this zone is adequate for the long term, providing that a new well is brought on line when peak day demands in the area rise above 11,000 gpm as recommended in Chapter 4. As previously described, the addition of an additional supply well keeps the equalization storage volume to a minimum by the supply meeting the peak hour demand. If the zone supply is lower, more storage is required to meet the peaks. By adding new wells in a timely manner, the equalization, fire, and emergency criteria can be maintained until system build-out, as previously illustrated in Figure 4-2. The General Zone storage, while adequate, has hydraulic connectivity problems between the Best Hill Tank and Tubbs Hill Tanks. Due to this, the Tubbs Hill Tanks cycle more regularly than the Best Hill Tank. A large pipeline project was completed in 2001, which significantly improved the situation. Although no problems have been encountered in the past, there are still concerns of water age at the Best Hill Tank, especially during low-use times. No additional storage is recommended for the General Zone. There are several general maintenance projects recommended. The 1.0 MG Tubbs Hill Tank is scheduled for an exterior recoating in 2022, and the Best Hill Tank will require interior and exterior recoating in 2026. The addition of a mixer at the Best Hill Tank may also be considered to improve circulation and reduce concern over water age. The storage analysis assumes that the City will make the recommended supply improvements as described in the previous chapter. If supply improvements are not made when recommended, storage needs will be much higher and could easily exceed available capacity.
5.2.3 Stanley Hill The Stanley Hill Tank has a usable volume of 0.20 MG and supplies the Stanley Hill Zone. Based on the review criteria, the existing service area, and pump capacity at the Elm Street Booster, a total of 1.03 MG, is required. This zone has significant potential future development, so any improvements will likely be tied to system expansion. As noted in Chapter 4, the Stanley Hill Zone is recommended to be divided into a Stanley Hill Zone and a Fernan Hill Zone. Following that division, the recommended storage for the Stanley Hill Zone can be reduced to 0.7 MG.

Chapter 5 – Water Sto rage
City of Coeur d’Alene 5-4 2012 Water System Comprehensive Plan Update
F:\Projects\JUB\20-12-015_CdA_2012_Wtr_Sys_Comp_Plan_Update\docs\Report\Comp Plan Update_FINAL.docx
5.2.4 Fernan Hill The Fernan Hill Zone is currently part of the Stanley Hill Zone. Once these zones are split, the Fernan Hill Zone will be independent and will require storage. The recommended storage for this zone is 0.7 MG. A full analysis of this zone and the division of the two zones is included in Appendix D.
5.2.5 Armstrong Park The Armstrong Park Tank has a current capacity of 0.16 MG, which is less than the current storage criteria of 0.46 MG of storage based on current system demands. It is expected that this area will see some additional development within the planning period, and any improvements in this zone will be driven by development. The recommended total storage for this zone is 0.5 MG and could be completed by adding 0.34 MG of storage to the system.
5.2.6 Blackwell Hill Blackwell Hill currently has only a small storage tank, providing minimal equalization storage to the Upper Pressure Zone. This area is expected by the City to see significant growth in the future, so any system improvements will be tied to system expansion. Assuming a booster pump station is capable of providing a firm capacity equal to the MDD for the zone, a 0.6 MG tank will be required to meet the required conditions at build-out. The Blackwell service area is currently very small, with a plan boundary that is significantly larger. This area is also very steep and will require detailed planning (Appendix E includes a discussion of the pressure zone analysis for this area). The overall storage requirement for the built-out plan area is 0.6 MG and may be supplied by one or several tanks, depending on design. Preliminary cost opinions for this Plan assume one storage tank and several booster stations for this area, all of which are expected to be developer-funded.
5.2.7 Storage Summary Table 5-2 shows the expected storage needs by zone for the water system.

Chapter 5 – Water Sto rage
City of Coeur d’Alene 5-5 2012 Water System Comprehensive Plan Update
F:\Projects\JUB\20-12-015_CdA_2012_Wtr_Sys_Comp_Plan_Update\docs\Report\Comp Plan Update_FINAL.docx
Table 5-2 – Storage Requirements by Zone
Scenario Zone
Equalization Storage (a)
(MG)
Fire Protection Demand
(MG)
Total Min. Storage Required/Available
(MG) Current Requirements
Upper Zone General Zone
Stanley Hill Zone Armstrong Park Zone
Blackwell Hill Zone
1.99 1.53 0.31 0.02 0.00
0.63 0.63 0.21 0.21 0.21
5.25 / 2.0 4.32 / 5.0 1.26 / 0.2
0.46 / 0.16 0.42 / 0.0
Build-Out Requirements
Upper Zone General Zone
Stanley Hill Zone Armstrong Park Zone
Blackwell Hill Zone Fernan Hill Zone
0.82 1.58 0.14 0.04 0.07 0.13
0.63 0.63 0.21 0.21 0.21 0.21
2.89 4.43 0.71 0.50 0.56 0.69
(a) Adequate equalization storage is based on firm pumping capacity exceeding maximum day demand.
5.3 Cost Opinions A summary of the recommended storage projects and potential schedules is included in Table 5-3.
Table 5-3 – Cost Opinions-Storage Recommendation Project No. Project
Anticipated Year of Construction Capital Cost
T-1 Upper Zone Storage – 1.0 MG 2018 $1,631,500
T-2 Stanley Hill Storage – 0.5 MG 2026 $1,016,600
T-3 Blackwell Hill – 0.6 MG 2021 $1,068,500
T-4 Armstrong Park – 0.3 MG 2022 $1,016,600
T-5 Fernan Hill – 0.7 MG 2020 $1,269,900
T-6 Recoating Prairie Standpipe 2014 $233,300
T-7 Recoating Industrial Standpipe 2019 $233,300
T-8 Recoating Tubbs Hill – 1.0 MG Tank 2022 $57,500
T-9 Recoating Best Hill Interior/Exterior 2026 $419,000
T-10 Best Hill Circulation 2015 $75,000

Distribution System

Chapter 6 – Dist r ibut ion System
City of Coeur d’Alene 6-1 2012 Water System Comprehensive Plan Update
F:\Projects\JUB\20-12-015_CdA_2012_Wtr_Sys_Comp_Plan_Update\docs\Report\Comp Plan Update_FINAL.docx
6.1 Distribution System Analysis A hydraulic computer model using WaterGEMs Version 8vi software produced by Haestad Methods was used to understand how the system reacts to various demands, and project how the system growth will impact existing infrastructure. The water model used data from the City’s existing GIS database of their water distribution system. Model components, including wells, water storage tanks, PRVs, and PSVs, were imported as sub-models from the previous (2005) water model. Current water demand was added to the system based on existing winter and summer water meter reading data. Future water demands were extrapolated from existing meter data by determining water usage per acre for existing land uses and assuming full build-out within the planning boundary. Operating conditions within the sub-models were reviewed and updated based on discussions with the City. Missing or questionable data was reviewed with the City and/or record drawings and then updated as needed. Additional information regarding the development, calibration, and utilization of the water model can be found in Appendix F (Technical Memorandum, 2012 Coeur d’Alene Water Model Analysis dated 7/12/12).
6.2 Evaluation of Distribution System The water model was utilized to identify locations within the existing distribution system that do not meet the system criteria and to understand the impact of future demands on the system within the Water Department's planning boundary. The analysis examined headlosses in each pipe. Based on the review criteria developed with City staff, maximum allowable headloss in the system is 10 feet/1,000 feet. This section examines the current system condition and the system under future demands.
6.2.1 Existing Demand Conditions The existing system was evaluated under three current demand conditions:
1. 2012 average winter demand with only Honeysuckle and Landings Wells operating
2. 2012 MDD with all wells operating 3. 2012 PHD with all wells operating
Under Demand Conditions 1 and 2, no major system deficiencies were observed. Generally, the distribution system headloss and working pressure appear to be within criteria. Only localized high pressures and headloss gradients were observed near well and booster pumps in operation.

Chapter 6 – Dist r ibut ion System
City of Coeur d’Alene 6-2 2012 Water System Comprehensive Plan Update
F:\Projects\JUB\20-12-015_CdA_2012_Wtr_Sys_Comp_Plan_Update\docs\Report\Comp Plan Update_FINAL.docx
Under Demand Condition 3, several areas exhibit headloss greater than the allowable system criteria of 10 feet per 1,000 feet (0.010 ft/ft). The pressure contour map provided on Figure 6-1 shows the existing distribution system headloss in feet per 1,000 feet. The areas of high headloss are primarily located adjacent to Highway 95 and south of Hanley Avenue. During peak hour demand, the Honeysuckle Well is unable to meet the demand of the northeast part of the system, so water must come from the water supply in the northwest. Highway 95 has limited crossings, which restricts flow from the water supply in the northwest to the demand in the northeast. Resolving this bottleneck requires either additional transmission piping or storage in the northeast. As noted in Chapter 5, storage is more cost effective.
6.2.2 Future Demand Conditions (Build-Out) As previously discussed, build-out conditions assume complete infill within the current service area and system expansion to the planning boundary according to City zoning. In order to apply build-out demands within the model, the following improvements were assumed:
• Additional supply as summarized in Chapter 4 was added to the northwest quadrant of the system.
• Future distribution pipes were routed to build-out areas (the actual location of future pipes will be determined by future development).
Distribution pipes were routed into future areas to help understand impacts to the existing system under build-out demand conditions, and additional supply was modeled as groundwater wells similar to the City’s existing wells. The build-out model was run under two demand conditions:
1. Build-out MDD with all but one well operating
2. Build-out PHD with all but one well operating Multiple areas exhibited pressure and head loss greater than allowable criteria as shown on Figure 6-2.


Chapter 6 – Dist r ibut ion System
City of Coeur d’Alene 6-5 2012 Water System Comprehensive Plan Update
F:\Projects\JUB\20-12-015_CdA_2012_Wtr_Sys_Comp_Plan_Update\docs\Report\Comp Plan Update_FINAL.docx
6.3 Pressure Zone Boundary Analysis
6.3.1 Upper Zone/General Zone The existing boundary was evaluated to determine if any changes are warranted. Current system pressures in both zones appear to be within existing pressure criteria, and system operators indicate the current boundaries are functioning well. Evaluation of supply and storage in each zone indicates that the Upper Zone has excess supply but is short on storage. The General Zone is short on supply but has adequate storage. Since the General Zone can be fed by the Upper Zone, supply needs can be met. Additional storage will be provided in the Upper Zone. At this time, no change in boundaries appears necessary.
6.3.2 Stanley/Fernan Boundary As discussed previously, the Stanley Hill service will be split into the following three areas:
1. The higher elevation service area on Stanley Hill will be fed by the Elm Street boosters. Existing isolation valves near Ponderosa Golf Course will be closed.
2. The low-lying area near Ponderosa Golf Course will be served by the General Zone. This will require upsizing existing small lines under I-90 as part of the City's regular replacement program.
3. Service to residents on Fernan Hill will be from a new Fernan Hill booster pump station located adjacent to the Elm Street Booster. This will require construction of a new 12-inch transmission main to Fernan Hill Road.
6.4 Recommended Improvements Table 6-1 includes a summary of the deficiencies identified at the build-out scenario as well as the recommended solutions. The improvement numbers are shown on Figure 6-3.
6.4.1 Upper Zone The recommended improvements in the Upper Zone are to upgrade the line along Dalton between Ramsey and Government Way to a 12-inch line in addition to the piping just south of the Hanley Well. Upsizing these pipes will improve the distribution of water from the west side to the east side of the zone.

Chapter 6 – Dist r ibut ion System
City of Coeur d’Alene 6-6 2012 Water System Comprehensive Plan Update
F:\Projects\JUB\20-12-015_CdA_2012_Wtr_Sys_Comp_Plan_Update\docs\Report\Comp Plan Update_FINAL.docx
Improvements connecting the new supply wells into the Upper Zone near the Industrial Park Standpipe are also recommended to allow the supply to be used for either the Upper or General Zone. The recommended pipe size is 18-inch. The line along Nettleton Gulch Road should be upgraded to an 8-inch line to better supply that area. The recommended improvements for this zone assume that 1.0 MG of storage has been added in the northeast quadrant of the City. If no storage is added, there are additional improvements that will be required to meet future demands.
6.4.2 General Zone Recommended improvements for the General Zone include upgrading the line along Ramsey from Appleway to the north, adding a new river crossing near Seltice and Huetter, improving the existing river crossing, and adding transmission main for new supply wells. The new 12-inch line on Appleway will improve transmission from the Upper Zone through the General Zone. The new river crossing will provide reliability to the Blackwell Hill area and allow for some transmission from the supply wells in the western portion of the City to downtown.
6.4.3 Stanley Hill Zone The Stanley Hill recommendations include upsizing the supply lines to the storage tank and upsizing undersized lines.
6.4.4 Fernan Hill Zone The recommended Fernan Hill Zone will require a new transmission main to supply the new zone from the Elm Street Booster Station site. In addition to this new 12-inch transmission main, areas of future growth will require additional 12-inch transmission mains.
6.4.5 Armstrong Park Zone It is recommended that the existing supply line to the Armstrong Park Zone be upsized to a 12-inch line in order to supply adequate flows to the booster station at build-out.
6.4.6 Blackwell Hill Zone No specific recommended improvements to the Blackwell Hill Zone are planned at this time. Improvements in this area will be dependent on locations and sizes of future development(s).

Chapter 6 – Dist r ibut ion System
City of Coeur d’Alene 6-7 2012 Water System Comprehensive Plan Update
F:\Projects\JUB\20-12-015_CdA_2012_Wtr_Sys_Comp_Plan_Update\docs\Report\Comp Plan Update_FINAL.docx
Table 6-1 – Build-Out Deficiencies
Project Number Pressure Zone Observed Problem Recommended Solution Planned Year Capital Cost (a)
D-1 Piping modifications for addition of NE
storage
Headloss gradients are greater than 0.01 ft/ft in the area of recommended NE storage.
Upgrade pipe for new addition of 1.0 MG of storage to NE quadrant.
2018 $582,000
D-2 Upper Zone near Hanley Well
Existing pipes act as a bottleneck as demand is routed to the eastern portion of the Upper Zone.
Upgrades mains near Hanley Well and on Christopher Lane and Ramsey.
2019 $799,800
D-3 Upper Zone - Nettleton Gulch Road
Headloss gradients are greater than 0.01 ft/ft along Nettleton Gulch.
Upsize mains to 8-inch. 2020 $392,500
D-4 General Zone - Ramsey Road
High headloss north of Appleway on Ramsey. Upgrade main to 12-inch. 2027 $385,400
D-5 General Zone - piping along Huetter and Seltice to supply New River Crossing
Headloss gradients are greater than 0.01 ft/ft in the area as flow is routed to the new Blackwell development area.
New piping along Huetter and Seltice to route flow from new wells into to new river crossing into the Blackwell area.
2022 $1,196,600
D-6 General Zone - Future River Crossing
Headloss gradients are greater than 0.01 ft/ft at new, proposed 12-inch river crossing into Blackwell development area and at the existing 12-inch Blackwell river crossing.
Upsize future river crossing near Huetter to 16-inch to route flow from new wells into the Blackwell area.
2022 $970,600
D-7 General Zone - replacement of Existing River
Crossing
Headloss gradients are greater than 0.01 ft/ft at river crossings.
Upsize existing Blackwell river crossing to 16-inch.
2023 $1,190,200

Chapter 6 – Dist r ibut ion System
Table 6-1 cont inued
City of Coeur d’Alene 6-8 2012 Water System Comprehensive Plan Update
F:\Projects\JUB\20-12-015_CdA_2012_Wtr_Sys_Comp_Plan_Update\docs\Report\Comp Plan Update_FINAL.docx
Project Number Pressure Zone Observed Problem Recommended Solution Planned Year Capital Cost (a)
D-8 Stanley Hill Zone - transmission piping
within the zone
Negative pressures near the Stanley Hill Tank/Johnson Ranch area due to large build-out demands in very small distribution lines. Headloss gradients are greater than 0.01 ft/ft in Stanley Hill area.
Upgrade mains to 12-inch (booster pumps will be required to serve some areas – future development).
2026 $569,400
D-9 Future Fernan Zone - new transmission piping from Elm
Street Booster Site to Zone
Negative pressures near the Fernan build-out area due to large build out demands in distribution lines.
Booster station and new Fernan Hill Tank. Transmission piping between the Elm Street site and the new zone will be required.
2017 $483,400
D-10 Armstrong Park Zone transmission line to
supply booster station
Headloss gradients are greater than 0.01 ft/ft in 6-inch transmission line to Armstrong Park area.
Upsize transmission line to Armstrong Park to 12-inch.
2023 $352,000
D-11 Miscellaneous Areas around the system
High headloss gradient observed in the Davidson/Mill area as well as other areas with undersized mains.
Annual main replacement. Annual $500,000
--- General Zone - 15th Street
Headloss difference of 16-20 ft at build-out PHD between Tubbs Hill and Best Hill Tanks.
No upgrades recommended. - -
D-12 Fernan Hill Future Development
Extensions will be required to service future areas.
Main extensions for future development.
2028 $500,000
D-13 New/Replace Meter/ Hydrant/Service Line
Work
Annual replacement projects. Annual $215,000
(a) All costs in 2012 dollars


Capital Improvement Plan

Chapter 7 – Cap i ta l Improvement Plan
City of Coeur d’Alene 7-1 2012 Water System Comprehensive Plan Update
F:\Projects\JUB\20-12-015_CdA_2012_Wtr_Sys_Comp_Plan_Update\docs\Report\Comp Plan Update_FINAL.docx
Chapters 4, 5, and 6 described the recommended water system improvements for the City. These improvements and order of magnitude cost estimates are included in this chapter.
7.1 Order of Magnitude Cost Estimates The order of magnitude estimates developed at this planning level are order-of-magnitude estimates without any detailed itemization. These estimates may have been based on:
• The advantages of recent bid prices for similar projects
• Budget pricing from specialty contractors or suppliers These costs also include the following:
• 20 percent contingency • 20 percent project soft costs (Engineering, etc.) • 5 percent mobilization • 2.5 percent bonding and administration
The accuracy of these numbers is expected to range from 50 percent above to 30 percent below the actual cost of design and construction.
7.2 Summary of Existing System Deficiencies and Improvements Individual components of the system were identified and evaluated in previous sections of the Plan. They are generally grouped into three categories─water supply, water storage, and water distribution. Improvement recommendations and Opinions of Cost are summarized in the following sections. These costs are identified as either City-funded or developer-contribution. The City-funded portions are paid for by rates or cap fees, depending on if the project is due to replacement and rehabilitation (rates) or related to system growth (cap fees). The developer-contribution projects are projects fully funded by a property developer. Criteria for these future projects are included in Appendix G.
7.2.1 Water Supply The water supply needs detailed in Chapter 4 can be met by drilling additional wells and adding capacity to existing wells. Table 7-1 summarizes the City’s water supply needs, timing/trigger flows for those improvements, and associated Opinion of Costs. This water supply is estimated to fulfill build-out requirements for the Water Department.

Chapter 7 – Cap i ta l Improvement Plan
City of Coeur d’Alene 7-2 2012 Water System Comprehensive Plan Update
F:\Projects\JUB\20-12-015_CdA_2012_Wtr_Sys_Comp_Plan_Update\docs\Report\Comp Plan Update_FINAL.docx
Table 7-1 – Water Supply Improvement Costs by Zone
Improvement
Trigger Maximum Day Demand for
Upgrades by Zone gpm
Estimated Construction
Date (a)
Recommended Pump Size
gpm Opinion of
Capital Cost (b) Funded By Upper Zone
New Well 11,400 2013\2014 4,000 $1,698,700 City 100% growth-related
Additional Supply 11,900 2020 1,500 $735,800 City 100% growth-related
General Zone New Well 12,400 2017\2018 4,000 $1,698,700 City
100% growth-related New Well 14,200 2022\2023 4,000 $1,698,700 City
100% growth-related Total $5,831,900
(a) Year is approximate based on projected growth rate City-wide. (b) All Opinions of Cost are planning level in 2012 dollars and do not include land purchase costs.
The dates listed are based on wells that produce 4,000 gpm and projected increases in water demand, consistent with planning values. However, growth rates and water conservation effects will fluctuate, so the maximum day demand requirements dictate when a new source is needed. The demand triggers are listed in Table 7-1. In addition to the additional supply required to meet the future needs, there are several wellhouses that will require replacement during this planning period and some other supply improvements that will need to be completed. These improvements are summarized in Table 7-2.
Table 7-2 – Additional Supply Improvements Project No. Capital Project Planned Year Capital Cost (a) Funded by S-5 Linden – Wellhouse Replacement 2020 $522,700 City (R&R) S-6 4th Street – Wellhouse Replacement 2024 $509,800 City (R&R) S-7 Atlas – System Upgrades 2025 $504,000 City (R&R) S-8 Regular Pump Rehabilitation Biennial $75,000 City (R&R) S-9 Onsite Chlorine Regeneration 2013-2015 $80,000 City (R&R) S-10 Soft Starter Replacement Biennial $75,000 City (R&R) S-11 Transfer Surface Water Rights to
Groundwater Rights 2017 $10,000 City (R&R)
S-12 Reasonably Anticipated Future Needs 2014 $25,000 City 100% growth related
S-13 SCADA Conversion 2013 $35,000 City (R&R) Total $1,836,500.00
(a) All opinions of cost are planning level 2012 dollars (b) Replacement and Rehabilitation
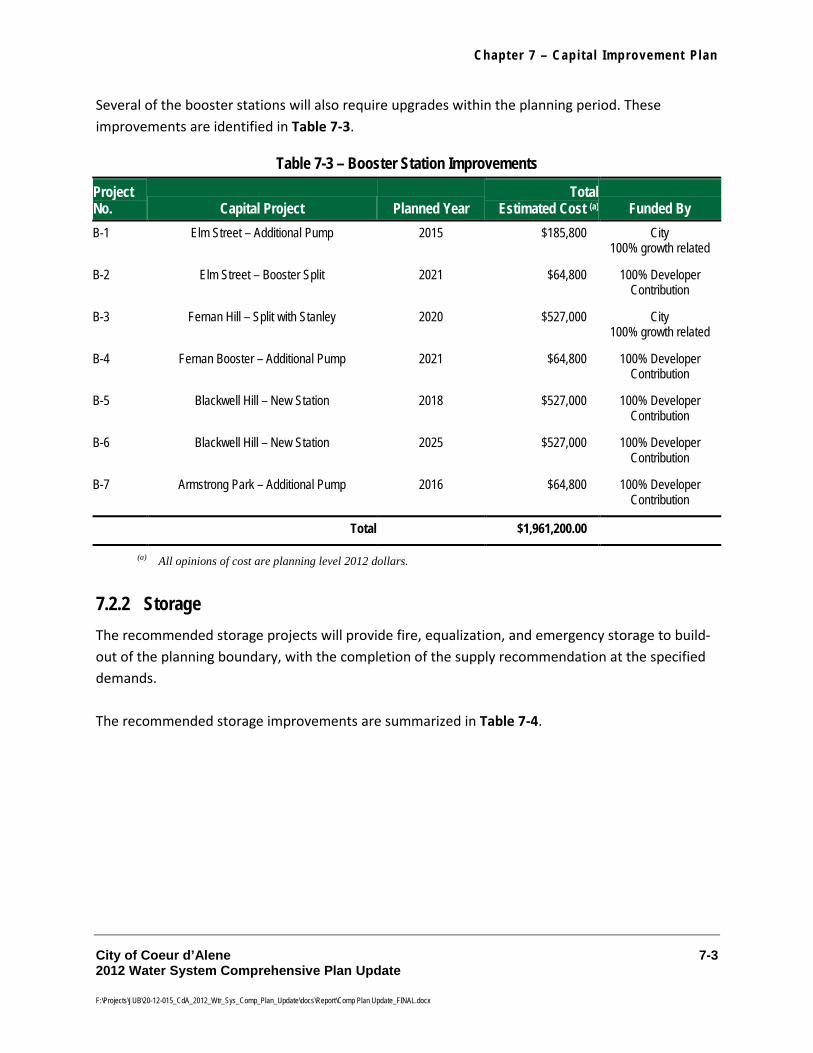
Chapter 7 – Cap i ta l Improvement Plan
City of Coeur d’Alene 7-3 2012 Water System Comprehensive Plan Update
F:\Projects\JUB\20-12-015_CdA_2012_Wtr_Sys_Comp_Plan_Update\docs\Report\Comp Plan Update_FINAL.docx
Several of the booster stations will also require upgrades within the planning period. These improvements are identified in Table 7-3.
Table 7-3 – Booster Station Improvements
Project No. Capital Project Planned Year
Total Estimated Cost (a) Funded By
B-1 Elm Street – Additional Pump 2015 $185,800 City 100% growth related
B-2 Elm Street – Booster Split 2021 $64,800 100% Developer Contribution
B-3 Fernan Hill – Split with Stanley 2020 $527,000 City 100% growth related
B-4 Fernan Booster – Additional Pump 2021 $64,800 100% Developer Contribution
B-5 Blackwell Hill – New Station 2018 $527,000 100% Developer Contribution
B-6 Blackwell Hill – New Station 2025 $527,000 100% Developer Contribution
B-7 Armstrong Park – Additional Pump 2016 $64,800 100% Developer Contribution
Total $1,961,200.00
(a) All opinions of cost are planning level 2012 dollars.
7.2.2 Storage The recommended storage projects will provide fire, equalization, and emergency storage to build-out of the planning boundary, with the completion of the supply recommendation at the specified demands. The recommended storage improvements are summarized in Table 7-4.

Chapter 7 – Cap i ta l Improvement Plan
City of Coeur d’Alene 7-4 2012 Water System Comprehensive Plan Update
F:\Projects\JUB\20-12-015_CdA_2012_Wtr_Sys_Comp_Plan_Update\docs\Report\Comp Plan Update_FINAL.docx
Table 7-4 – Storage Requirements
Project No. Project
Anticipated Year of Construction Capital Cost Funded By
T-1 Upper Zone Storage – 1.0 MG 2018 $1,631,500 City (growth)
T-2 Stanley Hill Storage – 0.5 MG 2026 $1,016,600 50% City/50% Developer
T-3 Blackwell Hill – 0.6 MG 2021 $1,068,500 Developer
T-4 Armstrong Park – 0.3 MG 2022 $1,016,600 Developer
T-5 Fernan Hill – 0.7 MG 2020 $1,269,900 40% City/60% Developer
T-6 Recoating Prairie Standpipe 2014 $233,300 City (R&R) (a)
T-7 Recoating Industrial Standpipe 2019 $233,300 City (R&R) (a)
T-8 Recoating Tubbs Hill – 1.0 MG Tank 2022 $57,500 City (R&R) (a)
T-9 Recoating Best Hill Interior/Exterior 2026 $419,000 City (R&R) (a)
T-10 Best Hill Circulation 2015 $75,000 City (R&R) (a)
Total $7,021,200.00
(a) R&R – Replacement and rehabilitation (b) All opinions of cost are planning level 2012 dollars.
7.2.3 Distribution/Piping The primary piping and booster station deficiencies in the existing distribution system were presented in Chapter 6. The existing distribution system is generally capable of meeting system demands due to a good distribution network. The City’s distribution system is reported to be in overall good condition. This can be attributed to an annual pipe replacement program. The City's replacement efforts have been focused on improving gaps in the distribution grid and replacing AC pipe less than 8 inches in diameter as well as galvanized, OD, steel, and less common sizes such as 10-inch. The City replaces an average of 1 to 1.5 miles of pipe per year. The City's target is 1.5 to 2 miles per year, which correlates to an average replacement cycle ranging from 150 to 200 years. Typical guidelines suggest that the useful life of domestic distribution systems ranges from 50 to 75 years, with PVC life as long as 125 years. Table 7-5 identifies the cost of distribution lines anticipated to be necessary through build-out. These improvements are required to complete the City’s distribution main grid and to provide firm pumping capacity in the booster pump stations.

Chapter 7 – Cap i ta l Improvement Plan
City of Coeur d’Alene 7-5 2012 Water System Comprehensive Plan Update
F:\Projects\JUB\20-12-015_CdA_2012_Wtr_Sys_Comp_Plan_Update\docs\Report\Comp Plan Update_FINAL.docx
Table 7-5 – Build-Out Deficiencies Project Number Pressure Zone Observed Problem Recommended Solution Planned Year Capital Cost (a) Funded By
D-1 Piping modifications for addition of NE
storage
Headloss gradients are greater than 0.01 ft/ft in the area of recommended NE storage.
Upgrade pipe for new addition of 1.0 MG of storage to NE quadrant.
2018 $582,000 City – 100% Growth
D-2 Upper Zone near Hanley Well
Existing pipes act as a bottleneck as demand is routed to the eastern portion of the Upper Zone.
Upgrades mains near Hanley Well and on Christopher Lane and Ramsey.
2019 $799,800 City – 100% Growth
D-3 Upper Zone - Nettleton Gulch
Road
Headloss gradients are greater than 0.01 ft/ft along Nettleton Gulch.
Upsize mains to 8-inch. 2020 $392,500 City – R&R
D-4 General Zone - Ramsey Road
High headloss north of Appleway on Ramsey.
Upgrade main to 12-inch. 2027 $385,400 City – R&R
D-5 General Zone - piping along Huetter and
Seltice New River Crossing
Headloss gradients are greater than 0.01 ft/ft in the area as flow is routed to the new Blackwell development area.
New piping along Huetter and Seltice to route flow from new wells into to new river crossing into the Blackwell area.
2022 $1,196,600 25% City 75% Developer
D-6 General Zone - Future River
Crossing
Headloss gradients are greater than 0.01 ft/ft at new, proposed 12-inch river crossing into Blackwell development area and at the existing 12-inch Blackwell river crossing.
Upsize future river crossing near Huetter to 16-inch to route flow from new wells into the Blackwell area.
2022 $970,600 Developer

Chapter 7 – Cap i ta l Improvement Plan Table 7-5 continued
City of Coeur d’Alene 7-6 2012 Water System Comprehensive Plan Update
F:\Projects\JUB\20-12-015_CdA_2012_Wtr_Sys_Comp_Plan_Update\docs\Report\Comp Plan Update_FINAL.docx
Project Number Pressure Zone Observed Problem Recommended Solution Planned Year Capital Cost (a) Funded By
D-7 General Zone - replacement of Existing River
Crossing
Headloss gradients are greater than 0.01 ft/ft at river crossings.
Upsize existing Blackwell river crossing to 16-inch.
2023 $1,190,200 90% City/ 10% Developer
D-8 Stanley Hill Zone - transmission
piping within the zone
Negative pressures near the Stanley Hill Tank/Johnson Ranch area due to large build-out demands in very small distribution lines. Headloss gradients are greater than 0.01 ft/ft in Stanley Hill area.
Upgrade mains to 12-inch (booster pumps will be required to serve some areas – future development).
2026 $569,400 Piping 50% City/ 50% Developer Both pumps -
Developer
D-9 Future Fernan Zone -
new transmission piping from Elm Street Booster Site to Zone
Negative pressures near the Fernan build-out area due to large build out demands in distribution lines.
Booster station and new Fernan Hill Tank. Transmission piping between the Elm Street site and the new zone will be required.
2017 $483,400 Developer
D-10 Armstrong Park Zone
transmission line to supply booster
station
Headloss gradients are greater than 0.01 ft/ft in 6-inch transmission line to Armstrong Park area.
Upsize transmission line to Armstrong Park to 12-inch.
2023 $352,000 Developer
D-11 Miscellaneous Areas around the
system
High headloss gradient observed in the Davidson/Mill area as well as other areas with undersized mains.
Annual main replacement. Annual $500,000 City –R&R
--- General Zone - 15th Street
Headloss difference of 16-20 ft at build-out PHD between Tubbs Hill and Best Hill Tanks.
No upgrades recommended. - - -

Chapter 7 – Cap i ta l Improvement Plan Table 7-5 continued
City of Coeur d’Alene 7-7 2012 Water System Comprehensive Plan Update
F:\Projects\JUB\20-12-015_CdA_2012_Wtr_Sys_Comp_Plan_Update\docs\Report\Comp Plan Update_FINAL.docx
Project Number Pressure Zone Observed Problem Recommended Solution Planned Year Capital Cost (a) Funded By
D-12 Fernan Hill Future
Development
Extensions will be required to service future areas.
Main extensions for future development.
2028 $500,000 Developer
D-13 New/Replace Meter/
Hydrant/Service Line Work
Annual replacement projects. Annual $215,000 City – R&R
(a) All costs are planning level 2012 dollars (b) R&R – Replacement and Rehabilitation

Chapter 7 – Cap i ta l Improvement Plan
City of Coeur d’Alene 7-8 2012 Water System Comprehensive Plan Update
F:\Projects\JUB\20-12-015_CdA_2012_Wtr_Sys_Comp_Plan_Update\docs\Report\Comp Plan Update_FINAL.docx
7.2.4 Additional Improvements In addition to the previously-recommended projects, replacement of the existing radio read program to a fixed base or other stationary read-type system is recommended. Table 7-6 includes this recommendation. Improvements will likely take several years.
Table 7-6 – Additional Recommended Improvements Project No. Capital Project Planned Year Capital Cost a Funded by
M-1 Fixed Base Metering Phase I 2020 $1,000,000 City R&R
M-2 Fixed Base Metering Phase II 2021 $1,000,000 City R&R
M-3 Fixed Base Metering Phase III 2022 $1,000,000 City R&R
M-4 Comprehensive Rate Study 2018 $75,000 City R&R
Total $3,075,000.00
(a) All opinions of cost are planning level 2012 dollars (b) R&R – Replacement and Rehabilitation
7.3 Identification and Scheduling of Improvements The projects detailed in the Plan have been scheduled based on priority and spread out over the planning period. Many of the projects are dependent on growth of the system and will be dependent on actual system demand. Individual development agreements may reduce capital requirements for the City but have not been considered here due to their unpredictable timing and scope. The overall summary of projected capital improvements is presented in Table 7-7. Figure 7-1 includes a schematic of the locations of the improvements within the City. A detailed Capital Improvement Plan, sheet documents, all the projects and their anticipated funding source are included in Appendix H.

Chapter 7 – Cap i ta l Improvement Plan
City of Coeur d’Alene 7-9 2012 Water System Comprehensive Plan Update
F:\Projects\JUB\20-12-015_CdA_2012_Wtr_Sys_Comp_Plan_Update\docs\Report\Comp Plan Update_FINAL.docx
Table 7-7 – City of Coeur d'Alene Schedule of Improvements
Item City-Funded Capital Cost Opinion by Year (a)
2013-2017 2018-2022 2023-2027 Supply Improvements
New Wells $3,397,400 $2,434,500
Other Supply Improvements $925,000 $747,700 $1,238,800
Storage Improvements
New Tanks $2,172,700 $508,300
Other Storage Improvements $308,300 $233,300 $476,500
Distribution Improvements (b)
Distribution Improvements $2,073,450 $2,014,078
Annual Water Main Replacement $3,575,000 $3,575,000 $3,575,000
Booster Stations
Booster Station Improvements $185,800 $527,000 0
Additional Capital Improvements
Additional Improvements $3,075,000
Totals $8,391,500 $19,485,150 $7,812,678
(a) All Opinions of Cost are planning level in 2012 dollars and do not include land purchase costs. (b) Development-driven improvements are included at no cost to the City.
An analysis of the funding requirements for the recommended improvements is discussed in Volume II of this report.

D-3
D-8
D-9
D-10
D-7
D-6
D-4 0
D-2
D-1
S-1
S-3b
T-1
T-5
T-4
S-3a
D-10
D-10
S-7
T-7
S-2
T-6
S-6
S-5
ELM STREET BOOSTER
T-10T-9
ARMSTRONGPARK BOOSTER
T-8
T-3T-2
S-4
S-2
D-5
KATHLEEN AVE
INTERSTATE 90
HIGHWAY 95
GOVERNMENT WAY
APPLEWAY AVE
FRENCH GULCH RD
NORTHWEST BLVD
SHERMAN AVE
WILBUR AVE
DALTON AVE
HANLEY AVE
SELTICE WAYHIGHWAY
95
HUETTER RD
ATLAS RD
RAMSEY RD
PRAIRIE AVE
INTERSTATE 90
15TH ST
4TH ST BEST HILL TANK
TUBBS HILL TANK
PRAIRIE STANDPIPE
ARMSTRONGPARK TANK
BLACKWELL HILL TANK
INDUSTRIAL STANDPIPE
TUBBS BOOSTER PUMP STATION
STANLEY HILLTANK
LAKE PUMPS
ATLAS WELL
ANNIE WELL
HANLEY WELL
4TH ST WELL
LOCUST WELL
LINDEN WELL
CLAYTON WELL
LANDINGS WELL
HONEYSUCKLE WELL
LEGENDCIP Pipe Upgrades
8"12"16"18"24"
Existing Pipes
Existing Pipes
City Boundary
Current Service Area
Future Service Area
Existing Well
Existing Tank
Existing Booster Station
Future Well
Future Tanks
Figure 7-1Capital
ImprovementProjects
City of Coeur d'Alene2012 Water System
Comprehensive Plan UpdatePa
th: F
:\Pro
ject
s\JU
B\2
0-12
-015
_CdA
_201
2_W
tr_Sy
s_C
omp_
Pla
n_U
pdat
e\G
IS\M
aps\
Plan
Fig
ures
\Fig
ure
7-1
Cap
ital I
mpr
ovem
ent P
roje
cts_
Tabl
e.m
xd
0 1 Miles
BLACKWELL HILL BOOSTERS
D-#
S-#
T-#
DistributionImprovements
Supply Improvements
Tank Improvements
Alternate Location

Appendix A – Coeur d'Alene Demographics Discussion/Evaluation Appendix B – Water System Conservation Plan Appendix C – Well Data Appendix D – Technical Memorandum, 2012 Fernan Hill Evaluation, August 3, 2012 Appendix E – Technical Memorandum, 2012 Blackwell Hill Zone Analysis, September 26, 2012 Appendix F – Technical Memorandum, 2012 Coeur d'Alene Water Model Analysis, July 12, 2012 Appendix G – Minimum System Development Criteria Appendix H – Capital Improvement Plan

Coeur d'Alene Demographics Discussion/Evaluation

City of Coeur d’Alene Coeur d’Alene, Idaho
2012 Water System Comprehensive Plan
Appendix A
Population Growth and Study Boundaries
May 2012
Prepared by
J-U-B ENGINEERS, Inc. 7825 Meadowlark Way Post Falls, Idaho 83854
(208)762-8787

Coeur d’Alene 2012 Water System Comprehensive Plan Update i Appendix A
F:\Projects\JUB\20-12-015_CdA_2012_Wtr_Sys_Comp_Plan_Update\docs\Report\Appendices\Appendix A_CdA Demographics.docx
Contents
Page Appendix A – Population Growth and Study Boundaries .................................................................................... A-1
A.1 Population Data and Projections.................................................................................................................. A-1 A.2 Infill within Existing City Limits ..................................................................................................................... A-3 A.3 Future Service Boundary Extents ................................................................................................................ A-3
Works Cited .............................................................................................................................................................. A-5
Figures Figure A-1 – City of Coeur d’Alene Population Projections (2010 to 2035) ................................................................ A-2 Figure A-2 – City of Coeur d’Alene New Dwelling Units (2010 to 2035) .................................................................... A-3 Figure A-3 – Study Boundaries .................................................................................................................................. A-4
Tables Table A-1 – US Census Bureau Population Data for Coeur d’Alene and Kootenai County ....................................... A-1

Append ix A – Popu lat ion Growth and Study Boundar ies
Coeur d'Alene 2012 Water System Comprehensive Plan Update A-1 Appendix A
F:\Projects\JUB\20-12-015_CdA_2012_Wtr_Sys_Comp_Plan_Update\docs\Report\Appendices\Appendix A_CdA Demographics.docx
Appendix A – Population Growth and Study Boundaries
A.1 Population Data and Projections The City of Coeur d’Alene has experienced variable rates of growth in its history. The most recent growth phases occurred in the late 1990s and again between 2004 and 2008. These periods of growth are bracketed with economic downturns; therefore, the last 20 years is considered representative of historical growth in the area. US Census data and annual average growth rates for the period 1990 through 2010 are summarized in Table A-1.
Table A-1 – US Census Bureau Population Data for Coeur d’Alene and Kootenai County
Year Coeur d’Alene
Population Annual Growth Rate
from Prior Period Kootenai County
Population Annual Growth Rate
from Prior Period 1990 24,563 - 69,795
2000 34,514 3.46% 108,685 4.53%
2010 44,137 2.49% 138,494 2.45%
Population projections for the City of Coeur d’Alene have been developed by Avista Utilities (Randy Barcus, Avista Chief Economist) and the Kootenai Metropolitan Planning Organization, KMPO (Bonnie Gow). A discussion of each is presented below:
• Avista serves areas outside the City of Coeur d’Alene; therefore, their projections are for the “Coeur d’Alene metropolitan area”. A comparison of the Avista Coeur d’Alene metropolitan area with the Kootenai County census data shows that the populations approximately match for the census years of 1990, 2000, and 2010. The historical annual growth rate for the metropolitan area between 1990 and 2010 has varied between 1.0 and 6.4 percent, with an average rate of 3.4 percent. Avista’s forecast period is 2011 through 2041, with population estimates made to the midpoint of each year. Avista expects slower growth for the forecast period, with an annual growth rate for the period ranging from 1.0 to 1.7 percent and averaging 1.5 percent. Mr. Barcus estimates that the City of Coeur d’Alene itself will experience growth at approximately 80 percent of the county. Avista’s county-wide projections through the planning period were therefore factored by 80 percent and then applied to the City’s 2010 population as reported by the US Census Bureau. This yields an annual growth rate of 0.8 to 1.4 percent and an average of 1.2 percent.
• KMPO utilized US Census Bureau data for Kootenai County and the individual cities within the county from 1990, 2000, and 2010 to formulate projections for 2014, 2020, and 2035. Observed annual average growth rates are shown in Table A-1. For the forecast period extending through 2035, KMPO assumed a consistent annual growth rate of 2.5 percent for the City of Coeur d’Alene, and a Kootenai County growth rate of 2.4 percent. Forecasts for Coeur d’Alene were made with a baseline population from the 2010 census.
Additionally, population growth was discussed with the Water Department, the Wastewater Department, and the Planning Department on April 16, 2012. The Planning Department indicated that historical growth rates for Coeur d’Alene have ranged from 1.8 to 2.2 percent and that a 2 percent

Append ix A – Popu lat ion Growth and Study Boundar ies
Coeur d'Alene 2012 Water System Comprehensive Plan Update A-2 Appendix A
F:\Projects\JUB\20-12-015_CdA_2012_Wtr_Sys_Comp_Plan_Update\docs\Report\Appendices\Appendix A_CdA Demographics.docx
growth rate was appropriate for forecasting purposes. The population projections from Avista and KMPO, as well as an assumed growth of 2.0 percent, are shown on Figure A-1. Projections were not extended beyond 2035 due to the limitations on the KMPO study and to approximately match the near-term objectives of the study.
Figure A-1 – City of Coeur d’Alene Population Projections (2010 to 2035)
The Census Bureau statistics indicate persons per household for the period 2006 through 2010 was 2.25. The KMPO data show a current value of 2.40 persons per household based on total occupied housing, which was used in KMPO’s subsequent projections for the forecast period. Avista estimated house starts through their forecast period, but no distinction was made between county and city growth. For consistency with the stated KMPO assumption, it is assumed that the number of persons per household will be 2.40 throughout the forecasting period. The corresponding number of new residential dwelling units (2010 baseline) based on the preceding population projections is shown on Figure A-2. In summary:
• The Avista population estimates result in approximately 6,300 additional new residential households by 2035.
• The KMPO population estimates result in approximately 15,700 additional new residential households by 2035.
• At an assumed annual growth rate of 2.0 percent, approximately 11,800 additional new residential households will be developed by 2035.
• Although the water service area extends outside the City limits, there are areas within the City limits that are not served by the water system. These areas are approximately equal in size so the current City population will be assumed to be equal to the water system service population.
24,563
34,514
44,137
20,000
30,000
40,000
50,000
60,000
70,000
80,000
90,000
1985 1990 1995 2000 2005 2010 2015 2020 2025 2030 2035 2040
Population
Year
Coeur d'Alene Census Data KMPO Projections
Projection at 2% Growth Avista Projections

Append ix A – Popu lat ion Growth and Study Boundar ies
Coeur d'Alene 2012 Water System Comprehensive Plan Update A-3 Appendix A
F:\Projects\JUB\20-12-015_CdA_2012_Wtr_Sys_Comp_Plan_Update\docs\Report\Appendices\Appendix A_CdA Demographics.docx
Figure A-2 – City of Coeur d’Alene New Dwelling Units (2010 to 2035)
A.2 Infill within Existing City Limits Approximately 1,080 acres of undeveloped land exists within the City limits. It is assumed that these areas will be developed consistently with the current zoning and the City’s Comprehensive Plan (2007-2027). As growth occurs, these areas will likely be developed prior to growth outside the current City limits.
A.3 Future Service Boundary Extents To define areas of growth outside the city limits and the build-out area, meetings were conducted with the Water, Wastewater, and Planning Departments. The preliminary growth boundaries for the water and wastewater systems were integrated into a single planning figure—reference Figure A-3. The total area of growth for water represented by these boundaries is approximately 3,200 acres. Although build-out growth is not expected to the southern and eastern edges of the ACI, expansion to the western and northern edges of the ACI is expected.
0
2000
4000
6000
8000
10000
12000
14000
16000
18000
2010 2015 2020 2025 2030 2035 2040
New Dwelling Units (from 2010)
Year
KMPO Projections Projection at 2% Growth Avista Projections

Append ix A – Popu lat ion Growth and Study Boundar ies
Coeur d'Alene 2012 Water System Comprehensive Plan Update A-4 Appendix A
F:\Projects\JUB\20-12-015_CdA_2012_Wtr_Sys_Comp_Plan_Update\docs\Report\Appendices\Appendix A_CdA Demographics.docx
Figure A-3 – Study Boundaries

Append ix A – Popu lat ion Growth and Study Boundar ies
Coeur d'Alene 2012 Water System Comprehensive Plan Update A-5 Appendix A
F:\Projects\JUB\20-12-015_CdA_2012_Wtr_Sys_Comp_Plan_Update\docs\Report\Appendices\Appendix A_CdA Demographics.docx
Works Cited Barcus, Randy. Avista Chief Economist. “RE: Request for population forecast data” (email). April 16,
2012.
Gow, Bonnie. Kootenai Metropolitan Planning Organization (KMPO). “FW: KMPO Growth Projections Final Draft – Correction” (email). January 26, 2012.
US Census Bureau. “State & County QuickFacts.” January 31, 2012. April 24, 2012. <http://quickfacts.census.gov/qfd/states/16/1616750.html>.

Water System Conservation Plan

City of Coeur d'Alene Water System Conservation Plan
November 2012

City of Coeur d’Alene i Water System Conservation Plan
F:\Projects\JUB\20-12-015_CdA_2012_Wtr_Sys_Comp_Plan_Update\docs\Report\Appendices\Appendix B_Water Conservation Plan.docx
Contents
Page
Appendix B Water System Conservation Plan ................................................................................................. B-1 I. Introduction .................................................................................................................................................. B-1 II. Water System Profile ................................................................................................................................... B-2 III. System Demand Forecast ........................................................................................................................... B-6 IV. Planned Facilities ......................................................................................................................................... B-8 V. Conservation Goals ..................................................................................................................................... B-9 VI. Water Conservation Measures .................................................................................................................... B-9 VII. Effects of Conservation Measures ............................................................................................................. B-11 VIII. Expected Savings ...................................................................................................................................... B-12 IX. Future Conservation Measures.................................................................................................................. B-13
Figures Figure B-1 – Water System Planning Boundary ....................................................................................................... B-14 Figure B-2 – Per Capita Water Use vs Temperature ............................................................................................... B-15

City of Coeur d’Alene B-1 Water System Conservation Plan
F:\Projects\JUB\20-12-015_CdA_2012_Wtr_Sys_Comp_Plan_Update\docs\Report\Appendices\Appendix B_Water Conservation Plan.docx
Appendix B Water System Conservation Plan I. Introduction
The City of Coeur d'Alene operates a water system that has 292 miles of pipe, utilizes 9 groundwater wells, 7 water storage tanks, and boosts water to 4 elevated pressure zones. The water is supplied from the Rathdrum Prairie-Spokane Valley (RPSV) Aquifer. This aquifer supplies drinking water to half a million people in northern Idaho and eastern Washington, and maintaining this supply for future use has become a significant focus for water purveyors in these areas. Working to standardize efforts of the water purveyors that are fed from the aquifer, a Ground Water Management Plan was developed by the Rathdrum Prairie Ground Water Advisory Committee, and the final order was adopted in 2005 by the Idaho Department of Water Resources (IDWR). The Management Plan, which is included at the end of this document, defines six goals for use in management of the aquifer resources. The fifth goal of the Management Plan is to “Encourage water conservation efforts by all users of the resource.” Part of this goal requires that a water conservation plan be in place for all municipal purveyors that request new water rights, or changes to their existing water rights. After the Management Plan was adopted, the Idaho Department of Water Resources developed a document for “Water Conservation Measures and Guidelines for Preparing Water Conservation Plans.” The draft plan guidance was issued from IDWR in February 2006. These guidelines include the recommended components to be included in a water conservation plan. The recommended components, and those included in this plan, are as follows:
• Development of a water system profile • Preparation of a demand forecast • Description of planned facilities • Development of conservation goals and methods for stakeholder involvement • Identification of water conservation measures • Analysis of conservation measures • Integration of resources and forecast modification • Implementation and evaluation strategies
This water conservation plan has been developed to meet the requirements of the Management Plan and the IDWR Guidelines for the purpose of applying for future water rights or modifying existing water rights for the City of Coeur d’Alene as necessary. The recommended components are discussed and addressed hereafter.

City of Coeur d’Alene B-2 Water System Conservation Plan
F:\Projects\JUB\20-12-015_CdA_2012_Wtr_Sys_Comp_Plan_Update\docs\Report\Appendices\Appendix B_Water Conservation Plan.docx
II. Water System Profile
A. Source Water
The Rathdrum Prairie-Spokane Valley aquifer is supplied by several large surface water sources, including Coeur d’Alene Lake, the Spokane River, Lake Pend Oreille, and Hayden Lake. Other small lake watersheds such as Hauser, Spirit, and Twin supply the balance of the surface water input to the aquifer. In an average year, precipitation also supplies the aquifer with one quarter of its recharge water. Of course, surface water flows and precipitation are subject to natural variations and will affect aquifer recharge rates. Detailed quantity, flow, and level analyses have been performed on both the Idaho and Washington side of the aquifer as part of the 2007 U.S. Geologic Surveys’ “Bi-State” Study and are available on the IDEQ website.
The Spokane Valley/Rathdrum Prairie Aquifer is comprised of a thin layer of soil overlaying 200 to 400 feet of coarse sands and gravels. The alluvial material was deposited by Ice Age floods from Glacial Lake Missoula approximately 12,000 years ago. The 2007 “Bi-State” aquifer study completed by the U.S. Geologic Survey shows that annual estimated aquifer withdrawals are approximately 22 percent of estimated annual recharge for the aquifer. While adequate aquifer supply appears to exist, pressure has been building from conservation groups to reduce per capita consumption in order to maintain Spokane River flows and water quality.
The Spokane Valley/Rathdrum Prairie Aquifer is the largest source of drinking water within the City’s hydrologic area. Treating water from the nearby Spokane River or other surface sources would remove water that recharges the aquifer. It is significantly more costly than continued use of groundwater and could also introduce minimum river flow constraints directly into water supply planning. As a result, it is assumed that the City will continue to use groundwater as its sole water supply.
B. Existing Water Rights
The City currently has a total of 52.4 cfs in claimed groundwater rights and 27.07 cfs in claimed surface water rights. A summary of the rights and their priority dates is included in Table B-1.

City of Coeur d’Alene B-3 Water System Conservation Plan
F:\Projects\JUB\20-12-015_CdA_2012_Wtr_Sys_Comp_Plan_Update\docs\Report\Appendices\Appendix B_Water Conservation Plan.docx
Table B-1 – Summary of Water Rights Right Number
Priority
Amount
(cfs) Nature of Use
Period of Use
95-2111 04/20/1955 3.00 Municipal 1/1 to 12/31 95-2133 07/21/1960 2.27 Municipal 1/1 to 12/31 95-2164 10/03/1964 3.61 Municipal 3/15 to 11/15 95-2198 12/13/1966 5.12 Municipal 1/1 to 12/31 95-7142 05/03/1971 2.45 Municipal 1/1 to 12/31 95-7181 03/14/1972 5.73 Municipal 1/1 to 12/31 95-8565 12/07/1987 7.55 Municipal 1/1 to 12/31 95-8647 03/19/1990 7.30 Municipal 1/1 to 12/31 95-8672 08/27/1990 3.00 Municipal 1/1 to 12/31 95-8938 02/08/1996 4.57 Municipal 1/1 to 12/31 95-9007 01/25/1999 7.80 Municipal 1/1 to 12/31
Total 52.4
C. Coeur d’Alene Water Service Boundary
The Coeur d’Alene Water Department serves an area that differs only slightly from the City limits. The existing water service boundary encompasses approximately 6,400 acres and is shown on Figure B-1. Most of the service area is relatively flat and is served by two main pressure zones and several smaller boosted zones. The perimeter of the service area along the east and south sides is more mountainous and is served by several relatively small pressure zones.
D. Coeur d’Alene Population and Connections Served
Coeur d’Alene has been growing rapidly over the last decade. U.S. Census data indicates the City population in 2000 was 34,514 and grew to 44,137 in 2010, an increase of approximately 2.49 percent year-over-year.
The City Water Department service area differs slightly from the City boundary. The Water Department currently has 20,040 total metered connections, of which, 14,255 are identified as residential connections. Using the 2010 Census information of 2.25 persons per household, the population of the service area is approximately 32,044 people.
E. Existing Facilities and Water Use Categories
The City is currently supplied by nine groundwater wells. These wells and their relative capacities are shown in Table B-2.

City of Coeur d’Alene B-4 Water System Conservation Plan
F:\Projects\JUB\20-12-015_CdA_2012_Wtr_Sys_Comp_Plan_Update\docs\Report\Appendices\Appendix B_Water Conservation Plan.docx
Table B-2 – Wells and Capacities Well Capacity (gpm)
1. Atlas 4,000 2. 4th Street 3,000 3. Hanley 3,600 4. Honeysuckle 1,650 5. Linden 2,300 6. Locust 3,000 7. Landings 3,000 8. Prairie 3,200 9. Annie 2,500
Total 26,250
The water use for the system has been divided into 13 key categories for planning purposes. The water use for each of these categories was evaluated and given a peak day usage designation in gallons per minute per acre (GPM/Ac). The key categories and land use designations are included in Table B-3.
Table B-3 – Categories and Land Use Designations Customer Type Max Month
(gpd) Total AC Served Demand/AC
(gpm) Assisted Living Facility 258,200 33.4 5.14 Church 280,133 89.3 1.97 Commercial 2,708,900 1,244.7 2.31 Hotel 561,867 38.5 10.48 Industrial 358,533 409.8 0.82 Office 185,467 42.7 3.25 Open Space 2,416,367 833.4 3.73 Public 492,000 262.0 1.03 Residential – High Density 2,254,733 460.3 4.06 Residential – Low Density 5,756,100 3,817.0 2.47 Residential – Medium Density 10,110,800 2,645.7 3.54 Restaurant 388,400 59.2 4.79 School 1,483,767 262.1 4.02
Total 27,255,267 10,198
Historic monthly water use for the system from 2006 to 2011 is shown on Figure B-2. The trend line shown in the figure indicates there has been a gradual reduction in water use over this period.

City of Coeur d’Alene B-5 Water System Conservation Plan
F:\Projects\JUB\20-12-015_CdA_2012_Wtr_Sys_Comp_Plan_Update\docs\Report\Appendices\Appendix B_Water Conservation Plan.docx
F. System Loss The City water production is measured on an ongoing basis at the wells with flow meters. Individual services are all metered to accurately account for water sold. The service line meters are read on a monthly basis with a radio read metering system. For 2011, the total water produced was 3,669,414,000 and the total water sold was 3,342,782,000. The lost water was 9.7 percent for 2011. This unaccounted water total includes volumes for regular maintenance items such as hydrant flushing, street cleaning and other City maintenance issues. It is estimated that these maintenance uses account for about half of the unaccounted for water. In order to examine the difference between indoor and outdoor use, losses were also examined for summer months versus winter months. In 2011, the lost water over the year varied between 5 percent in July and 11 percent in January and February.
G. Water System Growth and Planning Period
Growth of the water system is restricted on several sides due to adjacent water systems. Adjacent water purveyors exist on the north and west sides of the City along with one small private system within the City. Ross Point Water serves a large portion of the area north of Seltice and west of Huetter, and the Hayden Lake Irrigation District (HLID) borders the City system to the north along Prairie Avenue. The south side of the system is bound by Coeur d’Alene Lake.
The majority of the expected growth in the City of Coeur d’Alene is generally progressing toward the east and south with infill in the northwest, as shown on Figure B-1. Specific areas of growth in the water system include:
• The northwestern portion of town as development fills in toward Prairie Avenue
and Huetter
• The portion of town south of Seltice and north of the Spokane River
• The area south of the Spokane River
• The area east of the existing City boundary in the foothills
There are also several relatively small areas within the future City water boundary serviced by smaller, independent water systems. These specific areas are Hoffman Water, the Kootenai County Fairgrounds, and the USFS Nursery. These water systems may become part of the City system in the future, increasing demands to the City water system. Build-out water demand projections include the incorporation of the USFS nursery and fairgrounds into the City for planning purposes. Hoffman Water is assumed to remain independent.

City of Coeur d’Alene B-6 Water System Conservation Plan
F:\Projects\JUB\20-12-015_CdA_2012_Wtr_Sys_Comp_Plan_Update\docs\Report\Appendices\Appendix B_Water Conservation Plan.docx
The equivalent served acreage for the City was estimated by comparing build-out water demands with current water usage for land use areas within the system boundary. Based on this equivalent area, it is assumed that there will be a significant increase in water demands within the current system boundary. The total serviceable area for the build-out scenarios of the water system is approximately 10,600 acres.
H. Large Water Users
There were three water users identified as year-round large users when reviewing meter data from July 2011 through March 2012. These consistent large users were the Coeur d'Alene Resort, Oak Crest Mobile Home Park, and Lake Villa Apartment. In November 2011, the total water use for these three facilities was 6,774,000 gallons, which was 4.5 percent of the total 150,365,000 gallons sold that month. For the 2011 summer months, there were nine users that registered water use greater than 3,000,000 gallons for the September reading. These users are listed in Table B-4.
Table B-4 – Highest Water Users User Water Use Percent of Monthly Total
(%) 1. Courcelles Parkway Irrigation 12,987,000 1.65 2. Oak Crest Mobile Home Park 7,640,000 0.97 3. Coeur d'Alene Resort 7,040,000 0.89 4. Lake City High School Irrigation 5,930,000 0.75 5. Coeur d'Alene High School 5,265,000 0.67 6. Canfield Park Irrigation 4,460,000 0.57 7. Bluegrass Park Irrigation 3,480,000 0.44 8. Forest Cemetery Irrigation 3,314,000 0.42 9. Toulon Drive Irrigation 3,027,000 0.38
Total 53,143,000 6.74
III. System Demand Forecast
The anticipated increase in system demand for the water service area is accounted for by applying the growth rate of 2.0 percent for Coeur d’Alene to current peak day flow. Build-out demand for the system was estimated in conjunction with the City Planning Department using current zoning and water demand factors developed for major usage categories and applying these demands to the full build-out acreage. The growth rates were used to estimate approximate timing for service area build-out by projecting flows forward from

City of Coeur d’Alene B-7 Water System Conservation Plan
F:\Projects\JUB\20-12-015_CdA_2012_Wtr_Sys_Comp_Plan_Update\docs\Report\Appendices\Appendix B_Water Conservation Plan.docx
today's MDD at a 2 percent increase. Future projects described in this Plan include dates for planning purposes; however, observed system demand is the more accurate and critical component to scheduling upgrades. Based on these projections, build-out population is estimated to occur between 2028 and 2032.
A. Current and Future Water Consumption Demands
Water demands within the City are similar to nearby municipalities, with peak summer demands nearing three times the average daily demand (ADD). The terms below are typically used to define water consumption demands:
Average Day Demand (ADD): The average number of gallons of water consumed per day as calculated over the course of a year.
Maximum Day Demand (MDD): The maximum number of gallons of water used in one day as determined from well production records.
Peak Hour Demand (PHD): The maximum amount of water used in a one-hour period. This number is extrapolated from well production and tank level records.
Daily and hourly pumping records are kept at each well site. The maximum historical recorded maximum day demand on July 25, 2006 was 32.2 MG. The observed production has generally declined from 2006 to 2011. This decline is likely a combination of factors, including increased conservation efforts by the City and the economic slowdown. Due to this observed reduction in water use, an average of the observed peaks over the last five years has been used to develop a daily use for projections. The average maximum day from 2007 to 2011 is 30.2 MG, with an average MDD per capita water use of 700 gallons per capita per day. This value will be used in combination with the projected growth rate to develop future projected demands. Table B-5 illustrates current and future water use within the City’s water service area utilizing an annual growth rate of 2.0 percent.
Table B-5 – City of Coeur d’Alene Current and Future Water Demand 2011
(mgd) 2016
(mgd) 2021
(mgd) Build-Out
(mgd) Average Daily Demand 10.05 11.32 12.50 13.80 Maximum Daily Demand 32.19 35.77 39.50 43.60 Peak Hour Demand 57.94 64.38 71.10 78.48

City of Coeur d’Alene B-8 Water System Conservation Plan
F:\Projects\JUB\20-12-015_CdA_2012_Wtr_Sys_Comp_Plan_Update\docs\Report\Appendices\Appendix B_Water Conservation Plan.docx
The fluctuation in demands over a 24-hour period was developed using hourly SCADA information from the maximum day demand in 2011, taking into account pump run times, starts, and stops. The peak hour demand represents the highest rate of water use occurring in a one-hour period during the maximum day. Observed reservoir level fluctuations and pumping records indicate the PHD is approximately 1.8 times the MDD. This peak hour occurs at approximately 5:00 a.m., with a second lesser peak (1.2) at approximately 8:00 p.m. Demands above the base line show periods when equalization storage would be required if firm production capacity matched the peak day demand.
Domestic water use varies yearly primarily due to irrigation use. Table B-5 shows the maximum day pumping averages from 2007 through 2011. Comparing the average annual water demand of 10.4 mgd (7,220 gpm) to the maximum day demand of 30.2 mgd (20,970 gpm) yields a peaking factor of 2.9. This peaking factor is assumed to remain consistent through the planning period.
In addition to the domestic water use and irrigation, typical system demands include fire flow.
IV. Planned Facilities
In order to meet the projected build out demands new water supply sources will be required for the City in addition to other improvements outlined in The Comprehensive Plan Update. Three new, 4,000 gpm wells are required in addition to adding 1500 gpm to existing wells to meet the projections for a total of 13,500 gpm to be added to the system. Table B-6 includes the projected supply improvements and the estimated date that the improvements will be required.
Table B-6 – Supply Improvements
Improvement Estimated Date of
Construction
Recommended Pump Size
gpm Opinion of Capital
Cost Upper Zone
New Well 2013/2014 4,000 $1,698,700 Additional supply 2020 1,500 $753,800
General Zone New Well 2017/2018 4,000 $1,698,700 New well 2022/2023 4,000 $1,698,700

City of Coeur d’Alene B-9 Water System Conservation Plan
F:\Projects\JUB\20-12-015_CdA_2012_Wtr_Sys_Comp_Plan_Update\docs\Report\Appendices\Appendix B_Water Conservation Plan.docx
V. Conservation Goals
A. The City has implemented a number of conservation measures that have had an impact on water production. The following goals for the City were developed using the Idaho Department of Water Resources Water Conservation Guidelines for preparing Water Conservation Plans. The goals the City has selected are as follows: 1. Maintain a low unaccounted for water measurement. Industry standard for
lost water is approximately 10 percent, and the City has a current value of approximately 7 percent. Maintaining or reducing this low value over the next few years is a goal for the City. One way the City plans to reduce this value is by replacing aging or poor quality piping within the system. The impact of this Plan can be measured from one year to the next. Keeping this value low and keeping the system in excellent condition will allow the City to minimize the lost water value from future demands.
2. Continue their public education program and encourage smart controllers for irrigation to reduce the peak hour demands on the system.
3. Continue to participate in xeriscaping promotions, data collection, non-revenue water control, and maintaining their partnership that promotes conservation, all discussed in the following section.
VI. Water Conservation Measures
This section includes a discussion of the conservation measures the City has implemented and is currently using. A. Water Rate Structure
The City of Coeur d'Alene implemented a block rate structure in 2008. This structure included a base rate and two blocks for usage for residential users, with the upper block designed to discourage high residential water use. This rate structure was gradually increased over a 4-year period and is summarized in Table B-7.
Table B-7 – Residential Rate Structure
Year Block 1
(0-30,000 gal) Block 2
(Over 31,000 gal) Base Rate (¾" Meter)
2008 0.65 0.94 6.23 2009 0.67 0.97 6.32 2010 0.70 1.01 6.42 2011 0.72 1.04 6.51

City of Coeur d’Alene B-10 Water System Conservation Plan
F:\Projects\JUB\20-12-015_CdA_2012_Wtr_Sys_Comp_Plan_Update\docs\Report\Appendices\Appendix B_Water Conservation Plan.docx
B. Promoting Xeriscaping
The Water Department funded the installation of a Xeriscape demonstration garden adjacent to the community garden. The Department funded this project to demonstrate the look of native and low-water landscaping. In addition to the garden demonstration, the Department also distributes packets of wildflower seeds at the Street Fair, Parks Day, Earth Day, the local Farmer's Market, and other community events.
C. Data Collection Water production and sales are closely monitored by the City. Pumping data is collected on a daily basis, and water meters are read monthly. These data are used to monitor non-revenue water on a regular basis.
D. Non-Revenue Water Control The City has been reading meters on a monthly basis since 2005. The billing software identifies areas of unexpectedly high consumption, flagging a visit by City staff to determine if there is a leak on the customer's side of the meter. Since the meters are read monthly, this allows the City to rapidly identify any leaks and encourage repairs. The City is in the process of replacing the larger meters within the system with compound meters that more accurately read both high and low flows to improve the reliability of the non-revenue water data. The vast majority of smaller meters within the system were replaced during the conversion to radio read meter capabilities, increasing the overall accuracy of the system. The City has an aggressive water main replacement program. The mains within the system are ranked based on age, size, and pipe material, with the oldest mains receiving a high replacement priority. Replacement of these mains helps minimize the length of leaky pipes within the system. Any known leaks are immediately repaired.
E. Partnerships Beginning in 2008, the City began funding the installation of smart controllers for some of the larger water users within the system to help these users reduce their

City of Coeur d’Alene B-11 Water System Conservation Plan
F:\Projects\JUB\20-12-015_CdA_2012_Wtr_Sys_Comp_Plan_Update\docs\Report\Appendices\Appendix B_Water Conservation Plan.docx
consumption and improve their efficiency with irrigating. Most of these smart controllers have been installed on City park and public school properties. The City is actively meeting with a new organization called Idaho Washington Aquifer Collaborative (IWAC), which, among other things, will be addressing bi-state conservation issues. The City has partnered with Kootenai Environmental Alliance to evaluate their conservation needs and activities. The City funded a greenhouse rebuild behind the Jewett House as a demonstration facility. The gardens use a highly efficient drip irrigation system that minimizes the amount of water needed. The City has been and continues to be an active participant in the creation and implementation of the Comprehensive Aquifer Management Plan (CAMP), which includes significant information encouraging wise water use for utilities in Washington and Idaho.
F. Public Outreach and Publicity The City locally produced a video on "How to Xeriscape," which has been running on the City's television Channel 19. Presentations have been made to the City Council (August 3, 2010) and Kootenai Environmental Alliance (June 2, 2011) to publicize and encourage wise water use. Each spring, the Department runs a "City Streets" article in the local newspaper, giving tips on wise water use. Wise water use tips have been included in direct City mailings (Talk of the Town). The annual Water Quality Report includes wise watering tips. This report is mailed to each customer and is available on the City's website. The Department has included articles on wise water use in the Kootenai Environmental Alliance newsletter. The Department has supported a class at North Idaho College on xeriscaping for homeowners, and will credit the cost of the class, including the workbook, for any residential customer who takes and completes the class.
G. Hose Bib Timers The City has encouraged the use of hose bibb timers and moisture sensors by homeowners to prevent accidental excess lawn watering. Qualifying installations can receive a credit on their utility bills for a portion of the cost to purchase these.
VII. Effects of Conservation Measures
A. The impact of several of the conservation measures discussed previously began at specific times and can be measured when looking at water use over a period of years. The measures that are easily tracked are the following:

City of Coeur d’Alene B-12 Water System Conservation Plan
F:\Projects\JUB\20-12-015_CdA_2012_Wtr_Sys_Comp_Plan_Update\docs\Report\Appendices\Appendix B_Water Conservation Plan.docx
• Block water rate structure for residential customers, which was implemented in 2008 • Monthly reading of water meters, which was implemented in 2005 • Funding of smart controllers which happened in 2008
In order to analyze potential impacts, the produced and sold water were both plotted on a per connection basis along with the average daily temperature for the month. This chart is included as Figure B-1. The water reduction from the installation of the smart controllers has been easily measured by the City as they regularly watch the water use at the City Parks. Based on information from Doug Eastwood in an email dated January 20, 2009, the consumption of irrigation water for City Parks decreased between 30 and 50 percent at several of the parks after the installation of the Smart Controllers. City wide, the per capita water use in the peak months of July and August was 659 gallons per capita per day in 2006 and 2007. After the implementation of the Block Rate Structure and use of smart metering for parks and school irrigation (2008-2011), the per capita water use decreased to 563 gallons per capita per day, which is a 15 percent reduction. The trendline shown in Figure B-1 demonstrates the overall reduction over time. The average temperature was also examined for the years evaluated. Although the monthly average temperature was greater in 2006 and 2007 than it was from 2008-2011 as seen in Figure B-1, there was still a significant reduction in water use when adjusting temperature.
VIII. Expected Savings
While it is difficult to identify the impact on specific conservation measures, the United States Environmental Protection Agency (USEPA) has provided benchmark data for what can be expected. Specific conservation measures and the expected savings for these measures are included in Appendix B of the USEPA Water Conservation Guidelines. A summary of the expected savings for some specific measures according to EPA is included in Table B-8.
Table B-8 – USEPA Water Conservation Measure Benchmark Savings 1 Conservation Measure Expected Reduction in Use (%) Water Use Category Impacted Universal Metering 20 All 10% Increase in residential rates 2-4 Residential 10% Increase in non-residential rates 5-8 Non-Residential Public Education 2-5 All Large Landscape Water Audits 10-20 Non-Residential Low Water Use Plants 7.5 All
1 USEPA Water Conservation Plan Guidelines Appendix B

City of Coeur d’Alene B-13 Water System Conservation Plan
F:\Projects\JUB\20-12-015_CdA_2012_Wtr_Sys_Comp_Plan_Update\docs\Report\Appendices\Appendix B_Water Conservation Plan.docx
The implementation of any or all of these measures would be expected to reduce peak water demand and not expected to drastically impact revenue from water sales.
IX. Future Conservation Measures
Conservation Goals: The City has three main conservation goals moving forward:
1. To maintain non-revenue water at a level below 10 percent
2. To reduce or maintain the peak day and peak month consumption to optimize the use of their existing supply capacity
3. Continue to participate in educational programs, data collection, non-revenue water control, and maintaining their partnership that promotes conservation
In order to meet these goals, the City should continue with the water conservation measures they have been implementing, with continued focus on the following activities:
• Monitor meter reads to identify potential leaks at metered connections
• Compare monthly pumped data with billed data to identify potential distribution system leaks
• Use of compound meters for larger connections for better accuracy of actual use
• Regularly scheduled water main replacement
• Immediate leak repairs
• Use of smart controllers, especially for large irrigated spaces
• Partnerships with area groups such as IWAC, KEA, and CAMP
• Public education
• Promotion of hose bib timers and moisture sensors for all connections that provide irrigation
Some other measures the City may want to consider in the future are as follows:
• The use of reclaimed water for City irrigation • Re-evaluation of the water rate structure and adding additional blocks • Mandatory installation of moisture sensors for services that provide irrigation

City of Coeur d’Alene B-14 Water System Conservation Plan
F:\Projects\JUB\20-12-015_CdA_2012_Wtr_Sys_Comp_Plan_Update\docs\Report\Appendices\Appendix B_Water Conservation Plan.docx
Figure B-1 – Water System Planning Boundary

City of Coeur d’Alene B-15 Water System Conservation Plan
F:\Projects\JUB\20-12-015_CdA_2012_Wtr_Sys_Comp_Plan_Update\docs\Report\Appendices\Appendix B_Water Conservation Plan.docx
Figure B-2 – Per Capita Water Use vs Temperature

Well Data


Technical Memorandum 2012 Fernan Hill Evaluation
August 3, 2012

The purpose of this technical memorandum is to present a conceptual layout of a future water system in the Fernan Hill area. This includes necessary components and pressure zones required to serve the existing and build-out areas as dictated by City. This analysis was conducted using the following information and assumptions:
• Existing Fernan Hill service elevations range from 2300’ to 2450’ • Highest future build-out area elevation of 2560’ to the east. • Sole 12” transmission pipe feeding the Fernan Hill area via new booster pump station
near existing Elm St. Booster Station. • Future Fernan Hill storage reservoir necessary to regulate pressures at high demands • Future intermediate booster station required to service build-out area.
A cursory review of the Fernan Hill area shows steep contours, indicating multiple pressure zones will likely be required to maintain a desired 50 – 90 psi pressure range. The following conceptual layout was developed and can be seen in the attached Figure:
A. A minimum pressure of 50psi at the highest elevation in the build-out area (2560’) requires an system hydraulic grade line (HGL) of approximately 2675’. Therefore, a future storage reservoir overflow elevation should be set to 2675’-2680’. This elevation can be achieved following the ridge line contours east of the existing Fernan Hill area.
B. A high pressure of 90 psi would be reached at an elevation of approximately 2445’. Therefore, Fernan Hill area should be split into two pressure zones, an Upper Fernan Hill and a Lower Fernan Hill pressure zone. A reduction of 40 psi across this boundary would allow for a minimum pressure of 50 psi in the Lower Fernan Hill zone.
C. The Lower Fernan Hill zone would reach a high pressure of 90 psi at an elevation of approximately 2375’. This elevation should be the lowest elevation served by Fernan Hill under the conceptual layout.
DATE: 8/3/12
TO: Steve James, PE
CC: Michelle Johnson, PE
FROM: Nicolas Hiebert, EIT
SUBJECT: 2012 Coeur d’Alene Water Update – Fernan Hill Build-Out Area
MEMORANDUM

2012 Coeur d’Alene Fernan Hill Build-Out Area Technical Memorandum
Page 2
D. However, this layout appears to leave a gap in the service areas between the General Zone and the conceptual Lower Fernan Hill zone. The existing HGL in the General Zone is approximately 2350’, yielding allowable service pressures at ground elevations of approximately 2240’ – 2250’. This leaves a gap between the Lower Fernan Hill zone (2375’) and the General Zone (2250’) of approximately 125’ of head or 55 psi. Potential solutions include:
1. Serve residents within the gap from Lower Fernan Hill Zone utilizing pressure reducers at the service connection.
2. Distribute the pressure difference evenly between the Upper and Lower Fernan Hill zones by lowering the zone boundary elevations approximately 75’ (thus increasing pressures in the by 25 - 30 psi). This would increase maximum pressures from 90 psi to approximately 120 psi in both the Upper and Lower zones.
Depending on where these pressure zone are established, existing pressures to the Fernan Hill residents may change. This should be given consideration before future layout improvements are selected.

!
!
!
!
!!
!
! !
!
!
!
!
!
!
!
!
!
!
!
!
!
!
!
!
!
!
!
!
!
!
!
!
!
!
!
!
!
!!
!
!
!
!
!
!
!
!
!
!
!
!
!
!
!
!
!
! !
!
!
!
!
!
!
!!
!
!
!
!
!
!
!
!
!
!
!
!
!
!
!
!
!
! !
!
!!
!
!
!
!
!
!
!
! !
!
!
!
!
!
!
!
!
!
! !
!
!
!
!!
!
!
!
!
!
!
!
!
!
!!
!!
! !
!
!
!
!
!
!
!
!
!
!
!
!
!
!
!
!
!
!
!
!
!
!
!
!
!
!!
!!
!
!
!
!!
!
!
!
!
!
!
!!
!
!
!
!
!
!
!
!
!
!
!!
!
!
!
!
!
!
!
!
!
!
!
!
!
!
!
!!
!
!!
!
!
!
!!
!!
!
!
!
!!
!!
!!
!!
!
!
!!!!
!
!
!!
!
!
!
!
!
! !
!
!
!
!
!
!
! !
!
!
!
!
!
!
!
!
!
!
!
!
!
!
!
!
!
!
!
!!
! !
!
!
!
!
!
!
!!
!
!
!
!
!
!
!!
!
!
!
!
!
!!
!
!
!
!
!
! !
!
!
!
!
!
!
!
!
!
!!
!
!!
!
!
!
!
!
!
! !
!
!
!!
!
!
!
!
!
!!
!
!
!
!
!
!
!!
!
!!
!
!
!
!
!
!
!
!
!!
!
!
!
!
!
!
!
!
!
!
!
!
!!
!!
!
!
!
!
!
!
!
!
!!
!!
!
!!
!!
!!
!!
!
!
!
!!
!
!!
!!
!!
!
!
!
!
!
!
!
!
!
!!
!
!
!
!
!!
!
!!
!
!
!
!!
!
!
! !
!!
!
!!
!
!!
!
!
!
!
!
!
!
!
!
!
!
!
! !!
!
!
!
!
!!
!
!
!
!
!
!
!
!
!!
!
!
!
!
!
!
!
!
!
!
!
!
!
!
!
!
!
!
!
!
!
!
kj
kj
��
�
�
2300
2375
2450
25
60
2670
15
TH
9T
H
16
TH
BEST
FERNAN LAKE
FE
RN
AN
HIL
L
INTE
RS
TATE
90
SHERMAN
FRONT
FR
EN
CH
GU
LCH
17
TH
18
TH
10
TH
HIL
L
LAKESIDE
21
ST
19
TH
20
TH
HARRISON
ALLEY
HASTINGS
MAPLE
COEUR D ALENE
ELM
INDIANA
7T
H
SLEEPY
23
RD
12TH
MONTANA
RA
MP
BIRCH
BE
ST
HIL
L
WY
AT
T
ST MARIES
BOYD
SYRINGA
RA
MP
AR
T
8T
H
GILBERT
WALNUT
HOLT
LIL
AC
TRADITIONAL
VIC
TO
RIA
N
HATTIE
CR
ES
TLIN
E
FR
OS
TY
PIN
E
22
ND
JO
HN
SO
N
TVELA
PENNSYLVANIA
GARDEN
HAZEL
ADELINE
BE
CK
MA
N
SKYLINE
CO
UN
TR
Y
HANNA
FER
NAN
TER
RAC
E
11
TH
SPOKANE
GIESA
LA
MB
ER
T
FOSTER
CRICKET
14
TH
LOCUST
13
TH
LAKEVIE
W
FERNAN
LINDEN
LILLY
CANDY
STANLEY HIL
L
WALLACE
GA
LE
NA
BR
UC
E
ELT
ON
WHITE PINES
CH
ER
RY
WO
OD
HE
DB
ER
G
HA
LE
Y H
ILL
HAYCRAFT
BRANDON
BA
TO
N R
OU
GE
STINER
BURL
RO
SE
BORAH
VER
AN
DA
BALCONY
TU
SC
AN
CHERRY H
ILL
RANDLE
MURPHY
ROYAL ANNE
DISCOVERY P
OINT
GUNNISON
24
TH
HO
NE
YS
UC
KLE
MO
NTE
VIS
TA
SILVERTIP
BA
RR
ING
TO
N
SP
RU
CE
PINE MOUNTAIN
THERESA
KA
LE
IGH
TH
EIS
SPRINGVIEW
MCFARLAND
NOBLE
RIC
HM
ON
D
GIFTEDVIEW
CIT
Y V
IEW
WOOLSEY
SU
GA
R P
INE
S
HOMESTEAD
NORLYN
ANNIE
STOWE
VINTAGE
GR
AN
D F
IR
SELETA
STO
NE
PIN
ES
JU
LIE
AN
N
WINTER PINES
LU
CY
GARDEN
ALLEY
14
TH
ALLEY
ALLEY
ALLEY
14
TH
AL
LE
Y
RA
MP
ALLEY
17T
H
MONTANA
RA
MP
SPRUCE
12
TH
GARDEN
FOSTERFOSTER
14
TH
9T
H
21S
T
8T
H
AL
LE
Y
14
TH
HARRISON
ELM
AL
LE
Y
11
TH
13
TH
13
TH
ALLEY
8T
H
ALLEY
ALLEY
10
TH
BOYD
12
TH
AL
LE
Y
ALLEY
12
TH
BIRCH
23
RD
HO
NE
YS
UC
KLE
AL
LE
Y
AL
LE
Y
INTE
RS
TATE
90
LILLY
11
TH
MO
NT
E V
ISTA
9T
H
ALLEY
HOMESTEAD
16
TH
8T
H
WALLACE
ST MARIES
19
TH
10
TH
ALLEY
RAM
P
SPOKANE
RA
MP
10
TH
ALLEY
GILBERT
ALLEY
BOYD
ALL
EY
AL
LE
Y
8T
H
MCFARLAND
HAZEL
17TH
HOMESTEAD
BIRCH
AL
LE
Y
9T
H
ALLEY
22N
D
14
TH
ALLEY
ALL
EY
WALLACE
LOCUST
AL
LE
Y
AL
LE
Y
13
TH
ALLEY
ALLEY
22
ND
ALLEY
AL
LE
Y
HASTINGS
12
TH
GARDEN
ALLEY
MAPLE
14
TH
AL
LE
Y
AL
LE
Y
ALLEY
ALLEY
RA
MP
12
TH
11
TH
ALLEY
ALLEY
RAM
P
AL
LE
Y
PENNSYLVANIA
ALLEY
HAZEL
13T
H

Technical Memorandum 2012 Blackwell Hill Zone Analysis
September 26, 2012

This technical memorandum presents a conceptual analysis of the Blackwell Hill Area at build-out of the current planning boundary. This analysis includes the necessary components and multiple pressure zones required to serve the area. This analysis was conducted using the following information and assumptions:
• The Blackwell Hill planning boundary as established by the City. • The General Zone serves elevations up to 2225’. • Highest elevation within the planning boundary is approximately 2455’. • The future area will be served by two river crossings; the existing crossing will be
upsized to a 16-inch crossing and a new 18-inch crossing near the Mill River area on the north west corner of the service area.
• A future Blackwell Hill storage tank will be included to meet City criteria. • Future intermediate booster stations and pressure reducing valves will be required to
service the area.
The Blackwell Hill area is a steep, wooded area overlooking the Spokane River and Coeur d’Alene Lake. The contours indicate that multiple pressure zones will be required to maintain a pressure range of 50 – 90 psi. This approach for this concept is to serve the entire zone with one booster pump station that boosts from the General Zone up to a common storage tank for the entire Blackwell Zone. Several pressure reducing valves would then be required to supply the lower elevations within the zone. This operational scenario is expected to have lower cost and maintenance for the system than the installation of multiple storage tanks and booster stations. A triplex booster station is recommended, and the required pump capacity for a single pump would be 310 gpm at 140 psi head. This setup would provide a firm capacity equal to the
DATE: 9/26/12
TO: Steve James, PE
CC:
FROM: Michelle Johnson, PE
SUBJECT: 2012 Coeur d’Alene Water Update – Blackwell Hill Zone Analysis
MEMORANDUM

2012 Coeur d’Alene Water Blackwell Hill Zone Analysis Technical Memorandum
Page 2
projected peak day flow of 620 gpm. The required storage for a single tank for this zone would be 0.6 million gallons. The following conceptual layout was developed and can be seen in the attached Figure:
A. A minimum pressure of over 40 psi at the highest elevation in the build-out area (2450’) requires a minimum system hydraulic grade line (HGL) of at least 2550’. In order to maintain this minimum pressure, a future elevated storage reservoir would be required with an overflow elevation set at a minimum of 2550’.
B. Based on a tank overflow elevation of 2550’, a high pressure of 90 psi would be reached at an elevation of approximately 2440’, requiring a second pressure zone.
C. A third pressure zone would cover elevations from 2340 to 2225.
Depending on the final elevations selected for the future pressure zones, pressure for the existing Blackwell Hill residents may change. Consideration of existing water pressures and any significant changes should be taken into consideration and addressed with the property owners when establishing future pressure zones.

Technical Memorandum 2012 Coeur d'Alene
Water Model Analysis July 12, 2012

www.jub.com J-U-B ENGINEERS, Inc.
BACKGROUND The purpose of this technical memorandum is to summarize the development and analysis of the City of Coeur d’Alene’s 2012 water model. The primary purpose of the water model is to provide a hydraulic analysis of the system (does not include extended simulation). This generally includes:
• A snapshot of current system • Identification of potential existing capacity issues • An estimate of build-out conditions for the future system • Identification of potential future capacity issues
The existing model is based on assumptions and parameters that characterize the area and existing system. The assumptions are based on the City’s GIS data, characteristics learned from the physical system, similar studies done in the region, as well as general and historical knowledge gained through previous work for the City. EXISTING MODEL
GIS DEVELOPMENT
The City operates and maintains a detailed GIS database of their water distribution system. This database was used as the main source to develop the base water model and included information of pipe size, length, material, and connectivity. The GIS database was provided in shape file format and converted into a WaterGEMs database utilizing software interface tools. The pipe connectivity and pressure zone boundaries were updated based on GIS isolation valve data, City comments, and the previous (2005) water model. Numerous pipes with a length
DATE: 7/12/12
TO: Steve James, PE
CC: Michelle Johnson, PE
FROM: Nicolas Hiebert, EIT
SUBJECT: 2012 Coeur d’Alene Water Model Analysis
MEMORANDUM

2012 Coeur d’Alene Water Model Analysis Technical Memorandum
Page 2
www.jub.com J-U-B ENGINEERS, Inc.
less than “10-ft” were generated through the GIS conversion process. These short pipes were reviewed and deleted when deemed unnecessary for modeling purposes. Finally, elevation data was assigned to the base model junctions by use of Avista digital elevation model (DEM) data in shape file format and compared to topographic contours. The base model generated by the above process was validated without errors or warnings. Model components, including wells, water storage tanks, PRVs, and PSVs were imported as sub-models from the previous (2005) water model. Operating conditions within the sub-models were reviewed and updated based on discussion with the City. These operating conditions included:
• PRVs set to 68 psi downstream pressure • Tank levels set to full • Pump curves and settings updated based on well cut sheets • Base elevations compared to Avista DEM and verified
Missing or questionable data was reviewed with the City and/or record drawings and then updated if necessary.
EXISTING DEMAND DEVELOPMENT
The demand for the existing model was developed using actual water meter data from the period between June 2011 and March 2012. The City’s water meters were supplied in a geo-referenced shape file showing the location of each meter and the monthly usage data reported as a volume in thousands of gallons. This data was used to establish a maximum summer month usage (June – September) and an average winter month usage (December – March) for each meter within the shape file. This data was then imported into the water model using the “Load Builder” feature within WaterGEMs. This feature geospatially analyzes the location of the meter and corresponding usage and then distributes the usage as a weighted demand to model junctions. The total maximum month demand applied to the model was compared to the maximum day demand (MDD) that was established by historical usage. The maximum month was found to be less than the MDD by a factor of 1.18; this factor was then used to escalate demands, establishing a system MDD. Similarly peak hour demand (PHD) was established by a peaking factor of 1.8 x MDD. MDD and PHD demands were calculated within the meter GIS shape file and applied to the model with similar methods described above. Table 1 summarizes the existing demands assigned to the model:

2012 Coeur d’Alene Water Model Analysis
Technical Memorandum Page 3
www.jub.com J-U-B ENGINEERS, Inc.
Table 1: Existing Demands
Demand Value
GPM MGD Average Month Winter Demand 2,645 3.8 Maximum Month Summer Demand 18,955 27.3 Maximum Day Demand (MDD) 22,380 32.2 Peak Hour Demand (PHD) 40,260 58.0
MODEL CALIBRATION
Calibration is the process of globally modifying assumptions and parameters in order to best approximate actual system performance in multiple locations. The calibration process requires an understanding of the limitations of the data and achievable system accuracies (typically ± 15% accuracies are consider acceptable for water models per industry standards). Water model calibration is performed by observing the systems response and residual pressures under a high demand, such as an open hydrant. Then the model is observed under the same scenario and calibrated to best match the system. Calibration of the water model was developed by adjusting the Hazen-Williams roughness coefficient, C, of system pipes. These adjustments were based on typical values observed and applied globally based on pipe material. Table 2 provides a summary of Hazen-Williams C factors used in the model. Table 2: Pipe C Factors
Pipe Material "C" Factor AC 110 Cast Iron 90 Ductile Iron 100 Galvanized Iron 120 HDPE 120 PVC 120
MODEL VERIFICATION RESULTS
Verification of the model calibration was performed by comparing fire flow testing data provided by the City to the model output. As shown in Table 3, the calibration results for all six fire hydrants are within the target 15% accuracy range. Given the size and complexity of the City’s water system and the limited accuracy of the hydrant tests, this is an acceptable amount of error. Therefore, the model is considered calibrated.

2012 Coeur d’Alene Water Model Analysis Technical Memorandum
Page 4
www.jub.com J-U-B ENGINEERS, Inc.
Table 3: Model Verification Results
Fire Department
Testing Model Output % Difference
Address Static Residual Junction Static Residual Static Residual 1518 N. 3rd. Street 64 59 J-108 61 54.2 -4.7% -8.1% 2115 N. Government Way a 64 38 J-3578 63.5 39.8 -0.8% 4.7% 202 Anton 60 50 J-3460 58.1 48.9 -3.2% -2.2% 1125 Marie 56 36 J-1606 54.8 40 -2.1% 11.1% 315 Clayton b 82 73 J-1447 76.6 67.1 -6.6% -8.1% 6360 Sunshine 82 76 J-3184 79.9 76.6 -2.6% 0.8% a Residual reading is 440-ft east of hydrant on the 6-ft fire feed line (J-3749). b Residual reading is 500-ft north of hydrant near 12-ft mainline (J-1015).
EXISTING SYSTEM DEFICIENCIES
System deficiencies in the existing model were identified under three demand conditions:
1. 2012 average winter demand with only Honeysuckle and Landings wells operating
2. 2012 MDD with all wells operating
3. 2012 PHD with all wells operating
Under demand conditions 1 and 2, no major system deficiencies were observed with only localized high pressures and headloss gradients observed near the wells in operation. Under demand condition 3 however, several areas exhibit head loss greater than the allowable system criteria. These areas are primarily in the area of Hwy 95 south of Hanley Ave. to Dalton Ave. and will be discussed in greater detail in subsequent sections.
FUTURE MODEL
BUILD-OUT DEMAND DEVELOPMENT
The build-out model considers future conditions within the water system when it is fully developed. This includes infill to undeveloped areas within the current service area and future expansion within the planning area. The build-out demands were developed by using GIS data from the City’s water meter and zoning shape file, and parcel and structure shape files from Kootenai County. Each water meter was linked to multiple shape files to determine the land use type for each water meter. Parcel and structure shape files from Kootenai County were used in this process. Zoning was used as the primary designation to determine the land use type. The commercial zoning designations were further refined using additional characteristics found in the structure shape file. The Low Density Residential land use type comprised all of the single family dwelling units. Medium Density Residential consisted of multi-family dwelling units that contain between two to four dwelling per units, as well as mobile home and RV parks. High Density Residential

2012 Coeur d’Alene Water Model Analysis
Technical Memorandum Page 5
www.jub.com J-U-B ENGINEERS, Inc.
included all apartments and multi-family dwelling units with over four dwellings per unit. The various land use types are listed below in Table 4. Table 4: Existing Model Land Use Types
Land Use Types Assisted Living Public Church Residential – High Density
Commercial Residential – Medium Density
Hotel Residential – Low Density Industrial Restaurant Office School Open Space
Once land use types were established, unit flows on a per acre basis were developed by analyzing water meter data of various zoning categories. The maximum summer usage from June – September 2011 was used consistently with existing demand development. Unit flows are shown in Table 5. Table 5: Land Use Unit Flows
Land Use Maximum Summer Usage (Gallons)
Net Land Use Area (Acre)
Unit Demand (Gallons/Day/Acre)
Assisted Living 258,200 35 7,407 Church 280,133 99 2,840 Commercial a 2,708,900 816 3,321 Hotel 561,867 37 15,095 Industrial 358,533 302 1,187 Office 185,467 40 4,685 Open Space b 2,416,367 450 5,370 Public 492,000 331 1,486 Residential High 2,254,733 385 5,850 Residential Med 10,110,800 1,985 5,092 Residential Low 5,756,100 1,620 3,553 Restaurant 388,400 56 6,898 School 1,483,767 256 5,789
Totals 27,255,268 6,412 4,250 a Includes Hospitals usages in commercial. Hospitals likely have higher usage than typical commercial.
b Open Space analysis results are not trustworthy. Multiple parcels are associated with one meter, therefore unit demands are likely much lower than reported.
Unit flows were applied within the GIS shape file to the centroid of individual parcels associated with the City’s zoning map. The unit flows were then multiplied by the parcel area to establish build-out demands as shown in Table 6. The result was a GIS shape file that was then imported into the water model using

2012 Coeur d’Alene Water Model Analysis
Technical Memorandum Page 6
www.jub.com J-U-B ENGINEERS, Inc.
the “Load Builder” feature similar to the existing demand development. MDD and PHD demands were adjusted and applied to the model at 43.5 MGD and 78.2 MGD, respectively. Table 6: Land Use Build-out Demands
Land Use Net Land Use Area (Acre)a
Unit Demand (Gallons/Day/Acre)
Land Use Demand (Gallon/Day)
Assisted Living 33.4 7,407 247,186 Church 89.3 2,840 253,653 Commercial 1,244.7 3,321 4,133,938 Hotel 38.5 15,095 581,807 Industrial 409.8 1,187 486,583 Office 42.7 4,685 200,270 Open Space 833.4 5,370 4,475,290 Public 262.0 1,486 389,238 Residential High 460.3 5,850 2,693,031 Residential Med 2,645.7 5,092 13,473,090 Residential Low 3,817.0 3,553 13,563,183 Restaurant 59.2 6,898 408,611 ROW 28.1 School 262.1 5,789 1,517,132
TOTAL 10,226 42,423,014 a 394 acres associated with meter with zero usage reading, and therefore not included in net land use area.
BUILD-OUT SYSTEM
In order to apply build-out demands within, additional supply and future distribution pipes were required to model the system, including:
• Three new wells in NW quadrant of the system operating at 3000-4000 gpm • General future transmission lines routed into future build-out areas. These lines are shown in a
general way to help understand impacts to the existing system under build-out conditions.
BUILD-OUT SYSTEM DEFICIENCIES
The build-out model was run under two demand conditions:
1. Build-out MDD with all wells operating 2. Build-out PHD with all wells operating
Multiple areas exhibited pressure and head loss greater than allowable criteria. A summary of these deficiencies and potential solutions are listed in Table 7.
Table 7: Build-Out Deficiencies

2012 Coeur d’Alene Water Model Analysis
Technical Memorandum Page 7
www.jub.com J-U-B ENGINEERS, Inc.
Scenario a Observed Problem Potential Solution 1 Headloss gradients are greater than 0.01 ft/ft in the area
between Ramsey and Government Way South of Hanley Ave and along Clayton Ave to Colfax St. Existing pipes act as a bottle neck as demand is routed to the eastern portion of the upper zone.
Addition of 0.6 MG of storage to NE quadrant. Then observe the impacts to areas of high headloss in the area between Ramsey and Government Way South of Hanley Ave.
2 Headloss gradients are greater than 0.01 ft/ft in the area as flow is routed to the new Blackwell development area.
Upsize pipe on Atlas to 18-inch to route flow from new wells into to new river crossing into the Blackwell area.
3 Headloss gradients are greater than 0.01 ft/ft at future 12-inch river crossing into Blackwell development area and at the existing 12-inch Blackwell river crossing.
Upsize future river crossing near Atlas to 16-inch to route flow from new wells into the Blackwell area. Then check impact to river crossing off Foster.
3B Still headloss gradient greater than 0.01 ft/ft near river crossings under Scenarios 2 & 3.
Upsize Atlas from I90 to new river crossing to 24-inch, upsize existing Blackwell river crossing to 16-inch, upsize future river crossing near Atlas to 18-inch, upsize future Blackwell distribution pipes to 16-inch PVC.
4 High headloss gradient observed in the Davidson/Mill area.
Check pipe sizes in Davidson/Mill area.
5 Headloss gradients are greater than 0.01 ft/ft along Nettleton Gulch.
Check pipe sizes and pressure zone boundaries.
6 Headloss gradients are greater than 0.01 ft/ft within 6-inch transmission line to Armstrong Park area.
Upsize transmission line to Armstrong Park, and verify pump capacities.
7 Within the system, between Tubbs Hill and Best Hill Tanks, there appears to be a drop in HGL of approximately 16-20-ft at build out PHD.
Check HGL contours of Tubbs/ Best Hill Tanks. Upsize the distribution main along 15th St. to reduce headloss and even out HGL to within several feet of tank HGLs. How large of a main line would this require?
8 Headloss gradients are greater than 0.01 ft/ft in Stanley Hill area.
Check small pipe sizes and demands in various areas.
9 High pressures (>100psi) observed in the lower portions of the Stanley Hill pressure zone.
Pressure zone modification to include the lower portions of Stanley Hill zone into the Lower pressure zone.
10 Negative pressures near the Stanley Hill Tank/ Johnson Ranch area due to large build out demands applied on very small distribution lines.
Updates could include booster pumps, installing transmission line to new developments, and new pressure zone.
11 Negative pressures near the Fernan build out area due to large build out demands applied on distribution lines.
Booster station and new Fernan Hill Tank.
11B Considers new Fernan Hill Tank to provide emergency flow and regulate HGL of new Fernan Hill zone.
New tank and intermediate booster Fernan Hill Booster.
a Model Settings: Analysis at Build out PHD (78MGD) All existing wells on Tanks full Three new wells in NW quadrant, 3000-4000gpm EA Supply shortage of 15,000gpm - tanks draining

2012 Coeur d’Alene Water Model Analysis
Technical Memorandum Page 8
www.jub.com J-U-B ENGINEERS, Inc.
RECOMMENDED IMPROVEMENTS Based on the deficiencies identified in Table 7, the recommended projects to correct the deficiencies are included in Table 8.
Table 8: Recommended Improvements
Scenario Recommended Project Comments 1 New 0.6 MG ground level tank set at contour 2400-ft with max
elevation of 2432-ft. 1100 LF of 16-inch transmission line to intersection of Copper and Shadduck, and 1150 LF upgrade from 8-inch to 16-inch along Shadduck to 22nd. 1350 LF upgrade from 8-inch to 12-inch 22nd from Shadduck to Thomas.
The tank HGL was set to match Prairie Stand pipe overflow elevation at 2432-ft.
2 6000 LF of 24-inch pipe from Atlas Well to I90, 3800 LF of 18-inch pipe from I90 south to the new river crossing.
18-inch main was too small to reduce high head losses along Atlas north of the I90.
3 Upsized new river crossing to 16-inch PVC. Smaller 6-inch lines near Appaloosa still exhibit high headloss gradients and could be considered for annual main replacement projects.
3B 3300 LF 16-inch NW Blvd to Fairmont for existing river crossing, 5000 LF 24-inch from I90 to new river crossing, up sized new river crossing to 18-inch and upsize future Blackwell distribution pipe to 16-inch PVC.
Project addresses high headloss and the existing Blackwell crossing issues.
4 Consider upsizing 1) 1800 LF from 8-inch to 12-inch Ironwood to Mill Ave along Lincoln Way, 2) 900 LF 6-inch to 8-inch Emma Ave Lincoln to Medina St. as annual main replacement projects.
High headloss is on small pipes.
5 High headloss can be eliminated by replacement of this line with a larger, 8-inch main.
6 Upsize 3500 LF of 6-inch transmission line to 10-inch to Armstrong Park area.
Sizing based on demand build out PHD of 660 gpm and headloss gradient of .005-ft/ft.
7 10,600 LF of 24-inch or 18-inch pipe from Tubbs to Best Hill areas would likely be required to improve this. The cost is expected to be excessive for the benefit. No change is recommended.
It would take a 24-inch main interlinking Tubbs/Best Hill Tanks to even out the HGL within the lower zone too within 2-3-ft of max HGL (16-ft head increase). Upsizing smaller portions makes minimal difference.
8 1800 LF of 4-inch upsized to 8-inch and 1100 LF of 6-inch upsized to 8-inch.
Need to upsize 2-inch, 4-inch, and 6-inch lines in French Gulch and E. Pennsylvania Ave. area.
9 To split the zone, close pipe at N. Hill Dr. and N. Galena Dr. Dedicated transmission line from Elm St. boosters to Fernan Hill. Elevations less than 2240-ft moved into the lower zone.
HGL of the lower zone in approximately 2350-ft, this allows inclusion of high pressure areas within the lower zone up to a ground surface elevation of 2240-ft while maintaining minimum pressures of 50 psi.
10 TBD - Future development design. Very high headloss from Stanley Tank along Harrison and into high demand areas. Potential PHD at build out around 450 gpm and MDD of 250 gpm.
11 Install new booster near the existing Elm street Boosters, Install 1600 LF 12-inch transmission to connect to existing 12-inch line at 23rd & Boyd Ave.
Build out MDD is 660 gpm, PHD is 1200 gpm. Current total static head appears to be 280-ft.
11A Install new booster 23rd and Boyd, upsize 1000 LF from 4-inch to 12-inch transmission down 23rd, 1600 LF from 6-inch and 8-inch to 12-inch west along Pennsylvania.
Note there is overlap with Scenario 8. There is still 1200LF 6-inch line with headloss around .015-ft/ft along Boyd from future pump.
11B TBD - Depending on final HGL of new Fernan Hill zone. The current highest elevation served in Fernan Hill is 2450-ft. However, the future water service area shows serving to the top of a hill with ground surface elevation of 2560-ft. This would yield a new Tank HGL at 2675-ft and 3000 LF of transmission main to service area boundary.

Minimum System Development Criteria

Coeur d'Alene 2012 Water System Comprehensive Plan Update G-1 Appendix G
F:\Projects\JUB\20-12-015_CdA_2012_Wtr_Sys_Comp_Plan_Update\docs\Report\Appendices\Appendix G_Minimum System Development Criteria.docx
Minimum System Development Criteria The 2012 Water System Comprehensive Plan Update summarizes system design criteria for system evaluation regarding regulatory requirements, specific performance criteria, and fire flow. This section presents minimum criteria for system expansion by the City and private development. The criteria to be maintained by the City water system are as follows: General:
• A normal operating pressure range of 50 to 80 psi at the meter.
• Maximum system pressure of 90 psi at the bottom floor of the service address.
• A minimum pressure of 40 psi at the top story of the service address.
• Minimum residual pressure of 20 psi during fires meeting the fire flow criterion.
• A minimum fire flow in commercial areas of 3,500 gpm and 1,750 gpm in residential areas, or as determined by the current City Fire Code, whichever is greater.
• All system pipelines must be looped unless otherwise agreed to by the City.
• All improvements meet IDEQ and AWWA criteria.
• All improvements meet City of Coeur d'Alene standards. Boosted Systems:
• Water supply at least equal to the maximum day demand with the largest pump out of service.
• Storage capable of meeting the maximum fire demand plus equalization demand with the largest pump out of service during the maximum day while maintaining 50 percent storage in reserve. The City reserves the right to pay the incremental cost to oversize the storage at the City's discretion.
• A minimum fire flow in commercial areas of 3,500 gpm and 1,750 gpm in residential areas, or as determined by the current City Fire Code, whichever is greater.
• Ability to return water to lower pressure zones as determined by City staff. Booster Pump Stations:
• Minimum number of service connections = 100
• Minimum of two pumps, each capable of handling maximum day demand
• Standby power required

Coeur d'Alene 2012 Water System Comprehensive Plan Update G-2 Appendix G
F:\Projects\JUB\20-12-015_CdA_2012_Wtr_Sys_Comp_Plan_Update\docs\Report\Appendices\Appendix G_Minimum System Development Criteria.docx
• Provisions for supplemental disinfection as determined by City staff.
• Building configuration as determined by City staff but that has a minimum of 36-inch clear space around all pumps/pipes/electrical panels and provisions for pump removal.
Water Storage Tanks:
• Welded steel or precast concrete construction with coating systems as approved by City staff.
• Adequate access to and around tank for maintenance (minimum 20-foot-wide access)
• Separate fill/draw lines
• Telemetry as determined by City staff. Other Provisions:
• Compound meters required on meters greater than 1½ inches

Capital Improvement Plan

Appendix H - Capital Improvement PlanCity of Coeur d'Alene Water Department - Water System Comprehensive Plan Update
Project
NumberCapital Improvement Project Title Description of Project
Targeted
Date
When
Project
will Start
Estimated Cost
of Improvement
% Allocated
to Growth
% Required
by City for
Oversizing
Developer
Contribution
$ Growth
(CAP Fees)
$ Existing
Users
(Rates)
$ Paid by
Developers
Additional
Capacity Provided
(gpm)
Existing Users Growth Existing Users Growth Existing Users Growth Existing Users Growth Existing Users Growth Existing Users Growth Existing Users Growth
Supply
S-1Upper Zone Additional Supply 4000 gpm well - Upper Zone 2013 $ 1,698,700 100% $ 1,698,700 $ - $ - 0
-$ 800,000$ 898,700$
S-2General Zone Additional Supply 4000 gpm well - General Zone 2017 $ 1,698,700 100% $ 1,698,700 $ - $ - 4000
-$ 1,698,700$
S-3Upper Zone Additional Supply
1500 gpm additional Supply - Upper
Zone2020 $ 735,800 100% $ 735,800 $ - $ - 1500
S-4General Zone Additional Supply 4000 gpm well - General Zone 2022 $ 1,698,700 100% $ 1,698,700 $ - $ - 4000
S-5
Linden - Replacement of WellhouseReplace old building with new block
building, purchase additional
property
2020 $ 522,700 0% $ - $ 522,700 $ - 0
S-64th Street - Replacement of Wellhouse
Replace old building with new block
building. 2024 $ 509,800 0% $ - $ 509,800 $ - 0
S-7Atlas - System upgrades
Replace drive, add soft start,
extend chlorine room, and
connection for portable generator.
2025 $ 504,000 0% $ - $ 504,000 $ - 0
S-8 Regular Pump Rehabilitation Rebuild one pump. Biennial 75,000$ 0% $ - $ 75,000 $ - 0 75,000$ 75,000$ 75,000$
S-9On-Site Generation
Conversion to on-site generation for
disinfection in place of chlorine gas.
Two per year until complete.
2013 -
201580,000$
0% $ - $ 80,000 $ - 0 160,000$ 160,000$ 160,000$
S-10Soft Starter Replacement
Install soft starts at all well
locations.Biennial
75,000$ 0% $ - $ 75,000 $ -
0 75,000$ 75,000$ 75,000$ 75,000$
S-11
Transfer of surface water rights to groundwater rights
201710,000$
0% $ - $ 10,000 $ - 0 10,000$ -$
S-12
Reasonably Anticipated Future Needs (RAFN) water right process
201425,000$
100% $ 25,000 $ - $ - 0 -$ 25,000$
S-13 SCADA Conversion Conversion to Wonderware 2013 35,000$ 0% $ - $ 35,000 $ - 0 35,000$ -$
Storage
T-1Upper Zone Storage 1 MG storage in the NE quadrant 2018 $ 1,631,500 100% $ 1,631,500 $ - $ - 2275
-$ 1,631,500$
T-2Stanley Hill Storage 0.5 MG of storage 2026 $ 1,016,600 60% 40% 50% $ 609,960 $ 203,320 $ 203,320 333
T-3 Blackwell Hill Storage 0.6 MG of storage 2021 $ 1,068,500 100% 100% $ 1,068,500 $ - $ - 1013T-4 Armstrong Park Storage 0.3 MG of storage 2022 $ 1,016,600 75% 25% 100% $ 762,450 $ - $ 254,150 333T-5 Fernan Hill Storage 0.7 MG of storage 2020 $ 1,262,900 100% 57% $ 1,262,900 $ - $ - 1372T-6 Recoating of Prairie Standpipe Recoating of the exterior 2014 $ 233,300 0% $ - $ 233,300 $ - 0 233,300$ -$
T-7 Recoating of Industrial Standpipe Recoating of the exterior 2019 $ 233,300 0% $ - $ 233,300 $ - 0 233,300$ -$
T-8 Recoat Tubbs Hill 1M Gal Tank Recoat the exterior 2022 $ 57,500 0% $ - $ 57,500 $ - 0
T-9
Recoat Best Hill Tank - Internal and External
Recoat interior and exterior 2026 $ 419,000 0% $ - $ 419,000 $ - 0
T-10 Best Hill Circulation Recoat interior and exterior 2015 $ 75,000 0% $ - $ 75,000 $ - 0 75,000$ -$
DistributionD-1 Piping Modifications for NE Storage 2018 $ 582,000 100% $ 582,000 $ - $ - 8000 -$ 582,000$
D-2 Near Hanley Well
Upgrades near Hanley Well to improve east-west transmission. Lines on Christopher Lane and Ramsey.
2019 $ 799,800 100% $ 799,800 $ - $ - 2275
-$ 799,800$
D-3 Nettleton Gulch Road
Waterline Improvements at Nettleton Gulch
2020 $ 392,500 0% $ - $ 392,500 $ - 0
D-4
Ramsey Road Upgrades3000 feet of main replacement
between Kathleen and Appleway2027 $ 385,400 100% $ 385,400 $ - $ - 9660
D-5 Heutter and Seltice
New lines on Heutter and Seltice to route flow to new river crossing for Blackwell.
2022 $ 1,196,600 100% 75% $ 1,196,600 $ - $ - 1112
D-6 New River Crossing near Heutter 2022 $ 970,600 100% 100% $ 970,600 $ - $ - 1112
D-7 Replacement of Existing River Crossing 2023 $ 1,190,200 0% 11% $ - $ 1,059,278 $ 130,922 1013
D-8
Increase transmission mains around Stanley Hill Tank
2026 $ 569,400 50% 50% $ 284,700 $ 284,700 $ - 333
D-9
Piping Modifications for Fernan/Stanley Zone separation.
2017 $ 483,400 100% 100% $ 483,400 $ - $ - -$ -$
D-10
Transmission Improvements to Armstrong Park
2023 $ 352,700 100% 100% $ 352,700 $ - $ - 333
D-11Annual Main Replacement
1.5 miles of main replaced annually,
focus on 8 and 12-inch for this
planning period
Annual500,000$
44% $ 220,000 $ 5,880,000 $ - 280,000$ 220,000$ 280,000$ 220,000$ 280,000$ 220,000$ 280,000$ 220,000$ 280,000$ 220,000$ 280,000$ 220,000$ 280,000$ 220,000$
D-12 Fernan Hill - Future Development 2028 500,000$ 100% 100% $ 500,000
D-13
New/Replace Meter/Hydrant/Serviced Line work
Annual215,000$
50% $ 107,500 107,500$ 107,500$ 107,500$ 107,500$ 107,500$ 107,500$ 107,500$ 107,500$ 107,500$ 107,500$ 107,500$ 107,500$ 107,500$ 107,500$
Booster StationsB-1 Elm Street Booster Additional pump at station 2015 $ 185,800 100% $ 185,800 $ - $ - 27 -$ 185,800$
B-2Elm Street Booster
Pump modifications with Fernan
Split2021
64,800$ 100% 100% $ 64,800 $ - $ -
158
B-3Fernan Booster
Split Fernan and Elm, New Station
to Fernan2020
527,000$ 100% $ 527,000 $ - $ -
699B-4 Fernan Booster Additional pump at station 2021 64,800$ 100% 100% $ 64,800 $ - $ - 63B-5 Blackwell Hill Add booster station 2018 527,000$ 100% 100% $ 527,000 $ - $ - 375 -$ -$
B-6 Blackwell Hill Add booster station 2025 527,000$ 100% 100% $ 527,000 $ - $ - 188B-7 Armstrong Park Additional pump at station 2016 64,800$ 100% 100% $ 64,800 $ - $ - 185 -$ -$
Additional Capital Improvements
M-1Fixed Base Water Metering
Modifying the existing system to a
fixed base system for continuous
monitoring.
20201,000,000$
0% $ - $ 1,000,000 $ - 0
M-2Fixed Base Water Metering
Modifying the existing system to a
fixed base system for continuous
monitoring.
20211,000,000$
0% $ - $ 1,000,000 $ - 0
M-3Fixed Base Water Metering
Modifying the existing system to a
fixed base system for continuous
monitoring.
20221,000,000$
0% $ - $ 1,000,000 $ - 0
M-4Comprehensive Rate Study
Complete study of water system
rate structure.2018
75,000$ 0% $ - $ 75,000 $ -
1 75,000$ -$
TOTAL 27,856,400$ 19,036,110$ 13,724,398$ 588,392$ 657,500$ 1,127,500$ 855,800$ 1,251,200$ 697,500$ 513,300$ 462,500$ 327,500$ 472,500$ 2,026,200$ 537,500$ 2,541,000$ 695,800$ 1,127,300$
2013 2014 2015 2016 2017 2018 2019

Appendix H - Capital Improvement PlanCity of Coeur d'Alene Water Department - Water System Comprehensive Plan Update
Project
NumberCapital Improvement Project Title Description of Project
Targeted
Date
When
Project
will Start
Estimated Cost
of Improvement
Supply
S-1Upper Zone Additional Supply 4000 gpm well - Upper Zone 2013 $ 1,698,700
S-2General Zone Additional Supply 4000 gpm well - General Zone 2017 $ 1,698,700
S-3Upper Zone Additional Supply
1500 gpm additional Supply - Upper
Zone2020 $ 735,800
S-4General Zone Additional Supply 4000 gpm well - General Zone 2022 $ 1,698,700
S-5
Linden - Replacement of WellhouseReplace old building with new block
building, purchase additional
property
2020 $ 522,700
S-64th Street - Replacement of Wellhouse
Replace old building with new block
building. 2024 $ 509,800
S-7Atlas - System upgrades
Replace drive, add soft start,
extend chlorine room, and
connection for portable generator.
2025 $ 504,000
S-8 Regular Pump Rehabilitation Rebuild one pump. Biennial 75,000$
S-9On-Site Generation
Conversion to on-site generation for
disinfection in place of chlorine gas.
Two per year until complete.
2013 -
201580,000$
S-10Soft Starter Replacement
Install soft starts at all well
locations.Biennial
75,000$
S-11
Transfer of surface water rights to groundwater rights
201710,000$
S-12
Reasonably Anticipated Future Needs (RAFN) water right process
201425,000$
S-13 SCADA Conversion Conversion to Wonderware 2013 35,000$ Storage
T-1Upper Zone Storage 1 MG storage in the NE quadrant 2018 $ 1,631,500
T-2Stanley Hill Storage 0.5 MG of storage 2026 $ 1,016,600
T-3 Blackwell Hill Storage 0.6 MG of storage 2021 $ 1,068,500 T-4 Armstrong Park Storage 0.3 MG of storage 2022 $ 1,016,600 T-5 Fernan Hill Storage 0.7 MG of storage 2020 $ 1,262,900 T-6 Recoating of Prairie Standpipe Recoating of the exterior 2014 $ 233,300 T-7 Recoating of Industrial Standpipe Recoating of the exterior 2019 $ 233,300 T-8 Recoat Tubbs Hill 1M Gal Tank Recoat the exterior 2022 $ 57,500
T-9
Recoat Best Hill Tank - Internal and External
Recoat interior and exterior 2026 $ 419,000
T-10 Best Hill Circulation Recoat interior and exterior 2015 $ 75,000 Distribution
D-1 Piping Modifications for NE Storage 2018 $ 582,000
D-2 Near Hanley Well
Upgrades near Hanley Well to improve east-west transmission. Lines on Christopher Lane and Ramsey.
2019 $ 799,800
D-3 Nettleton Gulch Road
Waterline Improvements at Nettleton Gulch
2020 $ 392,500
D-4
Ramsey Road Upgrades3000 feet of main replacement
between Kathleen and Appleway2027 $ 385,400
D-5 Heutter and Seltice
New lines on Heutter and Seltice to route flow to new river crossing for Blackwell.
2022 $ 1,196,600
D-6 New River Crossing near Heutter 2022 $ 970,600
D-7 Replacement of Existing River Crossing 2023 $ 1,190,200
D-8
Increase transmission mains around Stanley Hill Tank
2026 $ 569,400
D-9
Piping Modifications for Fernan/Stanley Zone separation.
2017 $ 483,400
D-10
Transmission Improvements to Armstrong Park
2023 $ 352,700
D-11Annual Main Replacement
1.5 miles of main replaced annually,
focus on 8 and 12-inch for this
planning period
Annual500,000$
D-12 Fernan Hill - Future Development 2028 500,000$
D-13
New/Replace Meter/Hydrant/Serviced Line work
Annual215,000$
Booster StationsB-1 Elm Street Booster Additional pump at station 2015 $ 185,800
B-2Elm Street Booster
Pump modifications with Fernan
Split2021
64,800$
B-3Fernan Booster
Split Fernan and Elm, New Station
to Fernan2020
527,000$ B-4 Fernan Booster Additional pump at station 2021 64,800$ B-5 Blackwell Hill Add booster station 2018 527,000$ B-6 Blackwell Hill Add booster station 2025 527,000$ B-7 Armstrong Park Additional pump at station 2016 64,800$
Additional Capital Improvements
M-1Fixed Base Water Metering
Modifying the existing system to a
fixed base system for continuous
monitoring.
20201,000,000$
M-2Fixed Base Water Metering
Modifying the existing system to a
fixed base system for continuous
monitoring.
20211,000,000$
M-3Fixed Base Water Metering
Modifying the existing system to a
fixed base system for continuous
monitoring.
20221,000,000$
M-4Comprehensive Rate Study
Complete study of water system
rate structure.2018
75,000$
TOTAL 27,856,400$
Existing Users Growth Existing Users Growth Existing Users Growth Existing Users Growth Existing Users Growth Existing Users Growth Existing Users Growth Existing Users GrowthExisting
UsersGrowth Existing Users Growth
-$ 735,800$
-$ 1,698,700$
522,700$ -$
509,800$ -$
504,000$ -$
75,000$ 75,000$ 75,000$ 75,000$ 75,000$
203,320$ 304,980$
-$ -$
-$ -$
-$ 541,243$
57,500$ -$
419,000$ -$
392,500$ -$
385,400$
-$ 299,150$
-$ -$
1,059,278$ -$
284,700$ 284,700$
-$ -$
280,000$ 220,000$ 280,000$ 220,000$ 280,000$ 220,000$ 280,000$ 220,000$ 280,000$ 220,000$ 280,000$ 220,000$ 280,000$ 220,000$ 280,000$ 220,000$ 280,000$ 220,000$ 280,000$ 220,000$
-$
107,500$ 107,500$ 107,500$ 107,500$ 107,500$ 107,500$ 107,500$ 107,500$ 107,500$ 107,500$ 107,500$ 107,500$ 107,500$ 107,500$ 107,500$ 107,500$ 107,500$ 107,500$ 107,500$ 107,500$
-$ -$
-$ 527,000$
-$ -$
-$ -$
1,000,000$ -$
1,000,000$ -$
1,000,000$ -$
2,302,700$ 2,131,543$ 1,462,500$ 327,500$ 1,445,000$ 2,325,350$ 1,521,778$ 327,500$ 897,300$ 327,500$ 966,500$ 327,500$ 1,294,520$ 917,180$ 462,500$ 712,900$ 387,500$ 327,500$ 462,500$ 327,500$
2026 2027 2028 20292020 2021 2022 2023 2024 2025

Appendix H - Capital Improvement PlanCity of Coeur d'Alene Water Department - Water System Comprehensive Plan Update
Project
NumberCapital Improvement Project Title Description of Project
Targeted
Date
When
Project
will Start
Estimated Cost
of Improvement
Supply
S-1Upper Zone Additional Supply 4000 gpm well - Upper Zone 2013 $ 1,698,700
S-2General Zone Additional Supply 4000 gpm well - General Zone 2017 $ 1,698,700
S-3Upper Zone Additional Supply
1500 gpm additional Supply - Upper
Zone2020 $ 735,800
S-4General Zone Additional Supply 4000 gpm well - General Zone 2022 $ 1,698,700
S-5
Linden - Replacement of WellhouseReplace old building with new block
building, purchase additional
property
2020 $ 522,700
S-64th Street - Replacement of Wellhouse
Replace old building with new block
building. 2024 $ 509,800
S-7Atlas - System upgrades
Replace drive, add soft start,
extend chlorine room, and
connection for portable generator.
2025 $ 504,000
S-8 Regular Pump Rehabilitation Rebuild one pump. Biennial 75,000$
S-9On-Site Generation
Conversion to on-site generation for
disinfection in place of chlorine gas.
Two per year until complete.
2013 -
201580,000$
S-10Soft Starter Replacement
Install soft starts at all well
locations.Biennial
75,000$
S-11
Transfer of surface water rights to groundwater rights
201710,000$
S-12
Reasonably Anticipated Future Needs (RAFN) water right process
201425,000$
S-13 SCADA Conversion Conversion to Wonderware 2013 35,000$ Storage
T-1Upper Zone Storage 1 MG storage in the NE quadrant 2018 $ 1,631,500
T-2Stanley Hill Storage 0.5 MG of storage 2026 $ 1,016,600
T-3 Blackwell Hill Storage 0.6 MG of storage 2021 $ 1,068,500 T-4 Armstrong Park Storage 0.3 MG of storage 2022 $ 1,016,600 T-5 Fernan Hill Storage 0.7 MG of storage 2020 $ 1,262,900 T-6 Recoating of Prairie Standpipe Recoating of the exterior 2014 $ 233,300 T-7 Recoating of Industrial Standpipe Recoating of the exterior 2019 $ 233,300 T-8 Recoat Tubbs Hill 1M Gal Tank Recoat the exterior 2022 $ 57,500
T-9
Recoat Best Hill Tank - Internal and External
Recoat interior and exterior 2026 $ 419,000
T-10 Best Hill Circulation Recoat interior and exterior 2015 $ 75,000 Distribution
D-1 Piping Modifications for NE Storage 2018 $ 582,000
D-2 Near Hanley Well
Upgrades near Hanley Well to improve east-west transmission. Lines on Christopher Lane and Ramsey.
2019 $ 799,800
D-3 Nettleton Gulch Road
Waterline Improvements at Nettleton Gulch
2020 $ 392,500
D-4
Ramsey Road Upgrades3000 feet of main replacement
between Kathleen and Appleway2027 $ 385,400
D-5 Heutter and Seltice
New lines on Heutter and Seltice to route flow to new river crossing for Blackwell.
2022 $ 1,196,600
D-6 New River Crossing near Heutter 2022 $ 970,600
D-7 Replacement of Existing River Crossing 2023 $ 1,190,200
D-8
Increase transmission mains around Stanley Hill Tank
2026 $ 569,400
D-9
Piping Modifications for Fernan/Stanley Zone separation.
2017 $ 483,400
D-10
Transmission Improvements to Armstrong Park
2023 $ 352,700
D-11Annual Main Replacement
1.5 miles of main replaced annually,
focus on 8 and 12-inch for this
planning period
Annual500,000$
D-12 Fernan Hill - Future Development 2028 500,000$
D-13
New/Replace Meter/Hydrant/Serviced Line work
Annual215,000$
Booster StationsB-1 Elm Street Booster Additional pump at station 2015 $ 185,800
B-2Elm Street Booster
Pump modifications with Fernan
Split2021
64,800$
B-3Fernan Booster
Split Fernan and Elm, New Station
to Fernan2020
527,000$ B-4 Fernan Booster Additional pump at station 2021 64,800$ B-5 Blackwell Hill Add booster station 2018 527,000$ B-6 Blackwell Hill Add booster station 2025 527,000$ B-7 Armstrong Park Additional pump at station 2016 64,800$
Additional Capital Improvements
M-1Fixed Base Water Metering
Modifying the existing system to a
fixed base system for continuous
monitoring.
20201,000,000$
M-2Fixed Base Water Metering
Modifying the existing system to a
fixed base system for continuous
monitoring.
20211,000,000$
M-3Fixed Base Water Metering
Modifying the existing system to a
fixed base system for continuous
monitoring.
20221,000,000$
M-4Comprehensive Rate Study
Complete study of water system
rate structure.2018
75,000$
TOTAL 27,856,400$
Existing
UsersGrowth Existing Users Growth
Existing
UsersGrowth Existing Users Growth
75,000$ 75,000$
280,000$ 220,000$ 280,000$ 220,000$ 280,000$ 220,000$ 280,000$ 220,000$
107,500$ 107,500$ 107,500$ 107,500$ 107,500$ 107,500$ 107,500$ 107,500$
215,000$
387,500$ 327,500$ 462,500$ 327,500$ 602,500$ 327,500$ 462,500$ 327,500$
2031 2032 20332030