city of cleveland, ohio · immunization grants 2010 18-100-1-2-im-0110 93.268 226 ... shap/chore...
TRANSCRIPT

CITY OF CLEVELAND, OHIOSingle Audit Reports
Year Ended December 31, 2012


88 East Broad Street, Fifth Floor, Columbus, Ohio 43215‐3506 Phone: 614‐466‐4514 or 800‐282‐0370 Fax: 614‐466‐4490
www.ohioauditor.gov
City Council City of Cleveland 601 Lakeside Avenue Cleveland, Ohio 44114 We have reviewed the Independent Auditors’ Report of the City of Cleveland, Cuyahoga County, prepared by Clark, Schaefer, Hackett & Co., for the audit period January 1, 2012 through December 31, 2012. Based upon this review, we have accepted these reports in lieu of the audit required by Section 117.11, Revised Code. The Auditor of State did not audit the accompanying financial statements and, accordingly, we are unable to express, and do not express an opinion on them. Our review was made in reference to the applicable sections of legislative criteria, as reflected by the Ohio Constitution, and the Revised Code, policies, procedures and guidelines of the Auditor of State, regulations and grant requirements. The City of Cleveland is responsible for compliance with these laws and regulations. Dave Yost Auditor of State August 26, 2013

This page intentionally left blank.

TABLE OF CONTENTS
Schedule of Expenditures of Federal Awards ............................................................................1 – 8
Report on Internal Control Over Financial Reporting and on Compliance and Other Matters Based on an Audit of Financial Statements Performed in Accordance with Government Auditing Standards............................................................9 – 10
Report on Compliance for Each Major Federal Program; Report on Internal Control Over Compliance; and Report on Schedule of Expenditures of Federal Awards Required by OMB Circular A-133 .............................................................11 – 13
Schedule of Findings and Questioned Costs .........................................................................14 – 17
Schedule of Prior Audit Findings ....................................................................................................18

Federal Grant/ Pass Through FederalPass Through Grantor/ Entity CFDA Federal
Program Title Number Number Expenditures
Department of AgricultureSummer Food Service Program for Children 2012 10.559 294,258$
2 Total Department of Agriculture 294,258
Department of EnergyWeatherization Assistance for Low-Income Persons 2011 81.042 3,506,926Weatherization Assistance for Low-Income Persons 2012 81.042 700,804ARRA-Weatherization Assistance for Low-Income Persons 2009 81.042 715,655
4,923,385
ARRA-Energy Efficiency Appliance Rebate Program Grant 81.127 91,337
ARRA-Energy Efficiency And Conservation Block Grant Program (EECBG) 81.128 1,685,483
3 Total Department of Energy 6,700,205
Department of Health and Human ServiceHealthy Start Initiative Yr 11 93.926 1,140,029Healthy Start Initiative Yr 12 93.926 920,682
Subtotal 2,060,711
Family Planning Services Title X FY 2012 93.217 176,430Family Planning Services Title X FY 2013 93.217 98,527
Subtotal 274,957Pass Through Programs:
Ohio Department of Health:Centers for Disease Control and Prevention - Investigations and Technical Assistance:Substance Abuse and Mental Health Services Administration 5H79TI019946-02 93.243 86,248Substance Abuse and Mental Health Services Administration 5H79TI019946-03 93.243 13,703
Substance Abuse and Mental Health Services Administration 1H79TI023734-01 93.243 67,974Subtotal 167,925
Ohio Department of Health:Immunization Grants 2010 18-100-1-2-IM-0110 93.268 226Immunization Grants 2011 18-100-1-2-IM-0111 93.268 93,132
Subtotal 93,358
Ohio Department of Health:Childhood Lead Poisoning Prevention 2011/2012 18-2-001-1-BD-11 93.197 47,110
Ohio Department of Health:Centers for Disease Control and Prevention - Investigations and Technical Assistance:City Readiness Initiative 2011 18-200-1-2-PI-0211 93.069 2,085City Readiness Initiative 2012 18-200-1-2-PI-0312 93.069 440,705City Readiness Initiative 2013 18-200-1-2-PI-0413 93.069 53,171
Public Health Collaborative 2011 18-1-001-2-BI-11 93.069 346Public Health Collaborative 2012 18-1-001-2-BI-12 93.069 136,633Public Health Collaborative 2013 18-1-001-2-BI-13 93.069 67,421
PHER Area 3 2011 93.069 5,590Subtotal 705,951
(Continued)
CITY OF CLEVELANDCUYAHOGA COUNTY
SCHEDULE OF EXPENDITURES OF FEDERAL AWARDS
For The Year Ended December 31, 2012
1

Federal Grant/ Pass Through FederalPass Through Grantor/ Entity CFDA Federal
Program Title Number Number Expenditures
CITY OF CLEVELANDCUYAHOGA COUNTY
SCHEDULE OF EXPENDITURES OF FEDERAL AWARDS
For The Year Ended December 31, 2012
Department of Health and Human Service (continued):
WRAAA OAA/ADRC Project 93.044 5,591WRAAA Supportive Services 93.044 9,265WRAAA OAA/ADRC Project 93.044 144,092WRAAA Supportive Services 93.044 91,778
Subtotal 250,726
WRAAA Supportive Services/MIPPA 93.779 2,995
Ohio Department of Health:Preventive Health Services-Sexually Transmitted Diseases:Sexually Transmitted Diseases Diagnosis & Treatment 2011 18-2-001-2-BX-11 93.977 26,282Sexually Transmitted Diseases Diagnosis & Treatment 2012 18-2-001-2-SD-0112 93.977 120,649
Subtotal 146,931Ohio Department of Health:HIV Prevention 2010 18-2-001-2-AS-10 93.940 3,381HIV Prevention 2011 18-2-001-2-AS-11 93.940 72,520HIV Prevention 2012 18-2-001-2-AS-12 93.940 721,094
Subtotal 796,995
Cuyahoga County Board of Health:Block Grants for Prevention and Treatment of Substance Abuse:Student Assistance 2012 Treatment 93.959 175,275Student Assistance 2012 Prevention 93.959 5
Subtotal 175,280
Ohio Department of Development:Low-Income Home Energy Assistance-HHS 2011 11-111 93.568 41,407Low-Income Home Energy Assistance-HHS 2012 12-111 93.568 781,879Low-Income Home Energy Assistance-HHS 2009 10-111 93.568 998,089
Subtotal 1,821,375
4 Total Department of Health and Human Services 6,544,314
Department of Housing & Urban DevelopmentOhio Department of Health:Lead Hazard Reduction Demonstration Grant Program 2010 OHLHD0188-08 14.905 695,344
CDBG Yr 30 14.218 197,115CDBG Yr 31 14.218 74,592CDBG Yr 32/33 14.218 33,094CDBG Yr 34 14.218 170,313CDBG Yr 35 14.218 567,363CDBG Yr 36 14.218 3,080,150CDBG Yr 37 14.218 13,508,795CDBG Yr 38 14.218 8,793,866CDBG Neighborhood Stabilization Program 14.218 4,494,036NSP 3 14.218 2,640,302SHAP/CHORE 2007-2008 14.218 105,563ARRA-CDBG Entitlement Grants (CDBG-R) (Recovery Act Funded) 14.253 1,019,087
Subtotal 34,684,276
Lead Technical Studies Grants 2009 OHLHB0400-08 14.900 258,392Lead Technical Studies Grants 2010 OHLHB0400-08 14.900 587,003
Subtotal 845,395(Continued)
2

Federal Grant/ Pass Through FederalPass Through Grantor/ Entity CFDA Federal
Program Title Number Number Expenditures
CITY OF CLEVELANDCUYAHOGA COUNTY
SCHEDULE OF EXPENDITURES OF FEDERAL AWARDS
For The Year Ended December 31, 2012
Department of Housing & Urban Development (continued):Healthy Homes Production Program Grant OHHP0001-11 14.913 59,431
HOME Investment Partnerships Program 1992 14.239 4,185HOME Investment Partnerships Program 2001 14.239 15,712HOME Investment Partnerships Program 2003 14.239 285,000HOME Investment Partnerships Program 2005 14.239 170,000HOME Investment Partnerships Program 2007 14.239 44,568HOME Investment Partnerships Program 2008 14.239 418,259HOME Investment Partnerships Program 2009 14.239 4,623,826HOME Investment Partnerships Program 2011 14.239 2,531,172HOME Investment Partnerships Program 2012 14.239 12,645
Subtotal 8,105,367
Emergency Shelter Grants Program 2010 14.231 89,872Emergency Shelter Grants Program 2011 14.231 923,129
Subtotal 1,013,001
Housing Opportunities for Persons With Aids 2009 14.241 92,492Housing Opportunities for Persons With Aids 2010 14.241 337,996Housing Opportunities for Persons With Aids 2011 14.241 937,760
Subtotal 1,368,248
Empowerment Zones Program 14.244 2,168,446
Evergreen HUD 108 14.248 25,979Hemingway HUD 108 14.248 399,457
Subtotal 425,436
Pass Through Programs: Ohio Department of Development:
CDBG - Neighborhood Stabilization Program A-Z-08-264-1 14.228 855,278 Ohio Department of Development:
ARRA Homeless Prevention S-09-MY-39-0004 14.257 2,050,569
ARRA-Neighborhood Stabilization Program NSP HUD B-09-CN-OH-0032 14.256 12,151,599
5 Total Department of Housing & Urban Development 64,422,390Department of Justice
Public Safety Partnership and Community Policing Grants:Cleveland Universal Hiring II 16.710 1,716,018ARRA Cleveland Universal Hiring II 16.710 3,678,009Federal DOJ-COPS Technology GR 16.710 660,157
Subtotal 6,054,184
2010-Edward Byrne Memorial-JAG 2010-DJ-BX-0251 16.738 105,531ARRA-Recovery Act - Edward Byrne Memorial Justice Assistance Grants to Units of Local Government 2009-SB-B9-0367 16.804 226,777
Pass Through Programs:Ohio Department of Public Safety:2010-Edward Byrne Memorial-NOLETF 2010-JG-A01-6444 16.738 3922011-Edward Byrne Memorial-NOLETF 2011-JG-A01-6444 16.738 140,250
2011-Edward Byrne Memorial-NOVCC 2011-JG-A02-6947 16.738 32,215
(Continued)
3

Federal Grant/ Pass Through FederalPass Through Grantor/ Entity CFDA Federal
Program Title Number Number Expenditures
CITY OF CLEVELANDCUYAHOGA COUNTY
SCHEDULE OF EXPENDITURES OF FEDERAL AWARDS
For The Year Ended December 31, 2012
Department of Justice (continued):
ARRA-Edward Byrne Memorial Justice Assistance Grant Local 2009-SB-B9-0367 16.804 12,126
Cuyahoga County - Department of Justice Affairs:Edward Byrne Memorial Justice Assistance Grant Programs (JAG):2012-Edward Byrne Memorial-JAG 08-JAG-MUN-01 16.738 378,828
Subtotal 896,119
2010 Paul Coverdell 2010-CD-BX-0071 16.742 16,030
State of Ohio - Office of Criminal Justice Services:Law Enforcement Trust Federal 16.000 34,719
State of Ohio - Office of Criminal Justice Services:Violence Against Women Formula Grants :
Education, Training, and Enhanced Services to End Violence Against and Abuse of Women with Disabilities 2011-FW-AX-K004 16.529 5,255
State of Ohio - Office of Criminal Justice Services:Violence Against Women Formula Grants :
VAWA Team Approach 2009 Law 2009-VP-VA2-V041 16.588 1,375VAWA Team Approach 2010 Law 2010-VP-VA2-V041 16.588 119,001VAWA Team Approach 2011 Law 2010-VP-VA2-V041 16.588 94,153VAWA Team Approach 2011 Law Court Training Program 2011-WC-AX-0002 16.588 11,612
Subtotal 226,141State of Ohio - Office of Criminal Justice Services:
VAWA Team Approach 2010 Safety 2010-VP-VA2-V042 16.590 153,477VAWA Team Approach 2010 Safety 2010-VP-VA2-V042 16.590 153,571VAWA Team Approach 2011 Safety 2010-VP-VA2-V042 16.590 131,516
Subtotal 438,564Department of Justice (continued):State of Ohio - Office of Criminal Justice Services:
Juvenile Accountability Incentive Block Grants 2010 2010-JB-MUN-1001 16.523 6,992Juvenile Accountability Incentive Block Grants 2011 2011-JB-MUN-1001 16.523 45,872Juvenile Accountability Incentive Block Grants 2012 2012-JB-MUN-1001 16.523 275
Subtotal 53,139 Ohio Department of Public Safety:
Cleveland V-Grip 2007-PS-PSN-347A 16.609 11,216Cleveland V-Grip 2009-PS-PSN-347A 16.609 18,000
Subtotal 29,216 Ohio Department of Public Safety:
Anti-Gang Initiative 2006 2006-PS-CAG-372 16.744 119,642 Ohio Department of Public Safety:
Gang Resistance Education and Training 2009 2009-JV-FX-0001 16.737 61,234
6 Total Department of Justice 7,934,243(Continued)
Department of Commerce Ohio Department of Jobs and Family Services:
U S Department of Commerce, Economic Development Administration:Revolving Loan Fund Grant - Economic Adjustment Assistance See Footnote 1 11.307 3,055,860
7 Total Department of Commerce 3,055,860Department of Labor Ohio Department of Jobs and Family Services:
WIA Adult Program G-1011-15-0258 17.258 1,111,779WIA Youth Program G-1011-15-0258 17.259 20,812WIA Dislocated Worker Program G-1011-15-0258 17.278 409,721
8 Total Department of Labor 1,542,312(Continued)
4

Federal Grant/ Pass Through FederalPass Through Grantor/ Entity CFDA Federal
Program Title Number Number Expenditures
CITY OF CLEVELANDCUYAHOGA COUNTY
SCHEDULE OF EXPENDITURES OF FEDERAL AWARDS
For The Year Ended December 31, 2012
Department of Transportation
Airport Improvement Program 20.106 3,411,599
Pass Through Programs:Ohio Department of Transportation: Lakes to Lakes Trail/Woodland PID 90183 20.205 596,135SRTS FY 2009 Signals CUY-SRTS-2009-CLE3 20.205 5,647Ohio Department of Transportation:ARRA- East 14th Street PID 87358 20.205 99,650ARRA- Avenue District Ph IV PID 86251 20.205 16,896ARRA- KAMM'S CORNER PID 86255 20.205 431,055Northeast Ohio Areawide Coordinating Agency:Federal NOACA Miles Ave Street PID 84338 20.205 55,000Federal NOACA Kamm's Corner PID 84338 20.205 19,044Federal NOACA East 22 Trans Plan PID 84338 20.205 49,383Federal NOACA League Park Plan PID 84338 20.205 40,929Federal NOACA Westside Market Revival PID 84338 20.205 17,200Federal NOACA Variety Village Study PID 84339 20.205 11,680Federal NOACA UCI Bicycle Network Study PID 84339 20.205 17,452Federal NOACA W. 65 Corridor Study PID 84339 20.205 32,592Federal NOACA E. 55 & Euclid Ave. PID 84339 20.205 49,806Federal NOACA E. 131 St. Corridor Plan PID 84339 20.205 43,160
Subtotal 1,485,629
9 Total Department of Transportation 4,897,228Department of Environmental Protection AgencyDirect Programs:
Air Pollution Control Program Support 2011 66.001 104,295Air Pollution Control Program Support 2012 66.001 2,178,494Air Pollution Control Program Support 2013 66.001 430,155
Subtotal 2,712,944Pass Through Programs:
Ohio Water Development AuthorityOWDA Water 5133 66.468 817,479OWDA Water 6213 66.468 145,916
Subtotal 963,395Department of Environmental Protection Agency (continued):Pass Through Programs:
Cuyahoga County:ARRA-Warner Swasey Brownfield ASBES 2B-00E97301-0 66.818 1,046,401Warner Swasey Clean Ohio BL-00E45201-1 66.818 200,000
Subtotal 1,246,401
Brownfield Assessment Grant 66.814 92,884
Chemical Emergency Preparedness and Prevention:Bio-Watch Program 2011 66.810 3,606Bio-Watch Program 2012 66.810 248,113Bio-Watch Program 2013 66.810 119,870
Subtotal 371,589
10 Total Environmental Protection Agency 5,387,213
Department of Homeland SecurityMetropolitan Medical Response System 2004 97.071 12,548Metropolitan Medical Response System 2004-6 97.071 6,601Metropolitan Medical Response System 2006 97.071 5,857Metropolitan Medical Response System 2007 97.071 4,250Metropolitan Medical Response System 2008 97.071 150,802Metropolitan Medical Response System 2009 97.071 241,790Metropolitan Medical Response System 2010 97.071 246,205
Subtotal 668,053(Continued)
5

Federal Grant/ Pass Through FederalPass Through Grantor/ Entity CFDA Federal
Program Title Number Number Expenditures
CITY OF CLEVELANDCUYAHOGA COUNTY
SCHEDULE OF EXPENDITURES OF FEDERAL AWARDS
For The Year Ended December 31, 2012
Department of Homeland Security (continued):
Assistance to Firefighters Grant 97.044 999Assistance to Firefighters Grant 97.044 48,497Assistance to Firefighters Grant 97.044 42,880
Subtotal 92,376Port Security Grant Program 97.056 378,808Port Security Grant Program 97.056 159,430
Subtotal 538,238National Explosives Detection Canine Team Program 97.072 122,193
FEMA Diaster Grant Federal Portion 97.036 1,022,4492009 Safer Grant 97.083 11,4732010 Safer Grant 97.083 1,875,876
Subtotal 1,887,349
2008 (LETPP) Law Enforcement Terrorism Prevention Program 97.074 9,3002009 (LETPP) Law Enforcement Terrorism Prevention Program 97.074 678,944
Subtotal 688,244
Law Enforcement Officer Reimbursement Agreement Program 97.090 356,788
Cuyahoga County Department of Justice AffairsUrban Area Security Initiative 2007 2007-GE-T7-0030 97.008 132,026Urban Area Security Initiative 2008 2008-GE-T8-0025 97.008 111,745Urban Area Security Initiative 2009 2009-SS-T9-0089 97.008 726,712Urban Area Security Initiative 2010 2010-SS-T0-0012 97.008 405,456Urban Area Security Initiative 2005 97.008 9,143Urban Area Security Initiative 2006 97.008 9,785
Subtotal 1,394,867
Pass Through Programs:State of Ohio Emergency Management Agency:Public Safety Fire Grants:Buffer Zone Protection FY 05 2005-GR-T5-0012 97.078 2Buffer Zone Protection FY 07 2007-BZ-T7-0048 97.078 5,768Buffer Zone Protection FY 09 2009-BF-T9-0046 97.078 102,514
Wind Power Project 97.078 1,57512 Subtotal 109,85911 Total Department of Homeland Security 6,880,416
1 Grand Total 107,658,439$
(Concluded)
6

CITY OF CLEVELAND CUYAHOGA COUNTY
NOTES TO THE “SCHEDULE OF EXPENDITURES OF FEDERAL AWARDS” FOR THE YEAR ENDED DECEMBER 31, 2012
Basis of Presentation The accompanying “Schedule of Expenditures of Federal Awards” includes the federal grant activity of the City of Cleveland (the “City”) and is presented on the cash basis of accounting. The information in this schedule is presented in accordance with the requirements of OMB Circular A-133, Audits of States, Local Governments, and Non-Profit Organizations.
Longwood Apartments Grant The United States Department of Housing and Urban Development (HUD) made available an UpFront grant, CFDA 14.199, to the City in connection with the demolition, rebuilding and redevelopment of the Longwood apartments.
The funding for the plan is to come from a variety of public and private sources, including, tax-exempt bonds issued under Section 103 of the Internal Revenue Code of 1986, private sector equity derived from benefits associated with the low income housing tax credits, HUD Section 221 (d)(4) mortgage insurance, HUD UpFront Grant Program Funds, and City general obligation bond, public utility, Housing Trust Fund, and NDA funds.
The UpFront Grant will be allocated and loaned to the developer throughout the various phases of the project in accordance with a Promissory Note, Interest on this Note began to accrue on April 1, 2006 at a fixed annual rate of 0.25% with this Note maturing on April 1, 2046.
Park Village Apartment Grant
The United States Department of HUD made available an UpFront Grant in the amount of $981,836 for the rehabilitation of the Park Village Apartments, CFDA 14.199.
In addition to the Upfront Grant, funding for the plan includes a private lender first mortgage, a Community Development Block Grant Float Loan and private sector equity derived from benefits associated with low income housing tax credits.
The UpFront Grant funds are being loaned to the developer in accordance with the Promissory Note. Interest on this Note began to accrue on March 19, 2003 at a fixed annual rate of 5.23% per annum with this Note maturing on March 19, 2033.
Footnote 1: Revolving Loan Fund Activity in the Economic Adjustment Assistance, CFDA 11.307 revolving loan fund during 2012:
$1,713,5991,201,599(936,105)(39,848)
1,939,245
808,774647,381
1,456,1553,395,400(339,540)3,055,860
Ending loans receivable balance as of December 31, 2012
Cash balance on hand in the revolving loan fund as of December 31, 2012Cash balance, unobligatedRevolving loan committed but not disbursed
Beginning loans receivable balance as of January 1, 2012Loans made during 2012Loan principal repaid on loans issued prior to 2012
Loan principal repaid on 2012 loans issued
Total unobligated cash and committed but not disbursed cashTotal value of revolving loan portion of the EDA 11.307 program
Less: City's matching shareTotal federal value of revolving loan portion as of December 31, 2012
7
CITY OF CLEVELAND CUYAHOGA COUNTY
NOTES TO THE “SCHEDULE OF EXPENDITURES OF FEDERAL AWARDS” FOR THE YEAR ENDED DECEMBER 31, 2012
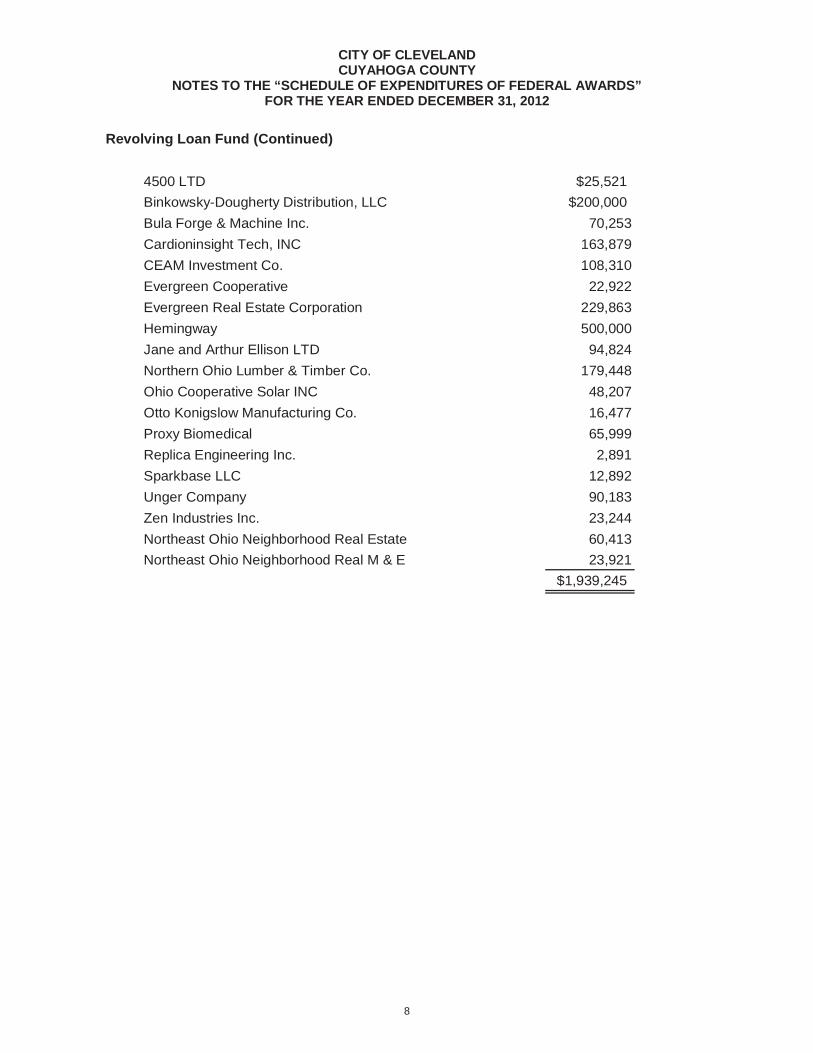
4500 LTD $25,521Binkowsky-Dougherty Distribution, LLC $200,000Bula Forge & Machine Inc. 70,253Cardioninsight Tech, INC 163,879CEAM Investment Co. 108,310Evergreen Cooperative 22,922Evergreen Real Estate Corporation 229,863Hemingway 500,000Jane and Arthur Ellison LTD 94,824Northern Ohio Lumber & Timber Co. 179,448Ohio Cooperative Solar INC 48,207Otto Konigslow Manufacturing Co. 16,477Proxy Biomedical 65,999Replica Engineering Inc. 2,891Sparkbase LLC 12,892Unger Company 90,183Zen Industries Inc. 23,244Northeast Ohio Neighborhood Real Estate 60,413Northeast Ohio Neighborhood Real M & E 23,921
$1,939,245
Revolving Loan Fund (Continued)
8

REPORT ON INTERNAL CONTROL OVER FINANCIAL REPORTING AND ON COMPLIANCEAND OTHER MATTERS BASED ON AN AUDIT OF FINANCIAL STATEMENTS PERFORMEDIN ACCORDANCE WITH GOVERNMENT AUDITING STANDARDS
INDEPENDENT AUDITORS’ REPORT
To the Honorable Frank G. Jackson, Mayor, Members of Council and the Audit CommitteeCity of Cleveland, Ohio:
We have audited, in accordance with the auditing standards generally accepted in the United States of America and the standards applicable to financial audits contained in Government Auditing Standardsissued by the Comptroller General of the United States, the financial statements of the governmental activities, the business-type activities, each major fund, and the aggregate remaining fund information of the City of Cleveland, Ohio ("City") as of and for the year ended December 31, 2012 and the related notes to the financial statements, which collectively comprise the City's basic financial statements and have issued our report thereon dated June 25, 2013, wherein we noted the City implemented Governmental Accounting Standards Board Statement No. 60, 62, 63 and 64.
Internal Control over Financial Reporting
In planning and performing our audit of the financial statements, we considered the City’s internal control over financial reporting (internal control) to determine the audit procedures that are appropriate in the circumstances for the purpose of expressing our opinions on the financial statements, but not for the purpose of expressing an opinion on the effectiveness of the City’s internal control. Accordingly, we do not express an opinion on the effectiveness of the City’s internal control.
A deficiency in internal control exists when the design or operation of a control does not allow management or employees, in the normal course of performing their assigned functions, to prevent, or detect and correct,misstatements on a timely basis. A material weakness is a deficiency, or a combination of deficiencies, in internal control such that there is a reasonable possibility that a material misstatement of the entity’s financial statements will not be prevented, or detected and corrected on a timely basis. A significant deficiency is a deficiency, or a combination of deficiencies, in internal control that is less severe than a material weakness, yet important enough to merit attention by those charged with governance.
Our consideration of internal control was for the limited purpose described in the first paragraph of this section and was not designed to identify all deficiencies in internal control over that might be material weaknesses or significant deficiencies and therefore, material weaknesses or significant deficiencies may exist that were not identified. Given these limitations, during our audit we did not identify any deficiencies in internal control that we consider to be material weaknesses. However, material weaknesses may exist that have not been identified. We did identify a certain deficiency in internal control, described in the accompanying schedule of findings and questioned costs as finding 2012-1 that we consider to be a significant deficiency.

10
Compliance And Other Matters
As part of obtaining reasonable assurance about whether the City's financial statements are free of material misstatement, we performed tests of its compliance with certain provisions of laws, regulations, contracts and grant agreements, noncompliance with which could have a direct and material effect on the determination of financial statement amounts. However, providing an opinion on compliance with those provisions was not an objective of our audit, and accordingly, we do not express such an opinion. The results of our tests disclosed no instances of noncompliance or other matters that are required to be reported under Government Auditing Standards.
City’s Response to Finding
The City’s response to the finding identified in our audit is described in the accompanying schedule of findings and questioned costs. The City’s response was not subjected to the auditing procedures applied in the audit of the financial statements and accordingly, we express no opinion on it.
Purpose of this Report
The purpose of this report is solely to describe the scope of our testing of internal control and compliance and the result of that testing, and not to provide an opinion on the effectiveness of the entity’s internal control or on compliance. This report is an integral part of an audit performed in accordance with Government Auditing Standards in considering the entity’s internal control and compliance. Accordingly, this communication is not suitable for any other purpose.
CClark, Schaefer, Hackett & Co.Cincinnati, OhioJune 25, 2013

REPORT ON COMPLIANCE FOR EACH MAJOR FEDERAL PROGRAM; REPORTON INTERNAL CONTROL OVER COMPLIANCE; AND REPORT ON SCHEDULE OFEXPENDITURES OF FEDERAL AWARDS REQUIRED BY OMB CIRCULAR A-133
INDEPENDENT AUDITORS’ REPORT
To the Honorable Frank G. Jackson, Mayor, Members of Council and the Audit CommitteeCity of Cleveland, Ohio:
Report on Compliance for Each Major Federal Program
We have audited the City of Cleveland, Ohio’s (the “City”) compliance with the types of compliance requirements described in the OMB Circular A-133 Compliance Supplement that could have a direct and material effect on each of the City’s major federal programs for the year ended December 31, 2012. The City’s major federal programs are identified in the summary of auditors’ results section of the accompanying schedule of findings and questioned costs.
Management’s Responsibility
Management is responsible for compliance with the requirements of laws, regulations, contracts, and grants applicable to its federal programs.
Auditors’ Responsibility
Our responsibility is to express an opinion on compliance for each of the City’s major federal programs based on our audit of the types of compliance requirements referred to above. We conducted our audit of compliance in accordance with auditing standards generally accepted in the United States of America; the standards applicable to financial audits contained in Government Auditing Standards, issued by the Comptroller General of the United States; and OMB Circular A-133, Audits of States, Local Governments, and Non-Profit Organizations. Those standards and OMB Circular A-133 require that we plan and perform the audit to obtain reasonable assurance about whether noncompliance with the types of compliance requirements referred to above that could have a direct and material effect on a major federal program occurred. An audit includes examining, on a test basis, evidence about the City’s compliance with those requirements and performing such other procedures as we considered necessary in the circumstances.
We believe that our audit provides a reasonable basis for our opinion on compliance for each major federal program. However, our audit does not provide a legal determination of the City’s compliance.
Opinion on Each Major Federal Program
In our opinion, the City complied, in all material respects, with the types of compliance requirements referred to above that could have a direct and material effect on each of its major federal programs for the year ended December 31, 2012.

12
Other Matters
The results of our auditing procedures disclosed instances of noncompliance, which are required to be reported in accordance with OMB Circular A-133 and which are described in the accompanying schedule of findings and questioned costs as items 2012-2, 2012-3 and 2012-4. Our opinion on each major federal program is not modified with respect to these matters.
The City’s responses to the noncompliance findings identified in our audit are described in the accompanying schedule of findings and questioned costs. The City’s responses were not subjected to the auditing procedures applied in the audit of compliance and, accordingly, we express no opinion on the responses.
Report on Internal Control Over Compliance
Management of the City is responsible for establishing and maintaining effective internal control over compliance with the types of compliance requirements referred to above. In planning and performing our audit of compliance, we considered the City’s internal control over compliance with the types of compliance requirements that could have a direct and material effect on a major federal program to determine the auditing procedures that are appropriate in the circumstances for the purpose of expressing an opinion on compliance for each major federal program and to test and report on internal control over compliance in accordance with OMB Circular A-133, but not for the purpose of expressing an opinion on the effectiveness of internal control over compliance. Accordingly, we do not express an opinion on the effectiveness of the City’s internal control over compliance.
A deficiency in internal control over compliance exists when the design or operation of a control over compliance does not allow management or employees, in the normal course of performing their assigned functions, to prevent, or detect and correct, noncompliance with a type of compliance requirement of a federal program on a timely basis. A material weakness in internal control over compliance is a deficiency, or combination of deficiencies, in internal control over compliance, such that there is a reasonable possibility that material noncompliance with a type of compliance requirement of a federal program will not be prevented, or detected and corrected, on a timely basis. A significant deficiency in internal control over compliance is a deficiency, or a combination of deficiencies, in internal control over compliance with a type of compliance requirement of a federal program that is less severe than a material weakness in internal control over compliance, yet important enough to merit attention by those charged with governance.
Our consideration of internal control over compliance was for the limited purpose described in the first paragraph of this section and was not designed to identify all deficiencies in internal control over compliance that might be material weaknesses or significant deficiencies and therefore material weaknesses or significant deficiencies may exist that were not identified. We did not identify any deficiencies in internal control over compliance that we consider to be material weaknesses. However, we identified certain deficiencies in internal control over compliance, as described in the accompanying schedule of findings and questioned costs as items 2012-2, 2012-3 and 2012-4 that we consider to be significant deficiencies.
The City’s responses to the internal control over compliance findings identified in our audit are described in the accompanying schedule of findings and questioned costs. The City’s responses were not subjected to the auditing procedures applied in the audit of compliance and, accordingly, we express no opinion on the responses.
The purpose of this report on internal control over compliance is solely to describe the scope of our testing of internal control over compliance and the results of that testing based on the requirements of OMB Circular A-133. Accordingly, this report is not suitable for any other purpose.
13
Report on Schedule of Expenditures of Federal Awards Required by OMB Circular A-133
We have audited the financial statements of the City as of and for the year ended December 31, 2012, and have issued our report thereon dated June 25, 2013, which contained an unmodified opinion on those financial statements. Our audit was conducted for the purpose of forming an opinion on the financial statements as a whole. The accompanying schedule of expenditures of federal awards ispresented for purposes of additional analysis as required by OMB Circular A-133 and is not a required part of the basic financial statements. Such information is the responsibility of management and was derived from and relates directly to the underlying accounting and other records used to prepare the financial statements. The information has been subjected to the auditing procedures applied in the audit of the financial statements and certain additional procedures, including comparing and reconciling such information directly to the underlying accounting and other records used to prepare the financial statements or to the financial statements themselves, and other additional procedures in accordance with auditing standards generally accepted in the United States of America. In our opinion, the schedule of expenditure of federal awards is fairly stated in all material respects in relation to the financial statements as a whole.
CClark, Schaefer, Hackett & Co.
Cincinnati, OhioJune 25, 2013

14
CITY OF CLEVELAND, OHIOSchedule of Findings and Questioned CostsYear Ended December 31, 2012
Section I – Summary of Auditors’ Results
Financial Statements
Type of auditors’ report issued: UnmodifiedInternal control over financial reporting:
! Material weakness(es) identified? None! Significant deficiency(ies) identified not
considered to be material weaknesses? Yes
Noncompliance material to the financial statements noted? None
Federal Awards
Internal control over major programs:! Material weakness(es) identified? None! Significant deficiency(ies) identified not
considered to be material weaknesses? Yes
Type of auditors’ report issued on compliance for major programs: Unmodified
Any audit findings that are required to be reported in accordance with 510(a) of Circular A-133? Yes
Identification of major programs:
! CFDA 14.239 – HOME Investment Partnerships Program! CFDA 14.256 – ARRA - Neighborhood Stabilization Program! CFDA 14.257 – ARRA – Homelessness Prevention and Rapid
Re-Housing Program! CFDA 16.710 – ARRA – Public Safety Partnership and Community
Policing Grants! CFDA 20.205 – ARRA – Highway Planning and Construction! CFDA 81.128 – ARRA – Energy Efficiency and Conservation Block
Grant Program
Dollar threshold to distinguish between Type A and Type B Programs: $3,000,000
Auditee qualified as low-risk auditee? Yes

15
Section II – Financial Statement Findings
Finding 2012-1 – Correction of an Error
During 2012, new fiscal management of the Department of Public Utilities, Division of Waterdetermined the City had not previously reported nearly $165 million of infrastructure capital assets in the City’s financial statements. These capital assets were obtained by the City through water service agreements signed over a period of years beginning in 2005 with surrounding cities served by the Division of Water. The agreements specify the City will maintain the water system infrastructure in exchange for ownership of the assets.
The unrecorded capital assets acquired prior to 2012 have been reported in the current year financial statements as a prior period restatement. The Division of Water capitalized assets relating to new water service agreements signed in 2012. We recommend the City develop procedures for future significant contracts and agreements to determine the appropriate accounting and reporting.
Management Response: The City recognizes the importance of ensuring Division of Water’s financial statements are correct, the Division of Fiscal Control inadvertently did not add the assets as water service agreements were entered into. As part of the Department’s reorganization, the process of recognizing all assets in the year they were required has been assigned to our capital assets unit which will work with the Division’s engineering unit to make the appropriate updates within the Advantage Accounting system at the time that the agreements are entered into.
Section III – Federal Award Findings and Questioned Costs
DEPARTMENT OF HOUSING AND URBAN DEVELOPMENT
Finding 2012-2 – ARRA - Neighborhood Stabilization Program – CFDA 14.256
Condition: We performed tests to determine if the City was in compliance with time and effort documentation requirements for payroll charged to the federal program. The City allocates payroll and benefits for certain employees working on the federal program. Employees spending less than 100% of their time on the program do not track actual time spent on the program, instead their time is charged based on a budget estimate.
Criteria: 2 CFR 225, Appendix B requires where employees work on multiple activities or cost objectives, a distribution of their salaries and wages to be supported by personnel activity reports or equivalent documentation. Personnel activity reports are required under various circumstances, including when employees work on more than one federal award. Personnel activity reports must reflect after-the-fact distribution of actual activity of each employee, must account for the total activity for which each employee is compensated, must be prepared at least monthly and must be signed by the employee. 2 CFR 225, Appendix B goes on to state, budget estimates or other distribution percentages determined before the services are performed do not qualify as support for charges to Federal awards.
Context: The City charged $207,891 for payroll costs to the program for employees charging less than 100% of their time to this program. None of these employees prepared personnel activity reports or equivalent documentation.
Cause: The Department of Community Development was unaware of time and effortdocumentation requirements for employees charging less than 100% to the program.
Effect: Costs of $207,891 are questioned as a result of not maintaining appropriate time and effort documentation.

16
Recommendation: We recommend the City communicate the importance of maintaining time and effort documentation to all departments and divisions operating federal programs and ensure proper documentation is maintained.
Views of Responsible Officials: The NSP-ARRA costs in question ($207,891, 0.82% of the grant)are real, eligible, reasonable, and NSP-related.
In the future, the Department of Community Development agrees to use either timesheets or develop an alternative method pre-approved by HUD. The importance of keeping timesheets reflecting actual time spent on each grant has been communicated to administrative staff and is being maintained for 2013.
Finding 2012-3 – Neighborhood Stabilization Program – CFDA 14.218
Condition: While testing the ARRA Neighborhood Stabilization program, we noted employees charging time to that program also charged time to the Neighborhood Stabilization Program. Employees spending less than 100% of their time on the program do not track actual time spent on the program, instead their time is charged based on a budget estimate.
Criteria: 2 CFR 225, Appendix B requires where employees work on multiple activities or cost objectives, a distribution of their salaries and wages to be supported by personnel activity reports or equivalent documentation. Personnel activity reports are required under various circumstances, including when employees work on more than one federal award. Personnel activity reports must reflect after-the-fact distribution of actual activity of each employee, must account for the total activity for which each employee is compensated, must be prepared at least monthly and must be signed by the employee. 2 CFR 225, Appendix B goes on to state, budget estimates or other distribution percentages determined before the services are performed do not qualify as support for charges to Federal awards.
Context: The City charged $337,511 of payroll costs for employees charging less than 100% of their time to this program. None of these employees prepared personnel activity reports or equivalent documentation.
Cause: The Department of Community Development was unaware of time and effort documentation requirements for employees charging less than 100% to the program.
Effect: Costs of $337,511 are questioned as a result of not maintaining appropriate time and effort documentation.
Recommendation: We recommend the City communicate the importance of maintaining time and effort documentation to all departments and divisions operating federal programs and ensure proper documentation is maintained.
Views of Responsible Officials: The NSP1 costs in question ($336,511, 2.09% of the grant) are real, eligible, reasonable, and NSP-related.
In the future, the Department of Community Development agrees to use either timesheets or develop an alternative method pre-approved by HUD. The importance of keeping timesheets reflecting actual time spent on each grant has been communicated to administrative staff and is being maintained for 2013.

17
DEPARTMENT OF ENERGY
Finding 2012-4 – ARRA – Energy Efficiency and Conservation Block Grant Program –CFDA 81.128
Condition: We performed tests to determine if the City was in compliance with time and effort requirements for payroll charged to the federal program. The City allocates payroll and benefits for certain employees working on the federal program. Employees spending less than 100% of their time on the program do not track actual time spent on the program, instead their time is charged based on budget estimates.
Criteria: 2 CFR 225, Appendix B requires where employees work on multiple activities or cost objectives, a distribution of their salaries and wages to be supported by personnel activity reports or equivalent documentation. Personnel activity reports are required under various circumstances, including when employees work on an unallowable activity and a direct cost activity. Personnel activity reports must reflect after-the-fact distribution of actual activity of each employee, must account for the total activity for which each employee is compensated, must beprepared at least monthly and must be signed by the employee. 2 CFR 225, Appendix B goes on to state, budget estimates or other distribution percentages determined before the services are performed do not qualify as support for charges to Federal awards.
Context: The City charged $67,286 payroll costs for an employee which represented 90% of the employee’s salary even though the City asserts the employee actually spends 100% of his time on the program. For employees that spend 100% of their time on a federal program, a semi-annual certificate should be prepared which indicates the employee fully devotes their time to the program in lieu of preparing personnel activity reports. No such certificates were prepared for the employee nor did the employee prepare personnel activity reports which support the allocation of 90% of their salary to the program.
Cause: The Office of Sustainability was unaware of time and effort documentation requirements for employees charging less than 100% to the program.
Effect: Costs of $67,286 are questioned as a result of not maintaining appropriate time and effort documentation.
Recommendation: We recommend the City communicate the importance of maintaining time and effort documentation to all departments and divisions operating federal programs and ensure proper documentation is maintained.
Views of Responsible Officials: We reviewed the importance of the time and effort documentation with personnel who oversee the grant. In addition, all personnel who are charged to the grant part time will submit detailed timesheets weekly to the Utilities CFO office. Any employees who spend 100% of their time on the grant will complete a semi-annual certificate indicating the employee fully devotes their time to the program.

18
CITY OF CLEVELAND, OHIOSchedule of Prior Audit FindingsYear Ended December 31, 2012
Finding 2011-1 – Highway Planning and Construction – CFDA 20.205
We performed tests to determine if the City was in compliance with matching requirements of this grant agreement. The Westside Market Revival project required a local match of $10,000. The City met this matching requirement with the use of funds from another Federal grant program. 49 CFR 18.24 prohibits using costs borne by other Federal grant agreements to meet a cost sharing or matching requirements.
Status: Corrected.
CITY OF CLEVELAND, OHIO
COMPREHENSIVE ANNUAL FINANCIAL REPORT
For the Fiscal Year Ended December 31, 2012
CITY OF CLEVELAND
Comprehensive Annual Financial Report
For the year ended December 31, 2012
Issued by the Department of Finance
Sharon Dumas Director
James E. Gentile, CPA City Controller

2
This Page Intentionally Left Blank.

3
CITY OF CLEVELAND, OHIO
TABLE OF CONTENTS COMPREHENSIVE ANNUAL FINANCIAL REPORT
FOR THE YEAR ENDED DECEMBER 31, 2012
Page
Introductory Section Transmittal Letter ........................................................................................................................................... 7-19 City Officials .................................................................................................................................................. 21 City Council ................................................................................................................................................... 22 Certificate of Achievement for Excellence in Financial Reporting ................................................................ 23 Administrative Organization Chart ................................................................................................................ 24 Financial Highlights ....................................................................................................................................... 25
Financial Section Independent Auditors’ Report ........................................................................................................................ 29-31 Management’s Discussion and Analysis ........................................................................................................ 33-51 Basic Financial Statements: Government-Wide Financial Statements: Statement of Net Position ....................................................................................................................... 54-55 Statement of Activities ............................................................................................................................ 56-57 Fund Financial Statements: Balance Sheet - Governmental Funds ..................................................................................................... 58 Statement of Revenues, Expenditures and Changes in Fund Balances - Governmental Funds .............. 59 Reconciliation of the Statement of Revenues, Expenditures and Changes in Fund Balances to the Statement of Activities of Governmental Funds ....................................................................... 60 Statement of Revenues, Expenditures and Changes in Fund Balances (Budget and Actual) - General Fund ....................................................................................................................................... 61 Statement of Net Position - Proprietary Funds ....................................................................................... 62-63 Statement of Revenues, Expenses and Changes in Fund Net Position - Proprietary Funds ................... 64 Statement of Cash Flows - Proprietary Funds ......................................................................................... 65-66 Statement of Fiduciary Assets and Liabilities ......................................................................................... 67 Notes to Financial Statements .................................................................................................................... 69-116 Supplementary Information: Combining and Individual Fund Financial Statements and Schedules: General Fund: Schedule of Revenues, Expenditures and Changes in Fund Balance - Budget and Actual (Non-GAAP Budgetary Basis) - General Fund-Legal Appropriation Level ................................... 118-125 Nonmajor Governmental Funds: Nonmajor Governmental Funds. ......................................................................................................... 127-129 Combining Balance Sheet - Nonmajor Governmental Funds ............................................................ 130-137 Combining Statement of Revenues, Expenditures and Changes in Fund Balances - Nonmajor Governmental Funds ....................................................................................................................... 138-145 Combining Schedule of Revenues, Expenditures and Changes in Fund Balances – Budget and Actual (Non-GAAP Budgetary Basis) - Budgeted Special Revenue Funds - Legal Appropriation Level ..................................................................................................................... 146-149 Combining Schedule of Revenues, Expenditures and Changes in Fund Balances - Budget and Actual (Non-GAAP Budgetary Basis) - Budgeted Debt Service Funds - Legal Appropriation Level ..................................................................................................................... 150-153

4
Page
Nonmajor Enterprise Funds: Nonmajor Enterprise Funds ................................................................................................................. 155 Combining Statement of Net Position - Nonmajor Enterprise Funds .................................................. 156-159 Combining Statement of Revenues, Expenses and Changes in Fund Net Position - Nonmajor Enterprise Funds ............................................................................................................. 160-161 Combining Statement of Cash Flows - Nonmajor Enterprise Funds ................................................... 162-165 Internal Service Funds: Internal Service Funds ......................................................................................................................... 167 Combining Statement of Net Position - All Internal Service Funds .................................................... 168-171 Combining Statement of Revenues, Expenses and Changes in Fund Net Position - All Internal Service Funds ............................................................................................................... 172-173 Combining Statement of Cash Flows - All Internal Service Funds ..................................................... 174-175 Agency Funds: Agency Funds ...................................................................................................................................... 177 Combining Statement of Changes in Assets and Liabilities - All Agency Funds ............................... 178-179 Capital Assets Used in the Operation of Governmental Funds: Schedule by Type ................................................................................................................................ 182 Schedule by Function and Activity ..................................................................................................... 183 Schedule of Changes by Function and Activity .................................................................................. 184
Statistical Section Table of Contents ................................................................................................................................ S2 Net Position by Component - Last Ten Years ..................................................................................... S3 Changes in Net Position – Last Ten Years .......................................................................................... S4 Fund Balances, Governmental Funds – Last Ten Years ...................................................................... S5 Changes in Fund Balances, Governmental Funds – Last Ten Years ................................................... S6 Assessed Valuation and Estimated Actual Values of Taxable Property – Last Ten Years ................................................................................................................................. S7 Property Tax Rates – Direct and Overlapping Governments – Last Ten Years .................................. S8 Property Tax Levies and Collections – Last Ten Years ...................................................................... S9 Principal Taxpayers – Real Estate Tax, 2012 and 2003 ...................................................................... S10 Income Tax Revenue Base and Collections – Last Ten Years ............................................................ S11 Ratio of Outstanding Debt to Total Personal Income and Debt Per Capita – Last Ten Years ................................................................................................................................. S12 Ratio of General Obligation Bonded Debt to Assessed Value and Bonded Debt Per Capita – Last Ten Years ............................................................................................................ S13 Computation of Direct and Overlapping Governmental Activities Debt ............................................ S14 Legal Debt Margin – Last Ten Years .................................................................................................. S15 Pledged Revenue Coverage, Airport Revenue Bonds – Last Ten Years ............................................. S16 Pledged Revenue Coverage, Power System Revenue Bonds – Last Ten Years .................................. S17 Pledged Revenue Coverage, Water System Revenue Bonds – Last Ten Years .................................. S18 Principal Employers, 2012 and 2003 ................................................................................................... S19 Demographic and Economic Statistics – Last Ten Years .................................................................... S20 Full-Time Equivalent City Government Employees by Function/Program – Last Nine Years ............................................................................................................................... S21 Operating Indicators by Function/Program – Last Ten Years ............................................................. S22 Capital Assets Statistics by Function/Program – Last Ten Years ....................................................... S23 Schedule of Statistics – General Fund ................................................................................................. S24

5
INTRODUCTORYSECTION

6
This Page Intentionally Left Blank.

7
June 25, 2013
Honorable Mayor Frank G. Jackson City of Cleveland Council and Citizens of the City of Cleveland, Ohio
Introduction
We are pleased to submit the Comprehensive Annual Financial Report of the City of Cleveland (the City) for the year ended December 31, 2012. This report, prepared by the Department of Finance, includes the basic financial statements that summarize the various operations and cash flows related to the City’s 2012 activities. Our intention is to provide a clear, comprehensive and materially accurate overview of the City’s financial position at the close of last year. The enclosed information has been designed to allow the reader to gain an understanding of the City’s finances, including financial trends, financial instruments and fund performances. The City has complete responsibility for all information contained in this report.
This report consists of management’s representations concerning the finances of the City. Consequently, management assumes full responsibility for the completeness and reliability of all of the information presented in this report. To provide a reasonable basis for making these representations, management of the City has established a comprehensive internal control framework that is designed both to protect the City’s assets from loss, theft, or misuse and to compile sufficient reliable information for the preparation of the City’s financial statements in conformity with generally accepted accounting principles in the United States of America (GAAP). Because the cost of internal controls should not outweigh their benefits, this comprehensive framework of internal controls has been designed to provide reasonable, rather than absolute, assurance that the financial statements will be free of material misstatement. As management, we assert that, to the best of our knowledge and belief, this financial report is complete and reliable in all material respects.
The City’s financial statements have been audited by Clark, Schaefer, Hackett & Co. The goal of the independent audit is to provide reasonable assurance that the financial statements of the City for the year ended December 31, 2012, are free of material misstatement. The independent audit involved examining, on a test basis, evidence supporting the amounts and disclosures in the financial statements; assessing the accounting principles used and significant estimates made by management; and evaluating the overall financial statement presentation. Clark, Schaefer, Hackett & Co. concluded, based upon its audit, that there was a reasonable basis for rendering an unmodified opinion that the City’s financial statements for the year ended December 31, 2012 are fairly presented in conformity with GAAP. The Independent Auditors’ Report is presented as the first component of the financial section of this report.
The independent audit of the financial statements of the City was part of a broader, federally mandated “Single Audit” designed to meet the special needs of federal grantor agencies. The standards governing Single Audit engagements require the independent auditor to report not only on the fair presentation of the financial statements, but also on the audited government’s internal controls and compliance with legal requirements, with special emphasis on internal controls and legal requirements involving the administration of federal awards. These reports are available in the City’s separately issued Single Audit Report.

8
GAAP requires that management provide a narrative introduction, overview and analysis to accompany the basic financial statements in the form of Management’s Discussion and Analysis (MD&A). This letter of transmittal is designed to complement the MD&A and should be read in conjunction with it. The City’s MD&A can be found immediately following the Independent Auditors’ Report.
Structure of this Comprehensive Annual Financial Report
This Comprehensive Annual Financial Report (CAFR) is designed to assist the reader in understanding the City’s finances. This CAFR consists of the following sections:
The Introductory Section, which includes this letter of transmittal and contains information pertinent to the City’s management and organization.
The Financial Section contains the Independent Auditors’ Report, Management’s Discussion and Analysis (MD&A), Basic Financial Statements and various other statements and schedules pertaining to the City’s funds and activities.
The Statistical Section contains numerous tables of financial and demographic information. Much of this information is shown with comparative data for the ten-year period from 2003 through 2012.
References throughout this report to Note 1, Note 2, etc., are to the Notes to Financial Statements included in the Financial Section of this CAFR.
Profile of the Government
The City
The City is a municipal corporation and political subdivision of the State of Ohio. It is located on the southern shore of Lake Erie and is the county seat of Cuyahoga County.
The City is included in the Cleveland-Elyria-Mentor, OH Metropolitan Statistical Area (MSA), comprised of Cuyahoga, Lake, Lorain, Geauga and Medina counties. This MSA is the 28th largest of 366 Metropolitan Areas in the United States and the largest Metropolitan Area in the State of Ohio.
Cleveland is located in the northeast part of the state, approximately 150 miles north-east of Columbus. Bordering Lake Erie, Cleveland is home to world-renowned medical facilities, professional sports venues, Severance Hall, numerous State of Ohio lakefront parks, the Port of Cleveland, the Rock and Roll Hall of Fame and operates the nation’s ninth largest water system. Interstate highways I-71, I-480, I-77 and I-90 serve as some of the City’s major transportation arteries. The City is rich in educational and medical facilities, including Cleveland State University, Case Western Reserve University, the Cleveland Clinic and University Hospitals of Cleveland.
City Government
The City operates under, and is governed by, the Charter which was first adopted by the voters in 1913 and has been and may be further amended by the voters from time to time. The City is also subject to certain general State laws that are applicable to all cities in the State. In addition, under Article XVIII, Section 3 of the Ohio Constitution, the City may exercise all powers of local self-government and may exercise police powers to the extent not in conflict with applicable general State laws. The Charter provides for a mayor-council form of government.
The City’s chief executive and administrative officer is the Mayor, elected by the voters for a four-year term. Frank G. Jackson was elected as Mayor of the City in November 2005 and began his first term on January 2, 2006. He was re-elected to a second term in November 2009. Prior to assuming office as Mayor, Mr. Jackson served as a Ward 5 City Council member for 16 years and in 2002, was elected by the 21-member City Council to serve as Council President. Under the Charter, the Mayor may veto any legislation passed by Council, but a veto may be overridden by a two-thirds vote of all members of the Council.

9
Legislative authority is currently vested in a 19-member Council. Council members serve four year terms and are elected from wards. The present terms of the Mayor and Council members expire on December 31, 2013. The Council fixes compensation of City officials and employees and enacts ordinances and resolutions relating to City services, tax levies, appropriating and borrowing money, licensing and regulating businesses and trades, and other municipal functions. The presiding officer is the President of Council, elected by the Council members. Martin J. Sweeney was re-elected as President of Council in November 2009. The Clerk of Council is appointed by Council. The Charter establishes certain administrative departments; the Council may establish divisions within departments or additional departments. The Mayor appoints all of the directors of the City’s 12 departments.
The Director of Finance and City Controller believe that, to the best of their knowledge, the data contained in this report present fairly the financial position and results of operations of the various funds of the City. All necessary disclosures areincluded in this report to enable the reader to understand the City’s financial activities.
Financial Reporting Entity
The City has applied guidelines established by Governmental Accounting Standards Board (GASB) Statement No. 14, TheFinancial Reporting Entity. Provisions outlined in this statement define the operational, functional and organizational units for which the City, “acting as Primary Government”, is required to include as part of its reporting entity. The inclusion of a component unit as part of the City’s reporting entity requires the appointment of a voting majority of the component unit’s board and either (1) the City’s ability to impose its will over the component unit or (2) the possibility that the component unit will provide a financial benefit to or impose a financial burden on the City.
Under these provisions, the City’s financial reporting entity acts as a single rather than multi-component unit. The provisions permit the entity to include all funds, agencies, boards and commissions that, by definition, comprise components within the primary government itself. For the City, these components include police and fire protection services, waste collection, parks and recreation, health, select social services and general administrative services. Primary enterprise activities owned and operated by the City include a water system, electric distribution system and two airports.
In accordance with GASB Statement No. 14, the Cuyahoga Metropolitan Housing Authority, Cleveland-Cuyahoga Port Authority and Cleveland Municipal School District are defined as related organizations and Gateway Economic Development Corporation of Greater Cleveland is defined as a jointly governed organization. None of these organizations are included within the City’s reporting entity.
Internal Control
Management of the City is responsible for establishing and maintaining an internal control structure designed to ensure that the assets of the City are protected from loss, theft or misuse. The internal control structure ensures that accounting data is compiled to allow for the preparation of financial statements in conformity with GAAP. The internal control structure is designed to provide reasonable assurances that these objectives are met. The concept of reasonable assurance recognizes that (1) the cost of a control should not exceed the benefits likely to be derived; and (2) the valuation of costs and benefits requires estimates and judgments by management.
As a recipient of federal, state and county financial assistance, the City is also responsible for maintaining a rigorous internal control structure that ensures full compliance with applicable laws and regulations related to those programs. This internal control structure is subject to periodic evaluation by management, external auditors and the internal audit staff of the City. The City is required to undergo an annual audit in conformity with the provisions of the Single Audit Act Amendments of 1996 and U.S. Office of Management and Budget Circular A-133, Audits of State and Local Governments and Non-profit Organizations. The information related to the Single Audit, including the schedule of federal awards expenditures, findings and recommendations and auditor’s reports on the internal control structure and compliance with applicable laws and regulations are included in a separate report.
Accounting and Financial Reporting
The City’s accounting system is organized and operated on a fund basis. A fund is defined as an independent fiscal and accounting entity with a self-balancing set of accounts. The types of funds to be used are determined by GAAP and the number of individual funds established is determined by sound financial administration. Each fund is a separate accounting entity with its own self-balancing set of accounts, assets, liabilities and fund balance. The City’s governmental funds include the General Fund, Special Revenue Funds, Debt Service Funds and Capital Projects Funds. The City’s proprietary funds are its Enterprise Funds that provide services to the general public, including utilities and airport serviceand Internal Service Funds that provide services to City departments, divisions and other governments. The City also maintains Fiduciary Funds to account for assets held by the City in an agent capacity for individuals, private organizations and other governments.

10
Except for budgetary purposes, the basis of accounting used by the City conforms to GAAP as applicable to governmental units. All governmental funds are accounted for using a current financial resources (current assets and current liabilities) measurement focus. The modified accrual basis of accounting is utilized for governmental funds. Revenues are recognized when they are susceptible to accrual (both measurable and available). Expenditures are recognized when the related liability is incurred, except for interest on long-term debt which is recorded when due.
The measurement focus of the City’s proprietary funds is on the flow of total economic resources (all assets and liabilities). The accrual basis of accounting (revenues are recognized when earned and expenses when incurred) is utilized for the Enterprise and Internal Service Funds.
The City’s basis of accounting for budgetary purposes differs from GAAP in that revenues are recognized when received, rather than when susceptible to accrual (measurable and available) and encumbrances and pre-encumbrances are included as expenditures rather than included in fund balances.
In November of 2010, Governmental Accounting Standards Board (GASB) Statement No. 60, Accounting and Financial Reporting for Service Concession Arrangements was issued. This Statement is effective for fiscal periods beginning after December 15, 2011. The objective of this Statement is to improve financial reporting by addressing issues related to service concession arrangements (SCAs), which are a type of public-private or public-public partnership. As used in this Statement, an SCA is an arrangement between a transferor (a government) and an operator (governmental or nongovernmental entity) in which (1) the transferor conveys to an operator the right and related obligation to provide services through the use of infrastructure or another public asset (a “facility”) in exchange for significant consideration and(2) the operator collects and is compensated by fees from third parties. As required, the City has implemented GASB Statement No. 60 effective for the 2012 fiscal year.
In December of 2010, Governmental Accounting Standards Board (GASB) Statement No. 62, Codification of Accounting and Financial Reporting Guidance Contained in Pre-November 30, 1989 FASB and AICPA Pronouncements was issued. This Statement is effective for fiscal periods beginning after December 15, 2011. The objective of this Statement is to incorporate into the GASB’s authoritative literature certain accounting and financial reporting guidance that is included in the following pronouncements issued on or before November 30, 1989, which does not conflict with or contradict GASB pronouncements: (1) Financial Accounting Standards Board (FASB) Statements and Interpretations, (2) Accounting Principles Board Opinions and (3) Accounting Research Bulletins of the American Institute of Certified Public Accountants’ (AICPA) Committee on Accounting Procedure. As required, the City has implemented GASB Statement No. 62 effective for the 2012 fiscal year.
In June of 2011, Governmental Accounting Standards Board (GASB) Statement No. 63, Financial Reporting of Deferred Outflows of Resources, Deferred Inflows of Resources and Net Position was issued. This Statement is effective for fiscal periods beginning after December 15, 2011. This Statement provides financial reporting guidance for deferred outflows of resources and deferred inflows of resources. Concepts Statement No. 4, Elements of Financial Statements, introduced and defined those elements as a consumption of net position by the government that is applicable to a future reporting period and an acquisition of net position by the government that is applicable to a future reporting period, respectively. Previous financial reporting standards do not include guidance for reporting those financial statement elements, which are distinct from assets and liabilities. As required, the City has implemented GASB Statement No. 63 effective for the 2012 fiscal year.
In June of 2011, Governmental Accounting Standards Board (GASB) Statement No. 64, Derivative Instruments: Application of Hedge Accounting Termination Provision was issued. This Statement is effective for fiscal periods beginning after June 15, 2011. The objective of this Statement is to clarify whether an effective hedging relationship continues after the replacement of a swap counterparty or a swap counterparty’s credit support provider. This Statement sets forth criteria that establish when the effective hedging relationship continues and hedge accounting should continue to be applied. As required, the City has implemented GASB Statement No. 64 effective for the 2012 fiscal year.

11
Budgeting Procedures
Detailed provisions regulating the City’s budget, tax levies and appropriations are set forth in the Ohio Revised Code and the City Charter. The Mayor is required to submit the appropriation budget, called “The Mayor’s Estimate” to City Council by February 1 of each year. The Council may adopt a temporary appropriation measure for the first three months of the year, but must adopt a permanent appropriation measure for the fiscal year by April 1. The Cuyahoga County Auditor must certify that the City’s appropriation measure does not exceed the amounts set forth in the County Budget Commission’s Certificate of Estimated Resources.
The City maintains budgetary control on a non-GAAP basis at the character level (personnel and related expenditures and other expenditures) within each division. Lower levels within each character are accounted for and reported internally. Lower levels are referred to as the program level. Estimated expenditure amounts must be pre-encumbered and subsequently encumbered prior to the release of purchase orders to vendors or finalization of other contracts. Pre-encumbrances and encumbrances that would exceed the available character level appropriation are not approved or recorded until the Council authorizes additional appropriations or transfers. Unencumbered appropriations lapse at the end of each calendar year. As an additional control over expenditures, the City Charter requires that all contracts in excess of $50,000 shall first be authorized and directed by ordinance of City Council.
Budget-to-actual comparisons are provided in this report for each individual governmental fund for which an appropriated annual budget has been adopted. For the General Fund, this comparison is shown on page 61 as part of the basic financial statements. For other governmental funds with appropriated annual budgets, this comparison is presented in the supplementary information subsection of this report along with more detailed information regarding the General Fund, which starts on page 118.
Factors Affecting Financial Condition
Local Economy
The information presented in the financial statements is perhaps best understood when it is considered from the broader perspective of the specific environment within which the City operates.
Cleveland’s economic condition draws strength and stability from its evolving role as the focal point of a growing, changing and substantial regional economy. The City is located at the center of one of the nation’s heaviest population concentrations. The Cleveland metropolitan area is a significant local market, housing 2.1 million people. Cleveland also provides superior links to the global markets. The Cleveland-Cuyahoga Port Authority handles the largest amount of overseas cargo on Lake Erie and includes a Foreign Trade Zone. The City is also well-served with extensive highways and Cleveland Hopkins International Airport serves as a United Airlines Hub and is serviced by all major airlines. The re-emergence of downtown Cleveland as a vibrant center for national and regional entertainment and major cultural activities signals a turning point in the City’s overall fortunes and is paving the way for further economic expansion that will be significantly more entrepreneurial in scope.
Major Industries, Economic Conditions and Employment
Cleveland, as well as most large urban municipalities across the nation, has faced significant economic challenges in recent years. Like all manufacturing cities across the country, Cleveland has tried to combat the declining industry base with more professional and service industry opportunities. The City’s budget basis income tax collections increased 5.3% in 2012.
While the City’s economy has shifted more toward health care and financial services, its manufacturing base has assumed a smaller, yet still vital role. Competitive pressures in manufacturing have limited job creation, but the competitive position of Cleveland based industrial companies has improved.

12
The 2007 economic census indicates that Cleveland’s employment base continues to become more diversified. The following table summarizes the percentage of Clevelanders employed by industry type based on 2007 census figures.
Percentof
Industry Workforce
Utilities 0.39 %Administration and Support of Waste Management and Remediation Services 8.40 Manufacturing 16.77 Wholesale Trade 6.54 Retail Trade 12.60 Transportation and Warehousing 3.28 Information 2.42 Finance, Insurance and Real Estate 9.57 Professional, Scientific Management 6.09 Education, Health, Social Services 19.43 Arts, Entertainment, Recreation 1.62 Accomodation and Food Services 9.47 Other Services 3.42 Total 100.00 %
Current Projects and 2012 Accomplishments
The 2012 budget focused on continuing the City’s commitment to improve the quality of life of its citizens by strengthening our neighborhoods, fostering a favorable business climate and providing superior services.
Despite fiscal constraints and economic challenges, the City achieved the following 2012 programmatic goals and projects without an income or property tax increase:
Department of Community Development
Expended $20,141,000 of Neighborhood Stabilization Program (NSP-1 and NSP-2), $1,019,000 of Community Development Block Grant - American Recovery and Reinvestment Act (CDBG-ARRA) and $716,000 of ARRA Home Weatherization Assistance Program (HWAP) funds to support demolition, land reutilization, housing renovation, home repair and energy efficiency improvements to strengthen the local housing stock.
The City and the Cuyahoga County Office of Homeless Services successfully completed the $9.8 million Homeless Prevention & Rapid Re-housing stimulus grant designed to help families avoid homelessness as well as helping homeless persons find permanent housing. Under this program:
o 2,692 households avoided homelessness; and
o 1,407 homeless households found housing.
The City, through the Housing First Initiative, completed the Greenbridge Permanent Supportive Housing (PSH) project on the Health Line corridor. Two more PSH projects are under construction: the 65-unit Emerald Alliance VI in the Buckeye-Shaker neighborhood and the 40-unit Winton on Lorain apartments in the Cudell neighborhood.
Completed the $31 million stimulus funded HWAP by weatherizing 4,236 homes to be energy efficient during the term of the grant, with 1,312 homes completed in 2012. The Department also completed the installation of energy efficiency improvement plans for 103 moderate and middle income homes using low-cost loans from the new Energy Savors Pilot Program, which used stimulus funds from the U.S. Department of Energy.

13
In anticipation of and to prepare for a rebound in the housing market, the City has assembled viable land tracts including:
o Morgana Run, St. Luke’s Point, Cliffview, Battery Park and Upper Chester.
o Coordinated with the Cuyahoga County Land Reutilization Corp. to assemble 1,965 vacant parcels for redevelopment or interim uses.
Successfully restructured our lead abatement services by completing the final 87 of the 130 units required under the Lead Hazard Control grant.
Reinforced the City’s position as a leader and innovator in urban agriculture by continuing to expand programs for the reuse of vacant land, particularly for urban gardens and agriculture programs, including:
o Increased community gardening in the City through the Summer Sprout program from 169 to 180 gardens, representing over 40 acres, in all 19 wards of the City, with more than 3,630 gardeners participating.
o Worked with the Office of Sustainability and the United States Department of Agriculture (USDA) to
facilitate the utilization of Environmental Quality Incentives Program funds, through which the USDA made 26 grants, totaling over $135,000, to urban agriculture entrepreneurs and community gardens for the purchase and installation of season extension high tunnels. With the use of these high tunnels, gardeners can nearly double their growing season.
Department of Building and Housing
Demolished 758 condemned structures. Since January 2006, the Department has inspected, condemned and razed over 6,517 structures.
Initiated 1,745 court cases against negligent property owners.
Issued 7,745 violation notices.
Issued 16,245 construction permits valued at $1.033 billion in new construction.
Boarded-up and secured 4,854 vacant structures.
Deconstructed 13 structures to achieve a more sustainable demolition process.
Issued 4,122 condemnation notices.
Department of Economic Development
Provided a $4,000,000 Housing & Urban Development (HUD) loan and a $500,000 Economic Development Administration loan to Midtown Tech Park for the third phase of the project. The loans will be used to add 66,000 square feet of high quality office space to the heart of the Health Tech Corridor. Upon completion, the project will create 80 jobs in the City.
Assisted with securing the new headquarters for Manitowoc/Cleveland Range. The Department coordinated the acquisition of land, street repair, demolition of vacant buildings and financial incentives to offer a more attractive package than competing cities. The company is expected to retain 260 employees and add 120 more.
The City provided $200,000 to the National Development Council’s Grow America Fund (GAF). The GAF operates as a community development leader to support creation of jobs and the expansion of eligible small businesses in underserved areas, particularly minority and women-owned businesses.
Supplied a $180,000 forgivable loan to the historic Agora complex. The loan will be used to add 56,000 square feet of needed office space in the Health Tech Corridor. The renovation will retain 15 jobs and create at least 25 new ones.

14
The City is providing $200,000 to the Economic and Community Development Institute (ECDI) to structure microloans to small businesses that would not be eligible for traditional bank funding. A portion of the funding ($50,000) is specifically geared toward immigrant and refugee businesses. The City’s funding will leverage more than $4 for every dollar the City has committed. The ECDI’s lending efforts have resulted in $516,500 in loans to Cleveland based businesses, the retention of 6 jobs and the creation of an anticipated 35 jobs in the City.
Assisted North Coast Media LLC, a start-up business-to-business media company, with a $50,000 grant. The company projects 30 new jobs with an estimated payroll of $1.7 million will be created within the first year of operations.
Department of Health
Performed 21,118 proactive nuisance inspections in 2012, exceeding the target by 4%.
Environmental ticketing and summons increased by 26% and 28%, respectively, over 2011.
Completed 7,674 food shop inspections, an increase from the 7,369 done in 2011. The increase depicts a growing food service industry in Cleveland during 2012.
Administered 1,208 seasonal influenza vaccinations at the city’s health centers and off-site events.
Helped launch the second phase of the Healthy Cleveland Initiative designed to engage the community in improving the health of Clevelanders. The initiative includes, but is not limited to, the following tasks:
o Remove all sugar-based drinks and trans-fats from vending machines in all city facilities and replace them with water, 100% juice and trans-fat free foods.
o Encourage local restaurants to remove trans-fats from their menus.
o Establish a task force to provide healthier food options within Cleveland Metropolitan School District.
o Require all new school construction plans to include a full-service kitchen to prepare healthier food.
o Reincorporate school gardens into every new school plan.
o Ensure the existence of a community garden within walking distance of every Cleveland citizen by 2020.
Continued to show considerable improvement in the infant mortality rate (IMR). In 2009, the IMR was 8.5%, declined to 2.6% in 2010 and dropped again to 1.3% in 2011. Rates are on pace to decline again when data is released for the 2012 year. Since MomsFirst participants are reflective of women at the highest risk for poor birth outcomes, the data supports the impact the program is having in reducing infant mortality in our community.
Conducted 4,220 HIV tests at City health centers during 2012. Additionally, our contractual partners completed 8,031 tests in the community to exceed its target by 34%.
Received additional Title X funding for the city’s health centers to provide expanded medical care to support reproductive health services. This enabled the health centers to screen 40% more patients than in 2011.
Collected $166,853 in air permit fees and completed 474 Ohio EPA-mandated inspections.
Distributed 117,470 birth and death certificates to Clevelanders and 34 Cuyahoga County suburbs.

15
Conducted a comprehensive marketing campaign using channels 19 and 43, as well as Clear Channel Broadcasting to promote reproductive health and wellness programs. Additional marketing campaigns promoted lead poisoning prevention and the impact of HIV/AIDS on the community. Nearly 500 TV ads on channels 19 and 43 were shown throughout all hours of the day and over 500 radio commercials were heard promoting CDPH programs and services. Additionally, the Department utilized social media as a marketing tool by posting to its Facebook page and Twitter feed.
Department of Aging
Provided core services to 5,620 clients including senior citizens and adults with disabilities.
Secured approximately $500,000 of external grants.
The Annual Senior Day Program held in May 2012 attracted more than 2,000 senior citizens; the Annual Senior Walk attracted over 1,000 senior citizens.
Provided the following services: 1,424 received Benefit Checkups, 135 units, in which a low income senior or adult with a disability own and reside, received a major home repair(s), 691 received grass cutting services, 717 received assistance with snow removal and 3,802 received other supportive services.
The Office of Equal Opportunity
Assessed approximately $52,000 in penalties from contractors for non-compliance with the Codified Ordinance 188.
Under Codified Ordinance 123.08, OEO is assuming a leadership role in coordinating touch points for Prevailing Wage citywide.
The OEO completed the Citywide Disparity Study (conducted by National Employment Rights Authority) in 2012. In 2013, OEO will review the recommendations and make appropriate legislative and administrative changes.
Business to Government Now (B2GNow) & Labor Compliance Tracker, OEO’s new real-time compliance software, went live in January 2013. OEO will continue internal and external technical assistance sessions in 2013.
Monitored over 133 construction contracts exceeding $100,000 to ensure compliance with the Cleveland Resident Employment Law (aka Fannie M. Lewis Law) requiring that at least 20% construction worker hours are City of Cleveland residents.
Department of Public Works
The Division of Recreation served 88,102 summer lunches during 2012.
The Division of Park Maintenance serviced 44,141 vacant properties in 2012.
The Division of Motor Vehicle Maintenance purchased 256 new vehicles.
The Division of Urban Forestry trimmed 3,905 trees.
The Division of Waste Collection collected and disposed of 212,367 tons of debris and recycled 22,318 tons of materials. They expanded the automated waste collection and curbside recycling program to 30,000 additional households, bringing the citywide total to 70,000.
The Division of Parking reassigned the City’s four multi-space electronic parking meters to East 12th Street between Superior and St. Clair.
The Division of Streets used over 7,276 tons of asphalt for street repairs in 2012. They also resurfaced over 32,356 square yards of roadway.
16
The Division of Traffic Engineering painted over 661 miles of lane lines and replaced over 3,535 traffic light bulbs.
Department of Public Safety
The Violence, Gun Reduction and Interdiction Program (V-GRIP) was expanded in 2012 to combat violent crimes and firearms. Initiatives were conducted in three distinct neighborhoods in 2012, and there were reductions in felonious assaults with firearms in each respective area. Statistics included: 54 firearms confiscated, 3,499 citations issued and 479 arrests.
Conducted monthly Neighborhood Safety Initiatives. Every enforcement strategy is utilized with an emphasis on combating crime in those areas reflecting the greatest volume of violent crimes in the previous six month period. Results included 423 felony arrests, 329 misdemeanor arrests, 41 firearms confiscated and 5,673 traffic citations issued.
Realized an overall reduction in the Part One crimes of 3.89%. Part One crimes include (defined by the Federal Bureau of Investigation Uniform Crime Reporting) homicide, rape, robbery, felonious assault, burglary, theft, auto theft and arson.
The Division of Fire implemented the Community Risk Reduction program through a grant from the Vision 20/20 Federal Program. The Division installed over 2,200 smoke alarms and 200 carbon monoxide detectors. In addition, the grant provided specialized smoke detectors for the hearing impaired.
Continued the integration of the Division of Fire and the Division of Emergency Medical Service to create a single division providing all fire, rescue and pre-hospital emergency medical care for the City of Cleveland.
Department of Public Utilities
The Division of Water (CWD) reliably provides approximately 1.4 million customers throughout the City and more than 69 surrounding suburbs with high quality, safe water. In 2012, CWD pumped more than 82.1 billion gallons of water to customers and invested more than $58.9 million in its infrastructure.
The Division of Cleveland Public Power (CPP) provided 74,000 residential and business customers in the City with reliable and affordable power. In 2012, CPP continued work on its Capacity Expansion Program, which is designed to upgrade infrastructure, increase customer capacity and improve reliability.
The Division of Water Pollution Control (WPC) maintains the local sanitary and storm collection system within the boundaries of the City. The system is comprised of 1,434 miles of sewer lines, 127,000 catch basins and 15 pump stations. In 2012, WPC completed the cleaning of 17,034 catch basins and 409,326 linear feet of sewers and the TV inspection of 227,449 linear feet of sewers.
Department of Port Control
Broke ground on the new U.S. Department of Transportation and Federal Aviation Administration $69 million Air Traffic Control Tower and Terminal Radar Approach Control Facility at Cleveland Hopkins Airport (CLE). The new tower will extend 324 feet to provide a better aerial view of aircraft coming in and out of the airport.
Received five 2011 Airport Revenue Awards for exceptional designs and concessions program management at CLE for the AIRMALL, which improved the quality, customer service and brand offerings for patrons at the airport. Currently, there are 60 new restaurants, retail and service locations, resulting in more than 325 new jobs at CLE. We anticipate the number of new jobs will increase as new venues continue to open.
Expanded the CLE Temporary Art Exhibition Program to include 3 dimensional art exhibits in order to increase airport ambiance and enhance travelers’ experience. The program is in line with the Mayor’s initiative to include Art in Everything, inviting travelers and visitors to the airport to take a closer look at the richness of artistic and cultural diversity in Cleveland.

17
Department of Law
Drafted approximately 535 contracts and reviewed over 962 contracts for legal form and correctness.
Prepared 565 pieces of legislation for introduction to City Council; including legislation to implement the Downtown Lakefront Plan.
Obtained 3,107 search warrants for housing court enforcement actions and helped Building and Housing obtain legal authorization for more than 1,228 demolitions of unsafe structures in the City.
Responded to 2,519 citizen requests for non-routine public records; provided legal advice as needed in response to almost 8,000 routine requests.
Processed 726 general claims for property damage and other losses.
Initiated 1,745 criminal prosecutions in Housing Court for health and safety code violations to ensure that property owners adequately maintain their properties. Successfully prosecuted civil nuisance abatement actions for numerous properties across the City.
2013 Budget
During 2012, the City continued to strengthen its financial position through increased efficiencies, streamlining of operations, improving accountability, refinancing debt and increasing revenue. The City is seeing moderate growth in income taxes due to heightened construction activity in the downtown and University Circle areas. The Budget Management Strategy for fiscal 2013 includes, but is not limited to, the following:
A continuation of additional Public Safety and Public Works services required to support the influx of Horseshoe Casino visitors.
A new unit of 25 police officers who will focus on violent crimes and guns.
A 27th pay period at a cost of $13 million for the General Fund.
An increase in Cleveland Browns Stadium debt service payments by an amount of $9.8 million.
The estimate of receipts and expenditures for all General Fund departments and divisions for the 2013 budget are:
Revenues and other sources are projected to decrease from $518.0 million in 2012 to $491.8 million in 2013. This decline is primarily attributed to a reduction of $14.2 million of transfers in and a $6.1 million dollar decrease in the local government fund. The change in transfers in is related to the one-time sale of the Convention Center that was transferred in 2012, while the decrease in local government is from State of Ohio cuts.
Expenditures and other uses are estimated to increase from $486.5 million to $538.9 million in 2013. This increase is primarily related to the previously noted 27th pay occurring in 2013 and an increase of $13.3 million in subsidies to other funds.
Long-term financial planning:
The City has a long-term goal of increasing the Rainy Day Reserve Fund to 5% of General Fund expenditures (approximately $25 million). As part of the goal, the City is scheduled to transfer $5 million into the Rainy Day Reserve Fund in 2013, bringing the balance in the fund to approximately $18.5 million. This will allow the City to obtain the lowest rates possible when issuing debt and also withstand economic downturns with minimum disruptions to City services.

18
The City manages its long-term financing of its capital needs through the annual updating of its Capital Improvement Plan (CIP). The CIP schedules capital improvements through the current and succeeding five years. The CIP does not include appropriations or authorizations to expend monies. Capital Projects are approved by City Council when funding sources have been determined. The City usually issues bonds to fund capital projects.
The following projects currently underway will provide the momentum necessary to continue rebuilding the City’s economic base:
Construction is near completion on the $465 million Convention Center and Global Center for Health Innovation (previously Medical Mart) in downtown Cleveland. The project is on-time and under-budget and expected to be completed in June 2013.
Phase one of the Flats East Bank project ($272 million) continued construction in 2012. The development will initially include a state-of-the-art office tower with rooftop deck, a 150-room Aloft hotel by Starwood, restaurants, retail and 1,200-foot riverfront boardwalk.
The $6 million renovation of League Park that will make Cleveland the only city in the nation to achieve adaptive reuse of an original major league ballpark.
The $21 million second phase of the Uptown Development broke ground in early 2013. The development comprises residential, retail and cultural attractions on the eastern edge of University Circle.
Major Initiatives
As the City plans ahead to achieve increased municipal efficiencies and enhanced infrastructure coordination, the Mayor has launched the following initiatives:
Making Cleveland a City of Choice – making Cleveland and its neighborhoods “communities of choice” is a principal goal of the administration. A community of choice is a place that residents and businesses and visitors choose because of the exceptional quality of life and amenities that it offers. The Departments of Economic and Community Development are taking the lead role in implementing the recommendations for development and revitalization.
Automated Waste Collection Program – begun in 2009, the program provides automated waste collection and curbside recycling to City residents. The City provides each resident participating in the program with a 96 gallon cart for garbage and a 64 gallon cart for recyclable items. The carts are automatically emptied by vehicles equipped with mechanical arms and semi-automatically by vehicles with a tipper on the back to lift and tip the containers into the truck. This will result in reduced costs, reduced employee injuries, increased productivity, cleaner curbs and increased recycling participation.
Connecting Cleveland 2020 Citywide Plan – a comprehensive plan for the future of Cleveland and its neighborhoods. It seeks to create great neighborhoods by creating “connections” between people and places and opportunities. The plan proposes not only to build houses, but build safe, vibrant neighborhoods. It is a plan that proposes not only to create shopping centers, but to create mixed-use “town centers” that can become the focus of community life. The plan not only seeks to create jobs, but to make job opportunities available to all Clevelanders.
Awards and Acknowledgements
The Independent Audit: The City Charter requires an annual audit of the financial statements of all accounts of the City by an Independent Certified Public Accountant. Accordingly, this year’s audit was completed by Clark, Schaefer, Hackett & Co. The year ended December 31, 2012, represents the 32nd consecutive year the City has prepared a Comprehensive Annual Financial Report (CAFR). In addition to the independent auditors, the City maintains its own Internal Audit Division. Along with the duty of assisting the independent auditors, the Internal Audit Division is responsible for strengthening and reviewing the City’s internal controls. The Internal Audit Division performs its own independent operational and financial audits of the City’s many funds, departments and divisions. We believe that the City’s internal control structure adequately safeguards its assets and provides reasonable assurance of proper recording of all financial transactions.


20
This Page Intentionally Left Blank.

21
CITY OF CLEVELAND, OHIO City Officials
Frank G. Jackson, Mayor
EXECUTIVE STAFF Ken Silliman, Esq. ................................................................................................................................................................... Chief of Staff
Darnell Brown ........................................................................................................................................................... Chief Operating Officer
Valarie J. McCall .............................................................................................................................................. Chief of Government Affairs
Chris Warren ................................................................................................................................................ Chief of Regional Development
Monyka S. Price ................................................................................................................................................................ Chief of Education
Maureen R. Harper ................................................................................................................................................. Chief of Communications
Jenita McGowan ......................................................................................................................................................... Chief of Sustainability
Natoya J. Walker Minor ............................................................................................................................................. Chief of Public Affairs
Sharon Dumas ............................................................................................................................................. Director, Department of Finance
Barbara A. Langhenry ....................................................................................................................................... Director, Department of Law
Martin Flask ........................................................................................................................................ Director, Department of Public Safety
ADMINISTRATION Jane E. Fumich ............................................................................................................................................... Director, Department of Aging
Edward W. Rybka ................................................................................................................. Director, Department of Building and Housing
Robert N. Brown ................................................................................................................................... Director, City Planning Commission
Lucille Ambroz .................................................................................................................................... Secretary, Civil Service Commission
Daryl P. Rush, Esq. ......................................................................................................... Director, Department of Community Development
Blaine Griffin ..................................................................................................................................... Director, Community Relations Board
Tracey A. Nichols ..................................................................................................................................... Director, Economic Development
Karen Butler ....................................................................................................................................... Director, Department of Public Health
Natoya J. Walker Minor ......................................................................................................... Interim Director, Office of Equal Opportunity
Michael E. Cox .................................................................................................................................. Director, Department of Public Works
Deborah Southerington ................................................................................................................ Director, Personnel and Human Resources
Ricky D. Smith, Sr. .............................................................................................................................. Director, Department of Port Control
Jomarie Wasik ........................................................................................................................... Director, Mayor’s Office of Capital Projects
Paul Bender. ..................................................................................................................................... Director, Department of Public Utilities

22
CITY OF CLEVELAND, OHIO
City Council Martin J. Sweeney ......................................................................................................... President of Council / Ward 18
Patricia J. Britt ...................................................................................................................................... Clerk of Council
Terrell H. Pruitt ........................................................................................................................................... Ward 1
Zachary Reed ............................................................................................................................................... Ward 2
Joe Cimperman ............................................................................................................................................ Ward 3
Kenneth L. Johnson ..................................................................................................................................... Ward 4
Phyllis E. Cleveland .................................................................................................................................... Ward 5
Mamie J. Mitchell ........................................................................................................................................ Ward 6
TJ Dow ........................................................................................................................................................ Ward 7
Jeffrey D. Johnson ....................................................................................................................................... Ward 8
Kevin Conwell ............................................................................................................................................. Ward 9
Eugene R. Miller.......................................................................................................................................... Ward 10
Michael D. Polensek .................................................................................................................................... Ward 11
Anthony Brancatelli ..................................................................................................................................... Ward 12
Kevin J. Kelley ............................................................................................................................................ Ward 13
Brian J. Cummins. ....................................................................................................................................... Ward 14
Matthew Zone ............................................................................................................................................. Ward 15
Jay Westbrook ............................................................................................................................................ Ward 16
Dona Brady ................................................................................................................................................. Ward 17
Martin J. Keane .......................................................................................................................................... Ward 19

23

24

CITY OF CLEVELAND, OHIO
FINANCIAL HIGHLIGHTS(Amounts in 000's)
For General General GeneralYear Fund Fund Fund Income
Ended Fund Balance** Revenues* Expenditures* Taxes***2008 31,545 524,744 523,046 327,3382009 5,865 491,827 520,036 301,5592010 12,541 499,681 498,504 296,5252011 51,594 502,703 492,672 310,1972012 71,750 518,001 486,484 326,783
* Budget Basis - General Fund revenues and expenditures include other financing sources (uses).** GAAP Basis.*** Budget Basis - Income Taxes includes General Fund and Restricted Income Tax Fund.
010,00020,00030,00040,00050,00060,00070,00080,000
2008 2009 2010 2011 2012
General Fund - Fund Balance**
460,000
480,000
500,000
520,000
540,000
2008 2009 2010 2011 2012
General Fund - Revenues*
460,000
480,000
500,000
520,000
540,000
2008 2009 2010 2011 2012
General Fund - Expenditures*
280,000
300,000
320,000
340,000
2008 2009 2010 2011 2012
Income Taxes***
25

26
This Page Intentionally Left Blank.

27
FINANCIALSECTION

28
This Page Intentionally Left Blank.

one east fourth street, ste. 1200cincinnati, oh 45202
www.cshco.comp. 513.241.3111f. 513.241.1212
cincinnati | cleveland | columbus | miami valley | springfield | toledo
INDEPENDENT AUDITORS’ REPORT
To the Honorable Frank G. Jackson, Mayor, Members of Council and the Audit CommitteeCity of Cleveland, Ohio:
Report on the Financial Statements
We have audited the accompanying financial statements of the governmental activities, the business-type activities, each major fund, and the aggregate remaining fund information of the City of Cleveland, Ohio (the “City”) as of and for the year ended December 31, 2012, and the related notes to the financial statements, which collectively comprise the City’s basic financial statements as listed in the table of contents.
Management’s Responsibility for the Financial StatementsManagement is responsible for the preparation and fair presentation of these financial statements in accordance with accounting principles generally accepted in the United States of America; this includes the design, implementation, and maintenance of internal control relevant to the preparation and fair presentation of financial statements that are free from material misstatement, whether due to fraud or error.
Auditors’ ResponsibilityOur responsibility is to express opinions on these financial statements based on our audit. We conducted our audit in accordance with auditing standards generally accepted in the United States of America and the standards applicable to financial audits contained in Government Auditing Standards, issued by the Comptroller General of the United States. Those standards require that we plan and perform the audit to obtain reasonable assurance about whether the financial statements are free from material misstatement.
An audit involves performing procedures to obtain audit evidence about the amounts and disclosures in the financial statements. The procedures selected depend on the auditors’ judgment, including the assessment of the risks of material misstatement of the financial statements, whether due to fraud or error. In making those risk assessments, the auditor considers internal control relevant to the entity’s preparation and fair presentation of the financial statements in order to design audit procedures that are appropriate in the circumstances, but not for the purpose of expressing an opinion on the effectiveness of the entity’s internal control. Accordingly, we express no such opinion. An audit also includes evaluating the appropriateness of accounting policies used and the reasonableness of significant accounting estimates made by management, as well as evaluating the overall presentation of the financial statements.
29

We believe that the audit evidence we have obtained is sufficient and appropriate to provide a basis for our audit opinions.
Opinions
In our opinion, the financial statements referred to above present fairly, in all material respects, the respective financial position of the governmental activities, the business-type activities, each major fund, and the aggregate remaining fund information of the City of Cleveland, Ohio, as of December 31, 2012, and the respective changes in financial position and, where applicable, cash flows and the budgetary comparison for the General Fund thereof for the year then ended in accordance with accounting principles generally accepted in the United States of America.
Effect of Adopting New Accounting Standards
As discussed in Note 2, the City adopted the provisions of Governmental Accounting Standards Board Statement No. 60, Accounting and Financial Reporting for Service Concession Arrangements, Statement No. 62, Codification of Accounting and Financial Reporting Guidance Contained in Pre-November 30, 1989 FASB and AICPA Pronouncements, Statement No. 63, Financial Reporting of Deferred Outflows of Resources, Deferred Inflows of Resources, and Net Position, and Statement No. 64, Derivative Instruments: Application of Hedge Accounting Termination Provision. Our opinion is not modified with respect to this matter.
Other Matters
Required Supplementary Information
Accounting principles generally accepted in the United States of America require that the management’s discussion and analysis on pages 33 through 51 be presented to supplement the basic financial statements. Such information, although not a part of the basic financial statements, is required by the Governmental Accounting Standards Board, who considers it to be an essential part of financial reporting for placing the basic financial statements in an appropriate operational, economic, or historical context. We have applied certain limited procedures to the required supplementary information in accordance with auditing standards generally accepted in the United States of America, which consisted of inquiries of management about the methods of preparing the information and comparing the information for consistency with management’s responses to our inquiries, the basic financial statements, and other knowledge we obtained during our audit of the basic financial statements. We do not express an opinion or provide any assurance on the information because the limited procedures do not provide us with sufficient evidence to express an opinion or provide any assurance.
30

Other Information
Our audit was conducted for the purpose of forming opinions on the financial statements that collectively comprise the City’s basic financial statements. The combining and individual nonmajor fund financial statements and schedules, capital assets schedules, introductory section, and statistical section are presented for purposes of additional analysis and are not a required part of the basic financial statements.
The combining and individual nonmajor fund financial statements and schedules and capital assets schedules are the responsibility of management and were derived from and relate directly to the underlying accounting and other records used to prepare the financial statements. Such information has been subjected to the auditing procedures applied in the audit of the basic financial statements and certain additional procedures, including comparing and reconciling such information directly to the underlying accounting and other records used to prepare the basic financial statements or to the basicfinancial statements themselves, and other additional procedures in accordance with auditing standards generally accepted in the United States of America. In our opinion, the information is fairly stated in all material respects in relation to the basic financial statements as a whole.
The introductory section and statistical section have not been subjected to the auditing procedures applied in the audit of the basic financial statements, and accordingly, we do not express an opinion or provide any assurance on them.
Other Reporting Required by Government Auditing Standards
In accordance with Government Auditing Standards, we have also issued our report dated June 25, 2013 on our consideration of the City of Cleveland’s internal control over financial reporting and on our tests of its compliance with certain provisions of laws, regulations, contracts, and grant agreements and other matters. The purpose of that report is to describe the scope of our testing of internal control over financial reporting and compliance and the results of that testing, and not to provide an opinion on internal control over financial reporting or on compliance. That report is an integral part of an audit performed in accordance with Government Auditing Standards in considering the City of Cleveland’s internal control over financial reporting and compliance.
CClark, Schaefer, Hackett & Co.Cincinnati, OhioJune 25, 2013
31

32
This Page Intentionally Left Blank.

33
CITY OF CLEVELAND, OHIO
MANAGEMENT’S DISCUSSION AND ANALYSIS
As management of the City of Cleveland (the City) we offer readers of the City’s financial statements this narrative overview and analysis of the financial activities of the City for the year ended December 31, 2012. Please read this information in conjunction with the City’s financial statements and footnotes that begin on page 54.
FINANCIAL HIGHLIGHTS
The assets and deferred outflows of the City exceeded its liabilities and deferred inflows at December 31, 2012 by approximately $2.707 billion (net position). Of this amount, $481 million (unrestricted net position) may be used to meet the City’s ongoing obligations to citizens and creditors.
Of the approximately $2.707 billion of net position, governmental activities accounted for approximately $682 million of net position, while business-type activities net position accounted for approximately $2.025 billion.
The City’s net position increased by $97.3 million as compared to 2011. The governmental activities net position increased by $40.9 million and the business-type activities net position increased by $56.4 million.
At the end of the current year, unassigned fund balance for the General Fund was $61.9 million, which represents the amount available for spending at the City’s discretion. The unassigned fund balance equals 12.9% of the total current General Fund expenditures and other financing uses.
In 2012, the City’s total long-term debt and other long-term debt-related obligations, excluding premiums, accreted interest, discounts and unamortized loss on debt refunding, increased by $49.9 million. The increase indicates that the City’s new debt issued exceeded debt service payments and debt refunded or defeased in 2012.
OVERVIEW OF THE FINANCIAL STATEMENTS
This discussion and analysis is intended to serve as an introduction to the City’s basic financial statements. The City’s basicfinancial statements are comprised of four components: (1) government-wide financial statements, (2) fund financial statements, (3) General Fund budget and actual statement and (4) notes to the financial statements. This report also contains other supplementary information in addition to the basic financial statements.
Government-wide financial statements. The government-wide financial statements are designed to provide readers with a broad overview of the City’s finances, in a manner similar to a private sector business.
The statement of net position presents financial information on all of the City’s assets, liabilities and deferred inflows/outflows of resources, with the difference reported as net position. Over time, increases or decreases in net positionmay serve as a useful indicator of whether the financial position of the City is improving or deteriorating.
The statement of activities presents information showing how the City’s net position changed during the most recent year. All changes in net position are reported as soon as the underlying event giving rise to the change occurs, regardless of the timingof the related cash flows. Thus, revenues and expenses are reported in this statement for some items that will only result in cash flows in future fiscal periods (e.g., uncollected taxes and earned but unused vacation leave).
Both of the government-wide financial statements distinguish functions of the City that are principally supported by taxes and intergovernmental revenues (governmental activities) from other functions that are intended to recover all or a significant portion of their costs through user fees and charges (business-type activities). The governmental activities of the City principally include: General Government; Public Works; Public Safety; Community Development; Building and Housing; Public Health and Economic Development. The business-type activities of the City principally include: water; electricity; and airport facilities.

34
The government-wide financial statements can be found on pages 54 - 57 of this report.
Fund financial statements. A fund is a grouping of related accounts that is used to maintain control over resources that have been segregated for specific activities or objectives. The City, like other state and local governments, uses fund accounting to ensure and demonstrate compliance with finance-related legal requirements. All of the funds of the City can be divided into three categories: governmental funds, proprietary funds and fiduciary funds.
Governmental funds. Governmental funds are used to account for essentially the same functions reported as governmental activities in the government-wide financial statements. However, unlike the government-wide financial statements, governmental fund financial statements focus on the near-term inflows and outflows of spendable resources, as well as on balances of spendable resources available at the end of the fiscal year. Such information may be useful in evaluating a government’s near-term financing requirements.
Because the focus of governmental funds is narrower than that of the government-wide financial statements, it is useful to compare the information presented for governmental funds with similar information presented for governmental activities in the government-wide financial statements. By doing so, readers may better understand the long-term impact of the City’s near-term financing decisions. Both the governmental fund balance sheet and the governmental fund statement of revenues, expenditures and changes in fund balances provide a reconciliation to facilitate this comparison between governmental funds and governmental activities.
The City presents 33 individual governmental funds on a modified accrual basis. Information is presented separately in the governmental fund balance sheet and in the governmental fund statement of revenues, expenditures and changes in fund balances for the General Fund, which is considered to be a major fund. Data from the other 32 governmental funds are combined into a single, aggregated presentation. Individual fund data for each of these nonmajor governmental funds is provided in the form of combining statements elsewhere in this report.
The City adopts an annually appropriated budget for its General Fund, Enterprise and Internal Service Funds. The City adopts an annually appropriated budget for some of its Special Revenue and Debt Service Funds. The General Fund budgetary comparison has been provided as a separate financial statement to demonstrate compliance with its budget.
The basic governmental fund financial statements can be found on pages 58 - 61 of this report.
Proprietary funds. The City maintains two different types of proprietary funds. The first type is Enterprise Funds. They are used to report the same functions presented as business-type activities in the government-wide financial statements. The City uses Enterprise Funds to account for its water, electric, airport, sewer, public auditorium, markets, parking lots, cemeteries andgolf course operations. The second type of proprietary fund the City uses is Internal Service Funds to account for its motor vehicle maintenance, printing and reproduction, postal services, utilities administration, sinking fund administration, municipal income tax administration, telephone exchange, radio communications operations and workers’ compensation reserve. Internal Service Funds are an accounting device used to accumulate and allocate costs internally throughout the City’s various functions. Because most of the internal services predominantly benefit governmental rather than business-type functions, they have been included within the governmental activities in the government-wide financial statements, except for the Utilities Administration Fund which has been classified as a business-type activity.
Proprietary funds provide the same type of information as the government-wide financial statements, only in more detail. The proprietary fund financial statements provide separate information for the Division of Water, Cleveland Public Power and Department of Port Control Funds, which are considered to be major funds of the City. Conversely, Internal Service Funds are combined into a single, aggregated presentation in the proprietary fund financial statements. Individual fund data for thenonmajor Enterprise and Internal Service Funds is provided in the form of combining statements elsewhere in this report.
The basic proprietary fund financial statements can be found on pages 62 - 66 of this report.

35
Fiduciary funds. Fiduciary funds are used to account for resources held for the benefit of parties outside the government. Fiduciary funds are not reflected in the government-wide financial statements because the resources of those funds are not available to support the City’s own programs. The accounting used for fiduciary funds is much like that used for proprietary funds. All of the City’s fiduciary funds are Agency Funds.
The basic fiduciary fund financial statement can be found on page 67 of this report.
Notes to the financial statements. The notes provide additional information that is essential to achieve a full understanding of the data provided in the government-wide and fund financial statements. The notes to the financial statements can be found on pages 69 - 116 of this report.
GOVERNMENT-WIDE FINANCIAL ANALYSIS
Information regarding the government-wide net position of the City is provided below:
2012 2011 2012 2011 2012 2011(restated) (restated)
Assets: Current and other assets 764,488$ 728,561$ 1,222,723$ 1,174,729$ 1,987,211$ 1,903,290$ Capital assets 929,462 915,743 3,055,706 3,050,381 3,985,168 3,966,124 Total assets 1,693,950 1,644,304 4,278,429 4,225,110 5,972,379 5,869,414
Deferred outflows of resources 27,699 27,955 27,699 27,955
Liabilities: Long-term obligations 774,706 763,056 2,065,917 2,043,248 2,840,623 2,806,304 Other liabilities 236,687 239,352 187,605 213,124 424,292 452,476 Total liabilities 1,011,393 1,002,408 2,253,522 2,256,372 3,264,915 3,258,780
Deferred inflows of resources 239 442 28,240 28,737 28,479 29,179
Net position: Net investment in capital assets 572,213 543,460 1,303,584 1,295,139 1,875,797 1,838,599 Restricted 122,488 117,765 227,826 234,050 350,314 351,815 Unrestricted (12,383) (19,771) 492,956 438,767 480,573 418,996
Total net position 682,318$ 641,454$ 2,024,366$ 1,967,956$ 2,706,684$ 2,609,410$
Summary Statements of Net Position
(Amounts in 000's)Total
GovernmentalActivities
Business-TypeActivities
as of December 31, 2012 and 2011

36
As noted earlier, net position may serve, over time, as a useful indicator of a government’s financial position. The City’s assets and deferred outflows exceeded liabilities and deferred inflows by approximately $2.707 billion at the close of the mostrecent fiscal year. This represents an increase of 3.7% in 2012. Of the City’s net position, 25.2% represents its governmentalnet position and 74.8% represents its business-type net position.
Of the net position from governmental activities, $572.2 million represents its investment in capital assets (e.g., land, land improvements, buildings, infrastructure, furniture, fixtures, equipment and vehicles), net of accumulated depreciation, less anyrelated, still-outstanding debt issued to acquire, construct or improve those assets. The City uses these capital assets to provide services to citizens; consequently, these assets are not available for future spending. Although the City’s investmentin capital assets is reported net of related debt, it should be noted that the resources needed to repay this debt must be provided from other resources, since the capital assets themselves cannot be used to liquidate these liabilities. Another significant portion of net position, $122.5 million, represents resources that are subject to external restrictions on how they may be used.There was an increase in unrestricted net position of $7.4 million.
In 2012, the total assets from governmental activities increased by $49.6 million. This increase is primarily attributed to increases in cash and cash equivalents and investments of $57.5 million and in loans receivable of $6.2 million. The increase in cash and cash equivalents and investments is mainly due to a $19.4 million increase in income taxes collected and a decrease of $11.3 million in public works expenditures. The total increase was partially offset by a decrease of $17.9 millionin local government funds.
Also in 2012, the total liabilities from governmental activities increased by $9.0 million. This increase is primarily due to increases of $11.7 million in long-term obligations and $5.3 million in due to other governments. The rise in long-term obligations is predominantly due to a net increase of $11.9 million in Subordinate Lien Income Tax Bonds, while the due to other governments increase is chiefly due to a $4.3 million increase in Economic Development’s HUD liability. These increases were offset by a $3.9 million decrease in deferred revenue, mainly caused by a $5.2 million decrease in the City’s property tax receivable.
In 2012, business-type total assets and deferred outflows of resources increased by $53.1 million, primarily due to increases incash and cash equivalents and investments of $61.8 million. The rise is mostly due to a $58.4 million increase in the Divisions’ of Water and Water Pollution Control cash and cash equivalents due to increased water rates and customer account collections. The increase is partially offset by a decrease in net accounts receivable of $37.9 million due to increased collection activity and account write-offs in the Department of Utilities.
Business-type total liabilities and deferred inflows of resources decreased by $3.3 million primarily due to decreases in amounts due to other governments of $15.6 million and accounts payable of $8.4 million. The due to other governments balance decreased primarily because of increased account write-offs in the Division of Water Pollution Control resulting in a lower liability to the Northeast Regional Sewer District. These decreases were partially offset by an increase in long-term obligations of $22.7 million.

37
At the end of the current year, the City is able to report positive balances in total net position for both its governmental activities and its business-type activities. Information regarding government-wide changes in net position is provided below:
2012 2011 2012 2011 2012 2011Revenues: (restated) (restated) (restated) Program revenues: Charges for services 72,938$ 84,681$ 597,432$ 554,641$ 670,370$ 639,322$ Operating grants and contributions 143,883 135,355 5,319 4,466 149,202 139,821 Capital grants and contributions 25,845 14,005 53,562 64,591 79,407 78,596 General revenues: Income taxes 330,863 311,492 330,863 311,492 Property taxes 56,086 63,839 56,086 63,839 Other taxes 28,680 27,312 28,680 27,312 Shared revenues 27,338 19,558 27,338 19,558 State local government funds 25,966 43,821 25,966 43,821 Unrestricted investment earnings 692 97 30 692 127 Other 18,141 19,086 18,141 19,086Total revenues 730,432 719,246 656,313 623,728 1,386,745 1,342,974
Expenses: General Government 106,141 95,833 106,141 95,833 Public Works 128,276 139,577 128,276 139,577 Public Safety 310,745 308,051 310,745 308,051 Community Development 70,705 75,778 70,705 75,778 Building and Housing 14,729 14,098 14,729 14,098 Public Health 17,385 19,596 17,385 19,596 Economic Development 13,845 22,323 13,845 22,323 Interest on debt 26,153 27,686 26,153 27,686 Water 244,647 235,313 244,647 235,313 Electricity 163,547 167,799 163,547 167,799 Airport facilities 153,627 167,531 153,627 167,531 Nonmajor activities 39,671 46,302 39,671 46,302
Total expenses 687,979 702,942 601,492 616,945 1,289,471 1,319,887
Changes in net position before special items and transfers 42,453 16,304 54,821 6,783 97,274 23,087
Special items - gain on sale of capital assets 5,125 - 5,125 Transfers (1,589) (2,031) 1,589 2,031 - -
Changes in net position 40,864 14,273 56,410 13,939 97,274 28,212
Net position at beginning of year (as restated) 641,454 627,181 1,967,956 1,954,017 2,609,410 2,581,198
Net position at end of year 682,318$ 641,454$ 2,024,366$ 1,967,956$ 2,706,684$ 2,609,410$
(Amounts in 000's)
Changes in Net PositionFor Fiscal Years Ended December 31, 2012 and 2011
GovernmentalActivities
Business-TypeActivities Total
Business-type net position increased $56.4 million in 2012. Of the business-type net position, $1.303 billion represents its investment in capital assets, net of accumulated depreciation, less any related, still-outstanding debt issued to acquire, construct or improve those assets. These capital assets are used to provide services to their customers. Consequently, these assets are not available for future spending. Although the City’s investment in capital assets is reported net of related debt, it should be noted that the resources needed to repay this debt must be provided from other resources, since the capital assets themselves cannot be used to liquidate these liabilities. An additional $228 million of net position is subject to external restrictions on their use. The remaining balance of $493 million is unrestricted and may be used to meet the City’s ongoing obligations to customers and creditors.

Operating grants and contributions
19.7%
Property taxes7.7%
Income taxes45.3%
State local government funds3.5%
Other 13.8%
Charges for services10.0%
Revenues by Source - Governmental Activities
Other includes capital grants and contributions, other taxes, shared revenues, unrestricted investment earnings and other general revenues.
0
50,000
100,000
150,000
200,000
250,000
300,000
350,000
GeneralGovernment
Public Works Public Safety CommunityDevelopment
Building andHousing
Public Health EconomicDevelopment
Interest on debt
Expenses and Program Revenues -Governmental Activities
(Amounts in 000's)
Expenses
Program revenues
38

Operating grants and contributions
0.8%
Charges for services91.0%
Capital grants and contributions
8.2%
Revenues by Source - Business-type Activities
0
50,000
100,000
150,000
200,000
250,000
300,000
350,000
Water Electricity Airport facilities Nonmajor activities
Expenses and Program Revenues -Business-type Activities
(Amounts in 000's) Expenses
Program revenues
39

40
Business-type activities are principally accounted for in the City’s Enterprise Funds. The City operates three major EnterpriseFunds encompassing two airports, a water system and an electric distribution system. The City also operates other Enterprise Funds consisting of a sewer system, cemeteries, a public auditorium, municipal parking lots and public market facilities. The City owns two golf courses whose management and operations are currently leased to outside entities. The operating results of the City’s Major Enterprise Funds are discussed below.
Division of Water: The Division operates a major public water supply system, the ninth largest in the United States that serves not only the City, but also 69 suburban municipalities in Cuyahoga, Medina, Summit and Geauga counties. The Division is an emergency standby provider for systems in eight other communities. They provide water to approximately 417,069 city and suburban accounts in the Cleveland Metropolitan Area. Operating revenue in 2012 increased to $280.3 million from $236.6 million in 2011. The increase is mainly due to increased water rates and more timely billing of customer accounts. Operating expenses, exclusive of depreciation, increased approximately 2.0% to $149.2 million compared to $146.2 million in 2011.
Also, the Division of Water restated their capital assets balances for 2011. The Division entered into amended Water Service Agreements with 21 member communities prior to 2011. These agreements transferred ownership of the distribution mains from the member communities to the Division of Water. As a result of the restatement the Division increased their capital assets balance $164,961,000 as of 12/31/2011. This is an increase of 11.0% compared to the reported capital assets balance prior to the restatement.
Division of Cleveland Public Power: The Division supplies electrical service to approximately 74,000 customers in the City. The Division is responsible for supplying, transmitting and distributing electricity and providing related electrical services to customers within its service area. The Division’s 2012 operating revenue decreased 1.9% to $165.2 million from $168.4 million in 2011. Purchased power expense increased 5.9% to $95.8 million in 2012 from $90.5 million in 2011. Operating expenses, exclusive of depreciation and purchased power, decreased 16.6% to $41.2 million compared to $49.4 million in 2011. The decrease is mostly attributed to street light upgrades and higher raw material costs in 2011.
Department of Port Control: The City’s Department of Port Control consists of the Divisions of Cleveland Hopkins International Airport and Burke Lakefront Airport. Currently, 26 passenger airlines provide scheduled airline service at Cleveland Hopkins International Airport. Burke Lakefront Airport, a federally certified commercial and general aviation reliever airport, provides the majority of its services to air taxi operators serving the City’s downtown business activities. The airports’ operating income increased $3.4 million in 2012. The increase is generally attributed to minor increases in terminaland concourse rental revenue and a $1.7 million decrease in operating expenses. Also, in 2012 there was a $29.4 million reduction in capital contributions due to the completion of runway 10-28 in 2012, which was partially funded by Federal Aviation Authority grant proceeds.
FINANCIAL ANALYSIS OF THE GOVERNMENT’S FUNDS
As noted earlier, the City uses fund accounting to ensure and demonstrate compliance with finance-related legal requirements.
Governmental funds. The focus of the City’s governmental funds is to provide information on near-term inflows, outflows and balances of spendable resources. Such information is useful in assessing the City’s financing requirements. In particular,unassigned fund balance may serve as a useful measure of a government’s net resources available for spending at the end of the fiscal year.

41
As of the end of the current year, the City’s governmental funds reported combined ending fund balances of $409.0 million, an increase of $46.1 million and approximately 12.7% in comparison with the prior year. The components of the governmental fund balances include an unassigned balance of $61.9 million, which indicates the amount available for spending at the City’s discretion. An additional $233.8 million of fund balance is available for expenditures that are legallyrestricted for a particular purpose. The nonspendable portion of fund balance has $1.1 million of items that are not in a spendable form, such as inventory. An additional $102.9 million is committed to fund specific purposes and cannot be reassigned without legislative approval. The remaining assigned balance of $9.3 million represents funds that the City intendsto use for a specific purpose.
The General Fund is the chief operating fund of the City. At the end of the current year, the unassigned fund balance of the General Fund was $61.9 million and the total fund balance was $71.8 million. As a measure of the General Fund’s liquidity, it may be useful to compare both unassigned fund balance and total fund balance to total fund expenditures and transfers out. Unassigned fund balance represents 12.9% of total General Fund expenditures and other financing uses, while total fund balance represents approximately 14.9% of that same amount.

42
A two-year comparison of General Fund activity is shown below. The revenues, expenditures and changes in fund balance shown in these comparisons are presented on the modified accrual basis of accounting applicable to governmental funds.
Restated
2012 2011
Revenues:
Income taxes 294,648$ 277,857$
Property taxes 36,028 36,618
State local government funds 31,821 45,640
Other taxes and shared revenues 50,489 43,994
Licenses and permits 12,314 14,224
Charges for services 34,230 33,669
Fines, forfeits and settlements 21,451 23,473
Investment earnings 277 228
Grants 5,724 3,934 Miscellaneous 10,074 10,812
Total revenues 497,056 490,449
Expenditures:
General Government 76,966 73,103
Public Works 63,622 66,612
Public Safety 294,955 292,594
Building and Housing 7,836 8,333
Public Health 5,326 4,451
Economic Development 1,407 1,400
Community Development 157
Other 10,992 11,171 Capital outlay 2,302 2,350
Total expenditures 463,563 460,014
Excess (deficiency) of revenues
over (under) expenditures 33,493 30,435
Other financing sources (uses):
Transfers in 3,602 8,404
Transfers out (16,941) (18,789) Sale of City assets 2 729
Net change in fund balance 20,156 20,779
Fund balance at beginning of year 51,594 30,815
Fund balance at end of year 71,750$ 51,594$
General Fund
Statement of Revenues, Expenditures and Changes in Fund Balance Information - GAAP Basis
2012 and 2011
(Amounts in 000's)

43
Analysis of General Fund Revenues
General Fund revenues and other sources totaled $500.7 million in 2012, an increase of approximately $1.1 million from 2011. A discussion of each of the major types of General Fund revenues follows.
Municipal Income Taxes
Ohio law authorizes a municipal income tax both on corporate income (net profits from the operation of a business or profession) and employee wages, salaries and other compensation at a rate of up to 1% without voter authorization and at a rate above 1% with voter authorization. In 1979 and in 1981, the voters in the City approved increases of one-half of one percent to the rate of the income tax, bringing it to the current 2% rate. By the terms of the 1981 voter approval, as amendedin 1985, one-ninth of the receipts of the total 2% tax (the Restricted Income Tax) must be used only for capital improvements, debt service or obligations issued for capital improvements or the payment of past deficits. The remaining eight-ninths of themunicipal income tax is recorded in the General Fund and is pledged to, and may also be used for, debt service on General Obligation Bonds of the City, to the extent required and certain other obligations of the City.
The income tax is also imposed on gross salaries and wages earned in the City by non-residents of the City and on salaries, wages and other compensation of City residents earned within or outside the City. The income tax liability of a City resident employed outside the City is reduced by a credit equal to 50% of the tax paid to the municipality in which the City resident isemployed. The tax on business profits is imposed on that part of profits attributable to business conducted within the City. In 2012, approximately 89% of the total income taxes paid to the City were derived from non-residents employed in the City and business profits.
Income tax revenue increased approximately $16.8 million in 2012 from 2011, primarily due to increased construction activity in the University Circle and downtown areas.
Property Taxes
Taxes collected from real property in one calendar year are levied in the preceding calendar year on assessed values as of January 1 of that preceding year. Public utility real and tangible personal property taxes collected in one calendar year are levied in the preceding calendar year on assessed values determined as of December 31 of the second year preceding the tax collection year.
The “assessed valuation” of real property is fixed at 35% of true value and is determined pursuant to rules of the State Tax Commissioner. An exception is that real property devoted exclusively to agricultural use is to be assessed at not more than 35% of its current agricultural use value. Real property devoted exclusively to forestry or timber growing is taxed at 50% of the local tax rate multiplied by the assessed value.
The assessed values of taxable property in the City for the past two years were as follows:
PublicTax Utility Total
Collection Real Tangible AssessedYear Property Personal Valuation
2012 5,385,180$ 246,081$ 5,631,261$
2011 5,398,098$ 242,172$ 5,640,270$
(Amounts in 000's)
Property tax revenue fell by $590,000 as a result of a decrease in both residential property valuations and lower collection rates.

44
State Local Government Funds and Other Taxes and Shared Revenues
State Local Government Funds and Other Taxes and Shared Revenues include taxes levied and collected by the State of Ohio or counties and partially redistributed to the City and other political subdivisions. Other taxes and shared revenues include state income, sales, admission, motor vehicle, parking, hotel, commercial activity, corporate franchise, casino, homestead and rollback, public utility, estate and cigarette taxes as well as liquor fees. State Local Government Funds revenue decreased by$13.8 million or 30.3% due to decreases in the distributions to local governments implemented as part of the State’s budget balancing measures. Other Taxes and Shared Revenues increased $6.5 million or 14.8% from 2011 levels primarily as a result of the City beginning to collect revenues from the opening of the new casino in May 2012.
Since 1993, the State Local Government Funds (LGF) have been the City’s largest source of non-tax General Fund revenue. Through these funds, Ohio subdivisions share in a portion of the State’s collection of the sales tax, use tax, personal income tax, corporate franchise tax and public utilities excise tax. The percentages of the five taxes supporting these funds have varied over the years. At times, the dollar amount in the funds has been capped at specified levels.
Pursuant to statutory law in Ohio, State LGF revenues are divided into county and municipal portions. The county portion, the larger of the two, is distributed to each of the State’s 88 counties and is allocated based upon a statutory formula utilizing county population and county municipal property values. Once received by a county, the funds can either be distributed to all subdivisions using the statutory formula or the county and its subdivisions may agree upon an alternate method for allocating the funds. Cuyahoga County and its recipient communities have chosen the latter method which is comprised of a base allocation and an excess allocation. The excess allocation takes into account such factors as assessed value per capita, per capita income, population density and the number of individuals receiving public assistance. The municipal portion of the LGF is distributed directly by the State to those municipalities that collect an income tax. A municipality receives its share of the funds based upon its percentage of total municipal income taxes collected throughout the state in a given year.
Distributions from the State of Ohio and Cuyahoga County (as a conduit between the State and City) have generally decreased since 2000.

45
Analysis of General Fund Expenditures
General Fund expenditures and other financing uses totaled $480.5 million in 2012, an increase of 0.4% from 2011. The amount of expenditures and other uses by function on a GAAP basis, including the increases (decreases) over the prior year, are shown in the following table:
RestatedExpenditures and Other Actual % of Actual % of Increase %Financing Uses 2012 Total 2011 Total (Decrease) Change
(Amounts in 000's)Current: General Government 76,966$ 16.02 73,103$ 15.27 3,863$ 5.28 Public Works 63,622 13.24 66,612 13.91 (2,990) (4.49) Public Safety 294,955 61.38 292,594 61.11 2,361 0.81 Building and Housing 7,836 1.63 8,333 1.74 (497) (5.96) Public Health 5,326 1.11 4,451 0.93 875 19.66 Economic Development 1,407 0.29 1,400 0.29 7 0.50 Community Development 157 0.03 157 N/A Other 10,992 2.29 11,171 2.33 (179) (1.60) Capital Outlay 2,302 0.48 2,350 0.49 (48) (2.04) Transfers Out 16,941 3.53 18,789 3.93 (1,848) (9.84)
Total Expenditures and Other Financing Uses 480,504$ 478,803$ 1,701$
The total expenditures and other financing uses increased by $1.7 million. The growth was primarily caused by a $3.9 million increase in General Government expenditures due to increased costs at Cleveland Municipal Court. This was primarily offset by a decrease of $1.8 million in transfers out which was due to decreases in transfers to service debt and to fund street operations.
Proprietary Funds. The City’s proprietary fund financial statements provide the same type of information found in the government-wide financial statements, but in more detail.
The unrestricted net position of the Division of Water, Cleveland Public Power and the Department of Port Control Funds amounted to $257.6 million, $52.5 million and $137.3 million, respectively, at December 31, 2012. The change in net position for each of the respective funds amounted to increases of $61.7 million, $2.6 million and a decrease of $11.9 million during 2012. Other factors concerning the finances of the City’s proprietary funds have already been addressed in the discussion of the City’s business-type activities.
Major Functional Expense Categories. A discussion of the City’s major functional expense categories follows:
Employees and Labor Relations
As of December 31, 2012 and 2011, the City had approximately 7,126 and 7,398 full-time employees, respectively. Of the 7,126 full-time employees, approximately 5,359 full-time employees are represented by 31 collective bargaining units. The largest collective bargaining units, together with the approximate number of employees represented by such units, include the American Federation of State, County and Municipal Employees, Local 100 – 1,219 members; Cleveland Police Patrolmen’s Association – 1,238 members; the Association of Cleveland Firefighters – 768 members; Municipal Foreman and Laborers Union, Local 1099 – 411 members; and Local 244 – 222 members.
There have been no significant labor disputes or work stoppages in the City within the last 29 years.

46
The Council, by ordinance, establishes schedules of salaries, wages and other economic benefits for City employees. Generally, the terms of these ordinances have been the product of negotiations with representatives of the employees or bargaining units, and increases in economic benefits have normally been provided on an annual basis.
Chapter 4117 of the Ohio Revised Code (the Collective Bargaining Law), establishes procedures for, and regulates public employer-employee collective bargaining and labor relations for the City and other state and local governmental units in Ohio. The Collective Bargaining Law creates a three-member State Employment Relations Board (the SERB), which administers and enforces the Collective Bargaining Law. Among other things, the Collective Bargaining Law: (i) creates rights and obligations of public employers, public employees and public employee organizations with respect to labor relations; (ii) defines the employees it covers; (iii) establishes methods for (a) the recognition of employees and organizations as exclusive representatives for collective bargaining and (b) the determination of bargaining units; (iv) establishes matters for which collective bargaining is either required, prohibited or optional; (v) establishes procedures for bargaining and the resolution ofdisputes, including negotiation, mediation and fact finding; and (vi) permits all covered employees to strike, except certain enumerated classes of employees, such as police and fire personnel.
Over the past two years, the total salaries and wages paid to the City’s employees from all funds were as follows:
Year Amount Paid(Amounts in 000's)
2012 421,023$ 2011 424,311$
In 2012, there was a minor decrease in salaries and wages payable due to a small reduction in employee levels.
Employee Retirement Benefits
City employees are members of one of two retirement systems. These retirement systems provide both pension and post-retirement health care benefits to participants. They were created pursuant to Ohio statutes and are administered by state created Boards of Trustees. The boards are comprised of a combination of elected members from the respective retirement system’s membership and ex-officio members from certain state and local offices.
These two retirement systems are:
Ohio Public Employees Retirement System (OPERS), created in 1935, represents state and local government employees not included in one of the other retirement systems. Management of the system indicates there are 348,235 actively contributing members and total net position of this pension system approximated $81.4 billion as of December 31, 2012, the latest information available. More data on this pension system is shown in Note 13 – Defined Benefit Pension Plans and Note 14 – Other Postemployment Benefits of this report.
Ohio Police and Fire Pension Fund (OP&F), created in 1965, represents sworn personnel, not civilians, employed in police and fire divisions of Ohio’s local governments. As of December 31, 2012, the latest information available, management of the fund indicates membership of 27,623 active members and net position of this pension fund approximated $11.5 billion. All of the City’s police and fire officers are members of this pension fund. More data on this pension fund is shown in Note 13 – Defined Benefit Pension Plans and Note 14 – Other Postemployment Benefits of this report.

47
Over the past two years, the City and its employees have paid the following amounts to OPERS and OP&F:
2012 2011
Paid by City to: OPERS 35,516$ 35,782$ OP&F 32,607 32,612
Total paid by City 68,123 68,394
Paid by employees to: OPERS 25,380 25,529 OP&F 15,060 15,171
Total paid by employees 40,440 40,700
Total 108,563$ 109,094$
(Amounts in 000's)
The City is current in all of its required contributions to the respective pension funds. The pension plans and other postemployment benefits for health care are explained in Note 13 – Defined Benefit Pension Plans and Note 14 – Other Postemployment Benefits.
GENERAL FUND BUDGETARY ANALYSIS
In 2012, the principal difference between the original and the final revenue and other sources budget (see page 61) was a $1.0 million decrease in transfers out. The decline offset minor increases in appropriations to general government and public health.
The major differences between the final amended budget and the actual total revenues were increases of $19.4 million in income taxes and $6.5 million in other taxes and shared revenues. The increase in income taxes is primarily attributed to increased construction activity and an improving local economy, while the other taxes and shared revenue increase resulted from uncertainty regarding the opening date of the Cleveland Horseshoe Casino and associated revenue projections. There were minor decreases of all expenditure components due to increased operating efficiencies and reduced payroll costs.
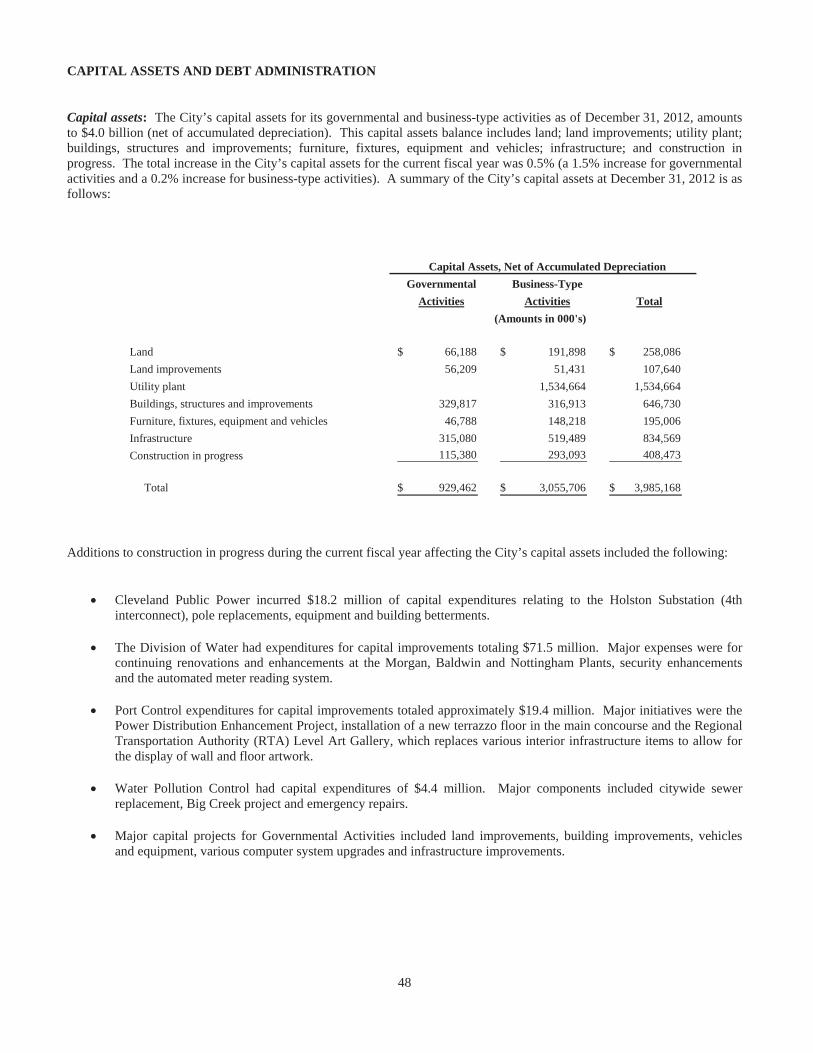
48
CAPITAL ASSETS AND DEBT ADMINISTRATION
Capital assets: The City’s capital assets for its governmental and business-type activities as of December 31, 2012, amounts to $4.0 billion (net of accumulated depreciation). This capital assets balance includes land; land improvements; utility plant;buildings, structures and improvements; furniture, fixtures, equipment and vehicles; infrastructure; and construction in progress. The total increase in the City’s capital assets for the current fiscal year was 0.5% (a 1.5% increase for governmentalactivities and a 0.2% increase for business-type activities). A summary of the City’s capital assets at December 31, 2012 is asfollows:
Capital Assets, Net of Accumulated DepreciationGovernmental Business-Type
Activities Activities Total
Land 66,188$ 191,898$ 258,086$ Land improvements 56,209 51,431 107,640 Utility plant 1,534,664 1,534,664 Buildings, structures and improvements 329,817 316,913 646,730 Furniture, fixtures, equipment and vehicles 46,788 148,218 195,006 Infrastructure 315,080 519,489 834,569 Construction in progress 115,380 293,093 408,473
Total 929,462$ 3,055,706$ 3,985,168$
(Amounts in 000's)
Additions to construction in progress during the current fiscal year affecting the City’s capital assets included the following:
Cleveland Public Power incurred $18.2 million of capital expenditures relating to the Holston Substation (4th interconnect), pole replacements, equipment and building betterments.
The Division of Water had expenditures for capital improvements totaling $71.5 million. Major expenses were for continuing renovations and enhancements at the Morgan, Baldwin and Nottingham Plants, security enhancements and the automated meter reading system.
Port Control expenditures for capital improvements totaled approximately $19.4 million. Major initiatives were the Power Distribution Enhancement Project, installation of a new terrazzo floor in the main concourse and the Regional Transportation Authority (RTA) Level Art Gallery, which replaces various interior infrastructure items to allow for the display of wall and floor artwork.
Water Pollution Control had capital expenditures of $4.4 million. Major components included citywide sewer replacement, Big Creek project and emergency repairs.
Major capital projects for Governmental Activities included land improvements, building improvements, vehicles and equipment, various computer system upgrades and infrastructure improvements.

49
The primary sources for financing the City’s Capital Improvement Projects are general obligation bond proceeds, certificates of participation proceeds, urban renewal bond proceeds, revenue bond proceeds, proceeds from capital leases, interest earned on funds prior to and during the construction period, restricted income taxes and funds from the State Issue 2 and Local Transportation Improvement Programs. The City has three primary goals relating to its Capital Improvements: (1) preservation and revitalization of the City’s neighborhoods, (2) economic development and job creation and (3) provision of cost-effective, basic City services to Cleveland residents and the business community. Additional information on the City’s capital assets, including commitments made for future capital expenditures, can be found in Note 15 – Capital Assets.
Long-term debt and certain other obligations: At the end of the current fiscal year, the City had total long-term debt and certain other obligations outstanding of $2.70 billion as shown below. General Obligation Bonds are typically issued for general governmental activities and are backed by the full faith and credit of the City. Revenue bonds are typically recorded in the applicable Enterprise Fund and are supported by the revenues generated by the respective Enterprise Fund. The remainder of the City’s debt represents bonds or notes secured solely by specified revenue sources.
The activity in the City’s debt obligations outstanding during the year ended December 31, 2012 is summarized below (excluding unamortized discounts, premiums, accreted interest and losses on debt refundings).
Balance Debt BalanceJanuary 1, Debt Refunded Debt December 31,
2012 Issued or Defeased Retired 2012
Governmental Activities: General Obligation Bonds 298,660$ 67,765$ (28,910)$ (28,815)$ 308,700$ Urban Renewal Bonds 4,835 (565) 4,270 Subordinated Income Tax Bonds 52,975 (2,955) 50,020 Subordinate Lien Income Tax Bonds 80,505 15,180 (3,305) 92,380 Non-Tax Revenue Bonds 58,591 (2,697) 55,894 Annual Appropriation Bonds 11,000 (235) 10,765 Certificates of Participation 129,547 (5,942) 123,605 Capital Lease Obligations 12,908 6,507 (3,179) 16,236 Gateway Note Payable 1,250 (250) 1,000
Total Governmental Activities 650,271 89,452 (28,910) (47,943) 662,870
Business –Type Activities: Revenue Bonds & Notes 1,930,163 421,595 (315,425) (110,130) 1,926,203 Ohio Water Development Loans 115,523 963 (6,744) 109,742 Deferred Payment Obligation 6,500 (2,990) 3,510
Total Business –Type Activities 2,052,186 422,558 (315,425) (119,864) 2,039,455
Total 2,702,457$ 512,010$ (344,335)$ (167,807)$ 2,702,325$
(Amounts in 000's)

50
Funds used to meet the debt service requirements of the City’s General Obligation Bonds are from certain ad valorem taxes, restricted income taxes and interest earnings. Ad valorem taxes, the primary source of funds, amounted to $19.28 million in 2012 which represents approximately 44% of the debt service requirements on the General Obligation Bonds. These taxes were derived from a levy of $4.35 per $1,000 of assessed property. The remaining 56% of debt service requirements is retired from a portion of the City’s restricted income tax proceeds, homestead and rollback reimbursement from the State, interest earnings and other miscellaneous revenue sources generated within the Debt Service Funds.
The City issues its General Obligation Bonds within the context of its Capital Improvement Program. Programs which have benefited due to the issuance of general obligation debt include, but are not limited to, public works improvements, bridge androadway improvements, recreation facilities, cemeteries and urban redevelopment. The City’s Enterprise Funds implement their own individual Capital Improvement Programs and issue revenue bond and note debt necessary to fund their programs.
The City’s bond ratings for general obligation and revenue bonds are as follows as of December 31, 2012:
Moody'sInvestors Standard & FitchService Poor's Ratings
General Obligation Bonds A1 AA A+ Subordinate Lien Income Tax Bonds A1 * AA N/AWaterworks Revenue Bonds Aa1 AA N/ASecond Lien Water Bonds Aa2 AA- N/ACleveland Public Power Revenue Bonds A2 A- N/AAirport System Revenue Bonds Baa1 A- A-Parking Revenue Bonds (Insured Ratings) Aa3 AA- N/A
* On November 8, 2012, Moody's Investors Service upgraded its rating on the City's Subordinate Lien Income Tax Bonds from A2 to A1 with a stable outlook.
The ratio of net general bonded debt to assessed valuation and the amount of bonded debt per capita are useful indicators of the City’s debt position to management, citizens and investors. Net general bonded debt is total general bonded debt supported by taxes less amounts available in the Debt Service Fund. This data at December 31, 2012 was:
Net General Bonded Debt: $302,484,000
Ratio of Net Bonded Debt to Assessed Valuation: 5.37%
Net General Bonded Debt Per Capita: $762.28
The Ohio Revised Code provides that the net debt of the municipal corporation, whether or not approved by the electors, shall not exceed 10.50% of the assessed value of all property in the municipal corporation as listed and assessed for taxation. In addition, the unvoted net debt of municipal corporations cannot exceed 5.50% of total assessed value of property. The City’s total debt limit (10.50%) is $591,282,445 and unvoted debt limit (5.50%) is $309,719,376. At December 31, 2012, the City had no capacity under the indirect debt limitation calculation per the Ohio Revised Code to issue additional unvoted debt. However, these debt limitations are not expected to affect the financing of any currently planned facilities or services.
In addition, the City has entered into various derivative or hedging agreements since 1999. Derivative instruments are contracts, the value of which depends on, or derives from, the value of an underlying asset, index or rate. The most common types of derivatives used by governments are interest rate swaps and interest rate locks. A detailed description of each outstanding derivative, including its terms, objectives, risks and fair value, can be found in Note 5 – Debt and Other Long-Term Obligations.

51
In accordance with GASB Statement No. 53, Accounting and Financial Reporting for Derivative Instruments, the City has reported a deferred outflow and a liability in the amount of the fair value of the interest rate swaps, which reflect the prevailing interest rate environment at December 31, 2012 and an investment loss or gain as appropriate based on the change in fair value. The specific terms and conditions of each swap have been provided by the respective counterparty for each swap and confirmed by the City’s financial advisor.
Additional information on the City’s long-term debt can be found in Note 5 – Debt and Other Long-Term Obligations.
FACTORS EXPECTED TO IMPACT THE CITY’S FUTURE FINANCIAL POSITION OR RESULTS OF OPERATIONS
The City, like all municipalities both local and national, continues to face the challenges of economic recession. Basic operating costs continue to rise due to negotiated salary increases, higher benefit costs and federal and state mandates being placed upon municipalities at the same time federal and state funding is being reduced.
Over the last several years, the City has seen significant reductions in funding from the federal and state governments. To offset these reductions, the City continues to focus on stimulating economic and community development throughout its core business districts and neighborhoods to strengthen its housing stock value and ensure a strong local job market.
Other Impacting Factors
On January 17, 2013, Moody’s Investors Service lowered its rating on Assured Guaranty Municipal Corporation, the insurer of the Series 2006 Parking Facilities Refunding Revenue Bonds. On March 21, 2013, the City completed a conversion of its $69,900,000 2010B Certificates of Participation (Cleveland Stadium Project) to a new index rate for a new index rate period. On April 16, 2013, the City entered into a novation agreement with UBS, AG and PNC Bank, National Association (PNC) under which the basis swap associated with the Parking Facilities Refunding Revenue Bonds, Series 2006, was transferred from UBS to PNC effective March 15, 2013. Effective April 24, 2013, the City issued $58,000,000 Airport System Revenue Bonds, Series 2013A (Taxable). On May 13, 2013, City Council approved legislation authorizing the City to enter into a lease agreement for the purchase of vehicles for various City departments. Effective May 30, 2013 the City issued $35,840,000 Subordinate Lien Income Tax Bonds, Series 2013A. The bonds were issued to provide funds for various public facilities, road and bridges, and parks and recreation improvements throughout the City. On June 20, 2013, the City entered into a lease agreement with Huntington Public Capital Corporation for the purchase of $6,500,000 of vehicles and heavy equipment for various departments. The lease will be paid for over seven years out of the receipts for Restricted Income Tax.
See Note 21- Subsequent Events for additional information.
NEED ADDITIONAL INFORMATION
This financial report is designed to provide a general overview of the City’s finances for all those with an interest in the City’s finances. Questions concerning any of the information provided in this report or requests for additional information should beaddressed to the Office of the Finance Director, City Hall, Room 104, 601 Lakeside Avenue, Cleveland, Ohio 44114.

52
This Page Intentionally Left Blank.

53
BASIC FINANCIAL STATEMENTS

CITY OF CLEVELAND, OHIO
STATEMENT OF NET POSITIONDECEMBER 31, 2012
Governmental Business-TypeActivities Activities Total
ASSETSCash and cash equivalents 345,777$ 396,119$ 741,896$ Investments 9,522 9,522 Receivables:
Taxes 136,030 136,030 Accounts 28,330 179,758 208,088 Grants 12,458 12,458 Loans 190,860 190,860 Unbilled revenue 39,616 39,616 Accrued interest 4 4 Assessments 2,615 2,615 Less: Allowance for doubtful accounts (20,967) (29,757) (50,724)
Receivables, net 349,330 189,617 538,947
Internal balances 1,576 (1,576) -Due from other governments 34,730 2,976 37,706 Inventory of supplies 2,348 16,384 18,732 Prepaid expenses and other assets 1,591 1,591 Restricted assets:
Cash and cash equivalents 585,961 585,961 Investments 3,739 3,739 Accrued interest receivable 86 86 Accrued passenger facility charge 2,244 2,244
Total restricted assets - 592,030 592,030
Unamortized bond issuance costs 21,205 25,582 46,787
Capital assets:Land and construction in progress 181,568 484,991 666,559 Other capital assets, net of accumulated depreciation 747,894 2,570,715 3,318,609
Total capital assets 929,462 3,055,706 3,985,168 Total assets 1,693,950 4,278,429 5,972,379
DEFERRED OUTFLOWS OF RESOURCES
Derivative instruments-interest rate swaps 27,699 27,699 Total deferred outflows of resources - 27,699 27,699
The notes to the financial statements are an integral part of this statement.
(Amounts in 000's)
54
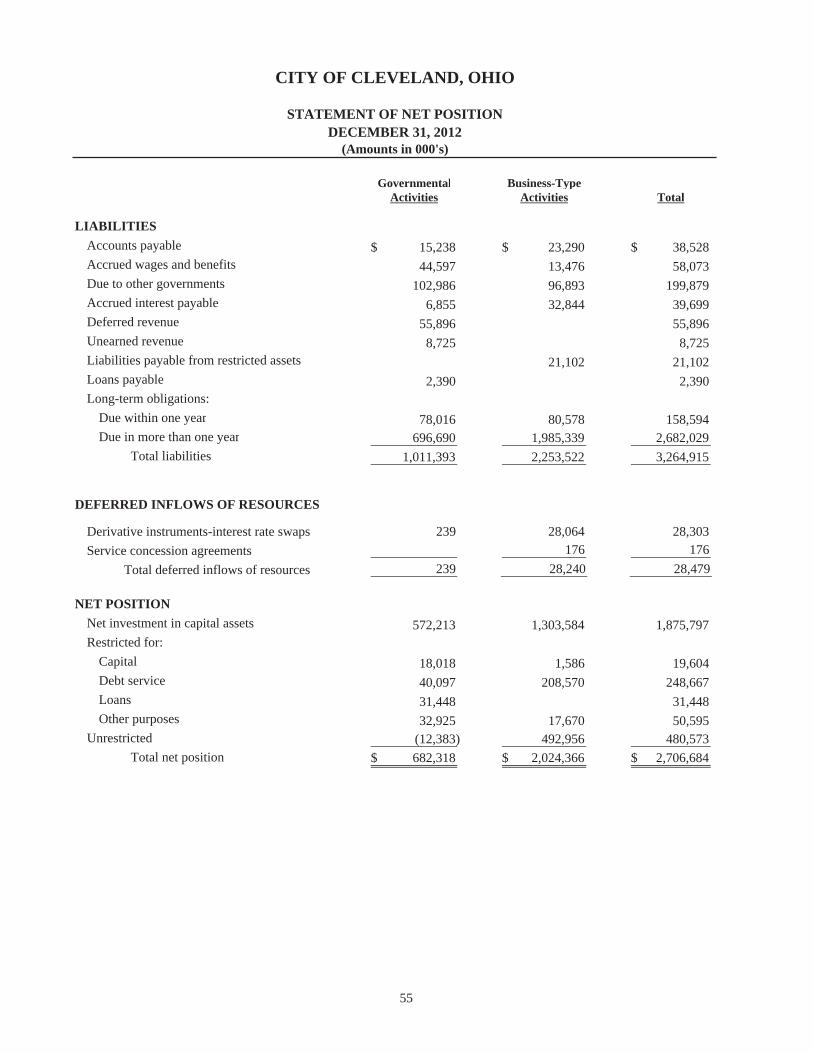
CITY OF CLEVELAND, OHIO
STATEMENT OF NET POSITIONDECEMBER 31, 2012
Governmental Business-TypeActivities Activities Total
LIABILITIESAccounts payable 15,238$ 23,290$ 38,528$ Accrued wages and benefits 44,597 13,476 58,073 Due to other governments 102,986 96,893 199,879 Accrued interest payable 6,855 32,844 39,699 Deferred revenue 55,896 55,896 Unearned revenue 8,725 8,725 Liabilities payable from restricted assets 21,102 21,102 Loans payable 2,390 2,390 Long-term obligations:
Due within one year 78,016 80,578 158,594 Due in more than one year 696,690 1,985,339 2,682,029
Total liabilities 1,011,393 2,253,522 3,264,915
DEFERRED INFLOWS OF RESOURCES
Derivative instruments-interest rate swaps 239 28,064 28,303 Service concession agreements 176 176
Total deferred inflows of resources 239 28,240 28,479
NET POSITIONNet investment in capital assets 572,213 1,303,584 1,875,797 Restricted for:
Capital 18,018 1,586 19,604 Debt service 40,097 208,570 248,667 Loans 31,448 31,448 Other purposes 32,925 17,670 50,595
Unrestricted (12,383) 492,956 480,573 Total net position 682,318$ 2,024,366$ 2,706,684$
(Amounts in 000's)
55

OperatingCharges for Grants and
Expenses Services Contributions
106,141$ 30,696$ 4,345$128,276 18,369 28,342310,745 15,049 13,80570,705 69,00414,729 5,757 6,67917,385 2,967 10,32113,845 100 11,38726,153
687,979 72,938 143,883
244,647 280,323 4,567163,547 165,227 97 153,627 116,694 177
25,231 22,894 592,435 1,2261,739 1,302 2
927,381 7,735 4171,821 1,495
972 536601,492 597,432 5,319
Total 1,289,471$ 670,370$ 149,202$
Property taxes
Public Auditorium
Nonmajor activities:
Golf Courses
Public Health
State local government funds
Other taxes
Total business-type activities
Income taxesGeneral revenues:
CITY OF CLEVELAND, OHIO
STATEMENT OF ACTIVITIESFOR THE YEAR ENDED DECEMBER 31, 2012
(Amounts in 000's)
Cemeteries
Program Revenues
Municipal Parking LotsEastside Market
The notes to the financial statements are an integral part of this statement.
Net position at end of year
Unrestricted investment earnings
Shared revenues
Net position at beginning of year (as restated)Change in net position
Total general revenues and transfersTransfers
Other
Business-type activities:
Airport facilitiesElectricityWater
Total governmental activitiesInterest on debt
Westside Market
Functions/Programs:
Building and HousingCommunity DevelopmentPublic SafetyPublic WorksGeneral Government
Governmental activities:
Economic Development
Sewer
56

CapitalGrants and Governmental Business-Type
Contributions Activities Activities Total
1,330$ (69,770)$ $ (69,770)$24,515 (57,050) (57,050)
(281,891) (281,891)(1,701) (1,701)(2,293) (2,293)(4,097) (4,097)(2,358) (2,358)
(26,153) (26,153)25,845 (445,313) - (445,313)
21,800 62,043 62,043964 2,741 2,741
25,025 (11,731) (11,731)
364 (1,914) (1,914)3,645 2,436 2,436
210 (225) (225)(92) (92)
496 1,267 1,267992 666 66666 (370) (370)
53,562 - 54,821 54,821
79,407$ (445,313) 54,821 (390,492)
330,863 330,863 56,086 56,086 28,680 28,680 27,338 27,338 25,966 25,966
692 692 18,141 18,141 (1,589) 1,589 -
486,177 1,589 487,76640,864 56,410 97,274
641,454 1,967,956 2,609,410682,318$ 2,024,366$ 2,706,684$
Net (Expense) Revenue andChanges in Net Positon
57

CITY OF CLEVELAND, OHIO
BALANCE SHEET-GOVERNMENTAL FUNDS
Other TotalGovernmental Governmental
General Funds Funds
ASSETS84,869$ 243,525$ 328,394$
Investments 9,522 9,522Receivables:
Taxes 101,021 35,009 136,030Accounts 28,330 28,330Grants 12,458 12,458Loans 190,860 190,860Accrued interest 4 4Assessments 2,615 2,615
(20,967) (20,967)Receivables, net 108,384 240,946 349,330Due from other funds 1,393 12,472 13,865Due from other governments 21,240 13,490 34,730Inventory of supplies 632 495 1,127
TOTAL ASSETS 216,518$ 520,450$ 736,968$
LIABILITIESAccounts payable 4,795$ 8,760$ 13,555$Accrued wages and benefits 40,426 3,140 43,566Due to other governments 3,745 98,486 102,231Deferred revenue 89,117 49,502 138,619Unearned revenue 576 8,149 8,725Due to other funds 6,109 15,183 21,292Total liabilities 144,768 183,220 327,988
FUND BALANCESNonspendable 632 495 1,127Restricted 233,832 233,832Committed 102,901 102,901Assigned 9,239 2 9,241Unassigned 61,879 61,879Total fund balances 71,750 337,230 408,980
216,518$ 520,450$
925,547
82,723
(747,409)
12,477682,318$
DECEMBER 31, 2012(Amounts in 000's)
due and payable in the current period and therefore are not reported
included in the governmental activities in the statement of net position.Net position of governmental activities
Capital assets used in governmental activities (excluding internal service fund capital assets) are not financial resources and,
in the funds. The assets and liabilities of most of the internal service funds are
The notes to the financial statements are an integral part of this statement.
Less: Allowance for doubtful accounts
Cash and cash equivalents
TOTAL LIABILITIES AND FUND BALANCES
Amounts reported for governmental activities in the statementof net position are different because:
therefore, are not reported in the funds. Other long-term assets are not available to pay for current-period expenditures and, therefore, are deferred in the funds. Long-term liabilities, including bonds and claims payable, are not
58

Other TotalGovernmental Governmental
General Funds Funds
REVENUES:Income taxes 294,648$ 36,470$ 331,118$ Property taxes 36,028 19,284 55,312 State local government funds 31,821 31,821 Other taxes and shared revenues 50,489 35,595 86,084 Licenses and permits 12,314 2,756 15,070 Charges for services 34,230 7,206 41,436 Fines, forfeits and settlements 21,451 5,379 26,830 Investment earnings 277 191 468 Grants 5,724 124,000 129,724 Contributions 1,364 1,364 Miscellaneous 10,074 8,696 18,770
Total revenues 497,056 240,941 737,997
EXPENDITURES:Current:
General Government 76,966 8,159 85,125 Public Works 63,622 22,131 85,753 Public Safety 294,955 8,812 303,767 Community Development 157 69,081 69,238 Building and Housing 7,836 6,706 14,542 Public Health 5,326 11,660 16,986 Economic Development 1,407 11,387 12,794 Other 10,992 10,992
Capital outlay 2,302 67,643 69,945 Inception of capital lease 5,648 5,648 Debt service:
Principal retirement 48,115 48,115 Interest 33,741 33,741 General Government 1,264 1,264 Other 1,168 1,168 Total expenditures 463,563 295,515 759,078
EXCESS (DEFICIENCY) OF REVENUESOVER (UNDER) EXPENDITURES 33,493 (54,574) (21,081)
OTHER FINANCING SOURCES (USES):Transfers in 3,602 56,228 59,830 Transfers out (16,941) (45,204) (62,145) Issuance of debt 82,945 82,945 Premium on bonds 8,770 8,770 Discount on bonds (145) (145) Payment to refund bonds (28,910) (28,910) Sale of City assets 2 322 324 Proceeds from capital lease 6,507 6,507
Total other financing sources (uses) (13,337) 80,513 67,176
NET CHANGE IN FUND BALANCES 20,156 25,939 46,095
FUND BALANCES AT BEGINNING OF YEAR 51,594 311,291 362,885
FUND BALANCES AT END OF YEAR 71,750$ 337,230$ 408,980$
The notes to the financial statements are an integral part of this statement.
CITY OF CLEVELAND, OHIO
STATEMENT OF REVENUES, EXPENDITURES AND CHANGESIN FUND BALANCES-GOVERNMENTAL FUNDS
FOR THE YEAR ENDED DECEMBER 31, 2012(Amounts in 000's)
59

Amounts reported for governmental activities in the statement of activities (pages 56 and 57) aredifferent because:
Net change in fund balances - total governmental funds (page 59) 46,095$
Governmental funds report capital outlays as expenditures; however, in thestatement of activities, the cost of those assets is allocated over their estimateduseful lives and reported as depreciation expense. This is the amount by which capital outlays exceeded depreciation in the current period. 15,654
Revenues in the statement of activities that do not provide current financial resourcesare not reported as revenues in the funds. (9,512)
The issuance of long-term debt (e.g., bonds, leases) provides current financialresources to governmental funds, while the repayment of the principal of long-termdebt consumes the current financial resources of governmental funds. Neithertransaction, however, has any effect on net position. Also, governmental fundsreport the effect of debt issuance costs, premiums, discounts, and similar items whendebt is first issued, whereas these amounts are deferred and amortized in thestatement of activities. This amount is the net effect of these differences,including accrued interest, in the treatment of long-term debt and related items. (17,982)
Some expenses reported in the statement of activities do not require the use ofcurrent financial resources and, therefore, are not reported as expenditures ingovernmental funds. 3,219
The net revenue of certain activities of internal service funds is reported withgovernmental activities. 3,390
Change in net position of governmental activities (pages 56 and 57) 40,864$
The notes to the financial statements are an integral part of this statement.
FOR THE YEAR ENDED DECEMBER 31, 2012(Amounts in 000's)
CITY OF CLEVELAND, OHIO
RECONCILIATION OF THE STATEMENT OF REVENUES,EXPENDITURES AND CHANGES IN FUND BALANCES TO THE
STATEMENT OF ACTIVITIES OF GOVERNMENTAL FUNDS
60

IN FUND BALANCES (BUDGET AND ACTUAL) - GENERAL FUND
Variance-Original Final PositiveBudget Budget Actual* (Negative)
REVENUES:Income taxes 271,105$ 271,105$ 290,474$ 19,369$Property taxes 36,903 36,903 36,028 (875)State local government funds 34,673 34,673 34,673 -Other taxes and shared revenues 40,472 40,472 46,929 6,457Licenses and permits 11,785 11,785 12,372 587Charges for services 29,994 29,994 33,837 3,843Fines, forfeits and settlements 22,737 22,737 21,626 (1,111)Investment earnings 130 130 250 120Grants 5,943 5,943 5,464 (479) Miscellaneous 18,264 18,264 19,365 1,101
Total revenues 472,006 472,006 501,018 29,012
EXPENDITURES:Current:
General Government 83,655 83,820 78,496 5,324Public Works 66,766 67,159 63,848 3,311Public Safety 299,409 299,409 294,746 4,663Community Development 271 271 148 123Building and Housing 9,822 9,837 8,317 1,520Public Health 5,299 5,653 5,346 307Economic Development 1,525 1,525 1,413 112Other 19,436 19,541 16,229 3,312 Total expenditures 486,183 487,215 468,543 18,672
EXCESS (DEFICIENCY) OF REVENUESOVER (UNDER) EXPENDITURES (14,177) (15,209) 32,475 47,684
OTHER FINANCING SOURCES (USES):Transfers in 18,218 18,218 16,981 (1,237)Transfers out (20,873) (19,841) (17,941) 1,900Sale of City assets 2 2
Total other financing sources (uses) (2,655) (1,623) (958) 665
EXCESS (DEFICIENCY) OF REVENUES AND OTHER FINANCINGSOURCES OVER (UNDER) EXPENDITURES AND OTHERFINANCING USES (16,832) (16,832) 31,517 48,349
DECERTIFICATION OF PRIOR YEAR ENCUMBRANCESAND PRE-ENCUMBRANCES 2,181 2,181
NET CHANGE IN FUND BALANCES (16,832) (16,832) 33,698 50,530
FUND BALANCES AT BEGINNING OF YEAR 16,861 16,861 16,861 -
FUND BALANCES AT END OF YEAR 29$ 29$ 50,559$ 50,530$
* On budgetary basis of accounting (see Note 2 - Summary of Significant Accounting Policies, "D" Budgetary Procedures).
The notes to the financial statements are an integral part of this statement.
CITY OF CLEVELAND, OHIO
STATEMENT OF REVENUES, EXPENDITURES AND CHANGES
FOR THE YEAR ENDED DECEMBER 31, 2012(Amounts in 000's)
61

GovernmentalCleveland Department Nonmajor Total Activities -
Division of Public of Port Enterprise Enterprise InternalWater Power Control Funds Funds Service Funds
ASSETSCurrent assets:
Cash and cash equivalents 194,377$ 58,097$ 87,196$ 55,679$ 395,349$ 18,153$Restricted cash and cash equivalents 12,755 1,310 7,037 21,102 Receivables:
Accounts 64,167 16,310 9,732 89,549 179,758 Unbilled revenue 31,540 1,931 3,314 2,831 39,616 Less: Allowance for doubtful accounts (15,299) (9,407) (2,000) (3,051) (29,757) Receivables, net 80,408 8,834 11,046 89,329 189,617 -
Due from other funds 14,662 3,313 34 546 18,555 9,201Due from other governments 2,976 2,976 Inventory of supplies 4,713 8,826 2,343 502 16,384 1,221Prepaid expenses and other assets 1,178 90 323 1,591
Total current assets 308,093 80,470 110,955 146,056 645,574 28,575
Noncurrent assets:Restricted assets:
Cash and cash equivalents 211,759 51,122 286,051 15,927 564,859 Investments 3,739 3,739 Accrued interest receivable 84 1 1 86 Accrued passenger facility charges 2,244 2,244 Total restricted assets 211,843 54,862 288,296 15,927 570,928 -
Unamortized bond issuance costs 5,151 2,646 16,497 1,288 25,582
Capital assets:Land 5,463 5,249 167,457 13,729 191,898 663Land improvements 16,549 305 74,153 6,728 97,735 146Utility plant 1,497,878 495,234 137,728 2,130,840 Buildings, structures and improvements 238,532 21,413 334,242 106,213 700,400 3,557Furniture, fixtures, equipment and vehicles 586,549 81,036 43,819 18,903 730,307 9,513Infrastructure 975,801 975,801 Construction in progress 201,167 46,583 29,011 16,332 293,093 488Less: Accumulated depreciation (859,199) (314,193) (729,465) (161,951) (2,064,808) (10,012) Total capital assets, net 1,686,939 335,627 895,018 137,682 3,055,266 4,355
Total noncurrent assets 1,903,933 393,135 1,199,811 154,897 3,651,776 4,355
TOTAL ASSETS 2,212,026 473,605 1,310,766 300,953 4,297,350 32,930
DEFERRED OUTFLOWS OF RESOURCESDerivative instruments-interest rate swaps 27,699 27,699
Total deferred outflows of resources 27,699 - - - 27,699 -
TOTAL ASSETS AND DEFERRED OUTFLOWS 2,239,725$ 473,605$ 1,310,766$ 300,953$ 4,325,049$ 32,930$
(Continued)
Business Type Activities - Enterprise Funds
CITY OF CLEVELAND, OHIO
STATEMENT OF NET POSITION - PROPRIETARY FUNDSDECEMBER 31, 2012
(Amounts in 000's)
62

GovernmentalCleveland Department Nonmajor Total Activities -
Division of Public of Port Enterprise Enterprise InternalWater Power Control Funds Funds Service Funds
LIABILITIESCurrent liabilities:
Accounts payable 6,721$ 10,350$ 3,546$ 2,870$ 23,487$ 2,246$Accrued wages and benefits 10,083 3,855 4,079 2,033 20,050 2,499Due to other funds 2,630 4,499 1,412 11,584 20,125 204Due to other governments 5,968 90,925 96,893 755Accrued interest payable 13,521 1,221 17,632 470 32,844 Current payable from restricted assets 12,755 1,310 7,037 21,102 Current portion of long-term obligations 37,804 12,710 19,515 3,045 73,074
Total current liabilities 83,514 33,945 59,189 110,927 287,575 5,704
Long-term liabilities:Accrued wages and benefits 1,365 499 595 206 2,665 14,409Construction loans payable 100,700 1,813 102,513 Deferred payment obligation 280 280 Accreted interest payable 7,768 7,768 Revenue bonds payable 766,975 220,202 856,702 28,103 1,871,982
Total noncurrent liabilities 869,040 228,469 857,577 30,122 1,985,208 14,409
Total liabilities 952,554 262,414 916,766 141,049 2,272,783 20,113
DEFERRED INFLOWS OF RESOURCESDerivative instruments-interest rate swaps 27,699 365 28,064 Service concession agreements 176 176
Total deferred inflows of resources 27,699 - - 541 28,240 -
NET POSITIONNet investment in capital assets 914,193 153,436 127,557 107,958 1,303,144 4,355Restricted for capital projects 99 1,309 178 1,586 Restricted for debt service 87,602 3,976 111,467 5,525 208,570 Restricted for passenger facility charges 17,670 17,670 Unrestricted 257,578 52,470 137,306 45,702 493,056 8,462
Total net position 1,259,472 211,191 394,000 159,363 2,024,026 12,817TOTAL LIABILITIES, DEFERRED INFLOWS AND NET POSITION 2,239,725$ 473,605$ 1,310,766$ 300,953$ 32,930$
Adjustment to reflect the consolidationof internal service fund activities relatedto enterprise funds 340
NET POSITION OF BUSINESS-TYPE ACTIVITIES 2,024,366$
The notes to the financial statements are an integral part of this statement. (Concluded)
Business-Type Activities - Enterprise Funds
CITY OF CLEVELAND, OHIO
STATEMENT OF NET POSITION - PROPRIETARY FUNDSDECEMBER 31, 2012
(Amounts in 000's)
63

GovernmentalCleveland Department Nonmajor Total Activities -
Division of Public of Port Enterprise Enterprise InternalWater Power Control Funds Funds Service Funds
OPERATING REVENUES:Charges for services 280,323$ 165,227$ 116,694$ 35,170$ 597,414$ 46,969$
Total operating revenue 280,323 165,227 116,694 35,170 597,414 46,969
OPERATING EXPENSES:Operations 103,687 21,379 64,454 19,827 209,347 42,500Maintenance 45,482 19,820 4,401 9,217 78,920 2,095Purchased power 95,788 95,788 Depreciation 67,455 16,971 50,541 7,684 142,651 649
Total operating expenses 216,624 153,958 119,396 36,728 526,706 45,244
OPERATING INCOME (LOSS) 63,699 11,269 (2,702) (1,558) 70,708 1,725
Investment income (loss) 1,965 80 272 484 2,801 21Interest expense (28,322) (9,677) (29,571) (1,955) (69,525) Passenger facility charges 15,781 15,781 Sound insulation program (577) (577) Loss on disposal of capital assets (15) (59) (8) (82) (68)Other revenues (expenses) 4,284 (59) (4,193) (77) (45)
Total non-operating revenues (expenses) (22,088) (9,656) (18,347) (1,556) (51,647) (47)
41,611 1,613 (21,049) (3,114) 19,061 1,678
Capital contributions 20,118 981 9,149 5,616 35,864 882Transfers in 1,589 1,589 726
Change in net position 61,729 2,594 (11,900) 4,091 56,514 3,286
1,197,743 208,597 405,900 155,272 9,5311,259,472$ 211,191$ 394,000$ 159,363$ 12,817$
(104)
56,410$
The notes to the financial statements are an integral part of this statement.
CHANGE IN NET POSITION OF
Business-Type Activities - Enterprise Funds
NON-OPERATING REVENUES (EXPENSES):
NET POSITION AT BEGINNING OF YEAR (as restated)
INCOME (LOSS) BEFORE CONTRIBUTIONSAND TRANSFERS
CITY OF CLEVELAND, OHIO
STATEMENT OF REVENUES, EXPENSES AND CHANGESIN FUND NET POSITION - PROPRIETARY FUNDS
FOR THE YEAR ENDED DECEMBER 31, 2012(Amounts in 000's)
BUSINESS-TYPE ACTIVITIES
Adjustment to reflect consolidation ofinternal service fund activities relatedto enterprise funds
NET POSITION AT END OF YEAR
64

GovernmentalCleveland Department Nonmajor Total Activities -
Division of Public of Port Enterprise Enterprise InternalWater Power Control Funds Funds Service Funds
264,534$ 168,740$ 122,327$ 35,426$ 591,027$ 45,578$(66,921) (15,640) (38,839) (11,655) (133,055) (25,549)(76,526) (22,056) (28,850) (14,256) (141,688) (17,733)
(95,152) (95,152) 6,265 6,265
140 (4,813) (4,673)
operating activities 121,227 31,079 54,638 15,780 222,724 2,296
Cash payments for sound insulation of homes (641) (641) Cash received through transfers
from other funds 1,589 1,589 726Miscellaneous non-operating revenue (expense) 89 (3,827) 145 (3,593)
Net cash provided by (used for) noncapitalfinancing activities - 89 (4,468) 1,734 (2,645) 726
FINANCING ACTIVITIESCash receipts for passenger facility charges 15,816 15,816 Proceeds from sale of revenue bonds,
loans and notes 192,924 15,325 252,946 461,195 Acquisition and construction of capital assets (67,355) (16,620) (22,452) (3,996) (110,423) (131)Principal paid on long-term debt (90,239) (10,050) (13,903) (2,925) (117,117) Interest paid on long-term debt (34,236) (9,746) (32,871) (1,807) (78,660) Cash paid to escrow agent for refunding (50,000) (16,294) (252,379) (318,673) Capital grant proceeds 6,846 289 7,135
Net cash provided by (used for) capitaland related financing activities (48,906) (37,385) (45,997) (8,439) (140,727) (131)
Purchase of investment securities (99,959) (28,731) (105,981) 6,022 (228,649) Proceeds from sale and maturity of
investment securities 112,004 30,010 185,583 4,095 331,692 Interest received on investments 2,158 120 449 111 2,838 21
Net cash provided by (used for) investing activities 14,203 1,399 80,051 10,228 105,881 21
86,524 (4,818) 84,224 19,303 185,233 2,912
332,367 115,347 296,060 52,303 796,077 15,241.
418,891$ 110,529$ 380,284$ 71,606$ 981,310$ 18,153$
(Continued)
CASH FLOWS FROM OPERATING ACTIVITIES:
Business-Type Activities - Enterprise Funds
CITY OF CLEVELAND, OHIO
STATEMENT OF CASH FLOWS - PROPRIETARY FUNDSFOR THE YEAR ENDED DECEMBER 31, 2012
(Amounts in 000's)
Cash payments to employees for servicesCash payments to suppliers for goods or servicesCash received from customers
AT END OF YEAR
FINANCING ACTIVITIES:
CASH FLOWS FROM INVESTING ACTIVITIES:
NET INCREASE (DECREASE) IN CASH
CASH AND CASH EQUIVALENTS AT
OtherNet cash provided by (used for)
CASH AND CASH EQUIVALENTS
BEGINNING OF YEAR
AND CASH EQUIVALENTS
CASH FLOWS FROM CAPITAL AND RELATED
Agency activity on behalf of other sewer authoritiesCash payments for purchased power
CASH FLOWS FROM NONCAPITAL
65
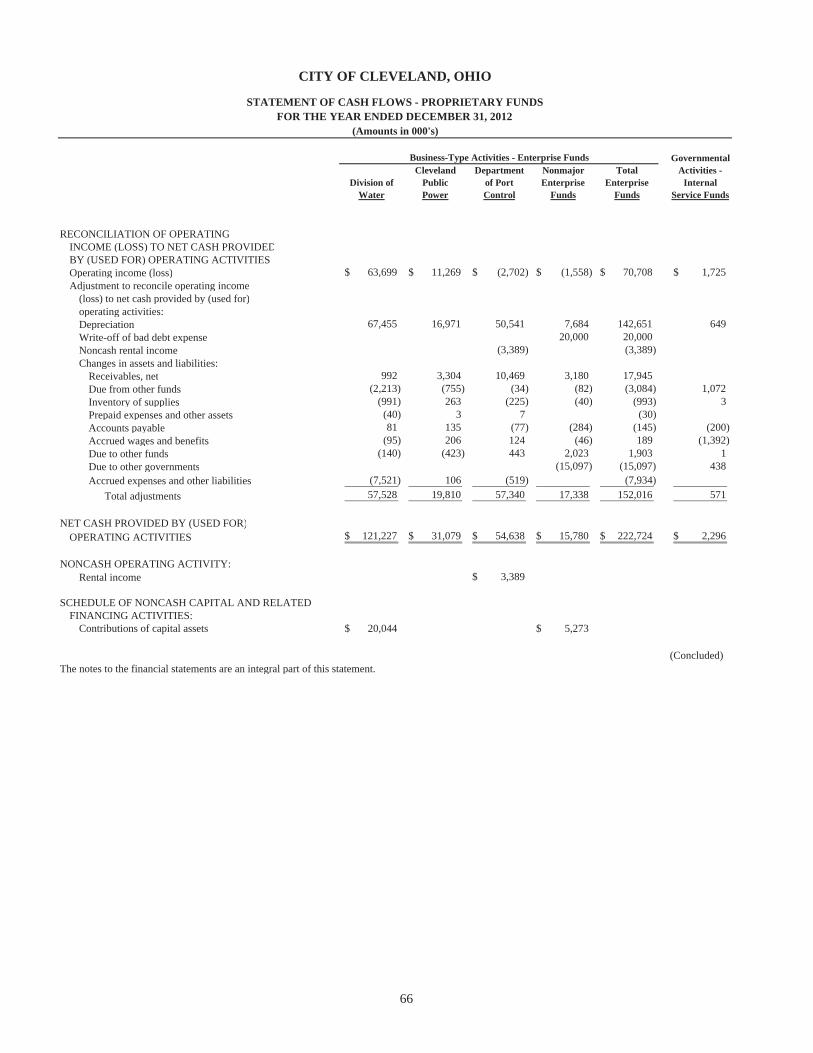
GovernmentalCleveland Department Nonmajor Total Activities -
Division of Public of Port Enterprise Enterprise InternalWater Power Control Funds Funds Service Funds
RECONCILIATION OF OPERATINGINCOME (LOSS) TO NET CASH PROVIDEDBY (USED FOR) OPERATING ACTIVITIESOperating income (loss) 63,699$ 11,269$ (2,702)$ (1,558)$ 70,708$ 1,725$Adjustment to reconcile operating income
(loss) to net cash provided by (used for)operating activities:Depreciation 67,455 16,971 50,541 7,684 142,651 649Write-off of bad debt expense 20,000 20,000 Noncash rental income (3,389) (3,389) Changes in assets and liabilities:
Receivables, net 992 3,304 10,469 3,180 17,945 Due from other funds (2,213) (755) (34) (82) (3,084) 1,072Inventory of supplies (991) 263 (225) (40) (993) 3Prepaid expenses and other assets (40) 3 7 (30) Accounts payable 81 135 (77) (284) (145) (200)Accrued wages and benefits (95) 206 124 (46) 189 (1,392)Due to other funds (140) (423) 443 2,023 1,903 1Due to other governments (15,097) (15,097) 438Accrued expenses and other liabilities (7,521) 106 (519) (7,934) Total adjustments 57,528 19,810 57,340 17,338 152,016 571
NET CASH PROVIDED BY (USED FOR)OPERATING ACTIVITIES 121,227$ 31,079$ 54,638$ 15,780$ 222,724$ 2,296$
Rental income 3,389$
Contributions of capital assets 20,044$ 5,273$
(Concluded)The notes to the financial statements are an integral part of this statement.
SCHEDULE OF NONCASH CAPITAL AND RELATED FINANCING ACTIVITIES:
NONCASH OPERATING ACTIVITY:
Business-Type Activities - Enterprise Funds
CITY OF CLEVELAND, OHIO
STATEMENT OF CASH FLOWS - PROPRIETARY FUNDSFOR THE YEAR ENDED DECEMBER 31, 2012
(Amounts in 000's)
66

AgencyFunds
ASSETSCash and cash equivalents 23,114$ Taxes receivable 19,699 Due from other governments 1,171
Total assets 43,984$
LIABILITIESDue to other governments 26,492 Due to others 17,492
Total liabilities 43,984$
The notes to the financial statements are an integral part of this statement.
CITY OF CLEVELAND, OHIO
STATEMENT OF FIDUCIARY ASSETS AND LIABILITIESFIDUCIARY FUNDSDECEMBER 31, 2012
(Amounts in 000's)
67

68
This Page Intentionally Left Blank.

69
CITY OF CLEVELAND, OHIO
NOTES TO FINANCIAL STATEMENTS
NOTE 1 – DESCRIPTION OF CITY OPERATIONS AND REPORTING ENTITY
The City: The City of Cleveland, Ohio (the City) operates under an elected Mayor/Council (19 Council members) administrative/legislative form of government.
Reporting Entity: The accompanying financial statements as of December 31, 2012 and for the year then ended have been prepared in conformity with accounting principles generally accepted in the United States of America (GAAP) applicable to local governments. The Governmental Accounting Standards Board (GASB) is the standard-setting body for establishing governmental accounting and financial reporting principles, which are primarily set forth in the GASB’s Codification of Governmental Accounting and Financial Reporting Standards (GASB Codification).
In evaluating how to define the governmental reporting entity, the City complies with the provisions of GASB Statement No. 14, The Financial Reporting Entity, under which the financial statements include all the organizations, activities, functions and component units for which the City (primary government) is financially accountable. Financial accountability is defined as the appointment of a voting majority of the component unit’s board, and either (1) the City’s ability to impose its will over the component unit or (2) the possibility that the component unit will provide a financial benefit to or impose a financial burden on the City.
On this basis, the City’s financial reporting entity has no component units but includes in its financial statements the financial activities of all departments, agencies, boards and commissions that are part of the primary government, including police and fire protection, waste collection, parks and recreation, health, certain social services and general administrative services. In addition, the City owns and operates several enterprise activities, the principal ones consisting of a water system, an electric distribution system and two airports.
The following entities are related organizations of the City of Cleveland; however, the City’s accountability does not extend beyond its appointing authority:
Cuyahoga Metropolitan Housing Authority – Created under the Ohio Revised Code, the Cuyahoga Metropolitan Housing Authority provides public housing services. The five-member board consists of two appointed by the Mayor of the City of Cleveland, two appointed by Cleveland City Council and one appointed by the Mayor of the City of East Cleveland with approval from its City Council.
Cleveland-Cuyahoga County Port Authority – Created under the Ohio Revised Code, the Cleveland-Cuyahoga County Port Authority conducts port operations and economic development activities. The nine-member Board of Directors consists of three appointed by the Cuyahoga County Commissioners and six appointed by the City of Cleveland.
Cleveland Metropolitan School District (Schools) – In November of 1998, the Mayor of the City of Cleveland was given appointing authority for the Schools. As approved by the State Legislature, the Ohio Revised Code provides for the Mayor to appoint a Chief Executive Officer who must be approved by the Board of Education (the Board). The Board is comprised of nine-members. The members of the Board are appointed by the Mayor from a pool of candidates presented to the Mayor by an independent nominating panel. In November 2002, the voters of Cleveland elected to maintain the current governance structure.

70
The following entity is a jointly governed organization of the City; however, the City has no ongoing financial interest or responsibility:
Gateway Economic Development Corporation of Greater Cleveland (Gateway) – Gateway is responsible for the operations of a sports complex and related economic development. The five-member board consists of two members appointed by the City, two members appointed by the Board of County Commissioners and one by the President of the Board of County Commissioners with concurrence of the Mayor of the City of Cleveland.
NOTE 2 – SUMMARY OF SIGNIFICANT ACCOUNTING POLICIES
Significant Accounting Policies:
The following is a summary of the more significant policies followed during the preparation of the accompanying financial statements.
A. Government-Wide and Fund Financial Statements
GASB Statement No. 34 established requirements and a reporting model for the annual financial reports of state and local governments. GASB Statement No. 34 was developed to make annual reports easier to understand and more useful to the people who use governmental financial information to make decisions. Financial information of the City is presented in the following format:
Basic Financial Statements:
1. Government-wide financial statements consist of a statement of net position and a statement of activities. These statements report all of the assets, deferred outflows, liabilities, deferred inflows, revenues, expenses, gains and losses of the City. Governmental activities are reported separately from business-type activities. Governmental activities are normally supported by taxes and intergovernmental revenues whereas business-type activities are normally supported by fees and charges for services and are usually intended by management to be financially self-sustaining. Fiduciary funds of the City are not included in these government-wide financial statements.
Interfund receivables and payables, bonds and notes issued and held by the City as investments within governmental and business-type activities have been eliminated in the government-wide statement of net position. Related interest amounts are eliminated in the government-wide statement of activities. These eliminations minimize the duplicating effect on assets and liabilities within the governmental and business-type activities total column.
Internal Service Fund balances, whether positive or negative, have been eliminated against the expenses and program revenues shown as governmental activities in the statement of activities, except for the Utilities Administration Fund which is shown in the business-type activities column.
The statement of activities presents a comparison between direct expenses and program revenues for the different business-type activities of the City and for each function of the City’s governmental activities.
Direct expenses are those that are specifically associated with a program or function and, therefore, are clearly identifiable to a particular function. Program revenue includes (a) charges paid by the recipients of goods or services offered by the programs and (b) grants and contributions, including special assessments that are restricted to meeting the operational or capital requirements of a particular program. Revenues that are not classified as program revenues, including all taxes, are presented as general revenues. General revenues are considered unrestricted in nature.

71
Program revenues and expenses previously reported as “Other” program revenues and expenses in governmental activities on the statement of activities are now classified as General Government program revenues and expenses as appropriate.
Business-type activities on the government-wide statement of activities summarizes other Enterprise Funds as Nonmajor activities. These include Sewer, Public Auditorium, West Side Market, East Side Market, Municipal Parking Lots, Cemeteries and Golf Courses.
2. Fund financial statements consist of a series of statements focusing on information about the City’s major governmental and Enterprise Funds. Separate statements are presented for the governmental, proprietary and fiduciary funds.
The City’s major governmental fund is the General Fund. Of the City’s business-type activities, the Division of Water Fund, Cleveland Public Power Fund and Department of Port Control Fund are considered major Enterprise Funds.
The General Fund is the primary operating fund of the City. It is used to account for all financial resources, except those required to be accounted for in other funds. Its revenues consist primarily of income and property taxes, investment earnings, other taxes and shared revenues, charges for services, licenses, fees and fines.
General Fund expenditures represent costs of General Government; Public Works (including waste collection); Public Safety (including police and fire); Building and Housing; Public Health; Community Development; and Economic Development. General Fund resources are also transferred annually to support other services which are accounted for in other separate funds.
The Division of Water Fund is a segment of the Department of Public Utilities of the City. The Division of Water was created for the purpose of supplying water services to customers within the Cleveland Metropolitan Area.
The Cleveland Public Power Fund is a segment of the Department of Public Utilities of the City. The Cleveland Public Power Fund was established by the City to provide electrical services to customers within the City.
The Department of Port Control Fund was established to account for the operations of the City’s airport facilities.
While not considered major funds, the City maintains Internal Service Funds used to account for the financing of goods or services provided by one department or division to another department, division or other government on a cost-reimbursement basis.
Also maintained by the City are fiduciary funds, such as Agency Funds, used to account for assets held by the City as an agent for individuals, private organizations or other governments.
3. The City’s General Fund budget to actual statement is presented as part of the basic financial statements.
4. Notes to the financial statements provide information that is essential to a user’s understanding of the basic financial statements.

72
B. Financial Reporting Presentation
The accounts of the City are organized on the basis of funds, each of which is considered a separate accounting entity. The operations of each fund are accounted for with a separate set of self-balancing accounts that comprise its assets, deferred outflows, liabilities, deferred inflows, fund balance (equity), revenues and expenditures (expenses). The fund types and classifications that the City reports are as follows:
GOVERNMENTAL FUNDS
1. General Fund – The general fund should be used to account for and report all financial resources not accounted for and reported in another fund.
2. Special Revenue Funds – Special Revenue Funds are used to account for and report the proceeds of specific revenue sources that are restricted or committed to expenditures of specified purposes other than debt service or capital projects. The term proceeds of specific revenue sourcesestablishes that one or more specific restricted or committed revenues should be the foundation for a special revenue fund.
3. Debt Service Funds – Debt Service Funds are used to account for and report financial resources that are restricted, committed, or assigned to expenditure for principal and interest. Debt service funds should be used to report resources if legally mandated (i.e. debt payable from property taxes). Financial resources that are being accumulated for principal and interest maturing in future years also should be reported in debt service funds.
4. Capital Project Funds – Capital Project Funds are used to account for and report financial resources that are restricted or committed to expenditure for capital outlays, including the acquisition or construction of capital facilities and other capital assets. Capital project funds exclude those types of capital-related outflows financed by proprietary funds or for assets that will be held in trust for individuals, private organizations, or other governments.
PROPRIETARY FUNDS
1. Enterprise Funds – The Enterprise Funds are used to account for operations that are financed and operated in a manner similar to private business enterprises, where the intent of the governing body is that the costs of providing goods or services to the general public on a continuing basis be financed or recovered primarily through user charges.
2. Internal Service Funds – The Internal Service Funds are used to account for the financing of goods or services provided by one department or division to other departments or divisions or to other governments on a cost-reimbursement basis. The City’s most significant Internal Service Funds are used to account for Motor Vehicle Maintenance, Municipal Income Tax Administration and the Workers’ Compensation Reserve.
FIDUCIARY FUNDS
1. Agency Funds – Agency Funds are used to account for assets held by the City as an agent for individuals, private organizations and other governments. The Agency Funds are custodial in nature (assets equal liabilities) and do not have a measurement focus. However, the accrual basis of accounting is used to recognize receivables and payables. The City’s more significant Agency Funds are used to account for Municipal Court and income tax collections for other municipalities.
Fiduciary funds are not included in the government-wide statements.
C. Measurement Focus and Basis of Accounting
Except for budgetary purposes, the basis of accounting used by the City conforms to GAAP as applicable to governmental units. The accounting and financial reporting treatment applied to a fund is determined by its measurement focus.

73
The government-wide, proprietary and fiduciary fund financial statements are reported using the economic resources measurement focus. The government-wide, proprietary and fiduciary fund financial statements are reported using the accrual basis of accounting. Revenues are recorded when earned and expenses are recorded at the time liabilities are incurred, regardless of when the related cash flows take place. Non-exchange transactions, in which the City gives (or receives) value without directly receiving (or giving) equal value in exchange, include income taxes, property taxes, grants, shared revenue and donations. On an accrual basis, revenue from income taxes is recognized in the period in which the taxpayer’s liability occurs and revenue from property taxes is recognized in the fiscal year for which the taxes are levied. On an accrual basis, revenue in the form of shared revenue is recognized when the provider government recognizes its liability to the City. Revenue from grants and donations is recognized in the fiscal year in which all eligibility requirements have been satisfied. Eligibility requirements include: (1) timing requirements which specify the year when the resources are required to be used or the year when use is first permitted; (2) matching requirements, in which the City must provide local resources to be used for a specified purpose; and (3) expenditure requirements, in which the resources are provided to the City on a cost-reimbursement basis.
Governmental fund financial statements are reported using the current financial resources measurement focus and the modified accrual basis of accounting. Under this method, revenues are recognized when both measurable and available. Revenues are considered to be available when they are collected within the current period or soon enough thereafter to pay liabilities of the current period. The City generally considers all revenues reported in the governmental funds to be available if the revenues are collected within sixty days after year end. Expenditures are generally recorded when the related fund liability is incurred, except for principal and interest on general long-term debt, claims and judgments and compensated absences, which are recognized as expenditures only when payment is due. General capital asset acquisitions are reported as expenditures in governmental funds. Proceeds of general long-term debt are reported as other financing sources.
In applying the susceptible-to-accrual concept under the modified accrual basis, the following revenue sources are deemed both measurable and available (i.e., collectible within the current year or within sixty days after year end and available to pay obligations of the current period): income taxes, investment earnings and shared revenues. Reimbursements due for federal or state funded projects are accrued as revenue at the time the expenditures are made or, when received in advance, deferred until expenditures are made. Property taxes and special assessments, though measurable, are not available to finance current period obligations. Therefore, property tax receivables are recorded and deferred until they become available. Other revenues, including licenses, fees, fines and forfeitures and charges for services are recorded as revenue when received in cash because they are generally not measurable until actually received.
Proprietary fund operating revenues, such as charges for services, result from exchange transactions associated with the principal activity of the fund. Exchange transactions are those in which each party receives and gives up essentially equal values. Operating expenses are necessary costs incurred to provide the goods or services that are the primary activity of the fund. Non-operating revenues, such as investment income and passenger facility charges, result from non-exchange transactions or ancillary activities.
When both restricted and unrestricted resources are available for use, it is the City’s policy to use restricted resources first, then unrestricted resources as they are needed. The City uses unrestricted resources that are committed first, assigned second and unassigned last.

74
Budgetary Procedures
The City is required by State law to adopt annual budgets for the General Fund, certain Special Revenue Funds (including the Division of Streets, Restricted Income Tax, Rainy Day Reserve, Schools Recreation and Cultural Activities and Cleveland Stadium Operations Funds), Debt Service Funds (except for Urban Renewal and Urban Renewal Reserve Funds) and Proprietary Operating Funds. Modifications to the original budget are approved by City Council throughout the year. The City maintains budgetary control by not permitting expenditures to exceed appropriations for personnel costs (including benefits) and other costs (including debt service and capital outlay), within a division of the City, without the approval of City Council. Adjustments to the budget can only be made within a division and then within each category. Further legislation is needed in order to move budget amounts from “personnel” to “other” or vice versa, or between divisions. City Council adopted four appropriation amendments during 2012 which reallocated appropriations and decreased the budget less than 1% from the original budget.
Unencumbered appropriations for annually budgeted funds lapse at year end.
The City’s budgetary process does not include annual budgeting for certain Special Revenue Funds and Capital Project Funds. Appropriations in these funds remain open and carry over to succeeding years (i.e., multi-year) until the related expenditures are made or until they are modified or canceled. Appropriations for these funds are controlled on a project basis.
The City’s budgetary process accounts for certain transactions on a basis other than GAAP. The major differences between the budget basis and the GAAP basis are that:
Revenues are recorded when received in cash (budget) as opposed to when susceptible to accrual (GAAP).
Expenditures are recorded when paid in cash (budget) as opposed to when the liability is incurred (GAAP).
Encumbrances and pre-encumbrances are recorded as the equivalent of expenditures (budget) as opposed to being included in fund balances (GAAP).
A reconciliation of the General Fund’s results of operations for 2012 reported on the budget basis versus the GAAP basis is as follows:
(Amounts in 000's)Excess of Revenues and Other Financing Sources over Expenditures and Other Financing Uses (Budget Basis) 31,517$
Adjustments: Revenue Accruals (17,341) Expenditure Accruals (2,039) Encumbrances and Pre-Encumbrances 8,019 Net Change in Fund Balance 20,156$
E. Other Significant Accounting Policies
Cash and Cash Equivalents: Cash resources of certain individual funds are combined to form a pool of cash and investments which is managed by the City Treasurer. Investments in the Pooled Cash and Segregated Accounts, consists of obligations of the U.S. Treasury, agencies and instrumentalities; State Treasurer Asset Reserve Fund (STAROhio); commercial paper; U.S. Government Money Market Mutual Funds; guaranteed investment contracts; manuscript debt; bonds and other State of Ohio obligations; certificates of deposit; and repurchase transactions are carried at fair value (see Note 4 – Pooled And Segregated Cash And Investments) based on quoted market values, where applicable. Interest earned on pooled cash and investments is distributed to the appropriate funds utilizing a formula based on the month-end balance of cash and investments of each fund. Cash equivalents are defined as highly liquid investments with a maturity of three months or less at the time they are purchased by the City.

75
Investments: The City reports its investments at fair value based on quoted market values, where applicable, and recognizes the corresponding change in the fair value of the investments recorded in investment earnings in the year in which the change occurs.
Unbilled Revenue: Unbilled revenues are estimates for services rendered but not billed to customers at year end.
Inventory of Supplies: Utility funds’ inventory is valued at average cost. All other funds’ inventory is valued at cost using the first in/first out method. Inventory generally consists of construction materials, utility plant supplies and parts inventory not yet placed into service. Inventory costs are charged to operations when consumed.
Restricted Assets: Issuance of debt and amounts set aside for payment of Enterprise Fund revenue bonds and construction loans are classified as restricted assets since their use is limited by applicable bond indentures. Passenger facility charges are restricted for capital expenditures or related debt. Construction loans are restricted to fund approved capital projects.
Capital Assets: Capital assets, which include property, plant, equipment and infrastructure assets (e.g., roads, bridges, sidewalks and similar items), are reported in the applicable governmental or business-type activities columns in the government-wide financial statements to the extent the City’s capitalization threshold is met. The City defines capital assets as assets with an estimated useful life in excess of one year and an individual cost of more than $5,000 for land, furniture, fixtures, equipment and vehicles; and $10,000 for all other assets or projects. Assets are recorded at historical cost or estimated historical cost, if historical cost is not available. Contributed capital assets are recorded at their estimated fair market value on the date contributed.
As permitted under the implementation provisions of GASB Statement No. 34, the historical cost of infrastructure assets acquired, significantly reconstructed or that received significant improvements prior to January 1, 1980 have not been included as part of governmental capital assets in the government-wide financial statements.
Capital assets in the proprietary funds are capitalized in the fund in which they are utilized. The valuation basis for proprietary fund capital assets are the same as those used for the general capital assets. Interest incurred during the construction phase of capital assets of business-type activities is included as part of the capitalized value of the assets constructed. Capitalized interest is amortized on the straight-line basis over the estimated useful lives of such assets. The City applies guidance provided by the Governmental Accounting Standards Board. This guidance requires capitalization of the interest cost of the borrowings less interest earned on investment of the bond proceeds from the date of the borrowing until the assets constructed from the bond proceeds are ready for their intended use. This guidance is applied to Waterworks Revenue Bonds, Public Power Revenue Bonds and Airport Revenue Bonds.
Costs for maintenance and repairs are expensed when incurred. However, costs for repairs and upgrading that materially add to the value or life of an asset and meet the above criteria are capitalized.
The City depreciates capital assets on a straight-line basis using the following estimated useful lives:
Assets Years
Land improvements 15-100Utility plant 5-100Buildings, structures and improvements 5-60Furniture, fixtures, equipment and vehicles 3-60Infrastructure 3-50

76
Compensated Absences: The City accrues for compensated absences such as vacation, sick leave and compensatory time using the termination payment method specified under GASB Statement No. 16, Accounting for Compensated Absences. In the government-wide and proprietary funds financial statements, the entire amount of unpaid compensated absences is reported as a liability. A liability for compensated absences is accrued in the governmental funds only if the amount is currently due and payable at year end. These amounts are recorded as accrued wages and benefits in the fund from which the employees who have accumulated leave are paid. The remaining portion of the liability is not reported in the governmental funds.
Normally, all vacation time is to be taken in the year available. The City allows employees to carryover vacation time from one year to the next. Sick days not taken may be accumulated until retirement. An employee is paid one-third of accumulated sick leave upon retirement, calculated at the three year average base salary rate, with the balance being forfeited.
Uniformed police and fire employees are eligible to defer earned vacation time and overtime, with the appropriate approvals, until retirement. Once deferred, the employee cannot use deferred time as vacation. Deferred vacation is paid to the employee upon retirement, calculated using their current hourly rate at the date of retirement. Deferred overtime is paid once a year upon request up to the amount budgeted for the year for such purpose. If requests exceed the budgeted amounts, the requests are to be paid on a pro-rata basis.
Long-Term Obligations: In the government-wide financial statements and proprietary fund types in the fund financial statements, long-term debt and other long-term obligations are reported as liabilities in the applicable governmental activities, business-type activities and proprietary fund type statements of net position. Bond premiums and discounts, as well as issuance costs, are deferred and amortized over the life of the bonds using the effective interest method. Losses on advance refundings are deferred and amortized over the life of the new debt, or the life of the advance refunded debt, whichever is shorter. Bonds payable are reported net of the applicable unamortized bond premium, discount or advance refunding losses. Bond issuance costs are reported as other assets and amortized over the term of the related debt.
In the governmental fund financial statements, bond premiums and discounts are reported as other financing sources and uses during the period in which they are incurred. The face amount of debt issued is reported as other financing sources. Premiums received on debt issuances are reported as other financing sources while discounts are reported as other financing uses. Issuance costs, whether or not withheld from the actual debt proceeds received, are reported as expenditures.
Swap Agreements: The City may enter into interest rate swap agreements to modify interest rates on outstanding debt. The City has accordingly recorded the fair value of each swap in the Government-wide financial statements. As further described in Note 5 – Debt And Other Long-Term Obligations, the City has four swap agreements outstanding at December 31, 2012, one for its Subordinated Income Tax Variable Rate Refunding Bonds, one on the Parking Facilities Refunding Revenue Bonds and two associated with the 2008 Water Revenue Bonds Series Q and 2010 Water Revenue Bonds Series U and V.
Grants and Other Intergovernmental Revenues: Grants and assistance awards made on the basis of entitlement programs are recorded as intergovernmental receivables and revenues when entitlement occurs. Reimbursement-type grants are recorded as intergovernmental receivables and revenues when the related expenditures (expenses) are incurred. The City accounts for loans receivable related to the Economic Development Funds, Urban Development Action Funds, Community Development Block Grants, Neighborhood Development Investment Funds and Supplemental Empowerment Zone as restricted or committed fund balance in the fund financial statements as applicable to the extent that these loans do not have to be repaid to the Federal government. Loans receivable deemed uncollectible are included in the allowance for doubtful accounts. The loan proceeds are earmarked for future reprogramming under federal guidelines and are not available to fund current operating expenditures of the City.
Encumbrances and Pre-Encumbrances: Encumbrance accounting, under which purchase orders, requisitions, contracts and other commitments for expenditures are recorded as encumbrances or pre-encumbrances to reserve the applicable portion of the appropriation.

77
Interfund Transactions: During the course of normal operations, the City has numerous transactions between funds, including the allocation of centralized expenses and transfers of resources to provide services, construct assets and service debt. Such transactions are generally reflected as transfers or direct expenses of the fund that is ultimately charged for such costs.
Statement of Cash Flows: The City utilizes the direct method of reporting cash flows from operating activities in the Statement of Cash Flows as defined by the GASB Statement No. 9, Reporting Cash Flows of Proprietary and Nonexpendable Trust Funds and Governmental Entities that use Proprietary Fund Accounting. In the statement of cash flows, cash receipts and cash payments are classified according to operating, noncapital financing, capital and related financing and investing activities.
Deferred Outflows/Inflows of Resources: In addition to assets, the statement of financial position will sometimes report a separate section for deferred outflows of resources. This separate financial statement element, deferred outflows of resources, represents a consumption of net position that applies to a future period(s) and so will not be recognized as an outflow of resources (expense/expenditure) until then. In addition to liabilities, the statement of financial position will sometimes report a separate section for deferred inflows of resources. This separate financial statement element, deferred inflows of resources,represents an acquisition of net position that applies to a future period(s) and so will not be recognized as an inflow of resources (revenue) until that time.
F. Accounting Pronouncements
In November of 2010, Governmental Accounting Standards Board (GASB) Statement No. 60, Accounting and Financial Reporting for Service Concession Arrangements was issued. This Statement is effective for fiscal periods beginning after December 15, 2011. The objective of this Statement is to improve financial reporting by addressing issues related to service concession arrangements (SCAs), which are a type of public-private or public-public partnership. As used in this Statement, an SCA is an arrangement between a transferor (a government) and an operator (governmental or nongovernmental entity) in which (1) the transferor conveys to an operator the right and related obligation to provide services through the use of infrastructure or another public asset (a “facility”) in exchange for significant consideration and (2) the operator collects and is compensated by fees from third parties. As required, the City has implemented GASB Statement No. 60 effective for the 2012 fiscal year.
In December of 2010, Governmental Accounting Standards Board (GASB) Statement No. 62, Codification of Accounting and Financial Reporting Guidance Contained in Pre-November 30, 1989 FASB and AICPA Pronouncements was issued. This Statement is effective for fiscal periods beginning after December 15, 2011. The objective of this Statement is to incorporate into the GASB’s authoritative literature certain accounting and financial reporting guidance that is included in the following pronouncements issued on or before November 30, 1989, which does not conflict with or contradict GASB pronouncements: (1) Financial Accounting Standards Board (FASB) Statements and Interpretations, (2) Accounting Principles Board Opinions and (3) Accounting Research Bulletins of the American Institute of Certified Public Accountants’ (AICPA) Committee on Accounting Procedure. As required, the City has implemented GASB Statement No. 62 effective for the 2012 fiscal year.
In June of 2011, Governmental Accounting Standards Board (GASB) Statement No. 63, Financial Reporting of Deferred Outflows of Resources, Deferred Inflows of Resources, and Net Position was issued. This Statement is effective for fiscal periods beginning after December 15, 2011. This Statement provides financial reporting guidance for deferred outflows of resources and deferred inflows of resources. Concepts Statement No. 4, Elements of Financial Statements, introduced and defined those elements as a consumption of net position by the government that is applicable to a future reporting period, and an acquisition of net position by the government that is applicable to a future reporting period, respectively. Previous financial reporting standards do not include guidance for reporting those financial statement elements, which are distinct from assets and liabilities. As required, the City has implemented GASB Statement No. 63 effective for the 2012 fiscal year.
In June of 2011, Governmental Accounting Standards Board (GASB) Statement No. 64, Derivative Instruments: Application of Hedge Accounting Termination Provision was issued. This Statement is effective for fiscal periods beginning after June 15, 2011. The objective of this Statement is to clarify whether an effective hedging relationship continues after the replacement of a swap counterparty or a swap counterparty’s credit support provider. This Statement sets forth criteria that establish when the effective
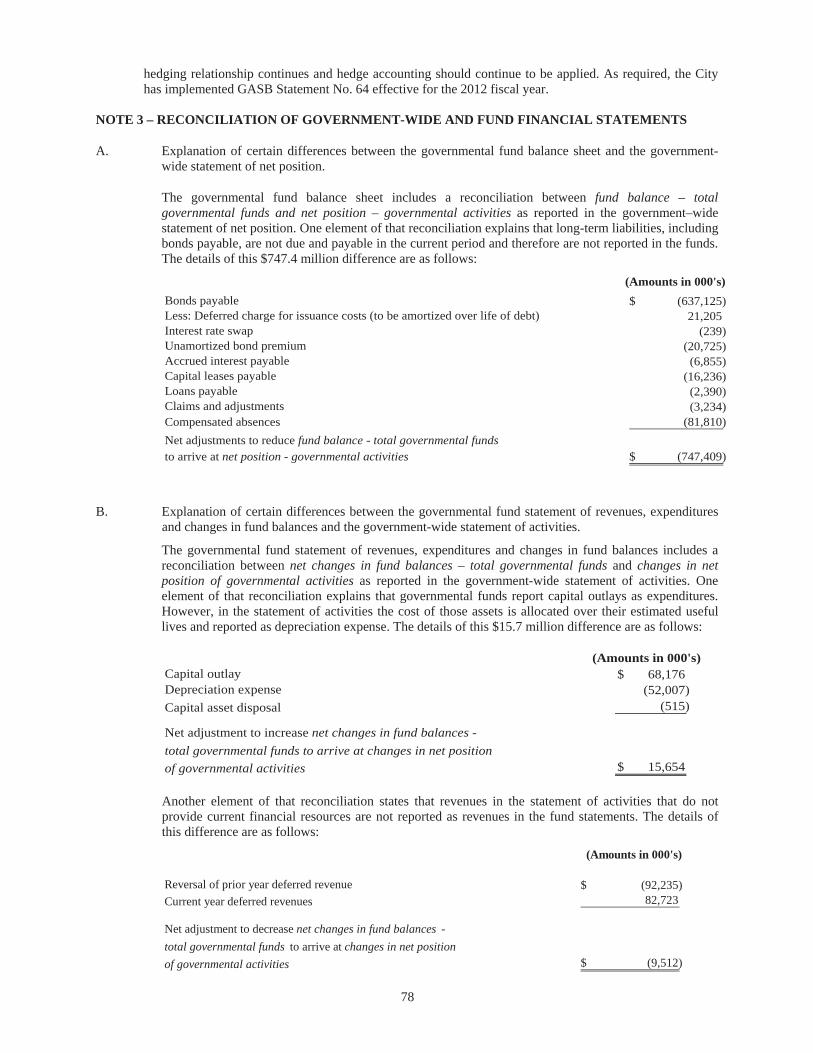
78
hedging relationship continues and hedge accounting should continue to be applied. As required, the City has implemented GASB Statement No. 64 effective for the 2012 fiscal year.
NOTE 3 – RECONCILIATION OF GOVERNMENT-WIDE AND FUND FINANCIAL STATEMENTS
A. Explanation of certain differences between the governmental fund balance sheet and the government-wide statement of net position.
The governmental fund balance sheet includes a reconciliation between fund balance – total governmental funds and net position – governmental activities as reported in the government–wide statement of net position. One element of that reconciliation explains that long-term liabilities, including bonds payable, are not due and payable in the current period and therefore are not reported in the funds. The details of this $747.4 million difference are as follows:
(Amounts in 000's)Bonds payable (637,125)$ Less: Deferred charge for issuance costs (to be amortized over life of debt) 21,205Interest rate swap (239)Unamortized bond premium (20,725)Accrued interest payable (6,855)Capital leases payable (16,236)Loans payable (2,390)Claims and adjustments (3,234)Compensated absences (81,810) Net adjustments to reduce fund balance - total governmental fundsto arrive at net position - governmental activities (747,409)$
B. Explanation of certain differences between the governmental fund statement of revenues, expenditures and changes in fund balances and the government-wide statement of activities.
The governmental fund statement of revenues, expenditures and changes in fund balances includes a reconciliation between net changes in fund balances – total governmental funds and changes in net position of governmental activities as reported in the government-wide statement of activities. One element of that reconciliation explains that governmental funds report capital outlays as expenditures. However, in the statement of activities the cost of those assets is allocated over their estimated useful lives and reported as depreciation expense. The details of this $15.7 million difference are as follows:
(Amounts in 000's)Capital outlay 68,176$ Depreciation expense (52,007) Capital asset disposal (515)
Net adjustment to increase net changes in fund balances - total governmental funds to arrive at changes in net positionof governmental activities 15,654$
Another element of that reconciliation states that revenues in the statement of activities that do not provide current financial resources are not reported as revenues in the fund statements. The details of this difference are as follows:
(Amounts in 000's)
Reversal of prior year deferred revenue (92,235)$ Current year deferred revenues 82,723
Net adjustment to decrease net changes in fund balances - total governmental funds to arrive at changes in net positionof governmental activities (9,512)$

79
Another element of that reconciliation states that the issuance of long-term debt (e.g., bonds, leases) provides current financial resources to governmental funds, while the repayment of the principal of long-term debt consumes the financial resources of governmental funds. Neither transaction, however, has any effect on net position. Also, governmental funds report the effect of issuance costs, premiums, discounts and similar items when debt is first issued, whereas these amounts are deferred and amortized in the statement of activities. The net effect of these differences, including accrued interest and in the treatment of long-term debt is $18.0 million which is detailed as follows:
(Amounts in 000's)Debt issued or incurred: Issuance of general obligation bonds and other obligations (98,077)$ Accrued interest 5,119Interest rate swap 203Principal repayments: General obligation debt and other obligations 44,764 Payment on capital lease 3,179 Payment on loan 85Refunding of general obligation bonds and other obligations 28,910Amortization of debt issuance cost (2,165)
Net adjustment to increase net changes in fund balances - totalgovernmental funds to arrive at changes in net position ofgovernmental activities (17,982)$
Another element of that reconciliation states that some expenses reported in the statement of activities do not require the use of current financial resources and therefore are not reported as expenditures in governmental funds. The details of this $3.2 million difference are as follows:
(Amounts in 000's)
Compensated absences 4,653$ Claims judgements (1,434)
Net adjustment to increase net changes in fund balances - totalgovernmental funds to arrive at changes in net position ofgovernmental activities 3,219$
NOTE 4 – POOLED AND SEGREGATED CASH AND INVESTMENTS
Monies for the Debt Service Funds, certain Capital Project Funds, certain Agency Funds, Department of Port Control, Division of Water, Division of Water Pollution Control, Division of Cleveland Public Power, Division of Municipal Parking Lots, Cemeteries, Golf Courses, Public Auditorium and certain Special Revenue Funds are deposited or invested in individual segregated bank accounts.
Monies of all other funds of the City, including the accounts of the General Fund, other Special Revenue Funds, other Capital Project Funds, other Enterprise Funds, Internal Service Funds and other fiduciary funds are maintained or invested in a common group of bank accounts. Collectively these common bank accounts and investments represent the Pooled Cash Account (PCA). Each fund whose monies are included in the PCA has equity therein.
Certain funds have made disbursements from the PCA in excess of their individual equities in the PCA. Such amounts have been classified as due to other funds and due from other funds between the Restricted Income Tax Special Revenue Fund and the respective funds that have made disbursements in excess of their individual equities in the PCA.

80
The City has a restrictive arrangement for certain segregated monies held in escrow at the banks’ trust departments in which the City must act in conjunction with a trust officer in order to make investments. The City’s role is that of investment manager and the trust officer’s role is that of purchasing agent. For other segregated monies, the City acts alone in placing investments with the banks. Amounts held in escrow are designated for a special purpose and are entrusted to a third party to fulfill certain legal provisions.
Deposits: Ohio law requires that deposits be placed in eligible banks located in Ohio. The City’s policy is to place deposits only with major commercial banks having offices within the City of Cleveland. Any public depository in which the City places deposits must pledge as collateral eligible securities of aggregate market value equal to the excess of deposits not insured by the Federal Deposit Insurance Corporation. Further, City ordinance requires such collateral amounts to exceed deposits by 10%. Collateral that may be pledged is limited to obligations of the following entities: the United States and its agencies, the State of Ohio, the Ohio Student Loan Commission and any legally constituted taxing subdivision within the State of Ohio. The City also requires that non-pooled securities pledged be held by either the Federal Reserve Bank or other trust institution, as designated by the City, as trustee. This collateral is held in joint custody with the financial institution pledging the collateral and cannot be sold or released without written consent from the City.
Monthly, the City determines that the collateral has a market value adequate to cover the deposits and that it has been segregated either physically or in book entry form. At year end, the carrying amount of the City’s deposits including certificates of deposit was $359,177,000 and the actual bank balance totaled $367,398,000. The difference represents outstanding warrants payable and normal reconciling items. Based on the criteria described in GASB Statement No. 3, Deposits with Financial Institutions, Investments (including Repurchase Agreements) and Repurchase Agreements and GASB Statement No. 40, Deposit and Investment Risk Disclosures – an Amendment of GASB Statement No. 3, $367,398,000 of the bank balance was insured or collateralized with securities held by the City or by its agent in the City’s name.
Custodial credit risk for deposits is the risk that in the event of bank failure, the City will not be able to recover deposits or collateral for securities that are in possession of an outside party. At year end, the City’s deposits were fully insured or collateralized. All deposits are collateralized with eligible securities pledged and deposited either with the City or with a qualified trustee by the financial institution as security for repayment of all public monies deposited in the financial institution whose market value at all times is equal to at least 110% of the carrying value of the deposits being secured.
Investments: The City’s investment policies are governed by state statutes and City ordinances which authorize the City to invest in obligations of the U.S. Treasury, agencies and instrumentalities; State Treasurer Asset Reserve Fund (STAROhio); commercial paper; U.S. Government Money Market Mutual Funds; guaranteed investment contracts; manuscript debt; bonds and other State of Ohio obligations; certificates of deposit; and repurchase transactions. Such repurchase transactions must be purchased from financial institutions as discussed in “Deposits” above or registered broker/dealers. Repurchase transactions are not to exceed a period of one year and confirmation of securities pledged must be obtained. Generally, investments are recorded in segregated accounts by way of book entry through the bank’s commercial or trust department and are kept at the Federal Reserve Bank in the depository institution’s separate custodial account for the City, apart from the assets of the depository institution. Ohio statute prohibits the use of reverse repurchase agreements.
Investment securities are exposed to various risks such as interest rate, market and credit. Market values of securities fluctuate based on the magnitude of changing market conditions; therefore, significant changes in market conditions could materially affect portfolio value.
Interest rate risk: In accordance with its investment policy, the City limits its exposure to fair value losses caused by rising interest rates, investing primarily in short-term investments maturing within five years from the date of purchase. The intent is to avoid the need to sell securities prior to maturity.
Custodial Credit Risk: For an investment, custodial credit risk is the risk that, in the event of the failure of the counterparty, the City will not be able to recover the value of the investments or collateral securities that are in the possession of an outside party. The City does not have an investment policy dealing with investment custodial risk beyond the requirement in the State statue.

81
Credit Risk: The City’s investments as of December 31, 2012 include U.S. Treasury Bills, U.S. Treasury Notes, STAROhio, commercial paper, money market mutual funds, guaranteed investment contracts and manuscript debt. The City maintains the highest ratings for its investments. The investments in U.S. Agencies carry a Moody’s rating of Aaa. Investments in Dreyfus Government Cash Management, First American Government Obligations Fund, First American Treasury Obligations Fund, Victory Money Market Fund, PNC Government Money Market Fund (A) and STAROhio carry a rating of AAAm, which is the highest money market fund rating given by Standard & Poor’s. Ohio law requires that STAROhio maintain the highest rating provided by at least one nationally recognized standard rating service. Investments in U.S. Bank N.A. Open Commercial Paper carries a Standard & Poor’s rating of A-1+. The City has no investment policy that would further limit its investment choices.
The City’s investments shown in the following table include those which are classified as cash equivalents in accordance with the provisions of GASB Statement No. 9:
Investment MaturitiesFair Less than 1 - 5 5 Years
Type of Investment Value Cost One Year Years or More
U.S. Treasury Bills 12,215$ 12,214$ 12,215$ $ $ U.S. Treasury Notes 3,246 3,251 3,246 STAROhio 283,038 283,038 283,038 Commercial Paper 141,635 141,635 141,635 Investments in Mutual Funds 519,186 519,186 519,186 Guaranteed Investment Contracts 36,850 36,850 36,850 Manuscript Debt 6,364 6,364 6,364 Other 2,521 2,521 2,521
Total Investments 1,005,055 1,005,059 961,841 36,850 6,364
Total Deposits 359,177 359,177 359,177
Total Deposits and Investments 1,364,232$ 1,364,236$ 1,321,018$ 36,850$ 6,364$
(Amounts in 000’s)
Investment type “Other” consist of deposits into collective cash escrow pools managed by either Huntington or US Bank, as trustee. STAROhio is an investment pool created pursuant to Ohio statutes and managed by the Treasurer of the State of Ohio. The fair value of the City’s position in STAROhio is equal to the value of the shares the City owns in the investment pool.
Concentration of Credit Risk: The City places a limitation on the amount it may invest in any one issuer to help minimize the concentration of credit risk. As of December 31, 2012, the investments in U.S. Treasury Bills, U.S. Treasury Notes, STAROhio, commercial paper, mutual funds, guaranteed investment contracts, manuscript debt and other are approximately 1.2%, 0.3%, 28.2%, 14.1%, 51.7%, 3.7%, 0.6% and 0.2%, respectively, of the City’s total investments.
Reconciliation to Financial Statements: Total cash and investments are reported as follows:
Government-Wide Financial Statements
(Amounts in 000’s)
Unrestricted: Cash and cash equivalents 741,896$ Investments 9,522
Restricted: Cash and cash equivalents 585,961 Investments 3,739
Total 1,341,118$

82
Fund Financial Statements
(Amounts in 000’s)
Balance Sheet – Governmental Funds: Unrestricted: Cash and cash equivalents 328,394$ Investments 9,522
337,916 Statement of Net Position – Proprietary Funds: Enterprise Funds: Unrestricted: Cash and cash equivalents 395,349 Restricted: Cash and cash equivalents 585,961 Investments 3,739 Internal Service Funds: Unrestricted: Cash and cash equivalents 18,153
Subtotal 1,003,202
Statement of Fiduciary Assets and Liabilities: Unrestricted: Cash and cash equivalents 23,114
Total 1,364,232$

83
NOTE 5 – DEBT AND OTHER LONG-TERM OBLIGATIONS
A summary of the changes in long-term debt and other long-term obligations of the City during the year ended December 31, 2012, are as follows:
Balance Balance DueJanuary 1, December 31, Within One
2012 Additions (Reductions) 2012 Year(Amounts in 000's)
Governmental Activities
General Obligation Bonds due through 2033 298,660$ 67,765$ (57,725)$ 308,700$ 26,150$
Other Obligations:
Urban Renewal Bonds due through 2018, 6.75% 4,835 (565) 4,270 600 Subordinated Income Tax Refunding Bonds due through 2024, 5.00% to 5.25% 52,975 (2,955) 50,020 3,105 Subordinate Lien Income Tax Bonds due through 2031, 2.00% to 6.34% 80,505 15,180 (3,305) 92,380 3,730 Non-Tax Revenue Bonds:Stadium due through 2020, 3.50% to 5.13% 11,665 (1,090) 10,575 1,130 Taxable Economic and Community Dev. (Core City Bonds) due through 2033, 0.15% to 5.40% 40,395 (1,440) 38,955 1,505 Lower Euclid Ave. TIF 2003A due through 2032, 1.00% to 4.00% 6,531 (167) 6,364 151 Annual Appropriation Bonds - Flats East Bank due through 2035, 2.60% to 6.00% 11,000 (235) 10,765 240 Certificates of Participation-Stadium due through 2028, 1.41% to 5.70% 129,547 (5,942) 123,605 5,936 Capital Lease Obligations, due through 2019, 1.41% to 3.22% 12,908 6,507 (3,179) 16,236 2,899 Gateway Note Payable, due through 2016 1,250 (250) 1,000 250 Accrued wages and benefits 51,069 16,526 (19,396) 48,199 27,850 Police and fire overtime 48,912 1,774 (4,962) 45,724 610 Fire deferred vacation 2,999 637 (711) 2,925 349 Estimated claims payable 2,528 3,534 (2,290) 3,772 3,511
755,779 111,923 (104,212) 763,490 78,016 Unamortized loss on debt refunding (8,325) (2,387) 1,203 (9,509) Unamortized (discount)/premium - net 15,602 8,625 (3,502) 20,725
Total Governmental Activities, Net 763,056$ 118,161$ (106,511)$ 774,706$ 78,016$
(Continued)

84
Balance Balance Due
January 1, December 31, Within One
2012 Additions (Reductions) 2012 Year
(Amounts in 000's)
Business-Type Activities (Enterprise Funds)
Airport System Revenue Bonds:
Series 2000 due through 2031, 4.00% to 5.00% 398,445$ $ (249,445)$ 149,000$ $
Series 2006 due through 2024, 5.00% to 5.25% 116,270 (1,245) 115,025 1,310
Series 2007B due through 2027, 4.00% to 5.00% 10,175 (530) 9,645 550
Series 2008D&F due through 2033, Variable Rate 64,925 (950) 63,975
Series 2009A-B due through 2027, Variable Rate 37,075 (1,215) 35,860 1,255
Series 2009C-D due through 2027, 0.11% to 5.00% 190,610 (9,720) 180,890 10,290
Series 2011A due through 2024, 3.00% to 5.00% 74,385 74,385 2,880
Series 2012A due through 2031, 5.00% 235,150 235,150
891,885 235,150 (263,105) 863,930 16,285
Public Power System Revenue Bonds:
Series 1994 due through 2013, Zero Coupon 14,650 (7,325) 7,325 7,325
Series 2001 refunded in 2012 15,980 (15,980) -
Series 2006 due through 2024, 4.25% to 5.00% 107,560 107,560
Series 2008 due through 2038, 3.00% to 5.40% 93,713 (910) 92,803 940
Series 2008 Accreted Interest Payable 5,948 1,820 7,768
Series 2010 due through 2017, 3.00% to 5.00% 23,915 23,915 445
Series 2012 due through 2016, 2.00% 15,325 (1,815) 13,510 4,000
261,766 17,145 (26,030) 252,881 12,710
Waterworks Improvement Revenue Bonds:
Series G 1993 due through 2021, 5.50% 81,225 (14,365) 66,860 310
Series N 2005 due through 2023, 3.50% to 5.00% 33,045 (5,030) 28,015 5,280
Series O 2007 due through 2037, 4.25% to 5.00% 133,315 (2,705) 130,610
Series P 2007 due through 2028, 4.00% to 5.00% 119,095 (5,815) 113,280
Series Q 2008 due through 2033, Variable Rate 90,800 90,800
Series T 2009 due through 2021, 2.00% to 5.00% 77,415 (6,085) 71,330 6,180
Series U 2010 due through 2033, Variable Rate 54,935 54,935
Series V 2010 due through 2033, Variable Rate 26,495 26,495
Series W 2011 due through 2026, 2.00% to 5.00% 82,090 82,090 19,330
Series X 2012 due through 2042, 3.63% to 5.00% 44,410 44,410
Second Lien Series A 2012 due through 2027, 4.00% to 5.00% 76,710 76,710
698,415 121,120 (34,000) 785,535 31,100
Ohio Water Development Authority and Public Works
Commission Loans due through 2032, 0.00% to 4.18% 115,523 963 (6,744) 109,742 7,229
Parking Facilities Refunding Revenue Bonds:
Series 2006 due through 2022, 4.00% to 5.25% 34,045 (2,420) 31,625 2,520 Deferred Payment Obligation 6,500 (2,990) 3,510 3,230
Accrued wages and benefits 10,400 1,112 (1,434) 10,078 7,283
Estmated claims payable 1,180 (959) 221 221
2,018,534 376,670 (337,682) 2,057,522 80,578
Unamortized loss on debt refunding (68,046) (8,793) 7,710 (69,129)
Unamortized (discount)/premium - net 42,760 39,446 (4,682) 77,524
Total Business-Type Activities, Net 1,993,248$ 407,323$ (334,654)$ 2,065,917$ 80,578$
Total Debt and Other Long-Term Obligations 2,756,304$ 525,484$ (441,165)$ 2,840,623$ 158,594$
(Concluded)

85
Internal Service Funds predominantly serve the governmental funds, except the Utilities Administration Fund, which serves only business-type activity funds. Long-term liabilities for all Internal Service Funds, except the Utilities Administration Fund, are included as part of the totals for governmental activities in the government-wide statement of net position. At December 31, 2012, $1,121,460 of the Internal Service Funds, except for Utilities Administration Fund, compensated absences were included in the governmental activities accrued wages and benefits. Long-term liabilities for the Utilities Administration Fund are included as part of the totals for business-type activities in the government-wide statements. At December 31, 2012, $470,515 of the Utilities Administration Fund compensated absences were included in business-type activities accrued wages and benefits.
The Subordinated Income Tax Refunding Bonds were issued to fund the City’s obligation for the employer’s accrued liability to the Police and Firemen’s Disability and Pension Fund of the State of Ohio. All other bonds were issued to fund capital related activities.
The accrued wages and benefits liability will be paid from the fund from which the employees’ salaries are paid. The estimated claims payable liability will be paid from the fund that incurred the liability or from Judgment Bond proceeds.
A detailed summary of principal due for General Obligation Bonds and business-type activities debt by purpose is as follows for 2012:
Original Balance BalanceIssue January 1, December 31,
Amount 2012 Additions (Reductions) 2012(Amounts in 000's)
Governmental Activities Obligations:
General Obligation Bonds
Public Facilities 101,670$ 47,560$ 14,235$ (9,770)$ 52,025$
Convention Center 1,010 970 (40) 930
Residential Redevelopment 25,760 13,805 (4,330) 9,475
Bridges and Roadways 161,005 74,260 20,025 (22,905) 71,380
Parks & Recreation 63,725 30,905 4,480 (7,535) 27,850
Refunding Bonds 201,045 114,335 29,025 (12,575) 130,785
Revitalization 6,020 5,440 (160) 5,280
Judgments/Settlements 18,515 11,385 (410) 10,975
Total Governmental Activities 578,750$ 298,660$ 67,765$ (57,725)$ 308,700$
Business-Type Activities Obligations:
Revenue Bonds / Notes
Airports 1,274,410$ 891,885$ 235,150$ (263,105)$ 863,930$
Public Power 501,543 255,818 15,325 (26,030) 245,113
Waterworks 1,131,695 748,415 171,120 (134,000) 785,535
Parking Facilities 57,520 34,045 (2,420) 31,625
Loans
Waterworks 151,625 112,680 963 (6,239) 107,404
Water Pollution Control 8,378 2,843 (505) 2,338
Total Business-Type Activities 3,125,171$ 2,045,686$ 422,558$ (432,299)$ 2,035,945$

86
The following is a summary of the City’s future debt service requirements as of December 31, 2012:
Year Ending
December 31 Principal Interest Principal Interest Principal Interest
2013 26,150$ 14,465$ 600$ 268$ 6,835$ 6,513$
2014 24,985 13,378 640 226 7,165 6,334
2015 24,820 12,378 685 181 7,435 6,055
2016 24,355 11,261 730 134 7,740 5,761
2017 24,170 10,058 780 83 8,060 5,426
2018-2022 97,740 34,334 835 28 45,105 21,035
2023-2027 61,090 14,481 37,855 10,059
2028-2032 24,695 2,805 18,060 2,666
2033-2037 695 36 4,145 439
308,700$ 113,196$ 4,270$ 920$ 142,400$ 64,288$
City Annual
Year Ending
December 31 Principal Interest Principal Interest Principal Interest
2013 2,786$ 2,388$ 240$ 633$ 5,936$ 7,448$
2014 2,895 2,275 245 626 5,890 4,397
2015 2,954 2,149 260 612 6,185 4,103
2016 3,206 2,013 275 597 6,495 3,793
2017 3,373 1,877 290 582 6,800 3,487
2018-2022 16,302 7,003 1,730 2,635 38,710 12,409
2023-2027 10,410 3,807 2,305 2,057 45,240 5,404
2028-2032 10,858 1,936 3,085 1,277 8,349 251
2033-2037 3,110 126 2,335 286
55,894$ 23,574$ 10,765$ 9,305$ 123,605$ 41,292$
Gateway Governmental
Year Ending
December 31 Principal Interest Principal Interest Principal Interest
2013 2,899$ 324$ 250$ $ 45,696$ 32,039$
2014 2,967 256 250 45,037 27,492
2015 3,036 186 250 45,625 25,664
2016 3,108 114 250 46,159 23,673
2017 2,100 56 45,573 21,569
2018-2022 2,126 22 202,548 77,466
2023-2027 156,900 35,808
2028-2032 65,047 8,935
2033-2037 10,285 887
16,236$ 958$ 1,000$ -$ 662,870$ 253,533$
Governmental Activities
Urban Renewal
Bonds Income Tax Bonds
Appropriation Bonds
(Amounts in 000's)
Certificates
General
Obligation Bonds
Subordinated
Non-Tax
(Amounts in 000's)
Lease Obligations
Capital
(Amounts in 000's)
Activities Total
of ParticipationRevenue Bonds
Note Payable

87
Business-Type Activities
Year EndingDecember 31 Principal Interest Principal Interest
2013 62,615$ 86,909$ 7,229$ 3,710$ 2014 87,870 86,058 7,465 3,475 2015 90,230 82,163 7,656 3,230 2016 92,290 77,952 7,853 2,981 2017 100,920 73,216 7,787 2,725
2018-2022 532,825 290,368 40,993 9,761 2023-2027 484,487 177,702 34,823 3,245 2028-2032 365,619 85,701 6,745 272 2033-2037 90,574 39,564 2038-2042 18,773 7,578
1,926,203$ 1,007,211$ 120,551$ 29,399$
Deferred PaymentYear EndingDecember 31 Principal Interest Principal Interest
(Amounts in 000's)
2013 3,230$ 159$ 73,074$ 90,778$ 2014 280 2 95,615 89,535 2015 97,886 85,393 2016 100,143 80,933 2017 108,707 75,941
2018-2022 573,818 300,129 2023-2027 519,310 180,947 2028-2032 372,364 85,973 2033-2037 90,574 39,564 2038-2042 18,773 7,578
3,510$ 161$ 2,050,264$ 1,036,771$
Construction Loans
Obligations (Note 6)
Revenue Bonds / Notes
(Amounts in 000's)
Business-TypeActivities Total
The schedule of minimum principal and interest payments for construction loans includes the amortization on fifteen loans provided to the Division of Water and the Division of Water Pollution Control by the Ohio Water Development Authority (OWDA) and two loans to the Division of Water Pollution Control by the Ohio Public Works Commission (OPWC). This amortization is based upon the full amount expected to be financed, regardless of whether the Division of Water and the Division of Water Pollution Control have received all the loan proceeds. Therefore, at December 31, 2012, the amount financed on these OWDA loan projects, which is reflected in the amortization schedule, less the principal payments made to date, exceeds the actual loan balances shown on the schedule of long-term debt outstanding and changes in long-term debt obligations by $10,809,000.

88
General Obligation Bonds
General Obligation Bonds: General Obligation Bonds are backed by the full faith and credit of the City. Such bonds are payable from ad valorem property taxes levied within the limitations provided by law, irrespective of whether such bonds are secured by other receipts of the City in addition to such ad valorem property taxes.
Under the direct debt limitation imposed by the Ohio Revised Code, the City had the capacity to issue $309,719,376 of additional unvoted debt at December 31, 2012.
Effective May 22, 2012, the City issued $50,245,000 Various Purpose and Refunding General Obligation Bonds, Series 2012. From the proceeds of the bonds, $38,337,650 will be used to pay costs of various public improvements to roads and bridges, public facilities, cemeteries and parks and recreation facilities. In addition, $11,505,000 of the proceeds were used to refund $11,610,000 outstanding Series 2002, Series 2003 and Series 2004 Various Purpose General Obligation Bonds. Proceeds in the amount of $12,570,041 were placed in an irrevocable escrow account to be used to pay the principal and interest on the refunded bonds. As a result, the refunded bonds are considered to be defeased and the liability for these bonds has been removed from long-term debt. The City completed this refunding to reduce its total debt service by $704,000 and to obtain an economic gain (the difference between the present values of the old and new debt service) of $728,000 or 6.27%.
On November 20, 2012, the City issued $17,520,000 Refunding General Obligation Bonds, Series 2012A to refund $17,300,000 of outstanding Series 2003 and Series 2005A General Obligation Bonds. Proceeds in the amount of $19,360,215 were placed in an irrevocable escrow account to be used to pay the debt service on the refunded bonds. Therefore, the refunded bonds are considered to be defeased and the liability for these bonds has been removed from long-term debt. The City refunded these bonds in order to achieve debt service savings which totaled $824,000 and net present value savings of $885,000 or 5.11%.
Other Governmental Obligations
Urban Renewal Bonds: In 1993, the City issued $10,800,000 of Urban Renewal Bonds (Rock and Roll Hall of Fame and Museum Project) for the purpose of paying a portion of the costs of the acquisition and construction of a “port authority educational and cultural facility” to conduct programs of an educational and instructional nature relating to the field of contemporary music, including rock and roll music, which constitutes the Rock and Roll Hall of Fame and Museum (the Facility). The net proceeds were contributed to the Cleveland-Cuyahoga County Port Authority which owns and leases the facility to Rock and Roll Hall of Fame and Museum, Inc., an Ohio non-profit corporation. The Rock and Roll Hall of Fame and Museum opened in September 1995. The Urban Renewal Bonds are not general obligations of the City and are not secured by the full faith and credit of the City nor are they payable from the general revenues or assets of the City. The Urban Renewal Bonds are secured solely by pledged receipts, consisting of payments to be made in lieu of real property taxes pursuant to Development Agreements between the City and certain property owners and interest income on those payments.
Subordinated Income Tax Variable Rate Refunding Bonds: Effective June 1, 1994, the City issued $74,700,000 of Subordinated Income Tax Variable Rate Refunding Bonds, Series 1994. The proceeds were used to fund the City’s obligation for the employer’s accrued liability to the Ohio Police and Fire Pension Fund (the Fund). The principal use of the proceeds was the current refunding of the City’s obligation to the Fund for the employer’s accrued liability in the amount of $104,686,400, which was payable in semi-annual installments of $2,696,243 through May 15, 2035. Pursuant to Section 742.30 (C) of the Ohio Revised Code, the City and the Fund entered into an agreement that permitted the City to make a one-time payment to the Fund to extinguish the City’s obligation. The payment amount of $70,493,204 was calculated by applying a 35% discount factor to the $104,686,400 accrued liability plus adding accrued interest of $2,447,044.
Effective August 6, 2008, the City issued $59,960,000 Subordinate Lien Unrestricted Income Tax Bonds, Series 2008 (Police and Fire Pension Payment) to refund all the outstanding Subordinated Income Tax Variable Rate Refunding Bonds, Series 1994. The interest rate swap related to the Series 1994 Bonds was terminated by the City on July 28, 2008 and the termination payment of $4,325,000 owed to Ambac Financial Services, LLC, the swap counterparty, was paid from the proceeds of the Series 2008 Bonds. The City refunded the Series 1994 Bonds in order to address the increased interest rates incurred on the Bonds as a result of the downgrade of the bond insurer. The Bonds are not general obligations of the City and are not secured by its full faith and credit. The Series 2008 Bonds are unvoted special obligations secured by a pledge of and a lien on the unrestricted municipal income taxes

89
of the City, to the extent that such income taxes are not needed to pay debt service on the City’s currently outstanding unvoted General Obligation Bonds or unvoted General Obligation Bonds issued in the future.
Interest Rate Swap Transaction:
Terms: On February 7, 2003, the City sold an option to JPMorgan Chase Bank (JPM) that gives JPM the right to execute an interest rate swap at its discretion at any time until the option expires on May 15, 2024 on a declining notional amount equal to the outstanding principal amount of the City’s Subordinated Income Tax Variable Rate Refunding Bonds, Series 1994. The swaption is now associated with the Series 2008 Bonds. Under the swap agreement, the City will be the fixed rate receiver, receiving the fixed rate of 4.88%, and JPM will be the floating rate receiver, receiving interest on what would have been the outstanding notional amount of the original 1994 Bonds of $47,700,000 at December 31, 2012, at a rate equal to the weekly Securities Industry and Financial Markets Association (SIFMA) index. If the option is exercised, the stated termination date under the swap agreement with JPM will be May 15, 2024. The obligation of the City under the swap agreement to make periodic floating ratepayments (but not any termination payment) is secured by a subordinate pledge of the income tax receipts, subordinate to the pledge of the income tax receipts made under the “General Bond Ordinance” securing the City’s General Obligation Bonds. The payment of any termination payment is subordinate to the payment of debt service on the Subordinate Lien Unrestricted Income Tax Bonds, Series 2008, and the periodic floating rate payments under the swap agreement.
Objective: The City entered into the swaption in order to potentially capture in the future the savings which could be derived from converting these bonds back to a variable rate if or when the option is exercised. In exchange for selling the option to JPM, the City received a premium payment of $1,700,000.
Basis Risk: There is no basis risk for the City associated with this transaction with the exception of the risk inherent in all variable rate debt. If the option is exercised, the City will receive a fixed rate of 4.88% which is approximately 29 basis points less than the fixed rate being paid on the Series 2008 Bonds. This transaction would leave the City paying the weekly SIFMA rate plus 29 basis points.
Counterparty Risk: The City selected JPM as a counterparty partly due to its credit strength. Over the long-term, it is possible that the credit strength of JPM could change and this event could trigger a termination payment on the part of the City.
Termination Risk: The swap agreement may be terminated prior to its stated termination date under certain circumstances. Upon termination, a payment may be owed by the City to JPM, or by JPM to the City, depending upon the prevailing economic circumstances at the time of the termination.
Fair Value: The fair value of the swaption at December 31, 2012 as reported by JPM was $239,000 which would be payable by the City.
Subordinate Lien Income Tax Bonds: Effective November 29, 2012, the City issued $15,180,000 of Subordinate Lien Income Tax Bonds, Series 2012. These bonds were issued to provide funds for the construction of a new police station and city-wide communications center. Effective June 23, 2010, the City issued $27,380,000 Subordinate Lien Income Tax Bonds, Series 2010. The proceeds of the bonds will be used to pay costs of various municipal improvements including public facilities, parks and recreation, and bridges and roadways. The $5,405,000 Series 2010A-1 Bonds were issued as traditional tax-exempt debt. The City took advantage of several new financing programs created by the American Recovery and Reinvestment Act (ARRA) when issuing the remaining portion of the bonds. The $5,385,000 Series 2010A-2 Bonds were issued as taxable Build America Bonds while the $8,245,000 Series 2010B Bonds and the $8,345,000 Series 2010C Bonds were issued using the City’s allocation of taxable Recovery Zone Bonds. Pursuant to these programs, the City will receive federal cash subsidies in amounts equal to a portion of the interest on these bonds.
These bonds are special obligations of the City and are not general obligation debt and are not secured by a pledge of the full faith and credit of the City. The bonds are payable from the City’s municipal income tax revenues to the extent those revenues are not needed to pay debt service charges on the City’s unvoted general obligation debt or unvoted general obligation debt issued in the future. It is the City’s intention to continue paying the debt service on these bonds and the Series 2008 Subordinate Lien Income Tax Bonds from the Restricted Income Tax collections.

90
Non-Tax Revenue Bonds – Stadium: Effective December 16, 2004, the City issued $14,835,000 Non-Tax Revenue Bonds, Series 2004 (Cleveland Stadium Project) to refund the Non-Tax Revenue Stadium Bonds, Series 1999A&B. These bonds do not represent a general obligation debt or pledge of the full faith and credit or taxing power of the City, and are payable solely from non-tax revenues of the City.
Non-Tax Revenue Bonds – Economic Development Bonds Series 2003A and Series 2003B (Lower Euclid Avenue Project): In November 2003, the City issued $7,200,000 Economic Development Revenue Bonds, Series 2003A and $1,000,000 Economic Development Revenue Bonds, Series 2003B-1 for the Lower Euclid Avenue Project. In November 2004, the final $1,000,000 Economic Development Revenue Bonds, Series 2003B-2 were issued. The proceeds of these bonds were made available to the owners of certain properties on Euclid Avenue for the construction and renovation of commercial restaurant and retail facilities and the construction of a parking garage. These Tax Increment Financing (TIF) Bonds are secured by a pledge of (a) service payments in lieu of taxes received by the City from the owners of certain properties located within a tax increment financing district, (b) loan payments payable to the City and (c) by a pledge of certain non-tax revenues of the City, subject to the prior pledge by the City of such non-tax revenues to secure other obligations of the City. Currently, only the Series 2003A Bonds remain outstanding.
Non-Tax Revenue Bonds – Taxable Economic and Community Development Revenue Bonds (Core City): Effective July 24, 2008, the City issued $28,160,000 Taxable Economic and Community Development Refunding Revenue Bonds, Series 2008 (Core City Fund). The proceeds of these bonds were used to refund the outstanding $26,900,000 Series 2003 Taxable Economic and Community Development Revenue Bonds, to fund a bond reserve fund and to pay the costs of issuing the bonds. The Series 2003 Bonds were refunded in order to address increased interest rates incurred on the bonds due to the collapse of the auction rate securities market. The Series 2008 Bonds, which are special obligations of the City, were issued as variable rate demand obligations secured by a letter of credit provided by Citizens Bank. Upon the expiration of the letter of credit in 2011, the City obtained a new letter of credit for the Series 2008 Bonds from PNC. The Bonds are payable from the City’s non-tax revenues and net project revenues.
On November 10, 2004, the City issued Taxable Economic and Community Development Revenue Bonds, Series 2004 (Core City). The Series 2004 Bonds were issued in the amount of $19,280,000 to pay the costs of certain economic and community development projects. These Series 2004 Bonds were issued as fixed rate securities and are special obligations of the City, payable from non-tax revenues and net project revenues.
Annual Appropriation Bonds – Flats East Bank: On December 21, 2010, the City issued $11,000,000 City Annual Appropriation Bonds through the Cleveland-Cuyahoga County Port Authority. The proceeds of the bonds are being used to provide funds for land purchase and public improvements in the area of the Flats East Development Project. The bonds are special obligations of the Port Authority payable from appropriation payments made by the City under a cooperative agreement. The City’s obligation to make payments is subject to and dependent upon annual appropriations being made by the City. The City intends to make these debt service payments from the Restricted Income Tax collections.
Certificates of Participation (COPS) - Stadium: In June 1997, Certificates of Participation (COPS) in the amount of $139,345,000 were issued to assist in the construction of an open-air stadium for the play of professional football and other events. In October 1999, COPS in the amount of $20,545,000 were issued to retire then outstanding Non-Tax Revenue Bond Anticipation Notes. The City will make lease payments subject to annual appropriation by City Council and certification by the Director of Finance as to the availability of funds from those appropriations. These obligations do not constitute a debt or pledge of the full faith and credit of the City.
Effective October 11, 2007, the City issued $108,390,000 Refunding COPS, Series 2007, to currently refund $105,800,000 of the outstanding COPS, Series 1997. These were issued as auction rate securities and the City realized $753,000 of net present value savings. A swap associated with this transaction went into effect on November 15, 2007.
Due to the downgrade of the bond insurers beginning in late 2007 and the collapse of the auction rate securities market, the COPS, Series 2007 experienced failed auctions and interest rates as high as 12% in early 2008. To address these issues, the City converted all of the outstanding $108,390,000 COPS, Series 2007 Auction Rate Certificates to Weekly Rate Certificates effective May 29, 2008. The payment of principal and interest was secured by a direct-pay letter of credit provided by Wachovia Bank, National Association.

91
Effective April 22, 2010, the City issued $63,225,000 COPS, Series 2010A and $69,900,000 COPS, Series 2010B to refund all of the outstanding $108,390,000 COPS, Series 2007, upon the expiration of the Wachovia letter of credit. Proceeds of the COPS, Series 2010, were used to currently refund the COPS, Series 2007, on the day of closing, to fund a required debt service reserve fund in the amount of $8,324,045, to make a termination payment on the existing hedge agreement with UBS in the amount of $17,322,000 and to pay costs of issuing the COPS. This refunding was undertaken (1) to remove Ambac as the bond and swap insurer and eliminate the risk of early termination of the hedge agreement due to Ambac’s possible insolvency, (2) to obtain lower credit enhancement costs and (3) to restructure debt service payments. The COPS, Series 2010A, were issued as fixed rate obligations. The COPS, Series 2010B, were purchased by Wells Fargo Bank, National Association, as floating rate obligations for a period of three years, the interest on which is reset weekly based on the SIFMA index plus a spread of 135 basis points. As a result of this refunding, the City achieved an economic gain (the difference between the present values of the old and new debt service) of approximately $3,461,000 or 3.19%.
Capital Lease Arrangements: The City has entered into various agreements to lease equipment. Such agreements are treated as lease purchases (Capital Leases) and are classified as long-term lease obligations in the financial statements. The lease contracts contain annual one-year renewal options that can be exercised by the City if sufficient funds are appropriated by City Council. Upon the exercise of each annual one-year renewal option and satisfaction of the lease obligations related thereto, title to the equipment will pass to the City.
In July 2005, the City entered into an equipment lease agreement with Chase Equipment Leasing, Inc. which allowed the City to purchase approximately $8,425,000 of heavy duty vehicles and apparatus. The City entered into another equipment lease agreement in February 2010. This lease agreement is with The Fifth Third Leasing Company and resulted in the City purchasing approximately $6,690,000 of heavy duty vehicles and apparatus. On June 30, 2011, the City entered into an equipment lease agreement with PNC Equipment Finance LLC. This enabled the City to purchase approximately $6,585,000 of vehicles and equipment for various departments, including police cars, a fire truck, waste collection equipment and ambulances. On June 5, 2012, the City entered into a $6,507,400 vehicle lease agreement with PNC Equipment Finance LLC. The funds will be used to purchase a variety of vehicles including police cars, EMS ambulances and waste collection equipment. Payments on all of these equipment leases are made over a period of seven years from issuance from the Restricted Income Tax Fund. The final payment on the 2005 lease was made in August 2012.
The assets recorded by the City under Capital Leases were as follows as of December 31, 2012: Governmental
Activities(Amounts in 000’s)
Furniture, fixtures and equipment 35,325$ Less – accumulated depreciation (14,363) Net book value 20,962$
Gateway Note Payable: In October 1996, the City and Cuyahoga County each agreed to pay $5,000,000 for additional costs associated with the Gateway Sports Complex. The amounts are to be repaid in annual installments of $250,000 for 20 years. The monies are deducted from the monthly distribution of the State Local Government Fund which is recorded in the City’s General Fund. The first deduction was made in March 1997.

92
Accrued Wages and Benefits: Accrued wages and benefits, included in long-term obligations, consist of the non-current portion of vacation and sick pay benefits earned by employees of the City. The City accrues vacation and sick pay benefits when earned and future compensation is likely.
Police and Fire Overtime and Deferred Vacation Pay: Uniformed employees of the Police and Fire Divisions accumulate overtime compensation in accordance with the union contracts and the requirements of the Fair Labor Standards Act. In addition, uniformed employees may defer earned vacation time, with the appropriate approvals, until retirement. The liabilities for overtime and deferred vacation time, at current pay rates including their related fringe benefits and converted to straight time hours, at December 31, 2012, follow:
Division Hours Dollars Hours Dollars
Police 1,249 39,240$ $ Fire 200 6,484 91 2,925
Total 1,449 45,724$ 91 2,925$
Overtime Deferred Vacation
(Amounts in 000's)
Business-Type (Enterprise Fund) Obligations
Airport System Revenue Bonds: These bonds are secured by the pledge of all airport revenues, as defined in the revenue bond indenture. Further, the City has assigned to the trustee all its interests in and rights to the airline use agreements under the revenue bond indenture.
Effective February 23, 2012, the City issued $235,150,000 Airport System Revenue Bonds, Series 2012A. Proceeds of the bonds were used to refund the outstanding $249,445,000 Airport System Revenue Bonds, Series 2000A and to pay the costs of issuing the bonds. Net proceeds of the Series 2012A Bonds, amounts on hand in the Series 2000 interest account and an amount released from the debt service reserve fund totaling $252,378,809 were placed in an irrevocable escrow account to pay the principal and interest on the refunded bonds on March 26, 2012. As a result, the refunded bonds were defeased and the liability for the 2000A Bonds has been removed from long-term debt. The City completed the refunding in order to achieve debt service savings of approximately $25.1 million or an economic gain (the difference between the present values of the old and new debt service) of approximately $15.12 million or 6.06%.
In June 2011, the Airport System, under its rights to optional redemption, elected to deposit cash on hand into the Series 2008G Bond Fund and into the Series 2008H Bond Fund sufficient to redeem, prior to maturity, all of the outstanding Series 2008G and Series 2008H Bonds. After taking into account the funds on hand in the respective bond funds, other available Airport funds were placed into the accounts to pay on June 22, 2011 principal in the amount of $7,425,000 on the Series 2008G Bonds and $430,000 on the Series 2008H Bonds, plus accrued interest to the redemption date. As a result, these bonds have been defeased and the liability for the bonds has been removed from long-term debt.
Effective November 16, 2011, the City issued $74,385,000 Airport System Revenue Bonds, Series 2011A (Non-AMT). Of this amount, $64,515,000 of the proceeds was issued to pay a portion of the costs of improvements to the Airport System, to fund deposits to the bond reserve fund and the Renewal and Replacement Fund and to pay issuance costs. The remaining $9,870,000 was used to refund a portion of the outstanding Airport System Revenue Bonds, Series 2008D in the aggregate principal amount of $9,200,000 on November 28, 2011 and to pay costs of issuing the bonds. As a result, the refunded bonds were defeased and the liability for these bonds removed from long-term debt. The City obtained an economic gain (the difference between the present values of the old and new debt service) of approximately $1.67 million as a result of the refunding.

93
Public Power System Revenue Bonds: These bonds are payable from the net revenues derived from the Public Power System and are secured by a pledge of and lien on such net revenues.
Effective February 24, 2012, the City issued $15,325,000 Public Power System Revenue Refunding Bonds, Series 2012, to refund all of the outstanding $15,980,000 Public Power System Refunding Revenue Bonds, Series 2001. Net proceeds of the Series 2012 Bonds and amounts on deposit in the Series 2001 Bond Fund together totaling $16,293,627 were placed in an irrevocable trust account to pay the principal and interest on the refunded Series 2001 Bonds on March 26, 2012. As a result, the refunded bonds were defeased and the liability for these bonds has been removed from long-term debt. The City completed the refunding in order to achieve debt service savings of approximately $1,169,000 or an economic gain (the difference between the present values of the old and new debt service) of approximately $1,148,000 or 7.18%. These bonds were sold through a private sale to Wells Fargo Bank, National Association.
Waterworks Improvement Revenue Bonds: These bonds are payable from the revenues derived from operations of the Waterworks System after the payment of all operating and maintenance expenses (net revenue) and from monies and investments on deposit in the Revenue Fund, the Debt Service Fund, the Debt Service Reserve Fund, the Contingency Fund and the Additions and Improvements Fund.
Effective October 24, 2012, the City issued $44,410,000 of Senior Lien Water Revenue Bonds, Series X, 2012, and $76,710,000 of Water Revenue Bonds, Second Lien Series A, 2012. Proceeds of the Series X Bonds will be used to pay costs of improvements to the Waterworks System and to pay costs of issuing the bonds. From the proceeds of the Series A Bonds, $42,000,000 will be used to fund the final phase of the automated meter reading project while the remainder was used to refund all of the outstanding $50,000,000 Water Revenue Subordinated Notes, Series 2012, and to pay issuance costs.
In conjunction with the issuance of the Water Revenue Bonds, Second Lien Series A, the City established a Subordinate Bonds indenture for the Division of Water. Bonds issued under this indenture are special obligations of the City payable solely from and secured solely by a pledge of and lien on the Subordinate Pledged Revenues and the Subordinate Pledged funds. The Subordinate Pledged Revenues generally consist of the net revenues of the Division which remain after the payment of all operating expenses and the deposit of all funds required to be made on behalf of the Senior Lien bonds. Bonds issued under this indenture are subordinate to those issued as senior lien bonds under the Division of Water’s Amended and Restated Indenture.
Effective October 6, 2011, the City issued $82,090,000 Water Revenue Bonds, Series W, 2011. Proceeds of these bonds were used to refund (1) the outstanding $1,940,000 Waterworks Improvement and Refunding First Mortgage Revenue Bonds, Series H, 1996, (2) the outstanding $42,865,000 Waterworks Refunding Revenue Bonds, Series J, 2001, (3) the outstanding $48,095,000 Water Revenue Bonds, Series K, 2002 and to pay issuance costs. Net proceeds of the Series W Bonds, amounts then on deposit in the Series H, J and K bond funds and an amount released from the debt service reserve fund totaling $95,349,171 were placed in an irrevocable escrow account to pay the principal and interest on the refunded bonds on January 1, 2012. As a result, the refunded bonds were defeased and the liability for these bonds removed from long-term debt. The City completed the refunding in order to achieve debt service savings of approximately $9,527,000 or an economic gain (the difference between the present values of the old and new debt service) of approximately $8,955,000 or 9.64%.

94
Interest Rate Swap Transactions:
Series U and Series V Bonds (previously Series Q, Series R and Series S Bonds):
When the Water Series R and Series S Bonds were refunded in 2010, the swap associated with these bonds was transferred to a portion of the new Series U and Series V Bonds.
Terms: Simultaneously with the issuance of the City’s $175,000,000 Water Revenue Bonds, Series M on August 10, 2004, the City entered into floating to fixed rate swap agreements with notional amounts equal to the total declining balance of the Series M Bonds. Bear Stearns Financial Products Inc. (Bear Stearns) (which has since been acquired by JPMorgan Chase Bank, N.A. (JPM)) was the counterparty on a two-thirds pro-rata share of the transaction and Morgan Stanley Capital Services Inc. (Morgan Stanley) is the counterparty on a one-third pro-rata share of the transaction. Under the original swap agreements for the Series M Bonds, the Water System was the fixed rate payor, paying a fixed rate of 3.533%. Each counterparty was a floating rate payor, with each paying the Water System 61.25% of one month LIBOR plus a spread of 28 basis points. Net payments were exchanged semiannually on January 1 and July 1. The obligation of the Water System to make periodic payments (but not any termination payment) was secured by a pledge of and lien on the net revenues of the Water System on a parity with the pledge and lien securing the payment of debt service on the bonds. Both the bond debt service payments on the Series M Bonds and the periodic swap payments were insured by Financial Security Assurance (FSA).
As part of the refunding of the Series M Bonds, the City amended and restated the original swap agreements to (a) eliminate the swap insurance and related insurer rights, (b) modify the payment frequency, (c) transfer the original swap agreement from Bear Stearns to JPM and (d) split each original swap agreement into two separate interest rate swaps in order to hedge separate series of bonds. The original Bear Stearns swap which has been assumed by JPM hedged the entire principal amount of Series R and certain maturities of the Series Q Bonds. The original Morgan Stanley swap hedged the entire principal amount of Series S and a portion of the Series Q Bonds. The floating rate received by the City was not altered. However, the fixed rate paid by the City was adjusted to 3.553% for the JPM swap and 3.5975% for the Morgan Stanley swap. The termination date for the swaps associated with Series Q is January 1, 2021 while the termination date for the Series R and Series S swaps is January 1, 2033. Net payments are now exchanged monthly. With the refunding of the Series R and Series S Bonds, the JPM swap now hedges all but $200,000 of the Series U Bonds and the Morgan Stanley swap hedges all but $200,000 of the Series V Bonds.
Objective: The City entered into the swaps in order to maximize the savings associated with the refunding of the bonds. The actual savings to be realized by Water System will depend upon the payments made on the variable rate bonds and the payments received under the swap agreement.
Basis Risk: By entering into swaps based upon the 30 day LIBOR rate of interest, the City has undertaken basis risk associated with a change in tax rates and structure. While the average relationship between SIFMA (tax-exempt) and LIBOR (taxable) interest rates has been 67%, this relationship may not always apply. If the payments received from the counterparties are less than the amount paid on the variable rate bonds, the Water System must make up the difference in addition to paying the fixed rate resulting from the swap. As a result of the turmoil in the financial markets since 2008, the SIFMA/LIBOR ratio was significantly higher than 67% for periods of time. In addition, a reduction in federal income tax rates might increase the percentage relationship between SIFMA and LIBOR and may potentially increase the cost of financing.
Counterparty Risk: The City selected highly rated counterparties in order to minimize this risk. However, in the wake of the sub-prime mortgage crisis, Bear Stearns was acquired by JPM. The portion of the City’s swap with Bear Stearns as the counterparty has been assumed by JPM. Over the long-term it is possible that the credit strength of JPM and/or Morgan Stanley could change and this event could trigger a termination payment on part of the City.
Termination Risk: The swap agreement may be terminated prior to its stated termination date under certain circumstances. Upon termination, a payment may be owed by the City to JPM and Morgan Stanley or by JPM and Morgan Stanley to the City, depending upon the prevailing economic circumstances at the time of the termination.
Fair Value: The fair value of the swaps (including accrued amounts) at December 31, 2012 as reported by JPM and Morgan Stanley totaled $27,699,000, which would be payable by the City.
Short-term Obligation: On July 24, 2012, the City issued $50,000,000 Subordinate Lien Water Revenue Notes, Series 2012. Proceeds of the notes were used to retire the $50,000,000 Subordinate Lien Water Revenue Notes issued in 2011. The Series 2012 Notes were subsequently redeemed on November 1, 2012 from the proceeds of the Second Lien Series A, 2012, Bonds. The original notes, which were issued in 2010, provided a portion of the funds needed for a new automated meter reading system for the Division of Water. At the end of 2012, the Division of Water no longer had any notes outstanding.

95
Balance BalanceJanuary 1, December 31,
2012 Increase Decrease 2012
Water Revenue Notes: Subordinate Lien Revenue Notes, Series 2011 50,000$ $ (50,000)$ - $ Subordinate Lien Revenue Notes, Series 2012 50,000 (50,000) -
Total revenue notes 50,000$ 50,000$ (100,000)$ - $
(In thousands)
Ohio Water Development Authority and Ohio Public Works Commission Loans: These loans are payable from net revenues derived from the Water and Water Pollution Control Systems. These obligations do not have a lien on revenues of the Divisions. In 2012, Water expended an additional $817,479 out of $8,304,000 for the Baldwin Residuals and Fairmount Reservoir and $145,916 out of an anticipated $10,954,516 for the Crown Waterworks Chemical Project.
Parking Facilities Revenue Bonds: These bonds are payable from net revenues generated from certain parking facilities and other operating revenues of the Division of Parking Facilities, including parking meter revenue. In addition, the City has pledged other non-tax revenue to meet debt service requirements. The City has pledged and assigned to the trustee a first lien on pledged revenues consisting of fines and penalties collected as a result of the violation of municipal parking ordinances and fines, waivers and costs relating to citations for misdemeanor offenses and the special funds as defined within the bond indenture.
Effective October 6, 2011, the City completed the sale of the City-owned Gateway North Parking Garage to Rock Ohio Caesars Gateway LLC. The garage is being used by the purchaser in conjunction with a new casino constructed in the Higbee Building adjacent to the garage. The net proceeds of the sale of the garage received by the City totaled $20,915,504. Of this amount, $19,578,288 was placed into an irrevocable escrow fund, along with $1,967,425 released from the debt service reserve fund as a result of the transaction, to be used to pay the principal and interest as it comes due on $16,145,000 Parking Facilities Refunding Revenue Bonds, Series 2006. As a result, these bonds are considered to be defeased and the liability for the bonds has been removed from long-term debt. In addition, $480,000 of the sale proceeds was used to terminate the portion of an existing basis swap which was associated with the bonds being defeased. Sale proceeds were also utilized to pay costs of the transaction. As a result of this transaction, the City expects to save approximately $600,000 annually through 2022.
Effective August 15, 2006, the City issued $57,520,000 of Parking Facilities Refunding Revenue Bonds, Series 2006. The bonds were issued to currently refund $56,300,000 of the outstanding Parking Facilities Refunding Revenue Bonds, Series 1996. In addition, proceeds were also used to fund a portion of a payment owed by the City upon early termination under an interest rate swaption agreement entered into in 2003. At the time of the issuance of the Series 2006 Bonds, the City entered into a basis swap agreement with UBS which is described below.
Interest Rate Swap Transaction:
Terms: Simultaneously with the issuance of the City’s $57,520,000 Parking Facilities Refunding Revenue Bonds, Series 2006 on August 15, 2006, the City entered into a floating-to-floating rate basis swap agreement with a notional amount equal to the total declining balance of the Series 2006 Bonds. UBS is the counterparty on the transaction. Under the swap agreement for the Series 2006 Bonds, the City is the floating rate payor, paying a floating rate based on the SIFMA index. The counterparty is also a floating rate payor, paying the City 67% of one month LIBOR. The City also received an upfront payment in the amount of $1,606,000. Net payments are exchanged semi-annually each March 15 and September 15. The obligation of the City to make periodic payments (but not any termination payment) is secured by a pledge of and lien on the parking revenues and additional pledged revenues as defined in the trust indenture securing the Parking Facilities Refunding Revenue Bonds, Series 2006, on parity with the pledge and lien securing the payment of debt service on the bonds.
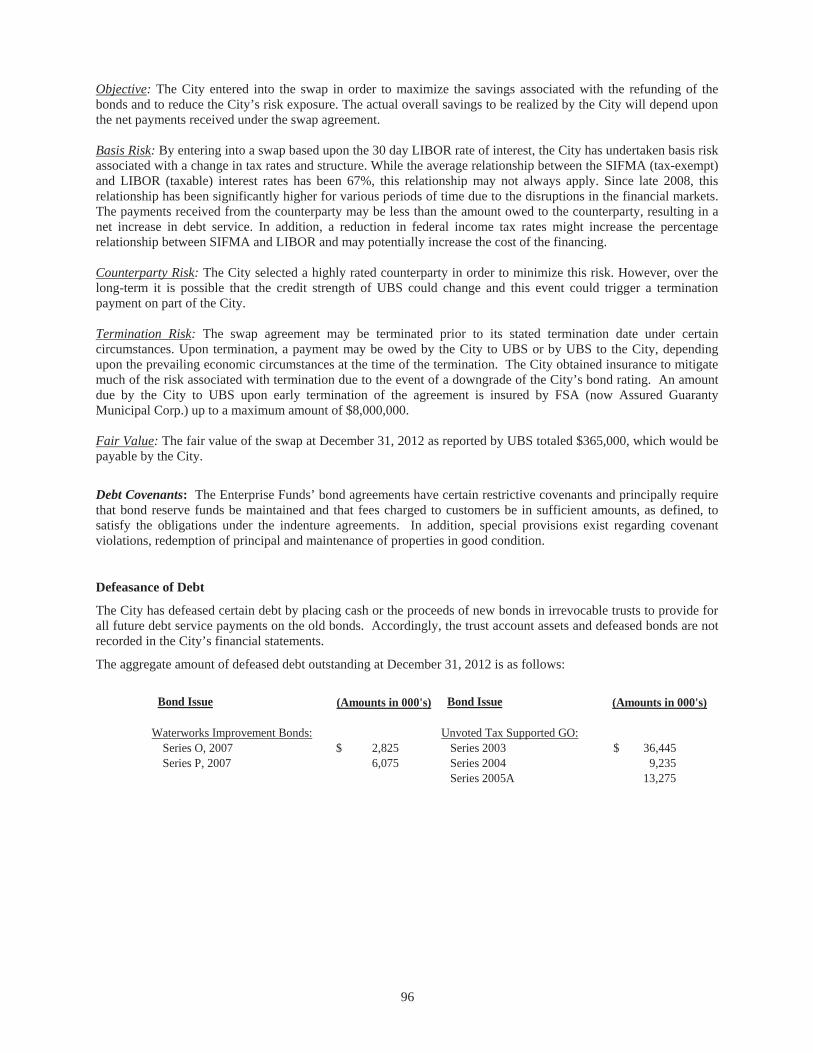
96
Objective: The City entered into the swap in order to maximize the savings associated with the refunding of the bonds and to reduce the City’s risk exposure. The actual overall savings to be realized by the City will depend upon the net payments received under the swap agreement.
Basis Risk: By entering into a swap based upon the 30 day LIBOR rate of interest, the City has undertaken basis risk associated with a change in tax rates and structure. While the average relationship between the SIFMA (tax-exempt) and LIBOR (taxable) interest rates has been 67%, this relationship may not always apply. Since late 2008, this relationship has been significantly higher for various periods of time due to the disruptions in the financial markets. The payments received from the counterparty may be less than the amount owed to the counterparty, resulting in a net increase in debt service. In addition, a reduction in federal income tax rates might increase the percentage relationship between SIFMA and LIBOR and may potentially increase the cost of the financing.
Counterparty Risk: The City selected a highly rated counterparty in order to minimize this risk. However, over the long-term it is possible that the credit strength of UBS could change and this event could trigger a termination payment on part of the City.
Termination Risk: The swap agreement may be terminated prior to its stated termination date under certain circumstances. Upon termination, a payment may be owed by the City to UBS or by UBS to the City, depending upon the prevailing economic circumstances at the time of the termination. The City obtained insurance to mitigate much of the risk associated with termination due to the event of a downgrade of the City’s bond rating. An amount due by the City to UBS upon early termination of the agreement is insured by FSA (now Assured Guaranty Municipal Corp.) up to a maximum amount of $8,000,000.
Fair Value: The fair value of the swap at December 31, 2012 as reported by UBS totaled $365,000, which would be payable by the City.
Debt Covenants: The Enterprise Funds’ bond agreements have certain restrictive covenants and principally require that bond reserve funds be maintained and that fees charged to customers be in sufficient amounts, as defined, to satisfy the obligations under the indenture agreements. In addition, special provisions exist regarding covenant violations, redemption of principal and maintenance of properties in good condition.
Defeasance of Debt
The City has defeased certain debt by placing cash or the proceeds of new bonds in irrevocable trusts to provide for all future debt service payments on the old bonds. Accordingly, the trust account assets and defeased bonds are not recorded in the City’s financial statements.
The aggregate amount of defeased debt outstanding at December 31, 2012 is as follows:
Bond Issue Bond Issue
Waterworks Improvement Bonds: Unvoted Tax Supported GO:Series O, 2007 2,825$ Series 2003 36,445$ Series P, 2007 6,075 Series 2004 9,235
Series 2005A 13,275
(Amounts in 000's) (Amounts in 000's)

97
Airport Special Facilities Revenue Bonds
Airport Special Revenue Bonds, Series 1990, totaling $76,320,000 were issued to finance the acquisition and construction of a terminal, hangar and other support facilities leased to Continental Airlines at Cleveland Hopkins International Airport. These bonds were refunded in 1999 by the issuance of Airport Special Revenue Refunding Bonds, Series 1999 totaling $71,440,000. Additional Airport Special Revenue Bonds, Series 1998, totaling $75,120,000, were issued in 1998 to finance the design and construction of certain airport facilities leased to Continental Airlines, including a new regional jet concourse. Because principal and interest on these bonds are unconditionally guaranteed by Continental Airlines and paid directly by Continental Airlines, these bonds do not constitute a debt, liability or general obligation of the City or a pledge of the City’s revenues. As such, no liabilities relating to these bonds are included in the accompanying financial statements.
Pledges of Future Revenues
The City has pledged future airport revenues to repay $863,930,000 in various Airport System Revenue Bonds issued in various years since 2001. Proceeds from the bonds provided financing for airport operations. The bonds are payable from airport net revenues and are payable through 2033. Annual principal and interest payments on the bonds are expected to require less than 61% of net revenues. The total principal and interest remaining to be paid on the various Airport System Revenue Bonds is $1,320,472,000. Principal and interest paid for the current year and total net revenues (including other available funds) were $50,051,000 and $83,175,000, respectively.
The City has pledged future power system revenues, net of specified operating expenses, to repay $245,113,000 in various Public Power System Revenue Bonds issued in various years since 1994. Proceeds from the bonds provided financing for Public Power System improvements. The bonds are payable from Public Power System net revenues and are payable through 2038. Annual principal and interest payments on the bonds are expected to require less than 70% of net revenues. The total principal and interest remaining to be paid on the various Power System Revenue Bonds is $405,846,000. Principal and interest paid for the current year and total net revenues were $19,796,000 and $28,320,000, respectively.
The City has pledged future Water System revenues, net of specified operating expenses, to repay $785,535,000 in various Senior Lien Water Revenue Bonds and Subordinate Lien Bonds issued in various years since 1993. Proceeds from the bonds provided financing for Water System improvements. The bonds are payable from Water System net revenues and are payable through 2042. Annual principal and interest payments on the bonds are expected to require less than 46% of net revenues. The total principal and interest remaining to be paid on the various Senior and Subordinate Lien Water Revenue Bonds is $1,165,786,000. Principal and interest paid for the current year and total net revenues were $60,856,000 and $133,119,000, respectively.
The City has pledged future revenues from certain parking facilities, net of specified operating expenses, and other operating revenues to repay $31,625,000 in Parking Facilities Refunding Revenue Bonds issued in 2006. Proceeds from the bonds initially issued provided financing for the construction of parking facilities. The bonds are payable from parking facilities net revenues and are payable through 2022. Annual principal and interest payments on the bonds are expected to require the full amount of net pledged revenues. The total principal and interest remaining to be paid on the Parking Facilities Revenue Bonds is $41,310,000. Principal and interest paid for the current year (including net swap payments) and total net revenues were $4,125,000 and $4,148,000 respectively.
In 2012, no additional pledged revenue was required to meet the debt service on the Parking Facilities Refunding Revenue Bonds. The trust indenture requires, among other things, that the Division will fix parking rates and will charge and collect fees for the use of the parking facilities and will restrict operating expenses. As of December 31, 2012, the Division of Parking Facilities was in compliance with the terms and requirements of the trust indenture.
Derivative Instruments
Derivative instruments are contracts, the value of which depends on, or derives from, the value of an underlying asset, index or rate. The most common types of derivatives used by governments are interest rate swaps and interest rate locks. The City has entered into various derivative or hedging agreements since 1999. A detailed description of each outstanding derivative, including its terms, objectives, risks and fair value, can be found in the section discussing the bonds to which the derivative relates.

98
The table below presents the fair value balances and notional amounts of the City’s derivative instruments outstanding at December 31, 2012, classified by type, and the changes in fair value of these derivatives during fiscal year 2012 as reported in the 2012 financial statements. The fair values of the interest rate swaps, which reflect the prevailing interest rate environment at December 31, 2012 and the specific terms and conditions of each swap, have been provided by the respective counterparty for each swap and confirmed by the City’s financial advisor.
Classification Amount Classification Amount Notional
Investment Derivatives: Governmental Activities: Fixed to floating interest rate swap 2003 Subordinated Income Tax Swaption Investment Revenue 203$ (a) Investment (239)$ 47,700$
Business-Type Activities: Floating to floating interest rate swap 2006 Parking Basis Swap Investment Revenue 417 (a) Investment (365) 31,625
Hedging Derivatives: Floating to fixed interest rate swaps 2008 Q Water Swap Deferred inflow 592 Debt (9,569) 76,375 2010 U Water Swap Deferred outflow (192) Debt (12,096) 54,735 2010 V Water Swap Deferred outflow (144) Debt (6,034) 26,295
Changes in Fair Value
(Amounts in 000's)
Fair Value at December 31, 2012
(a) These were reclassified from hedging derivatives to investment derivatives in 2011 due to the City’s determination that the derivatives were not effectively hedged. Therefore the revenue recognized in 2012 was $203,000 for governmental activities and $417,000 for business-type activities.
The table below presents the objective and significant terms of the City’s derivative instruments at December 31, 2012, along with the credit rating of each swap counterparty.
Notional Effective Maturity CounterpartyBonds Type Objective Amount Date Date Terms Credit Rating
Subordinated Receive Fixed Hedge of changes in fair 47,700,000$ 2/7/2003 5/15/2024 If option is exercised, Aa3/A+/A+Income Tax Bonds Interest Rate Swaption value of Series 1994 Receive 4.88%, pay
Subordinated Income Tax Bonds SIFMA
Water Series Q Pay Fixed Hedge of changes in cash 50,190,000$ 8/10/2004 1/1/2021 Pay 3.553%, receive Aa3/A+/A+Interest Rate Swap flow on the Series Q 61.25% of LIBOR + 28 bps
Water System Bonds
Water Series Q Pay Fixed Hedge of changes in cash 26,185,000$ 8/10/2004 1/1/2021 Pay 3.5975%, receive Baa1/A /AInterest Rate Swap flow on the Series Q 61.25% of LIBOR + 28 bps
Water System Bonds
Water Series U Pay Fixed Hedge in changes in cash 54,735,000$ 2/12/2009 1/1/2033 Pay 3.553%, receive Aa3/A+/A+Interest Rate Swap flow on the Series U 61.25% of LIBOR + 28 bps
Water System Bonds
Water Series V Pay Fixed Hedge in changes in cash 26,295,000$ 2/12/2009 1/1/2033 Pay 3.5975%, receive Baa1/A /AInterest Rate Swap flow on the Series V 61.25% of LIBOR + 28 bps
Water System Bonds
2006 Parking Bonds Basis Swap Pay Exchange floating rate 31,625,000$ 8/15/2006 9/15/2022 Pay SIFMA, receive A2/A/AFloating/Receive Floating payments on Series 2006 67% of LIBOR
Parking System Bonds

99
The following table presents the aggregate debt service requirements on the City’s hedged debt and net receipts/payments on the associated hedging derivative instruments as of December 31, 2012. These amounts assume that the interest rates on variable rate bonds and the reference rates in existence as of December 31, 2012 remain the same for the life of the hedging agreement. However, these rates will vary over time and the actual interest payments on the variable rate bonds and the net receipts/payments on the hedging derivative instruments will deviate from the numbers presented below.
Fiscal Year Ending Hedging
December 31 Principal Interest Derivatives, Net Total
2013 $ 800$ 4,786$ 5,586$ 2014 800 4,522 5,322 2015 799 4,244 5,043 2016 801 4,186 4,987 2017 800 4,147 4,947
2018-2022 17,000 3,850 14,804 35,654 2023-2027 81,415 1,491 3,712 86,618 2028-2032 61,730 274 257 62,261
2033 12,085 2 1 12,088 Total 172,230$ 9,617$ 40,659$ 222,506$
Aggregate Cash Flows on Hedging Derivative Instruments
(Amounts in 000's)
NOTE 6 – DEFERRED PAYMENT OBLIGATION / I-X CENTER
In January 1999, the City purchased the International Exposition (I-X) Center and the land on and around it for $66.5 million as part of its master plan to expand Cleveland Hopkins International Airport. As part of the purchase agreement, the City leased the building back to the former owner for 15 years, after which the City may demolish the building to make way for airport development. Of the $66.5 million purchase price, $36.5 million was paid in cash in 1999. The remaining $30 million, including interest at 7.75%, is being deferred by the seller and will be offset by future lease payments owed to the City over the 15 year lease period. The future lease payments are equal to the remaining purchase price plus interest at 7.75%, and as such, no cash will be exchanged between the City and the lessee over the term of the lease. The deferred payment is reported as “Deferred Payment Obligation” in the accompanying proprietary funds statement of net position.
In the event that either a similar facility is developed that exceeds a specified size, or there is an expansion of an existing facility that exceeds a specified size within the municipal boundary of the City of Cleveland, the lessee has the right to terminate the lease. Such termination would require the City to pay the lessee the remaining portion of the deferred purchase price.
Rental income recognized by the City under this agreement totaled $3,389,000 in 2012. Of this amount $399,000 was offset against interest expense and $2,990,000 was offset against the principal balance of the deferred obligation.

100
NOTE 7 – RISK MANAGEMENT
Self Insurance: The City is exposed to various risks of loss related to torts; thefts of, damage to and destruction of assets; errors and omissions; injuries to employees; and natural disasters. The City does not carry commercial insurance for such risks, except for certain proprietary funds and the football stadium. In accordance with GASB Statement No. 10, claims liabilities are reported when it is probable that a loss has occurred and the amount of the loss can be reasonably estimated. Liabilities include an amount for claims that have been incurred but not reported (IBNRs). Claims that meet this criteria are reported as liabilities of either governmental or business-type activities in the government-wide statement of net position. In the fund financial statements, claims liabilities that relate to proprietary funds are reported. The current portion of claims is reported as a fund liability in governmental funds; however, the long-term portion of claims liabilities is not reported.
The result of the process to estimate the claims liability is not an exact amount as it depends on many complex factors, such as inflation, changes in legal doctrines and damage awards. Accordingly, claims are re-evaluated periodically to consider the effects of inflation, recent claim settlement trends (including frequency and amount of pay-outs) and other economic and social factors. The estimate of the claims liability also includes amounts for incremental claim adjustment expenses related to specific claims and other claim adjustment expenses, regardless of whether allocated to specific claims. Estimated recoveries, for example from salvage or subrogation, are another component of the claims liability estimate.
Changes in the estimated claims payable for all funds during the years ended December 31, 2012 and 2011 were as follows:
2012 2011
Estimated claims payable, January 1 2,528$ 4,000$ Current year claims (including IBNRs) and changes in estimates 4,713 986 Claim payments (3,248) (2,458)
Estimated claims payable, December 31 3,993$ 2,528$
(Amounts in 000's)
The estimated claims liabilities are based on the estimated cost of settling claims (including incremental claim adjustment expenses) through a case-by-case review of all outstanding claims and by using historical experience. Claims payable are included as accounts payable on the modified accrual financial statements and are reclassed to long-term obligations as due with one year or due in more than one year on the Statement of Net Position.
Insurance: Certain proprietary funds carry insurance to cover particular liability risks and property protection. Otherwise, the City is generally self-insured. No material losses, including incurred but not reported losses, occurred in 2012. There was no significant decrease in any insurance coverage in 2012. In addition, there were no insurance settlements in excess of insurance coverage during the past three years.
The City provides the choice of four separate health insurance plans for its employees. These plans are provided by two different insurers through commercial insurance. Operating funds are charged a monthly rate per employee, by type of coverage.
In January of 2003, the City exercised the option of retrospective rating as the premium rating mechanism for its workers’ compensation program. The total estimated claims liability outstanding at December 31, 2012 was $21,786,771. Of this amount, $7,869,615 was recorded as a fund liability within each respective fund. The remaining $13,917,156 is due in future years and is recorded as a liability in the Workers’ Compensation Reserve Internal Service Fund. This liability is funded by charging the appropriate funds their proportionate share of this liability and recording the associated due to or due from as appropriate.

101
NOTE 8 – CONTINGENCIES
General Contingencies: Various claims and lawsuits are pending against the City. In accordance with GASB Statement No. 10, those claims which are considered “probable” are accrued (see Note 7 – Risk Management), while those claims that are considered “reasonably possible” are disclosed but not accrued.
As of December 31, 2012, the City had $6,500,000 in claims for which an unfavorable outcome is deemed to be reasonably possible.
These estimates were based on a case-by-case review of outstanding claims by the City’s in-house legal department.
Contingent Liabilities: In November 2009, participants in the American Municipal Power Generating Station (AMP) voted to terminate development of the 1,000 MW coal-fired generating station that was to be located on the Ohio River in Meigs County, Ohio. The City was one of 81 member participants in the project and had committed to receive an 80 MW share of the project’s output. AMP has instituted litigation against the EPC contractor to recover costs incurred as a result of the project’s cancellation.
The City and the other members participated in the project through “take or pay” contracts with AMP and are obligated to pay for the project’s sunk costs based on each member’s allocation. The City’s share of the incurred project costs is $13,556,845 plus interest of $79,704. AMP anticipates that any such costs that are not recovered through participation in a replacement project will be financed by AMP and recovered from the AMP participants over a period of time yet to be determined. AMP has rolled over a portion of the Meigs County facility cost into the Fremont Energy Center (Fremont), a new natural gas generating station that AMP purchased in July 2011. AMP has provided the Division a Development Cost Credit of $6,281,771. These credits cut the Division’s risk of loss in half. None of these credits have been recorded in the City’s financial statements through December 31, 2012.
Cleveland City Council passed legislation in 2011 allowing the City to pass through 50% of any costs that are determined to be the responsibility of the customers in their monthly electricity bills over time. Through this legislation, the Division will purchase power from the Fremont project, pay about half of its allocable share in AMP costs as power costs purchased from Fremont and include the costs in bills to customers over time. The legislation directs the City to pay its remaining share of the costs due to AMP, estimated at $3,677,390, from operating funds over a period of time yet to be determined.
The City has not paid any monies to AMP towards the project’s sunk costs. Furthermore, the City has not reported the stranded costs in the financial statements as the City’s communication received from AMP to date is that the actual amount of incurred costs that are not recoverable from the vendor is undeterminable.
Contingencies Under Grant Programs: The City participates in a number of federally assisted Investment Act Grant Programs, principal of which are Community Development Block Grants, Home Weatherization Assistance, the Healthy Start Initiative, Federal HOME Program, Youth Opportunity Area Grant, Workforce Investment Act Grant, Empowerment Zone and Federal Aviation Administration Airport Improvement Grant Programs. These programs are subject to financial and compliance audits by the grantors or their representatives.
In addition to the federally assisted Investment Act Grant Programs, the City received a portion of the American Recovery and Reinvestment Act (ARRA) funds. These funds were funded through existing programs. The ARRA funds are subject to financial and compliance audits by the grantor or their representative and are subject to availability.
HUD Office of the Inspector General has issued three findings against the City regarding the Afford-A-Home program. The City has contested and appealed two of the findings and is in the process of reviewing the third.

102
NOTE 9 – INTERFUND TRANSACTIONS AND BALANCES
Interfund Transactions: During the course of normal operations, the City records numerous transactions between funds including expenditures and transfers of resources to provide services, subsidize operations and service debt. The City has the following types of transactions among funds:
(1) Reciprocal interfund services provided and used – Purchases and sales of goods and services between funds for a price approximating their external exchange value.
(2) Nonreciprocal interfund transfers – Flows of assets between funds without equivalent flows of assets in return and without a requirement for repayment. This includes transfers to subsidize various funds.
(3) Nonreciprocal interfund reimbursements – Repayments from the funds responsible for particular expenditures or expenses to the funds that initially paid for them.
For the year ended December 31, 2012, transfers consisted of the following:
Transfers In
Other TotalTransfers Out Govern- Govern- Internal
General mental mental Enterprise ServiceTotal Fund Funds Funds Funds Funds
Governmental Funds: General 16,941$ $ 14,626$ 14,626$ 1,589$ 726$ Other Governmental 45,204 3,602 41,602 45,204
Total Governmental Funds 62,145 3,602 56,228 59,830 1,589 726
Total62,145$ 3,602$ 56,228$ 59,830$ 1,589$ 726$
(Amounts in 000's)

103
Interfund Balances: Interfund balances at December 31, 2012 represent charges for services or reimbursable expenses. These remaining balances resulted from the time lag between the dates that (1) interfund goods or services are provided or reimbursable expenditures occur, (2) transactions are recorded in the accounting records and (3) payments between funds are made. All are expected to be paid within one year.
Interfund receivable and payable balances as of December 31, 2012 are as follows:
DepartmentOther Total Division Cleveland of
Govern- Govern- of Public Port Other Total InternalGeneral mental mental Water Power Control Enterprise Enterprise Service
Due To Total Fund Funds Funds Fund Fund Fund Funds Funds Funds
Governmental Funds: General 6,109$ $ $ - $ 9$ 1,317$ 34$ 32$ 1,392$ 4,717$ Other Governmental 15,183 1,013 12,451 13,464 153 894 69 1,116 603
Total Governmental 21,292$
Enterprise Funds: Division of Water 2,630$ 11 18 29 1,008 205 1,213 1,388 Cleveland Public Power 4,499 5 5 3,856 8 3,864 630 Department of Port Control 1,412 269 269 17 227 244 899 Other Enterprise 11,584 92 3 95 10,644 71 1 10,716 773 Total Enterprise 20,125$
Internal Service Funds 204 3 3 6 4 10 191
Total Due To/Due From 41,621$ 1,393$ 12,472$ 13,865$ 14,662$ 3,313$ 34$ 546$ 18,555$ 9,201$
Due From
(Amounts in 000's)
NOTE 10 – INCOME TAXES
During 2012, the City income tax rate remained at 2% and the credit provided to City residents for income taxes paid to other municipalities remained at 50% and the maximum credit is limited to 1%. A portion of the City income tax is restricted in its use to capital expenditures and debt service and is included in the Restricted Income Tax Special Revenue Fund. All other income tax proceeds are included in the General Fund.
Employers within the City are required to withhold income taxes on employee compensation and remit withholdings to the City at least quarterly. Corporations and other individual taxpayers are required to pay their estimated tax quarterly and file a declaration annually.

104
NOTE 11 – PROPERTY TAXES
Property taxes include amounts levied against all real and public utility property located in the City. The 2012 levy was based upon an assessed valuation of approximately $5.631 billion. Ohio law prohibits taxation of property from all taxing authorities in excess of 10 mills of assessed value without a vote of the people. Under current procedures, the City’s share is 4.4 mills, of which 4.35 mills is dedicated to debt service and .05 mills is dedicated to the payment of fire pension obligations. A revaluation of all property is required to be completed no less than every six years, with a statistical update every third year. The last reappraisal was completed in 2012. Assessed values are established by the Cuyahoga County (County) Auditor. The County Treasurer collects property taxes on behalf of all taxing districts in the County including the City.
Real property taxes, excluding public utility property, are assessed at 35% of appraised market value. Pertinent real property tax dates are:
Collection Dates January 24 and July 10 of the current year
Lien Date January 1 of the year preceding the collection year
Levy Date October 1 of the year preceding the collection year
An electric company’s taxable utility production equipment is assessed at 25% of true value, while all of its other taxable property is assessed at 88% of true value. Pertinent public utility tangible personal property tax dates are:
Collection Dates January 20 and June 20 of the current year
Lien Date December 31 of the second year preceding the collection year
Levy Date October 1 of the year preceding the collection year

105
NOTE 12 – DEFERRED AND UNEARNED REVENUE
Governmental funds report deferred revenue in connection with receivables for revenues that are not considered to be available to liquidate liabilities of the current period. Governmental funds also defer revenue recognition in connection with resources that have been received, but not all eligibility requirements have been met as unearned revenue.
As of December 31, 2012, the various components of deferred revenue reported in the governmental funds on the modified accrual approach were as follows:
EligibilityRequirements
Unavailable Not Met Total
Governmental Funds:General Fund: Income taxes receivable 15,503$ $ 15,503$ Property taxes receivable 56,525 56,525 Local government receivable 8,241 8,241 Estate tax receivable 307 307
Homestead rollback 3,413 3,413
Emergency medical service receivable 146 146
Special assessments receivable 3,246 3,246 Other taxes receivable 1,736 576 2,312
Total General Fund 89,117 576 89,693
Other Governmental Funds: Income taxes receivable 1,938 1,938 Special assessments receivable 6,817 6,817 Property taxes receivable 29,447 29,447 Advances received under grants 8,147 8,147
Motor vehicle taxes receivable 1,327 1,327
Municipal gas tax receivable 1,015 1,015
State gasoline tax receivable 1,996 1,996 Homestead rollback 1,778 1,778
Grant receivable 119 2 121
Other taxes receivable 298 298
Due from other governments 4,767 4,767
Total Other Governmental Funds 49,502 8,149 57,651
Total Deferred and Unearned Revenue 138,619$ 8,725$ 147,344$
(Amounts in 000's)
NOTE 13 – DEFINED BENEFIT PENSION PLANS
Ohio Public Employees Retirement System: All full-time employees, other than non-administrative full-time police officers and firefighters, participate in the Ohio Public Employees Retirement System (OPERS). OPERS administers three separate pension plans as described below:
1) The Traditional Pension Plan – a cost-sharing, multiple-employer defined benefit pension plan.
2) The Member-Directed Plan – a defined contribution plan in which the member invests both member and employer contributions (employer contributions vest over five years at 20% per year). Under the Member-Directed Plan, members accumulate retirement assets equal to the value of member and (vested) employer contributions plus any investment earnings.
3) The Combined Plan – a cost-sharing, multiple-employer defined benefit pension plan. Under the Combined Plan, OPERS invests employer contributions to provide a formula retirement benefit similar in nature to the Traditional Pension Plan benefit. Member contributions, the investment of which is self-directed by the members, accumulate retirement assets in a manner similar to the Member-Directed Plan.

106
OPERS provides retirement, disability, survivor and death benefits and annual cost-of-living adjustments to members of the Traditional Pension and Combined Plans. Members of the Member-Directed Plan do not qualify for ancillary benefits. Authority to establish and amend benefits is provided in Chapter 145 of the Ohio Revised Code. OPERS issues a stand-alone financial report. Interested parties may obtain a copy by visiting https://www.opers.org/investments/cafr.shtml, writing to OPERS, 277 East Town Street, Columbus, Ohio 43215-4642, or by calling (614) 222-5601 or (800) 222-7377.
The Ohio Revised Code provides statutory authority for member and employer contributions. For 2012, member and employer contribution rates were consistent across all three plans. Member contribution rates were 10.00% in 2012, 2011 and 2010. The employer contribution rates were 14.00% of covered payroll in 2012, 2011 and 2010.
The City’s required employer contributions to OPERS for the pension portion of all the plans for the years ending December 31, 2012, 2011 and 2010 were $25,369,016, $25,558,982 and $25,698,844 each year, respectively. The required payments due in 2012, 2011 and 2010 have been made.
In June 2012, the Governmental Accounting Standards Board (GASB) issued GASB Statement No. 68, Accounting and Financial Reporting for Pensions. This accounting standard replaces GASB Statement No. 27, and it is effective for employer fiscal years beginning after June 15, 2014.
Ohio Police and Fire Pension Fund: The City contributes to the Ohio Police and Fire Pension Fund (OP&F), a cost-sharing multiple-employer defined benefit pension plan. OP&F provides retirement and disability pension benefits, annual cost-of-living adjustments and death benefits to plan members and beneficiaries. Benefit provisions are established by the Ohio State Legislature and are codified in Chapter 742 of the Ohio Revised Code. OP&F issues a publicly available financial report that includes financial information and required supplementary information for the plan. That report may be obtained by writing to the OP&F, 140 East Town Street, Columbus, Ohio 43215-5164.
Plan members are required to contribute 10.00% of their annual covered salary, while the City is required to contribute 19.50% for police officers and 24.00% for firefighters. The City’s contributions to the OP&F for the years ended December 31, 2012, 2011 and 2010 were $22,183,185, $22,213,372 and $22,678,219, respectively. The required payments due in 2012, 2011 and 2010 have been made.
NOTE 14 – OTHER POSTEMPLOYMENT BENEFITS
Ohio Public Employees Retirement System: All full-time employees, other than non-administrative full-time police officers and firefighters, participate in the Ohio Public Employees Retirement System (OPERS). OPERS administers three separate pension plans: The Traditional Pension Plan – a cost-sharing, multiple-employer defined benefit pension plan; the Member-Directed Plan – a defined contribution plan; and the Combined Plan – a cost-sharing, multiple-employer defined benefit pension plan that has elements of both a defined benefit and defined contribution plan. OPERS maintains a cost-sharing multiple employer defined benefit postemployment health care plan, which includes a medical plan, prescription drug program and Medicare Part B premium reimbursement, to qualifying members of both the Traditional Pension and the Combined Plans. Members of the Member-Directed Plan do not qualify for ancillary benefits, including postemployment health care coverage. In order to qualify for postemployment health care coverage, age-and-service retirees under the Traditional Pension and Combined Plans must have 10 or more years of qualifying Ohio service credit. Health care coverage for disability benefit recipients and qualified survivor benefit recipients is available. The health care coverage provided by OPERS meets the definition of an Other Postemployment Benefit (OPEB) as described in GASB Statement No. 45. The Ohio Revised Code permits, but does not mandate, OPERS to provide OPEB benefits to its eligible members and beneficiaries. Authority to establish and amend benefits is provided in Chapter 145 of the Ohio Revised Code.
OPERS issues a stand-alone financial report. Interested parties may obtain a copy by visiting https://www.opers.org/investments/cafr.shtml, writing to OPERS, 277 East Town Street, Columbus, Ohio 43215-4642, or by calling (614) 222-5601 or (800) 222-7377.

107
The Ohio Revised Code provides the statutory authority requiring public employers to fund post-retirement health care through their contributions to OPERS. A portion of each employer’s contribution to OPERS is set aside for funding of post-retirement health care benefits. Employer contribution rates are expressed as a percentage of the covered payroll of active members. The employer contribution rates were 14.00% of covered payroll in 2012, 2011 and 2010. The Ohio Revised Code currently limits the employer contribution to a rate not to exceed 14.00% of covered payroll. Active members do not make contributions to the OPEB Plan. OPERS’ Postemployment Health Care plan was established under and is administrated in accordance with, Internal Revenue Code 401(h). Each year, the OPERS Retirement Board determines the portion of the employer contribution rate that will be set aside for funding of postemployment health care benefits. Employer contribution rates used to fund postemployment benefits were 4.00% for members of the Traditional Plan in 2012 and 2011, 6.05% for members of the Combined Plan in 2012 and 2011 and 5.50% from January 1, 2010 through February 28, 2010 and 5.00% from March 1, 2010 through December 31, 2010 for both plans. Effective January 1, 2013, the portion of employer contributions allocated to health care was lowered to 1.00% for both plans, as recommended by the OPERS Actuary. The OPERS Retirement Board is also authorized to establish rules for the payment of a portion of the health care benefits provided, by the retiree or their surviving beneficiaries. Payment amounts vary depending on the number of covered dependents and the coverage selected. The City’s actual contributions to OPERS to fund postemployment benefits were $10,146,896 in 2012, $10,222,877 in 2011 and $14,648,933 in 2010. The required payments due in 2012, 2011 and 2010 have been made.
Changes to the health care plan were adopted by the OPERS Board of Trustees on September 19, 2012, with a transition plan commencing January 1, 2014. With the recent passage of pension legislation under SB343 and the approved health care changes, OPERS expects to be able to consistently allocate 4.00% of the employer contributions toward the health care fund after the end of the transition period.
Ohio Police and Fire Pension Fund: The City contributes to the OP&F sponsored health care program; a cost-sharing multiple-employer defined postemployment health care plan administered by OP&F. OP&F provides health care benefits including coverage for medical, prescription drugs, dental, vision, Medicare Part B Premium and long-term care to retirees, qualifying benefit recipients and their eligible dependents. OP&F provides access to post-retirement health care coverage for any person who receives or is eligible to receive a monthly service, disability, or survivor benefit check or is a spouse or eligible dependent child of such person. The health care coverage provided by OP&F meets the definition of an Other Postemployment Benefit (OPEB) as described in GASB Statement No. 45. The Ohio Revised Code allows, but does not mandate OP&F to provide OPEB benefits. Authority for the OP&F Board of Trustees to provide health care coverage to eligible participants and to establish and amend benefits are codified in Chapter 742 of the Ohio Revised Code. OP&F issues a publicly available financial report that includes financial information and required supplementary information for the Plan. That report may be obtained by writing to the OP&F, 140 East Town Street, Columbus, Ohio 43215-5164. That report is also available on OP&F’s website at www.op-f.org.
The Ohio Revised Code provides for contribution requirements of the participating employers and plan members to the OP&F (defined benefit pension plan). Participating employers are required to contribute to the pension plan at rates expressed as percentages of the payroll of active pension plan members, currently 19.50% of covered payroll for police and 24.00% of covered payroll for firefighters. The Ohio Revised Code states that the employer contribution may not exceed 19.50% of covered payroll for police and 24.00% of covered payroll for firefighters. Active members do not make contributions to the OPEB Plan.
OP&F maintains funds for health care in two separate accounts. One for health care benefits under an IRS Code Section 115 trust and one for Medicare Part B reimbursements administrated as an Internal Revenue Code 401(h) account, both of which are within the defined benefit pension plan, under the authority granted by the Ohio Revised Code to the OP&F Board of Trustees. The Board of Trustees is authorized to allocate a portion of the total employer contributions made into the pension plan to the Section 115 trust and the Section 401(h) account as the employer contribution for retiree health care benefits. For the year ended December 31, 2012, the employer contribution allocated to the health care plan was 6.75% of covered payroll. The amount of employer contributions allocated to the health care plan each year is subject to the Trustees’ primary responsibility to ensure that pension benefits are adequately funded and is limited by provisions of Sections 115 and 401(h). The OP&F Board of Trustees is authorized to establish requirements for contributions to the health care plan by retirees and their eligible dependents, or their surviving beneficiaries. Payment amounts vary depending on the number of covered dependents and the coverage selected. The City’s contribution to OP&F that was allocated to the health care plan was $10,424,190 for the year ending December 31, 2012, $10,399,050 for 2011 and $10,615,539 for 2010. The required payments due in 2012, 2011 and 2010 have been made.

108
NOTE 15 – CAPITAL ASSETS
Capital asset activity for the year ended December 31, 2012 was as follows:
Balance BalanceJanuary 1, December 31,
2012 Additions Reductions 2012(Amount in 000's)
Governmental Activities: Capital assets, not being depreciated: Land 66,188$ $ $ 66,188$ Construction in progress 88,129 52,542 (25,291) 115,380 Total capital assets, not being depreciated 154,317 52,542 (25,291) 181,568 Capital assets, being depreciated: Land improvements 147,772 9,779 157,551 Buildings, structures and improvements 618,625 4,157 622,782 Furniture, fixtures, equipment and vehicles 186,519 12,031 (7,321) 191,229 Infrastructure 543,908 16,690 (1,134) 559,464 Total capital assets, being depreciated 1,496,824 42,657 (8,455) 1,531,026 Less accumulated depreciation for: Land improvements (95,850) (5,492) (101,342) Buildings, structures and improvements (278,670) (14,295) (292,965) Furniture, fixtures, equipment and vehicles (136,106) (13,709) 5,374 (144,441) Infrastructure (224,772) (20,692) 1,080 (244,384) Total accumulated depreciation (735,398) (54,188) 6,454 (783,132)
Total capital assets being depreciated, net 761,426 (11,531) (2,001) 747,894
Governmental activities capital assets, net 915,743$ 41,011$ (27,292)$ 929,462$
Balance BalanceJanuary 1, December 31,
2012 Restatement Additions Reductions 2012
Business-Type Activities: Capital assets, not being depreciated: Land 191,512$ $ 386$ $ 191,898$ Construction in progress 378,741 118,749 (204,397) 293,093 Total capital assets, not being depreciated 570,253 - 119,135 (204,397) 484,991 Capital assets, being depreciated: Land improvements 97,735 97,735 Utility plant 1,720,170 239,074 173,085 (1,489) 2,130,840 Buildings, structures and improvements 676,849 23,972 (421) 700,400 Furniture, fixtures, equipment and vehicles 704,604 32,308 (5,419) 731,493 Infrastructure 956,696 19,105 975,801 Total capital assets, being depreciated 4,156,054 239,074 248,470 (7,329) 4,636,269 Less accumulated depreciation for: Land improvements (44,493) (1,811) (46,304) Utility plant (459,914) (74,113) (63,638) 1,489 (596,176) Buildings, structures and improvements (369,589) (14,319) 421 (383,487) Furniture, fixtures, equipment and vehicles (551,638) (36,956) 5,319 (583,275) Infrastructure (415,253) (41,059) (456,312) Total accumulated depreciation (1,840,887) (74,113) (157,783) 7,229 (2,065,554) Total capital assets being depreciated, net 2,315,167 164,961 90,687 (100) 2,570,715
Business-Type activities capital assets, net 2,885,420$ 164,961$ 209,822$ (204,497)$ 3,055,706$
(Amount in 000's)
The additions to accumulated depreciation may not match depreciation expense due to assets transferred between Business-Type Activities and Governmental Activities, if the transferred assets have been depreciated prior to this year.

109
Depreciation: Depreciation expense was charged to functions/programs of the City as follows:
(Amounts in 000’s)Governmental Activities: General Government 30,077$ Public Works 10,893 Public Safety 9,121 Building and Housing 144 Community Development 1,287 Public Health 366 Economic Development 119 Depreciation expense on capital assets held by the City's internal service funds that is charged to the various functions based on their usage of the assets 452
Total depreciation expense charged to governmental activities 52,459$
Business-Type Activities: Water 67,455$ Electricity 16,971 Airport Facilities 50,541 Nonmajor activities 7,684 Depreciation expense on capital assets held by the City's internal service funds that is charged to the various functions based on their usage of the assets 197
Total depreciation expense charged to business-type activities 142,848$
Capital Commitments: Significant commitments of the City as of December 31, 2012 are composed of the following:
RemainingProject Description Spent-to-Date Commitment
Governmental Activities:
3rd District Police Station Design & Construction 225$ 15,981$ 800 MHz Interoperability System 1,485 6,515 League Park Renovations 19 6,404 East Side Station 125 6,301 Fleet Avenue 6,000 Madison Avenue/W 65 263 5,339 Cedar Avenue (E55 to E89) 5,281 Woodland East 55 to Buckeye 270 4,582 Fire Station #36 Design 14 3,925 Cedar Avenue E 89 to MLK 268 3,856 New Financial Management System 7,272 3,542 Superior Avenue Rehab 7,391 3,475 Shoreway West 3,000
(Amounts in 000’s)

110
RemainingProject Description Spent-to-Date Commitment
Business-Type Activities:
Lake Road Substation 8,426$ 24,023$ Meter Automation & Replace Prg 30,861 20,588 Parking Redevelopment Program Phase 1 15,078 Suburban Water Main Renewal Program 12,000 Crown Water Plant 12,668 11,912 Harvard Substation 386 7,719 Watermain Renewal 2013 7,000 13.8 kV Distribution Feeders 152 6,423 Transmission Main Renewal Program 1,753 6,247 MS1/MS2 Tie-In 6,000 IT Converged Communications 2,650 5,762 Taxiway L Reconstruction 1,009 5,691 Denison Avenue 5,422
(Amounts in 000’s)
Capital Grant Programs: The City participates in the State Issue 2 program and the Local Transportation Improvement Program. Through these programs, the State of Ohio (State) provides financial assistance to the City for its various road and bridge improvements and storm water detention facilities. The Ohio Public Works Commission (OPWC) is the State agency which oversees the allocation of State bond proceeds and tax revenue to selected projects which have met funding requirements. Upon approval of the OPWC, the City and the State create project agreements establishing each entity’s financial contribution toward each project. Through December 31, 2012, the State funded $168,862,000 of road and bridge improvement projects and $6,974,000 for storm water detention facilities.
Capitalized Interest: Interest expense incurred during the construction phase of capital assets of business-type activities is included as part of the capitalized value of the assets constructed, net of interest income earned on invested debt proceeds. For 2012, interest expense incurred for the Enterprise Funds was $86,441,000 of which $16,708,000 was capitalized net of $208,000 of interest income capitalized.
Idle Facilities: In April 1977, Cleveland Public Power (CPP) closed its generation plant and since that time, CPP’s revenues have been derived primarily from the distribution of purchased power. CPP continued its past practice of depreciating the plant at rates which completed the amortization of the plant in 1999. With the present availability of competitively priced purchased power, management believes the plant will remain idle.
NOTE 16 – SERVICE CONCESSION ARRANGEMENTS
In 2010 the City entered into an agreement with Cleveland Metropolitan Park District (Cleveland Metroparks) under which Cleveland Metroparks will operate and collect user fees from Seneca Golf Course for the next 99 years. Cleveland Metroparks has paid the City $99 for this agreement. They have agreed to complete at least $4,000,000 of capital improvements before December 31, 2015. As completed, all capital improvements performed by Cleveland Metroparks will become an asset of Seneca Golf Course and the City. Upon expiration of the agreement, all improvements will be vest in the City. Cleveland Metroparks is required to operate and maintain the golf course in accordance with the City Contract.
In 2012 the City entered into an agreement with Mark A Nance Golf Ohio, LLC (MAN) under which MAN will operate and collect user fees from the Highland Park Golf Course for the next 10 years. MAN will pay the City installment payments over the course of the arrangement; the present value of these installment payments is $180,000. MAN will also pay 5% of revenues greater than $800,000 in years 2012 through 2017. In years 2018 and beyond, MAN will pay 5% on gross revenues up to $800,000; $10% of gross revenues $801,000 through

111
$1,000,000; and 15% of gross revenues greater than $1,000,000. In addition to receiving a portion of gross revenues, MAN will also make necessary capital improvements to the golf course. As completed, all capital improvements performed by MAN will become an asset of Highland Park Golf Course and the City. MAN is required to operate and maintain the golf course in accordance with the City Contract. The City reports a receivable and deferred inflow of resources in the amount of $175,500 at year-end pursuant to the service concession arrangement.
The City reports the golf courses and related equipment as a capital asset with a carrying amount of $3,454,013 at year end.
NOTE 17 – SEGMENT INFORMATION
The City has issued revenue bonds and construction loans to finance the activities accounted for in the following Enterprise Funds:
Division of Water
Cleveland Public Power
Department of Port Control
Municipal Parking Lots
Investors in the revenue bonds rely solely on the revenues generated from the specific enterprise activity to which the debt obligations pertain for repayment.
Shown below is summarized financial information for the City’s enterprise activity that has issued long-term obligations and is not reported as a major fund in the proprietary funds financial statements:
Condensed Statement of Net Position Information MunicipalParking Lots
(Amounts in 000's)Assets: Current assets 5,657$ Restricted assets 8,762 Other noncurrent assets 1,288 Capital assets, net 36,658 Total assets 52,365$
Liabilities: Current liabilities 3,692$ Long-term liabilities 28,129 Total liabilities 31,821
Deferred inflows of resources: Derivative instruments-interest rate swaps 365 Total liabilities 365
Net position: Net investment in capital assets 9,272 Restricted for debt service 5,525 Unrestricted 5,382 Total net position 20,179
Total liabilities, deferred inflows and net position 52,365$

112
Condensed Statement of Revenues, Expenses and Changes in Net Position Information
Municipal Parking Lots
(Amounts in 000's)
Charges for services 7,735$ Depreciation (expense) (1,405) Other operating (expenses) (3,896) Operating income (loss) 2,434 Nonoperating revenues (expenses): Investment income 423 Interest expense (1,853) Other revenue (expenses) (227) Capital Contibutions 490 Change in net position 1,267
Net position at beginning of year 18,912
Net position at end of year 20,179$
Condensed Statement of Cash Flows Information MunicipalParking Lots
(Amounts in 000's)Net cash provided by (used for): Operating activities 3,374$ Capital and related financing activities (4,125) Investing activities 4,107 Net increase (decrease) in cash and cash equivalents 3,356
Beginning cash and cash equivalents 10,855
Ending cash and cash equivalents 14,211$
The balances of the restricted asset accounts in the enterprise funds are as follows:
Division Cleveland Department Municipal Waterof Public of Port Parking Pollution
Purpose Water Power Control Lots Cemeteries Control
Construction activities 136,912$ 52,195$ 110,949$ 3,237$ $ 508$ Debt retirement 87,602 3,976 111,467 5,525Accrued passenger facility charges 17,670 Other 84 1 55,247 6,579 78
Total 224,598$ 56,172$ 295,333$ 8,762$ 6,579$ 586$
(Amounts in 000's)

113
NOTE 18 – RESTATEMENT
The Division of Water entered into amended Water Service Agreements with 21 member communities prior to 2012. As part of the agreements, ownership of distribution mains were transferred to the Division of Water. The City also gained tax sharing agreements with each suburb related to commercial entities relocating in or out of the City. The financial impact of the addition of these assets was not included in the financial statements in the year the agreements were finalized and ownership was officially transferred. As a result, the following restatement is necessary:
Water Government-WideEnterprise Fund Business - Type
Net Positon, January 1, 2012 1,032,782$ 1,802,995$Restatement 164,961 164,961Restated Net Position, January 1, 2012 1,197,743$ 1,967,956$
(Amounts in 000's)
In 2012 a departmental reorganization occurred that merged the departments of Public Service with Parks, Recreation and Properties becoming the Department of Public Works. The Office of Capital Projects was created from the Divisions of Architecture, Engineering and Construction and Research, Planning and Development and is reported under General Government. In addition, the Division of Consumer Affairs was merged with Community Development and was moved from General Government. As a result, the following restatements to the special revenue funds are necessary:
Parks General Community Public Recreation Public
Government Development Service and Properties Works Total
Fund balance, January 1, 2012 12,403$ 6,505$ 1,839$ 2,833$ $ 23,580$ Restatement 1,831 8 (1,839) (2,833) 2,833 - Restated Fund balance, January 1, 2012 14,234$ 6,513$ -$ -$ 2,833$ 23,580$
(Amounts in 000's)

114
NOTE 19 – FUND BALANCES / NET POSITION
Fund Balance Classifications: Fund balance is classified in five categories (1) Nonspendable, (2) Restricted, (3) Committed, (4) Assigned and (5) Unassigned. Nonspendable fund balances include amounts that are not in spendable form or are legally required to remain intact. Restricted fund balances include amounts that have external restrictions by either grantors, debt covenants, laws or other governments. Committed fund balances include amounts that are committed to a specific purpose by council ordinance. Assigned fund balances include amounts that have an intended use by the Mayor and/or the Director of Finance to be used for a specific purpose. Unassigned fund balances include amounts that have not been assigned to any purpose. Fund expenditures and encumbrances are from restricted resources to the extent of the restricted fund reserve and followed by committed then assigned and unassigned resources.
Below are the fund balance classifications for the governmental funds at December 31, 2012:
General Other TotalFund Governmental Governmental
Fund BalancesNonspendable
Inventory 632$ 495$ 1,127$ Nonspendable Total 632 495 1,127 Restricted
General Government 20,607 20,607 Public Works 20,123 20,123 Public Safety 6,482 6,482 Community Development 5,847 5,847 Public Health 375 375 Building and Housing 206 206 Economic Development 35,830 35,830 Debt Service 18,059 18,059 Capital Projects 126,303 126,303
Restricted Total - 233,832 233,832 Committed
General Government 7,594 7,594 Public Safety 204 204 Public Works 2,232 2,232 Community Development 1,358 1,358 Public Health 41 41 Economic Development 91,462 91,462 Capital Projects 10 10
Committed Total - 102,901 102,901 Assigned
General Government 4,119 4,119 Public Works 2,547 2,547 Public Safety 1,599 1,599 Public Health 339 339 Building and Housing 424 424 Other 211 211 Debt Service 2 2
Assigned Total 9,239 2 9,241 Unassigned 61,879 61,879
Total Fund Balances 71,750$ 337,230$ 408,980$
(Amounts in 000's)

115
Net Position: Net position represent the difference between assets, deferred outflows, liabilities and deferred inflows. Net investment in capital assets consists of capital assets, net of accumulated depreciation, reduced by the outstanding balances of any borrowings issued to acquire, construct or improve those assets. Net position is reported as restricted when there are limitations imposed on their use either through the enabling legislation adopted by the City or through external restrictions imposed by creditors, grantors or laws or regulations of other governments. The City applies restricted resources when an expense is incurred for purposes for which both restricted and unrestricted net position are available. Net position are restricted for debt service, loans and other purposes. Other purposes include street construction and maintenance, grant programs and debt or capital funding from restricted income tax.
Rainy Day Reserve Fund: The City, in accordance with Section 5705.13(A), Revised Code, has established by ordinance the Rainy Day Reserve Fund (Rainy Day). Rainy Day should accumulate to at least a level equal to two percent of the General Fund expenditures and cannot exceed five percent of the General Fund expenditures. The City funds the Rainy Day through transfers from the General Fund, when funds become available. In order to use the Rainy Day, the City must pass an ordinance. The amount of the Rainy Day is reported within the unassigned fund balance classification in the City’s General Fund.
NOTE 20 – GATEWAY ECONOMIC DEVELOPMENT CORPORATION
In accordance with an agreement with Gateway Economic Development Corporation (Gateway), Gateway is required to reimburse the City for the excess of the debt service requirements of the Parking Facilities Refunding Revenue Bonds attributed to the two Gateway garages over the net revenues generated by the two Gateway garages. In October 2011, the City sold one of the Gateway garages and defeased the applicable bonds. Going forward the amounts required to be reimbursed will be calculated based upon the net revenues of the remaining garage and remaining applicable bonds outstanding.
The first garage on the Gateway site was completed in January 1994. The second garage was completed in August 1994. The third parking facility, Willard Park Garage, was completed in April 1996.
In 2012, net revenues generated by the one remaining Gateway garage was less than the debt service payments attributed to that garage by $1,883,000. Cumulative debt service payments funded by the City that are due from Gateway totaled $45,239,000 at December 31, 2012. Due to the uncertainty of collecting such amounts, an allowance has been recorded to offset the amounts in full; therefore, these amounts do not appear in the accompanying financial statements.
To enhance the security of the bonds issued by the County for the construction of facilities at Gateway, the City has agreed to pledge annually a percentage of admissions taxes on all events held at the arena to pay debt service if other revenue sources are not sufficient. Any exempted admissions tax not required for debt service will be reimbursed to the City. The City’s current admissions tax rate is 8%. For the year ended December 31, 2012, the City pledged $2,057,811.
NOTE 21 – SUBSEQUENT EVENTS
On January 17, 2013, Moody’s Investors Service lowered its rating on Assured Guaranty Municipal Corporation, the insurer of the Series 2006 Parking Facilities Refunding Revenue Bonds. The rating was lowered to A2 from Aa3. The Division’s bonds only carry the insured rating and have no rating on its bonds based solely on its own credit.
On March 21, 2013, the City completed a conversion of its $69,900,000 2010B Certificates of Participation (Cleveland Stadium Project) to a new index rate for a new index rate period. The 2010B COPS were purchased for a period of five years by Wells Fargo Municipal Capital Strategies, LLC as floating rate obligations with the interest reset weekly at a rate 50 basis points lower than the previous index rate.

116
On April 16, 2013, the City entered into a novation agreement with UBS, AG and PNC Bank, National Association (PNC) under which the basis swap associated with the Parking Facilities Refunding Revenue Bonds, Series 2006, was transferred from UBS to PNC effective March 15, 2013. All of the terms of the original basis swap remain the same.
Effective April 24, 2013, the City issued $58,000,000 Airport System Revenue Bonds, Series 2013A (Taxable). These bonds refunded all of the outstanding $58,000,000 Airport System Revenue Bonds, Series 2008F in anticipation of the expiration of the existing letter of credit. The bonds were purchased by U.S. Bank National Association with the City paying an amount equal to one month LIBOR plus a spread of 105 basis points. As a result of this refunding, the City will realize aggregate net present value savings of $3.4 million or 5.87%.
On May 13, 2013, City Council approved legislation authorizing the City to enter into a lease agreement for the purchase of vehicles for various City departments. The City intends to purchase $6.5 million of various police vehicles, heavy duty trucks and other apparatus. Lease payments will be made from the Restricted Income Tax Fund for a period of seven years.
Effective May 30, 2013 the City issued $35,840,000 Subordinate Lien Income Tax Bonds, Series 2013A. The bonds were issued to provide funds for various public facilities, road and bridges, and parks and recreation improvements throughout the City.
Effective May 30, 2013 the City issued $25,360,000 of Taxable Economic and Community Development Refunding Revenue Bonds, Series 2013 (Core City) to refund all of the outstanding $25,360,000 Taxable Economic and Community Development Refunding Revenue Bonds, Series 2008 (Core City). The bonds were purchased by Key Bank for a period of five years.
On June 20, 2013, the City entered into a lease agreement with Huntington Public Capital Corporation for the purchase of $6,500,000 of vehicles and heavy equipment for various departments. The lease will be paid for over seven years out of the receipts for Restricted Income Tax.

117
SUPPLEMENTARYINFORMATION

CITY OF CLEVELAND, OHIO
SCHEDULE OF REVENUES, EXPENDITURES AND CHANGES IN FUNDBALANCE-BUDGET AND ACTUAL (NON-GAAP BUDGETARY BASIS)-
GENERAL FUND-LEGAL APPROPRIATION LEVELFOR THE YEAR ENDED DECEMBER 31, 2012
Variance-Original Final PositiveBudget Budget Actual (Negative)
REVENUES:Income taxes 271,105$ 271,105$ 290,474$ 19,369$Property taxes 36,903 36,903 36,028 (875)State local government funds 34,673 34,673 34,673 -Other taxes and shared revenues 40,472 40,472 46,929 6,457Licenses and permits 11,785 11,785 12,372 587Charges for services 29,994 29,994 33,837 3,843Fines, forfeits and settlements 22,737 22,737 21,626 (1,111)Investment earnings 130 130 250 120Grants 5,943 5,943 5,464 (479)Miscellaneous 18,264 18,264 19,365 1,101
TOTAL REVENUES 472,006 472,006 501,018 29,012
EXPENDITURES:Current:
General Government:Council and clerk of council:
Personnel 4,862 4,862 4,789 73Other 1,665 1,665 1,529 136 Total council and clerk of council 6,527 6,527 6,318 209
Municipal court-judicial division:Personnel 18,191 18,191 17,372 819Other 2,743 2,568 2,554 14 Total municipal court-judicial division 20,934 20,759 19,926 833
Municipal court-clerks division:Personnel 8,704 8,604 8,449 155Other 5,349 5,449 5,364 85 Total municipal court-clerks division 14,053 14,053 13,813 240
Municipal court-housing division:Personnel 3,019 3,019 2,831 188Other 140 140 140 - Total municipal court-housing division 3,159 3,159 2,971 188
Office of the mayor:Personnel 2,305 2,305 2,139 166Other 134 134 99 35 Total office of the mayor 2,439 2,439 2,238 201
Office of capital projects:Personnel 3,745 3,752 3,709 43Other 541 534 405 129 Total office of capital projects 4,286 4,286 4,114 172
(Continued)
(Amounts in 000's)
118

CITY OF CLEVELAND, OHIO
SCHEDULE OF REVENUES, EXPENDITURES AND CHANGES IN FUNDBALANCE-BUDGET AND ACTUAL (NON-GAAP BUDGETARY BASIS)-
GENERAL FUND-LEGAL APPROPRIATION LEVELFOR THE YEAR ENDED DECEMBER 31, 2012
Variance-Original Final PositiveBudget Budget Actual (Negative)
Landmarks commission:Personnel 179$ 179$ 176$ 3$ Other 55 55 54 1
Total landmarks commission 234 234 230 4
Board of building standards and appeals:Personnel 113 113 108 5Other 13 13 9 4
Total board of building standards and appeals 126 126 117 9
Board of zoning appeals:Personnel 194 194 189 5Other 15 15 13 2
Total board of zoning appeals 209 209 202 7
Civil service commission:Personnel 571 571 557 14Other 391 391 307 84
Total civil service commission 962 962 864 98
Community relations board:Personnel 1,127 1,127 1,101 26Other 63 73 55 18
Total community relations board 1,190 1,200 1,156 44
City planning commission:Personnel 1,425 1,425 1,331 94Other 99 99 92 7
Total city planning commission 1,524 1,524 1,423 101
Boxing and wrestling commission:Personnel 8 8 6 2
Total boxing and wrestling commission 8 8 6 2
Office of equal opportunity:Personnel 446 473 467 6Other 22 22 19 3
Total office of equal opportunity 468 495 486 9
Office of budget and management:Personnel 879 879 650 229Other 16 29 19 10
Total office of budget and management 895 908 669 239
(Continued)
(Amounts in 000's)
119

CITY OF CLEVELAND, OHIO
SCHEDULE OF REVENUES, EXPENDITURES AND CHANGES IN FUNDBALANCE-BUDGET AND ACTUAL (NON-GAAP BUDGETARY BASIS)-
GENERAL FUND-LEGAL APPROPRIATION LEVELFOR THE YEAR ENDED DECEMBER 31, 2012
Variance-Original Final PositiveBudget Budget Actual (Negative)
Department of aging:Personnel 746$ 746$ 630$ 116$Other 149 149 139 10
Total department of aging 895 895 769 126
Office of personnel:Personnel 1,281 1,281 1,234 47Other 695 695 667 28
Total department of personnel 1,976 1,976 1,901 75
Department of law:Personnel 6,335 5,835 5,741 94Other 2,878 3,578 3,302 276
Total department of law 9,213 9,413 9,043 370
Finance administration:Personnel 818 818 791 27Other 37 37 29 8
Total finance administration 855 855 820 35
Division of accounts:Personnel 1,255 1,255 1,211 44Other 662 662 612 50
Total division of accounts 1,917 1,917 1,823 94
Division of assessments and licenses:Personnel 2,241 2,241 1,986 255Other 2,291 2,381 1,844 537
Total division of assessments and licenses 4,532 4,622 3,830 792
Division of treasury:Personnel 468 468 463 5Other 93 93 89 4
Total division of treasury 561 561 552 9
Division of purchases and supplies:Personnel 563 563 521 42Other 39 39 33 6
Total division of purchases and supplies 602 602 554 48
Bureau of internal audit:Personnel 547 547 395 152Other 438 438 211 227
Total bureau of internal audit 985 985 606 379
(Continued)
(Amounts in 000's)
120

CITY OF CLEVELAND, OHIO
SCHEDULE OF REVENUES, EXPENDITURES AND CHANGES IN FUNDBALANCE-BUDGET AND ACTUAL (NON-GAAP BUDGETARY BASIS)-
GENERAL FUND-LEGAL APPROPRIATION LEVELFOR THE YEAR ENDED DECEMBER 31, 2012
Variance-Original Final PositiveBudget Budget Actual (Negative)
Division of financial reporting and control:Personnel 1,213$ 1,213$ 1,055$ 158$ Other 27 27 17 10
1,240 1,240 1,072 168
Division of information system services:Personnel 1,779 1,779 1,387 392Other 1,811 1,811 1,414 397
3,590 3,590 2,801 789
Office of IT planning:Personnel 164 164 163 1Other 6 6 3 3
170 170 166 4
Division of harbors:Personnel 105 105 26 79
105 105 26 79
TOTAL GENERAL GOVERNMENT 83,655 83,820 78,496 5,324
Public Health:Public health administration:
Personnel 582 607 576 31Other 314 314 311 3
896 921 887 34
Division of health:Personnel 1,805 1,830 1,721 109Other 1,257 1,557 1,452 105
3,062 3,387 3,173 214
Division of environment:Personnel 805 805 753 52Other 147 150 147 3
952 955 900 55
Division of air quality:Personnel 108 109 109 - Other 281 281 277 4
389 390 386 4
TOTAL PUBLIC HEALTH 5,299 5,653 5,346 307
(Continued)
Total division of health
Total division of information system services
Total division of harbors
(Amounts in 000's)
Total division of environment
Total division of air quality
Total division of financial reporting and control
Total office of IT planning
Total public health administration
121

CITY OF CLEVELAND, OHIO
SCHEDULE OF REVENUES, EXPENDITURES AND CHANGES IN FUNDBALANCE-BUDGET AND ACTUAL (NON-GAAP BUDGETARY BASIS)-
GENERAL FUND-LEGAL APPROPRIATION LEVELFOR THE YEAR ENDED DECEMBER 31, 2012
Variance-Original Final PositiveBudget Budget Actual (Negative)
Public Safety:Public safety administration:
Personnel 2,720$ 2,720$ 2,279$ 441$ Other 1,160 1,335 1,275 60
Total public safety administration 3,880 4,055 3,554 501
Division of police:Personnel 161,968 163,218 162,462 756 Other 10,065 10,065 9,513 552
Total division of police 172,033 173,283 171,975 1,308
Division of fire:Personnel 82,307 81,307 81,069 238 Other 3,357 3,357 3,220 137
Total division of fire 85,664 84,664 84,289 375
Division of emergency medical services:Personnel 19,321 18,773 18,086 687 Other 2,604 2,727 2,584 143
Total division of emergency medical services 21,925 21,500 20,670 830
Division of animal control services:Personnel 891 891 885 6 Other 369 369 291 78
Total division of animal control services 1,260 1,260 1,176 84
Division of correction:Personnel 10,589 10,589 10,024 565 Other 4,058 4,058 3,058 1,000
Total division correction 14,647 14,647 13,082 1,565
TOTAL PUBLIC SAFETY 299,409 299,409 294,746 4,663
(Continued)
(Amounts in 000's)
122

CITY OF CLEVELAND, OHIO
SCHEDULE OF REVENUES, EXPENDITURES AND CHANGES IN FUNDBALANCE-BUDGET AND ACTUAL (NON-GAAP BUDGETARY BASIS)-
GENERAL FUND-LEGAL APPROPRIATION LEVELFOR THE YEAR ENDED DECEMBER 31, 2012
Variance-Original Final PositiveBudget Budget Actual (Negative)
Public Works:Division of public works administration:
Personnel 2,667$ 2,612$ 2,458$ 154$ Other 151 206 200 6
Total division of public works administration 2,818 2,818 2,658 160
Division of recreation:Personnel 8,426 8,426 7,995 431Other 3,887 4,112 3,846 266
Total division of recreation 12,313 12,538 11,841 697
Division of parking facilities:Personnel 1,197 1,197 1,097 100Other 54 127 79 48
Total division of parking facilities 1,251 1,324 1,176 148
Division of property management:Personnel 5,482 5,482 5,049 433Other 3,112 3,112 2,889 223
Total division of property management 8,594 8,594 7,938 656
Division of park maintenance and properties:Personnel 8,063 8,063 7,761 302Other 4,859 4,954 4,861 93
Total division of park maintenance and properties 12,922 13,017 12,622 395
Division of waste collection and disposal:Personnel 13,892 13,892 12,894 998Other 11,412 11,412 11,348 64
Total division of waste collection and disposal 25,304 25,304 24,242 1,062
Division of traffic engineering:Personnel 2,742 2,742 2,639 103Other 822 822 732 90
Total division of traffic engineering 3,564 3,564 3,371 193
TOTAL PUBLIC WORKS 66,766 67,159 63,848 3,311
(Continued)
(Amounts in 000's)
123

CITY OF CLEVELAND, OHIO
SCHEDULE OF REVENUES, EXPENDITURES AND CHANGES IN FUNDBALANCE-BUDGET AND ACTUAL (NON-GAAP BUDGETARY BASIS)-
GENERAL FUND-LEGAL APPROPRIATION LEVELFOR THE YEAR ENDED DECEMBER 31, 2012
Variance-Original Final PositiveBudget Budget Actual (Negative)
Community Development:Director's office:
Personnel 252$ 252$ 139$ 113$Other 19 19 9 10
Total director's office 271 271 148 123
TOTAL COMMUNITY DEVELOPMENT 271 271 148 123
Building and Housing:Director's office:
Personnel 1,514 1,514 1,492 22Other 480 495 483 12
Total director's office 1,994 2,009 1,975 34
Division of code enforcement:Personnel 5,747 5,747 4,539 1,208Other 594 594 593 1
Total division of code enforcement 6,341 6,341 5,132 1,209
Division of construction permitting:Personnel 1,471 1,471 1,194 277Other 16 16 16 -
Total division of construction permitting 1,487 1,487 1,210 277
TOTAL BUILDING AND HOUSING 9,822 9,837 8,317 1,520
Economic Development:Economic development administration:
Personnel 1,504 1,504 1,396 108Other 21 21 17 4
Total economic development administration 1,525 1,525 1,413 112
TOTAL ECONOMIC DEVELOPMENT 1,525 1,525 1,413 112
Non-Departmental Expenditures:Other 19,436 19,541 16,229 3,312
TOTAL NON-DEPARTMENTAL EXPENDITURES 19,436 19,541 16,229 3,312
TOTAL EXPENDITURES 486,183 487,215 468,543 18,672
(Continued)
(Amounts in 000's)
124

CITY OF CLEVELAND, OHIO
SCHEDULE OF REVENUES, EXPENDITURES AND CHANGES IN FUNDBALANCE-BUDGET AND ACTUAL (NON-GAAP BUDGETARY BASIS)-
GENERAL FUND-LEGAL APPROPRIATION LEVELFOR THE YEAR ENDED DECEMBER 31, 2012
Variance-Original Final PositiveBudget Budget Actual (Negative)
EXCESS (DEFICIENCY) OF REVENUESOVER (UNDER) EXPENDITURES (14,177) (15,209) 32,475 47,684
OTHER FINANCING SOURCES (USES):Transfers in 18,218 18,218 16,981 (1,237)Transfers out (20,873) (19,841) (17,941) 1,900Sale of City assets 2 2
TOTAL OTHER FINANCING SOURCES (USES) (2,655) (1,623) (958) 665
DECERTIFICATION OF PRIOR YEARENCUMBRANCES AND PRE-ENCUMBRANCES 2,181 2,181
NET CHANGE IN FUND BALANCES (16,832) (16,832) 33,698 50,530
FUND BALANCES AT BEGINNING OF YEAR 16,861 16,861 16,861 -
FUND BALANCES AT END OF YEAR 29$ 29$ 50,559$ 50,530$
(Concluded)
(Amounts in 000's)
125

126
This Page Intentionally Left Blank.

127
CITY OF CLEVELAND, OHIO
NONMAJOR GOVERNMENTAL FUNDS
SPECIAL REVENUE FUNDS
Special Revenue Funds are used to account for specific revenues that are legally restricted or committed by the City to expenditures for particular purposes. The City’s Special Revenue Funds are described below:
Division of Streets To account for motor vehicle license tax and gasoline excise tax used for the repair and building of streets.
Restricted Income Tax To account for one-ninth of the City’s income tax collections. Monies are to be used for capital improvement purposes and repayment of debt.
Cleveland Stadium Operations To account for the operating activities of Cleveland Browns Stadium.
Community Development Block Grants To account for revenue from the federal government and expenditures as prescribed under the Community Development Block Grant Program.
Community Development Funds To account for revenue earmarked for City-wide development.
Building and Housing Funds To account for revenue earmarked to administer and enforce the provisions of the Cleveland building, housing and zoning codes plus the national electrical code and state building, plumbing and elevator codes.
Urban Development Action Funds To account for revenue from the federal government under the Urban Development Action Grant Program.
Economic Development Funds To account for revenue earmarked to revitalize distressed cities by stimulating economic development.
Home Weatherization Grants To account for revenue from the State of Ohio and expenditures as prescribed under the Home Weatherization Assistance Program.
Work Force Investment Act Grants (WIA) To account for revenue and expenditures from the State of Ohio under the Work Force Investment Act.
General Government Funds To account for revenue earmarked for general government activities. Public Works Funds To account for revenue earmarked for the public works activity.
Public Safety Funds To account for revenue earmarked for public safety activities.

128
SPECIAL REVENUE FUNDS (Continued)
Public Health Funds To account for revenue earmarked for the improvement of public health.
Cleveland Stadium Debt Service Fund To account for the accumulation of resources earmarked for the repayment of debt related to Cleveland Browns Stadium.
Gateway Shared Income Tax Funds To account for municipal income tax revenue derived from persons employed at the Arena and Progressive Field with 50% of the revenues shared with the other taxing districts in the City.
Neighborhood Development Investment Fund To account for revenue earmarked for the Neighborhood Development Investment Fund.
Core City Program Funds To account for revenue earmarked for certain economic and community development projects.
Supplemental Empowerment Zone To account for revenue from the U.S. Department of Housing and Urban Development Program designed to help rebuild specified urban communities.
SPECIAL REVENUE FUNDS (for budgetary purposes only) These funds are rolled into the General Fund for Modified Accrual Financial Statements.
Rainy Day Reserve Fund To account for revenue which is eligible to be used during significant periods of economic downturn.
Schools Recreation and Cultural To account for revenue from special taxes earmarked for Activities Fund Cleveland Municipal Schools for recreation and cultural activities.
DEBT SERVICE FUNDS
Debt Service Funds are used to account for the accumulation of financial resources for, and the payment of, general long-term debt principal, interest and related costs. The City’s Debt Service Funds are described below:
Unvoted Tax Supported Obligations Fund To account for the accumulation of resources for the payment of General Obligation Bonds of the City. These bonds do not require a vote of the electors, other than self- supporting obligations. They are payable from ad valorem property taxes levied within the limitations provided by law.
Stadium Bond Fund To account for the accumulation of resources for the payment of the Certificates of Participation (COPS) - Stadium from pledged City taxes.
Subordinated Income Tax Fund To account for the accumulation of resources for the payment of Subordinated Income Tax Variable Rate Refunding Bonds payable from pledged income taxes.

129
DEBT SERVICE FUNDS (Continued)
Lower Euclid Avenue TIF To account for the accumulation of resources for the payment of Economic Development Bonds payable from tax increment financing revenues and a pledge of the non-tax revenue of the City.
Core City Bonds To account for the accumulation of resources for the payment of taxable Economic and Community Development Bonds payable from non-tax and net project revenues.
Subordinate Lien Income Tax Fund To account for the accumulation of resources for the payment of Subordinate Lien Income Tax Bonds payable from pledged income taxes.
Urban Renewal Fund To account for the accumulation of resources for the payment of tax increment Urban Renewal Bonds payable from deposits made in lieu of taxes.
Urban Renewal Reserve Fund The account is to be maintained at an amount equal to one year’s maximum annual debt service on certain Urban Renewal Bonds and can be used to cover any debt insufficiency payable from certain urban renewal bonds.
CAPITAL PROJECT FUNDS
Capital Project Funds are used to account for financial resources to be used for the acquisition or construction of major capital facilities (other than those financed by proprietary funds). The City’s Capital Project Funds are described below:
Capital/Urban Renewal Bond Construction To account for all bond proceeds and capital projects costs of bond–funded capital acquisitions, tax increment Urban Renewal Bond issues and construction within the City.
Grant Improvement To account for capital grant revenues which fund Capital Improvement Projects within the City.
Capital Improvement To account for miscellaneous revenues which fund capital projects.
Certificates of Participation/Capital Leases To account for Certificates of Participation (COPS) and capital lease proceeds which fund certain capital funds.
Cleveland Stadium Construction To account for bond proceeds and capital projects costs of the Cleveland Browns Stadium.

Special Revenue Funds - Budgeted
Cleveland TotalDivision Restricted Stadium Budgeted
of Streets Income Tax Operations Funds
ASSETSCash and cash equivalents 1,384$ 213$ 4,792$ 6,389$ Receivables:
Taxes 5,562 5,562 Grants - Loans - Accrued interest - Assessments -
Receivables, net - 5,562 - 5,562
Due from other funds 21 8,901 8,922 Due from other governments 6,314 6,314 Inventory of supplies 495 495
TOTAL ASSETS 8,214$ 14,676$ 4,792$ 27,682$
LIABILITIESAccounts payable 202$ 179$ $ 381$ Accrued wages and benefits 1,716 1,716 Due to other governments 323 323 Deferred revenue 4,338 1,938 6,276 Unearned revenue - Due to other funds 599 80 679
Total liabilities 6,855 2,197 323 9,375
FUND BALANCESReserves for:Nonspendable 495 495 Restricted 864 12,479 4,469 17,812 Committed - Assigned -
Total fund balances 1,359 12,479 4,469 18,307
TOTAL LIABILITIES AND FUND BALANCES 8,214$ 14,676$ 4,792$ 27,682$
CITY OF CLEVELAND, OHIO
DECEMBER 31, 2012COMBINING BALANCE SHEET-NONMAJOR GOVERNMENTAL FUNDS
(Amounts in 000's)
130
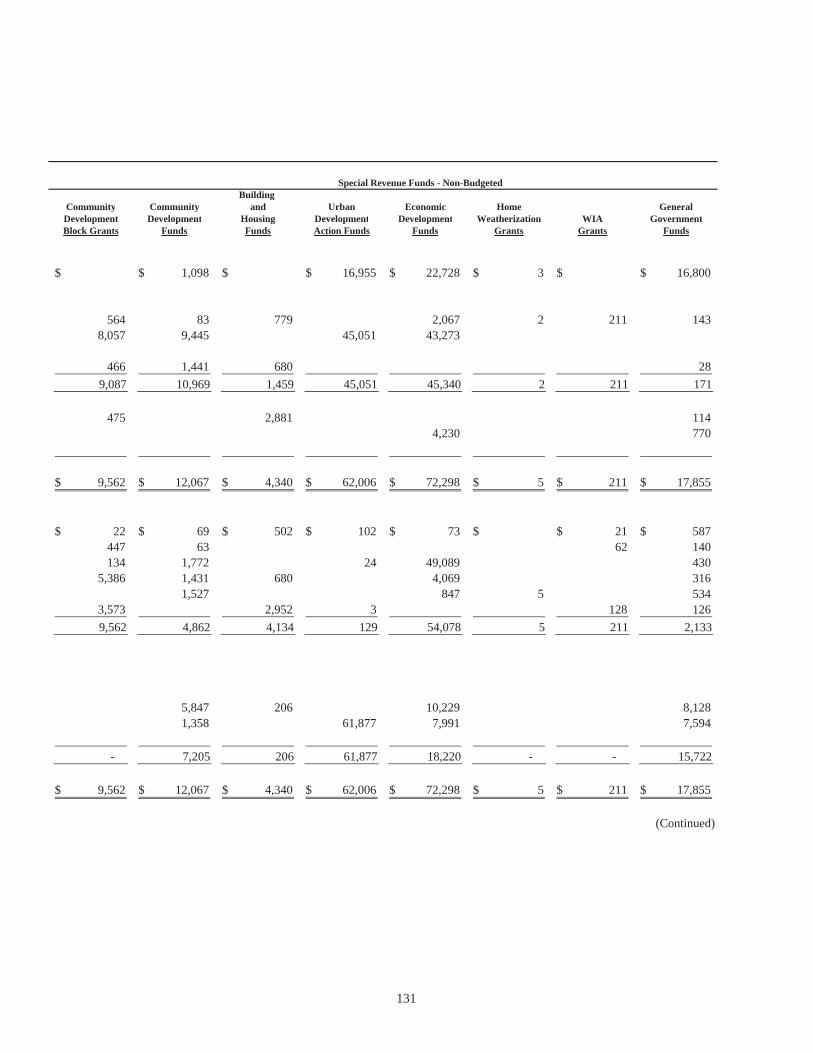
Special Revenue Funds - Non-BudgetedBuilding
Community Community and Urban Economic Home GeneralDevelopment Development Housing Development Development Weatherization WIA GovernmentBlock Grants Funds Funds Action Funds Funds Grants Grants Funds
$ 1,098$ $ 16,955$ 22,728$ 3$ $ 16,800$
564 83 779 2,067 2 211 143 8,057 9,445 45,051 43,273
466 1,441 680 289,087 10,969 1,459 45,051 45,340 2 211 171
475 2,881 114 4,230 770
9,562$ 12,067$ 4,340$ 62,006$ 72,298$ 5$ 211$ 17,855$
22$ 69$ 502$ 102$ 73$ $ 21$ 587$ 447 63 62 140 134 1,772 24 49,089 430
5,386 1,431 680 4,069 316 1,527 847 5 534
3,573 2,952 3 128 1269,562 4,862 4,134 129 54,078 5 211 2,133
5,847 206 10,229 8,128 1,358 61,877 7,991 7,594
- 7,205 206 61,877 18,220 - - 15,722
9,562$ 12,067$ 4,340$ 62,006$ 72,298$ 5$ 211$ 17,855$
(Continued)
131
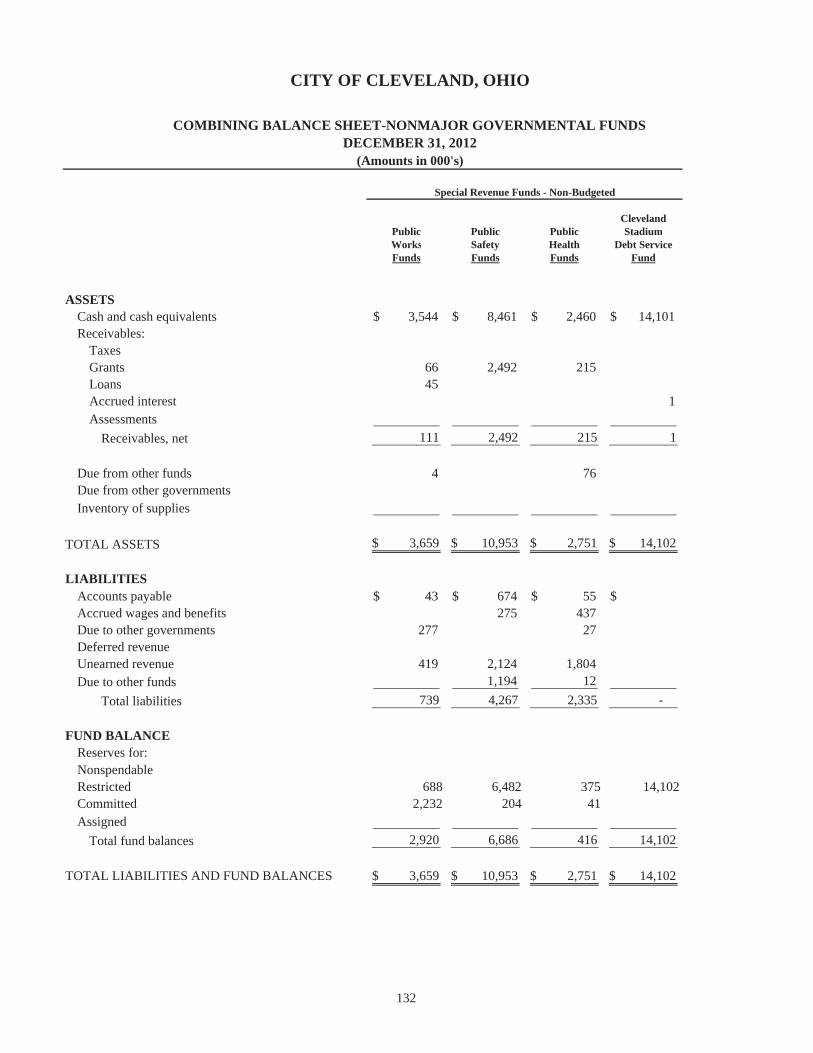
ClevelandPublic Public Public StadiumWorks Safety Health Debt ServiceFunds Funds Funds Fund
ASSETSCash and cash equivalents 3,544$ 8,461$ 2,460$ 14,101$ Receivables:
TaxesGrants 66 2,492 215 Loans 45 Accrued interest 1 Assessments
Receivables, net 111 2,492 215 1
Due from other funds 4 76 Due from other governmentsInventory of supplies
TOTAL ASSETS 3,659$ 10,953$ 2,751$ 14,102$
LIABILITIESAccounts payable 43$ 674$ 55$ $ Accrued wages and benefits 275 437 Due to other governments 277 27 Deferred revenueUnearned revenue 419 2,124 1,804 Due to other funds 1,194 12
Total liabilities 739 4,267 2,335 -
FUND BALANCEReserves for:NonspendableRestricted 688 6,482 375 14,102Committed 2,232 204 41Assigned
Total fund balances 2,920 6,686 416 14,102
TOTAL LIABILITIES AND FUND BALANCES 3,659$ 10,953$ 2,751$ 14,102$
Special Revenue Funds - Non-Budgeted
CITY OF CLEVELAND, OHIO
COMBINING BALANCE SHEET-NONMAJOR GOVERNMENTAL FUNDSDECEMBER 31, 2012
(Amounts in 000's)
132

Gateway Neighborhood Total Shared Development Core City Supplemental Total Special
Income Tax Investment Program Empowerment Non-Budgeted RevenueFunds Fund Funds Zone Funds Funds
1,229$ 4,586$ 2,045$ 1,509$ 95,519$ 101,908$
- 5,562 6,622 6,622
17,008 23,556 44,425 190,860 190,860 1 1
2,615 2,615- 17,008 23,556 44,425 200,098 205,660
3,550 12,472 398 5,398 11,712
- 495
1,627$ 21,594$ 25,601$ 45,934$ 304,565$ 332,247$
$ $ $ $ 2,148$ 2,529$ 1,424 3,140
813 45,047 97,613 97,936 11,882 18,158
887 8,147 8,147 814 8,802 9,481
1,627 - - 45,934 130,016 139,391
- 495 25,601 71,658 89,470
21,594 102,891 102,891 - -
- 21,594 25,601 - 174,549 192,856
1,627$ 21,594$ 25,601$ 45,934$ 304,565$ 332,247$
(Continued)
Special Revenue Funds - Non-Budgeted
133

Unvoted Tax LowerSupported Stadium Subordinated EuclidObligations Bond Income Tax Avenue
Fund Fund Fund TIF
ASSETSCash and cash equivalents 2,555$ 2$ 2,511$ 361$ Investments 3,661 Receivables:
Taxes 29,447 GrantsLoansAccrued interestAssessments
Receivables, net 29,447 - - -
Due from other fundsDue from other governments 1,778 Inventory of supplies
TOTAL ASSETS 37,441$ 2$ 2,511$ 361$
LIABILITIESAccounts payable $ $ $ $ Accrued wages and benefitsDue to other governmentsDeferred revenue 31,225 Unearned revenueDue to other funds
Total liabilities 31,225 - - -
FUND BALANCEReserves for:NonspendableRestricted 6,216 2,511 361 CommittedAssigned 2
Total fund balances 6,216 2 2,511 361
TOTAL LIABILITIES AND FUND BALANCES 37,441$ 2$ 2,511$ 361$
CITY OF CLEVELAND, OHIO
COMBINING BALANCE SHEET-NONMAJOR GOVERNMENTAL FUNDSDECEMBER 31, 2012
(Amounts in 000's)
Debt Service Funds - Budgeted
134
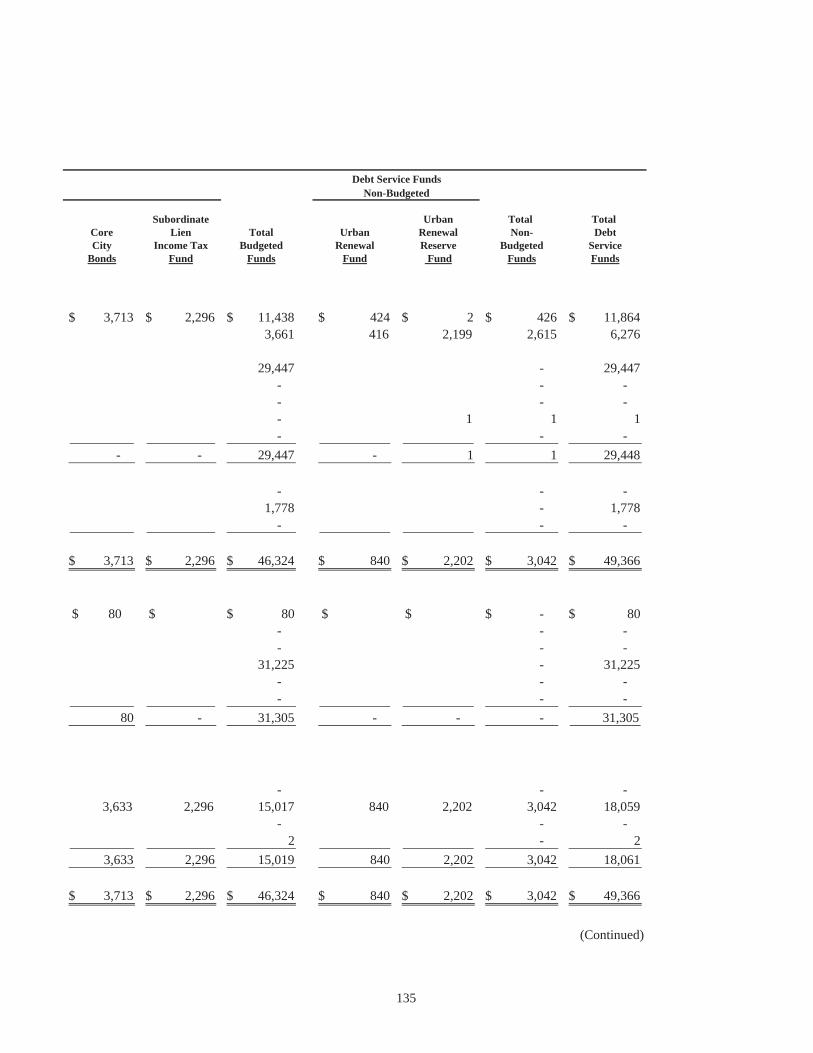
Subordinate Urban Total Total Core Lien Total Urban Renewal Non- DebtCity Income Tax Budgeted Renewal Reserve Budgeted Service
Bonds Fund Funds Fund Fund Funds Funds
3,713$ 2,296$ 11,438$ 424$ 2$ 426$ 11,864$ 3,661 416 2,199 2,615 6,276
29,447 - 29,447 - - - - - - - 1 1 1
- - -- - 29,447 - 1 1 29,448
- - - 1,778 - 1,778
- - -
3,713$ 2,296$ 46,324$ 840$ 2,202$ 3,042$ 49,366$
80$ $ 80$ $ $ -$ 80$ - - - - - -
31,225 - 31,225 - - -
- - -80 - 31,305 - - - 31,305
- - - 3,633 2,296 15,017 840 2,202 3,042 18,059
- - - 2 - 2
3,633 2,296 15,019 840 2,202 3,042 18,061
3,713$ 2,296$ 46,324$ 840$ 2,202$ 3,042$ 49,366$
(Continued)
Debt Service FundsNon-Budgeted
135

Capital/Urban
RenewalBond Grant Capital
Construction Improvement Improvement
ASSETSCash and cash equivalents 115,825$ $ 7,111$ InvestmentsReceivables:
TaxesGrants 5,836LoansAccrued interest 2Assessments
Receivables, net 2 5,836 -
Due from other fundsDue from other governmentsInventory of supplies
TOTAL ASSETS 115,827$ 5,836$ 7,111$
LIABILITIESAccounts payable 1,814$ 15$ 4,184$ Accrued wages and benefitsDue to other governments 550Deferred revenue 119Unearned revenue 2 Due to other funds 5,702
Total liabilities 2,364 5,836 4,186
FUND BALANCEReserve for:NonspendableRestricted 113,463 2,915 Committed 10 Assigned
Total fund balances 113,463 - 2,925
TOTAL LIABILITIES AND FUND BALANCES 115,827$ 5,836$ 7,111$
Non-BudgetedCapital Projects Funds
CITY OF CLEVELAND, OHIO
COMBINING BALANCE SHEET-NONMAJOR GOVERNMENTAL FUNDSDECEMBER 31, 2012
(Amounts in 000's)
136

Certificatesof Total Total
Participation/ Cleveland Capital NonmajorCapital Stadium Projects GovernmentalLeases Construction Funds Funds
3,135$ 3,682$ 129,753$ 243,525$3,246 3,246 9,522
0- 35,009
5,836 12,458- 190,860
2 4 - 2,615
- - 5,838 240,946
- 12,472- 13,490
- 495
6,381$ 3,682$ 138,837$ 520,450$
138$ $ 6,151$ 8,760$- 3,140550 98,486119 49,502
2 8,149 5,702 15,183
138 - 12,524 183,220
- 4956,243 3,682 126,303 233,832
10 102,901 - 2
6,243 3,682 126,313 337,230
6,381$ 3,682$ 138,837$ 520,450$
(Concluded)
137

Cleveland TotalDivision Restricted Stadium Budgeted
of Streets Income Tax Operations Funds
REVENUES:Income taxes $ 36,470$ $ 36,470$Property taxes -Other taxes and shared revenues 12,970 13,571 26,541Licenses and permits 1,263 1,263Charges for services 22 250 272Fines, forfeits and settlements -Investment earnings 1 16 6 23Grants -Contributions -Miscellaneous -
Total revenues 14,256 36,486 13,827 64,569
EXPENDITURES:Current:
General Government -Public Works 19,910 448 20,358Public Safety -Community Development -Building and Housing -Public Health -Economic Development -
Capital outlay 4,000 4,000Debt service:
Principal retirement 3,729 3,729Interest 1,077 1,077General Government -Other 1,150 1,150 Total expenditures 19,910 9,956 448 30,314
EXCESS (DEFICIENCY) OF REVENUESOVER (UNDER) EXPENDITURES (5,654) 26,530 13,379 34,255
OTHER FINANCING SOURCES (USES):Transfers in 5,327 5,327Transfers out (25,926) (8,814) (34,740)Issuance of debt -Premium on bonds -Discount on bonds -Payment to refund bonds -Sale of City assets -Proceeds from capital lease -
Total other financing sources (uses) 5,327 (25,926) (8,814) (29,413)
NET CHANGE IN FUND BALANCES (327) 604 4,565 4,842
FUND BALANCES AT BEGINNING OF YEAR (as restated) 1,686 11,875 (96) 13,465
FUND BALANCES AT END OF YEAR 1,359$ 12,479$ 4,469$ 18,307$
CITY OF CLEVELAND, OHIO
COMBINING STATEMENT OF REVENUES, EXPENDITURES AND CHANGESIN FUND BALANCES-NONMAJOR GOVERNMENTAL FUNDS
YEAR ENDED DECEMBER 31, 2012(Amounts in 000's)
Special Revenue Funds - Budgeted
138

BuildingCommunity Community and Urban Economic Home General
Development Development Housing Development Development Weatherization WIA GovernmentBlock Grants Funds Funds Action Funds Funds Grants Grants Funds
$ $ $ $ $ $ $ $
3,082 901
4,775 517 1,6423,247
1 10 2122,798 33,748 6,706 5,811 6,890 1,952 1,424
191,044 206 147 172
28,617 34,266 6,912 147 9,075 6,890 1,952 7,254
1,952 6,108
28,617 33,574 6,8906,706
1,570 8,83326 952 25
28,617 33,574 6,706 1,596 9,785 6,890 1,952 6,133
- 692 206 (1,449) (710) - - 1,121
367(1,276) (2,718)
85
- - - (1,276) (2,633) - - 367
- 692 206 (2,725) (3,343) - - 1,488
6,513 64,602 21,563 14,234
-$ 7,205$ 206$ 61,877$ 18,220$ -$ -$ 15,722$
(Continued)
Special Revenue Funds - Non-Budgeted
139

ClevelandPublic Public Public StadiumWorks Safety Health Debt ServiceFunds Funds Funds Fund
REVENUES:Income taxes $ $ $ $ Property taxesOther taxes and shared revenuesLicenses and permits 73 1,420Charges for servicesFines, forfeits and settlements 2,132Investment earnings 3 13 1 22Grants 1,721 8,069 10,321Contributions 15Miscellaneous 63 20 5
Total revenues 1,860 10,249 11,747 22
EXPENDITURES:Current:
General GovernmentPublic Works 1,773Public Safety 8,812Community DevelopmentBuilding and HousingPublic Health 11,660Economic Development
Capital outlayDebt service:
Principal retirement 5,942Interest 6,410General GovernmentOther Total expenditures 1,773 8,812 11,660 12,352
EXCESS (DEFICIENCY) OF REVENUESOVER (UNDER) EXPENDITURES 87 1,437 87 (12,330)
OTHER FINANCING SOURCES (USES):Transfers in 3,814Transfers outIssuance of debtPremium on bondsDiscount on bondsPayment to refund bondsSale of City assetsProceeds from capital lease
Total other financing sources (uses) - - - 3,814
NET CHANGE IN FUND BALANCES 87 1,437 87 (8,516)
FUND BALANCES AT BEGINNING OF YEAR (as restated) 2,833 5,249 329 22,618
FUND BALANCES AT END OF YEAR 2,920$ 6,686$ 416$ 14,102$
CITY OF CLEVELAND, OHIO
COMBINING STATEMENT OF REVENUES, EXPENDITURES AND CHANGESIN FUND BALANCES-NONMAJOR GOVERNMENTAL FUNDS
YEAR ENDED DECEMBER 31, 2012(Amounts in 000's)
Special Revenue Funds - Non-Budgeted
140

Gateway Neighborhood Total Total Shared Development Core City Supplemental Non- Special
Income Tax Investment Program Empowerment Budgeted RevenueFunds Fund Funds Zone Funds Funds
$ $ $ $ -$ 36,470$- -
86 4,069 30,6101,493 2,7566,934 7,2065,379 5,379
7 3 81 10445 99,485 99,485
34 34 797 4,330 6,784 6,78486 804 4,333 45 124,259 188,828
86 8,146 8,1461,773 22,1318,812 8,812
69,081 69,0816,706 6,706
11,660 11,660751 188 45 11,387 11,387
1,003 5,003
5,942 9,6716,410 7,487
- - - 1,150
86 751 188 45 130,920 161,234
- 53 4,145 - (6,661) 27,594
4,181 9,508(1,554) (5,548) (40,288)
- -- -- -- -
237 322 322 - -
- - (1,317) - (1,045) (30,458)
- 53 2,828 - (7,706) (2,864)
21,541 22,773 182,255 195,720
-$ 21,594$ 25,601$ -$ 174,549$ 192,856$
(Continued)
Special Revenue Funds - Non-Budgeted
141

Unvoted Tax Lower Supported Stadium Subordinated EuclidObligations Bond Income Tax Avenue Core City
Fund Fund Fund TIF Bonds
REVENUES:Income taxes $ $ $ $ $ Property taxes 19,284Other taxes and shared revenues 4,985Licenses and permitsCharges for servicesFines, forfeits and settlementsInvestment earnings 13 1 3 1GrantsContributionsMiscellaneous
Total revenues 24,282 1 3 - 1
EXPENDITURES:Current:
General GovernmentPublic WorksPublic SafetyCommunity DevelopmentBuilding and HousingPublic HealthEconomic Development
Capital outlayDebt service:
Principal retirement 28,815 1,090 2,955 167 1,440Interest 15,155 541 2,647 118 790General Government 360Other Total expenditures 43,970 1,631 5,602 285 2,590
EXCESS (DEFICIENCY) OF REVENUESOVER (UNDER) EXPENDITURES (19,688) (1,630) (5,599) (285) (2,589)
OTHER FINANCING SOURCES (USES):Transfers in 24,416 1,631 5,677 391 2,329Transfers outIssuance of debtPremium on bondsDiscount on bondsPayment to refund bondsSale of City assetsProceeds from capital lease
Total other financing sources (uses) 24,416 1,631 5,677 391 2,329
NET CHANGE IN FUND BALANCES 4,728 1 78 106 (260)
FUND BALANCES AT BEGINNING OF YEAR (as restated) 1,488 1 2,433 255 3,893
FUND BALANCES AT END OF YEAR 6,216$ 2$ 2,511$ 361$ 3,633$
CITY OF CLEVELAND, OHIO
COMBINING STATEMENT OF REVENUES, EXPENDITURES AND CHANGESIN FUND BALANCES-NONMAJOR GOVERNMENTAL FUNDS
YEAR ENDED DECEMBER 31, 2012(Amounts in 000's)
Debt Service Funds - Budgeted
142

Debt Service Funds Non-Budgeted
Subordinate UrbanLien Total Urban Renewal Non- Total
Income Tax Budgeted Renewal Reserve Budgeted Debt ServiceFund Funds Fund Fund Funds Funds
$ -$ $ $ -$ -$19,284 - 19,2844,985 - 4,985
- - -- - -- - -
3 21 1 2 3 24- - -- - -
546 546 983 983 1,529549 24,836 984 2 986 25,822
- - -- - -- - -- - -- - -- - -- - -- - -
3,305 37,772 565 565 38,3373,676 22,927 307 307 23,234
360 85 85 445 - - -
6,981 61,059 957 - 957 62,016
(6,432) (36,223) 27 2 29 (36,194)
6,426 40,870 - 40,870- - -- - -- - -- - -- - -- - -
- - -6,426 40,870 - - - 40,870
(6) 4,647 27 2 29 4,676
2,302 10,372 813 2,200 3,013 13,385
2,296$ 15,019$ 840$ 2,202$ 3,042$ 18,061$
(Continued)143

Capital/Urban
RenewalBond Grant Capital
Construction Improvement ImprovementREVENUES:
Income taxes $ $ $ Property taxesOther taxes and shared revenuesLicenses and permitsCharges for servicesFines, forfeits and settlementsInvestment earnings 46 4Grants 24,515 Contributions 1,330Miscellaneous 383
Total revenues 46 24,515 1,717
EXPENDITURES:Current:
General Government 13Public WorksPublic SafetyCommunity DevelopmentBuilding and HousingPublic HealthEconomic Development
Capital outlay 30,604 24,515 1,070Inception of capital leaseDebt service:
Principal retirementInterest 3,020General Government 819Other Total expenditures 34,456 24,515 1,070
EXCESS (DEFICIENCY) OF REVENUESOVER (UNDER) EXPENDITURES (34,410) - 647
OTHER FINANCING SOURCES (USES):Transfers inTransfers out (4,916)Issuance of debt 82,945Premium on bonds 8,770Discount on bonds (145)Payment to refund bonds (28,910) Sale of City assetsProceeds from capital lease
Total other financing sources (uses) 57,744 - -
NET CHANGE IN FUND BALANCES 23,334 - 647
FUND BALANCES AT BEGINNING OF YEAR (as restated) 90,129 2,278
FUND BALANCES AT END OF YEAR 113,463$ -$ 2,925$
CITY OF CLEVELAND, OHIO
Capital Projects Funds
Non-Budgeted
COMBINING STATEMENT OF REVENUES, EXPENDITURES AND CHANGESIN FUND BALANCES-NONMAJOR GOVERNMENTAL FUNDS
YEAR ENDED DECEMBER 31, 2012(Amounts in 000's)
144

Certificatesof Total Total
Participation/ Cleveland Capital NonmajorCapital Stadium Projects GovernmentalLeases Construction Funds Funds
$ $ -$ 36,470$- 19,284- 35,595- 2,756- 7,206- 5,379
5 8 63 19124,515 124,000
1,330 1,364 383 8,696
5 8 26,291 240,941
13 8,159- 22,131- 8,812- 69,081- 6,706- 11,660- 11,387
130 6,321 62,640 67,6435,648 5,648 5,648
107 107 48,1153,020 33,741
819 1,26418 18 1,168
5,903 6,321 72,265 295,515
(5,898) (6,313) (45,974) (54,574)
5,850 5,850 56,228(4,916) (45,204)82,945 82,945
8,770 8,770(145) (145)
(28,910) (28,910) - 322
6,507 6,507 6,5076,507 5,850 70,101 80,513
609 (463) 24,127 25,939
5,634 4,145 102,186 311,291
6,243$ 3,682$ 126,313$ 337,230$
(Concluded)
145

Variance-Original Revised PositiveBudget Budget Actual (Negative)
REVENUES:Income taxes $ $ $ -$ Other taxes and shared revenues 12,845 12,845 13,043 198 Licenses and permits 1,398 1,398 1,242 (156) Charges for services 5,816 5,816 4,100 (1,716) Investment earnings 1 1 Miscellaneous 4 4
Total revenues 20,059 20,059 18,390 (1,669)
EXPENDITURES:Public Works:
Personnel 15,207 15,207 14,014 1,193 Other 12,110 12,110 9,127 2,983
Capital outlay - Principal retirement - Interest -
Total expenditures 27,317 27,317 23,141 4,176
EXCESS (DEFICIENCY) OF REVENUESOVER (UNDER) EXPENDITURES (7,258) (7,258) (4,751) 2,507
OTHER FINANCING SOURCES (USES):Transfers in 7,140 5,908 5,327 (581) Transfers out -
Total other financing sources (uses) 7,140 5,908 5,327 (581)
EXCESS (DEFICIENCY) OF REVENUESAND OTHER FINANCING SOURCESOVER (UNDER) EXPENDITURES ANDOTHER FINANCING USES (118) (1,350) 576 1,926
DECERTIFICATION OF PRIOR YEAR
ENCUMBRANCES AND PRE-ENCUMBRANCES 133 133
FUND BALANCES AT BEGINNING
OF YEAR 118 118 118 -
FUND BALANCES AT END OF YEAR -$ (1,232)$ 827$ 2,059$
CITY OF CLEVELAND, OHIO
COMBINING SCHEDULE OF REVENUES, EXPENDITURES ANDCHANGES IN FUND BALANCES-BUDGET AND ACTUAL (NON-GAAP BUDGETARY BASIS)-
BUDGETED SPECIAL REVENUE FUNDS-LEGAL APPROPRIATION LEVELFOR THE YEAR ENDED DECEMBER 31, 2012
Division of Streets
(Amounts in 000's)
146

Variance- Variance-Original Revised Positive Original Revised PositiveBudget Budget Actual (Negative) Budget Budget Actual (Negative)
33,888$ 33,888$ 36,309$ 2,421$ $ $ $ -$ - - - - - -
15 15 16 1 25 25 - -
33,903 33,903 36,325 2,422 - - 25 25
- - - -
3,797 3,797 3,908 (111) - 4,799 4,799 4,799 - - 1,077 1,077 1,077 - -9,673 9,673 9,784 (111) - - - -
24,230 24,230 26,541 2,311 - - 25 25
- - (25,926) (25,926) (25,926) - -(25,926) (25,926) (25,926) - - - - -
(1,696) (1,696) 615 2,311 25 25
45 45 -
1,696 1,696 1,696 - 13,551 13,551 13,551 -
-$ -$ 2,356$ 2,356$ 13,551$ 13,551$ 13,576$ 25$
(Continued)
Rainy Day Reserve FundRestricted Income Tax
147

Variance-Original Revised PositiveBudget Budget Actual (Negative)
REVENUES:Income taxes $ $ $ -$ Other taxes and shared revenues - Licenses and permits - Charges for services - Investment earnings - Miscellaneous -
Total revenues - - - -
EXPENDITURES:Public Works:
Personnel - Other 1,000 1,000 1,000 -
Capital outlay - Principal retirement - Interest -
Total expenditures 1,000 1,000 1,000 -
EXCESS (DEFICIENCY) OF REVENUESOVER (UNDER) EXPENDITURES (1,000) (1,000) (1,000) -
OTHER FINANCING SOURCES (USES):Transfers in 1,000 1,000 1,000 - Transfers out -
Total other financing sources (uses) 1,000 1,000 1,000 -
EXCESS (DEFICIENCY) OF REVENUESAND OTHER FINANCING SOURCESOVER (UNDER) EXPENDITURES ANDOTHER FINANCING USES -
DECERTIFICATION OF PRIOR YEARENCUMBRANCES AND PRE-ENCUMBRANCES -
FUND BALANCES AT BEGINNING OF YEAR -
FUND BALANCES AT END OF YEAR -$ -$ -$ -$
BUDGETED SPECIAL REVENUE FUNDS-LEGAL APPROPRIATION LEVELFOR THE YEAR ENDED DECEMBER 31, 2012
(Amounts in 000's)
CITY OF CLEVELAND, OHIO
COMBINING SCHEDULE OF REVENUES, EXPENDITURES ANDCHANGES IN FUND BALANCES-BUDGET AND ACTUAL (NON-GAAP BUDGETARY BASIS)-
Schools Recreation and Cultural Activities
148

Variance- Variance-Original Revised Positive Original Revised PositiveBudget Budget Actual (Negative) Budget Budget Actual (Negative)
$ $ $ -$ 33,888$ 33,888$ 36,309$ 2,421$ 13,500 13,500 13,570 70 26,345 26,345 26,613 268
- 1,398 1,398 1,242 (156) 250 250 250 - 6,066 6,066 4,350 (1,716)
6 6 15 15 48 33 - 4 4
13,750 13,750 13,826 76 67,712 67,712 68,566 854
- 15,207 15,207 14,014 1,193 602 602 577 25 13,712 13,712 10,704 3,008
- 3,797 3,797 3,908 (111) - 4,799 4,799 4,799 -
- 1,077 1,077 1,077 -602 602 577 25 38,592 38,592 34,502 4,090
13,148 13,148 13,249 101 29,120 29,120 34,064 4,944
85 85 (85) 8,225 6,993 6,327 (666) (13,500) (13,500) (8,814) 4,686 (39,426) (39,426) (34,740) 4,686(13,415) (13,415) (8,814) 4,601 (31,201) (32,433) (28,413) 4,020
(267) (267) 4,435 4,702 (2,081) (3,313) 5,651 8,964
- 178 178
267 267 267 - 15,632 15,632 15,632 -
-$ -$ 4,702$ 4,702$ 13,551$ 12,319$ 21,461$ 9,142$
(Concluded)
Cleveland Stadium Operations Totals
149

Variance-Original Revised PositiveBudget Budget Actual (Negative)
REVENUES:Property taxes 19,700$ 19,700$ 19,284$ (416)$ Other taxes and shared revenues 5,009 5,009 4,985 (24) Investment earnings 12 12 13 1 Miscellaneous -
Total revenues 24,721 24,721 24,282 (439)
EXPENDITURES:Principal retirement 28,680 28,680 28,815 (135) Interest 15,303 15,303 15,155 148 General Government -
Total expenditures 43,983 43,983 43,970 13
EXCESS (DEFICIENCY) OF REVENUES OVER (UNDER) EXPENDITURES (19,262) (19,262) (19,688) (426)
OTHER FINANCING SOURCES (USES):Transfers in:
From other subfunds 4,916 4,916 Restricted income tax fund 19,500 19,500 19,500 -
Total other financing sources (uses) 19,500 19,500 24,416 4,916
EXCESS (DEFICIENCY) OF REVENUESAND OTHER FINANCING SOURCESOVER (UNDER) EXPENDITURES ANDOTHER FINANCING USES 238 238 4,728 4,490
FUND BALANCES AT BEGINNING OF YEAR 1,488 1,488 1,488 -
FUND BALANCES AT END OF YEAR 1,726$ 1,726$ 6,216$ 4,490$
CITY OF CLEVELAND, OHIO
COMBINING SCHEDULE OF REVENUES, EXPENDITURES AND CHANGESIN FUND BALANCES-BUDGET AND ACTUAL (NON-GAAP BUDGETARY BASIS)
Unvoted Tax Supported Obligations Fund
BUDGETED DEBT SERVICE FUNDS-LEGAL APPROPRIATION LEVELFOR THE YEAR ENDED DECEMBER 31, 2012
(Amounts in 000's)
150

Variance- Variance-Original Revised Positive Original Revised PositiveBudget Budget Actual (Negative) Budget Budget Actual (Negative)
$ $ $ -$ $ $ $ -$ - -
1 1 1 - 3 3 3 - - -
1 1 1 - 3 3 3 -
1,090 1,090 1,090 - 2,955 2,955 2,955 - 541 541 541 - 2,647 2,647 2,647 - - -
1,631 1,631 1,631 - 5,602 5,602 5,602 -
(1,630) (1,630) (1,630) - (5,599) (5,599) (5,599) -
1,631 1,631 1,631 - 5,677 5,677 5,677 - - -
1,631 1,631 1,631 - 5,677 5,677 5,677 -
1 1 1 - 78 78 78 -
1 1 1 - 2,433 2,433 2,433 -
2$ 2$ 2$ -$ 2,511$ 2,511$ 2,511$ -$
Stadium Bond Fund Subordinated Income Tax Fund
(Continued)
151

Variance- Variance-Original Revised Positive Original Revised PositiveBudget Budget Actual (Negative) Budget Budget Actual (Negative)
REVENUES:Property taxes $ $ $ -$ $ $ $ -$Other taxes and shared revenues - -Investment earnings - 2 2 1 (1)Miscellaneous - -
Total revenues - - - - 2 2 1 (1)
EXPENDITURES:Principal retirement 167 167 167 - 1,440 1,440 1,440 -Interest 118 118 118 - 1,001 1,001 790 211 General Government - 368 368 362 6
Total expenditures 285 285 285 - 2,809 2,809 2,592 217
EXCESS (DEFICIENCY) OF REVENUES OVER (UNDER) EXPENDITURES (285) (285) (285) - (2,807) (2,807) (2,591) 216
OTHER FINANCING SOURCES (USES):Transfers in:
From other subfunds 295 295 391 96 1,859 1,859 2,329 470Restricted income tax fund - -Total other financing sources (uses) 295 295 391 96 1,859 1,859 2,329 470
EXCESS (DEFICIENCY) OF REVENUESAND OTHER FINANCING SOURCESOVER (UNDER) EXPENDITURES ANDOTHER FINANCING USES 10 10 106 96 (948) (948) (262) 686
FUND BALANCES AT BEGINNING OF YEAR 255 255 255 - 3,975 3,975 3,975 -
FUND BALANCES AT END OF YEAR 265$ 265$ 361$ 96$ 3,027$ 3,027$ 3,713$ 686$
CITY OF CLEVELAND, OHIO
COMBINING SCHEDULE OF REVENUES, EXPENDITURES AND CHANGESIN FUND BALANCES-BUDGET AND ACTUAL (NON-GAAP BUDGETARY BASIS)
FOR THE YEAR ENDED DECEMBER 31, 2012(Amounts in 000's)
Lower Euclid Avenue TIF Core City Bonds
BUDGETED DEBT SERVICE FUNDS-LEGAL APPROPRIATION LEVEL
152

Variance- Variance-Original Revised Positive Original Revised PositiveBudget Budget Actual (Negative) Budget Budget Actual (Negative)
$ $ $ -$ 19,700$ 19,700$ 19,284$ (416)$ - 5,009 5,009 4,985 (24)
5 5 3 (2) 23 23 21 (2)546 546 546 - 546 546 546 -551 551 549 (2) 25,278 25,278 24,836 (442)
3,305 3,305 3,305 - 37,637 37,637 37,772 (135) 3,676 3,676 3,676 - 23,286 23,286 22,927 359
- 368 368 362 66,981 6,981 6,981 - 61,291 61,291 61,061 230
(6,430) (6,430) (6,432) (2) (36,013) (36,013) (36,225) (212)
- 9,462 9,462 14,944 5,482 6,426 6,426 6,426 - 25,926 25,926 25,926 -6,426 6,426 6,426 - 35,388 35,388 40,870 5,482
(4) (4) (6) (2) (625) (625) 4,645 5,270
2,302 2,302 2,302 - 10,454 10,454 10,454 -
2,298$ 2,298$ 2,296$ (2)$ 9,829$ 9,829$ 15,099$ 5,270$
(Concluded)
TotalsSubordinate Lien Income Tax Bonds
153

154
This Page Intentionally Left Blank.

155
CITY OF CLEVELAND, OHIO
NONMAJOR ENTERPRISE FUNDS
Enterprise Funds are used to account for operations that are financed and operated in a manner similar to private sector businesses where the intent of the governing body is that the expense (including depreciation) of providing goods or services primarily or solely to the general public be financed or recovered primarily through user charges. The City’s nonmajor Enterprise Funds are as follows:
Water Pollution Control The Division of Water Pollution Control is a segment of the Department of Public Utilities of the City. The Division of Water Pollution Control was created for the purpose of providing sewage services to customers and to maintain the local sewer system of the City.
Public Auditorium The Public Auditorium is a multi-purpose performing arts, entertainment and conference center. It was constructed in the grand opera tradition and features a spacious 21,780 square foot registration lobby, a 10,000 seat auditorium, the 3,000 seat Cleveland Music Hall and 600 seat Little Theater.
West Side Market The West Side Market provides a public market where Cleveland area residents can purchase a variety of quality foods in a centralized location.
East Side Market The East Side Market provides a public market where Cleveland area residents can purchase a variety of quality foods in a centralized location.
Municipal Parking Lots The Division of Parking was established to provide municipal parking within the City’s limits.
Cemeteries The Division of Cemeteries was established to provide interment and cremation services for the City and its neighboring communities.
Golf Courses The Golf Course Division was established to provide the City and neighboring communities with recreational facilities for golfing and cross country skiing. Currently, both City golf courses are being leased out. Seneca is being leased by Cleveland Metroparks and Highland is leased by Mark A Nance Golf Ohio.

WaterPollution Public West SideControl Auditorium Market
ASSETSCurrent assets:
Cash and cash equivalents 48,630$ 86$ 1,232$Receivables:
Accounts 89,141 210 Unbilled revenue 2,831Less: Allowance for doubtful accounts (3,007) (44) Receivables, net 88,965 166 -
Due from other funds 495Inventory of supplies 362
Total current assets 138,452 252 1,232
Noncurrent assets:Restricted assets:
Cash and cash equivalents 586 Total restricted assets 586 - -
Unamortized bond issuance costs
Capital assets:Land 297 4,261 198Land improvementsUtility plant 137,728Buildings, structures and improvements 8,963 20,166 13,002Furniture, fixtures, equipment and vehicles 13,046 1,112 1,707Construction in progress 6,143 5,040 174Less: Accumulated depreciation (97,468) (21,208) (7,193) Total capital assets, net 68,709 9,371 7,888
Total noncurrent assets 69,295 9,371 7,888
TOTAL ASSETS 207,747$ 9,623$ 9,120$
CITY OF CLEVELAND, OHIO
COMBINING STATEMENT OF NET POSITION - NONMAJOR ENTERPRISE FUNDSDECEMBER 31, 2012
(Amounts in 000's)
156

TotalMunicipal Nonmajor
East Side Parking Golf EnterpriseMarket Lots Cemeteries Courses Funds
68$ 5,449$ 107$ 107$ 55,679$
18 180 89,549 2,831
(3,051)- 18 - 180 89,329
51 546 139 1 50268 5,657 108 287 146,056
8,762 6,579 15,927- 8,762 6,579 - 15,927
1,288 1,288
414 5,478 1,259 1,822 13,729 484 1,256 955 4,033 6,728
137,728 2,400 53,719 6,148 1,815 106,213
450 1,290 799 499 18,903 440 4,535 16,332
(2,404) (25,525) (3,438) (4,715) (161,951)1,344 36,658 10,258 3,454 137,682
1,344 46,708 16,837 3,454 154,897
1,412$ 52,365$ 16,945$ 3,741$ 300,953$
(Continued)
157

WaterPollution Public West SideControl Auditorium Market
LIABILITIESCurrent liabilities:
Accounts payable 2,409$ 88$ 151$Accrued wages and benefits 1,557 111 39Due to other funds 11,399 35 17Due to other governments 90,704Accrued interest payableCurrent portion of long-term obligations 525
Total current liabilities 106,594 234 207
Long-term liabilities:Accrued wages and benefits 136 17 4Construction loans payable 1,813Revenue bonds payable
Total liabilities 108,543 251 211
DEFERRED INFLOWS OF RESOURCESDerivative instruments-interest rate swapsService concession agreements
Total deferred inflows of resources - - -
NET POSITIONNet investment in capital assets 66,371 9,371 7,888Restricted for capital projects 178Restricted for debt serviceUnrestricted 32,655 1 1,021
Total net position 99,204 9,372 8,909TOTAL LIABILITIES, DEFERRED INFLOWS AND NET POSITION 207,747$ 9,623$ 9,120$
CITY OF CLEVELAND, OHIO
COMBINING STATEMENT OF NET POSITION - NONMAJOR ENTERPRISE FUNDSDECEMBER 31, 2012
(Amounts in 000's)
158

TotalMunicipal Nonmajor
East Side Parking Golf EnterpriseMarket Lots Cemeteries Courses Funds
$ 214$ 8$ $ 2,870$ 150 147 29 2,033 117 10 6 11,584 221 90,925 470 470
2,520 3,045- 3,692 165 35 110,927
26 23 206 1,813
28,103 28,103- 31,821 188 35 141,049
365 365 176 176
- 365 - 176 541
1,344 9,272 10,258 3,454 107,958 178
5,525 5,525 68 5,382 6,499 76 45,702
1,412 20,179 16,757 3,530 159,363
1,412$ 52,365$ 16,945$ 3,741$ 300,953$
(Concluded)
159

WaterPollution Public West SideControl Auditorium Market
OPERATING REVENUES:Charges for services 22,876$ 1,226$ 1,302$
Total operating revenue 22,876 1,226 1,302
OPERATING EXPENSES:Operations 10,194 2,408 1,040Maintenance 9,075 13 13Depreciation 5,108 14 685
Total operating expenses 24,377 2,435 1,738
OPERATING INCOME (LOSS) (1,501) (1,209) (436)
NON-OPERATING REVENUE (EXPENSES):Investment income 59 2Interest expense (102)Loss on disposal of capital assetsOther revenues (expenses) 21 (1)
Total non-operating revenues (expenses) (22) - 1
INCOME (LOSS) BEFORE CONTRIBUTIONSAND TRANSFERS (1,523) (1,209) (435)
Capital contributions 343 3,645 210Transfers in 1,297
CHANGE IN NET POSITION (1,180) 3,733 (225)
NET POSITION AT BEGINNING OF YEAR 100,384 5,639 9,134
NET POSITION AT END OF YEAR 99,204$ 9,372$ 8,909$
(Amounts in 000's)
CITY OF CLEVELAND, OHIO
COMBINING STATEMENT OF REVENUES, EXPENSES AND CHANGESIN FUND NET POSITION-NONMAJOR ENTERPRISE FUNDS
FOR THE YEAR ENDED DECEMBER 31, 2012
160

TotalMunicipal Nonmajor
East Side Parking Golf EnterpriseMarket Lots Cemeteries Courses Funds
$ 7,735$ 1,495$ 536$ 35,170$- 7,735 1,495 536 35,170
32 3,797 1,567 789 19,82799 1 16 9,217
60 1,405 253 159 7,68492 5,301 1,821 964 36,728
(92) 2,434 (326) (428) (1,558)
423 484(1,853) (1,955)
(8) (8) (227) 64 66 (77)
- (1,657) 64 58 (1,556)
(92) 777 (262) (370) (3,114)
490 928 5,616 60 232 1,589
(92) 1,267 726 (138) 4,091
1,504 18,912 16,031 3,668 155,272
1,412$ 20,179$ 16,757$ 3,530$ 159,363$
161

WaterPollution Public West SideControl Auditorium Market
CASH FLOWS FROM OPERATING ACTIVITIES:Cash received from customers 22,996$ 1,146$ 1,302$Cash payments to suppliers for goods or services (5,484) (1,186) (632)Cash payments to employees for services (9,947) (1,258) (391)Agency activity on behalf of other sewer authorities 6,265
Net cash provided by (used for) operating activities 13,830 (1,298) 279
CASH FLOWS FROM NONCAPITAL FINANCING ACTIVITIES:Cash received through transfers from other funds 1,297Miscellaneous non-operating revenue (expense)
Net cash provided by (used for) noncapital financing activities - 1,297 -
CASH FLOWS FROM CAPITAL AND RELATEDFINANCING ACTIVITIES:Acquisition and construction of capital assets (3,996)Principal paid on long-term debt (505)Interest paid on long-term debt (102)Capital grant proceeds 289
Net cash provided by (used for) capital and related financing activities (4,314) - -
CASH FLOWS FROM INVESTING ACTIVITIES:Purchase of investment securitiesProceeds from sale and maturity of investment securitiesInterest received on investments 59 2
Net cash provided by (used for) investing activities 59 - 2
NET INCREASE (DECREASE) IN CASH ANDCASH EQUIVALENTS 9,575 (1) 281
CASH AND CASH EQUIVALENTS AT BEGINNING OF YEAR 39,641 87 951
CASH AND CASH EQUIVALENTS AT END OF YEAR 49,216$ 86$ 1,232$
(Amounts in 000's)
CITY OF CLEVELAND, OHIO
COMBINING STATEMENT OF CASH FLOWSNONMAJOR ENTERPRISE FUNDS
FOR THE YEAR ENDED DECEMBER 31, 2012
162

TotalMunicipal Nonmajor
East Side Parking Golf EnterpriseMarket Lots Cemeteries Courses Funds
$ 7,939$ 1,511$ 532$ 35,426$(41) (3,474) (422) (416) (11,655)
(1,091) (1,150) (419) (14,256) 6,265
(41) 3,374 (61) (303) 15,780
60 232 1,589 75 70 145
- - 135 302 1,734
(3,996)(2,420) (2,925)(1,705) (1,807)
289
- (4,125) - - (8,439)
6,022 6,0224,095 4,095
12 38 111- 4,107 6,060 - 10,228
(41) 3,356 6,134 (1) 19,303
109 10,855 552 108 52,303
68$ 14,211$ 6,686$ 107$ 71,606$(Continued)
163

WaterPollution Public West SideControl Auditorium Market
(1,501)$ (1,209)$ (436)$
5,108 14 68520,000
Receivables, net 3,259 (80) Due from other funds (79)Inventory of supplies (43)Accounts payable 253 (11) 19Accrued wages and benefits (13) (4) Due to other funds 1,979 (8) 11Due to other governments (15,133) Total adjustments 15,331 (89) 715
13,830$ (1,298)$ 279$
Contributions of capital assets 3,645$ 210$
NET CASH PROVIDED BY (USED FOR)
(Amounts in 000's)
SCHEDULE OF NONCASH CAPITAL AND RELATED
Operating income (loss)
FINANCING ACTIVITIES:
OPERATING ACTIVITIES
RECONCILIATION OF OPERATING INCOME (LOSS)
net cash provided by (used for) operating activities:
TO NET CASH PROVIDED BY (USED FOR)
Write-off of bad debt expenseDepreciation
Changes in assets and liabilities:
CITY OF CLEVELAND, OHIO
COMBINING STATEMENT OF CASH FLOWSNONMAJOR ENTERPRISE FUNDS
FOR THE YEAR ENDED DECEMBER 31, 2012
Adjustments to reconcile operating income (loss) to
OPERATING ACTIVITIES:
164

TotalMunicipal Nonmajor
East Side Parking Golf EnterpriseMarket Lots Cemeteries Courses Funds
(92)$ 2,434$ (326)$ (428)$ (1,558)$
60 1,405 253 159 7,684 20,000
- (11) 16 (4) 3,180
(3) (82) (3) 6 (40)
(9) (539) 4 (1) (284) 5 6 (40) (46)
50 (14) 5 2,023 36 (15,097)51 940 265 125 17,338
(41)$ 3,374$ (61)$ (303)$ 15,780$
490$ 928$ 5,273$
(Concluded)
165

166
This Page Intentionally Left Blank.

167
INTERNAL SERVICE FUNDS
Internal Service Funds are used to account for the financing of goods or services provided by one department of the City to other departments of the City on a cost-reimbursement basis. The City’s Internal Service Funds are described below:
Motor Vehicle Maintenance The Division of Motor Vehicle Maintenance was established to provide centralized maintenance, repairs and fueling of certain City vehicles.
Printing and Reproduction The Division of Printing and Reproduction was established to provide printing and reproduction services for all City divisions.
City Storeroom and Warehouse The City’s Storeroom and Warehouse Division provides centralized mailroom service.
Utilities Administration The Division of Utilities Administration was established to provide administrative assistance to the Department of Public Utilities.
Sinking Fund Administration The Sinking Fund Administration Fund was established to account for personnel and other operating expenditures related to the administration of the Debt Service Fund.
Municipal Income Tax Administration The Municipal Income Tax Administration Fund was established to account for operating expenditures related to the collection of municipal income tax for Cleveland and other municipalities.
Telephone Exchange The Division of Telephone Exchange was established to operate the communications system for the City at minimal cost.
Radio Communications The Office of Radio Communications was established to operate the 800MHZ radio communication system.
Workers’ Compensation Reserve The Workers’ Compensation Reserve was established to account for liabilities related to workers’ compensation claims under the retrospective rating policy.

CityMotor Printing StoreroomVehicle and and Utilities
Maintenance Reproduction Warehouse Administration
ASSETSCurrent assets:
Cash and cash equivalents 4,756$ 598$ 44$ 770$Due from other funds 1,690 244 37 Inventory of supplies 1,079 142
Total current assets 7,525 984 81 770
Capital assets:Land 663Land improvements 146Buildings, structures and improvements 2,673 884Furniture, fixtures, equipment and vehicles 6,967 1,153 1,186Construction in progress 488Less: Accumulated depreciation (8,004) (1,113) (746) Total capital assets, net 2,933 924 - 440
Total noncurrent assets 2,933 924 - 440
TOTAL ASSETS 10,458$ 1,908$ 81$ 1,210$
COMBINING STATEMENT OF NET POSITION - ALL INTERNAL SERVICE FUNDS
CITY OF CLEVELAND, OHIO
DECEMBER 31, 2012(Amounts in 000's)
168

Sinking Municipal Workers'Fund Income Tax Telephone Radio Compensation
Administration Administration Exchange Communications Reserve Total
43$ 1,783$ 542$ 1,747$ 7,870$ 18,153$150 871 162 6,047 9,201
1,221193 1,783 1,413 1,909 13,917 28,575
663146
3,55765 117 25 9,513
488 (14) (117) (18) (10,012)
- 51 - 7 - 4,355
- 51 - 7 - 4,355
193$ 1,834$ 1,413$ 1,916$ 13,917$ 32,930$
(Continued)
169

CityMotor Printing StoreroomVehicle and and Utilities
Maintenance Reproduction Warehouse Administration
LIABILITIESCurrent liabilities:
Accounts payable 867$ 187$ 1$ 24$Accrued wages and benefits 732 101 37 710Due to other funds 57 26 6Due to other governments
Total current liabilities 1,656 314 38 740
Long-term liabilities:Accrued wages and benefits 170 20 2 130
Total liabilities 1,826 334 40 870
NET POSITIONNet investment in capital assets 2,933 924 440Unrestricted 5,699 650 41 (100)
Total net position 8,632 1,574 41 340
TOTAL LIABILITIES AND NET POSITION 10,458$ 1,908$ 81$ 1,210$
CITY OF CLEVELAND, OHIO
COMBINING STATEMENT OF NET POSITION - ALL INTERNAL SERVICE FUNDSDECEMBER 31, 2012
(Amounts in 000's)
170

Sinking Municipal Workers'Fund Income Tax Telephone Radio Compensation
Administration Administration Exchange Communications Reserve Total
17$ 162$ 651$ 337$ $ 2,246$19 718 132 50 2,499
113 2 204 736 19 75536 1,729 783 408 - 5,704
7 105 36 22 13,917 14,40943 1,834 819 430 13,917 20,113
51 7 4,355150 (51) 594 1,479 8,462
150 - 594 1,486 - 12,817
193$ 1,834$ 1,413$ 1,916$ 13,917$ 32,930$
(Concluded)
171

CityMotor Printing StoreroomVehicle and and Utilities
Maintenance Reproduction Warehouse Administration
OPERATING REVENUES:Charges for services 19,779$ 2,102$ 501$ 5,880$
Total operating revenue 19,779 2,102 501 5,880
OPERATING EXPENSES:Operations 17,680 2,035 555 5,692Maintenance 952 76 96Depreciation 311 127 197
Total operating expenses 18,943 2,238 555 5,985
OPERATING INCOME (LOSS) 836 (136) (54) (105)
NON-OPERATING REVENUES (EXPENSES):Investment income 8 1 1Loss on disposal of capital assets (68)
Total non-operating revenues (expenses) (60) 1 - 1
INCOME (LOSS) BEFORE CONTRIBUTIONS AND TRANSFERS 776 (135) (54) (104)
Capital contributions 882Transfers in
CHANGE IN NET POSITION 1,658 (135) (54) (104)
NET POSITION AT BEGINNING OF YEAR 6,974 1,709 95 444
NET POSITION AT END OF YEAR 8,632$ 1,574$ 41$ 340$
CITY OF CLEVELAND, OHIO
COMBINING STATEMENT OF REVENUES, EXPENSES AND CHANGES INFUND NET POSITION - ALL INTERNAL SERVICE FUNDS
FOR THE YEAR ENDED DECEMBER 31, 2012(Amounts in 000's)
172

Sinking Municipal Workers'Fund Income Tax Telephone Radio Compensation
Administration Administration Exchange Communications Reserve Total
216$ 8,184$ 6,361$ 2,505$ 1,441$ 46,969$216 8,184 6,361 2,505 1,441 46,969
823 8,083 5,262 929 1,441 42,50097 70 804 2,095
11 3 649823 8,191 5,332 1,736 1,441 45,244
(607) (7) 1,029 769 - 1,725
7 1 3 21 (68)
- 7 1 3 - (47)
(607) - 1,030 772 - 1,678
882 726 726
119 - 1,030 772 - 3,286
31 (436) 714 9,531
150$ -$ 594$ 1,486$ -$ 12,817$
173

CityMotor Printing StoreroomVehicle and and
Maintenance Reproduction Warehouse
19,795$ 2,188$ 494$ (13,440) (1,196) (504)
(5,066) (805) (57)Net cash provided by (used for) operating activities 1,289 187 (67)
CASH FLOWS FROM NONCAPITAL
Net cash provided by (used for) noncapital financing activities - - -
CASH FLOWS FROM CAPITAL AND RELATED
(91)Net cash provided by (used for) capital and related financing activities - (91) -
8 1Net cash provided by investing activities 8 1 -
1,297 97 (67)
3,459 501 111
4,756$ 598$ 44$
Operating income (loss) 836$ (136)$ (54)$
Depreciation 311 127 Change in assets and liabilities:
Due from other funds 15 86 (6) Inventory of supplies 3 Accounts payable 57 108 (2) Accrued wages and benefits 32 (3) 24 Due to other funds 38 2 (29) Due to other governments Total adjustments 453 323 (13)
1,289$ 187$ (67)$
CASH AND CASH EQUIVALENTS AT END OF YEAR
CASH PROVIDED BY (USED FOR) OPERATING ACTIVITIES:RECONCILIATION OF OPERATING INCOME (LOSS) TO NET
NET CASH PROVIDED BY (USED FOR) OPERATING ACTIVITIES
net cash provided by (used for) operating activities:Adjustments to reconcile operating income (loss) to
CASH AND CASH EQUIVALENTS AT BEGINNING OF YEAR
CASH FLOWS FROM INVESTING ACTIVITIES:
FINANCING ACTIVITIES:Acquisition and construction of capital assets
CASH FLOWS FROM OPERATING ACTIVITIES:Cash received from customersCash payments to suppliers for goods or servicesCash payments to employees for services
CITY OF CLEVELAND, OHIO
COMBINING STATEMENT OF CASH FLOWS-ALL INTERNAL SERVICE FUNDSFOR THE YEAR ENDED DECEMBER 31, 2012
(Amounts in 000's)
Interest received on investments
NET INCREASE (DECREASE) IN CASH AND CASH EQUIVALENTS
Cash received through transfers from other fundsFINANCING ACTIVITIES:
174

Sinking Municipal Workers'Utilities Fund Income Tax Telephone Radio Compensation
Administration Administration Administration Exchange Communications Reserve Total
5,880$ 158$ 8,604$ 5,865$ 2,594$ $ 45,578$ (906) (661) (2,932) (4,499) (1,411) (25,549)
(4,872) (183) (5,168) (1,141) (441) (17,733)102 (686) 504 225 742 - 2,296
726 726- 726 - - - - 726
(40) (131)
(40) - - - - - (131)
1 7 1 3 211 - 7 1 3 - 21
63 40 511 226 745 - 2,912
707 3 1,272 316 1,002 7,870 15,241
770$ 43$ 1,783$ 542$ 1,747$ 7,870$ 18,153$
(105)$ (607)$ (7)$ 1,029$ 769$ $ 1,725$
197 11 3 649
(58) (495) 89 1,441 1,072 3
(1) 12 22 (271) (125) (200) 10 (33) 70 (38) (13) (1,441) (1,392)
1 (11) 1 419 19 438
207 (79) 511 (804) (27) - 571
102$ (686)$ 504$ 225$ 742$ - $ 2,296$
175

176
This Page Intentionally Left Blank.

177
CITY OF CLEVELAND, OHIO
AGENCY FUNDS
Agency Funds are used to account for assets received and held by the City acting in the capacity of an agent or custodian. The City’s Agency Funds are described below:
Municipal Courts To account for assets received and disbursed by the Municipal Courts as agent or custodian related to Civil and Criminal Court matters.
Central Collection Agency To account for the collection of the Municipal Income Tax for the City of Cleveland and any other municipalities that employ the Central Collection Agency as their agency.
Other Agencies To account for miscellaneous assets held by the City for governmental units or individuals.

Balance at Balance atBeginning End
of Year Additions Deductions of Year
MUNICIPAL COURTS
ASSETSCash and cash equivalents 4,784$ 17,984$ 19,046$ 3,722$
Total assets 4,784$ 17,984$ 19,046$ 3,722$
LIABILITIESDue to others 4,784$ 15,213$ 16,275$ 3,722$
Total liabilities 4,784$ 15,213$ 16,275$ 3,722$
CENTRAL COLLECTION AGENCY
ASSETSCash and cash equivalents 6,371$ 5,622$ 6,371$ 5,622$ Taxes receivable 19,361 19,699 19,361 19,699 Due from other governments 721 1,171 721 1,171
Total assets 26,453$ 26,492$ 26,453$ 26,492$
LIABILITIESDue to other governments 26,453$ 26,492$ 26,453$ 26,492$
Total liabilities 26,453$ 26,492$ 26,453$ 26,492$
(Continued)
CITY OF CLEVELAND, OHIO
ALL AGENCY FUNDS
(Amounts in 000's)FOR THE YEAR ENDED DECEMBER 31, 2012
COMBINING STATEMENT OF CHANGES IN ASSETS AND LIABILITIES -
178
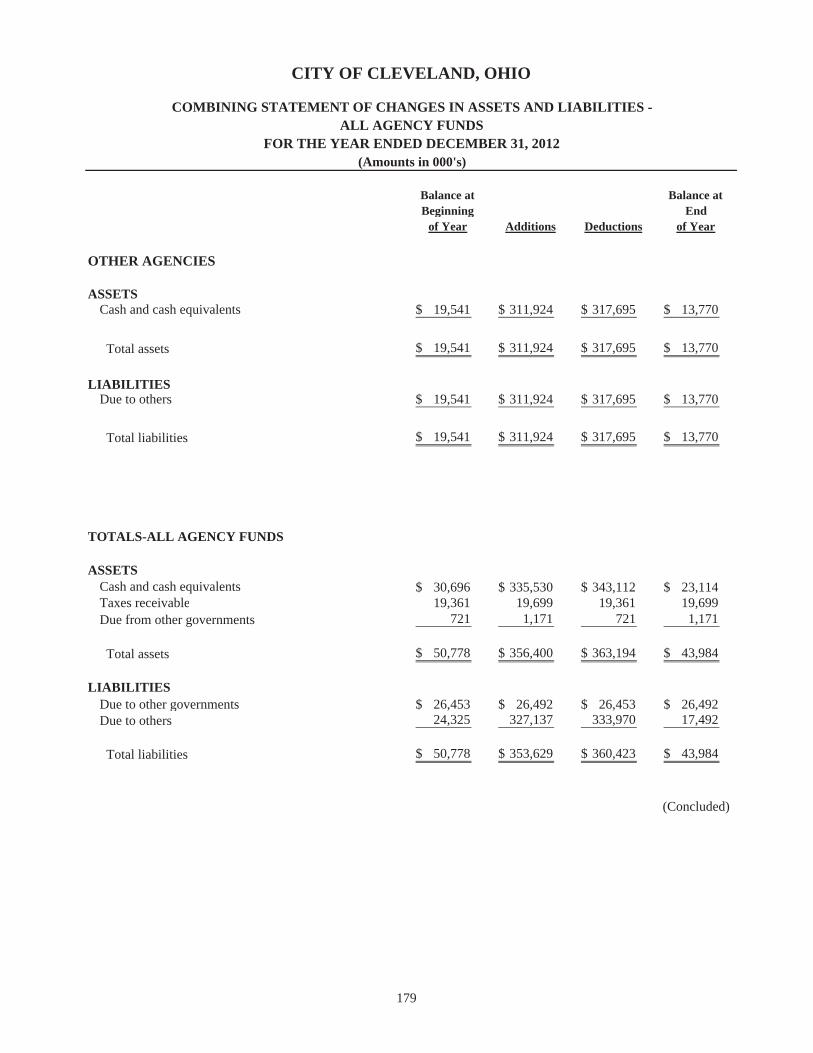
CITY OF CLEVELAND, OHIO
COMBINING STATEMENT OF CHANGES IN ASSETS AND LIABILITIES -ALL AGENCY FUNDS
FOR THE YEAR ENDED DECEMBER 31, 2012
Balance at Balance atBeginning End
of Year Additions Deductions of Year
OTHER AGENCIES
ASSETSCash and cash equivalents 19,541$ 311,924$ 317,695$ 13,770$
Total assets 19,541$ 311,924$ 317,695$ 13,770$
LIABILITIESDue to others 19,541$ 311,924$ 317,695$ 13,770$
Total liabilities 19,541$ 311,924$ 317,695$ 13,770$
TOTALS-ALL AGENCY FUNDS
ASSETSCash and cash equivalents 30,696$ 335,530$ 343,112$ 23,114$Taxes receivable 19,361 19,699 19,361 19,699Due from other governments 721 1,171 721 1,171
Total assets 50,778$ 356,400$ 363,194$ 43,984$
LIABILITIESDue to other governments 26,453$ 26,492$ 26,453$ 26,492$Due to others 24,325 327,137 333,970 17,492
Total liabilities 50,778$ 353,629$ 360,423$ 43,984$
(Concluded)
(Amounts in 000's)
179

180
This Page Intentionally Left Blank.

181
CAPITAL ASSETS USED IN THE OPERATION
OF GOVERNMENTAL FUNDS
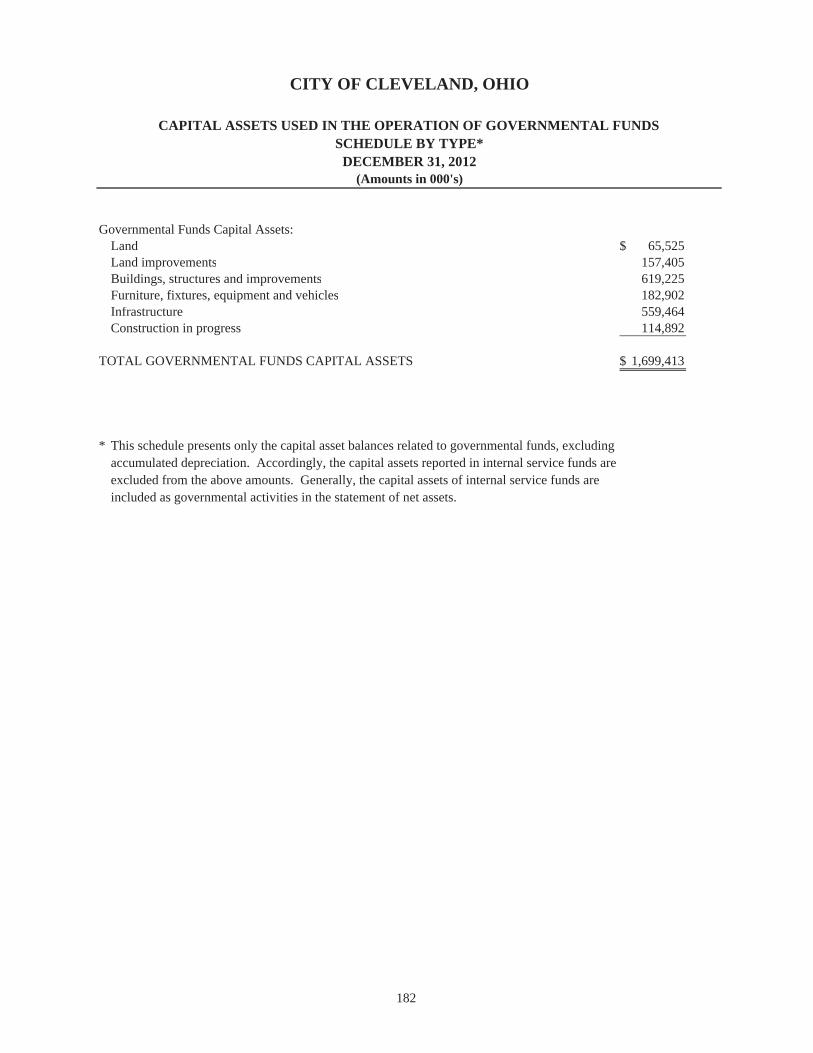
CITY OF CLEVELAND, OHIO
CAPITAL ASSETS USED IN THE OPERATION OF GOVERNMENTAL FUNDSSCHEDULE BY TYPE*
DECEMBER 31, 2012
Governmental Funds Capital Assets:Land 65,525$ Land improvements 157,405 Buildings, structures and improvements 619,225 Furniture, fixtures, equipment and vehicles 182,902 Infrastructure 559,464 Construction in progress 114,892
TOTAL GOVERNMENTAL FUNDS CAPITAL ASSETS 1,699,413$
* This schedule presents only the capital asset balances related to governmental funds, excludingaccumulated depreciation. Accordingly, the capital assets reported in internal service funds areexcluded from the above amounts. Generally, the capital assets of internal service funds areincluded as governmental activities in the statement of net assets.
(Amounts in 000's)
182

Buildings, Furniture,Structures Fixtures, Construction
Land and Equipment In Total Land Improvements Improvements and Vehicles Infrastructure Progress
General Government:General government 340,178$ 208$ 1,484$ 305,566$ 24,654$ 3,890$ 4,376$ City Hall 27,360 877 22,510 3,973 Engineering and construction 506,442 26,647 1,849 426,818 51,128 Justice Center 29,768 28,922 846 Research, planning and development 49,025 903 39,786 3,815 62 2,997 1,462 Charles V. Carr Municipal Center 647 15 632 Total general government 953,420 1,988 67,932 361,445 27,411 433,705 60,939
Public Works:Waste collection 30,734 499 8,269 20,004 1,460 502 Streets 149,001 1,540 11,602 14,393 19,444 96,229 5,793 Traffic engineering 5,208 813 2,178 2,200 17 Park maintenance and properties 98,606 36,852 23,388 18,679 16,470 271 2,946 Recreation 121,656 976 46,051 65,068 2,440 7,121 Other 49,732 2,669 32,631 929 13,503 Total public works 454,937 42,536 81,041 139,853 61,465 100,160 29,882
Public Safety:Police 125,086 4,805 573 59,187 47,958 162 12,401 Fire 65,118 1,663 29,240 32,737 1,478 Emergency medical service 15,678 1,090 8,930 5,614 44 Correction 7,588 264 6,570 731 23 Dog pound 1,136 868 265 3 Total public safety 214,606 6,732 573 96,955 90,621 5,776 13,949
Public Health:Health and environment 13,530 1,112 208 10,528 1,585 56 41 Total public health 13,530 1,112 208 10,528 1,585 56 41
Community Development:Community development 45,841 7,130 7,376 9,384 1,382 15,807 4,762 Total community development 45,841 7,130 7,376 9,384 1,382 15,807 4,762
Economic Development:Economic development 12,740 6,027 275 740 379 5,319 Total economic development 12,740 6,027 275 740 - 379 5,319
Building and Housing:Building and housing 4,339 320 438 3,581 Total building and housing 4,339 - - 320 438 3,581 -
TOTAL GOVERNMENTAL FUNDS CAPITAL ASSETS 1,699,413$ 65,525$ 157,405$ 619,225$ 182,902$ 559,464$ 114,892$
* This schedule presents only the capital asset balances related to governmental funds, excluding accumulated depreciation.Accordingly, the capital assets reported in internal service funds are excluded from the above amounts. Generally, the capital assets of internal service funds are included as governmental activities in the statement of net assets.
(Amounts in 000's)DECEMBER 31, 2012
SCHEDULE BY FUNCTION AND ACTIVITY*
CITY OF CLEVELAND, OHIO
CAPITAL ASSETS USED IN THE OPERATION OF GOVERNMENTAL FUNDS
183

CITY OF CLEVELAND, OHIO
CAPITAL ASSETS USED IN THE OPERATION OF GOVERNMENTAL FUNDSSCHEDULE OF CHANGES BY FUNCTION AND ACTIVITY*
FOR THE YEAR ENDED DECEMBER 31, 2012
Balance BalanceJanuary 1, December 31,
2012 Additions Deductions Transfers 2012
General Government:General government 339,976$ 219$ (41)$ 24$ 340,178$ City Hall 26,058 1,302 27,360 Engineering and construction 474,048 27,553 (16) 4,857 506,442 Justice Center 29,768 29,768 Research, planning and development 53,606 2,010 (11) (6,580) 49,025 Charles V. Carr Municipal Center 647 647 Total general government 924,103 31,084 (68) (1,699) 953,420
Public Works:Waste collection 28,747 3,348 (1,143) (218) 30,734 Streets 139,293 10,271 (1,619) 1,056 149,001 Traffic engineering 5,267 (59) 5,208 Park maintenance and properties 97,339 1,825 (285) (273) 98,606 Recreation 111,286 9,518 852 121,656 Other 49,705 47 (20) 49,732 Total public works 431,637 25,009 (3,067) 1,358 454,937
Public Safety:Police 121,981 4,407 (904) (398) 125,086 Fire 62,891 2,303 (76) 65,118 Emergency medical service 15,703 519 (585) 41 15,678 Correction 7,613 19 (28) (16) 7,588 Dog pound 1,154 (18) 1,136 Total public safety 209,342 7,248 (1,517) (467) 214,606
Public Health:Health and environment 13,277 209 (18) 62 13,530 Total public health 13,277 209 (18) 62 13,530
Community Development:Community development 45,785 65 (9) 45,841 Total community development 45,785 65 (9) - 45,841
Economic Development:Economic development 10,590 2,150 12,740 Total economic development 10,590 2,150 - - 12,740
Building and Housing:Building and housing 4,339 4,339 Total building and housing 4,339 - - - 4,339
CAPITAL ASSETS 1,639,073$ 65,765$ (4,679)$ (746)$ 1,699,413$
* This schedule presents only the capital asset balances related to governmental funds, excluding accumulateddepreciation. Accordingly, the capital assets reported in internal service funds are excluded from the aboveamounts. Generally, the capital assets of internal service funds are included as governmental activities inthe statement of net assets.
(Amounts in 000's)
TOTAL GOVERNMENTAL FUNDS
184

185
STATISTICALSECTION

This Page Intentionally Left Blank
- S1 -

- S2 -
CITY OF CLEVELAND, OHIO Statistical Section
This part of the City’s comprehensive annual financial report presents detailed information as a context for understanding what the information in the financial statements, note disclosures and required supplementary information says about the City’s overall financial health.
Contents Page
Financial Trends These schedules contain trend information to help the reader understand how the City’s financial performance and well-being have changed over time.
S3-S6
Revenue Capacity These schedules contain information to help the reader assess the City’s most significant local revenue source, the municipal income tax.
S7-S11
Debt Capacity These schedules present information to help the reader assess the affordability of the City’s current levels of outstanding debt and the City’s ability to issue additional debt in the future.
S12-S18
Economic and Demographic Information These schedules offer economic and demographic indicators to help the reader understand the environment within which the City’s financial activities take place.
S19-S21
Operating Information These schedules contain service and infrastructure data to help the reader understand how the information in the City’s financial report relates to the services the City provides and the activities it performs.
S22-S23
Schedule of Statistics – General Fund S24
Sources: Unless otherwise noted, the information in these schedules is derived from the comprehensive annual financial reports for the relevant year.

2012 2011 2010 2009(Restated)
Governmental Activities Net investment in capital assets $572,213 $543,460 $557,804 $561,586Restricted 122,488 117,765 159,942 166,280Unrestricted (12,383) (19,771) (90,565) (134,033)
Total Governmental Activities Net Position $682,318 $641,454 $627,181 $593,833
Business-Type Activities Net investment in capital assets $1,303,584 $1,295,139 $1,080,332 $1,016,182Restricted 227,826 234,050 243,511 275,907Unrestricted 492,956 438,767 462,397 469,010
Total Business-Type Activities Net Position $2,024,366 $1,967,956 $1,786,240 $1,761,099
Primary GovernmentNet investment in capital assets $1,875,797 $1,838,599 $1,638,136 $1,577,768Restricted 350,314 351,815 403,453 442,187Unrestricted 480,573 418,996 371,832 334,977
Total Primary Government Net Position $2,706,684 $2,609,410 $2,413,421 $2,354,932
(Amounts in 000's)
City of Cleveland, OhioNet Position By Component
Last Ten Years (Accrual Basis of Accounting)
- S3 -

2008 2007 2006 2005 2004 2003
$555,076 $484,758 $412,430 $395,600 $371,601 $365,946 179,318 214,811 211,361 193,529 199,038 193,872 (95,968) (59,630) (56,318) (52,676) (53,281) (50,673)
$638,426 $639,939 $567,473 $536,453 $517,358 $509,145
$985,556 $957,587 $886,978 $838,164 $780,436 $706,207272,613 252,514 247,802 287,039 285,256 298,663
512,876 506,745 496,624 474,875 478,229 489,211
$1,771,045 $1,716,846 $1,631,404 $1,600,078 $1,543,921 $1,494,081
$1,540,632 $1,442,345 $1,299,408 $1,233,764 $1,152,037 $1,072,153451,931 467,325 459,163 480,568 484,294 492,535416,908 447,115 440,306 422,199 424,948 438,538
$2,409,471 $2,356,785 $2,198,877 $2,136,531 $2,061,279 $2,003,226
$0$500,000
$1,000,000$1,500,000$2,000,000$2,500,000$3,000,000
2012 2011 2010 2009 2008 2007 2006 2005 2004 2003
Net Position (Accrual Basis)(Amounts in 000's)
Total Primary Government Net Positon Total Governmental Activities Net Position Total Business-Type Activities Net Position
- S3 -

2012 2011 2010 2009
Program RevenuesGovernmental Activities:
Charges for Services:General Government (1) $30,696 $32,336 $31,570 $34,937Public Works (1) 18,369 16,271Public Service (1) 12,024 5,517Public Safety 15,049 15,034 13,839 18,296Community Development (1) Building and Housing 5,757 18,072 7,327 13,402Public Health 2,967 2,931 3,033 3,187Parks, Recreation and Properties (1) 8,047 1,129Economic Development 100 37 1,469 759
Subtotal - Charges for Services 72,938 84,681 77,309 77,227Operating Grants and Contributions:
General Government (1) 4,345 3,673 1,348 1,121Public Works (1) 28,342 27,364Public Service (1) 13,821 13,469Public Safety 13,805 12,497 8,647 13,192Community Development 69,004 68,887 73,563 41,490Building and Housing 6,679 5,698 9,064 11,857Public Health 10,321 13,228 12,693 15,048Parks, Recreation and Properties (1) 13,830 14,404Economic Development 11,387 4,008 8,156 23,984
Subtotal - Operating Grants and Contributions 143,883 135,355 141,122 134,565Capital Grants and Contributions:
General Government 1,330 23 41Public Works (1) 24,515 13,982Public Service (1) 11,179 11,680Public Safety Community DevelopmentParks, Recreation and Properties (1)
Subtotal - Capital Grants and Contributions 25,845 14,005 11,220 11,680
Total Governmental Activities Program Revenues 242,666 234,041 229,651 223,472
Business-Type Activities:Charges for Services:
Water 280,323 236,626 237,270 228,235Electricity 165,227 168,448 166,665 155,865Airport facilities 116,694 114,967 106,696 98,143Nonmajor activities 35,188 34,600 39,358 43,110
Subtotal - Charges for Services 597,432 554,641 549,989 525,353Operating Grants and Contributions:
Water 4,567 3,305 3,553 4,917Electricity 97 883 566 169Airport facilities 177 619 1,232Nonmajor activities 478 278 4,051 3,857
Subtotal - Operating Grants and Contributions 5,319 4,466 8,789 10,175Capital Grants and Contributions:
Water 21,800 2,284 7,645 1,677Electricity 964 206 1,035Airport facilities 25,025 56,385 57,089 44,219Nonmajor activities 5,773 5,716 19,765 5,429
Subtotal - Capital Grants and Contributions 53,562 64,591 85,534 51,325
Total Business-Type Activities Program Revenues 656,313 623,698 644,312 586,853
Total Primary Government Program Revenues $898,979 $857,739 $873,963 $810,325
City of Cleveland, OhioChanges in Net Position
Last Ten Years(Accrual Basis of Accounting)
(Amounts in 000's)
- S4 -

2008 2007 2006 2005 2004 2003
$36,824 $30,470 $32,311 $22,174 $22,143 $32,878
5,517 4,490 5,158 6,208 5,030 4,80221,709 21,087 12,773 15,953 16,046 18,822
5,440 1,203 212,323 10,528 10,701 10,871 11,948 9,673
2,893 2,979 2,898 2,918 2,262 2,8611,351 1,160 746 913 692 1,2281,057 471 4,496 46 118 2,269
87,114 72,388 69,085 59,083 58,239 72,533
1,789 1,994 1,508 1,876 1,865 2,588
14,317 14,459 14,230 14,234 13,798 12,8737,448 5,789 9,364 9,153 7,561 9,677
42,129 50,344 56,882 51,848 59,734 63,2951,106 3,353 3,407
12,786 14,079 13,838 10,963 8,778 7,35716,417 16,123 16,232 354 2,427 34333,121 21,077 40,397 42,164 30,704 30,551
129,113 127,218 155,858 130,592 124,867 126,684
3,057 5,380 23,839 26,899 14,745 13,203
13,094 75,871
1,31589 125 66
16,151 82,566 23,839 26,988 14,870 13,269
232,378 282,172 248,782 216,663 197,976 212,486
242,872 242,014 209,694 222,635 209,622 203,748158,237 155,559 146,293 150,263 141,143 139,660111,402 105,887 105,711 111,087 110,882 89,958
41,950 40,614 33,821 33,843 35,079 33,628554,461 544,074 495,519 517,828 496,726 466,994
8,384 11,033 8,2422,118 2,589 1,7963,809 3,718 2,944 7,7265,557 6,399 1,616 100 48 790
19,868 23,739 14,598 7,826 48 790
3,460 7,906 6,817 12,408 5,448 6,6872,803 1,485 1,135 2,285 1,079 1,585
54,646 73,358 53,280 40,975 50,377 51,2113,155 2,591 6,201 5,505 4,698 7,317
64,064 85,340 67,433 61,173 61,602 66,800
638,393 653,153 577,550 586,827 558,376 534,584
$870,771 $935,325 $826,332 $803,490 $756,352 $747,070
(Continued)
- S4 -

2012 2011 2010 2009
ExpensesGovernmental Activities:
General Government (1) $106,141 $95,833 $81,898 $90,311Public Works (1) 128,276 139,577Public Service (1) 93,425 85,947Public Safety 310,745 308,051 315,900 329,765Human ResourcesCommunity Development (1) 70,705 75,778 70,589 59,204Building and Housing 14,729 14,098 17,445 20,925Public Health 17,385 19,596 19,740 22,999Parks, Recreation and Properties (1) 46,963 58,799Economic Development 13,845 22,323 24,729 38,083Interest on debt 26,153 27,686 47,531 30,448
Total Governmental Activities Expenses 687,979 702,942 718,220 736,481
Business-Type ActivitiesWater 244,647 232,497 232,862 224,269Electricity 163,547 167,799 165,330 158,100Airport facilities 153,627 167,531 158,262 168,734Nonmajor activities 39,671 46,302 43,443 46,546
Total Business-Type Activities Expenses 601,492 614,129 599,897 597,649
Total Primary Government Program Expenses 1,289,471 1,317,071 1,318,117 1,334,130
Net (Expense)/RevenueGovernmental Activities (445,313) (468,901) (488,569) (513,009)Business-Type Activities 54,821 9,569 44,415 (10,796)
Total Primary Government Net Expense (390,492) (459,332) (444,154) (523,805)
General Revenues and Other Changes in Net PositionGovernmental Activities
Taxes:Income taxes 330,863 311,492 298,209 296,507Property taxes 56,086 63,839 88,087 63,573Other taxes 28,680 27,312 28,450 25,053
Shared revenues 27,338 19,558 23,869 28,741Grants and contributions not restricted to specific programsState and local government funds 25,966 43,821 49,266 43,420Unrestricted investment earnings 692 97 654 1,740Other 18,141 19,086 14,104 10,207Transfers (1,589) (2,031) 19,278 (825)
Total Governmental Activities 486,177 483,174 521,917 468,416
Business-Type ActivitiesUnrestricted investment earnings 30 4 25Other Special items - gain on sale of captial assets 5,125Transfers 1,589 2,031 (19,278) 825
Total Business-Type Activities Expenses 1,589 7,186 (19,274) 850
Total Primary Government General Revenuesand Other Changes in Net Position 487,766 490,360 502,643 469,266
Change in Net PositionGovernmental Activities 40,864 14,273 33,348 (44,593)Business-Type Activities 56,410 16,755 25,141 (9,946)
Total Primary Government Change in Net Position $97,274 $31,028 $58,489 ($54,539)
Note:
Changes in Net PositionLast Ten Years
(Amounts in 000's)
Program revenues and expenses previously reported as “Other” program revenues and expenses in Governmental activities on the Statement of Activities are nowclassified as General Government program revenues and expenses as appropriate.Business-type activities on the Government-wide Statement of Activities summarizes other Enterprise Funds as Nonmajor activities. These include Sewer, PublicAuditorium, West Side Market, East Side Market, Municipal Parking Lots, Cemeteries and Golf Courses.(1) In 2012 a departmental reorganization occurred that merged the departments of Public Service with Parks, Recreation and Properties becoming the Department ofPublic Works. The Office of Capital Projects was created from the Divisions of Architecture, Engineering and Construction and Research, Planning and Developmentand is reported under General Government. In addition, the Division of Consumer Affairs was merged with Community Development and was moved from GeneralGovernment.
City of Cleveland, Ohio
- S4 -

2008 2007 2006 2005 2004 2003
$101,878 $99,311 $99,187 $97,544 $88,587 $96,757
87,154 86,435 81,248 80,888 78,634 80,698329,922 322,840 301,208 293,242 281,140 315,811
44,550 54,425 62,701 56,413 65,603 62,54315,831 13,999 13,832 10,650 10,703 12,93220,351 21,412 27,674 24,950 22,537 22,75061,628 54,332 45,546 44,840 42,734 47,72553,944 39,168 44,739 41,030 49,372 38,85032,896 27,763 32,162 27,557 30,815 29,065
748,154 719,685 708,297 677,114 670,125 707,131
213,335 205,470 204,994 192,187 188,118 173,179154,426 148,832 141,546 153,676 136,927 134,120172,274 167,967 157,976 146,807 145,749 143,147
44,507 45,762 42,112 41,526 41,333 42,606
584,542 568,031 546,628 534,196 512,127 493,052
1,332,696 1,287,716 1,254,925 1,211,310 1,182,252 1,200,183
(515,776) (437,513) (459,515) (460,451) (472,149) (494,645)53,851 85,122 30,922 52,631 46,249 41,532
(461,925) (352,391) (428,593) (407,820) (425,900) (453,113)
329,316 317,268 302,084 288,191 293,387 277,08665,398 69,313 66,762 64,390 69,483 63,49825,918 28,567 26,492 25,051 22,011 23,26628,587 23,805 16,949 22,468 20,470 20,799
1 94 10152,450 51,164 55,905 55,696 57,072 56,792
3,344 5,670 4,273 2,989 1,273 1,4439,556 14,482 18,460 21,135 18,855 8,855(306) (290) (390) (375) (2,283) 3,733
514,263 509,979 490,535 479,546 480,362 455,573
42 30 14 2,205 1,215 717946 93 4,212
306 290 390 375 2,283 (3,733)
348 320 404 3,526 3,591 1,196
514,611 510,299 490,939 483,072 483,953 456,769
(1,513) 72,466 31,020 19,095 8,213 (39,072)54,199 85,442 31,326 56,157 49,840 42,728
$52,686 $157,908 $62,346 $75,252 $58,053 $3,656
(Concluded)
- S4 -

2012 2011 2010 2009General Fund Reserved $ $ $15,070 $15,513 Unreserved (2,529) (9,648) Nonspendable 632 576 Assigned 9,239 12,027 Unassigned 61,879 38,991
Total General Fund 71,750 51,594 12,541 5,865
All Other Governmental Funds Reserved 257,696 263,059 Unreserved reported in: Special Revenue funds 64,432 45,781 Capital Projects funds 37,753 49,556 Nonspendable 495 1,172 Restricted 233,832 204,590 Committed 102,901 105,624 Assigned 2 1 Unassigned (96)
Total All Other Governmental Funds 337,230 311,291 359,881 358,396
Total Governmental Funds $408,980 $362,885 $372,422 $364,261
(1) Fund balance classifications changed in 2011 with the implementation of GASB No.54.
(Amounts in 000's)
City of Cleveland, OhioFund Balances, Governmental Funds
Last Ten Years (1)(Modified Accrual Basis of Accounting)
- S5 -

2008 2007 2006 2005 2004 2003
$14,689 $14,455 $13,029 $11,520 $13,258 $9,71916,856 17,399 22,502 24,693 21,376 14,932
31,545 31,854 35,531 36,213 34,634 24,651
272,039 277,669 278,984 280,042 272,122 276,518
72,421 77,223 77,287 65,786 89,325 88,25143,438 31,136 24,458 49,750 45,522 60,462
387,898 386,028 380,729 395,578 406,969 425,231
$419,443 $417,882 $416,260 $431,791 $441,603 $449,882
$0$100,000
$200,000$300,000
$400,000$500,000
2012 2011 2010 2009 2008 2007 2006 2005 2004 2003
Fund Balances - Governmental Funds(Amounts in 000's)
- S5 -

2012 2011 2010 2009
RevenuesIncome taxes $331,118 $312,508 $300,427 $298,546Property taxes 55,312 55,949 58,660 63,754State and local government funds 31,821 45,640 47,972 45,590Other taxes and shared revenues 86,084 77,636 79,620 81,440Licenses and permits 15,070 16,877 13,529 17,061Charges for services 41,436 39,433 33,779 22,136Fines, forfeits and settlements 26,830 28,376 28,643 32,321Investment earnings 468 518 621 2,691Grants 129,724 120,119 116,920 112,024Contributions 1,364 52 72 659Miscellaneous 18,770 15,356 16,490 25,811
Total Revenues 737,997 712,464 696,733 702,033
ExpendituresCurrent: General Government (1) 85,125 77,792 80,865 90,074 Public Works (1) 85,753 91,926 Public Service (1) 53,567 58,229 Public Safety 303,767 302,009 308,321 319,334 Community Development (1) 69,238 73,682 70,437 58,101 Building and Housing 14,542 14,031 17,401 20,841 Public Health 16,986 19,160 19,229 22,460 Parks, Recreation and Properties (1) 37,822 39,598 Economic Development 12,794 19,348 24,635 36,849 Other 10,992 11,171 11,490 10,446Capital outlay 69,945 66,575 56,227 66,720Inception of capital lease 5,648 4,566 3,201Debt issuance costInterest expenseDebt service: Principal retirement 48,115 47,481 48,223 53,048 Interest 33,741 30,628 28,682 32,942 General Government 1,264 438 18,722 477 Other 1,168 315 795 475
Total Expenditures 759,078 759,122 779,617 809,594
Excess (Deficiency) of Revenues Over (Under) Expenditures (21,081) (46,658) (82,884) (107,561)
Other Financing Sources (Uses)Transfers in 59,830 68,643 106,617 53,414Transfers out (62,145) (71,514) (88,152) (54,525)Issuance of debt 82,945 31,260 171,505 44,580Issuance of refunding bonds 13,820Proceeds from sale of debtPremium on bonds and notes 8,770 1,105 1,885 2,289Discount on bonds and notes (145) (217) (237)Payment to refund bonds and notes (28,910) (108,390) (13,767)Proceeds from sale of general obligation bonds and notesSale of development bondsLoan proceedsSale of City assets 324 1,229 1,127 6,568Proceeds from capital lease 6,507 6,615 6,690Inception of capital leasePremium on interest rate swap agreement
Total Other Financing Sources (Uses) 67,176 37,121 91,045 52,379
Net Change in Fund Balances $46,095 ($9,537) $8,161 ($55,182)Debt Service as a Percentage of Noncapital Expenditures 11.8% 11.1% 10.4% 11.5%
(Amounts in 000's)
City of Cleveland, OhioChanges in Fund Balances, Governmental Funds
Last Ten Years(Modified Accrual Basis of Accounting)
(1) In 2012 a departmental reorganization occurred that merged the departments of Public Service with Parks, Recreation and Properties becomingthe Department of Public Works. The Office of Capital Projects was created from the Divisions of Architecture, Engineering and Construction andResearch, Planning and Development and is reported under General Government. In addition, the Division of Consumer Affairs was merged withCommunity Development and was moved from General Government. Data for years prior to 2011 are unavailable.
- S6 -

2008 2007 2006 2005 2004 2003
$326,464 $311,784 $303,446 $292,193 $294,200 $278,71965,258 69,254 66,787 66,055 67,999 63,35352,269 53,506 55,908 55,899 55,808 55,46281,200 80,789 73,810 59,576 57,213 55,03015,047 13,802 14,520 14,806 16,033 13,72726,000 24,388 20,973 23,182 18,707 21,34534,763 31,246 27,877 19,985 19,611 25,689
8,871 16,875 13,809 8,774 3,758 3,63494,769 167,125 137,278 126,139 118,228 120,379
549 549 3,113 3,650 6,131 10127,649 18,581 18,683 14,394 21,462 17,013
732,839 787,899 736,204 684,653 679,150 654,452
91,664 84,578 74,905 71,107 71,291 74,128
60,105 60,700 58,739 60,049 56,044 56,761318,339 311,606 293,093 282,684 272,752 302,707
43,677 53,668 62,031 55,688 65,034 61,22715,691 13,892 13,668 10,472 10,497 11,93519,724 21,014 26,903 24,121 21,862 21,87042,593 40,494 37,817 35,503 32,934 37,82951,921 33,787 44,632 40,446 46,966 33,72810,627 9,206 9,256 11,212 11,510 14,19760,513 120,680 65,216 84,438 82,780 64,738
3,933 3,302 4,130 9,271818228
51,566 44,258 37,648 39,384 40,865 32,94934,318 30,075 31,462 29,822 32,002 27,400
5,3941,868 2,438 662 2,338 1,778 719
808,000 830,329 759,334 751,394 755,586 741,234
(75,161) (42,430) (23,130) (66,741) (76,436) (86,782)
57,550 61,064 41,853 43,245 47,256 59,368(58,243) (61,894) (42,665) (43,697) (50,271) (59,773)
266,160 121,395 35,1154,042 3,730 13,306 1,504 7,585(386) (18) (54) (200) 3,156
(192,675) (140,457) (94,145)
181,420 16,760 64,10032,315
11,365274 207 8,411 8,454
8,425 6,628 6,254(419)
5,100 76,722 44,052 7,599 56,929 68,157 117,686
$1,561 $1,622 ($15,531) ($9,812) ($8,279) $30,904
11.3% 10.3% 9.8% 10.3% 10.7% 8.7%
- S6 -

City of Cleveland, OhioAssessed Valuation and Estimated Actual Values of Taxable Property
Last Ten Years (Amounts in 000's)
Real Property Tangible Personal Property
Public UtilityEstimated Estimated
Collection Residential/ Commercial Actual Assessed ActualYear Agricultural Industrial/PU Value Value Value
2012 $2,641,867 $2,743,313 $15,386,229 $246,081 $279,638
2011 2,675,681 2,722,417 15,423,137 242,172 275,195
2010 2,693,686 2,585,663 15,083,857 233,870 265,761
2009 3,062,170 2,434,549 15,704,911 220,820 250,932
2008 3,041,791 2,438,801 15,658,834 210,970 239,739
2007 3,056,587 2,532,466 15,968,723 316,899 360,113
2006 2,662,461 2,285,525 14,137,103 314,385 357,256
2005 2,665,935 2,319,194 14,243,226 350,690 398,511
2004 2,666,178 2,232,575 13,996,437 355,889 404,419
2003 2,348,384 2,244,238 13,121,777 358,143 406,981
certain agricultural land and public utility property.
The percentage decreased to 0% in 2009 and remains at 0% in 2012.
by the State of Ohio from State resources. All taxable property remained at 88% true value.
The total direct rate is shown per $1,000 of assessed value.
Source: Cuyahoga County Auditor's Office.
true value. Effective in 2002, the valuation on electric utility production equipment was reduced from 100%to 25% of true value, with makeup payments in varying amounts to be made through 2016 to taxing subdivisions
Assessed Value
The assessed valuation level for real property in Cuyahoga County is 35% of appraised market value, except for
Beginning in 2003, the assessed valuation of personal property constituting "inventory" was reduced from 25%of true value to 23%, in 2006 it was further reduced to 18.75%, in 2007 to 12.50%, and in 2008 to 6.25%.
Electric deregulation took place January 1, 2001. Under prior law, an electric company's taxable productionequipment was assessed at 100% of true value, while all of its other taxable property was assessed at 88% of
- S7 -

Tangible Personal Property
General Business TotalEstimated Estimated Total
Assessed Actual Assessed Actual DirectValue Value Value Value Tax Rate Ratio
$0 $0 $5,631,261 $15,665,867 121.86 35.9 %
0 0 5,640,270 15,698,332 121.80 35.9
0 0 5,513,219 15,349,618 121.42 35.9
219,920 3,518,720 5,937,459 19,474,563 120.70 30.5
422,770 6,764,320 6,114,332 22,662,893 121.15 27.0
551,296 4,410,368 6,457,248 20,739,204 119.58 31.1
677,333 3,612,443 5,939,704 18,106,802 115.00 32.8
671,795 2,920,848 6,007,614 17,562,585 115.05 34.2
722,499 3,141,300 5,977,141 17,542,156 115.18 34.1
853,282 3,709,922 5,804,047 17,238,680 115.67 33.7
$0$1,000,000$2,000,000$3,000,000$4,000,000$5,000,000$6,000,000
2003 2004 2005 2006 2007 2008 2009 2010 2011 2012
Assessed Value of Taxable Property(Amounts in 000's)
Real Public Utility Personal General Business Personal
- S7 -

City of Cleveland, OhioProperty Tax Rates - Direct and Overlapping Governments
(Per $1,000 of Assessed Valuation)Last Ten Years
2012 2011 2010 2009
Unvoted MillageDebt 4.350000 4.350000 4.350000 4.350000Fire Pension 0.050000 0.050000 0.050000 0.050000
Total Unvoted Millage 4.400000 4.400000 4.400000 4.400000
Charter Millage Operating 7.750000 7.750000 7.750000 7.750000Fire Pension 0.250000 0.250000 0.250000 0.250000Police Pension 0.300000 0.300000 0.300000 0.300000
Total Charter Millage 8.300000 8.300000 8.300000 8.300000
Total Millage 12.700000 12.700000 12.700000 12.700000
Overlapping Rates by Taxing District
City School DistrictResidential/Agricultural Real 52.116544 31.674164 31.506887 31.460074Commercial/Industrial and Public Utility Real 60.128798 44.235815 44.362102 44.661412General Business and Public Utility Personal 79.800000 64.800000 64.800000 64.800000
CountyResidential/Agricultural Real 13.220000 13.118223 13.186617 13.178886Commercial/Industrial and Public Utility Real 12.996761 12.784540 12.841251 12.845700General Business and Public Utility Personal 13.220000 13.220000 13.320000 13.320000
Special Taxing Districts (1)Residential/Agricultural Real 11.391842 11.225159 11.207637 10.723710Commercial/Industrial and Public Utility Real 11.418198 11.232744 11.236434 10.859248General Business and Public Utility Personal 11.880000 11.880000 11.880000 11.580000
Note:
(1)
Source: Cuyahoga County Auditor's Office.
Cleveland Metropolitan Parks District, Cleveland-Cuyahoga County Port Authority, Cleveland Public Library andCuyahoga Community College. Prior to 2003, Cleveland Metropolitan Parks District and Cleveland Public Library only.
The rates presented for a particular calendar year are the rates that, when applied to the assessed values presented in theAssessed Value Table, generated the property tax revenue billed in that year. The City's basic property tax rate may beincreased only by a majority vote of the City's residents. Charter millage is consistently applied to all types of property.The real property tax rates for the voted levies of the overlapping taxing districts are reduced so that inflationary increasesin value do not generate additional revenue. Overlapping rates are those of local and county governments that apply toproperty owners within the City.
- S8 -

2008 2007 2006 2005 2004 2003
4.350000 4.350000 4.350000 4.350000 4.350000 4.3500000.050000 0.050000 0.050000 0.050000 0.050000 0.050000
4.400000 4.400000 4.400000 4.400000 4.400000 4.400000
7.750000 7.750000 7.750000 7.750000 7.750000 7.7500000.250000 0.250000 0.250000 0.250000 0.250000 0.2500000.300000 0.300000 0.300000 0.300000 0.300000 0.300000
8.300000 8.300000 8.300000 8.300000 8.300000 8.300000
12.700000 12.700000 12.700000 12.700000 12.700000 12.700000
29.076676 29.050497 29.002818 31.588821 31.586780 31.55919744.661009 44.592555 44.858685 48.826505 48.636211 48.76490964.800000 64.800000 64.800000 64.800000 64.800000 64.800000
12.660733 11.868868 11.865485 11.722742 10.975355 10.98985912.815297 12.453559 12.494099 12.588063 11.984633 12.04331613.320000 13.420000 13.420000 13.520000 13.520000 13.520000
10.330071 9.059500 9.045800 9.853500 9.851200 9.16830010.838537 10.191700 10.252900 11.084900 11.011300 10.52530011.580000 11.580000 11.580000 11.580000 11.580000 11.280000
- S8 -

Percent of CurrentCurrent Current Tax Collections Delinquent Total
Tax Tax To Current Tax TaxYear Levy Collections (1) Tax Levy Collections Collections
2012 $76,327,893 $58,664,824 76.86 % $6,972,134 $65,636,958
2011 74,312,975 59,301,577 79.80 5,104,558 $64,406,135
2010 73,818,689 59,078,863 80.03 5,259,959 $64,338,822
2009 76,071,934 63,707,028 83.75 5,351,909 $69,058,937
2008 77,142,266 66,210,703 85.83 6,416,603 $72,627,306
2007 79,578,480 68,823,516 86.49 5,675,616 $74,499,132
2006 74,560,517 65,617,123 88.01 5,523,803 $71,140,926
2005 77,325,122 67,759,024 87.63 5,428,007 $73,187,031
2004 76,856,612 67,571,431 87.92 7,055,068 $74,626,499
2003 73,483,514 65,058,362 88.53 5,052,595 $70,110,957
Note:The County does not identify delinquent collections by the year for which the tax was levied.
(1) State reimbursement of rollback and homestead exemptions are included.
Source: Cuyahoga County Auditor's Office.
City of Cleveland, OhioProperty Tax Levies and Collections
Last Ten Years
- S9 -

Percent of Total AccumulatedTotal Tax Collections Outstanding Percentage ofTax To Total Delinquent Delinquent TaxesLevy Tax Levy Taxes to Total Tax Levy
$122,143,372 53.74 % $47,654,232 39.01 %
109,926,575 58.59 44,679,192 40.64
107,119,066 60.06 39,704,298 37.07
107,873,764 64.02 36,999,445 34.30
107,071,494 67.83 31,984,896 29.87
108,161,761 68.88 22,770,570 21.05
100,452,563 70.82 21,063,311 20.97
100,842,631 72.58 26,330,702 26.11
102,396,067 72.88 24,928,208 24.34
95,920,068 73.09 25,151,032 26.22
- S9 -
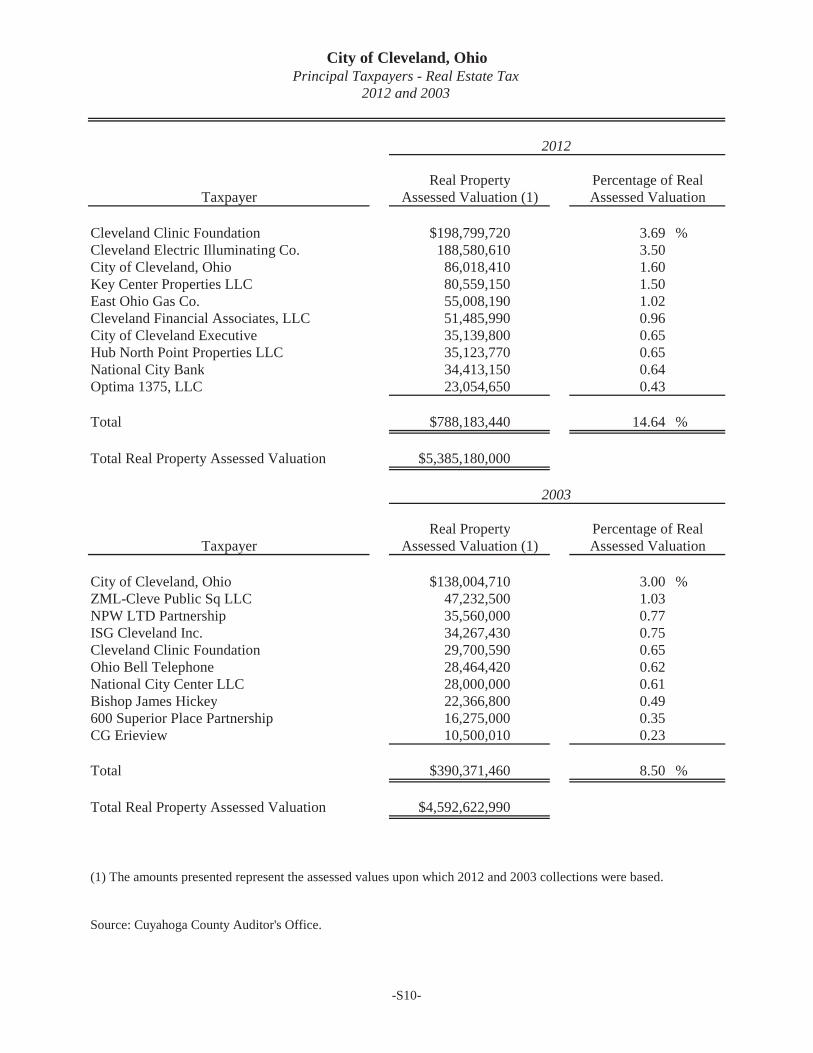
City of Cleveland, OhioPrincipal Taxpayers - Real Estate Tax
2012 and 2003
2012
Real Property Percentage of RealTaxpayer Assessed Valuation (1) Assessed Valuation
Cleveland Clinic Foundation $198,799,720 3.69 %Cleveland Electric Illuminating Co. 188,580,610 3.50City of Cleveland, Ohio 86,018,410 1.60Key Center Properties LLC 80,559,150 1.50East Ohio Gas Co. 55,008,190 1.02Cleveland Financial Associates, LLC 51,485,990 0.96City of Cleveland Executive 35,139,800 0.65Hub North Point Properties LLC 35,123,770 0.65National City Bank 34,413,150 0.64Optima 1375, LLC 23,054,650 0.43
Total $788,183,440 14.64 %
Total Real Property Assessed Valuation $5,385,180,000
2003
Real Property Percentage of RealTaxpayer Assessed Valuation (1) Assessed Valuation
City of Cleveland, Ohio $138,004,710 3.00 %ZML-Cleve Public Sq LLC 47,232,500 1.03NPW LTD Partnership 35,560,000 0.77ISG Cleveland Inc. 34,267,430 0.75Cleveland Clinic Foundation 29,700,590 0.65Ohio Bell Telephone 28,464,420 0.62National City Center LLC 28,000,000 0.61Bishop James Hickey 22,366,800 0.49600 Superior Place Partnership 16,275,000 0.35CG Erieview 10,500,010 0.23
Total $390,371,460 8.50 %
Total Real Property Assessed Valuation $4,592,622,990
(1) The amounts presented represent the assessed values upon which 2012 and 2003 collections were based.
Source: Cuyahoga County Auditor's Office.
-S10-

City of Cleveland, OhioIncome Tax Revenue Base and Collections
Last Ten Years
Percentage Percentage Percentageof Taxes of Taxes Taxes of Taxes
Tax Tax Total Tax Taxes from from Taxes From from From fromYear Rate Collected (1) Withholding Withholding Net Profits Net Profits Individuals Individuals
2012 $338,046,790 $285,450,129 $35,946,656 $16,650,005
2011 2.00 322,072,689 272,209,650 84.52 32,693,730 10.15 17,169,309 5.33
2010 2.00 310,339,588 261,801,977 84.36 32,095,566 10.34 16,442,045 5.30
2009 2.00 312,129,641 261,878,357 83.90 33,065,140 10.59 17,186,144 5.51
2008 2.00 335,310,894 277,203,932 82.67 38,709,596 11.54 19,397,366 5.78
2007 2.00 328,167,945 274,733,506 83.72 34,314,408 10.46 19,120,031 5.83
2006 2.00 311,254,815 260,697,679 83.76 32,469,591 10.43 18,087,545 5.81
2005 2.00 300,836,796 253,082,844 84.13 29,796,387 9.90 17,957,565 5.97
2004 2.00 300,041,379 255,039,437 85.00 25,919,958 8.64 19,081,984 6.36
2003 2.00 285,904,337 242,321,319 84.76 24,334,618 8.51 19,248,400 6.73
Note: The City is prohibited by statute from presenting information regarding individual taxpayers.
(1) Gross collections.
Source: Central Collection Agency.
2.00% 84.44% 4.93%10.63%
$0
$50
$100
$150
$200
$250
$300
$350
$400
2012201120102009200820072006200520042003
Income Tax Collections for the Last 10 Years(Amounts in millions)
Withholding Net Profits Individuals
- S11 -

Subordinated SubordinateGeneral Urban Non-Tax Income Tax Certificates Lien
Obligation Renewal Revenue Capital Refunding of Income TaxYear Bonds Bonds/Notes Bonds/Notes Leases Bonds Participation Bonds
2012 $308,700,000 $4,270,000 $55,894,000 $16,236,000 $50,020,000 $123,605,000 $92,380,000
2011 298,660,000 4,835,000 58,591,000 12,908,000 52,975,000 129,547,000 80,505,000
2010 297,115,000 5,365,000 61,795,000 8,937,000 55,785,000 135,537,000 83,025,000
2009 326,230,000 5,860,000 64,956,000 5,320,000 58,460,000 119,016,000 57,630,000
2008 313,630,000 6,325,000 67,617,000 8,604,000 59,960,000 129,949,000 59,560,000
2007 336,990,000 6,760,000 68,091,000 11,786,000 58,900,000 140,714,000
2006 323,795,000 7,170,000 69,353,000 15,057,000 60,700,000 143,950,000
2005 353,325,000 7,555,000 70,085,000 18,083,000 62,400,000 146,225,000
2004 346,700,000 12,215,000 70,715,000 11,750,000 64,000,000 148,485,000
2003 356,900,000 12,555,000 45,600,000 6,254,000 65,500,000 150,550,000
Note: Population and Personal Income data are presented on page S20.
Governmental Activities
City of Cleveland, OhioRatio of Outstanding Debt to
Total Personal Income and Debt Per CapitaLast Ten Years
- S12 -

Annual OWDA/ PercentageAppropriation Revenue OPWC Total of Personal Per
Bonds Bonds / Notes Loans Debt Income Capita
$10,765,000 $1,926,203,000 $109,742,000 $2,697,815,000 $6,799
11,000,000 1,930,163,000 115,523,000 2,694,707,000 41.66 6,791
11,000,000 1,974,828,000 121,335,000 2,754,722,000 48.58 6,942
2,032,178,000 107,654,000 2,777,304,000 40.62 5,805
2,100,768,000 112,275,000 2,858,688,000 41.81 5,975
2,075,755,000 110,070,000 2,809,066,000 41.09 5,872
1,995,045,000 103,415,000 2,718,485,000 39.76 5,682
2,049,820,000 78,498,000 2,785,991,000 40.75 5,824
2,102,986,000 52,616,000 2,809,467,000 41.09 5,873
2,160,842,000 33,045,000 2,831,246,000 41.41 5,918
Business-Type Activities
41.70%
$0
$1,000
$2,000
$3,000
$4,000
$5,000
$6,000
$7,000
$8,000
YEAR
Total Debt Per CapitaLast 10 Years
- S12 -

Estimated Ratio ofActual Value Net Bonded
of Taxable Net Debt to Estimated Net BondedProperty (2) Bonded Actual Value of Debt Per
Year Population (1) (Amount in 000's) Debt Taxable Property Capita
2012 396,815 (a) $5,631,261 $302,484,000 5.37 % $762.28
2011 396,815 (a) 5,640,270 297,172,000 5.27 748.89
2010 396,815 (a) 5,513,219 294,923,000 5.35 743.23
2009 478,403 (b) 5,937,459 323,631,000 5.45 676.48
2008 478,403 (b) 6,114,332 311,134,000 5.09 650.36
2007 478,403 (b) 6,457,248 333,823,000 5.17 697.79
2006 478,403 (b) 5,939,704 320,265,000 5.39 669.45
2005 478,403 (b) 6,007,614 348,004,000 5.79 727.43
2004 478,403 (b) 5,977,141 339,209,000 5.68 709.04
2003 478,403 (b) 5,804,047 352,569,000 6.07 736.97
Note: Net Bonded Debt includes all general obligation bonded debt less balance in debt service fund.
Sources:
(1) U. S. Bureau of Census, Census of Population: (a) 2010 Federal Census (b) 2000 Federal Census(2) Cuyahoga County Fiscal Officer's Office.
City of Cleveland, OhioRatio of General Obligation Bonded Debt to Assessed
Value and Bonded Debt Per CapitaLast Ten Years
- S13 -

City of Cleveland, OhioComputation of Direct and Overlapping Governmental Activities Debt
December 31, 2012
Governmental AmountActivities Debt Applicable
Jurisdiction Outstanding to City
Direct - City of ClevelandGeneral Obligation Bonds $308,700,000 100.00 % $308,700,000Capital Leases 16,236,000 100.00 16,236,000Urban Renewal Bonds 4,270,000 100.00 4,270,000Subordinated Income Tax Refunding Bonds 50,020,000 100.00 50,020,000Subordinate Lien Income Tax Bonds 92,380,000 100.00 92,380,000Non-tax Revenue Bonds 55,894,000 100.00 55,894,000Annual Appropriation Bonds 10,765,000 100.00 10,765,000
Total Direct Debt 538,265,000 538,265,000
OverlappingCleveland Municipal School District
General Obligation Bonds (1) 159,744,118 97.00 154,951,794Cuyahoga County
General Obligation Bonds (1) 341,075,645 18.90 64,463,297Regional Transit Authority (1) 129,495,000 18.90 24,474,555
Total Overlapping Debt 630,314,763 243,889,646
Total $1,168,579,763 $782,154,646
(1) Percentages were determined by dividing each overlapping subdivision's assessed valuation within the City by its total assessedvaluation.
Source: Cuyahoga County Fiscal Officer's Office.
PercentageApplicableto City (1)
- S14 -

City of Cleveland, OhioLegal Debt Margin
Last Ten Years
2012 2011 2010 2009
Total Assessed Property Value $5,631,261,380 $5,640,270,380 $5,513,219,400 $5,937,458,591
Overall Legal Debt Limit(10½% of Assessed Valuation) 591,282,445 592,228,390 578,888,037 623,433,152
Debt Outstanding:General Obligation Bonds 308,700,000 298,660,000 297,115,000 326,230,000Revenue Notes/Bonds 1,926,203,000 1,930,163,000 1,974,828,000 2,032,178,000Urban Renewal Bonds/Notes 4,270,000 4,835,000 5,365,000 5,860,000Subordinated Income Tax Refunding Bonds 50,020,000 52,975,000 55,785,000 58,460,000Subordinate Lien Income Tax Bonds 92,380,000 80,505,000 83,025,000 57,630,000OWDA/OPWC Loans 109,742,000 115,523,000 121,335,000 107,654,000Non-tax Revenue Bonds 55,894,000 58,591,000 61,795,000 64,956,000Annual Appropriation Bonds 10,765,000 11,000,000 11,000,000
Total Gross Indebtedness 2,557,974,000 2,552,252,000 2,610,248,000 2,652,968,000Less:
General Obligation Bonds 308,700,000 298,660,000 297,115,000 326,230,000Revenue Notes/Bonds 1,926,203,000 1,930,163,000 1,974,828,000 2,032,178,000Urban Renewal Bonds/Notes 4,270,000 4,835,000 5,365,000 5,860,000Subordinated Income Tax Refunding Bonds 50,020,000 52,975,000 55,785,000 58,460,000Subordinate Lien Income Tax Bonds 92,380,000 80,505,000 83,025,000 57,630,000OWDA/OPWC Loans 109,742,000 115,523,000 121,335,000 107,654,000Non-tax Revenue Bonds 55,894,000 58,591,000 61,795,000 64,950,000Annual Appropriation Bonds 10,765,000 11,000,000 11,000,000General Obligation Bond Retirement Fund Balance 6,216,000 1,488,000 2,192,000 2,599,000
Total Net Debt Applicable to Debt Limit* - - - -
Legal Debt Margin Within 10½% Limitations $591,282,445 $592,228,390 $578,888,037 $623,433,152
Legal Debt Margin as a Percentage of the Debt Limit 100.00% 100.00% 100.00% 100.00%
Unvoted Debt Limitation $309,719,376 $310,214,871 $303,227,067 $326,560,223(5½% of Assessed Valuation)
Total Gross Indebtedness 2,557,974,000 2,552,252,000 2,610,248,000 2,652,968,000Less:
General Obligation Bonds 308,700,000 298,660,000 297,115,000 326,230,000Revenue Notes/Bonds 1,926,203,000 1,930,163,000 1,974,828,000 2,032,178,000Urban Renewal Bonds/Notes 4,270,000 4,835,000 5,365,000 5,860,000Subordinated Income Tax Refunding Bonds 50,020,000 52,975,000 55,785,000 58,460,000Subordinate Lien Income Tax Bonds 92,380,000 80,505,000 83,025,000 57,630,000OWDA/OPWC Loans 109,742,000 115,523,000 121,335,000 107,654,000Non-tax Revenue Bonds 55,894,000 58,591,000 61,795,000 64,950,000Annual Appropriation Bonds 10,765,000 11,000,000 11,000,000General Obligation Bond Retirement Fund Balance 6,216,000 1,488,000 2,192,000 2,599,000
Net Debt Within 5½% Limitations* - - - -
Unvoted Legal Debt Margin Within 5½% Limitations $309,719,376 $310,214,871 $303,227,067 $326,560,223
Unvoted legal Debt Margin as a Percentage of theUnvoted Debt Limitation 100.00% 100.00% 100.00% 100.00%
* The City does not report net debt limits below zero, therefore if the net debt limit is negative it is considered to be equal to zero.The types of Debt issued by the City are exempt from the limitations defined in the Ohio Revised Code.
Source: City Financial Records.
- S15 -

2008 2007 2006 2005 2004 2003
$6,114,332,281 $6,457,247,750 $5,939,704,867 $6,007,616,318 $5,977,142,243 $5,804,048,750
642,004,890 678,011,014 623,669,011 630,799,713 627,599,936 609,425,119
313,630,000 336,990,000 323,795,000 353,325,000 346,700,000 356,900,0002,100,768,000 2,075,755,000 1,995,045,000 2,049,820,000 2,102,986,000 2,160,842,000
6,325,000 6,760,000 7,170,000 7,555,000 12,215,000 12,555,00059,960,000 58,900,000 60,700,000 62,400,000 64,000,000 65,500,00059,560,000
112,275,000 110,070,000 103,415,000 78,498,000 52,616,000 33,045,00067,617,000 68,091,000 69,353,000 70,085,000 70,715,000 45,600,000
2,720,135,000 2,656,566,000 2,559,478,000 2,621,683,000 2,649,232,000 2,674,442,000
313,630,000 336,990,000 323,795,000 353,325,000 346,700,000 356,900,0002,100,768,000 2,075,755,000 1,995,045,000 2,049,820,000 2,102,986,000 2,160,842,000
6,325,000 6,760,000 7,170,000 7,555,000 12,215,000 12,555,00059,960,000 58,900,000 60,700,000 62,400,000 64,000,000 65,500,00059,560,000
112,275,000 110,070,000 103,415,000 78,498,000 52,616,000 33,045,00067,617,000 68,091,000 69,353,000 70,085,000 70,715,000 45,600,000
2,496,000 3,167,000 3,530,000 5,321,000 7,491,000 4,331,000
- - - - - -
$642,004,890 $678,011,014 $623,669,011 $630,799,713 $627,599,936 $609,425,119
100.00% 100.00% 100.00% 100.00% 100.00% 100.00%
$336,288,276 $355,148,626 $326,683,768 $330,418,898 $328,742,823 $319,222,681
2,720,135,000 2,656,566,000 2,559,478,000 2,621,683,000 2,649,232,000 2,674,442,000
313,630,000 336,990,000 323,795,000 353,325,000 346,700,000 356,900,0002,100,768,000 2,075,755,000 1,995,045,000 2,049,820,000 2,102,986,000 2,160,842,000
6,325,000 6,760,000 7,170,000 7,555,000 12,215,000 12,555,00059,960,000 58,900,000 60,700,000 62,400,000 64,000,000 65,500,00059,560,000
112,275,000 110,070,000 103,415,000 78,498,000 52,616,000 33,045,00067,617,000 68,091,000 69,353,000 70,085,000 70,715,000 45,600,000
2,496,000 3,167,000 3,530,000 5,321,000 7,491,000 4,331,000
- - - - - -
$336,288,276 $355,148,626 $326,683,768 $330,418,898 $328,742,823 $319,222,681
100.00% 100.00% 100.00% 100.00% 100.00% 100.00%
- S15 -

City of Cleveland, OhioPledged Revenue Coverage
Airport Revenue BondsLast Ten Years
Direct Net Revenues Debt ServiceGross Operating Available for
Year Revenues (1) Expenses (2) Debt Service Principal Interest Coverage
2012 $152,030,000 $68,855,000 $83,175,000 $16,285,000 $33,765,871 1.66
2011 150,112,000 73,310,000 76,802,000 13,660,000 34,940,285 1.58
2010 152,053,000 70,152,000 81,901,000 14,705,000 36,386,915 1.60
2009 167,358,000 68,432,000 98,926,000 22,450,000 37,622,000 1.65
2008 160,455,000 74,885,000 85,570,000 16,830,000 40,497,264 1.49
2007 151,430,000 69,358,000 82,072,000 20,160,000 34,968,361 1.49
2006 135,883,000 62,426,000 73,457,000 17,775,000 39,565,000 1.28
2005 140,157,000 66,957,000 73,200,000 10,895,000 43,026,000 1.36
2004 135,117,000 58,647,000 76,470,000 9,373,000 35,817,000 1.69
2003 107,758,000 57,845,000 49,913,000 11,104,000 25,128,000 1.38
(1) Gross revenues include operating revenues plus interest income. Beginning in 2001, a minimum of 40% of passenger facility charges, as well asgrant funds from the FAA for the new runway, are dedicated to the payment of debt service charges and are included in gross revenues. Beginningin 2007, the Coverage Account was included in the calculation of debt service coverage.
(2) Direct operating expenses are calculated in accordance with the bond indenture.
- S16 -

City of Cleveland, OhioPledged Revenue Coverage
Power System Revenue BondsLast Ten Years
Direct Net Revenues Debt ServiceGross Operating Available for
Year Revenues (1) Expenses (2) Debt Service Principal Interest Coverage
2012 $165,307,000 $136,987,000 $28,320,000 $10,050,000 $9,746,181 (3) 1.43
2011 168,599,000 139,952,000 28,647,000 10,495,000 9,987,500 (3) 1.40
2010 166,761,000 138,030,000 28,731,000 8,045,000 9,871,011 1.60
2009 156,034,000 128,436,000 27,598,000 8,530,000 9,009,810 1.57
2008 160,224,000 124,161,000 36,063,000 8,335,000 9,054,492 2.07
2007 159,232,000 120,415,000 38,817,000 8,045,000 9,368,159 2.23
2006 149,276,000 114,942,000 34,334,000 11,025,000 8,144,118 1.79
2005 152,146,000 125,924,000 26,222,000 4,920,000 9,813,126 1.78
2004 142,148,000 109,275,000 32,873,000 9,410,000 10,447,476 1.66
2003 141,190,000 104,940,000 36,250,000 7,865,000 10,886,836 1.93
(3) Net of capitalized interest per indenture.
(1) Gross revenues include operating revenues plus interest income.
(2) Direct operating expenses are calculated in accordance with the bond indenture.
- S17 -

City of Cleveland, OhioPledged Revenue Coverage
Water System Revenue BondsLast Ten Years
Direct Net Revenues Debt ServiceGross Operating Available for
Year Revenues (1) Expenses (2) Debt Service Principal Interest (3) Coverage
2012 $282,288,000 $149,169,000 $133,119,000 $31,100,000 $26,639,529 2.31
2011 238,975,000 146,232,000 92,743,000 34,000,000 30,275,641 1.44
2010 241,277,000 149,513,000 91,764,000 37,150,000 32,447,214 1.32
2009 232,357,000 147,716,000 84,641,000 31,945,000 33,200,509 1.30
2008 252,660,000 143,833,000 108,827,000 27,285,000 38,139,614 1.66
2007 257,992,000 140,210,000 117,782,000 19,660,000 30,660,206 2.34
2006 223,903,000 132,879,000 91,024,000 17,695,000 35,300,322 1.72
2005 230,354,000 123,931,000 106,423,000 15,485,000 36,763,888 2.04
2004 215,012,000 127,021,000 87,991,000 20,748,333 30,184,582 1.73
2003 210,352,000 123,640,000 86,712,000 25,160,000 33,188,434 1.49
(2) Direct operating expenses are calculated in accordance with the bond indenture.
(1) Gross revenues include operating revenues plus interest income.
(3) Per indenture, interest expense is reduced by amount released from reserve fund at the start of year.
- S18 -

City of Cleveland, OhioPrincipal Employers
2012 and 2003
2012
Percentage ofTotal City
Employer Employment
Cleveland Clinic 33,000University Hospitals of Cleveland 15,123 10.27Cuyahoga County 7,709 5.23United States Postal Service 7,565 5.14City of Cleveland 7,061 4.79Cleveland Metropolitan School District 6,246 4.24KeyCorp 5,983 4.06The MetroHealth System 5,238 3.56Case Western Reserve University 4,636 3.15UPS 3,168 2.15
Total 95,729
Total Employment within the City 147,300
2003
Percentage ofTotal City
Employer Employment
Cleveland Clinic Health Systems 23,567University Hospitals Health System 14,270 7.93Cleveland City School District 10,510 5.84Cuyahoga County 9,376 5.21City of Cleveland 8,658 4.81KeyCorp 7,381 4.10United States Postal Service 5,548 3.09The MetroHealth System 5,411 3.01National City Corp. 5,400 3.00Case Western Reserve University 5,249 2.92
Total 95,370
Total Employment within the City 179,900
Note:Largest employers headquartered in the City ranked by FTE employees.
Source: Number of employees from Crain's Cleveland: Book of Lists 2013, Largest Northeast Ohio Employers; FTEs as of 6/30/2012 Book of Lists 2004, Largest Cuyahoga County Employers; FTEs as of 01/01/2003
13.10%
53.01%
64.99%
Employees
Employees
22.40%
- S19 -
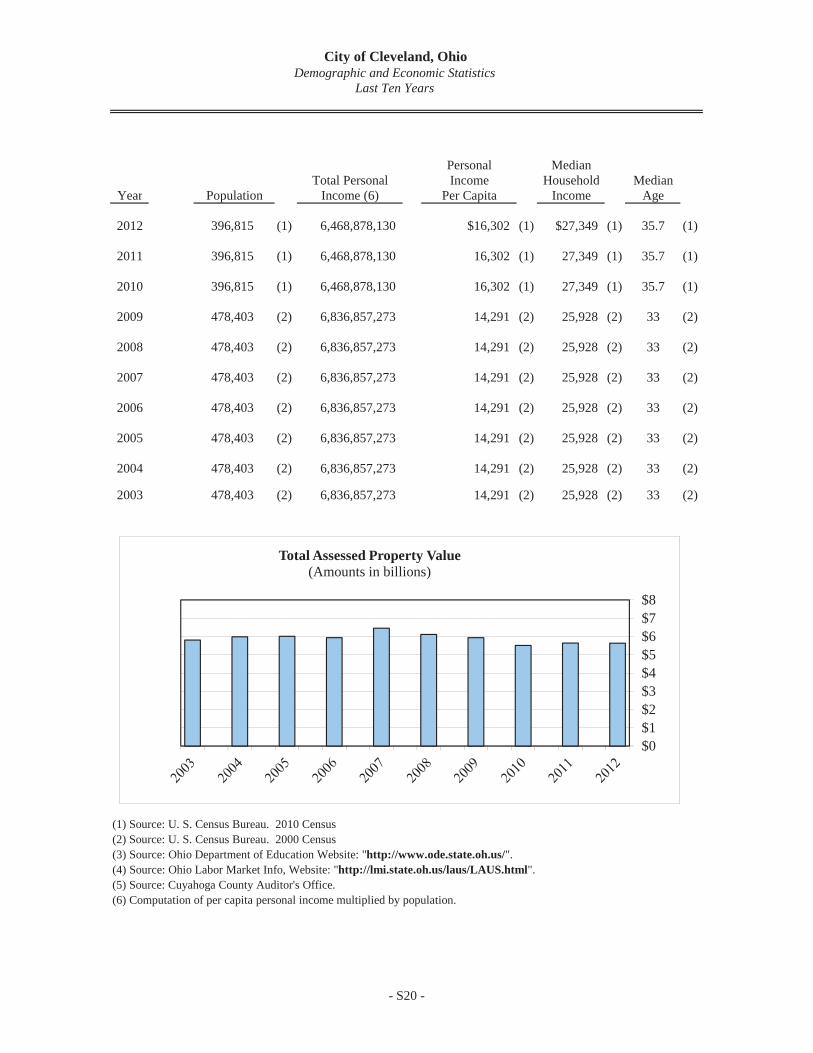
City of Cleveland, OhioDemographic and Economic Statistics
Last Ten Years
Personal MedianTotal Personal Income Household Median
Year Population Income (6) Per Capita Income Age
2012 396,815 (1) 6,468,878,130 $16,302 (1) $27,349 (1) 35.7 (1)
2011 396,815 (1) 6,468,878,130 16,302 (1) 27,349 (1) 35.7 (1)
2010 396,815 (1) 6,468,878,130 16,302 (1) 27,349 (1) 35.7 (1)
2009 478,403 (2) 6,836,857,273 14,291 (2) 25,928 (2) 33 (2)
2008 478,403 (2) 6,836,857,273 14,291 (2) 25,928 (2) 33 (2)
2007 478,403 (2) 6,836,857,273 14,291 (2) 25,928 (2) 33 (2)
2006 478,403 (2) 6,836,857,273 14,291 (2) 25,928 (2) 33 (2)
2005 478,403 (2) 6,836,857,273 14,291 (2) 25,928 (2) 33 (2)
2004 478,403 (2) 6,836,857,273 14,291 (2) 25,928 (2) 33 (2)
2003 478,403 (2) 6,836,857,273 14,291 (2) 25,928 (2) 33 (2)
(1) Source: U. S. Census Bureau. 2010 Census(2) Source: U. S. Census Bureau. 2000 Census(3) Source: Ohio Department of Education Website: "http://www.ode.state.oh.us/".(4) Source: Ohio Labor Market Info, Website: "http://lmi.state.oh.us/laus/LAUS.html".(5) Source: Cuyahoga County Auditor's Office.(6) Computation of per capita personal income multiplied by population.
$0$1$2$3$4$5$6$7$8
Total Assessed Property Value(Amounts in billions)
- S20 -

Educational Average TotalAttainment: Sales AssessedBachelor's City Price of Property
Degree School Unemployment Residential Value (5)or Higher Enrollment (3) Rate (4) Property (5) (Amount in 000's)
(1) 42,883 8.5% $55,774 $5,631,261
13.1 (1) 45,060 10.0 54,638 5,640,270
13.1 (1) 47,615 11.5 60,398 5,513,219
11.4 (2) 74,615 10.6 57,075 5,937,459
11.4 (2) 50,078 8.8 50,515 6,114,332
11.4 (2) 52,769 7.6 57,230 6,457,248
11.4 (2) 59,586 7.1 83,237 5,939,704
11.4 (2) 65,079 7.7 86,142 6,007,614
11.4 (2) 69,655 8.3 81,185 5,977,141
11.4 (2) 71,616 8.3 83,216 5,804,047
13.1%
$0
$20
$40
$60
$80
$100
$120
Average Sales Price of Residential Property(Amounts in 000's)
- S20 -

Function/Program 2012 2011 2010
General GovernmentCouncil 61.50 63.00 62.00Mayor's Office 25.50 24.50 25.50Office of Capital Projects 46.00 (4)Landmarks Commission 5.00 5.00 5.50Building Standards and Appeals 6.00 6.00 5.50Board of Zoning Appeals 4.50 4.50 4.00Civil Service Commission 10.00 9.50 11.00Community Relations Board 24.00 28.00 30.50City Planning Commission 20.50 21.50 24.00Equal Employment Opportunity 8.00 8.00 10.00Court 461.00 479.50 531.00Office of Budget Administration 7.00 7.00 7.00Aging 22.00 25.00 24.50Personnel and Human Resources 18.00 16.00 16.50Consumer Affairs 0.00 (4) 4.00 3.00Law 72.50 76.00 87.00Finance 232.00 234.00 241.50
Security of Persons and PropertyAdministration 36.50 36.50 40.00Police 1,873.00 1,869.50 1,983.50Fire 729.00 803.00 875.00EMS 232.00 214.00 218.00Dog Pound 14.50 15.00 16.00House of Corrections 133.00 153.00 170.00
Public Health Services 125.50 140.50 159.50Leisure Time Activities
Parks, Recreation and Property Administration 0.00 (4) 8.00 7.00Research, Planning and Development 0.00 (4) 5.00 6.00Recreation 190.50 189.00 230.00Convention Center, Westside Market and Cleveland Stadium 42.50 29.50 27.50Parking Facilities 39.50 42.50 42.50Property Management 70.50 73.50 81.50Parks Maintenance 119.00 126.00 140.00
Community Development 78.50 76.50 87.00Building and Housing 113.00 120.00 134.50Economic Development 26.00 28.00 34.00Public Works
Public Works Administration 34.00 5.50 4.50Architecture 0.00 (4) 5.00 6.00Waste Collection and Disposal 206.50 212.50 238.50Engineering and Construction 0.00 (4) 31.50 59.50Motor Vehicle Maintenance 68.00 75.00 81.00Streets 260.00 285.00 257.50Traffic Engineering 29.00 36.00 38.00
Port Control 404.50 418.00 446.50Basic Utility Services
Water 1,093.00 1,157.00 1,164.50Cleveland Public Power 335.00 358.00 345.00Water Pollution Control 136.00 148.50 158.00
Totals: 7,412.50 7,673.00 8,139.50
Method: Using 1.0 for each full-time employee and 0.50 for each part-time and seasonal employee at year end.
(1) Information prior to 2004 is not available.(2) Building and Housing was moved from Community Development to its own department in 2005.(3) House of Corrections was moved from Public Health to Public Safety in 2007.
N/A - Information not available.
Source: City Payroll Department.
City of Cleveland, OhioFull-Time Equivalent City Government Employees by Function/Program
Last Nine Years (1)
(4) In 2012 a departmental reorganization occurred that merged the departments of Public Service with Parks, Recreation and Properties becoming theDepartment of Public Works. The Office of Capital Projects was created from the Divisions of Architecture, Engineering and Construction andResearch, Planning and Development and is reported under General Government. In addition, the Division of Consumer Affairs was merged withCommunity Development and was moved from General Government.
- S21 -

2009 2008 2007 2006 2005 2004
65.50 64.50 62.50 63.50 65.00 66.0025.50 27.50 26.00 25.00 29.50 27.00
5.50 5.50 5.50 5.00 4.50 4.505.50 5.50 5.50 5.00 6.00 6.004.50 4.50 4.50 4.50 5.50 5.50
10.50 10.00 11.50 10.00 10.50 12.5029.00 27.50 27.00 28.50 23.50 24.5024.00 23.00 26.00 23.00 26.00 27.0010.00 11.00 13.00 13.00 14.00 12.00
542.50 541.50 551.00 544.00 541.50 534.505.50 7.00 8.00 7.00 7.00 8.00
21.50 21.00 22.50 20.50 18.00 18.0015.00 17.00 20.00 19.00 18.00 91.50
5.00 6.00 5.00 5.00 3.00 4.0088.50 86.50 89.50 88.50 89.00 93.00
248.50 250.50 255.00 255.00 255.50 245.50
39.00 39.00 42.50 39.50 39.00 41.502,079.00 2,095.50 2,105.00 2,176.50 2,179.00 2,145.50
894.00 883.00 902.00 915.00 916.00 913.00236.00 252.00 288.00 292.00 297.00 298.00
15.00 14.50 14.50 14.50 13.00 13.00188.00 176.50 183.50 (3) N/A N/A N/A168.50 169.50 168.50 (3) 260.00 253.00 261.50
7.00 7.00 8.00 8.00 7.00 9.008.00 9.00 9.00 9.00 10.00 10.00
238.00 233.50 238.00 165.00 170.50 176.0031.00 54.50 59.50 49.50 54.00 49.5041.00 44.50 49.00 46.50 47.50 56.0084.50 87.50 89.50 93.00 100.00 99.50
141.00 151.00 164.00 161.00 170.00 167.0086.00 77.50 78.50 81.00 87.50 (2) 271.50
142.00 147.00 161.00 165.00 170.00 (2) 0.0068.00 73.00 88.00 94.00 98.00 29.00
4.50 5.00 5.00 5.00 5.00 6.006.00 7.00 8.00 9.00 9.00 9.00
253.50 225.50 252.50 244.50 225.50 223.5061.50 60.50 65.50 65.50 69.50 70.0085.00 86.00 95.00 102.00 100.00 102.00
271.50 283.50 306.00 288.50 303.00 287.0039.00 40.00 41.00 44.00 44.00 3.00
447.50 406.50 386.00 369.50 377.50 402.00
1,179.50 1,215.50 1,194.00 1,207.00 1,216.00 1,263.50343.00 340.00 341.00 337.00 341.00 347.00157.00 150.00 157.00 144.00 147.00 147.00
8,420.50 8,442.50 8,632.00 8,502.00 8,565.50 8,579.50
- S21 -

Function/Program 2012 2011 2010 2009
General GovernmentCouncil and Clerk
Number of ordinances passed 631 723 621 772Number of resolutions passed 739 647 747 776Number of planning commission docket items (4) 359 262 298 309Zoning board of appeals docket items 237 241 274 267
Finance DepartmentNumber of payments issued 38,010 38,501 37,944 44,289Total amount of payments $1,236,189,641 $1,311,830,974 $1,276,014,604 $1,307,460,874Interest earnings for fiscal year (cash basis) $3,283,638 $4,061,090 $7,507,827 $13,219,445Number of receiving warrants (8) 32,087 30,433 31,497 16,369Number of journal entries issued (8) 190,554 179,546 192,281 41,238Number of budget adjustments issued 4 6 2 2Agency ratings - Standard & Poor's (1) AA AA AA AAAgency ratings - Moody's Financial Services (1) A1 A1 A1 A2Health insurance costs vs. General Fund expenditures % 15% 18% 17% 15%General Fund receipts (cash basis in thousands) $501,018 $496,086 $480,724 $487,678General Fund expenditures (cash basis in thousands) $468,543 $472,883 $482,227 $501,758General Fund cash balances (in thousands) $84,869 $54,888 $16,400 $12,327
Income Tax DepartmentNumber of individual returns 192,362 196,457 202,232 211,241Number of business returns 25,140 26,240 26,881 26,326Number of business withholding accounts 14,414 14,338 13,835 14,542Amount of penalties and interest collected $1,771,088 $2,059,203 $1,754,501 $1,884,453Annual number of corporate withholding forms processed 147,175 149,537 149,584 144,493Annual number of balance due statements forms processed 37,642 38,152 36,188 38,610Annual number of estimated payment forms processed 41,813 41,636 42,767 47,841Annual number of reconciliations of withholdings processed 11,416 11,376 11,357 12,213
Engineer Contracted Services Dollar amount of construction overseen by engineer (2) $25,400,000 $30,760,000 $34,000,000 $32,000,000
Municipal Court Number of civil cases (10) 9,451 11,513 19,280 16,375Number of criminal cases (10) 110,754 107,711 167,563 120,131
Vital StatisticsCertificates filed (3)
Number of births 17,264 16,616 15,528 16,403Number of deaths 13,016 12,958 12,296 12,101Number of fetal deaths 384 459 454 401
Certificates issued (3)Number of births 57,297 57,542 62,507 69,785Number of deaths 60,173 61,147 59,689 60,465
Civil Service Number of police entry tests administered 0 0 0 1Number of fire entry tests administered 0 0 1 0Number of police promotional tests administered 0 1 0 0Number of fire promotional tests administered 0 1 0 0Number of hires of police officers from certified lists 50 42 0 56Number of hires of fire/medics from certified lists 0 0 0 22Number of promotions from police certified lists 33 0 0 20Number of promotions from fire certified lists 42 0 0 0
City of Cleveland, OhioOperating Indicators by Function/Program
Last Ten Years
- S22 -

2008 2007 2006 2005 2004 2003
771 784 846 899 891 1,028304 363 361 306 292 349444 441 768 725 669 538242 263 265 394 337 349
47,670 47,985 49,533 50,541 48,808 51,922$1,251,719,916 $1,287,268,015 $1,284,108,296 $1,266,586,217 $1,211,743,500 $1,211,440,564
$45,366,880 $63,335,510 $53,988,258 $42,035,213 $38,154,383 $39,688,08016,141 15,300 14,799 14,485 14,344 58,96741,217 43,619 43,186 39,839 41,543 54,095
5 2 3 5 4 4AA A A A A A A2 A2 A2 A2 A2 A2
14% 14% 14% 14% 12% 12%$517,796 $509,616 $490,927 $471,755 $455,775 $459,365$501,124 $485,410 $465,162 $451,323 $484,856 $437,964
$40,685 $41,885 $30,957 $29,738 $24,058 $17,676
232,210 238,319 248,108 267,712 287,904 299,08129,014 28,335 30,567 25,763 30,584 29,82514,653 14,469 16,200 14,942 15,503 15,520
$2,357,490 $1,912,554 $1,999,859 $1,990,879 $2,471,464 $2,233,996151,256 152,334 169,933 136,931 148,779 147,478
44,637 39,767 45,909 47,252 53,458 58,68951,527 57,092 56,163 55,036 62,115 64,78012,198 12,488 18,929 9,075 14,723 13,000
$159,540,000 $251,305,000 $141,733,000 $52,741,000 $78,562,000 $49,716,000
19,890 18,569 22,909 21,567 22,418 23,133120,077 113,661 121,676 121,791 113,822 151,395
16,942 17,235 17,645 17,638 18,191 18,54212,354 12,086 11,992 12,343 12,296 11,825
447 399 312 361 294 477
77,967 102,140 98,545 101,284 58,452 N/A65,149 64,436 84,615 66,268 38,684 N/A
0 1 0 0 0 00 0 0 0 0 03 0 0 0 0 00 0 0 0 0 0
106 73 0 0 0 00 0 0 0 0 0
40 0 0 39 19 2310 49 0 0 0 0
(Continued)
- S22 -

Function/Program 2012 2011 2010 2009
Building Department IndicatorsConstruction permits issued 16,245 15,082 6,829 8,334Estimated value of construction $1,033,330,550 $1,556,000,000 $729,883,689 $919,923,776Number of other permits issued 4,854 4,164 8,629 8,290Amount of revenue generated from permits $7,867,168 $8,306,423 $6,078,922 $7,332,522Number of contract registrations issued 2,802 2,822 2,895 2,847Annual apartment/rooming house license fees $1,305,182 $1,343,457 $1,571,317 $1,281,530
Security of Persons and PropertyPolice
Number of traffic citations issued 121,474 119,371 75,362 77,037Number of parking citations issued 42,404 42,763 48,691 59,598Number of criminal arrests 35,730 37,531 39,657 38,613Number of accident reports completed 14,549 15,444 14,761 14,804Part 1 offenses (major offenses) 39,028 40,554 38,003 38,586DUI arrests 790 679 729 738Prisoners 35,251 37,235 39,156 37,864Motor vehicle accidents 14,549 15,412 14,761 14,804Fatalities from motor vehicle accidents 31 29 49 38Community diversion program youths 152 188 196 139
FireFire calls - incoming for services (6) 65,040 65,132 60,076 60,306Fires 2,846 2,714 2,869 2,794Fires with loss 1,372 1,398 1,266 843Fires with losses exceeding $10K 259 256 219 237Fire losses $ $13,128,848 $14,747,291 $12,035,650 $12,312,407Fire safety inspections 13,380 10,898 13,631 13,982Number of times mutual aid given to fire 30 21 29 17
EMSEMS calls - incoming for service 96,359 94,307 92,230 89,632Ambulance billing collections (net) $12,051,964 $11,594,178 $10,832,204 $9,649,887
Public Health and WelfareNumber of health inspections
Barber shops 333 400 238 219Food 7,674 7,369 7,624 8,684Hotels/motels 38 42 36 34Marinas 0 11 11 11Mobile home parks 5 12 5 5Laundries 62 87 69 58Nuisance 21,118 19,136 24,130 27,544Pools 161 204 120 142Schools 419 480 390 349
Day care inspections 161 229 223 209Maternity inspections 0 4 4 4Abortion inspections 5 6 6 6Cemetery burials 0 0 0 3Cemetery cremations 196 177 169 155
City of Cleveland, OhioOperating Indicators by Function/Program
Last Ten Years
- S22 -

2008 2007 2006 2005 2004 2003
10,631 8,397 9,163 9,699 10,020 9,471$814,646,916 $648,592,297 $743,566,106 $652,537,749 $558,278,403 $487,768,588
9,710 8,971 9,157 9,272 9,489 9,767$7,364,794 $7,112,426 $7,399,513 $7,504,979 $8,661,198 $6,353,990
2,783 2,887 3,077 3,700 2,200 5,492$1,331,940 $1,427,208 $1,290,830 $1,367,157 $1,433,689 $1,399,415
79,089 62,652 77,003 82,642 77,424 106,97049,012 49,669 59,311 51,947 54,268 173,18539,596 39,087 40,678 39,002 38,090 45,20515,525 16,239 17,374 18,878 20,655 21,89839,237 41,400 44,018 42,352 39,933 32,198
695 847 577 705 660 1,07538,629 38,142 39,851 38,259 37,426 43,76515,525 16,239 17,374 18,878 20,655 21,898
52 34 39 38 49 42169 229 177 155 273 263
60,263 63,403 61,702 65,825 56,236 3,7032,790 3,343 3,296 3,195 3,202 N/A1,095 1,807 1,708 1,904 1,641 1,777
362 479 362 379 316 261$11,242,477 $19,115,824 $21,567,578 $18,292,877 $18,140,355 $12,179,966
8,110 9,764 5,901 6,027 6,198 6,98911 5 0 87 39 92
88,934 88,506 86,010 91,161 87,009 89,380$12,091,087 $11,394,837 $10,698,730 $10,075,142 $8,830,211 $7,243,765
227 263 251 237 230 1999,611 7,914 8,143 8,140 8,175 8,207
37 31 31 27 29 2411 11 11 11 11 11
5 5 5 5 5 562 81 68 59 46 46
17,205 23,402 20,057 18,317 18,299 17,539127 131 129 146 129 129195 274 235 376 225 225
98 109 104 95 101 1134 4 3 4 4 46 5 5 5 5 5
17 54 27 49 73 77149 144 83 45 32 19
(Continued)
- S22 -

Function/Program 2012 2011 2010 2009
Leisure Time ActivitiesRecreation men and women leagues receipts $9,862 $5,280 $5,145 $5,070
Economic DevelopmentGrant amounts received (Amounts in 000's) (13) $5,856 $2,154 $4,564 $12,958
Public WorksStreet improvements - asphalt overlay (linear feet) (9) 212,032 224,361 0 101,000Crackseal coating program (linear feet) (9) 0 3,263 679,450 200,640Street repair (curbs, aprons, berms, asphalt) (hours) 117,239 83,212 76,000 80,000Guardrail repair (hours) (11) 100 40 2,500 2,500Paint striping
Lane line (miles) 661 651 855 936Crosswalks (each) 4,952 5,260 5,172 6,950Arrows (each) 4,273 4,706 4,210 3,716
Street sweeper (hours) (11) 2,176 3,840 46,000 55,000Cold patch (hours) 19,271 31,345 22,000 24,000Snow and ice removal regular hours 87,369 128,000 128,000 128,000Snow and ice removal overtime hours 18,912 23,117 21,139 14,400Leaf collection (hours) (12) 0 0 18,300 18,000Holiday lights setup (hours) (7) 500 0 0 0Equipment repair/body shop (hours) 4,196 5,000 5,076 2,663Tons of snow melting salt purchased November-March 40,236 74,679 53,322 67,000Cost of salt purchased $1,834,359 $3,348,606 $2,321,118 $2,700,000Refuse disposal per year (in tons) August through July 212,367 240,603 232,241 236,225Refuse disposal costs per year August through July $5,723,227 $6,556,260 $6,079,532 $6,928,858Annual recycling tonnage (excluding leaf, and compost items) 22,318 9,197 7,227 6,039Percentage of waste recycled 10.06% 3.68% 3.13% 4.12%
Port ControlCleveland Hopkins Airport
Landed weight (in thousands of pounds) 5,732,148 5,912,394 5,907,546 6,265,656Total operations 180,944 188,286 192,683 200,268Total passengers 9,010,077 9,203,740 9,492,455 9,715,604Total enplaned passengers 4,495,353 4,597,697 4,745,308 4,855,129
Burke Lakefront AirportTotal operations 72,916 65,664 64,358 68,456Total passengers 184,427 176,096 174,598 166,965Total enplaned passengers 92,160 87,695 87,012 83,438
Water DepartmentWater rates per 1st 600 cubic feet of water used (5) $13.76 $12.58 $12.58 $11.59Average number of water accounts billed monthly (cubic feet) 139,023 138,002 133,626 135,675Total water collections annually (including P&I) $246,046,531 $211,302,881 $210,264,218 $221,967,799Payments to Cleveland for bulk water purchases $21,271,504 $19,101,723 $20,660,824 $18,093,912
Wastewater DepartmentSewer and sanitary calls for service 4,035 5,489 7,272 8,021After hours sewer calls (hours) 167 204 185 103
(1)(2)(3)(4)(5)(6)(7)(8)
(9)
(10)(11)(12)(13)
N/A
Street sweeping was limited in 2011 and 2012 due to state imposed budget cuts.
Economic Development grants received were restated in 2011 for all years shown. They Include Neighborhood Development Investment Fund, SupplementalImpowerment Zone, Economic Development Funds, Urban Development Action Funds, WIA Grants and Core City Program Funds. Beginning in 2011 WIAGrants were moved to General Government.Information not available.
Beginning in 2011, the City no longer provides an orgainized leaf collection program.
Holiday light setup was contracted to an outside agency in 2009, 2010 and 2011The City went "live" on a new financial system in January 2010. The new system creates journal entries at the transaction level instead of at the summary levellike the prior financial system.No program was available for asphalt overlay in 2010 and a new program was implemented for crackseal coating. In 2011 this program ended due to state budget
2010 data has been changed. Figures included cases from prior years.cuts and the asphalt overlay program was again funded.
General obligation bond rating.Amounts are new construction starts. The majority of engineering and construction projects are multi-year projects.Includes entire area serviced by the Division of Vital Statistics (i.e., Cleveland + suburbs).Beginning 2007, administratively approved cases no longer included.This is the rate for the City of Cleveland residents only. In 2012 rates changed from per 1000 cubic feet to per 600 cublic feet.Fire Calls was changed to "Fire calls-Incoming for service" and all years adjusted beginning 2004 to reflect all calls for service received.
Operating Indicators by Function/ProgramLast Ten Years
City of Cleveland, Ohio
- S22 -

2008 2007 2006 2005 2004 2003
$6,825 $6,375 $5,730 $7,140 $10,455 $20,720
$16,837 $16,294 $36,005 $31,625 $29,936 $30,067
113,772 65,000 40,000 162,800 101,000 135,100158,400 126,720 79,200 316,800 211,200 264,000
95,000 95,000 95,000 95,000 95,000 95,0003,000 1,100 1,600 1,000 800 800
630 650 650 650 633 6305,700 6,000 6,000 6,000 5,900 5,8002,800 3,000 3,000 3,000 2,800 2,500
49,000 36,000 30,000 30,000 15,000 12,00031,000 31,000 31,000 31,000 31,000 31,000
132,000 132,000 132,000 132,000 132,000 132,00015,000 18,000 8,000 30,000 23,000 17,00020,000 17,000 17,000 17,000 17,000 17,000
4 5 5 5 5 51,010 809 1,066 1,179 1,664 1,811
85,000 82,000 64,500 83,000 40,000 95,000$3,330,000 $2,640,000 $2,128,363 $2,750,034 $1,321,066 $2,819,235
266,035 293,801 303,196 333,497 316,083 296,139$7,790,729 $7,944,516 $8,662,913 $7,761,318 $7,461,798 $7,135,942
9,000 8,584 16,435 16,088 12,825 14,5003.39% 2.93% 5.42% 4.82% 4.06% 4.90%
7,256,242 7,380,384 7,467,746 7,910,706 8,074,843 7,827,776235,975 244,719 249,967 258,926 263,561 258,460
11,106,194 11,458,898 11,321,050 11,463,391 11,264,937 10,555,3875,545,205 5,722,338 5,646,470 5,724,440 5,613,255 5,257,224
69,231 68,137 77,593 73,064 84,101 94,626188,171 204,582 214,947 188,381 199,194 215,601
93,772 102,039 107,786 93,941 99,563 107,931
$10.63 $9.62 $8.71 $8.71 $8.41 $8.13137,528 138,727 139,129 140,166 138,338 138,441
$218,285,825 $214,378,311 $192,386,791 $202,615,763 $190,316,017 $187,482,239$18,399,096 $20,353,610 $19,632,453 $21,102,439 $19,422,375 $19,041,420
8,275 7,585 6,515 6,188 5,481 7,802147 384 448 526 437 N/A
(Concluded)
- S22 -

Function/Program 2012 2011 2010 2009
General GovernmentSquare footage occupied (4) 3,690,000 3,690,000 3,700,000 3,700,000Administrative vehicles 37 36 26 28
PoliceStations 5 5 5 5Square footage of buildings (1) 553,100 553,100 553,100 553,100Vehicles 825 796 808 830
FireStations 26 26 26 26Square footage of buildings 313,224 313,224 313,224 313,224Vehicles 104 104 120 127
EMSStations (headquarters) 1 1 1 1Square footage of buildings 33,000 33,000 33,000 33,000Vehicles 45 45 44 49
Port Control (Hopkins)Runways 3 3 3 3
Terminal area (approximate square footage) 935,000 935,000 935,000 935,000Gates 96 96 96 96Parking spaces (approximately) Long term 2,600 2,600 2,576 2,647 Short term 3,900 3,900 3,895 4,088 Surface 640 640 615 390Total parking spaces 7,140 7,500 7,086 7,125Vehicles 335 353 324 325
Other Public WorksStreets (miles) 1,300 1,290 1,319 1,319Service vehicles (5) 1,906 868 754 773
City of Cleveland, OhioCapital Assets Statistics by Function/Program
Last Ten Years
- S23 -

2008 2007 2006 2005 2004 2003
3,700,000 3,700,000 2,310,732 2,310,732 2,187,420 2,187,42027 26 28 26 25 23
6 6 6 6 6 6769,536 769,536 769,536 769,536 769,536 769,536
764 921 958 979 905 872
26 26 26 26 26 26313,224 313,224 313,224 313,224 313,224 313,224
132 155 153 152 147 154
1 1 1 1 N/A N/A33,000 33,000 33,000 33,000 N/A N/A
46 49 57 53 47 46
3 3 4 4 4 4
935,000 935,000 935,000 935,000 935,000 935,00096 96 96 96 96 96
2,500 2,500 2,500 2,500 2,500 2,5004,200 4,200 4,200 4,200 4,200 4,200
500 500 500 0 0 07,200 7,200 7,200 6,700 6,700 6,700
325 326 362 345 321 314
1,319 1,319 1,280 1,280 1,240 1,210741 760 828 842 859 857
- S23 -

Function/Program 2012 2011 2010 2009
City of Cleveland, OhioCapital Assets Statistics by Function/Program
Last Ten Years
RecreationNumber of parks 154 154 154 154Number of playgrounds 110 109 109 109Number of baseball diamonds 138 132 133 134Number of tennis courts 119 111 111 114Number of basketball courts Full 103 110 108 110 Half 10 10 10 10Number of soccer fields 3 9 7 7Number of recreation centers 21 20 19 19Number of pools Indoor 19 19 18 18 Outdoor 20 23 23 23Number of aquatic playgrounds 10 10 9 9Number of golf courses (3) 2 2 2 2Number of ice rinks 1 1 1 1Number of roller rinks 1 1 1 1Number of fine arts centers 1 1 1 1Number of greenhouses 1 1 1 1Number of camps 1 1 1 1Total park acreage 1,489 1,495 1,492 1,487Vehicles 97 99 156 160
WastewaterSanitary sewers (miles) 170 170 170 170Storm sewers (miles) 199 199 199 199Combined sewers (miles) 1,065 1,065 1,065 1,065Vehicles 116 115 108 111
Electric PowerVehicles 284 266 252 272
Water DepartmentWater lines (miles) (2) 2,839 2,709 2,704 2,493Vehicles 736 708 744 745
(1) Includes Dog Kennels, Inspection Garage and House of Corrections.(2)
(3) In 2011 the City leased Seneca golf course. In 2012 the City leased both golf courses.(4) Closed Platt Station and Luke Easter Station in 2011.(5)
N/A Information not available.
These are calculated totals of all trunk mains [20" diameter and larger] (439 miles), distribution mains [16" andsmaller] within the City of Cleveland (1,266 miles) plus distribution mains within certain suburbs with updatedservice agreements (1,134 miles) which transferred ownership of the distribution mains within those suburbanboundaries to the City of Cleveland. Not included in these totals are the distribution mains in all master metercommunities and any direct service suburban community who has not entered into a new service agreement.
In 2012 a departmental reorganization occurred that merged the departments of Public Service with Parks,Recreation and Properties becoming the Department of Public Works. The Office of Capital Projects was createdfrom the Divisions of Architecture, Engineering and Construction and Research, Planning and Development and isreported under General Government. In addition, the Division of Consumer Affairs was merged with CommunityDevelopment and was moved from General Government.
- S23 -
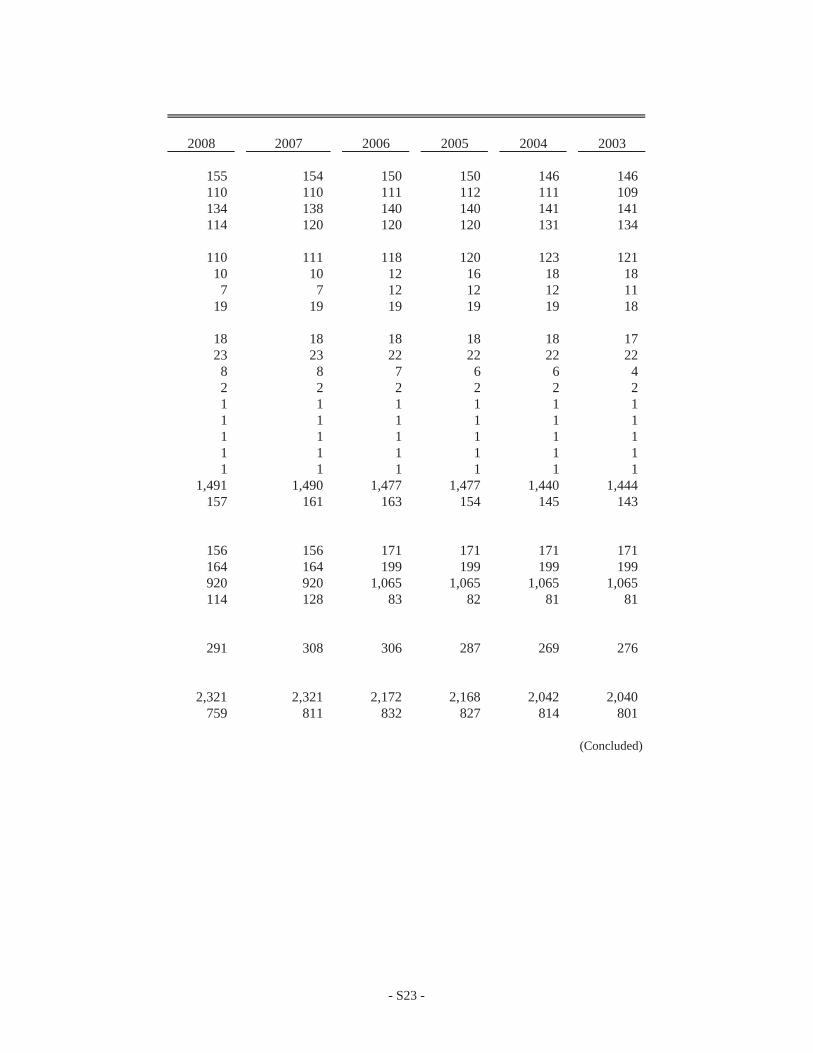
2008 2007 2006 2005 2004 2003
155 154 150 150 146 146110 110 111 112 111 109134 138 140 140 141 141114 120 120 120 131 134
110 111 118 120 123 12110 10 12 16 18 18
7 7 12 12 12 1119 19 19 19 19 18
18 18 18 18 18 1723 23 22 22 22 22
8 8 7 6 6 42 2 2 2 2 21 1 1 1 1 11 1 1 1 1 11 1 1 1 1 11 1 1 1 1 11 1 1 1 1 1
1,491 1,490 1,477 1,477 1,440 1,444157 161 163 154 145 143
156 156 171 171 171 171164 164 199 199 199 199920 920 1,065 1,065 1,065 1,065114 128 83 82 81 81
291 308 306 287 269 276
2,321 2,321 2,172 2,168 2,042 2,040759 811 832 827 814 801
(Concluded)
- S23 -

CITY OF CLEVELAND, OHIOSCHEDULE OF STATISTICS-GENERAL FUNDFOR THE YEAR ENDED DECEMBER 31, 2012
OPERATING RATIOS: GENERAL FUND-BUDGET BASIS
REVENUE DOLLAR BY SOURCEWhere the money came from
a. Income taxes a. $0.56b. Property taxes b. 0.07c. State local government funds c. 0.07d. Other taxes and shared revenues d. 0.09e. Licenses and permits e. 0.02f. Charges for services f. 0.07g. Fines, forfeits and settlements g. 0.04h. Grant revenue h. 0.01i. Miscellaneous i. 0.04j. Transfers in j. 0.03
$1.00
EXPENDITURE DOLLAR BY FUNCTIONWhere the money was spent
a. General Government a. $0.16b. Public Health b. 0.01c. Public Safety c. 0.60d. PublicWorks d. 0.13e. Building and Housing e. 0.02f. Economic and Community Development and other f. 0.04g. Transfers out g. 0.04
$1.00
EXPENDITURE DOLLAR BY OBJECTWhat the money was spent on
a. Salaries, wages and related benefits a. $0.79b. Interdepartmental charges b. 0.04c. Utilities c. 0.04d. Contractual services d. 0.07e. Materials and supplies e. 0.01f. Maintenance f. 0.01g. Transfers out g. 0.04
$1.00a.
b.
c.
d. e. f. g.
a.
b.
c.
d.e. f.
g.
a.b.
c.
d.
e.f. g. h. i. j.
- S24 -

SPECIAL THANKS TO:
The Division of Financial Reporting and Control
Accounting and Administrative
Poljona Basho Monete Morris Lesly Camargo Va’Kedia Stiggers Donnetta Carter Sharon Teter Shelfie Carter Pandora Ward Kay Cebron Sylvia Ware Leigh Ebner Kathleen Woidke Michael Klein
Photography
City of Cleveland Bureau of Photographic Services
Cover color separations and printing
City of Cleveland Division of Printing and Reproduction
James E. Gentile, CPA City Controller
Department of Finance Room 18 – City Hall
Cleveland, Ohio 44114 (216) 664-3881

This page intentionally left blank.

CITY OF CLEVELAND, OHIO
CENTRAL COLLECTION AGENCY
DEPARTMENT OF FINANCE DIVISION OF TAXATION
REPORT ON AUDITS OF FINANCIAL STATEMENTS For the years ended December 31, 2012 and 2011

This page intentionally left blank.

CITY OF CLEVELAND, OHIO
CENTRAL COLLECTION AGENCY DEPARTMENT OF FINANCE
DIVISION OF TAXATION
TABLE OF CONTENTS
Page
Independent Auditors’ Report.................................................................................................... 1-2 Management’s Discussion and Analysis ................................................................................... 3-8 Statements of Net Position - All Fund Types ............................................................................ 11-12 Statements of Revenues, Expenses and Changes in Net Position - Internal Service Fund ....... 13 Statements of Cash Flows - Internal Service Fund.................................................................... 14 Notes to Financial Statements.................................................................................................... 15-25 Schedules of Changes in Assets and Liabilities – Agency Fund ............................................... 26 Schedule of Cash Receipts and Distribution of Funds............................................................... 27 Schedule of Allocation of Net Operating Expenses .................................................................. 28 Schedules of Income Taxes Receivable..................................................................................... 29

one east fourth street, ste. 1200
cincinnati, oh 45202
www.cshco.com
p. 513.241.3111
f. 513.241.1212
cincinnati | cleveland | columbus | miami valley | springfield | toledo
INDEPENDENT AUDITORS’ REPORT
To the Honorable Frank G. Jackson, Mayor, Members of Council and the Audit CommitteeCentral Collection AgencyDivision of TaxationCity of Cleveland, Ohio:
Report on the Financial Statements
We have audited the accompanying financial statements of the Central Collection Agency’s Internal Service and Agency Funds, Division of Taxation, City of Cleveland, Ohio (the “Agency”) as of and for the years ended December 31, 2012 and 2011 and the related notes to the financial statements, as listed in the table of contents.
Management’s Responsibility for the Financial Statements
Management is responsible for the preparation and fair presentation of these financial statements in accordance with accounting principles generally accepted in the United States of America; this includes the design, implementation, and maintenance of internal control relevant to the preparation and fair presentation of financial statements that are free from material misstatement, whether due to fraud or error.
Auditors’ Responsibility
Our responsibility is to express an opinion on these financial statements based on our audits. We conducted our audits in accordance with auditing standards generally accepted in the United States of America and the standards applicable to financial audits contained in Government Auditing Standards, issued by the Comptroller General of the United States. Those standards require that we plan and perform the audit to obtain reasonable assurance about whether the financial statements are free from material misstatement.
An audit involves performing procedures to obtain audit evidence about the amounts and disclosures in the financial statements. The procedures selected depend on the auditors’ judgment, including the assessment of the risks of material misstatement of the financial statements, whether due to fraud or error. In making those risk assessments, the auditor considers internal control relevant to the entity’s preparation and fair presentation of the financial statements in order to design audit procedures that are appropriate in the circumstances, but not for the purpose of expressing an opinion on the effectiveness of the entity’s internal control. Accordingly, we express no such opinion. An audit also includes evaluating the appropriateness of accounting policies used and the reasonableness of significant accounting estimates made by management, as well as evaluating the overall presentation of the financial statements.
We believe that the audit evidence we have obtained is sufficient and appropriate to provide a basis for our audit opinion.

Opinions
In our opinion, the financial statements referred to previously present fairly, in all material respects, the financial position of the Central Collection Agency’s Internal Service and Agency Funds, Division of Taxation, City of Cleveland, Ohio as of December 31, 2012 and 2011, and the changes in financial position and cash flows thereof, where applicable, for the years then ended in conformity with accounting principles generally accepted in the United States of America.
Other Matters
As described in Note A, the financial statements present only the financial position and the changes in financial position and cash flows of the Agency and do not purport to, and do not, present fairly the financial position of the City of Cleveland as of December 31, 2012 and 2011, and the respective changes in its financial position and cash flows for the years then ended in conformity with accounting principles generally accepted in the United States of America. Our opinion is not modified with respect to this matter.
Required Supplementary Information
Accounting principles generally accepted in the United States of America require that the management’s discussion and analysis on pages 3 through 8 be presented to supplement the basic financial statements. Such information, although not a part of the basic financial statements, is required by the Governmental Accounting Standards Board who considers it to be an essential part of financial reporting for placing the basic financial statements in an appropriate operational, economic, or historical context. We have applied certain limited procedures to the required supplementary information in accordance with auditing standards generally accepted in the United States of America, which consisted of inquiries of management about the methods of preparing the information and comparing the information for consistency with management’s responses to our inquiries, the basic financial statements, and other knowledge we obtained during our audit of the basic financial statements. We do not express an opinion or provide any assurance on the information because the limited procedures do not provide us with sufficient evidence to express an opinion or provide any assurance.
Other Information
Our audit was conducted for the purpose of forming an opinion on the financial statements taken as a whole. The schedules on pages 26 through 29 are presented for purpose of additional analysis and are not a required part of the Agency’s basic financial statements.
The schedules are the responsibility of management and were derived from and relate directly to the underlying accounting and other records used to prepare the financial statements. Such information has been subjected to the auditing procedures applied in the audit of the Agency’s basic financial statements and certain additional procedures, including comparing and reconciling such information directly to the underlying accounting and other records used to prepare the financial statements or to the financial statements themselves, and other additional procedures in accordance with auditing standards generally accepted in the United States of America. In our opinion, the information is fairly presented in all material respects in relation to the Agency’s basic financial statements taken as a whole.
Clark, Schaefer, Hackett & Co.
Cincinnati, OhioJune 25, 2013
2

CITY OF CLEVELAND, OHIO CENTRAL COLLECTION AGENCY
DEPARTMENT OF FINANCE DIVISION OF TAXATION
MANAGEMENT’S DISCUSSION AND ANALYSIS
3
GENERAL As management of the City of Cleveland’s (the City) Department of Finance, Division of Taxation, Central Collection Agency (the Agency), we offer readers of the Agency’s financial statements this narrative overview and analysis of the financial activities of the Agency for the years ended December 31, 2012 and December 31, 2011. Please read this information in conjunction with the Agency’s financial statements and footnotes that begin on page 11. The Division of Taxation was created in 1966 by the enactment of the City of Cleveland’s Income Tax Ordinance providing the City’s Income Tax Administrator with the authority to enter into agreements with any other municipal corporation to administer income tax laws and to provide for a central income tax collection facility. The Agency began with 14 member communities and during 2012 provided a full range of tax collection services for 54 member communities throughout 19 Ohio counties. The Agency employs more than 100 individuals to process approximately one million returns, estimated payments and tax assessments. COMPARISON OF CURRENT YEAR’S AND PRIOR YEARS’ DATA FINANCIAL HIGHLIGHTS
• The assets and the liabilities of the Agency equal $85,515,911, $80,568,081 and $81,201,634, at December 31, 2012, 2011 and 2010, respectively. The Agency’s total assets increased by $4,947,830 in 2012. The Agency’s total assets decreased by $633,553 in 2011. Its total assets increased by $4,536,150 in 2010. The increase in 2012 was primarily due to increases in cash and cash equivalents and taxes receivable.
• The agency fund total cash receipts were approximately $430 million, $410 million and $404 million
in 2012, 2011 and 2010, respectively. In 2012, cash receipts consisted of $349 million of employer withholding, $43 million of business profits, $34 million of individual payments and $4 million of other payments.
• The Agency’s total operational cost was $8,191,396, $7,929,898 and $7,738,182 in 2012, 2011 and
2010, respectively. In 2012, operational costs consisted of $5,241,763 of employee’s wages and benefits, $1,214,372 of allocated charges and $1,735,261 of other miscellaneous expenses.
• The Agency provides a mechanism for member municipalities to maximize efficiencies, minimize
costs and capitalize from economies of scale. Pooling tax collections and investing at current market rates allows the operational costs of the Agency to be reduced by interest income. The Agency’s member municipalities also benefit by printing and mailing large volumes of income tax forms to their taxpayers.
CITY OF CLEVELAND, OHIO CENTRAL COLLECTION AGENCY
DEPARTMENT OF FINANCE DIVISION OF TAXATION
MANAGEMENT’S DISCUSSION AND ANALYSIS (Continued)
4
OVERVIEW OF THE FINANCIAL STATEMENTS This discussion and analysis is intended to serve as an introduction to the Agency’s financial statements. The accompanying financial statements present financial information for the City of Cleveland’s Division of Taxation Fund, in which the City of Cleveland accounts for the operations of the Department of Finance, Division of Taxation. A fund is a grouping of related accounts that is used to maintain control over resources that have been segregated for specific activities or objectives. The City, like other state and local governments, uses fund accounting to ensure and demonstrate compliance with finance-related legal requirements. The Agency operates two funds. The operating fund is considered an internal service proprietary fund because the operations of this fund are similar to a private-sector business enterprise. Accordingly, in accounting for the operating activities within this fund, the economic resources measurement focus and the accrual basis of accounting is used. The second fund is an agency fund, which is used to account for the collection and remittance of income taxes for the member municipalities. For accounting measurement purposes, the agency fund is custodial in nature (assets equal liabilities) and does not involve the measurement of operations. The financial statements of the Agency can be found on pages 11-14 of this report. The notes to the financial statements and accompanying schedules provide additional information that is essential to a full understanding of the data provided in the basic financial statements. The notes to the financial statements and accompanying schedules can be found on pages 15-29 of this report.

CITY OF CLEVELAND, OHIO CENTRAL COLLECTION AGENCY
DEPARTMENT OF FINANCE DIVISION OF TAXATION
MANAGEMENT’S DISCUSSION AND ANALYSIS (Continued)
5
CONDENSED STATEMENT OF NET POSITION INFORMATION Provided below is condensed statement of net position information for the internal service and agency funds of the Agency as of December 31, 2012, 2011 and 2010:
2012 2011 2010
Assets: Cash and cash equivalents 13,993,219$ 11,253,433$ 11,474,868$ Capital assets, net of accumulated depreciation 51,264 62,149 Taxes receivable 70,300,395 68,531,863 68,776,540 Due from CCA internal service fund 736,482 317,108 536,515 Due from member municipalities 434,551 403,528 413,711
Total assets 85,515,911$ 80,568,081$ 81,201,634$
Liabilities: Accounts payable 161,621$ 139,472$ 130,198$ Due to CCA agency fund 736,482 317,108 536,515 Due to the City of Cleveland 57,407,784 54,309,391 52,361,519 Due to member municipalities 26,387,134 25,049,168 27,349,724 Accrued wages and benefits - current 717,938 653,504 713,714 Accrued wages and benefits - long-term 104,952 99,438 109,964 Total liabilities 85,515,911$ 80,568,081$ 81,201,634$
Assets: The Agency collects and disburses income tax receipts monthly, except for the City of Cleveland which receives collections of tax receipts in advance of the regular monthly distribution date. Assets primarily consist of cash on hand and anticipated income tax receivable. Total assets increased $4,947,830 during 2012, and decreased $633,553 during 2011. In 2012, the increase in assets is primarily attributable to an increase in cash and cash equivalents due to timing differences in the receipt of cash and distribution to member communities and increase in taxes receivable. In 2011, the minimal decrease in assets is attributable to decreases in cash and cash equivalents, taxes receivable and due from CCA internal service fund.

CITY OF CLEVELAND, OHIO CENTRAL COLLECTION AGENCY
DEPARTMENT OF FINANCE DIVISION OF TAXATION
MANAGEMENT’S DISCUSSION AND ANALYSIS (Continued)
6
CONDENSED STATEMENT OF NET POSITION INFORMATION (Continued) Capital assets: The Agency’s investment in capital assets as of December 31, 2012 amounted to $51,264 (net of accumulated depreciation). The investment in capital assets include: furniture, fixtures, equipment and vehicles. A summary of the Agency’s capital assets during the year ended December 31, 2012 is as follows:
Balance BalanceJanuary 1, December 31,
2012 Additions Reductions 2012
Furniture, fixtures, equipment and vehicles 65,310$ $ $ 65,310$ Total 65,310 - - 65,310 Less: Accumulated depreciation (3,161) (10,885) (14,046)
Total capital assets, net 62,149$ (10,885)$ -$ 51,264$
Balance BalanceJanuary 1, December 31,
2011 Additions Reductions 2011
Furniture, fixtures, equipment and vehicles $ 65,310$ $ 65,310$ Total - 65,310 - 65,310 Less: Accumulated depreciation (3,161) (3,161)
Total capital assets, net -$ 62,149$ -$ 62,149$
Liabilities: Liabilities primarily consist of amounts owed to member municipalities (including the City of Cleveland). During 2012, the increase in liabilities was primarily due to an increase in Due to the City of Cleveland, which reflects the timing differences in the receipt of cash and distribution to the City. During 2011, the decrease in liabilities was primarily due to a net effect decrease in Due to CCA agency fund, Due to the City of Cleveland and Due to member municipalities.

CITY OF CLEVELAND, OHIO CENTRAL COLLECTION AGENCY
DEPARTMENT OF FINANCE DIVISION OF TAXATION
MANAGEMENT’S DISCUSSION AND ANALYSIS (Continued)
7
STATEMENTS OF REVENUES, EXPENSES AND CHANGES IN NET POSITION Provided below is statement of revenue, expenses and changes in net position for the internal service fund of the Agency for the years ended December 31, 2012, 2011 and 2010:
2012 2011 2010
Operating Revenues Charges for services 8,183,986$ 7,923,161$ 7,725,279$ Total operating revenues 8,183,986 7,923,161 7,725,279
Operating Expenses Salaries and wages 3,904,075 3,652,130 3,572,148 Employee benefits 1,337,688 1,200,388 1,348,976 Postage and office supplies 316,428 314,709 256,730 Allocation of City of Cleveland costs 1,214,372 1,263,593 1,115,576 Other administrative expenses 1,388,237 1,495,917 1,444,752 Property rental 19,711 Depreciation 10,885 3,161
Total operating expense 8,191,396 7,929,898 7,738,182
Operating loss (7,410) (6,737) (12,903)
Non-operating Revenue Interest income 7,410 6,737 12,903
Change in net position - - -
Net position at beginning of year - - -
Net position at end of year -$ -$ -$
Internal Service Fund

CITY OF CLEVELAND, OHIO CENTRAL COLLECTION AGENCY
DEPARTMENT OF FINANCE DIVISION OF TAXATION
MANAGEMENT’S DISCUSSION AND ANALYSIS (Continued)
8
STATEMENTS OF REVENUES, EXPENSES AND CHANGES IN NET POSITION (Continued) 2012: There was an increase in the combined costs for salaries and wages and employee benefits of $389,245 in 2012. This was due to an employee pay increase of 3% and an increase in the cost of benefits. Other administrative expenses decreased $107,680 in 2012. This was due to a decrease of approximately $100,000 in the professional services account. 2011: The increase in total operating expenses of $191,716 is primarily a result of the increase in printing and telephone expenses. Due to economic factors and declining interest rates, interest income decreased $6,166 in 2011. This is a decrease of approximately 48%. FACTORS EXPECTED TO IMPACT THE DIVISION’S FUTURE FINANCIAL POSITION OR RESULTS OF OPERATION The Agency continues to face the challenges of an economic recession. The Agency’s most significant task is dealing with the complications of rising basic operating costs. However, the Agency is attempting to reduce the impact of these increasing expenses by continuing to aggressively collect income taxes due, thereby spreading the incremental cost over a larger base. The Agency’s collections for the first quarter of 2013 are approximately the same as the collections in the same period in 2012. The Agency will continue to strive for increased delinquency collections, while trying to maintain operational expenses at their current level.
The operating budget for the Agency, as approved by the Cleveland City Council for 2013, provides for an overall increase in budgeted expenditures of approximately 2.5%. ADDITIONAL INFORMATION This financial report is designed to provide a general overview of the Agency’s finances. Questions concerning any of the information provided in this report or requests for additional information should be addressed to the Office of the Finance Director, City Hall, Room 104, 601 Lakeside Avenue, Cleveland, Ohio 44114.

9
FINANCIAL STATEMENTS

10
This page intentionally left blank.

Proprietary Fund Type
Fiduciary Fund Type
Proprietary Fund Type
Fiduciary Fund Type
Internal Service Agency
Internal Service Agency
ASSETS CURRENT ASSETS: Cash and cash equivalents 1,782,729$ 12,210,490$ 1,271,669$ 9,981,764$ Taxes receivable 70,300,395 68,531,863 Due from CCA internal service fund 736,482 317,108 Due from member municipalities 434,551 403,528
TOTAL CURRENT ASSETS 1,782,729 83,681,918 1,271,669 79,234,263
CAPITAL ASSETS: Furniture, fixtures, equipment and vehicles 65,310 65,310 Less: Accumulated depreciation (14,046) (3,161)
CAPITAL ASSETS, NET 51,264 - 62,149 -
TOTAL ASSETS 1,833,993$ 83,681,918$ 1,333,818$ 79,234,263$
CITY OF CLEVELAND, OHIO
December 31, 2012 and 2011
2012 2011
CENTRAL COLLECTION AGENCYDEPARTMENT OF FINANCE
DIVISION OF TAXATION
STATEMENTS OF NET POSITION - ALL FUND TYPES
(Continued)
The notes to the financial statements are an integral part of this statement.
11

Proprietary Fund Type
Fiduciary Fund Type
Proprietary Fund Type
Fiduciary Fund Type
Internal Service Agency
Internal Service Agency
LIABILITIESCURRENT LIABILITIES Accounts payable 161,621$ $ 139,472$ $ Due to CCA agency fund 736,482 317,108 Due to the City of Cleveland 113,000 57,294,784 124,296 54,185,095 Due to member municipalities 26,387,134 25,049,168 Accrued wages and benefits - current 717,938 653,504
TOTAL CURRENT LIABILITIES 1,729,041 83,681,918 1,234,380 79,234,263
LONG-TERM LIABILITIES Accrued wages and benefits 104,952 99,438
TOTAL LONG-TERM LIABILITIES 104,952 - 99,438 -
TOTAL LIABILITIES 1,833,993 83,681,918 1,333,818 79,234,263
NET POSITION Net investment in capital assets 51,264 62,149 Unrestricted (51,264) (62,149)
TOTAL NET POSITION - - - -
TOTAL LIABILITIES AND NET POSITION 1,833,993$ 83,681,918$ 1,333,818$ 79,234,263$
CITY OF CLEVELAND, OHIO
December 31, 2012 and 2011
2012 2011
CENTRAL COLLECTION AGENCYDEPARTMENT OF FINANCE
DIVISION OF TAXATION
STATEMENTS OF NET POSITION - ALL FUND TYPES
(Concluded)
The notes to the financial statements are an integral part of this statement.
12

2012 2011OPERATING REVENUES Charges for services 8,183,986$ 7,923,161$
TOTAL OPERATING REVENUES 8,183,986 7,923,161
OPERATING EXPENSES Salaries and wages 3,904,075 3,652,130 Employee benefits 1,337,688 1,200,388 Postage and office supplies 316,428 314,709 Allocation of City of Cleveland costs 1,214,372 1,263,593 Other administrative expenses 1,388,237 1,495,917 Property rental 19,711 Depreciation 10,885 3,161
TOTAL OPERATING EXPENSES 8,191,396 7,929,898
OPERATING LOSS (7,410) (6,737)
NON-OPERATING REVENUE Interest income 7,410 6,737
CHANGE IN NET POSITION - -
NET POSITION AT BEGINNING OF YEAR
NET POSITION AT END OF YEAR -$ -$
CITY OF CLEVELAND, OHIO
For the Years Ended December 31, 2012 and 2011
CENTRAL COLLECTION AGENCY
DIVISION OF TAXATIONDEPARTMENT OF FINANCE
STATEMENTS OF REVENUES, EXPENSES AND CHANGES IN NET POSITIONINTERNAL SERVICE FUND
The notes to the financial statements are an integral part of this statement.
13
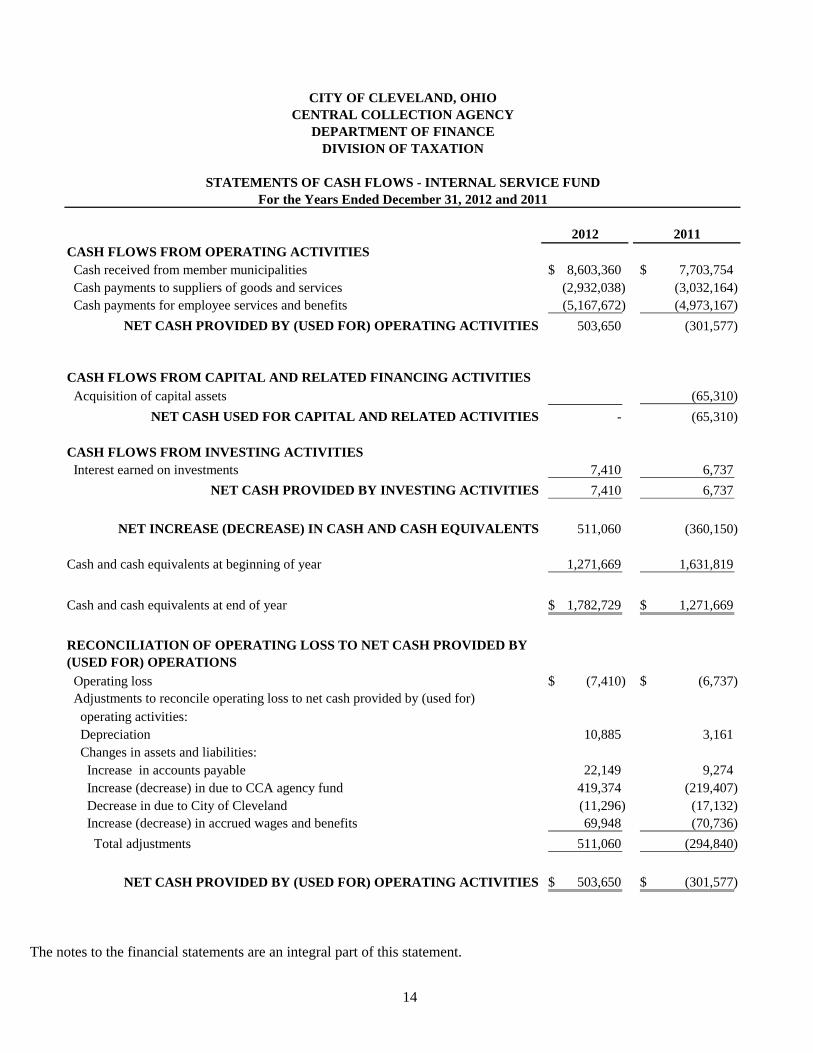
2012 2011CASH FLOWS FROM OPERATING ACTIVITIES Cash received from member municipalities 8,603,360$ 7,703,754$ Cash payments to suppliers of goods and services (2,932,038) (3,032,164) Cash payments for employee services and benefits (5,167,672) (4,973,167)
NET CASH PROVIDED BY (USED FOR) OPERATING ACTIVITIES 503,650 (301,577)
CASH FLOWS FROM CAPITAL AND RELATED FINANCING ACTIVITIES Acquisition of capital assets (65,310)
NET CASH USED FOR CAPITAL AND RELATED ACTIVITIES - (65,310)
CASH FLOWS FROM INVESTING ACTIVITIES Interest earned on investments 7,410 6,737
NET CASH PROVIDED BY INVESTING ACTIVITIES 7,410 6,737
NET INCREASE (DECREASE) IN CASH AND CASH EQUIVALENTS 511,060 (360,150)
Cash and cash equivalents at beginning of year 1,271,669 1,631,819
Cash and cash equivalents at end of year 1,782,729$ 1,271,669$
RECONCILIATION OF OPERATING LOSS TO NET CASH PROVIDED BY (USED FOR) OPERATIONS Operating loss (7,410)$ (6,737)$ Adjustments to reconcile operating loss to net cash provided by (used for) operating activities: Depreciation 10,885 3,161 Changes in assets and liabilities: Increase in accounts payable 22,149 9,274 Increase (decrease) in due to CCA agency fund 419,374 (219,407) Decrease in due to City of Cleveland (11,296) (17,132) Increase (decrease) in accrued wages and benefits 69,948 (70,736) Total adjustments 511,060 (294,840)
NET CASH PROVIDED BY (USED FOR) OPERATING ACTIVITIES 503,650$ (301,577)$
STATEMENTS OF CASH FLOWS - INTERNAL SERVICE FUNDFor the Years Ended December 31, 2012 and 2011
CITY OF CLEVELAND, OHIOCENTRAL COLLECTION AGENCY
DEPARTMENT OF FINANCEDIVISION OF TAXATION
The notes to the financial statements are an integral part of this statement.
14

CITY OF CLEVELAND, OHIO CENTRAL COLLECTION AGENCY
DEPARTMENT OF FINANCE DIVISION OF TAXATION
NOTES TO FINANCIAL STATEMENTS (Continued)
For the Years Ended December 31, 2012 and 2011
15
NOTE A--DESCRIPTION OF OPERATIONS AND BASIS OF PRESENTATION
The Central Collection Agency, Division of Taxation, City of Cleveland, Ohio (the Agency) is reported as part of the City of Cleveland’s primary government and was created for the purpose of collecting city income taxes and disbursing those funds to the respective member municipalities (members) after payment of related expenses. Allocations of tax collections to members are based upon information provided by the taxpayers on the returns and supporting data. Such allocations are subject to adjustments in the subsequent year, dependent upon final returns filed by taxpayers and final review by the Agency. Refunds for overpayments are offset against allocated collections as amounts are determined. Basis of Presentation: The financial statements are presented in accordance with Governmental Accounting Standards Board's (GASB) Codification of Governmental Accounting and Financial Reporting Standards (GASB Codification) which requires financial statements by fund type. These financial statements present a columnar total for all fund types included in the statement of assets and liabilities. The following fund types are used by the Agency: Proprietary Fund Type--Internal Service Fund: This fund is used to account for the services provided to members on a cost-reimbursement basis. Fiduciary Fund Type--Agency Fund: This fund is used to account for assets held by the Agency as an agent for others. NOTE B--SUMMARY OF SIGNIFICANT ACCOUNTING POLICIES The accounting policies and financial reporting practices of the Agency comply with accounting principles generally accepted in the United States of America applicable to governmental units. In November of 2010, Governmental Accounting Standards Board (GASB) Statement No. 60, Accounting and Financial Reporting for Service Concession Arrangements was issued. This Statement is effective for fiscal periods beginning after December 15, 2011. The objective of this Statement is to improve financial reporting by addressing issues related to service concession arrangements (SCAs), which are a type of public-private or public-public partnership. The Agency has determined that GASB Statement No. 60 has no impact on its financial statements as of December 31, 2012.
In December of 2010, Governmental Accounting Standards Board (GASB) Statement No. 62, Codification of Accounting and Financial Reporting Guidance Contained in Pre-November 30, 1989 FASB and AICPA Pronouncements was issued. This Statement is effective for fiscal periods beginning after December 15, 2011. The objective of this Statement is to incorporate into the GASB’s authoritative literature certain accounting and financial reporting guidance that is included in the following pronouncements issued on or before November 30, 1989, which does not conflict with or contradict GASB pronouncements: (1) Financial Accounting Standards Board (FASB) Statements and Interpretations, (2) Accounting Principles Board Opinions and (3) Accounting Research Bulletins of the American Institute of Certified Public Accountants’ (AICPA) Committee on Accounting Procedure. As required, the Agency has implemented GASB Statement No. 62 effective for the 2012 fiscal year.

CITY OF CLEVELAND, OHIO CENTRAL COLLECTION AGENCY
DEPARTMENT OF FINANCE DIVISION OF TAXATION
NOTES TO FINANCIAL STATEMENTS (Continued)
For the Years Ended December 31, 2012 and 2011
16
NOTE B--SUMMARY OF SIGNIFICANT ACCOUNTING POLICIES (Continued) In June of 2011, Governmental Accounting Standards Board (GASB) Statement No. 63, Financial Reporting of Deferred Outflows of Resources, Deferred Inflows of Resources, and Net Position was issued. This Statement is effective for fiscal periods beginning after December 15, 2011. This Statement provides financial reporting guidance for deferred outflows of resources and deferred inflows of resources. As required, the Agency has implemented GASB Statement No. 63 effective for the 2012 fiscal year. The Agency has determined that GASB Statement No. 63 has no impact on its financial statements as of December 31, 2012. In June of 2011, Governmental Accounting Standards Board (GASB) Statement No. 64, Derivative Instruments: Application of Hedge Accounting Termination Provision was issued. This Statement is effective for fiscal periods beginning after June 15, 2011. The objective of this Statement is to clarify whether an effective hedging relationship continues after the replacement of a swap counterparty or a swap counterparty’s credit support provider. The Agency has determined that GASB Statement No. 64 has no impact on its financial statements as of December 31, 2012. The Agency’s net position is accounted for in the accompanying statements of net position and is divided into amounts in net investment in capital assets and unrestricted. The negative unrestricted amount will be eliminated as depreciation expense is passed along to members of the Agency. Basis of Accounting: All financial transactions of the Agency are reported on the accrual basis of accounting. Under this accounting method, assets and the related liabilities at the end of the year primarily consist of individual income taxes receivable arising from payroll tax withholdings in December and a receivable for quarterly and annual payments of income taxes pertaining to net profits, self-employment and residents’ taxes earned in the prior years. For accounting purposes, the agency fund is custodial in nature (assets equal liabilities) and does not involve the measurement of operations. Financial transactions for the internal service fund are reported on the accrual basis of accounting; revenues are recognized when earned and measurable and expenses are recognized as incurred. For accounting purposes, the operations of the internal service fund are similar to a private-sector business enterprise. Accordingly, in accounting for the operating activities, the economic resources measurement focus is used. Supplies: Supplies are expensed when purchased. Statement of Cash Flows: The Agency utilizes the direct method of reporting for the statement of cash flows as defined by GASB Statement No. 9, Reporting Cash Flows of Proprietary and Non-expendable Trust Funds and Governmental Entities That Use Proprietary Fund Accounting, for its internal service fund. In a statement of cash flows, cash receipts and cash payments are classified according to operating, non-capital financing, capital and related financing and investing activities. For purposes of this statement, cash and cash equivalents include highly liquid investments with a maturity of three months or less when purchased and all of the Agency's share of the City of Cleveland's pooled cash accounts. Allocation of Expenses: The Agency allocates all operating expenses, net of interest income, to members based upon the arithmetic mean of the percentage of each municipality's transactions to total transactions and the percentage of each municipality's revenue to total revenue.

CITY OF CLEVELAND, OHIO CENTRAL COLLECTION AGENCY
DEPARTMENT OF FINANCE DIVISION OF TAXATION
NOTES TO FINANCIAL STATEMENTS (Continued)
For the Years Ended December 31, 2012 and 2011
17
NOTE B--SUMMARY OF SIGNIFICANT ACCOUNTING POLICIES (Continued) Allocation of Interest Income: Excess funds are invested on a daily basis and interest income earned on such investments is allocated to members based on the percentage of each municipality's revenue to total revenue. The City of Cleveland receives collections of tax receipts in advance of the regular monthly distribution date, and accordingly, interest income is allocated exclusively to the other members. Investments: The Division follows the provisions of GASB Statement No. 31, Accounting and Financial Reporting for Certain Investments and External Investment Pools, which requires governmental entities to report certain investments at fair value and recognize the corresponding change in the fair value of investments in the year in which the change occurred. The fair value is based on quoted market rates. The City has invested funds in STAROhio during years 2012 and 2011. STAROhio is an investment pool managed by the State Treasurer’s Office, which allows governments within the State to pool their funds for investment purposes. STAROhio is not registered with SEC as an investment company, but does operate in a manner consistent with Rule 2a7 of the Investment Company Act of 1940. Investments in STAROhio are valued at STAROhio’s share price, which is the price the investment could be sold for on December 31, 2012 and 2011. Capital Assets and Depreciation: Capital assets are stated on the basis of historical cost, or if contributed, at fair market value as of the date received. Depreciation is computed by allocating the cost of capital assets over the estimated useful lives of the assets using the straight-line method. A capital asset is defined as an item with a useful life in excess of one year and an individual cost of more than $5,000 for land, furniture, fixtures, equipment and vehicles and $10,000 for all other assets. When capital assets are disposed, the cost and related accumulated depreciation are removed from the accounts with gains or losses on disposition being reflected in operations. The estimated useful lives are as follows:
Furniture, fixtures, equipment and vehicles 3 to 60 years Compensated Absences: The Agency accrues for compensated absences such as vacation, sick leave and compensatory time using the termination payment method specified under GASB Statement No. 16, Accounting for Compensated Absences. These amounts are recorded as accrued wages and benefits in the accompanying statement of net position.
Normally, all vacation time is to be taken in the year available. The Agency allows employees to carryover vacation time from one year to the next. Sick days not taken may be accumulated until retirement. An employee is paid one-third of accumulated sick leave upon retirement, calculated at the three-year average base salary rate, with the balance being forfeited.

CITY OF CLEVELAND, OHIO CENTRAL COLLECTION AGENCY
DEPARTMENT OF FINANCE DIVISION OF TAXATION
NOTES TO FINANCIAL STATEMENTS (Continued)
For the Years Ended December 31, 2012 and 2011
18
NOTE C--POOLED AND SEGREGATED CASH AND INVESTMENTS
Deposits: The carrying amount of the Agency’s deposits at December 31, 2012 and December 31, 2011 totaled $2,967,406 and $2,905,987, respectively, and the Agency’s bank balances were $2,166,208 and $2,595,620, respectively. The differences represent outstanding warrants payable, positions in pooled bank accounts and normal reconciling items. Based on the criteria described in GASB Statement No. 3, Deposits with Financial Institutions, Investments (including Repurchase Agreements), and Reverse Repurchase Agreements and GASB Statement No. 40, Deposit and Investment Risk Disclosures – an Amendment of GASB Statement No. 3, $2,166,208 and $2,595,620 of the bank balances at December 31, 2012 and 2011, respectively, were insured or collateralized with securities held by the City or by its agent in the City’s name.
Custodial credit risk for deposits is the risk that in the event of bank failure, the Agency will not be able to recover deposits or collateral for securities that are in possession of an outside party. At year end, the Agency’s deposits were fully insured or collateralized. All deposits are collateralized with eligible securities pledged and deposited either with the City or with a qualified trustee by the financial institution as security for repayment of all public monies deposited in the financial institution whose market value at all times is equal to at least 110% of the carrying value of the deposits being secured. Investments: The City’s investment policies are governed by state statutes and City ordinances which authorize the City to invest in obligations of the U.S. Treasury, agencies and instrumentalities; State Treasurer Asset Reserve Fund (STAROhio); commercial paper; US Government Money Market Mutual Funds; guaranteed investment contracts; manuscript debt; bonds and other State of Ohio obligations; certificates of deposit; and repurchase transactions. Such repurchase transactions must be purchased from financial institutions or registered broker/dealers. Repurchase transactions are not to exceed a period of one year and confirmation of securities pledged must be obtained.
Generally, investments are recorded in segregated accounts by way of book entry through the banks’ commercial or trust department and are kept at the Federal Reserve Bank in the depository institutions’ separate custodial account for the Agency, apart from the assets of the depository institution. Ohio statute prohibits the use of reverse repurchase agreements.
Investment securities are exposed to various risks such as interest rate, market and credit. Market values of securities fluctuate based on the magnitude of changing market conditions; significant changes in market conditions could materially affect portfolio value.
Interest rate risk: As a means of limiting its exposure to fair value losses caused by rising interest rates, the Agency invests primarily in short-term investments maturing within five years from the date of purchase. The intent is to avoid the need to sell securities prior to maturity.
Custodial Credit Risk: For an investment, custodial credit risk is the risk that, in the event of the failure of the counterparty, the Agency will not be able to recover the value of the investments or collateral securities that are in the possession of an outside party. The Agency does not have an investment policy dealing with investment custodial credit risk beyond the requirement in the state statute.

CITY OF CLEVELAND, OHIO CENTRAL COLLECTION AGENCY
DEPARTMENT OF FINANCE DIVISION OF TAXATION
NOTES TO FINANCIAL STATEMENTS (Continued)
For the Years Ended December 31, 2012 and 2011
19
NOTE C--POOLED AND SEGREGATED CASH AND INVESTMENTS (Continued)
Credit Risk: The Division’s investments as of December 31, 2012 and 2011 include STAROhio and mutual funds. Investments in STAROhio and Federated Government Obligation Mutual Fund carry a rating of AAAm, which is the highest money market fund rating given by Standard & Poor’s. Ohio law requires that STAROhio maintain the highest rating provided by at least one nationally recognized standard rating service.
Concentration of Credit Risk: The Agency places a limitation on the amount it may invest in any one issuer to help minimize the concentration of credit risk. The Agency had the following investments at December 31, 2012 and 2011, which include those classified as cash and cash equivalents in the Statements of Net Position in accordance with the provisions of GASB Statement No. 9 since they have a maturity of three months or less:
Investment2012 2011 Maturities
Type of Fair 2012 Fair 2011 Less ThanInvestment Value Cost Value Cost One Year
STAROhio 10,052,926$ 10,052,926$ 1,683,888$ 1,683,888$ 10,052,926$ Investment in Mutual Funds 972,887 972,887 6,663,558 6,663,558 972,887
Total Investments 11,025,813 11,025,813 8,347,446 8,347,446 11,025,813 Total Deposits 2,967,406 2,967,406 2,905,987 2,905,987 2,967,406
Total Deposits and Investments 13,993,219$ 13,993,219$ 11,253,433$ 11,253,433$ 13,993,219$
. These amounts are monies invested by the City Treasurer on behalf of the Agency and are used in daily operations with excess monies invested daily in STAROhio and mutual funds. These investments are carried at cost which approximates market value. Monies due to member agencies are disbursed from these funds on a monthly basis.
As of December 31, 2012, the investments in STAROhio and mutual funds are approximately 91% and 9%, respectively, of the Agency’s total investments. As of December 31, 2011, the investments in STAROhio and mutual funds are approximately 20% and 80%, respectively, of the Agency’s total investments.
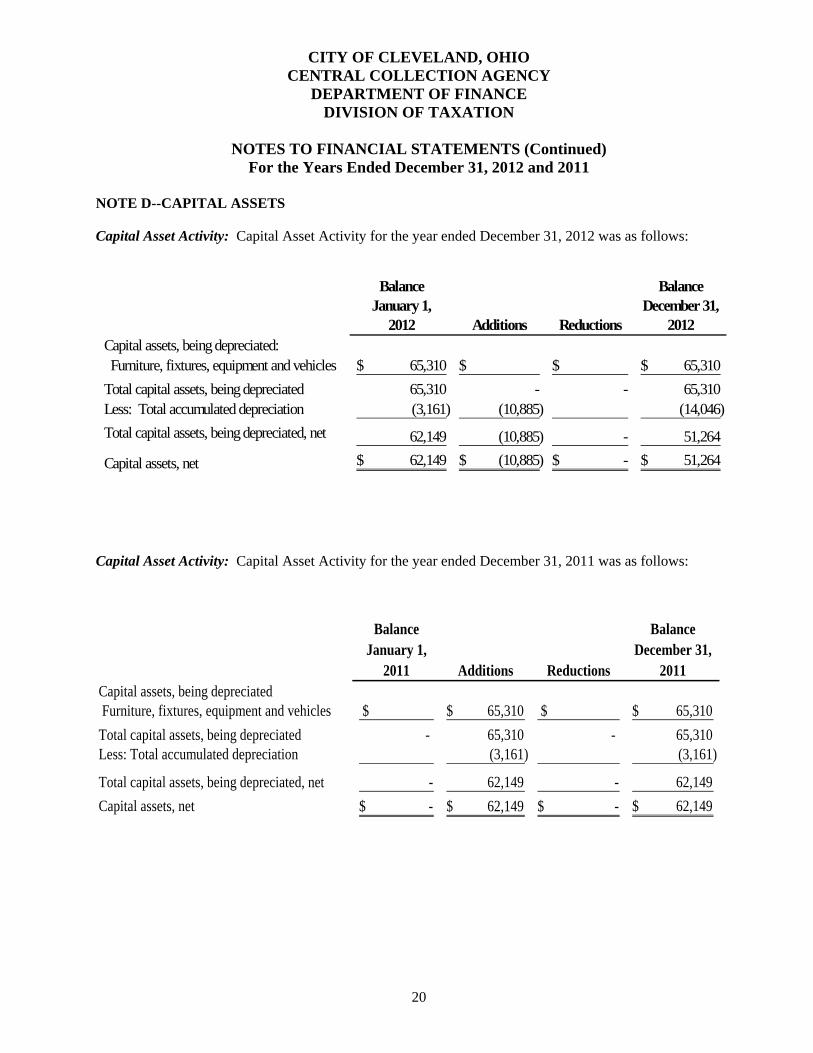
CITY OF CLEVELAND, OHIO CENTRAL COLLECTION AGENCY
DEPARTMENT OF FINANCE DIVISION OF TAXATION
NOTES TO FINANCIAL STATEMENTS (Continued)
For the Years Ended December 31, 2012 and 2011
20
NOTE D--CAPITAL ASSETS
Capital Asset Activity: Capital Asset Activity for the year ended December 31, 2012 was as follows:
Balance BalanceJanuary 1, December 31,
2012 Additions Reductions 2012Capital assets, being depreciated: Furniture, fixtures, equipment and vehicles 65,310$ $ $ 65,310$ Total capital assets, being depreciated 65,310 - - 65,310 Less: Total accumulated depreciation (3,161) (10,885) (14,046) Total capital assets, being depreciated, net 62,149 (10,885) - 51,264
Capital assets, net 62,149$ (10,885)$ -$ 51,264$
Capital Asset Activity: Capital Asset Activity for the year ended December 31, 2011 was as follows:
Balance BalanceJanuary 1, December 31,
2011 Additions Reductions 2011Capital assets, being depreciated Furniture, fixtures, equipment and vehicles $ 65,310$ $ 65,310$ Total capital assets, being depreciated - 65,310 - 65,310 Less: Total accumulated depreciation (3,161) (3,161)
Total capital assets, being depreciated, net - 62,149 - 62,149 Capital assets, net -$ 62,149$ -$ 62,149$

CITY OF CLEVELAND, OHIO CENTRAL COLLECTION AGENCY
DEPARTMENT OF FINANCE DIVISION OF TAXATION
NOTES TO FINANCIAL STATEMENTS (Continued)
For the Years Ended December 31, 2012 and 2011
21
NOTE E--DUE TO AND DUE FROM TRANSACTIONS
During the course of normal operations, the Agency has numerous transactions between its own funds and the municipalities which it serves, including transfers of resources to provide services. Such transactions are generally reflected as due to or due from account balances in the accompanying financial statements. Individual fund due to and due from and certain payables balances as of December 31, 2012 are as follows:
Internal Service AgencyFund Fund Total
Due from CCA internal service fund $ 736,482$ 736,482$ Due from member municipalities 434,551 434,551
Total Due From -$ 1,171,033$ 1,171,033$
Due to the CCA agency fund 736,482$ $ 736,482$ Due to the City of Cleveland 113,000 57,294,784 57,407,784 Due to member municipalities 26,387,134 26,387,134
Total Due To 849,482$ 83,681,918$ 84,531,400$
Individual fund due to and due from and certain payables balances as of December 31, 2011 are as follows:
Internal Service AgencyFund Fund Total
Due from CCA internal service fund $ 317,108$ 317,108$ Due from member municipalities 403,528 403,528
Total Due From -$ 720,636$ 720,636$
Due to the CCA agency fund 317,108$ $ 317,108$ Due to the City of Cleveland 124,296 54,185,095 54,309,391 Due to member municipalities 25,049,168 25,049,168
Total Due To 441,404$ 79,234,263$ 79,675,667$

CITY OF CLEVELAND, OHIO CENTRAL COLLECTION AGENCY
DEPARTMENT OF FINANCE DIVISION OF TAXATION
NOTES TO FINANCIAL STATEMENTS (Continued)
For the Years Ended December 31, 2012 and 2011
22
NOTE F--DEFINED BENEFIT PENSION PLAN Ohio Public Employees Retirement System: All full-time employees, other than non-administrative full-time police officers and firefighters, participate in the Ohio Public Employees Retirement System (OPERS). OPERS administers three separate pension plans as described below:
1) The Traditional Pension Plan – a cost-sharing, multiple-employer defined benefit pension plan. 2) The Member-Directed Plan – a defined contribution plan in which the member invests both member
and employer contributions (employer contributions vest over five years at 20% per year). Under the Member-Directed Plan, members accumulate retirement assets equal to the value of member and (vested) employer contributions plus any investment earnings.
3) The Combined Plan – a cost-sharing, multiple-employer defined benefit pension plan. Under the Combined Plan, OPERS invests employer contributions to provide a formula retirement benefit similar in nature to the Traditional Pension Plan benefit. Member contributions, the investment of which is self-directed by the members, accumulate retirement assets in a manner similar to the Member-Directed Plan.
OPERS provides retirement, disability, survivor and death benefits and annual cost-of-living adjustments to members of the Traditional Pension and Combined Plans. Members of the Member-Directed Plan do not qualify for ancillary benefits. Authority to establish and amend benefits is provided in Chapter 145 of the Ohio Revised Code. OPERS issues a stand-alone financial report. Interested parties may obtain a copy by visiting https://www.opers.org/investments/cafr.shtml, writing to OPERS, 277 East Town Street, Columbus,
hio 43215-4642, or by calling (614) 222-5601 or (800) 222-7377. O The Ohio Revised Code provides statutory authority for member and employer contributions. For 2012, member and employer contribution rates were consistent across all three plans. Member contribution rates were 10.00% in 2012, 2011 and 2010. The employer contribution rates were 14.00% of covered payroll in 2012, 2011 and 2010.
The Agency’s required employer contributions to OPERS for the pension portion of all the plans for the years ending December 31, 2012, 2011 and 2010 were $381,000, $363,000 and $364,000 each year, respectively. The required payments due in 2012, 2011 and 2010 have been made.
In June 2012, the Governmental Accounting Standards Board (GASB) issued GASB No. 68, Accounting and Financial Reporting for Pensions. This accounting standard replaces GASB Statement No. 27 and it is effective for employer fiscal years beginning after June 15, 2014.

CITY OF CLEVELAND, OHIO CENTRAL COLLECTION AGENCY
DEPARTMENT OF FINANCE DIVISION OF TAXATION
NOTES TO FINANCIAL STATEMENTS (Continued)
For the Years Ended December 31, 2012 and 2011
23
NOTE G-- OTHER POSTEMPLOYMENT BENEFITS
Ohio Public Employees Retirement System: All full-time employees, other than non-administrative full-time police officers and firefighters, participate in the Ohio Public Employees Retirement System (OPERS). OPERS administers three separate pension plans: The Traditional Pension Plan – a cost-sharing, multiple-employer defined benefit pension plan; the Member-Directed Plan – a defined contribution plan; and the Combined Plan – a cost-sharing, multiple-employer defined benefit pension plan that has elements of both a defined benefit and defined contribution plan. OPERS maintains a cost-sharing multiple employer defined benefit postemployment health care plan, which includes a medical plan, prescription drug program and Medicare Part B premium reimbursement, to qualifying members of both the Traditional Pension and the Combined Plans. Members of the Member-Directed Plan do not qualify for ancillary benefits, including postemployment health care coverage. In order to qualify for postemployment health care coverage, age-and-service retirees under the Traditional Pension and Combined Plans must have 10 or more years of qualifying Ohio service credit. Health care coverage for disability benefit recipients and qualified survivor benefit recipients is available. The health care coverage provided by OPERS meets the definition of an Other Postemployment Benefit (OPEB) as described in GASB Statement No. 45. The Ohio Revised Code permits, but does not mandate, OPERS to provide OPEB benefits to its eligible members and beneficiaries. Authority to establish and amend benefits is provided in Chapter 145 of the Ohio Revised Code. OPERS issues a stand-alone financial report. Interested parties may obtain a copy by visiting https://www.opers.org/investments/cafr.shtml, writing to OPERS, 277 East Town Street, Columbus, Ohio 43215-4642, or by calling (614) 222-5601 or (800) 222-7377. The Ohio Revised Code provides the statutory authority requiring public employers to fund post-retirement health care through their contributions to OPERS. A portion of each employer’s contribution to OPERS is set aside for funding of post-retirement health care benefits. Employer contribution rates are expressed as a percentage of the covered payroll of active members. The employer contribution rates were 14.00% of covered payroll in 2012, 2011 and 2010. The Ohio Revised Code currently limits the employer contribution to a rate not to exceed 14.00% of covered payroll. Active members do not make contributions to the OPEB Plan. OPERS’ Postemployment Health Care plan was established under and is administrated in accordance with, Internal Revenue Code 401(h). Each year, the OPERS Retirement Board determines the portion of the employer contribution rate that will be set aside for funding of postemployment health care benefits. Employer contribution rates used to fund postemployment benefits were 4.00% for members of the Traditional Plan in 2012 and 2011, 6.05% for members of the Combined Plan in 2012 and 2011 and 5.50% from January 1, 2010 through February 28, 2010 and 5.00% from March 1, 2010 through December 31, 2010 for both plans. Effective January 1, 2013, the portion of employer contributions allocated to health care was lowered to 1.00% for both plans, as recommended by the OPERS Actuary. The OPERS Retirement Board is also authorized to establish rules for the payment of a portion of the health care benefits provided, by the retiree or their surviving beneficiaries. Payment amounts vary depending on the number of covered dependents and the coverage selected. The Agency’s actual contributions to OPERS to fund postemployment benefits were $152,000 in 2012, $145,000 in 2011 and $207,000 in 2010. The required payments due in 2012, 2011 and 2010 have been made. Changes to the health care plan were adopted by the OPERS Board of Trustees on September 19, 2012, with a transition plan commencing January 1, 2014. With the recent passage of pension legislation under SB343 and the approved health care changes, OPERS expects to be able to consistently allocate 4.00% of the employer contributions toward the health care fund after the end of the transition period.
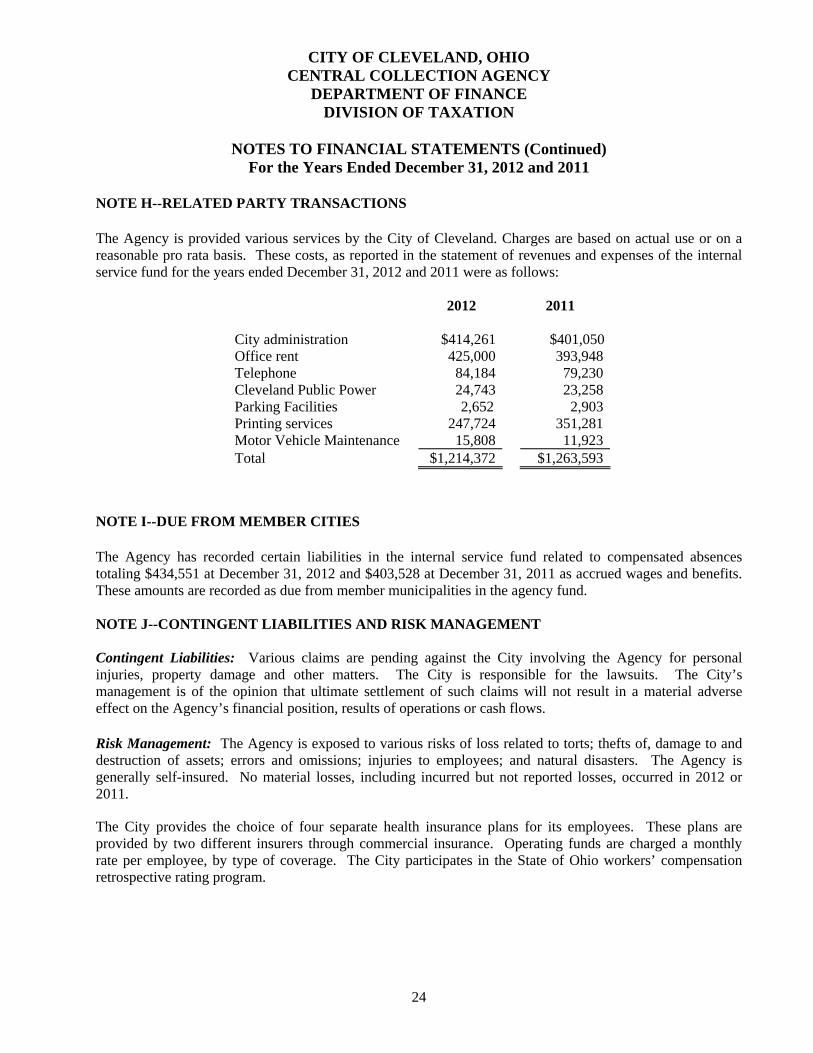
CITY OF CLEVELAND, OHIO CENTRAL COLLECTION AGENCY
DEPARTMENT OF FINANCE DIVISION OF TAXATION
NOTES TO FINANCIAL STATEMENTS (Continued)
For the Years Ended December 31, 2012 and 2011
24
NOTE H--RELATED PARTY TRANSACTIONS The Agency is provided various services by the City of Cleveland. Charges are based on actual use or on a reasonable pro rata basis. These costs, as reported in the statement of revenues and expenses of the internal service fund for the years ended December 31, 2012 and 2011 were as follows:
2012 2011
City administration $414,261 $401,050 Office rent 425,000 393,948 Telephone 84,184 79,230 Cleveland Public Power 24,743 23,258 Parking Facilities 2,652 2,903 Printing services 247,724 351,281 Motor Vehicle Maintenance 15,808 11,923 Total $1,214,372 $1,263,593
NOTE I--DUE FROM MEMBER CITIES
The Agency has recorded certain liabilities in the internal service fund related to compensated absences totaling $434,551 at December 31, 2012 and $403,528 at December 31, 2011 as accrued wages and benefits. These amounts are recorded as due from member municipalities in the agency fund. NOTE J--CONTINGENT LIABILITIES AND RISK MANAGEMENT Contingent Liabilities: Various claims are pending against the City involving the Agency for personal injuries, property damage and other matters. The City is responsible for the lawsuits. The City’s management is of the opinion that ultimate settlement of such claims will not result in a material adverse effect on the Agency’s financial position, results of operations or cash flows. Risk Management: The Agency is exposed to various risks of loss related to torts; thefts of, damage to and destruction of assets; errors and omissions; injuries to employees; and natural disasters. The Agency is generally self-insured. No material losses, including incurred but not reported losses, occurred in 2012 or 2011.
The City provides the choice of four separate health insurance plans for its employees. These plans are provided by two different insurers through commercial insurance. Operating funds are charged a monthly rate per employee, by type of coverage. The City participates in the State of Ohio workers’ compensation retrospective rating program.

CITY OF CLEVELAND, OHIO CENTRAL COLLECTION AGENCY
DEPARTMENT OF FINANCE DIVISION OF TAXATION
NOTES TO FINANCIAL STATEMENTS (Continued)
For the Years Ended December 31, 2012 and 2011
25
NOTE J--CONTINGENT LIABILITIES AND RISK MANAGEMENT (Continued) In accordance with GASB Statement No. 10, claims liabilities are reported when it is probable that a loss has occurred and the amount of the loss can be reasonably estimated. Liabilities include an amount for claims that have been incurred but not reported. The result of the process to estimate the claims liability is not an exact amount as it depends on many complex factors, such as inflation, changes in legal doctrines, and damage awards. Accordingly, claims are re-evaluated periodically to consider the effects of inflation, recent claim settlement trends (including frequency and amount of pay-outs), and other economic and social factors. The estimate of the claims liability also includes amounts for incremental claim adjustment expenses related to specific claims and other claim adjustment expenses, regardless of whether allocated to specific claims. Estimated recoveries, for example from salvage or subrogation, are another component of the claims liability estimate. Claims liability for the Agency is immaterial.
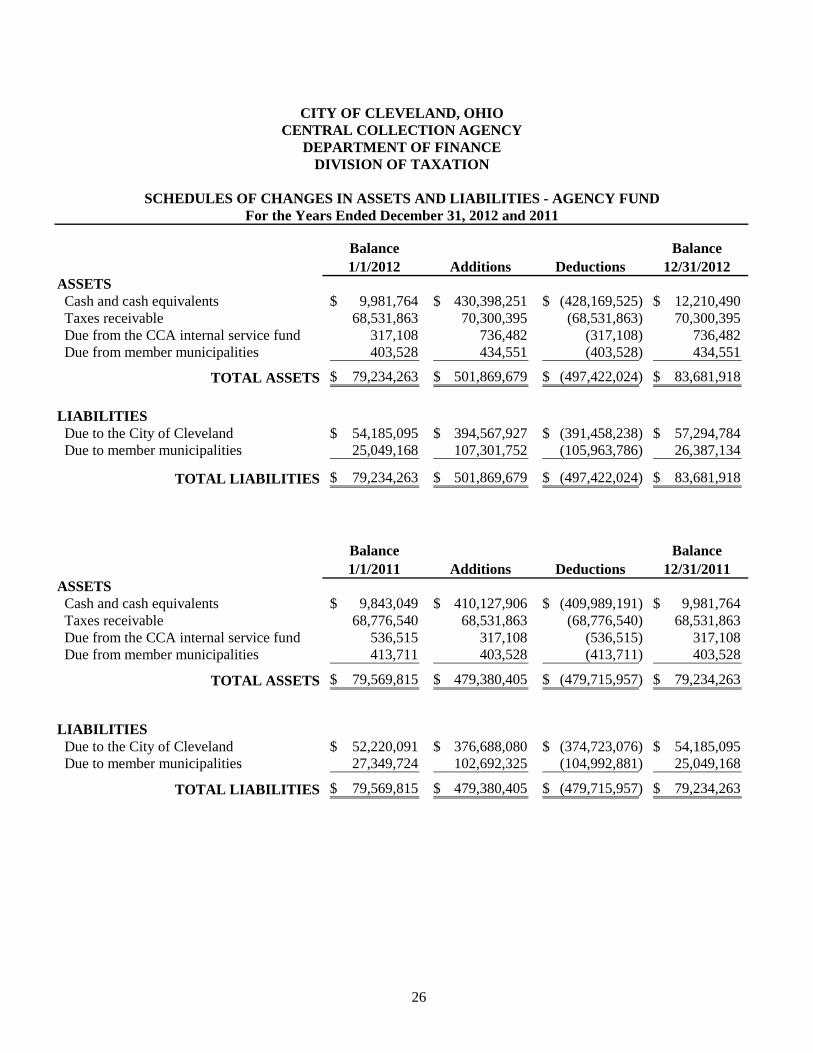
Balance 1/1/2012 Additions Deductions
Balance 12/31/2012
ASSETS Cash and cash equivalents 9,981,764$ 430,398,251$ (428,169,525)$ 12,210,490$ Taxes receivable 68,531,863 70,300,395 (68,531,863) 70,300,395 Due from the CCA internal service fund 317,108 736,482 (317,108) 736,482 Due from member municipalities 403,528 434,551 (403,528) 434,551
TOTAL ASSETS 79,234,263$ 501,869,679$ (497,422,024)$ 83,681,918$
LIABILITIES Due to the City of Cleveland 54,185,095$ 394,567,927$ (391,458,238)$ 57,294,784$ Due to member municipalities 25,049,168 107,301,752 (105,963,786) 26,387,134
TOTAL LIABILITIES 79,234,263$ 501,869,679$ (497,422,024)$ 83,681,918$
Balance 1/1/2011 Additions Deductions
Balance 12/31/2011
ASSETS Cash and cash equivalents 9,843,049$ 410,127,906$ (409,989,191)$ 9,981,764$ Taxes receivable 68,776,540 68,531,863 (68,776,540) 68,531,863 Due from the CCA internal service fund 536,515 317,108 (536,515) 317,108 Due from member municipalities 413,711 403,528 (413,711) 403,528
TOTAL ASSETS 79,569,815$ 479,380,405$ (479,715,957)$ 79,234,263$
LIABILITIES Due to the City of Cleveland 52,220,091$ 376,688,080$ (374,723,076)$ 54,185,095$ Due to member municipalities 27,349,724 102,692,325 (104,992,881) 25,049,168
TOTAL LIABILITIES 79,569,815$ 479,380,405$ (479,715,957)$ 79,234,263$
SCHEDULES OF CHANGES IN ASSETS AND LIABILITIES - AGENCY FUNDFor the Years Ended December 31, 2012 and 2011
CITY OF CLEVELAND, OHIOCENTRAL COLLECTION AGENCY
DEPARTMENT OF FINANCEDIVISION OF TAXATION
26

CIT
Y O
F C
LE
VE
LA
ND
, OH
IOC
EN
TR
AL
CO
LL
EC
TIO
N A
GE
NC
YD
IVIS
ION
OF
TA
XA
TIO
N
SCH
ED
UL
E O
F C
ASH
RE
CE
IPT
S A
ND
DIS
TR
IBU
TIO
N O
F FU
ND
SFO
R T
HE
YE
AR
EN
DE
D D
EC
EM
BE
R 3
1, 2
012
Bal
ance
Allo
catio
nB
alan
ceC
olle
cted
and
Cas
hTo
tal
of N
etTo
tal
Col
lect
ed A
ndD
ue M
embe
rsR
ecei
pts
Cas
hC
ash
Ope
ratin
gD
isbur
sem
ents
Due
Mem
bers
Mem
bers
Janu
ary
1,20
12N
etR
ecei
pts
Disb
urse
dEx
pens
esan
d Ex
pens
esD
ecem
ber 3
1,20
12A
da11
4,94
7.07
$
1,56
5,92
2.50
$
1,68
0,86
9.57
$
1,49
3,75
5.01
$
48
,258
.84
$
1,54
2,01
3.85
$
138,
855.
72$
A
lger
(1,2
10.0
2)55
,538
.09
54,3
28.0
748
,958
.60
6,40
4.78
55,3
63.3
8
(1
,035
.31)
Ath
ens
665.
00
665.
0062
5.00
49.2
867
4.28
(9
.28)
Bar
berto
n82
3,23
0.28
10,2
41,8
10.1
0
11,0
65,0
40.3
89,
898,
035.
30
27
5,07
8.73
10,1
73,1
14.0
3
891,
926.
35B
edfo
rd(4
28.8
2)12
,379
.18
11,9
50.3
611
,395
.36
869.
5212
,264
.88
(314
.52)
Bra
dner
4,14
4.06
128,
284.
32
132,
428.
3811
6,87
9.85
10
,464
.95
127,
344.
80
5,08
3.58
Bra
tena
hl26
2,10
5.83
1,46
6,24
0.43
1,72
8,34
6.26
1,52
0,96
2.81
37,0
01.1
11,
557,
963.
92
17
0,38
2.34
Bur
ton
37,2
92.3
646
7,60
8.71
50
4,90
1.07
450,
903.
31
26,0
27.1
347
6,93
0.44
27
,970
.63
Cle
vela
nd5,
014,
287.
5133
4,66
4,09
7.67
33
9,67
8,38
5.18
327,
762,
699.
03
5,22
2,00
6.46
332,
984,
705.
49
6,69
3,67
9.69
Crid
ersv
ille
10,4
50.1
830
4,47
6.78
31
4,92
6.96
279,
413.
04
22,3
06.4
830
1,71
9.52
13
,207
.44
Cuy
ahog
a Fa
lls67
,404
.68
67,4
04.6
860
,933
.70
6,72
7.76
67,6
61.4
6
(2
56.7
8)D
ayto
n22
,754
.21
228,
982.
94
251,
737.
1522
8,41
7.40
23
,550
.34
251,
967.
74
(230
.59)
East
lake
33,6
59.1
4
33
,659
.14
31,7
08.0
7
2,
113.
9933
,822
.06
(162
.92)
Elid
a16
,196
.10
425,
905.
04
442,
101.
1439
6,22
3.94
27
,852
.53
424,
076.
47
18,0
24.6
7En
glew
ood
18,5
45.8
7
18
,545
.87
17,5
22.2
0
2,
172.
7919
,694
.99
(1,1
49.1
2)G
ates
Mill
s20
3,41
9.65
1,63
8,56
9.38
1,84
1,98
9.03
1,59
2,82
3.08
54,9
83.2
61,
647,
806.
34
19
4,18
2.69
Gen
eva-
on-th
e-La
ke(1
,079
.30)
167,
005.
84
165,
926.
5414
5,64
6.71
16
,209
.69
161,
856.
40
4,07
0.14
Gra
nd R
apid
s(4
79.7
6)25
8,55
4.01
25
8,07
4.25
225,
962.
29
19,8
17.4
524
5,77
9.74
12
,294
.51
Gra
nd R
iver
29,3
25.2
126
8,66
7.34
297,
992.
5526
6,09
1.45
8,74
4.24
274,
835.
69
23
,156
.86
Ham
ilton
203,
052.
70
203,
052.
7017
8,94
9.90
16
,485
.78
195,
435.
68
7,61
7.02
Hig
hlan
d H
ills
228,
135.
923,
227,
048.
28
3,
455,
184.
203,
195,
515.
57
47
,982
.71
3,24
3,49
8.28
211,
685.
92H
unts
ville
284.
0563
,143
.17
63,4
27.2
255
,081
.43
5,92
0.02
61,0
01.4
5
2,
425.
77La
kew
ood
20.6
912
,963
.40
12,9
84.0
911
,404
.48
1,79
2.11
13,1
96.5
9
(2
12.5
0)La
ncas
ter
99,5
10.3
2
99
,510
.32
86,7
28.5
4
5,
968.
5992
,697
.13
6,81
3.19
Libe
rty C
ente
r2,
689.
6718
3,24
2.41
18
5,93
2.08
167,
595.
76
13,2
81.9
718
0,87
7.73
5,
054.
35Li
ma
(781
.10)
16,0
85.9
1
15
,304
.81
13,8
31.4
4
2,
342.
2316
,173
.67
(868
.86)
Linn
dale
5,83
2.04
77,7
17.8
7
83
,549
.91
76,2
09.9
7
2,
804.
7679
,014
.73
4,53
5.18
Lora
in(2
,349
.49)
31,5
79.6
6
29
,230
.17
25,3
70.5
4
2,
142.
3027
,512
.84
1,71
7.33
Mad
ison
56,6
21.2
186
3,61
0.36
92
0,23
1.57
812,
486.
66
52,7
45.5
386
5,23
2.19
54
,999
.38
Med
ina
897,
634.
9113
,712
,781
.05
14
,610
,415
.96
13,0
48,9
95.2
4
47
1,67
6.10
13,5
20,6
71.3
4
1,08
9,74
4.62
Men
tor-
on-th
e-La
ke55
,225
.44
848,
545.
59
903,
771.
0380
3,71
9.55
44
,385
.56
848,
105.
11
55,6
65.9
2M
unro
e Fa
lls75
,498
.95
1,09
1,82
4.82
1,16
7,32
3.77
1,02
6,15
6.62
50,5
85.7
11,
076,
742.
33
90
,581
.44
Nor
thfie
ld64
,014
.50
1,06
2,12
6.75
1,12
6,14
1.25
980,
732.
95
45,5
92.4
81,
026,
325.
43
99
,815
.82
Nor
th B
altim
ore
50,1
55.4
668
6,59
7.86
73
6,75
3.32
632,
309.
52
33,9
46.2
466
6,25
5.76
70
,497
.56
Nor
th P
erry
73,6
10.1
71,
002,
641.
95
1,
076,
252.
1297
9,63
3.97
18
,793
.54
998,
427.
51
77,8
24.6
1N
orth
Ran
dall
90,7
02.4
71,
007,
884.
67
1,
098,
587.
1499
1,31
1.51
27
,783
.23
1,01
9,09
4.74
79,4
92.4
0N
orto
n31
0,47
8.39
4,81
6,40
1.81
5,12
6,88
0.20
4,57
8,01
4.77
172,
931.
174,
750,
945.
94
37
5,93
4.26
Vill
age
of O
akw
ood
3,95
0.14
85,4
73.4
1
89
,423
.55
77,5
98.5
7
8,
016.
5085
,615
.07
3,80
8.48
Pain
esvi
lle56
1,54
4.70
8,06
6,35
0.08
8,62
7,89
4.78
7,69
4,76
3.93
192,
670.
007,
887,
433.
93
74
0,46
0.85
Parm
a H
eigh
ts1,
204.
77
1,
204.
771,
144.
77
60.0
01,
204.
77
-
Paul
ding
7,35
6.03
434,
657.
80
442,
013.
8338
8,12
0.01
38
,490
.03
426,
610.
04
15,4
03.7
9Pe
nins
ula
16,2
31.1
629
2,24
2.09
30
8,47
3.25
273,
126.
90
16,5
95.9
528
9,72
2.85
18
,750
.40
Roc
ky R
iver
594,
737.
058,
868,
954.
44
9,
463,
691.
498,
395,
345.
53
35
3,56
0.78
8,74
8,90
6.31
714,
785.
18R
usse
lls P
oint
9,74
2.96
230,
051.
47
239,
794.
4321
1,43
7.49
17
,157
.68
228,
595.
17
11,1
99.2
6Se
ville
61,4
83.3
71,
026,
007.
19
1,
087,
490.
5697
2,10
0.67
47
,814
.66
1,01
9,91
5.33
67,5
75.2
3So
uth
Rus
sell
97,8
98.6
81,
334,
853.
13
1,
432,
751.
811,
271,
160.
55
62
,499
.95
1,33
3,66
0.50
99,0
91.3
1St
ow2,
368.
4624
,211
.05
26,5
79.5
122
,561
.01
2,33
4.38
24,8
95.3
9
1,
684.
12Ti
mbe
rlake
264.
1684
,115
.64
84,3
79.8
073
,948
.70
8,38
4.21
82,3
32.9
1
2,
046.
89Tr
otw
ood
6,48
2.14
36,8
84.3
4
43
,366
.48
36,1
39.0
3
2,
568.
5738
,707
.60
4,65
8.88
Troy
(2,2
07.1
2)42
,877
.54
40,6
70.4
224
,167
.78
6,32
0.87
30,4
88.6
5
10
,181
.77
Wad
swor
th50
6,45
2.09
7,59
6,51
4.98
8,10
2,96
7.07
7,14
3,13
7.89
318,
166.
737,
461,
304.
62
64
1,66
2.45
War
ren
(1,9
16.5
9)80
,335
.99
78,4
19.4
067
,840
.19
6,18
6.84
74,0
27.0
3
4,
392.
37W
arre
nsvi
lle H
eigh
ts96
8,47
4.76
13,5
22,4
92.7
3
14,4
90,9
67.4
913
,118
,549
.75
266,
872.
1713
,385
,421
.92
1,
105,
545.
57W
ayne
sfie
ld2,
348.
7912
9,57
1.15
13
1,91
9.94
118,
666.
76
8,48
7.78
127,
154.
54
4,76
5.40
Tota
ls11
,277
,938
.62
$
422,
877,
873.
40$
434,
155,
812.
02$
412,
102,
814.
10$
8,18
3,98
6.46
$
420,
286,
800.
56$
13,8
69,0
11.4
6$
27

CIT
Y O
F C
LE
VE
LA
ND
, OH
IOC
EN
TR
AL
CO
LL
EC
TIO
N A
GE
NC
YD
IVIS
ION
OF
TA
XA
TIO
N
SCH
ED
UL
E O
F A
LL
OC
AT
ION
OF
NE
T O
PER
AT
ING
EX
PEN
SES
FOR
TH
E Y
EA
R E
ND
ED
DE
CE
MB
ER
31,
201
2
Inte
rest
Inco
me
Allo
catio
nC
ost
Inte
rest
Cos
t Allo
catio
nof
Mun
icip
aliti
esof
Net
Allo
catio
nA
lloca
tion
Bef
ore
Inte
rest
Oth
er T
han
Ope
ratin
gM
embe
rsPe
rcen
tPe
rcen
tIn
com
eC
leve
land
Expe
nses
Ad a
0.59
0908
%1.
9538
32%
48,4
03.6
2$
14
4.78
$
48
,258
.84
$
A
lger
0.07
8252
%0.
0692
96%
6,40
9.91
5.13
6,40
4.78
A
then
s0.
0006
02%
0.00
0830
%49
.34
0.
06
49
.28
B
arbe
rton
3.36
9702
%12
.778
906%
276,
025.
63
946.
90
275,
078.
73
B
edfo
rd0.
0106
29%
0.01
5446
%87
0.66
1.
14
86
9.52
Bra
dner
0.12
7900
%0.
1600
63%
10,4
76.8
1
11
.86
10
,464
.95
B
rate
nahl
0.45
3362
%1.
8294
57%
37,1
36.6
7
13
5.56
37
,001
.11
B
urto
n0.
3182
65%
0.58
3444
%26
,070
.36
43.2
3
26,0
27.1
3
Cle
vela
nd63
.508
923%
0.00
0000
%5,
222,
006.
46
5,
222,
006.
46
Crid
ersv
ille
0.27
2660
%0.
3799
02%
22,3
34.6
3
28
.15
22
,306
.48
C
uyah
oga
Falls
0.08
2208
%0.
0841
02%
6,73
3.99
6.23
6,72
7.76
D
ayto
n0.
2877
59%
0.28
5706
%23
,571
.51
21.1
7
23,5
50.3
4
East
lake
0.02
5845
%0.
0419
97%
2,11
7.10
3.11
2,11
3.99
El
ida
0.34
0503
%0.
5314
10%
27,8
91.9
1
39
.38
27
,852
.53
En
glew
ood
0.02
6546
%0.
0231
40%
2,17
4.50
1.71
2,17
2.79
G
ates
Mill
s0.
6730
81%
2.04
4475
%55
,134
.75
151.
49
54,9
83.2
6
Gen
eva-
on-th
e-La
ke0.
1980
75%
0.20
8376
%16
,225
.13
15.4
4
16
,209
.69
Gra
nd R
apid
s0.
2422
22%
0.32
2603
%19
,841
.35
23.9
0
19,8
17.4
5
Gra
nd R
iver
0.10
7052
%0.
3352
21%
8,76
9.08
24.8
4
8,
744.
24
H
amilt
on0.
2014
86%
0.25
3353
%16
,504
.55
18.7
7
16
,485
.78
Hig
hlan
d H
ills
0.58
9412
%4.
0264
51%
48,2
81.0
7
29
8.36
47
,982
.71
Hun
tsvi
lle0.
0723
43%
0.07
8785
%5,
925.
86
5.
84
5,92
0.02
Lake
woo
d0.
0218
93%
0.01
6175
%1,
793.
31
1.
20
1,79
2.11
Lanc
aste
r0.
0729
76%
0.12
4161
%5,
977.
79
9.
20
5,
968.
59
Libe
rty C
ente
r0.
1623
52%
0.22
8635
%13
,298
.91
16.9
4
13,2
81.9
7
Lim
a0.
0286
12%
0.02
0071
%2,
343.
72
1.
49
2,
342.
23
Linn
dale
0.03
4328
%0.
0969
70%
2,81
1.95
7.19
2,
804.
76
Lo
rain
0.02
6189
%0.
0394
03%
2,14
5.22
2.92
2,14
2.30
M
adiso
n0.
6448
88%
1.07
7543
%52
,825
.37
79.8
4
52,7
45.5
3
Med
ina
5.77
3667
%17
.109
704%
472,
943.
91
1,26
7.81
471,
676.
10
M
ento
r-on
-the-
Lake
0.54
2814
%1.
0587
47%
44,4
64.0
1
78
.45
44
,385
.56
M
unro
e Fa
lls0.
6187
79%
1.36
2291
%50
,686
.65
100.
94
50,5
85.7
1
Nor
thfie
ld0.
5577
89%
1.32
5236
%45
,690
.68
98.2
0
45,5
92.4
8
Nor
th B
altim
ore
0.41
5188
%0.
8566
82%
34,0
09.7
2
63
.48
33
,946
.24
N
orth
Per
ry0.
2305
62%
1.25
1016
%18
,886
.24
92.7
0
18,7
93.5
4
Nor
th R
anda
ll0.
3403
13%
1.25
7557
%27
,876
.41
93.1
8
27,7
83.2
3
Nor
ton
2.11
6568
%6.
0095
18%
173,
376.
47
445.
30
172,
931.
17
V
illag
e of
Oak
woo
d0.
0979
61%
0.10
6647
%8,
024.
40
7.
90
8,
016.
50
Pain
esvi
lle2.
5898
67%
0.00
0000
%19
2,67
0.00
19
2,67
0.00
Parm
a H
eigh
ts0.
0039
39%
0.00
0000
%60
.00
60
.00
Pa
uldi
ng0.
4703
74%
0.54
2331
%38
,530
.22
40.1
9
38,4
90.0
3
Peni
nsul
a0.
2029
32%
0.36
4636
%16
,622
.97
27.0
2
16,5
95.9
5
Roc
ky R
iver
4.32
6256
%11
.065
967%
354,
380.
75
819.
97
353,
560.
78
R
usse
lls P
oint
0.20
9719
%0.
2870
40%
17,1
78.9
5
21
.27
17
,157
.68
Se
ville
0.58
4876
%1.
2801
69%
47,9
09.5
2
94
.86
47
,814
.66
So
uth
Rus
sell
0.76
4502
%1.
6655
22%
62,6
23.3
6
12
3.41
62
,499
.95
St
ow0.
0285
25%
0.03
0209
%2,
336.
62
2.
24
2,
334.
38
Tim
berla
ke0.
1024
49%
0.10
4953
%8,
391.
99
7.
78
8,
384.
21
Trot
woo
d0.
0313
99%
0.04
6021
%2,
571.
98
3.
41
2,
568.
57
Troy
0.07
7213
%0.
0534
99%
6,32
4.83
3.96
6,32
0.87
W
adsw
orth
3.89
2731
%9.
4783
20%
318,
869.
06
702.
33
318,
166.
73
W
arre
n 0.
0756
19%
.0.
1002
37%
6,19
4.27
7.43
6,18
6.84
W
arre
nsvi
lle H
eigh
ts3.
2732
20%
16.8
7227
7%26
8,12
2.39
1,
250.
22
26
6,87
2.17
Way
nesf
ield
0.10
3765
%0.
1616
68%
8,49
9.76
11.9
8
8,48
7.78
To
tals
100.
0000
00%
100.
0000
00%
8,19
1,39
6.32
$
7,40
9.86
$
8,18
3,98
6.46
$
28

CITY OF CLEVELAND, OHIOCENTRAL COLLECTIONS AGENCY
DIVISION OF TAXATION
SCHEDULES OF INCOME TAXES RECEIVABLEFOR THE YEARS ENDED DECEMBER 31, 2012 AND 2011
Income IncomeTaxes Taxes
Receivable ReceivableDec. 31, 2012 Dec. 31, 2011
Ada 287,695.99$ 217,305.95$ Alger 29,310.91 21,022.10 Athens 53,599.17Barberton 1,831,823.64 1,938,784.65 Bedford 2,360.56 2,982.42 Bradner 45,933.97 45,508.92 Bratenahl 504,917.23 542,783.42 Burton 130,734.19 139,101.15 Cleveland 50,601,104.01 49,170,807.30 Cridersville 104,407.84 111,722.14 Cuyahoga Falls 1,888.27Dayton 34,425.93 50,548.67 Eastlake 1,727.33Elida 169,972.19 169,552.09 Englewood 1,077.67Gates Mills 674,927.21 631,825.04 Geneva-on-the-Lake 57,603.53 48,416.86 Grand Rapids 99,563.72 77,145.84 Grand River 57,513.97 51,552.69 Hamilton 41,375.15Highland Hills 452,776.23 438,438.55 Huntsville 20,482.71 16,079.62 Lakewood 6,716.89 1,957.47 Lancaster 8,944.21Liberty Center 46,360.77 44,530.43 Lima 3,034.51 2,759.83 Linndale 10,711.15 11,017.73 Lorain 9,708.68 13,497.11 Madison 301,217.06 310,531.44 Medina 3,507,821.88 3,253,925.84 Mentor-on-the-Lake 221,636.88 233,512.32 Munroe Falls 249,824.08 240,165.75 Northfield 267,887.35 260,876.72 North Baltimore 136,744.80 135,053.14 North Perry 104,171.19 125,602.11 North Randall 165,821.85 148,095.83 Norton 1,199,095.38 1,181,535.00 Village of Oakwood 21,827.00 28,907.45 Painesville 503,872.84 1,198,473.22 Paulding 105,130.53 102,009.38 Peninsula 72,324.25 66,031.55 Rocky River 2,558,965.40 2,412,346.28 Russells Point 76,113.73 77,413.16 Seville 317,959.58 305,018.85 South Russell 506,003.88 424,839.48 Stow 5,560.19 4,327.99 Timberlake 34,109.34 33,621.74 Trotwood 2,919.33 11,156.74 Troy 9,096.47 4,265.06 Wadsworth 2,003,237.57 1,750,699.83 Warren 18,819.48 20,889.22 Warrensville Heights 2,582,004.35 2,420,485.06 Waynesfield 37,532.82 34,739.51
70,300,394.86$ 68,531,862.65$
29

CITY OF CLEVELAND, OHIO
DEPARTMENT OF PUBLIC WORKS DIVISION OF PARKING FACILITIES
REPORT ON AUDITS OF FINANCIAL STATEMENTS For the years ended December 31, 2012 and 2011

CITY OF CLEVELAND, OHIO
DEPARTMENT OF PUBLIC WORKS DIVISION OF PARKING FACILITIES
TABLE OF CONTENTS
Page
Independent Auditors' Report ................................................................................................................. 1-2 Management’s Discussion and Analysis................................................................................................. 3-10 Statements of Net Position...................................................................................................................... 13-14 Statements of Revenues, Expenses and Changes in Net Position........................................................... 16 Statements of Cash Flows....................................................................................................................... 17-18 Notes to Financial Statements................................................................................................................. 20-36
one east fourth street, ste. 1200
cincinnati, oh 45202
www.cshco.com
p. 513.241.3111
f. 513.241.1212
cincinnati | cleveland | columbus | miami valley | springfield | toledo
INDEPENDENT AUDITORS’ REPORT
To the Honorable Frank G. Jackson, Mayor, Members of Council and the Audit CommitteeDivision of Parking FacilitiesDepartment of Public WorksCity of Cleveland, Ohio:
Report on the Financial Statements
We have audited the accompanying financial statements of the Division of Parking Facilities, Department of Public Works, City of Cleveland, Ohio (the “Division”) as of and for the years ended December 31, 2012 and 2011 and the related notes to the financial statements, as listed in the table of contents.
Management’s Responsibility for the Financial Statements
Management is responsible for the preparation and fair presentation of these financial statements in accordance with accounting principles generally accepted in the United States of America; this includes the design, implementation, and maintenance of internal control relevant to the preparation and fair presentation of financial statements that are free from material misstatement, whether due to fraud or error.
Auditors’ Responsibility
Our responsibility is to express an opinion on these financial statements based on our audits. We conducted our audits in accordance with auditing standards generally accepted in the United States of America and the standards applicable to financial audits contained in Government Auditing Standards, issued by the Comptroller General of the United States. Those standards require that we plan and perform the audit to obtain reasonable assurance about whether the financial statements are free from material misstatement.
An audit involves performing procedures to obtain audit evidence about the amounts and disclosures in the financial statements. The procedures selected depend on the auditors’ judgment, including the assessment of the risks of material misstatement of the financial statements, whether due to fraud or error. In making those risk assessments, the auditor considers internal control relevant to the entity’s preparation and fair presentation of the financial statements in order to design audit procedures that are appropriate in the circumstances, but not for the purpose of expressing an opinion on the effectiveness of the entity’s internal control. Accordingly, we express no such opinion. An audit also includes evaluating the appropriateness of accounting policies used and the reasonableness of significant accounting estimates made by management, as well as evaluating the overall presentation of the financial statements.
We believe that the audit evidence we have obtained is sufficient and appropriate to provide a basis for our audit opinion.

Opinions
In our opinion, the financial statements referred to previously present fairly, in all material respects, the financial position of the Division of Parking Facilities, Department of Public Works, City of Cleveland, Ohio as of December 31, 2012 and 2011, and the changes in financial position and cash flows thereoffor the years then ended in conformity with accounting principles generally accepted in the United States of America.
Effect of Adopting New Accounting Standards
As discussed in Note A, the Division adopted the provisions of Governmental Accounting Standards Board Statement No. 60 Accounting and Financial Reporting for Service Concession Arrangements, Statement No. 62, Codification of Accounting and Financial Reporting Guidance Contained in Pre-November 30, 1989 FASB and AICPA Pronouncements, Statement No. 63, Financial Reporting of Deferred Outflows of Resources, Deferred Inflows of Resources, and Net Position, and Statement No. 64, Derivative Instruments: Application of Hedge Accounting Termination Provision. Our opinion is not modified with respect to this matter.
Other Matters
As described in Note A, the financial statements present only the financial position and the changes in financial position and cash flows of the Division and do not purport to, and do not, present fairly the financial position of the City of Cleveland as of December 31, 2012 and 2011, and the respective changes in its financial position and cash flows for the years then ended in conformity with accounting principles generally accepted in the United States of America. Our opinion is not modified with respect to this matter.
Required Supplementary Information
Accounting principles generally accepted in the United States of America require that the management’s discussion and analysis on pages 3 through 10 be presented to supplement the basic financial statements. Such information, although not a part of the basic financial statements, is required by the Governmental Accounting Standards Board who considers it to be an essential part of financial reporting for placing the basic financial statements in an appropriate operational, economic, or historical context. We have applied certain limited procedures to the required supplementary information in accordance with auditing standards generally accepted in the United States of America, which consisted of inquiries of management about the methods of preparing the information and comparing the information for consistency with management’s responses to our inquiries, the basic financial statements, and other knowledge we obtained during our audit of the basic financial statements. We do not express an opinion or provide any assurance on the information because the limited procedures do not provide us with sufficient evidence to express an opinion or provide any assurance.
Clark, Schaefer, Hackett & Co.Cincinnati, OhioJune 25, 2013
2

CITY OF CLEVELAND, OHIO DEPARTMENT OF PUBLIC WORKS DIVISION OF PARKING FACILITIES
MANAGEMENT'S DISCUSSION AND ANALYSIS
3
GENERAL
As management of the City of Cleveland’s (the City) Department of Public Works, Division of Parking Facilities (the Division), we offer readers of the Division’s financial statements this narrative overview and analysis of the financial activities of the Division for the years ended December 31, 2012 and 2011. Please read this information in conjunction with the Division’s financial statements and footnotes which begin on page 13.
The Division was created for the purpose of providing moderately priced off-street parking facilities and on-street metered parking to citizens, visitors and those who work in the City. The Division’s operating revenues are derived primarily from charges for parking at its facilities and from parking meter collections. In 2012 the Division facilities included two parking garages and four surface lots. In 2011 the Division facilities included three parking garages and four surface lots until the sale of one garage in October. COMPARISON OF CURRENT YEAR’S AND PRIOR YEARS’ DATA FINANCIAL HIGHLIGHTS • The assets of the Division exceeded its liabilities (net position) by $20,179,000, $18,912,000 and
$21,302,000 at December 31, 2012, 2011 and 2010, respectively. Of these amounts, $5,382,000, $5,391,000 and $7,741,000 (unrestricted net position) at December 31, 2012, 2011 and 2010, respectively, may be used to meet the Division’s ongoing obligations to customers and creditors.
• The Division’s total net position increased by $1,267,000 during 2012, decreased by $2,390,000 during
2011 and decreased by $10,000 during 2010. In 2012, operating income decreased by $541,000 and net non-operating expenses and special items decreased by $3,708,000. In 2011, operating income decreased by $410,000 and net non-operating expenses increased by $7,095,000.
• The Division’s total bonded debt decreased by $2,420,000 (7.1%), $19,570,000 (36.5%) and $3,300,000 (5.8%) during 2012, 2011 and 2010, respectively. These amounts represent the principal payments made in 2012, 2011 and 2010. In addition, in 2011 the Division defeased $16,145,000 as a result of the sale of the Gateway North Garage.
OVERVIEW OF THE FINANCIAL STATEMENTS
This discussion and analysis is intended to serve as an introduction to the Division’s basic financial statements. The accompanying financial statements present financial information for the City of Cleveland’s Division of Parking Facilities Fund, in which the City accounts for the activities of off-street parking operations and meter revenue collections. A fund is a grouping of related accounts that is used to maintain control over resources that have been segregated for specific activities or objectives.

CITY OF CLEVELAND, OHIO DEPARTMENT OF PUBLIC WORKS DIVISION OF PARKING FACILITIES
MANAGEMENT'S DISCUSSION AND ANALYSIS (Continued)
4
OVERVIEW OF THE FINANCIAL STATEMENTS (Continued)
The City, like other state and local governments, uses fund accounting to ensure and demonstrate compliance with finance-related legal requirements.
The Division of Parking Facilities Fund is considered an Enterprise Fund because the operations of the Division are similar to a private sector business enterprise. Accordingly, in accounting for the activities of the Division, the economic resources measurement focus and the accrual basis of accounting is used. The basic financial statements of the Division can be found on pages 13 - 18 of this report.
The notes to the financial statements provide additional information that is essential to a full understanding of the data provided in the basic financial statements. The notes to the basic financial statements can be found on pages 20 – 36 of this report. CONDENSED STATEMENT OF NET POSITION INFORMATION Provided below is condensed statement of net position information for the Division as of December 31, 2012, 2011 and 2010:
2012 2011 2010(Am ounts in 000's)
Assets and Deferred Outflows: Assets: Current assets 5,657$ 1,959$ 2,164$ Restricted assets 8,762 13,188 16,002 Unamortized bond issuance costs 1,288 1,515 2,583 Capital assets, net 36,658 37,573 53,748 Total assets 52,365 54,235 74,497 Deferred Outflows of Resources: Derivative instruments-interest rate swaps 1,829 Total deferred outflows of resources - - 1,829
Total assets and deferred outflows 52,365 54,235 76,326
Liabilities, Deferred Inflows and Net Position: Liabilities: Current liabilities 3,692 4,066 4,983 Long-term liabilities 28,129 30,475 50,041 Total liabilities 31,821 34,541 55,024 Deferred Inflows of Resources: Derivative instruments-interest rate swaps 365 782 Total deferred inflows of resources 365 782 - Net Positon: Net investment in capital assets 9,272 7,943 5,423 Restricted for debt service 5,525 5,578 8,138 Unrestricted 5,382 5,391 7,741 Total net position 20,179 18,912 21,302 Total liabilities, deferred inflows and net position 52,365$ 54,235$ 76,326$

CITY OF CLEVELAND, OHIO DEPARTMENT OF PUBLIC WORKS DIVISION OF PARKING FACILITIES
MANAGEMENT'S DISCUSSION AND ANALYSIS (Continued)
5
CONDENSED STATEMENT OF NET POSITION INFORMATION (Continued) Assets: Current, restricted and other non-capital assets: The Division’s current, restricted and other non-capital assets have decreased a total of approximately 5.7% from 2011 to 2012. This was primarily due to the decrease in restricted assets. The primary reason for the decrease in 2011 was a $3.9 million reduction in restricted assets and unamortized bond issuance costs which was caused by the defeasance of $16.1 million in revenue bonds. Capital assets: The Division’s capital assets (net of accumulated depreciation) as of December 31, 2012 and 2011 amounted to $36,658,000 and $37,573,000, respectively. The total decrease in the Division’s investment in capital assets was $915,000 (2.4%) and $16,175,000 (30.1%) in 2012 and 2011, respectively. The decrease in 2012 was due to depreciation expense exceeding asset additions. The decrease in 2011 is primarily due to the sale of the Gateway North Garage. A summary of the activity in the Division’s capital assets during the year ended December 31, 2012 is as follows:
Balance BalanceJanuary 1, December 31,
2012 Additions Deletions 2012(Amounts in 000's)
Land 5,478$ $ $ 5,478$ Land improvements 1,256 1,256 Buildings, structures and improvements 53,719 53,719 Furniture, fixtures, equipment and vehicles 1,250 50 (10) 1,290 Construction in progress 440 440 Total 61,703 490 (10) 62,183
Less: Accumulated depreciation (24,130) (1,405) 10 (25,525)
Capital assets, net 37,573$ (915)$ -$ 36,658$
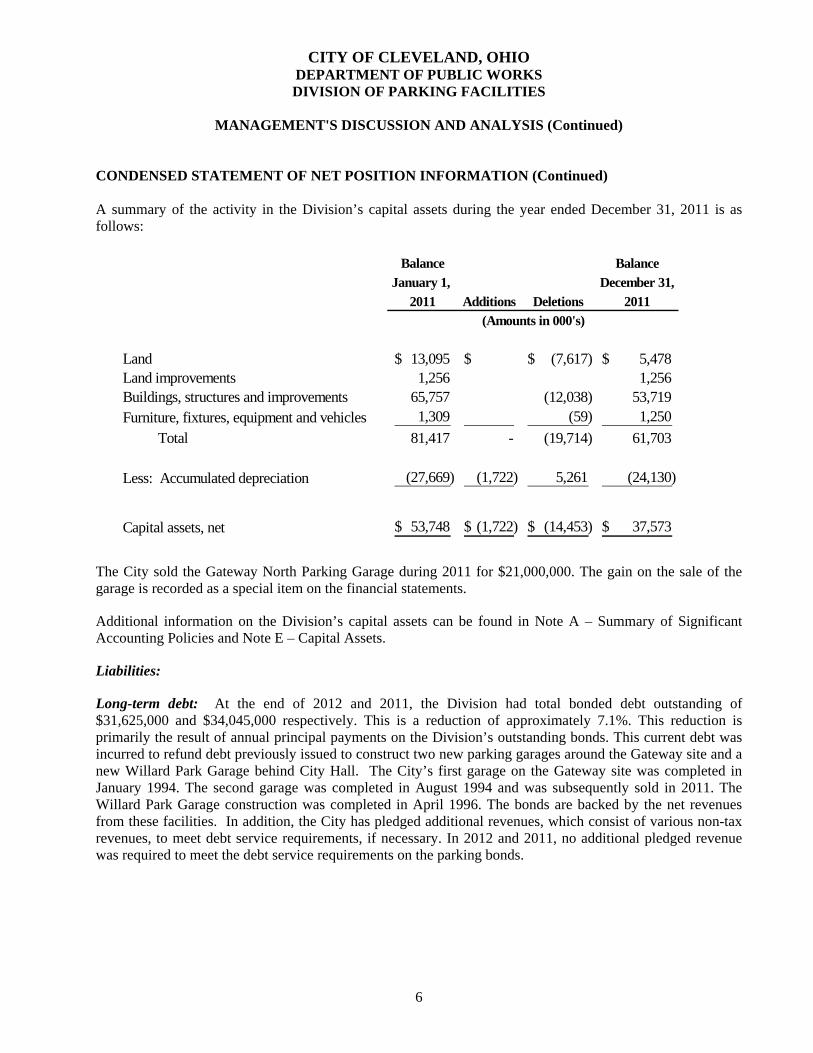
CITY OF CLEVELAND, OHIO DEPARTMENT OF PUBLIC WORKS DIVISION OF PARKING FACILITIES
MANAGEMENT'S DISCUSSION AND ANALYSIS (Continued)
6
CONDENSED STATEMENT OF NET POSITION INFORMATION (Continued) A summary of the activity in the Division’s capital assets during the year ended December 31, 2011 is as follows:
Balance BalanceJanuary 1, December 31,
2011 Additions Deletions 2011(Amounts in 000's)
Land 13,095$ $ (7,617)$ 5,478$ Land improvements 1,256 1,256 Buildings, structures and improvements 65,757 (12,038) 53,719 Furniture, fixtures, equipment and vehicles 1,309 (59) 1,250 Total 81,417 - (19,714) 61,703
Less: Accumulated depreciation (27,669) (1,722) 5,261 (24,130)
Capital assets, net 53,748$ (1,722)$ (14,453)$ 37,573$
The City sold the Gateway North Parking Garage during 2011 for $21,000,000. The gain on the sale of the garage is recorded as a special item on the financial statements.
Additional information on the Division’s capital assets can be found in Note A – Summary of Significant Accounting Policies and Note E – Capital Assets.
Liabilities:
Long-term debt: At the end of 2012 and 2011, the Division had total bonded debt outstanding of $31,625,000 and $34,045,000 respectively. This is a reduction of approximately 7.1%. This reduction is primarily the result of annual principal payments on the Division’s outstanding bonds. This current debt was incurred to refund debt previously issued to construct two new parking garages around the Gateway site and a new Willard Park Garage behind City Hall. The City’s first garage on the Gateway site was completed in January 1994. The second garage was completed in August 1994 and was subsequently sold in 2011. The Willard Park Garage construction was completed in April 1996. The bonds are backed by the net revenues from these facilities. In addition, the City has pledged additional revenues, which consist of various non-tax revenues, to meet debt service requirements, if necessary. In 2012 and 2011, no additional pledged revenue was required to meet the debt service requirements on the parking bonds.

CITY OF CLEVELAND, OHIO DEPARTMENT OF PUBLIC WORKS DIVISION OF PARKING FACILITIES
MANAGEMENT'S DISCUSSION AND ANALYSIS (Continued)
7
CONDENSED STATEMENT OF NET POSITION INFORMATION (Continued)
The activity in the Division’s debt obligations outstanding during the year ended December 31, 2012 is summarized below:
Balance BalanceJanuary 1, Debt December 31,
2012 Retired 2012
Parking Facilities Improvement
Revenue Bonds 34,045$ (2,420)$ 31,625$
(Amounts in 000's)
The activity in the Division’s debt obligations outstanding during the year ended December 31, 2011 is summarized below:
Balance BalanceJanuary 1, Debt December 31,
2011 Retired 2011
Parking Facilities Improvement
Revenue Bonds 53,615$ (19,570)$ 34,045$
(Amounts in 000's)
The bond ratings at December 31, 2012 for the Division’s revenue bonds are as follows:
Moody’sInvestors Service Standard & Poor’s
Series 2006 Bonds Aa3 AA-
The bond ratings indicated above are insured ratings only, reflecting the ratings of Assured Guaranty Municipal Corp. (formerly Financial Security Assurance, Inc.). The Division has no ratings on its bonds based solely on its own credit.
In addition, the Division entered into a derivative or hedging agreement in 2003. Derivative instruments are contracts, the value of which depends on, or derives from, the value of an underlying asset, index or rate. The most common types of derivatives used by governments are interest rate swaps and interest rate locks. A detailed description of the outstanding derivative, including its terms, objectives, risks and fair value, can be found in Note B – Long-Term Debt and Other Obligations.
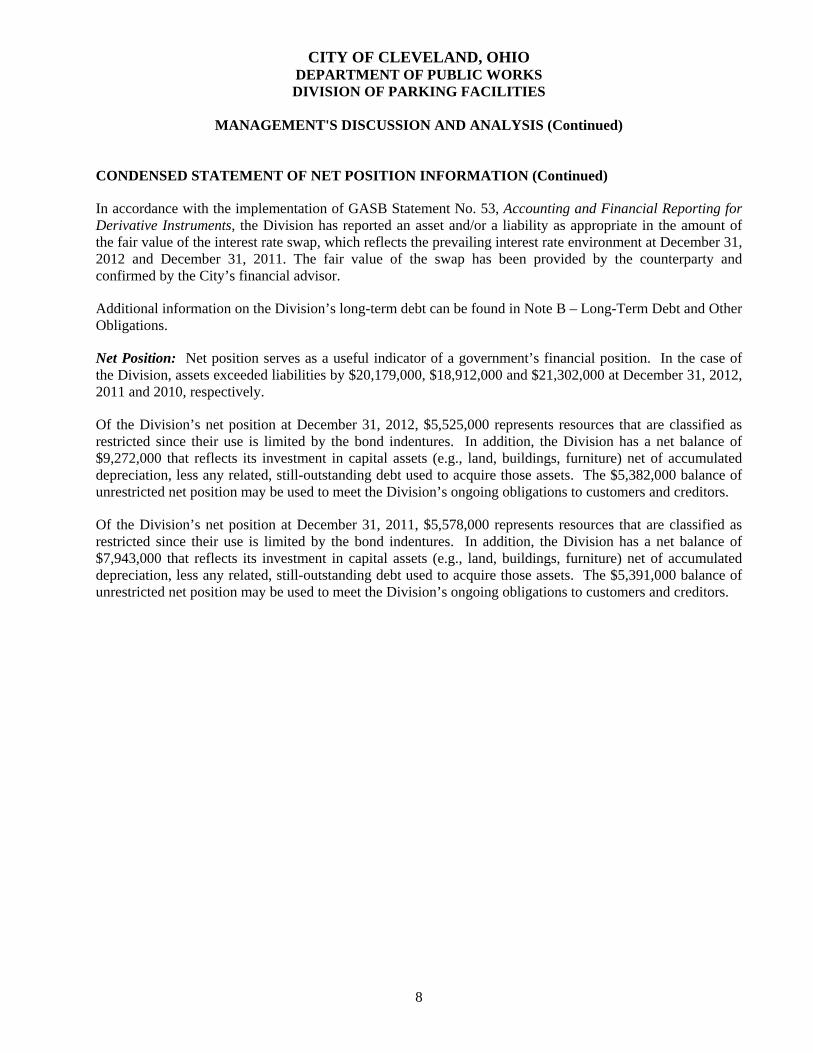
CITY OF CLEVELAND, OHIO DEPARTMENT OF PUBLIC WORKS DIVISION OF PARKING FACILITIES
MANAGEMENT'S DISCUSSION AND ANALYSIS (Continued)
8
CONDENSED STATEMENT OF NET POSITION INFORMATION (Continued)
In accordance with the implementation of GASB Statement No. 53, Accounting and Financial Reporting for Derivative Instruments, the Division has reported an asset and/or a liability as appropriate in the amount of the fair value of the interest rate swap, which reflects the prevailing interest rate environment at December 31, 2012 and December 31, 2011. The fair value of the swap has been provided by the counterparty and confirmed by the City’s financial advisor.
Additional information on the Division’s long-term debt can be found in Note B – Long-Term Debt and Other Obligations.
Net Position: Net position serves as a useful indicator of a government’s financial position. In the case of the Division, assets exceeded liabilities by $20,179,000, $18,912,000 and $21,302,000 at December 31, 2012, 2011 and 2010, respectively.
Of the Division’s net position at December 31, 2012, $5,525,000 represents resources that are classified as restricted since their use is limited by the bond indentures. In addition, the Division has a net balance of $9,272,000 that reflects its investment in capital assets (e.g., land, buildings, furniture) net of accumulated depreciation, less any related, still-outstanding debt used to acquire those assets. The $5,382,000 balance of unrestricted net position may be used to meet the Division’s ongoing obligations to customers and creditors.
Of the Division’s net position at December 31, 2011, $5,578,000 represents resources that are classified as restricted since their use is limited by the bond indentures. In addition, the Division has a net balance of $7,943,000 that reflects its investment in capital assets (e.g., land, buildings, furniture) net of accumulated depreciation, less any related, still-outstanding debt used to acquire those assets. The $5,391,000 balance of unrestricted net position may be used to meet the Division’s ongoing obligations to customers and creditors.

CITY OF CLEVELAND, OHIO DEPARTMENT OF PUBLIC WORKS DIVISION OF PARKING FACILITIES
MANAGEMENT'S DISCUSSION AND ANALYSIS (Continued)
9
CONDENSED STATEMENT OF REVENUES, EXPENSES AND CHANGES IN NET POSITION INFORMATION
The Division’s operations during 2012 increased net position by $1,267,000 and during 2011 decreased net position by $2,390,000. Provided below are key elements of the Division’s results of operations as of and for the years ended December 31, 2012, 2011 and 2010:
2012 2011 2010(Amounts in 000's)
Operating revenues 7,735$ 8,453$ 9,227$ Operating expenses 5,301 5,478 5,842
Operating income 2,434 2,975 3,385
Non-operating revenue (expense): Investment income (loss) 423 (773) 5 Interest expense (1,853) (8,649) (3,044) Other non-operating revenue (expense) 11 Sale of scrap 3 Amortization of bond issuance costs (227) (1,068) (370)
Total non-operating revenue (expense), net (1,657) (10,490) (3,395)
Income (Loss) before capital contributions and special item 777 (7,515) (10)
Capital contributions 490 Special items - gain on sale of capital assets 5,125
Increase (Decrease) in net position 1,267 (2,390) (10)
Net position, beginning of year 18,912 21,302 21,312
Net position, end of year 20,179$ 18,912$ 21,302$
Operating revenues: From 2011 to 2012, operating revenues decreased $718,000, or 8.5%. From 2010 to 2011, operating revenues decreased $774,000, or 8.4%. These reductions were primarily due to the sale of the Gateway North Garage. The Gateway North Garage was owned by the Division for all of 2010 and was sold in October of 2011.
Operating expenses: In 2012, operating expenses decreased $177,000, or 3.2%. This reduction was primarily due to the decrease in professional service fees associated with the operators of the Gateway North Garage.

CITY OF CLEVELAND, OHIO DEPARTMENT OF PUBLIC WORKS DIVISION OF PARKING FACILITIES
MANAGEMENT'S DISCUSSION AND ANALYSIS (Continued)
10
CONDENSED STATEMENT OF REVENUES, EXPENSES AND CHANGES IN NET POSITION INFORMATION (Continued) Non-operating revenues and expenses: From 2011 to 2012, net non-operating expenses decreased $8,833,000. This decrease was primarily due to the reduction of interest expense, due to the defeasance of revenue bonds associated with the Gateway North Garage. From 2010 to 2011, net non-operating expenses increased $7,095,000. This increase was primarily due to the defeasance of $16.1 million of revenue bonds. FACTORS EXPECTED TO IMPACT THE DIVISION’S FUTURE FINANCIAL POSITION OR RESULTS OF OPERATIONS Operating revenues are derived primarily from fees charged to users of City-owned parking garages and facilities operated by the Division including the net income from the Gateway garage and on-street parking meter revenue. The Division continues to assess their operations to improve efficiencies, identify additional revenue sources and improve existing revenue sources in this time of economic recession. City Council has the authority to further increase parking fees when deemed necessary to assist the Division in meeting operational and debt commitments as economic circumstances dictate. ADDITIONAL INFORMATION
This financial report is designed to provide a general overview of the Division’s finances. Questions concerning any of the information provided in this report or requests for additional information should be addressed to the Office of the Finance Director, City Hall, Room 104, 601 Lakeside Avenue, Cleveland, Ohio 44114.

11
BASIC FINANCIAL STATEMENTS

12
This page intentionally left blank.

13
CITY OF CLEVELAND, OHIO
DEPARTMENT OF PUBLIC WORKSDIVISION OF PARKING FACILITIES
STATEMENTS OF NET POSITIONDecember 31, 2012 and 2011
(Amounts in 000's)2012 2011
ASSETS
CURRENT ASSETS Cash and cash equivalents 5,449$ 1,762$ Accounts receivable - net of allowance 18 7 Accrued Interest 6 Due from other City of Cleveland departments, divisions or funds 51 48 Inventory of supplies, at cost 139 136
TOTAL CURRENT ASSETS 5,657 1,959
RESTRICTED ASSETS Cash and cash equivalents 8,762 9,093 Investments 4,095
TOTAL RESTRICTED ASSETS 8,762 13,188
UNAMORTIZED BOND ISSUANCE COSTS 1,288 1,515
CAPITAL ASSETS Land 5,478 5,478 Land improvements 1,256 1,256 Buildings, structures and improvements 53,719 53,719 Furniture, fixtures, equipment and vehicles 1,290 1,250 Construction in progress 440
62,183 61,703 Less: Accumulated depreciation (25,525) (24,130)
CAPITAL ASSETS, NET 36,658 37,573
TOTAL ASSETS 52,365$ 54,235$
(Continued)

14
CITY OF CLEVELAND, OHIO
DEPARTMENT OF PUBLIC WORKSDIVISION OF PARKING FACILITIES
STATEMENTS OF NET POSITIONDecember 31, 2012 and 2011
(Amounts in 000's)2012 2011
LIABILITIES, DEFERRED INFLOWS AND NET POSITON
LIABILITIES
CURRENT LIABILITIES Current portion of long-term debt, due within one year 2,520$ 2,420$ Accounts payable 214 753 Due to other governments 221 185 Due to other City of Cleveland departments, divisions or funds 117 67 Accrued interest payable 470 499 Accrued wages and benefits 150 142
TOTAL CURRENT LIABILITIES 3,692 4,066
LONG-TERM LIABILITIES Revenue bonds - excluding amount due within one year 28,103 30,447 Accrued wages and benefits 26 28
TOTAL LONG-TERM LIABILITIES 28,129 30,475
TOTAL LIABILITIES 31,821 34,541
DEFERRED INFLOWS OF RESOURCES Derivative instruments - interest rate swaps 365 782
TOTAL DEFERRED INFLOWS 365 782
NET POSITION Net investment in capital assets 9,272 7,943 Restricted for debt service 5,525 5,578 Unrestricted 5,382 5,391
TOTAL NET POSITION 20,179 18,912
TOTAL LIABILITIES, DEFERRED INFLOWS AND NET POSITON 52,365$ 54,235$
(Concluded)
See notes to financial statements.

15
This page intentionally left blank.

CITY OF CLEVELAND, OHIO
DEPARTMENT OF PUBLIC WORKSDIVISION OF PARKING FACILITIES
STATEMENTS OF REVENUES, EXPENSES AND CHANGES IN NET POSITIONFor the Years Ended December 31, 2012 and 2011
(Amounts in 000's)2012 2011
OPERATING REVENUES Charges for services 7,735$ 8,453$
TOTAL OPERATING REVENUES 7,735 8,453
OPERATING EXPENSESOperations 3,797 3,729 Maintenance 99 27 Depreciation 1,405 1,722
TOTAL OPERATING EXPENSES 5,301 5,478
OPERATING INCOME 2,434 2,975
NON-OPERATING REVENUE (EXPENSE)Investment income (loss) 423 (773) Interest expense (1,853) (8,649) Amortization of bond issuance costs (227) (1,068)
TOTAL NON-OPERATING REVENUE (EXPENSE) - NET (1,657) (10,490)
INCOME (LOSS) BEFORE CAPITAL CONTRIBUTIONS AND SPECIAL ITEM 777 (7,515)
Capital contributions 490 Special items - gain on sale of capital assets 5,125
INCREASE (DECREASE) IN NET POSITION 1,267 (2,390)
NET POSITION, beginning of year 18,912 21,302
NET POSITION, end of year 20,179$ 18,912$
See notes to financial statements.
16

CITY OF CLEVELAND, OHIO
DEPARTMENT OF PUBLIC WORKSDIVISION OF PARKING FACILITIES
STATEMENTS OF CASH FLOWSFor the Years Ended December 31, 2012 and 2011
(Amounts in 000's)2012 2011
CASH FLOWS FROM OPERATING ACTIVITIES Cash received from customers 7,939$ 8,984$ Cash payments to suppliers for goods or services (3,474) (3,495) Cash payments to employees for services (1,091) (1,055)
NET CASH PROVIDED BY OPERATING ACTIVITIES 3,374 4,434
CASH FLOWS FROM CAPITAL AND RELATED FINANCING ACTIVITIES Cash paid to escrow agent for refunding (21,545) Proceeds from sale of capital assets 20,162 Principal paid on long-term debt (2,420) (3,425) Interest paid on long-term debt (1,705) (2,695)
NET CASH USED FOR CAPITAL ANDRELATED FINANCING ACTIVITIES (4,125) (7,503)
CASH FLOWS FROM INVESTING ACTIVITIES Purchase of investment securities (4,095) Proceeds from sale and maturity of investment securities 4,095 Interest received on investments 12 3
NET CASH PROVIDED BY(USED FOR) INVESTING ACTIVITIES 4,107 (4,092)
NET INCREASE (DECREASE) IN CASHAND CASH EQUIVALENTS 3,356 (7,161)
CASH AND CASH EQUIVALENTS, beginning of year 10,855 18,016
CASH AND CASH EQUIVALENTS, end of year 14,211$ 10,855$
(Continued)
17

CITY OF CLEVELAND, OHIO
DEPARTMENT OF PUBLIC WORKSDIVISION OF PARKING FACILITIES
STATEMENTS OF CASH FLOWSFor the Years Ended December 31, 2012 and 2011
(Amounts in 000's)2012 2011
RECONCILIATION OF OPERATING INCOME TO NET CASH PROVIDED BY OPERATING ACTIVITIES
Operating Income 2,434$ 2,975$ Adjustments to reconcile operating income to net cash provided by operating activities: Depreciation 1,405 1,722 Changes in assets and liabilities: Accounts receivable, net (11) 13 Due from other City of Cleveland departments, divisions or funds (3) 51 Inventory of supplies (3) (105) Accounts payable (539) (145) Due to other governments 36 Due to other City of Cleveland departments, divisions or funds 50 (76) Accrued wages and benefits 5 (1)
TOTAL ADJUSTMENTS 940 1,459
NET CASH PROVIDED BY OPERATING ACTIVITIES 3,374$ 4,434$
SCHEDULE OF NON-CASH CAPITAL AND RELATED FINANCING ACTIVITIES
Contributions of capital assets 490$
(Concluded)See notes to financial statements.
18

19
This page intentionally left blank.

CITY OF CLEVELAND, OHIO DEPARTMENT OF PUBLIC WORKS DIVISION OF PARKING FACILITIES
NOTES TO FINANCIAL STATEMENTS
For the Years Ended December 31, 2012 and 2011
20
NOTE A – SUMMARY OF SIGNIFICANT ACCOUNTING POLICIES
The Division of Parking Facilities (the Division) is reported as an Enterprise Fund of the City of Cleveland’s (the City) Department of Public Works and is a part of the City’s primary government. The Division was created for the purpose of providing moderately priced off-street parking facilities and on-street metered parking to citizens, visitors and those who work in the City. The following is a summary of the more significant accounting policies.
Reporting Model and Basis of Accounting: The accounting policies and financial reporting practices of the Division comply with accounting principles generally accepted in the United States of America applicable to governmental units. In November of 2010, Governmental Accounting Standards Board (GASB) Statement No. 60, Accounting and Financial Reporting for Service Concession Arrangements was issued. This Statement is effective for fiscal periods beginning after December 15, 2011. The objective of this Statement is to improve financial reporting by addressing issues related to service concession arrangements (SCAs), which are a type of public-private or public-public partnership. The Division has determined that GASB Statement No. 60 has no impact on its financial statements as of December 31, 2012.
In December of 2010, Governmental Accounting Standards Board (GASB) Statement No. 62, Codification of Accounting and Financial Reporting Guidance Contained in Pre-November 30, 1989 FASB and AICPA Pronouncements was issued. This Statement is effective for fiscal periods beginning after December 15, 2011. The objective of this Statement is to incorporate into the GASB’s authoritative literature certain accounting and financial reporting guidance that is included in the following pronouncements issued on or before November 30, 1989, which does not conflict with or contradict GASB pronouncements: (1) Financial Accounting Standards Board (FASB) Statements and Interpretations, (2) Accounting Principles Board Opinions and (3) Accounting Research Bulletins of the American Institute of Certified Public Accountants’ (AICPA) Committee on Accounting Procedure. As required, the Division has implemented GASB Statement No. 62 effective for the 2012 fiscal year.
In June of 2011, Governmental Accounting Standards Board (GASB) Statement No. 63, Financial Reporting of Deferred Outflows of Resources, Deferred Inflows of Resources and Net Position was issued. This Statement is effective for fiscal periods beginning after December 15, 2011. This Statement provides financial reporting guidance for deferred outflows of resources and deferred inflows of resources. As required, the Division has implemented GASB Statement No. 63 effective for the 2012 fiscal year. In June of 2011, Governmental Accounting Standards Board (GASB) Statement No. 64, Derivative Instruments: Application of Hedge Accounting Termination Provision was issued. This Statement is effective for fiscal periods beginning after June 15, 2011. The objective of this Statement is to clarify whether an effective hedging relationship continues after the replacement of a swap counterparty or a swap counterparty’s credit support provider. As required, the Division has implemented GASB Statement No. 64 effective for the 2012 fiscal year.

CITY OF CLEVELAND, OHIO DEPARTMENT OF PUBLIC WORKS DIVISION OF PARKING FACILITIES
NOTES TO FINANCIAL STATEMENTS
For the Years Ended December 31, 2012 and 2011 Continued)
21
NOTE A – SUMMARY OF SIGNIFICANT ACCOUNTING POLICIES (Continued)
The Division’s net position is accounted for in the accompanying statements of net position and the net position is divided into the following categories:
• Net investment in capital assets
• Amount restricted for debt service
• Remaining unrestricted amount
In addition, certain additional financial information regarding the Division is included in these footnotes. The implementation of the new GASB statements did not result in a change in the Division’s beginning net position balance as previously reported.
Basis of Accounting: The Division’s financial statements are prepared under the accrual basis of accounting. Under this method, revenues are recognized when earned and measurable and expenses are recognized as incurred.
Revenues: Revenues are derived primarily from fees charged to users of City-owned parking garages and facilities operated by the Division including the Gateway garages and on-street parking meter revenue. Parking rates are authorized by City Council. Parking fees are collected on a daily or monthly basis.
Statement of Cash Flows: The Division utilizes the direct method of reporting for the statement of cash flows as defined by the GASB Statement No. 9, Reporting Cash Flows of Proprietary and Non-expendable Trust Funds and Governmental Entities That Use Proprietary Fund Accounting. In the statement of cash flows, cash receipts and cash payments are classified according to operating, capital and related financing and investment activities.
Cash and Cash Equivalents: Cash and cash equivalents represent cash on hand and cash deposits maintained by the City Treasurer on behalf of the Division. Cash equivalents are defined as highly liquid investments with a maturity of three months or less when purchased.
Investments: The Division follows the provisions of GASB Statement No. 31, Accounting and Financial Reporting for Certain Investments and External Investment Pools, which requires governmental entities to report certain investments at fair value in the balance sheet and recognize the corresponding change in the fair value of investments in the year in which the change occurred. Fair values of investments at year end are based on market quotes, where available.
The City has invested funds in the State Treasury Asset Reserve of Ohio (STAROhio) during 2012 and 2011. STAROhio is an investment pool managed by the State Treasurer’s Office, which allows governments within the State to pool their funds for investment purposes. STAROhio is not registered with the SEC as an investment company, but does operate in a manner consistent with Rule 2a7 of the Investment Company Act of 1940. Investments in STAROhio are valued at STAROhio’s share price, which is the price the investment could be sold for on December 31, 2012 and 2011.

CITY OF CLEVELAND, OHIO DEPARTMENT OF PUBLIC WORKS DIVISION OF PARKING FACILITIES
NOTES TO FINANCIAL STATEMENTS
For the Years Ended December 31, 2012 and 2011 (Continued)
22
NOTE A – SUMMARY OF SIGNIFICANT ACCOUNTING POLICIES (Continued)
Restricted Assets: Proceeds from debt and amounts set aside in various fund accounts for payment of debt are classified as restricted assets since their use is limited by the underlying bond indenture.
Inventory of Supplies: Inventory is valued at cost using the first in/first out method. Inventory costs are charged to operations when consumed.
Capital Assets and Depreciation: Capital assets are stated on the basis of historical cost or, if contributed, at fair market value as of the date received. Depreciation is computed by allocating the cost of capital assets over the estimated useful lives of the assets using the straight-line method. A capital asset is defined as an item with a useful life in excess of one year and an individual cost of more than $5,000 for land, furniture, fixtures, equipment and vehicles and $10,000 for all other assets. When capital assets are disposed of, the cost and related accumulated depreciation are removed from the accounts with gains or losses on disposition being reflected in operations.
The estimated useful lives are as follows:
Land improvements 15 to 100 years
Buildings, structures and improvements 5 to 60 years
Furniture, fixtures, equipment and vehicles 3 to 60 years
Compensated Absences: The Division accrues for compensated absences such as vacation, sick leave and compensatory time using the termination payment method specified under GASB Statement No. 16, Accounting for Compensated Absences. These amounts are recorded as accrued wages and benefits in the accompanying statements of net position. The portion of the compensated absence liability that is not expected to be paid or utilized within one year is reported as a long-term liability.
Normally, all vacation time is to be taken in the year available. The Division allows employees to carryover vacation time from one year to the next. Sick days not taken may be accumulated until retirement. An employee is paid one-third of accumulated sick leave upon retirement, calculated at the three-year average base salary rate, with the balance being forfeited. Deferred Inflows of Resources: In addition to liabilities, the statement of financial position will sometimes report a separate section for deferred inflows of resources. This separate financial statement element, deferred inflows of resources, represents an acquisition on net position that applies to the future period(s) and so will not be recognized as an inflow of resources (revenue) until that time.

CITY OF CLEVELAND, OHIO DEPARTMENT OF PUBLIC WORKS DIVISION OF PARKING FACILITIES
NOTES TO FINANCIAL STATEMENTS
For the Years Ended December 31, 2012 and 2011 (Continued)
23
NOTE A – SUMMARY OF SIGNIFICANT ACCOUNTING POLICIES (Continued)
Bond Issuance Costs, Discounts and Unamortized Loss on Debt Refunding: Bond issuance costs are initially recorded as deferred expenses and unamortized original issuance discounts are netted against long-term debt. Both are amortized over the lives of the related bonds. Unamortized loss on debt refunding is netted against long-term debt and is amortized over the shorter of the remaining life of the defeased bond or the newly issued bond. NOTE B – LONG-TERM DEBT AND OTHER OBLIGATIONS Long-term debt outstanding at December 31 is as follows:
OriginalInterest Rate Issuance 2012 2011
(Amounts in 000's)
Parking Facilities Refunding Revenue Bonds Series 2006, due through 2022 4.00%-5.25% 57,520$ 31,625$ 34,045$
Unamortized loss on debt refunding (2,261) (2,660) Unamortized discount and premium 1,259 1,482 Current portion (2,520) (2,420)
Total Long-Term Debt 28,103$ 30,447$
Summary: Changes in long-term obligations for the year ended December 31, 2012 are as follows:
Balance Balance DueJanuary 1, December 31, Within
2012 Increase Decrease 2012 One Year
(Amounts in 000's)Parking Facilities Refunding Revenue Bonds Series 2006, due through 2022 34,045$ $ (2,420)$ 31,625$ 2,520$
Accrued wages and benefits 170 148 (142) 176 150 Total 34,215$ 148$ (2,562)$ 31,801$ 2,670$

CITY OF CLEVELAND, OHIO DEPARTMENT OF PUBLIC WORKS DIVISION OF PARKING FACILITIES
NOTES TO FINANCIAL STATEMENTS
For the Years Ended December 31, 2012 and 2011 (Continued)
24
NOTE B – LONG-TERM DEBT AND OTHER OBLIGATIONS (Continued)
Summary: Changes in long-term obligations for the year ended December 31, 2011 are as follows:
Balance Balance DueJanuary 1, December 31, Within
2011 Increase Decrease 2011 One Year
(Amounts in 000's)Parking Facilities Refunding Revenue Bonds Series 2006, due through 2022 53,615$ $ (19,570)$ 34,045$ 2,420$
Accrued wages and benefits 171 139 (140) 170 142 Total 53,786$ 139$ (19,710)$ 34,215$ 2,562$
Minimum principal and interest payments on outstanding long-term debt are as follows:
Principal Interest Total
2013 2,520$ 1,613$ 4,133$ 2014 2,645 1,487 4,132 2015 2,770 1,354 4,124 2016 2,880 1,244 4,124 2017 3,040 1,093 4,133
2018-2022 17,770 2,894 20,664 Total 31,625$ 9,685$ 41,310$
.
(Amounts in 000's)
The Parking Facilities Refunding Revenue Bonds are payable from net revenues generated from certain parking facilities and other operating revenues of the Division of Parking Facilities, including parking meter revenue. In addition, the City has pledged other non-tax revenue to meet debt service requirements. The City has pledged and assigned to the trustee a first lien on pledged revenues consisting of fines and penalties collected as a result of the violation of municipal parking ordinances and fines, waivers and costs relating to citations for misdemeanor offenses and the special funds as defined within the bond indenture.

CITY OF CLEVELAND, OHIO DEPARTMENT OF PUBLIC WORKS DIVISION OF PARKING FACILITIES
NOTES TO FINANCIAL STATEMENTS
For the Years Ended December 31, 2012 and 2011 (Continued)
25
NOTE B – LONG-TERM DEBT AND OTHER OBLIGATIONS (Continued) Effective October 6, 2011, the City completed the sale of the City-owned Gateway North Parking Garage to Rock Ohio Caesars Gateway LLC. The garage is being used by the purchaser in conjunction with a new casino constructed in the Higbee Building adjacent to the garage. The net proceeds of the sale of the garage received by the City totaled $20,915,504. Of this amount, $19,578,288 was placed into an irrevocable escrow fund, along with $1,967,425 released from the debt service reserve fund as a result of the transaction, to be used to pay the principal and interest as it comes due on $16,145,000 Parking Facilities Refunding Revenue Bonds, Series 2006. As a result, these bonds are considered to be defeased and the liability for the bonds has been removed from long-term debt. In addition, $480,000 of the sale proceeds was used to terminate the portion of an existing basis swap which was associated with the bonds being defeased. Sale proceeds were also utilized to pay costs of the transaction. As a result of this transaction, the city expects to save approximately $600,000 annually through 2022. Effective August 15, 2006, the City issued $57,520,000 of Parking Facilities Refunding Revenue Bonds, Series 2006. The bonds were issued to currently refund $56,300,000 of the outstanding Parking Facilities Refunding Revenue Bonds, Series 1996. In addition, proceeds were also used to fund a portion of a payment owed by the City upon early termination under an interest rate swaption agreement entered into in 2003. Net proceeds of $58,709,855 were placed in an irrevocable escrow account which was used to pay the principal, interest and premium on the refunded bonds. As a result, the refunded bonds are considered to be defeased and the liability for these bonds has been removed from long-term debt. The City completed the refunding to reduce its total debt service payments by $1,340,000 and to obtain an economic gain (the difference between the present values of the old and new debt service payments) of approximately $970,000. At the time of the issuance of the Series 2006 Bonds, the City entered into a basis swap agreement with UBS, which is described below. Interest Rate Swap Transaction
Terms: Simultaneously with the issuance of the City’s $57,520,000 Parking Facilities Refunding Revenue Bonds, Series 2006 on August 15, 2006, the City entered into a floating-to-floating rate basis swap agreement with a notional amount equal to the total declining balance of the Series 2006 Bonds. UBS is the counterparty on the transaction. Under the swap agreement for the Series 2006 Bonds, the City is a floating rate payor, paying a floating rate based on the Securities Industry Financial Markets Association (SIFMA) index. The counterparty is also a floating rate payor, paying the City 67% of one month LIBOR. The City also received an upfront payment in the amount of $1,606,000. Net payments are exchanged semi-annually each March 15 and September 15. The obligation of the City to make periodic payments (but not any termination payment) is secured by a pledge of and lien on the parking revenues and additional pledged revenue as defined in the trust indenture securing the Parking Facilities Refunding Revenue Bonds, Series 2006, on parity with the pledge and lien securing the payment of debt service on the bonds. Objective: The City entered into the swap in order to maximize the savings associated with the refunding of the bonds and to reduce the City’s risk exposure. The actual overall savings to be realized by the City will depend upon the net payments received under the swap agreement.

CITY OF CLEVELAND, OHIO DEPARTMENT OF PUBLIC WORKS DIVISION OF PARKING FACILITIES
NOTES TO FINANCIAL STATEMENTS
For the Years Ended December 31, 2012 and 2011 (Continued)
26
NOTE B – LONG-TERM DEBT AND OTHER OBLIGATIONS (Continued) Basis Risk: By entering into the swap based upon the 30 day LIBOR rate of interest, the City has undertaken basis risk associated with a change in tax rates and structure. While the average relationship between the SIFMA (tax-exempt) and LIBOR (taxable) interest rates has historically been 67%, this relationship may not always apply. Since late 2008, this relationship has been significantly higher for various periods of time due to disruptions in the financial markets. The payments received from the counterparty may be less than the amount owed to the counterparty, resulting in a net increase in debt service. However there have also been periods recently when the SIFMA/LIBOR relationship has been lower than 67%. In this case payments received from the counterparty may be greater than the amount owed to the counterparty which results in a net decrease in debt service. In addition, a reduction in federal income tax rates might increase the percentage relationship between SIFMA and LIBOR and may potentially increase the cost of the financing. Counterparty Risk: The City selected a highly rated counterparty in order to minimize this risk. However, over the long-term, it is possible that the credit strength of UBS could change and this event could trigger a termination payment on the part of the City. Termination Risk: The swap agreement may be terminated prior to its stated termination date under certain circumstances. Upon termination, a payment may be owed by the City to UBS, or by UBS to the City, depending upon the prevailing economic circumstances at the time of the termination. The City obtained insurance to mitigate much of the risk associated with termination due to the event of a downgrade of the City’s bond rating. An amount due by the City to UBS upon early termination of the agreement is insured by FSA (now Assured Guaranty Municipal Corp.) up to a maximum amount of $8,000,000. Fair Value: The fair value of the swap at December 31, 2012 and 2011 reported by UBS was $365,000 and $782,000, respectively, which would be payable by the City. The City has pledged future revenues from certain parking facilities, net of specified operating expenses, and other operating revenues to repay $31,625,000 of Parking Facilities Refunding Revenue Bonds issued in 2006. Proceeds from the bonds initially issued provided financing for the construction of parking facilities. The bonds are payable from parking facilities net revenues and are payable through 2022. Annual principal and interest payments on the bonds are expected to require the full amount of net operating revenues. The total principal and interest remaining to be paid on the Parking Facilities Refunding Revenue Bonds is $41,310,000. Principal and interest paid for the current year (including net swap payments) and total net revenues were $4,125,000 and $4,148,000, respectively.
In 2012 and 2011, no additional pledged revenue was required to meet the debt service on the Parking Facilities Refunding Revenue Bonds. The trust indenture requires, among other things, that the Division will fix parking rates and will charge and collect fees for the use of the parking facilities and will restrict operating expenses. As of December 31, 2012 and 2011, the Division was in compliance with the terms and requirements of the trust indenture.

CITY OF CLEVELAND, OHIO DEPARTMENT OF PUBLIC WORKS DIVISION OF PARKING FACILITIES
NOTES TO FINANCIAL STATEMENTS
For the Years Ended December 31, 2012 and 2011 (Continued)
27
NOTE B – LONG-TERM DEBT AND OTHER OBLIGATIONS (Continued)
Derivative Instruments
Derivative instruments are contracts, the value of which depends on, or derives from, the value of an underlying asset, index or rate. The most common types of derivatives used by governments are interest rate swaps and interest rate locks. The Division entered into a derivative or hedging agreement in 2003. A detailed description of the outstanding derivative, including its terms, objectives, risks and fair value, can be found in the preceding section. The Division has reported an asset and/or a liability as appropriate in the amount of the fair value of the interest rate swap, which reflects the prevailing interest rate environment at December 31, 2012 and December 31, 2011. The fair value of the swap has been provided by the counterparty and confirmed by the City’s financial advisor. The Division recognized a $417,000 investment income pursuant to this swap in 2012. The tables below present the fair value balances and notional amounts of the Division’s derivative instrument outstanding at December 31, 2012 and December 31, 2011, classified by type and the change in fair value of this derivative during fiscal years 2012 and 2011 as reported in the respective financial statements. The fair values of the interest rate swap, which reflect the prevailing interest rate environment at December 31, 2012 and December 31, 2011 and the specific terms and conditions of the swap, have been provided by the counterparty and confirmed by the City’s financial advisor.
Fair Value at December 31,
Classification Amount Classification Amount Notional(Amounts in 000's)
Floating to floating interest rate swap 2006 Parking Basis Swap Investment Revenue 417$ Investment (365)$ 31,625$
Classification Amount Classification Amount Notional(Amounts in 000's)
Floating to floating interest rate swap 2006 Parking Basis Swap Investment Loss 1,047$ (a) Investment (782)$ 34,045$
Changes in Fair ValueFair Value at December 31,
2011
Changes in Fair Value 2012
(a) This was reclassified from a hedging derivative to an investment derivative in 2011 due to the Division’s determination that the derivative was not effectively hedged; therefore the loss recognized in 2011 was $782,000.

CITY OF CLEVELAND, OHIO DEPARTMENT OF PUBLIC WORKS DIVISION OF PARKING FACILITIES
NOTES TO FINANCIAL STATEMENTS
For the Years Ended December 31, 2012 and 2011 (Continued)
28
NOTE B – LONG-TERM DEBT AND OTHER OBLIGATIONS (Continued)
The table below presents the objective and significant terms of the Division’s derivative instrument at December 31, 2012, along with the credit rating of the swap counterparty.
Bonds Type Objective Amount Date Date Terms Credit Rating
(Amounts in 000's)
2006 Parking Bonds Basis Swap - Pay Floating/ Receive Floating
Exchange floating rate payments on Series 2006 Parking System Bonds
31,625$ 8/15/2006 9/15/2022 Pay SIFMA, receive 67% of LIBOR
A2/A/A
NOTE C – RECEIVABLE FROM GATEWAY ECONOMIC DEVELOPMENT CORPORATION
In accordance with an agreement with Gateway Economic Development Corporation (Gateway), Gateway is required to reimburse the City for the excess of the debt service requirements of the Parking Facilities Refunding Revenue Bonds attributed to the two Gateway garages over the net revenues generated by the two Gateway garages. In October 2011, the City sold one of the Gateway garages and defeased the applicable bonds. Going forward the amounts required to be reimbursed will be calculated based upon the net revenues of the remaining garage and remaining applicable bonds outstanding.
The first garage on the Gateway site was completed in January 1994. The second garage was completed in August 1994.
In 2012, net revenues generated by the remaining Gateway garage were less than the debt service payments attributed to that garage by $1,883,000. Cumulative debt service payments funded by the City that are due from Gateway totaled $45,239,000 at December 31, 2012. Due to the uncertainty of collecting such amounts, an allowance has been recorded to offset the amounts in full; therefore, these amounts do not appear in the accompanying financial statements.
NOTE D – DEPOSITS AND INVESTMENTS
Deposits: The carrying amount of the Division’s deposits at December 31, 2012 and 2011 totaled $778,000 and $901,000, respectively, and the Division’s bank balances were $787,000 and $906,000, respectively. The differences represent positions in pooled bank accounts and normal reconciling items. Based on the criteria described in GASB Statement No. 3, Deposits with Financial Institutions, Investments (including Repurchase Agreements) and Reverse Repurchase Agreements and GASB Statement No. 40, Deposit and Investment Risk Disclosures – an Amendment of GASB Statement No. 3, $787,000 and $906,000 of the bank balances at December 31, 2012 and 2011, respectively, were insured or collateralized with securities held by the City or by its agent in the City’s name.

CITY OF CLEVELAND, OHIO DEPARTMENT OF PUBLIC WORKS DIVISION OF PARKING FACILITIES
NOTES TO FINANCIAL STATEMENTS
For the Years Ended December 31, 2012 and 2011 (Continued)
29
NOTE D – DEPOSITS AND INVESTMENTS (Continued)
Custodial credit risk for deposits is the risk that in the event of bank failure, the Division will not be able to recover deposits or collateral for securities that are in possession of an outside party. At year end, the Division’s deposits were fully insured or collateralized. All deposits are collateralized with eligible securities pledged and deposited either with the City or with a qualified trustee by the financial institution as security for repayment of all public monies deposited in the financial institution whose market value at all times is equal to at least 110% of the carrying value of the deposits being secured.
Investments: The City’s investment policies are governed by state statutes and City ordinances which authorize the City to invest in obligations of the U.S. Treasury, agencies and instrumentalities; State Treasurer Asset Reserve Fund (STAROhio); commercial paper; US Government Money Market Mutual Funds; guaranteed investment contracts; manuscript debt; bonds and other State of Ohio obligations; certificates of deposit; and repurchase transactions. Such repurchase transactions must be purchased from financial institutions or registered broker/dealers. Repurchase transactions are not to exceed a period of one year and confirmation of securities pledged must be obtained.
Under City policy, investments are limited to repurchase agreements, U.S. Government securities, certificates of deposit, investments in certain money market mutual funds and STAROhio. Generally, investments are recorded in segregated accounts by way of book entry through the banks’ commercial or trust department and are kept at the Federal Reserve Bank in the depository institutions’ separate custodial account for the City, apart from the assets of the depository institution. Ohio statutes prohibit the use of reverse repurchase agreements.
Investment securities are exposed to various risks such as interest rate, market and credit. Market values of securities fluctuate based on the magnitude of changing market conditions; therefore, significant changes in market conditions could materially affect portfolio value.
Interest rate risk: In accordance with its investment policy, the Division limits its exposure to fair value losses caused by rising interest rates, the Division invests primarily in short-term investments maturing within five years from the date of purchase. The intent is to avoid the need to sell securities prior to maturity. Investment maturities are disclosed in the table on the following page.
Custodial Credit Risk: For an investment, custodial credit risk is the risk that, in the event of the failure of the counterparty, the Division will not be able to recover the value of the investments or collateral securities that are in the possession of an outside party. The Division does not have an investment policy dealing with investment custodial credit risk beyond the requirement in the state statute.
Credit Risk: The Division’s investments as of December 31, 2012 and 2011 include US Agency Obligations, STAROhio and investments in mutual funds. The Division maintains the highest ratings for their investments. Investments in Victory Money Market Fund and STAROhio carry a rating of AAAm, which is the highest money market fund rating given by Standard & Poor’s. Ohio law requires that STAROhio maintain the highest rating provided by at least one nationally recognized standard rating service.

CITY OF CLEVELAND, OHIO DEPARTMENT OF PUBLIC WORKS DIVISION OF PARKING FACILITIES
NOTES TO FINANCIAL STATEMENTS
For the Years Ended December 31, 2012 and 2011 (Continued)
30
NOTE D – DEPOSITS AND INVESTMENTS (Continued)
Concentration of Credit Risk: The Division places a limitation on the amount it may invest in any one issuer to help minimize the concentration of credit risk. The Division had the following investments at December 31, 2012 and 2011, which include those classified as cash and cash equivalents in the balance sheet in accordance with the provisions of GASB Statement No. 9 since they have a maturity of three months or less:
Investment
2012 2011 MaturitiesType of Fair 2012 Fair 2011 Less thanInvestment Value Cost Value Cost One Year
US Agency Obligations $ $ 4,095$ 4,095$ $ STAROhio 969 969 849 849 969 Investment in Mutual Funds 12,464 12,464 9,105 9,105 12,464 Total Investments 13,433 13,433 14,049 14,049 13,433 Total Deposits 778 778 901 901 778
Total Deposits and Investments 14,211$ 14,211$ 14,950$ 14,950$ 14,211$
(Amounts in 000's)
These amounts are monies invested by the City Treasurer on behalf of the Division and are used in daily operations with excess monies invested daily in STAROhio and mutual funds. These investments are carried at cost which approximates market value.
As of December 31, 2012, the investments in STAROhio and mutual funds are approximately 7% and 93%, respectively, of the Division’s total investments. As of December 31, 2011, the investments in US Agency Obligations, STAROhio and in mutual funds are approximately 29%, 6% and 65%, respectively, of the Division’s total investments.

CITY OF CLEVELAND, OHIO DEPARTMENT OF PUBLIC WORKS DIVISION OF PARKING FACILITIES
NOTES TO FINANCIAL STATEMENTS
For the Years Ended December 31, 2012 and 2011 (Continued)
31
NOTE E – CAPITAL ASSETS Capital Asset Activity: Capital asset activity for the year ended December 31, 2012 was as follows:
Balance BalanceJanuary 1, December 31,
2012 Additions Deletions 2012(Amounts in 000's)
Capital assets, not being depreciated: Land 5,478 5,478 Construction in progress $ 440$ $ 440$ Total capital assets, not being depreciated 5,478 440 - 5,918
Capital assets, being depreciated: Land improvements 1,256 1,256 Buildings, structures and improvements 53,719 53,719 Furniture, fixtures, equipment and vehicles 1,250 50 (10) 1,290 Total capital assets, being depreciated 56,225 50 (10) 56,265 Less: Accumulated depreciation (24,130) (1,405) 10 (25,525)
Total capital assets being depreciated, net 32,095 (1,355) - 30,740
Capital assets, net 37,573$ (915)$ -$ 36,658$
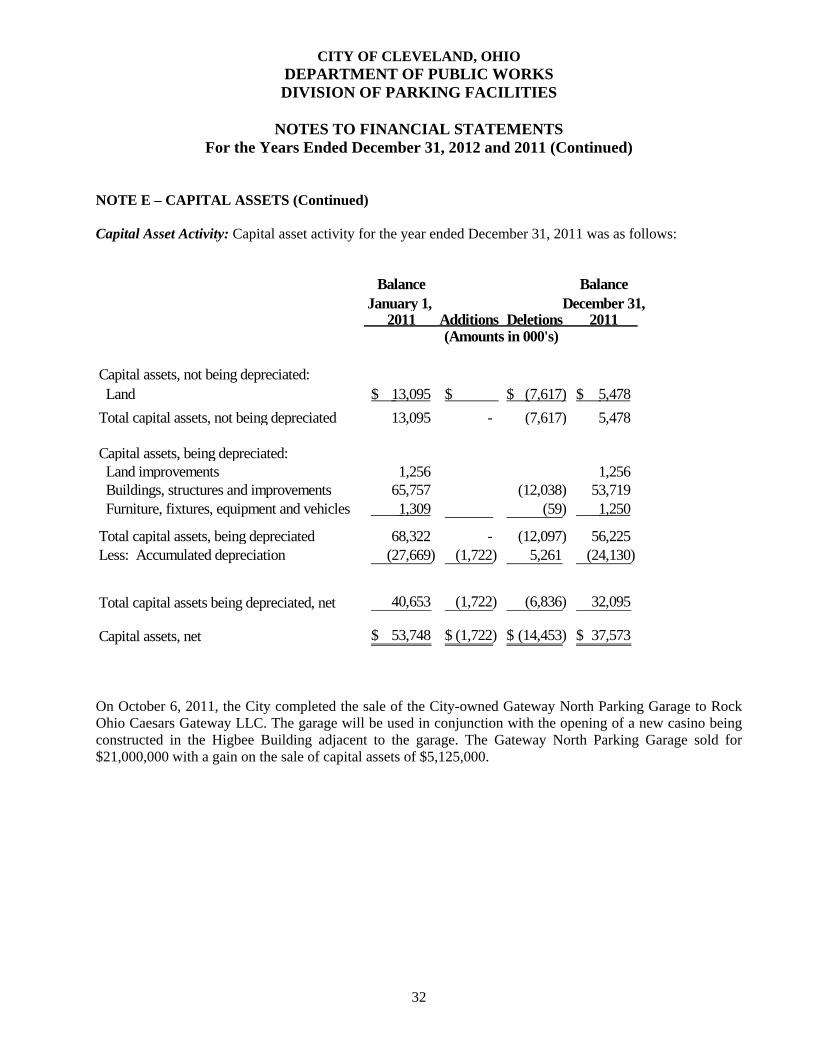
CITY OF CLEVELAND, OHIO DEPARTMENT OF PUBLIC WORKS DIVISION OF PARKING FACILITIES
NOTES TO FINANCIAL STATEMENTS
For the Years Ended December 31, 2012 and 2011 (Continued)
32
NOTE E – CAPITAL ASSETS (Continued) Capital Asset Activity: Capital asset activity for the year ended December 31, 2011 was as follows:
Balance BalanceJanuary 1, December 31,
2011 Additions Deletions 2011(Amounts in 000's)
Capital assets, not being depreciated: Land 13,095$ $ (7,617)$ 5,478$ Total capital assets, not being depreciated 13,095 - (7,617) 5,478
Capital assets, being depreciated: Land improvements 1,256 1,256 Buildings, structures and improvements 65,757 (12,038) 53,719 Furniture, fixtures, equipment and vehicles 1,309 (59) 1,250
Total capital assets, being depreciated 68,322 - (12,097) 56,225 Less: Accumulated depreciation (27,669) (1,722) 5,261 (24,130)
Total capital assets being depreciated, net 40,653 (1,722) (6,836) 32,095
Capital assets, net 53,748$ (1,722)$ (14,453)$ 37,573$
On October 6, 2011, the City completed the sale of the City-owned Gateway North Parking Garage to Rock Ohio Caesars Gateway LLC. The garage will be used in conjunction with the opening of a new casino being constructed in the Higbee Building adjacent to the garage. The Gateway North Parking Garage sold for $21,000,000 with a gain on the sale of capital assets of $5,125,000.

CITY OF CLEVELAND, OHIO DEPARTMENT OF PUBLIC WORKS DIVISION OF PARKING FACILITIES
NOTES TO FINANCIAL STATEMENTS
For the Years Ended December 31, 2012 and 2011 (Continued)
33
NOTE F – DEFINED BENEFIT PENSION PLANS Ohio Public Employees Retirement System: All full-time employees, other than non-administrative full-time police officers and firefighters, participate in the Ohio Public Employees Retirement System (OPERS). OPERS administers three separate pension plans as described below:
1) The Traditional Pension Plan – a cost-sharing, multiple-employer defined benefit pension plan. 2) The Member-Directed Plan – a defined contribution plan in which the member invests both member
and employer contributions (employer contributions vest over five years at 20% per year). Under the Member-Directed Plan, members accumulate retirement assets equal to the value of member and (vested) employer contributions plus any investment earnings.
3) The Combined Plan – a cost-sharing, multiple-employer defined benefit pension plan. Under the
Combined Plan, OPERS invests employer contributions to provide a formula retirement benefit similar in nature to the Traditional Pension Plan benefit. Member contributions, the investment of which is self-directed by the members, accumulate retirement assets in a manner similar to the Member-Directed Plan.
OPERS provides retirement, disability, survivor and death benefits and annual cost-of-living adjustments to members of the Traditional Pension and Combined Plans. Members of the Member-Directed Plan do not qualify for ancillary benefits. Authority to establish and amend benefits is provided in Chapter 145 of the Ohio Revised Code. OPERS issues a stand-alone financial report. Interested parties may obtain a copy by visiting https://www.opers.org/investments/cafr.shtml, writing to OPERS, 277 East Town Street, Columbus, Ohio 43215-4642, or by calling (614) 222-5601 or (800) 222-7377. The Ohio Revised Code provides statutory authority for member and employer contributions. For 2012, member and employer contribution rates were consistent across all three plans. Member contribution rates were 10.00% in 2012, 2011 and 2010. The employer contribution rates were 14.00% of covered payroll in 2012, 2011 and 2010. The Division’s required employer contributions to OPERS for the pension portion of all the plans for the years ending December 31, 2012, 2011 and 2010 were $81,000, $77,000 and $77,000 each year, respectively. The required payments due in 2012, 2011 and 2010 have been made. In June 2012, the Governmental Accounting Standards Board (GASB) issued GASB Statement No. 68, Accounting and Financial Reporting for Pensions. This accounting standard replaces GASB Statement No. 27 and it is effective for employer fiscal years beginning after June 15, 2014.

CITY OF CLEVELAND, OHIO DEPARTMENT OF PUBLIC WORKS DIVISION OF PARKING FACILITIES
NOTES TO FINANCIAL STATEMENTS
For the Years Ended December 31, 2012 and 2011 (Continued)
34
NOTE G – OTHER POSTEMPLOYMENT BENEFITS Ohio Public Employees Retirement System: All full-time employees, other than non-administrative full-time police officers and firefighters, participate in the Ohio Public Employees Retirement System (OPERS). OPERS administers three separate pension plans: The Traditional Pension Plan – a cost-sharing, multiple-employer defined benefit pension plan; the Member-Directed Plan – a defined contribution plan; and the Combined Plan – a cost-sharing, multiple-employer defined benefit pension plan that has elements of both a defined benefit and defined contribution plan. OPERS maintains a cost-sharing multiple employer defined benefit postemployment health care plan, which includes a medical plan, prescription drug program and Medicare Part B premium reimbursement, to qualifying members of both the Traditional Pension and the Combined Plans. Members of the Member-Directed Plan do not qualify for ancillary benefits, including postemployment health care coverage. In order to qualify for postemployment health care coverage, age-and-service retirees under the Traditional Pension and Combined Plans must have 10 or more years of qualifying Ohio service credit. Health care coverage for disability benefit recipients and qualified survivor benefit recipients is available. The health care coverage provided by OPERS meets the definition of an Other Postemployment Benefit (OPEB) as described in GASB Statement No. 45. The Ohio Revised Code permits, but does not mandate, OPERS to provide OPEB benefits to its eligible members and beneficiaries. Authority to establish and amend benefits is provided in Chapter 145 of the Ohio Revised Code. OPERS issues a stand-alone financial report. Interested parties may obtain a copy by visiting https://www.opers.org/investments/cafr.shtml, writing to OPERS, 277 East Town Street, Columbus, Ohio 43215-4642, or by calling (614) 222-5601 or (800) 222-7377. The Ohio Revised Code provides the statutory authority requiring public employers to fund post-retirement health care through their contributions to OPERS. A portion of each employer’s contribution to OPERS is set aside for funding of post-retirement health care benefits. Employer contribution rates are expressed as a percentage of the covered payroll of active members. The employer contribution rates were 14.00% of covered payroll in 2012, 2011 and 2010. The Ohio Revised Code currently limits the employer contribution to a rate not to exceed 14.00% of covered payroll. Active members do not make contributions to the OPEB Plan. OPERS’ Postemployment Health Care plan was established under and is administrated in accordance with, Internal Revenue Code 401(h). Each year, the OPERS Retirement Board determines the portion of the employer contribution rate that will be set aside for funding of postemployment health care benefits. Employer contribution rates used to fund postemployment benefits were 4.00% for members of the Traditional Plan in 2012 and 2011, 6.05% for members of the Combined Plan in 2012 and 2011 and 5.50% from January 1, 2010 through February 28, 2010 and 5.00% from March 1, 2010 through December 31, 2010 for both plans. Effective January 1, 2013, the portion of employer contributions allocated to health care was lowered to 1.00% for both plans, as recommended by the OPERS Actuary. The OPERS Retirement Board is also authorized to establish rules for the payment of a portion of the health care benefits provided, by the retiree or their surviving beneficiaries. Payment amounts vary depending on the number of covered dependents and the coverage selected. The Division’s actual contributions to OPERS to fund postemployment benefits were $32,000 in 2012, $31,000 in 2011 and $44,000 in 2010. The required payments due in 2012, 2011 and 2010 have been made. Changes to the health care plan were adopted by the OPERS Board of Trustees on September 19, 2012, with a transition plan commencing January 1, 2014. With the recent passage of pension legislation under SB343 and the approved health care changes, OPERS expects to be able to consistently allocate 4.00% of the employer contributions toward the health care fund after the end of the transition period.

CITY OF CLEVELAND, OHIO DEPARTMENT OF PUBLIC WORKS DIVISION OF PARKING FACILITIES
NOTES TO FINANCIAL STATEMENTS
For the Years Ended December 31, 2012 and 2011 (Continued)
35
NOTE H – RELATED PARTY TRANSACTIONS Revenues and Accounts Receivable: The Division provides parking facilities at usual and customary rates to various departments and divisions of the City. The Division operates certain garages and parking lots on behalf of other City divisions. The professional management fees recorded by the Division to operate the garages and parking lots are as follows:
2012 2011
Department of Community Development 41$ 36$
.
(Amounts in 000's)
Operating Expenses: The Division is provided various services by other City divisions. Charges are based on actual usage or on a reasonable pro-rata basis. The more significant expenses included in the statements of operations for the years ended December 31, 2012 and 2011 are as follows:
2012 2011
Parks Maintenance 74$ 73$ Motor Vehicle Maintenance 9 Cleveland Public Power 178 187 Maintenance 4 Telephone 17 14
(Amounts in 000's)
NOTE I – CONTINGENT LIABILITIES AND RISK MANAGEMENT Contingent Liabilities: Various claims are pending against the City involving the Division for personal injuries, property damage and other matters. The City is responsible for the lawsuits. The City’s management is of the opinion that ultimate settlement of such claims will not result in a material adverse effect on the Division’s financial position, results of operations or cash flows. Risk Management: The Division is exposed to various risks of loss related to torts; thefts of, damage to and destruction of assets; errors and omissions; injuries to employees; and natural disasters. The Division is generally self-insured. No material losses, including incurred but not reported losses, occurred in 2012 or 2011.
The City provides the choice of four separate health insurance plans for its employees. These plans are provided by two different insurers through commercial insurance. Operating funds are charged a monthly rate per employee, by type of coverage. The City participates in the State of Ohio workers’ compensation retrospective rating program.

CITY OF CLEVELAND, OHIO DEPARTMENT OF PUBLIC WORKS DIVISION OF PARKING FACILITIES
NOTES TO FINANCIAL STATEMENTS
For the Years Ended December 31, 2012 and 2011 (Continued)
36
NOTE I – CONTINGENT LIABILITIES AND RISK MANAGEMENT (Continued) In accordance with GASB Statement No. 10, claims liabilities are reported when it is probable that a loss has occurred and the amount of the loss can be reasonably estimated. Liabilities include an amount for claims that have been incurred but not reported. The result of the process to estimate the claims liability is not an exact amount as it depends on many complex factors, such as inflation, changes in legal doctrines and damage awards. Accordingly, claims are re-evaluated periodically to consider the effects of inflation, recent claim settlement trends (including frequency and amount of pay-outs) and other economic and social factors. The estimate of the claims liability also includes amounts for incremental claim adjustment expenses related to specific claims and other claim adjustment expenses, regardless of whether allocated to specific claims. Estimated recoveries, for example from salvage or subrogation, are another component of the claims liability estimate. Claims liability for the Division is immaterial. NOTE J – LEASES The Division leases the land for various parking facilities to management companies under non-cancelable lease agreements, which expire at various times through the year 2056. Revenues generated from such leases totaled $180,000 in 2012 and 2011. Future minimum rentals on non-cancelable leases are as follows:
(Amounts in 000's)
2013 180$ 2014 180 2015 180 2016 180 2017 180
Thereafter 4,740
5,640$
NOTE K – SUBSEQUENT EVENTS On January 17, 2013, Moody’s Investors Service lowered its rating on Assured Guaranty Municipal Corporation, the insurer of the Series 2006 Parking Facilities Refunding Revenue Bonds. The rating was lowered to A2 from Aa3. The Division’s bonds only carry the insured rating and have no ratings on its bonds based solely on its own credit. On April 16, 2013, the City entered into a novation agreement with UBS, AG and PNC Bank, National Association (PNC) under which the basis swap associated with the Parking Facilities Refunding Revenue Bonds, Series 2006, was transferred from UBS to PNC effective March 15, 2013. All of the terms of the original basis swap remain the same.

CITY OF CLEVELAND, OHIO
DEPARTMENT OF PORT CONTROL DIVISIONS OF CLEVELAND HOPKINS INTERNATIONAL
AND BURKE LAKEFRONT AIRPORTS
REPORT ON AUDITS OF FINANCIAL STATEMENTS For the years ended December 31, 2012 and 2011

CITY OF CLEVELAND, OHIO
DEPARTMENT OF PORT CONTROL DIVISIONS OF CLEVELAND HOPKINS INTERNATIONAL
AND BURKE LAKEFRONT AIRPORTS
TABLE OF CONTENTS
Page
Independent Auditors’ Report .................................................................................................... 1-2
Management’s Discussion and Analysis ................................................................................... 3-15
Statements of Net Position ......................................................................................................... 18-19
Statements of Revenues, Expenses and Changes in Net Position ............................................. 21
Statements of Cash Flows .......................................................................................................... 22-23
Notes to Financial Statements .................................................................................................... 25-45
Schedule of Airport Revenues and Operating Expensesas Defined in the Airline Use Agreements ................................................................................ 46
Report on Compliance with Requirements Applicable to the Passenger Facility Charge Program and on Internal Control Over Compliance in Accordance with 14 CFR Part 158 .................................................................... 47-48
Schedule of Expenditures of Passenger Facility Charges .......................................................... 49
Notes to Schedule of Expenditures of Passenger Facility Charges ........................................... 50

one east fourth street, ste. 1200cincinnati, oh 45202
www.cshco.comp. 513.241.3111f. 513.241.1212
cincinnati | cleveland | columbus | miami valley | springfield | toledo
INDEPENDENT AUDITORS’ REPORT
To the Honorable Frank G. Jackson, Mayor, Members of Council and the Audit CommitteeDivisions of Cleveland Hopkins International and Burke Lakefront AirportsDepartment of Port ControlCity of Cleveland, Ohio:
Report on the Financial Statements
We have audited the accompanying financial statements of the Divisions of Cleveland Hopkins International and Burke Lakefront Airports, Department of Port Control, City of Cleveland, Ohio (the “Divisions”) as of and for the years ended December 31, 2012 and 2011 and the related notes to the financial statements, as listed in the table of contents.
Management’s Responsibility for the Financial StatementsManagement is responsible for the preparation and fair presentation of these financial statements in accordance with accounting principles generally accepted in the United States of America; this includes the design, implementation, and maintenance of internal control relevant to the preparation and fair presentation of financial statements that are free from material misstatement, whether due to fraud or error.
Auditors’ ResponsibilityOur responsibility is to express an opinion on these financial statements based on our audits. We conducted our audits in accordance with auditing standards generally accepted in the United States of America and the standards applicable to financial audits contained in Government Auditing Standards, issued by the Comptroller General of the United States. Those standards require that we plan and perform the audit to obtain reasonable assurance about whether the financial statements are free from material misstatement.
An audit involves performing procedures to obtain audit evidence about the amounts and disclosures in the financial statements. The procedures selected depend on the auditors’ judgment, including the assessment of the risks of material misstatement of the financial statements, whether due to fraud or error. In making those risk assessments, the auditor considers internal control relevant to the entity’s preparation and fair presentation of the financial statements in order to design audit procedures that are appropriate in the circumstances, but not for the purpose of expressing an opinion on the effectiveness of the entity’s internal control. Accordingly, we express no such opinion. An audit also includes evaluating the appropriateness of accounting policies used and the reasonableness of significant accounting estimates made by management, as well as evaluating the overall presentation of the financial statements.
We believe that the audit evidence we have obtained is sufficient and appropriate to provide a basis for our audit opinion.
OpinionsIn our opinion, the financial statements referred to previously present fairly, in all material respects, the financial position of the Divisions of Cleveland Hopkins International and Burke Lakefront Airports, Department of Port Control, City of Cleveland, Ohio as of December 31, 2012 and 2011, and thechanges in financial position and cash flows thereof for the years then ended in conformity with accounting principles generally accepted in the United States of America.

Effect of Adopting New Accounting Standards
As discussed in Note A, the Divisions adopted the provisions of Governmental Accounting Standards Board Statement No. 60 Accounting and Financial Reporting for Service Concession Arrangements, Statement No. 62, Codification of Accounting and Financial Reporting Guidance Contained in Pre-November 30, 1989 FASB and AICPA Pronouncements, Statement No. 63, Financial Reporting of Deferred Outflows of Resources, Deferred Inflows of Resources, and Net Position, and Statement No. 64, Derivative Instruments: Application of Hedge Accounting Termination Provision. Our opinion is not modified with respect to this matter.
Other Matters
As described in Note A, the financial statements present only the financial position and the changes in financial position and cash flows of the Divisions and do not purport to, and do not, present fairly the financial position of the City of Cleveland as of December 31, 2012 and 2011, and the respective changes in its financial position and cash flows for the years then ended in conformity with accounting principles generally accepted in the United States of America. Our opinion is not modified with respect to this matter.
Required Supplementary Information
Accounting principles generally accepted in the United States of America require that the management’s discussion and analysis on pages 3 through 15 be presented to supplement the basic financial statements. Such information, although not a part of the basic financial statements, is required by the Governmental Accounting Standards Board who considers it to be an essential part of financial reporting for placing the basic financial statements in an appropriate operational, economic, or historical context. We have applied certain limited procedures to the required supplementary information in accordance with auditing standards generally accepted in the United States of America, which consisted of inquiries of management about the methods of preparing the information and comparing the information for consistency with management’s responses to our inquiries, the basic financial statements, and other knowledge we obtained during our audit of the basic financial statements. We do not express an opinion or provide any assurance on the information because the limited procedures do not provide us with sufficient evidence to express an opinion or provide any assurance.
Other Information
Our audit was conducted for the purpose of forming an opinion on the financial statements taken as a whole. The schedule of airport revenues and operating expenses as defined in the airline use agreement for the year ended December 31, 2012 is presented for purpose of additional analysis and is not a required part of the Divisions’ basic financial statements. The schedule of airport revenues and operating expenses is the responsibility of management and was derived from and relates directly to the underlying accounting and other records used to prepare the financial statements. Such information has been subjected to the auditing procedures applied in the audit of the Divisions’ basic financial statements and certain additional procedures, including comparing and reconciling such information directly to the underlying accounting and other records used to prepare the financial statements or to the financial statements themselves, and other additional procedures in accordance with auditing standards generally accepted in the United States of America. In our opinion, the information is fairly presented in all material respects in relation to the Divisions’ basic financial statements taken as a whole.
CClark, Schaefer, Hackett & Co.Cincinnati, OhioJune 25, 2013
2

CITY OF CLEVELAND DEPARTMENT OF PORT CONTROL
DIVISIONS OF CLEVELAND HOPKINS INTERNATIONAL AND BURKE LAKEFRONT AIRPORTS
MANAGEMENT’S DISCUSSION AND ANALYSIS
3
GENERAL
As management of the City of Cleveland’s (the City) Department of Port Control, Divisions of Cleveland Hopkins International (CLE) and Burke Lakefront (BKL) Airports (the Divisions), we offer readers of the Divisions’ financial statements this narrative overview and analysis of the financial activities of the Divisions for the years ended December 31, 2012 and December 31, 2011. Please read this information in conjunction with the Divisions’ basic financial statements and notes that begin on page 18.
The Divisions are charged with the administration and control of, among other facilities, the municipally owned airports of the City. The Divisions operate a major public airport and a reliever airport serving not only the City of Cleveland, but also suburban municipalities in Cuyahoga, Medina, Summit and Geauga counties. In 2012, the Divisions were served by 26 scheduled airlines and four cargo airlines. There were 83,000 scheduled landings with landed weight amounting to 5,732,148,000 pounds. There were 4,495,000 passengers enplaned at Cleveland Hopkins International Airport and 92,000 passengers enplaned at Burke Lakefront Airport during 2012. In 2011, the Divisions were served by 27 scheduled airlines and four cargo airlines. There were 87,000 scheduled landings with landed weight amounting to 5,912,394,000 pounds. There were 4,598,000 passengers enplaned at Cleveland Hopkins International Airport, and 88,000 passengers enplaned at Burke Lakefront Airport during 2011.
COMPARISON OF CURRENT YEAR AND PREVIOUS YEAR DATA
FINANCIAL HIGHLIGHTS
The assets of the Divisions exceeded its liabilities (net position) by $394,000,000, $405,900,000 and $401,879,000 at December 31, 2012, 2011 and 2010, respectively. Of these amounts, $137,306,000, $128,908,000 and $148,100,000 (unrestricted net position) at December 31, 2012, 2011 and 2010, respectively, may be used to meet the Divisions’ ongoing obligations to customers and creditors.
The Divisions’ total net position decreased by $11,900,000 in 2012. This is due to a significant decrease in net investment in capital assets relating to principal payment on bond debt, a decrease in bond proceeds related to the use of bond funds to finance capital projects and an increase in accumulated depreciation resulting from capital assets placed into operation after completion.
Additions to construction in progress totaled $19,434,000, $19,431,000 and $25,497,000in 2012, 2011 and 2010, respectively.
The major capital expenditures during 2012 were for the Power Distribution Enhancement Project, the Terminal Terrazzo Flooring project, the BKL Runway 6L-24R Safety Area Improvement project, the Regional Transit Authority (RTA) Level Art Gallery project and the Converged Communications project.

CITY OF CLEVELAND, OHIO DEPARTMENT OF PORT CONTROL
DIVISIONS OF CLEVELAND HOPKINS INTERNATIONAL AND BURKE LAKEFRONT AIRPORTS
MANAGEMENT’S DISCUSSION AND ANALYSIS (Continued)
4
FINANCIAL HIGHLIGHTS (Continued)
The Divisions’ total bonded debt decreased by $27,955,000 in 2012, increased $42,625,000 in 2011 and decreased $52,480,000 during 2010. In 2012, the City issued $235,150,000 of Airport System Revenue Bonds, Series 2012A, to refund all of the outstanding Airport System Revenue Bonds, Series 2000A. In 2011, the City issued $74,385,000 of Airport System Revenue Bonds Series 2011A which provided funds to pay the costs of improvements to the Airport Systems and refunded a part of the Series 2008D Bonds. The key factors for the decrease in 2012 were the scheduled principal payments on the Divisions’ outstanding Bonds and the refunding of the Series 2000A Bonds. The reason for the increase in 2011 was the issuance of the Series 2011A Bonds.
OVERVIEW OF THE FINANCIAL STATEMENTS
This discussion and analysis is intended to serve as an introduction to the Divisions’ basic financial statements. The accompanying financial statements present financial information for the City of Cleveland’s Divisions of Cleveland Hopkins International and Burke Lakefront Airports Fund, in which the City accounts for the operations of the Department of Port Control. A fund is a grouping of related accounts that is used to maintain control over resources that have been segregated for specific activities or objectives. The City, like other state and local governments, uses fund accounting to ensure and demonstrate compliance with finance-related legal requirements.
The Divisions are considered an Enterprise Fund because the operations of the Divisions are similar to a private sector business enterprise. Accordingly, in accounting for the activities of the Divisions, the economic resources measurement focus and the accrual basis of accounting is used. This is similar to businesses in the private sector.
The basic financial statements of the Divisions can be found on pages 18-23 of this report.
The notes to the financial statements provide additional information that is essential to gain a full understanding of the data provided in the basic financial statements. The notes to the basic financial statements can be found on pages 25-45 of this report.

CITY OF CLEVELAND, OHIO DEPARTMENT OF PORT CONTROL
DIVISIONS OF CLEVELAND HOPKINS INTERNATIONAL AND BURKE LAKEFRONT AIRPORTS
MANAGEMENT’S DISCUSSION AND ANALYSIS (Continued)
5
CONDENSED STATEMENT OF NET POSTION INFORMATION
Provided below is condensed statement of net position information for the Divisions as of December 31, 2012, 2011 and 2010:
2012 2011 2010(Amounts in 000's)
Assets and Deferred Outflows: Assets: Current assets 110,955$ 106,763$ 106,802$ Restricted assets 288,296 295,994 262,691 Unamortized bond issuance costs 16,497 17,172 17,453 Capital assets, net 895,018 921,777 900,508 Total assets 1,310,766 1,341,706 1,287,454 Deferred outflows of resources: Derivative instruments-interest rate swaps 7,715 Total deferred outflows of resources - - 7,715 Total assets and deferred outflows 1,310,766$ 1,341,706$ 1,295,169$
Liabilities and net position: Liabilities: Current liabilities 59,189$ 57,178$ 53,558$ Long-term obligations 857,577 878,628 839,732
Total liabilities 916,766 935,806 893,290
Net position: Net investment in capital assets 127,557 147,324 124,506 Restricted for debt service 111,467 109,292 103,701 Restricted for passenger facility charges 17,670 20,376 25,572 Unrestricted 137,306 128,908 148,100 Total net position 394,000 405,900 401,879 Total liabilities and net position 1,310,766$ 1,341,706$ 1,295,169$

CITY OF CLEVELAND, OHIO DEPARTMENT OF PORT CONTROL
DIVISIONS OF CLEVELAND HOPKINS INTERNATIONAL AND BURKE LAKEFRONT AIRPORTS
MANAGEMENT’S DISCUSSION AND ANALYSIS (Continued)
6
CONDENSED STATEMENT OF NET POSITION INFORMATION (Continued)
Assets: Total assets decreased $30,940,000 in 2012 and increased $46,537,000 during 2011. The decrease in capital assets, net of accumulated depreciation, accounted for $26,759,000 or 86.5% of this change. This decrease was primarily due to the increase in accumulated depreciation. In 2011 the increase in total assets is primarily due to an increase in restricted assets. Restricted assets increased due to the proceeds from the issuance of construction bonds in 2011.
Capital assets: The Divisions’ investment in capital assets as of December 31, 2012 amounted to $895,018,000 (net of accumulated depreciation), which is a decrease of 2.9%. The Divisions’ investment in capital assets as of December 31, 2011 amounted to $921,777,000 (net of accumulated depreciation), which was an increase of 2.4%. These investments in capital assets include: land; land improvements; buildings, structures and improvements; furniture, fixtures and equipment; infrastructure; vehicles; and construction in progress. A summary of the activity in the Divisions’ capital assets during the year ended December 31, 2012 is as follows:
Balance BalanceJanuary 1, December 31,
2012 Additions Reductions 2012
Land 167,457$ $ $ 167,457$ Land improvements 74,153 74,153 Buildings, structures and improvements 329,324 5,339 (421) 334,242 Furniture, fixtures and equipment 23,305 6,470 (607) 29,168 Infrastructure 956,696 19,105 975,801 Vehicles 14,993 162 (504) 14,651
Total 1,565,928 31,076 (1,532) 1,595,472 Less: Accumulated depreciation (680,397) (50,541) 1,473 (729,465) Total 885,531 (19,465) (59) 866,007
Construction in progress 36,246 19,434 (26,669) 29,011
Capital assets, net 921,777$ (31)$ (26,728)$ 895,018$
(Amounts in 000's)

CITY OF CLEVELAND, OHIO DEPARTMENT OF PORT CONTROL
DIVISIONS OF CLEVELAND HOPKINS INTERNATIONAL AND BURKE LAKEFRONT AIRPORTS
MANAGEMENT’S DISCUSSION AND ANALYSIS (Continued)
7
CONDENSED STATEMENT OF NET POSITION INFORMATION (Continued)
A summary of the activity in the Divisions’ capital assets during the year ended December 31, 2011 is as follows:
Balance BalanceJanuary 1, December 31,
2011 Additions Reductions 2011
Land 167,457$ $ $ 167,457$ Land improvements 72,568 1,585 74,153 Buildings, structures and improvements 328,738 586 329,324 Furniture, fixtures and equipment 22,815 490 23,305 Infrastructure 910,907 45,789 956,696 Vehicles 13,830 1,163 14,993 Total 1,516,315 49,613 - 1,565,928 Less: Accumulated depreciation (632,622) (47,775) (680,397) Total 883,693 1,838 - 885,531
Construction in progress 16,815 19,431 36,246
Capital assets, net 900,508$ 21,269$ -$ 921,777$
(Amounts in 000's)
Major events during 2012 and 2011 affecting the Divisions’ capital assets included the following:
The Power Distribution Enhancement Project was initiated to permit the airport to function effectively and to provide an adequate level of operations, safety and security in the event of a power outage. Phase I involved the purchase and installation of four generators in 2011. Phase II calls for a redundant feeder system between MS1 and MS2 that will allow power to be supplied to the terminal uninterrupted from either substation. The project design began in late 2012 and construction is expected to be completed in 2013.

CITY OF CLEVELAND, OHIO DEPARTMENT OF PORT CONTROL
DIVISIONS OF CLEVELAND HOPKINS INTERNATIONAL AND BURKE LAKEFRONT AIRPORTS
MANAGEMENT’S DISCUSSION AND ANALYSIS (Continued)
8
CONDENSED STATEMENT OF NET POSITION INFORMATION (Continued)
The first phase of the CLE terrazzo floor and artwork installation project began in January 2011 and continued throughout 2012. The project consisted of removing old flooring and carpet to replace them with terrazzo starting at security checkpoint C, continuing up Concourse C, then proceeding to Concourses A and B. The entire project is expected to be complete in January 2014. As part of the terrazzo flooring project, artwork selected from an airport art competition will be installed into select floor locations. Five of the seven selected art pieces have been installed.
The BKL Runway 6L-24R Safety Area Improvement project includes the installation of an Engineered Materials Arresting System (EMAS) bed in the extended safety area of Runway 6L, a runway extension on 24R, a displacement of the Runway 6L threshold, new entrance taxiways, vehicle service road modifications, and navigation aid (NAVAID) modifications and improvements. In 2012, an Environmental Assessment (EA) was completed as well as the final project design. Construction is scheduled to commence in Spring 2013.
Construction for the RTA Level Art Gallery commenced at the end of 2011 and involved the transformation of the CLE RTA level interior from a standard passageway into a formal art gallery. The effort included replacement of all flooring, walls, stair treads and columns to allow wall and floor artwork to be shown. The space will also hold cultural exhibits and performances as required. The project was substantially completed in April 2012.
The Converged Communications project which commenced in September 2012, integrates six disparate communications systems and functions to deliver critical information for Cleveland Airport System personnel and travelers at CLE. The project supports the informational needs of CLE travelers with a new flight and baggage information system to more easily track and monitor travel itineraries and personal belongings; integrated audio and visual messaging providing synchronized public address messaging for all travelers, which has been helpful to the hearing-impaired; and an expanded, free Wi-Fi system that extends and improves public access to the Internet. The project also supports the information needs of the Airport System with a new, private Wi-Fi system that covers the entire CLE campus and a unified communications infrastructure that provides access to email, voice mail, fax, instant messaging, online presence and videoconferencing all through a unified interface. These improvements not only provide new functionality to Airport System personnel, but also enable mobile access to mission-critical systems and functions.

CITY OF CLEVELAND, OHIO DEPARTMENT OF PORT CONTROL
DIVISIONS OF CLEVELAND HOPKINS INTERNATIONAL AND BURKE LAKEFRONT AIRPORTS
MANAGEMENT’S DISCUSSION AND ANALYSIS (Continued)
9
CONDENSED STATEMENT OF NET POSITION INFORMATION (Continued)
Additional information on the Divisions’ capital assets, including commitments made for future capital expenses can be found in Note A – Summary of Significant Accounting Policies and Note F – Capital Assets to the basic financial statements.
Liabilities: In 2012 total liabilities decreased $19,040,000. In 2012, the decrease in long-term obligations was $21,051,000 or 2.4%. Current liabilities increased $2,011,000 or 3.5% as a result of increases in the current portion of long-term debt, due to other funds and interest payable offset by a decrease in accounts payable and accrued property taxes. In 2011 the increase in total liabilities was $42,516,000. The increase in long term obligations in 2011 was $38,896,000 or 4.6%. In 2011, current liabilities increased $3,620,000 or 6.8% as the construction fund payable from restricted assets increased $4,112,000, which resulted from an increase in retainage withheld on construction project Runway 10/28 Safety Area Improvement payments.
Long-term debt: At December 31, 2012 and 2011, the Divisions’ had $863,930,000 and $891,885,000, respectively, in total bonded debt outstanding. The Airport System Revenue Bonds are secured by the pledge of all airport revenues, as defined in the revenue bond indenture.
The activity in the Divisions’ debt obligations outstanding during the year ended December 31, 2012 is summarized below:
Balance BalanceJanuary 1, Debt Debt December 31,
2012 Issued Retired 2012
Airport System Revenue Bonds: Series 2000 398,445$ $ (249,445)$ 149,000$ Series 2006 116,270 (1,245) 115,025 Series 2007 10,175 (530) 9,645 Series 2008 64,925 (950) 63,975 Series 2009 227,685 (10,935) 216,750 Series 2011 74,385 74,385 Series 2012 235,150 235,150
Total 891,885$ 235,150$ (263,105)$ 863,930$
(Amounts in 000's)

CITY OF CLEVELAND, OHIO DEPARTMENT OF PORT CONTROL
DIVISIONS OF CLEVELAND HOPKINS INTERNATIONAL AND BURKE LAKEFRONT AIRPORTS
MANAGEMENT’S DISCUSSION AND ANALYSIS (Continued)
10
CONDENSED STATEMENT OF NET POSITION INFORMATION (Continued)
The activity in the Divisions’ debt obligations outstanding during the year ended December 31, 2011 is summarized below:
Balance BalanceJanuary 1, Debt Debt December 31,
2011 Issued Retired 2011
Airport System Revenue Bonds: Series 2000 398,445$ $ $ 398,445$ Series 2006 117,450 (1,180) 116,270 Series 2007 10,680 (505) 10,175 Series 2008 84,160 (19,235) 64,925 Series 2009 238,525 (10,840) 227,685 Series 2011 74,385 74,385
Total 849,260$ 74,385$ (31,760)$ 891,885$
(Amounts in 000's)
The bond ratings from Moody’s Investors Service, Standard & Poor’s Rating Service, and Fitch Ratings are as follows:
Moody’s Standard & Poor’sInvestors Service Rating Service Fitch Ratings
Baa1 A- A-
On April 25, 2011, Fitch Ratings lowered its rating on the Airport System Revenue Bonds from A (negative outlook) to A- (stable outlook). These ratings were reaffirmed in 2012.
The ratio of net revenue available for debt service to debt service requirements (revenue bond coverage) is a useful indicator of the Divisions’ debt position to management, customers and creditors. The Divisions’ revenue bond coverage for 2012, 2011 and 2010, was 166%, 158% and 160%, respectively.

CITY OF CLEVELAND, OHIO DEPARTMENT OF PORT CONTROL
DIVISIONS OF CLEVELAND HOPKINS INTERNATIONAL AND BURKE LAKEFRONT AIRPORTS
MANAGEMENT’S DISCUSSION AND ANALYSIS (Continued)
11
CONDENSED STATEMENT OF NET POSITION INFORMATION (Continued)
Additional information on the Divisions’ long-term debt can be found in Note B – Long-Term Debt and Other Obligations to the basic financial statements.
Net Position: Net position serves as a useful indicator of an entity's financial position. In the case of the Divisions, assets exceed liabilities by $394,000,000, $405,900,000 and $401,879,000at December 31, 2012, 2011 and 2010, respectively. Of the Divisions’ net position at December 31, 2012 and 2011, $127,557,000 and $147,324,000, respectively, reflects its investment in capital assets (e.g., construction in progress; land; land improvements; buildings, structures, and improvements; furniture, fixtures and equipment; vehicles; and infrastructure), net of accumulated depreciation, less any related, still-outstanding debt used to acquire those assets. The Divisions use these capital assets to provide services to their customers. Consequently, these assets are not available for future spending.
Although the Divisions’ investment in capital assets is reported net of related debt, it should be noted that the resources needed to repay this debt must be provided from other resources since the capital assets themselves cannot be used to liquidate these liabilities.
An additional portion of the Divisions’ net position represents resources that are subject to external restrictions. At December 31, 2012 and 2011 the restricted net position amounted to $129,137,000 and $129,668,000, respectively. The restricted net position include amounts set aside in various fund accounts for payment of revenue bonds, which are limited by the bond indentures, and passenger facility charges imposed and collected at Cleveland Hopkins International Airport based on an approved Federal Aviation Administration application. Passenger facility charges are restricted for designated capital projects and approved debt service. The remaining balance of unrestricted net position, $137,306,000 and $128,908,000 for December 31, 2012 and 2011, respectively, may be used to meet the Divisions’ ongoing obligations to customers and creditors.

CITY OF CLEVELAND, OHIO DEPARTMENT OF PORT CONTROL
DIVISIONS OF CLEVELAND HOPKINS INTERNATIONAL AND BURKE LAKEFRONT AIRPORTS
MANAGEMENT’S DISCUSSION AND ANALYSIS (Continued)
12
CONDENSED STATEMENT OF REVENUES, EXPENSES AND CHANGES IN NET POSITION INFORMATION
The Divisions’ operations during 2012 decreased its net position by $11,900,000 and increased by $4,021,000 in 2011. Provided below are key elements of the Divisions’ results of operations as of and for the years ended December 31, 2012, 2011 and 2010:
2012 2011 2010
Operating revenues: Landing fees 36,676$ 37,288$ 26,356$ Terminal and concourse rentals 52,133 50,131 52,670 Concessions 21,960 22,638 21,496 Utility sales and other 5,925 4,910 6,174 Total operating revenues 116,694 114,967 106,696
Operating expenses 119,396 121,085 120,151
Operating income (loss) (2,702) (6,118) (13,455)
Non-operating revenue (expense):Passenger facility charges revenue 15,781 17,874 18,820 Non-operating expense (3,437) 2,414 (2,299) Sound insulation program (577) (689) (2,545) Loss on disposal of capital asset (59) Investment income (loss) 272 (9,634) 1,088 Interest expense (29,571) (35,389) (30,442) Amortization of bond issuance expense, bond discounts and loss on debt refundings (756) (2,948) (2,754)
Total non-operating revenue (expense), net (18,347) (28,372) (18,132)
Capital and other contributions 9,149 38,511 37,800
Increase (decrease) in net position (11,900) 4,021 6,213
Net position, beginning of year 405,900 401,879 395,666
Net position, end of year 394,000$ 405,900$ 401,879$
(Amounts in 000's)

CITY OF CLEVELAND, OHIO DEPARTMENT OF PORT CONTROL
DIVISIONS OF CLEVELAND HOPKINS INTERNATIONAL AND BURKE LAKEFRONT AIRPORTS
MANAGEMENT’S DISCUSSION AND ANALYSIS (Continued)
13
CONDENSED STATEMENT OF REVENUES, EXPENSES AND CHANGES IN NET POSITION INFORMATION (Continued)
Operating revenues: Of the 2012 operating revenues of $116,694,000, $34,923,000 or 29.9% represented landing fees received from signatory airlines. This is a decrease in landing fees of 2.8% from the prior year due to a decrease in the both the number of landings and landed weights. Signatory terminal rentals accounted for $36,280,000, or 31.1% of total operating revenues. The increase in signatory terminal rent of 5.7% is a result of an increase in square footage rates for terminal and concourse leased areas. Parking revenues increased 5.2% over the prior year due to an increase in the demand for services such as valet airport parking and economy parking usage. Parking revenues amounted to $13,649,000 or 11.7% of total operating revenues for 2012. The fourth largest airport revenue source, rental cars, accounted for 7.9% of total operating revenues.
Of the 2011 operating revenues of $114,967,000, $35,911,000 or 31.2% represented landing fees received from signatory airlines. This is an increase of 43.4% from the prior year. Signatory terminal rentals accounted for $34,312,000, or 29.8% of total operating revenues. The decrease in signatory terminal rent of 5.7% is a result of a decrease in terminal rates and charges attributed to the signatory airlines enplaned passenger credit. Parking revenues increased 2.9% over the prior year due to an increase in the demand for services such as valet airport parking and economy parking usage. Parking revenues amounted to $12,969,000 or 11.3% of total operating revenues for 2011. The fourth largest airport revenue source, rental cars, accounted for 8.0% of total operating revenues, which is a decrease of 1.0% from 2010.
Operating expenses: Total operating expenses for 2012 decreased $1,689,000 or 1.4%. The decrease is primarily due to a milder winter season which resulted in a decreased usage of de-icing chemicals and related waste disposal. These decreases were partially offset by modest increases in costs associated with property taxes and professional fees. Employee salaries, wages and benefits increased $609,000 or 2.1% due to increases in employee wages. Total operating expenses for 2011 increased $934,000 or 0.8%. The increase is primarily due to a 40.5% increase in maintenance expenses which was the result of the Divisions’ increase in the costs related to maintaining aging equipment and the increase in the price of de-icing chemicals and their disposal. These increases were partially offset by modest decreases in costs associated with utility, property taxes and professional fees. Employee salaries, wages and benefits increased $1,216,000 or 4.4% due to increases in employee benefits.
Non-operating revenue and expense: Expenses related to the Sound Insulation Program were $577,000, $689,000, and $2,545,000 in 2012, 2011 and 2010, respectively. Passenger facility charge revenues decreased 11.7%, from $17,874,000 in 2011 to $15,781,000 in 2012 resulting from a decrease in the scheduled airline enplanements.

CITY OF CLEVELAND, OHIO DEPARTMENT OF PORT CONTROL
DIVISIONS OF CLEVELAND HOPKINS INTERNATIONAL AND BURKE LAKEFRONT AIRPORTS
MANAGEMENT’S DISCUSSION AND ANALYSIS (Continued)
14
CONDENSED STATEMENT OF REVENUES, EXPENSES AND CHANGES IN NET POSITION INFORMATION (Continued)
Capital and other contributions: In 2012, 2011 and 2010, the Divisions’ received $9,149,000, $38,511,000 and $37,800,000, respectively, in Federal Airport Improvement Grants. Airport Improvement Program Grants received from the Federal Aviation Administration were primarily for the Burke RSA project, airfield safety improvements, Residential Sound Insulation Program and the acquisition of snow-melters.
FACTORS EXPECTED TO IMPACT THE DIVISIONS’ FINANCIAL POSITION OR RESULTS OF OPERATIONS
Continental Airlines and United Airlines (collectively Continental) entered into a Settlement Agreement (Agreement) with the Office of the Attorney General of the State of Ohio (AG) effective October 31, 2010 (Merger Closing Date) to resolve the AG’s investigation of the antitrust implications of their proposed merger. Pursuant to the terms of the Agreement Continental agreed to maintain, for a period of 24-months from the Merger Closing Date, average daily departures from the Airport at no less then ninety (90%) percent of average daily departures in the year prior to the Merger Closing Date (Base Departure Commitment). In addition the Agreement contains an additional three year commitment for average daily departures at the Base Departure Commitment level subject to certain metrics based on Airport segment profitability as more fully outlined in the Agreement. The Agreement gives the AG’s office the right to audit Airport segment profitability at Continental’s expense up to $80,000 per annum. Continental also agreed to maintain its current Airport aircraft maintenance facility at a level of operations commensurate with the 12-month period immediately preceding the merger. Any reduction in the Base Departure Commitment may result in a reduction in aircraft maintenance facility operations. Other commitments include continuation of the Cleveland Air Service Working Group during the effective period of the Agreement and a penalty based on an amount equal to the percentage by which Continental is found to have breached its minimum departure commitments of $20 million. Pursuant to the terms of a separate Memorandum of Understanding between the City and the AG’s office any monies collected from Continental pursuant to this penalty will be forwarded to the City. The AG’s office has also agreed to inform the City whether, as a result of its audits any of the metrics outlined in the Agreement have been triggered or are likely to be triggered.
On February 13, 2013, American Airlines and US Airways announced a proposed merger agreement with the “new” American Airlines remaining as the largest airline in the world. Although this business combination is not expected to occur before the end of 2013, looking towards the future, there will likely be an impact on the Divisions’ operations. Both airlines expect that the regional carriers they own – AMR Corporation’s American Eagle and US Airways’ Piedmont and PSA – will continue to operate as distinct entities, providing seamless service to the combined airline. American Airlines and US Airways enplaned 5.6% and 4.3% of total passengers at the Airport, respectively, in 2012. It is not known at this time whether the impact will have a negative or positive effect on CLE.

CITY OF CLEVELAND, OHIO DEPARTMENT OF PORT CONTROL
DIVISIONS OF CLEVELAND HOPKINS INTERNATIONAL AND BURKE LAKEFRONT AIRPORTS
MANAGEMENT’S DISCUSSION AND ANALYSIS (Continued)
15
FACTORS EXPECTED TO IMPACT THE DIVISIONS’ FINANCIAL POSITION OR RESULTS OF OPERATIONS (Continued)
Federal Sequestration has had a direct impact on Cleveland Airport System (CAS) federally-funded projects such as the CLE Airport Surface Surveillance Capability (ASSC) Project currently placed on hold. In addition, CAS has been advised by the Federal Aviation Administration (FAA) Airport District Office that there is no funding for an Environmental Assessment (EA) of the CLE airfield due to Sequestration. The EA would have focused on specific areas of the airfield that require either rehabilitation (due to age and deterioration) and/or are planned for development. Long-term, not being able to implement the aforementioned projects due to Sequestration may compromise airfield system preservation (i.e., ability to improve existing infrastructure), airfield capacity, safety and funding for future Airport Improvement Program (AIP)-eligible projects.
Effective April 24, 2013, the City issued $58,000,000 Airport System Revenue Bonds, Series 2013A (Taxable). These bonds refunded all of the outstanding $58,000,000 Airport System Revenue Bonds, Series 2008F in anticipation of the expiration of the existing letter of credit. The bonds were purchased by U.S. Bank National Association with the City paying an amount equal to one month LIBOR plus a spread of 105 basis points. As a result of this refunding, the City will realize aggregate net present value savings of $3.4 million or 5.87%.
ADDITIONAL INFORMATION
This financial report is designed to provide a general overview of the Divisions’ finances. Questions concerning any of the information provided in this report or requests for additional information should be addressed to the Office of the Finance Director, City Hall, Room 104, 601 Lakeside Avenue, Cleveland, Ohio 44114.

16
This page intentionally left blank.

17
BASIC FINANCIAL STATEMENTS

18
CITY OF CLEVELAND, OHIODEPARTMENT OF PORT CONTROL
DIVISIONS OF CLEVELAND HOPKINS INTERNATIONAL AND BURKE LAKEFRONT AIRPORTS
STATEMENTS OF NET POSITIONDecember 31, 2012 and 2011
(Amounts in 000's)2012 2011
ASSETSCURRENT ASSETS
Cash and cash equivalents 87,196$ 64,252$ Restricted cash and cash equivalents 7,037 7,664 Investments 10,117 Receivables:
Accounts-net of allowance for doubtful accounts of $2,000,000 in 2012 and $2,006,000 in 2011 7,732 14,066 Unbilled revenue 3,314 3,599 Landing fees - due from airlines 3,850 Accrued interest receivable 94
Total receivables 11,046 21,609
Prepaid expenses 323 330 Due from other funds 34 Due from other governments 2,976 673 Materials and supplies-at cost 2,343 2,118
TOTAL CURRENT ASSETS 110,955 106,763 RESTRICTED ASSETS
Cash and cash equivalents 286,051 224,144 Investments 69,570 Accrued interest receivable 1 Accrued passenger facility charges 2,244 2,280
TOTAL RESTRICTED ASSETS 288,296 295,994
UNAMORTIZED BOND ISSUANCE COSTS 16,497 17,172
CAPITAL ASSETSLand 167,457 167,457 Land improvements 74,153 74,153 Buildings, structures and improvements 334,242 329,324 Furniture, fixtures and equipment 29,168 23,305 Infrastructure 975,801 956,696 Vehicles 14,651 14,993
1,595,472 1,565,928 Less: Accumulated depreciation (729,465) (680,397)
866,007 885,531 Construction in progress 29,011 36,246
CAPITAL ASSETS, NET 895,018 921,777
TOTAL ASSETS 1,310,766$ 1,341,706$
(Continued)

19
CITY OF CLEVELAND, OHIODEPARTMENT OF PORT CONTROL
(Amounts in 000's)2012 2011
LIABILITIES AND NET POSITIONLIABILITIES CURRENT LIABILITIES
Current portion of long-term debt, due within one year 16,285$ 13,660$ Current portion of long-term deferred payment obligation, due within one year 3,230 2,989 Accounts payable 3,246 4,457
Landing fee settlement payable to airlines 300 Due to other funds 1,412 969
Current portion of accrued wages and benefits 4,079 3,972 Accrued interest payable 17,632 16,980 Accrued property taxes 5,968 6,487 Construction fund payable from restricted assets 1,913 6,010 Other construction accounts payable from restricted assets 5,124 1,654
TOTAL CURRENT LIABILITIES 59,189 57,178
LONG-TERM OBLIGATIONS - excluding amounts due within one yearRevenue bonds 856,702 874,540 Deferred payment obligation 280 3,510 Accrued wages and benefits 595 578
TOTAL LONG-TERM OBLIGATIONS 857,577 878,628
TOTAL LIABILITIES 916,766 935,806
NET POSITIONNet investment in capital assets 127,557 147,324 Restricted for debt service 111,467 109,292 Restricted for passenger facility charges 17,670 20,376 Unrestricted 137,306 128,908
TOTAL NET POSITION 394,000 405,900
TOTAL LIABILITIES AND NET POSITION 1,310,766$ 1,341,706$
(Concluded)
See notes to financial statements.
DIVISIONS OF CLEVELAND HOPKINS INTERNATIONAL AND BURKE LAKEFRONT AIRPORTS
STATEMENTS OF NET POSITIONDecember 31, 2012 and 2011

20
This page intentionally left blank.

21
CITY OF CLEVELAND, OHIODEPARTMENT OF PORT CONTROL
DIVISIONS OF CLEVELAND HOPKINS INTERNATIONAL AND BURKE LAKEFRONT AIRPORTS
STATEMENTS OF REVENUES, EXPENSES AND CHANGES IN NET POSITIONFor the Years Ended December 31, 2012 and 2011
(Amounts in 000's)2012 2011
OPERATING REVENUESLanding fees:
Scheduled airlines 34,923$ 35,911$ Other 1,753 1,377
36,676 37,288 Terminal and concourse rentals:
Scheduled airlines 36,280 34,312 Other 15,853 15,819
52,133 50,131
Concessions 21,960 22,638 Utility sales and other 5,925 4,910
TOTAL OPERATING REVENUES 116,694 114,967
OPERATING EXPENSESOperations 64,454 68,094 Maintenance 4,401 5,216 Depreciation 50,541 47,775
TOTAL OPERATING EXPENSES 119,396 121,085
OPERATING INCOME (LOSS) (2,702) (6,118) NON-OPERATING REVENUE (EXPENSE)
Passenger facility charges revenue 15,781 17,874 Non-operating revenue (expense) (3,437) 2,414 Sound insulation program (577) (689) Loss on disposal of capital asset (59) Rebate arbitrage expenseInvestment income (loss) 272 (9,634) Interest expense (29,571) (35,389) Amortization of bond issuance expense, bond discounts and loss on debt refundings (756) (2,948)
TOTAL NON-OPERATING REVENUE (EXPENSE) - NET (18,347) (28,372)
INCOME (LOSS) BEFORE CAPITAL AND OTHERCONTRIBUTIONS (21,049) (34,490)
Capital and other contributions 9,149 38,511
INCREASE (DECREASE) IN NET POSITION (11,900) 4,021 NET POSITION, BEGINNING OF YEAR 405,900 401,879
NET POSITION, END OF YEAR 394,000$ 405,900$ See notes to financial statements.
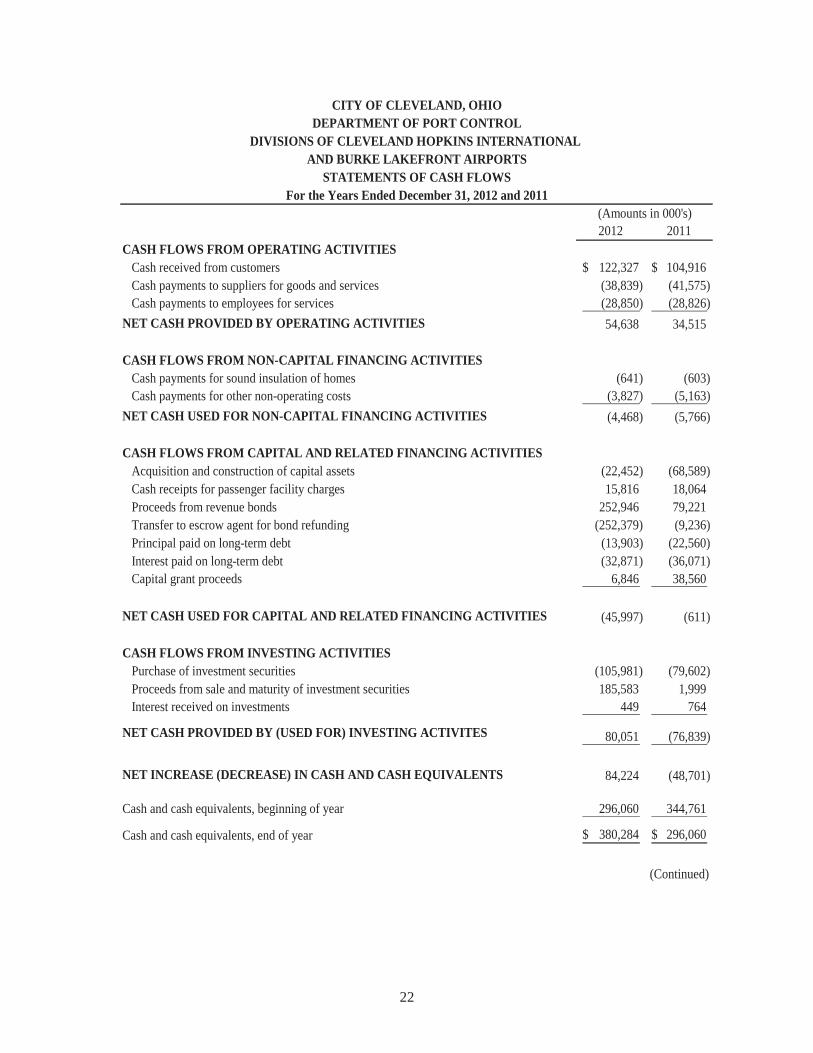
22
CITY OF CLEVELAND, OHIODEPARTMENT OF PORT CONTROL
DIVISIONS OF CLEVELAND HOPKINS INTERNATIONAL AND BURKE LAKEFRONT AIRPORTS
STATEMENTS OF CASH FLOWSFor the Years Ended December 31, 2012 and 2011
(Amounts in 000's)2012 2011
CASH FLOWS FROM OPERATING ACTIVITIESCash received from customers 122,327$ 104,916$ Cash payments to suppliers for goods and services (38,839) (41,575) Cash payments to employees for services (28,850) (28,826)
NET CASH PROVIDED BY OPERATING ACTIVITIES 54,638 34,515
CASH FLOWS FROM NON-CAPITAL FINANCING ACTIVITIESCash payments for sound insulation of homes (641) (603) Cash payments for other non-operating costs (3,827) (5,163)
NET CASH USED FOR NON-CAPITAL FINANCING ACTIVITIES (4,468) (5,766)
CASH FLOWS FROM CAPITAL AND RELATED FINANCING ACTIVITIESAcquisition and construction of capital assets (22,452) (68,589) Cash receipts for passenger facility charges 15,816 18,064 Proceeds from revenue bonds 252,946 79,221 Transfer to escrow agent for bond refunding (252,379) (9,236) Principal paid on long-term debt (13,903) (22,560) Interest paid on long-term debt (32,871) (36,071) Capital grant proceeds 6,846 38,560
NET CASH USED FOR CAPITAL AND RELATED FINANCING ACTIVITIES (45,997) (611)
CASH FLOWS FROM INVESTING ACTIVITIESPurchase of investment securities (105,981) (79,602) Proceeds from sale and maturity of investment securities 185,583 1,999 Interest received on investments 449 764
NET CASH PROVIDED BY (USED FOR) INVESTING ACTIVITES 80,051 (76,839)
NET INCREASE (DECREASE) IN CASH AND CASH EQUIVALENTS 84,224 (48,701)
Cash and cash equivalents, beginning of year 296,060 344,761
Cash and cash equivalents, end of year 380,284$ 296,060$
(Continued)

23
CITY OF CLEVELAND, OHIODEPARTMENT OF PORT CONTROL
DIVISIONS OF CLEVELAND HOPKINS INTERNATIONAL AND BURKE LAKEFRONT AIRPORTS
STATEMENTS OF CASH FLOWSFor the Years Ended December 31, 2012 and 2011
(Amounts in 000's)2012 2011
RECONCILIATION OF OPERATING INCOME (LOSS) TO NET CASH PROVIDED BY OPERATING ACTIVITIES
OPERATING INCOME (LOSS) (2,702)$ (6,118)$ Adjustments to reconcile operating income (loss) to net cash provided by operating activities:Depreciation and amortization 50,541 47,775 Noncash rental income (3,389) (3,389) Changes in assets and liabilities:
Accounts receivable, net 6,334 (5,646) Unbilled revenue 285 816 Landing fees - due from airlines 3,850 262 Prepaid expenses 7 2 Due from other funds (34) 96 Materials and supplies, at cost (225) (62) Accounts payable (377) 1,114 Due to other funds 443 (100) Accrued wages and benefits 124 (230) Landing fees - due to airlines 300 Accrued property taxes (519) (5)
TOTAL ADJUSTMENTS 57,340 40,633
NET CASH PROVIDED BY OPERATING ACTIVITIES 54,638$ 34,515$
Noncash operating activities:Rental Income $3,389 $3,389
(Concluded)
See notes to financial statements.

24
This page intentionally left blank.

CITY OF CLEVELAND, OHIO DEPARTMENT OF PORT CONTROL
DIVISIONS OF CLEVELAND HOPKINS INTERNATIONAL AND BURKE LAKEFRONT AIRPORTS
NOTES TO FINANCIAL STATEMENTS For the Years Ended December 31, 2012 and 2011
25
NOTE A – SUMMARY OF SIGNIFICANT ACCOUNTING POLICIES
The Divisions of Cleveland Hopkins International and Burke Lakefront Airports (the Divisions) are reported as an Enterprise Fund of the City of Cleveland, Department of Port Control and are part of the City of Cleveland’s (the City) primary government. The Divisions were created for the purpose of operating the airports within the Cleveland Metropolitan Area. The following is a summary of the more significant accounting policies.
Reporting Model and Basis of Accounting: The accounting policies and financial reporting practices of the Divisions comply with accounting principles generally accepted in the United States of America applicable to governmental units.
In November of 2010, Governmental Accounting Standards Board (GASB) Statement No. 60, Accounting and Financial Reporting for Service Concession Arrangements was issued. This Statement is effective for fiscal periods beginning after December 15, 2011. The objective of this Statement is to improve financial reporting by addressing issues related to service concession arrangements (SCAs), which are a type of public-private or public-public partnership. The Divisions have determined that GASB Statement No. 60 has no impact on its financial statements as of December 31, 2012.
In December of 2010, Governmental Accounting Standards Board (GASB) Statement No. 62, Codification of Accounting and Financial Reporting Guidance Contained in Pre-November 30, 1989 FASB and AICPA Pronouncements was issued. This Statement is effective for fiscal periods beginning after December 15, 2011. The objective of this Statement is to incorporate into the GASB’s authoritative literature certain accounting and financial reporting guidance that is included in the following pronouncements issued on or before November 30, 1989, which does not conflict with or contradict GASB pronouncements: (1) Financial Accounting Standards Board (FASB) Statements and Interpretations, (2) Accounting Principles Board Opinions and (3) Accounting Research Bulletins of the American Institute of Certified Public Accountants’ (AICPA) Committee on Accounting Procedure. As required, the Divisions have implemented GASB Statement No. 62 effective for the 2012 fiscal year.
In June of 2011, Governmental Accounting Standards Board (GASB) Statement No. 63, Financial Reporting of Deferred Outflows of Resources, Deferred Inflows of Resources, and Net Position was issued. This Statement is effective for fiscal periods beginning after December 15, 2011. This Statement provides financial reporting guidance for deferred outflows of resources and deferred inflows of resources. As required, the Divisions have implemented GASB Statement No. 63 effective for the 2012 fiscal year.

CITY OF CLEVELAND, OHIO DEPARTMENT OF PORT CONTROL
DIVISIONS OF CLEVELAND HOPKINS INTERNATIONAL AND BURKE LAKEFRONT AIRPORTS
NOTES TO FINANCIAL STATEMENTS (Continued) For the Years Ended December 31, 2012 and 2011
26
NOTE A – SUMMARY OF SIGNIFICANT ACCOUNTING POLICIES (Continued)
In June of 2011, Governmental Accounting Standards Board (GASB) Statement No. 64, Derivative Instruments: Application of Hedge Accounting Termination Provision was issued. This Statement is effective for fiscal periods beginning after June 15, 2011. The objective of this Statement is to clarify whether an effective hedging relationship continues after the replacement of a swap counterparty or a swap counterparty’s credit support provider. The Divisions have determined that GASB Statement No. 64 has no impact on its financial statements as of December 31, 2012.
The Divisions’ net position is accounted for in the accompanying statement of net position and the net position is divided into the following categories:
Net investment in capital assets
Amount restricted for debt service
Amount restricted for passenger facility charges
Remaining unrestricted amount
In addition, certain additional financial information regarding the Divisions is included in these notes. The implementation of the new GASB statements did not result in a change in the Divisions’ beginning net position as previously reported.
Basis of Accounting: The Divisions’ financial statements are prepared under the accrual basis of accounting. Under this method, revenues are recognized when earned and measurable and expenses are recognized when incurred.
Statement of Cash Flows: The Divisions utilize the direct method of reporting for the statement of cash flows as defined by the GASB Statement No. 9, Reporting Cash Flows of Proprietary and Non-expendable Trust Funds and Governmental Entities That Use Proprietary Fund Accounting. In the statement of cash flows, cash receipts and cash payments are classified according to operating, non-capital financing, capital and related financing and all investment activities.
Cash and Cash Equivalents: Cash and cash equivalents represent cash on hand and cash deposits maintained by the City Treasurer on behalf of the Divisions. Cash equivalents are defined as highly liquid investments with a maturity of three months or less when purchased.

CITY OF CLEVELAND, OHIO DEPARTMENT OF PORT CONTROL
DIVISIONS OF CLEVELAND HOPKINS INTERNATIONAL AND BURKE LAKEFRONT AIRPORTS
NOTES TO FINANCIAL STATEMENTS (Continued) For the Years Ended December 31, 2012 and 2011
27
NOTE A – SUMMARY OF SIGNIFICANT ACCOUNTING POLICIES (Continued)
Investments: The Divisions follow the provisions of GASB Statement No. 31, Accounting and Financial Reporting for Certain Investments and External Investment Pools, which requires governmental entities to report certain investments at fair value in the balance sheet and recognize the corresponding change in the fair value of investments in the year in which the change occurred. The fair market value is based on quoted market values.
The Divisions have invested funds in the State Treasury Asset Reserve of Ohio (STAROhio) during 2012 and 2011. STAROhio is an investment pool managed by the State Treasurer’s Office, which allows governments within the State to pool their funds for investment purposes. STAROhio is not registered with the SEC as an investment company, but does operate in a manner consistent with Rule 2a7 of the Investment Company Act of 1940. Investments in STAROhio are valued at STAROhio’s share price, which is the price the investment could be sold for on December 31, 2012 and 2011.
Restricted Assets: Proceeds from debt and amounts set aside in various fund accounts for payment of revenue bonds are classified as restricted assets since their use is limited by the bond indentures.
Restricted for Passenger Facility Charges: These assets are for passenger facility charges imposed and collected at Cleveland Hopkins International Airport based on an approved Federal Aviation Administration application. These are restricted for designated capital projects or debt service.
Capital Assets and Depreciation: Capital assets are stated on the basis of historical cost or, if contributed, at fair market value as of the date received. Depreciation is computed by allocating the cost of capital assets over the estimated useful lives of the assets using the straight-line method. A capital asset is defined as a tangible item with a useful life in excess of one year and an individual cost of more than $5,000 for furniture, fixtures, equipment and vehicles and $10,000 for all other assets. When capital assets are disposed, the cost and related accumulated depreciation are removed from the accounts with gains or losses on disposition being reflected in operations. The estimated useful lives are as follows:
Land Improvements 15 to 100 yearsBuildings, structures and improvements 5 to 60 yearsFurniture, fixtures and equipment 3 to 35 yearsInfrastructure 3 to 50 yearsVehicles 3 to 35 years

CITY OF CLEVELAND, OHIO DEPARTMENT OF PORT CONTROL
DIVISIONS OF CLEVELAND HOPKINS INTERNATIONAL AND BURKE LAKEFRONT AIRPORTS
NOTES TO FINANCIAL STATEMENTS (Continued) For the Years Ended December 31, 2012 and 2011
28
NOTE A – SUMMARY OF SIGNIFICANT ACCOUNTING POLICIES (Continued)
The Divisions’ policy is to capitalize interest on construction projects up to the point in time that the project is substantially completed. Capitalized interest is included in the cost of the assets and is depreciated on the straight-line basis over the estimated useful lives of such assets. The Divisions apply Governmental Accounting Standards Board guidance pertaining to capitalization of interest cost in situations involving certain tax-exempt borrowings and certain gifts and grants, for its revenue bonds. This guidance requires capitalization of interest cost of eligible borrowings less interest earned on investment of the related bond proceeds from the date of borrowing until the assets constructed from the bond proceeds are ready for their intended use.
For 2012 and 2011, total interest costs incurred amounted to $34,165,000 and $42,375,000, respectively, of which $4,594,000 and $6,981,000 respectively, was capitalized, net of interest income of $0 in 2012 and $5,000 in 2011.
Bond Issuance Costs, Discounts and Unamortized Losses on Debt Refundings: Bond issuance expense is carried on the Divisions’ books as a deferred expense and deferred bond discounts/premiums are netted against long-term debt. Both are amortized over the lives of the applicable bonds. Unamortized loss on debt refundings is netted against long-term debt and is amortized over the shorter of the defeased bond or the newly issued bond.
Compensated Absences: The Divisions’ accrue for compensated absences such as vacation, sick leave and compensatory time using the termination payment method specified under GASB Statement No. 16, Accounting for Compensated Absences. These amounts are recorded as accrued wages and benefits in the accompanying statements of net position. The portion of the compensated absence liability that is not expected to be paid or utilized within one year is reported as a long-term liability.
Normally, all vacation time is to be taken in the year available. The Divisions allow employees to carryover vacation time from one year to the next. Sick days not taken may be accumulated until retirement. An employee is paid one-third of accumulated sick leave upon retirement, calculated at the three-year average base salary rate, with the balance being forfeited.
Environmental Expenses: Environmental expenses consist of costs incurred for remediation efforts to airport property. Environmental expenses that relate to current operations are expensed or capitalized, as appropriate. Environmental expenses that relate to existing conditions caused by past operations and which do not contribute to future revenues are expensed. Liabilities are recorded when remedial efforts are probable and the costs can be reasonably estimated.
Non-operating Expenses: Non-operating expenses relate to expenses of the Divisions’ incurred for purposes other than the operations of the airports and consist primarily of interest costs incurred on the Divisions’ long-term debt. The funding for non-operating expenses is non-operating revenue (passenger facility charges, revenue bonds and federal grants).

CITY OF CLEVELAND, OHIO DEPARTMENT OF PORT CONTROL
DIVISIONS OF CLEVELAND HOPKINS INTERNATIONAL AND BURKE LAKEFRONT AIRPORTS
NOTES TO FINANCIAL STATEMENTS (Continued) For the Years Ended December 31, 2012 and 2011
29
NOTE A – SUMMARY OF SIGNIFICANT ACCOUNTING POLICIES (Continued)
Interfund Transactions: During the course of normal operations, the Divisions have numerous transactions between other City divisions and departments. Unpaid amounts at year end are generally reflected as due to or due from in the accompanying financial statements.
Interfund receivables and payables balances at December 31, 2012 and 2011 are as follows:
2012 2012 2011 2011Due From Due To Due From Due To
City of Cleveland General Fund 34$ 269$ $ 228$ Division of Water Pollution Control 227 81 Division of Cleveland Public Power 17 18 Workers' Compensation Refund Reserve 674 461 Division of Radio Communication 4 6 Division of Printing 5 6 Division of Motor Vehicle Maintenance 86 95 Sinking Fund Administration 34 30 Division of Telephone Exchange 96 44
34$ 1,412$ -$ 969$ .
(Amounts in 000's)

CITY OF CLEVELAND, OHIO DEPARTMENT OF PORT CONTROL
DIVISIONS OF CLEVELAND HOPKINS INTERNATIONAL AND BURKE LAKEFRONT AIRPORTS
NOTES TO FINANCIAL STATEMENTS (Continued) For the Years Ended December 31, 2012 and 2011
30
NOTE B – LONG-TERM DEBT AND OTHER OBLIGATIONS
Long-term debt outstanding at December 31 is as follows:
Interest Rate Original Issuance 2012 2011
Airport System Revenue Bonds: Series 2000, due through 2031 4.00%-5.00% 509,880$ 149,000$ 398,445$ Series 2006, due through 2024 5.00%-5.25% 118,760 115,025 116,270 Series 2007, due through 2027 4.00%-5.00% 11,255 9,645 10,175 Series 2008, due through 2033 Variable Rate 76,700 63,975 64,925 Series 2009, due through 2027 .11%-5.00% 248,280 216,750 227,685 Series 2011, due through 2024 3.00%-5.00% 74,385 74,385 74,385 Series 2012, due through 2031 5.00% 235,150 235,150
1,274,410$ 863,930 891,885 Unamortized (discount) premium 36,033 17,569 Unamortized loss on debt refunding (26,976) (21,254) Current portion (due within one year) (16,285) (13,660) Total Long-Term Debt excluding the deferred payment obligation 856,702$ 874,540$
(Amounts in 000's)

CITY OF CLEVELAND, OHIO DEPARTMENT OF PORT CONTROL
DIVISIONS OF CLEVELAND HOPKINS INTERNATIONAL AND BURKE LAKEFRONT AIRPORTS
NOTES TO FINANCIAL STATEMENTS (Continued) For the Years Ended December 31, 2012 and 2011
31
NOTE B – LONG-TERM DEBT AND OTHER OBLIGATIONS (Continued)
Summary: Changes in long-term obligations for the year ended December 31, 2012 are as follows:
Balance January 1,
2012 Increase Decrease
BalanceDecember 31,
2012
Due Within
One Year
Airport System Revenue Bonds: Series 2000 398,445$ $ (249,445)$ 149,000$ $ Series 2006 116,270 (1,245) 115,025 1,310 Series 2007 10,175 (530) 9,645 550 Series 2008 64,925 (950) 63,975 Series 2009 227,685 (10,935) 216,750 11,545 Series 2011 74,385 74,385 2,880 Series 2012 235,150 235,150
Total revenue bonds 891,885 235,150 (263,105) 863,930 16,285 Accrued wages and benefits 4,550 4,096 (3,972) 4,674 4,079
Total 896,435$ 239,246$ (267,077)$ 868,604$ 20,364$
(Amounts in 000's)

CITY OF CLEVELAND, OHIO DEPARTMENT OF PORT CONTROL
DIVISIONS OF CLEVELAND HOPKINS INTERNATIONAL AND BURKE LAKEFRONT AIRPORTS
NOTES TO FINANCIAL STATEMENTS (Continued) For the Years Ended December 31, 2012 and 2011
32
NOTE B – LONG-TERM DEBT AND OTHER OBLIGATIONS (Continued)
Summary: Changes in long-term obligations for the year ended December 31, 2011 are as follows:
Balance January 1,
2011 Increase Decrease
BalanceDecember 31,
2011
Due Within
One Year
Airport System Revenue Bonds: Series 2000 398,445$ $ $ 398,445$ $ Series 2006 117,450 (1,180) 116,270 1,245 Series 2007 10,680 (505) 10,175 530 Series 2008 84,160 (19,235) 64,925 950 Series 2009 238,525 (10,840) 227,685 10,935 Series 2011 74,385 74,385
Total revenue bonds 849,260 74,385 (31,760) 891,885 13,660
Accrued wages and benefits 4,780 3,899 (4,129) 4,550 3,972
Total 854,040$ 78,284$ (35,889)$ 896,435$ 17,632$
(Amounts in 000's)
Minimum principal and interest payments on long-term debt are as follows:
Principal Interest Total
2013 16,285$ 41,258$ 57,543$ 2014 32,120 40,228 72,348 2015 33,155 38,807 71,962 2016 34,415 37,265 71,680 2017 39,765 35,466 75,231 2018-2022 228,545 146,398 374,9432023-2027 235,865 90,420 326,2852028-2032 238,335 26,564 264,8992033 5,445 136 5,581
Total 863,930$ 456,542$ 1,320,472$
.
(Amounts in 000's)

CITY OF CLEVELAND, OHIO DEPARTMENT OF PORT CONTROL
DIVISIONS OF CLEVELAND HOPKINS INTERNATIONAL AND BURKE LAKEFRONT AIRPORTS
NOTES TO FINANCIAL STATEMENTS (Continued) For the Years Ended December 31, 2012 and 2011
33
NOTE B – LONG-TERM DEBT AND OTHER OBLIGATIONS (Continued)
The Airport System Revenue Bonds are secured by the pledge of all airport revenues, as defined in the revenue bond indenture. Further, the City has assigned to the trustee all its interest in and rights to the airline use agreements under the revenue bond indenture. Amounts held in trust may be invested by the City Treasurer or the trustee in permitted investments. However, the use of funds is limited by the bond indenture and, accordingly, is classified as restricted assets in these financial statements.
As of December 31, 2012 and 2011, the Divisions were in compliance with the terms and requirements of the bond indenture.
The indenture, as amended, requires, among other things, that the Divisions (1) make equal monthly deposits to the Bond Service Fund to have sufficient assets available to meet debt service requirements on the next payment date; (2) maintain the Bond Service Reserve Fund equal in amount to the maximum annual debt service to be paid in any year; and (3) as long as any revenue bonds are outstanding, charge such rates, fees and charges for use of the airport system to produce in each year, together with other available funds, net revenues (as defined) at least equal to the greater of (a) 116% of the annual debt service due in such year on all outstanding revenue bonds and general obligation debt or (b) 125% of the annual debt service due in such year on all outstanding bonds.
From time to time, the Divisions have defeased certain Revenue Bonds by placing the proceeds of the new bonds in an irrevocable trust to provide for all future debt service payments on old bonds. However, at December 31, 2012 and 2011 there was no defeased debt outstanding.
The City has pledged future airport revenues to repay $863,930,000 in Airport System Revenue Bonds issued in various years since 2001. Proceeds from the bonds provided financing for airport facilities. The bonds are payable from airport revenues and are payable through 2033. Annual principal and interest payments on the bonds are expected to require less than 61% of net revenues. The total principal and interest remaining to be paid on the various airport system revenue bonds is $1,320,472,000. Principal and interest paid for the current year and total net revenues (including other available funds) were $50,051,000 and $83,175,000, respectively.
Effective February 23, 2012, the City issued $235,150,000 Airport System Revenue Bonds, Series 2012A. Proceeds of the bonds were used to refund the outstanding $249,445,000 Airport System Revenue Bonds, Series 2000A and to pay the costs of issuing the bonds. Net proceeds of the Series 2012A Bonds, amounts on hand in the Series 2000 interest account and an amount released from the debt service reserve fund totaling $252,378,809 were placed in an irrevocable escrow account to pay the principal and interest on the refunded bonds on March 26, 2012. As a result, the refunded bonds were defeased and the liability for the 2000A Bonds has been removed from long-term debt. The City completed the refunding in order to achieve debt service savings of approximately $25.1 million or an economic gain (the difference between the present values of the old and new debt service payments) of approximately $15.12 million or 6.06%.

CITY OF CLEVELAND, OHIO DEPARTMENT OF PORT CONTROL
DIVISIONS OF CLEVELAND HOPKINS INTERNATIONAL AND BURKE LAKEFRONT AIRPORTS
NOTES TO FINANCIAL STATEMENTS (Continued) For the Years Ended December 31, 2012 and 2011
34
NOTE B – LONG-TERM DEBT AND OTHER OBLIGATIONS (Continued)
In June 2011, the Airport System, under its rights to optional redemption, elected to deposit cash on hand into the Series 2008G Bond Fund and into the Series H Bond Fund sufficient to redeem, prior to maturity, all of the outstanding Series 2008G and Series 2008H Bonds. A notice of full redemption of the bonds was issued by the trustee on June 15, 2011. After taking into account the funds on hand in the respective bond funds, other available Airport funds were placed into the accounts to pay on June 22, 2011 principal in the amount of $7,425,000 on the Series 2008G Bonds and $430,000 on the Series 2008H Bonds, plus accrued interest to the redemption date. As a result, these bonds have been defeased and the liability for the bonds has been removed from long-term debt.
Effective November 16, 2011, the City issued $74,385,000 Airport System Revenue Bonds, Series 2011A (Non-AMT). Of this amount, $64,515,000 of the proceeds was issued to pay a portion of the costs of improvements to the Airport System, to fund deposits to the bond reserve fund and the Renewal and Replacement Fund and to pay issuance costs. The remaining $9,870,000 was used to currently refund a portion of the outstanding Airport System Revenue Bonds, Series 2008D in the aggregate principal amount of $9,200,000 on November 28, 2011 and to pay costs of issuing the bonds. As a result, the refunded bonds have been defeased and the liability for these bonds has been removed from long-term debt. The City obtained an economic gain (the difference between the present values of the old and new debt service payments) of approximately $1.67 million as a result of the refunding.
Interest Rate Swap Transactions: On November 2, 2011, the City, at its option, terminated the four interest rate exchange agreements originally entered into in 2003 and most recently identified as hedges for the Series 2008D Bonds and the Series 2009D Bonds. The City owed a payment to the counterparty, JP Morgan Chase Bank, National Association, under each hedge agreement in connection with the early terminations. Those termination payments totaled $10,515,000 and were paid on November 16, 2011 from available Airport funds. The City has no remaining interest rate swap agreements in place with respect to any Airport System Revenue Bonds.
NOTE C – SPECIAL FACILITY REVENUE BONDS
Airport Special Revenue Bonds, Series 1990, totaling $76,320,000 were issued to finance the acquisition and construction of a terminal, hangar and other support facilities of Continental Airlines at Cleveland Hopkins International Airport. These bonds were refunded in 1999 by the issuance of Airport Special Revenue Refunding Bonds, Series 1999, totaling $71,440,000. Airport Special Revenue Bonds, Series 1998, totaling $75,120,000 were issued in 1998 to finance the design and construction of certain airport facilities leased to Continental Airlines, including a new regional jet concourse. Because all principal and interest on these bonds is unconditionally
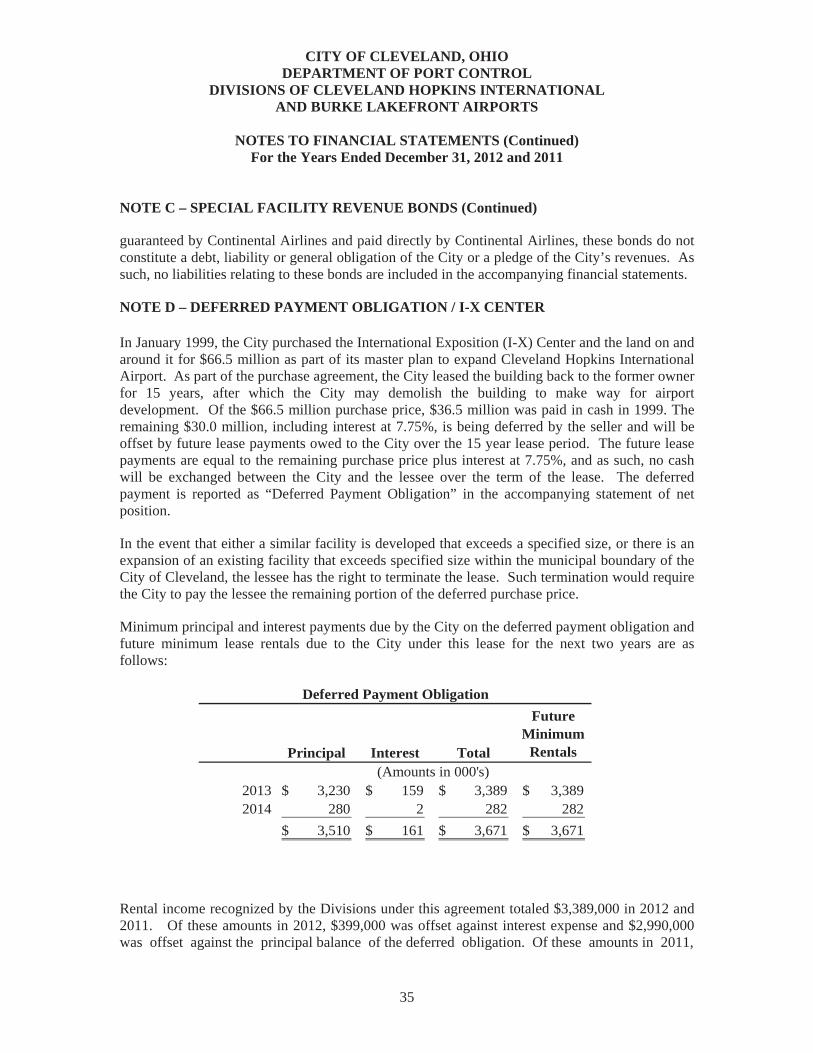
CITY OF CLEVELAND, OHIO DEPARTMENT OF PORT CONTROL
DIVISIONS OF CLEVELAND HOPKINS INTERNATIONAL AND BURKE LAKEFRONT AIRPORTS
NOTES TO FINANCIAL STATEMENTS (Continued) For the Years Ended December 31, 2012 and 2011
35
NOTE C – SPECIAL FACILITY REVENUE BONDS (Continued)
guaranteed by Continental Airlines and paid directly by Continental Airlines, these bonds do not constitute a debt, liability or general obligation of the City or a pledge of the City’s revenues. As such, no liabilities relating to these bonds are included in the accompanying financial statements.
NOTE D – DEFERRED PAYMENT OBLIGATION / I-X CENTER
In January 1999, the City purchased the International Exposition (I-X) Center and the land on and around it for $66.5 million as part of its master plan to expand Cleveland Hopkins International Airport. As part of the purchase agreement, the City leased the building back to the former owner for 15 years, after which the City may demolish the building to make way for airport development. Of the $66.5 million purchase price, $36.5 million was paid in cash in 1999. The remaining $30.0 million, including interest at 7.75%, is being deferred by the seller and will be offset by future lease payments owed to the City over the 15 year lease period. The future lease payments are equal to the remaining purchase price plus interest at 7.75%, and as such, no cash will be exchanged between the City and the lessee over the term of the lease. The deferred payment is reported as “Deferred Payment Obligation” in the accompanying statement of net position.
In the event that either a similar facility is developed that exceeds a specified size, or there is an expansion of an existing facility that exceeds specified size within the municipal boundary of the City of Cleveland, the lessee has the right to terminate the lease. Such termination would require the City to pay the lessee the remaining portion of the deferred purchase price.
Minimum principal and interest payments due by the City on the deferred payment obligation and future minimum lease rentals due to the City under this lease for the next two years are as follows:
Principal Interest Total
FutureMinimum
Rentals
2013 3,230$ 159$ 3,389$ 3,389$ 2014 280 2 282 282
3,510$ 161$ 3,671$ 3,671$
Deferred Payment Obligation
(Amounts in 000's)
Rental income recognized by the Divisions under this agreement totaled $3,389,000 in 2012 and 2011. Of these amounts in 2012, $399,000 was offset against interest expense and $2,990,000 was offset against the principal balance of the deferred obligation. Of these amounts in 2011,

CITY OF CLEVELAND, OHIO DEPARTMENT OF PORT CONTROL
DIVISIONS OF CLEVELAND HOPKINS INTERNATIONAL AND BURKE LAKEFRONT AIRPORTS
NOTES TO FINANCIAL STATEMENTS (Continued) For the Years Ended December 31, 2012 and 2011
36
NOTE D – DEFERRED PAYMENT OBLIGATION / I-X CENTER (Continued)
$621,000 was offset against interest expense and $2,768,000 was offset against the principal balance of the deferred obligation.
NOTE E – DEPOSITS AND INVESTMENTS
Deposits: The Divisions’ carrying amount of deposits at December 31, 2012 and 2011 totaled approximately $50,562,000 and $52,284,000, respectively, and the Divisions’ bank balance was approximately $53,754,000 and $60,243,000, respectively. The differences represent positions in pooled bank accounts and normal reconciling items. Based on the criteria described in GASB Statement No. 3, Deposits with Financial Institutions, Investments (including Repurchase Agreements) and Reverse Repurchase Agreements and GASB Statement No. 40, Deposit and Investment Risk Disclosures – an Amendment of GASB Statement No. 3, $53,754,000 and $60,243,000 of the bank balances at December 31, 2012 and 2011, respectively, were insured or collateralized with securities held by the City or by its agent in the City’s name.
Custodial credit risk for deposits is the risk that in the event of bank failure, the Divisions will not be able to recover deposits or collateral for securities that are in possession of an outside party. At year end, the Divisions’ deposits were fully insured or collateralized. All deposits are collateralized with eligible securities pledged and deposited either with the City or with a qualified trustee by the financial institution as security for repayment of all public monies deposited in the financial institution whose market value at all times is equal to at least 110% of the carrying value of the deposits being secured.
Investments: The City’s investment policies are governed by state statutes and City ordinances which authorize the City to invest in obligations of the U.S. Treasury, agencies and instrumentalities; State Treasurer Asset Reserve Fund (STAROhio); commercial paper; US Government Money Market Mutual Funds; guaranteed investment contracts; manuscript debt; bonds and other State of Ohio obligations; certificates of deposit; and repurchase transactions. Such repurchase transactions must be purchased from financial institutions or registered broker/dealers. Repurchase transactions are not to exceed a period of one year and confirmation of securities pledged must be obtained.
Generally, investments are recorded and are kept at the Federal Reserve Bank in the depository institutions’ separate custodial account for the City, apart from the assets of the depository institution. Ohio statutes prohibit the use of reverse repurchase agreements.
Investment securities are exposed to various risks such as interest rate, market and credit risk. Market values of securities fluctuate based on the magnitude of changing market conditions; significant changes in market conditions could materially affect portfolio value.

CITY OF CLEVELAND, OHIO DEPARTMENT OF PORT CONTROL
DIVISIONS OF CLEVELAND HOPKINS INTERNATIONAL AND BURKE LAKEFRONT AIRPORTS
NOTES TO FINANCIAL STATEMENTS (Continued) For the Years Ended December 31, 2012 and 2011
37
NOTE E – DEPOSITS AND INVESTMENTS (Continued)
Interest rate risk: As a means of limiting its exposure to fair value losses caused by rising interest rates, the Divisions invest primarily in short-term investments maturing within five years from the date of purchase. The intent is to avoid the need to sell securities prior to maturity. Investment maturities are disclosed in the table below.
Custodial Credit Risk: For an investment, custodial credit risk is the risk that, in the event of the failure of the counterparty, the Divisions will not be able to recover the value of the investments or collateral securities that are in the possession of an outside party.
Credit Risk: The Divisions’ investments as of December 31, 2012 and 2011 include U.S. Agencies, STAROhio and mutual funds. The Divisions maintain the highest ratings for their investments. Investments in STAROhio, Federated Government Obligations and Dreyfus Government Cash Management Mutual Funds carry a rating of AAAm, which is the highest money market fund rating given by Standard & Poor’s. Ohio law requires that STAROhio maintain the highest rating provided by at least one nationally recognized standard rating service.
Concentration of Credit Risk: The Divisions place a limitation on the amount that may be invested in any one issuer to help minimize the concentration of credit risk. The Divisions had the following investments at December 31, 2012 and 2011, which include those classified as cash and cash equivalents in the statement of net position in accordance with the provisions of GASB Statement No. 9 since they have a maturity of three months or less:
2012 2011 Investment MaturitiesType of Fair 2012 Fair 2011 Less thanInvestment Value Cost Value Cost One Year
U.S. Agency Obligations $ $ 79,687$ 79,602$ $STAROhio 84,113 84,113 66,444 66,444 84,113 Investment in Mutual Funds 245,609 245,609 177,332 177,332 245,609
Total Investments 329,722 329,722 323,463 323,378 329,722 Total Deposits 50,562 50,562 52,284 52,284 50,562
Total Deposits and Investments 380,284$ 380,284$ 375,747$ 375,662$ 380,284$
(Amount in 000's)
These amounts are monies invested by the City Treasurer on behalf of the Division and are used in daily operations with excess monies invested daily in STAROhio and mutual funds. These investments are carried at cost which approximates market value.

CITY OF CLEVELAND, OHIO DEPARTMENT OF PORT CONTROL
DIVISIONS OF CLEVELAND HOPKINS INTERNATIONAL AND BURKE LAKEFRONT AIRPORTS
NOTES TO FINANCIAL STATEMENTS (Continued) For the Years Ended December 31, 2012 and 2011
38
NOTE E – DEPOSITS AND INVESTMENTS (Continued)
As of December 31, 2012, the investments in STAROhio and mutual funds are approximately 26% and 74%, respectively, of the Divisions’ total investments. As of December 31, 2011, the investments in U.S. Agency Obligations, STAROhio and mutual funds are approximately 25%, 20% and 55%, respectively, of the Divisions’ total investments.
NOTE F – CAPITAL ASSETS
Capital Asset Activity: Capital Asset Activity for the year ended December 31, 2012 was as follows:
January 1, 2012 Additions Reductions
December 31, 2012
Capital Assets, not being depreciated: Land 167,457$ $ $ 167,457$ Construction in progress 36,246 19,434 (26,669) 29,011 Total capital assets, not being depreciated 203,703 19,434 (26,669) 196,468
Capital assets, being depreciated: Land improvements 74,153 74,153 Buildings, structures and improvements 329,324 5,339 (421) 334,242 Furniture, fixtures and equipment 23,305 6,470 (607) 29,168 Infrastructure 956,696 19,105 975,801 Vehicles 14,993 162 (504) 14,651
Total capital assets, being depreciated 1,398,471 31,076 (1,532) 1,428,015Less: Total accumulated depreciation (680,397) (50,541) 1,473 (729,465)Total capital assets being depreciated, net 718,074 (19,465) (59) 698,550
Capital assets, net 921,777$ (31)$ (26,728)$ 895,018$
(Amounts in 000's)

CITY OF CLEVELAND, OHIO DEPARTMENT OF PORT CONTROL
DIVISIONS OF CLEVELAND HOPKINS INTERNATIONAL AND BURKE LAKEFRONT AIRPORTS
NOTES TO FINANCIAL STATEMENTS (Continued) For the Years Ended December 31, 2012 and 2011
39
NOTE F – CAPITAL ASSETS (Continued)
Capital Asset Activity: Capital Asset Activity for the year ended December 31, 2011 was as follows:
January 1, 2011 Additions Reductions
December 31, 2011
Capital Assets, not being depreciated: Land 167,457$ $ $ 167,457$ Construction in progress 16,815 19,431 36,246 Total capital assets, not being depreciated 184,272 19,431 - 203,703
Capital assets, being depreciated: Land improvements 72,568 1,585 74,153 Buildings, structures and improvements 328,738 586 329,324 Furniture, fixtures and equipment 22,815 490 23,305 Infrastructure 910,907 45,789 956,696 Vehicles 13,830 1,163 14,993
Total capital assets, being depreciated 1,348,858 49,613 - 1,398,471 Less: Total accumulated depreciation (632,622) (47,775) (680,397)
Total capital assets being depreciated, net 716,236 1,838 - 718,074
Capital assets, net 900,508$ 21,269$ -$ 921,777$
(Amounts in 000's)
Commitments: As of December 31, 2012 and 2011, the Divisions had capital expenditure purchase commitments outstanding of approximately $59,877,000 and $37,136,000, respectively.
NOTE G – LEASES AND CONCESSIONS
The Divisions lease specific terminal and concourse areas to the various airlines under terms and conditions of the airline use agreements. These agreements remain in effect until December 31, 2015 and under the terms of the agreements, rental payments and landing fees paid by the airlines are adjusted annually to provide airport revenues sufficient to meet the financial requirements of the airport system. Other areas are leased to various occupants under separate agreements.
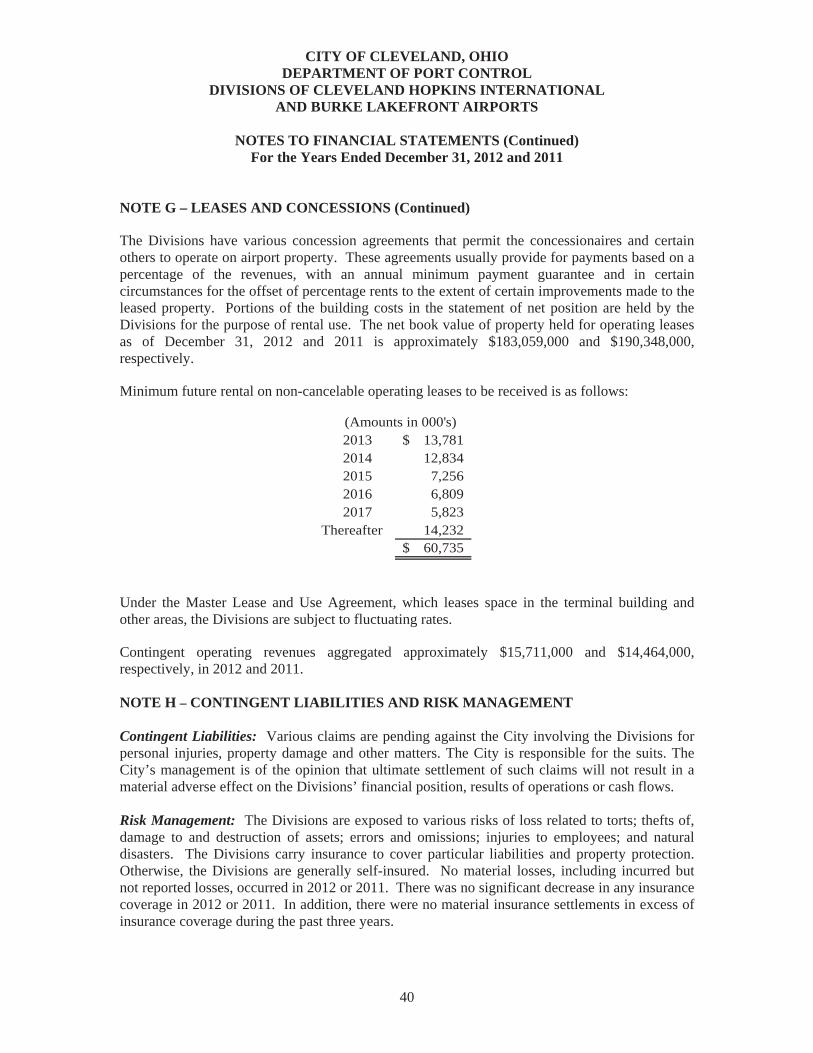
CITY OF CLEVELAND, OHIO DEPARTMENT OF PORT CONTROL
DIVISIONS OF CLEVELAND HOPKINS INTERNATIONAL AND BURKE LAKEFRONT AIRPORTS
NOTES TO FINANCIAL STATEMENTS (Continued) For the Years Ended December 31, 2012 and 2011
40
NOTE G – LEASES AND CONCESSIONS (Continued)
The Divisions have various concession agreements that permit the concessionaires and certain others to operate on airport property. These agreements usually provide for payments based on a percentage of the revenues, with an annual minimum payment guarantee and in certain circumstances for the offset of percentage rents to the extent of certain improvements made to the leased property. Portions of the building costs in the statement of net position are held by the Divisions for the purpose of rental use. The net book value of property held for operating leases as of December 31, 2012 and 2011 is approximately $183,059,000 and $190,348,000, respectively.
Minimum future rental on non-cancelable operating leases to be received is as follows:
2013 13,781$ 2014 12,834 2015 7,256 2016 6,809 2017 5,823
Thereafter 14,232 60,735$
(Amounts in 000's)
Under the Master Lease and Use Agreement, which leases space in the terminal building and other areas, the Divisions are subject to fluctuating rates.
Contingent operating revenues aggregated approximately $15,711,000 and $14,464,000, respectively, in 2012 and 2011.
NOTE H – CONTINGENT LIABILITIES AND RISK MANAGEMENT
Contingent Liabilities: Various claims are pending against the City involving the Divisions for personal injuries, property damage and other matters. The City is responsible for the suits. The City’s management is of the opinion that ultimate settlement of such claims will not result in a material adverse effect on the Divisions’ financial position, results of operations or cash flows.
Risk Management: The Divisions are exposed to various risks of loss related to torts; thefts of, damage to and destruction of assets; errors and omissions; injuries to employees; and natural disasters. The Divisions carry insurance to cover particular liabilities and property protection. Otherwise, the Divisions are generally self-insured. No material losses, including incurred but not reported losses, occurred in 2012 or 2011. There was no significant decrease in any insurance coverage in 2012 or 2011. In addition, there were no material insurance settlements in excess of insurance coverage during the past three years.

CITY OF CLEVELAND, OHIO DEPARTMENT OF PORT CONTROL
DIVISIONS OF CLEVELAND HOPKINS INTERNATIONAL AND BURKE LAKEFRONT AIRPORTS
NOTES TO FINANCIAL STATEMENTS (Continued) For the Years Ended December 31, 2012 and 2011
41
NOTE H – CONTINGENT LIABILITIES AND RISK MANAGEMENT (Continued)
The City provides the choice of four separate health insurance plans for its employees. These plans are provided by two different insurers through commercial insurance. Operating funds are charged a monthly rate per employee, by type of coverage. The City participates in the State of Ohio workers’ compensation retrospective rating program.
In accordance with GASB Statement No. 10, claims liabilities are reported when it is probable that a loss has occurred and the amount of the loss can be reasonably estimated. Liabilities include an amount for claims that have been incurred but not reported. The result of the process to estimate the claims liability is not an exact amount as it depends on many complex factors, such as inflation, changes in legal doctrines and damage awards. Accordingly, claims are re-evaluated periodically to consider the effects of inflation, recent claim settlement trends (including frequency and amount of pay-outs), and other economic and social factors. The estimate of the claims liability also includes amounts for incremental claim adjustment expenses related to specific claims and other claim adjustment expenses, regardless of whether allocated to specific claims. Estimated recoveries, for example from salvage or subrogation, are another component of the claims liability estimate. Claims payable has been included with accounts payable and is considered to be immaterial for the Divisions.
NOTE I – DEFINED BENEFIT PENSION PLAN
Ohio Public Employees Retirement System: All full-time employees, other than non-administrative full-time police officers and firefighters, participate in the Ohio Public Employees Retirement System (OPERS). OPERS administers three separate pension plans as described below:
1) The Traditional Pension Plan – a cost-sharing, multiple-employer defined benefit pension plan.
2) The Member-Directed Plan – a defined contribution plan in which the member invests both member and employer contributions (employer contributions vest over five years at 20% per year). Under the Member-Directed Plan, members accumulate retirement assets equal to the value of member and (vested) employer contributions plus any investment earnings.
3) The Combined Plan – a cost-sharing, multiple-employer defined benefit pension plan. Under the Combined Plan, OPERS invests employer contributions to provide a formula retirement benefit similar in nature to the Traditional Pension Plan benefit. Member contributions, the investment of which is self-directed by the members, accumulate retirement assets in a manner similar to the Member-Directed Plan.
CITY OF CLEVELAND, OHIO DEPARTMENT OF PORT CONTROL
DIVISIONS OF CLEVELAND HOPKINS INTERNATIONAL AND BURKE LAKEFRONT AIRPORTS
NOTES TO FINANCIAL STATEMENTS (Continued) For the Years Ended December 31, 2012 and 2011
42
NOTE I – DEFINED BENEFIT PENSION PLAN (Continued)
OPERS provides retirement, disability, survivor and death benefits and annual cost-of-living adjustments to members of the Traditional Pension and Combined Plans. Members of the Member-Directed Plan do not qualify for ancillary benefits. Authority to establish and amend benefits is provided in Chapter 145 of the Ohio Revised Code. OPERS issues a stand-alone financial report. Interested parties may obtain a copy by visiting https://www.opers.org/investments/cafr.shtml, writing to OPERS, 277 East Town Street, Columbus, Ohio 43215-4642, or by calling (614) 222-5601 or (800) 222-7377.
The Ohio Revised Code provides statutory authority for member and employer contributions. For 2012, member and employer contribution rates were consistent across all three plans. Member contribution rates were 10.00% in 2012, 2011 and 2010. The employer contribution rates were 14.00% of covered payroll in 2012, 2011 and 2010.
The Divisions’ required employer contributions to OPERS for the pension portion of all the plans for the years ending December 31, 2012, 2011 and 2010 were $2,095,000, $2,048,000 and $1,918,000 each year, respectively. The required payments due in 2012, 2011 and 2010 have been made.
In June 2012, the Governmental Accounting Standards Board (GASB) issued GASB Statement No. 68, Accounting and Financial Reporting for Pensions. This accounting standard replaces GASB Statement No. 27, and it is effective for employer fiscal years beginning after June 15, 2014.
NOTE J – OTHER POSTEMPLOYMENT BENEFITS
Ohio Public Employees Retirement System: All full-time employees, other than non-administrative full-time police officers and firefighters, participate in the Ohio Public Employees Retirement System (OPERS). OPERS administers three separate pension plans: The Traditional Pension Plan – a cost-sharing, multiple-employer defined benefit pension plan; the Member-Directed Plan – a defined contribution plan; and the Combined Plan – a cost-sharing, multiple-employer defined benefit pension plan that has elements of both a defined benefit and defined contribution plan. OPERS maintains a cost-sharing multiple employer defined benefit postemployment health care plan, which includes a medical plan, prescription drug program and Medicare Part B premium reimbursement, to qualifying members of both the Traditional Pension and the Combined Plans. Members of the Member-Directed Plan do not qualify for ancillary benefits, including postemployment health care coverage. In order to qualify for postemployment health care coverage, age-and-service retirees under the Traditional Pension and Combined Plans must have 10 or more years of qualifying Ohio service credit. Health care coverage for disability benefit recipients and qualified survivor benefit recipients is available. The health care coverage provided by OPERS meets the definition of an Other Postemployment Benefit (OPEB) as described in GASB Statement No. 45. The Ohio Revised Code permits, but does not mandate, OPERS to provide OPEB benefits to its eligible members and beneficiaries. Authority to establish and amend benefits is provided in Chapter 145 of the Ohio Revised Code. OPERS issues a stand-

CITY OF CLEVELAND, OHIO DEPARTMENT OF PORT CONTROL
DIVISIONS OF CLEVELAND HOPKINS INTERNATIONAL AND BURKE LAKEFRONT AIRPORTS
NOTES TO FINANCIAL STATEMENTS (Continued) For the Years Ended December 31, 2012 and 2011
43
NOTE J – OTHER POSTEMPLOYMENT BENEFITS (Continued)
alone financial report. Interested parties may obtain a copy by visiting https://www.opers.org/investments/cafr.shtml, writing to OPERS, 277 East Town Street, Columbus, Ohio 43215-4642, or by calling (614) 222-5601 or (800) 222-7377.
The Ohio Revised Code provides the statutory authority requiring public employers to fund post-retirement health care through their contributions to OPERS. A portion of each employer’s contribution to OPERS is set aside for funding of post-retirement health care benefits. Employer contribution rates are expressed as a percentage of the covered payroll of active members. The employer contribution rates were 14.00% of covered payroll in 2012, 2011 and 2010. The Ohio Revised Code currently limits the employer contribution to a rate not to exceed 14.00% of covered payroll. Active members do not make contributions to the OPEB Plan. OPERS’ Postemployment Health Care plan was established under and is administrated in accordance with, Internal Revenue Code 401(h). Each year, the OPERS Retirement Board determines the portion of the employer contribution rate that will be set aside for funding of postemployment health care benefits. Employer contribution rates used to fund postemployment benefits were 4.00% for members of the Traditional Plan in 2012 and 2011, 6.05% for members of the Combined Plan in 2012 and 2011 and 5.50% from January 1, 2010 through February 28, 2010 and 5.00% from March 1, 2010 through December 31, 2010 for both plans. Effective January 1, 2013, the portion of employer contributions allocated to health care was lowered to 1.00% for both plans, as recommended by the OPERS Actuary. The OPERS Retirement Board is also authorized to establish rules for the payment of a portion of the health care benefits provided, by the retiree or their surviving beneficiaries. Payment amounts vary depending on the number of covered dependents and the coverage selected. The Divisions’ actual contributions to OPERS to fund postemployment benefits were $838,000 in 2012, $819,000 in 2011 and $1,093,000 in 2010. The required payments due in 2012, 2011 and 2010 have been made.
Changes to the health care plan were adopted by the OPERS Board of Trustees on September 19, 2012, with a transition plan commencing January 1, 2014. With the recent passage of pension legislation under SB343 and the approved health care changes, OPERS expects to be able to consistently allocate 4.00% of the employer contributions toward the health care fund after the end of the transition period.

CITY OF CLEVELAND, OHIO DEPARTMENT OF PORT CONTROL
DIVISIONS OF CLEVELAND HOPKINS INTERNATIONAL AND BURKE LAKEFRONT AIRPORTS
NOTES TO FINANCIAL STATEMENTS (Continued) For the Years Ended December 31, 2012 and 2011
44
NOTE K – RELATED PARTY TRANSACTIONS
The Divisions are provided various intra-city services. Charges are based on actual use or on a reasonable pro-rata basis. The more significant costs for the years ended December 31, 2012 and 2011 were as follows:
2012 2011
City Central Services, including police 8,306$ 8,218$Electricity purchased 239 243Motor vehicle maintenance 577 654
(Amounts in 000's)
NOTE L – LANDING FEE ADJUSTMENT AND INCENTIVE COMPENSATION
Under the terms of the airline use agreements, if the annual statement for the preceding term demonstrates that airport revenues over expenses (both as defined) is greater or less than that used in calculating the landing fee for the then current term, such difference shall be charged or credited to the airlines over the remaining billing periods in the current term. The landing fee adjustment for 2012 was payable to the Airlines from the City in the amount of $300,000. The landing fee adjustment for 2011 was payable to the City from the Airlines in the amount of $3,850,000.
The airline use agreements also provide an incentive for the City to provide the highest quality management for the airport system. There was no incentive compensation expense in 2012 and 2011.
NOTE M – PASSENGER FACILITY CHARGES
On November 1, 1992, Cleveland Hopkins International Airport began collecting Passenger Facility Charges (PFC’s) subject to title 14, Code of Federal Regulations, Part 158. PFC’s are fees imposed on passengers enplaned by public agencies controlling commercial service airports for the strict purpose of supporting airport planning and development projects. The charge is collected by the airlines and remitted to the airport operator net of an administrative fee to be retained by the airline and refunds to passengers.
As of December 31, 2012, Cleveland Hopkins International Airport had the authority from the Federal Aviation Administration to collect approximately $556 million, of which an estimated 15.1% will be spent on noise abatement for the residents of communities surrounding the airport, 56.3% on runway expansion and 28.6% on airport development. PFC revenues and related interest earnings are recorded as non-operating revenues and non-capitalized expenses funded by PFC revenues are recorded as non-operating expenses.

CITY OF CLEVELAND, OHIO DEPARTMENT OF PORT CONTROL
DIVISIONS OF CLEVELAND HOPKINS INTERNATIONAL AND BURKE LAKEFRONT AIRPORTS
NOTES TO FINANCIAL STATEMENTS (Continued) For the Years Ended December 31, 2012 and 2011
45
NOTE N – MAJOR CUSTOMER
In 2012 and 2011, operating revenues from one airline group for landing fees, rental and other charges amounted to approximately 45% and 45% respectively, of total operating revenue.
NOTE O – SUBSEQUENT EVENTS
On February 13, 2013, American Airlines and US Airways announced a proposed merger agreement with the “new” American Airlines remaining as the largest airline in the world. Although this business combination is not expected to occur before the end of 2013, looking towards the future, there will likely be an impact on the Divisions’ operations. Both airlines expect that the regional carriers they own – AMR Corporation’s American Eagle and US Airways’ Piedmont and PSA – will continue to operate as distinct entities, providing seamless service to the combined airline. American Airlines and US Airways enplaned 5.6% and 4.3% of total passengers at the Airport, respectively, in 2012. It is not known at this time whether the impact will have a negative or positive effect on CLE.
Federal Sequestration has had a direct impact on Cleveland Airport System (CAS) federally-funded projects such as the CLE Airport Surface Surveillance Capability (ASSC) Project currently placed on hold. In addition, CAS has been advised by the FAA Airport District Office that there is no funding for an Environmental Assessment (EA) of the CLE airfield due to Sequestration. The EA would have focused on specific areas of the airfield that require either rehabilitation (due to age and deterioration) and/or are planned for development. Long-term, not being able to implement the aforementioned projects due to Sequestration may compromise airfield system preservation (i.e., ability to improve existing infrastructure), airfield capacity, safety and funding for future AIP-eligible projects.
Effective April 24, 2013, the City issued $58,000,000 Airport System Revenue Bonds, Series 2013A (Taxable). These bonds refunded all of the outstanding $58,000,000 Airport System Revenue Bonds, Series 2008F in anticipation of the expiration of the existing letter of credit. The bonds were purchased by U.S. Bank National Association with the City paying an amount equal to one month LIBOR plus a spread of 105 basis points. As a result of this refunding, the City will realize aggregate net present value savings of $3.4 million or 5.87%.

CITY OF CLEVELAND, OHIO DEPARTMENT OF PORT CONTROL
DIVISIONS OF CLEVELAND HOPKINS INTERNATIONAL AND BURKE LAKEFRONT AIRPORTS
SCHEDULE OF AIRPORT REVENUES AND OPERATING EXPENSES AS DEFINED IN THE AIRLINE USE AGREEMENTS
For the Year Ended December 31, 2012
46
ClevelandHopkins Burke
International Lakefront Total(Amounts in 000's)
REVENUEAirline revenue:
Landing fees 34,923$ $ 34,923$Terminal rental 36,280 36,280Other 3,663 3,663
74,866 - 74,866
Operating revenues fromother sources:
Concessions 21,582$ 378$ 21,960$Rentals 10,247 308 10,555Landing fees 1,646 107 1,753Other 4,062 109 4,171
37,537 902 38,439
Non-operating revenue:Interest income 90 90
TOTAL REVENUE 112,493$ 902$ 113,395$
OPERATING EXPENSESSalaries and wages 20,211$ 1,038$ 21,249$Employee benefits 7,535 423 7,958City Central Services, including police 8,606 265 8,871Materials and supplies 7,855 343 8,198Contractual services 22,397 182 22,579
TOTAL OPERATING EXPENSES 66,604$ 2,251$ 68,855$

one east fourth street, ste. 1200cincinnati, oh 45202
www.cshco.comp. 513.241.3111f. 513.241.1212
cincinnati | columbus | dayton | middletown | springfield
REPORT ON COMPLIANCE WITH REQUIREMENTS THAT COULD HAVE A DIRECT AND MATERIAL EFFECT ON THE PASSENGER FACILITY CHARGE PROGRAM; REPORT ONINTERNAL CONTROL OVER COMPLIANCE; AND REPORT ON SCHEDULE OF EXPENDITURES OF PASSENGER FACILITY CHARGES IN ACCORDANCE WITH 14 CFR PART 158
INDEPENDENT AUDITORS’ REPORT
To the Honorable Frank G. Jackson, Mayor, Members of Council and the Audit CommitteeDivisions of Cleveland Hopkins International and Burke Lakefront AirportsDepartment of Port ControlCity of Cleveland, Ohio:
Report on Compliance for the Passenger Facility Charge Program
We have audited the Divisions’ of Cleveland Hopkins International and Burke Lakefront Airports, Department of Port Control, City of Cleveland, Ohio (the “Divisions”) compliance with the types ofcompliance requirements described in the Passenger Facility Charge Audit Guide for Public Agencies, issued by the Federal Aviation Administration (the “Guide”), for its passenger facility charge program for the year ended December 31, 2012.
Management’s ResponsibilityManagement is responsible for compliance with the compliance requirements applicable to the passenger facility charge program.
Auditors’ ResponsibilityOur responsibility is to express an opinion on compliance with the passenger facility charge program based on our audit of the compliance requirements referred to above. We conducted our audit of compliance in accordance with auditing standards generally accepted in the United States of America; the standards applicable to financial audits contained in Government Auditing Standards issued by the Comptroller General of the United States; and the Guide. Those standards and the Guide require that we plan and perform the audit to obtain reasonable assurance about whether noncompliance with the types of compliance requirements referred to above that could have a direct and material effect on the passenger facility charge program occurred. An audit includes examining, on a test basis, evidence about the Divisions’ compliance with those requirements and performing such other procedures as we considered necessary in the circumstances.
We believe that our audit provides a reasonable basis for our opinion on compliance for the passenger facility charge program. However, our audit does not provide a legal determination of the Divisions’ compliance.
Opinion on the Passenger Facility Charge ProgramIn our opinion, the Divisions of Cleveland Hopkins International and Burke Lakefront Airports,Department of Port Control, City of Cleveland, Ohio complied, in all material respects, with the compliance requirements referred to above that could have a direct and material effect on its passenger facility charge program for the year ended December 31, 2012.
47

Report on Internal Control Over Compliance
Management of the Divisions is responsible for establishing and maintaining effective internal control over compliance with the requirements of laws and regulations applicable to the passenger facility charge program. In planning and performing our audit of compliance, we considered the Divisions’ internal control over compliance with the requirements that could have a direct and material effect on the passenger facility charge program to determine the auditing procedures that are appropriate in the circumstances for the purpose of expressing an opinion on compliance and to test and report on internal control over compliance in accordance with the Guide, but not for the purpose of expressing an opinion on the effectiveness of internal control over compliance. Accordingly, we do not express an opinion on the effectiveness of the Divisions’ internal control over compliance.
A deficiency in internal control over compliance exists when the design or operation of a control over compliance does not allow management or employees, in the normal course of performing their assigned functions, to prevent, or detect and correct, noncompliance with a type of compliance requirement of the passenger facility charge program on a timely basis. A material weakness in internal control over compliance is a deficiency, or combination of deficiencies, in internal control over compliance, such that there is a reasonable possibility that material noncompliance with a type of compliance requirement of the passenger facility charge program will not be prevented, or detected and corrected, on a timely basis. A significant deficiency in internal control over compliance is a deficiency, or a combination of deficiencies, in internal control over compliance with a type of compliance requirement of the passenger facility charge program that is less severe than a material weakness in internal control over compliance, yet important enough to merit attention by those charged with governance.
Our consideration of internal control over compliance was for the limited purpose described in the first paragraph of this section and was not designed to identify all deficiencies in internal control over compliance that might be material weaknesses or significant deficiencies. We did not identify any deficiencies in internal control over compliance that we consider to be material weaknesses. However, material weaknesses may exist that have not been identified.
The purpose of this report on internal control over compliance is solely to describe the scope of our testing of internal control over compliance and the results of that testing based on the requirements of the Guide. Accordingly, this report is not suitable for any other purpose.
Report on Schedule of Expenditures of Passenger Facility Charges
We have audited the financial statements of the Divisions as of and for the year ended December 31, 2012, and have issued our report thereon dated June 25, 2013, which contained an unmodified opinion on those financial statements. Our audit was conducted for the purpose of forming an opinion on the Divisions’ basic financial statements. The accompanying schedule of expenditures of passenger facility charges is presented for purposes of additional analysis as required by the Guide and is not a required part of the basic financial statements as a whole. Such information is the responsibility of management and was derived from and relates directly to the underlying accounting and other records used to prepare the financial statements. The information has been subjected to the auditing procedures applied in the audit of the financial statements and certain additional procedures, including comparing and reconciling such information directly to the underlying accounting and other records used to prepare the financial statements or to the financial statements themselves, and other additional procedures in accordance with auditing standards generally accepted in the United States of America. In our opinion, the schedule of expenditures of passenger facility charges is fairly stated in all material respects in relation to the Divisions’ basic financial statements taken as a whole.
CClark, Schaefer, Hackett & Co.Cincinnati, OhioJune 25, 2013
48

App
rove
d C
umul
ativ
e 20
1220
1220
1220
1220
12C
umul
ativ
eP
roje
ctE
xpen
ditu
res
1st Q
uarte
r2n
d Q
uarte
r3r
d Q
uarte
r4t
h Q
uarte
rYT
DE
xpen
ditu
res
Pro
ject
sB
udge
t20
11E
xpen
ditu
res
Exp
endi
ture
sE
xpen
ditu
res
Exp
endi
ture
sE
xpen
ditu
res
thro
ugh
2012
Insu
late
Res
iden
ces
- Ful
l Pro
gram
Pha
se I
16,9
60,4
00$
16,9
60,4
00$
$$
$$
-$
16,9
60,4
00$
Ext
ensi
on o
f Tax
iwa y
"Q"
2,15
5,74
32,
155,
743
-
2,
155,
743
Land
Acq
uisi
tion-
Res
iden
t Rel
ocat
ion
14,6
89,4
5914
,689
,459
-
14
,689
,459
Asb
esto
s R
emov
al in
Ter
min
al C
HIA
729,
842
72
9,84
2-
729,
842
Acq
uisi
tion
of A
nale
x O
ffice
Bld
g &
Vac
ant L
and
13,0
25,0
0013
,025
,000
-
13
,025
,000
Was
te W
ater
- G
l yco
l Col
lect
ion
Sys
tem
Con
stru
ctio
n5,
835,
921
5,83
5,92
1-
5,83
5,92
1N
AS
A F
easi
bilit
y &
Pre
-Eng
inee
ring
Stu
dy35
5,00
0
355,
000
-
35
5,00
0S
ewer
s fo
r Con
fined
Dis
posa
l Fac
ility-
BK
L (a
pp 1
)5,
500,
000
5,50
0,00
0-
5,50
0,00
0S
ound
Insu
latio
n8,
595,
641
8,59
5,64
1-
8,59
5,64
1La
nd A
cqui
sitio
n - M
idva
le, B
r ysd
ale,
For
estw
ood,
Roc
ky R
iver
25,2
82,2
9825
,282
,298
-
25
,282
,298
Env
ironm
enta
l Ass
essm
ent /
Impa
ct S
tudi
es1,
725,
000
1,72
5,00
0-
1,72
5,00
0P
art 1
50 N
oise
Com
patib
ility
Pro
gram
Upd
ate
584,
570
584,
570
-58
4,57
0B
rook
Par
k La
nd T
rans
fer
8,75
0,00
08,
750,
000
-
8,
750,
000
Ana
lex
Dem
oliti
on1,
229,
000
890,
914
38,4
79
38,4
79
929,
393
Sou
nd In
sula
tion
20,0
00,0
0020
,000
,000
-
20
,000
,000
Ba g
gage
Cla
im/E
xpan
sion
9,52
6,08
7
9,
526,
087
-
9,
526,
087
Tug
Roa
d R
epla
cem
ent
1,01
9,00
0
66
8,55
3-
668,
553
Inte
rim C
omm
uter
Ram
p5,
560,
338
5,02
2,51
861
,211
61,2
115,
083,
729
Con
cour
se D
Ram
p/S
ite U
tiliti
es51
,305
,804
46,3
46,4
1356
4,44
756
4,44
746
,910
,860
Bur
ke R
unw
a y O
verla
y 6L
/24R
530,
286
53
0,28
6-
530,
286
Bur
ke IL
S2,
181,
400
1,72
5,26
251
,914
51,9
141,
777,
176
Run
wa y
6L/
23R
270,
550,
360
11
5,97
3,56
117
,592
,948
17
,592
,948
13
3,56
6,50
9R
unw
a y 6
R/2
4L U
ncou
plin
g2,
148,
000
2,14
8,00
0-
2,14
8,00
0R
unw
a y 2
8 S
afet
y Im
prov
emen
ts2,
200,
000
2,01
0,45
4-
2,01
0,45
4M
idfie
ld D
eici
n g P
ad39
,100
,000
39,1
00,0
00-
39,1
00,0
00Ta
xiw
a y M
Impr
ovem
ents
10,0
00,0
00
9,
579,
060
-
9,
579,
060
Doa
n B
rook
Res
tora
tion
870,
000
--
Dei
cin g
Env
ironm
enta
l Upg
rade
s1,
410,
000
-
-
Mai
n Te
rmin
al R
oof R
epla
cem
ent
500,
000
--
Mai
n Te
rmin
al B
oile
r Rep
lace
men
t1,
510,
000
--
Roa
dwa y
Exp
ansi
on J
oint
Rep
air/R
epla
cem
ent
1,00
0,00
0-
-A
irpor
t-wid
e Fl
ight
Info
rmat
ion
Dis
play
Sys
tem
(FID
S)/B
agga
ge In
form
atio
n D
ispl
ay S
yste
m (B
IDS
) 3,
868,
000
-
-
Airp
ort-w
ide
In-li
ne B
agga
ge S
yste
m D
esig
n85
0,00
0-
-A
irpor
t Mas
ter P
lan
Upd
ate
2,10
0,00
0-
-R
unw
a y 1
0/28
- Run
way
Saf
ety
Are
a Im
porv
emen
ts11
,659
,300
6,79
4,42
079
,049
120,
877
95,3
6229
5,28
87,
089,
708
Sou
th C
argo
Ram
p R
ehab
ilitat
ion
3,00
0,00
0-
-Ta
xiw
a y N
Reh
abilit
atio
n4,
400,
000
-
-
SID
A S
ecur
it y S
yste
m E
nhan
cem
ents
1,00
0,00
0-
-In
tera
ctiv
e P
art 1
39 A
irpor
t Ope
ratio
ns T
rain
ing
Pro
gram
250,
000
--
Mai
n S
ubst
atio
n (M
S1
& M
S2)
Red
unda
nt E
lect
rical
Pow
er F
eed
& E
mer
genc
y G
ener
ator
s4,
160,
000
- -
T
otal
55
6,11
6,44
9$
36
4,50
4,40
2$
79
,049
$
120,
877
$
-
$
18
,404
,361
$
18
,604
,287
$
38
3,10
8,68
9$
City
of C
leve
land
- D
epar
tmen
t of P
ort C
ontr
olC
leve
land
Hop
kins
Inte
rnat
iona
l Airp
ort
Sche
dule
of E
xpen
ditu
res
of P
asse
nger
Fac
ility
Cha
rges
For t
he P
erio
d En
ding
Dec
embe
r 31,
201
2
49

CITY OF CLEVELAND, OHIO DEPARTMENT OF PORT CONTROL
DIVISIONS OF CLEVELAND HOPKINS INTERNATIONAL AND BURKE LAKEFRONT AIRPORTS
NOTES TO SCHEDULE OF EXPENDITURES OF PASSENGER FACILITY CHARGES For the Year Ended December 31, 2012
50
GENERAL
The accompanying schedule presents all activity of the Airport’s Passenger Facility Charge (PFC) program. The Airport’s reporting entity is defined in Note A – Summary of Significant Accounting Policies to the Airports’ financial statement.
BASIS OF PRESENTATION
The accompanying schedule is presented on the cash basis of accounting.

CITY OF CLEVELAND, OHIO
DEPARTMENT OF PUBLIC UTILITIES DIVISION OF CLEVELAND PUBLIC POWER
REPORT ON AUDITS OF FINANCIAL STATEMENTS For the years ended December 31, 2012 and 2011
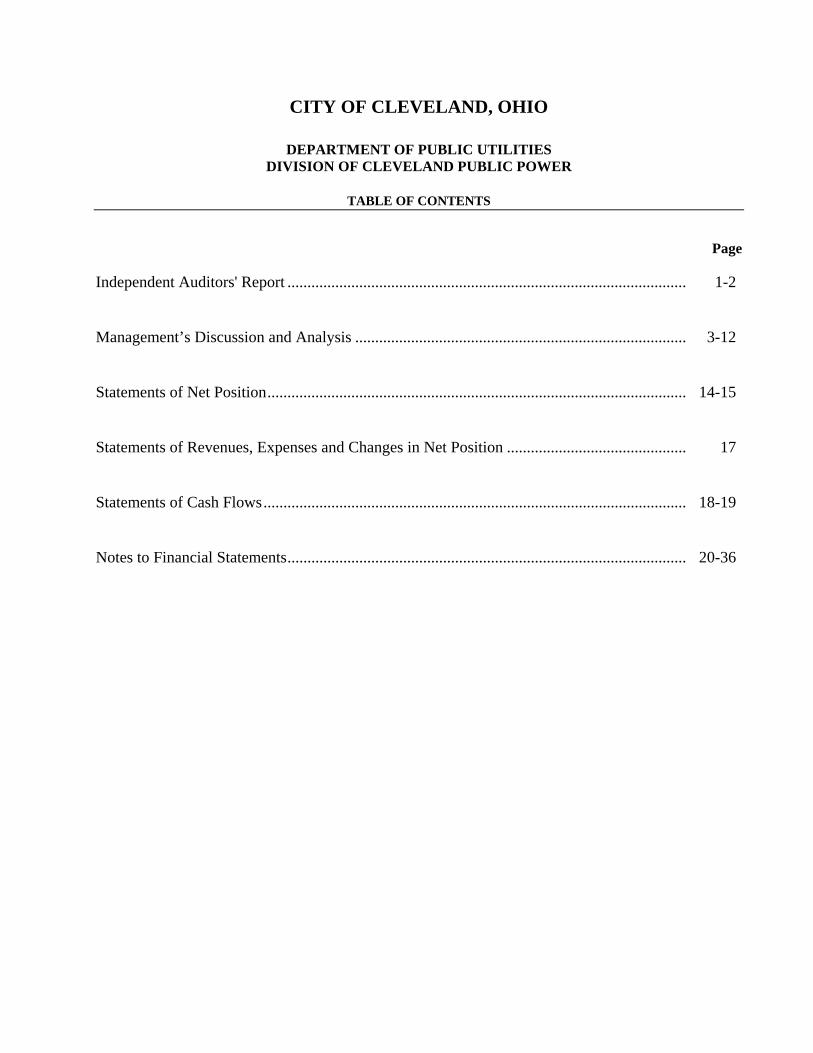
CITY OF CLEVELAND, OHIO
DEPARTMENT OF PUBLIC UTILITIES DIVISION OF CLEVELAND PUBLIC POWER
TABLE OF CONTENTS
Page
Independent Auditors' Report .................................................................................................... 1-2 Management’s Discussion and Analysis ................................................................................... 3-12 Statements of Net Position......................................................................................................... 14-15 Statements of Revenues, Expenses and Changes in Net Position ............................................. 17 Statements of Cash Flows.......................................................................................................... 18-19 Notes to Financial Statements.................................................................................................... 20-36

one east fourth street, ste. 1200
cincinnati, oh 45202
www.cshco.com
p. 513.241.3111
f. 513.241.1212
cincinnati | cleveland | columbus | miami valley | springfield | toledo
INDEPENDENT AUDITORS’ REPORT
To the Honorable Frank G. Jackson, Mayor, Members of Council and the Audit CommitteeDivision of Cleveland Public PowerDepartment of Public UtilitiesCity of Cleveland, Ohio:
Report on the Financial Statements
We have audited the accompanying financial statements of the Division of Cleveland Public Power, Department of Public Utilities, City of Cleveland, Ohio (the “Division”) as of and for the years ended December 31, 2012 and 2011 and the related notes to the financial statements, as listed in the table of contents.
Management’s Responsibility for the Financial Statements
Management is responsible for the preparation and fair presentation of these financial statements in accordance with accounting principles generally accepted in the United States of America; this includes the design, implementation, and maintenance of internal control relevant to the preparation and fair presentation of financial statements that are free from material misstatement, whether due to fraud or error.
Auditors’ Responsibility
Our responsibility is to express an opinion on these financial statements based on our audits. We conducted our audits in accordance with auditing standards generally accepted in the United States of America and the standards applicable to financial audits contained in Government Auditing Standards, issued by the Comptroller General of the United States. Those standards require that we plan and perform the audit to obtain reasonable assurance about whether the financial statements are free from material misstatement.
An audit involves performing procedures to obtain audit evidence about the amounts and disclosures in the financial statements. The procedures selected depend on the auditors’ judgment, including the assessment of the risks of material misstatement of the financial statements, whether due to fraud or error. In making those risk assessments, the auditor considers internal control relevant to the entity’s preparation and fair presentation of the financial statements in order to design audit procedures that are appropriate in the circumstances, but not for the purpose of expressing an opinion on the effectiveness of the entity’s internal control. Accordingly, we express no such opinion. An audit also includes evaluating the appropriateness of accounting policies used and the reasonableness of significant accounting estimates made by management, as well as evaluating the overall presentation of the financial statements.
We believe that the audit evidence we have obtained is sufficient and appropriate to provide a basis for our audit opinion.

Opinions
In our opinion, the financial statements referred to previously present fairly, in all material respects, the financial position of the Division of Cleveland Public Power, Department of Public Utilities, City of Cleveland, Ohio as of December 31, 2012 and 2011, and the changes in financial position and cash flows thereof for the years then ended in conformity with accounting principles generally accepted in theUnited States of America.
Effect of Adopting New Accounting Standards
As discussed in Note A, the Division adopted the provisions of Governmental Accounting Standards Board Statement No. 60 Accounting and Financial Reporting for Service Concession Arrangements, Statement No. 62, Codification of Accounting and Financial Reporting Guidance Contained in Pre-November 30, 1989 FASB and AICPA Pronouncements, Statement No. 63, Financial Reporting of Deferred Outflows of Resources, Deferred Inflows of Resources, and Net Position, and Statement No. 64, Derivative Instruments: Application of Hedge Accounting Termination Provision. Our opinion is not modified with respect to this matter.
Other Matters
As described in Note A, the financial statements present only the financial position and the changes in financial position and cash flows of the Division and do not purport to, and do not, present fairly the financial position of the City of Cleveland as of December 31, 2012 and 2011, and the respective changes in its financial position and cash flows for the years then ended in conformity with accounting principles generally accepted in the United States of America. Our opinion is not modified with respect to this matter.
Required Supplementary Information
Accounting principles generally accepted in the United States of America require that the management’s discussion and analysis on pages 3 through 12 be presented to supplement the basic financial statements. Such information, although not a part of the basic financial statements, is required by the Governmental Accounting Standards Board who considers it to be an essential part of financial reporting for placing the basic financial statements in an appropriate operational, economic, or historical context. We have applied certain limited procedures to the required supplementary information in accordance with auditing standards generally accepted in the United States of America, which consisted of inquiries of management about the methods of preparing the information and comparing the information for consistency with management’s responses to our inquiries, the basic financial statements, and other knowledge we obtained during our audit of the basic financial statements. We do not express an opinion or provide any assurance on the information because the limited procedures do not provide us with sufficient evidence to express an opinion or provide any assurance.
Clark, Schaefer, Hackett & Co.Cincinnati, OhioJune 25, 2013
2

CITY OF CLEVELAND, OHIO DEPARTMENT OF PUBLIC UTILITIES
DIVISION OF CLEVELAND PUBLIC POWER
MANAGEMENT'S DISCUSSION AND ANALYSIS
3
GENERAL As management of the City of Cleveland’s (the City) Department of Public Utilities, Division of Cleveland Public Power (the Division), we offer readers of the Division’s financial statements this narrative overview and analysis of the financial activities of the Division for the years ended December 31, 2012 and 2011. Please read this information in conjunction with the Division’s financial statements and footnotes that begin on page 14. The Division was created in 1906 and charged with the responsibility of the distribution of electricity and related electric service to customers within its service areas. The Division operates a municipal electric system that is the largest in the State of Ohio and the thirty-ninth largest in the United States. The Division serves an area that is bound by the City limits and presently serves approximately 74,000 customers. The Division is one of the very few municipal electric companies in the United States that competes with an investor-owned utility, in this case First Energy Corporation’s Cleveland Electric Illuminating Company (CEI). According to the 2010 census reports, the City’s population is 397,000 people. There are approximately 208,000 residential dwelling units and 11,000 commercial units. The Division has distribution facilities in about 60% of the geographical area of the City, primarily on the east side. The Division obtains substantially all of its power and energy requirements through agreements with various regional utilities and other power suppliers for power delivered through CEI interconnections. The balance of the Division's power and energy requirements are satisfied with production from the Division's three combustion turbine generating units and various arrangements for the exchange of short-term power and energy. To reduce its reliance on the wholesale market, the Division’s long-term base load supply will include a mix of power provided by participation in American Municipal Power (AMP) Inc. hydroelectric projects, the Prairie State Energy Campus project and new/emerging alternative energy technologies. COMPARISON OF CURRENT YEAR’S AND PRIOR YEARS’ DATA FINANCIAL HIGHLIGHTS • The assets of the Division exceeded its liabilities (net position) by $211,191,000, $208,597,000 and
$206,758,000 at December 31, 2012, 2011 and 2010, respectively. Of these amounts, $52,470,000, $58,236,000 and $58,291,000 are unrestricted net position at December 31, 2012, 2011 and 2010, respectively, that may be used to meet the Division’s ongoing obligations to customers and creditors.
• The Division’s total net position increased by $2,594,000 and $1,839,000 in 2012 and 2011, respectively. Operating revenue decreased by $3,221,000 or 1.9%. Purchased power increased by $5,274,000 or 5.8% and total operating expenses decreased by $2,570,000 or 1.6% for 2012. In addition, investment income decreased by $71,000 or 47.0%, interest expense decreased by $1,493,000 or 13.4% and amortization of bond issuance costs, premiums and discounts increased by $50,000 or 22.1%.

CITY OF CLEVELAND, OHIO DEPARTMENT OF PUBLIC UTILITIES
DIVISION OF CLEVELAND PUBLIC POWER
MANAGEMENT’S DISCUSSION AND ANALYSIS (Continued)
4
FINANCIAL HIGHLIGHTS (Continued)
• During 2012, the Division had an increase in capital assets, net of accumulated depreciation of
$3,575,000 or 1.1%. The principal capital expenditures in 2012 were for the Holton Substation (Fourth Interconnect), Pole Replacement, New Vehicles, Transformers, Building Betterments and Flats East Bank Distribution. These additions were offset by current year depreciation.
• The Division’s total long-term bonded debt decreased by $10,705,000 and $10,495,000 for the years ended December 31, 2012 and 2011, respectively. The decrease in both years is attributed mainly to scheduled debt service payments made to bondholders. Also, in 2012, the Division refinanced the 2001 bonds for a net decrease of $655,000 in long-term debt.
• In 2005, the Division was impacted by the introduction of Seams Elimination Cost Adjustment (SECA), which was mandated by the Federal Energy Regulatory Commission (FERC). For additional information see Note L. The Division paid SECA charges totaling $10,800,000 to Midwest Independent System Operator from December 2004 to March 2006 and has been refunded $5,655,000 as of December 31, 2012.
OVERVIEW OF THE FINANCIAL STATEMENTS This discussion and analysis is intended to serve as an introduction to the Division’s basic financial statements. The accompanying financial statements present financial information for the City’s Division of Cleveland Public Power Fund, in which the City accounts for the operations of the Department of Public Utilities, Division of Cleveland Public Power. A fund is a grouping of related accounts that is used to maintain control over resources that have been segregated for specific activities or objectives. The City, like other state and local governments, uses fund accounting to ensure and demonstrate compliance with finance-related legal requirements. The Division of Cleveland Public Power Fund is considered an enterprise fund because the operations of the Division are similar to a private sector business enterprise. Accordingly, in accounting for the activities of the Division, the economic resources measurement focus and accrual basis of accounting are used. This is similar to businesses in the private sector. The basic financial statements of the Division can be found on pages 14 – 19 of this report. The notes to the financial statements provide additional information that is essential to a full understanding of the data provided in the basic financial statements. The notes to the financial statements can be found on pages 20 - 36 of this report.

CITY OF CLEVELAND, OHIO DEPARTMENT OF PUBLIC UTILITIES
DIVISION OF CLEVELAND PUBLIC POWER
MANAGEMENT’S DISCUSSION AND ANALYSIS (Continued)
5
CONDENSED STATEMENT OF NET POSITION INFORMATION Provided below is condensed statement of net position information for the Division as of December 31, 2012, 2011 and 2010.
2012 2011 2010(In thousands)
Assets: Capital assets, net of accumulated depreciation 335,627$ 332,052$ 334,495$ Restricted assets 54,862 59,031 63,448 Unamortized bond issuance costs 2,646 2,947 3,293 Current assets 80,470 85,253 83,389
Total assets 473,605 479,283 484,625
Net Position and Liabilities: Net Position: Net investment in capital assets 153,436 145,158 144,257 Restricted for capital projects 1,309 1,309 Restricted for debt service 3,976 3,894 4,210 Unrestricted 52,470 58,236 58,291 Total net position 211,191 208,597 206,758 Liabilities: Long-term obligations 228,469 237,151 240,565 Current liabilities 33,945 33,535 37,302
Total liabilities 262,414 270,686 277,867
Total net position and liabilities 473,605$ 479,283$ 484,625$
Restricted assets: The Division’s restricted assets decreased by $4,169,000 and $4,417,000 in 2012 and 2011 respectively. The decreases for both years are primarily related to use of revenue bond funds for capital project expenditures. Current assets: The Division’s current assets decreased by $4,783,000 in 2012, compared to an increase of $1,864,000 in 2011. The decrease in 2012 is mainly due to a decrease in net accounts receivable of $3,155,000 as a result of decreased billings. There was also a net decrease of $1,348,000 in cash and cash equivalents and investments as well as a decrease of restricted cash and cash equivalents of $620,000. These items were offset by a $755,000 increase in due from other City of Cleveland departments, divisions and funds.

CITY OF CLEVELAND, OHIO DEPARTMENT OF PUBLIC UTILITIES
DIVISION OF CLEVELAND PUBLIC POWER
MANAGEMENT’S DISCUSSION AND ANALYSIS (Continued)
6
CONDENSED STATEMENT OF NET POSITION INFORMATION (Continued)
Capital assets: The Division’s capital assets as of December 31, 2012 amounted to $335,627,000 (net of accumulated depreciation). The total increase in the Division’s net capital assets for the current year was $3,575,000. A summary of the activity in the Division’s capital assets during the year ended December 31, 2012 is as follows:
Balance BalanceJanuary 1, December 31,
2012 Additions Reductions 2012
Land 4,863$ 386$ $ 5,249$ Land improvements 305 305 Utility plant 473,921 21,313 495,234 Buildings, structures and improvements 20,080 1,333 21,413 Furniture, fixtures, equipment and vehicles 79,996 2,980 (1,940) 81,036 Construction in progress 52,049 18,246 (23,712) 46,583 Total 631,214 44,258 (25,652) 649,820
Less: Accumulated depreciation (299,162) (16,971) 1,940 (314,193)
Capital assets, net 332,052$ 27,287$ (23,712)$ 335,627$
(In thousands)
A summary of the activity in the Division’s capital assets during the year ended December 31, 2011 is as follows:
Balance BalanceJanuary 1, December 31,
2011 Additions Reductions 2011
Land 4,863$ $ $ 4,863$ Land improvements 305 305 Utility plant 472,178 1,743 473,921 Buildings, structures and improvements 18,699 1,381 20,080 Furniture, fixtures, equipment and vehicles 78,502 1,602 (108) 79,996 Construction in progress 42,642 14,132 (4,725) 52,049 Total 617,189 18,858 (4,833) 631,214
Less: Accumulated depreciation (282,694) (16,576) 108 (299,162)
Capital assets, net 334,495$ 2,282$ (4,725)$ 332,052$
(In thousands)

CITY OF CLEVELAND, OHIO DEPARTMENT OF PUBLIC UTILITIES
DIVISION OF CLEVELAND PUBLIC POWER
MANAGEMENT’S DISCUSSION AND ANALYSIS (Continued)
7
CONDENSED STATEMENT OF NET POSITION INFORMATION (Continued) The principal capital expenditures during 2012 included the following:
• Holton Substation (4th Interconnect) - $8,838,000 • Engineering and Overhead expense - $5,637,000 • Pole Replacement - $1,399,000 • New Vehicles - $1,615,000 • Transformers - $913,000 • Building Betterments - garage at W 41st - $768,000 • Flats East Bank - $633,000 • Retaining Wall W 41st - $594,000 • 800 MGHz Radio System - $420,000
Additional information on the Division’s capital assets, including commitments made for future capital expenditures, can be found in Note D to the basic financial statements. Current liabilities: The increase in current liabilities of $410,000 in 2012 is mainly due to the increase of $1,070,000 in the current portion of long-term debt due in one year according to predetermined schedules, offset by a $620,000 decrease in current payable from restricted assets. Long-term obligations: The long-term obligation decrease of $8,682,000 in 2012 is mainly attributed to scheduled debt service payments. At December 31, 2012, the Division had total debt outstanding of $245,113,000. All bonds are backed by the revenues generated by the Division. The Division issued revenue bonds in the public capital markets in the late 1980’s and early 1990’s to finance a substantial expansion to its service territory. The Division also issued bonds in April 2008 for system expansion. In 2006, 2010 and 2012, the Division issued bonds to refinance a portion of its long-term debt. This outstanding debt is being retired in accordance with repayment schedules through 2038. Accreted interest payable will increase every year until 2025, mainly due to interest accruing on the Division’s 2008B Capital Appreciation Bonds (CABs). Payments of the accreted amount will begin in 2025.

CITY OF CLEVELAND, OHIO DEPARTMENT OF PUBLIC UTILITIES
DIVISION OF CLEVELAND PUBLIC POWER
MANAGEMENT’S DISCUSSION AND ANALYSIS (Continued)
8
CONDENSED STATEMENT OF NET POSITION INFORMATION (Continued) The activity in the Division’s debt obligations outstanding during the year ended December 31, 2012 is summarized in the following table (excluding unamortized discounts, premiums and losses on debt refundings):
Balance BalanceJanuary 1, Debt Debt Debt December 31,
2012 Issued Refunded Retired 2012
Revenue Bonds:
Mortgage Revenue Bonds 1994 A 14,650$ $ $ (7,325)$ 7,325$ Revenue Bonds 2001 15,980 (15,980) - Revenue Bonds 2006 A-1 95,265 95,265 Revenue Bonds 2006 A-2 12,295 12,295 Revenue Bonds 2008 A 21,105 21,105 Revenue Bonds 2008 B-1 44,705 (910) 43,795 Revenue Bonds 2008 B-2 27,903 27,903 Revenue Bonds 2010 23,915 23,915 Revenue Bonds 2012 15,325 (1,815) 13,510 Total 255,818$ 15,325$ (15,980)$ (10,050)$ 245,113$
(In thousands)
The activity in the Division’s debt obligations outstanding during the year ended December 31, 2011 is summarized in the following table (excluding unamortized discounts, premiums and losses on debt refundings):
Balance BalanceJanuary 1, Debt Debt Debt December 31,
2011 Issued Refunded Retired 2011
Revenue Bonds:
Mortgage Revenue Bonds 1994 A 21,185$ $ $ (6,535)$ 14,650$ Mortgage Revenue Bonds 1996 1,050 (1,050) - Revenue Bonds 2001 18,890 (2,910) 15,980 Revenue Bonds 2006 A-1 95,265 95,265 Revenue Bonds 2006 A-2 12,295 12,295 Revenue Bonds 2008 A 21,105 21,105 Revenue Bonds 2008 B-1 44,705 44,705 Revenue Bonds 2008 B-2 27,903 27,903 Revenue Bonds 2010 23,915 23,915
Total 266,313$ -$ -$ (10,495)$ 255,818$
(In thousands)
CITY OF CLEVELAND, OHIO DEPARTMENT OF PUBLIC UTILITIES
DIVISION OF CLEVELAND PUBLIC POWER
MANAGEMENT’S DISCUSSION AND ANALYSIS (Continued)
9
CONDENSED STATEMENT OF NET POSITION INFORMATION (Continued) The bond ratings for the Division’s outstanding revenue bonds are as follows:
Moody’sInvestors Service Standard & Poor’s
A2 A-
The ratio of net revenue available for debt service to debt service requirements (revenue bond coverage) is a useful indicator of the Division’s debt position to management, customers and creditors. The Division’s revenue bond coverage for 2012, 2011 and 2010 was 143%, 140% and 160%, respectively. Additional information on the Division’s long-term debt can be found in Note B to the basic financial statements on pages 23 - 27.
Net Position: Net position serves as a useful indicator of a government’s financial position. In the case of the Division, assets exceeded liabilities by $211,191,000, $208,597,000 and $206,758,000 at December 31, 2012, 2011 and 2010, respectively.
Of the Division’s net position at December 31, 2012, $153,436,000 reflects the Division’s investment in capital assets (e.g., land, buildings, utility plant, furniture, fixtures, vehicles and equipment), net of accumulated depreciation, less any related, still-outstanding debt used to acquire those assets. In addition, $1,309,000 denotes funds restricted for use in capital projects and $3,976,000 represents resources subject to debt service restrictions. The remaining $52,470,000 reflects unrestricted funds available to meet the Division’s ongoing obligations to customers and creditors.
Of the Division’s net position at December 31, 2011, $145,158,000 reflects the Division’s investment in capital assets (e.g., land, buildings, utility plant, furniture, fixtures, vehicles and equipment), net of accumulated depreciation, less any related, still-outstanding debt used to acquire those assets. In addition, $1,309,000 denotes funds restricted for use in capital projects and $3,894,000 represents resources subject to debt service restrictions. The remaining $58,236,000 reflects unrestricted funds available to meet the Division’s ongoing obligations to customers and creditors.

CITY OF CLEVELAND, OHIO DEPARTMENT OF PUBLIC UTILITIES
DIVISION OF CLEVELAND PUBLIC POWER
MANAGEMENT’S DISCUSSION AND ANALYSIS (Continued)
10
CONDENSED STATEMENT OF REVENUES, EXPENSES AND CHANGES IN NET POSITION INFORMATION The Division increased its net position by $2,594,000 in 2012, while the 2011 increase in net position amounted to $1,839,000. Provided below are key elements of the Division’s results of operations as of and for the years ended December 31, 2012, 2011 and 2010:
2012 2011 2010(In thousands)
Operating revenues 165,227$ 168,448$ 166,665$ Operating expenses 153,958 156,528 154,221
Operating income (loss) 11,269 11,920 12,444
Non-operating revenue (expense): Investment income 80 151 96 Interest expense (9,677) (11,170) (10,966) Amortization of bond issuance costs and discount (276) (226) (739) Other 217 1,006 1,223
Total non-operating revenue (expense), net (9,656) (10,239) (10,386)
Income (loss) before capital andother contributions 1,613 1,681 2,058
Capital and other contributions 981 158 1,021
Increase (decrease) in net position 2,594 1,839 3,079
Net position, beginning of year 208,597 206,758 203,679
Net position, end of year 211,191$ 208,597$ 206,758$
• In 2012, operating revenues decreased by $3,221,000. This decrease is related to cooler summer
weather. The summer of 2011 was the second warmest summer on record. The weather normalized in 2012.
• In 2011, operating revenues increased by $1,783,000. The increase was related to warmer than
normal summer weather, as the City experienced its second warmest July on record. As a result, the Division recorded its highest system peak along with increased seasonal electric sales.
• In 2012, operating expenses decreased by $2,570,000. This decrease is mainly related to street light
upgrades and higher raw materials costs that occurred in 2011.

CITY OF CLEVELAND, OHIO DEPARTMENT OF PUBLIC UTILITIES
DIVISION OF CLEVELAND PUBLIC POWER
MANAGEMENT’S DISCUSSION AND ANALYSIS (Continued)
11
CONDENSED STATEMENT OF REVENUES, EXPENSES AND CHANGES IN NET POSITION INFORMATION (Continued)
• In 2012, the cost of purchased power increased $5,274,000 due to the increase price of purchased power on the market. This increase in the cost of purchased power is passed through to customers via an Energy Adjustment Charge.
• In 2011, operating expenses increased by $2,307,000. The increase was mainly related to the rise in
operations and maintenance expenses offset by a decrease in cost of purchased power. FACTORS EXPECTED TO IMPACT THE DIVISION’S FUTURE FINANCIAL POSITION OR RESULTS OF OPERATIONS As a municipally-owned utility, the Division's mission is to improve the quality of life in the City of Cleveland by providing reliable, affordable energy and energy services to the residents and businesses of the City. The Division has concluded its 5-year Strategic Business Plan (SBP) for the period of 2007 – 2012 and is currently in the process of finalizing a new 5-year SBP that will identify and address competitive factors likely to impact the division over the period of 2013-2018.
The Capacity Expansion Program has been an ongoing project for the Division. Two major components remain and are expected to be completed in the future. The Capacity Expansion Program is designed to support and improve the Division’s electric system reliability and provide for future load growth opportunities.
Southern Project: This component of the Capacity Expansion Program includes the extension of the southern 138kV transmission system and the addition of a 138/13.8kV substation (the Southern Project). The proposed extension will complete a continuous transmission ring around the Division’s system. The Southern Project also includes the construction of a new distribution substation. It will allow the Division to extend its electric service to serve potential customers in parts of the southern and western areas of the City that are outside the Division’s current footprint as well as areas that are within the Division’s current footprint but presently lack sufficient capacity. The substation and transmission line are currently in final design phase with an anticipated in-service date of the 4th quarter of 2014.
Lake Road Project: This component of the Capacity Expansion Program is the expansion of the Lake Road 11.5kV Substation and the 11.5kV system downtown (the Lake Road Project). The proposed expansion will allow the Division to serve new customers throughout the downtown areas including the Quadrangle, Flats and Warehouse districts. Construction on the Lake Road Project is 50% complete with an anticipated in-service date of 1st quarter 2014.
The Division is focusing its marketing efforts on those sections of the City that were part of its earlier system expansion to increase the density of customers served. As the Division competes with CEI in these areas, density is measured as the number of the Division’s customers on a given street versus the total customers available on that street. New customers can be added with little additional expense.

CITY OF CLEVELAND, OHIO DEPARTMENT OF PUBLIC UTILITIES
DIVISION OF CLEVELAND PUBLIC POWER
MANAGEMENT’S DISCUSSION AND ANALYSIS (Continued)
12
FACTORS EXPECTED TO IMPACT THE DIVISION’S FUTURE FINANCIAL POSITION OR RESULTS OF OPERATIONS (Continued) The Division purchases most of its power requirements via contracts in the power markets. The Division intends to reduce its dependence on the purchased power market by acquiring interests in certain generating facilities. The Division’s long-term base load supply will include a mix of power provided by participation in AMP Inc. hydroelectric projects, the Prairie State Energy Campus project, and new/emerging alternative energy technologies. The Division is currently scheduled to purchase a total of approximately 50 MW from the AMP Inc.’s hydroelectric projects, which are expected to be in operation by 2014. The Division will also purchase up to 25 MW from AMP Inc.’s share of the Prairie State Energy Campus project, an Illinois coal-fired generating plant that came on-line in November 2012, and has also contracted to receive 60 MW of the Fremont Energy Center, a 707 MW natural gas-fired generating plant, which came on-line in January 2012. The Division’s payments for the Prairie State and Fremont project power will be an operating expense for CPP, the cost of which will be passed through to its customers via an Energy Adjustment Charge on its bills. As power costs rise, sales revenue will also increase commensurately through the Energy Adjustment Charge.
The Division owns and operates approximately 67,000 street lights, including 18,000 that were purchased in 2008 from CEI for $4,000,000. The Division provides street lighting service to its customer, the City of Cleveland, under a published rate schedule. CEI will continue to provide the power to street lights where the Division lacks distribution facilities but will charge an energy-based rate under CEI's tariff for municipally-owned street lights. The Division intends to continue to charge the City the current CEI rate for the newly acquired lights for a transition period, after which the lights will be billed at the Division’s then-current standard rate. In addition to adding a new revenue stream, the transfer will enable the City to avoid CEI's proposed new street lighting tariff charges, potentially affecting the General Fund and will allow for improved maintenance of the new lights by increasing responsiveness.
In early 2001, Ohio Electric Choice legislation created a new kilowatt-hour excise tax on electric power distributed to end users of electricity in the State by both investor-owned and municipal utilities. For municipal utilities, the state law requires the utility to remit the tax receipts to the municipality's General Fund. In accordance to Ordinance No. 1560-10 passed in November 2010, the General Fund retained 100% of the tax remittance in 2011 and also retained 100% during the calendar year 2012. Under Ordinance No. 193-13 passed in March 2013, the General Fund will retain 100% of the tax remittance in 2013 and will also retain 50% during the calendar year 2014.
ADDITIONAL INFORMATION This financial report is designed to provide a general overview of the Division’s finances. Questions concerning any of the information provided in this report or requests for additional information should be addressed to the Office of the Finance Director, City Hall Room 104, 601 Lakeside Avenue, Cleveland, Ohio 44114.

13
BASIC FINANCIAL STATEMENTS

14
CITY OF CLEVELAND, OHIO
DEPARTMENT OF PUBLIC UTILITIESDIVISION OF CLEVELAND PUBLIC POWER
STATEMENTS OF NET POSITIONDecember 31, 2012 and 2011
(In thousands)2012 2011
ASSETSCAPITAL ASSETS Land 5,249$ 4,863$ Land improvements 305 305 Utility plant 495,234 473,921 Buildings, structures and improvements 21,413 20,080 Furniture, fixtures, equipment and vehicles 81,036 79,996
603,237 579,165 Less: Accumulated depreciation (314,193) (299,162)
289,044 280,003 Construction in progress 46,583 52,049
CAPITAL ASSETS, NET 335,627 332,052 RESTRICTED ASSETS Cash and cash equivalents 51,122 59,031 Investments 3,739 Accrued interest receivable 1
TOTAL RESTRICTED ASSETS 54,862 59,031
UNAMORTIZED BOND ISSUANCE COSTS 2,646 2,947
CURRENT ASSETS Cash and cash equivalents 58,097 54,386 Restricted cash and cash equivalents 1,310 1,930 Investments 5,059 Receivables: Accounts receivable - net of allowance for doubtful accounts of $9,407,000 in 2012 and $6,889,000 in 2011 6,903 10,058 Unbilled revenue 1,931 2,080 Due from other City of Cleveland departments, divisions or funds 3,313 2,558 Materials and supplies - at average cost 8,826 9,089 Prepaid expenses 90 93
TOTAL CURRENT ASSETS 80,470 85,253
TOTAL ASSETS 473,605$ 479,283$
(Continued)

15
CITY OF CLEVELAND, OHIO
DEPARTMENT OF PUBLIC UTILITIESDIVISION OF CLEVELAND PUBLIC POWER
STATEMENTS OF NET POSITIONDecember 31, 2012 and 2011
(In thousands)2012 2011
NET POSITION AND LIABILITIES
NET POSITION Net investment in capital assets 153,436$ 145,158$ Restricted for capital projects 1,309 1,309 Restricted for debt service 3,976 3,894 Unrestricted 52,470 58,236
TOTAL NET POSITION 211,191 208,597
LIABILITIES LONG-TERM OBLIGATIONS-excluding amounts due within one year Revenue bonds 220,202 230,690 Accreted interest payable 7,768 5,948 Accrued wages and benefits 499 513
TOTAL LONG-TERM OBLIGATIONS 228,469 237,151
CURRENT LIABILITIES Current portion of long-term debt, due within one year 12,710 11,640 Accounts payable 8,732 8,598 Current payable from restricted assets 1,310 1,930 Due to other City of Cleveland departments, divisions or funds 4,499 4,922 Accrued interest payable 1,221 1,298 Current portion of accrued wages and benefits 3,855 3,635 Other accrued expenses 507 420 Customer deposits and other liabilities 1,111 1,092
TOTAL CURRENT LIABILITIES 33,945 33,535
TOTAL LIABILITIES 262,414 270,686
TOTAL NET POSITION AND LIABILITIES 473,605$ 479,283$
See notes to financial statements. (Concluded)

16
This page intentionally left blank.

CITY OF CLEVELAND, OHIO
DEPARTMENT OF PUBLIC UTILITIESDIVISION OF CLEVELAND PUBLIC POWER
STATEMENTS OF REVENUES, EXPENSES AND CHANGES IN NET POSITIONFor the Years Ended December 31, 2012 and 2011
(In thousands)2012 2011
OPERATING REVENUES Charges for services 165,227$ 168,448$
TOTAL OPERATING REVENUES 165,227 168,448 OPERATING EXPENSESPurchased power 95,788 90,514 Operations 21,379 29,542 Maintenance 19,820 19,896 Depreciation 16,971 16,576
TOTAL OPERATING EXPENSES 153,958 156,528
OPERATING INCOME (LOSS) 11,269 11,920
NON-OPERATING REVENUE (EXPENSE)Investment income 80 151 Interest expense (9,677) (11,170) Amortization of bond issuance costs and discounts (276) (226) Other 217 1,006
TOTAL NON-OPERATING REVENUE (EXPENSE), NET (9,656) (10,239)
INCOME (LOSS) BEFORE CAPITAL ANDOTHER CONTRIBUTIONS 1,613 1,681
Capital and other contributions 981 158 INCREASE (DECREASE) IN NET POSITION 2,594 1,839
NET POSITION, BEGINNING OF YEAR 208,597 206,758
NET POSITION, END OF YEAR 211,191$ 208,597$
See notes to financial statements.
17

CITY OF CLEVELAND, OHIODEPARTMENT OF PUBLIC UTILITIES
DIVISION OF CLEVELAND PUBLIC POWERSTATEMENTS OF CASH FLOWS
For the Years Ended December 31, 2012 and 2011(In thousands)
2012 2011CASH FLOWS FROM OPERATING ACTIVITIES Cash received from customers 168,740$ 172,078$ Cash payments to suppliers for goods or services (15,640) (20,615) Cash payments to employees for services (22,056) (24,018) Cash payments for purchased power (95,152) (90,960) Electric excise tax payments to agency fund and other (4,813) (5,334)
NET CASH PROVIDED BY (USED FOR) OPERATING ACTIVITIES 31,079 31,151
CASH FLOWS FROM NONCAPITAL FINANCING ACTIVITIES Grants 89 158 Other 689
NET CASH PROVIDED BY (USED FOR) NONCAPITALFINANCING ACTIVITIES 89 847
CASH FLOWS FROM CAPITAL AND RELATED FINANCING ACTIVITIES Proceeds from sale of revenue bonds 15,325 Acquisition and construction of capital assets (16,620) (9,618) Principal paid on long-term debt (10,050) (10,495) Interest paid on long-term debt (9,746) (10,573) Cash paid to escrow agent for refunding (16,294)
NET CASH PROVIDED BY (USED FOR) CAPITAL ANDRELATED FINANCING ACTIVITIES (37,385) (30,686)
CASH FLOWS FROM INVESTING ACTIVITIES Purchase of investment securities (28,731) (5,019) Proceeds from sale and maturity of investment securities 30,010 3,572 Interest received on investments 120 123
NET CASH PROVIDED BY (USED FOR)INVESTING ACTIVITIES 1,399 (1,324)
NET INCREASE (DECREASE) INCASH AND CASH EQUIVALENTS (4,818) (12)
CASH AND CASH EQUIVALENTS, BEGINNING OF YEAR 115,347 115,359
CASH AND CASH EQUIVALENTS, END OF YEAR 110,529$ 115,347$
(Continued)
18

CITY OF CLEVELAND, OHIO
DEPARTMENT OF PUBLIC UTILITIESDIVISION OF CLEVELAND PUBLIC POWER
STATEMENTS OF CASH FLOWSFor the Years Ended December 31, 2012 and 2011
(In thousands)2012 2011
RECONCILIATION OF OPERATING INCOME TO NET CASH PROVIDED BY OPERATING ACTIVITIES
OPERATING INCOME 11,269$ 11,920$ Adjustments to reconcile operating income to net cash provided by operating activities: Depreciation 16,971 16,576 Changes in assets and liabilities: Accounts receivable, net 3,155 3,600 Unbilled revenue 149 412 Due from other City of Cleveland departments, divisions or funds (755) (53) Materials and supplies, net 263 46 Prepaid expenses 3 23 Accounts payable 135 (946) Due to other City of Cleveland departments, divisions or funds (423) (242) Accrued wages and benefits 206 (193) Other accrued expenses 87 (32) Customer deposits and other liabilities 19 40
TOTAL ADJUSTMENTS 19,810 19,231
NET CASH PROVIDED BY OPERATING ACTIVITIES 31,079$ 31,151$
See notes to financial statements. (Concluded)
19

CITY OF CLEVELAND, OHIO DEPARTMENT OF PUBLIC UTILITIES
DIVISION OF CLEVELAND PUBLIC POWER
NOTES TO FINANCIAL STATEMENTS For the Years Ended December 31, 2012 and 2011
20
NOTE A - SUMMARY OF SIGNIFICANT ACCOUNTING POLICIES
The Division of Cleveland Public Power (the Division) is reported as an Enterprise Fund of the City of Cleveland’s (the City) Department of Public Utilities and is a part of the City’s primary government. The Division was created for the purpose of supplying electrical services to customers within the City. The following is a summary of the more significant accounting policies.
Reporting Model and Basis of Accounting: The accounting policies and financial reporting practices of the Division comply with accounting principles generally accepted in the United States of America applicable to governmental units. In November of 2010, Governmental Accounting Standards Board (GASB) Statement No. 60, Accounting and Financial Reporting for Service Concession Arrangements was issued. This Statement is effective for fiscal periods beginning after December 15, 2011. The objective of this Statement is to improve financial reporting by addressing issues related to service concession arrangements (SCAs), which are a type of public-private or public-public partnership. The Division has determined that GASB Statement No. 60 has no impact on its financial statements as of December 31, 2012.
In December of 2010, Governmental Accounting Standards Board (GASB) Statement No. 62, Codification of Accounting and Financial Reporting Guidance Contained in Pre-November 30, 1989 FASB and AICPA Pronouncements was issued. This Statement is effective for fiscal periods beginning after December 15, 2011. The objective of this Statement is to incorporate into the GASB’s authoritative literature certain accounting and financial reporting guidance that is included in the following pronouncements issued on or before November 30, 1989, which does not conflict with or contradict GASB pronouncements: (1) Financial Accounting Standards Board (FASB) Statements and Interpretations, (2) Accounting Principles Board Opinions and (3) Accounting Research Bulletins of the American Institute of Certified Public Accountants’ (AICPA) Committee on Accounting Procedure. As required, the Division has implemented GASB Statement No. 62 effective for the 2012 fiscal year.
In June of 2011, Governmental Accounting Standards Board (GASB) Statement No. 63, Financial Reporting of Deferred Outflows of Resources, Deferred Inflows of Resources, and Net Position was issued. This Statement is effective for fiscal periods beginning after December 15, 2011. This Statement provides financial reporting guidance for deferred outflows of resources and deferred inflows of resources. As required, the Division has implemented GASB Statement No. 63 effective for the 2012 fiscal year. In June of 2011, Governmental Accounting Standards Board (GASB) Statement No. 64, Derivative Instruments: Application of Hedge Accounting Termination Provision was issued. This Statement is effective for fiscal periods beginning after June 15, 2011. The objective of this Statement is to clarify whether an effective hedging relationship continues after the replacement of a swap counterparty or a swap counterparty’s credit support provider. The Division has determined that GASB Statement No. 64 has no impact on its financial statements as of December 31, 2012. In addition, certain additional financial information regarding the Division is included in these footnotes. The implementation of the new GASB statements did not result in a change in the Division’s beginning net position/equity balance as previously reported.

CITY OF CLEVELAND, OHIO DEPARTMENT OF PUBLIC UTILITIES
DIVISION OF CLEVELAND PUBLIC POWER
NOTES TO FINANCIAL STATEMENTS (Continued) For the Years Ended December 31, 2012 and 2011
21
NOTE A - SUMMARY OF SIGNIFICANT ACCOUNTING POLICIES (Continued)
The Division’s net assets are accounted for in the accompanying statements of net position and the net assets are divided into the following categories:
• Net investment in capital assets
• Amount restricted for capital projects
• Amount restricted for debt service
• Remaining unrestricted amount
Basis of Accounting: The Division’s financial statements are prepared under the accrual basis of accounting. Under this method, revenues are recognized when earned and measurable and expenses are recognized as incurred.
Revenues: Revenues are derived primarily from sales of electricity to residential, commercial and industrial customers based upon actual consumption. Electricity rates are authorized by City Council and billings are made on a cyclical basis. Estimates for services between the end of the various cycles and the end of the year are recorded as unbilled revenue.
Statement of Cash Flows: The Division utilizes the direct method of reporting for the statement of cash flows as defined by the GASB Statement No. 9, Reporting Cash Flows of Proprietary and Non-expendable Trust Funds and Governmental Entities That Use Proprietary Fund Accounting. In a statement of cash flows, cash receipts and cash payments are classified according to operating, non-capital financing, capital and related financing and investment activities.
Cash and Cash Equivalents: Cash and cash equivalents represent cash on hand and cash deposits maintained by the City Treasurer on behalf of the Division. Cash equivalents are defined as highly liquid investments with maturity of three months or less when purchased and include certificates of deposit, U.S. Treasury Bills, State Treasury Asset Reserve Fund of Ohio (STAROhio), commercial paper, mutual funds and repurchase agreements. The City’s policy is to enter into repurchase agreements with local commercial banks and to obtain confirmation of securities pledged.
Investments: The Division follows the provisions of GASB Statement No. 31, Accounting and Financial Reporting for Certain Investments and External Investment Pools, which requires governmental entities to report certain investments at fair value in the balance sheet and recognize the corresponding change in the fair value of investments in the year in which the change occurred. The fair value is based on quoted market prices.
The City has invested funds in STAROhio during fiscal year 2012 and 2011. STAROhio is an investment pool managed by the State Treasurer’s Office, which allows governments within the State to pool their funds for investment purposes. STAROhio is not registered with the SEC as an investment company, but does operate in a manner consistent with Rule 2a7 of the Investment Company Act of 1940. Investments in STAROhio are valued at STAROhio’s share price, which is the price the investment could be sold for on December 31, 2012 and 2011.

CITY OF CLEVELAND, OHIO DEPARTMENT OF PUBLIC UTILITIES
DIVISION OF CLEVELAND PUBLIC POWER
NOTES TO FINANCIAL STATEMENTS (Continued) For the Years Ended December 31, 2012 and 2011
22
NOTE A - SUMMARY OF SIGNIFICANT ACCOUNTING POLICIES (Continued)
Restricted Assets: Proceeds from debt and amounts set aside in various fund accounts for payment of revenue bonds are classified as restricted assets since their use is limited by the bond indentures.
Capital Assets and Depreciation: Capital assets are stated on the basis of historical cost, or, if contributed, at fair market value as of the date received. Depreciation is computed by allocating the cost of capital assets over the estimated useful lives of the assets using the straight-line method. A capital asset is defined as an item with a useful life in excess of one year and an individual cost of more than $5,000 for land, furniture, fixtures, equipment and vehicles and $10,000 for all other assets. When capital assets are disposed, the cost and related accumulated depreciation are removed from the accounts with gains or losses on disposition being reflected in operations. The estimated useful lives are as follows:
Utility plant 5 to 100 yearsLand improvements 15 to 100 yearsBuildings, structures and improvements 5 to 60 yearsFurniture, fixtures, equipment and vehicles 3 to 60 years
The Division’s policy is to capitalize interest on construction projects up to the point in time that the project is substantially completed. Capitalized interest is included in the cost of the assets and is depreciated on the straight-line basis over the estimated useful lives of such assets. The Division applies FASB guidance pertaining to capitalization of interest cost for its revenue bonds. This guidance requires capitalization of interest cost of eligible borrowings less interest earned on investment of the related bond proceeds from the date of borrowing until the assets constructed from the bond proceeds are ready for their intended use. For 2012 and 2011 total interest costs incurred amounted to $13,227,000 and $14,715,000 respectively, of which $3,533,000 and $3,533,000, respectively, was capitalized, net of interest income of $17,000 in 2012 and $12,000 in 2011.
Bond Issuance Costs, Discounts and Unamortized Losses on Debt Refundings: Bond issuance costs are initially recorded as deferred expenses and unamortized original issuance discounts are netted against long-term debt. Both are amortized over the lives of the related bonds. Unamortized losses on debt refundings are netted against long-term debt and are amortized over the shorter of the remaining life of the defeased bond or the newly issued bond.
Compensated Absences: The Division accrues for compensated absences such as vacation, sick leave and compensatory time using the termination payment method specified under GASB Statement No. 16, Accounting for Compensated Absences. These amounts are recorded as accrued wages and benefits in the accompanying statement of net position. The portion of the compensated absence liability that is not expected to be paid out within one year is reported as a long-term liability.
Normally, all vacation time is to be taken in the year available. The Division allows employees to carryover vacation from one year to the next. Sick days not taken may be accumulated until retirement. An employee is paid one-third of accumulated sick leave upon retirement, calculated at the three year base salary rate, with the balance being forfeited.

CITY OF CLEVELAND, OHIO DEPARTMENT OF PUBLIC UTILITIES
DIVISION OF CLEVELAND PUBLIC POWER
NOTES TO FINANCIAL STATEMENTS (Continued) For the Years Ended December 31, 2012 and 2011
23
NOTE B - DEBT AND OTHER LONG-TERM OBLIGATIONS
Long-term debt outstanding at December 31, 2012 and 2011 is as follows:
OriginalInterest Rate Issuance 2012 2011
Revenue Bonds:
Series 1994 A, due through 2013 Zero Coupon 219,105$ 7,325$ 14,650$ Series 2001, refunded in 2012 5.00%-5.50% 41,925 15,980 Series 2006 A-1, due through 2024 4.25%-5.00% 95,265 95,265 95,265 Series 2006 A-2, due through 2017 5.00% 12,295 12,295 12,295 Series 2008 A, due through 2024 4.00%-4.50% 21,105 21,105 21,105 Series 2008 B-1, due through 2038 3.00%-5.00% 44,705 43,795 44,705 Series 2008 B-2, due through 2038 5.13%-5.40% 27,903 27,903 27,903 Series 2010 , due through 2017 3.00%-5.00% 23,915 23,915 23,915
Series 2012 , due through 2016 2.00% 15,325 13,510
501,543$ 245,113 255,818
Less: Unamortized discount-zero coupon bonds (1,690) (2,612) Unamortized premium (discount)-current interest bonds (net) 3,678 4,764 Unamortized loss on debt refunding (14,189) (15,640) Current portion (12,710) (11,640)
Total Long-Term Debt 220,202$ 230,690$
(In thousands)

CITY OF CLEVELAND, OHIO DEPARTMENT OF PUBLIC UTILITIES
DIVISION OF CLEVELAND PUBLIC POWER
NOTES TO FINANCIAL STATEMENTS (Continued) For the Years Ended December 31, 2012 and 2011
24
NOTE B - DEBT AND OTHER LONG-TERM OBLIGATIONS (Continued) Summary: Changes in long-term obligations for the year ended December 31, 2012 are as follows:
Balance Balance DueJanuary 1, December 31, Within
2012 Increase Decrease 2012 One Year(In thousands)
Revenue Bonds: Series 1994 A, due through 2013 14,650$ $ (7,325)$ 7,325$ 7,325$
Series 2001, refunded in 2012 15,980 (15,980) -
Series 2006 A-1, due through 2024 95,265 95,265
Series 2006 A-2, due through 2017 12,295 12,295
Series 2008 A, due through 2024 21,105 21,105
Series 2008 B-1, due through 2038 44,705 (910) 43,795 940
Series 2008 B-2, due through 2038 27,903 27,903
Series 2010, due through 2017 23,915 23,915 445 Series 2012, due through 2016 15,325 (1,815) 13,510 4,000
Total revenue bonds 255,818 15,325 (26,030) 245,113 12,710
Accrued wages and benefits 4,148 3,841 (3,635) 4,354 3,855
Total 259,966$ 19,166$ (29,665)$ 249,467$ 16,565$

CITY OF CLEVELAND, OHIO DEPARTMENT OF PUBLIC UTILITIES
DIVISION OF CLEVELAND PUBLIC POWER
NOTES TO FINANCIAL STATEMENTS (Continued) For the Years Ended December 31, 2012 and 2011
25
NOTE B - DEBT AND OTHER LONG-TERM OBLIGATIONS (Continued) Summary: Changes in long-term obligations for the year ended December 31, 2011 are as follows:
Balance Balance DueJanuary 1, December 31, Within
2011 Increase Decrease 2011 One Year(In thousands)
Revenue Bonds: Series 1994 A, due through 2013 21,185$ $ (6,535)$ 14,650$ 7,325$
Series 1996, due through 2011 1,050 (1,050) -
Series 2001, due through 2016 18,890 (2,910) 15,980 3,405
Series 2006 A-1, due through 2024 95,265 95,265
Series 2006 A-2, due through 2017 12,295 12,295
Series 2008 A, due through 2024 21,105 21,105
Series 2008 B-1, due through 2038 44,705 44,705 910
Series 2008 B-2, due through 2038 27,903 27,903
Series 2010, due through 2017 23,915 23,915
Total revenue bonds 266,313 - (10,495) 255,818 11,640 Accrued wages and benefits 4,341 3,588 (3,781) 4,148 3,635
Total 270,654$ 3,588$ (14,276)$ 259,966$ 15,275$

CITY OF CLEVELAND, OHIO DEPARTMENT OF PUBLIC UTILITIES
DIVISION OF CLEVELAND PUBLIC POWER
NOTES TO FINANCIAL STATEMENTS (Continued) For the Years Ended December 31, 2012 and 2011
26
NOTE B - DEBT AND OTHER LONG-TERM OBLIGATIONS (Continued) Minimum principal and interest payments on long-term debt are as follows:
Principal Interest T otal
2013 12,710$ 9 ,767$ 22,477$ 2014 13,195 9 ,638 22,833 2015 13,105 9 ,111 22,216 2016 13,710 8 ,591 22,301 2017 14,325 7 ,974 22,299
2018 - 2022 82,235 28,952 111,187 2023 - 2027 51,032 22,671 73,703 2028 - 2032 20,249 29,214 49,463 2033 - 2037 20,344 29,130 49,474
2038 4,208 5 ,685 9 ,893
T otal 245,113$ 160,733$ 405,846$
.
(In thousands)
The City has pledged future power system revenues, net of specified operating expenses, to repay $245,113,000 in various Public Power System Revenue Bonds issued in various years since 1994. Proceeds from the bonds provided financing for Public Power System improvements. The bonds are payable from Public Power System net revenues and are payable through 2038. Annual principal and interest payments on the bonds are expected to require less than 70 percent of net revenues. The total principal and interest remaining to be paid on the various Power System Revenue Bonds is $405,846,000. Principal and interest paid for the current year and total net revenues were $19,796,000 and $28,320,000, respectively. Effective February 24, 2012, the City issued $15,325,000 Public Power System Revenue Refunding Bonds, Series 2012, to refund all of the outstanding $15,980,000 Public Power System Refunding Revenue Bonds, Series 2001. Net proceeds of the Series 2012 Bonds and amounts on deposit in the Series 2001 Bond Fund together totaling $16,293,627 were placed in an irrevocable trust account to pay the principal and interest on the refunded Series 2001 Bonds on March 26, 2012. As a result, the refunded bonds were defeased and the liability for these bonds has been removed from long-term debt. The City completed the refunding in order to achieve debt service savings of approximately $1,169,000 or an economic gain (the difference between the present values of the old and new debt service) of approximately $1,148,000 or 7.18%. These bonds were sold through a private sale to Wells Fargo Bank, National Association. The Division has, at various times, defeased certain revenue bonds by placing the proceeds of new bonds in an irrevocable trust to provide for all future debt service payments on the old bonds. Accordingly, the trust account assets and the liability for the defeased bonds are not included in the Division’s financial statements. The Division has no defeased debt outstanding at December 31, 2012.

CITY OF CLEVELAND, OHIO DEPARTMENT OF PUBLIC UTILITIES
DIVISION OF CLEVELAND PUBLIC POWER
NOTES TO FINANCIAL STATEMENTS (Continued) For the Years Ended December 31, 2012 and 2011
27
NOTE B - DEBT AND OTHER LONG-TERM OBLIGATIONS (Continued) Revenue bonds are payable from the revenues derived from operations of the Public Power System, after the payment of all operating and maintenance expenses (net revenues). The bonds are collateralized by a pledge of and lien on such net revenues and the special funds described below. The indenture requires that, at all times, the Division will charge rates and fees for the products and services of the Public Power System. Revenues will be at least sufficient to provide funds for the payment in each year of the necessary operating and maintenance expenses of the power system and in an amount equal to 1.25 times the payments of principal and interest on the revenue bonds then outstanding and due in that year. As of December 31, 2012 and 2011, the Division was in compliance with the terms and requirements of the bond indenture. The indenture establishes the following fund accounts for the application of revenues: Revenue Fund: All revenues will be deposited into this fund and will be used for payment of current operating expenses and deposits into other funds. Debt Service Fund: Monthly deposits will be made from the revenue fund to cover succeeding principal and interest payments as they become due on the revenue bonds. Debt Service Reserve Fund: Deposits will be made to this fund if the amount in the debt service fund at any time is less than the debt service reserve requirement. However, the Division has elected, pursuant to provisions of the indenture governing the Division's bonds, to satisfy the bond reserve requirement with a surety bond in an aggregate amount at least equal to the bond reserve requirement. Renewal and Replacement Fund: The balance in this fund is maintained at a minimum of $1,000,000 and is to be applied against the cost of repair or replacement of capital assets in order to maintain the system. Construction Fund: The proceeds from Series 1991, Series 1994 and Series 2008 Bonds of $12,050,000, $79,386,000, and $72,608,000, respectively, were deposited into this fund to be used, along with earnings from investments of amounts held therein, for the payment of capital costs. As of December 31, 2012 and 2011, the Division had $46,195,000 and $47,456,000, respectively, of outstanding commitments for future constructions that will be funded by available bond proceeds and operating revenue. Capital costs include all costs of additions, extensions, renewals, replacements, alterations, betterments and any other capital improvements to the system. Amounts held in this fund are subject to a lien in favor of bondholders and may be used to pay principal of outstanding bonds to the extent that amounts in all other funds are insufficient. No payment needs to be made into a fund if the amounts in such fund are equal to the required fund balance, if any. Amounts held in trust may be invested by the City Treasurer or the trustee in permitted investments. However, the use of funds is limited by the bond indenture and, accordingly, the amounts are classified as restricted assets in the financial statements.

CITY OF CLEVELAND, OHIO DEPARTMENT OF PUBLIC UTILITIES
DIVISION OF CLEVELAND PUBLIC POWER
NOTES TO FINANCIAL STATEMENTS (Continued) For the Years Ended December 31, 2012 and 2011
28
NOTE C - DEPOSITS AND INVESTMENTS Deposits: At December 31, 2012 and 2011, the Division’s carrying amount of deposits totaled $14,096,000 and $17,695,000, respectively, and the Division’s bank balances totaled $14,002,000 and $18,132,000, respectively. The differences represent positions in pooled bank accounts and normal reconciling items. Based on the criteria described in GASB Statement No. 3, Deposits with Financial Institutions, Investments (including Repurchase Agreements) and Reverse Repurchase Agreements and GASB Statement No. 40, Deposit and Investment Risk Disclosures – an Amendment of GASB Statement No. 3, $14,002,000 and $18,132,000 of the bank balances at December 31, 2012 and 2011, respectively, were insured or collateralized with securities held by the City or by its agent in the City’s name.
Custodial credit risk for deposits is the risk that in the event of bank failure, the Division will not be able to recover deposits or collateral for securities that are in possession of an outside party. At year end, the Division’s deposits were fully insured or collateralized. All deposits are collateralized with eligible securities pledged and deposited either with the City or with a qualified trustee by the financial institution as security for repayment of all public monies deposited in the financial institution whose market value at all times is equal to at least 110% of the carrying value of the deposits being secured. Investments: The City’s investment policies are governed by State statutes and City ordinances which authorize the City to invest in obligations of the U.S. Treasury, agencies and instrumentalities; State Treasurer Asset Reserve Fund (STAROhio); commercial paper; US Government Money Market Mutual Funds; guaranteed investment contracts; manuscript debt; bonds and other State of Ohio obligations; certificates of deposit; and repurchase transactions. Such repurchase transactions must be purchased from financial institutions or registered broker/dealers. Repurchase transactions are not to exceed a period of one year and confirmation of securities pledged must be obtained.
Under City policy, investments are limited to repurchase agreements, U.S. Government securities, certificates of deposit, investments in certain money market mutual funds, and STAROhio. Generally, investments are recorded in segregated accounts by way of book entry through the banks’ commercial or trust department and are kept at the Federal Reserve Bank in the depository institutions’ separate custodial account for the City, apart from the assets of the depository institution. Ohio statute prohibits the use of reverse repurchase agreements.
Investment securities are exposed to various risks such as interest rate, market and credit. Market values of securities fluctuate based on the magnitude of changing market conditions; significant changes in market conditions could materially affect the portfolio value.
Interest rate risk: As a means of limiting its exposure to fair value losses caused by rising interest rates, the Division invests primarily in short-term investments maturing within five years from the date of purchase. The intent is to avoid the need to sell securities prior to maturity. Investment maturities are disclosed in the following table.
Custodial Credit Risk: For an investment, custodial credit risk is the risk that, in the event of the failure of the counterparty, the Division will not be able to recover the value of the investments or collateral securities that are in the possession of an outside party. The Division does not have an investment policy dealing with investment custodial credit risk beyond the requirement in the State statute.

CITY OF CLEVELAND, OHIO DEPARTMENT OF PUBLIC UTILITIES
DIVISION OF CLEVELAND PUBLIC POWER
NOTES TO FINANCIAL STATEMENTS (Continued) For the Years Ended December 31, 2012 and 2011
29
NOTE C - DEPOSITS AND INVESTMENTS (Continued) Credit Risk: The Division’s investments as of December 31, 2012 and 2011 include U.S. Treasury Bills, U.S. Agency Obligations, STAROhio, commercial paper and mutual funds. The Division maintains the highest ratings for its investments. Investments in STAROhio and First American Government Obligations mutual funds carry a rating of AAAm, which is the highest money market fund rating given by Standard & Poor’s. The Division’s investment in U.S. Bank N.A. Open Commercial Paper carries a Standard & Poor’s rating of A-1+. Ohio law requires that STAROhio maintain the highest rating provided by at least one nationally recognized standard rating service.
Concentration of Credit Risk: The Division places a limitation on the amount it may invest in any one issuer to help minimize the concentration of credit risk. The Division had the following investments at December 31, 2012 and 2011, which include those classified as cash and cash equivalents in the statement of net position in accordance with the provisions of GASB Statement No. 9 since they have a maturity of three months or less:
2012 2011 Investment MaturitiesFair 2012 Fair 2011 Less than
Type of Investment Value Cost Value Cost One Year
U.S. Treasury Bills 3,739$ 3,739$ $ $ 3,739$ U.S. Agency Obligations 5,059 5,019 STAROhio 45,475 45,475 38,322 38,322 45,475 Commercial Paper 1,133 1,133 1,131 1,131 1,133 Investment in Mutual Funds 49,825 49,825 58,199 58,199 49,825
Total Investments 100,172 100,172 102,711 102,671 100,172 Total Deposits 14,096 14,096 17,695 17,695 14,096
Total Deposits and Investments 114,268$ 114,268$ 120,406$ 120,366$ 114,268$
(In thousands)
These amounts are monies invested by the City Treasurer on behalf of the Division and are used in daily operations with excess monies invested daily in STAROhio and mutual funds. These investments are carried at cost which approximates market value.
As of December 31, 2012, the investments in U.S. Treasury Bills, STAROhio, commercial paper and mutual funds are approximately 4%, 45%, 1% and 50%, respectively, of the Division’s total investments. As of December 31, 2011, the investments in U.S. Agency Obligations, STAROhio, commercial paper and mutual funds are approximately 5%, 37%, 1% and 57%, respectively, of the Division’s total investments.

CITY OF CLEVELAND, OHIO DEPARTMENT OF PUBLIC UTILITIES
DIVISION OF CLEVELAND PUBLIC POWER
NOTES TO FINANCIAL STATEMENTS (Continued) For the Years Ended December 31, 2012 and 2011
30
NOTE D - CAPITAL ASSETS
Capital Asset Activity: Capital asset activity for the year ended December 31, 2012 was as follows:
Balance BalanceJanuary 1, Decem 31ber ,
2012 Additions Reductions 2012
Capital assets, not being depreciated: Land $ 4,863 $ 386 $ $ 5,249 Construction in progress 52,049 18,246 (23,712) 46,583 Total capital assets, not being depreciated 56,912 18,632 (23,712) 51,832
Capital assets, being depreciated: Land improvements 305 305 Utility plant 473,921 21,313 495,234 Buildings, structures and improvements 20,080 1,333 21,413 Furniture, fixtures, equipment and vehicles 79,996 2,980 (1,940) 81,036 Total capital assets, being depreciated 574,302 25,626 (1,940) 597,988
Less: Accumulated depreciation (299,162) (16,971) 1,940 (314,193)
Total capital assets being depreciated, net 275,140 8,655 - 283,795
Capital assets, net $ 332,052 $ 27,287 $ (23,712) $ 335,627
(In thousands)
.

CITY OF CLEVELAND, OHIO DEPARTMENT OF PUBLIC UTILITIES
DIVISION OF CLEVELAND PUBLIC POWER
NOTES TO FINANCIAL STATEMENTS (Continued) For the Years Ended December 31, 2012 and 2011
31
NOTE D - CAPITAL ASSETS (Continued)
Capital Asset Activity: Capital asset activity for the year ended December 31, 2011 was as follows:
Balance BalanceJanuary 1, December 31,
2011 Additions Reductions 2011
Capital assets, not being depreciated: Land $ 4,863 $ 4,863
Construction in progress 42,642 14,132 (4,725) 52,049
Total capital assets, not being depreciated 47,505 14,132 (4,725) 56,912
Capital assets, being depreciated: Land improvements 305 305 Utility plant 472,178 1,743 473,921 Buildings, structures and improvements 18,699 1,381 20,080 Furniture, fixtures, equipment and vehicles 78,502 1,602 (108) 79,996 Total capital assets, being depreciated 569,684 4,726 (108) 574,302
Less: Accumulated depreciation (282,694) (16,576) 108 (299,162)
Total capital assets being depreciated, net 286,990 (11,850) - 275,140
Capital assets, net $ 334,495 $ 2,282 $ (4,725) $ 332,052
(In thousands)
Commitments: The Division has outstanding commitments of approximately $59,544,000 and $51,775,000 for future capital expenditures at December 31, 2012 and 2011, respectively. It is anticipated that these commitments will be financed from the Division’s cash balances; however, at the discretion of the Division, additional long-term debt may be issued in the future to finance a portion of the costs.

CITY OF CLEVELAND, OHIO DEPARTMENT OF PUBLIC UTILITIES
DIVISION OF CLEVELAND PUBLIC POWER
NOTES TO FINANCIAL STATEMENTS (Continued) For the Years Ended December 31, 2012 and 2011
32
NOTE E - DEFINED BENEFIT PENSION PLAN
Ohio Public Employees Retirement System: All full-time employees, other than non-administrative full-time police officers and firefighters, participate in the Ohio Public Employees Retirement System (OPERS). OPERS administers three separate pension plans as described below:
1) The Traditional Pension Plan – a cost-sharing, multiple-employer defined benefit pension plan. 2) The Member-Directed Plan – a defined contribution plan in which the member invests both member
and employer contributions (employer contributions vest over five years at 20% per year). Under the Member-Directed Plan, members accumulate retirement assets equal to the value of member and (vested) employer contributions plus any investment earnings.
3) The Combined Plan – a cost-sharing, multiple-employer defined benefit pension plan. Under the
Combined Plan, OPERS invests employer contributions to provide a formula retirement benefit similar in nature to the Traditional Pension Plan benefit. Member contributions, the investment of which is self-directed by the members, accumulate retirement assets in a manner similar to the Member-Directed Plan.
OPERS provides retirement, disability, survivor and death benefits and annual cost-of-living adjustments to members of the Traditional Pension and Combined Plans. Members of the Member-Directed Plan do not qualify for ancillary benefits. Authority to establish and amend benefits is provided in Chapter 145 of the Ohio Revised Code. OPERS issues a stand-alone financial report. Interested parties may obtain a copy by visiting https://www.opers.org/investments/cafr.shtml, writing to OPERS, 277 East Town Street, Columbus, Ohio 43215-4642, or by calling (614) 222-5601 or (800) 222-7377.
The Ohio Revised Code provides statutory authority for member and employer contributions. For 2012, member and employer contribution rates were consistent across all three plans. Member contribution rates were 10.00% in 2012, 2011 and 2010. The employer contribution rates were 14.00% of covered payroll in 2012, 2011 and 2010.
The Division’s required employer contributions to OPERS for the pension portion of all the plans for the years ending December 31, 2012, 2011 and 2010 were $2,037,000, $2,012,000 and $1,939,000 each year, respectively. The required payments due in 2012, 2011 and 2010 have been made.
In June 2012, the Governmental Accounting Standards Board (GASB) issued GASB Statement No. 68, Accounting and Financial Reporting for Pensions. This accounting standard replaces GASB Statement No. 27, and it is effective for employer fiscal years beginning after June 15, 2014.

CITY OF CLEVELAND, OHIO DEPARTMENT OF PUBLIC UTILITIES
DIVISION OF CLEVELAND PUBLIC POWER
NOTES TO FINANCIAL STATEMENTS (Continued) For the Years Ended December 31, 2012 and 2011
33
NOTE F - OTHER POST-EMPLOYMENT BENEFITS
Ohio Public Employees Retirement System: All full-time employees, other than non-administrative full-time police officers and firefighters, participate in the Ohio Public Employees Retirement System (OPERS). OPERS administers three separate pension plans: The Traditional Pension Plan – a cost-sharing, multiple-employer defined benefit pension plan; the Member-Directed Plan – a defined contribution plan; and the Combined Plan – a cost-sharing, multiple-employer defined benefit pension plan that has elements of both a defined benefit and defined contribution plan. OPERS maintains a cost-sharing multiple employer defined benefit postemployment health care plan, which includes a medical plan, prescription drug program and Medicare Part B premium reimbursement, to qualifying members of both the Traditional Pension and the Combined Plans. Members of the Member-Directed Plan do not qualify for ancillary benefits, including postemployment health care coverage. In order to qualify for postemployment health care coverage, age-and-service retirees under the Traditional Pension and Combined Plans must have 10 or more years of qualifying Ohio service credit. Health care coverage for disability benefit recipients and qualified survivor benefit recipients is available. The health care coverage provided by OPERS meets the definition of an Other Postemployment Benefit (OPEB) as described in GASB Statement No. 45. The Ohio Revised Code permits, but does not mandate, OPERS to provide OPEB benefits to its eligible members and beneficiaries. Authority to establish and amend benefits is provided in Chapter 145 of the Ohio Revised Code. OPERS issues a stand-alone financial report Interested parties may obtain a copy by visiting https://www.opers.org/investments/cafr.shtml, writing to OPERS, 277 East Town Street, Columbus, Ohio 43215-4642, or by calling (614) 222-5601 or (800) 222-7377.
The Ohio Revised Code provides the statutory authority requiring public employers to fund post-retirement health care through their contributions to OPERS. A portion of each employer’s contribution to OPERS is set aside for funding of post-retirement health care benefits. Employer contribution rates are expressed as a percentage of the covered payroll of active members. The employer contribution rates were 14.00% of covered payroll in 2012, 2011 and 2010. The Ohio Revised Code currently limits the employer contribution to a rate not to exceed 14.00% of covered payroll. Active members do not make contributions to the OPEB Plan. OPERS’ Postemployment Health Care plan was established under and is administrated in accordance with, Internal Revenue Code 401(h). Each year, the OPERS Retirement Board determines the portion of the employer contribution rate that will be set aside for funding of postemployment health care benefits. Employer contribution rates used to fund postemployment benefits were 4.00% for members of the Traditional Plan in 2012 and 2011, 6.05% for members of the Combined Plan in 2012 and 2011 and 5.50% from January 1, 2010 through February 28, 2010 and 5.00% from March 1, 2010 through December 31, 2010 for both plans. Effective January 1, 2013, the portion of employer contributions allocated to health care was lowered to 1.00% for both plans, as recommended by the OPERS Actuary. The OPERS Retirement Board is also authorized to establish rules for the payment of a portion of the health care benefits provided, by the retiree or their surviving beneficiaries. Payment amounts vary depending on the number of covered dependents and the coverage selected. The Division’s actual contributions to OPERS to fund postemployment benefits were $815,000 in 2012, $804,000 in 2011 and $1,105,000 in 2010. The required payments due in 2012, 2011, and 2010 have been made.
Changes to the health care plan were adopted by the OPERS Board of Trustees on September 19, 2012, with a transition plan commencing January 1, 2014. With the recent passage of pension legislation under SB343 and the approved health care changes, OPERS expects to be able to consistently allocate 4.00% of the employer contributions toward the health care fund after the end of the transition period.

CITY OF CLEVELAND, OHIO DEPARTMENT OF PUBLIC UTILITIES
DIVISION OF CLEVELAND PUBLIC POWER
NOTES TO FINANCIAL STATEMENTS (Continued) For the Years Ended December 31, 2012 and 2011
34
NOTE G - CONTINGENT LIABILITIES AND RISK MANAGEMENT Contingent Liabilities: In November 2009, participants in the American Municipal Power Generating Station (AMP) voted to terminate development of the 1,000 MW coal-fired generating station that was to be located on the Ohio River in Meigs County, Ohio. The Division was one of 81 member participants in the project and had committed to receive an 80 MW share of the project’s output. AMP has instituted litigation against the EPC contractor to recover costs incurred as a result of the project’s cancellation.
The Division and the other members participated in the project through “take or pay” contracts with AMP and are obligated to pay for the project’s sunk costs based on each member’s allocation. The Division’s share of the incurred project costs is $13,556,845 plus interest of $79,704. AMP anticipates that any such costs that are not recovered through participation in a replacement project will be financed by AMP and recovered from the AMP participants over a period of time yet to be determined. AMP has rolled over a portion of the Meigs County facility cost into the Fremont Energy Center (Fremont), a new natural gas generating station that AMP purchased in July 2011. AMP has provided the Division a Development Cost Credit of $6,281,771. These credits cut the Division’s risk of loss in half. None of these credits have been recorded in the Division’s financial statements through December 31, 2012.
Cleveland City Council passed legislation in 2011 allowing the Division to pass through 50% of any costs for which CPP is determined to be responsible to customers in their monthly electricity bills over time. Through this legislation, the Division will purchase power from the Fremont project, pay about half of its allocable share in AMP costs as power costs purchased from Fremont and include the costs in bills to customers over time. The legislation directs the Division to pay its remaining share of the costs due to AMP, estimated at $3,677,390, from operating funds over a period of time yet to be determined.
The Division has not paid any monies to AMP towards the project’s sunk costs. Furthermore, the Division has not reported the stranded costs in the financial statements as the Division’s communication received from AMP to date is that the actual amount of incurred costs that are not recoverable from the vendor is undeterminable.
In addition, various claims are pending against the City involving the Division for personal injuries, property damage and other matters. The City is responsible for the lawsuits. The City’s management is of the opinion that ultimate settlement of such claims will not result in a material adverse effect on the Division’s financial position, results of operations or cash flows.
Risk Management: The Division is exposed to various risks of loss related to torts; thefts of, damage to and destruction of assets; errors and omissions; injuries to employees; and natural disasters. The Division carries insurance to cover particular liabilities and property protection. Otherwise, the Division is generally self-insured. No material losses, including incurred but not reported losses, occurred in 2012 or 2011. There were no significant decreases in any insurance coverage in 2012. In addition, there were no insurance settlements in excess of insurance coverage during the past three years.
The City provides the choice of four separate health insurance plans for its employees. These plans are provided by two different insurers through commercial insurance. Operating funds are charged a monthly rate per employee, by type of coverage. The City participates in the State of Ohio’s workers’ compensation retrospective rating program.
CITY OF CLEVELAND, OHIO DEPARTMENT OF PUBLIC UTILITIES
DIVISION OF CLEVELAND PUBLIC POWER
NOTES TO FINANCIAL STATEMENTS (Continued) For the Years Ended December 31, 2012 and 2011
35
NOTE G - CONTINGENT LIABILITIES AND RISK MANAGEMENT (Continued)
In accordance with GASB Statement No. 10, claims liabilities are reported when it is probable that a loss has occurred and the amount of the loss can be reasonably estimated. Liabilities include an amount for claims that have been incurred but not reported. The result of the process to estimate the claims liability is not an exact amount as it depends on many complex factors, such as inflation, changes in legal doctrines, and damage awards. Accordingly, claims are re-evaluated periodically to consider the effects of inflation, recent claim settlement trends (including frequency and amount of pay-outs) and other economic and social factors.
The estimate of the claims liability also includes amounts for incremental claim adjustment expenses related to specific claims and other claim adjustment expenses, regardless of whether allocated to specific claims. Estimated recoveries, for example from salvage or subrogation, are another component of the claims liability estimate. Claims liability for the Division is reported as part of accounts payable on the statement of net position and is immaterial.
The Division suffered a loss of a transformer amounting to $1,120,000 in 2012. After the insurance claim, the Division’s loss is expected to be $250,000.
NOTE H - RELATED PARTY TRANSACTIONS Revenues and Accounts Receivable: The Division provides services to the City, including its various departments and divisions. The usual and customary rates are charged to all City departments and divisions.
Operating Expenses: The Division is provided various intra-city services. Charges are based on actual use or on a reasonable pro-rata basis. The more significant costs for the years ended December 31, 2012 and 2011 are as follows:
2012 2011
City Administration 1,092$ 1,054$ Telephone Exchange 727 565 Division of Water 435 427 Utilities Administration and Fiscal Control 947 871 Motor Vehicle Maintenance 700 630
(In thousands)
NOTE I - CUYAHOGA COUNTY REAL PROPERTY TAXES
The Division is required by ordinance to keep records of the estimated property taxes which would be payable to Cuyahoga County were it subject to such taxes. The estimated property taxes for the Division, based on book value of real estate at the current tax rates, would have been approximately $1,023,000 and $746,000 for the years ended December 31, 2012 and 2011, respectively.

CITY OF CLEVELAND, OHIO DEPARTMENT OF PUBLIC UTILITIES
DIVISION OF CLEVELAND PUBLIC POWER
NOTES TO FINANCIAL STATEMENTS (Continued) For the Years Ended December 31, 2012 and 2011
36
N
OTE J - KILOWATT PER HOUR TAX
In May 2001, the Division started billing its customers the electric deregulation kilowatt-hour tax according to the laws of the State of Ohio. This law requires the Division to remit the proceeds to the City’s General Fund, except for any proceeds attributable to sales outside the City which are remitted to the State of Ohio. The Division billed $5,284,000 and $5,308,000 for this tax in 2012 and in 2011 respectively, of which $6,563 and $5,131 was remitted to the State. As noted previously, City Council passed Ordinance No. 1768-07, which required the General Fund to remit 50% of the proceeds back to the Division in 2008. However, City Council subsequently passed Ordinance No. 1248-09, which allocated 100% of the proceeds to the General Fund in 2009 and 2010. In accordance to Ordinance No. 1560-10 passed in November 2010, the General Fund retained 100% of the tax remittance during calendar years 2011 and 2012. In accordance with Ordinance No. 193-13 passed in March 2013, the General Fund will retain 100% of the tax remittance in 2013 and will also retain 50% during the calendar year 2014.
NOTE K – INCREMENTAL CHARGES
In 2000, Cleveland City Council passed Ordinance No. 910-98, which increased rates to CPP customers. The rate increase was originally scheduled to expire December 31, 2005, but was extended through legislation several times, most recently to June 30, 2012. The legislation originally restricted the use of the rate increase proceeds to the payment of bonded indebtedness. In recent years, City Council authorized additional uses and in December 2005, Council removed the restriction related to bond indebtedness. The Division retained a rates consultant in 2011 to support the Division’s request to make the incremental charge permanent. The incremental charges billed were $13,448,000 and $13,670,000 in 2012 and 2011, respectively.
NOTE L – SEAMS ELIMINATION COST ADJUSTMENT (SECA) PAYMENTS Between December 2004 and March 2006, the Division was required by the FERC to pay SECA payments totaling $10,800,000. The payments arose from a transmission restructuring effort aimed at reducing transmission costs by allowing users such as Cleveland Public Power to pay a single rate for transmission across a regional system consisting of multiple utilities. These payments, made subject to refund and the outcome of litigation proceedings, were intended as a temporary replacement for revenues previously received by transmission owners in neighboring regional systems for transmission access across their systems. Through December 31, 2012, the Division received $5,655,000 as reimbursements for SECA payments. CPP’s trade association, American Municipal Power, is pursuing an additional reimbursement on behalf of its members for $1,600,000 from transmission owners in the Midwest ISO and another $1,200,000 from Baltimore Gas & Electric, which they are contesting. If AMP is successful, CPP will receive some portion of these recoveries but the amount is unknown.
The FERC has issued a SECA order requiring compliance filing, which the Division has filed, but so far it has not acted on the compliance filings. There have been appeals of the SECA orders and the parties involved have been negotiating the briefing schedule.

CITY OF CLEVELAND, OHIO
DEPARTMENT OF PUBLIC UTILITIES DIVISION OF WATER
REPORT ON AUDITS OF FINANCIAL STATEMENTS For the years ended December 31, 2012 and 2011

CITY OF CLEVELAND, OHIO
DEPARTMENT OF PUBLIC UTILITIES DIVISION OF WATER
TABLE OF CONTENTS
Page
Independent Auditors' Report .................................................................................................... 1-2 Management’s Discussion and Analysis ................................................................................... 3-15 Statements of Net Position......................................................................................................... 17-18 Statements of Revenues, Expenses and Changes in Net Position ............................................. 20 Statements of Cash Flows.......................................................................................................... 21-22 Notes to Financial Statements.................................................................................................... 23-45

one east fourth street, ste. 1200
cincinnati, oh 45202
www.cshco.com
p. 513.241.3111
f. 513.241.1212
cincinnati | cleveland | columbus | miami valley | springfield | toledo
INDEPENDENT AUDITORS’ REPORT
To the Honorable Frank G. Jackson, Mayor, Members of Council and the Audit CommitteeDivision of WaterDepartment of Public UtilitiesCity of Cleveland, Ohio:
Report on the Financial Statements
We have audited the accompanying financial statements of the Division of Water, Department of Public Utilities, City of Cleveland, Ohio (the Division) as of and for the years ended December 31, 2012 and 2011 and the related notes to the financial statements, as listed in the table of contents.
Management’s Responsibility for the Financial Statements
Management is responsible for the preparation and fair presentation of these financial statements in accordance with accounting principles generally accepted in the United States of America; this includes the design, implementation, and maintenance of internal control relevant to the preparation and fair presentation of financial statements that are free from material misstatement, whether due to fraud or error.
Auditors’ Responsibility
Our responsibility is to express an opinion on these financial statements based on our audits. We conducted our audits in accordance with auditing standards generally accepted in the United States of America and the standards applicable to financial audits contained in Government Auditing Standards, issued by the Comptroller General of the United States. Those standards require that we plan and perform the audit to obtain reasonable assurance about whether the financial statements are free from material misstatement.
An audit involves performing procedures to obtain audit evidence about the amounts and disclosures in the financial statements. The procedures selected depend on the auditors’ judgment, including the assessment of the risks of material misstatement of the financial statements, whether due to fraud or error. In making those risk assessments, the auditor considers internal control relevant to the entity’s preparation and fair presentation of the financial statements in order to design audit procedures that are appropriate in the circumstances, but not for the purpose of expressing an opinion on the effectiveness of the entity’s internal control. Accordingly, we express no such opinion. An audit also includes evaluating the appropriateness of accounting policies used and the reasonableness of significant accounting estimates made by management, as well as evaluating the overall presentation of the financial statements.
We believe that the audit evidence we have obtained is sufficient and appropriate to provide a basis for our audit opinion.

Opinions
In our opinion, the financial statements referred to previously present fairly, in all material respects, the financial position of the Division of Water, Department of Public Utilities, City of Cleveland, Ohio, (as of December 31, 2012 and 2011, and the changes in financial position and cash flows thereof for the years then ended in conformity with accounting principles generally accepted in the United States of America.
Effect of Adopting New Accounting Standards
As discussed in Note A, the Division adopted the provisions of Governmental Accounting Standards Board Statement No. 60 Accounting and Financial Reporting for Service Concession Arrangements, Statement No. 62, Codification of Accounting and Financial Reporting Guidance Contained in Pre-November 30, 1989 FASB and AICPA Pronouncements, Statement No. 63, Financial Reporting of Deferred Outflows of Resources, Deferred Inflows of Resources, and Net Position, and Statement No. 64, Derivative Instruments: Application of Hedge Accounting Termination Provision. Our opinion is not modified with respect to this matter.
Other Matters
As described in Note A, the financial statements present only the financial position and the changes in financial position and cash flows of the Division and do not purport to, and do not, present fairly the financial position of the City of Cleveland as of December 31, 2012 and 2011, and the respective changes in its financial position and cash flows for the years then ended in conformity with accounting principles generally accepted in the United States of America. Our opinion is not modified with respect to this matter.
Required Supplementary Information
Accounting principles generally accepted in the United States of America require that the management’s discussion and analysis on pages 3 through 15 be presented to supplement the basic financial statements. Such information, although not a part of the basic financial statements, is required by the Governmental Accounting Standards Board who considers it to be an essential part of financial reporting for placing the basic financial statements in an appropriate operational, economic, or historical context. We have applied certain limited procedures to the required supplementary information in accordance with auditing standards generally accepted in the United States of America, which consisted of inquiries of management about the methods of preparing the information and comparing the information for consistency with management’s responses to our inquiries, the basic financial statements, and other knowledge we obtained during our audit of the basic financial statements. We do not express an opinion or provide any assurance on the information because the limited procedures do not provide us with sufficient evidence to express an opinion or provide any assurance.
Clark, Schaefer, Hackett & Co.Cincinnati, OhioJune 25, 2013
2

CITY OF CLEVELAND, OHIO DEPARTMENT OF PUBLIC UTILITIES
DIVISION OF WATER
MANAGEMENT'S DISCUSSION AND ANALYSIS
3
GENERAL As management of the City of Cleveland’s (the City) Department of Public Utilities, Division of Water (the Division), we offer readers of the Division’s financial statements this narrative overview and analysis of the financial activities of the Division for the years ended December 31, 2012 and 2011. Please read this information in conjunction with the Division’s financial statements and footnotes that begin on page 17.
The Division services not only the City, but also 69 surrounding communities, six master meter communities, and eight emergency standby communities. They provide water to approximately 417,069 city and suburban accounts in the Cleveland metropolitan area. They also sell water to master meter communities that operate their own distribution systems, and they provide billing and payment services for the Northeast Ohio Regional Sewer District and other communities. During 2012, the Division provided services to approximately 124,520 accounts located within Cleveland and approximately 292,549 accounts located in direct service communities. Water provided to each master meter community is metered at each community’s boundary. Consumers within the City of Cleveland accounted for 21% of the Division’s metered sales revenue, while the direct service and master meter communities accounted for 70% and 9% of metered sales revenue, respectively. The Division, along with Division of Utilities Fiscal Control (UFC), provides a complete array of processing services including billing, payment processing, mailing delinquency notices, terminating water service on delinquent accounts and distributing the money collected to the communities. UFC processes approximately 5,000 bills daily, which include bills for water only, sewer only, water and sewer, final notices and delinquent bills. COMPARISON OF CURRENT YEAR’S AND PRIOR YEARS’ DATA FINANCIAL HIGHLIGHTS • The Division restated its 2011 beginning capital assets due to the acquisition of $167,777,000, net of
accumulated depreciation, of suburban distribution water mains by agreements signed with 21 suburbs from 2005 through 2010.
• The Division’s net position was $1,259,472,000, $1,197,743,000 and $1,190,443,000 at December 31, 2012, 2011 and 2010, respectively. Of these amounts, $257,578,000, $204,911,000 and $207,491,000 are unrestricted net position at December 31, 2012, 2011 and 2010, respectively, and may be used to meet the Division’s ongoing obligations to customers and creditors.
• In 2012, the operating revenues of the Division increased by $43,697,000 mainly due to a water rate increase. In 2011, the operating revenues of the Division decreased by $644,000.
• In 2012 the Division had a decrease in water pumpage of 0.16%. The major users of water consumption
were ISG-Cleveland, Cuyahoga Metropolitan Housing Authority, Nestle Inc., Cleveland Clinic Foundation, Alcoa Inc., Northeast Ohio Regional Sewer District, Pepsi Inc. and Case Western Reserve University. In 2011 the Division had an increase in water pumpage of 0.2%. The major users of water consumption were ISG-Cleveland, Cuyahoga Metropolitan Housing Authority, Nestle Inc., Alcoa Inc., Cleveland Clinic Foundation, Pepsi Inc., Northeast Ohio Regional Sewer District and NASA Lewis Research Center.

CITY OF CLEVELAND, OHIO DEPARTMENT OF PUBLIC UTILITIES
DIVISION OF WATER
MANAGEMENT'S DISCUSSION AND ANALYSIS (Continued)
4
FINANCIAL HIGHLIGHTS (Continued) • The Division’s overall net position increased by $61,729,000 and $7,300,000 in 2012 and 2011
respectively.
• The Division had increases in capital assets, net of accumulated depreciation, of $26,286,000 and $23,318,000 in 2012 and 2011, respectively. The major additions during these years were related to the continuing renovation projects for plant enhancements at the Morgan, Baldwin, Crown and Nottingham sites, suburban water main renewal and the meter reading program. The Division added the water mains for three suburbs in 2012 for $20,044,000. The major projects that were closed in construction in progress and moved to assets were Cleveland Security Contracts, Keller II Water Tower, Warehouse Improvements, Baldwin Residuals and Fairmount, Morgan Chemical Facility and the Plant Enhancements Program.
• The total long-term revenue bonds and loans payable of the Division increased $81,844,000 in 2012. This increase is primarily attributed to the issuance of $44,410,000 of Senior Lien, Series X Bonds and $76,710,000 Second Lien, Series A Bonds, which was offset by $40,239,000 of debt retired. The total long-term debt of the Division decreased $62,551,000 in 2011. This decrease is attributed to $43,407,000 of debt retired and $101,800,000 of debt defeased, which was offset by the issuance of $82,090,000 of revenue bonds and receipt of one Ohio Water Development Authority loan totaling $566,000.
• In July, 2012 the Division issued $50,000,000 of Water Revenue Subordinate Lien Notes Series 2012 in
order to refund notes issued in 2011 to fund a portion of the Automated Meter Reading program. The 2012 Notes were redeemed in November 2012 with a portion of the proceeds from Second Lien Series A 2012 Bonds.
OVERVIEW OF THE FINANCIAL STATEMENTS This discussion and analysis is intended to serve as an introduction to the Division’s basic financial statements. The accompanying financial statements present financial information for the City’s Division of Water Fund, in which the City accounts for the operations of the Department of Public Utilities, Division of Water.
A fund is a grouping of related accounts that is used to maintain control over resources that have been segregated for specific activities or objectives. The City, like other state and local governments, uses fund accounting to ensure and demonstrate compliance with finance-related legal requirements.
The Division is considered an Enterprise Fund because the operations of the Division are similar to a private sector business enterprise. Accordingly, in accounting for the activities of the Division, the economic resources measurement focus and the accrual basis of accounting is used. This is similar to businesses in the private sector.
The basic financial statements of the Division can be found on pages 17 – 22 of this report.

CITY OF CLEVELAND, OHIO DEPARTMENT OF PUBLIC UTILITIES
DIVISION OF WATER
MANAGEMENT'S DISCUSSION AND ANALYSIS (Continued)
5
OVERVIEW OF THE FINANCIAL STATEMENTS (Continued) The notes to the financial statements provide additional information that is essential to a full understanding of the data provided in the basic financial statements. The notes to the financial statements can be found on pages 23 - 45 of this report. CONDENSED STATEMENT OF NET POSITION INFORMATION Provided below is condensed statement of net position information for the Division as of December 31, 2012, 2011 and 2010:
Restated Restated2012 2011 2010
(In thousands)Assets: Capital assets, net 1,686,939$ 1,660,653$ 1,637,335$ Restricted assets 211,843 171,598 240,993 Unamortized bond issuance costs 5,151 4,517 4,911 Current assets 308,093 271,720 276,285 Total assets 2,212,026 2,108,488 2,159,524 Deferred outflows of resources: Derivative instruments-interest rate swaps 27,699 27,955 17,664 Total deferred outflows of resources 27,699 27,955 17,664 Total assets and deferred outflows 2,239,725 2,136,443 2,177,188
Net Position, Deferred Inflows and Liabilities: Net position: Net Investment in capital assets 914,193 899,231 881,062 Restricted for capital projects 99 Restricted for debt service 87,602 93,601 101,890 Unrestricted 257,578 204,911 207,491 Total net positon 1,259,472 1,197,743 1,190,443 Deferred inflows of resources: Derivative instruments-interest rate swaps 27,699 27,955 17,664 Total deferred inflows of resources 27,699 27,955 17,664 Liabilities: Long-term obligations 869,040 765,540 819,238 Current liabilities 83,514 145,205 149,843 Total liabilities 952,554 910,745 969,081 Total net position, deferred inflows and liabilities 2,239,725$ 2,136,443$ 2,177,188$

CITY OF CLEVELAND, OHIO DEPARTMENT OF PUBLIC UTILITIES
DIVISION OF WATER
MANAGEMENT'S DISCUSSION AND ANALYSIS (Continued)
6
CONDENSED STATEMENT OF NET POSITION INFORMATION (Continued) Total Assets and Deferred Outflows: The Division’s investment in total assets and deferred outflows as of December 31, 2012 amounted to $2,239,725,000, which is an increase of $103,282,000 from 2011. The Division had an increase in restricted assets and current assets of $40,245,000 and $36,373,000 respectively, due primarily to the issuance of revenue bonds of $44,410,000 and second lien water bonds of $76,710,000, and an increase of $634,000 in unamortized bond issuance costs. The division had a decrease in deferred outflows of resources of $256,000. The Division’s capital assets as of December 31, 2012 amounted to $1,686,939,000, which is an increase of $26,286,000.
The Division’s plant enhancements continue to be the primary reason for the increase in capital assets. Utility plant had additions of $145,112,000, buildings, structures and improvements had additions $17,159,000 and furniture, fixtures, equipment and vehicles had additions of $21,158,000. Included in these additions is $20,044,000, net of accumulated depreciation, of distribution mains acquired from three suburbs.
Also, construction in progress had deletions of $146,245,000 due to the completion of several major projects: Kirtland Pump Station Rehab, Fairmount Pump Station Rehab, Morgan Pretreatment and Residuals, Warehouse Rehabilitation and Baldwin Residuals and Fairmount offset by several ongoing major projects: Automated Meter Reading program, Crown Water Plant Improvements, Suburban Water Main Renewal, Morgan Chemical Facility Improvements, plant enhancement program improvements and 800MHz radio system renewal.
The Division’s investment in total assets and deferred outflows as of December 31, 2011 amounted to $2,136,443,000 which is a decrease of $40,745,000 from 2010. The Division had decreases in restricted assets of $69,395,000, current assets of $4,565,000 and unamortized bond issuance costs of $394,000. The Division had an increase in deferred outflows of resources of $10,291,000.
The Division’s capital assets as of December 31, 2011 amounted to $1,660,653,000 which is an increase of $23,318,000. The Division’s plant enhancements continue to be the primary reason for the increase in capital assets. Utility plant had additions of $112,795,000, buildings, structures and improvements had additions $1,437,000 and furniture, fixtures, equipment and vehicles had additions of $5,709,000. Also, construction in progress decreased by $35,012,000 due to the completion of several major projects: Kirtland Pump Station Rehab, Fairmount Pump Station Rehab, Morgan Pretreatment and Residuals, Water Tank Rehabilitation and Water and Aurora Road Water Main Improvement, offset by several ongoing major projects: Automated Meter Reading program, Warehouse Improvements Phase 1 and 2, Crown Water Plant Improvements, Suburban Water Main Renewal, Morgan Chemical Facility Improvements and plant enhancement program improvements. The increase in restricted assets of $40,245,000 as of December 31, 2012 is mainly attributed to increased cash balances in the debt service fund and restricted funds mainly due to the sale of the new Series X and the Second Lien Series A 2012 bonds. The decrease in restricted assets of $69,395,000 as of December 31, 2011 is mainly attributed to decreased cash balances in the debt service fund and restricted funds for revenue bonds Series K, N, O and T. The deferred outflow of resources related to the Division’s interest rate swap agreements decreased from $27,955,000 in 2011 to $27,699,000 in 2012. The fair value of the swaps is determined by the taxable LIBOR rate as of December 31, 2012.
CITY OF CLEVELAND, OHIO DEPARTMENT OF PUBLIC UTILITIES
DIVISION OF WATER
MANAGEMENT'S DISCUSSION AND ANALYSIS (Continued)
7
CONDENSED STATEMENT OF NET POSITION INFORMATION (Continued) Capital Assets: The Division of Water restated their capital assets balances for 2011. The Division entered into amended Water Service Agreements with 21 member communities prior to 2011. These Agreements transferred ownership of the distribution mains from the member communities to the Division of Water. The Division’s increase in their capital assets balance as a result of the restatement is $167,777,000 as of January 1, 2011. This is an increase of 11.4% compared to the reported capital assets balance prior to the restatement. In 2012, the Division of Water entered into amended Water Service Agreements with three member communities. The amended Water Service Agreements transferred the ownership of the distribution mains to the Division. These new assets account for $20,044,000, net of accumulated depreciation, or 7.8% of the additions recorded in 2012.
The Division’s investment in capital assets, as of December 31, 2012 amounted to $1,686,939,000 (net of accumulated depreciation). The total increase in the Division’s investment in net capital assets for the current year was approximately 1.6%. The Division’s investment in capital assets, as of December 31, 2011 amounted to $1,660,653,000 (net of accumulated depreciation). The total increase in the Division’s investment in net capital assets for 2011 was approximately 1.4%. A summary of the activity in the Division’s capital assets during the years ended December 31, 2012 and 2011 is as follows:
Balance BalanceJanuary 1, December 31,
2012 Additions Reductions 2012
Land 5,463$ $ $ 5,463$ Land improvements 16,549 16,549 Utility plant 1,354,191 145,112 (1,425) 1,497,878 Buildings, structures and improvements 221,373 17,159 238,532 Furniture, fixtures, equipment and vehicles 566,679 21,158 (1,288) 586,549 Construction in progress 275,907 71,505 (146,245) 201,167
Total 2,440,162 254,934 (148,958) 2,546,138
Less: Accumulated depreciation (779,509) (82,370) 2,680 (859,199)
Capital assets, net 1,660,653$ 172,564$ (146,278)$ 1,686,939$
(In thousands)

CITY OF CLEVELAND, OHIO DEPARTMENT OF PUBLIC UTILITIES
DIVISION OF WATER
MANAGEMENT'S DISCUSSION AND ANALYSIS (Continued)
8
CONDENSED STATEMENT OF NET POSITION INFORMATION (Continued)
RestatedBalance Balance
January 1, December 31,2011 Additions Reductions 2011
Land 5,463$ $ $ 5,463$ Land improvements 16,549 16,549 Utility plant 1,241,644 112,795 (248) 1,354,191 Buildings, structures and improvements 219,953 1,437 (17) 221,373 Furniture, fixtures, equipment and vehicles 565,014 5,709 (4,044) 566,679 Construction in progress 310,919 84,929 (119,941) 275,907 Total 2,359,542 204,870 (124,250) 2,440,162
Less: Accumulated depreciation (722,207) (61,611) 4,309 (779,509)
Capital assets, net 1,637,335$ 143,259$ (119,941)$ 1,660,653$
(In thousands)
Major events during 2012 affecting the Division’s capital assets included the following:
• The construction, renovations and plant enhancements were completed on the Morgan, Baldwin and Nottingham facilities, the rehabilitation of the Fairmount and Kirtland pump stations and the rehabilitation of water mains and water tanks amounted to $148,401,000 in 2012. The major projects still under construction include: Security Enhancements Program, Plant Enhancement Program, Pump Station Enhancement Program, Water Tank Rehabilitation and Automated Meter Reading program.
• Three cities signed asset transfer agreements that turned over their distribution water mains in the amount of $20,044,000, net of accumulated depreciation.
Major events during 2011 affecting the Division’s capital assets included the following:
• The construction, renovations, and plant enhancements on the Morgan, Baldwin and Nottingham facilities, the rehabilitation of the Fairmount and Kirtland pump stations and the rehabilitation of water mains and water tanks amounted to $135,070,000. The major programs totaling $124,645,000 are: Security Enhancements Program, Plant Enhancement Program, Pump Station Enhancement Program, Water Tank Rehabilitation, Automated Meter Reading program and the purchase of office equipment and vehicles. Other smaller programs, such as the Electrical Power Reliability program comprise the remaining $10,425,000.
Additional information on the Division’s capital assets, including commitments made for future capital expenditures, can be found in Note D to the basic financial statements.

CITY OF CLEVELAND, OHIO DEPARTMENT OF PUBLIC UTILITIES
DIVISION OF WATER
MANAGEMENT'S DISCUSSION AND ANALYSIS (Continued)
9
CONDENSED STATEMENT OF NET POSITION INFORMATION (Continued)
Liabilities: In 2012, the factors for the Division’s net increase in long-term obligations of $103,500,000 is primarily attributed the issuance of $122,283,000 of new bonds and loans and an increase in the unamortized discount and premium of $16,686,000, a decrease in unamortized loss on debt refunding of $2,788,000, offset by $40,239,000 of debt retirement. The increase in long-term obligations occurred due to the Division issuing bonds in order to refinance the $50,000,000 Series 2012 Notes with the balance of the proceeds used to fund the Automated Meter Reading program.
In 2011, the factors for the Division’s net decrease in long-term obligations of $53,698,000 is attributed to additional Ohio Water Development Authority Loans of $566,000, the issuance of $132,090,000 of new bonds and notes and an increase in the unamortized discount and premium of $3,829,000. These amounts were offset by $93,407,000 of debt retirement, $101,800,000 of debt defeased, a decrease in unamortized loss on debt refunding of $1,857,000 and a decrease in accrued wages and benefits of $499,000.
Current Liabilities: In 2012, total current liabilities decreased by $61,691,000. The significant component of the change was a reduction to the current portion of long-term debt obligations and short-term notes of $52,281,000, which was primarily due to the retirement of the $50,000,000 Series 2011 short-term notes. Other decreases included customer deposits and other liabilities of $8,062,000, which was due to recognizing completed construction deposits and current payable from restricted assets of $2,087,000. These reductions were offset by a minor increase in accrued interest payable of $794,000.
In 2011, total current liabilities decreased by $4,638,000. The significant components of the change were increases to payable from accounts payable of $565,000, due to other City departments, divisions or funds of $547,000 and customer deposits and other liabilities of $1,669,000. These increases were offset by reductions to the current portion of long-term debt obligations and short-term notes of $3,322,000, current payable from restricted assets of $885,000, of accrued interest of $2,870,000 and current portion of accrued wages and benefits of $344,000.
Long-term Debt: At the end of 2012, the Division had total long-term debt outstanding of $892,939,000. All bonds are backed by the revenues generated by the Division. The Ohio Water Development Authority (OWDA) loans do not have a lien on revenues of the Division.
At the end of 2011, the Division had total long-term debt outstanding of $811,095,000. All bonds are backed by the revenues generated by the Division. The Ohio Water Development Authority (OWDA) loans do not have a lien on revenues of the Division.
Short-term Debt: The Division had no short-term debt outstanding at the end of 2012.
The City issued $50,000,000 Subordinate Lien Water Revenue Notes, Series 2012 in July 2012 to retire the Series 2011 Notes. The Series 2012 Notes were then redeemed on November 1, 2012 from the proceeds of the Second Lien Series A, 2012 Bonds.
At the end of 2011, the Division had $50,000,000 of Water Revenue Subordinate Revenue Notes outstanding. The Notes, which are subordinate to the Division’s outstanding revenue bonds, were redeemed on July 26, 2012 with the proceeds of Series 2012 Notes and were backed by the revenues generated by the Division.

CITY OF CLEVELAND, OHIO DEPARTMENT OF PUBLIC UTILITIES
DIVISION OF WATER
MANAGEMENT'S DISCUSSION AND ANALYSIS (Continued)
10
CONDENSED STATEMENT OF NET POSITION INFORMATION (Continued) The activity in the Division’s debt obligations outstanding during the year ended December 31, 2012 is summarized below (excluding unamortized discounts, premiums and losses on debt refundings):
Balance BalanceJanuary 1, Debt Debt December 31,
2012 Issued Retired 2012
Long-Term DebtWater Revenue Bonds: Series G, 1993 81,225$ $ (14,365)$ 66,860$ Series N, 2005 33,045 (5,030) 28,015 Series O, 2007 133,315 (2,705) 130,610 Series P, 2007 119,095 (5,815) 113,280 Series Q, 2008 90,800 90,800 Series T, 2009 77,415 (6,085) 71,330 Series U, 2010 54,935 54,935 Series V, 2010 26,495 26,495 Series W, 2011 82,090 82,090 Series X, 2012 44,410 44,410 Second Lien, Series A 2012 76,710 76,710 Ohio Water Development Authority Loans 112,680 963 (6,239) 107,404 Total 811,095$ 122,083$ (40,239)$ 892,939$
(In thousands)
Balance BalanceJanuary 1, Debt Debt December 31,
2012 Issued Retired 2012
Short-Term DebtWater Revenue Notes: Sub. Lien Revenue Notes, 2011 50,000$ $ (50,000)$ -$ Sub. Lien Revenue Notes, 2012 50,000 (50,000) -
Total 50,000$ 50,000$ (100,000)$ -$
(In thousands)

CITY OF CLEVELAND, OHIO DEPARTMENT OF PUBLIC UTILITIES
DIVISION OF WATER
MANAGEMENT'S DISCUSSION AND ANALYSIS (Continued)
11
CONDENSED STATEMENT OF NET POSITION INFORMATION (Continued)
The activity in the Division’s debt obligations outstanding during the year ended December 31, 2011 is summarized below (excluding unamortized discounts, premiums and losses on debt refundings):
Balance BalanceJanuary 1, Debt Debt Debt December 31,
2011 Issued Defeased Retired 2011
Long-Term DebtWater Revenue Bonds: Series G, 1993 94,830$ $ $ (13,605)$ 81,225$ Series H, 1996 2,020 (1,940) (80) - Series J, 2001 43,230 (42,865) (365) - Series K, 2002 52,810 (48,095) (4,715) - Series N, 2005 33,045 33,045 Series O, 2007 138,725 (2,825) (2,585) 133,315 Series P, 2007 135,410 (6,075) (10,240) 119,095 Series Q, 2008 90,800 90,800 Series T, 2009 83,340 (5,925) 77,415 Series U, 2010 54,935 54,935 Series V, 2010 26,495 26,495 Series W, 2011 82,090 82,090 Ohio Water Development Authority Loans 118,006 566 (5,892) 112,680
Total 873,646$ 82,656$ (101,800)$ (43,407)$ 811,095$
(In thousands)
Balance BalanceJanuary 1, Debt Debt December 31,
2011 Issued Retired 2011
Short-Term Debt Water Revenue Notes: Sub. Lien Revenue Notes, 2010 50,000$ $ (50,000)$ -$ Sub. Lien Revenue Notes, 2011 50,000 50,000
Total 50,000$ 50,000$ (50,000)$ 50,000$
(In thousands)
CITY OF CLEVELAND, OHIO DEPARTMENT OF PUBLIC UTILITIES
DIVISION OF WATER
MANAGEMENT'S DISCUSSION AND ANALYSIS (Continued)
12
CONDENSED STATEMENT OF NET POSITION INFORMATION (Continued) The bond ratings for the Division’s outstanding revenue bonds as of December 31, 2012 are as follows:
Moody’sInvestors Service Standard & Poor’s
Waterworks Revenue Bonds Aa1 AASecond Lien Water Revenue Bonds Aa2 AA-
The ratio of net revenue available for debt service to debt service requirements (revenue bond coverage) is a useful indicator of the Division’s debt position to management, customers and creditors. The Division’s revenue bond coverage for 2012, 2011 and 2010 was 231%, 144% and 132%, respectively.
Additional information on the Division’s long-term debt can be found in Note B on pages 27 - 37.
Net Position: Net position serves as a useful indicator of a government’s financial position. In the case of the Division, assets and deferred outflows exceed liabilities and deferred inflows by $1,259,472,000, $1,197,743,000 and $1,190,443,000 at December 31, 2012, 2011 and 2010, respectively.
Of the Division’s net position, $914,193,000 or 72.6% and $899,231,000 or 75.1% at December 31, 2012 and 2011, respectively, reflects its investment in capital assets, net of accumulated depreciation, less any related, still-outstanding debt used to acquire those assets. The Division uses these capital assets to provide services to its customers; consequently, these assets are not available for future spending. Although the Division’s investment in capital assets is reported net of related debt, it should be noted that the resources needed to repay this debt must be provided from other resources since the capital assets themselves cannot be used to liquidate these liabilities. An additional portion of the Division’s net position, $87,701,000 or 7.0%, and $93,601,000 or 7.8%, at December 31, 2012 and 2011, respectively, represents resources that are subject to external restrictions. These funds are set aside for the payment of revenue bonds and capital projects. The remaining balance of unrestricted net position, $257,578,000 or 20.4% and $204,911,000 or 17.1%, at December 31, 2012 and 2011, respectively, may be used to meet the Division’s ongoing obligations to customers and creditors.

CITY OF CLEVELAND, OHIO DEPARTMENT OF PUBLIC UTILITIES
DIVISION OF WATER
MANAGEMENT'S DISCUSSION AND ANALYSIS (Continued)
13
CONDENSED STATEMENT OF REVENUES, EXPENSES AND CHANGES IN NET POSITION INFORMATION The Division’s net position increased during 2012 and 2011 by $61,729,000 and $7,300,000, respectively. The following table identifies the key elements of the Division’s results of operations as of and for the years ended December 31, 2012, 2011 and 2010:
Restated Restated2012 2011 2010
(In thousands)
Operating revenues 280,323$ 236,626$ 237,270$ Operating expenses 216,624 207,844 208,016 Operating income (loss) 63,699 28,782 29,254
Non-operating revenue (expense): Investment income 1,965 2,349 4,007 Interest expense (28,322) (27,071) (27,410) Amortization of bond issuance costs, premiums and discounts 4,284 2,682 2,189 Gain (Loss) on disposal of capital assets (15) 1 Total non-operating revenue (expense), net (22,088) (22,040) (21,213)
Income (loss) before capital andother contributions 41,611 6,742 8,041
Capital and other contributions 20,118 558 5,001 Increase (decrease) in net position 61,729 7,300 13,042
Net position, beginning of year (as restated) 1,197,743 1,190,443 1,177,401
Net position, end of year 1,259,472$ 1,197,743$ 1,190,443$
Operating revenue: In 2012, total operating revenues increased by $43,697,000. The Division of Water had a minor decrease in pumpage of 0.16% and an increase in new rates and a full year of the fixed rate fee in 2012. The major users of water were as follows: ISG-Cleveland, Cuyahoga Metropolitan Housing Authority, Nestle Inc., Alcoa Inc., Cleveland Clinic Foundation, Pepsi Inc., Northeast Ohio Regional Sewer District and Case Western Reserve University.
In 2011, total operating revenues decreased by $644,000. The Division of Water had a minor increase in pumpage of 0.2%. The major users of water were as follows: ISG-Cleveland, Cuyahoga Metropolitan Housing Authority, Nestle Inc., Alcoa Inc., Cleveland Clinic Foundation, Pepsi Inc., Northeast Ohio Regional Sewer District and NASA Lewis Research Center.

CITY OF CLEVELAND, OHIO DEPARTMENT OF PUBLIC UTILITIES
DIVISION OF WATER
MANAGEMENT'S DISCUSSION AND ANALYSIS (Continued)
14
CONDENSED STATEMENT OF REVENUES, EXPENSES AND CHANGES IN NET POSITION INFORMATION (Continued) Operating expenses: In 2012, the overall increase in operating expenses of $8,780,000 was primarily due to a $3,466,000 increase in operations expense and a $5,844,000 increase in depreciation expense. Operations expense increases were identified in the following areas: bad debt expense and professional services. Depreciation increased because several assets were brought into service during the year. In 2011, the overall decrease in operating expenses of $172,000 was due to a $611,000 increase in operations expense and a $3,109,000 increase for depreciation expense. These increases were offset by a decrease of $3,892,000 in maintenance expenses. Operations expense increases were identified in the following areas: contractual services and electricity. The decrease in maintenance expenses were noted in the following areas: computer hardware maintenance and Ohio Public Employee Retirement System. Salary and benefit costs also decreased as a result of retirements, reductions in overtime costs, hospitalization and workers compensation costs. Non-operating revenue (expense): The major changes in 2012 were an increase of $1,251,000 in interest expense and an increase of $1,602,000 in amortization of bond costs, premiums and discounts. The major changes in 2011 were a decrease of $1,658,000 in investment income (attributed to declining interest rates), decrease of $339,000 in interest expense and an increase of $493,000 in amortization expense. Capital and other contributions: In 2012, there was a $19,560,000 rise in capital and other contributions as compared to 2011. The increase is primarily attributed to the Division acquiring suburban distribution mains totaling $20,044,000 throughout the year. FACTORS EXPECTED TO IMPACT THE DIVISION’S FUTURE FINANCIAL POSITION OR RESULTS OF OPERATIONS Water rate increases will continue to have a positive impact on the financial position of the Division:
WATER RATES
EFFECTIVE REGULAR HOMESTEAD REGULAR HOMESTEADJanuary 1, 2013 $15.51 $8.53 $29.48 $8.53January 1, 2014 $17.34 $10.41 $31.22 $10.41January 1, 2015 $19.26 $12.52 $32.74 $12.52
CLEVELAND - PER 1st .6 MCF(Thousand cubic feet)
CLEVELAND - PER ADDITIONAL MCF(Thousand cubic feet)

CITY OF CLEVELAND, OHIO DEPARTMENT OF PUBLIC UTILITIES
DIVISION OF WATER
MANAGEMENT'S DISCUSSION AND ANALYSIS (Continued)
15
FACTORS EXPECTED TO IMPACT THE DIVISION’S FUTURE FINANCIAL POSITION OR RESULTS OF OPERATIONS (Continued)
WATER RATES
EFFECTIVE REGULAR HOMESTEAD REGULAR HOMESTEADJanuary 1, 2013 $22.11-$30.33 $12.16-$16.68 $42.01-$57.63 $12.16-$16.68January 1, 2014 $23.63-$33.00 $14.18-$19.80 $42.53-$59.39 $14.18-$19.80January 1, 2015 $25.04-$35.63 $16.27-$23.16 $42.56-$60.57 $16.27-$23.16
DIRECT SERVICE SUBURBS - PER 1st .6 MCF(Thousand cubic feet)
DIRECT SERVICE SUBURBS-PER ADDITIONAL MCF(Thousand cubic feet)
These increase in rates, fixed customer charges and recommended modifications to the Division’s water rate structure were adopted by the Cleveland City Council on May 23, 2011. The fixed customer charges change became effective July 16, 2011 and was first billed on October 16, 2011. The new fixed customer charges are based on meter size. The first increase in a series of annual increases in water consumption charges became effective January 1, 2012. The annual rate increases for the years 2013 through 2015 are expected to increase operating revenues to adequately cover anticipated operating expenses. The increases in rates within the City of Cleveland average 12.7%, 11.8% and 11.1% for the first .6 MCF and 7.1%, 5.9% and 4.9% for each additional MCF for the years 2013, 2014 and 2015, respectively. The increases in rates within the suburbs average 8.0%, 6.9% and 6.0% for the first .6 MCF and 0.7%, 1.2% and 0.1% for each additional MCF for the years 2013, 2014 and 2015, respectively. The increases for fixed customer charges for Cleveland and suburbs average 16.7%, 14.3% and 12.5% for the years 2013, 2014 and 2015, respectively. On July 24, 2012, the City issued $50,000,000 Subordinate Lien Water Revenue Notes, Series 2012. Proceeds of the notes were used to retire the $50,000,000 Subordinate Lien Water Revenue Notes issued in 2011. The Series 2012 Notes were redeemed on November 1, 2012 from the proceeds of the Second Lien Series A 2012 Bonds. The original notes, which were issued in 2010, provided a portion of the funds needed for a new Automated Meter Reading program for the Division. Effective October 24, 2012, the Division issued $44,410,000 of Senior Lien Water Revenue Bonds Series X 2012 and $76,710,000 of Second Lien Water Revenue Bonds Series A 2012. Proceeds of the Series X Bonds will be used to pay costs of improvements to the Waterworks System and to pay costs of issuing the bonds. From the proceeds of the Series A 2012 Bonds, $42,000,000 will be used to fund the rest of the Automated Meter Reading program and the remainder was used to refund all of the outstanding $50,000,000 Water Revenue Subordinate Notes Series 2012 and to pay issuance costs. ADDITIONAL INFORMATION This financial report is designed to provide a general overview of the Division’s finances. Questions concerning any of the information provided in this report or requests for additional information should be addressed to the Office of the Finance Director, City Hall, Room 104, 601 Lakeside Avenue, Cleveland, Ohio 44114.

16
BASIC FINANCIAL STATEMENTS
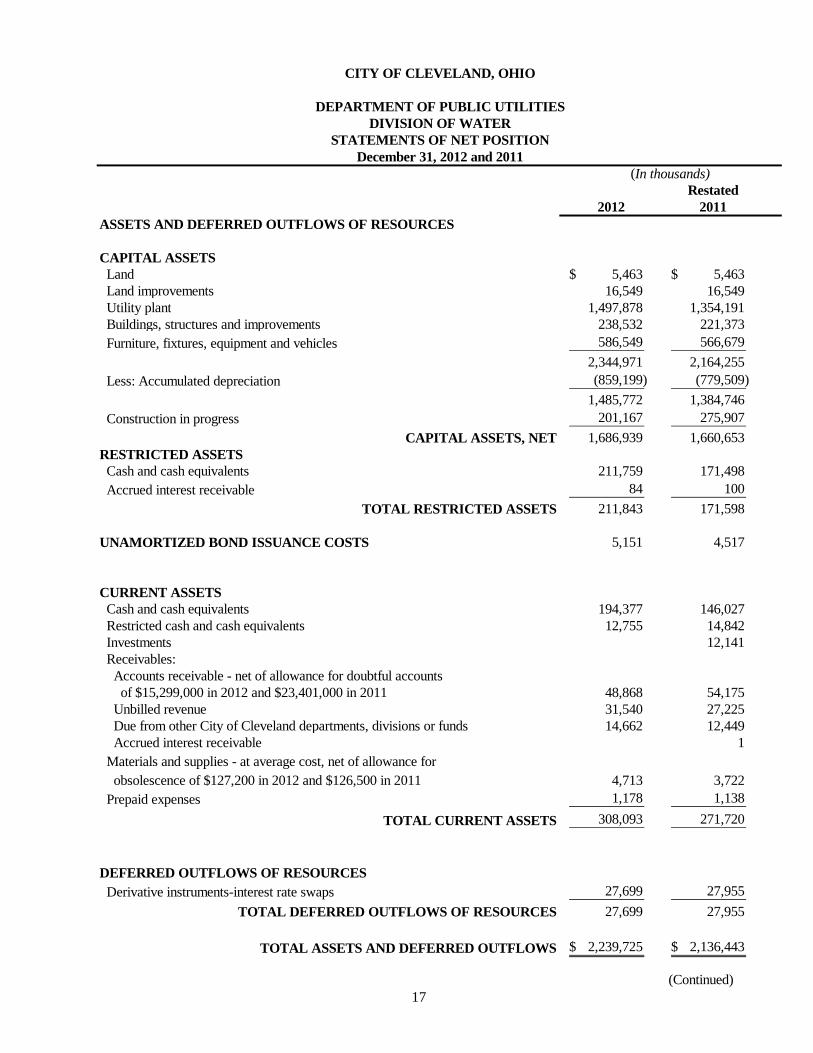
17
CITY OF CLEVELAND, OHIO
DEPARTMENT OF PUBLIC UTILITIESDIVISION OF WATER
STATEMENTS OF NET POSITIONDecember 31, 2012 and 2011
(In thousands)Restated
2012 2011ASSETS AND DEFERRED OUTFLOWS OF RESOURCES
CAPITAL ASSETS Land 5,463$ 5,463$ Land improvements 16,549 16,549 Utility plant 1,497,878 1,354,191 Buildings, structures and improvements 238,532 221,373 Furniture, fixtures, equipment and vehicles 586,549 566,679
2,344,971 2,164,255 Less: Accumulated depreciation (859,199) (779,509)
1,485,772 1,384,746 Construction in progress 201,167 275,907
CAPITAL ASSETS, NET 1,686,939 1,660,653 RESTRICTED ASSETS Cash and cash equivalents 211,759 171,498 Accrued interest receivable 84 100
TOTAL RESTRICTED ASSETS 211,843 171,598
UNAMORTIZED BOND ISSUANCE COSTS 5,151 4,517
CURRENT ASSETS Cash and cash equivalents 194,377 146,027 Restricted cash and cash equivalents 12,755 14,842 Investments 12,141 Receivables: Accounts receivable - net of allowance for doubtful accounts of $15,299,000 in 2012 and $23,401,000 in 2011 48,868 54,175 Unbilled revenue 31,540 27,225 Due from other City of Cleveland departments, divisions or funds 14,662 12,449 Accrued interest receivable 1 Materials and supplies - at average cost, net of allowance for obsolescence of $127,200 in 2012 and $126,500 in 2011 4,713 3,722 Prepaid expenses 1,178 1,138
TOTAL CURRENT ASSETS 308,093 271,720
DEFERRED OUTFLOWS OF RESOURCES Derivative instruments-interest rate swaps 27,699 27,955
TOTAL DEFERRED OUTFLOWS OF RESOURCES 27,699 27,955
TOTAL ASSETS AND DEFERRED OUTFLOWS 2,239,725$ 2,136,443$
(Continued)

18
CITY OF CLEVELAND, OHIO
DEPARTMENT OF PUBLIC UTILITIESDIVISION OF WATER
STATEMENTS OF NET POSITIONDecember 31, 2012 and 2011
(In thousands)Restated
2012 2011NET POSITION, LIABILITIES AND DEFERRED INFLOWS OF RESOURCES
NET POSITION Net investment in capital assets 914,193$ 899,231$ Restricted for capital projects 99 Restricted for debt service 87,602 93,601 Unrestricted 257,578 204,911
TOTAL NET POSITION 1,259,472 1,197,743
LIABILITIES
LONG-TERM OBLIGATIONS-excluding amounts due within one year Revenue bonds 766,975 657,481 OWDA loans 100,700 106,595 Accrued wages and benefits 1,365 1,464
TOTAL LONG-TERM OBLIGATIONS 869,040 765,540
CURRENT LIABILITIES Current portion of long-term debt, due within one year and short-term notes 37,804 90,085 Accounts payable 4,951 4,870 Current payable from restricted assets 12,755 14,842 Due to other City of Cleveland departments, divisions or funds 2,630 2,770 Accrued interest payable 13,521 12,727 Current portion of accrued wages and benefits 10,083 10,079 Other accrued expenses 395 395 Customer deposits and other liabilities 1,375 9,437
TOTAL CURRENT LIABILITIES 83,514 145,205 TOTAL LIABILITIES 952,554 910,745
DEFERRED INFLOW OF RESOURCES Derivative instruments-interest rate swaps 27,699 27,955
TOTAL DEFERRED INFLOWS OF RESOURCES 27,699 27,955
TOTAL NET POSITION, LIABILITIES AND DEFERRED INFLOWS 2,239,725$ 2,136,443$
See notes to financial statements. (Concluded)

19
This page intentionally left blank.

20
CITY OF CLEVELAND, OHIO
DEPARTMENT OF PUBLIC UTILITIESDIVISION OF WATER
STATEMENTS OF REVENUES, EXPENSES AND CHANGES IN NET POSITIONFor the Years Ended December 31, 2012 and 2011
(In thousands)Restated
2012 2011
OPERATING REVENUES Charges for services 280,323$ 236,626$
TOTAL OPERATING REVENUES 280,323 236,626
OPERATING EXPENSESOperations 103,687 100,221 Maintenance 45,482 46,012 Depreciation 67,455 61,611
TOTAL OPERATING EXPENSES 216,624 207,844
OPERATING INCOME (LOSS) 63,699 28,782
NON-OPERATING REVENUE (EXPENSE) Investment income 1,965 2,349 Interest expense (28,322) (27,071) Amortization of bond issuance costs, premiums, and discounts 4,284 2,682 Gain (loss) on disposal of capital assets (15)
TOTAL NON-OPERATING REVENUE (EXPENSE), NET (22,088) (22,040)
INCOME (LOSS) BEFORE CAPITAL ANDOTHER CONTRIBUTIONS 41,611 6,742
CAPITAL AND OTHER CONTRIBUTIONS 20,118 558 INCREASE (DECREASE) IN NET POSITION 61,729 7,300
NET POSITION, beginning of year (as restated) 1,197,743 1,190,443
NET POSITION, end of year 1,259,472$ 1,197,743$
See notes to financial statements.

CITY OF CLEVELAND, OHIO
DEPARTMENT OF PUBLIC UTILITIESDIVISION OF WATER
STATEMENTS OF CASH FLOWSFor the Years Ended December 31, 2012 and 2011
(In thousands)2012 2011
CASH FLOWS FROM OPERATING ACTIVITIES Cash received from customers 264,534$ 229,625$ Cash payments to suppliers for goods or services (66,921) (64,085) Cash payments to employees for services (76,526) (75,905) Other 140 (226)
NET CASH PROVIDED BY(USED FOR) OPERATING ACTIVITIES 121,227 89,409
CASH FLOWS FROM CAPITAL AND RELATEDFINANCING ACTIVITIES Acquisition and construction of capital assets (67,355) (89,005) Capital grant proceeds 558 Proceeds of OWDA loan 1,362 Principal paid on long-term debt (90,239) (93,407) Interest paid on long-term debt (34,236) (39,158) Cash paid to escrow agent for refunding (50,000) (104,676) Proceeds of bonds, premiums and discounts 142,924 104,626 Proceeds from sale of notes 50,000 50,000
NET CASH PROVIDED BY (USED FOR)CAPITAL AND RELATED FINANCING ACTIVITIES (48,906) (169,700)
CASH FLOWS FROM INVESTING ACTIVITIES Purchase of investment securities (99,959) (12,044) Proceeds from sale and maturity of investment securities 112,004 6,998 Interest received on investments 2,158 2,588
NET CASH PROVIDED BY (USED FOR) INVESTING ACTIVITIES 14,203 (2,458)
NET INCREASE (DECREASE) IN CASH AND CASH EQUIVALENTS 86,524 (82,749)
CASH AND CASH EQUIVALENTS, beginning of year 332,367 415,116
CASH AND CASH EQUIVALENTS, end of year 418,891$ 332,367$
(Continued)
21
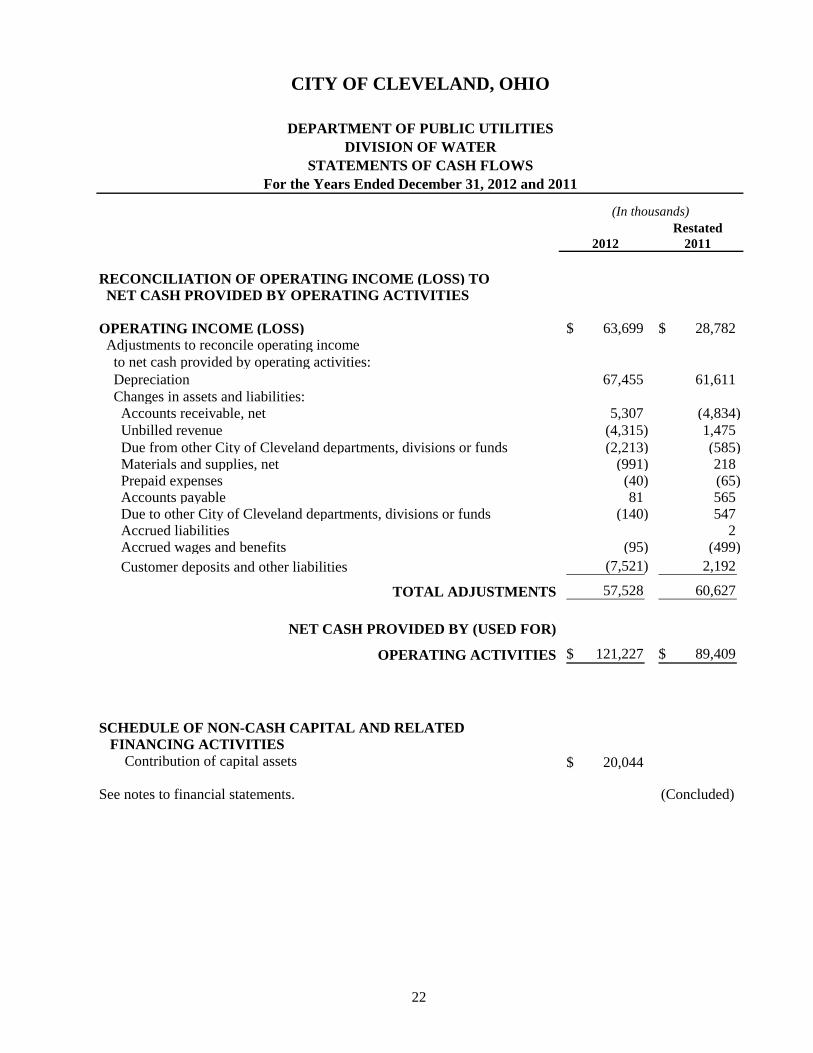
CITY OF CLEVELAND, OHIO
DEPARTMENT OF PUBLIC UTILITIESDIVISION OF WATER
STATEMENTS OF CASH FLOWSFor the Years Ended December 31, 2012 and 2011
(In thousands)Restated
2012 2011
RECONCILIATION OF OPERATING INCOME (LOSS) TO NET CASH PROVIDED BY OPERATING ACTIVITIES
OPERATING INCOME (LOSS) 63,699$ 28,782$ Adjustments to reconcile operating income to net cash provided by operating activities: Depreciation 67,455 61,611 Changes in assets and liabilities: Accounts receivable, net 5,307 (4,834) Unbilled revenue (4,315) 1,475 Due from other City of Cleveland departments, divisions or funds (2,213) (585) Materials and supplies, net (991) 218 Prepaid expenses (40) (65) Accounts payable 81 565 Due to other City of Cleveland departments, divisions or funds (140) 547 Accrued liabilities 2 Accrued wages and benefits (95) (499) Customer deposits and other liabilities (7,521) 2,192
TOTAL ADJUSTMENTS 57,528 60,627
NET CASH PROVIDED BY (USED FOR)
OPERATING ACTIVITIES 121,227$ 89,409$
SCHEDULE OF NON-CASH CAPITAL AND RELATED FINANCING ACTIVITIES Contribution of capital assets 20,044$
See notes to financial statements. (Concluded)
22

CITY OF CLEVELAND, OHIO DEPARTMENT OF PUBLIC UTILITIES
DIVISION OF WATER
NOTES TO FINANCIAL STATEMENTS For the Years Ended December 31, 2012 and 2011
23
NOTE A – SUMMARY OF SIGNIFICANT ACCOUNTING POLICIES The Division of Water (the Division) is reported as an Enterprise Fund of the City of Cleveland’s Department of Public Utilities and is a part of the City of Cleveland’s (the City) primary government. The Division was created for the purpose of supplying water services to customers within the metropolitan area. The following is a summary of the more significant accounting policies. Reporting Model and Basis of Accounting: The accounting policies and financial reporting practices of the Division comply with accounting principles generally accepted in the United States of America applicable to governmental units. In November of 2010, Governmental Accounting Standards Board (GASB) Statement No. 60, Accounting and Financial Reporting for Service Concession Arrangements was issued. This Statement is effective for fiscal periods beginning after December 15, 2011. The objective of this Statement is to improve financial reporting by addressing issues related to service concession arrangements (SCAs), which are a type of public-private or public-public partnership. The Division has determined that GASB Statement No. 60 has no impact on its financial statements as of December 31, 2012.
In December of 2010, Governmental Accounting Standards Board (GASB) Statement No. 62, Codification of Accounting and Financial Reporting Guidance Contained in Pre-November 30, 1989 FASB and AICPA Pronouncements was issued. This Statement is effective for fiscal periods beginning after December 15, 2011. The objective of this Statement is to incorporate into the GASB’s authoritative literature certain accounting and financial reporting guidance that is included in the following pronouncements issued on or before November 30, 1989, which does not conflict with or contradict GASB pronouncements: (1) Financial Accounting Standards Board (FASB) Statements and Interpretations, (2) Accounting Principles Board Opinions and (3) Accounting Research Bulletins of the American Institute of Certified Public Accountants’ (AICPA) Committee on Accounting Procedure. As required, the Division has implemented GASB Statement No. 62 effective for the 2012 fiscal year.
In June of 2011, Governmental Accounting Standards Board (GASB) Statement No. 63, Financial Reporting of Deferred Outflows of Resources, Deferred Inflows of Resources, and Net Position was issued. This Statement is effective for fiscal periods beginning after December 15, 2011. This Statement provides financial reporting guidance for deferred outflows of resources and deferred inflows of resources. As required, the Division has implemented GASB Statement No. 63 effective for the 2012 fiscal year. In June of 2011, Governmental Accounting Standards Board (GASB) Statement No. 64, Derivative Instruments: Application of Hedge Accounting Termination Provision was issued. This Statement is effective for fiscal periods beginning after June 15, 2011. The objective of this Statement is to clarify whether an effective hedging relationship continues after the replacement of a swap counterparty or a swap counterparty’s credit support provider. As required, the Division has implemented GASB Statement No. 64 effective for the 2012 fiscal year.

CITY OF CLEVELAND, OHIO DEPARTMENT OF PUBLIC UTILITIES
DIVISION OF WATER
NOTES TO FINANCIAL STATEMENTS (Continued) For the Years Ended December 31, 2012 and 2011
24
NOTE A – SUMMARY OF SIGNIFICANT ACCOUNTING POLICIES (Continued) The Division’s net position is accounted for in the accompanying statement of net position and the net position is divided into the following categories:
• Net investment in capital assets
• Amount restricted for capital projects
• Amount restricted for debt service
• Remaining unrestricted amount
In addition, certain financial information regarding the Division is included in these footnotes. The implementation of the new GASB statements did not result in a change in the Division’s beginning net position/equity balance as previously reported.
Basis of Accounting: The Division’s financial statements are prepared under the accrual basis of accounting. Under this method, revenues are recognized when earned and measurable and expenses are recognized as incurred. Revenues: Revenues are derived primarily from sales of water to residential, commercial and industrial customers based upon actual water consumption and from a fixed charge based upon meter size. Water rates are authorized by City Council and billings are made on a cyclical basis. Estimates for services between the ends of the various cycles and the end of the year are recorded as unbilled revenue. Statement of Cash Flows: The Division utilizes the direct method of reporting for the statement of cash flows as defined by GASB Statement No. 9, Reporting Cash Flows of Proprietary and Non-expendable Trust Funds and Governmental Entities That Use Proprietary Fund Accounting. In a statement of cash flows, cash receipts and cash payments are classified according to operating, noncapital financing, capital and related financing, and investment activities. Cash and Cash Equivalents: Cash and cash equivalents represent cash on hand and cash deposits maintained by the City Treasurer on behalf of the Division. Cash equivalents are defined as highly liquid investments with a maturity of three months or less when purchased and include certificates of deposit, U.S. Treasury bills, State Treasury Asset Reserve of Ohio (STAROhio) and repurchase agreements. The City’s policy is to enter into repurchase agreements with local commercial banks and to obtain confirmation of securities pledged. Investments: The Division follows the provisions of GASB Statement No. 31, Accounting and Financial Reporting for Certain Investments and External Investment Pools, which requires governmental entities to report certain investments at fair value in the balance sheet and recognize the corresponding change in the fair value of investments in the year in which the change occurred. The fair value is based on quoted market prices.

CITY OF CLEVELAND, OHIO DEPARTMENT OF PUBLIC UTILITIES
DIVISION OF WATER
NOTES TO FINANCIAL STATEMENTS (Continued) For the Years Ended December 31, 2012 and 2011
25
NOTE A – SUMMARY OF SIGNIFICANT ACCOUNTING POLICIES (Continued) The City has invested funds in STAROhio during 2012 and 2011. STAROhio is an investment pool managed by the State Treasurer’s Office, which allows governments within the State to pool their funds for investment purposes. STAROhio is not registered with the SEC as an investment company, but does operate in a manner consistent with Rule 2a7 of the Investment Company Act of 1940. Investments in STAROhio are valued at STAROhio’s share price, which is the price the investment could be sold for on December 31, 2012 and 2011. Restricted Assets: Proceeds from debt and amounts set aside in various fund accounts for payment of revenue bonds are classified as restricted assets since their use is limited by the bond indentures. Capital Assets and Depreciation: Capital assets are stated on the basis of historical cost, or if contributed, at fair market value as of the date received. Depreciation is computed by allocating the cost of capital assets over the estimated useful lives of the assets using the straight-line method. A capital asset is defined as an item with a useful life in excess of one year and an individual cost of more than $5,000 for land, furniture, fixtures, equipment and vehicles and $10,000 for all other assets. When capital assets are disposed, the cost and related accumulated depreciation are removed from the accounts with gains or losses on disposition being reflected in operations. The estimated useful lives are as follows:
Utility plant 5 to 100 yearsLand improvements 15 to 100 yearsBuildings, structures and improvements 5 to 60 yearsFurniture, fixtures, equipment and vehicles 3 to 60 years
The Division’s policy is to capitalize interest on construction projects up to the point in time that the project is substantially completed. Capitalized interest is included in the cost of the assets and is depreciated on the straight-line basis over the estimated useful lives of such assets. The Division applies General Accounting Standards Board guidance pertaining to capitalization of interest costs for its revenue bonds. This statement requires capitalization of interest cost of eligible borrowings, less interest earned on investment of the related bond proceeds from the date of borrowing until the assets constructed from the bond proceeds are ready for their intended use. For 2012 and 2011, total interest costs incurred amounted to $37,094,000 and $39,260,000, respectively, of which $8,581,000 and $11,998,000, respectively, was capitalized, net of interest income of $191,000 in 2012 and $191,000 in 2011. Bond Issuance Costs, Discounts and Unamortized Losses on Debt Refundings: Bond issuance costs are recorded as deferred expenses, and unamortized original issuance discounts are netted against long-term debt. Both are amortized over the lives of the related bonds. Unamortized losses on debt refundings are netted against long-term debt and are amortized over the shorter of the remaining life of the defeased bond or the newly issued bond.

CITY OF CLEVELAND, OHIO DEPARTMENT OF PUBLIC UTILITIES
DIVISION OF WATER
NOTES TO FINANCIAL STATEMENTS (Continued) For the Years Ended December 31, 2012 and 2011
26
NOTE A – SUMMARY OF SIGNIFICANT ACCOUNTING POLICIES (Continued) Compensated Absences: The Division accrues for compensated absences such as vacation, sick leave and compensatory time using the termination payment method specified under GASB Statement No. 16, Accounting for Compensated Absences. These amounts are recorded as accrued wages and benefits in the accompanying statement of net position. The portion of the compensated absence liability that is not expected to be paid or utilized within one year is reported as a long-term liability. Normally, all vacation time is to be taken in the year available. The Division allows employees to carryover vacation from one year to the next. Sick days not taken may be accumulated until retirement. An employee is paid one-third of accumulated sick leave upon retirement, calculated at the three highest year average base salary rate, with the balance being forfeited. Interfund Transactions: During the course of normal operations the Division has numerous transactions between other City divisions and departments. Unpaid amounts at year end are generally reflected as due to or due from in the accompanying financial statements. Deferred Outflows/Inflows of Resources: In addition to assets, the statement of financial position will sometimes report a separate section for deferred outflows of resources. This separate financial statement element, deferred outflows of resources, represents a consumption of net position that applies to future period(s) and so will not be recognized as an outflow of resources (expense/expenditure) until then. In addition to liabilities, the statement of financial position will sometimes report a separate section for deferred inflows of resources. This separate financial statement element, deferred inflows of resources, represents an acquisition of net position that applies to future period(s) and so will not be recognized as an inflow of resources (revenues) until that time.

CITY OF CLEVELAND, OHIO DEPARTMENT OF PUBLIC UTILITIES
DIVISION OF WATER
NOTES TO FINANCIAL STATEMENTS (Continued) For the Years Ended December 31, 2012 and 2011
27
NOTE B – DEBT AND OTHER LONG-TERM OBLIGATIONS Debt outstanding at December 31, 2012 and 2011 is as follows:
OriginalInterest Rate Issuance 2012 2011
Water Revenue Bonds: Series G, 1993, due through 2021 5.50% 228,170$ 66,860$ 81,225$ Series N, 2005, due through 2023 3.50%-5.00% 64,480 28,015 33,045 Series O, 2007, due through 2037 4.25%-5.00% 143,570 130,610 133,315 Series P, 2007, due through 2028 4.00%-5.00% 135,410 113,280 119,095 Series Q, 2008, due through 2033 Variable 90,800 90,800 90,800 Series T, 2009, due through 2021 2.00%-5.00% 84,625 71,330 77,415 Series U, 2010, due through 2033 Variable 54,935 54,935 54,935 Series V, 2010, due through 2033 Variable 26,495 26,495 26,495 Series W, 2011, due through 2026 2.00%-5.00% 82,090 82,090 82,090 Series X, 2012, due through 2042 3.63%-5.00% 44,410 44,410 Second Lien Series A, 2012, due 2027 4.00%-5.00% 76,710 76,710 Ohio Water Development Authority Loans payable annually through 2032 0.00%-4.14% 151,625 107,404 112,680
1,183,320$ 892,939 811,095
Adjustments: Unamortized discount and premium 38,244 21,558 Unamortized loss on debt refunding (25,704) (28,492) Current portion (37,804) (40,085)
Total Long-Term Debt 867,675$ 764,076$
(In thousands)
Original
Interest Rate Issuance 2012 2011
Water Revenue Notes: Subordinate Lien Revenue Notes, due 2012 1.00% 50,000$ $ 50,000$
Total Short-Term Debt 50,000$ -$ 50,000$
(In thousands)

CITY OF CLEVELAND, OHIO DEPARTMENT OF PUBLIC UTILITIES
DIVISION OF WATER
NOTES TO FINANCIAL STATEMENTS (Continued) For the Years Ended December 31, 2012 and 2011
28
NOTE B – DEBT AND OTHER LONG-TERM OBLIGATIONS (Continued) Summary: Changes in long and short-term obligations for the year ended December 31, 2012 are as follows:
Balance Balance DueJanuary 1, December 31, Within
2012 Increase Decrease 2012 One Year
Water Revenue Bonds: Series G, 1993, due through 2021 81,225$ $ (14,365)$ 66,860$ 310$ Series N, 2005, due through 2023 33,045 (5,030) 28,015 5,280 Series O, 2007, due through 2037 133,315 (2,705) 130,610 Series P, 2007, due through 2028 119,095 (5,815) 113,280 Series Q, 2008, due through 2033 90,800 90,800 Series T, 2009, due through 2021 77,415 (6,085) 71,330 6,180 Series U, 2010, due through 2033 54,935 54,935 Series V, 2010, due through 2033 26,495 26,495 Series W, 2011, due through 2026 82,090 82,090 19,330 Series X, 2012, due through 2042 44,410 44,410 Second Lien Series A 2012, due through 2027 76,710 76,710 Ohio Water Development Authority Loans payable annually through 2032 112,680 963 (6,239) 107,404 6,704
Total revenue bonds/loans 811,095 122,083 (40,239) 892,939 37,804 Accrued wages and benefits 11,543 9,984 (10,079) 11,448 10,083
Total 822,638$ 132,067$ (50,318)$ 904,387$ 47,887$
(In thousands)
Balance Balance DueJanuary 1, December 31, Within
2012 Increase Decrease 2012 One Year
Water Revenue Notes: Subordinate Lien Revenue Notes, due 2012 50,000$ $ (50,000)$ -$ $ Subordinate Lien Revenue Notes, due 2013 50,000 (50,000) -
Total revenue notes 50,000$ 50,000$ (100,000)$ -$ -$
(In thousands)
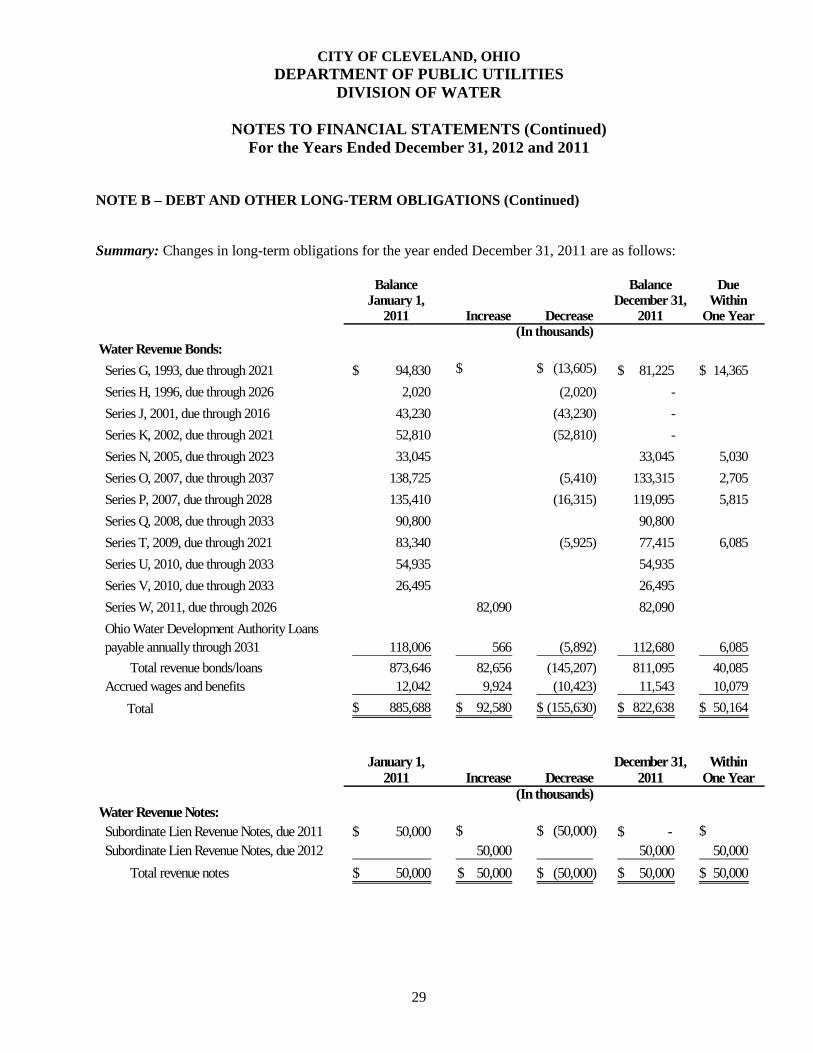
CITY OF CLEVELAND, OHIO DEPARTMENT OF PUBLIC UTILITIES
DIVISION OF WATER
NOTES TO FINANCIAL STATEMENTS (Continued) For the Years Ended December 31, 2012 and 2011
29
NOTE B – DEBT AND OTHER LONG-TERM OBLIGATIONS (Continued) Summary: Changes in long-term obligations for the year ended December 31, 2011 are as follows:
Balance Balance DueJanuary 1, December 31, Within
2011 Increase Decrease 2011 One Year
Water Revenue Bonds: Series G, 1993, due through 2021 94,830$ $ (13,605)$ 81,225$ 14,365$ Series H, 1996, due through 2026 2,020 (2,020) - Series J, 2001, due through 2016 43,230 (43,230) - Series K, 2002, due through 2021 52,810 (52,810) - Series N, 2005, due through 2023 33,045 33,045 5,030 Series O, 2007, due through 2037 138,725 (5,410) 133,315 2,705 Series P, 2007, due through 2028 135,410 (16,315) 119,095 5,815 Series Q, 2008, due through 2033 90,800 90,800 Series T, 2009, due through 2021 83,340 (5,925) 77,415 6,085 Series U, 2010, due through 2033 54,935 54,935 Series V, 2010, due through 2033 26,495 26,495 Series W, 2011, due through 2026 82,090 82,090 Ohio Water Development Authority Loans payable annually through 2031 118,006 566 (5,892) 112,680 6,085 Total revenue bonds/loans 873,646 82,656 (145,207) 811,095 40,085 Accrued wages and benefits 12,042 9,924 (10,423) 11,543 10,079 Total 885,688$ 92,580$ (155,630)$ 822,638$ 50,164$
(In thousands)
January 1, December 31, Within
2011 Increase Decrease 2011 One Year
Water Revenue Notes: Subordinate Lien Revenue Notes, due 2011 50,000$ $ (50,000)$ $ - $ Subordinate Lien Revenue Notes, due 2012 50,000 50,000 50,000 Total revenue notes 50,000$ 50,000$ (50,000)$ 50,000$ 50,000$
(In thousands)

CITY OF CLEVELAND, OHIO DEPARTMENT OF PUBLIC UTILITIES
DIVISION OF WATER
NOTES TO FINANCIAL STATEMENTS (Continued) For the Years Ended December 31, 2012 and 2011
30
NOTE B – DEBT AND OTHER LONG-TERM OBLIGATIONS (Continued) Minimum principal and interest payments on long-term debt for the next five years and thereafter are as follows:
Principal Interest Total
2013 37,804$ 37,900$ 75,704$ 2014 46,829 38,119 84,948 2015 48,341 36,082 84,423 2016 48,657 33,813 82,470 2017 51,400 31,405 82,805 2018-2022 245,174 121,885 367,059 2023-2027 232,413 67,856 300,269 2028-2032 113,780 30,193 143,973 2033-2037 64,785 10,298 75,083 2038-2042 14,565 1,893 16,458
Total 903,748$ 409,444$ 1,313,192$ .
(In thousands)
The above schedule of minimum principal and interest payments on long-term debt includes the amortization on ten loans provided to the City by the Ohio Water Development Authority (OWDA). OWDA provided the City with the amount expected to be financed, the interest rate, initial repayment date and other significant items(s) for each of the ten loans. From the information received, the City prepared a detailed amortization schedule for each loan based upon the amount expected to be financed. However, the amortization schedule is tentative and will be adjusted if, and when, OWDA revises the amount to be financed. Further, OWDA requires the City to begin making semi-annual payments for each loan based on the agreed upon initial repayment date, regardless of whether the City has received all loan proceeds or has completed the project(s). In 2012, the Division expended another $817,000 for the Baldwin Residuals and Fairmount Reservoir. The OWDA loan associated with this project is a zero percent loan for the face value of $8,304,000 which matures January 1, 2031. The Division also expended $146,000 on the Crown Chemical project which is funded by a 2.0% OWDA loan maturing in July 2032.

CITY OF CLEVELAND, OHIO DEPARTMENT OF PUBLIC UTILITIES
DIVISION OF WATER
NOTES TO FINANCIAL STATEMENTS (Continued) For the Years Ended December 31, 2012 and 2011
31
NOTE B – DEBT AND OTHER LONG-TERM OBLIGATIONS (Continued) At December 31, 2012, the amount financed on these ten loan projects, less principal payments made, totaled $118,213,000 and is reflected in the debt service payment schedule. However, the total of the actual loan balances received by the City was $107,404,000 as reflected on the schedules of long-term debt outstanding and changes in long-term debt obligations as of December 31, 2012. The difference of $10,809,000 will be received or accrued in future years. The Division has defeased certain Revenue Bonds by placing the proceeds of new bonds in an irrevocable trust to provide for all future debt service payments on the old bonds. In 2011, the Division deposited cash in the amount of $9,327,000 in an escrow account for the payment of future debt service requirements. Accordingly, the trust account assets and the liability for the defeased bonds are not included in the Division’s financial statements. The aggregate amount of defeased debt outstanding at December 31, 2012 and 2011 is as follows:
Bond Issue 2012 2011
Series H, 1996 $ 1,940$ Series J, 2001 52,335 Series K, 2002 116,420 Series O, 2007 2,825 2,825 Series P, 2007 6,075 6,075 Total 8,900$ 179,595$
(In thousands)
In 1996, the City authorized the adoption of the eighth supplemental indenture to amend and restate the existing indenture, subject to the receipt of consent of the requisite number of bondholders. With the issuance of the Series J bonds, the City reached the 66.7% consent required to enact the Amended and Restated Indenture. Effective October 5, 2001, all outstanding bonds and any future bonds are secured by the Amended and Restated Indenture. Under the new indenture, the bonds are no longer secured by a mortgage lien. All bonds are secured by the Division’s net revenues and by the pledged funds. The Division’s indentures have certain restrictive covenants and principally require that bond reserve funds be maintained and charges for fees to customers are sufficient amounts, as defined, to satisfy the obligations under the indenture agreements. In addition, special provisions exist regarding covenant violations, redemption of principal and maintenance of properties in good condition. The indenture requires that at all times the Division will charge rates and fees for the products and services of the waterworks system, so that revenues will be at least sufficient to provide funds for the payment in each year of the necessary operating and maintenance expenses of the waterworks system and the greater of (1) an amount equal to 1.25 times the payments of principal, premium, if any, and interest on the revenue bonds then outstanding due in that year or (2) an amount sufficient to maintain the required balances in all funds and accounts created under the indenture. As of December 31, 2012 and 2011, the Division was in compliance with the terms and requirements of the bond indenture.

CITY OF CLEVELAND, OHIO DEPARTMENT OF PUBLIC UTILITIES
DIVISION OF WATER
NOTES TO FINANCIAL STATEMENTS (Continued) For the Years Ended December 31, 2012 and 2011
32
NOTE B – DEBT AND OTHER LONG-TERM OBLIGATIONS (Continued) The indenture establishes the following fund accounts for the application of revenues: Revenue Fund: All revenues will be deposited into this fund and will be used for payment of current operating expenses and deposits into other funds. An amount equal to one-sixth of the operating expenses, before depreciation, for the preceding fiscal year must be maintained in this fund. Debt Service Fund: Deposits will be made from the revenue fund to cover succeeding principal and interest payments as they become due on the revenue bonds. Debt Service Reserve Fund: Deposits will be made to this fund if the amount in the debt service fund at any time is less than the debt service reserve requirement. Amounts in the fund were deposited from the proceeds of the revenue bonds and represent the maximum annual debt service requirement of these bonds. Contingency Fund: The balance in this fund must be maintained at $3,500,000. Construction Fund: Proceeds from the revenue bonds were deposited into this fund to be used, along with earnings from investments of amounts held therein, for the payment of capital costs. Capital costs include all costs of additions, extensions, renewals, replacements, alterations, betterments and any other capital improvements to the waterworks system. Amounts held in this fund are subject to a lien in favor of bondholders and may be used to pay principal of outstanding revenue bonds to the extent that amounts in all other funds are insufficient. No payments need be made into a fund if the amounts in such fund are equal to the required fund balance, if any. Amounts held in any fund may be invested by the City Treasurer or the trustee in permitted investments. However, the use of funds is limited by the bond indenture and accordingly, the funds are classified as restricted assets in the accompanying financial statements. Effective October 24, 2012, the City issued $44,410,000 of Senior Lien Water Revenue Bonds, Series X, 2012 and $76,710,000 of, Second Lien Water Revenue Bonds, Series A, 2012. Proceeds of the Series X Bonds will be used to pay costs of improvements to the Waterworks System and to pay costs of issuing the bonds. From the proceeds of the Series A 2012 Bonds, $42,000,000 will be used to fund the rest of the Automated Meter Reading program and the remainder was used to refund all of the outstanding $50,000,000 Water Revenue Subordinate Notes, Series 2012 and to pay issuance costs. In conjunction with the issuance of the Second Lien Water Revenue Bonds, Series A, 2012 in October 2012, the Division established a Subordinate Bonds indenture. Bonds issued under this indenture are special obligations of the City payable solely from and secured solely by a pledge of and lien on the Subordinate Pledged Revenues and the Subordinate Pledged funds. The Subordinate Pledged Revenues generally consist of the net revenues of the Division which remain after the payment of all operating expenses and the deposit of all funds required to be made on the Senior Bonds. Bonds issued under this indenture are subordinate to those issued as senior lien bonds under the Amended and Restated Indenture.

CITY OF CLEVELAND, OHIO DEPARTMENT OF PUBLIC UTILITIES
DIVISION OF WATER
NOTES TO FINANCIAL STATEMENTS (Continued) For the Years Ended December 31, 2012 and 2011
33
NOTE B – DEBT AND OTHER LONG-TERM OBLIGATIONS (Continued) On July 24, 2012, the City issued $50,000,000 Subordinate Lien Water Revenue Notes, Series 2012. Proceeds of the notes were used to retire the $50,000,000 Subordinate Lien Water Revenue Notes issued in 2011. The Series 2012 Notes were subsequently redeemed on November 1, 2012 from the proceeds of the Second Lien Series A, 2012 Bonds. The original notes, which were issued in 2010, provided a portion of the funds needed for a new automated meter reading system for the Division. At the end of 2012, the Division no longer had any notes outstanding. In December 2011, the Division utilized cash on hand to defease $2,825,000 principal amount of outstanding Series O bonds and $6,075,000 principal amount of outstanding Series P bonds. The Division placed $9,327,000 in an irrevocable trust account which will be used to pay principal and interest on the defeased bonds. As a result the bonds are considered defeased and the liability for the bonds has been removed from long-term debt. Effective July 26, 2011, the Division issued $50,000,000 of Subordinate Lien Water Revenue Notes. The notes, which mature on July 26, 2012, refunded $50,000,000 Subordinate Lien Water Revenue Notes issued in 2010 to provide a portion of the funds needed for the acquisition and installation of a new automated meter reading system. Effective October 6, 2011, the City issued $82,090,000 Water Revenue Bonds, Series W, 2011. Proceeds of these bonds were used to refund all of 1) the outstanding $1,940,000 Waterworks Improvement and Refunding First Mortgage Revenue Bonds, Series H, 1996, 2) the outstanding $42,865,000 Waterworks Refunding Revenue Bonds, Series J, 2001 and 3) the outstanding $48,095,000 Water Revenue Bonds, Series K, 2002 and to pay issuance costs. Net proceeds of the Series W Bonds, amounts then on deposit in the Series H, J and K bond funds and an amount released from the debt service reserve fund all totaling $95,349,171 were placed in an irrevocable escrow account to pay the principal and interest on the refunded bonds on January 1, 2012. As a result, the refunded bonds were defeased and the liability for these bonds has been removed from long-term debt. The City completed the refunding in order to achieve debt service savings of approximately $9,527,000 or an economic gain (the difference between the present values of the old and new debt service payments) of approximately $8,955,000 or 9.6%. The City has pledged future water system revenues, net of specified operating expenses, to repay $785,535,000 in various Senior Lien Water Revenue Bonds and Subordinate Lien Bonds issued in various years since 1993. Proceeds from the bonds provided financing for Water System improvements. The bonds are payable from water system net revenues and are payable through 2042. Annual principal and interest payments on the bonds are expected to require less than 46% of net revenues. The total principal and interest remaining to be paid on the various Water Revenue Bonds is $1,165,786,000. Principal and interest requirements for the current year and total net revenues were $60,856,000 and $133,119,000, respectively. Interest Rate Swap Transactions: Upon the refunding of the Series M Bonds in 2009, the Division’s swap became associated with the Series Q, Series R and Series S Bonds. When the Series R and Series S Bonds were refunded in 2010, the swap associated with these bonds was transferred to a portion of the new Series U and Series V bonds.

CITY OF CLEVELAND, OHIO DEPARTMENT OF PUBLIC UTILITIES
DIVISION OF WATER
NOTES TO FINANCIAL STATEMENTS (Continued) For the Years Ended December 31, 2012 and 2011
34
NOTE B – DEBT AND OTHER LONG-TERM OBLIGATIONS (Continued) Terms: Simultaneously with the issuance of the City’s $175,000,000 Water Revenue Bonds, Series M, on August 10, 2004, the City entered into floating to fixed rate swap agreements with notional amounts equal to the total declining balance of the Series M Bonds. Bear Stearns Financial Products Inc. (Bear Stearns), (which has since been acquired by JPMorgan Chase Bank, N.A. (JPM)), was the counterparty on a two-thirds pro-rata share of the transaction and Morgan Stanley Capital Services Inc. (Morgan Stanley) is the counterparty on a one-third pro-rata share of the transaction. Under the original swap agreements for the Series M Bonds, the Water System was the fixed rate payor, paying a fixed rate of 3.533%. Each counterparty was a floating rate payor, with each paying the Water System 61.25% of one month LIBOR plus a spread of 28 basis points. Net payments were exchanged semiannually on January 1 and July 1. The obligation of the Water System to make periodic payments (but not any termination payment) was secured by a pledge of and lien on the net revenues of the Water System on a parity with the pledge and lien securing the payment of debt service on the bonds. Both the bond debt service payments on the Series M bonds and the periodic swap payments were insured by Financial Security Assurance (FSA). As part of the refunding of the Series M Bonds, the City amended and restated the original swap agreements to (a) eliminate the swap insurance and related insurer rights, (b) modify the payment frequency, (c) transfer the original swap agreement from Bear Stearns to JPM and (d) split each original swap agreement into two separate interest rate swaps in order to hedge separate series of bonds. The original Bear Stearns swap, which has been assumed by JPM, hedged the entire principal amount of Series R and certain maturities of the Series Q Bonds. The original Morgan Stanley swap hedged the entire principal amount of Series S and a portion of the Series Q Bonds. The floating rate received by the City was not altered. However, the fixed rate paid by the City was adjusted to 3.553% for the JPM swap and 3.5975% for the Morgan Stanley swap. The termination date for the swaps associated with the Series Q Bonds is January 1, 2021 while the termination date for the Series R and Series S swaps is January 1, 2033. Net payments are now exchanged monthly. With the refunding of the Series R and Series S Bonds, the JPM swap now hedges all but $200,000 of the Series U Bonds and the Morgan Stanley Swap hedges all but $200,000 of the Series V Bonds. Objective: The City entered into the swaps in order to maximize the savings associated with the refunding of the bonds. The actual savings to be realized by the Water System will depend upon the payments made on the variable rate bonds and the payments received under the swap agreement. Basis Risk: By entering into swaps based upon the 30 day LIBOR rate of interest, the City has undertaken basis risk associated with a change in tax rates and structure. While the average relationship between Securities Industry Financial Markets Association (SIFMA) (tax-exempt) and LIBOR (taxable) interest rates has been 67%, this relationship may not always apply. If the payments received from the counterparties are less than the amount paid on the variable rate bonds, the Water System must make up the difference in addition to paying the fixed rate resulting from the swap. As a result of the turmoil in the financial markets since 2008, the SIFMA/LIBOR ratio has been significantly higher than 67% for large periods of time. In addition, a reduction in federal income tax rates might increase the percentage relationship between SIFMA and LIBOR and may potentially increase the cost of the financing.

CITY OF CLEVELAND, OHIO DEPARTMENT OF PUBLIC UTILITIES
DIVISION OF WATER
NOTES TO FINANCIAL STATEMENTS (Continued) For the Years Ended December 31, 2012 and 2011
35
NOTE B – DEBT AND OTHER LONG-TERM OBLIGATIONS (Continued) Counterparty Risk: The City selected highly rated counterparties in order to minimize this risk. However, in the wake of the subprime mortgage crisis, Bear Stearns was acquired by JPM. The portion of the City’s swap with Bears Stearns as the counterparty has been assumed by JPM. Over the long-term it is possible that the credit strength of JPM and/or Morgan Stanley could change and this event could trigger a termination payment on the part of the City. Termination Risk: The swap agreement may be terminated prior to its stated termination date under certain circumstances. Upon termination, a payment may be owed by the City to JPM and Morgan Stanley, or by JPM and Morgan Stanley to the City, depending upon the prevailing economic circumstances at the time of the termination. Fair Value: The fair value of the swaps (including accrued amounts) at December 31, 2012 and December 31, 2011 as reported by JPM and Morgan Stanley totaled $27,699,000 and $27,955,000, respectively, which would be payable by the City. Derivative Instruments: Derivative instruments are contracts, the value of which depends on, or derives from, the value of an underlying asset, index or rate. The most common types of derivatives used by governments are interest rate swaps and interest rate locks. The City has entered into various derivative or hedging agreements since 1999. A detailed description of each outstanding derivative, including its terms, objectives, risks and fair value, can be found in the section discussing the bonds to which the derivative relates.
Classification Amount Classification Amount Notional
Hedging Derivatives:
Floating to fixed interest rate swaps 2008 Q Water Swap Deferred inflow 592$ Debt (9,569)$ 76,375$ 2010 U Water Swap Deferred outflow (192) Debt (12,096) 54,735 2010 V Water Swap Deferred outflow (144) Debt (6,034) 26,295
Changes in Fair Value
(In thousands)
Fair Value at December 31, 2012

CITY OF CLEVELAND, OHIO DEPARTMENT OF PUBLIC UTILITIES
DIVISION OF WATER
NOTES TO FINANCIAL STATEMENTS (Continued) For the Years Ended December 31, 2012 and 2011
36
NOTE B – DEBT AND OTHER LONG-TERM OBLIGATIONS (Continued)
Classification Amount Classification Amount Notional
Hedging Derivatives:
Floating to fixed interest rate swaps 2008 Q Water Swap Deferred outflow (2,210)$ Debt (10,161)$ 82,625$ 2010 U Water Swap Deferred outflow (5,467) Debt (11,904) 54,735 2010 V Water Swap Deferred outflow (2,614) Debt (5,890) 26,295
Changes in Fair Value
(In thousands)
Fair Value at December 31, 2011
The following table presents the objective and significant terms of the City’s derivative instruments at December 31, 2012, along with the credit rating of each swap counterparty.
Notional Effective Maturity CounterpartyBonds Type Objective Amount Date Date Terms Credit Rating
Water Series Q Pay Fixed Hedge of changes in cash 50,190,000$ 8/10/2004 1/1/2021 Pay 3.553%, receive Aa3/A+/A+Interest Rate Swap flow on the Series Q 61.25% of LIBOR + 28 bps
Water System Bonds
Water Series Q Pay Fixed Hedge of changes in cash 26,185,000$ 8/10/2004 1/1/2021 Pay 3.5975%, receive Baa1/A-/AInterest Rate Swap flow on the Series Q 61.25% of LIBOR + 28 bps
Water System Bonds
Water Series U Pay Fixed Hedge in changes in cash 54,735,000$ 2/12/2009 1/1/2033 Pay 3.553%, receive Aa3/A+/A+Interest Rate Swap flow on the Series U 61.25% of LIBOR + 28 bps
Water System Bonds
Water Series V Pay Fixed Hedge in changes in cash 26,295,000$ 2/12/2009 1/1/2033 Pay 3.5975%, receive Baa1/A-/AInterest Rate Swap flow on the Series V 61.25% of LIBOR + 28 bps
Water System Bonds
The following table presents the aggregate debt service requirements on the City’s hedged debt and net receipts/payments on the associated hedging derivative instruments as of December 31, 2012. These amounts assume that the interest rates on variable rate bonds and the reference rates in existence as of December 31, 2012 remain the same for the life of the hedging agreement. However, these rates will vary over time and the actual interest payments on the variable rate bonds and the net receipts/payments on the hedging derivative instruments will deviate from the numbers presented below.

CITY OF CLEVELAND, OHIO DEPARTMENT OF PUBLIC UTILITIES
DIVISION OF WATER
NOTES TO FINANCIAL STATEMENTS (Continued) For the Years Ended December 31, 2012 and 2011
37
NOTE B – DEBT AND OTHER LONG-TERM OBLIGATIONS (Continued)
Fiscal Year Ending HedgingDecember 31 Principal Interest Derivatives, Net Total
2013 $ 800$ 4,786$ 5,586$ 2014 800 4,522 5,322 2015 799 4,244 5,043 2016 801 4,186 4,987 2017 800 4,147 4,947
2018-2022 17,000 3,850 14,804 35,654 2023-2027 81,415 1,491 3,712 86,618 2028-2032 61,730 274 257 62,261
2033 12,085 2 1 12,088
Total 172,230$ 9,617$ 40,659$ 222,506$
(In thousands)
Ohio Water Development Authority (OWDA) Loans: These loans are payable from net revenues derived from the Waterworks System. These obligations do not have a lien on revenues of the Division. The Division received an increase in OWDA loans in the amount of $963,000 and $566,000 during 2012 and 2011, respectively. The current loans are being paid directly to the contractor by the State of Ohio, but accounted for as if the Division received and disbursed those monies.
NOTE C – DEPOSITS AND INVESTMENTS Deposits: The carrying amount of the Division’s deposits at December 31, 2012 and 2011 totaled $133,643,000 and $126,903,000, respectively, and the Division’s bank balances were $134,956,000 and $128,025,000, respectively. The differences represent positions in pooled bank accounts and normal reconciling items. Based on the criteria described in GASB Statement No. 3, Deposits with Financial Institutions, Investments (including Repurchase Agreements), and Reverse Repurchase Agreements and GASB Statement No. 40, Deposit and Investment Risk Disclosures – an Amendment of GASB Statement No. 3, $134,956,000 and $128,025,000 of the bank balances at December 31, 2012 and 2011, respectively, were insured or collateralized with securities held by the City or by its agent in the City’s name. Custodial credit risk for deposits is the risk that in the event of bank failure, the Divisions will not be able to recover deposits or collateral for securities that are in possession of an outside party. At year end, the Division’s deposits were fully insured or collateralized. All deposits are collateralized with eligible securities pledged and deposited either with the City or with a qualified trustee by the financial institution as security for repayment of all public monies deposited in the financial institution whose market value at all times is equal to at least 110% of the carrying value of the deposits being secured.

CITY OF CLEVELAND, OHIO DEPARTMENT OF PUBLIC UTILITIES
DIVISION OF WATER
NOTES TO FINANCIAL STATEMENTS (Continued) For the Years Ended December 31, 2012 and 2011
38
NOTE C – DEPOSITS AND INVESTMENTS (Continued) Investments: The City’s investment policies are governed by state statutes and City ordinances which authorize the City to invest in obligations of the U.S. Treasury, agencies and instrumentalities; State Treasurer Asset Reserve Fund (STAROhio); commercial paper; US Government Money Market Mutual Funds; guaranteed investment contracts; manuscript debt; bonds and other State of Ohio obligations; certificates of deposit; and repurchase transactions. Such repurchase transactions must be purchased from financial institutions or registered broker/dealers and are not to exceed a period of one year and confirmation of securities pledged must be obtained. Under City policy, investments are limited to repurchase agreements, U.S. Government securities, STAROhio, certificates of deposit, commercial paper and investments in certain money market mutual funds. Generally, investments are recorded in segregated accounts by way of book entry through the bank's commercial or trust department and are kept at the Federal Reserve Bank in the depository institution's separate custodial account for the City, apart from the assets of the depository institution. Ohio statute prohibits the use of reverse repurchase agreements. Investment securities are exposed to various risks such as interest rate, market and credit. Market values of securities fluctuate based on the magnitude of changing market conditions; significant changes in market conditions could materially affect portfolio value. Interest rate risk: As a means of limiting its exposure to fair value losses caused by rising interest rates, the Division invests primarily in short-term investments maturing within five years from the date of purchase. The intent is to avoid the need to sell securities prior to maturity. Investment maturities are disclosed in the table below.
Custodial Credit Risk: For an investment, custodial credit risk is the risk that, in the event of the failure of the counterparty, the Division will not be able to recover the value of the investments or collateral securities that are in the possession of an outside party. The Division does not have an investment policy dealing with investment custodial credit risk beyond the requirement in the State statute. Credit Risk: The Division’s investments as of December 31, 2012 and 2011 include U.S. Agencies, STAROhio, commercial paper, mutual funds, guaranteed investment contracts and other investments. The Division maintains the highest ratings for their investments. Investments in STAROhio and Allegiant Government Money Market Funds carry a rating of AAAm, which is the highest money market fund rating given by Standard & Poor’s. The Division’s investment in U.S. Bank N.A. Open Commercial Paper carries a Standard & Poor’s rating of A-1+. Ohio law requires that STAROhio maintain the highest rating provided by at least one nationally recognized standard rating service.

CITY OF CLEVELAND, OHIO DEPARTMENT OF PUBLIC UTILITIES
DIVISION OF WATER
NOTES TO FINANCIAL STATEMENTS (Continued) For the Years Ended December 31, 2012 and 2011
39
NOTE C – DEPOSITS AND INVESTMENTS (Continued) Concentration of Credit Risk: The Division places a limitation on the amount it may invest in any one issuer to help minimize the concentration of credit risk. The Division had the following investments at December 31, 2012 and 2011, which include those classified as cash and cash equivalents in the statement of net position in accordance with the provisions of GASB Statement No. 9 since they have a maturity of three months or less:
2012 2011 Investment MaturitiesType of Fair 2012 Fair 2011 Less than 1 - 5Investment Value Cost Value Cost One Year Years
U.S. Agency Obligations $ $ 12,141$ 12,045$ $ $STAROhio 63,604 63,604 32,134 32,134 63,604 Commercial Paper 89,164 89,164 135,521 135,521 89,164 Investment in Mutual Funds 94,252 94,252 959 959 94,252 Guaranteed Investment Contracts 36,850 36,850 36,850 36,850 36,850 Other Investments 1,378 1,378 1,378 Total Investments 285,248 285,248 217,605 217,509 248,398 36,850 Total Deposits 133,643 133,643 126,903 126,903 133,643 Total Deposits and Investments 418,891$ 418,891$ 344,508$ 344,412$ 382,041$ 36,850$
(In thousands)
These amounts are monies invested by the City Treasurer on behalf of the Division and are used in daily operations with excess monies invested daily in STAROhio and mutual funds. These investments are carried at cost which approximates market value.
As of December 31, 2012, the investments in STAROhio, commercial paper, mutual funds, guaranteed investment contracts and escrow are approximately 22%, 31%, 33%, 13% and 1%, respectively, of the Division’s total investments. As of December 31, 2011, the investments in U.S. Agency Obligations, STAROhio, commercial paper, mutual funds, and guaranteed investment contracts are approximately 6%, 15%, 62%, <1% and 17%, respectively, of the Division’s total investments.
The City’s current guaranteed investment contracts are not categorized as investments on the financial statements because they are reserved against future debt service requirements and may need to be liquidated prior to maturity.

CITY OF CLEVELAND, OHIO DEPARTMENT OF PUBLIC UTILITIES
DIVISION OF WATER
NOTES TO FINANCIAL STATEMENTS (Continued) For the Years Ended December 31, 2012 and 2011
40
NOTE D – CAPITAL ASSETS
Capital Asset Activity: Capital asset activity for the year ended December 31, 2012 was as follows:
Balance BalanceJanuary 1, December 31,
2012 Additions Deletions 2012
Capital assets, not being depreciated: Land 5,463$ $ $ 5,463$ Construction in progress 275,907 71,505 (146,245) 201,167 Total capital assets, not being depreciated 281,370 71,505 (146,245) 206,630
Capital assets, being depreciated: Land improvements 16,549 16,549 Utility plant 1,354,191 145,112 (1,425) 1,497,878 Buildings, structures and improvements 221,373 17,159 238,532
Furniture, fixtures, equipment and vehicles 566,679 21,158 (1,288) 586,549
Total capital assets, being depreciated 2,158,792 183,429 (2,713) 2,339,508 Less: Accumulated depreciation (779,509) (82,370) 2,680 (859,199)
Total capital assets being depreciated, net 1,379,283 101,059 (33) 1,480,309
Capital assets, net 1,660,653$ 172,564$ (146,278)$ 1,686,939$
(In thousands)

CITY OF CLEVELAND, OHIO DEPARTMENT OF PUBLIC UTILITIES
DIVISION OF WATER
NOTES TO FINANCIAL STATEMENTS (Continued) For the Years Ended December 31, 2012 and 2011
41
NOTE D – CAPITAL ASSETS (Continued)
Capital Asset Activity: Capital asset activity for the year ended December 31, 2011 was as follows:
RestatedBalance Balance
January 1, December 31,2011 Additions Deletions 2011
Capital assets, not being depreciated: Land 5,463$ $ $ 5,463$ Construction in progress 310,919 84,929 (119,941) 275,907 Total capital assets, not being depreciated 316,382 84,929 (119,941) 281,370
Capital assets, being depreciated: Land improvements 16,549 16,549 Utility plant 1,241,644 112,795 (248) 1,354,191 Buildings, structures and improvements 219,953 1,437 (17) 221,373
Furniture, fixtures, equipment and vehicles 565,014 5,709 (4,044) 566,679 Total capital assets, being depreciated 2,043,160 119,941 (4,309) 2,158,792 Less: Accumulated depreciation (722,207) (61,611) 4,309 (779,509)
Total capital assets being depreciated, net 1,320,953 58,330 - 1,379,283
Capital assets, net 1,637,335$ 143,259$ (119,941)$ 1,660,653$
(In thousands)
Capital assets were restated for 2011 due to the Division entering into amended Water Service Agreements with 21 member communities prior to 2011. Additional information is provided in Note J on page 45.
Commitments: The Division has outstanding commitments at December 31, 2012 and 2011 of approximately $93,395,000 and $84,911,000, respectively, for future capital expenditures. It is anticipated that these commitments will be financed from the Division’s cash balances; however, at the discretion of the Division, additional long-term debt may be issued in the future to finance a portion of the costs.

CITY OF CLEVELAND, OHIO DEPARTMENT OF PUBLIC UTILITIES
DIVISION OF WATER
NOTES TO FINANCIAL STATEMENTS (Continued) For the Years Ended December 31, 2012 and 2011
42
NOTE E – DEFINED BENEFIT PENSION PLAN
Ohio Public Employees Retirement System: All full-time employees, other than non-administrative full-time police officers and firefighters, participate in the Ohio Public Employees Retirement System (OPERS). OPERS administers three separate pension plans as described below:
1) The Traditional Pension Plan – a cost-sharing, multiple-employer defined benefit pension plan. 2) The Member-Directed Plan – a defined contribution plan in which the member invests both member
and employer contributions (employer contributions vest over five years at 20% per year). Under the Member-Directed Plan, members accumulate retirement assets equal to the value of member and (vested) employer contributions plus any investment earnings.
3) The Combined Plan – a cost-sharing, multiple-employer defined benefit pension plan. Under the Combined Plan, OPERS invests employer contributions to provide a formula retirement benefit similar in nature to the Traditional Pension Plan benefit. Member contributions, the investment of which is self-directed by the members, accumulate retirement assets in a manner similar to the Member-Directed Plan.
OPERS provides retirement, disability, survivor and death benefits and annual cost-of-living adjustments to members of the Traditional Pension and Combined Plans. Members of the Member-Directed Plan do not qualify for ancillary benefits. Authority to establish and amend benefits is provided in Chapter 145 of the Ohio Revised Code. OPERS issues a stand-alone financial report. Interested parties may obtain a copy by visiting https://www.opers.org/investments/cafr.shtml, writing to OPERS, 277 East Town Street, Columbus, Ohio 3215-4642, or by calling (614) 222-5601 or (800) 222-7377. 4
The Ohio Revised Code provides statutory authority for member and employer contributions. For 2012, member and employer contribution rates were consistent across all three plans. Member contribution rates were 10.00% in 2012, 2011 and 2010. The employer contribution rates were 14.00% of covered payroll in 2012, 2011 and 2010.
The Division’s required employer contributions to OPERS for the pension portion of all the plans for the years ending December 31, 2012, 2011 and 2010 were $5,452,000, $5,406,000 and $5,286,000 each year, respectively. The required payments due in 2012, 2011 and 2010 have been made.
In June 2012, the Governmental Accounting Standards Board (GASB) issued GASB Statement No. 68, Accounting and Financial Reporting for Pensions. This accounting standard replaces GASB Statement No. 27 and it is effective for employer fiscal years beginning after June 15, 2014.

CITY OF CLEVELAND, OHIO DEPARTMENT OF PUBLIC UTILITIES
DIVISION OF WATER
NOTES TO FINANCIAL STATEMENTS (Continued) For the Years Ended December 31, 2012 and 2011
43
NOTE F – OTHER POSTEMPLOYMENT BENEFITS
Ohio Public Employees Retirement System: All full-time employees, other than non-administrative full-time police officers and firefighters, participate in the Ohio Public Employees Retirement System (OPERS). OPERS administers three separate pension plans: The Traditional Pension Plan – a cost-sharing, multiple-employer defined benefit pension plan; the Member-Directed Plan – a defined contribution plan; and the Combined Plan – a cost-sharing, multiple-employer defined benefit pension plan that has elements of both a defined benefit and defined contribution plan. OPERS maintains a cost-sharing multiple employer defined benefit postemployment health care plan, which includes a medical plan, prescription drug program and Medicare Part B premium reimbursement, to qualifying members of both the Traditional Pension and the Combined Plans. Members of the Member-Directed Plan do not qualify for ancillary benefits, including postemployment health care coverage. In order to qualify for postemployment health care coverage, age-and-service retirees under the Traditional Pension and Combined Plans must have 10 or more years of qualifying Ohio service credit. Health care coverage for disability benefit recipients and qualified survivor benefit recipients is available. The health care coverage provided by OPERS meets the definition of an Other Postemployment Benefit (OPEB) as described in GASB Statement No. 45. The Ohio Revised Code permits, but does not mandate, OPERS to provide OPEB benefits to its eligible members and beneficiaries. Authority to establish and amend benefits is provided in Chapter 145 of the Ohio Revised Code. OPERS issues a stand-alone financial report. Interested parties may obtain a copy by visiting https://www.opers.org/investments/cafr.shtml, writing to OPERS, 277 East Town Street, Columbus, Ohio 43215-4642, or by calling (614) 222-5601 or (800) 222-7377. The Ohio Revised Code provides the statutory authority requiring public employers to fund post-retirement health care through their contributions to OPERS. A portion of each employer’s contribution to OPERS is set aside for funding of post-retirement health care benefits. Employer contribution rates are expressed as a percentage of the covered payroll of active members. The employer contribution rates were 14.00% of covered payroll in 2012, 2011 and 2010. The Ohio Revised Code currently limits the employer contribution to a rate not to exceed 14.00% of covered payroll. Active members do not make contributions to the OPEB Plan. OPERS’ Postemployment Health Care plan was established under and is administrated in accordance with, Internal Revenue Code 401(h). Each year, the OPERS Retirement Board determines the portion of the employer contribution rate that will be set aside for funding of postemployment health care benefits. Employer contribution rates used to fund postemployment benefits were 4.00% for members of the Traditional Plan in 2012 and 2011, 6.05% for members of the Combined Plan in 2012 and 2011 and 5.50% from January 1, 2010 through February 28, 2010 and 5.00% from March 1, 2010 through December 31, 2010 for both plans. Effective January 1, 2013, the portion of employer contributions allocated to health care was lowered to 1.00% for both plans, as recommended by the OPERS Actuary. The OPERS Retirement Board is also authorized to establish rules for the payment of a portion of the health care benefits provided, by the retiree or their surviving beneficiaries. Payment amounts vary depending on the number of covered dependents and the coverage selected. The Division’s actual contributions to OPERS to fund postemployment benefits were $2,180,000 in 2012, $2,162,000 in 2011 and $3,013,000 in 2010. The required payments due in 2012, 2011, and 2010 have been made.
Changes to the health care plan were adopted by the OPERS Board of Trustees on September 19, 2012, with a transition plan commencing January 1, 2014. With the recent passage of pension legislation under SB343 and the approved health care changes, OPERS expects to be able to consistently allocate 4.00% of the employer contributions toward the health care fund after the end of the transition period.

CITY OF CLEVELAND, OHIO DEPARTMENT OF PUBLIC UTILITIES
DIVISION OF WATER
NOTES TO FINANCIAL STATEMENTS (Continued) For the Years Ended December 31, 2012 and 2011
44
NOTE G – CONTINGENT LIABILITIES AND RISK MANAGEMENT Contingent Liabilities: Various claims are pending against the City involving the Division for personal injuries, property damage and other matters. The City is responsible for the suits. The City’s management is of the opinion that ultimate settlement of such claims will not result in a material adverse effect on the Division’s financial position, results of operations or cash flows. Risk Management: The Division is exposed to various risks of loss related to torts; thefts of, damage to and destruction of assets; errors and omissions; injuries to employees; and natural disasters. The Division is generally self-insured. No material losses, including incurred but not reported losses, occurred in 2012 or 2011. The City provides the choice of four separate health insurance plans for its employees. These plans are provided by two different insurers through commercial insurance. Operating funds are charged a monthly rate per employee, by type of coverage. The City participates in the State of Ohio workers’ compensation retrospective rating program. In accordance with GASB Statement No. 10, claims liabilities are reported when it is probable that a loss has occurred and the amount of the loss can be reasonably estimated. Liabilities include an amount for claims that have been incurred but not reported.
The result of the process to estimate the claims liability is not an exact amount as it depends on many complex factors, such as inflation, changes in legal doctrines, and damage awards. Accordingly, claims are re-evaluated periodically to consider the effects of inflation, recent claim settlement trends (including frequency and amount of pay-outs), and other economic and social factors.
The estimate of the claims liability also includes amounts for incremental claim adjustment expenses related to specific claims and other claim adjustment expenses, regardless of whether allocated to specific claims. Estimated recoveries, for example from salvage or subrogation, are another component of the claims liability estimate. Claims liability for the Division is immaterial.
NOTE H – RELATED PARTY TRANSACTIONS Revenues and Accounts Receivable: The Division provides water services to the City, including its various departments and divisions. Standard consumption rates are charged, except for the Division of Fire, public buildings and certain other facilities owned by the City, which by ordinance are provided free water services. The Division performs billing and collection services for the Division of Water Pollution Control for a fee. This fee is based on the number of billings made on behalf of that division during the year at the same rates as charged to other users of the billing system. Revenue realized from the Division of Water Pollution Control for such services was approximately $2,421,000 and $2,414,000 in 2012 and 2011, respectively. The Division also provides miscellaneous services to other departments and divisions of the City. Revenue realized from such services was approximately $3,586,000 and $3,716,000 in 2012 and 2011, respectively.
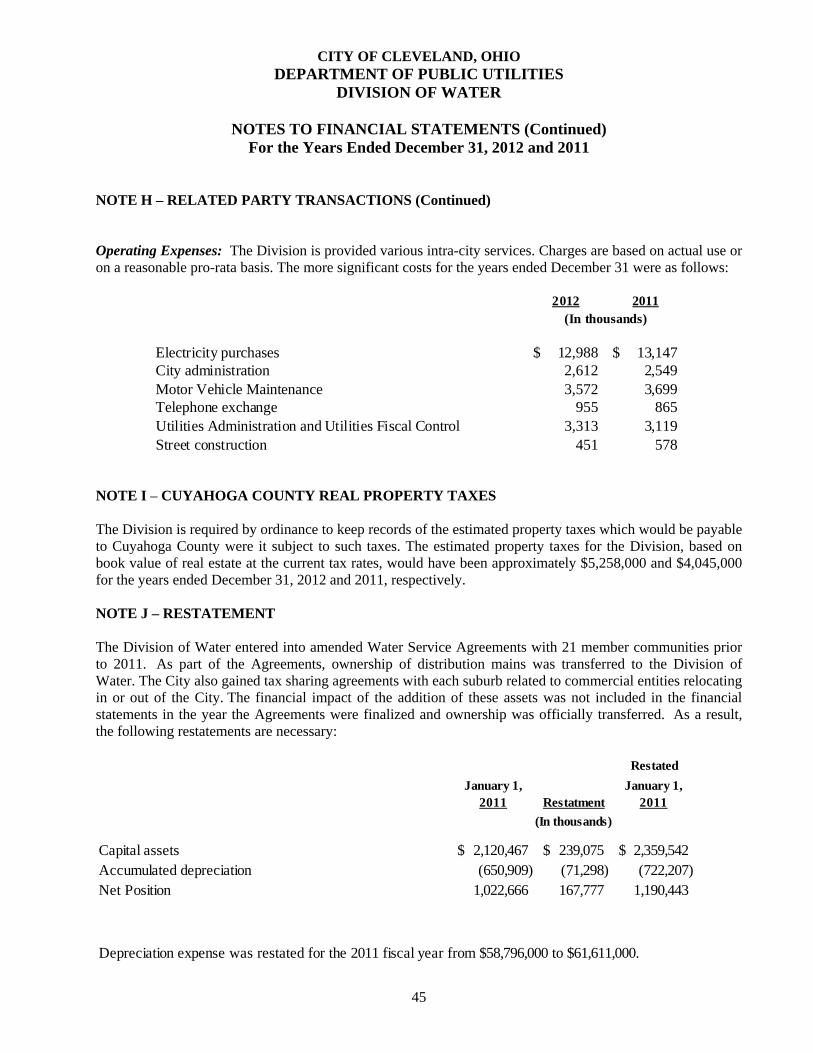
CITY OF CLEVELAND, OHIO DEPARTMENT OF PUBLIC UTILITIES
DIVISION OF WATER
NOTES TO FINANCIAL STATEMENTS (Continued) For the Years Ended December 31, 2012 and 2011
45
NOTE H – RELATED PARTY TRANSACTIONS (Continued) Operating Expenses: The Division is provided various intra-city services. Charges are based on actual use or on a reasonable pro-rata basis. The more significant costs for the years ended December 31 were as follows:
2012 2011
Electricity purchases 12,988$ 13,147$ City administration 2,612 2,549 Motor Vehicle Maintenance 3,572 3,699 Telephone exchange 955 865 Utilities Administration and Utilities Fiscal Control 3,313 3,119 Street construction 451 578
(In thousands)
NOTE I – CUYAHOGA COUNTY REAL PROPERTY TAXES The Division is required by ordinance to keep records of the estimated property taxes which would be payable to Cuyahoga County were it subject to such taxes. The estimated property taxes for the Division, based on book value of real estate at the current tax rates, would have been approximately $5,258,000 and $4,045,000 for the years ended December 31, 2012 and 2011, respectively. NOTE J – RESTATEMENT The Division of Water entered into amended Water Service Agreements with 21 member communities prior to 2011. As part of the Agreements, ownership of distribution mains was transferred to the Division of Water. The City also gained tax sharing agreements with each suburb related to commercial entities relocating in or out of the City. The financial impact of the addition of these assets was not included in the financial statements in the year the Agreements were finalized and ownership was officially transferred. As a result, the following restatements are necessary:
RestatedJanuary 1, January 1,
2011 Restatment 2011
Capital assets 2,120,467$ 239,075$ 2,359,542$ Accumulated depreciation (650,909) (71,298) (722,207) Net Position 1,022,666 167,777 1,190,443
Depreciation expense was restated for the 2011 fiscal year from $58,796,000 to $61,611,000.
(In thousands)

This page intentionally left blank.

CITY OF CLEVELAND, OHIO
DEPARTMENT OF PUBLIC UTILITIES DIVISION OF WATER POLLUTION CONTROL
REPORT ON AUDITS OF FINANCIAL STATEMENTS For the years ended December 31, 2012 and 2011

CITY OF CLEVELAND, OHIO
DEPARTMENT OF PUBLIC UTILITIES DIVISION OF WATER POLLUTION CONTROL
TABLE OF CONTENTS
Page
Independent Auditors' Report .................................................................................................... 1-2 Management’s Discussion and Analysis ................................................................................... 3-11 Statements of Net Position......................................................................................................... 13-14 Statements of Revenues, Expenses and Changes in Net Position ............................................. 16 Statements of Cash Flows.......................................................................................................... 17-18 Notes to Financial Statements.................................................................................................... 19-32

one east fourth street, ste. 1200
cincinnati, oh 45202
www.cshco.com
p. 513.241.3111
f. 513.241.1212
cincinnati | cleveland | columbus | miami valley | springfield | toledo
INDEPENDENT AUDITORS’ REPORT
To the Honorable Frank G. Jackson, Mayor, Members of Council and the Audit CommitteeDivision of Water Pollution ControlDepartment of Public UtilitiesCity of Cleveland, Ohio:
Report on the Financial Statements
We have audited the accompanying financial statements of the Division of Water Pollution Control, Department of Public Utilities, City of Cleveland, Ohio (the “Division”) as of and for the years ended December 31, 2012 and 2011 and the related notes to the financial statements, as listed in the table of contents.
Management’s Responsibility for the Financial Statements
Management is responsible for the preparation and fair presentation of these financial statements in accordance with accounting principles generally accepted in the United States of America; this includes the design, implementation, and maintenance of internal control relevant to the preparation and fair presentation of financial statements that are free from material misstatement, whether due to fraud or error.
Auditors’ Responsibility
Our responsibility is to express an opinion on these financial statements based on our audits. We conducted our audits in accordance with auditing standards generally accepted in the United States of America and the standards applicable to financial audits contained in Government Auditing Standards, issued by the Comptroller General of the United States. Those standards require that we plan and perform the audit to obtain reasonable assurance about whether the financial statements are free from material misstatement.
An audit involves performing procedures to obtain audit evidence about the amounts and disclosures in the financial statements. The procedures selected depend on the auditors’ judgment, including the assessment of the risks of material misstatement of the financial statements, whether due to fraud or error. In making those risk assessments, the auditor considers internal control relevant to the entity’s preparation and fair presentation of the financial statements in order to design audit procedures that are appropriate in the circumstances, but not for the purpose of expressing an opinion on the effectiveness of the entity’s internal control. Accordingly, we express no such opinion. An audit also includes evaluating the appropriateness of accounting policies used and the reasonableness of significant accounting estimates made by management, as well as evaluating the overall presentation of the financial statements.
We believe that the audit evidence we have obtained is sufficient and appropriate to provide a basis for our audit opinion.

Opinions
In our opinion, the financial statements referred to previously present fairly, in all material respects, the financial position of the Division of Water Pollution Control, Department of Public Utilities, City of Cleveland, Ohio as of December 31, 2012 and 2011, and the changes in financial position and cash flows thereof for the years then ended in conformity with accounting principles generally accepted in the United States of America.
Effect of Adopting New Accounting Standards
As discussed in Note A, the Division adopted the provisions of Governmental Accounting Standards Board Statement No. 60 Accounting and Financial Reporting for Service Concession Arrangements, Statement No. 62, Codification of Accounting and Financial Reporting Guidance Contained in Pre-November 30, 1989 FASB and AICPA Pronouncements, Statement No. 63, Financial Reporting of Deferred Outflows of Resources, Deferred Inflows of Resources, and Net Position, and Statement No. 64, Derivative Instruments: Application of Hedge Accounting Termination Provision. Our opinion is not modified with respect to this matter.
Other Matters
As described in Note A, the financial statements present only the financial position and the changes in financial position and cash flows of the Division and do not purport to, and do not, present fairly the financial position of the City of Cleveland as of December 31, 2012 and 2011, and the respective changes in its financial position and cash flows for the years then ended in conformity with accounting principles generally accepted in the United States of America. Our opinion is not modified with respect to this matter.
Required Supplementary Information
Accounting principles generally accepted in the United States of America require that the management’s discussion and analysis on pages 3 through 11 be presented to supplement the basic financial statements. Such information, although not a part of the basic financial statements, is required by the Governmental Accounting Standards Board who considers it to be an essential part of financial reporting for placing the basic financial statements in an appropriate operational, economic, or historical context. We have applied certain limited procedures to the required supplementary information in accordance with auditing standards generally accepted in the United States of America, which consisted of inquiries of management about the methods of preparing the information and comparing the information for consistency with management’s responses to our inquiries, the basic financial statements, and other knowledge we obtained during our audit of the basic financial statements. We do not express an opinion or provide any assurance on the information because the limited procedures do not provide us with sufficient evidence to express an opinion or provide any assurance.
Clark, Schaefer, Hackett & Co.Cincinnati, OhioJune 25, 2013
2

CITY OF CLEVELAND, OHIO DEPARTMENT OF PUBLIC UTILITIES
DIVISION OF WATER POLLUTION CONTROL
MANAGEMENT’S DISCUSSION AND ANALYSIS
3
GENERAL As management of the City of Cleveland’s (the City) Department of Public Utilities, Division of Water Pollution Control (the Division), we offer readers of the Division’s financial statements this narrative overview and analysis of the financial activities of the Division for the years ended December 31, 2012 and 2011. Please read this information in conjunction with the Division’s basic financial statements and footnotes that begin on page 13. The Division was created for the purpose of supplying sewer services to customers within the Cleveland metropolitan area. Embarking with a rudimentary system in the late 1800’s, the Cleveland Sewer System developed as the City itself expanded. Prior till the early 1970’s, the City operated the entire system and managed all aspects of sewage treatment and disposal. In 1972, a court order created the Northeast Ohio Regional Sewer District (NEORSD) and transferred the operation of all wastewater treatment plants and interceptors to the NEORSD during December 1973. The City retained responsibility for the sewer collector system in Cleveland. The Division serves a significant portion of the entire metropolitan area by managing the sanitary sewage and storm water drainage collection system. The sewer collection system transfers sanitary and storm sewage from its point of origin to an interceptor sewer or treatment plant for processing. The system is comprised of over 1,400 miles of sewer lines with attendant catch basins and includes 15 pump/lift stations. The Division is also responsible for the cleaning of 127,000 catch basins and for maintaining two storm detention basins. The Division currently has 125,577 customer accounts in the City of Cleveland of which 96.4% are residential and 3.6% commercial. Also, in 2012, the Division’s sewers transported 1,858,142 Mcf’s (thousand cubic feet) of water. The Division’s capital improvement program is supported by a “pay as you go” system funded by its operating revenue and loans. The Division has a low debt burden. The Division maintains an unencumbered cash balance that allows its current debts to be paid. Maintaining this approach helps the Division stabilize the rates charged to its customers. COMPARISON OF CURRENT YEAR’S AND PRIOR YEARS’ DATA FINANCIAL HIGHLIGHTS
• The assets of the Division exceeded its liabilities (net position) by $99,204,000, $100,384,000 and $99,104,000 at December 31, 2012, 2011 and 2010, respectively. Of these amounts, $32,655,000, $34,208,000 and $33,267,000 are unrestricted net position at December 31, 2012, 2011 and 2010, respectively and may be used to meet the Division’s ongoing obligations to customers and creditors.
• The Division’s net position decreased by $1,180,000. The main components of the change were an
increase in operating revenues of $677,000, offset by an increase of $1,493,000 in operating expenses and a decrease of $1,637,000 in capital and other contributions.

CITY OF CLEVELAND, OHIO DEPARTMENT OF PUBLIC UTILITIES
DIVISION OF WATER POLLUTION CONTROL
MANAGEMENT’S DISCUSSION AND ANALYSIS (Continued)
4
FINANCIAL HIGHLIGHTS (Continued) • The regular sewage rate was $12.53 per thousand cubic feet in 2011 and 2012. Also, the homestead
sewage rate was $7.43 per thousand cubic feet in 2011 and 2012. • During 2012, the Division’s current assets decreased by $13,067,000. The primary component was a
decrease of $23,141,000 in net accounts receivable as a result of collection of accounts and accounts written-off, offset by a $10,070,000 increase in cash and cash equivalents. In 2011, the Division’s current assets decreased by $930,000.
• The Division’s total debt decreased in 2012 and 2011 by $505,000 and $486,000, respectively, due to
the continuing scheduled debt payments made during the year. OVERVIEW OF THE FINANCIAL STATEMENTS This discussion and analysis is intended to serve as an introduction to the Division’s basic financial statements. The accompanying financial statements present financial information for the City’s Division of Water Pollution Control Fund, in which the City accounts for the operations of the Department of Public Utilities, Division of Water Pollution Control. A fund is a grouping of related accounts that is used to maintain control over resources that have been segregated for specific activities or objectives. The City, like other state and local governments, uses fund accounting to ensure and demonstrate compliance with finance-related legal requirements. The Division of Water Pollution Control is considered an enterprise fund because the operations of the Division are similar to a private sector business enterprise. Accordingly, in accounting for the activities of the Division, the economic resources measurement focus and the accrual basis of accounting is used. The basic financial statements of the Division can be found on pages 13 - 18 of this report. The notes to the financial statements provide additional information that is essential to a full understanding of the data provided in the basic financial statements. The notes to the basic financial statements can be found on pages 19 - 32 of this report.

CITY OF CLEVELAND, OHIO DEPARTMENT OF PUBLIC UTILITIES
DIVISION OF WATER POLLUTION CONTROL
MANAGEMENT’S DISCUSSION AND ANALYSIS (Continued)
5
CONDENSED STATEMENT OF NET POSITION INFORMATION
Provided below are the statements of net position information for the Division as of December 31, 2012, 2011 and 2010:
2012 2011 2010
Assets: Capital assets, net 68,709$ 69,019$ 69,166$ Restricted assets 586 1,081 1,250 Current assets 138,452 151,519 152,449 Total assets 207,747 221,619 222,865
Net Positon and Liabilities: Net position: Net investment in capital assets 66,371 66,176 65,837 Restricted for capital projects 178 Unrestricted 32,655 34,208 33,267 Total net position 99,204 100,384 99,104 Liabilities: Long-term obligations 1,949 2,482 3,010 Current liabilities 106,594 118,753 120,751 Total liabilities 108,543 121,235 123,761 Total net position and liabilities 207,747$ 221,619$ 222,865$
(In thousands)
Current Assets: In 2012, there was a decrease of $13,067,000 in current assets due to the increase in current cash and cash equivalents of $10,070,000, which was the product of increased collection activity, offset by a decrease in net accounts receivable of $23,141,000, which was the result of increased write-offs. In 2011, there was a decrease of $930,000 in current assets due to the decrease in net accounts receivable of $2,765,000, which was the result of increased collection activity. There were also increases in current cash and cash equivalents and unbilled revenue of $1,111,000 and $652,000, respectively.

CITY OF CLEVELAND, OHIO DEPARTMENT OF PUBLIC UTILITIES
DIVISION OF WATER POLLUTION CONTROL
MANAGEMENT’S DISCUSSION AND ANALYSIS (Continued)
6
CONDENSED STATEMENT OF NET POSITION INFORMATION (Continued) Capital Assets: In 2012, the Division’s net capital assets amounted to $68,709,000. This was a decrease of $310,000 from 2011. The change is primarily due to scheduled depreciation. In 2011, the Division’s net capital assets amounted to $69,019,000. This was a decrease of $147,000 from the prior year. The change is primarily the result of a $2,572,000 increase in utility plant, offset by a $4,163,000 net increase in accumulated depreciation. A summary of the activity in the Division’s capital assets during the years ended December 31, 2012 and 2011 is as follows:
Balance Balance
January 1, December 31,2012 Additions Reductions 2012
Land 297$ $ $ 297$ Utility plant 131,132 6,660 (64) 137,728Buildings, structures and improvments 8,948 15 8,963Furniture, fixture, equipment and vehicles 12,481 1,320 (755) 13,046Construction in progress 9,340 4,368 (7,565) 6,143
Total 162,198 12,363 (8,384) 166,177
Less: Accumulated depreciation (93,179) (5,108) 819 (97,468)
Capital assets, net 69,019$ 7,255$ (7,565)$ 68,709$
(In thousands)
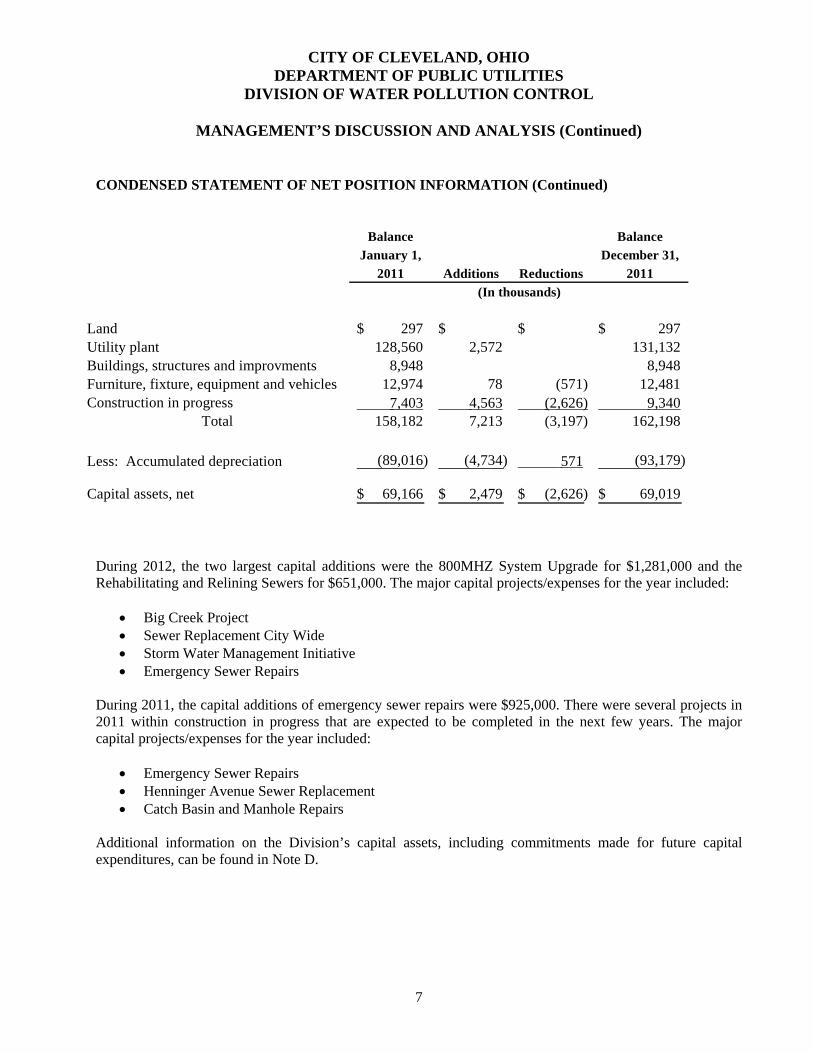
CITY OF CLEVELAND, OHIO DEPARTMENT OF PUBLIC UTILITIES
DIVISION OF WATER POLLUTION CONTROL
MANAGEMENT’S DISCUSSION AND ANALYSIS (Continued)
7
CONDENSED STATEMENT OF NET POSITION INFORMATION (Continued)
Balance Balance
January 1, December 31,2011 Additions Reductions 2011
Land 297$ $ $ 297$ Utility plant 128,560 2,572 131,132Buildings, structures and improvments 8,948 8,948Furniture, fixture, equipment and vehicles 12,974 78 (571) 12,481Construction in progress 7,403 4,563 (2,626) 9,340
Total 158,182 7,213 (3,197) 162,198
Less: Accumulated depreciation (89,016) (4,734) 571 (93,179)
Capital assets, net 69,166$ 2,479$ (2,626)$ 69,019$
(In thousands)
During 2012, the two largest capital additions were the 800MHZ System Upgrade for $1,281,000 and the Rehabilitating and Relining Sewers for $651,000. The major capital projects/expenses for the year included:
• Big Creek Project • Sewer Replacement City Wide • Storm Water Management Initiative • Emergency Sewer Repairs
During 2011, the capital additions of emergency sewer repairs were $925,000. There were several projects in 2011 within construction in progress that are expected to be completed in the next few years. The major capital projects/expenses for the year included:
• Emergency Sewer Repairs • Henninger Avenue Sewer Replacement • Catch Basin and Manhole Repairs
Additional information on the Division’s capital assets, including commitments made for future capital expenditures, can be found in Note D.
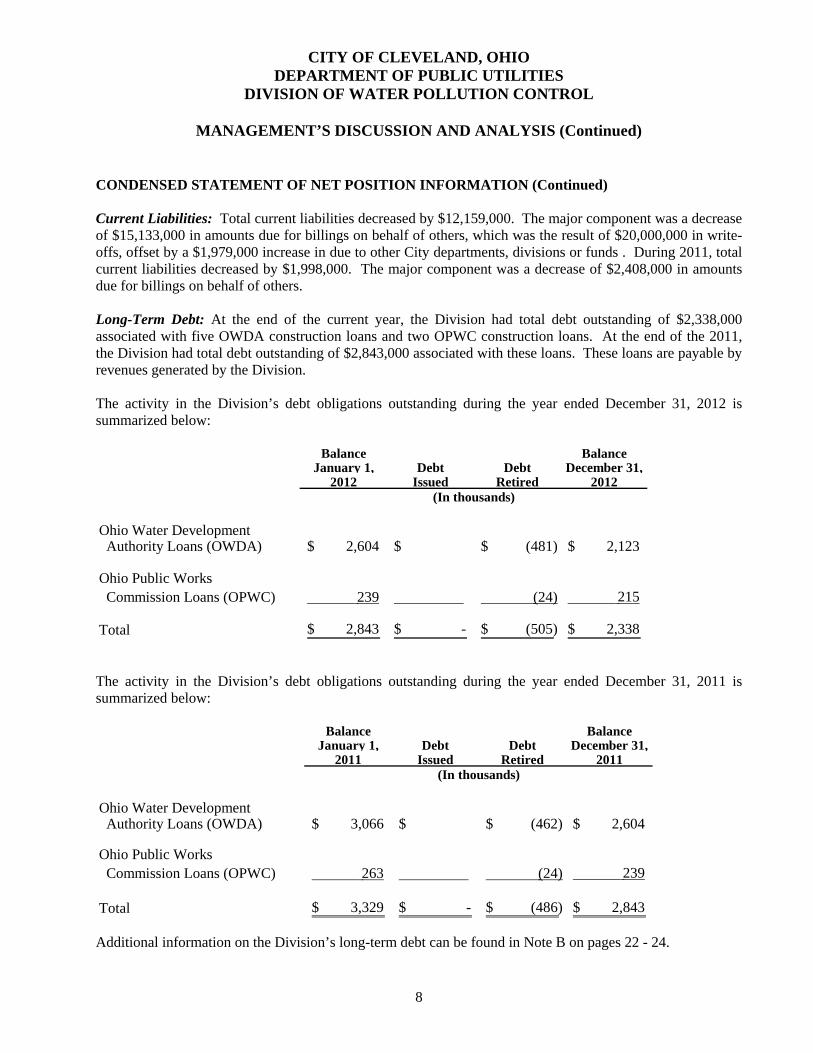
CITY OF CLEVELAND, OHIO DEPARTMENT OF PUBLIC UTILITIES
DIVISION OF WATER POLLUTION CONTROL
MANAGEMENT’S DISCUSSION AND ANALYSIS (Continued)
8
CONDENSED STATEMENT OF NET POSITION INFORMATION (Continued) Current Liabilities: Total current liabilities decreased by $12,159,000. The major component was a decrease of $15,133,000 in amounts due for billings on behalf of others, which was the result of $20,000,000 in write-offs, offset by a $1,979,000 increase in due to other City departments, divisions or funds . During 2011, total current liabilities decreased by $1,998,000. The major component was a decrease of $2,408,000 in amounts due for billings on behalf of others. Long-Term Debt: At the end of the current year, the Division had total debt outstanding of $2,338,000 associated with five OWDA construction loans and two OPWC construction loans. At the end of the 2011, the Division had total debt outstanding of $2,843,000 associated with these loans. These loans are payable by revenues generated by the Division. The activity in the Division’s debt obligations outstanding during the year ended December 31, 2012 is summarized below:
Balance BalanceJanuary 1, Debt Debt December 31,
2012 Issued Retired 2012
Ohio Water Development Authority Loans (OWDA) 2,604$ $ (481)$ 2,123$
Ohio Public Works Commission Loans (OPWC) 239 (24) 215
Total 2,843$ -$ (505)$ 2,338$
(In thousands)
The activity in the Division’s debt obligations outstanding during the year ended December 31, 2011 is summarized below:
Balance BalanceJanuary 1, Debt Debt December 31,
2011 Issued Retired 2011
Ohio Water Development Authority Loans (OWDA) 3,066$ $ (462)$ 2,604$
Ohio Public Works Commission Loans (OPWC) 263 (24) 239
Total 3,329$ -$ (486)$ 2,843$
(In thousands)
Additional information on the Division’s long-term debt can be found in Note B on pages 22 - 24.

CITY OF CLEVELAND, OHIO DEPARTMENT OF PUBLIC UTILITIES
DIVISION OF WATER POLLUTION CONTROL
MANAGEMENT’S DISCUSSION AND ANALYSIS (Continued)
9
CONDENSED STATEMENT OF NET POSITION INFORMATION (Continued) Net Position: Net position serves as a useful indicator of a government’s financial position. In the case of the Division, assets exceeded liabilities by $99,204,000, $100,384,000 and $99,104,000 at December 31, 2012, 2011 and 2010, respectively. The largest portion of the Division’s net position, $66,371,000 and $66,176,000, at December 31, 2012 and 2011, respectively, reflects its investment in capital assets (e.g., land, buildings, utility plant, machinery and equipment), net of accumulated depreciation, less any related outstanding debt used to acquire those assets. The Division uses these capital assets to provide services to its customers. Consequently, these assets are not available for future spending. Although the Division’s investment in capital assets is reported net of related debt, it should be noted that the resources needed to repay this debt must be provided from other sources since the capital assets themselves cannot be used to liquidate these liabilities. An additional portion of the Division’s net position, $178,000 and $0, at December 31, 2012 and 2011, respectively, represents resources that are subject to external restrictions. These funds are set aside for the payment of capital projects. The remaining balance of net position, $32,655,000 and $34,208,000, at December 31, 2012 and 2011, respectively, are unrestricted and may be used to meet the Division’s ongoing obligations to customers and creditors.

CITY OF CLEVELAND, OHIO DEPARTMENT OF PUBLIC UTILITIES
DIVISION OF WATER POLLUTION CONTROL
MANAGEMENT’S DISCUSSION AND ANALYSIS (Continued)
10
CONDENSED STATEMENT OF REVENUES, EXPENSES AND CHANGES IN NET POSITION INFORMATION
The Division’s operations for 2012 had decreased net position of $1,180,000 and during 2011, net position increased by $1,280,000. Provided below are the key elements of the Division’s results of operations for the years ended December 31, 2012, 2011 and 2010:
2012 2011 2010(In thousands)
Operating revenues 22,876$ 22,199$ 25,110$ Operating expenses 24,377 22,884 23,926
Operating income (loss) (1,501) (685) 1,184
Non-operating revenue (expense): Investment income 59 53 41 Interest expense (102) (121) (139) Other 21 53 13 Total non-operating revenue (expense), net (22) (15) (85)
Income (loss) before other contributions (1,523) (700) 1,099
Capital and other contributions 343 1,980 390
Increase (decrease) in net position (1,180) 1,280 1,489
Net position, beginning of year 100,384 99,104 97,615
Net position, end of year 99,204$ 100,384$ 99,104$
Operating revenues: Total operating revenues amounted to $22,876,000 in 2012. This was an increase of $677,000 from the prior year, mainly due to increased consumption. In 2011, total operating revenues amounted to $22,199,000.

CITY OF CLEVELAND, OHIO DEPARTMENT OF PUBLIC UTILITIES
DIVISION OF WATER POLLUTION CONTROL
MANAGEMENT’S DISCUSSION AND ANALYSIS (Continued)
11
CONDENSED STATEMENT OF REVENUES, EXPENSES AND CHANGES IN NET POSITION INFORMATION (Continued)
Operating expenses: In 2012, total operating expenses increased by $1,493,000. There was an increase in operations costs of $879,000. The major component was accrued bad debt expense, which increased by $1,061,000. In 2011, total operating expenses decreased by $1,042,000. The main component was a decrease in operations costs of $683,000. Non-operating revenues and expenses: Other revenues decreased by $32,000 in 2012. In 2011, investment income increased by $12,000. ADDITIONAL INFORMATION This financial report is designed to provide a general overview of the Division’s finances. Questions concerning any of the information provided in this report or requests for additional information should be addressed to the Office of the Finance Director, City Hall, Room 104, 601 Lakeside Avenue, Cleveland, Ohio 44114.

12
BASIC FINANCIAL STATEMENTS
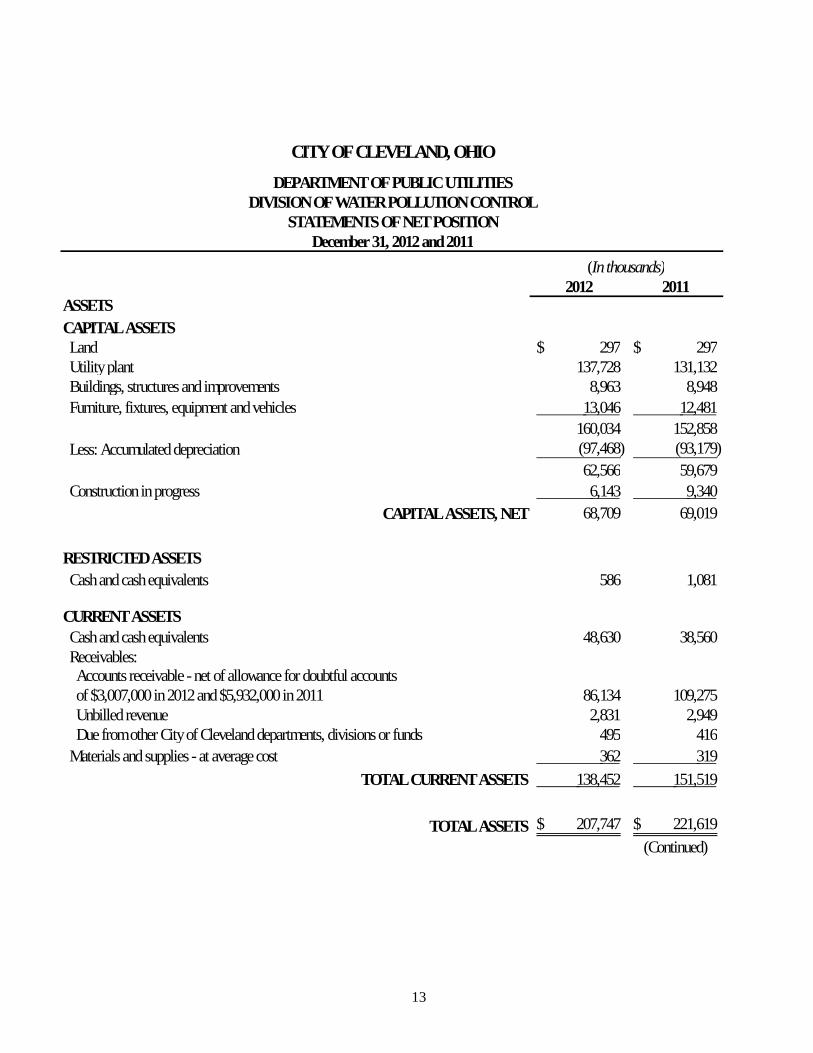
13
CITY OF CLEVELAND, OHIODEPARTMENT OF PUBLIC UTILITIES
DIVISION OF WATER POLLUTION CONTROLSTATEMENTS OF NET POSITION
December 31, 2012 and 2011(In thousands)
2012 2011ASSETSCAPITAL ASSETS Land 297$ 297$ Utility plant 137,728 131,132 Buildings, structures and improvements 8,963 8,948 Furniture, fixtures, equipment and vehicles 13,046 12,481
160,034 152,858 Less: Accumulated depreciation (97,468) (93,179)
62,566 59,679 Construction in progress 6,143 9,340
CAPITAL ASSETS, NET 68,709 69,019
RESTRICTED ASSETS Cash and cash equivalents 586 1,081
CURRENT ASSETS Cash and cash equivalents 48,630 38,560 Receivables: Accounts receivable - net of allowance for doubtful accounts of $3,007,000 in 2012 and $5,932,000 in 2011 86,134 109,275 Unbilled revenue 2,831 2,949 Due from other City of Cleveland departments, divisions or funds 495 416 Materials and supplies - at average cost 362 319
TOTAL CURRENT ASSETS 138,452 151,519
TOTAL ASSETS 207,747$ 221,619$ (Continued)

14
CITY OF CLEVELAND, OHIO
DEPARTMENT OF PUBLIC UTILITIESDIVISION OF WATER POLLUTION CONTROL
STATEMENTS OF NET POSITIONDecember 31, 2012 and 2011
(In thousands)2012 2011
NET POSITION AND LIABILITIES
NET POSITION Net investment in capital assets 66,371$ 66,176$ Restricted for capital projects 178 Unrestricted 32,655 34,208
TOTAL NET POSITION 99,204 100,384 LIABILITIESLONG-TERM OBLIGATIONS-excluding amounts due within one year: OWDA loans 1,622 2,123 OPWC loans 191 215 Accrued wages and benefits 136 144
TOTAL LONG-TERM OBLIGATIONS 1,949 2,482
CURRENT LIABILITIES Current portion of long-term debt, due within one year 525 505 Accounts payable 171 704 Construction payable 2,050 518 Amounts due for billing on behalf of others 90,704 105,837 Due to other City of Cleveland departments, divisions or funds 11,399 9,420 Current portion of accrued wages and benefits 1,557 1,562 Other accrued expenses 55 60 Customer deposits and other liabilities 133 147
TOTAL CURRENT LIABILITIES 106,594 118,753
TOTAL LIABILITIES 108,543 121,235
TOTAL NET POSITION AND LIABILITIES 207,747$ 221,619$
(Concluded)See notes to financial statements.

15
This page intentionally left blank.

CITY OF CLEVELAND, OHIO
DEPARTMENT OF PUBLIC UTILITIESDIVISION OF WATER POLLUTION CONTROL
STATEMENTS OF REVENUES, EXPENSES AND CHANGES IN NET POSITIONFor the Years Ended December 31, 2012 and 2011
(In thousands)2012 2011
OPERATING REVENUES Charges for services 22,876$ 22,199$
TOTAL OPERATING REVENUES 22,876 22,199
OPERATING EXPENSESOperations 10,194 9,315 Maintenance 9,075 8,835 Depreciation 5,108 4,734
TOTAL OPERATING EXPENSES 24,377 22,884
OPERATING INCOME (LOSS) (1,501) (685)
NON-OPERATING REVENUE (EXPENSE)Investment income 59 53 Interest expense (102) (121) Other 21 53
TOTAL NON-OPERATING REVENUE (EXPENSE), NET (22) (15)
INCOME (LOSS) BEFORE OTHER CONTRIBUTIONS (1,523) (700)
Capital and other contributions 343 1,980
INCREASE (DECREASE) IN NET POSITION (1,180) 1,280
NET POSITION, BEGINNING OF YEAR 100,384 99,104
NET POSITION, END OF YEAR 99,204$ 100,384$
See notes to financial statements.
16

CITY OF CLEVELAND, OHIO
DEPARTMENT OF PUBLIC UTILITIESDIVISION OF WATER POLLUTION CONTROL
STATEMENTS OF CASH FLOWSFor the Years Ended December 31, 2012 and 2011
2012 2011CASH FLOWS FROM OPERATING ACTIVITIES Cash received from customers 22,996$ 22,328$ Cash payments to suppliers for goods or services (5,484) (6,154) Cash payments to employees for services (9,947) (10,227) Agency activity on behalf of other sewer authorities 6,265 (681)
NET CASH PROVIDED BY (USED FOR) OPERATING ACTIVITIES 13,830 5,266
CASH FLOWS FROM CAPITAL AND RELATED FINANCING ACTIVITIES Acquisition and construction of capital assets (3,996) (5,750) Principal paid on long-term debt (505) (486) Interest paid on long-term debt (102) (121) Capital grant proceeds 289 1,980
NET CASH PROVIDED BY (USED FOR) CAPITAL ANDRELATED FINANCING ACTIVITIES (4,314) (4,377)
CASH FLOWS FROM INVESTING ACTIVITIES Interest received on investments 59 53
NET CASH PROVIDED BY (USED FOR) INVESTING ACTIVITIES 59 53
NET INCREASE (DECREASE) INCASH AND CASH EQUIVALENTS 9,575 942
CASH AND CASH EQUIVALENTS, BEGINNING OF YEAR 39,641 38,699 CASH AND CASH EQUIVALENTS, END OF YEAR 49,216$ 39,641$
(Continued)
(In thousands)
17

CITY OF CLEVELAND, OHIO
DEPARTMENT OF PUBLIC UTILITIESDIVISION OF WATER POLLUTION CONTROL
STATEMENTS OF CASH FLOWSFor the Years Ended December 31, 2012 and 2011
2012 2011
RECONCILIATION OF OPERATING INCOME (LOSS) TO NET CASH PROVIDED BY OPERATING ACTIVITIES
OPERATING INCOME (LOSS) (1,501)$ (685)$ Adjustments to reconcile operating income (loss) to net cash provided by operating activities: Depreciation 5,108 4,734 Write-off of bad debt expense 20,000 Changes in assets and liabilities: Accounts receivable, net 3,141 2,765 Accrued and unbilled revenue 118 (652) Due from other City of Cleveland departments, divisions or funds (79) 2 Materials and supplies, net (43) (74) Accounts payable (533) 267 Other accrued expenses (5) (5) Amounts due for billings on behalf of others (15,133) (2,408) Due to other City of Cleveland departments, divisions or funds 1,979 571 Accrued wages and benefits (13) (45) Customer deposits and other liabilities 791 796
TOTAL ADJUSTMENTS 15,331 5,951
NET CASH PROVIDED BY OPERATING ACTIVITIES 13,830$ 5,266$
(Concluded)See notes to financial statements.
(In thousands)
18

CITY OF CLEVELAND, OHIO DEPARTMENT OF PUBLIC UTILITIES
DIVISION OF WATER POLLUTION CONTROL
NOTES TO FINANCIAL STATEMENTS For the Years Ended December 31, 2012 and 2011
19
NOTE A - SUMMARY OF SIGNIFICANT ACCOUNTING POLICIES The Division of Water Pollution Control (the Division) is reported as an Enterprise Fund of the City of Cleveland’s Department of Public Utilities and is a part of the City of Cleveland’s (the City) primary government. The Division was created for the purpose of supplying sewer services to customers within the metropolitan area. The following is a summary of the more significant accounting policies. Reporting Model and Basis of Accounting: The accounting policies and financial reporting practices of the Division comply with accounting principles generally accepted in the United States of America applicable to governmental units. In November of 2010, Governmental Accounting Standards Board (GASB) Statement No. 60, Accounting and Financial Reporting for Service Concession Arrangements was issued. This Statement is effective for fiscal periods beginning after December 15, 2011. The objective of this Statement is to improve financial reporting by addressing issues related to service concession arrangements (SCAs), which are a type of public-private or public-public partnership. The Division has determined that GASB Statement No. 60 has no impact on its financial statements as of December 31, 2012.
In December of 2010, Governmental Accounting Standards Board (GASB) Statement No. 62, Codification of Accounting and Financial Reporting Guidance Contained in Pre-November 30, 1989 FASB and AICPA Pronouncements was issued. This Statement is effective for fiscal periods beginning after December 15, 2011. The objective of this Statement is to incorporate into the GASB’s authoritative literature certain accounting and financial reporting guidance that is included in the following pronouncements issued on or before November 30, 1989, which does not conflict with or contradict GASB pronouncements: (1) Financial Accounting Standards Board (FASB) Statements and Interpretations, (2) Accounting Principles Board Opinions and (3) Accounting Research Bulletins of the American Institute of Certified Public Accountants’ (AICPA) Committee on Accounting Procedure. As required, the Division has implemented GASB Statement No. 62 effective for the 2012 fiscal year.
In June of 2011, Governmental Accounting Standards Board (GASB) Statement No. 63, Financial Reporting of Deferred Outflows of Resources, Deferred Inflows of Resources, and Net Position was issued. This Statement is effective for fiscal periods beginning after December 15, 2011. This Statement provides financial reporting guidance for deferred outflows of resources and deferred inflows of resources. As required, the Division has implemented GASB Statement No. 63 effective for the 2012 fiscal year. In June of 2011, Governmental Accounting Standards Board (GASB) Statement No. 64, Derivative Instruments: Application of Hedge Accounting Termination Provision was issued. This Statement is effective for fiscal periods beginning after June 15, 2011. The objective of this Statement is to clarify whether an effective hedging relationship continues after the replacement of a swap counterparty or a swap counterparty’s credit support provider. The Division has determined that GASB Statement No. 64 has no impact on its financial statements as of December 31, 2012.

CITY OF CLEVELAND, OHIO DEPARTMENT OF PUBLIC UTILITIES
DIVISION OF WATER POLLUTION CONTROL
NOTES TO FINANCIAL STATEMENTS (Continued) For the Years Ended December 31, 2012 and 2011
20
NOTE A - SUMMARY OF SIGNIFICANT ACCOUNTING POLICIES (Continued) The Division’s net position is accounted for in the accompanying statements of net position and is divided into the following categories:
• Net investment in capital assets.
• Restricted for capital projects.
• Remaining unrestricted amount. In addition, certain additional financial information regarding the Division is included in these footnotes. The implementation of the new GASB statements did not result in a change in the Division’s beginning net position/equity balance as previously reported. Basis of Accounting: The Division’s financial statements are prepared under the accrual basis of accounting. Under this method, revenues are recognized when earned and measurable and expenses are recognized as incurred. Revenues: Revenues are derived primarily from sales of sewer services to residential, commercial and industrial customers based upon actual water consumption. Sewer rates are authorized by City Council and billings are made on a cyclical basis. Estimates for services between the end of the various cycles and the end of the year are recorded as unbilled revenue.
Accounts Receivables: The Division’s share of the accounts receivable balance is $12,112,000 and $13,229,000, net of allowance for doubtful accounts of $3,007,000 and $5,932,000, for 2012 and 2011, respectively. The remaining accounts receivable balances of $74,022,000 and $96,046,000 for 2012 and 2011, respectively, belong to the Northeast Ohio Regional Sewer District and other municipalities in the Greater Cleveland Region and are offset by the corresponding amounts due for billings on behalf of others.
Statement of Cash Flows: The Division utilizes the direct method of reporting for the statement of cash flows as defined by the Governmental Accounting Standards Board (GASB) Statement No. 9, Reporting Cash Flows of Proprietary and Non-Expendable Trust Funds and Governmental Entities That Use Proprietary Fund Accounting. In a statement of cash flows, cash receipts and cash payments are classified according to operating, noncapital financing, capital and related financing and investment activities. Cash and Cash Equivalents: Cash and cash equivalents represent cash on hand and cash deposits maintained by the City Treasurer on behalf of the Division. Cash equivalents are defined as highly liquid investments with maturity of three months or less when purchased and include certificates of deposit, U.S. Treasury bills, State Treasury Asset Reserve of Ohio (STAROhio), mutual funds and repurchase agreements. The City’s policy is to enter into repurchase agreements with local commercial banks and to obtain confirmation of securities pledged.

CITY OF CLEVELAND, OHIO DEPARTMENT OF PUBLIC UTILITIES
DIVISION OF WATER POLLUTION CONTROL
NOTES TO FINANCIAL STATEMENTS (Continued) For the Years Ended December 31, 2012 and 2011
21
NOTE A - SUMMARY OF SIGNIFICANT ACCOUNTING POLICIES (Continued) Investments: The Division follows the provisions of GASB Statement No. 31, Accounting and Financial Reporting for Certain Investments and External Investment Pools, which requires governmental entities to report certain investments at fair value and recognize the corresponding change in the fair value of investments in the year in which the change occurred. The fair value is based on quoted market rates. The City has invested funds in STAROhio during years 2012 and 2011. STAROhio is an investment pool managed by the State Treasurer's Office, which allows governments within the State to pool their funds for investment purposes. STAROhio is not registered with the SEC as an investment company, but does operate in a manner consistent with Rule 2a7 of the Investment Company Act of 1940. Investments in STAROhio are valued at STAROhio’s share price, which is the price the investment could be sold for on December 31, 2012 and 2011. Capital Assets and Depreciation: Capital assets are stated on the basis of historical cost or, if contributed, at fair market value as of the date received. Depreciation is computed by allocating the cost of capital assets over the estimated useful lives of the assets using the straight-line method. A capital asset is defined as an item with a useful life in excess of one year and an individual cost of more than $5,000 for furniture, fixtures, equipment and vehicles and $10,000 for all other assets. When capital assets are disposed of, the cost and related accumulated depreciation are removed from the accounts with gains or losses on disposition being reflected in operations. The estimated useful lives are as follows:
Utility plant 5 to 100 yearsBuilding, structures and improvements 5 to 60 yearsFurniture, fixtures, equipment and vehicles 3 to 60 years
Compensated Absences: The Division accrues for compensated absences such as vacation, sick leave and compensatory time using the termination payment method specified under GASB Statement No. 16, Accounting for Compensated Absences. These amounts are recorded as accrued wages and benefits in the accompanying statement of net position. The portion of the compensated absence liability that is not expected to be paid or utilized within one year is reported as a long-term liability. Normally, all vacation time is to be taken in the year available. The Division allows employees to carryover sick leave from one year to the next. Sick days not taken may be accumulated until retirement. An employee is paid one-third of accumulated sick leave upon retirement, calculated at the three-year average base salary rate, with the balance being forfeited.

CITY OF CLEVELAND, OHIO DEPARTMENT OF PUBLIC UTILITIES
DIVISION OF WATER POLLUTION CONTROL
NOTES TO FINANCIAL STATEMENTS (Continued) For the Years Ended December 31, 2012 and 2011
22
NOTE B - LONG-TERM OBLIGATIONS
Long-term obligations outstanding at December 31, 2012 and 2011 as follows:
OriginalInterest Rate Issuance 2012 2011
Ohio Water Development Authority (OWDA) Loans payable annually through 2017 4.04% - 4.18% 7,897$ 2,123$ 2,604$
Ohio Public Works Commission (OPWC) Loans payable annually through 2022 0.00% 481 215 239
8,378$ 2,338 2,843
Less: Current portion (525) (505)
Total Long-Term Debt 1,813$ 2,338$
(In thousands)

CITY OF CLEVELAND, OHIO DEPARTMENT OF PUBLIC UTILITIES
DIVISION OF WATER POLLUTION CONTROL
NOTES TO FINANCIAL STATEMENTS (Continued) For the Years Ended December 31, 2012 and 2011
23
NOTE B - LONG-TERM OBLIGATIONS (Continued) Summary: Changes in long-term obligations for the year ended December 31, 2012 are as follows:
Balance Balance DueJanuary 1, December 31, Within
2012 Increase Decrease 2012 One Year(In thousands)
Ohio Water Development Authority (OWDA) Loans payable annually through 2017 2,604$ $ (481)$ 2,123$ 501$
Ohio Public Works Commission (OPWC) Loans payable annually through 2022 239 (24) 215 24 Total loans 2,843 - (505) 2,338 525 Accrued wages and benefits 1,706 1,549 (1,562) 1,693 1,557
Total 4,549$ 1,549$ (2,067)$ 4,031$ 2,082$
Summary: Changes in long-term obligations for the year ended December 31, 2011 are as follows:
Balance Balance DueJanuary 1, December 31, Within
2011 Increase Decrease 2011 One Year(In thousands)
Ohio Water Development Authority (OWDA) Loans payable annually through 2017 3,066$ $ (462)$ 2,604$ 481$
Ohio Public Works Commission (OPWC) Loans payable annually through 2022 263 (24) 239 24 Total loans 3,329 - (486) 2,843 505 Accrued wages and benefits 1,751 1,539 (1,584) 1,706 1,562
Total 5,080$ 1,539$ (2,070)$ 4,549$ 2,067$

CITY OF CLEVELAND, OHIO DEPARTMENT OF PUBLIC UTILITIES
DIVISION OF WATER POLLUTION CONTROL
NOTES TO FINANCIAL STATEMENTS (Continued) For the Years Ended December 31, 2012 and 2011
24
NOTE B - LONG-TERM OBLIGATIONS (Continued) Minimum principal and interest payments on long-term debt are as follows:
Principal Interest Total
2013 525$ 82$ 607$ 2014 546 61 607 2015 515 40 555 2016 481 20 501 2017 177 3 180 2018-2022 94 94
Total 2,338$ 206$ 2,544$
(In thousands)
The Ohio Water Development Authority and Ohio Public Works Commission Loans are being paid from the revenues derived from operations of the Division. Water Pollution Control Loans: Under Title VI of the Clean Water Act, Congress created the State Revolving Fund (SRF). The SRF program provides federal capitalization grants to states, in addition to the 20% state matching funds, in order to capitalize state level revolving loan funds. Besides the traditional types of municipal wastewater treatment projects, Congress expanded the potential use of SRF funds to include correction of combined sewer overflows, major sewer rehabilitation and new collector sewers. In Ohio, this SRF program is known as the Water Pollution Control Loan Fund and is jointly administered by the Ohio EPA and the Ohio Water Development Authority. Principal balances on loans increase as project costs are incurred. Interest accrues on principal amounts outstanding during the construction period and is combined with the principal balance upon completion of the project. The repayment period for each loan commences no later than the 1st of January or July following the expected completion date of the project to which it relates utilizing an estimate of total eligible project costs as the preliminary loan amount. Construction loans and design loans are to be repaid in semi-annual payments of principal and interest over a period of twenty years and five years, respectively. The Division had five SRF loan awards related to projects as of December 31, 2012.
In addition, the Division had two OPWC loan awards as of December 31, 2012. The loan related projects are for sewer repair and replacement at the Hamlet and Adolpha Streets intersection, and a storm water detention basin project at Kerruish Park. Both loans are interest-free and principal repayment will be made from the Division’s operating revenues.

CITY OF CLEVELAND, OHIO DEPARTMENT OF PUBLIC UTILITIES
DIVISION OF WATER POLLUTION CONTROL
NOTES TO FINANCIAL STATEMENTS (Continued) For the Years Ended December 31, 2012 and 2011
25
NOTE C - DEPOSITS AND INVESTMENTS Deposits: The Division’s carrying amount of deposits at years ended December 31, 2012 and December 31, 2011 totaled $26,347,000 and $21,617,000, and the Division’s bank balances were approximately $26,752,000 and $25,909,000, respectively. The differences represent positions in pooled bank accounts and normal reconciling items. Based on the criteria described in GASB Statement No. 3, Deposits with Financial Institutions, Investments (including Repurchase Agreements) and Reverse Repurchase Agreements and GASB Statement No. 40, Deposit and Investment Risk Disclosures – an Amendment of GASB Statement No. 3, $26,752,000 and $25,909,000 of the bank balances at December 31, 2012 and 2011, respectively, were insured or collateralized with securities held by the City or by its agent in the City’s name. Custodial credit risk for deposits is the risk that in the event of bank failure, the Division will not be able to recover deposits or collateral for securities that are in possession of an outside party. At year end, the Division’s deposits were fully insured or collateralized. All deposits are collateralized with eligible securities pledged and deposited either with the City or with a qualified trustee by the financial institution as security for repayment of all public monies deposited in the financial institution whose market value at all times is equal to at least 110% of the carrying value of the deposits being secured. Investments: The City’s investment policies are governed by State statutes and City ordinances which authorize the City to invest in obligations of the U.S. Treasury, agencies and instrumentalities; State Treasurer Asset Reserve Fund (STAROhio); commercial paper; US Government Money Market Mutual Funds; guaranteed investment contracts; manuscript debt; bonds and other State of Ohio obligations; certificates of deposit; and repurchase transactions. Such repurchase transactions must be purchased from financial institutions or registered broker/dealers. Repurchase transactions are not to exceed a period of one year and confirmation of securities pledged must be obtained. Generally, investments are recorded in segregated accounts by way of book entry through the banks’ commercial or trust department and are kept at the Federal Reserve Bank in the depository institutions’ separate custodial account for the City, apart from the assets of the depository institution. Ohio statute prohibits the use of reverse repurchase agreements. Investment securities are exposed to various risks such as interest rate, market and credit. Market values of securities fluctuate based on the magnitude of changing market conditions; significant changes in market conditions could materially affect portfolio value. Interest rate risk: As a means of limiting its exposure to fair value losses caused by rising interest rates, the Division invests primarily in short-term investments maturing within five years from the date of purchase. The intent is to avoid the need to sell securities prior to maturity. Investment maturities are disclosed in the table on the following page.
Custodial Credit Risk: For an investment, custodial credit risk is the risk that, in the event of the failure of the counterparty, the Division will not be able to recover the value of the investments or collateral securities that are in the possession of an outside party. The Division does not have an investment policy dealing with investment custodial credit risk beyond the requirement in the State statute.

CITY OF CLEVELAND, OHIO DEPARTMENT OF PUBLIC UTILITIES
DIVISION OF WATER POLLUTION CONTROL
NOTES TO FINANCIAL STATEMENTS (Continued) For the Years Ended December 31, 2012 and 2011
26
NOTE C - DEPOSITS AND INVESTMENTS (Continued) Credit Risk: The Division’s investments as of December 31, 2012 and 2011 include STAROhio and mutual funds. The Division maintains the highest ratings for their investments. Investments in STAROhio and the Allegiant Government Money Market Fund carry a rating of AAAm, which is the highest money market fund rating given by Standard & Poor’s. Ohio law requires that STAROhio maintain the highest rating provided by at least one nationally recognized standard rating service. Concentration of Credit Risk: The Division places a limitation on the amount it may invest in any one issuer to minimize the concentration of credit risk. The Division had the following investments at December 31, 2012 and 2011, which include those classified as cash and cash equivalents in the statement of net position in accordance with the provisions of GASB Statement No. 9 since they have a maturity of three months or less:
2012 2011 Investment MaturitiesFair 2012 Fair 2011 Less than
Type of Investment Value Cost Value Cost One Year
STAROhio 21,815$ 21,815$ 6,135$ 6,135$ 21,815$ Investment in Mutual Funds 1,054 1,054 11,889 11,889 1,054
Total Investments 22,869 22,869 18,024 18,024 22,869
Total Deposits 26,347 26,347 21,617 21,617 26,347
Total Deposits and Investments 49,216$ 49,216$ 39,641$ 39,641$ 49,216$
.
(In thousands)
These amounts are monies invested by the City Treasurer on behalf of the Division and are used in daily operations with excess monies invested daily in STAROhio and mutual funds. These investments are carried at cost which approximates market value. As of December 31, 2012, the investments in STAROhio and mutual funds are 95% and 5%, respectively, of the Division’s total investments. As of December 31, 2011, the investments in STAROhio and mutual funds were 34% and 66%, respectively, of the Division’s total investments.

CITY OF CLEVELAND, OHIO DEPARTMENT OF PUBLIC UTILITIES
DIVISION OF WATER POLLUTION CONTROL
NOTES TO FINANCIAL STATEMENTS (Continued) For the Years Ended December 31, 2012 and 2011
27
NOTE D - CAPITAL ASSETS Capital Asset Activity: Capital asset activity for the year ended December 31, 2012 was as follows:
Balance BalanceJanuary 1, Decemb 31er ,
2012 Additions Reductions 2012
Capital assets, not being depreciated: Land 297$ $ $ 297$ Construction in progress 9,340 4,368 (7,565) 6,143 Total capital assets, not being depreciated 9,637 4,368 (7,565) 6,440
Capital assets, being depreciated: Utility plant 131,132 6,660 (64) 137,728 Buildings, structures and improvements 8,948 15 8,963 Furniture, fixtures, equipment and vehicles 12,481 1,320 (755) 13,046 Total capital assets, being depreciated 152,561 7,995 (819) 159,737 Less: Accumulated depreciation (93,179) (5,108) 819 (97,468)
Total capital assets being depreciated, net 59,382 2,887 - 62,269
Capital assets, net 69,019$ 7,255$ (7,565)$ 68,709$
(In thousands)
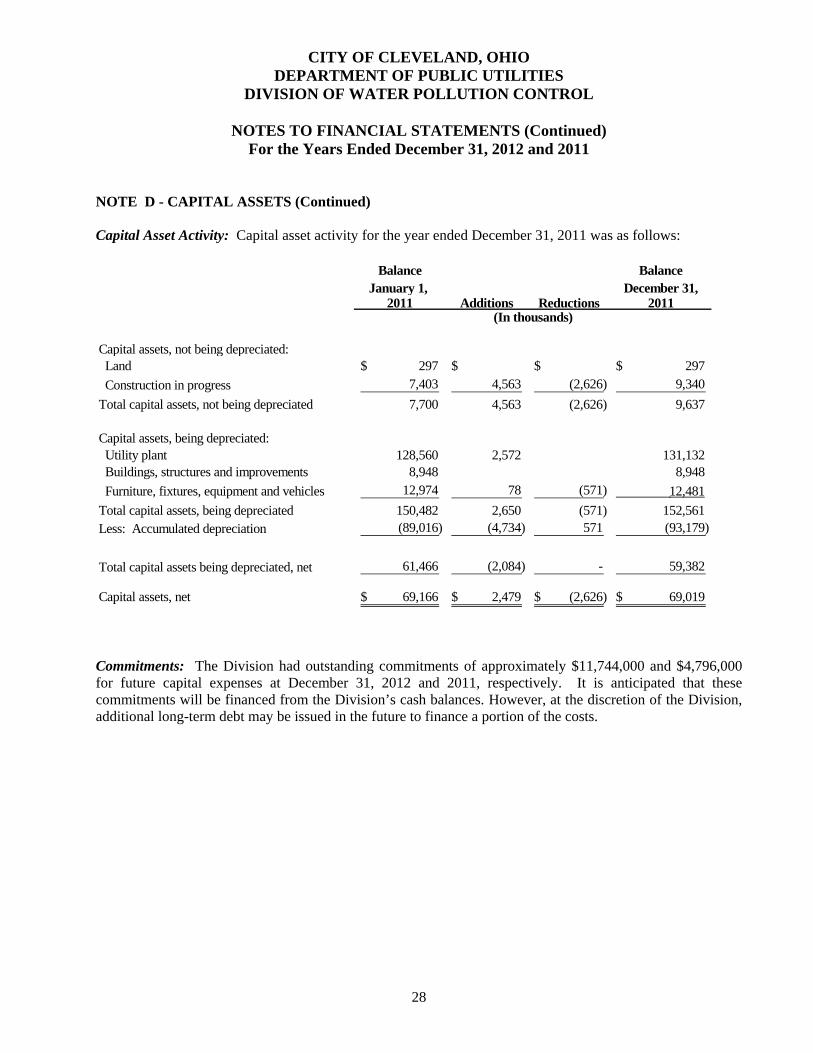
CITY OF CLEVELAND, OHIO DEPARTMENT OF PUBLIC UTILITIES
DIVISION OF WATER POLLUTION CONTROL
NOTES TO FINANCIAL STATEMENTS (Continued) For the Years Ended December 31, 2012 and 2011
28
NOTE D - CAPITAL ASSETS (Continued) Capital Asset Activity: Capital asset activity for the year ended December 31, 2011 was as follows:
Balance BalanceJanuary 1, Decemb 31er ,
2011 Additions Reductions 2011
Capital assets, not being depreciated: Land 297$ $ $ 297$ Construction in progress 7,403 4,563 (2,626) 9,340 Total capital assets, not being depreciated 7,700 4,563 (2,626) 9,637
Capital assets, being depreciated: Utility plant 128,560 2,572 131,132 Buildings, structures and improvements 8,948 8,948 Furniture, fixtures, equipment and vehicles 12,974 78 (571) 12,481 Total capital assets, being depreciated 150,482 2,650 (571) 152,561 Less: Accumulated depreciation (89,016) (4,734) 571 (93,179)
Total capital assets being depreciated, net 61,466 (2,084) - 59,382
Capital assets, net 69,166$ 2,479$ (2,626)$ 69,019$
(In thousands)
Commitments: The Division had outstanding commitments of approximately $11,744,000 and $4,796,000 for future capital expenses at December 31, 2012 and 2011, respectively. It is anticipated that these commitments will be financed from the Division’s cash balances. However, at the discretion of the Division, additional long-term debt may be issued in the future to finance a portion of the costs.

CITY OF CLEVELAND, OHIO DEPARTMENT OF PUBLIC UTILITIES
DIVISION OF WATER POLLUTION CONTROL
NOTES TO FINANCIAL STATEMENTS (Continued) For the Years Ended December 31, 2012 and 2011
29
NOTE E – DEFINED BENEFIT PENSION PLAN Ohio Public Employees Retirement System: All full-time employees, other than non-administrative full-time police officers and firefighters, participate in the Ohio Public Employees Retirement System (OPERS). OPERS administers three separate pension plans as described below:
1) The Traditional Pension Plan – a cost-sharing, multiple-employer defined benefit pension plan.
2) The Member-Directed Plan – a defined contribution plan in which the member invests both member and employer contributions (employer contributions vest over five years at 20% per year). Under the Member-Directed Plan, members accumulate retirement assets equal to the value of member and (vested) employer contributions plus any investment earnings.
3) The Combined Plan – a cost-sharing, multiple-employer defined benefit pension plan. Under the Combined Plan, OPERS invests employer contributions to provide a formula retirement benefit similar in nature to the Traditional Pension Plan benefit. Member contributions, the investment of which is self-directed by the members, accumulate retirement assets in a manner similar to the Member-Directed Plan.
OPERS provides retirement, disability, survivor and death benefits and annual cost-of-living adjustments to members of the Traditional Pension and Combined Plans. Members of the Member-Directed Plan do not qualify for ancillary benefits. Authority to establish and amend benefits is provided in Chapter 145 of the Ohio Revised Code. OPERS issues a stand-alone financial report. Interested parties may obtain a copy by visiting https://www.opers.org/investments/cafr.shtml, writing to OPERS, 277 East Town Street, Columbus, Ohio 43215-4642, or by calling (614) 222-5601 or (800) 222-7377. The Ohio Revised Code provides statutory authority for member and employer contributions. For 2012, member and employer contribution rates were consistent across all three plans. Member contribution rates were 10.00% in 2012, 2011 and 2010. The employer contribution rates were 14.00% of covered payroll in 2012, 2011 and 2010.
The Division’s required employer contributions to OPERS for the pension portion of all the plans for the years ending December 31, 2012, 2011 and 2010 were $686,000, $704,000 and $691,000, respectively. The required payments due in 2012, 2011 and 2010 have been made.
In June 2012, the Governmental Accounting Standards Board (GASB) issued GASB Statement No. 68, Accounting and Financial Reporting for Pensions. This accounting standard replaces GASB Statement No. 27, and it is effective for employer fiscal years beginning after June 15, 2014.

CITY OF CLEVELAND, OHIO DEPARTMENT OF PUBLIC UTILITIES
DIVISION OF WATER POLLUTION CONTROL
NOTES TO FINANCIAL STATEMENTS (Continued) For the Years Ended December 31, 2012 and 2011
30
NOTE F – OTHER POSTEMPLOYMENT BENEFITS Ohio Public Employees Retirement System: All full-time employees, other than non-administrative full-time police officers and firefighters, participate in the Ohio Public Employees Retirement System (OPERS). OPERS administers three separate pension plans: The Traditional Pension Plan – a cost-sharing, multiple-employer defined benefit pension plan; the Member-Directed Plan – a defined contribution plan; and the Combined Plan – a cost-sharing, multiple-employer defined benefit pension plan that has elements of both a defined benefit and defined contribution plan. OPERS maintains a cost-sharing multiple employer defined benefit postemployment health care plan, which includes a medical plan, prescription drug program and Medicare Part B premium reimbursement, to qualifying members of both the Traditional Pension and the Combined Plans. Members of the Member-Directed Plan do not qualify for ancillary benefits, including postemployment health care coverage. In order to qualify for postemployment health care coverage, age-and-service retirees under the Traditional Pension and Combined Plans must have 10 or more years of qualifying Ohio service credit. Health care coverage for disability benefit recipients and qualified survivor benefit recipients is available. The health care coverage provided by OPERS meets the definition of an Other Postemployment Benefit (OPEB) as described in GASB Statement 45. The Ohio Revised Code permits, but does not mandate, OPERS to provide OPEB benefits to its eligible members and beneficiaries. Authority to establish and amend benefits is provided in Chapter 145 of the Ohio Revised Code. OPERS issues a stand-alone financial report. Interested parties may obtain a copy by visiting https://www.opers.org/investments/cafr.shtml, writing to OPERS, 277 East Town Street, Columbus, Ohio 43215-4642, or by calling (614) 222-5601 or (800) 222-7377. The Ohio Revised Code provides the statutory authority requiring public employers to fund post-retirement health care through their contributions to OPERS. A portion of each employer’s contribution to OPERS is set aside for funding of post-retirement health care benefits. Employer contribution rates are expressed as a percentage of the covered payroll of active members. The employer contribution rates were 14.00% of covered payroll in 2012, 2011 and 2010. The Ohio Revised Code currently limits the employer contribution to a rate not to exceed 14.00% of covered payroll. Active members do not make contributions to the OPEB Plan. OPERS’ Postemployment Health Care plan was established under and is administrated in accordance with, Internal Revenue Code 401(h). Each year, the OPERS Retirement Board determines the portion of the employer contribution rate that will be set aside for funding of postemployment health care benefits. Employer contribution rates used to fund postemployment benefits were 4.00% for members of the Traditional Plan in 2012 and 2011, 6.05% for members of the Combined Plan in 2012 and 2011 and 5.50% from January 1, 2010 through February 28, 2010 and 5.00% from March 1, 2010 through December 31, 2010 for both plans. Effective January 1, 2013, the portion of employer contributions allocated to health care was lowered to 1.00% for both plans, as recommended by the OPERS Actuary. The OPERS Retirement Board is also authorized to establish rules for the payment of a portion of the health care benefits provided, by the retiree or their surviving beneficiaries. Payment amounts vary depending on the number of covered dependents and the coverage selected. The Division’s actual contributions to OPERS to fund postemployment benefits were $274,000 in 2012, $281,000 in 2011 and $394,000 in 2010. The required payments due in 2012, 2011, and 2010 have been made.
CITY OF CLEVELAND, OHIO DEPARTMENT OF PUBLIC UTILITIES
DIVISION OF WATER POLLUTION CONTROL
NOTES TO FINANCIAL STATEMENTS (Continued) For the Years Ended December 31, 2012 and 2011
31
NOTE F – OTHER POSTEMPLOYMENT BENEFITS (Continued) Changes to the health care plan were adopted by the OPERS Board of Trustees on September 19, 2012, with a transition plan commencing January 1, 2014. With the recent passage of pension legislation under SB343 and the approved health care changes, OPERS expects to be able to consistently allocate 4.00% of the employer contributions toward the health care fund after the end of the transition period. NOTE G - CONTINGENT LIABILITIES AND RISK MANAGEMENT Contingent Liabilities: Various claims are pending against the City involving the Division for personal injuries, property damage and other matters. The City is responsible for the suits. The City’s management is of the opinion that ultimate settlement of such claims will not result in a material adverse effect on the Division’s financial position, results of operations or cash flows. Risk Management: The Division is exposed to various risks of loss related to torts; thefts of, damage to and destruction of assets; errors and omissions; injuries to employees; and natural disasters. The Division is generally self-insured. No material losses, including incurred but not reported losses, occurred in 2012 or 2011.
The City provides the choice of four separate health insurance plans for its employees. These plans are provided by two different insurers through commercial insurance. Operating funds are charged a monthly rate per employee, by type of coverage. The Division participates in the State of Ohio workers’ compensation retrospective rating program.
In accordance with GASB Statement No. 10, claims liabilities are reported when it is probable that a loss has occurred and the amount of the loss can be reasonably estimated. Liabilities include an amount for claims that have been incurred but not reported. The result of the process to estimate the claims liability is not an exact amount as it depends on many complex factors, such as inflation, changes in legal doctrines, and damage awards. Accordingly, claims are re-evaluated periodically to consider the effects of inflation, recent claim settlement trends (including frequency and amount of pay-outs), and other economic and social factors.
The estimate of the claims liability also includes amounts for incremental claim adjustment expenses related to specific claims and other claim adjustment expenses, regardless of whether allocated to specific claims. Estimated recoveries, for example from salvage or subrogation, are another component of the claims liability estimate. Claims liability for the Division is immaterial.
NOTE H - RELATED PARTY TRANSACTIONS Revenues and Accounts Receivable: The Division provides sewer services to the City, including its various departments and divisions. Standard consumption rates are charged, except for the Division of Fire, public buildings and certain other facilities owned by the City, which by ordinance are provided free sewer services. Billing and collection services for the Division are performed by the Division of Water for a fee. This fee is based on the number of billings made on behalf of the Division during the year at the same rates as charged to other users of the billing system. These fees were approximately $2,421,000 and $2,414,000 in 2012 and 2011, respectively.

CITY OF CLEVELAND, OHIO DEPARTMENT OF PUBLIC UTILITIES
DIVISION OF WATER POLLUTION CONTROL
NOTES TO FINANCIAL STATEMENTS (Continued) For the Years Ended December 31, 2012 and 2011
32
NOTE H - RELATED PARTY TRANSACTIONS (Continued) Operating Expenses: The Division is provided various intra-city services. Charges are based on actual use or on a reasonable pro-rata basis. The more significant costs for the years ended December 31, 2012 and 2011 were as follows:
2012 2011Electricity purchases 198$ 204$ Street construction and maintenance 134 199 City Administration 469 456 Motor Vehicle Maintenance 472 458 Utilities Administration and Utilities Fiscal Control 473 477 Services provided by the Division of Water 315 467
(In thousands)
NOTE I - CUYAHOGA COUNTY REAL PROPERTY TAXES The Division is required by ordinance to keep records of the estimated property taxes which would be payable to Cuyahoga County were it subject to such taxes. The estimated property taxes for the Division, based on book value of real estate at the current tax rates, would have been approximately $24,552 and $21,181 for the years ended December 31, 2012 and 2011, respectively.

88EastBroadStreet,FourthFloor,Columbus,Ohio43215‐3506Phone:614‐466‐4514or800‐282‐0370Fax:614‐466‐4490
www.ohioauditor.gov
CITY OF CLEVELAND
CUYAHOGA COUNTY
CLERK’S CERTIFICATION This is a true and correct copy of the report which is required to be filed in the Office of the Auditor of State pursuant to Section 117.26, Revised Code, and which is filed in Columbus, Ohio.
CLERK OF THE BUREAU CERTIFIED SEPTEMBER 5, 2013