city of chesapeake, virginia - rampp-team.com · pdf filethis flood insurance study covers the...
TRANSCRIPT
CITY OF
CHESAPEAKE,
VIRGINIA INDEPENDENT CITY
PRELIMINARY:
APRIL 5, 2013
Federal Emergency Management Agency
FLOOD INSURANCE STUDY NUMBER 510034V000A
City of Chesapeake
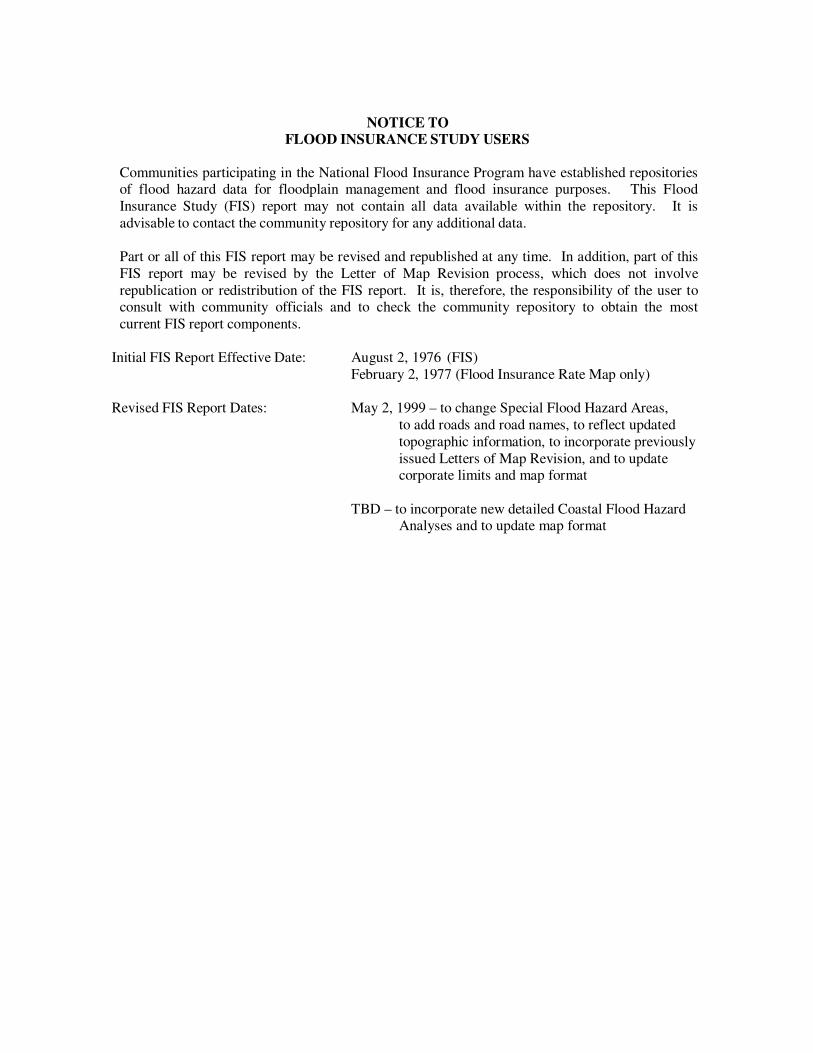
NOTICE TO FLOOD INSURANCE STUDY USERS
Communities participating in the National Flood Insurance Program have established repositories of flood hazard data for floodplain management and flood insurance purposes. This Flood
Insurance Study (FIS) report may not contain all data available within the repository. It is
advisable to contact the community repository for any additional data.
Part or all of this FIS report may be revised and republished at any time. In addition, part of this
FIS report may be revised by the Letter of Map Revision process, which does not involve
republication or redistribution of the FIS report. It is, therefore, the responsibility of the user to consult with community officials and to check the community repository to obtain the most
current FIS report components.
Initial FIS Report Effective Date: August 2, 1976 (FIS)
February 2, 1977 (Flood Insurance Rate Map only)
Revised FIS Report Dates: May 2, 1999 – to change Special Flood Hazard Areas,
to add roads and road names, to reflect updated
topographic information, to incorporate previously
issued Letters of Map Revision, and to update corporate limits and map format
TBD – to incorporate new detailed Coastal Flood Hazard Analyses and to update map format

TABLE OF CONTENTS
Page
1.0 INTRODUCTION 1
1.1 Purpose of Study 1
1.2 Authority and Acknowledgments 1
1.3 Coordination 2 2.0 AREA STUDIED 2
2.1 Scope of Study 2
2.2 Community Description 3
2.3 Principal Flood Problems 4
2.4 Flood Protection Measures 5 3.0 ENGINEERING METHODS 5
3.1 Hydrologic Analyses 6
3.2 Hydraulic Analyses 6
3.3 Coastal Analysis 7
3.4 Vertical Datum 10 4.0 FLOODPLAIN MANAGEMENT APPLICATIONS 10
4.1 Floodplain Boundaries 11
4.2 Floodways 11 5.0 INSURANCE APPLICATIONS 12 6.0 FLOOD INSURANCE RATE MAP 13 7.0 OTHER STUDIES 13 8.0 LOCATION OF DATA 14 9.0 BIBLIOGRAPHY AND REFERENCES 14
i
TABLE OF CONTENTS - continued
TABLES
Page
Table 1 – Summary of Stillwater Elevations 8
FIGURES
Figure 1 – Transect Schematic 9
EXHIBITS
Exhibit 1 – Flood Insurance Rate Map Index
Flood Insurance Rate Map
ii
1
FLOOD INSURANCE STUDY
CITY OF CHESAPEAKE, VIRGINIA, INDEPENDENT CITY
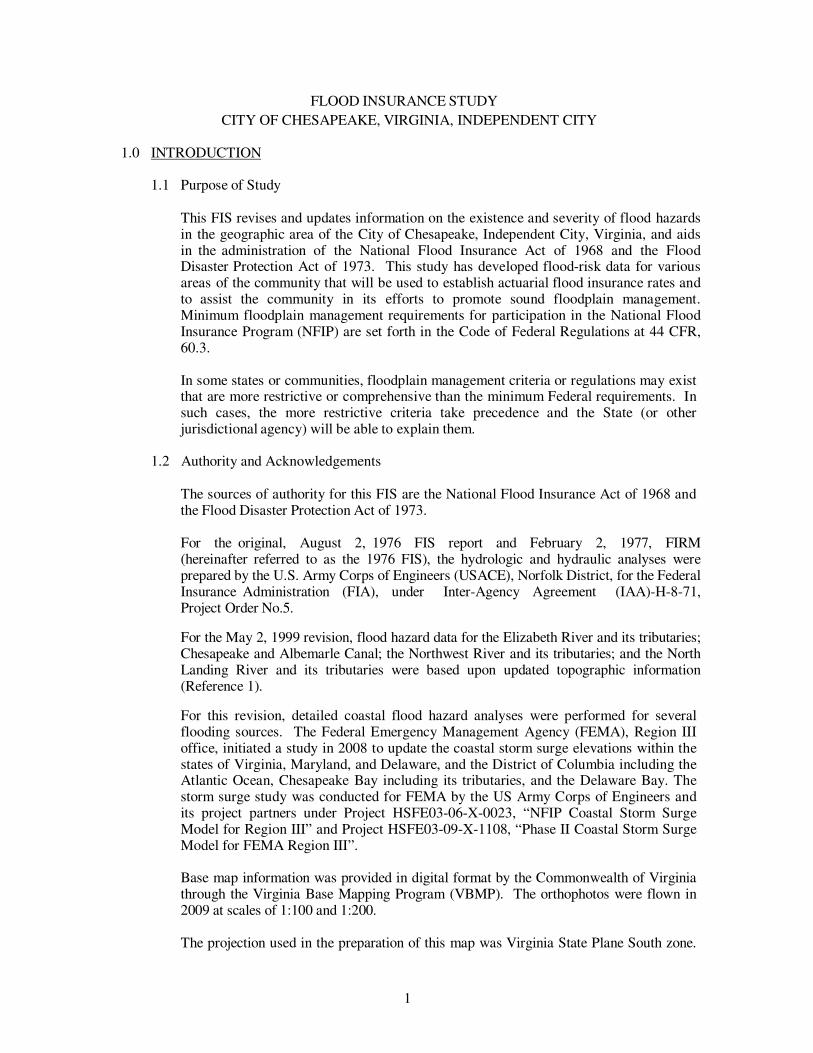
1.0 INTRODUCTION
1.1 Purpose of Study
This FIS revises and updates information on the existence and severity of flood hazards in the geographic area of the City of Chesapeake, Independent City, Virginia, and aids in the administration of the National Flood Insurance Act of 1968 and the Flood Disaster Protection Act of 1973. This study has developed flood-risk data for various areas of the community that will be used to establish actuarial flood insurance rates and to assist the community in its efforts to promote sound floodplain management. Minimum floodplain management requirements for participation in the National Flood Insurance Program (NFIP) are set forth in the Code of Federal Regulations at 44 CFR, 60.3.
In some states or communities, floodplain management criteria or regulations may exist that are more restrictive or comprehensive than the minimum Federal requirements. In such cases, the more restrictive criteria take precedence and the State (or other jurisdictional agency) will be able to explain them.
1.2 Authority and Acknowledgements
The sources of authority for this FIS are the National Flood Insurance Act of 1968 and the Flood Disaster Protection Act of 1973.
For the original, August 2, 1976 FIS report and February 2, 1977, FIRM (hereinafter referred to as the 1976 FIS), the hydrologic and hydraulic analyses were prepared by the U.S. Army Corps of Engineers (USACE), Norfolk District, for the Federal Insurance Administration (FIA), under Inter-Agency Agreement (IAA)-H-8-71, Project Order No.5.
For the May 2, 1999 revision, flood hazard data for the Elizabeth River and its tributaries; Chesapeake and Albemarle Canal; the Northwest River and its tributaries; and the North Landing River and its tributaries were based upon updated topographic information (Reference 1).
For this revision, detailed coastal flood hazard analyses were performed for several flooding sources. The Federal Emergency Management Agency (FEMA), Region III office, initiated a study in 2008 to update the coastal storm surge elevations within the states of Virginia, Maryland, and Delaware, and the District of Columbia including the Atlantic Ocean, Chesapeake Bay including its tributaries, and the Delaware Bay. The storm surge study was conducted for FEMA by the US Army Corps of Engineers and its project partners under Project HSFE03-06-X-0023, “NFIP Coastal Storm Surge Model for Region III” and Project HSFE03-09-X-1108, “Phase II Coastal Storm Surge Model for FEMA Region III”. Base map information was provided in digital format by the Commonwealth of Virginia through the Virginia Base Mapping Program (VBMP). The orthophotos were flown in 2009 at scales of 1:100 and 1:200. The projection used in the preparation of this map was Virginia State Plane South zone.
2
The horizontal datum was NAD 83, HARN. Differences in datum, spheroid, projection or State Plane zones used in the production of FIRMs for adjacent jurisdictions may result in slight positional differences in map features across jurisdiction boundaries. These differences do not affect the accuracy of this FIRM.
1.3 Coordination
The purpose of an initial Consultation Coordination Officer’s (CCO) meeting is to
discuss the scope of the FIS. A final CCO meeting is held to review the results of the
study.
During the course of the original study, a search for basic data was made at all levels of
government. Several meetings were held during the preparation of the original study
with representatives of FEMA, USACE, the Virginia Department of Environmental Quality (previously, the Virginia State Water Control Board), and local officials.
Contacts with various agencies were made to minimize possible hydraulic and
hydrologic conflicts. For the 1976 FIS, the preparation ran concurrently with the preparation of a report titled "Floodplain Information, Coastal Flooding, Chesapeake, Virginia, December 1972." Assistance and cooperation was given by the City Engineer, the U.S. Weather Bureau, the USGS, local newspapers, the City of Chesapeake Planning Department, and private citizens (Reference 2).
For the May 2, 1999 revision, the city was notified by FEMA in a letter dated September 24, 1996, that its FIS would be revised using the aforementioned updated topographic information. For this revision, an initial CCO meeting was held on March 22, 2011, with
representatives from the City of Chesapeake, the Commonwealth of Virginia, USACE,
and FEMA.
2.0 AREA STUDIED
2.1 Scope of Study
This Flood Insurance Study covers the incorporated area of the City of Chesapeake, Virginia. In the 1976 FIS, tidal flooding within the city was studied by detailed methods.
For the May 2, 1999 revision, the Elizabeth River and its tributaries, Chesapeake and Albemarle Canal, the Northwest River and its tributaries, and the North Landing River and its tributaries were revised based on updated topographic information for their entirety within the City of Chesapeake (Reference 1). Additionally, the stream formerly known as Drum Creek has been renamed Drum Point Creek.
In this revision, the effects of the Chesapeake Bay on the Eastern Branch Elizabeth River, Southern Branch Elizabeth River, Western Branch Elizabeth River and Indian River and their tributaries were studied.
3
Limits of detailed study are indicated on the FIRM (Exhibit 1). The areas studied by detailed methods were selected with priority given to all known flood hazard areas and areas of projected development and proposed construction. The scope and methods of study were proposed to, and agreed upon by, FEMA and the City of Chesapeake.
No Letters of Map Revision (LOMRs) were incorporated into this revision.
2.2 Community Description
The City of Chesapeake is in southeastern Virginia. It is bordered on the north by the Cities of Norfolk and Portsmouth, on the east by the City of Virginia Beach, on the west by the City of Suffolk, and to the south by the Virginia-North Carolina state boundary.
Three branches of the Elizabeth River border and enter the city on its northern boundary. The Eastern Branch touches the northeast comer of the city and its tributary, the Indian River, is the major drainage way of that area. The Western Branch drains the northwest corner of the city. The Southern Branch, the main stem of the Elizabeth River, is a part of the Intracoastal Waterway; it makes two connections with the Waterway; its Deep Creek tributary runs southwest to the Dismal Swamp Canal and, at its upper reach, it connects with the Chesapeake and Albemarle Canal which runs eastward to connect with the North Landing River. Locks at Deep Creek and at Great Bridge accommodate the difference in water levels.
The Northwest River flows easterly across the southern part of the city. The North Landing River, a part of the Intracoastal Waterway, flows south and forms the most easterly boundary of the city. This FIS investigates tidal flooding adjacent to the Southern, Eastern, and Western Branches of the Elizabeth River, and the Indian River.
Lake Drummond, a large land-locked body of water, is located within the Great Dismal Swamp National Wildlife Refuge area within the city. This lake and the Intracoastal Waterway south of Deep Creek are not subject to tidal flooding.
The City of Chesapeake was established in 1963 with the consolidation of the City of South Norfolk and Norfolk County. The established city contains 353 square miles and is exceeded only by its neighbor, the City of Suffolk, as the largest city in the area in the Commonwealth. The 2010 census population was listed as 222,209 (Reference 3).
Development within the city consists generally of residential areas along the northern boundary, this development being a continuation of the urban growth of the cities of Norfolk and Portsmouth. The municipal government and Civic Center are located in the Great Bridge area. This area also contains a central commercial shopping and banking area.
Other large commercial areas are located in the Churchland and South Norfolk areas. Interstate 64 is located in the northern portion of the city and provides an adequate loop through this area of the city and to the remaining Tidewater cities.
Industrial development along the Southern Branch of the Elizabeth River is varied. Major industries are cement, fertilizer, gasoline and fuel storage, block and pipe manufacture, steel processing and manufacture, and grain storage and shipment.
The topography of the City of Chesapeake is typical of the Tidewater coastal plain in which the city is located. The terrain is essentially flat and featureless with an average
4
elevation of approximately 11 feet North American Vertical Datum of 1988 (NAVD). Heavily developed areas along the Elizabeth River, located in the South Norfolk and Deep Creek areas, are approximately 9 feet NAVD and lower. Many large industrial areas are below 9 feet NAVD.
The land area in the southeastern part of the city contiguous to the Northwest River is used primarily for agricultural purposes. This area contains large marsh and swamp areas below 9 feet NAVD.
The central and southern portions of the city are generally agricultural.
A typical feature of the rural landscape of the City of Chesapeake is the widespread use of manmade drainage ditches and canals alongside roadways and property lines.
A part of the Great Dismal Swamp National Wildlife Refuge is included in the city. Average land elevations in the swamp are higher than the city’s average elevation of about 19 feet NAVD and, thus, not subject to tidal flooding. However, surface drainage is poor resulting in a swampy condition from which the area has derived its name. At the present time, there is practically no development in this part of the city. Consequently the area is not important to the study of flood problems in the City of Chesapeake. The entire area has been excluded from the study.
2.3 Principal Flood Problems
Large sections of the City of Chesapeake are low and are subject to tidal flooding during hurricanes and severe northeast storms. Tidal flooding of 7 feet NAVD has been experienced in all areas contiguous to the Western and Southern Branches of the Elizabeth River tidal estuary and along the Intracoastal Waterway as far south as Great Bridge. The extreme southern part of the city and all areas contiguous to the North Landing and Northwest Rivers are partially protected from tidal flooding by the barrier beach which separates Back Bay from the Atlantic Ocean. Nevertheless, wind surges up to approximately 3 feet NAVD have been experienced in this part of the city. In the northern part of the city where the source of tidal flooding is the Elizabeth River and its tributary branches, very little development has taken place below an elevation of 5 feet NAVD. However, between 5 feet and 8 feet NAVD, there are numerous residential, commercial, and industrial type structures which in some cases have suffered serious damage during past tidal floods. The land area in the southern part of the city remains largely undeveloped and is used primarily for agricultural purposes. Development on the floodplain consists of a few farmhouses and other rural type structures. Historical accounts of flooding as determined from available documents, interviews with older residents, and the meager tide gage records, indicate that significant flooding in Northwest River and North Landing River does not occur as often as it does in other parts of the city. Only on four occasions, those of August 1933, December 1949, October 1954, and August 1955, have flood heights exceeded 2 feet NAVD in these areas in the past 38 years. A maximum flood crest of 2.51 feet NAVD was recorded on a USACE gage in North Landing River during Hurricane Hazel in October 1954. The center of this hurricane moved inland in the vicinity of the South Carolina-North Carolina border between 9:00 and 10:00 a.m. on the 15th day of October and rapid northward movement carried it through Virginia from Brunswick County to Loudoun County between 2:00 and 6:00 p.m. The center passed a few miles

5
west of Chesapeake and produced hurricane force winds with gusts from 80 to 100 miles per hour in the North Landing River area. Highest winds were from the south which are conducive to high water levels in the North Landing River, Northwest River and Chesapeake and Chesapeake Canal. A similar hurricane moving along the same path as the October 1954 storm but with a slower forward speed could no doubt produce a much higher wind tide. Other large floods occurred in April 1956 (northeaster), October 1957 (Tropical Storm Eight), September 1960 (Hurricane Donna), September 1960 (Hurricane Donna), September 1964 (remnants of Hurricane Cleo), June 1972, (Hurricane Agnes), September 1979 (Hurricane David), September 1985 (Hurricane Gloria), August 1998 (Hurricane Bonnie), September 1999 (Hurricane Floyd), September 2003 (Hurricane Isabel), and August 2011 (Hurricane Irene). Irene, in the City of Chesapeake, brought heavy rain of up to 6 inches, and flooding. The storm surge was 8.5 feet above mean sea level with the third highest tide on record. The main flood season due to hurricanes generally extends from May through November. Nearly 80 percent of all hurricanes occur during the months of August, September and October, and about 40 percent occur in September. The "northeaster" type of storm and the resulting flooding may occur at any period of the year, but they occur most frequently in the winter and spring. The most severe "northeasters" of record have occurred during the months of March and April. Wave action is responsible for much of the waterfront structural damage and for damage to boats and equipment. Waves are generated by the action of wind on the surface of the water. Wave heights at any given location are dependent upon the velocity, direction, and duration of the wind; and the length, width, and depth of water area over which the wind is acting. The City of Chesapeake is not generally exposed to wide reaches of water; however, wave runup to elevations higher than stillwater level could be a significant factor particularly at industrial locations adjacent to the branches of the Elizabeth River. The duration of floods depends upon the duration of the tide producing forces. Floods caused by a hurricane are usually of much shorter duration than the ones caused by a "northeaster." Flooding from hurricanes rarely lasts through more than one tidal cycle, whereas flooding caused by northeast storms may last several days, during which the most severe flooding takes place at the time of peak astronomical tide.
2.4 Flood Protection Measures
There are no existing flood control structures that would provide protection during major floods in the study area. The "Uniform Statewide Building Code", which went into effect in September 1973 states, "where a structure is located in a 1% annual chance flood plain, the lowest floor of all future construction or substantial improvement to an existing structure…, must be built at or above that level, except for non-residential structures which may be flood proofed to that level." These requirements will no doubt be beneficial in reducing future flood damage in the city (Reference 4).
3.0 ENGINEERING METHODS
For the flooding sources studied by detail methods in the county, standard hydrologic and hydraulic study methods were used to determine the flood hazard data required
6
for this study. Flood events of a magnitude that are expected to be equaled or exceeded once on the average during any 10-, 50-, 100-, or 500-Year period (recurrence interval) have been selected as having special significance for floodplain management and for flood insurance rates. These events, commonly termed the 10-, 50-, 100-, and 500-Year floods, have a 10-, 2-, 1-, and 0.2-percent chance, respectively, of being equaled or exceeded during any year. Although the recurrence interval represents the long-term average period between floods of a specific magnitude, rare floods could occur at short intervals or even within the same year. The risk of experiencing a rare flood increases when periods greater than one year are considered. For example, the risk of having a flood which equals or exceeds the 1-percent- annual-chance flood in any 50-year period is approximately 40 percent (four in ten); for any 90-year period, the risk increases to approximately 60 percent (six in ten). The analyses reported herein reflect flooding potentials based on conditions existing in the county at the time of completion of this study. Maps and flood elevations will be amended periodically to reflect future changes.
3.1 Hydrologic Analyses
Hydrologic analyses were carried out to establish the peak elevation-frequency relationships for the flooding source studied in detail affecting the community. For previous studies, the stillwater elevations that were used were developed by Dewberry & Davis. These elevations were developed from the following sources of data: intermittent and continuous tide gage records for six locations in the general vicinity of the Cities of Norfolk, Hampton, and Poquoson for the period between 1906 and 1977; observed tidal flood elevations for tropical and extratropical storms and hurricanes which occurred between 1928 and 1976; and a storm surge model analysis for the Chesapeake Bay completed by the Virginia Institute of Marine Science in 1978.
3.2 Hydraulic Analyses Hydraulic analyses, considering storm characteristics and the shoreline and bathymetric characteristics of the flooding source studied, were carried out to provide estimates of the elevations of floods of the selected recurrence intervals along the shorelines. Qualifying bench marks (elevation reference marks) within a given jurisdiction that are cataloged by the National Geodetic Survey (NGS) and entered into the National Spatial Reference System (NSRS) as First or Second Order Vertical and have a vertical stability classification of A, B, or C are shown and labeled on the FIRM with their 6- character NSRS Permanent Identifier.
Bench marks cataloged by the NGS and entered into the NSRS vary widely in vertical stability classification. NSRS vertical stability classifications are as follows:
• Stability A: Monuments of the most reliable nature, expected to hold position/elevation well (e.g., mounted in bedrock)
• Stability B: Monuments which generally hold their position/elevation well (e.g., concrete bridge abutment)
• Stability C: Monuments which may be affected by surface ground movement (e.g., concrete monument below frost line)
7
• Stability D: Mark of questionable or unknown stability (e.g., concrete monument above frost line, or steel witness post)
In addition to NSRS bench marks, the FIRM may also show vertical control monuments established by a local jurisdiction; these monuments will be shown on the FIRM with the appropriate designations. Local monuments will only be placed on the FIRM if the community has requested that they be included, and if the monuments meet the aforementioned NSRS inclusion criteria.
To obtain current elevation, description, and/or location information for bench marks shown on the FIRM for this jurisdiction, please contact the Information Services Branch of the NGS at (301) 713-3242, (Internet address www.ngs.noaa.gov).
It is important to note that temporary vertical monuments are often established during the preparation of a flood hazard analysis for the purpose of establishing local vertical control. Although these monuments are not shown on the FIRM, they may be found in the Technical Support Data Notebook associated with this FIS and FIRMs. Interested individuals may contact FEMA to access this data.
3.3 Coastal Analysis
Coastal analysis, considering storm characteristics and the shoreline and bathymetric characteristics of the flooding sources studied, were carried out to provide estimates of the elevations of floods of the selected recurrence intervals along the shoreline. Users of the FIRM should be aware that coastal flood elevations are provided in Table 1, “Summary of Stillwater Elevations” table in this report. If the elevation on the FIRM is higher than the elevation shown in this table, a wave height, wave runup, and/or wave setup component likely exists, in which case, the higher elevation should be used for construction and/or floodplain management purposes.
Development along the coastline of the City of Chesapeake, along northern and central portions of the city is extensive, especially along the Eastern Branch, Southern Branch, and Indian River, with much of the area occupied by transportation, industrial, educational, and residential facilities. Large agricultural and residential development exists within the southern portion of the city. Undeveloped areas extend along the North Carolina state line. The City of Chesapeake has no direct frontage along either the Atlantic Ocean or Chesapeake Bay.
An analysis was performed to establish the frequency peak elevation relationships for coastal flooding in the City of Chesapeake. FEMA, Region III office, initiated a study in 2008 to update the coastal storm surge elevations within the states of Virginia, Maryland, and Delaware, and the District of Columbia including the Atlantic Ocean, Chesapeake Bay including its tributaries, and the Delaware Bay. The study replaces outdated coastal storm surge stillwater elevations for all FISs in the study area, including The City of Chesapeake, VA, and serves as the basis for updated FIRMs. Study efforts were initiated in 2008 and concluded in 2012.
The storm surge study was conducted for FEMA by the USACE and its project partners under Project HSFE03-06-X-0023, “NFIP Coastal Storm Surge Model for Region III” and Project HSFE03-09-X-1108, “Phase II Coastal Storm Surge Model for FEMA Region III”. The work was performed by the Coastal Processes Branch (HF-C) of the
8
Flood and Storm Protection Division (HF), U.S. Army Engineer Research and Development Center – Coastal & Hydraulics Laboratory (ERDC-CHL).
The end-to-end storm surge modeling system includes the Advanced Circulation Model for Oceanic, Coastal and Estuarine Waters (ADCIRC) for simulation of 2-dimensional hydrodynamics (Reference 5). ADCIRC was dynamically coupled to the unstructured numerical wave model Simulating WAves Nearshore (unSWAN) to calculate the contribution of waves to total storm surge (Reference 6). The resulting model system is typically referred to as SWAN+ADCIRC (Reference 6). A seamless modeling grid was developed to support the storm surge modeling efforts. The modeling system validation consisted of a comprehensive tidal calibration followed by a validation using carefully reconstructed wind and pressure fields from three major flood events for the Region III domain: Hurricane Isabel, Hurricane Ernesto, and extratropical storm Ida. Model skill was accessed by quantitative comparison of model output to wind, wave, water level and high water mark observations.
The tidal surge from Chesapeake Bay affects the Eastern Branch Elizabeth River, Southern Branch Elizabeth River, Western Branch Elizabeth River and Indian River. The widths of these tidal rivers, as well as several smaller tidal tributaries are narrow. In these areas, the fetch over which winds can operate for wave generation is significantly less.
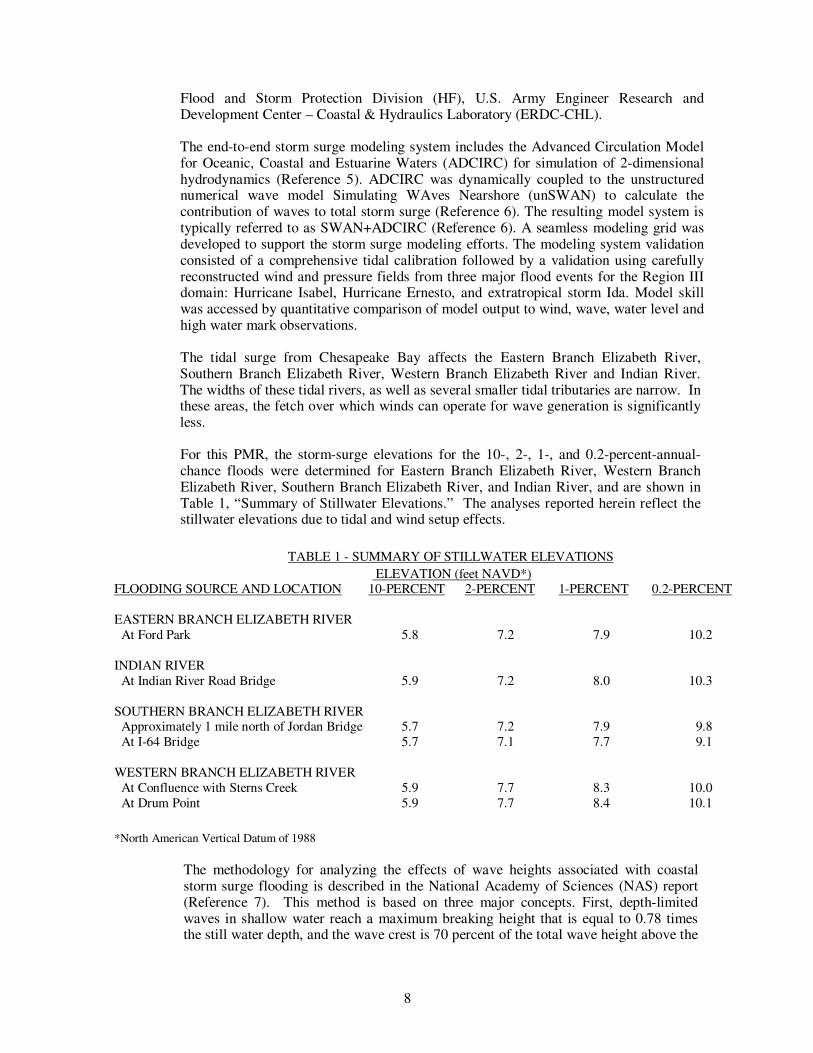
For this PMR, the storm-surge elevations for the 10-, 2-, 1-, and 0.2-percent-annual-chance floods were determined for Eastern Branch Elizabeth River, Western Branch Elizabeth River, Southern Branch Elizabeth River, and Indian River, and are shown in Table 1, “Summary of Stillwater Elevations.” The analyses reported herein reflect the stillwater elevations due to tidal and wind setup effects.
TABLE 1 - SUMMARY OF STILLWATER ELEVATIONS
ELEVATION (feet NAVD*) FLOODING SOURCE AND LOCATION 10-PERCENT 2-PERCENT 1-PERCENT 0.2-PERCENT
EASTERN BRANCH ELIZABETH RIVER
At Ford Park 5.8 7.2 7.9 10.2
INDIAN RIVER
At Indian River Road Bridge 5.9 7.2 8.0 10.3
SOUTHERN BRANCH ELIZABETH RIVER Approximately 1 mile north of Jordan Bridge 5.7 7.2 7.9 9.8
At I-64 Bridge 5.7 7.1 7.7 9.1
WESTERN BRANCH ELIZABETH RIVER
At Confluence with Sterns Creek 5.9 7.7 8.3 10.0
At Drum Point 5.9 7.7 8.4 10.1
*North American Vertical Datum of 1988
The methodology for analyzing the effects of wave heights associated with coastal storm surge flooding is described in the National Academy of Sciences (NAS) report (Reference 7). This method is based on three major concepts. First, depth-limited waves in shallow water reach a maximum breaking height that is equal to 0.78 times the still water depth, and the wave crest is 70 percent of the total wave height above the
9
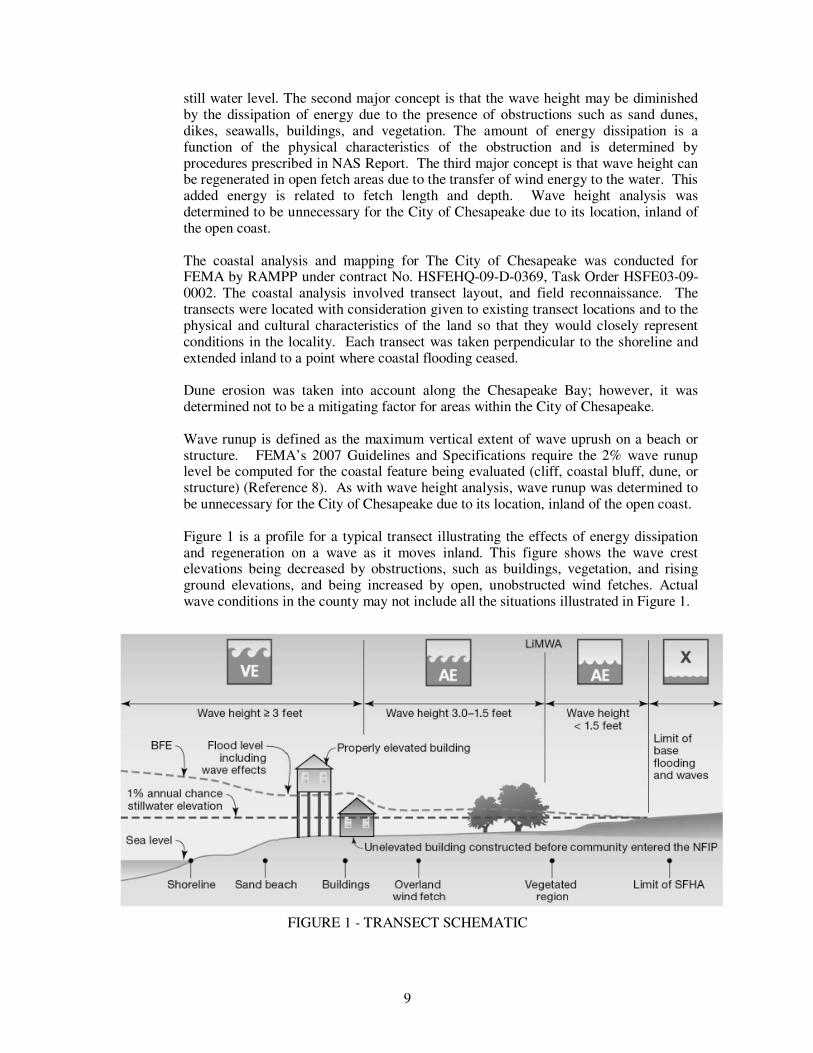
still water level. The second major concept is that the wave height may be diminished by the dissipation of energy due to the presence of obstructions such as sand dunes, dikes, seawalls, buildings, and vegetation. The amount of energy dissipation is a function of the physical characteristics of the obstruction and is determined by procedures prescribed in NAS Report. The third major concept is that wave height can be regenerated in open fetch areas due to the transfer of wind energy to the water. This added energy is related to fetch length and depth. Wave height analysis was determined to be unnecessary for the City of Chesapeake due to its location, inland of the open coast. The coastal analysis and mapping for The City of Chesapeake was conducted for FEMA by RAMPP under contract No. HSFEHQ-09-D-0369, Task Order HSFE03-09-0002. The coastal analysis involved transect layout, and field reconnaissance. The transects were located with consideration given to existing transect locations and to the physical and cultural characteristics of the land so that they would closely represent conditions in the locality. Each transect was taken perpendicular to the shoreline and extended inland to a point where coastal flooding ceased. Dune erosion was taken into account along the Chesapeake Bay; however, it was determined not to be a mitigating factor for areas within the City of Chesapeake. Wave runup is defined as the maximum vertical extent of wave uprush on a beach or structure. FEMA’s 2007 Guidelines and Specifications require the 2% wave runup level be computed for the coastal feature being evaluated (cliff, coastal bluff, dune, or structure) (Reference 8). As with wave height analysis, wave runup was determined to be unnecessary for the City of Chesapeake due to its location, inland of the open coast. Figure 1 is a profile for a typical transect illustrating the effects of energy dissipation and regeneration on a wave as it moves inland. This figure shows the wave crest elevations being decreased by obstructions, such as buildings, vegetation, and rising ground elevations, and being increased by open, unobstructed wind fetches. Actual wave conditions in the county may not include all the situations illustrated in Figure 1.
FIGURE 1 - TRANSECT SCHEMATIC
10
Between transects, elevations were interpolated using topographic maps, land-use and land cover data, and engineering judgment to determine the aerial extent of flooding. The results of the calculations are accurate until local topography, vegetation, or cultural development within the community undergo major changes.
3.4 Vertical Datum
All FIS reports and FIRMs are referenced to a specific vertical datum. The vertical datum provides a starting point against which flood, ground, and structure elevations can be referenced and compared. Until recently, the standard vertical datum used for newly created or revised FIS reports and FIRMs was the National Geodetic Vertical Datum of 1929 (NGVD29). With the completion of the NAVD 88, many FIS reports and FIRMs are now prepared using NAVD 88 as the referenced vertical datum.
All flood elevations shown in this FIS report and on the FIRM are referenced to NAVD. In order to perform this conversion, effective NGVD elevation values were adjusted downward by 1.03 feet. Structure and ground elevations in the community must, therefore, be referenced to NAVD. It is important to note that adjacent communities may be referenced to NGVD. This may result in differences in base flood elevations across the corporate limits between the communities. Elevations initially referenced to the City of Chesapeake local datum would have to be adjusted downward by 1.03 feet to convert to NAVD.
The conversion equation for all of Chesapeake is as follows:
NGVD = NAVD +1.03 ft.
For more information on NAVD 88, see Converting the National Flood Insurance Program to the North American Vertical Datum of 1988, FEMA Publication FIA-20/June 1992, or contact the National Geodetic Survey at the following address:
NGS Information Services
NOAA, N/NGS12 National Geodetic Survey
SSMC-3, #9202 1315 East-West Highway
Silver Spring, Maryland 20910-3282 (301) 713-3242
http://www.ngs.noaa.gov/
4.0 FLOODPLAIN MANAGEMENT APPLICATIONS
The NFIP encourages State and local governments to adopt sound floodplain management programs. Therefore, each FIS provides 1-percent-annual-chance floodplain data, which may include a combination of the following: 10-percent-annual-chance, 2-percent-annual chance, 1-percent-annual-chance, and 0.2-percent-annual-chance flood elevations; delineations of the 1-percent-annual-chance and 0.2-percent-annual-chance floodplains; and 1-percent-annual-chance floodway to assist communities in developing floodplain management measures.
11
This information is presented on the FIRM and in many components of the FIS report, including Summary of Stillwater Elevations Table. Users should reference the data presented in the FIS report as well as additional information that may be available at the local map repository before making flood elevation and/or floodplain boundary determinations.
4.1 Floodplain Boundaries
To provide a national standard without regional discrimination, the 1 percent annual chance flood has been adopted by FEMA as the base flood for flood plain management purposes. The 0.2 percent annual chance flood is employed to indicate additional areas of flood risk in the community. In the previous FIS, for flooding sources studied in detail, the 1- and 0.2- percent annual flood plain boundaries were delineated using topographic maps at a scale of 1:2,400 with a contour interval of 2 feet. In this revised FIS, flooding sources studied in detail, the 1- and 0.2-percent annual chance flood plain boundaries, were delineated using LiDAR which was flown in 2009. The 1- and 0.2-percent annual chance flood plain boundaries are shown on the Flood Insurance Rate Map (Exhibit 1). In cases where the 1- and 0.2-percent annual chance flood boundaries were close together, only the 1-percent annual chance floodplain boundary has been shown. The 1- and 0.2-percent-annual-chance floodplain boundaries are shown on the FIRM (Exhibit 2). On this map, the 1-percent-annual-chance floodplain boundary corresponds to the boundary of the areas of special flood hazards (Zones A, AE, AH, AO, A99, V and VE), and the 0.2-percent-annual-chance floodplain boundary corresponds to the boundary of areas of moderate flood hazards. In cases where the 1- and 0.2-percent-annual-chance floodplain boundaries are close together, only the 1-percent-annual-chance floodplain boundary has been shown. Small areas within the floodplain boundaries may lie above the flood elevations but cannot be shown due to limitations of the map scale and/or lack of detailed topographic data.
4.2 Floodways Encroachment on floodplains, such as structures and fill, reduces flood-carrying capacity, increases flood heights and velocities, and increases flood hazards in areas beyond the encroachment itself. One aspect of floodplain management involves balancing the economic gain from floodplain development against the resulting increase in flood hazard. For purposes of the NFIP, a floodway is used as a tool to assist local communities in this aspect of floodplain management. Under this concept, the area of the 1-percent annual chance floodplain is divided into a floodway and a floodway fringe. The floodway is the channel of a stream, plus any adjacent floodplain areas, that must be kept free of encroachment so that the 1-percent annual chance flood can be carried without substantial increases in flood heights. Minimum federal standards limit such increases to 1.0 foot, provided that hazardous velocities are not produced. The floodways are presented to local agencies as minimum standards that can be adopted directly or that can be used as a basis for additional floodway studies. No floodways were calculated as part of this FIS.
12
5.0 INSURANCE APPLICATIONS
For flood insurance rating purposes, flood insurance zone designations are assigned to a community based on the results of the engineering analyses. These zones are as follows: Zone A
Zone A is the flood insurance rate zone that corresponds to the 1-percent-annual-chance floodplains that are determined in the FIS by approximate methods. Because detailed hydraulic analyses are not performed for such areas, no BFEs or base flood depths are shown within this zone.
Zone AE
Zone AE is the flood insurance rate zone that corresponds to the 1-percent-annual-chance floodplains that are determined in the FIS by detailed methods. In most instances, whole- foot BFEs derived from the detailed hydraulic analyses are shown at selected intervals within this zone.
Zone AH
Zone AH is the flood insurance rate zone that corresponds to the areas of 1-percent-annual- chance shallow flooding (usually areas of ponding) where average depths are between 1 and 3 feet. Whole-foot BFEs derived from the detailed hydraulic analyses are shown at selected intervals within this zone.
Zone AO
Zone AO is the flood insurance rate zone that corresponds to the areas of 1-percent-annual- chance shallow flooding (usually sheet flow on sloping terrain) where average depths are between 1 and 3 feet. Average whole-foot depths derived from the detailed hydraulic analyses are shown within this zone.
Zone AR
Zone AR is the flood insurance risk zone that corresponds to an area of special flood hazard formerly protected from the 1-percent-annual-chance flood event by a flood-control system that was subsequently decertified. Zone AR indicates that the former flood-control system is being restored to provide protection from the 1-percent-annual-chance or greater flood event.
Zone A99
Zone A99 is the flood insurance zone that corresponds to areas of the 1-percent-annual- chance floodplain that will be protected by a Federal flood protection system where construction has reached specified statutory milestones. No BFEs or depths are shown within this zone.
Zone V
Zone V is the flood insurance rate zone that corresponds to the 1-percent-annual-chance coastal floodplains that have additional hazards associated with storm waves. Because
13
approximate hydraulic analyses are performed for such areas, no BFEs are shown within this zone.
Zone VE
Zone VE is the flood insurance rate zone that corresponds to the 1-percent-annual-chance coastal floodplains that have additional hazards associated with storm waves. Whole-foot BFEs derived from the detailed hydraulic analyses are shown at selected intervals within this zone. Zone X
Zone X is the flood insurance rate zone that corresponds to areas outside the 0.2-percent- annual-chance floodplain, areas within the 0.2-percent-annual-chance floodplain, areas of 1- percent-annual-chance flooding where average depths are less than 1 foot, areas of 1- percent-annual-chance flooding where the contributing drainage area is less than 1 square mile, and areas protected from the 1-percent-annual-chance flood by levees. No BFEs or depths are shown within this zone. Zone X (Future Base Flood)
Zone X (Future Base Flood) is the flood insurance risk zone that corresponds to the 1- percent-annual-chance floodplains that are determined based on future-conditions hydrology. No BFEs or base flood depths are shown within this zone.
Zone D
Zone D is the flood insurance rate zone that corresponds to unstudied areas where flood hazards are undetermined, but possible.
6.0 FLOOD INSURANCE RATE MAP
The FIRM is designed for flood insurance and floodplain management applications.
For flood insurance applications, the map designates flood insurance rate zones as described in Section 5.0 and, in the 1-percent-annual-chance floodplains that were studied by detailed methods, shows selected whole-foot BFEs or average depths. Insurance agents use the zones and BFEs in conjunction with information on structures and their contents to assign premium rates for flood insurance policies.
For floodplain management applications, the map shows by tints, screens, and symbols, the
1- and 0.2-percent-annual-chance floodplains, floodways and the locations of selected cross sections used in the hydraulic analyses and floodway computations.
7.0 OTHER STUDIES
FISs are being updated for the Cities of Norfolk, Portsmouth, Suffolk, and Virginia Beach, VA. Being part of the same regional analysis, the results of this study are all in agreement. (References 9-12). The results of this Flood Insurance Study supersede the previous FIS published for City of Chesapeake.
14
8.0 LOCATION OF DATA
Information concerning the pertinent data used in preparation of this FIS can be obtained by contacting FEMA, Federal Insurance and Mitigation Division, FEMA Region III, One Independence Mall, Sixth Floor, 615 Chestnut Street, Philadelphia, Pennsylvania 19106- 4404.
9.0 BIBLIOGRAPHY AND REFERENCES
1. Abrams Aerial Survey Corporation, Lansing Michigan, Topographic Maps, Scale
1:2,400, Contour Interval 2 Feet: City of Chesapeake, Virginia, February 1984.
2. Floodplain Information, Coastal Flooding, City of Chesapeake, Virginia, Corps of Engineers, U.S. Army, Norfolk, Virginia District, December 1972.
3. U. S. Census Bureau, “Profile of General Population and Housing Characteristics: 2010, (Table) DP-1, 2010 Demographic Profile Data” published April 1, 2011, Internet address: www.census.gov.
4. Commonwealth of Virginia, Virginia Uniform Statewide Building Code, Article 8, Part C, Section 872.6, September 1973.
5. Luettich, R. A. and J. J. Westerink. A (Parallel) Advanced Circulation Model for
Oceanic, Coastal and Estuarine Waters (ADCIRC). Version 45.12. February 6, 2008. University of North Carolina at Chapel Hill, Institute of Marine Sciences. Morehead City, NC.
6. U.S. Army Corps of Engineers. 2012. ERDC/CHL TR11-X. FEMA Region 3 Storm Surge Study Coastal Storm Surge Analysis: Modeling System Validation Submission No.2. US Army Corps of Engineers
7. National Academy of Sciences, Methodology for Calculating Wave Action Effects
Associated with Storm Surges, Washington, D. C., 1977.
8. Federal Emergency Management Agency, 2007. Atlantic Ocean and Gulf of Mexico Update Coastal Guidelines Update. Washington, DC.
9. Federal Emergency Management Agency. Flood Insurance Study, City of Norfolk, Independent City, Virginia, Washington, D.C., study underway.
10. Federal Emergency Management Agency. Flood Insurance Study, City of Portsmouth, Independent City, Virginia, Washington, D.C., study underway.
11. Federal Emergency Management Agency. Flood Insurance Study, City of Suffolk, Independent City, Virginia, Washington, D.C., study underway.
12. Federal Emergency Management Agency. Flood Insurance Study, City of Virginia Beach, Independent City, Virginia, Washington, D.C., study underway.