city of casselberry - ccie.ucf.edu · vanessa balta cook, kelly carson, justin eason, merissa...
TRANSCRIPT

0
City of Casselberry
HEALTHY COMMUNITY PLAN MASTER OF URBAN & REGIONAL PLANNING
UNIVERSITY OF CENTRAL FLORIDA – CAPSTONE 2016 / 2017
“As cities are now the dominant human habitat, they must be a healthy human habitat. They must be planned, developed, and managed in healthy and sustainable ways—ways that minimize their ecologi-cal footprints and maximize health and well-being for their residents.”
-Anthony C. Capon and Susan M. Thompson Making Healthy Places: Designing and Building for
Health, Well-being, and Sustainability

Casselberry Healthy Community Plan >> Page i
City of Casselberry HEALTHY COMMUNITY PLAN
School of Public Administration College of Health and Public Affairs University of Central Florida 4364 Scorpius Street Orlando, FL 32816-1395 https://www2.cohpa.ucf.edu/publicadmin/
Authors Vanessa Balta Cook, Kelly Carson, Justin Eason, Merissa Evans, Christina Hyson, Sharisse Kenney, Benjamin Paquin Advisor Dr. Christopher Hawkins, Ph.D., Associate Pro-fessor, Master of Science in Urban and Regional Planning Program Director Prepared Final draft published on April 17, 2017. This re-port was completed as part of the 2016-2017 Capstone Project by students in the Master of Science in Urban and Regional Planning Program at the University of Central Florida.
Acknowledgements The authors wish to extend a special thank you to those individuals and groups who assisted with the initiation, research, and preparation of the City of Casselberry Healthy Community Plan: The City of Casselberry City Commission; The City of Cassel-berry Planning & Zoning Board; The City of Cassel-berry Planning & Zoning Staff including Emily Hanna, Dean Fathelbab, and Randy Woodruff; Chief of Po-lice Larry D. Krantz of the City of Casselberry Po-lice Department; Lynn Hoppes of the City of Cas-selberry Recreation Program and Events Depart-ment; Sara Hunsinger of the Seminole County Prop-erty Appraiser Office; Richard Miles of Seminole County Public Schools; and April Fisher.

Casselberry Healthy Community Plan >> Page ii
TABLE OF CONTENTS
iii EXECUTIVE SUMMARY
1 PART ONE: Background
2 PART TWO: Studio Planning Process
3 PART THREE: Foundation Research 4 Air Quality 5 Water Quality 7 Food Environment 9 Social Justice & Equity 11 Social Capital 12 Physical Activity 14 Community Safety 16 Mental Health 18 Environment & Housing
20 PART FOUR: Casselberry Demographics
25 PART FIVE: Community Health Indicators 25 Natural Environment Quality 26 Built Environment Quality 31 Social & Economic Factors 36 Health Behaviors 40 Health Outcomes
43 PART SIX: Engagement & Observation
52 PART SEVEN: Comprehensive Plan Audit
53 PART EIGHT: Key Findings
54 PART NINE: Healthy Community Element
61 PART TEN: Data & Element Development
63 APPENDIX 63 A Community Health Indicators Raw Data 65 B Center for Disease Control Healthy
Community Design Checklist 66 C UCF – HCDS Print Format 67 D UCF- HCDS Electronic Format 70 E UCF Healthy Community Design Survey
Results Report 87 F SOPARC Data Collection Form 88 G Park Audit Raw Data 92 H Healthy Communities Comprehensive
Plan Assessment of Casselberry Comprehensive Plan
93 REFERENCES & RESOURCES

Casselberry Healthy Community Plan >> Page iii
EXECUTIVE SUMMARY The relationship between urban planning and public health is an emerging area of study for planning practitioners across the United States. Rural small towns and large cities alike are ad-vancing policies and making strategic public in-vestments to improve community health. Alt-hough in many cases these investments fall under the domain of urban planning, there is a natural nexus with community health. Across the coun-try, community stakeholders and elected and ap-pointed officials are actively promoting policies and programmatic initiatives that leverage these relationships to build stronger and healthier communities.
The promotion of health as the centerpiece of long range planning has coalesced around what is generally referred to as the Healthy Communities Movement. This is a national effort to improve the health and well-being of individuals and fami-lies, primarily through policies and urban design that sustain positive, lasting changes to local sys-tems and environments. Underpinning this movement is the argument that communities with well-planned parks, sidewalk systems, bike trails, greenways, and other amenities can help address such health issues as obesity, diabetes, heart dis-ease, attention disorders and depression in chil-dren and adults alike. Walking and biking, and visiting nearby parks, shops and restaurants also provide important social and mental health bene-
fits as residents may have more opportunities to interact with each other. Although health is influ-enced by many factors, including individual life-styles, socio economic status, education and fami-ly history, urban planning initiatives focused on policy and the built environment are key ele-ments in promoting community and individual health.
The Casselberry Healthy Community Plan is the re-sult of a year-long process of data collection and analysis conducted by the University of Central Florida Master of Science in Urban and Regional Planning program. The overarching objectives of this plan are to provide a set of healthy communi-ty policies that will promote positive impacts on the health of Casselberry. It provides the basis for decisions related to transportation infrastruc-ture, parks and recreation areas, land uses, among other public elements of the built envi-ronment.
The need to expand access to fresh food, invest in infrastructure that promotes physical activity, and ensure land uses and regulations enable ra-ther than inhibit positive social change are among the key findings from the planning process. Policy decisions related to these and other public in-vestments should be made to promote greater social equity and to improve the health and well-being of all residents of Casselberry. The Cassel-
berry Healthy Community Goals and Objectives presented at the conclusion of this plan reflect these needs. The associated policies emphasize the importance of modifying, where possible, the built environment to promote active lifestyles, and to mitigate the negative effects of future growth and development on environmental health. These policies, coupled with the progres-sive actions the city is already taking, will have significant impacts on the community’s physical and mental health.

Casselberry Healthy Community Plan >> Page 1
. Part One .
BACKGROUND
The City of Casselberry is located in Central Florida in the southern region of Seminole County. The total area of the City covers approximately eight square miles. There are eighteen parks and two public schools (Cassel-berry Elementary and South Seminole Middle) located within the City.
The City of Casselberry utilizes a Commission and City Manager form of government. The Commission is comprised of a Mayor and four other elect-ed officials. The daily operations of the City are administered by a City Man-ager that is appointed by the Commission.
Casselberry was incorporated in 1940 as a tax-free town. Hibbard Cassel-berry was a leading figure in the town’s development and served as Cassel-berry’s first mayor. Historically, the Casselberry economy was based pri-marily on agriculture and the fern industry. From the late 1920s until the be-ginning of World War II, the area was one of the leading producers of ferns worldwide. The area was reincorporated as the City of Casselberry in 1965 and residents began paying property taxes in 1976.
Figure 1. City of Casselberry Population Growth, 1950-2010, US Census
Casselberry has experienced a significant increase in population since 1950 (Figure 1) According to the U.S. Census Bureau, the total population of the City of Casselberry was 26,241 in 2010 with 11,430 households and a medi-an age of 37.5. The Bureau of Economic and Business Research estimates that the 2016 population is 27,786, a 5.9% increase from 2010 (see Part Four for more detailed city demographic information).

Casselberry Healthy Community Plan >> Page 2
. Part Two .
STUDIO PLANNING PROCESS Foundation Research
The 2016 / 2017 Master of Science in Urban and Regional Planning Capstone studio planning pro-cess began with an in-depth literature review to identify relevant studies reporting on the impacts of planning and design of the built environment on health in the research areas of Air Quality, Water Quality, Food Environment, Social Justice & Equity, Social Capital, Physical Activity, Com-munity Safety, Mental Health, and Environment & Housing. Community Health Indicators
Informed by the studio’s foundation research, secondary data at multiple levels - including city-level, census-tract level (when the data was avail-able), county-level, and state level - related to Demographics, Natural Environment Quality, Built Environment Quality, Social & Economic Factors, Health Behaviors, and Health Outcomes, were collected and analyzed.
Engagement & Observation
Recognizing the need for primary data on resi-dents’ healthy community design preferences and physical activity behaviors, the studio conducted a Healthy Community Design Survey of Casselber-ry residents, as well as a Park Audit of Casselber-ry’s Secret Lake Park to determine park users’ physical activity levels, gender, activity modes/types, and estimated age and ethnicity groupings.
Comprehensive Plan Audit
To ensure future growth in the City of Cassel-berry promotes healthy lifestyles, an assessment of the city’s existing comprehensive plan was conducted, evaluating the plan’s effectiveness in the areas of Pedestrian & Bicycle Accessibility, Mixed Use & Compact Development, Complete Streets Principles, Access to Healthy Food, and Open Space & Recreation. Healthy Community Element
Five major health goal categories related to the built environment emerged from data derived from each of the aforementioned sections: Ac-cess & Connectivity, Physical Activity, Healthy Food, Social Capital, and Safety. The Goals, Ob-jectives, and Policies of the Healthy Community Element are informed by the key findings of this process.

Casselberry Healthy Community Plan >> Page 3
. Part Three .
FOUNDATION RESEARCH
“The built environment is comprised of structures and systems that are designed, built, and managed by humans. These include transportation systems, water and sewer management systems, food systems, neighborhoods, homes, workplaces, hospitals, and schools (Dannenberg, Frumkin, & Jackson, 2011)”. “Public health and urban planning research is increasingly demonstrating that the built environment can result in both beneficial and adverse health impacts (Dannenberg et al, 2011)” .
AIR QUALITY
WATER QUALITY SOCIAL JUSTICE & EQUITY
FOOD ENVIRONMENT
SOCIAL CAPITAL
PHYSICAL ACTIVITY
COMMUNITY SAFETY
MENTAL HEALTH
ENVIRONMENT & HOUSING

Casselberry Healthy Community Plan >> Page 4
Air quality affects human health and impacts the social and economic vibrancy of a community. Good air quality in a city is essential to having a healthy community and an attractive place to live. However, long-term exposure to air pollution can lead to health risks, including asthma, COPD, and accelerated cancer risk. Community air standard policies are instrumental for improving air quality and human health. This section elabo-rates on the various techniques that can be used to reduce air pollution and increase the quality of the air.
Source of Pollution and Chemicals
One important source of air pollution that local governments can address through land use, zon-ing, and transportation infrastructure are station-ary facilities such as manufacturing or chemical factories. Other sources of air pollution are mo-bile sources, including cars, buses, and city owned vehicles. Among the most toxic pollutants emit-ted from these sources are volatile organic com-pounds (VOCs), carbon monoxide (CO), Nitro-gen dioxide (NOx), and sulfur dioxide (SO2). These chemicals are produced primarily by the burning of fossil fuels. There is also particulate matter (PM), which encompasses suspended sol-
ids in the air. When these primary pollutants combine with other chemicals in the air, it can cause secondary pollutants. For instance, NOx can produce nitric acid HNO3, and SO2 can pro-duce sulfuric acid (H2SO2) when combined.
Figure 2. Air Pollution Sources, Health Effects, and Chemicals
Federal regulatory approaches, such as the 1970 Clean Air Act, are pivotal to improving and main-taining healthy air quality. Local governments also have the capacity to influence air quality condi-tions through such mechanisms as Transportation Control Measures (TCMs). TCMs are transporta-tion strategies affecting traffic patterns and/or
reducing vehicle miles traveled (VMT) which re-duce emissions by reducing the rate of vehicle usage (Shewmake, 2012).
Strategies in a smaller suburban city may include the implementation of high-occupancy vehicle (HOV) lanes, installation of bicycle lanes and facil-ities, and ride sharing programs such as Zipcar. Funding these initiatives, however, provides signif-icant challenges for localities. To address this, there are various types of federally aided funding available to assist with air quality improvement.
Table 1. Air Quality Indicator
AIR QUALITY
• The ambient concentrations of air toxins • Asthma prevalence among children and
adults
Air
Pollu-tion
HealthEffects
Heartdisease
Lungdisease
Con-
trols
Regula-tionof
AirPollu-tants
CleanAirActof1970
Chemi-
cals
Sources
Natural
Stationary
Natural
Pollu-tants
Carbondioxide(CO)
VolatileOrganicCom-pounds(VOCs)
Particulatematter(PM)
Sulfurdioxide(SO2)
A I R Q U A L I T Y
Casselberry Healthy Community Plan >> Page 5
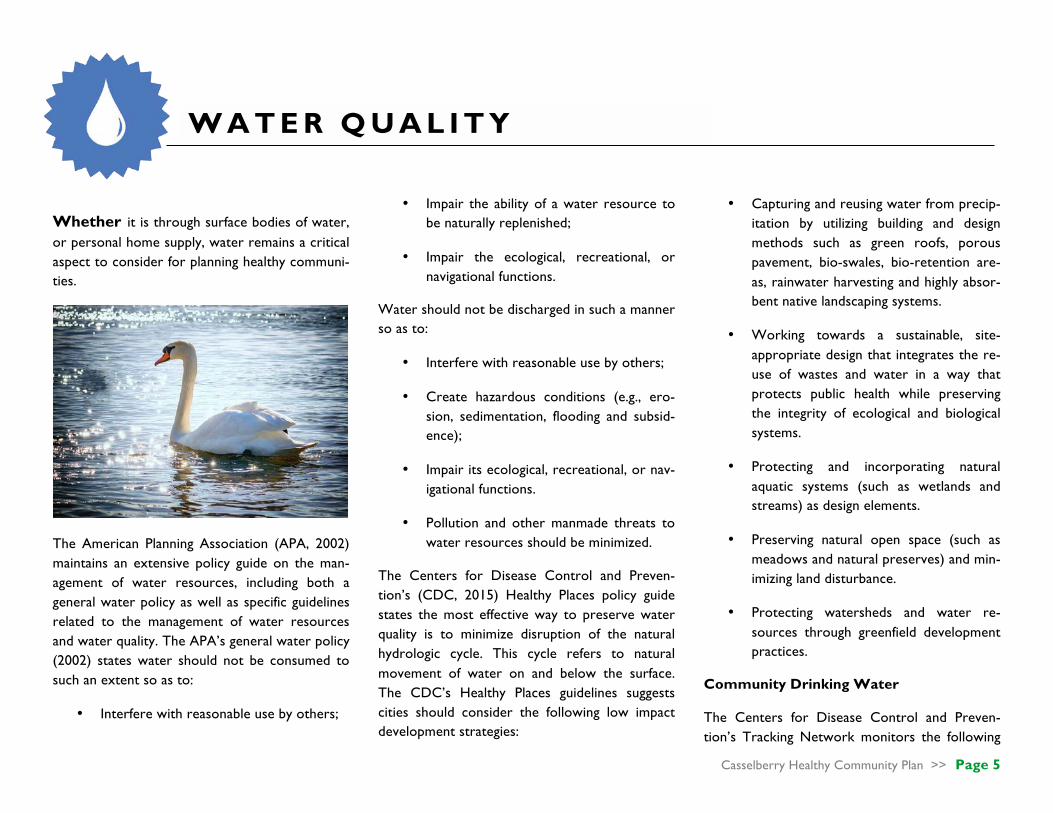
Whether it is through surface bodies of water, or personal home supply, water remains a critical aspect to consider for planning healthy communi-ties.
The American Planning Association (APA, 2002) maintains an extensive policy guide on the man-agement of water resources, including both a general water policy as well as specific guidelines related to the management of water resources and water quality. The APA’s general water policy (2002) states water should not be consumed to such an extent so as to:
• Interfere with reasonable use by others;
• Impair the ability of a water resource to be naturally replenished;
• Impair the ecological, recreational, or navigational functions.
Water should not be discharged in such a manner so as to:
• Interfere with reasonable use by others;
• Create hazardous conditions (e.g., ero-sion, sedimentation, flooding and subsid-ence);
• Impair its ecological, recreational, or nav-igational functions.
• Pollution and other manmade threats to water resources should be minimized.
The Centers for Disease Control and Preven-tion’s (CDC, 2015) Healthy Places policy guide states the most effective way to preserve water quality is to minimize disruption of the natural hydrologic cycle. This cycle refers to natural movement of water on and below the surface. The CDC’s Healthy Places guidelines suggests cities should consider the following low impact development strategies:
• Capturing and reusing water from precip-itation by utilizing building and design methods such as green roofs, porous pavement, bio-swales, bio-retention are-as, rainwater harvesting and highly absor-bent native landscaping systems.
• Working towards a sustainable, site-appropriate design that integrates the re-use of wastes and water in a way that protects public health while preserving the integrity of ecological and biological systems.
• Protecting and incorporating natural aquatic systems (such as wetlands and streams) as design elements.
• Preserving natural open space (such as meadows and natural preserves) and min-imizing land disturbance.
• Protecting watersheds and water re-sources through greenfield development practices.
Community Drinking Water
The Centers for Disease Control and Preven-tion’s Tracking Network monitors the following
W A T E R Q U A L I T Y

Casselberry Healthy Community Plan >> Page 6
contaminants in community water: Arsenic; Atra-zine; Di(2-ethylhexyl) Phthalate (DEHP); Disinfec-tion By-products; Nitrate; Perchloroethene (PCE); Radium; Trichloroethene (TCE); and Ura-nium. The CDC tracks these contaminants be-cause they are believed to occur more frequently in community water supplies and at levels that can affect public health (Centers for Disease Control and Prevention, 2013). Potential contam-inants in community water supply directly affect the community’s health, and should be monitored closely and strategic corrective measures should be implemented if any contaminants are meas-ured at a level that is deemed unsafe.
The risk of waterborne illness via drinking water is rare within the United States. Proper municipal water treatment effectively eliminates most path-ogens, however, ineffective and poorly regulated water treatment systems increase the risk of wa-terborne disease outbreaks (Reynolds, Mena, & Gerba, 2008). Chemically contaminated drinking
water, polluted via accidental spills, runoff, or leaching, has been associated with negative health effects such as cancer, cardiovascular disease, neurological disease, and miscarriage (Barrett, 2014). For example, in April 2014, improper wa-ter treatment by the City of Flint, Michigan caused lead to leach into the city’s water supply, exposing thousands of residents (adults and chil-dren) to elevated levels of lead (Hanna-Attisha, et al., 2016).
When they fail, septic systems can lead to surface water and groundwater contamination with dis-ease-causing pathogens, as well as nitrates and phosphorous pollution of inland waters. This in-crease in algal growth lowers dissolved oxygen levels within the water (US Environmental Pro-tection Agency, 2016).
Natural Water Contaminants
It is important to establish a baseline of data on a community’s natural water and institute a meas-urement system to monitor and evaluate trends and needs. The US Environmental Protection Agency (2016) identifies the following as key wa-ter quality indicators that should be monitored: dissolved oxygen; pH; temperature; turbidity; total phosphorous; total nitrogen; and E. Coli.
Trophic State Index
Trophic State Index is an important indicator of natural water quality. The Trophic State Index ranges from one to 100, which is translated into a rating of good, fair, or poor (Lake County Wat-eratlas, 2016).
Table 2. Trophic State Rating System (Lake County Wateratlas, 2016)
TROPHIC STATE INDEX RATING SYSTEM: LAKES, PONDS, & RIVERS
0-59 Good
60-69 Fair
70-100 Poor
The Trophic State Index rating can be measured to determine a baseline level (if it has not previ-ously been measured), and can be continuously measured annually to track changes. Lakes with a ‘poor’ Trophic State Index, or ones that consist-ently increase annually should be identified and targeted for water quality improvement strate-gies.
Table 3. Water Quality Indicators
COMMUNITY WATER
• Drinking Water Contaminants Violations NATURAL WATER
• Trophic State Index • Water Quality Deficiencies
Casselberry Healthy Community Plan >> Page 7
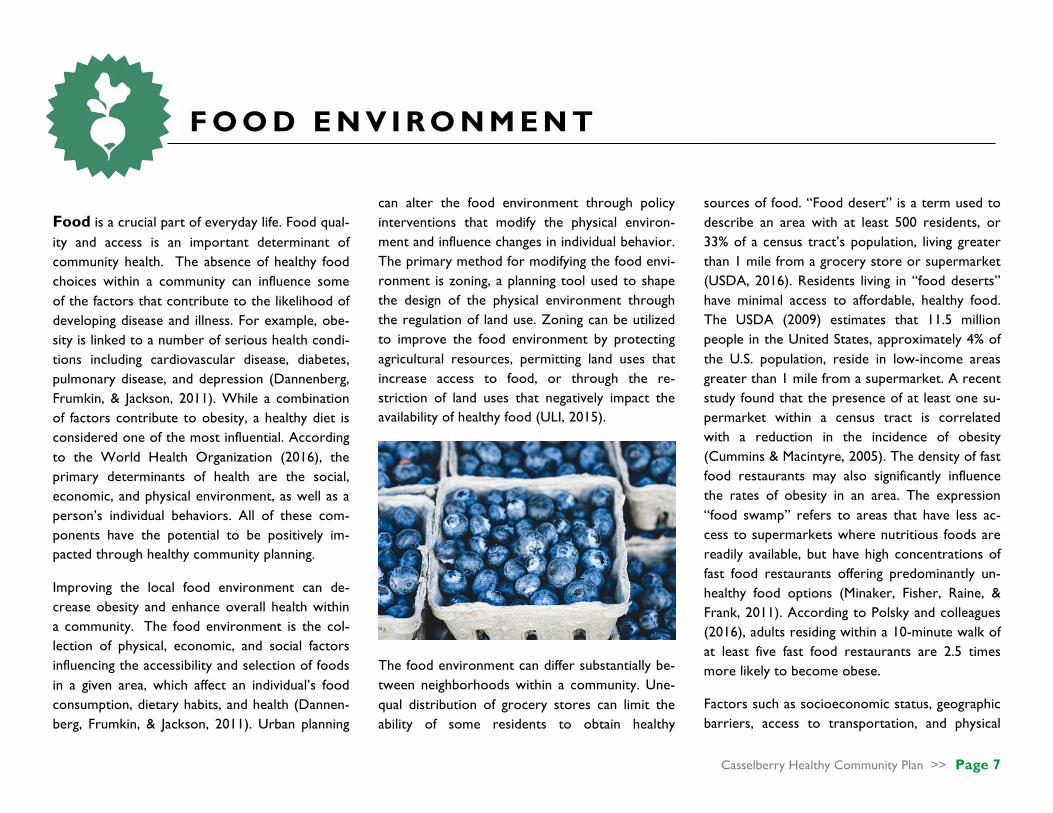
Food is a crucial part of everyday life. Food qual-ity and access is an important determinant of community health. The absence of healthy food choices within a community can influence some of the factors that contribute to the likelihood of developing disease and illness. For example, obe-sity is linked to a number of serious health condi-tions including cardiovascular disease, diabetes, pulmonary disease, and depression (Dannenberg, Frumkin, & Jackson, 2011). While a combination of factors contribute to obesity, a healthy diet is considered one of the most influential. According to the World Health Organization (2016), the primary determinants of health are the social, economic, and physical environment, as well as a person’s individual behaviors. All of these com-ponents have the potential to be positively im-pacted through healthy community planning.
Improving the local food environment can de-crease obesity and enhance overall health within a community. The food environment is the col-lection of physical, economic, and social factors influencing the accessibility and selection of foods in a given area, which affect an individual’s food consumption, dietary habits, and health (Dannen-berg, Frumkin, & Jackson, 2011). Urban planning
can alter the food environment through policy interventions that modify the physical environ-ment and influence changes in individual behavior. The primary method for modifying the food envi-ronment is zoning, a planning tool used to shape the design of the physical environment through the regulation of land use. Zoning can be utilized to improve the food environment by protecting agricultural resources, permitting land uses that increase access to food, or through the re-striction of land uses that negatively impact the availability of healthy food (ULI, 2015).
The food environment can differ substantially be-tween neighborhoods within a community. Une-qual distribution of grocery stores can limit the ability of some residents to obtain healthy
sources of food. “Food desert” is a term used to describe an area with at least 500 residents, or 33% of a census tract’s population, living greater than 1 mile from a grocery store or supermarket (USDA, 2016). Residents living in “food deserts” have minimal access to affordable, healthy food. The USDA (2009) estimates that 11.5 million people in the United States, approximately 4% of the U.S. population, reside in low-income areas greater than 1 mile from a supermarket. A recent study found that the presence of at least one su-permarket within a census tract is correlated with a reduction in the incidence of obesity (Cummins & Macintyre, 2005). The density of fast food restaurants may also significantly influence the rates of obesity in an area. The expression “food swamp” refers to areas that have less ac-cess to supermarkets where nutritious foods are readily available, but have high concentrations of fast food restaurants offering predominantly un-healthy food options (Minaker, Fisher, Raine, & Frank, 2011). According to Polsky and colleagues (2016), adults residing within a 10-minute walk of at least five fast food restaurants are 2.5 times more likely to become obese.
Factors such as socioeconomic status, geographic barriers, access to transportation, and physical
F O O D E N V I R O N M E N T

Casselberry Healthy Community Plan >> Page 8
disabilities can impact the ability of an individual or household to obtain healthy foods (Minaker, Fisher, Raine, & Frank, 2011). Vulnerable popula-tions are found to be disproportionately affected by poor food access (USDA, 2009). For example, obesity rates are higher among minorities and individuals with low socioeconomic status (Dan-nenberg, Frumkin, & Jackson, 2011). Thus, urban planning processes should emphasize strategies ensuring these populations gain access to afforda-ble and nutritious food options. Assessing a community’s food environment is an important first step in determining which planning tools will be the most effective at creating an environment that encourages and supports healthy choices. Policy and design tools should be evaluated as part of a comprehensive strategy to optimize the community’s food environment to ensure that every resident has adequate access to healthy and nutritious food.
Food Environment Indicators
The characteristics of the food environment con-tributing most to health outcomes include food access, food availability, food affordability, and food quality (Minaker, Fisher, Raine, & Frank, 2011). Food access relates to the proximity, den-sity, and variety of food outlets in a community (Minaker, Fisher, Raine, & Frank, 2011). Food availability pertains to the actual foods that are present in a community, which affects eating hab-its and dietary patterns. Food affordability refers to the cost of a specific food and the comparative price of alternative food options (USDA, 2009), and food quality is the condition of available food and the subsequent effect on consumer prefer-ences and purchasing behavior (Minaker, Fisher, Raine, & Frank, 2011).
A thorough analysis of a community’s food ac-cess, food availability, food affordability, and food quality is necessary to develop a comprehensive understanding of the local food environment. In-dicators of individual behaviors, aspects of the built environment, and medical conditions associ-ated with poor nutrition can provide further in-sight into the health of a community, and inform decisions on potential policy, system, and envi-ronmental interventions to improve the food en-vironment.
Table 4 displays indicators and measures that are often used by planners and public health officials to evaluate the quality of the food environment in a community.
Table 4. Food Environment Indicators
BEHAVIORS
• Daily per Capita Servings of Fruits & Veg. • Adult Diabetes Rate • Adult Obesity Rate
ACCESS TO FOOD
• % Households w/o Car/Low Store Access • % of Households w/o Access to a Car • % of Neighborhoods w/ Low Vehicular
Access & w/in 5 Min Walk (0.25 mi) of a Healthy Food Retail Destination
• % of Households that are Food Insecure • Number of Certified Farmers’ Markets • Land Vacancy Rate • # Community Gardens/1,000 Households • Number of Community Gardens • Number of Food Deserts • % of Population Living in Food Desert • Number of Food Banks • % Grocery Stores w/ Bus Stops
LOCAL FOOD PRODUCTION
• Number of Farms • Number of CSAs
AVAILABILITY
• Retail Food Environment Index
AFFORDABILITY
• National School Lunch Program (% pop) • SNAP Participants (% of Population) • % Students Eligible for Free Lunch • % Students Eligible for Reduced-Price
Lunch • WIC Participants (% of Population) • Farmers’ Markets that Accept WIC &
SNAP • Median Household Income

Casselberry Healthy Community Plan >> Page 9
When planning healthy communities, it is im-portant to be inclusive in the planning process and sensitive to the variation in resident income, ethnicities, cultures, and age. The following sec-tion describes these elements and also some of the key related topics.
Social Justice & Access
Social justice refers to the lack of equitable distri-bution of resources among social groups. Resi-dents in communities with poor health typically face an uneven distribution of critical facilities and services (Smit, et al., 2011), and research demon-strates that neighborhoods with concentrated areas of poverty tend to have increased levels of health risks (Pastor & Morello-Frosch, 2014). Long commutes, for example, increases expenses spent on travel instead of what could be used for health expenses and services (Robert Wood Johnson Foundation Commission to Build a Healthier America, 2008).
The negative impacts of unequal service delivery are particularly acute for individuals with disabili-ties and the elderly. These factors intensify pro-longed exposure and illness in poor areas (Eitler, McMahon, & Thoerig, 2013).
Disparate access to basic needs and services within a municipality contribute to increased health risks and prevents localities from achieving truly sustainable places. Additionally, privileged social structures that engender inequality are am-plified when the issue of social justice is not ad-dressed. Inequitable access to basic services, in-cluding supermarkets, parks, and transportation can reinforce health disparities. Poor health con-ditions tend to be seen at high levels in poor, mi-nority clustered communities in which service environments are of poor quality. The conditions present in these areas tend to expose popula-tions to dangerous conditions, sedentary life-styles, and lack of opportunity which all contrib-ute to poor health (Robert Wood Johnson Foun-dation Commission to Build a Healthier America, 2008).
Basic Needs
Diversifying mobility options is critical in planning for healthy communities. Providing alternative modes of transportation can have a positive im-pact on those living in poverty, as well as chil-dren, individuals living with disabilities, and the elderly (Centers for Disease Control and Preven-tion, 2011). Additionally, the transportation op-tions available in less dense suburban areas do not accommodate systems such as light rail, met-ro systems, or even consistent bus services (Eit-ler, McMahon, & Thoerig, 2013).
Various transit options are needed to provide access to basic needs and services for residents with physical, economic, and social limitations (Centers for Disease Control and Prevention, 2011). Increasing modes of travel for vulnerable
S O C I A L J U S T I C E & E Q U I T Y
Casselberry Healthy Community Plan >> Page 10
populations will increase the opportunity to make healthy life decisions (Eitler, McMahon, & Thoerig, 2013).
Residential Equity Concepts
Improving social equity within a residential setting can be achieved through zoning that enhances social connectivity. This tool allows planners to expand access to affordable housing, economic opportunity, as well as other human services such as quality schools. Enforcing the power of fair housing laws and equitably locating vulnerable populations assists with improved healthy com-munity design (Robert Wood Johnson Founda-tion Commission to Build a Healthier America, 2008).
Equitable access to basic needs and resources is often presented as spatial justice. The spatial jus-tice movement within planning seeks to provide access to all residents of a community, ensuring ample opportunities to connect with all of the
benefits of an urban life. This includes livelihood access, recreational facility access, human ser-vices, as well as cultural and educational opportu-nities. Spatial justice is best viewed through the idea of planning for people as opposed to cars (Smit, et al., 2011).
A final term related to access within a healthy community design is that of Universal Design. Universal design seeks to provide and ensure ac-cess to all populations regardless of background or ability. This is especially key when looking to serve vulnerable populations with disabilities and the growing older population. These populations have significant market impacts, which planners and designers can address through Universal De-sign. Universal Design seeks to provide a livable environment in which residents are able to age in place. A truly healthy designed community is one where an individual is able to grow and age with-out experiencing any loss of quality of life (Eitler, McMahon, & Thoerig, 2013.)
Social Justice and Equity Indicators
Access can be a difficult healthy community di-mension to identify clear indicators for analysis. However, research does offer some guidance to observe and measure the level of social vibrancy as a health indicator. For example, the State of California’s Health Department provides a de-scription of indicators that can be used to evalu-ate the impacts of access on social capital (Table 5, State of California, 2015).
Table 5. Social Justice & Equity Indicators
ACCESS
• Distance to Transit Options • Distance to High Quality Food Options • Residential Segregation • Distance to Services including Healthcare,
Schools, Library, Post Office, and Leisure Activities
Casselberry Healthy Community Plan >> Page 11
A central element for incorporating the societal aspect of a community into planning is social capi-tal. Social capital is presented as the intangible assets existing among human interactions such as goodwill, fellowship, sympathy, and social inter-course. Social capital exists at various levels of public interaction beginning with individual inter-actions and integrating into larger organizational structures. There are many forms of generating social capital including small activities and large scale events. All of these factors are key to un-derstanding the concept of social capital and im-portant for planners to recognize when improv-ing effectiveness of governmental and institutional efforts within the community (Putnam, 2001).
Urban and regional planning policies shape the built environment and also impact the level of social interaction within a community. Targeted practices initiated and supported by planning enti-ties directly assist with resident interaction and
have been shown to provide positive effects on social capital. Encouraging greater citizen partici-pation at all levels (individual, groups, etc.) has also shown to improve higher levels of trust with government institutions (Putnam, 2001).
Social Capital Indicators
Social capital can be a difficult dimension to iden-tify clear indicators for analysis. However, re-search does offer some elements to observe and measure in order to determine the level of social vibrancy existing within a community.
For assessing social capital, research indicates observation of the level of mixed land use as well as walkable communities has a tendency to in-crease social capital (Leyden 2003; Lund 2002). In comparison, social dispersion caused by long ‘everyday’ commutes resulting from suburban sprawl may have a negative effect on social capital due to decreased time for socialization, recrea-tion, and community involvement.
Table 6. Social Capital Indicators
GROUP CHARACTERISTICS
• Number of Membership • Rate of Donation • Frequency of Participation
• Participation in Decision Making • Membership Homogeneity • Source of Group Funding
GENERALIZED NORMS
• Helpfulness of People • Trustworthiness of People • Fairness of People • How Well People Get Along • Togetherness
EVERYDAY SOCIABILITY
• Everyday Sociability NEIGHBORHOOD CONNECTIONS
• Asking Neighbor to Care for Sick Child • Asking for Help When Sick • Volunteer Service • Expectations of Volunteering • Criticism for Not Volunteering • Fair Contribution to Neighborhood • Experiencing Helping Someone TRUST
• Farmers’ Markets Accept WIC and SNAP • Trust of Family • Trust of People in Neighborhood • Trust of Business Owners • Trust of Judges/Courts/Police • Trust of Government Service Providers • Trust of Local Government
S O C I A L C A P I T A L
Casselberry Healthy Community Plan >> Page 12
Human behavior is heavily influenced by the built environment and the related characteristics, which are embedded in the supporting infrastruc-ture. Therefore, the level of physical activity in a community is strongly connected to such infra-structure as recreational facilities, trails, bicycle and pedestrian support, green space, and more. For these reasons, physical activity is a crucial element for healthy community planning.
Technological innovations such as automation, the decline of physically active occupations, vari-ous labor reducing tools in the home, and an auto centric paradigm have significantly reduced the amount of physical activity most people exhibit in their daily life. In addition, the decentralization of central city employment centers to low density suburban locations has increased travel distances by car and have led to a significant reduction of physical activity in everyday life (Transportation Research Board, 2005).
Understanding the correlation between planning, physical activity and health has emerged as an important line of inquiry in planning practice and has led communities to evaluate how their ameni-ties such as parks and trails facilitate walking and
how land use patterns inhibit physical activity. Specific built environment attributes such as street connectivity, residential density and land use mix, including access and availability to places like local shops, green spaces, and transit stations, have been consistently associated with walking for recreation and transportation (Koohsari, et al. 2013)
Very specific criteria are now commonly applied by cities to evaluate inhibitors to physical activity, such as sidewalk connectivity, quality, and safety (Southworth 2005; Adams et al. 205). Some re-search suggests that regardless of how walkable the neighborhood appears, few “eyes on the street” create a perception of unsafe walking conditions and less pedestrian activity. This con-sequently leads to higher Body Mass Index (BMI),
particularly among females. The effect of pedes-trian networks on BMI is compounded further when considering the characteristics of the hous-ing stock. For example, residents of housing built prior to the establishment of Euclidian Zoning are shown to have significantly lower risk of obesity problems, suggesting that older housing is gener-ally in dense walkable neighborhoods that sup-port physical activity (Brown et al. 2009). People living in dense residential areas with many desti-nations and connected streets have much higher rates of physical activity, much of which is at-tributed to utilitarian walking. In other words, walkable neighborhoods with a variety of transit options and a myriad of destinations increase health (Glaizer et al. 2014).
The conclusion of Frank and colleague’s (2006, pg. 76) study of physical activity and the built en-vironment summarizes the general findings of research on this subject quite succinctly: “1. If the built environment reduces opportunity for active transportation, this may reduce total physi-cal activity, and potentially increase risk for chronic disease. 2. If the built environment stimu-lates increased time spent in vehicles, it may re-duce physical activity, and both of these may con-tribute to obesity, potentially increasing risk for chronic disease. 3. If the built environment stimu-
P H Y S I C A L A C T I V I T Y

Casselberry Healthy Community Plan >> Page 13
lates increased vehicular travel, this may increase per capita vehicle emissions, and these may in-crease exposure to pollutants and risk of respira-tory and cardiovascular ailments.” Creating neighborhoods with physical characteristics that are conducive to walking and non-motorized transport increase the frequency of utilitarian trips can raise physical activity and ultimately im-prove health (Transportation Research Board, 2005).
It is clear that collaboration between urban de-sign, policy, and public health is necessary to facil-itate and encourage physical activity within any community. The field of planning and urban de-sign can contribute to the built environment while public health can provide us with an under-standing of the impacts of the built environment on health as well as data that can be used to es-tablish a nexus between health, planning, and physical activity (Koohsari, Badland, & Giles-Corti, 2013).
Physical Activity Indicators
Interventions and policies that modify the built environment are critical to making changes to the physical activity patterns of a municipal popula-tion. These recommendations have the ability to reach large segments of the populace but must be backed by research and data. The most common methods for collecting data on physical activity in a community is through direct observation, self-reporting, and surveys (U.S. Department of Health and Human Services, 2008). However, data collected by examining indicators of physical activity will leave gaps in evidence that must be filled with research and best practices that are concerned with increasing physical activity. These indicators will allow planners to conduct an as-sessment of the physical activity needs of the community. This will inform planners of any populations that are physically active or, con-versely, at risk for physical inactivity.
The table 7 below identifies a variety of physical activity indicators and measurements. It was compiled from a variety of sources to provide a
clear understanding of the levels of physical activi-ty in Casselberry. Each of the indicators have been selected because of the availability of data, or a method of direct observation collection that is feasible within the timeframe of The Casselber-ry Healthy Community Studio project.
Table 7. Physical Activity Indicators
WALKABILITY
• Walk Score
PARK USE
• SOPARC
ACCESS TO TRAILS & GREEN SPACE
• Ready Access to Parks & Trails for Exercise
• Sidewalks and Mixed Use Neighborhoods
WORK TRANSPORTATION
• Transit Use
TRANSPORTATION INJURY
• Number of Pedestrians and Cyclist Inju-ries / Collisions
BEFORE / AFTER SCHOOL ACTIVITY
• School Policies for Safe, Supervised, Daily Active Play
• School Supported/Resourced Extracurric-ular Activities
• Available School Facilities after Hours, Cost Free
STREET CYCLING PATHS / LANES
• Traffic Count Related to Hierarchy of Roads

Casselberry Healthy Community Plan >> Page 14
Members of the community are influenced by their perception of how likely injury can occur from navigating the built environment. If a person believes the streets and sidewalks of a neighbor-hood are not reasonably safe for navigating, whether it is walking, cycling, or by other means, then this perception will lead to sedentary choic-es. Street systems are major contributors to un-safe environments and poor pedestrian infra-structure. Transportation and pedestrian injury are intimately connected to the built environment and planning processes are critical to designing safe navigation networks (Stoker, et al., 2015).
Trends in urban planning include mixed use de-velopment and increased residential density. While these elements have proven beneficial to various dimensions of healthy community plan-ning, when it comes to safety there are some im-pacts to note. Particularly associated with in-creased density, the resulting increase of vehicle-to-pedestrian accidents is an important factor to consider. A way to combat this potential hazard is to encourage a higher rate of pedestrians and cyclists using the streets. Drivers have been shown to become more aware of street users when there is heavy pedestrian traffic (Stoker, et al., 2015). This is particularly important in rural communities that encourage faster speeds, less visibility, and other characteristics that can in-crease risks for injury (Stoker, et al., 2015).
In general, pedestrian safety is impacted by three dimensions of vehicular traffic including visibility, volume, and speed. Visibility is associated with the type of pedestrian infrastructure in place on roadways including lights, crosswalks, and other features, which provide clear viewing of residents moving around. Traffic volumes are impacted by urban design, which is related to the surrounding built environment. Speed is also impacted by signage as well as roadway features that aim to
calm or encourage vehicular speed. The above elements can increase the risks to pedestrians and bicyclists (Stoker, et al., 2015).
In addressing these safety concerns, urban plan-ners must seek tools that decrease pedestrian contact with the dangers of vehicular traffic. This involves separating cars from pedestrians, imped-ing the volume of traffic within roadways, and implementing complete street policies. Solutions include incorporating elements such as wide sidewalks, clearly marked crosswalks, over or under walk ways. Another solution includes also providing easy access to mass transit options. Additionally, proper implementation of speed management techniques has proven to be one of
C O M M U N I T Y S A F E T Y

Casselberry Healthy Community Plan >> Page 15
the most effective tools to reduce injury risk to pedestrians. This includes special treatments to roadways, which provide perceptual influences to calm traffic. These elements have been demon-strated in various studies to successfully reduce pedestrian hazards by way of providing places of refuge, clear crosswalks, raised road bumps and also narrowing of roads.
Safety Indicators
In approaching ways to determine how safe a place is with regard to crime, there are broad community aspects that have been analyzed such as poverty, homelessness, and level of crime. These elements can provide a picture of contrib-uting factors connected to crime (Cozens P. M., 2011). Additionally, crime can be further broken down into subcategories such as rates of proper-ty arson, burglary, larceny, theft and auto related crime and also violent crime including assault, murder, rape, and robbery (Williams, Galster, & Verma, 2013).
Indicators that connect the built environment to safety include population density as well as the distance to the nearest police station. These indi-cators have been shown to be key predictors of residential crime density, more so than compared with income levels or wealth (Sohn, 2015). After reviewing how safety is related to the built envi-ronment, mainly through the dimensions of crime and pedestrian/vehicle injury, this information provides a good foundation for approaching how to analyze a potential healthy community. There
are several areas that can be analyzed to demon-strate key indicators of safety. Of those reviewed, potential options are the following:
Table 8. Community Safety Indicators
SAFETY FROM CRIME
• Percentage of Crime • Grid Street Layouts and Residential Den-
sity • Vegetation including trees, shrubs, and
groundcovers; presence and maintained height
• The condition of structures (broken win-dows, poor building upkeep, garbage, de-bris, etc.)
• The local rates of Foreclosures / Poverty / Homelessness
• Amount of Social Capital (presence of neighborhood watch groups and other community organizations, eyes on the street, etc.)
SAFETY FROM STREET INJURY
• The rate of Pedestrian Injury and/or Fatal-ities
• The rate of Traffic Injuries and/or Fatali-ties
• The presence of Pedestrian Infrastructure: Including Crosswalks, Sidewalks, Center Island Refuges, Speed Reduction Design Elements, etc.
Casselberry Healthy Community Plan >> Page 16
The built environment exerts tremendous influ-ence over mental health and wellbeing. Research demonstrates that the physical makeup of the built environment contributes significantly to fos-tering good mental health outcomes.
According to Reeves et al. (2011), approximately one in four adults in the United States have a mental health disorder, with the most common being depression and anxiety. One in seventeen of those adults have a serious mental illness such as a psychotic, bipolar, or major depressive dis-order (Goldman & Grob, 2006). Additionally, Reeves et al. (2011) found that one in five chil-dren in the United States have a mental health disorder, with the most prevalent being atten-tion-deficit/ hyperactivity disorder (ADHD). Men-tal health issues are tied to poor physical health outcomes and economic woes, and studies indi-cate that they may be just as disabling to everyday life as chronic physical conditions (Campo, Salm-on, & Burke, 2008).
Given the pervasiveness and severity of mental health disorders, it follows that there would be ample opportunities for planners to explore strategies that promote better mental health out-comes and foster greater happiness within com-
munities. Although promoting physical health has been a key focus area within the profession in recent years, improving mental health outcomes through planning interventions is a topic with many research gaps that have yet to be filled (Pfeiffer & Cloutier, 2016).
The quality and composure of the built environ-ment can impact mental and emotional health profoundly. A study by Evans (2003) posited that the environment influences mental health both directly and indirectly. Direct effects include housing, noise, crowding, indoor air quality, and light. Indirect effects include the negative health consequences of diminished social support, re-duction in personal environmental control, and increased cognitive fatigue & stress (Evans, 2003).
According to Pfeiffer & Cloutier (2016), planners
can promote emotional wellbeing within commu-nities by focusing on three aspects of the built environment: access to natural green space; de-sign that promotes social interaction; and strate-gies that foster personal safety. The authors posit that other elements such as housing diversity and conditions, transportation infrastructure, and pol-lution may also contribute to happiness, although the strength of the links is less conclusive.
Green Space & Nature
Green, natural spaces provide the strongest link between the physical environment and positive mental health outcomes. Studies have shown that persons living in areas devoid of green spaces have a higher risk of morbidity and mortality, even when accounting for other external factors such as race and socioeconomic status (Kuo, 2015). Habitual exposure to natural environ-ments has been shown to be effective in combat-ing stress and attention disorders while support-ing elements that promote mental health such as increased physical activity and social cohesion (Groenewegen, 2006).
Green spaces can take a number of forms and exist at a wide range of scales. Regional nature preserves, botanical gardens, local parks, back-
M E N T A L H E A L T H
Casselberry Healthy Community Plan >> Page 17
yards, and vegetated rights-of-way all provide some level of restorative benefits associated with engaging with the natural environment (Campbell & Wiesen, 2010). Also, studies have shown that how ecologically diverse the environment is may have an impact on the level of mental health ben-efits provided (Ruokolainen, 2015).
Social Ties Promotion
There is an apparent link between social ties and mental wellbeing. Smaller social networks, a lack of close personal relationships, and a lower level of social support have all been found to contrib-ute to symptoms of anxiety and depression (Ka-wachi and Berkman, 2001). Social ties may affect an individual’s mental health in a number of ways including influencing one’s perspective on norma-tive health behaviors; increasing social control; providing behavioral guidance, purpose, and meaning; helping to foster self-esteem and feel-ings of self-worth; helping to nurture a sense of control or mastery; increasing feelings of belong-ing and companionship; and increasing the per-ception of social support (Thoits, 2011).
The physical characteristics of a neighborhood that promote social capital include housing design and density, street connectivity and walkability, land use mix, and the availability of shared public spaces (Pfeiffer & Cloutier, 2016). High density environments can cause negative mental health effects due to increased psychological stress from overcrowding. Those in high-density housing are also exposed to higher levels of traffic noise, which are linked to less frequent outdoor play,
weakened social ties, and greater psychological distress in children (Lercher et al., 2002). Circa-dian rhythms may be interrupted by greater levels of light pollution in dense environments, leading to sleep disorders that impact mental well-being (Chepesiuk, 2009). Conversely, low density envi-ronments may not provide opportunities for in-teractions occurring en-route to destinations.
Personal Security Promotion
The presence of crime within one’s community can have myriad negative impacts on mental health and wellbeing. The presence of crime may be a source of anxiety and fear, causing members of the community to exist largely behind locked doors. This avoidance behavior precludes many activities that have been shown to positively im-pact mental health outcomes such as social inter-action, physical activity, and engagement with green, natural spaces (Lorenc et al, 2012).
There are many physical interventions that can have positive impacts on crime reduction. Neigh-borhoods that have buildings with windows facing the street, front porches, and street activity have greater opportunities for natural surveillance, which may deter criminal activities (Wilson & Kelling, 1982). Conversely, neighborhoods that are vacant, dilapidated, poorly lit, or have large numbers of hiding places are associated with greater levels of crime (Pfeiffer & Cloutier, 2016).
Mental Health Indicators
Mental health within communities has been de-termined in many ways, although privacy con-
cerns make it challenging to collect accurate data. Surveys are often administered containing ques-tions related to mental health and/or life satisfac-tion, typically qualified as number of mentally un-healthy days (Pfeiffer & Cloutier, 2016). The fol-lowing are common mental health indicators de-rived from multiple sources. While most of these indicators focus on individual health and personal behavior data, there are few direct indicators of the built environment’s effect on mental health.
Table 9. Mental Health Indicators
SUICIDE
• Suicide & Attempted Suicide Rates
MENTAL HEALTH RESOURCES
• Number of Physiatrists / Beds Per Capita • In-Hospital Stay/Discharge Data • Use of Psychotrophic Medications
SELF-REPORTED SYMPTOMS
• Adults With Poor Mental Health Past 14 or More of The Past 30 Days
DEPRESSION
• Diagnosed with Depressive Disorder
CRIME
• Murder & Domestic Violence Rates • Child Abuse Cases
SUPPORT & LIFE SATISFACTION
• Survey
SUBSTANCE ABUSE
• Adults Engaging in Heavy/Binge Drinking • Alcohol Related Vehicle Injuries/Mortality • Drug-Related Mortality Rate

Casselberry Healthy Community Plan >> Page 18
One of the most influential dimensions of a healthy community is that of the environment and housing. These settings interact with residents daily and therefore have a strong impact over the health of the residents.
The Indoor Environment
Homes provide shelter, personal identity, and collectively form communities; poor housing conditions can threaten the safety and security of dwellings, compromising the health of occupants and neighbors.
Physical Health Risks
Substandard housing conditions, such as structur-ally damaged or poorly constructed roofs, walls, floors, and windows, can impact a home’s ability to retain warmth during cooler months and main-tain cooling during warmer months, and com-promise proper ventilation and allow for pest infestation. Escalated heat exposure during summer months may increase stress on human functions, the occurrence of heat-related illness-es, dehydration and respiratory system stress (Florida Department of Health, 2015). Poor ven-tilation, combined with damp and high humidity
conditions, exacerbate the growth of mold; mold exposure may result in allergic reactions, asthma, and other respiratory issues (US EPA, 2016). Housing conditions may also create environments that are more susceptible to pest infestations: pests, such as mites, cockroaches, and rodents carry pathogens, diseases, and allergens, and can contaminate food and water sources (Bonnefoy, 2007). The indoor environment may also be compromised in older homes (built before 1978) by lead-based paint. Lead is a highly toxic metal that bio accumulates in vital organs and may pre-sent symptoms of headaches, stomachaches, nau-sea, tiredness, and irritability (US HUD, 2016a).
Mental Health Risks
A recent European study found that survey re-spondents who identified damp and moldy dwell-ings were more likely to report depressive symp-toms (Shenassa, Daskalakis, Liebhaber, Braubach, & Brown, 2007). Of these respondents, vulnera-ble groups such as older individuals, women, and unemployed individuals were most likely to re-port depressive symptoms (Shenassa et al., 2007). A study of psychological consequences of pest infestation in the home indicated that female sur-vey respondents with cockroach, rat, and mice infestations in their homes were more likely to
report anxiety-like symptoms of dizziness, palms sweating, and headaches than non-infested homes (Zahner, Kasl, White, & Will, 1985). Common signs of pest infestation, such as the presence of dead cockroaches and rodent droppings, may diminish residents’ openness to home visits from friends and neighbors, increasing social isolation and reducing opportunities for salubrious social interaction (Dannenberg et al., 2011; Krieger & Higgins, 2002).
The Outdoor Environment
Neighborhoods provide a sense of community, safety, and create opportunities for healthful so-cial interaction. The absence or perceived ab-
E N V I R O N M E N T & H O U S I N G

Casselberry Healthy Community Plan >> Page 19
sence of safety and social cohesion can endanger a community’s well-being and social capital.
Physical Health Risks
Abandoned and vacant lots can quickly become littered and overgrown by weeds, increasing the risk of injury, trash buildup and the attraction of rodents (Garvin et al, 2012). Several studies have reported relationships between vacant land and an urban area’s gonorrhea rates, pre-mature mortality, diabetes, suicide, and physical injury risk (Garvin et al., 2012). Brownfields may also pose a health risk to nearby residents if improp-erly disposed hazardous materials persist in soils (Litt et al., 2002). There are also potential safety issues that arise in these large abandoned parcels. Extended periods of neglect may result in unsafe physical conditions (deteriorating pavement and buildings, vandalism, and hazardous waste from illegal drug-related activities) (US EPA, 2006). Nearly half of all brownfields in the United States have petroleum contamination; many of these sites are former gasoline stations with leaking underground storage tanks (LUST) (US EPA, 2015). LUSTs can contaminate soil and ground-water, negatively impacting both environmental and human health.
Mental Health Risks
Land use development patterns that result in low-density residential development often demon-strate a lack of connectivity between adjacent neighborhoods and are not located within walk-ing distance of schools, supermarkets, and em-
ployment, encouraging the continued reliance on vehicles and, in turn, reducing the likelihood of social interactions. A study examining the impact of neighborhood design on social capital demon-strated that residents in vehicle-dependent sub-urbs were less likely to be familiar with their neighbors, participate in the political process, trust or have faith in others, and be socially en-gaged than respondents in more walkable, mixed-use neighborhoods (Leyden, 2003).
Poor neighborhood quality (i.e. limited or no neighborhood maintenance and upkeep) can also impair and undermine a neighborhood’s sense of safety and security. The visual of deteriorating and neglected homes and public spaces can sug-gest indifference and disregard by community members. A study investigating the effects of neighborhood conditions on residents’ percep-tions of safety indicated that survey respondents perceived deteriorating neighborhoods condi-tions as a sign of declining social control and indi-cated increased concerns of safety and fear of crime (Austin, Furr, & Spine, 2002).
Environment & Housing Indicators
Researchers exploring the relationship between the built environment and health have utilized various methods and measures to determine health risks related to environment and housing factors. Methods employed include comprehen-sive reviews of previous studies, reviews of exist-ing health data, and cross-sectional studies and case studies that utilize in-person and mail-in in-
terviews. Measures for physical and mental health risks are provided below.
Table 10. Environment & Housing Indicators
PHYSICAL HEALTH
• Heat Exposure: Heat edema/heat cramps, heat exhaustion, classical heat stroke, ex-ertional heat stroke
• Mold Exposure: Cold or throat illness, wheezing, asthma attack, other respirato-ry problems, fatigue, and headache diag-nosed by physician within the last 12 months (binary); In-person interview
• Pest Infestation Exposure: Rats, mice, cockroaches, and other pests (presence or absence); in-person interview
• Lead Exposure: Home-Built before 1978; Children: Check blood lead levels
• Physical Hazards: Open foundations, compromised infrastructure or equipment (presence or absence)
• Drinking water and Soil quality tests MENTAL HEALTH
• Perception of control over one’s home: I feel in control of my home (5-point Likert scale); In-person interview
• Perception of safety: Need to lock doors, worry about break-ins, walk at night without fear, leave items without fear of stealing (Likert scale); Telephone survey
• Psychological Well-being: Agitated de-pression, phobic anxiety, somatization hostility (Likert scale); In-Person interview
• Social Capital: Know neighbors (scale of 1-4), Political participation (additive in-dex), Trust (scale of 1-3), and social en-gagement (additive index); Mail-in survey

Casselberry Healthy Community Plan >> Page 20
. Part Four .
CASSELBERRY DEMOGRAPHICS
Figure 3. Casselberry Census Tracts
The demographic analysis for the City of Casselberry focuses on population, age, gender, race, and housing. The population data is broken down into general population distribution as well as that of population growth through-out the selected census tracts. For age, what is displayed is selected census tracts that reveal data differing from the Seminole County and Florida trends; this is also the same for the distribution of gender. For race, this is presented for general distribution and also a highlight of the Latino/Hispanic ethnicity is displayed. Finally, for reviewing housing, this section looks at households, housing units, renter versus owner distribution, and concludes with a look at occupancy compared to vacancy.
Population
The population of the census tracts of Casselberry ranges from 2,000-6,800. The smallest is in CT220.01, with a population of 2,233. The largest popula-tion is in CT221.01, totaling 6,841. Figure 4 displays Casselberry’s population by census tract.
Figure 4. Casselberry Population; US Census, 2010
*Note: CTs with a large majority of area located outside City limits were not included in the tract-specific indicator research. Much of the data was not available at the Block level, so it was not known whether the information was indicative of the small areas located within the City, or more representative of areas outside the jurisdiction. The analysis would potentially be misleading, as it would be based on data that may or may not be specific to Casselberry.

Casselberry Healthy Community Plan >> Page 21
Growth
Population growth within the city appears inconsistent with the county as well as the state. Seminole County has a population growth rate of 13.53% and the state of Florida’s is 16.38%. The only census tract in Casselberry with similar growth is CT220.04, which shows growth of 11.34%. There are four census tracts with negative growth numbers, with the lowest being CT220.01 with -14.53%. This would suggest that population numbers are dwindling in these tracts, which does not coincide with the overall trend of the county and state.
Figure 5. Population Growth, % Change; US Census, 2010
Gender
The gender distribution throughout Casselberry is comparable to the county and state level. Seminole County is distributed with 51.6% female and 48.4% male, and Florida is 51.1% female and 48.9% male. This is comparable with most of the census tracts within the city, with the exception of CT220.04, which is 53% female.
Figure 6. Gender of CT 220.04, US Census, 2010
Age
In general, the State of Florida’s age distribution shows the largest population segment is the 20-44 bracket. This is followed by the 45-64 age range, then people under 20 years old, and ending with those individuals that are 65 or older. Seminole County’s population segments are similar to the State’s, with the only exception being the 65+ group.
Figure 7. Age Dist. Of Seminole County & Florida, US Census, 2010
Geography Under20Years
20-44Years
45-64Years
65+Years
SeminoleCounty 25.8% 34.2% 28% 12%
StateofFlorida 23.9% 31.7% 27% 17.4%
Casselberry Healthy Community Plan >> Page 22
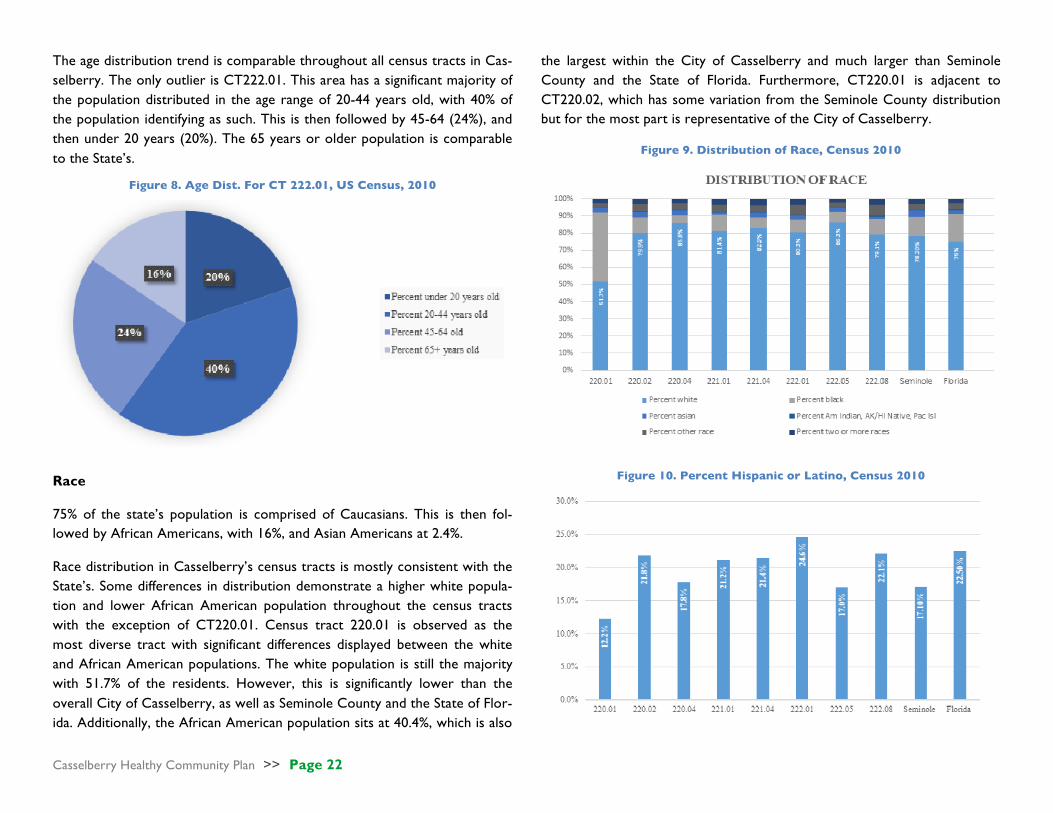
The age distribution trend is comparable throughout all census tracts in Cas-selberry. The only outlier is CT222.01. This area has a significant majority of the population distributed in the age range of 20-44 years old, with 40% of the population identifying as such. This is then followed by 45-64 (24%), and then under 20 years (20%). The 65 years or older population is comparable to the State’s.
Figure 8. Age Dist. For CT 222.01, US Census, 2010
Race
75% of the state’s population is comprised of Caucasians. This is then fol-lowed by African Americans, with 16%, and Asian Americans at 2.4%.
Race distribution in Casselberry’s census tracts is mostly consistent with the State’s. Some differences in distribution demonstrate a higher white popula-tion and lower African American population throughout the census tracts with the exception of CT220.01. Census tract 220.01 is observed as the most diverse tract with significant differences displayed between the white and African American populations. The white population is still the majority with 51.7% of the residents. However, this is significantly lower than the overall City of Casselberry, as well as Seminole County and the State of Flor-ida. Additionally, the African American population sits at 40.4%, which is also
the largest within the City of Casselberry and much larger than Seminole County and the State of Florida. Furthermore, CT220.01 is adjacent to CT220.02, which has some variation from the Seminole County distribution but for the most part is representative of the City of Casselberry.
Figure 9. Distribution of Race, Census 2010
Figure 10. Percent Hispanic or Latino, Census 2010

Casselberry Healthy Community Plan >> Page 23
Florida has a growing Hispanic/Latino population, which is currently 22.5%, while 17% of Seminole County residents identify as Hispanic/Latino. Looking at the City of Casselberry, this is much more in line with the trend of the State of Florida throughout the census tracts. There are five census tracts that demonstrate similar percentages to the State, with CT222.01 having a higher distribution at 24.6 %. The remaining three tracts have similar distri-bution with Seminole County; CT220.01 has the least with 12%. Households The household distribution within the City of Casselberry demonstrates some clear differences between census tracts. Census tracts 221.04, 221.01, and 222.01 contain the highest number of households, with 17% - 19% of total households in each. The remaining census tracts contain substantially fewer of the total households in each. Census tracts 222.08, 222.05, 220.04, and 220.02 all contain between 8-12% each. CT220.01 contains the lowest number of total, with just 6%. These percentages are consistent with that of the number of housing units as well.
Figure 11. Total Households, Census 2010
The distribution of housing occupied units versus vacant units throughout the State of Florida is 82.5% occupied and 17.5% vacant. Seminole County has a much higher occupied rate, with 90.8% occupied and 9.2% vacant. The City of Casselberry is on par with Seminole County, with one outlier being CT222.01, which has an 85.7% occupancy rate and 14.3% vacancy rate. The distribution within this area is more comparable to the State of Florida.
Figure 12. Total Housing Units, Census 2010
The State of Florida exhibits a distribution, which is at 67.4% owner occupied units compared with 32.6% renter occupied units. This is comparable to Seminole County’s distribution of 66.5% owner-occupied units and 33.5% renter-occupied units.
The distribution within the City of Casselberry is varied throughout the cen-sus tracts. The highest rate of owner-occupied units is in CT221.04, with 84% and only 16.1% renter-occupied units. This is followed by CT222.05 with 75.3% owner-occupied units and 24.7% renter-occupied units. The low-est percentage of owner-occupied units is in CT222.01, with 46% and an in-creased rate of renter-occupied units of 53%.

Casselberry Healthy Community Plan >> Page 24
Figure 13. Housing Units; Census 2010
Summary of Findings In conclusion, the analysis of the demographic distribution for the City of Casselberry appears to showcase some apparent differences within the cen-sus tracts. These differences are strongest in the areas of race and housing. CT220.01 demonstrates the most diversity within the city. Additionally, when looking at housing, there appears to be a divide within the census tracts of those renting versus those owning housing units, with one census tract (221.04) retaining over 80% of owner-occupied units. Outside of these, the remaining demographics are consistent with Seminole County and the State of Florida.

Casselberry Healthy Community Plan >> Page 25
. Part Five .
COMMUNITY HEALTH INDICATORS
NATURAL ENVIRONMENTAL QUALITY
Water Quality
Community Water
The City of Casselberry provides drinking water to approximately 55,747 residents. From February 2012 – present the Environmental Protection Agency (EPA) notified the city of 10 drinking water contaminants violations. All violations were subsequently resolved to meet EPA requirements (EPA, 2016). Contaminants in the EPA’s National Primary Drinking Water Regula-tions (NPDWR) include: microorganisms; disinfectants; disinfection byprod-ucts; inorganic chemicals; organic chemicals; and radionuclides (US Environ-mental Protection Agency, 2016).
Natural Water
A study of the surface water quality of Casselberry’s lakes, completed in 2016 by Geosyntec, focused on 12 lakes within the city. The study included measurements of dissolved oxygen (DO), PH, and trophic state index. Seven lakes did not meet the standard DO of 5.0 mg/L, which is necessary to sup-port a healthy aquatic system. At different times during the study, five lakes had PH measures outside the recommended range of 6.0 - 8.5. Finally, two lakes were classified as eutrophic during the two-year study, while one was classified hypereutrophic in Spring 2015. While several lakes had measured water deficiencies, none are a significant threat and the Casselberry Lakes
meet the class III standard for recreational water bodies. Continued moni-toring will ensure identification of all significant water quality trends.
Figure 14. Casselberry Lake Quality, Geosyntec, 2016
LAKE CONCORD None
GRASSY LAKE DO < 5.0 mg/L; PH < 6.0
LAKE GRIFFIN DO < 5.0 mg/L
LAKE KATHRYN PH > 8.5
LOST LAKE DO < 5.0 mg/L
MIDDLE LAKE TRIPLET PH < 6.0; Classified Eutrophic
NORTH LAKE TRIPLET PH < 6.0
SOUTH LAKE TRIPLET DO , 5.0 mg/L; Classified Eutrophic
QUEEN’S MIRROR LAKE Classified Hypereutrophic Spring 2015
SECRET LAKE DO < 5.0 mg/L
TROUT LAKE DO < 5.0 mg/L
LAKE YVONNE DO < 5.0 mg/L; PH < 6.0
Casselberry Healthy Community Plan >> Page 26
Summary of Findings
Although several lakes registered various water quality deficiencies, the indi-cators suggest that it is unlikely that these deficiencies pose a significant
threat to the health of the Casselberry community. Continued monitoring of natural environmental quality indicators, including both water and air quality indicators, is necessary to ensure new risks don’t threaten to compromise community health outcomes.
BUILT ENVIRONMENTAL QUALITY Walkability
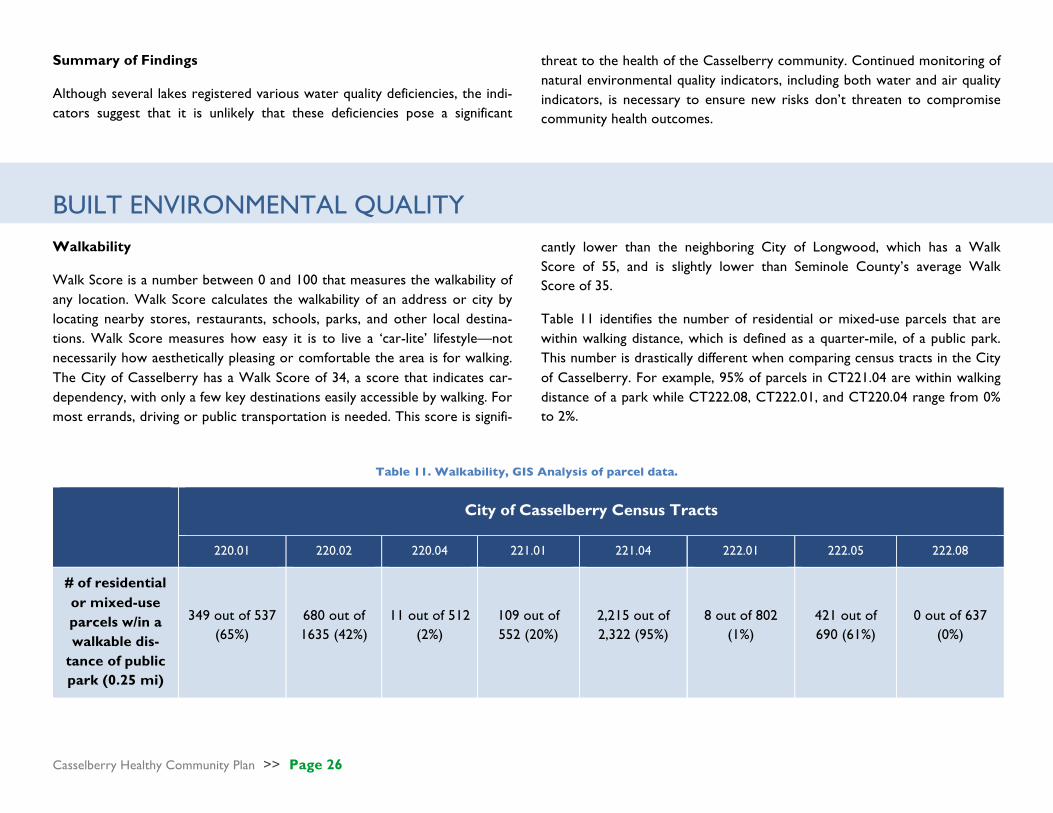
Walk Score is a number between 0 and 100 that measures the walkability of any location. Walk Score calculates the walkability of an address or city by locating nearby stores, restaurants, schools, parks, and other local destina-tions. Walk Score measures how easy it is to live a ‘car-lite’ lifestyle—not necessarily how aesthetically pleasing or comfortable the area is for walking. The City of Casselberry has a Walk Score of 34, a score that indicates car-dependency, with only a few key destinations easily accessible by walking. For most errands, driving or public transportation is needed. This score is signifi-
cantly lower than the neighboring City of Longwood, which has a Walk Score of 55, and is slightly lower than Seminole County’s average Walk Score of 35.
Table 11 identifies the number of residential or mixed-use parcels that are within walking distance, which is defined as a quarter-mile, of a public park. This number is drastically different when comparing census tracts in the City of Casselberry. For example, 95% of parcels in CT221.04 are within walking distance of a park while CT222.08, CT222.01, and CT220.04 range from 0% to 2%.
Table 11. Walkability, GIS Analysis of parcel data.
City of Casselberry Census Tracts
220.01 220.02 220.04 221.01 221.04 222.01 222.05 222.08
# of residential or mixed-use parcels w/in a walkable dis-
tance of public park (0.25 mi)
349 out of 537 (65%)
680 out of 1635 (42%)
11 out of 512 (2%)
109 out of 552 (20%)
2,215 out of 2,322 (95%)
8 out of 802 (1%)
421 out of 690 (61%)
0 out of 637 (0%)

Casselberry Healthy Community Plan >> Page 27
Figure 15 illustrates a lack of walkability in relation to parks and trails in much of Casselberry. There are significant portions of the city that lack walkable access to the parks and trails system. This problem is particularly pronounced in CT222.01, CT222.08, and CT222.05.
Figure 15. Walkability to Parks & Trails
Figure 16. Brownfield Sites
Land Use
Figure 16 shows the locations of EPA brownfield sites in the City of Cassel-berry. There are 16 EPA-sponsored brownfield sites in Casselberry compris-ing 185 acres that are currently undergoing or that have completed assess-ment and/or remediation. The largest concentration of brownfield sites is located just off Highway 17/92 (CT 220.01 and 220.02). However, the total acreage of brownfields with the City of Casselberry is presently unknown.
Casselberry Healthy Community Plan >> Page 28
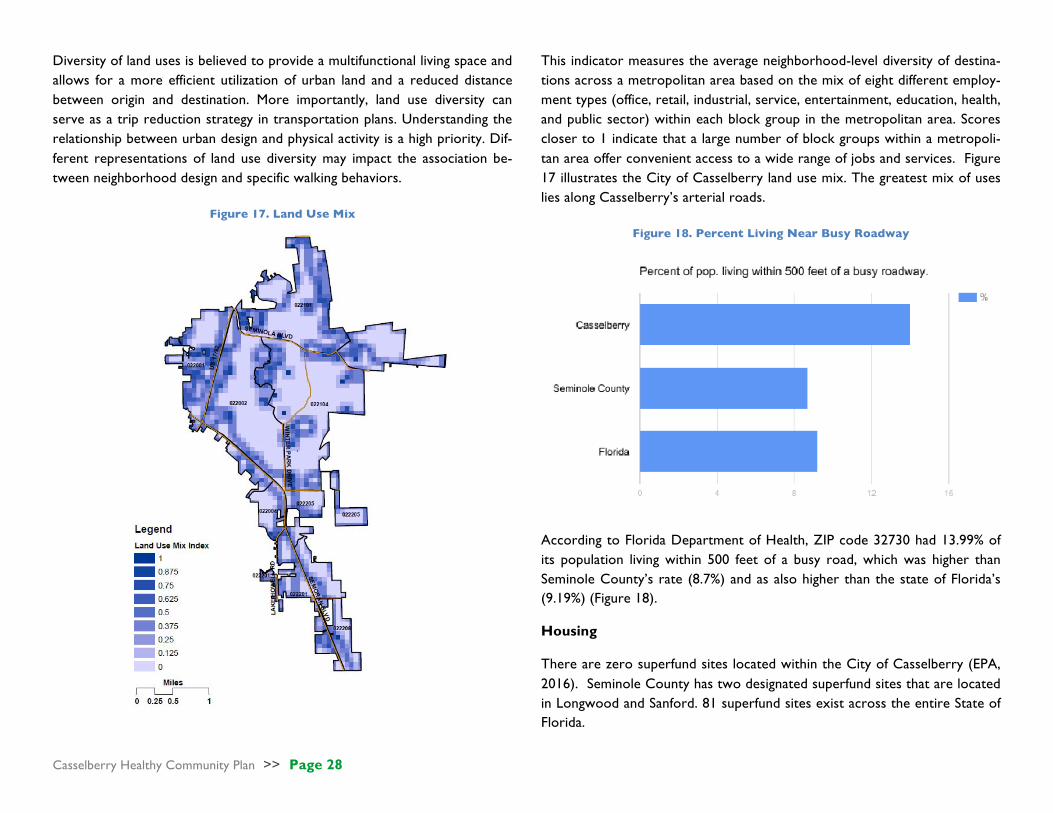
Diversity of land uses is believed to provide a multifunctional living space and allows for a more efficient utilization of urban land and a reduced distance between origin and destination. More importantly, land use diversity can serve as a trip reduction strategy in transportation plans. Understanding the relationship between urban design and physical activity is a high priority. Dif-ferent representations of land use diversity may impact the association be-tween neighborhood design and specific walking behaviors.
Figure 17. Land Use Mix
This indicator measures the average neighborhood-level diversity of destina-tions across a metropolitan area based on the mix of eight different employ-ment types (office, retail, industrial, service, entertainment, education, health, and public sector) within each block group in the metropolitan area. Scores closer to 1 indicate that a large number of block groups within a metropoli-tan area offer convenient access to a wide range of jobs and services. Figure 17 illustrates the City of Casselberry land use mix. The greatest mix of uses lies along Casselberry’s arterial roads.
Figure 18. Percent Living Near Busy Roadway
According to Florida Department of Health, ZIP code 32730 had 13.99% of its population living within 500 feet of a busy road, which was higher than Seminole County’s rate (8.7%) and as also higher than the state of Florida’s (9.19%) (Figure 18).
Housing
There are zero superfund sites located within the City of Casselberry (EPA, 2016). Seminole County has two designated superfund sites that are located in Longwood and Sanford. 81 superfund sites exist across the entire State of Florida.

Casselberry Healthy Community Plan >> Page 29
The percentage of occupied housing units built prior to 1980 was higher across all of the census tracts in Casselberry than in Seminole County and the State of Florida (Figure 19), which suggests that the housing stock in the City is aging and there may be some concern about the presence of lead paint affecting health outcomes, especially the health outcomes of children. Among Casselberry’s eight census tracts, CT221.04 retains the highest per-centage of occupied housing units built prior to 1980 (69.50%), whereas CT222.05 has the lowest percentage of occupied housing units built prior to 1980 (43.4%).
Figure 19. Percentage of Occupied Housing Units Built before 1980, ACS,
2015
Food Access
Figure 20 displays the Retail Food Environment Index (RFEI) score for seven census tracts in Casselberry and the state of Florida as a whole. It should be noted that the RFEI score was not available for CT222.08 or Seminole Coun-ty. Five of the seven census tracts with reported values had RFEI scores that
were higher than the State of Florida (10). CT220.04 had the highest Retail Food Environment Index score (21), whereas CT220.01 and CT221.04 had the lowest (9).
Figure 20. Retail Food Environment Scores, CDC, 2011
There are no grocery stores located within CT220.01, CT221.01, CT221.04, CT220.04, or CT222.05. All of the grocery stores located in CT220.02, CT222.01, and CT222.08 have a bus stop within 0.1 miles of the store. Fig-ure 21 displays the location of bus stops and their proximity to grocery stores across the eight census tracts of Casselberry.
Despite the indication of limited access by bus to grocery stores within some census tracts, the indicators also suggest that there are no food deserts lo-cated within the eight census tracts of Casselberry (USDA, 2013). Three food deserts exist in Seminole County and there are 530 total food deserts throughout the State of Florida.

Casselberry Healthy Community Plan >> Page 30
Figure 21. Casselberry Bus Stops and Grocery Stores, NAICS
According to NAICS (2016), ZIP code 32707 has 0.16 bars per 1,000 people, which is higher than Seminole County’s rate (0.06) and higher than Florida (0.09) (Figure 22).
Figure 22. Number of Bars Per 1,000 People, NAICS, 2015
Summary of Findings
The built environmental quality indicators suggest that Casselberry is an au-tomobile-dependent City, although the level of this auto-dependency varies among the eight census tracts. Land use mix is directly related to the need of residents to utilize an automobile to reach daily destinations, and the data points to a significant lack of land use mix in certain areas of the City. Simi-larly, the availability of bus stops near local grocery stores varies by census tract, although there are no food deserts located in Casselberry as defined by the USDA’s standards. The housing stock as compared to both the County and State is aging, which indicates that housing conditions may be deteriorating in some areas of Casselberry and the presence of lead paint may pose a threat to local health outcomes, especially among children. The data also reveals that the City has a higher number of bars per capita than the County and the State, which may raise questions about the presence of substance abuse issues in the city.

Casselberry Healthy Community Plan >> Page 31
SOCIAL & ECONOMIC FACTORS
INCOME AND POVERTY
CT220.01 has the highest percentage of persons with incomes below the poverty level across all Casselberry census tracts (25.2%) (Figure 23). This percentage is well above the average percentages found in Seminole County (8.1%) and Florida (12.2%). Of the eight census tracts examined, five exhibit greater percentages of persons living below the poverty level than Seminole County (two for the state of Florida). Across all Casselberry census tracts, CT222.05 has the lowest percentage of persons living below the poverty line (3.8%). This is well below county and state averages.
The median household income across all eight Casselberry census tracts ranges between $31,670 (CT220.01) and $66,007 (CT222.05) (Table 12). The median household income in CT220.01, the census tract with the lowest median household income across the City of Casselberry, is approximately
83% lower than Seminole County’s ($57,875) median household income and approximately 33% lower than the state’s ($42,212) median household in-come.
Figure 23. Percentage of families and people whose income in the past 12 months is below the poverty level; ACS, 2014
Table 12. Median Household Income; ACS, 2014.
City of Casselberry Census Tracts Seminole County Florida
220.01 220.02 220.04 221.01 221.04 222.01 222.05 222.08
Median Household
Income
$32,571 $41,127 $52,667 $31,670 $50,982 $40,792 $66,007 $35,571 $57,875 $42,212

Casselberry Healthy Community Plan >> Page 32
The percentage of occupied housing units in which monthly housing costs exceed 30% of household income ranges between 33.8% (CT220.04) and 55% (CT221.01) across Casselberry census tracts (Figure 24). Of the eight census tracts examined, five have percentages that exceed both Seminole County (37.5%) and Florida (38.7%) percentages.
Figure 24. Percentage of occupied housing units in which monthly housing costs are more than 30% of household income; ACS, 2014.
FOOD AFFORDABILITY
70% of students at Casselberry elementary schools meet the eligibility crite-ria for free or reduced price meals (Table 13). 54% of students at Sterling Elementary are eligible for free or reduced price meals.
The percentage of total households with public assistance income or food stamps/SNAP ranges between 3.23% (CT222.05) and 24.68% (CT221.01) across Casselberry census tracts (Figure 25). Of the eight census tracts ex-amined, five have percentages that exceed county (7.74%) percentages and two have percentages that exceed the state (14.10%) percentage.
Table 13. Florida Income Eligibility Guidelines: Free or Reduced Price Meals, 2016-2017; Seminole County PS Dining Services.
Figure 25. % Households - Assist, Food Stamps, SNAP; USDA, 2015
3.23% CT 222.05 6.26% CT 220.04 6.40% CT 221.04 9.49% CT 222.08 10.46% CT 222.01 12.15% CT 220.02 21.81% CT 220.01 24.68% CT 221.01 No Data

Casselberry Healthy Community Plan >> Page 33
Figure 26. % of Households w/No Vehicles; US Census, 2016.
CT220.01 has the highest percentage of households with no vehicles across all Casselberry census tracts (14.9%) (Figure 26). This percentage is double the percentages found in Seminole County (5.1%) and Florida (7.4%). Of the eight census tracts examined, three exhibit greater percentages of house-holds with no vehicles than the county (one for the State). Across all Cas-selberry census tracts, CT220.02 and CT222.05 have the lowest percentage of households with no vehicle (1.7%), which is well below county and state averages.
Of the eight census tracts examined, only three census tracts are found to contain households considered food insecure (e.g., household is both low income and has low access to food, greater than one mile) (Table x). CT221.01 demonstrates the highest percentage of households considered food insecure (11.57%), exceeding the county-level (8.58%) percentage.
Table 14. Percent of Food Insecure Households; USDA, 2013.
City of Casselberry Census Tracts
Seminole County 220.01 220.02 220.04 221.01 221.04 222.01 222.05 222.08
Percent of Households
that are Food Insecure
0.00% 0.00% 0.00% 11.57% 8.56% 0.00% 1.21% 0.00% 8.58%
EDUCATION AND EMPLOYMENT
Across Casselberry census tracts, the percentage of the population 25 years and over with some post-secondary education ranges between 48.8% (CT221.01) and 79.4% (CT222.05) (Figure 27). Of the eight census tracts examined, seven have percentages lower than Seminole County percentage (68.9%) and two have percentages lower than the State percentage (57.4%).
CT220.02 demonstrates the highest unemployment rate across Casselberry census tracts (17.4%) (Figure 28). This rate is approximately 80% higher than the Seminole County rate (9.4%) and approximately 74% higher than the Florida rate (9.7%). Across all Casselberry census tracts, CT220.04 demon-strates the lowest unemployment rate (5.2%).

Casselberry Healthy Community Plan >> Page 34
Figure 27. Percentage of population 25 years and over with some post-secondary education; ACS, 2015.
Figure 28. Unemployment Rate, Age 16 and Over; ACS, 2015.
Table 15. Mean Travel Time to Work; ACS, 2015.
City of Casselberry Census Tracts Seminole County Florida
220.01 220.02 220.04 221.01 221.04 222.01 222.05 222.08
Mean Travel Time to Work
(Min)
28.4 23.5 25.4 25.1 25.2 25.5 31.8 27.1 26.9 26.4
Mean travel time to work across Casselberry census tracts ranges between 23.5 minutes (CT220.02) and 31.8 minutes (CT222.05) (Table 15). Mean travel time to work in CT222.05, which is the census tract with the highest
mean travel time to work across Casselberry, is approximately 18% higher than county-level (26.9 minutes) and approximately 20% higher than state-level (26.4 minutes) mean travel time to work.

Casselberry Healthy Community Plan >> Page 35
SOCIAL SUPPORT
There is only one social change advocacy organization (NAICS Code 813319) listed in Casselberry zip code 32707. There are 13 social advocacy organizations are listed in Seminole County and 603 organizations are listed in Florida.
CRIME
In 2012, the City of Casselberry’s aggravated assault rate per 100,000 people (383.1) was higher than the Florida rate (330.94) (Table 16). The City’s vio-lent crime rate per 100,000 people (595.6) was higher than the Florida rate (487.05). The city’s property crime rate per 100,000 people (4059.0) was higher than the State rate (3276.8). In 2016, the City’s aggravated assault rate, violent crime rate, and property crime rate was lower than it was in 2012.
Table 16. Crime Statistics; USDOJ, FBI, UCRS, 2012
City of Casselberry Florida
2012 2013 2014 2015 2016 2012 Aggravated assault rate (per 100,000
people)
383.1 362.2 359.6 387.5 370.7 330.94
Violent crime rate (per
100,000 people) 595.6 539.6 468.6 510.6 550.6 487.05
Property crime rate (per 100,000 people)
4059.0 4745.5 4003.3 4081.3 3840.1 3276.8
ACCESS TO HEALTH CARE
Across Casselberry census tracts, the percentage of the population without health insurance ranges between 7.6% (CT222.04) and 23.6% (CT221.01) (Figure 29). Of the eight census tracts examined, seven have percentages that exceed Seminole County (10%) percentages and three have percentages that exceed the Florida (19.6%) percentage.
Figure 29. % of Populations without Health Insurance; ACS, 2014
There are 17 physician offices (NAICS Code 6211) in the City of Casselber-ry, 436 in Seminole County and 19,303 in Florida (Table 17). There are no psychiatric and substance abuse hospitals (NAICS 6222) listed in the City of Casselberry and Seminole County. In comparison, there are 39 psychiatric and substance abuse hospitals in Florida.
Table 17. Health Facilities; US Census, 2016
City of Casselberry
Seminole County
State of Florida
# of physician offices 17 436 19,303
# of psychiatric & sub-stance abuse hospitals
0 0 39
CT222.08 demonstrates the highest percentage of all persons without a usu-al place of health care (e.g., a clinic, a doctor’s office, an emergency room, or some other health care place) across Casselberry census tracts (15.4%) (Fig-ure 30). This percentage is slightly higher than county (14.9%) and state (14.6%) percentages. Across all Casselberry census tracts, CT222.05 demonstrates the lowest percentage of all persons without a usual place of health care (14.4%), which is comparable to Seminole County and Florida percentages.

Casselberry Healthy Community Plan >> Page 36
Figure 30. % of Persons without a Usual Place of Healthcare; EASI Health Care, 2016.
SUMMARY OF FINDINGS
Of the eight census tracts examined, CT221.01 demonstrates the highest frequency of social & economic indicators that may be negatively impacting the health of its residents:
• Lowest Median Household Income • Highest percentage of occupied housing units where monthly hous-
ing costs exceeds 30% of household income • Highest percentage of total households with public assistance income
or food stamps/SNAP • Highest some percentage of households considered food insecure • Lowest percentage of the population 25 years and over with some
post-secondary education • Highest percentage of all persons without health insurance
Of the eight census tracts examined, CT222.05 demonstrates the highest frequency of social & economic indicators that may be encouraging a healthi-er lifestyle for its residents:
• Lowest percentage of persons with incomes below the poverty level • Highest Median Household Income • Lowest percentage of total households with public assistance income
or food stamps/SNAP • Lowest percentage of households with no vehicles • Highest percentage of the population 25 years and over with some
post-secondary education • Lowest percentage of all persons without a usual place of health care
HEALTH BEHAVIORS Individual behaviors such as smoking, alcohol abuse, physical inactivity, and innutritious diet can lead to poor health outcomes such as obesity, high blood pressure, and cancer. Behavioral patterns are responsible for more premature deaths than any other factor; more so than genetic predisposi-tion, health care, environmental exposure, and social circumstances
(Schroeder, 2007). Understanding the behavioral patterns that impact health outcomes is vital to attaining an overall health snapshot of Casselberry’s res-idents. Considering behaviors will also aid in strategizing the most effective changes to the City’s built environment that may result in more positive health behaviors and outcomes.
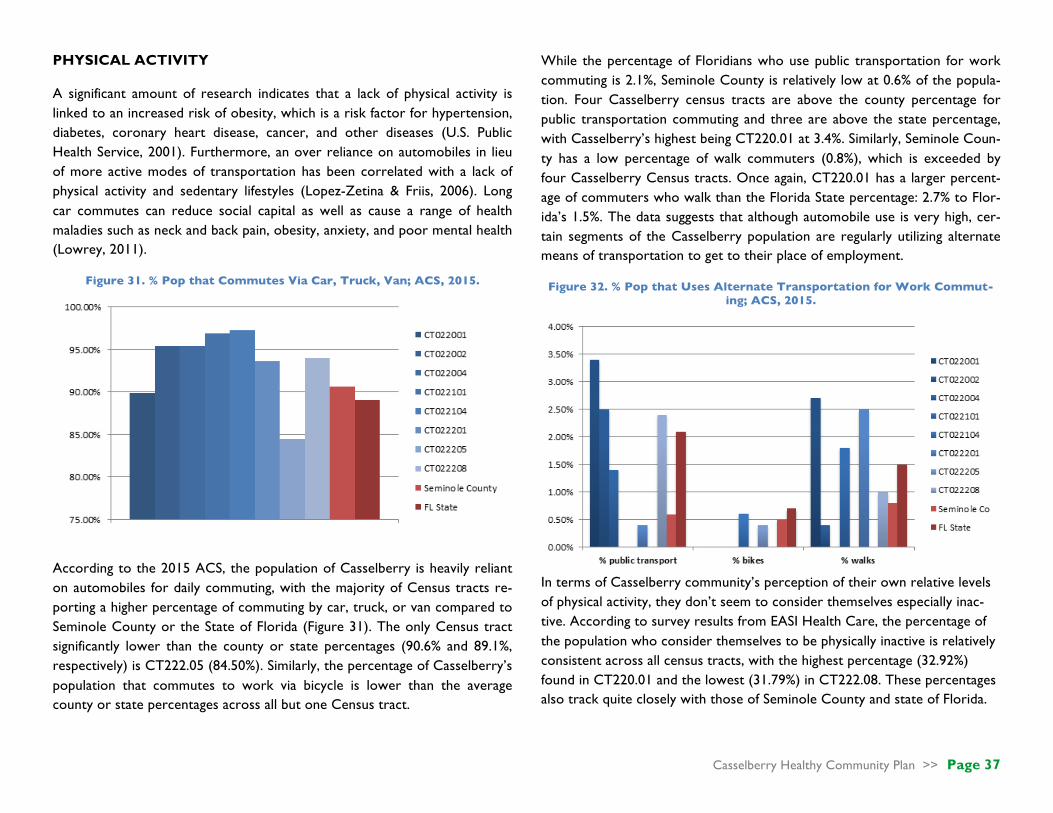
Casselberry Healthy Community Plan >> Page 37
PHYSICAL ACTIVITY
A significant amount of research indicates that a lack of physical activity is linked to an increased risk of obesity, which is a risk factor for hypertension, diabetes, coronary heart disease, cancer, and other diseases (U.S. Public Health Service, 2001). Furthermore, an over reliance on automobiles in lieu of more active modes of transportation has been correlated with a lack of physical activity and sedentary lifestyles (Lopez-Zetina & Friis, 2006). Long car commutes can reduce social capital as well as cause a range of health maladies such as neck and back pain, obesity, anxiety, and poor mental health (Lowrey, 2011).
Figure 31. % Pop that Commutes Via Car, Truck, Van; ACS, 2015.
According to the 2015 ACS, the population of Casselberry is heavily reliant on automobiles for daily commuting, with the majority of Census tracts re-porting a higher percentage of commuting by car, truck, or van compared to Seminole County or the State of Florida (Figure 31). The only Census tract significantly lower than the county or state percentages (90.6% and 89.1%, respectively) is CT222.05 (84.50%). Similarly, the percentage of Casselberry’s population that commutes to work via bicycle is lower than the average county or state percentages across all but one Census tract.
While the percentage of Floridians who use public transportation for work commuting is 2.1%, Seminole County is relatively low at 0.6% of the popula-tion. Four Casselberry census tracts are above the county percentage for public transportation commuting and three are above the state percentage, with Casselberry’s highest being CT220.01 at 3.4%. Similarly, Seminole Coun-ty has a low percentage of walk commuters (0.8%), which is exceeded by four Casselberry Census tracts. Once again, CT220.01 has a larger percent-age of commuters who walk than the Florida State percentage: 2.7% to Flor-ida’s 1.5%. The data suggests that although automobile use is very high, cer-tain segments of the Casselberry population are regularly utilizing alternate means of transportation to get to their place of employment.
Figure 32. % Pop that Uses Alternate Transportation for Work Commut-ing; ACS, 2015.
In terms of Casselberry community’s perception of their own relative levels of physical activity, they don’t seem to consider themselves especially inac-tive. According to survey results from EASI Health Care, the percentage of the population who consider themselves to be physically inactive is relatively consistent across all census tracts, with the highest percentage (32.92%) found in CT220.01 and the lowest (31.79%) in CT222.08. These percentages also track quite closely with those of Seminole County and state of Florida.

Casselberry Healthy Community Plan >> Page 38
Table 18. Physical Activity Personal Perceptions; Crime Statistics; EASI Health Care, 2016
City of Casselberry Census Tracts
Seminole County 220.01 220.02 220.04 221.01 221.04 222.01 222.05 222.08
%ofpopwhode-scribethemselvesphysicallyinactive
32.92% 32.17% 32.02% 32.18% 32.04% 32.03% 32.11% 31.79% 32.07%
NUTRITION
Poor and/or insufficient nutrition leads to a number of undesirable health outcomes associated with obesity and chronic diseases such as diabetes, can-cer, heart disease, and stroke (CDC, 2016). Maintaining a diet that incorpo-rates healthy food choices such as fresh fruits and vegetables is essential to sustaining a healthy weight and reducing the myriad health risks associated with obesity (ODPHP, 2015). Research also indicates that among families that eat meals together frequently, the children and adolescents have an overall better diet quality and a lower risk of obesity (Newman et al., 2015).
Figure 33. % Pop w/ No Time for Healthy Meal Prep & Pop Households That Use Fresh Produce, EASI Health Care, 2016
The percentage of Casselberry residents who report they do not have enough time to prepare and eat healthy meals varies throughout the City, with the highest percentage being in CT221.01 (31.51%) and the lowest in CT220.04 (21.10%). The county and state percentages are more or less in the middle of the two extremes at 27.83% and 27.39%, respectively. In terms of the percentage of households that use fresh produce, census tract CT220.04 has the highest percentage (93.71%), which, when considered with the healthy food preparation indicator, suggests that it may have the most nutritionally balanced meals in the city. There seems to be somewhat of a correlation between the two indicators; for instance, CT220.01 has the low-est percentage of fresh produce use (84.50%) and also a relatively high per-centage of the population who report little available healthy food preparation time (30.69%). The county and state percentages for use of fresh produce are 92.42% and 90.84%, respectively.
The percentage of children ages 12-17 who reportedly do not eat meals with their families most days of the week also varies significantly among the eight census tracts. The tract with the lowest percentage is CT220.01 (29.43%), which is significant considering this tract also had a relatively high percentage of people reporting they do not have time to prepare and eat healthy meals (30.69%). The census tract with the highest percentage adolescents who don’t eat meals with their families is CT222.08 (42.35%), which is higher than both Seminole County (40.46%) and the State of Florida (38.75%) averages.
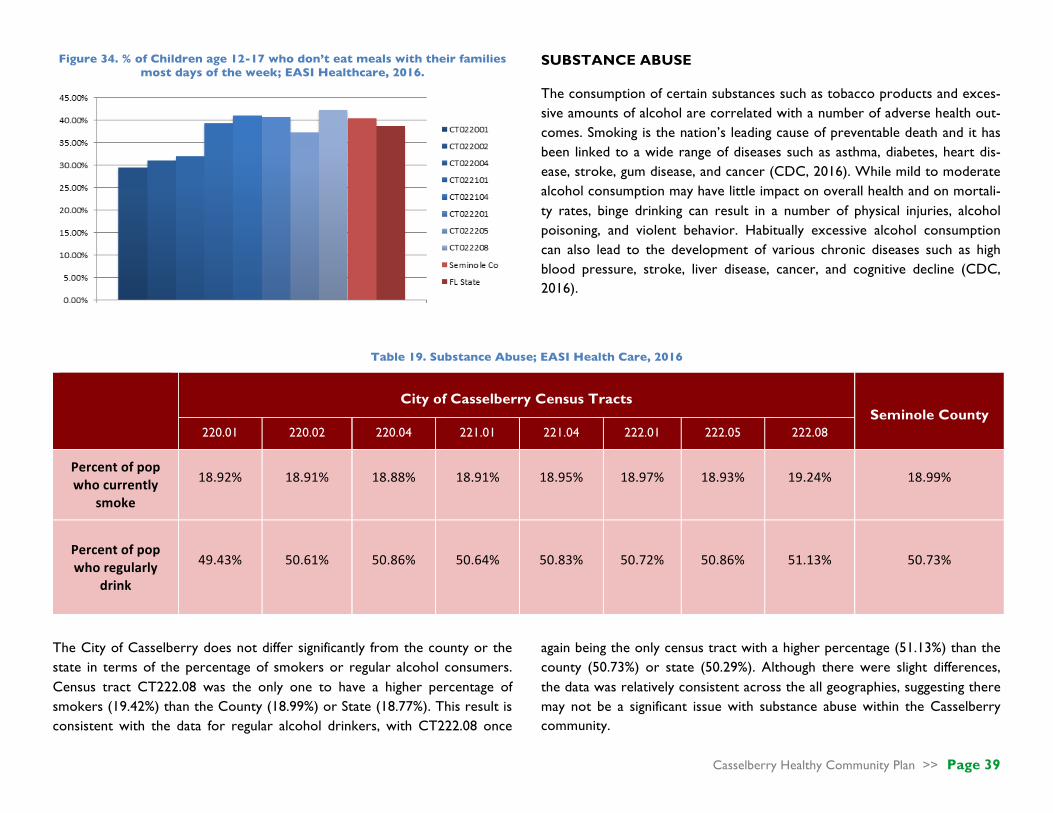
Casselberry Healthy Community Plan >> Page 39
Figure 34. % of Children age 12-17 who don’t eat meals with their families most days of the week; EASI Healthcare, 2016.
SUBSTANCE ABUSE
The consumption of certain substances such as tobacco products and exces-sive amounts of alcohol are correlated with a number of adverse health out-comes. Smoking is the nation’s leading cause of preventable death and it has been linked to a wide range of diseases such as asthma, diabetes, heart dis-ease, stroke, gum disease, and cancer (CDC, 2016). While mild to moderate alcohol consumption may have little impact on overall health and on mortali-ty rates, binge drinking can result in a number of physical injuries, alcohol poisoning, and violent behavior. Habitually excessive alcohol consumption can also lead to the development of various chronic diseases such as high blood pressure, stroke, liver disease, cancer, and cognitive decline (CDC, 2016).
Table 19. Substance Abuse; EASI Health Care, 2016
City of Casselberry Census Tracts
Seminole County 220.01 220.02 220.04 221.01 221.04 222.01 222.05 222.08
Percentofpopwhocurrently
smoke
18.92% 18.91% 18.88% 18.91% 18.95% 18.97% 18.93% 19.24% 18.99%
Percentofpopwhoregularly
drink
49.43% 50.61% 50.86% 50.64% 50.83% 50.72% 50.86% 51.13% 50.73%
The City of Casselberry does not differ significantly from the county or the state in terms of the percentage of smokers or regular alcohol consumers. Census tract CT222.08 was the only one to have a higher percentage of smokers (19.42%) than the County (18.99%) or State (18.77%). This result is consistent with the data for regular alcohol drinkers, with CT222.08 once
again being the only census tract with a higher percentage (51.13%) than the county (50.73%) or state (50.29%). Although there were slight differences, the data was relatively consistent across the all geographies, suggesting there may not be a significant issue with substance abuse within the Casselberry community.

Casselberry Healthy Community Plan >> Page 40
SUMMARY OF FINDINGS
Many of the census tracts within Casselberry share similarities in health be-haviors, particularly as they apply to residents’ overwhelming preference for using cars, trucks, and vans for work commuting. There are some noted dif-ferences by census tract in the number of residents who use alternate means of transportation to commute, but Casselberry nevertheless remains a large-
ly automobile-oriented city. Nutrition-wise, residents of CT220.01 report the lowest use of fresh produce, a low amount of available time to prepare healthy meals, and the lowest percentage of children who regularly eat meals with their families. This may indicate that nutrition issues could be of greater concern in this area. Although there may be more pertinent data available, the noted indicators don’t point to any notable substance abuse issues within Casselberry.
HEALTH OUTCOMES
GENERAL HEALTH
The percentage of population with disability status in Casselberry CT220.01 (14.01%) is nearly double the county (6.5%) and state (7.2%) rates. The percentage of population with disability status in CT221.01 (9%) is also higher than the county and state rates. In contrast, CT 220.04 and CT222.01 both have percentages of less than 3%, well below the county and state levels.
Figure 35. Percentage of Population with Disability Status
The range of adult obesity rates (27.83-29.13%) across Casselberry CTs is within 1% of county (28.16%) and state (28.25%) rates, with the highest rate (29.3), slightly above the state rate, being exhibited in CT220.01.
Figure 36. Adult Obesity Rates
MENTAL HEALTH
The percentage of people who reported feeling sadness all or most of the time is nearly identical (range between 3.28% and 3.41%) for all Casselberry CTs, Seminole County and the state of Florida. The percentage of people who reported feeling alone all or most of the time is nearly identical (2.27%-2.32%) for all Casselberry CTs and the state of Florida. These rates are approximately 1% less than the county (3.33%) rate.

Casselberry Healthy Community Plan >> Page 41
Table 20. Mental Health
City of Casselberry Census Tracts Seminole County Florida
220.01 220.02 220.04 221.01 221.04 222.01 222.05 222.08
%ofpeoplewhoreportfeelingsadnessallormostofthetime
3.41% 3.32% 3.28% 3.33% 3.32% 3.31% 3.33% 3.31% 3.32% 3.33%
%ofpeoplewhoreportfeelingaloneallormostofthetime
2.32% 2.29% 2.27% 2.30% 2.30% 2.30% 2.29% 2.29% 3.33% 2.29%
CHRONIC ILLNESS
Rates of diabetes, asthma, cancer, heart disease (all types), and emphysema across Casselberry CTs are within 1% of Seminole and Florida rates.
Table 21. Chronic Illness
City of Casselberry Census Tracts Seminole County Florida
220.01 220.02 220.04 221.01 221.04 222.01 222.05 222.08
%ofPopulationwithDiabetes 9.45% 9.16% 8.99% 9.28% 9.22% 8.99% 9.37% 8.75% 9.04% 9.40%
%ofPopulationWhoHasorHasEverHadAsthma
12.99% 12.79% 12.74% 12.77% 12.74% 12.87% 12.64% 12.91% 12.80% 12.75%
%ofPopulationwithHeartDisease(All)
11.44% 11.66% 11.64% 11.94% 11.79% 11.58% 11.96% 11.32% 11.42% 12.00%
%ofPopulationwithEmphysema
2.05% 2.09% 2.08% 2.15% 2.13% 2.07% 2.16% 2.01% 2.05% 2.15%
%ofPopulationwithCancer 7.88% 8.37% 8.42% 8.61% 8.50% 8.30% 8.67% 8.03% 8.35% 8.61%

Casselberry Healthy Community Plan >> Page 42
INJURY
In 2015, there were 604 vehicular crashes, 293 injury crashes, and 17 pe-destrian crashes, resulting in 7 traffic fatalities and no pedestrian fatalities (FIRES Quick Stats, 2015).
MORTALITY
The suicide rate (0.1%) and unintentional incident mortality rate (0.4%) across Casselberry CTs (0.1%) is identical to county and state rates.
SUMMARY OF FINDINGS
Many of the census tracts within Casselberry share similarities in health outcomes, demonstrating very little variation with county and state rates of chronic illness, mental health, and mortality indicators. There is a relatively high rate of disability status in CT 220.01 (nearly double the state rate, nearly four times the rates found in CT 222.01 and CT220.02). A number of vehicular crashes, injury crashes, pedestrian crashes, and traffic fatalities were reported in 2015.

Casselberry Healthy Community Plan >> Page 43
. Part Six .
ENGAGEMENT & OBSERVATION
UCF HEALTHY COMMUNITY DESIGN SURVEY DESCRIPTION The University of Central Florida’s Healthy Community Design Survey (UCF-HCDS) is adapted from the Centers for Disease Control’s (CDC) Healthy Community Design Checklist (Appendix B). Healthy community design promotes “planning and designing communities that make the healthy choice the easy choice” (CDC, 2013). The UCF-HCDS consists of several questions aimed at determining healthy community design preferences. The UCF-HCDS was made available to Casselberry residents in two media formats: print (Appendix C) and electronic (Appendix D). Responses were collected, in-person, at three (3) Art & Music in the Park Food Truck Events, two (2) Lakes District Planning Meetings, and one (1) Parks Master Plan Meeting, as well as on-line using the Qualtrics© online survey platform. The City posted the Qualtrics© survey link on the City’s Facebook page and on the City’s Main Page’s “In the News” section. SURVEY COLLECTION Between October 14, 2016 and January 22, 2016, two hundred and twenty-four (224) survey responses were collected. SURVEY COVERAGE Figure 35 shows the distribution of survey respondents based on street name. The majority of survey respondents indicated street names that fall within the City of Casselberry’s jurisdictional borders.
Figure 37. UCF-HCDS Coverage

Casselberry Healthy Community Plan >> Page 44
HEALTHY COMMUNITY DESIGN PREFERENCES
The majority of survey respondents “strongly agreed” to statements that express a desire to have more options that enable them be more physically active, have healthier and more affordable food choices, and allow them to reach destinations without a car (Figure 36). In comparison, more respond-ents “agreed” that it was important to “have more chances to get to know my neighbors.”
Figure 38. HCD Preferences
PHYSICAL ACTIVITY OPTIONS
The majority of survey respondents (69%) indicated that they would like more parks, trails, and open spaces in their community, fifty-four percent (54%) would like more daily activities within walking distance of their resi-dence, forty-five percent (45%) would like more sidewalks in their communi-ty, and thirty-five percent (35%) would like more bike lanes (Figure 37). Twenty-five percent (25%) of respondents provided write-in responses. The most common write-in response was a new community skate park (30). Other responses included better lighting of streets, sidewalks and trails (3), more crosswalks (2), and generally a “safer” environment (2) (Appendix E).
Figure 39. : Physical Activity Options
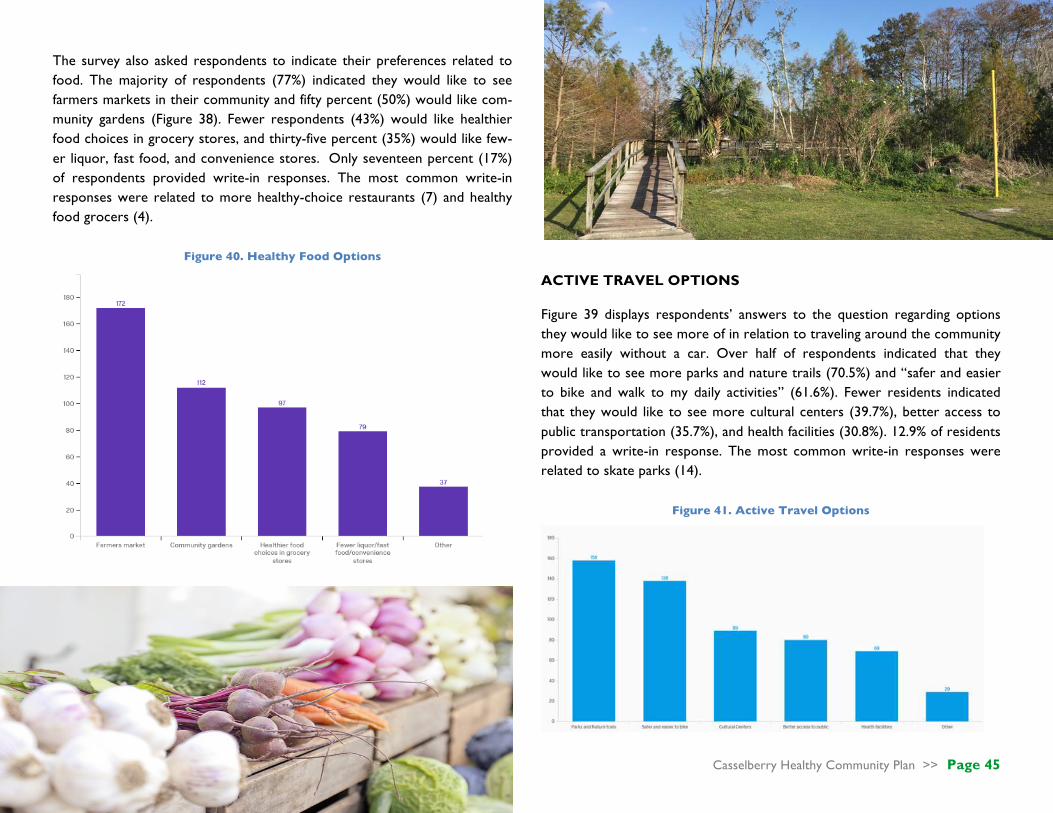
Casselberry Healthy Community Plan >> Page 45
The survey also asked respondents to indicate their preferences related to food. The majority of respondents (77%) indicated they would like to see farmers markets in their community and fifty percent (50%) would like com-munity gardens (Figure 38). Fewer respondents (43%) would like healthier food choices in grocery stores, and thirty-five percent (35%) would like few-er liquor, fast food, and convenience stores. Only seventeen percent (17%) of respondents provided write-in responses. The most common write-in responses were related to more healthy-choice restaurants (7) and healthy food grocers (4).
Figure 40. Healthy Food Options
ACTIVE TRAVEL OPTIONS
Figure 39 displays respondents’ answers to the question regarding options they would like to see more of in relation to traveling around the community more easily without a car. Over half of respondents indicated that they would like to see more parks and nature trails (70.5%) and “safer and easier to bike and walk to my daily activities” (61.6%). Fewer residents indicated that they would like to see more cultural centers (39.7%), better access to public transportation (35.7%), and health facilities (30.8%). 12.9% of residents provided a write-in response. The most common write-in responses were related to skate parks (14).
Figure 41. Active Travel Options

Casselberry Healthy Community Plan >> Page 46
SAFETY OPTIONS
Figure 40 illustrates the preferences of respondents when asked which op-tions they would like to see more of in regards to wanting to feel safer in the community. 58.9% of respondents indicated a preference for more street lighting. 55.3% of respondents indicated a desire for reduced vehicle speeds on residential streets while 42.4% would like to see well-marked crosswalks and bike lanes. 73 respondents (32.6%) selected “other.”
Figure 42. Safety Options
SOCIALIZING OPTIONS The survey also inquired about respondents’ preferences in regards to what options they would like to see more of in the community in order to have additional chances to get to know their neighbors (Figure 41). The vast ma-jority of respondents indicated a desire for more community events (71.4%) and pleasant public spaces to gather (60.3%). 40 respondents provided write-in responses. The most frequent write-in responses were related to skate parks (12) and parks (3).
Figure 43. Socializing Options

Casselberry Healthy Community Plan >> Page 47
UNIVERSAL DESIGN OPTIONS Figure 42 displays the respondents’ answers when asked which options they would like to see more of in the community in regards to having a communi-ty that is a good place for all people to live regardless of age, abilities, or in-come. An overwhelming majority of respondents (70.5%) indicated a desire for design that makes it easy for people to get around regardless of age or abilities. 32.1% of respondents would like to see housing for all income levels and types of households, and 29.5% would prefer more directional signage. There were 42 write-in responses. The most common write-in responses were related to skate parks (8) and reducing the amount of low-income housing in Casselberry (4).
Figure 44. Universal Design Options
ENVIRONMENTAL QUALITY OPTIONS Respondents were asked to provide their opinion on what they’d like to see more of in regards to living in a clean environment (Figure 43). 69.6% of re-spondents expressed that they’d like clean water supply and proper sewage treatment facilities. Respondents also indicated interest in soil that is free of toxins from past uses (54.9%) and reduced air and noise pollution from sources like freeways (42.9%). 60 respondents provided write-in responses. The most common response was reducing litter (9). Other responses in-cluded skate parks (7), cleaner lakes (3), and solar power (2).
Figure 45. Environmental Quality Options
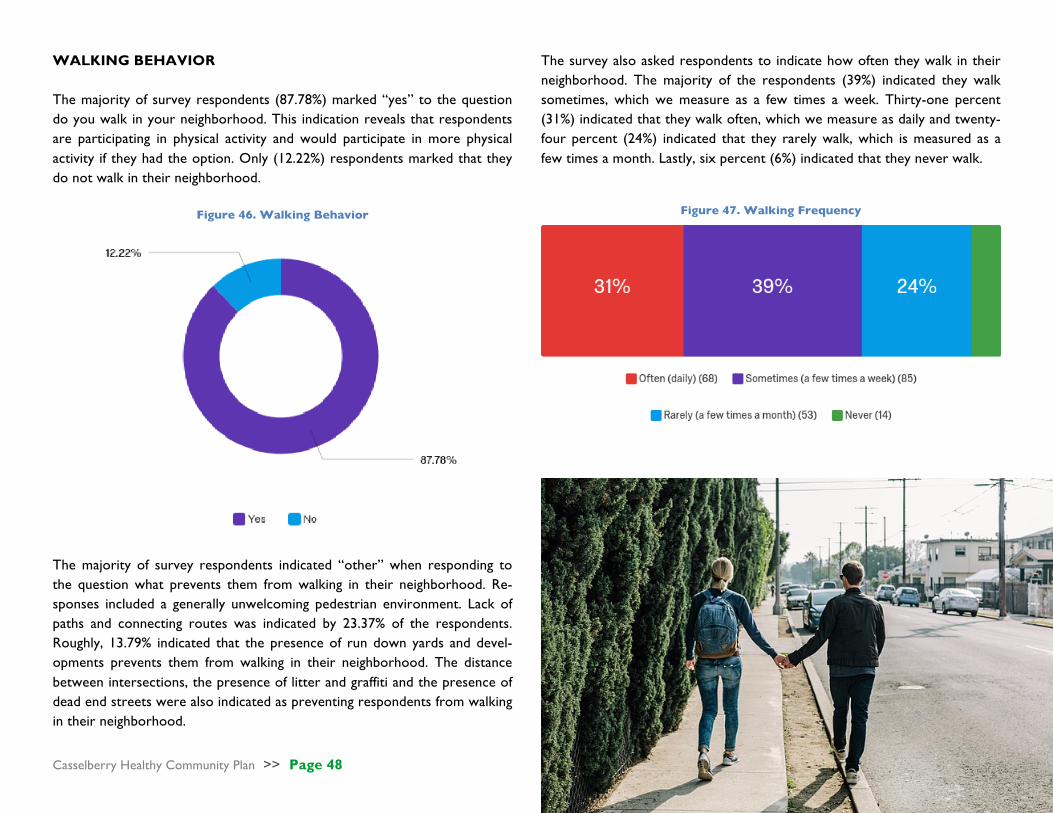
Casselberry Healthy Community Plan >> Page 48
WALKING BEHAVIOR The majority of survey respondents (87.78%) marked “yes” to the question do you walk in your neighborhood. This indication reveals that respondents are participating in physical activity and would participate in more physical activity if they had the option. Only (12.22%) respondents marked that they do not walk in their neighborhood.
Figure 46. Walking Behavior
The survey also asked respondents to indicate how often they walk in their neighborhood. The majority of the respondents (39%) indicated they walk sometimes, which we measure as a few times a week. Thirty-one percent (31%) indicated that they walk often, which we measure as daily and twenty-four percent (24%) indicated that they rarely walk, which is measured as a few times a month. Lastly, six percent (6%) indicated that they never walk.
Figure 47. Walking Frequency
The majority of survey respondents indicated “other” when responding to the question what prevents them from walking in their neighborhood. Re-sponses included a generally unwelcoming pedestrian environment. Lack of paths and connecting routes was indicated by 23.37% of the respondents. Roughly, 13.79% indicated that the presence of run down yards and devel-opments prevents them from walking in their neighborhood. The distance between intersections, the presence of litter and graffiti and the presence of dead end streets were also indicated as preventing respondents from walking in their neighborhood.

Casselberry Healthy Community Plan >> Page 49
Figure 48. Walking Obstacles
WHAT WOULD YOU ADD OR CHANGE TO MAKE CASSELBERRY A HEALTHY COMMUNITY?
Figure 49. Word Cloud of Write-in Responses to “What would you add or
change to make Casselberry a Healthy Community?”

Casselberry Healthy Community Plan >> Page 50
SOPARC PARK AUDIT
DESCRIPTION
System for Observing Plan and Recreation in Communities (SOPARC), is a direct observation tool (Appendix F) used to gather information on community park use, such as park users’ physical activity levels, gender, activity modes/types, and estimated age and ethnicity groups and park ac-tivity area characteristics such as accessibility, usability, supervision, and organization (McKenzie & Cohen, 2006). DATA COLLECTION
The SOPARC park audit was ap-plied to Secret Lake Park, one of Casselberry’s most heavily-used public spaces. All potential areas for leisure-time physical activity in the park were visited and plotted
prior to data collection. The size, location, and boundaries of each target area were identified and a map was created of each. A total of 5 areas were targeted for observations: (1) basketball court, (2) open field, (3) playground, (4) boardwalk, and (5) baseball field. Between December 13, 2016 and Feb-ruary 11, 2017, a total of nine (9) separate visits were conducted, equating to twelve hours of observation and 90 park scans. During each visit to a target area, one or more observers went to the designated area and completed a
coding form (Appendix F). The assessor first entered the start time for ob-servations in the area and entered codes to capture the current characteris-tics of the setting, including whether it was sufficiently accessible, usable, su-pervised, equipped, and provided an organized activity.
PARK USE ANALYSIS
Assessors observed a total of 326 park users. Activity areas with different facilities and purposes attracted different numbers of people. The Play-grounds (32.29% of total visitors) and Basketball Courts (30.06%) were the most frequently used by visitors. Together these locations account for 200 (62.35%) of the 326 observed park users. Also, there were significantly more males than females (63% vs. 37%) observed using the park across all areas.
Figure 50. Park Usage
32.29%
30.06%
15.34%
12.88%
10.43%
Playground BasketballCourt OpenField BaseballBield Boardwalk
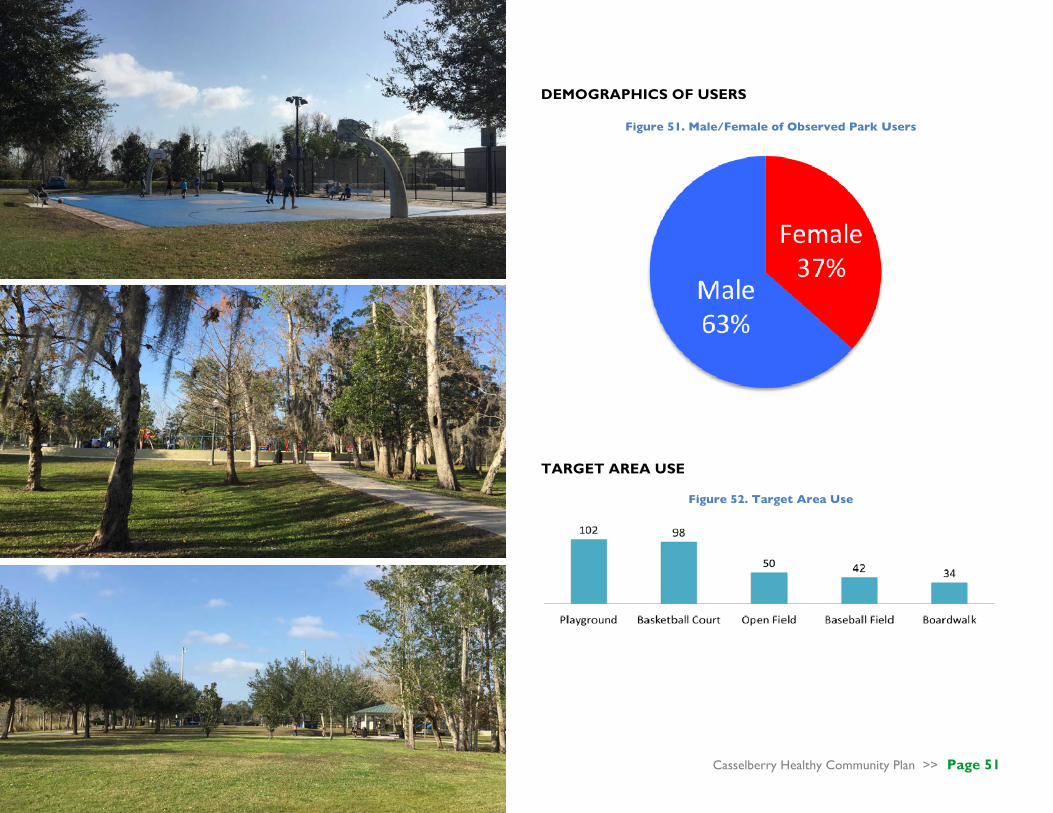
Casselberry Healthy Community Plan >> Page 51
DEMOGRAPHICS OF USERS
Figure 51. Male/Female of Observed Park Users
TARGET AREA USE
Figure 52. Target Area Use
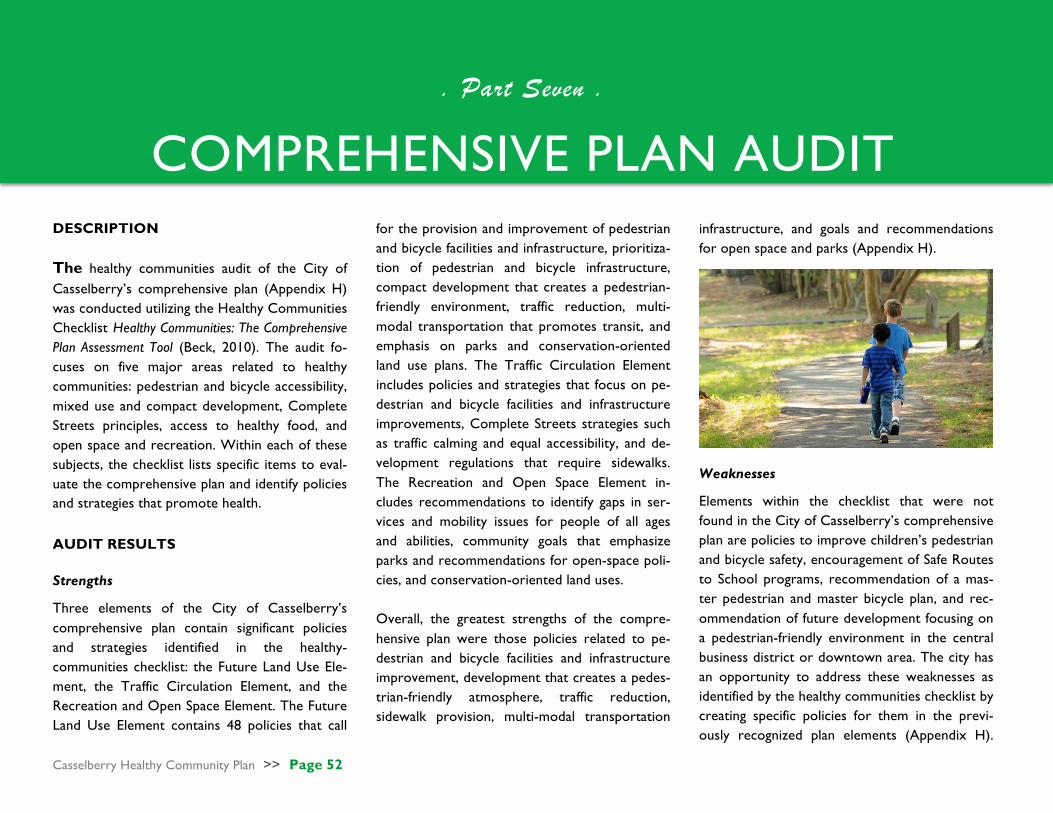
Casselberry Healthy Community Plan >> Page 52
. Part Seven .
COMPREHENSIVE PLAN AUDIT DESCRIPTION The healthy communities audit of the City of Casselberry’s comprehensive plan (Appendix H) was conducted utilizing the Healthy Communities Checklist Healthy Communities: The Comprehensive Plan Assessment Tool (Beck, 2010). The audit fo-cuses on five major areas related to healthy communities: pedestrian and bicycle accessibility, mixed use and compact development, Complete Streets principles, access to healthy food, and open space and recreation. Within each of these subjects, the checklist lists specific items to eval-uate the comprehensive plan and identify policies and strategies that promote health.
AUDIT RESULTS Strengths
Three elements of the City of Casselberry’s comprehensive plan contain significant policies and strategies identified in the healthy-communities checklist: the Future Land Use Ele-ment, the Traffic Circulation Element, and the Recreation and Open Space Element. The Future Land Use Element contains 48 policies that call
for the provision and improvement of pedestrian and bicycle facilities and infrastructure, prioritiza-tion of pedestrian and bicycle infrastructure, compact development that creates a pedestrian-friendly environment, traffic reduction, multi-modal transportation that promotes transit, and emphasis on parks and conservation-oriented land use plans. The Traffic Circulation Element includes policies and strategies that focus on pe-destrian and bicycle facilities and infrastructure improvements, Complete Streets strategies such as traffic calming and equal accessibility, and de-velopment regulations that require sidewalks. The Recreation and Open Space Element in-cludes recommendations to identify gaps in ser-vices and mobility issues for people of all ages and abilities, community goals that emphasize parks and recommendations for open-space poli-cies, and conservation-oriented land uses. Overall, the greatest strengths of the compre-hensive plan were those policies related to pe-destrian and bicycle facilities and infrastructure improvement, development that creates a pedes-trian-friendly atmosphere, traffic reduction, sidewalk provision, multi-modal transportation
infrastructure, and goals and recommendations for open space and parks (Appendix H).
Weaknesses
Elements within the checklist that were not found in the City of Casselberry’s comprehensive plan are policies to improve children’s pedestrian and bicycle safety, encouragement of Safe Routes to School programs, recommendation of a mas-ter pedestrian and master bicycle plan, and rec-ommendation of future development focusing on a pedestrian-friendly environment in the central business district or downtown area. The city has an opportunity to address these weaknesses as identified by the healthy communities checklist by creating specific policies for them in the previ-ously recognized plan elements (Appendix H).

Casselberry Healthy Community Plan >> Page 53
. Part Eight .
KEY FINDINGS
FINDING 1. Of the 8 CTs (Census Tracts) examined, CT 221.01 demonstrates the highest frequency of social and economic indicators that may be negatively impacting the health of residents.
FINDING 2. The majority of survey respondents indicated that they would like more parks, trails, open spaces and so-cially-oriented community events such as farmers markets in their community.
FINDING 3. Survey respondents expressed a preference for designing the built environment in a way that makes it easy for people to get around regardless of age or abilities.
FINDING 4. The majority of survey respondents indicated that while they do walk a few times a week, they also indi-cated that there are factors that prevent them from walking.
FINDING 5. Casselberry is a car-dependent city; land use mix is low in many residentially-oriented areas and the vast majority of residents across every CT utilize a car, truck, and/or van to reach daily destinations.
FINDING 6. The Casselberry Comprehensive Plan lacks land use and transportation policies specific to children pedes-trians and safe routes to school.
FINDING 7. There are several Casselberry lakes that have water quality deficiencies, but none a dire threat to health.
FINDING 8. Access to healthy food options varies, ranging from low to moderate depending on geography & income.
FINDING 9. A slightly higher percentage of residents in CT 220.01 battle obesity, diabetes, and asthma and have a sig-nificantly higher rate of people with disability status as compared to the County or State.
FINDING 10. There are significant portions of the city that lack walkable access to the parks and trails system. This problem is particularly pronounced in CT 222.01, CT 222.08, and CT 222.05.
FINDING 11. Some survey respondents indicated that a perception of danger is inhibiting levels of outdoor physical activity.
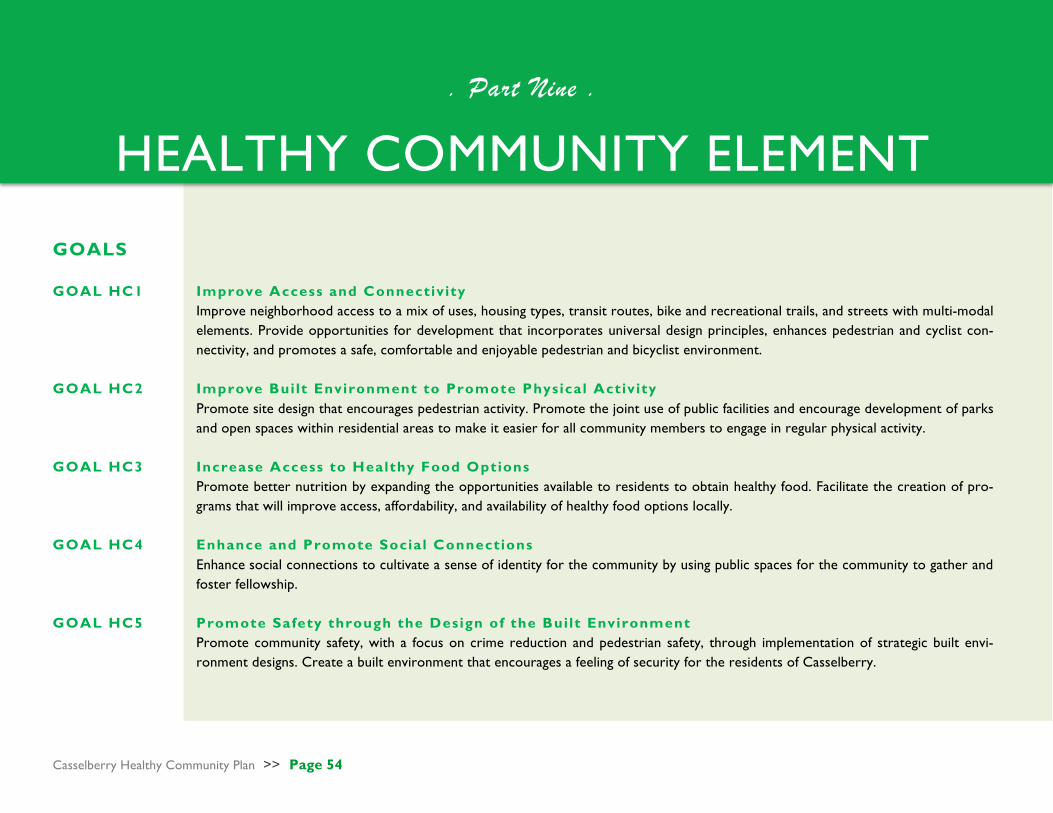
Casselberry Healthy Community Plan >> Page 54
. Part Nine .
HEALTHY COMMUNITY ELEMENT GOALS GOAL HC1 Improve Access and Connectivity
Improve neighborhood access to a mix of uses, housing types, transit routes, bike and recreational trails, and streets with multi-modal elements. Provide opportunities for development that incorporates universal design principles, enhances pedestrian and cyclist con-nectivity, and promotes a safe, comfortable and enjoyable pedestrian and bicyclist environment.
GOAL HC2 Improve Built Environment to Promote Physical Activity Promote site design that encourages pedestrian activity. Promote the joint use of public facilities and encourage development of parks
and open spaces within residential areas to make it easier for all community members to engage in regular physical activity. GOAL HC3 Increase Access to Healthy Food Options
Promote better nutrition by expanding the opportunities available to residents to obtain healthy food. Facilitate the creation of pro-grams that will improve access, affordability, and availability of healthy food options locally.
GOAL HC4 Enhance and Promote Social Connections
Enhance social connections to cultivate a sense of identity for the community by using public spaces for the community to gather and foster fellowship.
GOAL HC5 Promote Safety through the Design of the Built Environment
Promote community safety, with a focus on crime reduction and pedestrian safety, through implementation of strategic built envi-ronment designs. Create a built environment that encourages a feeling of security for the residents of Casselberry.

Casselberry Healthy Community Plan >> Page 55
GOAL HC1 Improve Access and Connectivity
Objective HC1.1 Promote Connected and Integrated Neighborhoods for Al l Residents.
Policy HC1.1A Casselberry shall encourage medium/high density housing and mixed uses in new development, redevelopment, and infill pro-
jects, especially along major road corridors US HWY 17-192 and SR 436, while discouraging homogenous land use develop-ments and suburban sprawl.
Policy HC1.1B Casselberry shall promote the development of neighborhood districts with a mix of incomes, ages, and housing types. Policy HC1.1C Casselberry shall promote aging in place strategies that allow residents to live comfortably and safely within the community
regardless of age or ability. Policy HC1.1D Casselberry shall encourage development near existing and proposed transit routes, bike and recreational trails, and streets
with multi-modal elements, and require all new developments to provide access to existing or proposed trails.
Objective HC1.2 Promote Connected Transportation Systems.
Policy HC1.2A Casselberry shall continue to update the City’s Multimodal Transportation Master Plan to identify opportunities to improve pedestrian and bicycle connectivity to community facilities, schools, parks, lakes, open spaces, healthy food sources, and other commercial and employment areas.
Policy HC1.2B Casselberry shall continue to promote the City’s Complete Streets Policy, balancing public transit, walking, and bicycling with
other modes of travel. Policy HC1.2C Casselberry shall encourage active forms of transportation for both recreation and daily mobility needs. Policy HC1.2D Casselberry shall encourage cross-access between properties and discourage the development of physical barriers between
destinations such as long block lengths, cul-de-sacs, and gated neighborhoods. Policy HC1.2E Casselberry shall encourage the preparation of a Health Impact Assessment during the planning stage of any major proposed
transportation project, plan, or policy to consider any possible adverse health outcomes.

Casselberry Healthy Community Plan >> Page 56
Objective HC1.3 Improve the Pedestr ian and Bicycl ist Environment.
Policy HC1.3A Casselberry shall encourage the development of street design standards that emphasize a safe, comfortable, and enjoyable pe-
destrian and bicycle experience through the development of wide sidewalks, off-street bike lanes, street trees and vegetation, traffic calming elements, crosswalks and mid-block pedestrian refuge islands, lighting, bus shelters, street furnishings, and oth-er amenities.
Policy HC1.3B Casselberry shall assess the City’s overall accessibility for people of all ages and abilities and make improvements to the built
environment as necessary by using universal design principles. Policy HC1.3C Casselberry shall encourage the development of Green Streets featuring design elements that help improve air and water
quality such as bio-swale planters, permeable paving, Florida Friendly vegetation, street trees, and vegetative habitat corridors. Policy HC1.3D Casselberry shall consider reducing the number and width of existing vehicular travel lanes wherever feasible.

Casselberry Healthy Community Plan >> Page 57
GOAL HC2 Improve Built Environment to Promote Physical Activity
Objective HC2.1 Promote Pedestr ian-Oriented Site Design.
Policy HC2.1A Casselberry shall accommodate pedestrian circulation through new mixed-use and commercial projects with sidewalks and
internal pathways. Policy HC2.1B Casselberry shall encourage future development to incorporate greenways to link open space areas located in close proximity
to one another. Policy HC2.1C Casselberry shall encourage development that considers the connections, both vehicular and pedestrian, to adjoining sites to
reduce personal automobile trips.
Objective HC2.2 Encourage the Development of Parks and Open Spaces to Promote Physical Activ ity.
Policy HC2.2A Casselberry shall encourage new subdivisions to provide land for open spaces, neighborhood parks, and/or pocket parks. Policy HC2.2B Casselberry shall develop a neighborhood park system that provides recreational opportunities located within 1/4-mile of
most residences.
Objective HC2.3 Promote Joint Use of Public Faci l it ies .
Policy HC2.3A Casselberry shall coordinate with the School District and other local public and private organizations for joint use of areas and facilities. The city shall work with other organizations including the School District to jointly develop and operate play-ground/park facilities in order economically to meet the needs for neighborhood parks and improved school facilities.
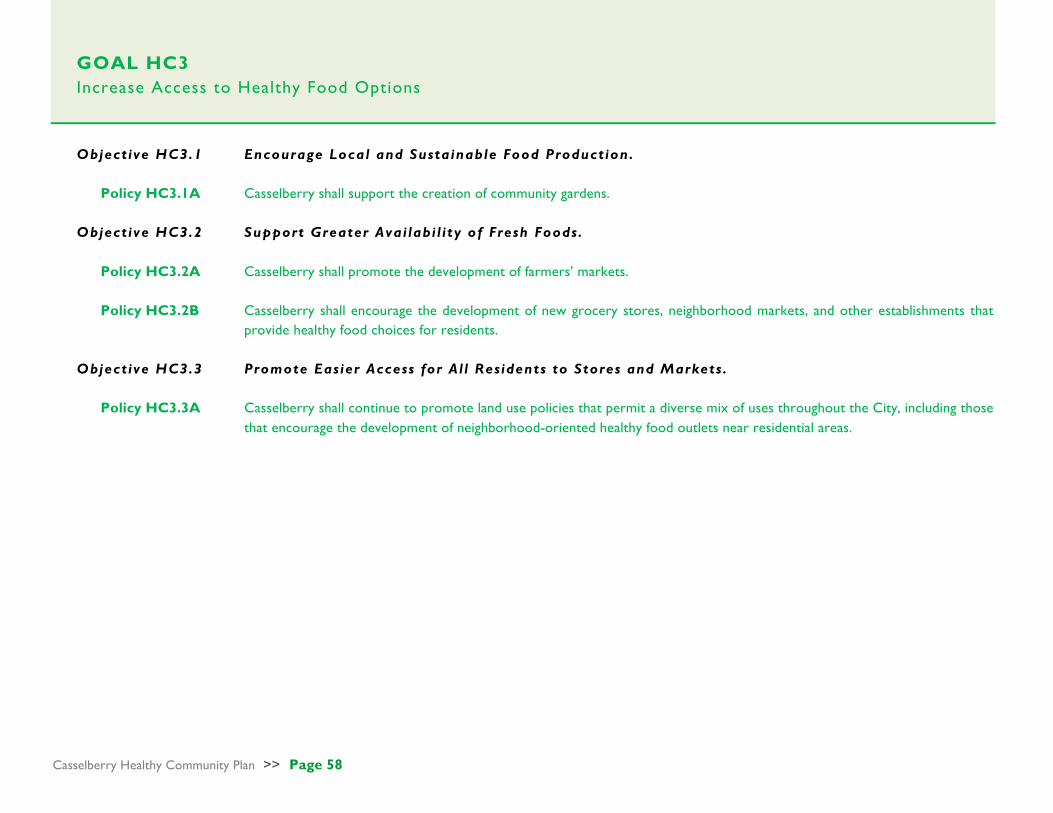
Casselberry Healthy Community Plan >> Page 58
GOAL HC3 Increase Access to Healthy Food Options
Objective HC3.1 Encourage Local and Sustainable Food Production.
Policy HC3.1A Casselberry shall support the creation of community gardens.
Objective HC3.2 Support Greater Avai labi l ity of Fresh Foods .
Policy HC3.2A Casselberry shall promote the development of farmers’ markets. Policy HC3.2B Casselberry shall encourage the development of new grocery stores, neighborhood markets, and other establishments that
provide healthy food choices for residents.
Objective HC3.3 Promote Easier Access for Al l Residents to Stores and Markets .
Policy HC3.3A Casselberry shall continue to promote land use policies that permit a diverse mix of uses throughout the City, including those that encourage the development of neighborhood-oriented healthy food outlets near residential areas.
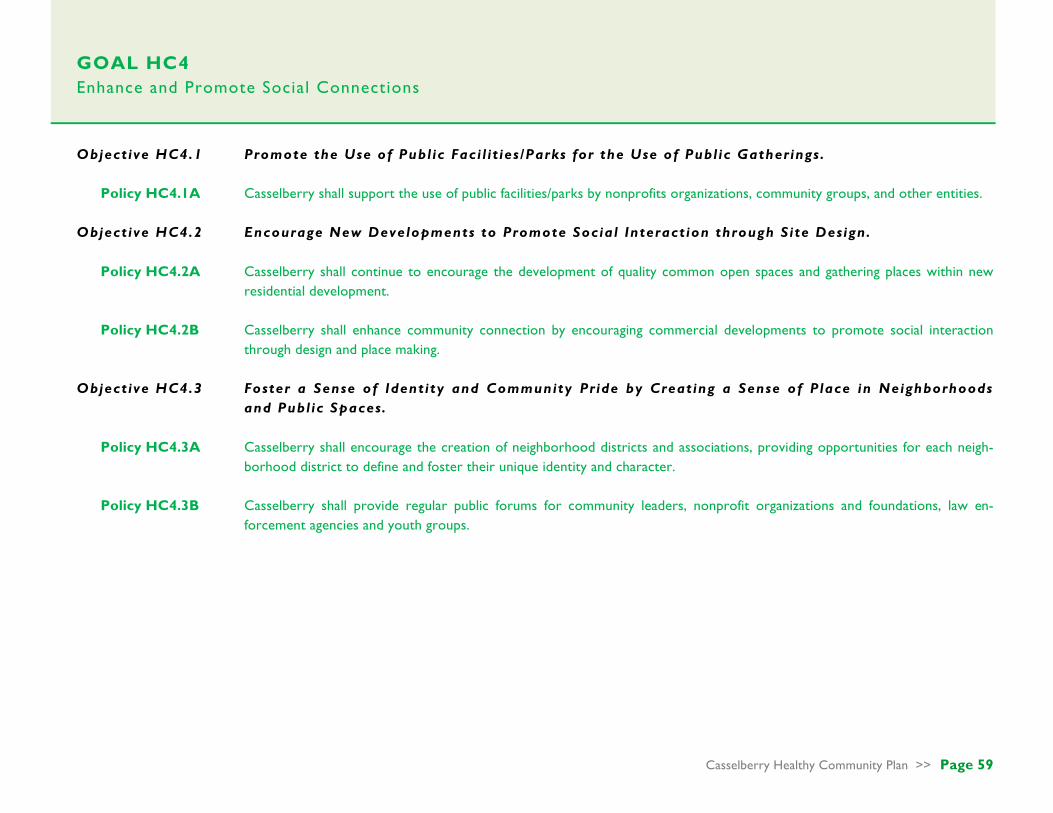
Casselberry Healthy Community Plan >> Page 59
GOAL HC4 Enhance and Promote Social Connections
Objective HC4.1 Promote the Use of Public Faci l it ies/Parks for the Use of Public Gatherings .
Policy HC4.1A Casselberry shall support the use of public facilities/parks by nonprofits organizations, community groups, and other entities.
Objective HC4.2 Encourage New Developments to Promote Social Interaction through Site Design.
Policy HC4.2A Casselberry shall continue to encourage the development of quality common open spaces and gathering places within new
residential development. Policy HC4.2B Casselberry shall enhance community connection by encouraging commercial developments to promote social interaction
through design and place making.
Objective HC4.3 Foster a Sense of Identity and Community Pride by Creating a Sense of Place in Neighborhoods and Public Spaces.
Policy HC4.3A Casselberry shall encourage the creation of neighborhood districts and associations, providing opportunities for each neigh-
borhood district to define and foster their unique identity and character. Policy HC4.3B Casselberry shall provide regular public forums for community leaders, nonprofit organizations and foundations, law en-
forcement agencies and youth groups.
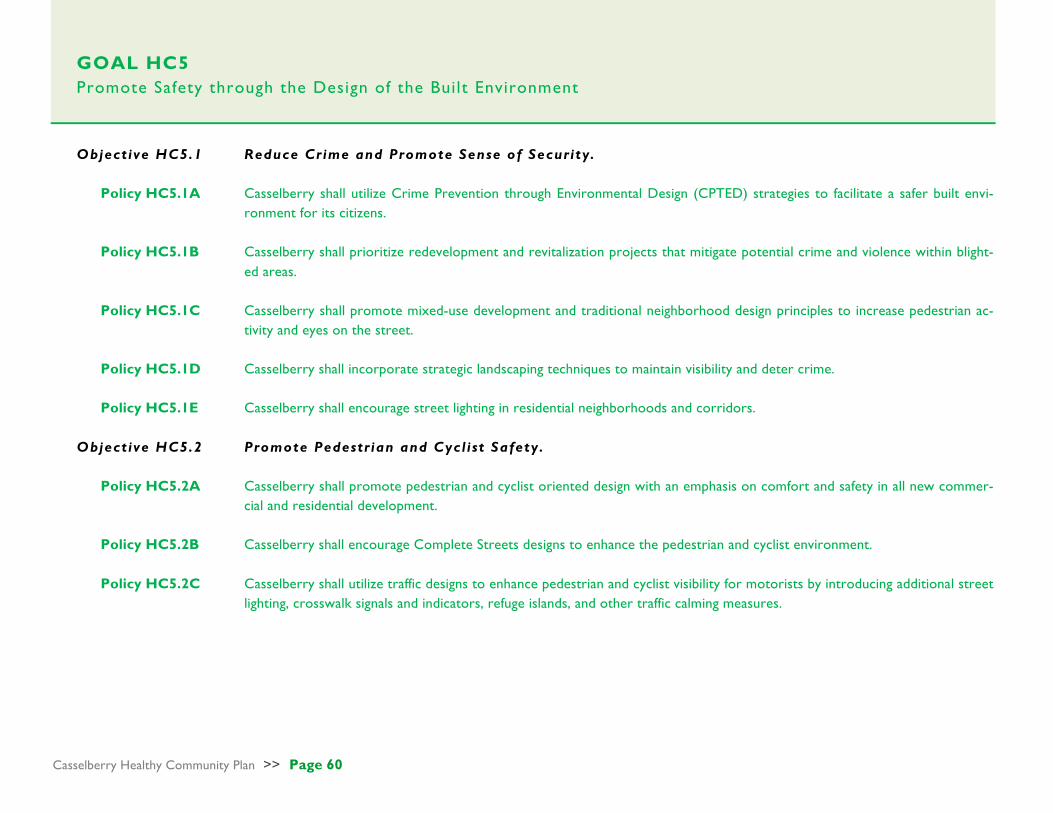
Casselberry Healthy Community Plan >> Page 60
GOAL HC5 Promote Safety through the Design of the Built Environment
Objective HC5.1 Reduce Crime and Promote Sense of Security.
Policy HC5.1A Casselberry shall utilize Crime Prevention through Environmental Design (CPTED) strategies to facilitate a safer built envi-
ronment for its citizens. Policy HC5.1B Casselberry shall prioritize redevelopment and revitalization projects that mitigate potential crime and violence within blight-
ed areas. Policy HC5.1C Casselberry shall promote mixed-use development and traditional neighborhood design principles to increase pedestrian ac-
tivity and eyes on the street. Policy HC5.1D Casselberry shall incorporate strategic landscaping techniques to maintain visibility and deter crime. Policy HC5.1E Casselberry shall encourage street lighting in residential neighborhoods and corridors.
Objective HC5.2 Promote Pedestr ian and Cycl ist Safety .
Policy HC5.2A Casselberry shall promote pedestrian and cyclist oriented design with an emphasis on comfort and safety in all new commer-
cial and residential development. Policy HC5.2B Casselberry shall encourage Complete Streets designs to enhance the pedestrian and cyclist environment. Policy HC5.2C Casselberry shall utilize traffic designs to enhance pedestrian and cyclist visibility for motorists by introducing additional street
lighting, crosswalk signals and indicators, refuge islands, and other traffic calming measures.

Casselberry Healthy Community Plan >> Page 61
. Part Ten .
DATA & ELEMENT DEVELOPMENT
LiteratureReview Indicators HCDSurvey
Findings ParkAudit CompPlanAudit
CasselberryMulti-ModalTransportationMasterPlan
GoalHC1 ObjectiveHC1.1 PolicyHC1.1A ✔ ✔ ✔ PolicyHC1.1B ✔ ✔ ✔ PolicyHC1.1C ✔ ✔ PolicyHC1.1D ✔ ✔ ObjectiveHC1.2 PolicyHC1.2A ✔ ✔ ✔ PolicyHC1.2B ✔ PolicyHC1.2C ✔ ✔ PolicyHC1.2D ✔ ✔ PolicyHC1.2E ✔ ObjectiveHC1.3 PolicyHC1.3A ✔ ✔ PolicyHC1.3B ✔ ✔ PolicyHC1.3C ✔ ✔ PolicyHC1.3D ✔ GoalHC2 ObjectiveHC2.1 PolicyHC2.1A ✔ ✔ PolicyHC2.1B ✔ PolicyHC2.1C ✔ ✔

Casselberry Healthy Community Plan >> Page 62
ObjectiveHC2.2 PolicyHC2.2A ✔ ✔ PolicyHC2.2B ✔ ✔ ✔ ✔ ObjectiveHC2.3 PolicyHC2.3A ✔ GoalHC3 ObjectiveHC3.1 PolicyHC3.1A ✔ ✔ ✔ ObjectiveHC3.2 PolicyHC3.2A ✔ ✔ ✔ PolicyHC3.2B ✔ ✔ ObjectiveHC3.3 PolicyHC3.3A ✔ ✔ GoalHC4 ObjectiveHC4.1A PolicyHC4.1A ✔ ✔ ✔ ObjectiveHC4.2 PolicyHC4.2A ✔ ✔ PolicyHC4.2B ✔ ✔ ✔ ObjectiveHC4.3 PolicyHC4.3A ✔ ✔ PolicyHC4.3B ✔ GoalHC5 ObjectiveHC5.1 PolicyHC5.1A ✔ ✔ ✔ PolicyHC5.1B ✔ ✔ PolicyHC5.1C ✔ PolicyHC5.1D ✔ PolicyHC5.1E ✔ ObjectiveHC5.2 PolicyHC5.2A ✔ PolicyHC5.2B ✔ PolicyHC5.2C ✔
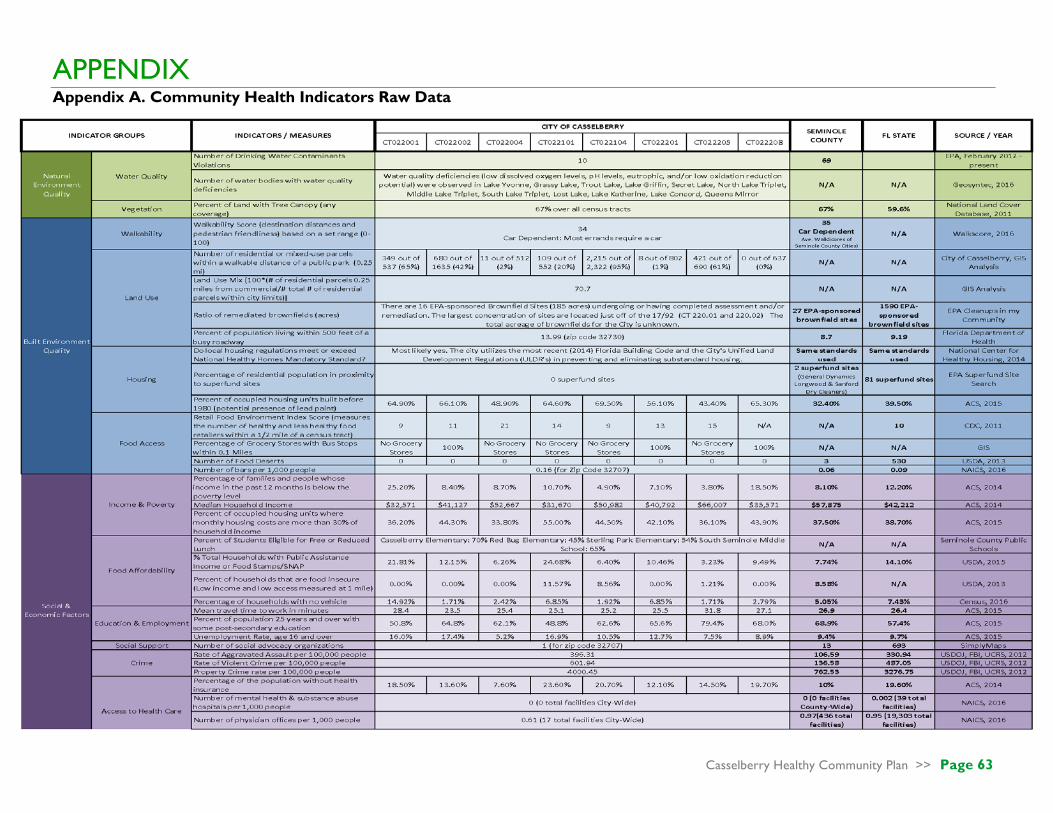
Casselberry Healthy Community Plan >> Page 63
APPENDIX Appendix A. Community Health Indicators Raw Data
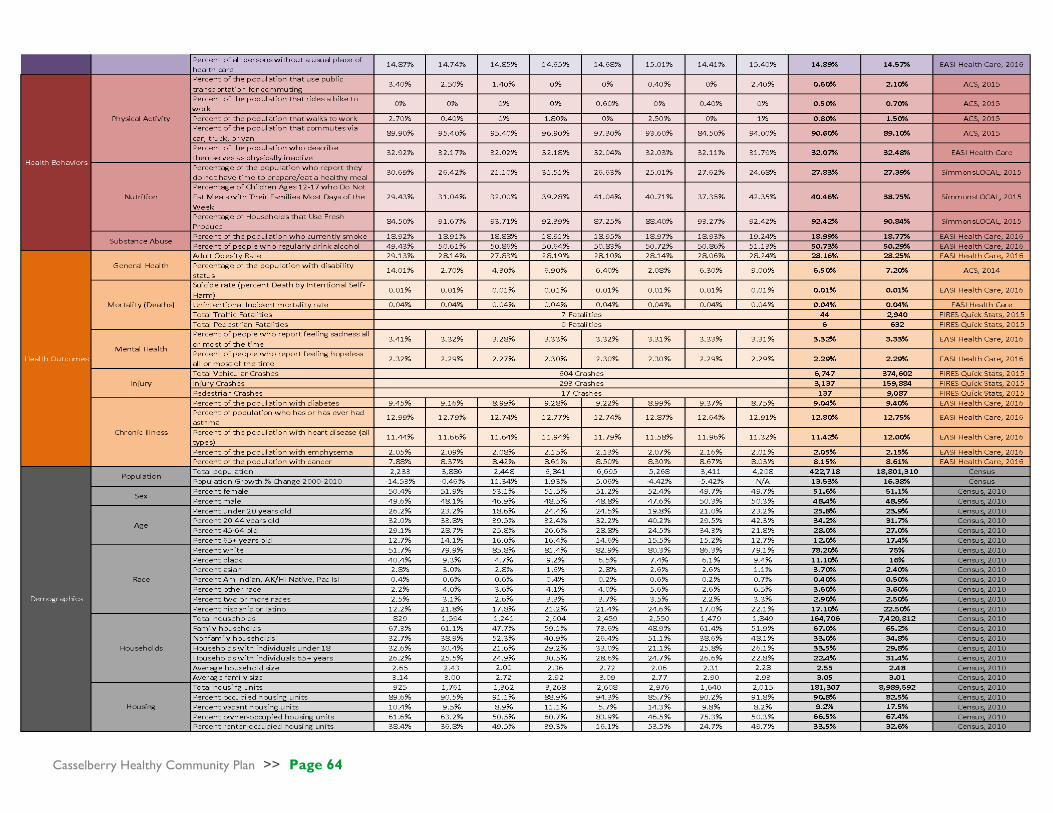
Casselberry Healthy Community Plan >> Page 64
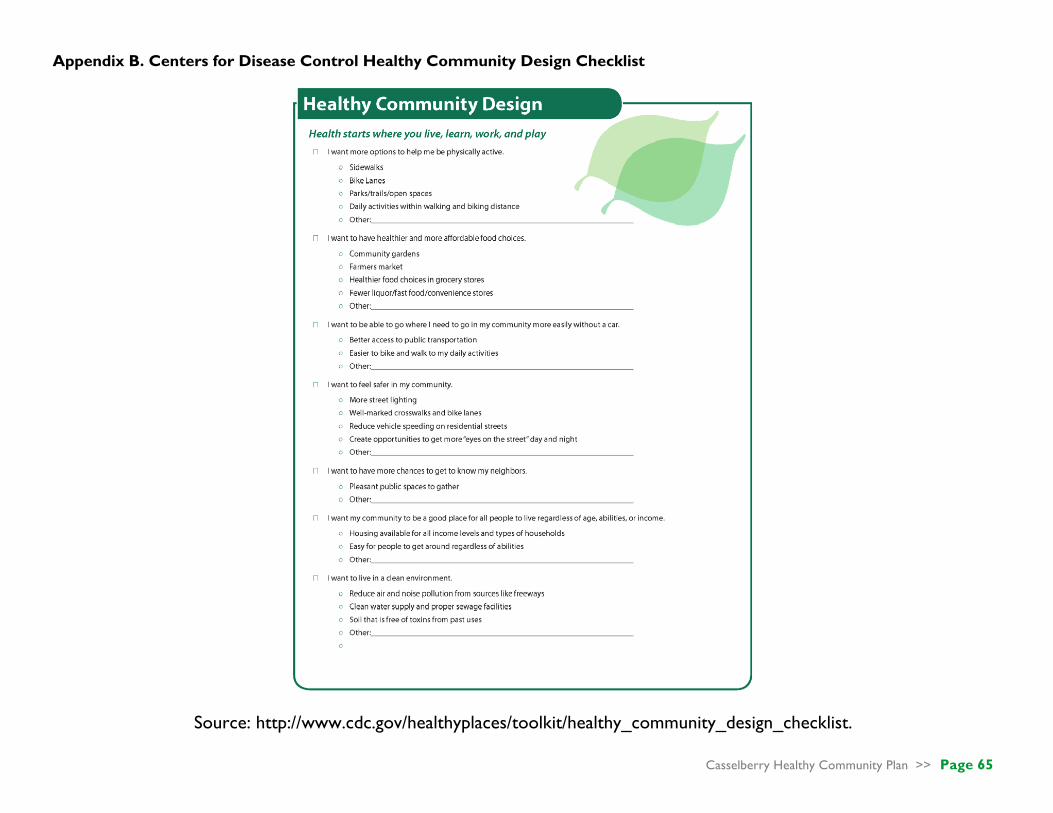
Casselberry Healthy Community Plan >> Page 65
Appendix B. Centers for Disease Control Healthy Community Design Checklist
Source: http://www.cdc.gov/healthyplaces/toolkit/healthy_community_design_checklist.

Casselberry Healthy Community Plan >> Page 66
Appendix C. UCF-HCDS Print Format

Casselberry Healthy Community Plan >> Page 67
Appendix D. UCF-HCDS Electronic Format
Screen 1
Screen 2
Screen 3
Screen 4a

Casselberry Healthy Community Plan >> Page 68
Screen 4b
Screen 4c
Screen 4d
Screen 5

Casselberry Healthy Community Plan >> Page 69
Screen 6

Casselberry Healthy Community Plan >> Page 70
Appendix E. UCF Healthy Community Design Survey Results Report
ResultsReport
Healthy_Community_Design_SurveyApril5th2017,6:09amEDT
Q23-Pleaseenteryourstreetname:
Pleaseenteryourstreetname:
2019seplerct
2107CochiseTrail
440IrisRd
5
627kendallway
710seminolablvd
95TripletLakeDrive
Austin
Azalea
AzaleaAve
BayberryBranch
BenedictWay
Benedictway
Benwickway
Bocana
BridlePath
bridlepath
BridlePath
BrightonWay
BrightonWay
BrightonWay
BrittanyCircle
Carlisle
CarriageHill
CarriageHillCircle
CarriageHillDr.
CarriageHillDrive
CastlewoodTerrace
Chaney
ChaneyDrive
CochiseTrail
CochiseTrail
Collier
CollierDr
CopperstoneCircle
CopperstoneCircle
CreeTrail
Creetrail
Derbyshirerd
EagleCircle
eldoradoway
FalmouthRd
FiresideCt.
Flamingarrowct
FoothillWayWest
Georgetowndr
GrandRueDr
GregoryDr
Guinevere
HastingsCourt
Hastingsct.
hibiscus
ImperialDrive
Imperialdrive
IvanhoeWay
IveyLane
JericoDr
kendallway
Kentia
Kewanneetrail
KewanneeTrail
Ladysusandr
LagoVistaBlvd.
LagoVistaBlvd.
LakeEllenDrive
LakeTripletDrive
Lakeside
lilacrd
Longderbyway
Meadowood
MoonlusterDr
Nlostlakelane
ntripletlakedr
NTripletLakeDr
NTripletLakeDrive
NETripletDr.
NiblickDrive
noneindicated
NormandyRd
NorrisPlace
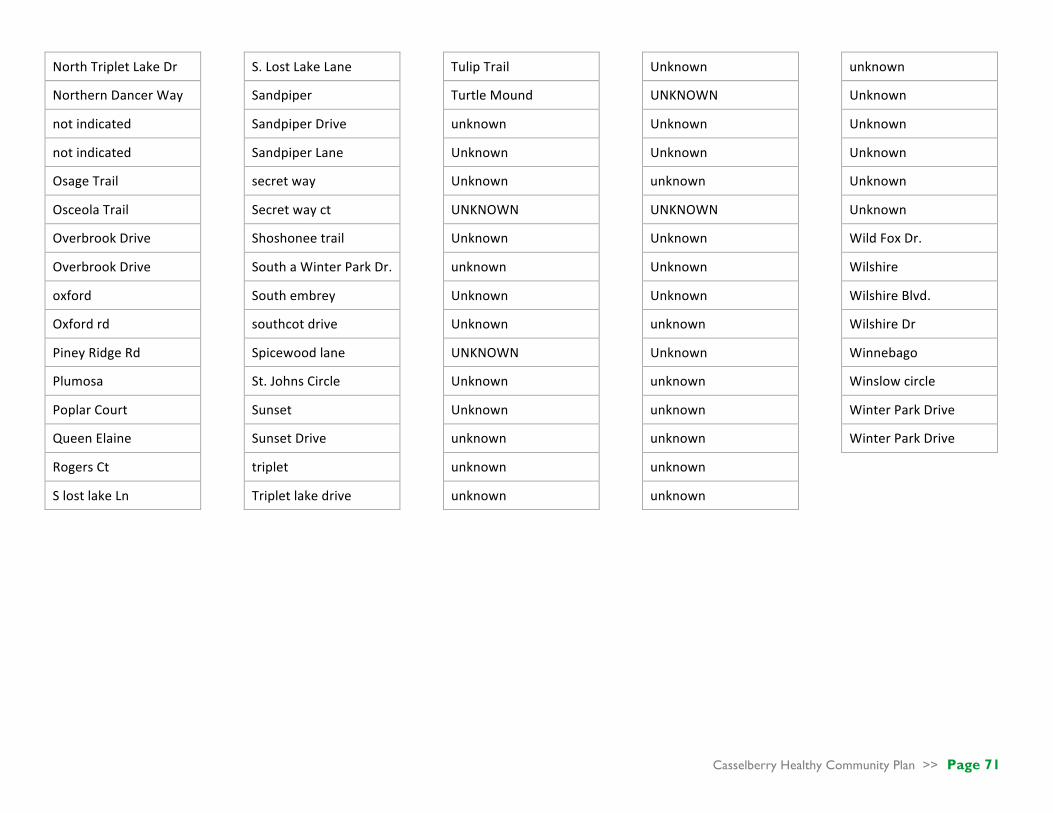
Casselberry Healthy Community Plan >> Page 71
NorthTripletLakeDr
NorthernDancerWay
notindicated
notindicated
OsageTrail
OsceolaTrail
OverbrookDrive
OverbrookDrive
oxford
Oxfordrd
PineyRidgeRd
Plumosa
PoplarCourt
QueenElaine
RogersCt
SlostlakeLn
S.LostLakeLane
Sandpiper
SandpiperDrive
SandpiperLane
secretway
Secretwayct
Shoshoneetrail
SouthaWinterParkDr.
Southembrey
southcotdrive
Spicewoodlane
St.JohnsCircle
Sunset
SunsetDrive
triplet
Tripletlakedrive
TulipTrail
TurtleMound
unknown
Unknown
Unknown
UNKNOWN
Unknown
unknown
Unknown
Unknown
UNKNOWN
Unknown
Unknown
unknown
unknown
unknown
Unknown
UNKNOWN
Unknown
Unknown
unknown
UNKNOWN
Unknown
Unknown
Unknown
unknown
Unknown
unknown
unknown
unknown
unknown
unknown
unknown
Unknown
Unknown
Unknown
Unknown
Unknown
WildFoxDr.
Wilshire
WilshireBlvd.
WilshireDr
Winnebago
Winslowcircle
WinterParkDrive
WinterParkDrive
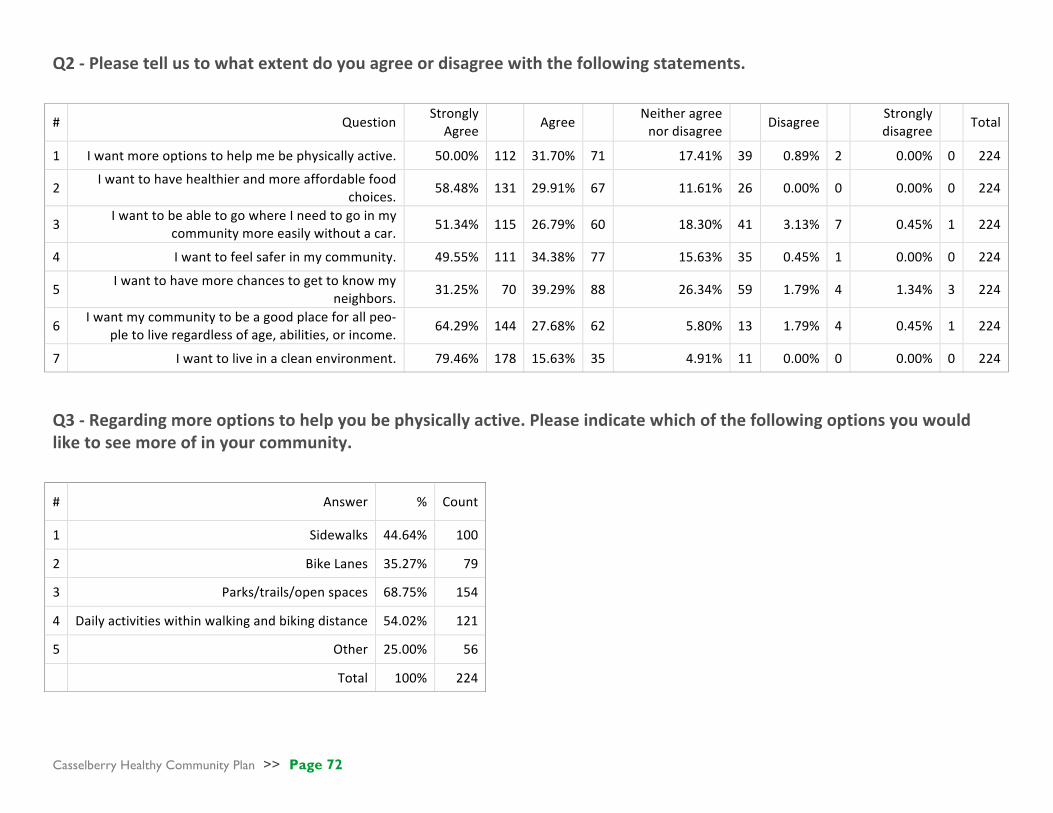
Casselberry Healthy Community Plan >> Page 72
Q2-Pleasetellustowhatextentdoyouagreeordisagreewiththefollowingstatements.
# Question Strongly
Agree Agree Neitheragreenordisagree Disagree
Stronglydisagree Total
1 Iwantmoreoptionstohelpmebephysicallyactive. 50.00% 112 31.70% 71 17.41% 39 0.89% 2 0.00% 0 224
2 Iwanttohavehealthierandmoreaffordablefood
choices. 58.48% 131 29.91% 67 11.61% 26 0.00% 0 0.00% 0 224
3 IwanttobeabletogowhereIneedtogoinmy
communitymoreeasilywithoutacar. 51.34% 115 26.79% 60 18.30% 41 3.13% 7 0.45% 1 224
4 Iwanttofeelsaferinmycommunity. 49.55% 111 34.38% 77 15.63% 35 0.45% 1 0.00% 0 224
5 Iwanttohavemorechancestogettoknowmy
neighbors. 31.25% 70 39.29% 88 26.34% 59 1.79% 4 1.34% 3 224
6 Iwantmycommunitytobeagoodplaceforallpeo-
pletoliveregardlessofage,abilities,orincome. 64.29% 144 27.68% 62 5.80% 13 1.79% 4 0.45% 1 224
7 Iwanttoliveinacleanenvironment. 79.46% 178 15.63% 35 4.91% 11 0.00% 0 0.00% 0 224
Q3-Regardingmoreoptionstohelpyoubephysicallyactive.Pleaseindicatewhichofthefollowingoptionsyouwouldliketoseemoreofinyourcommunity.
# Answer % Count
1 Sidewalks 44.64% 100
2 BikeLanes 35.27% 79
3 Parks/trails/openspaces 68.75% 154
4 Dailyactivitieswithinwalkingandbikingdistance 54.02% 121
5 Other 25.00% 56
Total 100% 224

Casselberry Healthy Community Plan >> Page 73
Q3_5_TEXT-Other
Askatepark
Askateparkforeveryonetosafelyridetheirbikes,skateboards,scooters,rollerbladesetcanddotricks
Askateparkforourkids
AtrackforrunningorspecificrunningturflikethewaterfrontparkinSanford. BikeLanesforTransportationtocartypedesti-nationsinsteadofneighborhoodtrails Bikelanesshouldhaveseparatiinfromhighspeedroadways.
blank
Boating
buildingaskateparkthatcanhelppeopleschildrenbemoreactive
canoesandkayakhubs
Crosswalksandenforcedcrosswalklaws
Enforceleashlaws
garbagecansallthesame
Havingthetop3combinedwhenpossible
Iwouldliketoseethetrailslighted
makeaskateparkforchildrentogetoutofhouseandgetinvolved Morewalksaroundourlakesandgreenspac-es.Safesidewalkswithbrightlighting.Too
manypeoplewalk/joginthestreetwhereasidewalkiswithin3feetbutdon'tuseitbe-causethesidewalkisdarkandbumpy.
na
NA
None
none
safercommunitysoicantakeadvantageoftheoptionswealreadyhaveinourcommunity Saferenviromentwerehomelesspeopleareresidinginthewoodsandattackingpeople SaferpedestrianroutesasFLisoneofthelead-ingstatesforpedestriandeaths
Saferwaystocrossbusyroads.
skatepark
SkatePark
SkatePark
skatepark
skatepark
skatepark
Skatepark
SkatePark
Skatepark
SKATEPARK
Skatepark
Skate/bikepark
Skatepark
SkatePark
skatepark
Skatepark
skatepark
Skatepark
Skatepark
skateparks
skateparks
skateparks
skateparks
Skateparks
Streetlights
Trees.KeepGrenGrantgetagain.
Upkeepontennisandracketballcourts.Addsandvolleyballcourts
youthrecreation/skatepark
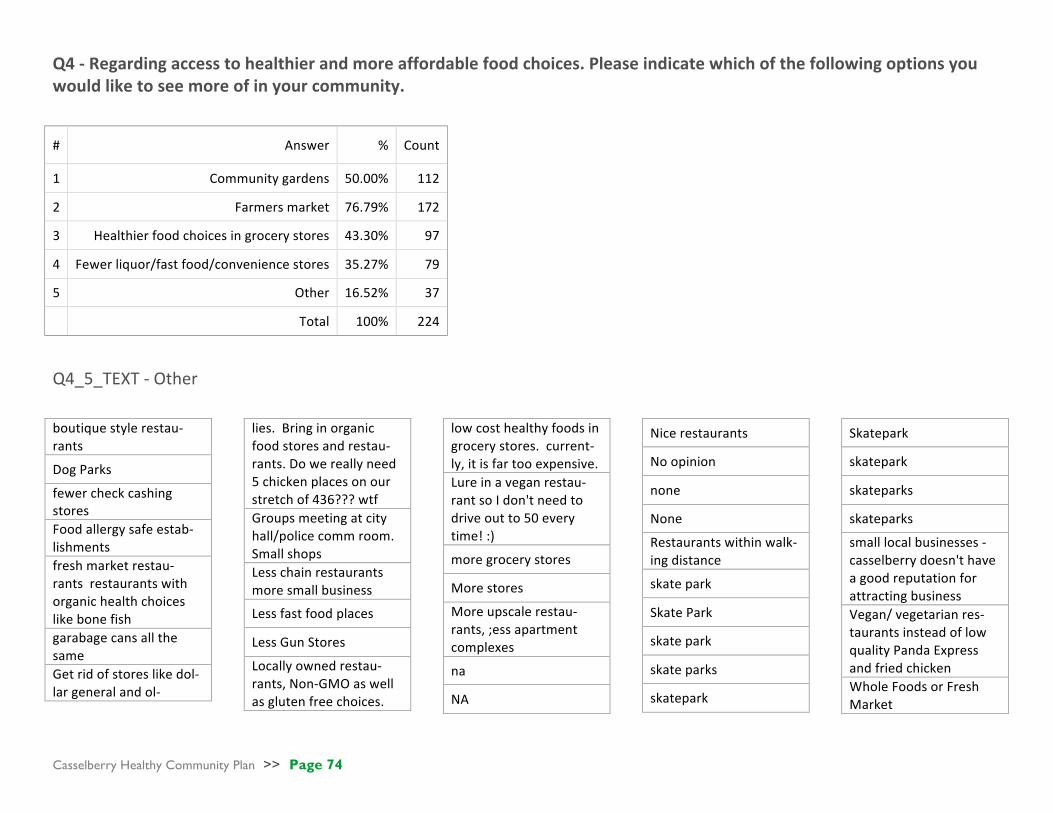
Casselberry Healthy Community Plan >> Page 74
Q4-Regardingaccesstohealthierandmoreaffordablefoodchoices.Pleaseindicatewhichofthefollowingoptionsyouwouldliketoseemoreofinyourcommunity.
Q4_5_TEXT-Other
boutiquestylerestau-rants
DogParks
fewercheckcashingstores Foodallergysafeestab-lishments freshmarketrestau-rantsrestaurantswithorganichealthchoiceslikebonefish garabagecansallthesame Getridofstoreslikedol-largeneralandol-
lies.Bringinorganicfoodstoresandrestau-rants.Dowereallyneed5chickenplacesonourstretchof436???wtf Groupsmeetingatcityhall/policecommroom.Smallshops Lesschainrestaurantsmoresmallbusiness
Lessfastfoodplaces
LessGunStores
Locallyownedrestau-rants,Non-GMOaswellasglutenfreechoices.
lowcosthealthyfoodsingrocerystores.current-ly,itisfartooexpensive. Lureinaveganrestau-rantsoIdon'tneedtodriveoutto50everytime!:)
moregrocerystores
Morestores
Moreupscalerestau-rants,;essapartmentcomplexes
na
NA
Nicerestaurants
Noopinion
none
None
Restaurantswithinwalk-ingdistance
skatepark
SkatePark
skatepark
skateparks
skatepark
Skatepark
skatepark
skateparks
skateparks
smalllocalbusinesses-casselberrydoesn'thaveagoodreputationforattractingbusiness Vegan/vegetarianres-taurantsinsteadoflowqualityPandaExpressandfriedchicken WholeFoodsorFreshMarket
# Answer % Count
1 Communitygardens 50.00% 112
2 Farmersmarket 76.79% 172
3 Healthierfoodchoicesingrocerystores 43.30% 97
4 Fewerliquor/fastfood/conveniencestores 35.27% 79
5 Other 16.52% 37
Total 100% 224

Casselberry Healthy Community Plan >> Page 75
Q5-Regardingbeingabletogowhereyouneedtogoinyourcommunitymoreeasilywithoutacar.Pleaseindicatewhichofthefollowingoptionsyouwouldliketoseemoreofinyourcommunity.
# Answer % Count
Total 100% 224
5 ParksandNaturetrails 70.54% 158
2 Saferandeasiertobikeandwalktomydailyactivities 61.61% 138
6 CulturalCenters 39.73% 89
1 Betteraccesstopublictransportation 35.71% 80
4 Healthfacilities 30.80% 69
3 Other 12.95% 29
Q5_3_TEXT-Other abilitytogettoandfromthesunrailstationwithoutusingabus(takestoolong),cab($)oruber($)
bettergarbagepickup
ConnecttoSunrail
GolfCarts
Hobbycenters
Iliketodrive
ItsthelawbutridingontheroadisNOTsafe,especiallytoschool
NEV's
Noanswergiven
Noanswerprovided
Noresponse
none
SkatePark
skatepark
Skateparkandotherplacesforfamilies
SkateParks
skatepark
Skatepark
skatepark
Skatepark
skatepark
Skateparkwithincloseproximitytoneighbor-hoods.
skateparkwouldbenice
skateparks
skateparks
skateparks
Spreadtheartthroughoutthecitysowecanwalktoit.Maketrailstoallourparks.Brighterlitsidewalksandmakethemsafe!
youthrecreation

Casselberry Healthy Community Plan >> Page 76
Q6-Regardingwantingtofeelsaferinyourcommunity.Pleaseindicatewhichofthefollowingoptionsyouwouldliketoseemoreofinyourcommunity.
# Answer % Count
1 Morestreetlighting 58.93% 132
2 Well-markedcrosswalksandbikelanes 42.41% 95
3 Reducedvehiclespeedingonresidentialstreets 55.36% 124
4 Other 32.59% 73
Total 100% 224
Q6_4_TEXT-Other Asafeandlegalplacetoskateboard
bettergarbagepickup
Camerasonintersections
CommunityPolicing/BicyclePatrols Eliminateonstreetpark-ing&parkingacrosssidewalks enforcestopsignsinneighborhoods/issuetickets
eyesonstreet
eyesonstreet
eyesonthestreetatnight GetridofSuburbanLodge
Increasedpolicepres-ence. Lessfoottrafficcut-throughtoourstreet
lesshomeless
Liveinaprovatecom-munity More"eyesonthestreet"daynight More"eyesonstreet"dayandnight more"eyesonthestreet" More"eyesonthestreet"dayandnight More"eyesonthestreet"dayandnight.Morestreetlightingin-cludingreflectorsfornighttime.
moreeyesonthesteet
moreeyesonthestreet
moreeyesonthestreet
MOreeyesonthestreetdayandnight Moreeyesonthestreetdayandnight Moreeyesonthestreetdayandnight Moreeyesonthestreetdayandnight Moreeyesonthestreetdayandnight Moreeyesonthestreetdayandnight
Morepatrols
Morepolicebikepatrolthroughoutthetrains.
Emergencycallboxesontrails. morepolicepresenceinresidentialneighbor-hoods Morepolicepresenceonstreetstoreducespeed-ersandstupiddrivers Morepolicepresence,findsomewaytodis-couragetheriff-raffthatkeepsmovingintoourcommunity moreupscalerestau-rants
na
NoResponse
NoResponse
None
None
None
None
none
none
none
parkssafer
patrolsforvandalism
Placesforyoungadultstohangandkeepbusylikeaskatepark Reducednumberofout-doorhomelesscamps Reducedverylowin-comehousing/high
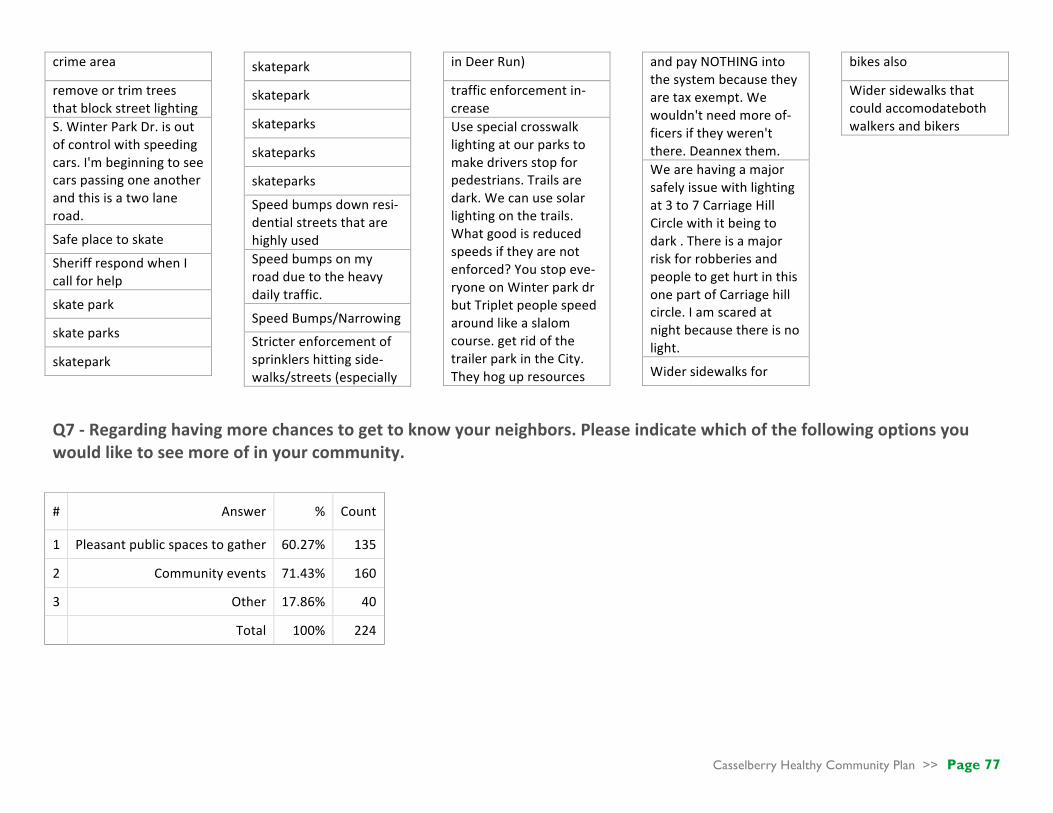
Casselberry Healthy Community Plan >> Page 77
crimearea
removeortrimtreesthatblockstreetlighting S.WinterParkDr.isoutofcontrolwithspeedingcars.I'mbeginningtoseecarspassingoneanotherandthisisatwolaneroad.
Safeplacetoskate
SheriffrespondwhenIcallforhelp
skatepark
skateparks
skatepark
skatepark
skatepark
skateparks
skateparks
skateparks
Speedbumpsdownresi-dentialstreetsthatarehighlyused Speedbumpsonmyroadduetotheheavydailytraffic.
SpeedBumps/Narrowing
Stricterenforcementofsprinklershittingside-walks/streets(especially
inDeerRun)
trafficenforcementin-crease Usespecialcrosswalklightingatourparkstomakedriversstopforpedestrians.Trailsaredark.Wecanusesolarlightingonthetrails.Whatgoodisreducedspeedsiftheyarenotenforced?Youstopeve-ryoneonWinterparkdrbutTripletpeoplespeedaroundlikeaslalomcourse.getridofthetrailerparkintheCity.Theyhogupresources
andpayNOTHINGintothesystembecausetheyaretaxexempt.Wewouldn'tneedmoreof-ficersiftheyweren'tthere.Deannexthem. Wearehavingamajorsafelyissuewithlightingat3to7CarriageHillCirclewithitbeingtodark.ThereisamajorriskforrobberiesandpeopletogethurtinthisonepartofCarriagehillcircle.Iamscaredatnightbecausethereisnolight.
Widersidewalksfor
bikesalso
Widersidewalksthatcouldaccomodatebothwalkersandbikers
Q7-Regardinghavingmorechancestogettoknowyourneighbors.Pleaseindicatewhichofthefollowingoptionsyouwouldliketoseemoreofinyourcommunity.
# Answer % Count
1 Pleasantpublicspacestogather 60.27% 135
2 Communityevents 71.43% 160
3 Other 17.86% 40
Total 100% 224

Casselberry Healthy Community Plan >> Page 78
Q7_3_TEXT-Other
blockparties
Blockparties
Communityeventsthatdon'tnegativelyaffecttheresidentswithtraffic,peopleparkinginouryards,andlitterleftbehindafterevents. HomeOwnerAssociationholidayparties
I'mcontentbeingahermit.:)
Moreactiverecreationoptions,parksaregreat,butdonotin-spireinteractionwithothers.
MoreeventsatLakeConcord
multiuseparks
na
na
Neighborhoodparks
Noanswergiven
Noanswergiven
Noanswerprovided
Noanswerprovided
none
none
none
none
none
noneindicated
notinterested
Notedcommunicationofcom-munityevents
Parksw/moreshade
publicgamesthatcanbeplayedlikechessorhorseshoeattheparks.Bigenoughnottobestoleandfunenoughtogeteveryone'sattention.
SkatePark
skatepark
skateparkcontests
Skateparksareagreatplacetoohangwithouryouth,gettoknow
themandotherparents
Skatepark
skatepark
skatepark
skatepark
skateparks
skateparks
skateparks
Skateparks
Q8-Regardinghavingacommunitythatisagoodplaceforallpeopletoliveregardlessofage,abilities,orincome.Pleaseindicatewhichofthefollowingoptionsyouwouldliketoseemoreofinyourcommunity.
# Answer % Count
1 Housingforallincomelevelsandtypesofhouseholds 32.14% 72
2 Designthatmakesiteasyforpeopletogetaroundregardlessofageorabilities 70.54% 158
3 Directionalsignage 29.46% 66
4 Other 18.75% 42
Total 100% 224

Casselberry Healthy Community Plan >> Page 79
Q8_4_TEXT-Other
Thereissomuchbullyingbyneighborsweneedtofixthisissueandfindawaytomakethosebeingbulliedfeelliketheycancomeandenjoyeventswithoutdealingwithothersbeingnastytothem.IcanhonestlysayifiwereableIwouldsellmyhouseandmoveoutofCassel-berryandneverlookbackduetohowthecityandsomeresidentstreatothers.Neverinmylifehaveiseenthis. Getridofthetrailers!Theycontributenothingtothecitycoffersbecausetheyareexemptyetuseupmostofthepolice&fireandtherestofuspayfortheirsewer&water.Notcool.Getridofleeches.Whereiscodeenforcement???WehavevansparkedonstreetsforMONTHSyetnothingisdone.Carportsstuffedtothegillswithtrash,peopleparkingtractortrailersintheirfrontyards.Blightisincrediblyuglyinourcity.RAISEthelowestcommondenominatorandthentherestofthecitywillbebroughtupfromthegroundup.YoucannotraisethevalueofthecitywithoutgettingridoftheTRASH.ForGod'ssake-NOSKATEPARKS. Toomuchlowincomehousinginthecity.Thetrailerparkaddsnotaxbase,yetusesmorethanit'sshareofservices. Notinterestedindiversifyingthehousingmorewiththeincreasedapartmentsplannedbutdowanttoseemorediverserestaurants,busi-nessesandretailfortheexistingresidents.FastfoodandRossdonotcutit.Mydollarsarebe-ingtakentosurroundingcitiessuchasWinter
ParkbecauseCasselberryjustisn'tofferinggoodoptions.
skateparks
Skatepark
skateparks
Roundabout
skatepark
skatepark
na
skatepark
na
skatepark
skateparks
rulesthatwouldenforceownerpropertyup-keep. StrongneedforAffordableHousing.EnoughLuxury"apartments"etc.
None
None
IthinkCasselberryisalreadyveryinclusive.Goodjob!:D Citysponsoredvolunteeropportunitiestohelpthehomeless.Foodpantry.Clothingdrives.Toydrives.Waystoraisemoneyforschoolkidswhocan'taffordlunch.
Moreopportunitiestohelpthehomeless
Noneofabove
Recreationoptionsthatdon'tdiscriminatebasedonfalsestereotypes. Ithinkwealreadyhavetoomanylowerincomepeoplelivinghere.Iwouldliketoseeanin-creaseofmiddleandupperclass;peoplewhoactuallytakecareoftheirhomesandproperty.
none
none
na
none
none
Noanswerprovided
Noanswergiven
Noanswergiven
Noanswerprovided
Widensidewalks,fullyaccessibleintersections

Casselberry Healthy Community Plan >> Page 80
Q9-Regardinglivinginacleanenvironment.Pleaseindicatewhichofthefollowingoptionsyouwouldliketoseemoreofinyourcommunity.
# Answer % Count
Total 100% 224
1 Reducedairandnoisepollutionfromsourceslikefreeways 42.86% 96
2 Cleanwatersupplyandpropersewagetreatmentfacilities 69.64% 156
3 Soilthatisfreeoftoxinsfrompastuses 54.91% 123
4 Other 26.79% 60
Q9_4_TEXT-Other
Bettergarbagecol-lection.Suppliedcoveredrecyclebins Betterpublictrans-portation Bettersewageanddrainagesysteminmyneighborhood.CertainlyonNTri-pletLakeDrive.
Buriedpowerlines
Compostoptions
DonotallowHOAstomandateuseofharmfulherbicides,fertilizers,orinva-siveplantsincom-munities Enforcecitycodeswithoutsomeonehavingtocall,en-
forcedogpooppickup
healthierlakes
Keepourlakesclean Lessgarbage,junk,andclutterinpeo-ple'syardsandlesslitteronthestreetsandsidewalks.
Lesslitter
Lesstrashonroadways
Litter
Moretrashandrecyclebinsinpub-licareas
MosquitosSpray
na
na
na
Noanswergiven
Noanswergiven
Noanswergiven
Noanswerprovid-ed
None
None
None
none
None
none
none
none
none
none
none
parkcleanups;moretrashcans Reducedlitteronrightofwaysandcityownedvacantland.
skatepark
skateparks
skatepark
skatepark
skatepark
skateparks
skateparks
Solarpowerforschools Solarpowerusedthroughoutthecity Streetsweeperus-age Thesearegoodinourcommunity Tonsofcontamina-tionjustonourtrailsalone.Peopledumpingbitsfromoilchangesinthetrails.Thetrailerpeopledumpallkindsofstuffinthegroundandstreamsupthere.ThereisafilmofoilystuffalloverthestreamGeeCreek.GETRIDOFTHE
TRAILERS!USECodeEnforce-ment!!!Wehavethem,yettheydoNOTHING.Viola-tionsalloverandnotasingleoneisdealtwith.None.
Trashonsidewalks
Wastepickupthroughoutthecityandlesstrashyneighborhoodsthatcausemajorde-creaseinvalueanddrugs

Casselberry Healthy Community Plan >> Page 81
Q10-Doyouwalkinyourneighborhood?
# Answer % Count
1 Yes 87.78% 194
2 No 12.22% 27
Total 100% 221 Q11-Howoftendoyouwalkinyourneighborhood?
# Answer % Count
1 Often(daily) 30.91% 68
2 Sometimes(afewtimesaweek) 38.64% 85
3 Rarely(afewtimesamonth) 24.09% 53
4 Never 6.36% 14
Total 100% 220
Q12-Whatpreventsyoufromwalkinginyourneighborhood?
# Answer % Count
1 Distancesbetweenintersections 6.19% 13
2 Lackofpathsandconnectingroutes 29.05% 61
3 Presenceofdeadendstreets 2.38% 5
4 Presenceofrundownyardsanddevelopments 17.14% 36
5 Presenceoflitterandgraffiti 6.67% 14
6 Other 62.86% 132
Total 100% 210

Casselberry Healthy Community Plan >> Page 82
Q12_6_TEXT–Other
betterlightingbehindmiddleschoolandele-mentary
BusyLife
Carsparkingonsidewalk
Carsspeedingthrough
Cars,bushes,etc.blockingsidewalks
damagedsidewalks/overgrownbrush
Donotfeelsafeduetoconstructionandtransi-ents Dogsthatseemviciouswhenyouwalkpasttheirhouse FeelunsafewithallthespeedingvehiclesonS.WinterParkDr.
gettingold
handicapped
Handicapped
Heat
Highvolumepassthroughtraffic,speeding,lackofsafety Homeless-increasednumberslatelysleepingintheparkduringtheday
Homelesspeople
Idon'tfeelsafe.KidsandadultshangingoutaskingifIwanttobuydrugs.INFRONTOFTHESCHOOLS!!!Hookersaresolicitinginthetrailerparks.Thisisnotbecomingofagoodcityofpeople.Policedonotenforcetheruleswehave,dangeroushidingplaceswithallthetrashinthefrontyards,perfectforambush.Who
knowswhathomelessriffraffliveinthetrashybackyards.Wehavethemeansbutdon'tusethem.Instead,wecatertothetrash.De-annexthetrash.Theypaynothinganduseupourresourcesforfree.Chargethemforeverypolicecall,finethemforviolations.It'sanab-soluteslumlordsituationonNWinterParkdrive,likeMadMaxorsomething.
Ihaveadisability
Imnotpreventedfromwalking
inadequatelighting
Keeprunningintomynoseyneighbors.Nahjustkidding,Ilovemyneighbors.Itjustgetsdarksoearlynowthatit'sfinallycoolenough.Eliminatedaylightsavingsandmorekidscanplayoutsidewiththeparentsafterwork.
knee/backissues
Lackofdesire
Lackofhandicapramps
Lackoflightingandnotenoughofficerpres-ence
lackoflightingandstreetpaths
LackofSidewalks
Lackofsidewalksandfasttraffic
Lackoftrees/shadeonpath.ThisisFlorida!!It'stoobloodyhottowalkinmosttimes.
Laziness
Lazy
Lazy
lighting
lightingandfeelingunsafe
lightsatnight
Looseunleasheddogsandthepeoplewhodon'tobeyexistinglaws
Myhealth
myself
N/a
N/A
N/A
n/a
na
na
na
na
Na
NA
narrowandunevensidewalks
Needmorestreetlighting
Nighttimesprinkers:(Theyspraymeallthetimeandforcemeoutintotheroad!
Noanswergiven

Casselberry Healthy Community Plan >> Page 83
Noanswergiven
Noanswerprovided
Noanswersgivenaboutwalking
Noanswersprovidedaboutwalking
Nodaytimehours;IwouldwalkmoreatnightifIhadasidewalkandmorelightinginwalkareas.
Nolighting
NoResponse
NoResponse
Noskatepark
Notime,don'tfeelsafe
None
none
None
none
None
None
none
none
none
None
none
none
none
none
none
None
Noneoftheabove
Notenoughlighting
Notheretowalkoften
Nothing
Nothing
Nothing
Nothingpreventsme,myneighborhoodisanewsubdivision.Ijustprefertobikeridein-steadofwalk.
only2streetlightsandmystreetisdark
Ourneighborhoodisnotwelllitinmyopinion
pathsconnectinggolfcourses
Personalhealth
physicalissues
PleasegetTripletopenagainsothatthereisatrafficlighttogetacross17-92onbikeorfoot.Wehavenoothersafewayofgettingacross17-92withoutourlivesbeingthreat-ened.
rain!
Rundownneighborhood,litter,trashyneigh-bors,unrulykids.Iusedtowalkallthetimebuthavebeenapproachedmenandteenboystoooftenandalmostrunoverbybicyclesandcarssonowijustgotootherneighborhoodstowalk.
safety
Safety-timeofdaywalking-homelessintheparkinsecretlake
sidewalksarenotsmooth
Sidewalksthatareuneven
Stakeparksnotanywhereclose
StreetLighting
textingdrivers
Thespeedofothercars.Whenwalkingwithastroller,carsoftenspeedpastordon'tstopatstopsigns.
Time
time
Timepressure
Time,heat
TooHot:)
unhealthytreesoverthesidewalks
Wehave3acres-alittleunique
Weneedmorelakeaccesswithareastositandenjoytheview.Especiallytripletlake.
Weather
Weather
Weather,
Widersidewalks
workschedule
work/lifebalance
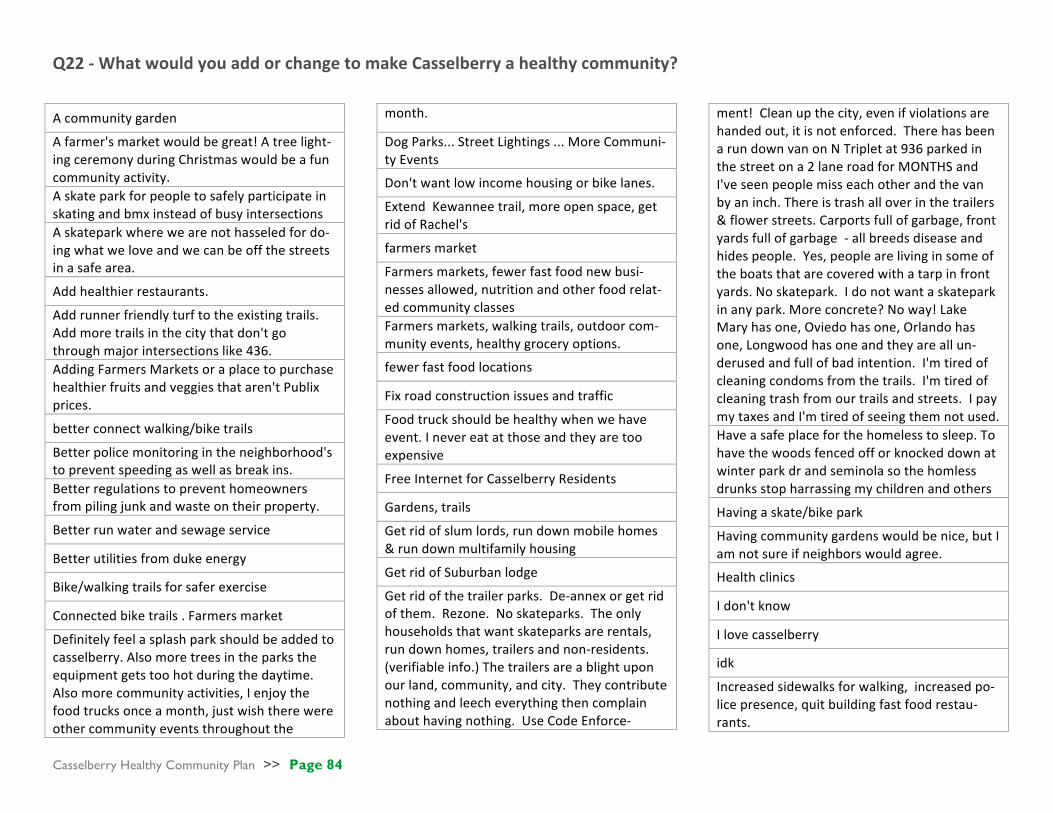
Casselberry Healthy Community Plan >> Page 84
Q22-WhatwouldyouaddorchangetomakeCasselberryahealthycommunity?
Acommunitygarden
Afarmer'smarketwouldbegreat!Atreelight-ingceremonyduringChristmaswouldbeafuncommunityactivity. Askateparkforpeopletosafelyparticipateinskatingandbmxinsteadofbusyintersections Askateparkwherewearenothasseledfordo-ingwhatweloveandwecanbeoffthestreetsinasafearea.
Addhealthierrestaurants.
Addrunnerfriendlyturftotheexistingtrails.Addmoretrailsinthecitythatdon'tgothroughmajorintersectionslike436. AddingFarmersMarketsoraplacetopurchasehealthierfruitsandveggiesthataren'tPublixprices.
betterconnectwalking/biketrails
Betterpolicemonitoringintheneighborhood'stopreventspeedingaswellasbreakins. Betterregulationstopreventhomeownersfrompilingjunkandwasteontheirproperty.
Betterrunwaterandsewageservice
Betterutilitiesfromdukeenergy
Bike/walkingtrailsforsaferexercise
Connectedbiketrails.Farmersmarket
Definitelyfeelasplashparkshouldbeaddedtocasselberry.Alsomoretreesintheparkstheequipmentgetstoohotduringthedaytime.Alsomorecommunityactivities,Ienjoythefoodtrucksonceamonth,justwishtherewereothercommunityeventsthroughoutthe
month.
DogParks...StreetLightings...MoreCommuni-tyEvents
Don'twantlowincomehousingorbikelanes.
ExtendKewanneetrail,moreopenspace,getridofRachel's
farmersmarket
Farmersmarkets,fewerfastfoodnewbusi-nessesallowed,nutritionandotherfoodrelat-edcommunityclasses Farmersmarkets,walkingtrails,outdoorcom-munityevents,healthygroceryoptions.
fewerfastfoodlocations
Fixroadconstructionissuesandtraffic
Foodtruckshouldbehealthywhenwehaveevent.Inevereatatthoseandtheyaretooexpensive
FreeInternetforCasselberryResidents
Gardens,trails
Getridofslumlords,rundownmobilehomes&rundownmultifamilyhousing
GetridofSuburbanlodge
Getridofthetrailerparks.De-annexorgetridofthem.Rezone.Noskateparks.Theonlyhouseholdsthatwantskateparksarerentals,rundownhomes,trailersandnon-residents.(verifiableinfo.)Thetrailersareablightuponourland,community,andcity.Theycontributenothingandleecheverythingthencomplainabouthavingnothing.UseCodeEnforce-
ment!Cleanupthecity,evenifviolationsarehandedout,itisnotenforced.TherehasbeenarundownvanonNTripletat936parkedinthestreetona2laneroadforMONTHSandI'veseenpeoplemisseachotherandthevanbyaninch.Thereistrashalloverinthetrailers&flowerstreets.Carportsfullofgarbage,frontyardsfullofgarbage-allbreedsdiseaseandhidespeople.Yes,peoplearelivinginsomeoftheboatsthatarecoveredwithatarpinfrontyards.Noskatepark.Idonotwantaskateparkinanypark.Moreconcrete?Noway!LakeMaryhasone,Oviedohasone,Orlandohasone,Longwoodhasoneandtheyareallun-derusedandfullofbadintention.I'mtiredofcleaningcondomsfromthetrails.I'mtiredofcleaningtrashfromourtrailsandstreets.IpaymytaxesandI'mtiredofseeingthemnotused. Haveasafeplaceforthehomelesstosleep.Tohavethewoodsfencedofforknockeddownatwinterparkdrandseminolasothehomlessdrunksstopharrassingmychildrenandothers
Havingaskate/bikepark
Havingcommunitygardenswouldbenice,butIamnotsureifneighborswouldagree.
Healthclinics
Idon'tknow
Ilovecasselberry
idk
Increasedsidewalksforwalking,increasedpo-licepresence,quitbuildingfastfoodrestau-rants.

Casselberry Healthy Community Plan >> Page 85
Keepdoingwhatthecityhasbeendoing-Openparkspace,upgradedsidewalks,safeplacestoliveandbe!
Lesschainandfastfood
Lesschickenplaces.Moreveganandupscalefood.
Lessconstructionandlesstransients
lessfastfoodandchains
Lessfastfood,lessconstruction,itislosingthesmalltownfeel.Moreartandmusic.Whathappenedtoourfarmersmarket?
Lesspeoplelittering
Lesstrafficcongestion
localfarmersmarket
Makeitmoresafe!
Moreactivespaceslikeaskateparkwherekidscanbesafeandliveahealthyvibrantlifestylefreeoffearofbeingtargetedbystafforpolice. Moreactivitiestokeepthekidsoutoftrou-ble.Discouragetheriffrafffrommovingin,trytoattractmorefamilyandcommunitymindedresidents.
Morecitysocialgatherings
Morecommunityeventandbetterinformationabouttheschedule
Moregreenspaces.
Morehealthierstoresandfarmersmarkets
Morelightingonstreets,farmersmarketwithlocallygrownfoods
Moreparks
Moreparksandactivitiesforthechildren
Moreparkswithplaygroundsforthekids.
Moresidewalks
Moretrailsandbikelanes
Moretrails/publicspacesthataren'toccu-pied/surroundedbyderelict/abandonedbuild-ings/businesses Morecommunityeventsneedspeedcalmingdevices
N/A
N/A
N/A
N/A
N/A
N/A
N/A
N/A
n/a
N/A
N/A
na
na
na
na
na
needlesspassiveparks.Trailsleadtonowhere.Moreactiveparksareneededwithbasketballcourts,baseballandsoftballfields
andsoccerfieldsthatcanbeutlizedforflagfootball.moreplannedongoingsportsleaguesandoutdooractivitiesforchildrenandadults.TheCity'sfocushasshiftedsolelytoartsandpassiveactivitieswhichdoesnotpro-moteorprovideforahealthycommunity.
newbloodtocommunitygroupsandplanners
Noskatepark,andgetridofthosebloody"skatepark"signs!They'remostlyintrashyyards&litteringuptheplace. NOSKATEPARKS.NOSKATEPARKS.NOSKATEPARKS
Nosmokinganywhere
notindicated
Outdooractivities
PolicepresenceintheareasoffS.WinterParkDr.Makeitabetterareaforthosecitizenswhoareconcernedabouttheirneighborhood.Ifthecaringandconcernedcitizenscontinuetobeignored,thentheneighborhoodwillcontinuetodeclineandtherewillbenohope.KeeptheconcernedcitizenshappyandthecityofCas-selberryalsobecomesabetterandmoreat-tractiveplacetolive.Also,havestricterrulesandlawsregardingrentalproperties.
Promotionofparksandtrailstoexerciseat.
Reasonablefeesforutilities
Safewalkingpathsinnontrafficareas
Safercrossingforwalkingorbikeridingonbusyroads.Likeanoverpassforpedestrianson436and17/92.
Saferforpedestrians
Safety,lights,gettingkidsoutsidebeingactive
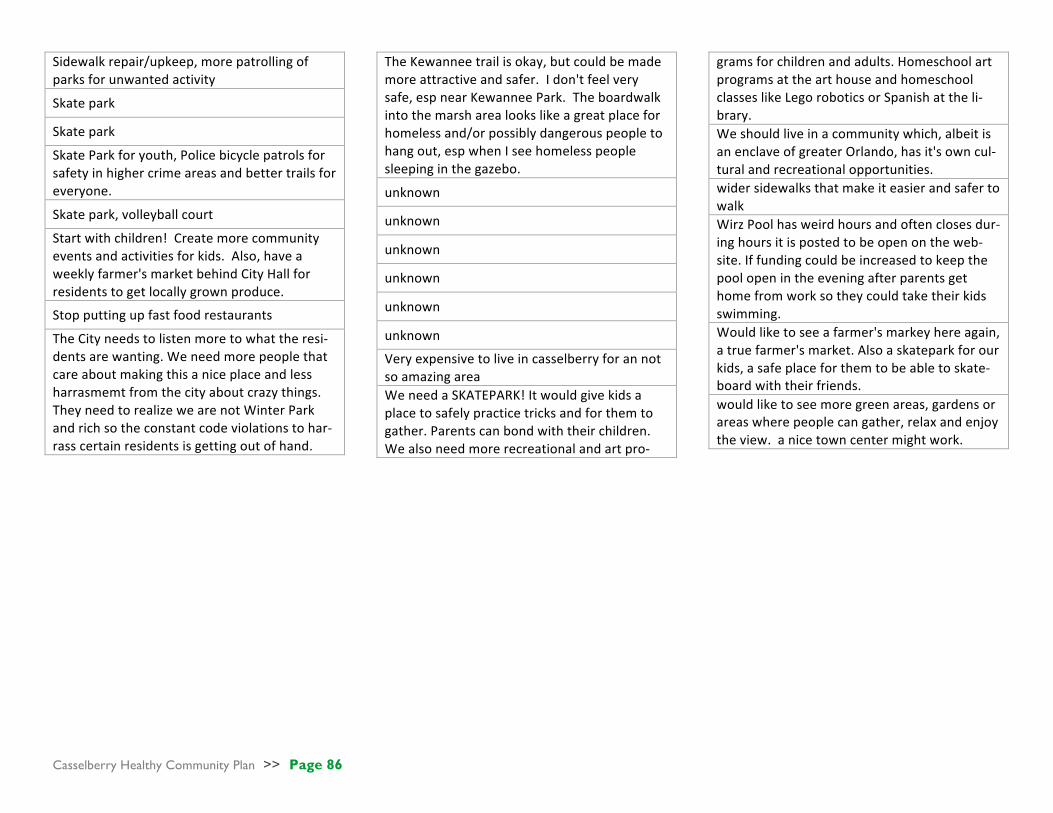
Casselberry Healthy Community Plan >> Page 86
Sidewalkrepair/upkeep,morepatrollingofparksforunwantedactivity
Skatepark
Skatepark
SkateParkforyouth,Policebicyclepatrolsforsafetyinhighercrimeareasandbettertrailsforeveryone.
Skatepark,volleyballcourt
Startwithchildren!Createmorecommunityeventsandactivitiesforkids.Also,haveaweeklyfarmer'smarketbehindCityHallforresidentstogetlocallygrownproduce.
Stopputtingupfastfoodrestaurants
TheCityneedstolistenmoretowhattheresi-dentsarewanting.Weneedmorepeoplethatcareaboutmakingthisaniceplaceandlessharrasmemtfromthecityaboutcrazythings.TheyneedtorealizewearenotWinterParkandrichsotheconstantcodeviolationstohar-rasscertainresidentsisgettingoutofhand.
TheKewanneetrailisokay,butcouldbemademoreattractiveandsafer.Idon'tfeelverysafe,espnearKewanneePark.Theboardwalkintothemarsharealookslikeagreatplaceforhomelessand/orpossiblydangerouspeopletohangout,espwhenIseehomelesspeoplesleepinginthegazebo.
unknown
unknown
unknown
unknown
unknown
unknown
Veryexpensivetoliveincasselberryforannotsoamazingarea WeneedaSKATEPARK!Itwouldgivekidsaplacetosafelypracticetricksandforthemtogather.Parentscanbondwiththeirchildren.Wealsoneedmorerecreationalandartpro-
gramsforchildrenandadults.HomeschoolartprogramsatthearthouseandhomeschoolclasseslikeLegoroboticsorSpanishattheli-brary. Weshouldliveinacommunitywhich,albeitisanenclaveofgreaterOrlando,hasit'sowncul-turalandrecreationalopportunities. widersidewalksthatmakeiteasierandsafertowalk WirzPoolhasweirdhoursandoftenclosesdur-inghoursitispostedtobeopenontheweb-site.Iffundingcouldbeincreasedtokeepthepoolopenintheeveningafterparentsgethomefromworksotheycouldtaketheirkidsswimming. Wouldliketoseeafarmer'smarkeyhereagain,atruefarmer'smarket.Alsoaskateparkforourkids,asafeplaceforthemtobeabletoskate-boardwiththeirfriends. wouldliketoseemoregreenareas,gardensorareaswherepeoplecangather,relaxandenjoytheview.anicetowncentermightwork.
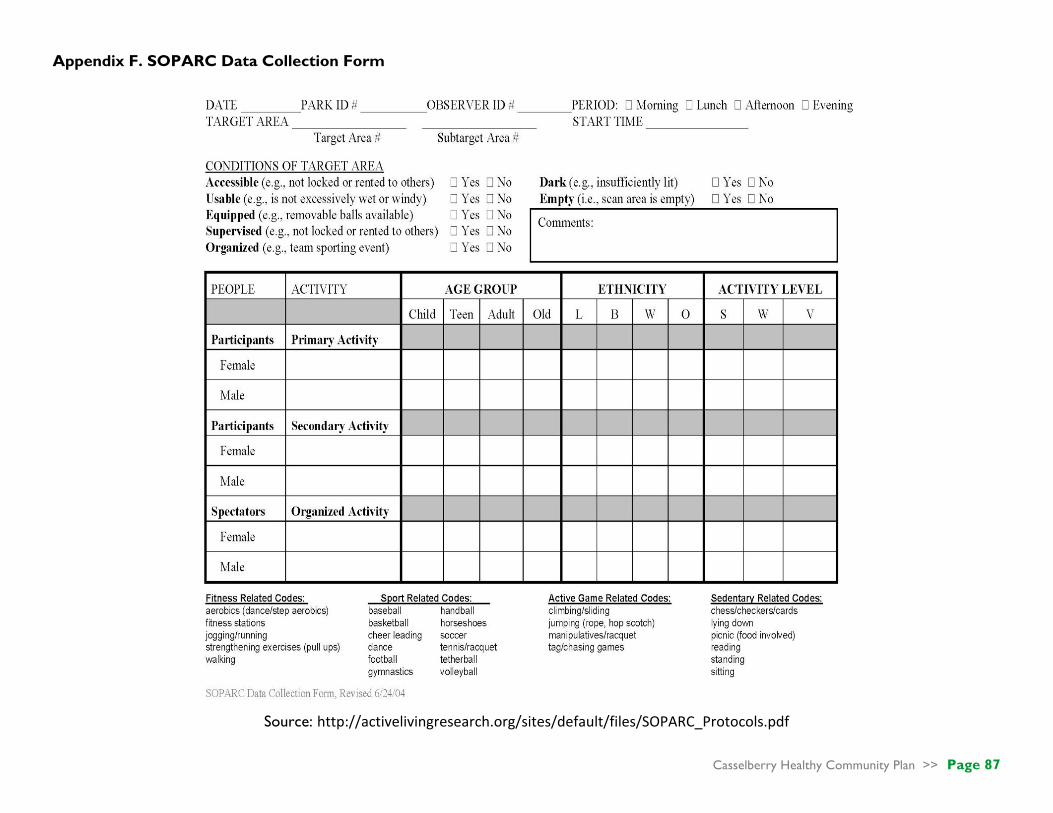
Casselberry Healthy Community Plan >> Page 87
Appendix F. SOPARC Data Collection Form
Source: http://activelivingresearch.org/sites/default/files/SOPARC_Protocols.pdf

Casselberry Healthy Community Plan >> Page 88
Appendix G. Park Audit Raw Data

Casselberry Healthy Community Plan >> Page 89

Casselberry Healthy Community Plan >> Page 90

Casselberry Healthy Community Plan >> Page 91
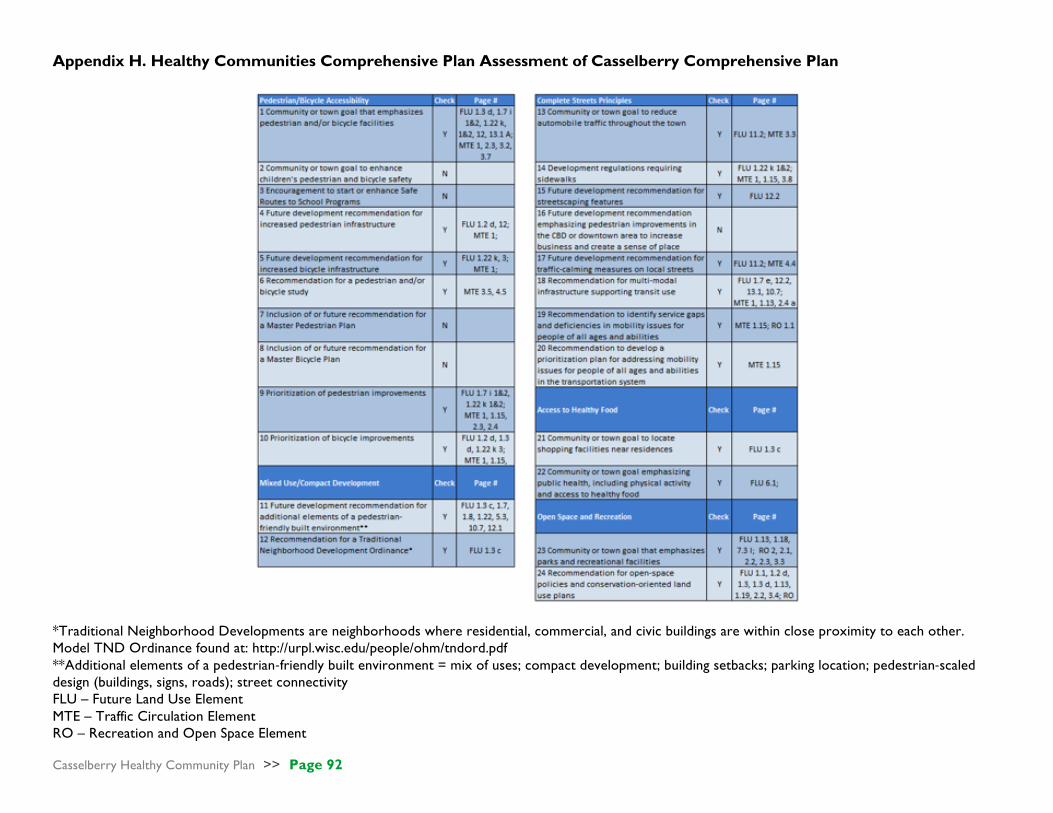
Casselberry Healthy Community Plan >> Page 92
Appendix H. Healthy Communities Comprehensive Plan Assessment of Casselberry Comprehensive Plan
*Traditional Neighborhood Developments are neighborhoods where residential, commercial, and civic buildings are within close proximity to each other. Model TND Ordinance found at: http://urpl.wisc.edu/people/ohm/tndord.pdf **Additional elements of a pedestrian-friendly built environment = mix of uses; compact development; building setbacks; parking location; pedestrian-scaled design (buildings, signs, roads); street connectivity FLU – Future Land Use Element MTE – Traffic Circulation Element RO – Recreation and Open Space Element
Casselberry Healthy Community Plan >> Page 93
REFERENCES AND RESOURCES
Austin, D. M., Furr, L. A., & Spine, M. (2002). The effects of neighborhood conditions on perceptions of safety. Journal of Criminal Justice, 30(5), 417-427.
doi:http://dx.doi.org/10.1016/S0047-2352(02)00148-4 Baker Act (2014). Retrieved from http://bakeract.fmhi.usf.edu/document/BA_Annual_2014.pdf Barrett JR. (2014). Chemical contaminants in drinking water: where do we go from here? Environmental Health Perspectives. 122:A80;
http://dx.doi.org/10.1289/ehp.122-A80 Beck, C. M. (2010). Healthy communities: the comprehensive plan assessment tool. Retrieved from:
http://www.ipa.udel.edu/healthyDEtoolkit/docs/CompPlanAssessmentTool.pdf Bonnefoy, X. (2007). Inadequate housing and health: an overview. International Journal Of Environment & Pollution, 30(3/4), 411-429. doi:10.1504/IJEP.2007.014819 Campbell, L., & Wiesen, A. 2010. Restorative commons: Creating health and well-being through urban landscapes. Newtown Square, PA: U.S. Department of
Agriculture, Forest Service, Northern Research Station. Campo, P., Salmon, C., & Burke, J. (2008). Neighbourhoods and mental well-being: What are the pathways? Health & Place, 15(1), 56-68 Centers for Disease Control. (2013). Healthy Community Design PowerPoint Presentation. Retrieved from
https://www.cdc.gov/healthyplaces/toolkit/healthy_community_designppt.pptx Centers for Disease Control and Prevention. (2011). CDC Recommendations for Transportation. Retrieved from Centers for Disease Control and Preven-
tion: https://www.cdc.gov/transportation/ Centers for Disease Control and Prevention (2016). U.S. Department of Health and Human Services. Healthy living. Retrieved from:
https://www.cdc.gov/HealthyLiving/
Chepesiuk, R. (2009). Missing the dark: Health effects of light pollution. Environmental Health Perspectives, 117(1). Chiesura, A. (2002). The role of urban parks for the sustainable city. Landscape and Urban Planning ,129-138. Cozens, P. M. (2011). Urban Planning and Environmental Criminology: Towards a New Perspective for Safer Cities. Planning Practice and Research , 481-508. Cozens, P., & Hillier, D. (2008). The Shape of Things to Come: New Urbanism, the Grid, and th Cul-De- Sac. International Planning Studies, 51-73. Dannenberg, A., Frumkin, H., & Jackson, R. (2011). Making healthy places: designing and building for health, well-being, and sustainability. Washington, DC: Island
Press.

Casselberry Healthy Community Plan >> Page 94
Dannenberg, A. L., Bhatia, R., Cole, B. L., Heaton, S. K., Feldman, J.D., & Rutt, C. D. (2008). Use of health impact assessment in the United States: 27 case stud-
ies, 1999–2007. American Journal of Preventive Medicine, 34(3), 241–256. Design for Health. (2007). Planning Information Sheet: Integrating Health into Comprehensive Planning. Retrieved from www.designforhealth.net Design for Health Comprehensive Review Checklists. (2010). Design for Health: The University of Minnesota. Retrieved from: http://designforhealth.net/wp-
content/uploads/2012/02/DFH_FullChecklist__092607update.xls Dora, C., and Phillips, M. (2000). Transport, environment, and health. World Health Organization (WHO), 89. Eitler, T. W., McMahon, E. T., & Thoerig, T. C. (2013). Ten Principles for Building Healthy Places.Washington, D.C.: Urban Land Institute. Evans, G.W. (2003). The built environment and mental health. Journal of Urban Health, 80(4): 536-555. Florida Department of Health. (2015). Health effects of summer heat in Florida. Retrieved from http://www.floridahealth.gov/environmental-health/climate-and-
health/_documents/heat-profile.pdf Goldman, H. & Grob, G. (2006). Defining ‘mental illness’ in mental health policy. Health Affairs, 25(3), 737–749. Retrieved from http://content.healthaffairs.org/
content/25/3/737.full Groenewegen, P. P., Van den Berg, A. E., De Vries, S., and Verheij, R. A. (2006). Vitamin G: effects of green space on health, well-being, and social safety. BMC
Public Health 6:149. doi: 10.1186/1471-2458-6-149 Hanna-Attisha, M., LaChance, J., Casey Sadler, R., & Champney Schnepp, A. (2016). Elevated Blood Lead Levels in Children Associated With the Flint Drinking
Water Crisis: A Spatial Analysis of Risk and Public Health Response. American Journal Of Public Health, 106(2), 283-290. Kaplan, R., & Kaplan, S. (1989). The experience of nature: A psychological perspective. Cambridge, UK: Cambridge University Press. Kawachi, I., and Berkman, L. (2001). Social ties and mental health. Journal of Urban Health, 78(3), 458-467. King County. (2016). Community health indicators. Retrieved from: http://www.kingcounty.gov/depts/health/data/community-health-indicators.aspx Kuo, M. (25 August, 2015). How might contact with nature promote human health? Promising mechanisms and a possible central pathway. Frontiers in Psycholo-
gy. Retrieved from http://dx.doi.org/10.3389/fpsyg.2015.01093 Lercher, P., Evans, G.W., Meis, M., Kofler, W. (2002). Ambient neighborhood noise and children’s mental health. Occupational Environmental Medicine, 59, 380–
386

Casselberry Healthy Community Plan >> Page 95
Leyden, K. (2003). Social capital and the built environment: the importance of walkable neighborhoods. American Journal Of Public Health, 93(9), 1546-1551 6p. doi:10.2105/AJPH.93.9.1546
Litt, J. S., Tran, N. L., & Burke, T. A. (2002). Examining urban brownfields through the public health “macroscope”. Environmental Health Perspectives, 110(Suppl
2), 183–193. Lopez-Zetina, J., Lee, H., & Friis, R. (2006). The link between obesity and the built environment. Evidence from an ecological analysis of obesity and vehicle
miles of travel in California. Health & Place, 12(4), 656-664.
Lowrey, A. (2011). Your commute is killing you: Long commutes cause obesity, neck pain, loneliness, divorce, stress, and insomnia. Slate. Retrieved from: http://www.slate.com/articles/business/moneybox/2011/05/your_commute_is_killing_you.html
Lorenc, T., Clayton, S., Neary, D., Whitehead, M., Petticrew, M., Thomson, H., . . . Renton, A. (2012). Crime, fear of crime, environment, and mental health and wellbeing: Mapping review of theories and causal pathways. Health & Place, 18(4), 757-765.
Mckenzie, T.L. & Cohen, D.A. (2006). SOPARC: Description and Procedures Manual. Retrieved from
http://activelivingresearch.org/sites/default/files/SOPARC_Protocols.pdf Mental Health: Key Questions. (2007). Design for Health: The University of Minnesota. Retrieved from: http://designforhealth.net/wp con-
tent/uploads/2012/12/BCBS_ KQmentalhealth_061308.pdf Merrill, C., Cottrell, L., & Searcy, K. (2016). District of Columbia community health needs assessment. Retrieved from:
http://www.dchealthmatters.org/content/sites/washingtondc/2016_DC_CHNA_062416_FINAL.pdf Newman, S.L., Tumin, R., Andridge, R., & Anderson, S.E. (2015). Family meal frequency and association with household food availability in United States multi-
person households: National Health and Nutrition Examination Survey 2007-2010. PLoS ONE 10(12).
Office of Disease Prevention and Health Promotion. (2015). Dietary guidelines for Americans: 2015-2020. Retrieved from: https://health.gov/dietaryguidelines/2015/guidelines/
Pastor, M., & Morello-Frosch, R. (2014). Integrating Public Health and Community Development To Tackle Neighborhood Distress and Promote Well-Being. Health Affairs, 1890-1896.
Pfeiffer, D. & Cloutier, S. (2016). Planning for happy neighborhoods. Journal of the American Planning Association, 82:3, 267-279. Polk County. (2015). Community needs assessment. Retrieved from: http://polk.floridahealth.gov/_files/_documents/CHA%2010.1.15.pdf Portland Comprehensive Plan Update – Proposed Draft. (2014). Retrieved from https://www.portlandoregon.gov/bps/article/49723

Casselberry Healthy Community Plan >> Page 96
Reeves, W., Strine, T., & Pratt, L. (2011). Mental illness surveillance among adults in the United States. MMWR. 60(3):1–32. Atlanta, GA: Centers for Disease Control and Prevention. Available from http://www.cdc.gov/mmwr/preview/mmwrhtml/ su6003a1.htm?s_cid =su6003a1_w
Requirements for Florida Comprehensive Plans. (2011). Florida Land Development Regulations. Retrieved from:
https://floridaldrs.com/2011/06/06/requirements-for-florida-comprehensive-plans/ Reynolds, K. A., Mena, K. D., & Gerba, C. P. (2008). Risk of waterborne illness via drinking water in the United States. Reviews of Environmental Contamination
and Toxicology, 192, 117-158. Robert Wood Johnson Foundation Commission to Build a Healthier America. (2008). Where We Live Matters for Our Health: Neighborhoods and Health.
Retrieved from Commissionhealth.org: http://www.rwjf.org/en/our-focus-areas/topics/built-environment-and-health.html Rodríguez, D. A., Khattak, A. J., & Evenson, K. R. (2006). Can New Urbanism Encourage Physical Activity?. Journal Of The American Planning Association,
72(1), 43-54. Ruokolainen. L., von Hertzen, L., Fyhrquist, N., Laatikainen, T., Lehtomäki, J., Auvinen, P., Karvonen, A.M., Hyvärinen, A., Tillmann, V., Niemelä, O., Knip, M.,
Haahtela, T., Pekkanen, J., Hanski, I. (2015). Green areas around homes reduce atopic sensitization in children. European Journal of Allergy and Clinical Immunology, 70: 195–202
Schroeder, S. (2007). We can do better - Improving the health of American people. The New England Journal of Medicine, 357, 1221-1228.
Shenassa, E. D., Daskalakis, C., Liebhaber, A., Braubach, M., & Brown, M. (2007). Dampness and mold in the home and depression: an examination of mold-related illness and perceived control of one’s home as possible depression pathways. American Journal of Public Health, 97(10), 1893–1899.
Smit, W., Hancock, T., Kumaresen, J., Santos-Burgoa, C., Sanchez-Kobashi, R., & Friel, S. (2011). Toward a Research and Action Agenda on Urban Plan-
ning/Design and Health Equity in Cities in Low and Middle-Income Countries. Journal of Urban Health: Bulletin of New York Academy of Medicine, 875-885.
Sohn, D. (2015). Residential crimes and neighborhood built environment: Assessing the effectiveness of crime prevention through environmental design
(CPTED). Cities, 86-93. Sohn, D. (2016). Do all commercial land uses deteriorate neighborbood safety?: Examining the relationship between commercial land-use mix and residential
burglary. Habitat International,148-158. State of California. (2015, November 19). Healthy Communities Data and Indicators Project. Retrieved from California Department of Public Health:
http://www.cdph.ca.gov/programs/pages/healthycommunityindicators.aspx Stoker, P., Garfinkel-Castro, A., Khayesi, M., Odero, W., Mwangi, M. N., Peden, M., & Ewing, R. (2015). Pedestrian Safety and the Built Environment: A Review
of the Risk Factors. Journal of Planning Literature, 377-392. Taylor, B., & Taylor, A. (1996). A wayfinding perspective in mental health: Generating a Psychiatric Rehabilitation Journal, 20(2), 77.
Casselberry Healthy Community Plan >> Page 97
Thoits, P. (2011). Mechanisms Linking Social Ties and Support to Physical and Mental Health. Journal of Health and Social Behavior, 52(2), 145-161 Thomson, H., Thomas, S., Sellstrom, E., & Petticrew, M. (2009). The Health Impacts of Housing Improvement: A Systematic Review of Intervention Studies
From 1887 to 2007. American Journal of Public Health, 99(Suppl 3), S681–S692. Ulrich, R. S., Simons, R. F., Losito, B. D., Fiorito, E., Miles, M. A., & Zelson, M. (1991). Stress recovery during exposure to natural and urban environments.
Journal of Environmental Psychology,11: 201-30. United States Public Health Service. (2001). The Surgeon General’s Call to Action to Prevent and Decrease Overweight and Obesity. US Department of Health and
Human Services, Public Health Service, Rockville, MD. US Department of Housing and Urban Development. (2016a). About lead-based paint. Retrieved from
http://portal.hud.gov/hudportal/HUD?src=/program_offices/healthy_homes/healthyhomes/lead US Department of Housing and Urban Development. (2016b). The healthy homes program. Retrieved from
http://portal.hud.gov/hudportal/HUD?src=/program_offices/healthy_homes/hhi US Environmental Protection Agency. (2006). Brownfields: Public health and health monitoring. Retrieved from https://www.epa.gov/sites/production/files/2015-
09/documents/finalphandbffact.pdf US Environmental Protection Agency. (2015). Petroleum Brownfields. Retrieved from http://www.epa.gov/ust/petroleum-brownfields US Environmental Protection Agency. (2016). Ten things you should know about mold. Retrieved from https://www.epa.gov/mold/ten-things-you-should-know-
about-mold Williams, S., Galster, G., & Verma, N. (2013). Home Foreclosures as Early Warning Indicator of Neighborhood Decline. Journal of the American Planning As-
sociation, 201-209. Wilson, J., & Kelling, G. (1982, March). Broken windows: The police and neighborhood safety. Atlantic Monthly, pp. 29–38. Winter Garden Comprehensive Plan 2010-2020. (2010). The City of Winter Garden. Reteieved from http://www.cwgdn.com/files/planning-and-
zoning/COMP_PLAN_ 2020.pdf Wolfe, M. K., & Mennis, J. (2012). Does vegetation encourage or suppress urban crime? Evidence from Philadelphia PA. Landscape and Urban Planning, 112-
122. Zahner, G. E., Kasl, S. V., White, M., & Will, J. C. (1985). Psychological consequences of infestation of the dwelling unit. American Journal of Public Health, 75(11),
1303-1307.