city marketing: how to promote a city? - diva
TRANSCRIPT
City Marketing: How to promote a city? The case of Umeå Authors: Amélie Balencourt Antonio Curado Zafra Supervisor: Peter Hultén Student Umeå School of Business Spring semester 2012 Master thesis, one-‐year, 15 hp

Abstract A context of increased competition between territories for attracting investments and people has led the cities to implement Marketing and Branding strategies. Those strategies should be adapted in order to fit the cities’ requirements and needs, consequently city managers and planners have to be initiated to those techniques. The city’s image is a central item here. Every possible asset of the city should be enhanced to improve people’s perception of the city (residents but also potential residents and visitors). The purpose of the present study was to identify the main points that Umeå can develop to improve its image. We needed then an insight of people’s perception of the city. Also we wanted to investigate how city planners of Umeå could use the event of hosting the European Capital of Culture event in 2014 by observing people’s perception of the event. Accordingly we designed a questionnaire and got 250 valid responses including 70 from Swedish respondents and 180 from non-Swedish respondents. The findings can be used as simple pieces of advice for the city managers and planners of the city of Umeå and also to the Umeå Capital of Culture event’s staff. To conduct our survey, we used a quantitative method and a non-probability sampling technique: the convenience one. The two versions of our questionnaire (in English and in Swedish) are composed of 28 questions divided identically in 3 parts (the first one being about the general image of the city, the second one being about the city’s performances in specific areas and the third one being about the European Capital of Culture event). We used mainly Likert-scales questions (composed of 5 items with 1 being “Totally Disagree” or “Not important at all” and 5 being “Totally Agree” or “Very Important”). We found that among the areas investigated, culture had the greater impact on people’s perception of the city. So promoting cultural activity is a great ingredient in the “city-marketing mix”. Also the perception of the city’s economy can influence the image of this same city. Finally tourism is also a significant element of the “city-marketing mix” since it allows the image of the city to be spread all over the world. Keywords: Destination Marketing, City Marketing, ECC (European Capital of Culture), Umeå and Perception of the City.

Acknowledgements This Master thesis has been guided at the Marketing department of Umeå School of Business (USBE) during spring 2012. In this part, we would like to express our gratefulness to the persons that helped us in this project. Writing this thesis has been a great experience for us since we have been into a subject in greater depth and have acquired interesting knowledge about it. Also we improved our way to find information and to use it in our work. We were lucky to have at our disposal the very complete library resources of Umeå University, which helped us to find accurate and relevant information to develop our study. More specifically now, we would like to thank our supervisor Peter Hultén for the time spent with us to guide us in the right path. Then, we would like to thank the entire Marketing department in USBE, which attended us when we needed help. Finally, we give all our gratitude to Emina Averin, student of Umeå University, for helping us to translate our questionnaire in Swedish and to every of our respondents without which this study would have been impossible. We cannot forget the support of our family, friends and people that believed in us. Umeå, May 31, 2012 Amélie Balencourt Antonio Curado Zafra
Table of contents
Part 1: Introduction ........................................................................................................................ 1 1.1Background ........................................................................................................................................................... 1 1.2 Problem Discussion .......................................................................................................................................... 2 1.3 Knowledge Gap .................................................................................................................................................. 3 1.4 Purpose of the study ........................................................................................................................................ 4 1.5 Delimitations ....................................................................................................................................................... 4 1.6 Authors Background ........................................................................................................................................ 4 1.7 Thesis outline ...................................................................................................................................................... 5
Part 2: Literature Review .............................................................................................................. 6
2.1 The city and its development ....................................................................................................................... 6 2.2 From Marketing to City Marketing ............................................................................................................ 7 2.3 Terms Definition ................................................................................................................................................ 7 2.4 Destination Marketing .................................................................................................................................... 8 2.5 Management of City Branding ..................................................................................................................... 9 2.6 Examples of implementation of City Branding or Marketing theories ................................... 10 2.7 Key actors in the City .................................................................................................................................... 11 2.8 The image of the City .................................................................................................................................... 13 2.9 Conceptual framework and hypotheses ............................................................................................... 15
Part 3: Methodology .................................................................................................................... 18
3.1 Approach and philosophical standpoints ............................................................................................ 18 3.2 A quantitative method ................................................................................................................................. 19 3.3 Research Design .............................................................................................................................................. 20 3.4 About Data Collection and Sample Selection ..................................................................................... 20 3.5 Factor Analysis ................................................................................................................................................ 22 3.6 Questionnaire Design ................................................................................................................................... 23 3.7 Pre-‐test ............................................................................................................................................................... 25 3.8 Quality Criteria ................................................................................................................................................ 25 3.9 Ethical assumptions ...................................................................................................................................... 26 3.10 About Literature .......................................................................................................................................... 27
Part 4: Empirical Findings and Analysis ............................................................................... 28 4.1 Respondents’ Demographics ..................................................................................................................... 28 4.2 Measurement validity .................................................................................................................................. 30 4.3 General findings .............................................................................................................................................. 31 4.3.1 Investments and infrastructures in the city ............................................................... 33 4.3.2 Education in the city ............................................................................................................. 35
4.3.3 Tourism in the city ................................................................................................................ 37 4.3.4 Culture and the European Capital of Culture event ................................................ 38 4.3.5 Factor analysis ........................................................................................................................ 40
4.4 Comparisons between International and Swedish respondents ............................................... 40 4.4.1 About investments and infrastructures ....................................................................... 42 4.4.2 Education .................................................................................................................................. 42 4.4.3 Tourism ...................................................................................................................................... 42
4.4.4 Culture ........................................................................................................................................ 43
Part 5: Discussion ......................................................................................................................... 45 5.1 Analysis procedure ........................................................................................................................................ 45 5.2 Economy, education, tourism and culture towards the perception of the city ................... 46 5.2.1 Economy .................................................................................................................................... 46
5.2.2 Education .................................................................................................................................. 46 5.2.3 Tourism ...................................................................................................................................... 47 5.2.4 Culture ........................................................................................................................................ 47
5.3 Evaluation of the conceptual framework ............................................................................................. 48 Part 6: Conclusion ......................................................................................................................... 50
6.1 General conclusions ...................................................................................................................................... 50 6.2 Implications ...................................................................................................................................................... 51 6.3 Limitations ........................................................................................................................................................ 52 6.4 Further research ............................................................................................................................................. 52
References ....................................................................................................................................... 53
Appendixes :
- Appendix 1: English questionnaire - Appendix 2: Swedish questionnaire - Appendix 3: Additional elements multiple regression analysis (investments and
infrastructures variables) - Appendix 4: Additional elements multiple regression analysis (education variables) - Appendix 5: Simple regression analysis (education variable) - Appendix 6: Additional elements multiple regression analysis (tourism variables) - Appendix 7: Additional elements multiple regression analysis (culture variables) - Appendix 8: Crosstabs between nationality and economy - Appendix 9: Crosstabs between nationality and education - Appendix 10: Crosstabs between nationality and tourism - Appendix 11: Crosstabs between nationality and culture
List of Figures : - Figure 1: Outline of the thesis ...................................................................................... 5 - Figure 2: Example of brands box ............................................................................... 10 - Figure 3: The actors of the city .................................................................................. 12 - Figure 4: The perceptual process ............................................................................... 13 - Figure 5: Conceptual framework ................................................................................ 14 - Figure 6: Nationality of the responders ...................................................................... 28 - Figure 7: Composition of the Swedish sample ........................................................... 29 - Figure 8: Gender distribution ..................................................................................... 29 - Figure 9: Age of the responders ................................................................................. 30

- Figure 10: Frequency distribution of the perception variable ...................................... 32 - Figure 11: Simplified pie chart of the perception variable ........................................... 33 - Figure 12: Cross-tab´s outcome between “Umeå has a strong economy” and
nationality variables .................................................................................... 40 - Figure 13: Cross-tab´s outcome between “Umeå University is a good incentive for
student come in the city” and nationality variables .................................... 41 - Figure 14: Cross-tab´s outcome between “Umeå has a great touristic potential” and
nationality variables .................................................................................... 42 - Figure 15: Cross-tab´s outcome between “What is the point that should be highlighted
for the ECC 2014 event” and nationality variables .................................... 43 - Figure 16: Revised conceptual framework ................................................................... 45
List of Tables - Table 1: Division and characteristics of the responders ............................................. 21 - Table 2: Questionnaire´s summary and structure ....................................................... 23 - Table 3: Alpha coefficients for each part of the questionnaire .................................. 31 - Table 4: Components of the perception variable ....................................................... 31 - Table 5: Alpha coefficient of the perception variable ................................................ 32 - Table 6: Independent variables in testing hypothesis 1 and 2 .................................... 33 - Table 7: Alpha coefficient of the investment and infrastructures variables´ set ........ 34 - Table 8: Model summary of the regression analysis between perception (dependent)
and investment and infrastructure variables ................................................. 34 - Table 9: Multiple regression analysis between perception (dependent) and economy
variables ........................................................................................................ 35 - Table 10: T-test between the Swedish and Other´ samples for the education variable 36 - Table 11: Independent variables in testing hypothesis 3 .............................................. 37 - Table 12: Alpha coefficient for the tourism variables´ set ........................................... 37 - Table 13: Model summary of the regression analysis between perception (dependent)
and tourism variables ................................................................................... 37 - Table 14: Multiple regression analysis between perception (dependent) and tourism
variables ....................................................................................................... 38 - Table 15: Independent variables in testing hypothesis 4 .............................................. 38 - Table 16: Alpha coefficient for the culture variables’ set ............................................ 39 - Table 17: Model summary of the regression analysis between perception (dependent)
and cultural variables ................................................................................... 39 - Table 18: Multiple regression analysis between perception (dependent) and cultural
variables ...................................................................................................... 39 - Table 19: Rotated component matrix (Varimax) ........................................................ 40 - Table 18: Divided model summary of the regression analysis between perception
(dependent) and culture variables ................................................................ 47 - Table 19: ANOVA table .............................................................................................. 48
1
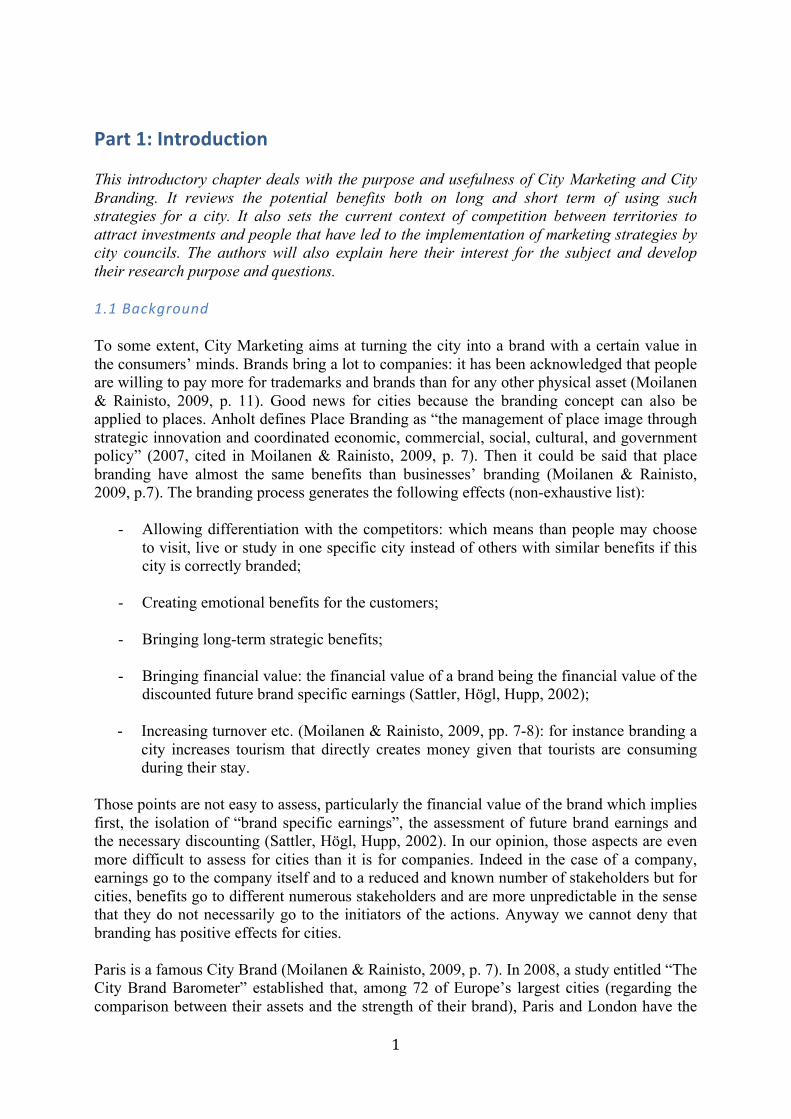
Part 1: Introduction This introductory chapter deals with the purpose and usefulness of City Marketing and City Branding. It reviews the potential benefits both on long and short term of using such strategies for a city. It also sets the current context of competition between territories to attract investments and people that have led to the implementation of marketing strategies by city councils. The authors will also explain here their interest for the subject and develop their research purpose and questions. 1.1 Background To some extent, City Marketing aims at turning the city into a brand with a certain value in the consumers’ minds. Brands bring a lot to companies: it has been acknowledged that people are willing to pay more for trademarks and brands than for any other physical asset (Moilanen & Rainisto, 2009, p. 11). Good news for cities because the branding concept can also be applied to places. Anholt defines Place Branding as “the management of place image through strategic innovation and coordinated economic, commercial, social, cultural, and government policy” (2007, cited in Moilanen & Rainisto, 2009, p. 7). Then it could be said that place branding have almost the same benefits than businesses’ branding (Moilanen & Rainisto, 2009, p.7). The branding process generates the following effects (non-exhaustive list):
- Allowing differentiation with the competitors: which means than people may choose to visit, live or study in one specific city instead of others with similar benefits if this city is correctly branded;
- Creating emotional benefits for the customers;
- Bringing long-term strategic benefits; - Bringing financial value: the financial value of a brand being the financial value of the
discounted future brand specific earnings (Sattler, Högl, Hupp, 2002); - Increasing turnover etc. (Moilanen & Rainisto, 2009, pp. 7-8): for instance branding a
city increases tourism that directly creates money given that tourists are consuming during their stay.
Those points are not easy to assess, particularly the financial value of the brand which implies first, the isolation of “brand specific earnings”, the assessment of future brand earnings and the necessary discounting (Sattler, Högl, Hupp, 2002). In our opinion, those aspects are even more difficult to assess for cities than it is for companies. Indeed in the case of a company, earnings go to the company itself and to a reduced and known number of stakeholders but for cities, benefits go to different numerous stakeholders and are more unpredictable in the sense that they do not necessarily go to the initiators of the actions. Anyway we cannot deny that branding has positive effects for cities. Paris is a famous City Brand (Moilanen & Rainisto, 2009, p. 7). In 2008, a study entitled “The City Brand Barometer” established that, among 72 of Europe’s largest cities (regarding the comparison between their assets and the strength of their brand), Paris and London have the

2
best assets and brands to match (Saffron Consultants, 2008). The branding effects for Paris are such than people are willing to go there even if they know nothing about the city. Paris remains the most visited capital in the world even if it is also considered as one of the less welcoming and one of the most expensive. More specifically now, efficient city marketing and city branding strategies can only be positive for the city of Umeå which is now in a development process. The main instigators of the Umeå 2014 project expect that this year will serve as a “catalyst” in their overall process aiming at:
- “Promoting human growth”; - “Strengthening the role of culture as a driving force for sustainable development, and
reinforce the international relations and dimensions of cultural life” (Umeå 2014, 2010).
The previous statements may sound a bit superficial and idealistic in the sense that they do not really mean something concretely measurable but it’s obvious that there are other hidden objectives including economic and financial ones. Being a candidate and then being elected to host the Capital of Culture event costs a lot, and, as any investment, it should generate benefits (both tangible and intangible). Between 1985 and 2001 the selected European Capitals of Culture have been dedicating at least 9 million euros (budget of the city of Amsterdam in 1987) and up to 285 million euros to this event (budget of the city of Thessaloniki in 1997) (Richards & Wilson, 2004, p. 1939). It becomes obvious then that growth is expected from this investment. 1.2 Problem Discussion Nowadays, cities around the world are trying to show the best possible image. There is a strong competition between them to position themselves in the top of cities’ ranking in the world, country, region or area. But, the main success factor to achieve this goal is to know what point that the city should enhance or on which segment of the market it needs to focus. Marketing is a tool used by the cities to develop corresponding strategies. The image of a city alone can differentiate this city from another one. Actually, the cities understood that and invest wider budget for this purpose. However a city brand is not easy to build and every city does not have the abilities to achieve it. This is the core of the real problem: to build an image or a brand is neither an easy nor a rapid process. It is very easy for example to be mistaken in the elaboration of a strategy or to focus on an inaccurate aspect (with deceptive or insufficient effects). Therefore, deep investigation is the basis to build a good city brand or image. According to Aakers (2002) the most dangerous pitfall is the tendency to define organizations by their products instead of by the customer’s basic needs, wants and demands. Levitt (1960) called that marketing myopia. The city must have identified which are the potential customers to communicate with them and satisfy them. Van den Berg and Braun (1999, p. 987) distinguish four general categories of customers: (potential) residents, (potential) companies, (potential) visitors and (potential) investors. Observing other studies about destination marketing or city branding, we established that the main areas where the city of Umeå needs to have relevant strategies are the following: economy, education, culture and tourism. Umeå has a solid industry sector with more than
3
12.000 companies established in the region. Also, the engineering industry, the Information and Technologies’ sector and the medical and biotechnologies’ sector are getting stronger and provide innovation abilities and knowledge, which are success’ factors in the market. Concerning the higher education sector, the city has two universities: Umeå University and the Swedish University of Agricultural Sciences and 8 University Colleges. Umeå University, with its 35,000 students is the biggest one in Norrland. The wide offer and quality of the courses (more than 150 programs and 2,000 courses) and staff have turned this institution into one of the most important in the region (Umeå 2014, 2010). However, if we consider history as a part of culture, some may think that the city of Umeå has some weaknesses from this side since it does not have a long or famous history. Also, the city may lack of some monuments or architectural heritage since it has been burned by Russian troops in 1714 and 1720 (Umeå, 2009). But, as culture is an on-going process, the city is actually trying to counterbalance this by creating new activities as festivals, concerts or any type of cultural event and dedicates places like museums to contemporaneous art and culture, etc. Finally, Umeå is quite far from the center of Europe, and is near to the Article Circle Polar. But the landscape around the city is idyllic. Natural environment, lake, trees, animals etc. represent an interesting potential to attract tourists. In addition, it is interesting to mix forest and snow activities. Umeå is original in the sense that it belongs to Europe while being very close to the Arctic Circle, thus it should exploit this to the maximum as well as the contribution of the Norrland culture and the Sami people. We will concentrate our analysis on getting information and developing different ideas or strategies that the city can follow to strengthen its image and the awareness of people about it. This study does not pretend to develop a theory or model, but rather to elaborate some tips for the city of Umeå. 1.3 Knowledge Gap The literature shows that there are many studies on tourism marketing and variety of theories and models to analyze this phenomenon. But when it comes to city and destination marketing, the number of studies and knowledge diminishes considerably. In addition to that most of those materials concerns large and famous cities benefiting from a worldwide reputation. However city marketing and destination marketing can also be used to enhance the activity of small cities or regions. This is what we actually miss in our literature review, and particularly if we talk about marketing of Nordic countries’ places. In the existing literature, we see that places use image and branding to develop strategies to be followed in order to position themselves successfully in the market (Anholt, 2004, p. 28). Now, seeing the lack of information on destination marketing plan in small towns and more specifically in Nordic towns, we would like to offer some contribution by analyzing what effect does an event like the European Capital of Culture in 2014 can have on a city of this type (focusing in the case of the city of Umeå). Especially we want to investigate how the city can use this event to be released to the rest of Europe. The contribution of this study is focused on detecting the particular points that should be enhanced in this small town so that it becomes a “reference” in Norrland and an attractive city for the rest of Europe or even for the world, using the image as a trademark of the city and the event of a European city of culture in 2014 to reinforce it.

4
1.4 Purpose of the Study The main aim of this study is to identify the principal points that must be developed by Umeå to improve its image. This information will be collected from our sample composed of people living or studying in the city. Also we are going to investigate how people perceive that Umeå can use the European Capital of Culture event in 2014 as a showcase. We expect to be able to develop some assumptions about possible strategies while highlighting specific points to be thought in order to improve the image of the city and to make it interesting as a destination. The purpose of this study will be reached by answering the following research questions (RQ): RQ1: What is the general image that people have about Umeå? RQ2: What are the key points to focus on in order to improve the image of the city of Umeå? RQ3: In people’s mind, what asset of the city of Umeå should be highlighted during the European Capital of Culture event in 2014? 1.5 Delimitations It is very important to define the boundaries of the research. In our case, destination marketing constitutes the basis of our study and the use of branding techniques to promote the city is seen as a special application of destination marketing. Also some may wonder: why not choosing a bigger city already benefiting from an international or at least a European recognition? Effectively, Umeå’s recognition is quite low compared to other European cities and this, even in its own country (the other city designated to be a European Capital of Culture alongside with Umeå is Riga: Latvia’s capital and largest city and important economical, financial and cultural center in the Baltic Sea region). The answer is simple: we actually think that the process of marketing the city is all the more interesting at this stage that the amount of challenges that local actors have to take up is important. Furthermore, it is also a convenience choice given that we are currently studying here and consequently we have some clues about the topic and we also have access to data collection from the locals. Also, studying city marketing from such an atypical city will allows us to draw comparisons with more known ones. Also, we defined the area to be investigated based on macroeconomic features: economy, education, tourism and culture. Focusing on these areas can be more productive than trying to cover all other areas. 1.6 Authors Background The authors studied different programs in different countries but share a background in business studies with a special interest in Marketing. That’s why they became interested in the subject of City Marketing, interest increased by the fact of living in a city in the core of a development process and therefore likely to use city marketing techniques. Also, the subjects that they studied here at Umeå University have provided them additional useful knowledge to proceed to the elaboration of this dissertation. One of the author studied a Master in Business Development and Internationalization where he has been initiated to the concepts of managing networks (helpful in the understanding of partnerships’ functioning), to
5
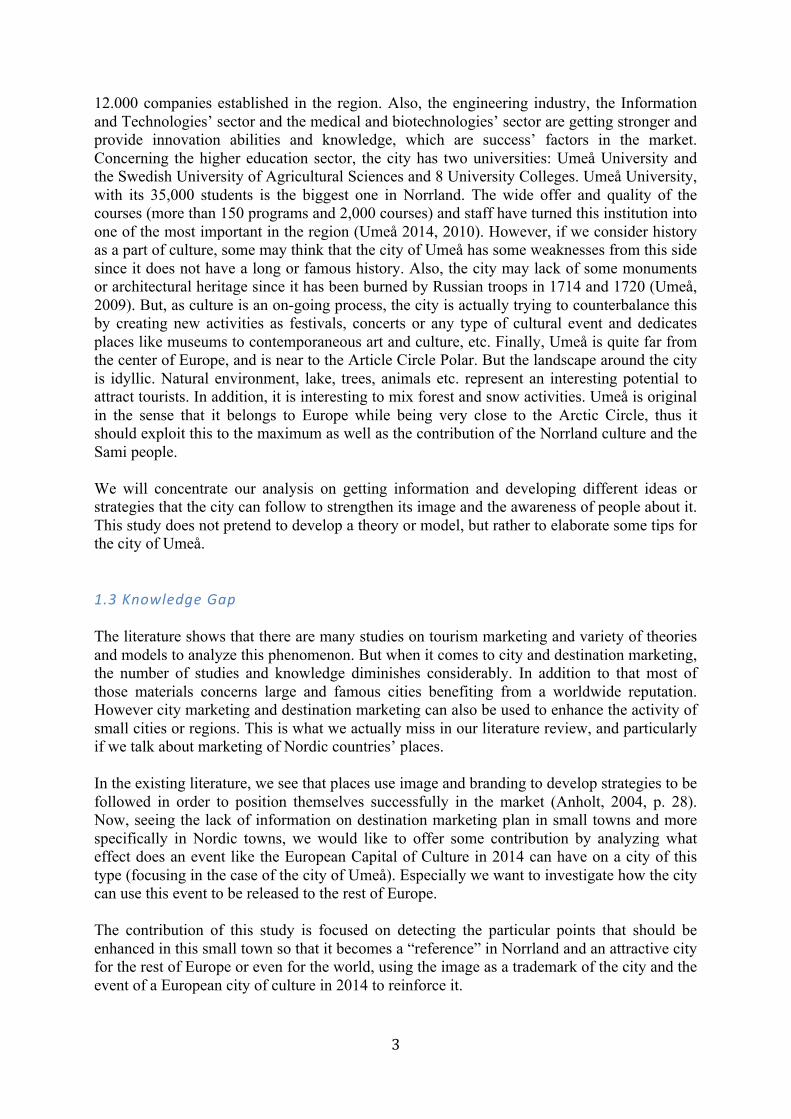
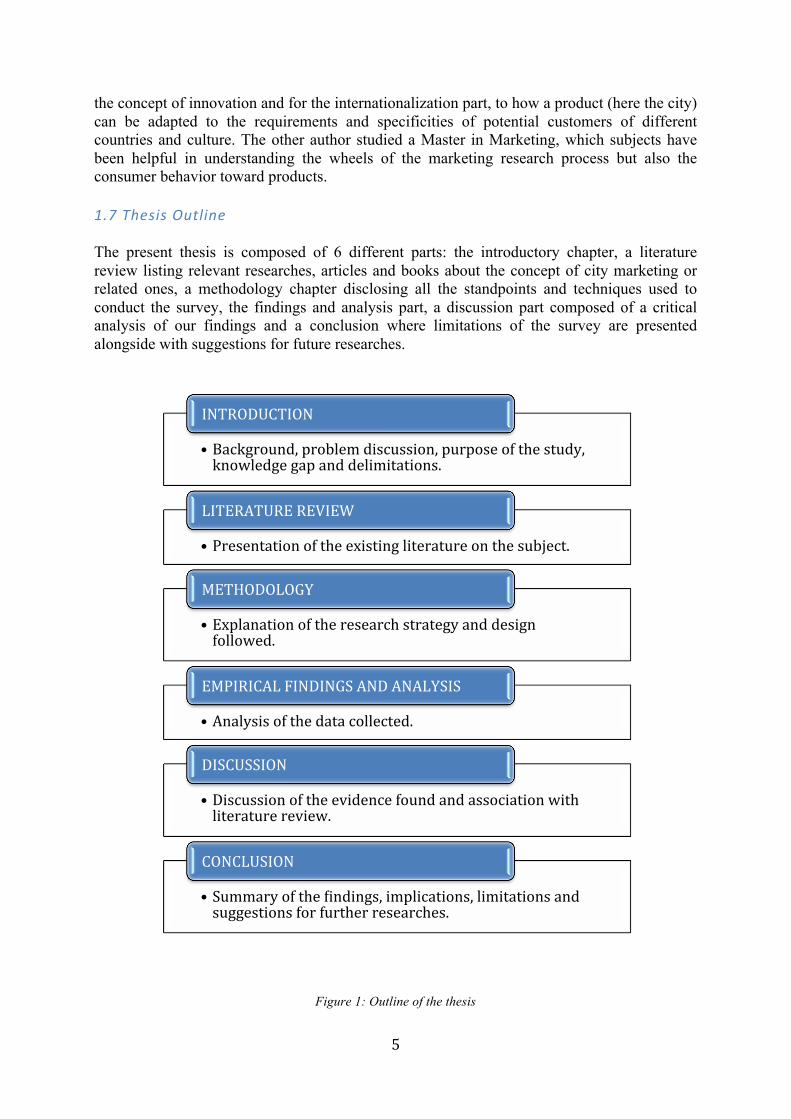
the concept of innovation and for the internationalization part, to how a product (here the city) can be adapted to the requirements and specificities of potential customers of different countries and culture. The other author studied a Master in Marketing, which subjects have been helpful in understanding the wheels of the marketing research process but also the consumer behavior toward products. 1.7 Thesis Outline The present thesis is composed of 6 different parts: the introductory chapter, a literature review listing relevant researches, articles and books about the concept of city marketing or related ones, a methodology chapter disclosing all the standpoints and techniques used to conduct the survey, the findings and analysis part, a discussion part composed of a critical analysis of our findings and a conclusion where limitations of the survey are presented alongside with suggestions for future researches.
Figure 1: Outline of the thesis
• Background, problem discussion, purpose of the study, knowledge gap and delimitations.
INTRODUCTION
• Presentation of the existing literature on the subject.
LITERATURE REVIEW
• Explanation of the research strategy and design followed.
METHODOLOGY
• Analysis of the data collected.
EMPIRICAL FINDINGS AND ANALYSIS
• Discussion of the evidence found and association with literature review.
DISCUSSION
• Summary of the bindings, implications, limitations and suggestions for further researches.
CONCLUSION
6
Part 2: Literature Review In this part we present relevant pieces of literature about our area of interest. Those different parts will be used to elaborate a conceptual framework and will be related later to our findings. Van den Berg and Braun’s model about the potential customers of a city will be presented. This model helped us to build a theoretical framework on which we based our hypotheses and our questionnaire. 2.1 The City and its development Even if some agree that the term “city” may be difficult to define, the city can be viewed as a relatively permanent and highly organized center of population, of greater size or importance than a town or village and designate urban communities by virtue of some legal or conventional distinction. In most cases, the concept of city refers to a particular type of community, the urban community and its culture, known as urbanism (Britannica, 2012). Etymologically, the term derived from the old French cite, from Latin civitas from civis: citizen. There is no real consensus about the reasons why people began to gather and form cities. Researchers from the Oriental Institute of Chicago suggest that the birth of the first cities in Mesopotamia around years 4000 to 3500 B.C may arise from the lack of rainfall requiring people to organize themselves and build canals for irrigation purposes or from protection needs in plain areas (The Oriental Institute, 2012). In a paper by V. Gordon Childe (1950, cited in Michael E. Smith, 2009, p. 10), early cities match a ten-criteria model. Those ten criteria are a set of characteristics developed by Gordon Childe for urban planning purposes. This model gathers the following features: consequent size and density of population, differentiation of the residents’ functions, payment of taxes, existence of monumental public buildings displayed as distinction symbols, existence of a “ruling class”, the “writing” knowledge, the elaboration of exact and predictive sciences and finally the concept of art. Interestingly we still observe similar frameworks and development axes in our modern cities (even if a great number of additional features turn them to be a lot more complicated than before). Indeed the size of the city still matters and can be a source of competitive advantage as size of the city implies the presence of infrastructures, services etc. City dwellers also have different jobs and functions more or less in relation with the functioning of the city. They pay taxes. Monuments are still symbols for the cities. Concerning the “ruling class” of Childe’s model, we can say that it still exist in the form of some “officials” that establish sets of administrative and other rules. In the same way we could assume that writing now symbolizes a spreading-knowledge will that can be associated with clusters of knowledge and competencies (in universities, research centers and all academic institutions in general). Finally art and more generally culture still constitutes an important part of the city’s life. What can be retrieved from this comparison is that cities have always had almost the same growing motivations and functioning model. However now, there is competition between them to attract people and investments.

7
2.2 From marketing to city marketing Kotler and Keller summarize the marketing notion as the action of “meeting needs profitably”. In a more detailed way they define it as “an organizational function and a set of processes for creating, communicating, and delivering value to customers and for managing customer relationships in ways that benefit the organization and its stakeholders” (Kotler & Keller, 2009, p. 45). One of the most famous implementation tools of marketing is called the marketing-mix elaborated by McCarthy in 1960 and is constituted of the following components: Product – Price – Promotion – Place. This marketing-mix tool (as well as several other ones) has been and is still implemented in the majority of businesses at a more or less important level. Big companies have marketing departments while smaller ones may include at least one representative of the marketing function in their staff or entrust this function to other employees in a less official way. Marketing can be thus perceived as an important part of businesses’ activities even if there are controversies about the usefulness of marketing departments. However some researchers identified opportunities for them to use marketing to other purposes than pure businesses ones, for instance here to cities. The implementation of marketing tools, theories and concepts to complex entities such as cities is not something obvious. It has been turned possible with the progressive broadening of the concept of marketing, thus seen as a “useful business heritage” (Kotler & Levy, 1969, p.15). Kotler and Levy expressed the utility for public organizations (“non purely companies”) to implement marketing tools as development tools for universities, churches, politic movements etc. This is due to their similarities with business organizations. Indeed, those organizations need to maximize their benefits towards their costs, they need to communicate/ advertise themselves and define target groups and they need a broader definition of what they offer (for instance cosmetics can be seen as beauty, soap as cleaning/ thus the city can be seen as work opportunities or entertainment regarding what you are looking for. Also those organizations (cities as well) are sensitive to change and consequently have to re-determine their objectives and resources. So this article signaled the switch from a traditional view of marketing as a business activity to a larger vision including areas previously seen as public relations. It meant then opportunities for marketers to prove their talent in those new areas. However, and Kotler already mentioned it in his article previously discussed, there must be differences in the effective marketing planning between organizations as cities and companies. For example, marketing in businesses is a task for one department or one manager whereas there are multiple performers in cities. In the book “How to brand nations, cities and destinations”, Teemu Moilanen and Seppo Rainisto underline the differences and the challenges in Place Branding compared to products and services’ branding (Moilanen & Rainisto, 2009, pp. 19-22). 2.3 Terms definition Apart from organizations, the broadening of the marketing concept has allowed it to be applied to geographical entities. From there arise the concepts of Destination Marketing (also called Place marketing) that will be defined in the next part and City Marketing, among

8
others. Here, the authors perceive City Marketing as a special application of Destination Marketing. City marketing is the promotion of a city, or a district within it, with the aim of encouraging certain activities to take place there. It is used to alter the external perceptions of a city in order to encourage tourism, attract inward migration of residents, or enable business relocation. A significant feature of city marketing is the development of new landmark, or 'flagship', buildings and structures (Smyth & Hedley, 1994, pp. 2-3). City marketing can be seen as one of the results of the introduction of non-profit marketing, which allows the definition of marketing to be broadened. It is thus related to an increasing demand from public sector for marketing concepts (Tross, 2006). Another definition by the American Marketing Association (AMA) is the coordinated use of marketing tools supported by a shared customer-oriented philosophy, for creating, communicating, delivering, and exchanging urban offerings that have value for the city’s customers and the city’s community at large (Braun, 2008, p.43). Those two definitions fit our view of the concept of City Marketing and complete each other. City marketing management is the process of setting marketing goals for a city, the planning and execution of activities to meet these goals, and measuring progress toward their achievement. 2.4 Destination Marketing Brands are very important for companies. They can be defined as “the sum of all tangible and intangible elements, which makes a selection unique” (Moilanen & Rainisto, 2009, p. 6). They yield a lot to companies and worth sometimes more than the companies’ physical assets. Aaker developed a brand equity measurement model composed of five factors that can also be implemented to places. Those factors are the following: brand awareness, brand loyalty, brand image, perceived quality, brand associations and property rights (Aaker, 1996, in Moilanen & Rainisto, 2009, p. 12). Branding a city offers a lot of advantages within a destination marketing strategy, especially when it comes to the outside image of the city. A place brand can behave just like a manufacture´s brand, providing an umbrella of trust, a guarantee of quality, which kick-starts the entry of its new “sub-brands” on the marketplace (Anholt, 2004, p. 26). The city is not exactly similar to a manufactured company´s brand but sometimes the techniques used are similar. That’s why we can link manufacture´s brand and place’s brand. As Anholt mentioned businesses have to create loyalties; loyalties of the workforce, loyalties of suppliers, loyalties of the communities in which they operate, loyalties of investors and loyalties of customers and the cities have to create myths, special languages, environment that reinforce loyalties, colors, symbols, and quasi-historical myths (Anholt, 2004). The techniques are similar but the skills for the different business models are not the same. The importance to display a good and coherent image of the city is huge, that’s why culture must be related to the city image abroad. However, building or changing the image of a city is a long and complicated process. Indeed time is needed for the image to be accepted and recognized among the target public or to be accredited a new value (comparison with the information received before). Also, the image should be homogeneous and coherent to be accepted with more efficiency. Another difficulty is that the perception of the people can change more quickly that the manager would

9
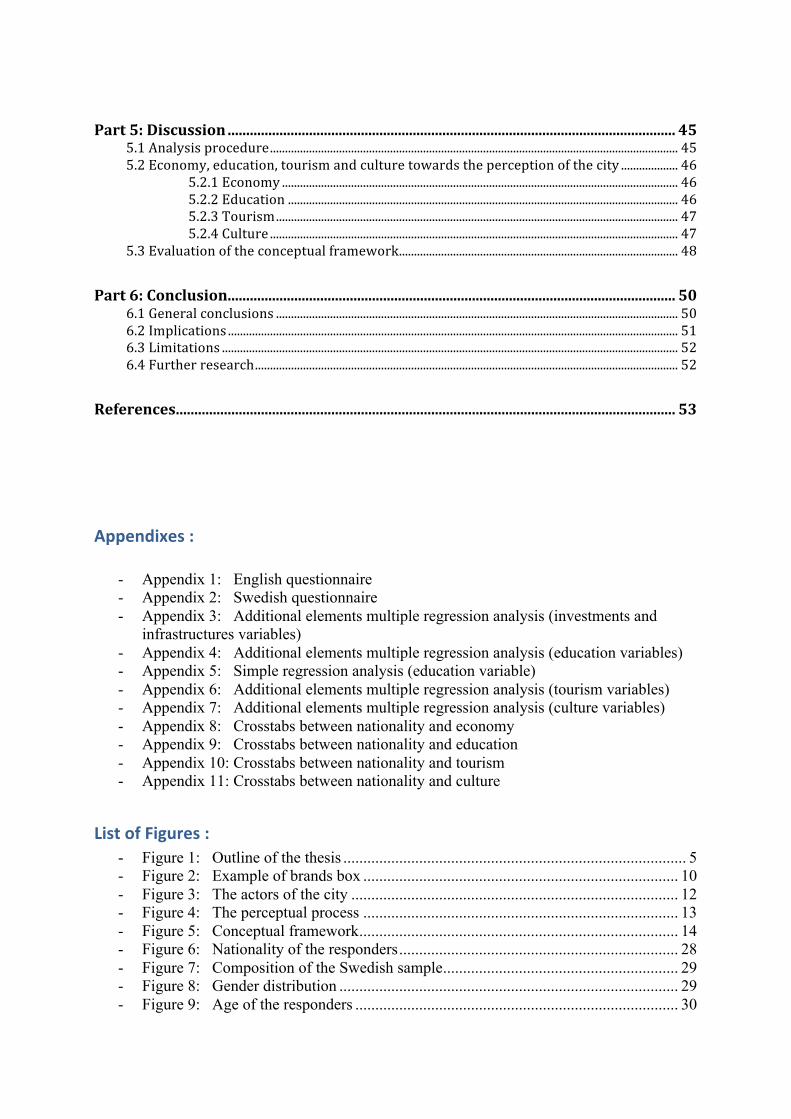
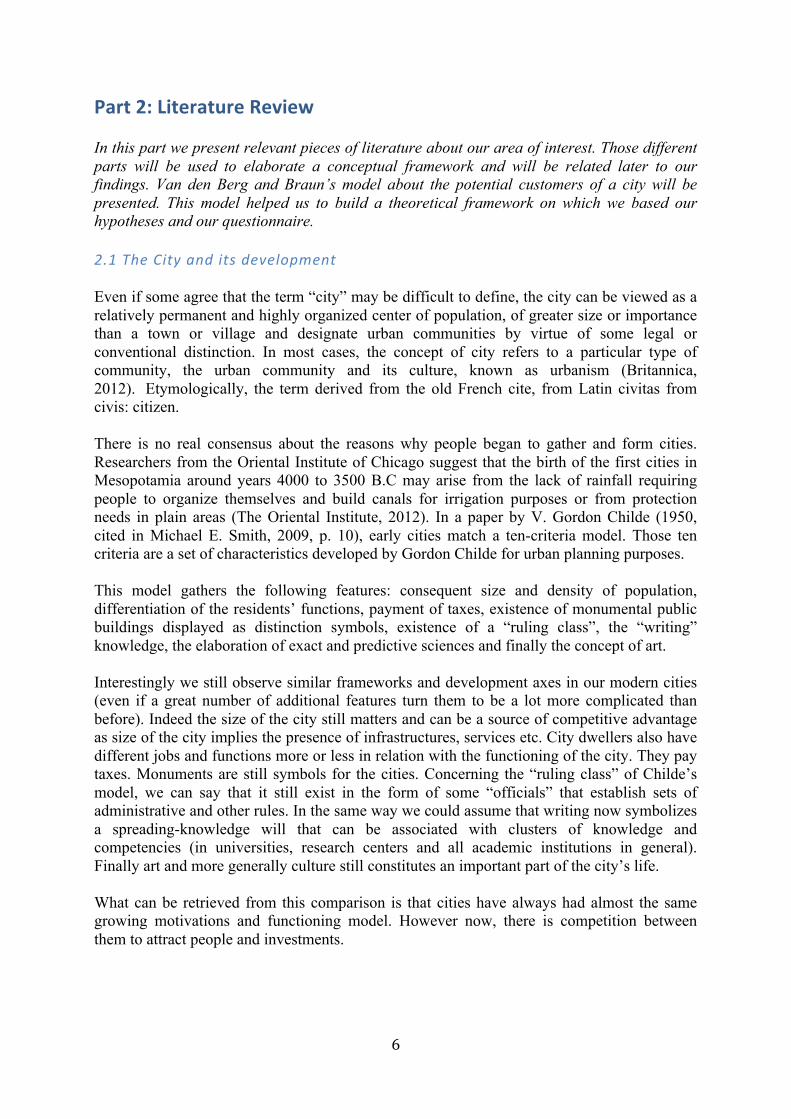
imagine. This is the reason why city´s brand must be coherent and clear in the beginning and try to the maximum to avoid big changes over time (Anholt, 2004). Another possible problem that Anholt mentions concerning the process of building a city brand is the lack of objectivity. This problem can occur when the manager of the city brand is born in the same city. The manager should be impartial and recognize the strengths and weaknesses of the place and not focus only in the existing strengths. Effectively, partiality results in a “blindness” problem which consequences can be difficult to recover in the future (Anholt, 2004, p. 35). To avoid those problems, it is necessary to follow a strategic image management. It is defined as the ongoing process of researching a place´s image among its audiences, segmenting and targeting its specific image and its demographic audiences, positioning the place´s benefits to support an existing imagine or create a new image, and communicating those benefits to the target audiences (Kotler et al., 1993, cited in Kotler & Gertner, 2004, p. 47). The first question in this process is: Can this place or city be a brand? Kotler and Gertner refer to “country equity” standing for the emotional value resulting from customers´ association of a place or city brand as one assessing tool for that. In other word, it is constituted of the values that the people can link with the city and the importance that they give to them (Kotler & Gertner, 2004, p. 41). Yet strategies cannot be the same for every city since each city has its own interests and features. Kotler and Gertner have made a differentiation of potential tourism segments that have been proven interesting for tourists, such as natural beauty, sun, adventure, gaming, events/sports or culture/history. Seasonality can also segment the market by customer´s characteristics or by benefits (Kotler et al., 1993, cited in Kotler & Gertner, 2004, p. 48). 2.5 Management of city branding The image of a city is one of the most important success factors in tourism (Kampshulte, A., 1999, p. 235). A good management and implementation of this concept can make the city realize what is the image that tourists have of it. Knowing this, the city can act to keep that line or trying to change its image. The authors De Chernatony and McWilliam developed in their article: The Strategic Implications of Clarifying How Marketers Interpret" Brands " a strategy for the brand management of companies. Even if the model is made for commercial companies, it can also be used in the brand management of tourism and city image. The aim of this model is to understand what position a brand can adopt to be visible to consumers. To determine this, the authors developed a four-cell matrix, which measured two dimensions of the brand: functionality and “representationality” (de Chernatony & McWilliam, 1989, p. 165). The first dimension, labeled “functionality”, measured the performance capability of the brand based on its physical attributes. The second dimension, labeled “representationality”, measured the expressive nature of the brand, and the beliefs and meanings with which it was associated. This map represents the current situation for marketing managers, and a directional tool for the strategic decision to build. There they can see if they need to maintain or reduce either dimension (de Chernatony & McWilliam, 1989, p. 166):
10
Functionality
High
High R – Low F
High R – High F
Low
Low R – Low F
Low R – High F
Low High
Representationality Figure 2: Examples of brands box, source: De Chernatory & McWilliam If we adapt this model to city branding, when a city wants to be perceived as highly functional, it is important to develop physical attributes such as: infrastructures, monuments, places of interest, etc. On the other hand, representationality refers to what the city wants to transmit. A city is not only of interest for its history, culture or landscape. A city can enhance its quality of life, economy, tourism, activities, etc to represent something. As discussed above, the representationality of a city is achieved by the actions or decisions made. It is very important for a city define clearly its image to attract potential residents or visitor. 2.6 Examples of implementation of places’ branding/marketing theories In this part we want to talk about two examples of places’ brand management in Scandinavia (for the two first cases) and in United Kingdom for the third case. The aim is to provide insights into brand development and management practice. Analyzing the steps followed by these cities can help us to sort out common success factors to them. We have chosen those three different cases of branding because they concern different aspects: economy, education and tourism. The first case is about Copenhagen’s branding and the way to develop its economic sector. It is considered as one of the earliest implementation case of marketing strategies for a city. Copenhagen decided to invest DKK 20 million annually in city marketing because studies revealed that the city did not have the image of an attractive place in which people were willing to live or invest (Moilanen & Rainisto, 2009, p. 87). Consequently, urban managers analyzed the strengths and core capabilities of the city by comparing it with other cities, for instance Stockholm and Amsterdam and the research reveled that those cities have the same
11
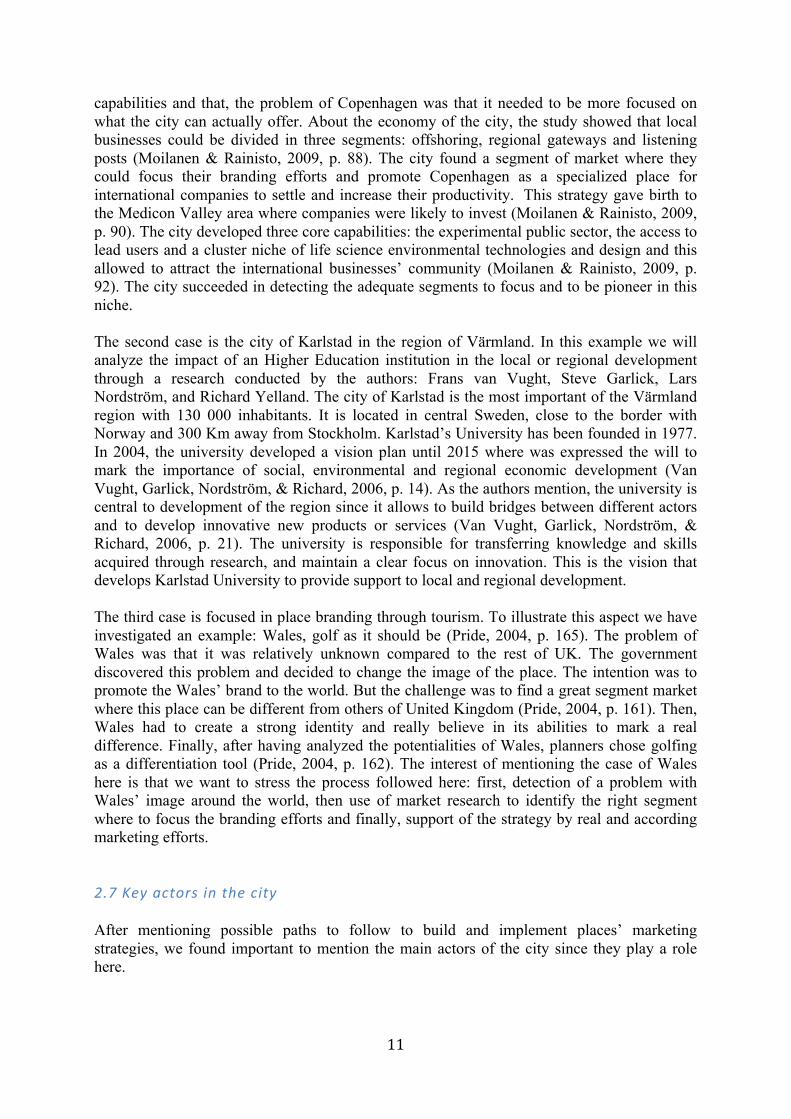
capabilities and that, the problem of Copenhagen was that it needed to be more focused on what the city can actually offer. About the economy of the city, the study showed that local businesses could be divided in three segments: offshoring, regional gateways and listening posts (Moilanen & Rainisto, 2009, p. 88). The city found a segment of market where they could focus their branding efforts and promote Copenhagen as a specialized place for international companies to settle and increase their productivity. This strategy gave birth to the Medicon Valley area where companies were likely to invest (Moilanen & Rainisto, 2009, p. 90). The city developed three core capabilities: the experimental public sector, the access to lead users and a cluster niche of life science environmental technologies and design and this allowed to attract the international businesses’ community (Moilanen & Rainisto, 2009, p. 92). The city succeeded in detecting the adequate segments to focus and to be pioneer in this niche. The second case is the city of Karlstad in the region of Värmland. In this example we will analyze the impact of an Higher Education institution in the local or regional development through a research conducted by the authors: Frans van Vught, Steve Garlick, Lars Nordström, and Richard Yelland. The city of Karlstad is the most important of the Värmland region with 130 000 inhabitants. It is located in central Sweden, close to the border with Norway and 300 Km away from Stockholm. Karlstad’s University has been founded in 1977. In 2004, the university developed a vision plan until 2015 where was expressed the will to mark the importance of social, environmental and regional economic development (Van Vught, Garlick, Nordström, & Richard, 2006, p. 14). As the authors mention, the university is central to development of the region since it allows to build bridges between different actors and to develop innovative new products or services (Van Vught, Garlick, Nordström, & Richard, 2006, p. 21). The university is responsible for transferring knowledge and skills acquired through research, and maintain a clear focus on innovation. This is the vision that develops Karlstad University to provide support to local and regional development. The third case is focused in place branding through tourism. To illustrate this aspect we have investigated an example: Wales, golf as it should be (Pride, 2004, p. 165). The problem of Wales was that it was relatively unknown compared to the rest of UK. The government discovered this problem and decided to change the image of the place. The intention was to promote the Wales’ brand to the world. But the challenge was to find a great segment market where this place can be different from others of United Kingdom (Pride, 2004, p. 161). Then, Wales had to create a strong identity and really believe in its abilities to mark a real difference. Finally, after having analyzed the potentialities of Wales, planners chose golfing as a differentiation tool (Pride, 2004, p. 162). The interest of mentioning the case of Wales here is that we want to stress the process followed here: first, detection of a problem with Wales’ image around the world, then use of market research to identify the right segment where to focus the branding efforts and finally, support of the strategy by real and according marketing efforts. 2.7 Key actors in the city After mentioning possible paths to follow to build and implement places’ marketing strategies, we found important to mention the main actors of the city since they play a role here.
12
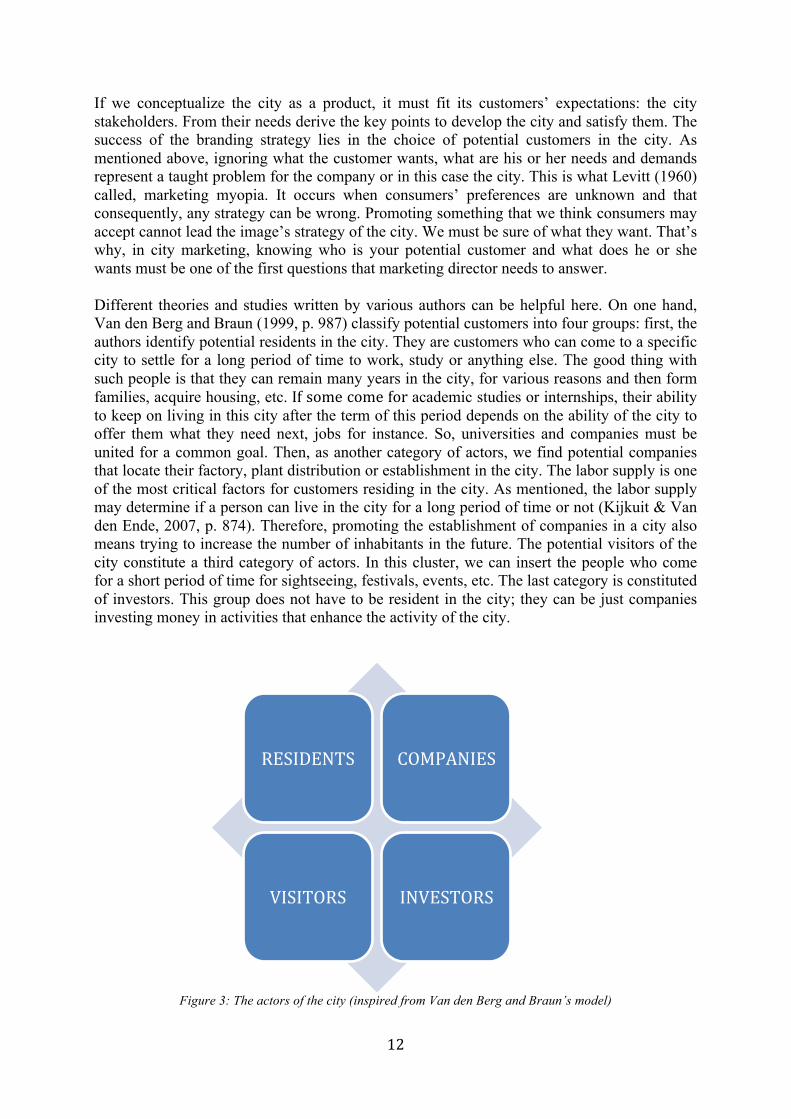
If we conceptualize the city as a product, it must fit its customers’ expectations: the city stakeholders. From their needs derive the key points to develop the city and satisfy them. The success of the branding strategy lies in the choice of potential customers in the city. As mentioned above, ignoring what the customer wants, what are his or her needs and demands represent a taught problem for the company or in this case the city. This is what Levitt (1960) called, marketing myopia. It occurs when consumers’ preferences are unknown and that consequently, any strategy can be wrong. Promoting something that we think consumers may accept cannot lead the image’s strategy of the city. We must be sure of what they want. That’s why, in city marketing, knowing who is your potential customer and what does he or she wants must be one of the first questions that marketing director needs to answer. Different theories and studies written by various authors can be helpful here. On one hand, Van den Berg and Braun (1999, p. 987) classify potential customers into four groups: first, the authors identify potential residents in the city. They are customers who can come to a specific city to settle for a long period of time to work, study or anything else. The good thing with such people is that they can remain many years in the city, for various reasons and then form families, acquire housing, etc. If some come for academic studies or internships, their ability to keep on living in this city after the term of this period depends on the ability of the city to offer them what they need next, jobs for instance. So, universities and companies must be united for a common goal. Then, as another category of actors, we find potential companies that locate their factory, plant distribution or establishment in the city. The labor supply is one of the most critical factors for customers residing in the city. As mentioned, the labor supply may determine if a person can live in the city for a long period of time or not (Kijkuit & Van den Ende, 2007, p. 874). Therefore, promoting the establishment of companies in a city also means trying to increase the number of inhabitants in the future. The potential visitors of the city constitute a third category of actors. In this cluster, we can insert the people who come for a short period of time for sightseeing, festivals, events, etc. The last category is constituted of investors. This group does not have to be resident in the city; they can be just companies investing money in activities that enhance the activity of the city.
Figure 3: The actors of the city (inspired from Van den Berg and Braun’s model)
RESIDENTS COMPANIES
VISITORS INVESTORS
13
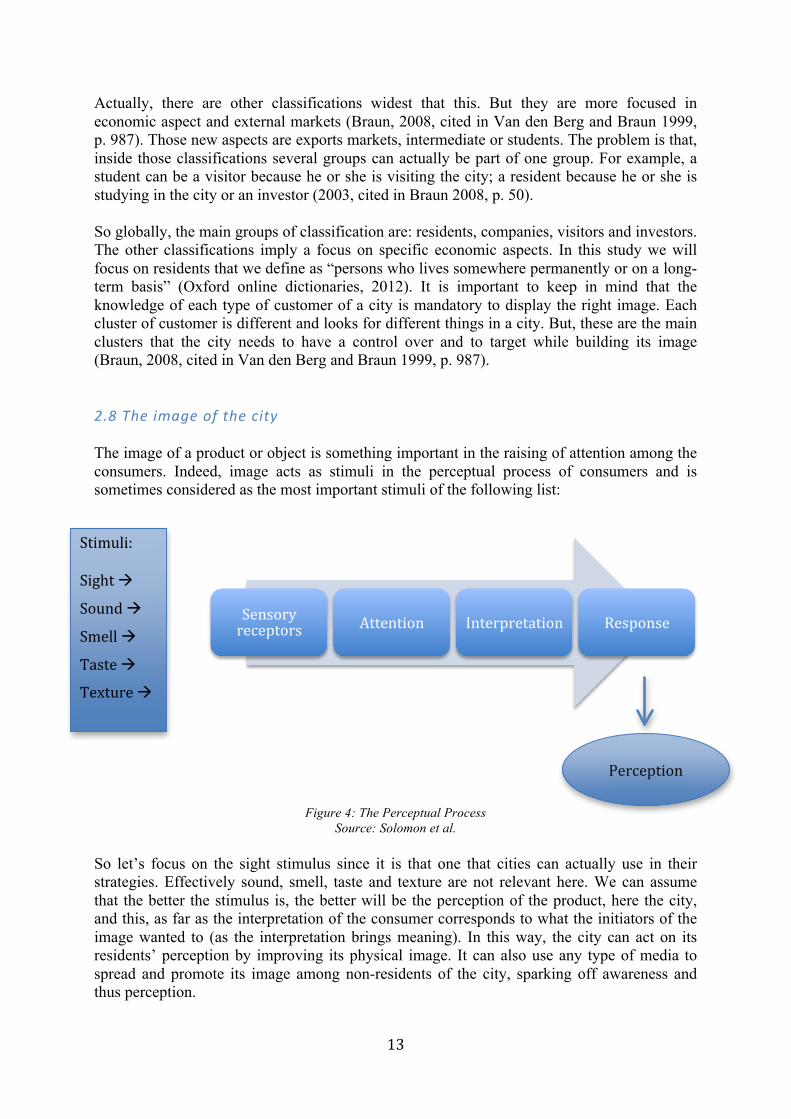
Actually, there are other classifications widest that this. But they are more focused in economic aspect and external markets (Braun, 2008, cited in Van den Berg and Braun 1999, p. 987). Those new aspects are exports markets, intermediate or students. The problem is that, inside those classifications several groups can actually be part of one group. For example, a student can be a visitor because he or she is visiting the city; a resident because he or she is studying in the city or an investor (2003, cited in Braun 2008, p. 50). So globally, the main groups of classification are: residents, companies, visitors and investors. The other classifications imply a focus on specific economic aspects. In this study we will focus on residents that we define as “persons who lives somewhere permanently or on a long-term basis” (Oxford online dictionaries, 2012). It is important to keep in mind that the knowledge of each type of customer of a city is mandatory to display the right image. Each cluster of customer is different and looks for different things in a city. But, these are the main clusters that the city needs to have a control over and to target while building its image (Braun, 2008, cited in Van den Berg and Braun 1999, p. 987). 2.8 The image of the city The image of a product or object is something important in the raising of attention among the consumers. Indeed, image acts as stimuli in the perceptual process of consumers and is sometimes considered as the most important stimuli of the following list:
Figure 4: The Perceptual Process Source: Solomon et al.
So let’s focus on the sight stimulus since it is that one that cities can actually use in their strategies. Effectively sound, smell, taste and texture are not relevant here. We can assume that the better the stimulus is, the better will be the perception of the product, here the city, and this, as far as the interpretation of the consumer corresponds to what the initiators of the image wanted to (as the interpretation brings meaning). In this way, the city can act on its residents’ perception by improving its physical image. It can also use any type of media to spread and promote its image among non-residents of the city, sparking off awareness and thus perception.
Sensory receptors Attention Interpretation Response
Stimuli: Sight à
Sound à
Smell à
Taste à
Texture à
Perception
14
Several researchers including Lynch in his book entitled “The Image of the City”, published in 1960, have proved the importance of the city image. In this book, which is actually an empirical study on how people perceive the urban landscape, the author gives a kind of framework to assess urban areas. This book has been useful, not only for urban planners being given the opportunity to propose a more meaningful image of the city, but also for city marketers (Hospers, G.-J., 2010, p. 2073). Lynch introduced the terms “city of the mind” and “imageability of the city” defined by “that quality in a physical object which gives it a high probability of evoking a strong image in any given observer” (Lynch, 1960, cited in Hospers, 2010, p. 2074). Lynch’s “mental map” of cities is constituted of 5 interdependent distinct elements:
o Paths: streets, main thoroughfare where people move; o Edges: transition zones between water for instance; o Districts: divisions of the city; o Nodes: strategic gathering points; o Landmarks: public singular points. (Lynch, 1960, cited in Hospers, 2010, p. 2075).
This conceptualization of the city is still used by researchers and there have been recent application of this concept to create 2 and 3 Dimensions measurement to improve urban spaces visibility (Morello & Ratti, 2009). We can perceive here the importance of landmarks or scenic places as monuments, which stay in people’s minds when remembering the city. Indeed people often remember public monuments and associate them with the city’s name in their minds (the Eiffel Tower in Paris for instance). In the study evocated before interesting properties about popular cities and landmarks have been sorted out. The image of the city can then be used in many ways to increase the city’s popularity. Also this “imageability” of the city can be used to raise affective links among people. In a study about the affective components of cities, researchers assessed that an affective dimension can be added to Lynch’s cognitive mapping of the cities (Bomfim & Urrutia, 2005, p. 37). We could assume then that attitudes can be created among the “consumers” of the city. If positive signals about the city are sent, then people can develop attitudes based on an hedonic consumption model, following the ABC model of attitude (Solomon et al., 2010, p. 277). Indeed this model specifies that attitude can possibly derive from (in the right order): affect (consumer’s feeling about an attitude object), behavior (consumer’s intention towards an attitude object) and beliefs (knowledge of the consumer of an attitude object) (Solomon et al., 2010, p. 277). Other hierarchies exist that do not start from affect.
15
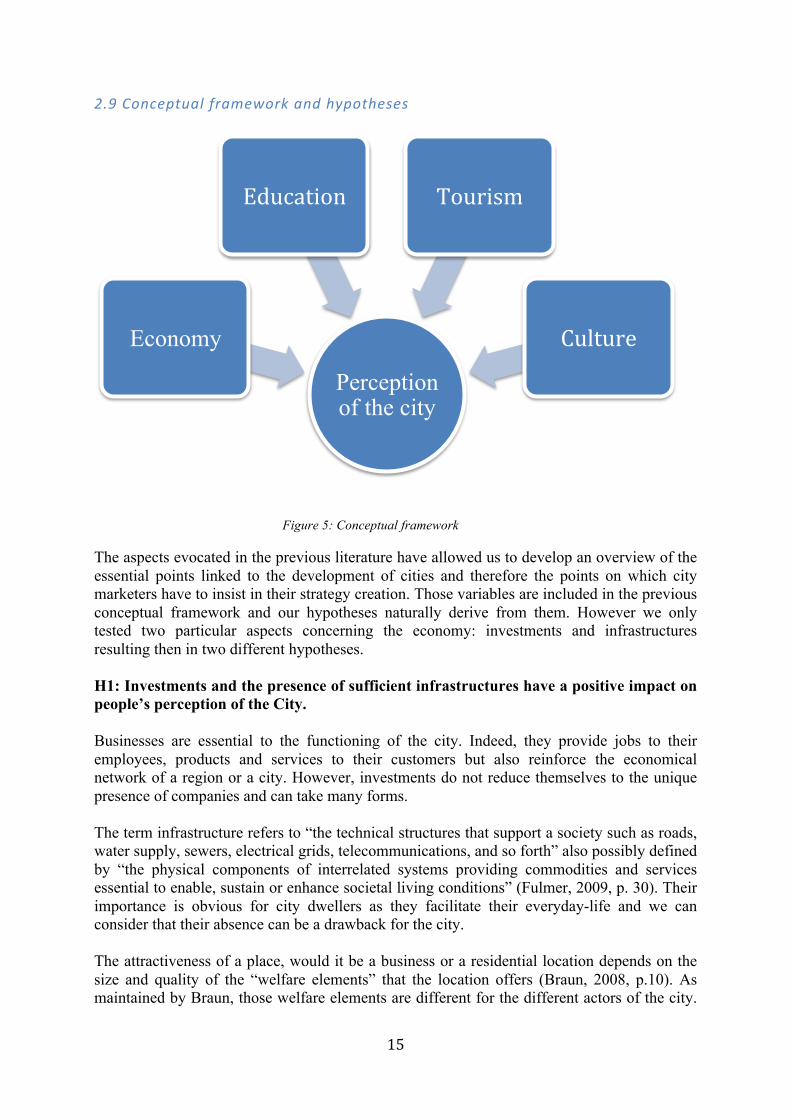
2.9 Conceptual framework and hypotheses
Figure 5: Conceptual framework The aspects evocated in the previous literature have allowed us to develop an overview of the essential points linked to the development of cities and therefore the points on which city marketers have to insist in their strategy creation. Those variables are included in the previous conceptual framework and our hypotheses naturally derive from them. However we only tested two particular aspects concerning the economy: investments and infrastructures resulting then in two different hypotheses. H1: Investments and the presence of sufficient infrastructures have a positive impact on people’s perception of the City. Businesses are essential to the functioning of the city. Indeed, they provide jobs to their employees, products and services to their customers but also reinforce the economical network of a region or a city. However, investments do not reduce themselves to the unique presence of companies and can take many forms. The term infrastructure refers to “the technical structures that support a society such as roads, water supply, sewers, electrical grids, telecommunications, and so forth” also possibly defined by “the physical components of interrelated systems providing commodities and services essential to enable, sustain or enhance societal living conditions” (Fulmer, 2009, p. 30). Their importance is obvious for city dwellers as they facilitate their everyday-life and we can consider that their absence can be a drawback for the city. The attractiveness of a place, would it be a business or a residential location depends on the size and quality of the “welfare elements” that the location offers (Braun, 2008, p.10). As maintained by Braun, those welfare elements are different for the different actors of the city.
Perception of the city
Economy
Education Tourism
Culture

16
For companies, for instance, the welfare potentials are the following: locational potential, labor-market potential (is there here enough qualified people to be employed in the company?), input potential and market potential (is there here enough potential customers?) (Braun, 2008, p.10). However, for city dwellers, home and its surroundings, access to employment and general facilities constitute the core of the welfare elements (Braun, 2008, p.10). Infrastructures are consequently entire parts of those welfare elements. H2: The presence of the university has a positive impact on people’s perception of the City. As in any business, possessing skills and competencies is a competitive advantage for the city. This is one of the reasons why the presence of higher education institutions (universities for instance) is perceived as an important development factor. We think here that those institutions offer multidimensional advantages to the city: - They attract students; - They provide the city with graduated population and potential recruits for companies; - They foster culture; - Etc. Models have been created to measure the effects of education on economic growth but also on wider and less explored areas including democratization, health and environment (McMahon, 1999). In the same way, worker’s education in China has been linked with the development of provincial innovative activities, with higher education contributing more than primary and secondary (Chi & Qian, 2010). The OECD created a program called IMHE standing for Institutional Management for Higher Education. You can read more about that at: www.oecd.org. This program includes the project “Supporting the Contribution of Higher Education Institutions to Regional Development” and Sweden’s Värmland region participated in it during the years 2005 and 2006, the main purpose of this program being guiding education and encouraging dialogue and cooperation between educational institutions and local actors. Similarities may be found between the action of Karlstad’s University on the development of the Värmland region and the role of Umeå University in the development of the city and more generally of the Vasterbotten’s county. H3: Tourism has a positive impact on people’s perception of the City. Several authors have already stated that there is a certain and complex link between tourism and the economic development process. The World Tourism Organization describes tourism as one of the largest and fastest growing economic sectors in the world. In the 2011 edition of the review entitled Tourism Highlights, international tourism receipts are estimated to have reached 693 billion euros compared to 610 billion euros in 2009. The number of tourists each year keeps on increasing switching to 25 million in 1950 to 675 million in 2000 and to 940 million in 2011 (WTO, 2012, p.10).

17
H4: Culture has a positive impact on people’s perception of the City In the competition for attracting people, cities often use special shows or events to promote themselves. Several researchers have claimed that such events have a positive impact on the city image and thus on its attractiveness. In a model created by Rainisto (2003, cited in Moilanen & Rainisto, 2009, p.22), creating events in place marketing practices, in the network, as well as in the macroenvironment of the marketed place are considered as required practices leading to successful place branding. In the model, those practices should be associated with specific success factors that we may discuss later. Researches tend to demonstrate that the following points can be improved by cultural events: local economy, number of visitors but also image (Richards & Wilson, 2004), which is a central point in the attractiveness of the city. Consequently the fact of hosting the European Capital of Culture event should impact, to a certain extent, the development of the city. The concept of the European Cities of Culture has been launched in June 13,1985 by the council of EU Ministers. The cities were designated on an intergovernmental basis until 2004 (EU members were choosing the cities most likely to host the event and those cities were granted a subsidy). In 1999, the European CiTies of Culture became the European Capitals of Culture, funded by the Culture 2000 program. New selection procedures were set to avoid too fierce competition and give each EU member to host the event. Since 2005, the number of cities elected each year has turned into two. The event’s initial purpose is to “help bring the peoples of the member-states closer together” thanks to the “expression of a culture which, in its historical emergence and contemporary development, is characterized by having both common elements and a richness born of diversity” (European Commission, 1985). However, each nomination can have specific purposes. For instance, the nomination of Helsinki as European Capital of Culture in 2000, was supposed to “enhance the quality of life of the inhabitants and to increase inter-national awareness of Finnish culture” (Helsinki City of Culture Foundation, 2000, in Richards & Wilson, 2004). Umeå’s objective for 2014 is to “promote human growth, strengthen the role of culture as a driving force for sustainable development of society, and reinforce cultural life’s international relations and dimensions” (Umeå 2014 European Capital of Culture, 2010). The city also expects to see the investments and growth’s movement accelerate as expressed in its long-term strategy till 2050.
18
Part 3: Methodology In this part, the authors determine the approach they followed to conduct their study as well as the philosophical standpoints they were relying on. They also present their research design, explain how their questionnaire was constructed and why and describe the way they collected data. Then, as ethics bears an increasingly important place in business studies nowadays, they dedicate some sentences to essential ethical points that they respected. 3.1 Approach and philosophical standpoints Before undertaking any activity, we reviewed the amount of literature on city marketing and other related subjects as destination marketing and city branding. Several researches have been undertaken on the topic, a lot of them including case studies of implementation of city marketing strategies. We even found articles on the effect of the European Capital of Culture event on the development of towns. Therefore we had theoretical material as well as practical one. Based on established models and theories included in our literature review, we formulated hypotheses aiming at testing those theories and models. So we chose a deductive approach to guide our research. Theory and the hypotheses come first and drive the process of gathering data (Bryman & Bell, 2011, p. 11). Those data will be then analyzed and used to confirm or reject the hypotheses. This view of the relationship between theory and research is the most common among and was accurate for us since we did not want to elaborate our own theory based on observations (inductive approach). Typically, deductive strategies are associated with quantitative research approaches while inductive strategies are associated with qualitative research approaches (Bryman & Bell, 2011, p.13). Epistemology deals with the way of perceiving reality and therefore with what should or not being considered as knowledge. The main epistemological standpoints possibly used in social sciences studies are interpretivism, positivism and realism (which include empirical realism and critical realism and shares some features with positivism). Interpretivism, as described by Bryman & Bell (2011, p.16), directly opposes the positivist standpoint highlighting a fundamental difference between natural and social sciences and consequently the need to apply different research method processes. However, here we believe that the development of a city can be evaluated through a positivist view with the implementation of scientific models. Indeed it fits our view of the purpose of theory, which is to generate hypotheses that can be tested and that allows explication of laws to be assessed (Bryman & Bell, 2011, p. 16). Ontology deals with the nature of social entities and the key issue here is to determine whether they should be considered objective and having a reality external to social actors (objectivist point of view) or whether they can be considered as social constructions by social actors (constructionist point of view) (Bryman & Bell, 2011, p.20). In our case we are conceptualizing the city as a tangible object, having rules and regulations and influencing city dwellers. Thus, our view matches exactly the features of an objectivist ontological viewpoint as described by Bryman & Bell (2011, p. 21). A constructionist point of view would have lead us to perceive the city as the outcome of an ongoing action of social actors. In constructionism then, knowledge is view as indeterminate (Bryman & Bell, 2011, p.22) and likely to evolve at any time. This could have also fit a certain view of the city as built up and constantly renovated by social actors external to the city as the country government or companies wishing to invest there or internal such as local companies, public administrations

19
or even any city dweller. This view, although not mistaken, would have been too complicated for us to investigate and would have necessitated a qualitative study on top. 3.2 A quantitative method For the research strategy and to answer the research questions, we chose a quantitative approach. The other possible method is the qualitative approach. The are some differences between both concepts, but we decided to used the quantitative way because, as we said before, this method entails a deductive approach to the relationship between theory and research (Bryman & Bell, 2011, p. 27) and we want to test some theories and to build an approach linked with social reality. Qualitative method is used to build a theory testing other theories. There are four main preoccupations among quantitative researchers: measurement, causality, generalization and replication (Bryman & Bell, 2011, p. 163). We are aware that measurement and generalization are one of the most sensitive issues in our study. Measurement carries a wide number of advantages but it is not always easy to obtain a good reliability and validity (Bryman & Bell, 2011, p. 163). Also, generalization is a sensitive issue because we use a sampling of the total population and then we extrapolate the result. For this reason, sampling is very important and should be done carefully (Bryman & Bell, 2011, p. 165). However we thought that, in our case, quantitative methods could be more easily assessed compared to qualitative methods. Concerning the replication issue, it implies that the researchers carefully describe their procedures to allow their work to be replicated (Bryman &Bell, 2011, p.41); what we do later in this present chapter. Causality deals with the establishment of causal relationships between the objects of the survey and is represented in the analyses by the notions of “independent” and “dependent” variables (Bryman & Bell, 2011, p.163) that we will use later in our analysis. The more confidence there is in the researchers’ causal inferences, the better will be considered the quantitative analysis (Bryman & Bell, 2011, p. 163). There are some conveniences in conducting surveys through quantitative methods. For instance, surveys are quite easy to administer and the quantitative methods allows reaching larger sample sizes making the generalization of the results more reliable (Shiu et al., 2009, p. 227). In addition to that, using several variables, allows us to analyze the data through different perspectives and also to conduct multivariable analysis (Shiu et al, 2009, p. 226). Conducting a quantitative analysis here will allow us to make comparisons between the attitudes of different subjects according to their age, gender etc. Also, an important advantage is represented by the fact that using standardized data collection methods and questionnaires makes the analysis of data easier through the use of software like SPSS (standing for Statistical Package for the Social Sciences). However, we cannot deny that the use of a quantitative method prevents us the access to richer data only available through the use of qualitative methods as establishment of focus groups or conducting of in-depth interviews, especially efficient to record marketplace behaviors or gaining insights into decision problems and opportunities (Shiu et al, 2009, p.173-174). Conducting a qualitative analysis allows researchers to get the real feelings and attitudes of the respondents on a specific topic, which is almost impossible with quantitative analysis. In addition to that, it’s also possible to make wrong data analysis with quantitative method given that data can be easily misinterpreted due to a wrong use of statistical
20
techniques (Shiu et al, 2009, p.227). Biases are possible in both cases and we will try to avoid creating any of them. 3.3 Research design Cross-sectional design is the type of research design used in this study. According to Bryman & Bell (2011, p.45), there are five main different types of designs: experimental design, cross-sectional design, longitudinal design, case study design and comparative design. Our decision is based in the idea of the social survey is closely connected in most people´s minds with questionnaires and structured interviewing (Bryman & Bell, 2011, p.53). Cross-sectional research design entails the collection of data on more than one case and at a single point in time in order to collect a body of quantitative data in connection with two or more variables (Bryman & Bell, 2011, p.53). The survey aims to obtain information about the city of Umeå under different aspects. The main areas studied here are: economy, education, tourism and culture. With this analysis, our study aims to answer a series of previously formulated hypotheses focused on these areas. Also, the use of a cross-sectional design will drive us to infer that some variables cause the others (Bryman & Bell, 2011, p.163). Other types of research designs are used in other types of investigations that are not suitable to apply in this study. For instance, in longitudinal design, the analysis is based on a number of variables that are studied in different periods of time (Bryman & Bell, 2011, p.58), which is not feasible for us. The respondents are the same in different moments. Another example is comparative design. In this case, the study analyzes different cases in different periods of time (Bryman & Bell, 2011, p.63). It could have been very interesting in our case but we cannot have access to data on other cities with the same precision than we have here, which would have led to an unbalanced comparison with rich and “fresh” primary data on one side and poorer secondary data on another side. 3.4 About data collection and sample selection As we are conducting primary research, we are concerned with sampling issues (Shiu et al., 2009, p. 63) as the sample quality has a direct influence on the generalizability of the findings. Basically sampling is seen as selecting a small number of elements from a larger defined group of elements while expecting to be able to draw accurate judgments about the larger group with the data obtained from the smaller group (Shiu et al., 2009, p. 448). Here, as we thought that data structure could be different for certain types of people, we expected to draw comparisons between those categories: Swedes native from Umeå, Swedes born in other cities and Internationals. Our three categories are composed of people actually living or studying in the city of Umeå and thus concerned by the city’s development issues. Determining the sample size is not an easy task. Moreover, researchers are often limited in time and/or money resources, which is our case here. Different issues are raised concerning the sample size: absolute and relative size of the sample, non-response rate, precision etc. (Bryman, 2012, p. 197-200). It is usually acknowledged that the larger your sample is, the more precise it is likely to be.

21
International viewpoint External viewpoint Swedes native from Umeå Swedes from other cities
Internationals
No special social status Students
Table 1: Division and characteristics of the respondents We knew that spreading the online questionnaire to a certain amount of people wouldn’t provide us with the same amount of answers. Thus we decided to spread the online questionnaire the bigger amount of people that was possible for us (483 in total), both non-Swedish (majority of them) and Swedish. We expected that there would be some respondents likely to have an “internal” view of the city (Swedish people) and respondents likely to have a more “external” view (non-Swedish people). We forecasted to draw comparisons in the analysis between first, the international and the Swedish respondents and then, among the Swedish respondents, between the respondents native from Umeå and the others. As told before, we are students writing a Master Thesis, therefore our research is time-limited and we do not have any funding partners. Consequently, it was not possible for us to follow a probability sampling design, described by Shiu et al. (2009, p. 470) as a technique in which every sampling unit has a known probability to be included in the sample. Instead we selected our respondents accordingly to the quota sampling rules as we divided our target population in pre-specified subgroups presenting selected variables expected to have impact on the findings of the survey (Shiu et al., 2009, p. 482). In what concerns the data collection procedures, we intend to use two different collection methods: a web-based one (spreading of a self-administration questionnaire) and a paper-based one (both self-administration and face-to-face method). The web-based questionnaire was designed via Google Docs, an online application allowing us to elaborate forms that can be easily spread on the Internet by e-mails or by incorporating the link of the form on another webpage. We chose this last option and decided to spread our questionnaire in the most convenient way for us, that is to say via Facebook, the most famous social network in the world that we both use, so we created a Facebook event for this purpose. The guests of the event have been selected among our friends’ list and they were offered the possibility to answer either in English or in Swedish. The paper-based questionnaire has been administered only in Swedish. Effectively we knew that we would get a lot more responses of Internationals with the online questionnaire and we decided then to look specifically for Swedish respondents. One of the disadvantages of spreading an online questionnaire to a large amount of people is that we have no real control on the final sample. However, our idea was to get around two-thirds of International respondents and one third of Swedish respondents. The reason is that, as we are conducting a survey on the image of the city of Umeå and its growth potential, we thought that we needed more “external” viewpoints. In a meeting dedicated to International students of Umeå University intending to find a job in Sweden after their studies, that took place on the 14th of May of this year, we have been explained that Sweden need “brains from other countries” to keep growing and developing. Indeed Sweden, as the rest of Europe, is facing demographic challenges: thirty per cent of today workers will be pensioners in 2015 and consequently need
22
to be replaced and Sweden’s population can only expand through immigration (meeting, 2012). Thus, jobs must be created and qualified workers should be attracted (meeting), which is one of the objectives of Umeå’s city marketing strategy. Then, it is more interesting for us to have the opinion of international students of Umeå University that are in a certain extent the targets of Umeå’s marketing strategy aiming at increasing the city’s aura out of the region and out of the country. However, the Swedish points of view are also extremely important since they will allow us to draw comparisons and potentially make them realize that they do not perceive some points as the outsiders do and that they specifically have to work on it. To sum up, our target population of Internationals was composed of students since their opinion matters a lot in the attempt of Umeå to attract (as students and as future skilled worforce) while we had no specific social status criteria for our Swedish respondents (they could be students, as well as workers or pensioners as soon as they lived in the city of Umeå). About the data collection, we did our best to reduce sampling error defined as “errors deriving from the difference between a sample and the population from which it is selected” (Bryman, 2012, p. 187) all the more so as we are using a non-probability sampling technique. We also tried to avoid non-sampling errors by using an appropriate sampling frame. Finally, before spreading the questionnaire to our sample, we did a pretest, essentially to make sure that our questions are understandable and that the answers are usable for analysis. 3.5 Factor analysis As said before, we spread the online English version of the questionnaire to 483 people and got 250 valid answers out of them. We also got 34 answers by the face-to-face way with the Swedish paper-based version of our questionnaire. The objective of those face-to-face interviews was to get more responses from Swedish persons since we have a lot more international people in our Facebook networks. Finally our responses were divided this way:
- Online responses: 216 including 180 from international persons and 36 from Swedish persons;
- Physical responses: 34 all from Swedish persons. Among the Swedish respondents, 35 of them were from Umeå. As expressed before, we intended to have around two-thirds of answers from Internationals and one-third from Swedes. At the end, we got 250 responses including 180 from Internationals and 70 from Swedes, that is to say 72 percent of International profiles and 28 percent of Swedish profiles, that we judged acceptable in comparison to our initial expectations. So, after the data collection, we processed the information obtained through SPSS software to be able to accurately analyze the data.
23
3.6 Questionnaire design To investigate the key elements in the development of a city, and particularly here the case of Umeå, we decided to draw a questionnaire divided in three parts. We followed a “from the general to the particular” approach (common to deductive methods). Each part is actually linked to a research question. The questionnaire is actually composed of 28 questions divided into three parts. The first part aims at isolating general perceptions about the city and corresponds to our first research question. The questions included in this part (7 in total) aim at drawing the general image that people have about Umeå, we will try to get an insight of the main strengths and weaknesses of the city in people’s mind, relying on Lynch’s theory on cognitive maps of cities. The second part is the most important because we get deeper information about the main aspects affecting the improvement of this city. To develop this set of questions (11 in total), we used the most representative macroeconomic aspects of this city: economic, education, infrastructure and tourism. There we used different literature sources, all dealing with one or several aspects related to the city. Finally, the third and last one will deal with the event of Umeå being the European Capital of Culture in 2014. It is composed of 6 questions inspired from the current strategies’ directions of the Umeå 2014 group. Then 4 questions constitute the demographics part. Content and purpose First part: In this part the city is attributed several characteristics among the usually most appreciated ones and the most decisive ones in someone’s choice of a city to live in, including importance in size, cosmopolitanism, safety, culture and history (10 variables). The respondents just have to indicate the extent to which they think Umeå complies with those characteristics. Then they just have to do the same with some potential disadvantages: location, weather conditions, services and infrastructures and language barrier (4 variables). Second part: This part investigates the following area: education, economy, infrastructures and tourism. The questions included in each part aim at getting people’s opinion about the performances of the city in each respective area. Education:
- Umeå University as an incentive to come to Umeå. - Importance for the city to have a skilled workforce. - Importance of partnerships between businesses and higher education institutions.
Economy: - Umeå has a strong economy. - What is the most important economic area in Umeå?
24
Infrastructures: - Assessment of the transportation network inside the city, between Umeå and the rest
of Sweden, between Umeå and the rest of Europe (4 variables). - Assessment of different means of transportation: plane, train, bus, car and bike (5
variables). Tourism:
- Umeå has a great touristic potential. - Importance of some touristic aspects: proximity with Lapland and Sami people, snow
activities, natural environment and cultural events (4 variables). Third part: This part deals with the European Capital of Culture event that Umeå will host in 2014. It aims at evaluating people’s knowledge about it and their view of the importance of possible points to highlight during this year through the following variables:
- Knowledge of the event (3 variables). - Link with the event and the opportunity to develop the city. - Opinion on the promotion of different aspects during the European Capital of Culture
event (10 variables). Demographics: The information derived from this part mainly serves as comparisons’ base:
- Gender. - Category of age. - Nationality.
An additional question for Swedish respondents: If you are Swedish, are you from Umeå?
Table 2: Questionnaire’s summary and structure
Concerning our questions’ format, we used only structured questions, requiring respondents to pick up answers from predetermined sets of questions (Shiu et al., 2009, p. 330), and this, for convenience reasons. In our questionnaire we decided to use many Likert scales questions given their usefulness to measure attitudes defined by “learned predispositions to react in a consistent positive or negative way to a given object, idea, or set of information” (Shiu et al, 2009, p.419). Attitudes are composed of three distinct components: the cognitive component, the affective component and the behavioral component. However Likert scales assess mainly the cognitive components of attitudes (Shiu et al, 2009, p.419-420), which can be viewed as a weakness. Indeed the intensity levels constituting the scale (from definitely agree to definitely disagree) don’t really represent the associated attitudes but the extent to which the respondent think the statement represents his/her belief (Shiu, 2009, p.423). Still, Likert scales are useful to catch psychographic traits that we will use to classify people regarding to their behavior toward such or such attribute of the city they live in. The demographics part is mainly composed of nominal scales questions, requiring the respondents to provide descriptors as a response (Shiu et al., 2009, p.391) as well as true class
25
interval scales. This part allowed us to draw comparisons between the variables and to establish kinds of profiles. The research design we want to use is a descriptive one as we intend to collect state-of-being and state-of-behavior data likely to be translated into facts (Shiu et al., 2009, p. 333). Indeed, we want to investigate the effects of different actors on the development of the city and city dweller’s state of mind towards this phenomenon. Descriptive studies often provide information about customers as well as environmental factors (Shiu et al., 2009, p.62) and effectively here we want to evaluate the attitude of city dwellers as “consumers” of the city while evaluating the environmental factors provided by the city to those special customers. In fact we perceive the city marketing strategy as focused on the different customers of the city and deriving from their needs and wants, in the same way that companies traditional marketing strategies are focused on the customers needs and wants. Information derived from our observation can provide city planners and marketers with useful information to drive their actions towards. The questionnaire has been offered non-Swedish participants in English and to local (Swedish) participants in Swedish, and this to avoid misunderstanding to the maximum. Indeed, even if Swedes have a quite good understanding of the English language, we considered it even better to administer them the questionnaire in their own language (that’s why our online respondents have been offered the choice to answer either in Swedish or in English). In addition to that, they do not really need more information than written in the questionnaire and if in case they do, we will do our best to provide them additional explanation in English. Before each section of the questionnaire we will provide a brief description of what is included in it so that the respondents are given more information about the topic and have a more or less clear overview of the purpose of the study which is not obvious for people lacking of a background in marketing or more generally in business. 3.7 Pre-‐test Shiu et al. state that every questionnaire must be pre-tested among representative of potential respondents (2009, p. 65). The aim of this pre-test is to obtain feedback from the respondents about their understanding of the questions, the clarity of the instructions or the overall coherence of the questionnaire. In fact any comment or suggestion is welcomed in this important phase. That’s why, we pre-tested 10 people, including our thesis supervisor, a marketing researcher, other teachers of the university and random students of the same university. All the pre-tested persons were either working or studying in the city of Umeå, we can consequently admit that they have some interest for the topic and are able to understand the scope of our questions. This phase has actually completed its role since we effectively did some modifications of our questions after it. For instance, we specified some terms that were either confusing or too general in the questionnaire, we split some questions in 2 realizing that they were actually about 2 different subjects and suppressed some questions that were actually redundant. 3.8 Quality criteria The quality of quantitative analyses can be evaluated through the assessment of the reliability and the validity criteria. Reliability deals with measurement consistency (Bryman & Bell,

26
2011, p.157). A measure is considered as reliable as soon as it matches the following characteristics: stability over time, internal reliability or the necessary relation between different indicators’ scores and inter-observer consistency or the coordination between possible subjective interpretations of items and data (Bryman & Bell, 2011, p.158). While constructing the questionnaire, we took into account those considerations and did our best to establish reliable measures. The evaluation of internal reliability can be obtained with the Cronbach’s alpha test allocating a certain coefficient comprised between 0 and 1 with 0,8 being the commonly considered as acceptable level of reliability (Bryman & Bell, 2011, p.159) and 0,6 being the threshold not to go under in order to achieve a satisfactory internal consistency (Shiu et al, 2009, p. 403). The other quantitative analyses’ quality criterion is the one of validity. It deals with the assessment of whether a given indicator really measure the associated concept or not (Bryman & Bell, 2011, p. 159). There are different ways to assess validity: via face validity concurrent validity, predictive validity, construct validity or convergent validity. Also, in question wording, we avoided ambiguity to the maximum. Thus we avoided double question or ambiguous ones as well as the use of too complex words or jargon (Vlad’s course). 3.9 Ethical assumptions As our work implies using data obtained by respondents to draw conclusions that will become public about a specific topic, we must obey ethical rules. Ethical issues mainly deal with the way researchers treat their respondents and the activities in which they should or not engage in with them (Bryman & Bell, 2011, p.122). Actually, ethical principles can be categorized into those four main areas: possibility of harming participants, lack of informed consent, invasion of privacy, and involvement of deception (Bryman & Bell, 2011, p. 128). Ethical dilemmas arise generally from interaction between those three main groups: research providers, research users and respondents (Shiu et al., 2009, p.27). Here the second group does not concern us, as our work will only be assessed by the university and will not really serve other purposes. The first point, possibility of harming participants of the study, is actually quite complex. Harming participants can be done physically but also psychologically (Bryman & Bell, 2011, p. 128). Above all, confidentiality must be ensured unless permission is given to disclose the information obtained (in this case, respondents should know to whom the information can be disclosed to and the purpose of the study). Also respondents must be informed of the purpose of the study (Bryman & Bell, 2011, p.129) and they should explicitly wish to participate in the study. We included a short introductory text at the beginning of our questionnaire explaining the reason and purpose of our study. Also, all respondents automatically agreed to be respondents since the online version implied their will to follow the link to the questionnaire and the face-to-face approach implied their consent to answer. The notion of invasion of privacy is linked to that of informed consent (Bryman & Bell, 2011, p. 136) and deception occurs when researchers lie about the nature of their study, presenting it as something else than it really is (Bryman & Bell, 2011, p. 136). To avoid this, we will properly formulate the real purpose of our study and the extent to what the results will be

27
used. The questionnaire will be anonymous and the only thing likely to be disclosed or used in data comparisons is the nationality of the respondents, the gender or their age. 3.10 About literature The databases supplied by the University of Umeå have been very useful in our literature research. Most of the articles we have been referring to come from online researches via the library’s databases hosted by EBSCO including Academic Search Elite and Business Premier. We also used the Google Scholar database to complete our findings. Then, some other materials like previous essays or thesis about our subject or similar ones have been found via the search engine Google. We also consulted Diva database to get inspiration from other thesis work and structure. In addition to that, the richness of the physical materials of the library has been used since it provided us with some useful books about place branding, destination marketing, urban marketing and urbanism in general. Theoretical aspects of methodology have been provided by literature on research methods in social sciences and on marketing research. We have also been helped by the fact of following a course on Business Research Methodology before the beginning of the present work. Concerning the selection of literature, we mainly chose either material specifically about city marketing (which are not that many) or either materials dealing with one aspect of the subject. We basically rejected too general works. However, the beginning of our literature review can appear like too general because of two reasons: first it deals with a reflection about cities and their development and secondly because it explains the shift from marketing to city marketing. The thing is that we simply thought that it was interesting to underline the causality between development of the urbanization process and the need of new strategies to support it.
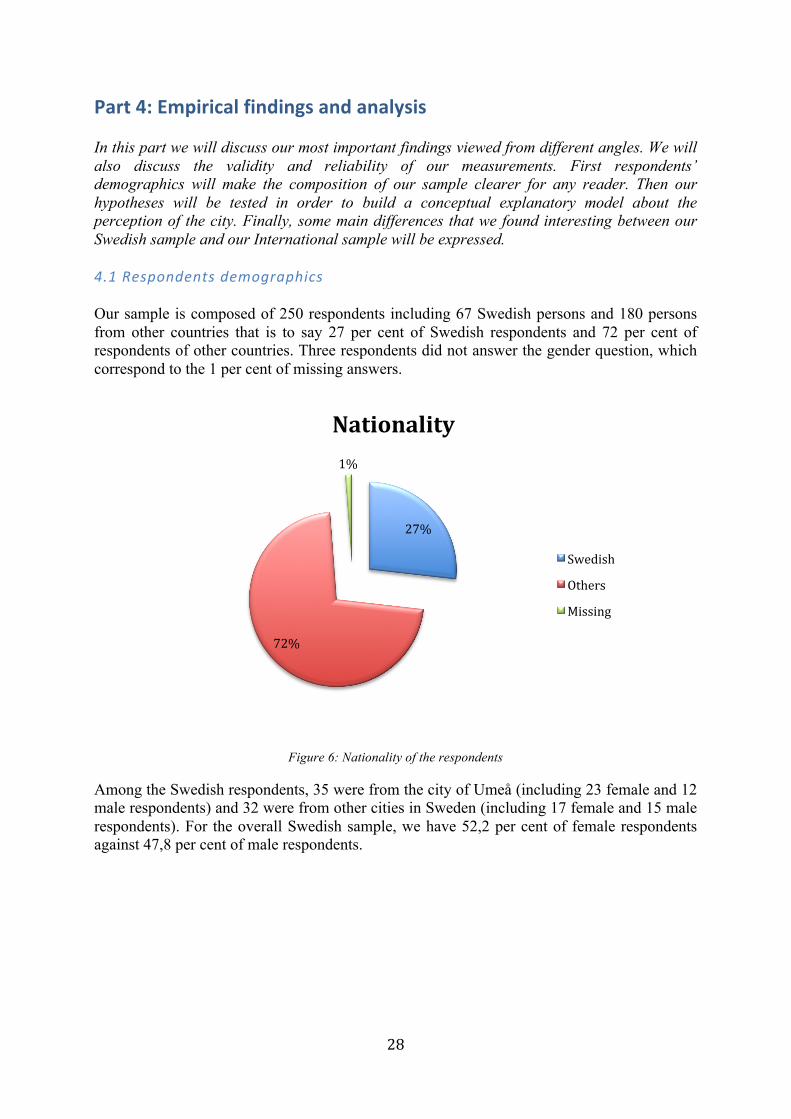
28
Part 4: Empirical findings and analysis In this part we will discuss our most important findings viewed from different angles. We will also discuss the validity and reliability of our measurements. First respondents’ demographics will make the composition of our sample clearer for any reader. Then our hypotheses will be tested in order to build a conceptual explanatory model about the perception of the city. Finally, some main differences that we found interesting between our Swedish sample and our International sample will be expressed. 4.1 Respondents demographics Our sample is composed of 250 respondents including 67 Swedish persons and 180 persons from other countries that is to say 27 per cent of Swedish respondents and 72 per cent of respondents of other countries. Three respondents did not answer the gender question, which correspond to the 1 per cent of missing answers.
Figure 6: Nationality of the respondents
Among the Swedish respondents, 35 were from the city of Umeå (including 23 female and 12 male respondents) and 32 were from other cities in Sweden (including 17 female and 15 male respondents). For the overall Swedish sample, we have 52,2 per cent of female respondents against 47,8 per cent of male respondents.
27%
72%
1%
Nationality
Swedish
Others
Missing

29
Figure 7: Composition of the Swedish sample
Then, if we take gender as an element of division of our sample, we have 128 female respondents and 120 male respondents, that is to say 51,2 per cent and 48 per cent respectively. Here again we had 2 missing answers corresponding to the 0,8 per cent left. It is also possible to divide our Swedish and Internationals respondents by gender. In this case, among the first sample we count 40 female respondents and 27 male respondents while we count respectively 88 and 92 female and male respondents.
Figure 8: Gender distribution
As told previously, most of our respondents are students from the University of Umeå, which explains the age distribution of our sample displaying 200 people in the 18-25 age category (including 109 female and 91 male respondents), 42 people in the 26-35 category (including 15 female and 27 male respondents) and 5 in the other categories, which means 80 per cent of our respondents are between 18 and 25 years old, 16,8 per cent are between 26 and 35 years old and only 2 per cent are older than 35 years. Because of this distribution there will be no relevance to do any variable comparison analysis based on the age.
52%
48%
Swedish sample
Swedish from Umea
Swedish from other cities
51% 48%
1%
Gender
Female
Male
Missing
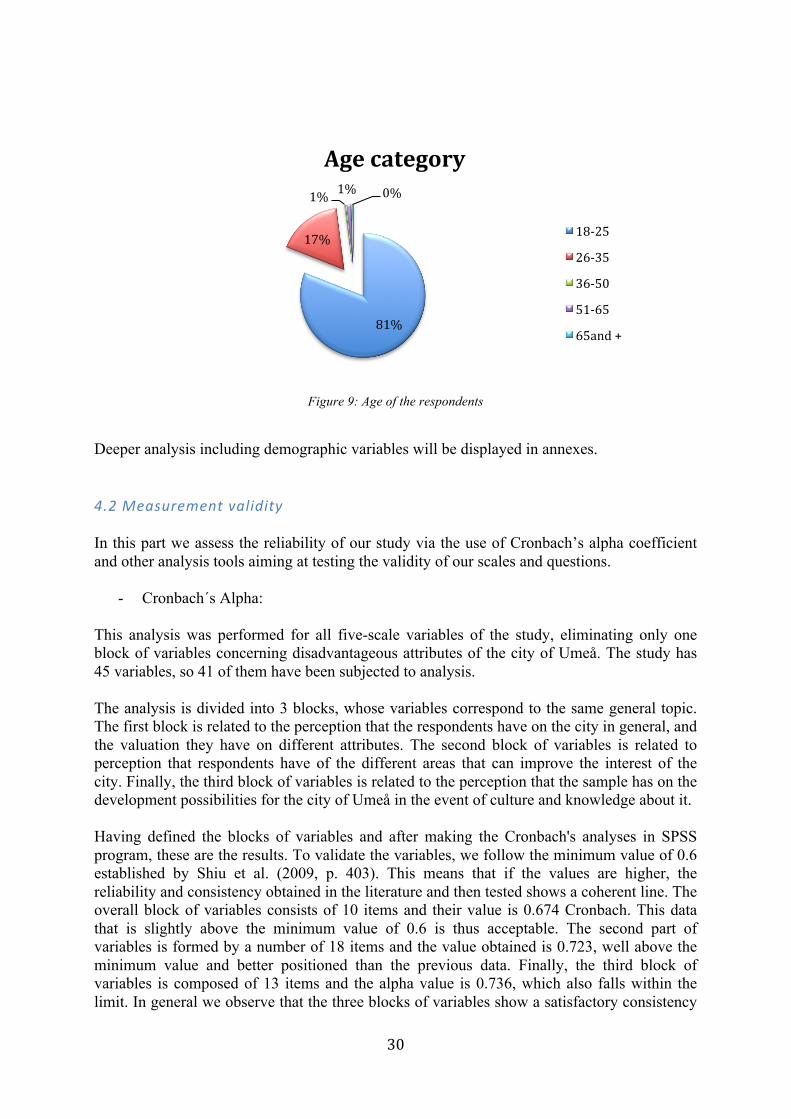
30
Figure 9: Age of the respondents
Deeper analysis including demographic variables will be displayed in annexes. 4.2 Measurement validity In this part we assess the reliability of our study via the use of Cronbach’s alpha coefficient and other analysis tools aiming at testing the validity of our scales and questions.
- Cronbach´s Alpha: This analysis was performed for all five-scale variables of the study, eliminating only one block of variables concerning disadvantageous attributes of the city of Umeå. The study has 45 variables, so 41 of them have been subjected to analysis. The analysis is divided into 3 blocks, whose variables correspond to the same general topic. The first block is related to the perception that the respondents have on the city in general, and the valuation they have on different attributes. The second block of variables is related to perception that respondents have of the different areas that can improve the interest of the city. Finally, the third block of variables is related to the perception that the sample has on the development possibilities for the city of Umeå in the event of culture and knowledge about it. Having defined the blocks of variables and after making the Cronbach's analyses in SPSS program, these are the results. To validate the variables, we follow the minimum value of 0.6 established by Shiu et al. (2009, p. 403). This means that if the values are higher, the reliability and consistency obtained in the literature and then tested shows a coherent line. The overall block of variables consists of 10 items and their value is 0.674 Cronbach. This data that is slightly above the minimum value of 0.6 is thus acceptable. The second part of variables is formed by a number of 18 items and the value obtained is 0.723, well above the minimum value and better positioned than the previous data. Finally, the third block of variables is composed of 13 items and the alpha value is 0.736, which also falls within the limit. In general we observe that the three blocks of variables show a satisfactory consistency
81%
17%
1% 1% 0%
Age category
18-‐25
26-‐35
36-‐50
51-‐65
65and +
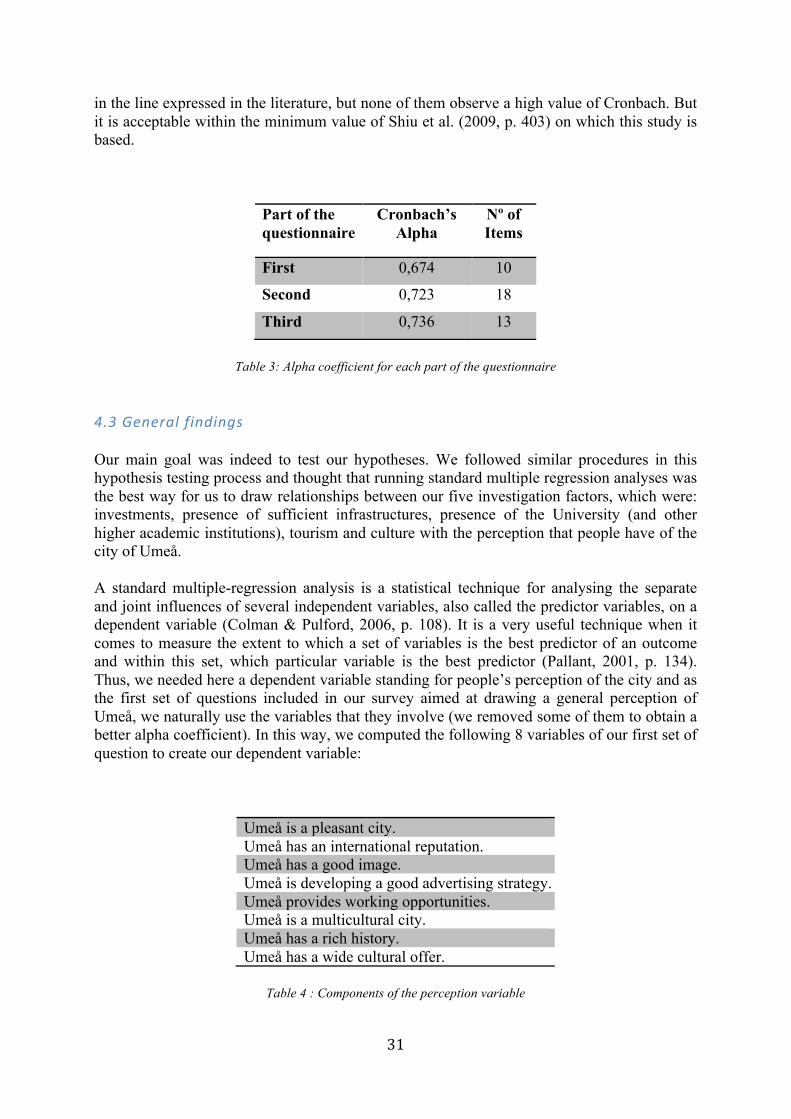
31
in the line expressed in the literature, but none of them observe a high value of Cronbach. But it is acceptable within the minimum value of Shiu et al. (2009, p. 403) on which this study is based.
Part of the questionnaire
Cronbach’s Alpha
Nº of Items
First 0,674 10
Second 0,723 18
Third 0,736 13
Table 3: Alpha coefficient for each part of the questionnaire
4.3 General findings Our main goal was indeed to test our hypotheses. We followed similar procedures in this hypothesis testing process and thought that running standard multiple regression analyses was the best way for us to draw relationships between our five investigation factors, which were: investments, presence of sufficient infrastructures, presence of the University (and other higher academic institutions), tourism and culture with the perception that people have of the city of Umeå. A standard multiple-regression analysis is a statistical technique for analysing the separate and joint influences of several independent variables, also called the predictor variables, on a dependent variable (Colman & Pulford, 2006, p. 108). It is a very useful technique when it comes to measure the extent to which a set of variables is the best predictor of an outcome and within this set, which particular variable is the best predictor (Pallant, 2001, p. 134). Thus, we needed here a dependent variable standing for people’s perception of the city and as the first set of questions included in our survey aimed at drawing a general perception of Umeå, we naturally use the variables that they involve (we removed some of them to obtain a better alpha coefficient). In this way, we computed the following 8 variables of our first set of question to create our dependent variable:
Umeå is a pleasant city. Umeå has an international reputation. Umeå has a good image. Umeå is developing a good advertising strategy. Umeå provides working opportunities. Umeå is a multicultural city. Umeå has a rich history. Umeå has a wide cultural offer.
Table 4 : Components of the perception variable
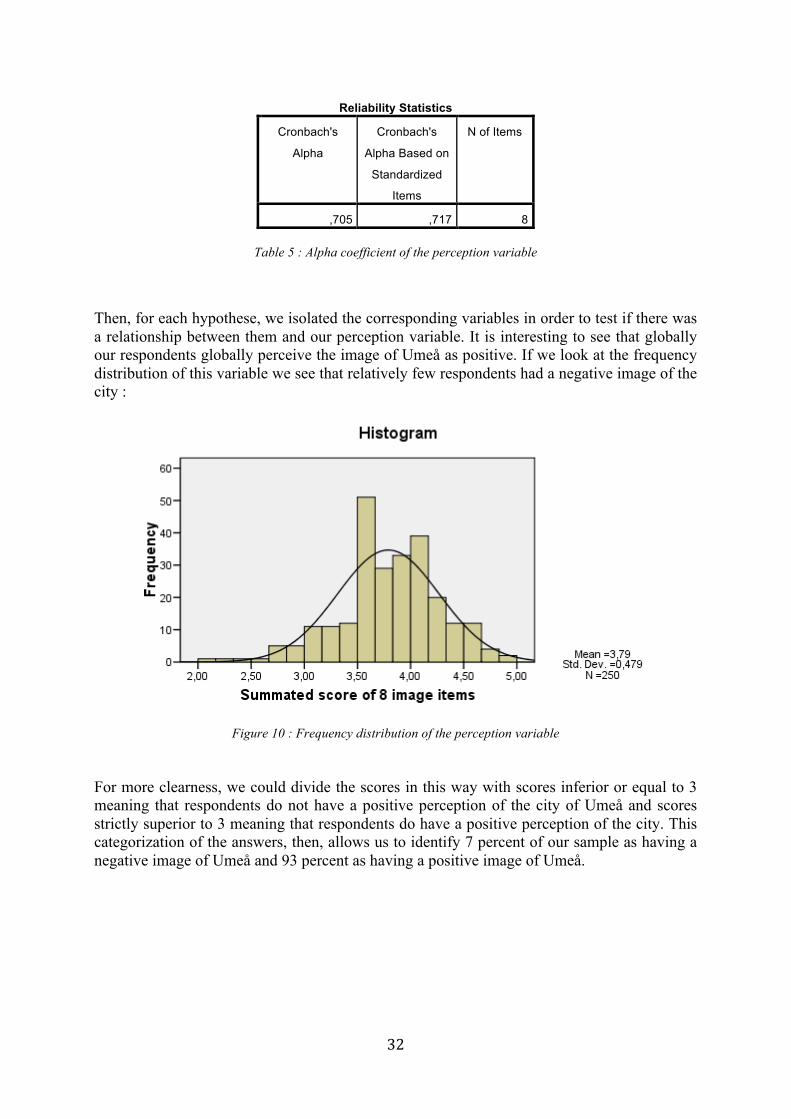
32
Reliability Statistics
Cronbach's
Alpha
Cronbach's
Alpha Based on
Standardized
Items
N of Items
,705 ,717 8
Table 5 : Alpha coefficient of the perception variable Then, for each hypothese, we isolated the corresponding variables in order to test if there was a relationship between them and our perception variable. It is interesting to see that globally our respondents globally perceive the image of Umeå as positive. If we look at the frequency distribution of this variable we see that relatively few respondents had a negative image of the city :
Figure 10 : Frequency distribution of the perception variable For more clearness, we could divide the scores in this way with scores inferior or equal to 3 meaning that respondents do not have a positive perception of the city of Umeå and scores strictly superior to 3 meaning that respondents do have a positive perception of the city. This categorization of the answers, then, allows us to identify 7 percent of our sample as having a negative image of Umeå and 93 percent as having a positive image of Umeå.
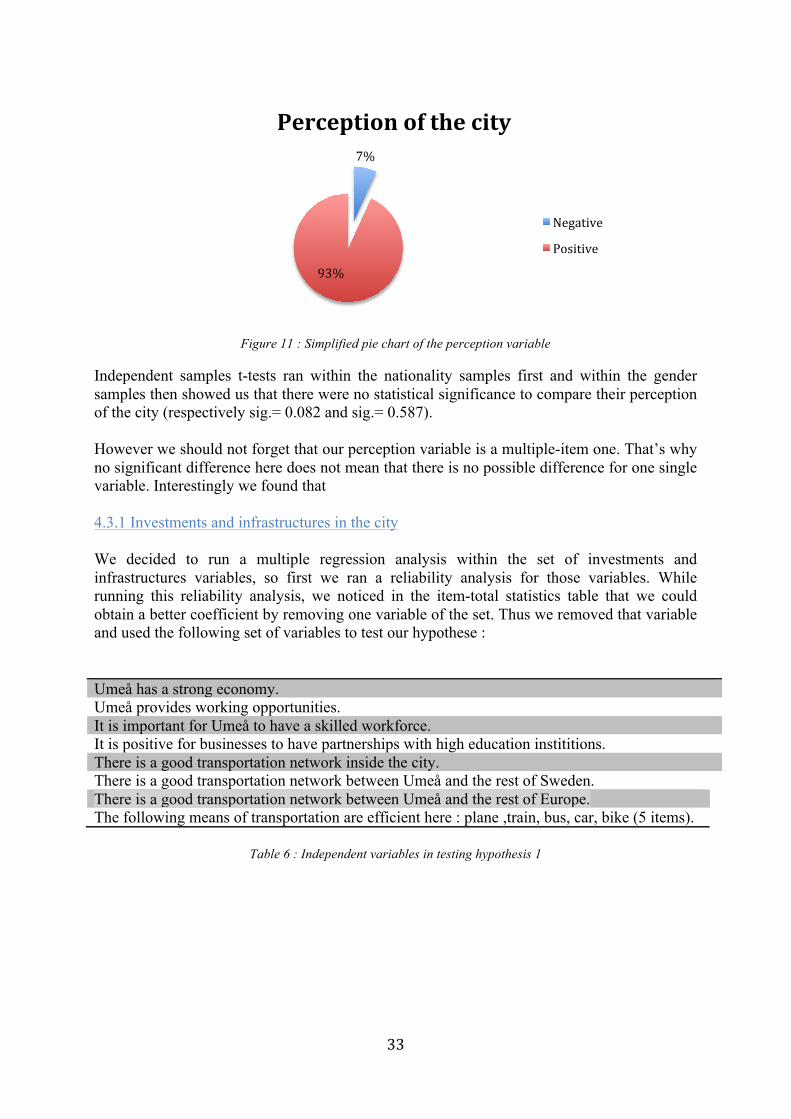
33
Figure 11 : Simplified pie chart of the perception variable
Independent samples t-tests ran within the nationality samples first and within the gender samples then showed us that there were no statistical significance to compare their perception of the city (respectively sig.= 0.082 and sig.= 0.587). However we should not forget that our perception variable is a multiple-item one. That’s why no significant difference here does not mean that there is no possible difference for one single variable. Interestingly we found that 4.3.1 Investments and infrastructures in the city We decided to run a multiple regression analysis within the set of investments and infrastructures variables, so first we ran a reliability analysis for those variables. While running this reliability analysis, we noticed in the item-total statistics table that we could obtain a better coefficient by removing one variable of the set. Thus we removed that variable and used the following set of variables to test our hypothese : Umeå has a strong economy. Umeå provides working opportunities. It is important for Umeå to have a skilled workforce. It is positive for businesses to have partnerships with high education instititions. There is a good transportation network inside the city. There is a good transportation network between Umeå and the rest of Sweden. There is a good transportation network between Umeå and the rest of Europe. The following means of transportation are efficient here : plane ,train, bus, car, bike (5 items).
Table 6 : Independent variables in testing hypothesis 1
7%
93%
Perception of the city
Negative
Positive
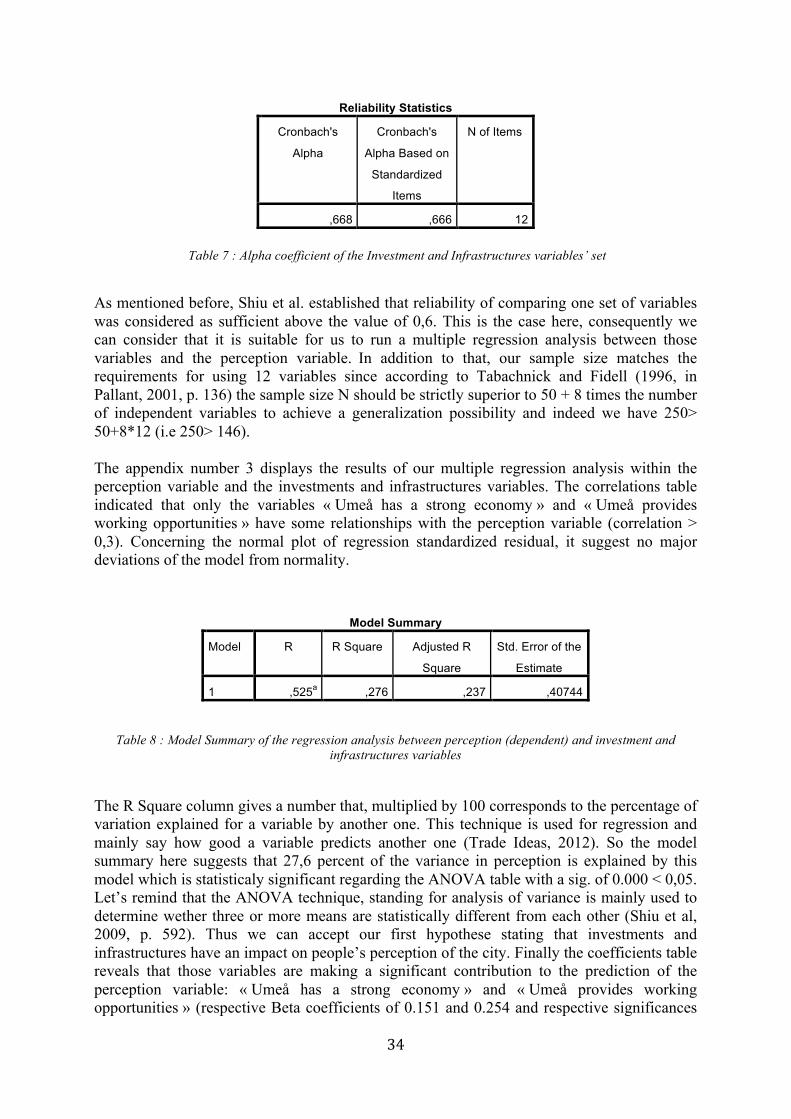
34
Reliability Statistics
Cronbach's
Alpha
Cronbach's
Alpha Based on
Standardized
Items
N of Items
,668 ,666 12
Table 7 : Alpha coefficient of the Investment and Infrastructures variables’ set As mentioned before, Shiu et al. established that reliability of comparing one set of variables was considered as sufficient above the value of 0,6. This is the case here, consequently we can consider that it is suitable for us to run a multiple regression analysis between those variables and the perception variable. In addition to that, our sample size matches the requirements for using 12 variables since according to Tabachnick and Fidell (1996, in Pallant, 2001, p. 136) the sample size N should be strictly superior to 50 + 8 times the number of independent variables to achieve a generalization possibility and indeed we have 250> 50+8*12 (i.e 250> 146). The appendix number 3 displays the results of our multiple regression analysis within the perception variable and the investments and infrastructures variables. The correlations table indicated that only the variables « Umeå has a strong economy » and « Umeå provides working opportunities » have some relationships with the perception variable (correlation > 0,3). Concerning the normal plot of regression standardized residual, it suggest no major deviations of the model from normality.
Model Summary
Model R R Square Adjusted R
Square
Std. Error of the
Estimate
1 ,525a ,276 ,237 ,40744
Table 8 : Model Summary of the regression analysis between perception (dependent) and investment and infrastructures variables
The R Square column gives a number that, multiplied by 100 corresponds to the percentage of variation explained for a variable by another one. This technique is used for regression and mainly say how good a variable predicts another one (Trade Ideas, 2012). So the model summary here suggests that 27,6 percent of the variance in perception is explained by this model which is statisticaly significant regarding the ANOVA table with a sig. of 0.000 < 0,05. Let’s remind that the ANOVA technique, standing for analysis of variance is mainly used to determine wether three or more means are statistically different from each other (Shiu et al, 2009, p. 592). Thus we can accept our first hypothese stating that investments and infrastructures have an impact on people’s perception of the city. Finally the coefficients table reveals that those variables are making a significant contribution to the prediction of the perception variable: « Umeå has a strong economy » and « Umeå provides working opportunities » (respective Beta coefficients of 0.151 and 0.254 and respective significances
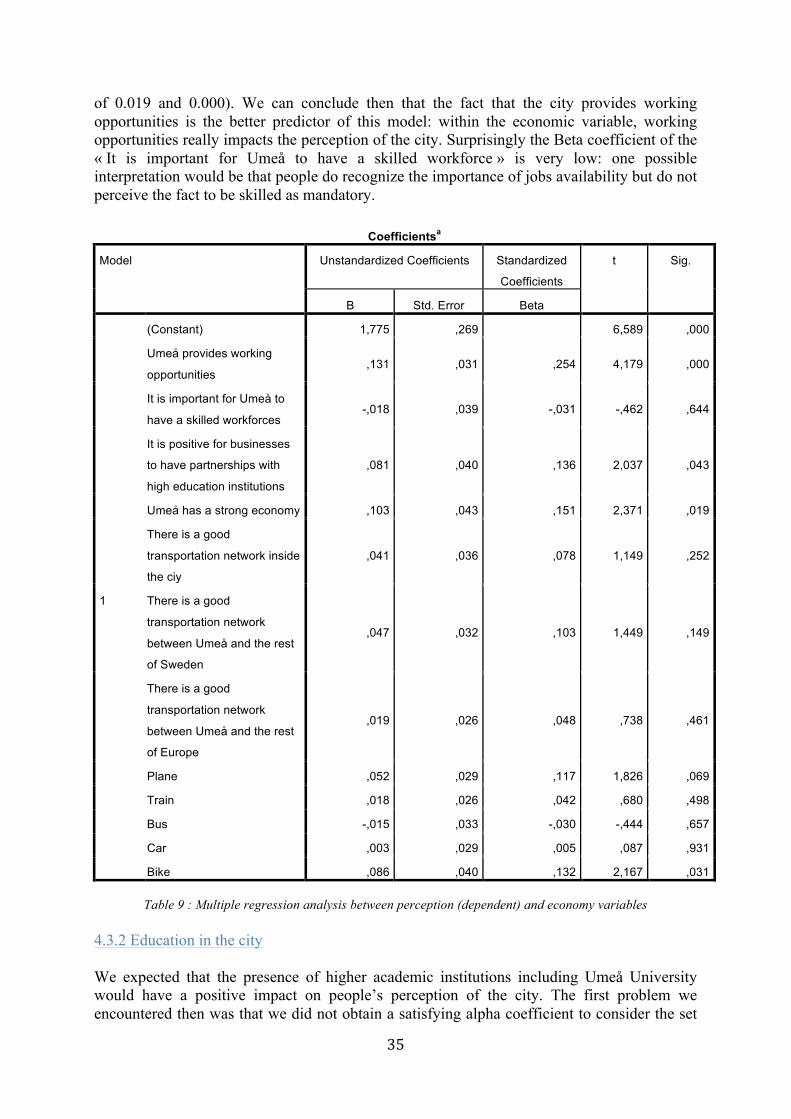
35
of 0.019 and 0.000). We can conclude then that the fact that the city provides working opportunities is the better predictor of this model: within the economic variable, working opportunities really impacts the perception of the city. Surprisingly the Beta coefficient of the « It is important for Umeå to have a skilled workforce » is very low: one possible interpretation would be that people do recognize the importance of jobs availability but do not perceive the fact to be skilled as mandatory.
Coefficientsa
Model Unstandardized Coefficients Standardized
Coefficients
t Sig.
B Std. Error Beta
1
(Constant) 1,775 ,269 6,589 ,000
Umeå provides working
opportunities ,131 ,031 ,254 4,179 ,000
It is important for Umeå to
have a skilled workforces -,018 ,039 -,031 -,462 ,644
It is positive for businesses
to have partnerships with
high education institutions
,081 ,040 ,136 2,037 ,043
Umeå has a strong economy ,103 ,043 ,151 2,371 ,019
There is a good
transportation network inside
the ciy
,041 ,036 ,078 1,149 ,252
There is a good
transportation network
between Umeå and the rest
of Sweden
,047 ,032 ,103 1,449 ,149
There is a good
transportation network
between Umeå and the rest
of Europe
,019 ,026 ,048 ,738 ,461
Plane ,052 ,029 ,117 1,826 ,069
Train ,018 ,026 ,042 ,680 ,498
Bus -,015 ,033 -,030 -,444 ,657
Car ,003 ,029 ,005 ,087 ,931
Bike ,086 ,040 ,132 2,167 ,031
Table 9 : Multiple regression analysis between perception (dependent) and economy variables 4.3.2 Education in the city We expected that the presence of higher academic institutions including Umeå University would have a positive impact on people’s perception of the city. The first problem we encountered then was that we did not obtain a satisfying alpha coefficient to consider the set
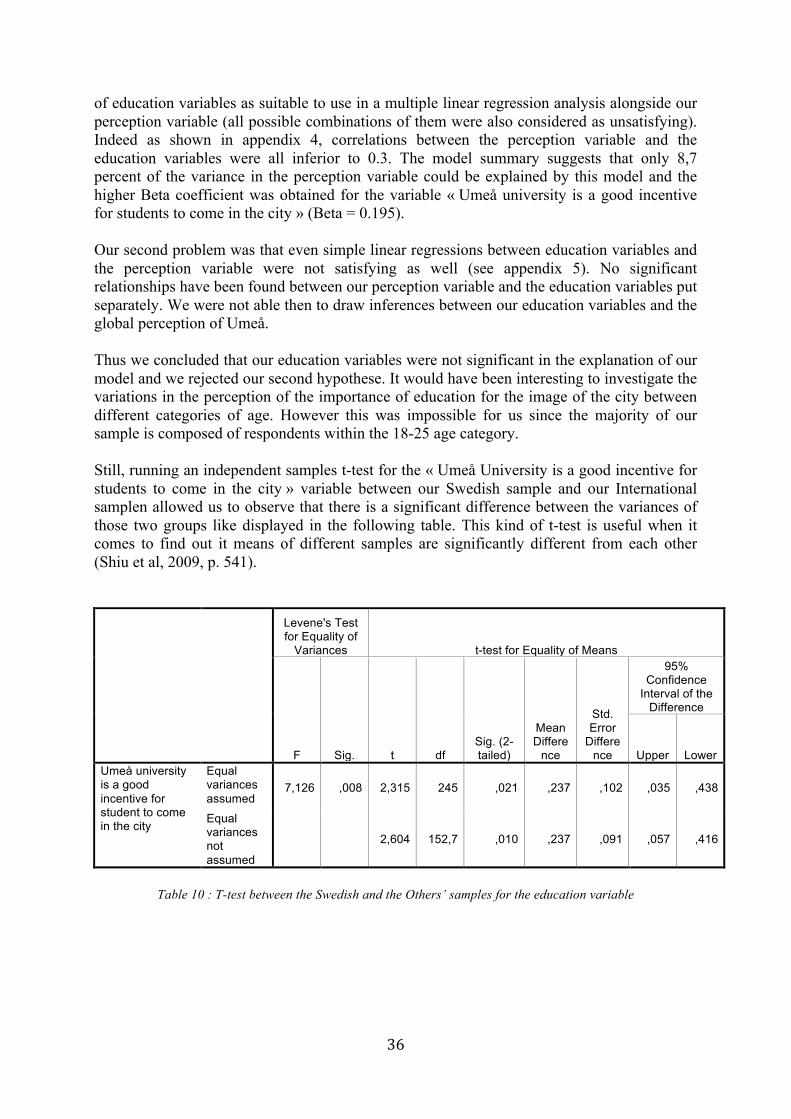
36
of education variables as suitable to use in a multiple linear regression analysis alongside our perception variable (all possible combinations of them were also considered as unsatisfying). Indeed as shown in appendix 4, correlations between the perception variable and the education variables were all inferior to 0.3. The model summary suggests that only 8,7 percent of the variance in the perception variable could be explained by this model and the higher Beta coefficient was obtained for the variable « Umeå university is a good incentive for students to come in the city » (Beta = 0.195). Our second problem was that even simple linear regressions between education variables and the perception variable were not satisfying as well (see appendix 5). No significant relationships have been found between our perception variable and the education variables put separately. We were not able then to draw inferences between our education variables and the global perception of Umeå. Thus we concluded that our education variables were not significant in the explanation of our model and we rejected our second hypothese. It would have been interesting to investigate the variations in the perception of the importance of education for the image of the city between different categories of age. However this was impossible for us since the majority of our sample is composed of respondents within the 18-25 age category. Still, running an independent samples t-test for the « Umeå University is a good incentive for students to come in the city » variable between our Swedish sample and our International samplen allowed us to observe that there is a significant difference between the variances of those two groups like displayed in the following table. This kind of t-test is useful when it comes to find out it means of different samples are significantly different from each other (Shiu et al, 2009, p. 541).
Levene's Test for Equality of
Variances t-test for Equality of Means
F Sig. t df Sig. (2-tailed)
Mean Differe
nce
Std. Error
Difference
95% Confidence
Interval of the Difference
Upper Lower Umeå university is a good incentive for student to come in the city
Equal variances assumed
7,126 ,008 2,315 245 ,021 ,237 ,102 ,035 ,438
Equal variances not assumed
2,604 152,7 ,010 ,237 ,091 ,057 ,416
Table 10 : T-test between the Swedish and the Others’ samples for the education variable
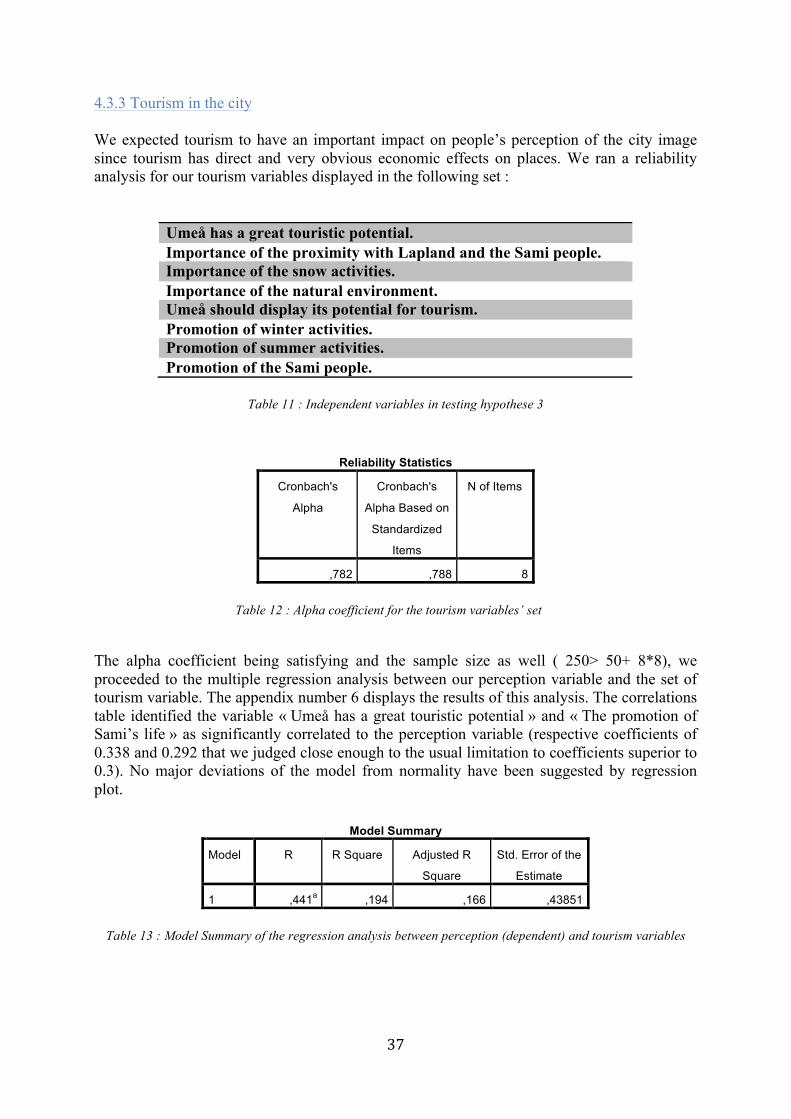
37
4.3.3 Tourism in the city We expected tourism to have an important impact on people’s perception of the city image since tourism has direct and very obvious economic effects on places. We ran a reliability analysis for our tourism variables displayed in the following set :
Umeå has a great touristic potential. Importance of the proximity with Lapland and the Sami people. Importance of the snow activities. Importance of the natural environment. Umeå should display its potential for tourism. Promotion of winter activities. Promotion of summer activities. Promotion of the Sami people.
Table 11 : Independent variables in testing hypothese 3
Reliability Statistics
Cronbach's
Alpha
Cronbach's
Alpha Based on
Standardized
Items
N of Items
,782 ,788 8
Table 12 : Alpha coefficient for the tourism variables’ set The alpha coefficient being satisfying and the sample size as well ( 250> 50+ 8*8), we proceeded to the multiple regression analysis between our perception variable and the set of tourism variable. The appendix number 6 displays the results of this analysis. The correlations table identified the variable « Umeå has a great touristic potential » and « The promotion of Sami’s life » as significantly correlated to the perception variable (respective coefficients of 0.338 and 0.292 that we judged close enough to the usual limitation to coefficients superior to 0.3). No major deviations of the model from normality have been suggested by regression plot.
Model Summary
Model R R Square Adjusted R
Square
Std. Error of the
Estimate
1 ,441a ,194 ,166 ,43851
Table 13 : Model Summary of the regression analysis between perception (dependent) and tourism variables

38
Coefficientsa
Model Unstandardized Coefficients Standardized
Coefficients
t Sig.
B Std. Error Beta
1
(Constant) 2,511 ,211 11,883 ,000
Umeå has a great touristic
potential ,124 ,032 ,250 3,832 ,000
The proximity with Lapland
and Sami people ,053 ,036 ,116 1,461 ,145
The snow activities -,058 ,046 -,109 -1,258 ,210
The natural enviroment ,037 ,039 ,066 ,930 ,353
Umeå should display its
potential for tourism ,027 ,043 ,043 ,625 ,532
Umeå should advertise
winter activities ,053 ,051 ,084 1,036 ,301
Umeå should advertise
summer activities ,044 ,037 ,084 1,187 ,237
Umeå should advertise
Sami´s life ,059 ,035 ,128 1,703 ,090
Table 14: Multiple regression analysis between perception (dependent) and tourism variables
Tourism seems to have less impact that investments and infrastructures variable on people’s perception of the city since 19,4 percent of the variance of the perception variable can be explained by it. However the model is still significant regarding the ANOVA table which displays a sig. of 0.000, consequently we decided to accept our third hypothese stating that tourism has an impact on people’s perception of the city. The variables contributing the most in the model are unsurprisingly the most correlated to the perception variable. We can thus assume that touristic potential of Umeå is positively related to people’s image of the city. In addition to that best touristic advantage of the city of Umeå for the respondents seem to be the proximity to Lapland and the promotion of the Sami people. In the contrary the promotion of winter activities seem to have a negative impact on people’s perception of the city. 4.3.4 Culture and the European Capital of Culture event We ran a multiple regression analysis within the following set of cultural variables : Umeå is a multicultural city. Umeå has a rich history. Umeå has a wide cultural offer. Umeå should display a strong cultural activity. Umeå should advertize the history of the city.
Table 15 : Independent variables in testing hypothesis 5

39
Reliability Statistics
Cronbach's
Alpha
Cronbach's
Alpha Based on
Standardized
Items
N of Items
,593 ,595 5
Table 16 : Alpha coefficient for the culture variables’ set
The alpha of our selection of culture variables was lowest than the other sets, however we decided still to run the multiple regression analysis since it was almost equal to 0,6. We expected culture to be the most important factor in our model. Several assumptions were to be tested here. First we wanted to investigate the importance that people attributes to the European Capital of Culture event. Then we wanted to investigate if the promotion of culture had an impact on the perception of the city. More than 86 percent of our sample agree that the event constitutes an opportunity to develop the city, which show that people are quite confident concerning the outcomes of the event.
Model Summary
Model R R Square Adjusted R
Square
Std. Error of the
Estimate
1 ,814a ,663 ,656 ,27270
Table 17 : Model summary of the regression analysis between perception (dependent) and cultural variables
Coefficientsa
Model Unstandardized Coefficients Standardized
Coefficients
t Sig.
B Std. Error Beta
1
(Constant) 1,565 ,132 11,881 ,000
Umeå is a multicultural city ,193 ,022 ,339 8,613 ,000
Umeå has a rich history ,140 ,022 ,268 6,343 ,000
Umeå has a wide cultural
offer ,221 ,019 ,474 11,507 ,000
Umeå should display a
strong cultural activity ,014 ,027 ,021 ,507 ,612
Umeå should advertise the
history of the city ,046 ,020 ,101 2,329 ,021
Table 18 : Multiple regression analysis between perception (dependent) and cultural variables
Culture seems to have a great impact on people’s perception of the city since the model summary points out that 66,3 per cent of the variance in the perception variable can be

40
explained by this model. Consequently we confirm our last hypothese stating that culture has an impact on people’s perception of the city. In the previous coefficients table we can see that « Umeå has a wide cultural offer » is the most important variable in this model, followed by « Umeå is a multicultural city », « Umeå has a rich history » and to a less important extent : « Umeå should advertise the history of the city. We notice that the first variables evocated before all display a significance coefficient of 0.000 which is satisfying. The last variable displays a 0.021 significance coefficient which is also acceptable since inferior to 0.05. Thus we can affirm that the promotion of cultural activity matters a lot in the promotion of the city itself. Also, respondents look at history as an interesting attribute to display. This reflects the need of an identity for the city to be recognized throughout the country and the world. 4.3.5 Factor analysis
Component
1 2 3 Umeå provides working opportunities ,065 ,779 ,083
Umeå has a strong economy ,085 ,434 ,349
It is positive for businesses to have partnerships with high education institutions ,565 -,146 ,183
Umeå has a great touristic potential ,764 ,007 ,157
Umeå should advertise Sami´s life ,129 ,114 ,789
The proximity with Lapland and Sami people ,076 ,087 ,856
Umeå has a wide cultural offer ,626 ,403 ,000
Umeå is a multicultural city ,060 ,735 ,071
Umeå has a rich history ,599 ,329 -,055
Table 19: Rotated component matrix (varimax) Also, we found interesting to run a factor analysis with the more telling variables included in our previous tests. The previous rotated matrix indicates that the following variables “Umeå has a wide cultural offer” and “ Umeå has a rich history” can be included in one factor; interestingly they were part of the most important one in our cultural set of variables. Additional information here is that those variables could have been associated with the touristic potential of the city in another model. In the same way, “Umeå provides working opportunities” and “Umeå has a strong economy” can be included in a second factor while they were significant in our economic set of variables. It is also pertinent to notice that multiculturality and cultural offers can also be part of one factor in a new model. Finally, “Umeå should advertise Sami’s life” and “The proximity with Lapland and Sami people” weight in a third possible cluster and effectively those variables were important part of our tourism set of variables.
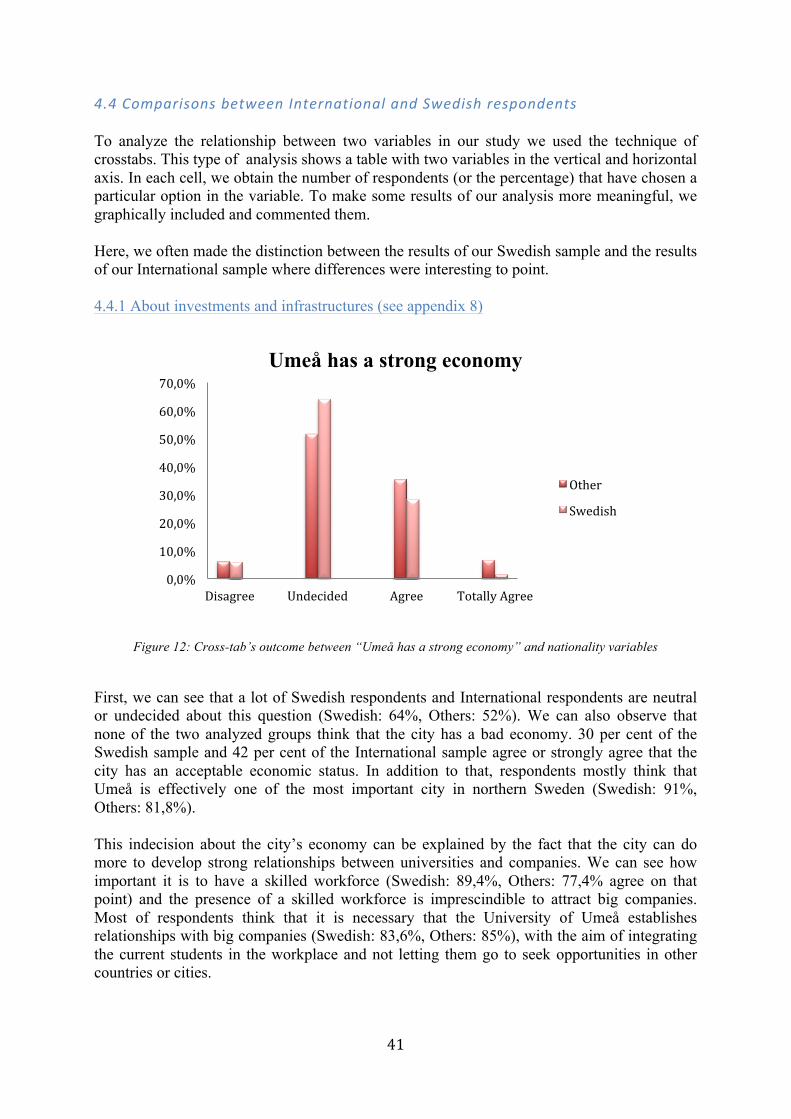
41
4.4 Comparisons between International and Swedish respondents To analyze the relationship between two variables in our study we used the technique of crosstabs. This type of analysis shows a table with two variables in the vertical and horizontal axis. In each cell, we obtain the number of respondents (or the percentage) that have chosen a particular option in the variable. To make some results of our analysis more meaningful, we graphically included and commented them. Here, we often made the distinction between the results of our Swedish sample and the results of our International sample where differences were interesting to point. 4.4.1 About investments and infrastructures (see appendix 8)
Figure 12: Cross-tab’s outcome between “Umeå has a strong economy” and nationality variables
First, we can see that a lot of Swedish respondents and International respondents are neutral or undecided about this question (Swedish: 64%, Others: 52%). We can also observe that none of the two analyzed groups think that the city has a bad economy. 30 per cent of the Swedish sample and 42 per cent of the International sample agree or strongly agree that the city has an acceptable economic status. In addition to that, respondents mostly think that Umeå is effectively one of the most important city in northern Sweden (Swedish: 91%, Others: 81,8%). This indecision about the city’s economy can be explained by the fact that the city can do more to develop strong relationships between universities and companies. We can see how important it is to have a skilled workforce (Swedish: 89,4%, Others: 77,4% agree on that point) and the presence of a skilled workforce is imprescindible to attract big companies. Most of respondents think that it is necessary that the University of Umeå establishes relationships with big companies (Swedish: 83,6%, Others: 85%), with the aim of integrating the current students in the workplace and not letting them go to seek opportunities in other countries or cities.
0,0%
10,0%
20,0%
30,0%
40,0%
50,0%
60,0%
70,0%
Disagree Undecided Agree Totally Agree
Umeå has a strong economy
Other
Swedish
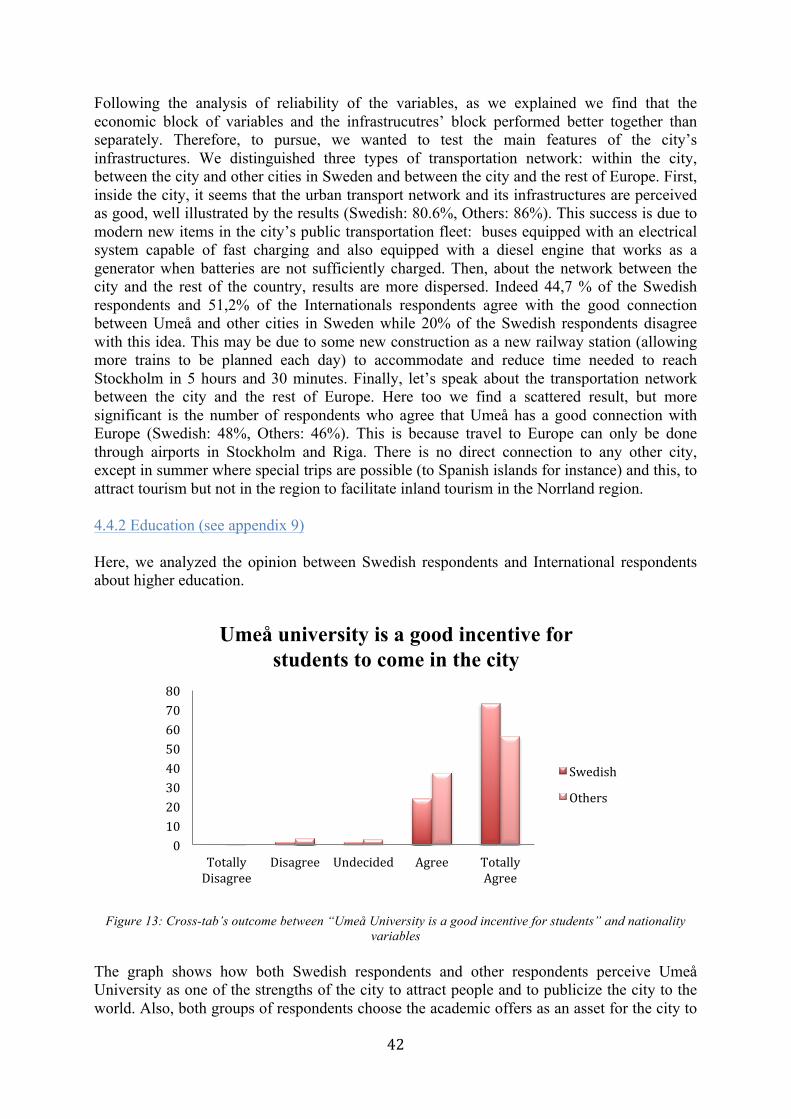
42
Following the analysis of reliability of the variables, as we explained we find that the economic block of variables and the infrastrucutres’ block performed better together than separately. Therefore, to pursue, we wanted to test the main features of the city’s infrastructures. We distinguished three types of transportation network: within the city, between the city and other cities in Sweden and between the city and the rest of Europe. First, inside the city, it seems that the urban transport network and its infrastructures are perceived as good, well illustrated by the results (Swedish: 80.6%, Others: 86%). This success is due to modern new items in the city’s public transportation fleet: buses equipped with an electrical system capable of fast charging and also equipped with a diesel engine that works as a generator when batteries are not sufficiently charged. Then, about the network between the city and the rest of the country, results are more dispersed. Indeed 44,7 % of the Swedish respondents and 51,2% of the Internationals respondents agree with the good connection between Umeå and other cities in Sweden while 20% of the Swedish respondents disagree with this idea. This may be due to some new construction as a new railway station (allowing more trains to be planned each day) to accommodate and reduce time needed to reach Stockholm in 5 hours and 30 minutes. Finally, let’s speak about the transportation network between the city and the rest of Europe. Here too we find a scattered result, but more significant is the number of respondents who agree that Umeå has a good connection with Europe (Swedish: 48%, Others: 46%). This is because travel to Europe can only be done through airports in Stockholm and Riga. There is no direct connection to any other city, except in summer where special trips are possible (to Spanish islands for instance) and this, to attract tourism but not in the region to facilitate inland tourism in the Norrland region. 4.4.2 Education (see appendix 9) Here, we analyzed the opinion between Swedish respondents and International respondents about higher education.
Figure 13: Cross-tab’s outcome between “Umeå University is a good incentive for students” and nationality variables
The graph shows how both Swedish respondents and other respondents perceive Umeå University as one of the strengths of the city to attract people and to publicize the city to the world. Also, both groups of respondents choose the academic offers as an asset for the city to
0 10 20 30 40 50 60 70 80
Totally Disagree
Disagree Undecided Agree Totally Agree
Umeå university is a good incentive for students to come in the city
Swedish
Others
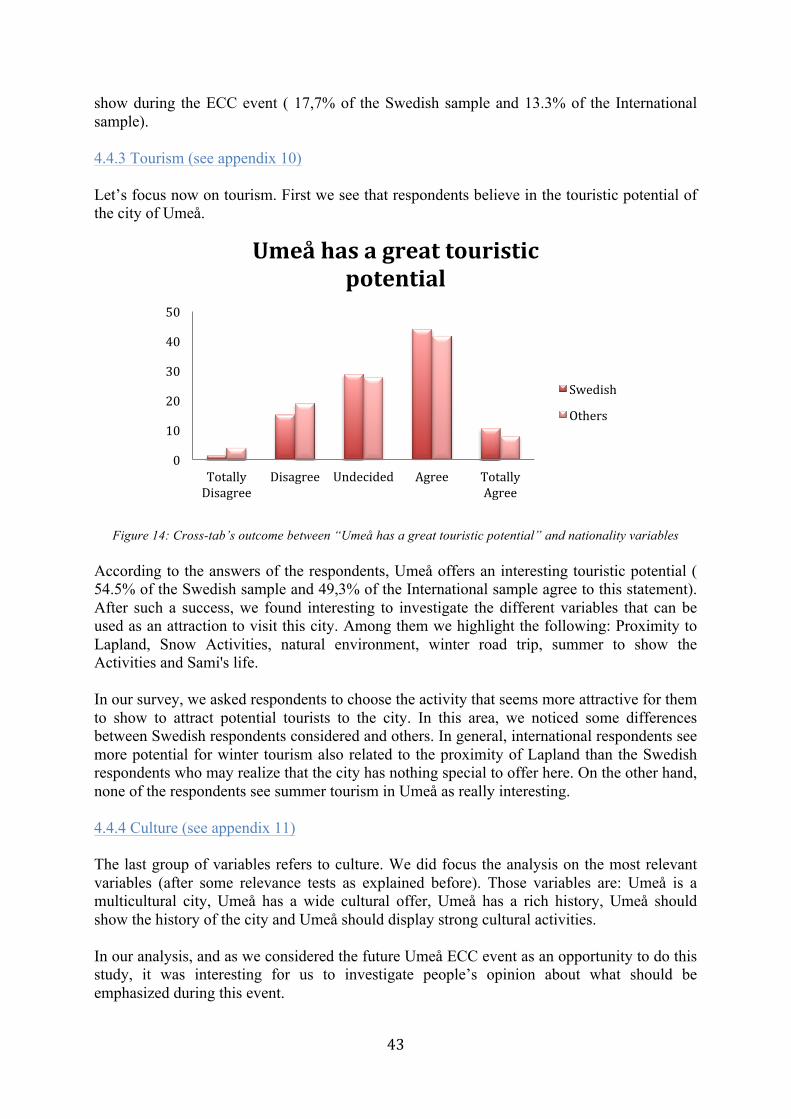
43
show during the ECC event ( 17,7% of the Swedish sample and 13.3% of the International sample). 4.4.3 Tourism (see appendix 10) Let’s focus now on tourism. First we see that respondents believe in the touristic potential of the city of Umeå.
Figure 14: Cross-tab’s outcome between “Umeå has a great touristic potential” and nationality variables According to the answers of the respondents, Umeå offers an interesting touristic potential ( 54.5% of the Swedish sample and 49,3% of the International sample agree to this statement). After such a success, we found interesting to investigate the different variables that can be used as an attraction to visit this city. Among them we highlight the following: Proximity to Lapland, Snow Activities, natural environment, winter road trip, summer to show the Activities and Sami's life. In our survey, we asked respondents to choose the activity that seems more attractive for them to show to attract potential tourists to the city. In this area, we noticed some differences between Swedish respondents considered and others. In general, international respondents see more potential for winter tourism also related to the proximity of Lapland than the Swedish respondents who may realize that the city has nothing special to offer here. On the other hand, none of the respondents see summer tourism in Umeå as really interesting. 4.4.4 Culture (see appendix 11) The last group of variables refers to culture. We did focus the analysis on the most relevant variables (after some relevance tests as explained before). Those variables are: Umeå is a multicultural city, Umeå has a wide cultural offer, Umeå has a rich history, Umeå should show the history of the city and Umeå should display strong cultural activities. In our analysis, and as we considered the future Umeå ECC event as an opportunity to do this study, it was interesting for us to investigate people’s opinion about what should be emphasized during this event.
0
10
20
30
40
50
Totally Disagree
Disagree Undecided Agree Totally Agree
Umeå has a great touristic potential
Swedish
Others
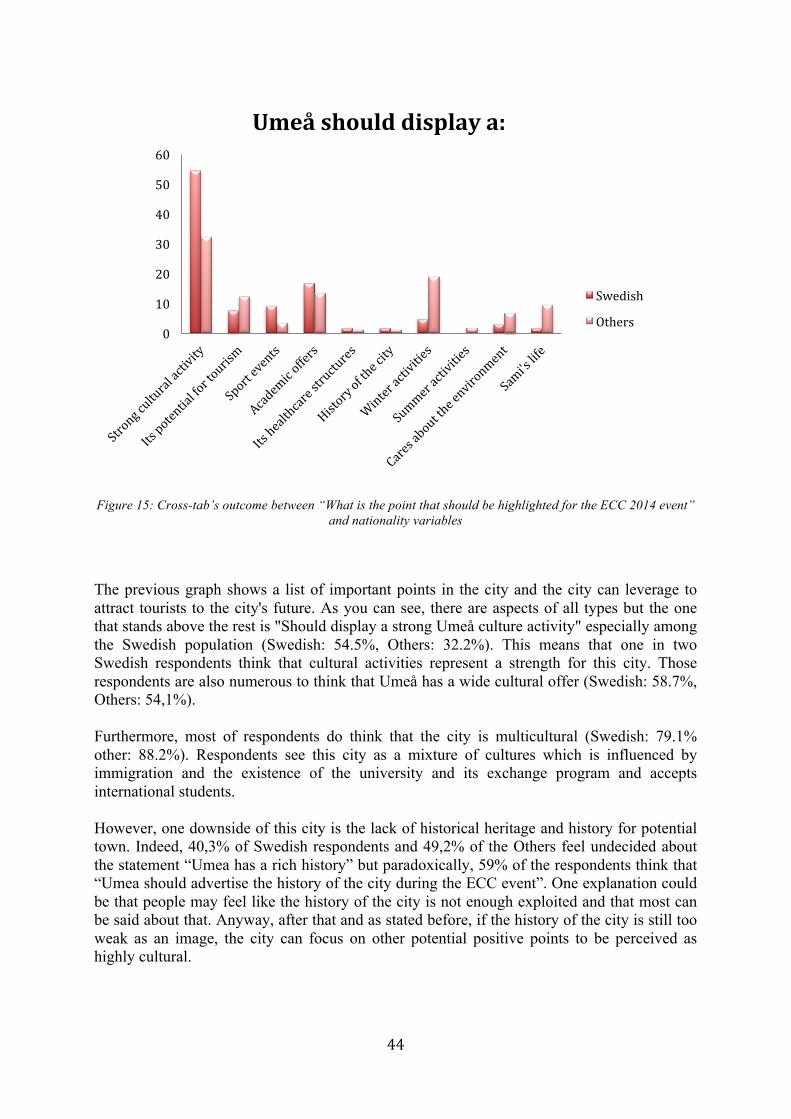
44
Figure 15: Cross-tab’s outcome between “What is the point that should be highlighted for the ECC 2014 event”
and nationality variables
The previous graph shows a list of important points in the city and the city can leverage to attract tourists to the city's future. As you can see, there are aspects of all types but the one that stands above the rest is "Should display a strong Umeå culture activity" especially among the Swedish population (Swedish: 54.5%, Others: 32.2%). This means that one in two Swedish respondents think that cultural activities represent a strength for this city. Those respondents are also numerous to think that Umeå has a wide cultural offer (Swedish: 58.7%, Others: 54,1%). Furthermore, most of respondents do think that the city is multicultural (Swedish: 79.1% other: 88.2%). Respondents see this city as a mixture of cultures which is influenced by immigration and the existence of the university and its exchange program and accepts international students. However, one downside of this city is the lack of historical heritage and history for potential town. Indeed, 40,3% of Swedish respondents and 49,2% of the Others feel undecided about the statement “Umea has a rich history” but paradoxically, 59% of the respondents think that “Umea should advertise the history of the city during the ECC event”. One explanation could be that people may feel like the history of the city is not enough exploited and that most can be said about that. Anyway, after that and as stated before, if the history of the city is still too weak as an image, the city can focus on other potential positive points to be perceived as highly cultural.
0
10
20
30
40
50
60
Umeå should display a:
Swedish
Others
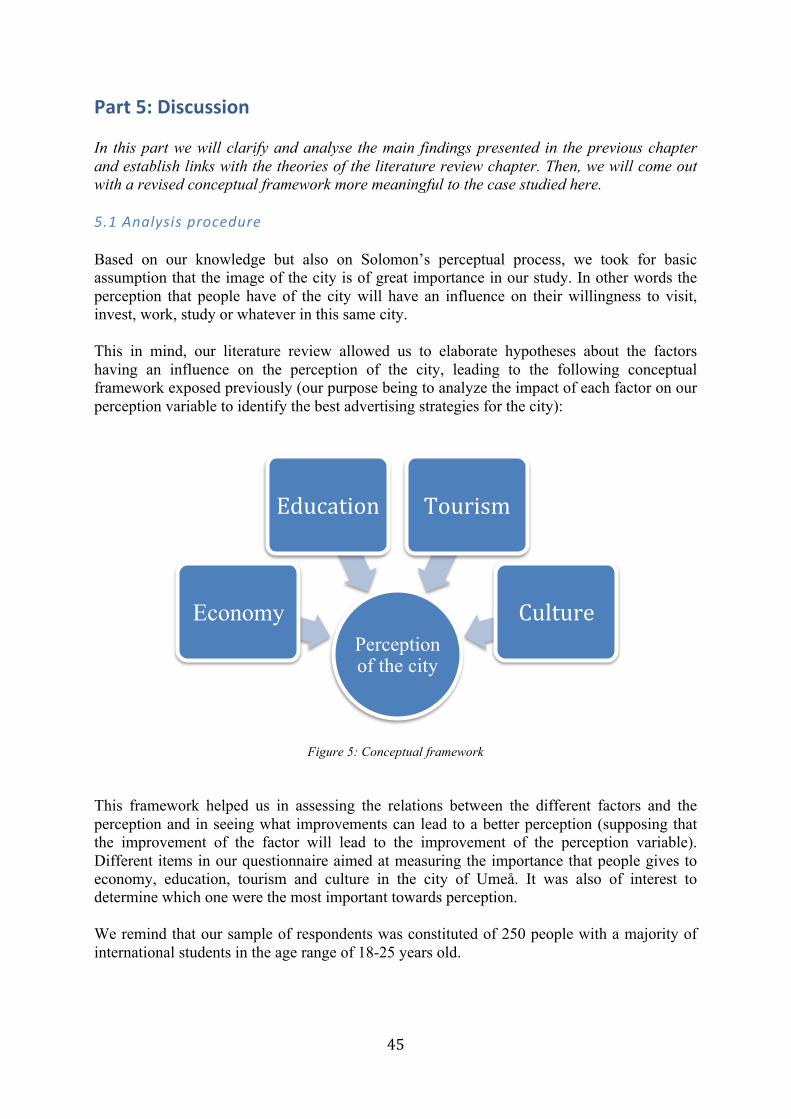
45
Part 5: Discussion In this part we will clarify and analyse the main findings presented in the previous chapter and establish links with the theories of the literature review chapter. Then, we will come out with a revised conceptual framework more meaningful to the case studied here. 5.1 Analysis procedure Based on our knowledge but also on Solomon’s perceptual process, we took for basic assumption that the image of the city is of great importance in our study. In other words the perception that people have of the city will have an influence on their willingness to visit, invest, work, study or whatever in this same city. This in mind, our literature review allowed us to elaborate hypotheses about the factors having an influence on the perception of the city, leading to the following conceptual framework exposed previously (our purpose being to analyze the impact of each factor on our perception variable to identify the best advertising strategies for the city):
Figure 5: Conceptual framework This framework helped us in assessing the relations between the different factors and the perception and in seeing what improvements can lead to a better perception (supposing that the improvement of the factor will lead to the improvement of the perception variable). Different items in our questionnaire aimed at measuring the importance that people gives to economy, education, tourism and culture in the city of Umeå. It was also of interest to determine which one were the most important towards perception. We remind that our sample of respondents was constituted of 250 people with a majority of international students in the age range of 18-25 years old.
Perception of the city
Economy
Education Tourism
Culture

46
5.2 Economy, education, tourism and culture towards the perception of the city Running multiple regression analysis with our sets of economical, educational, touristic and cultural variables allowed us to consider the weight of each of the factor of our conceptual framework. Our major findings can be summed up within those points: 5.2.1 Economy Let’s remind that we gathered the infrastructures’ variables and the investment’s variables to form a unique economical factor since the variables were more significant together. Economic features have always mattered in the functioning of the city. Several parts of our literature review demonstrate that: the payment of taxes in early cities (Gordon Childe, 1950, in cited in Michael E. Smith, 2009, p. 10), the choice by Copenhagen to develop its economic sector as a branding strategy for the city (Moilanen & Rainisto, 2009) or even the consideration of companies and investors as key actors of the city by Van den Berg and Braun (1999). Those last authors went even further in giving weight to economical features by claiming that the attractiveness of a given place depends of its welfare elements. Based on those theories, we expected the first factor of our conceptual framework, economy (gathering here investments and infrastructures that is to say the parameters of our first and second hypotheses) to be highly influencing the perception of the city and indeed our multiple regression analysis ran in the previous chapter showed that 27,6 % of the variance of our perception variable could be explained by our set of economic variables. Within the set of economic variables we noticed that only the following variables “Umeå provides working opportunities”, “Umeå has a strong economy” and “The efficiency of the plane as a mean of transportation” had a significant impact on people’s perception of the city as indicated by the correlations displayed in the multiple regression analysis between our perception variable (dependent) and our set of economic variables (including investment’ variables and infrastructures’ variables). Concerning the first variable, this finding is to relate with the fact that, as evocated before in the literature review, labour supply by the city is one of the most critical factors to attract potential residents (Kijkuit & Van den Ende, 2007). 5.2.2 Education
Education has been rejected of our conceptual framework since it was explaining only 8,4% of the variance of the perception variable. In addition to that no significant correlation has been found between our education variables and the perception of the city, unlikely to our expectations. Indeed, as our sample was composed of an important amount of students, we expected to have a relationship between the presence of the university and their perception of the city but it seems that our third hypothesis: Education has an influence on people’s perception of the city turned out to be too functional and not enough related to perception. Effectively, education has been demonstrated to be useful for the development of a city (the article of Van Vught, Garlick, Nordström & Yelland, 2006, deals with the impact of education on regional economic development) but most of people seem not to think that this factor is representative of the city. Education comes under functionality while perception comes under representationality. As De Chernatory and McWilliam pointed out in their four-cell matrix, there are two dimensions to consider while preparing branding strategies: functionality linked with physical attributes and representationality linked with what is transmitted as an image.

47
Indeed, education was linked to development in our literature review (Van Vught, Garlick, Nordström & Yelland, 2006) but our respondents do not link education with economy and consequently with development. This can explain the fact that their perception of the city is not connected to the education variables. Education offers are clearly essential to the functioning while tourism and culture are more matters of image. This explains the fact that correlating education with the perception of the city was less meaningful than to correlate tourism, economy and culture to this same perception variable. 5.2.3 Tourism Tourism is the third significant factor explaining 19,4% of the variance in the perception variable. Within this set the variables “Umeå has a great touristic potential”, “Umeå should advertise Sami’s life” and “The proximity with Lapland and Sami people” are the variables that have been proven significantly correlated with our perception variable. It shows that history and culture are to some extent part of the touristic potential of a place. Indeed, an important thing for tourist is to learn about the history of the place they are visiting. Consequently we can assume that the city of Umeå can use the Sami history as a symbol or an historical myth as suggested by Anholt (2004) even if Umeå does not really belong to Lapland (which explains that we found that Swedish respondents agree less on the importance of promoting this specific aspect than do International respondents). 5.2.4 Culture Culture is undoubtedly what matters more here in the perception of the city of Umeå since 66,3% of the variance of our perception variable can be explained by this factor. If we look into the variables’ set, we see that “Umeå is a multicultural city”, “Umeå has a wide cultural offer” and “Umeå has a rich history” are the most important variables in the cultural set when it comes to the relation with the perception of the city. This is linked with Anholt’s assumption of the importance for the city to display an image in relation with the possibility of this same city since this cultural aspect should be coherent with the image of the city abroad (Anholt, 2004). Culture matters a lot here, however we were aware of the fact that the opinion of our respondents may have been influenced by the imminence of the ECC 2014 event: 96,8 % of our sample was aware of this event. Our doubts were confirmed by running the same multiple regression analysis between our cultural set of variables and our perception variable while splitting our sample in two parts: the ones aware of the Umeå ECC 2014 event and the ones not aware of that. The regression was not significant for the second sample (low adjusted R square and a high Sig in the ANOVA) as highlighted in the following tables:
Model Summary
Did you know that Umea will be the
European Capital of Culture in
2014?
Model R R Square Adjusted R Square Std. Error of the
Estimate
NO 1 ,798a ,636 ,151 ,39954
YES 1 ,692a ,478 ,469 ,33693
Table 18 : Model summary of the Multiple Regression Analysis between the perception variable (dependent) and the cultural
variables
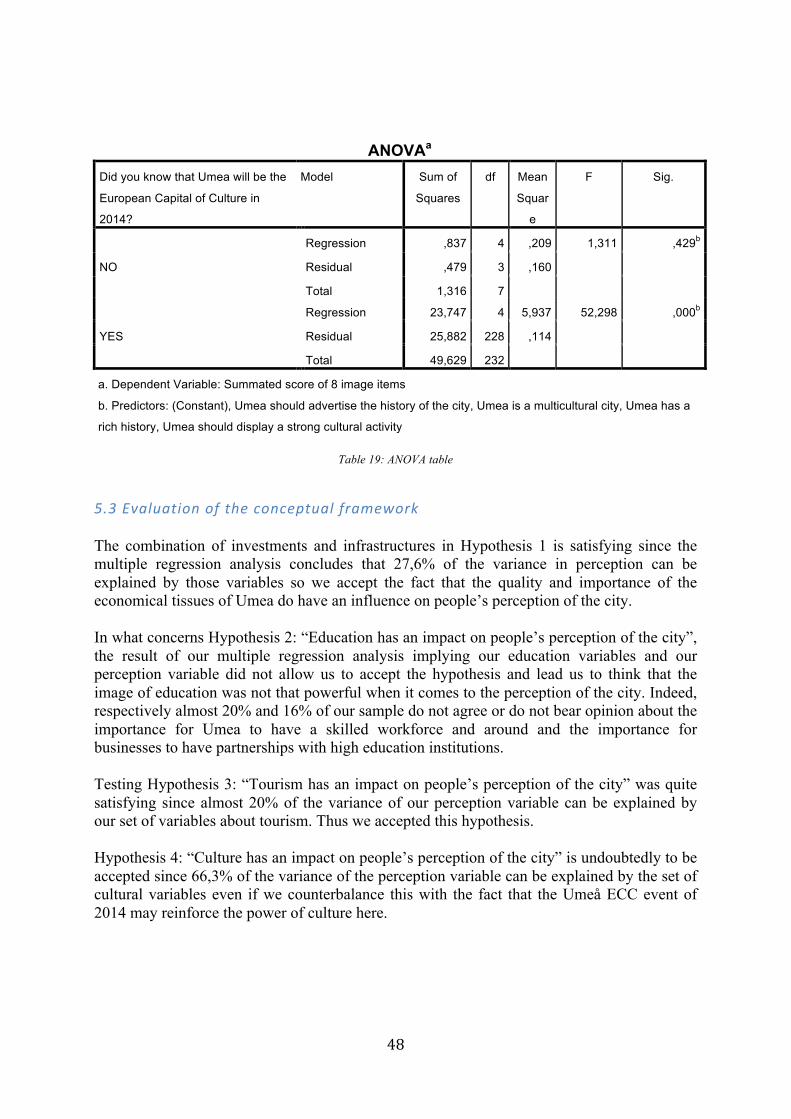
48
ANOVAa Did you know that Umea will be the
European Capital of Culture in
2014?
Model Sum of
Squares
df Mean
Squar
e
F Sig.
NO 1
Regression ,837 4 ,209 1,311 ,429b
Residual ,479 3 ,160
Total 1,316 7
YES 1
Regression 23,747 4 5,937 52,298 ,000b
Residual 25,882 228 ,114
Total 49,629 232
a. Dependent Variable: Summated score of 8 image items
b. Predictors: (Constant), Umea should advertise the history of the city, Umea is a multicultural city, Umea has a
rich history, Umea should display a strong cultural activity
Table 19: ANOVA table
5.3 Evaluation of the conceptual framework The combination of investments and infrastructures in Hypothesis 1 is satisfying since the multiple regression analysis concludes that 27,6% of the variance in perception can be explained by those variables so we accept the fact that the quality and importance of the economical tissues of Umea do have an influence on people’s perception of the city. In what concerns Hypothesis 2: “Education has an impact on people’s perception of the city”, the result of our multiple regression analysis implying our education variables and our perception variable did not allow us to accept the hypothesis and lead us to think that the image of education was not that powerful when it comes to the perception of the city. Indeed, respectively almost 20% and 16% of our sample do not agree or do not bear opinion about the importance for Umea to have a skilled workforce and around and the importance for businesses to have partnerships with high education institutions. Testing Hypothesis 3: “Tourism has an impact on people’s perception of the city” was quite satisfying since almost 20% of the variance of our perception variable can be explained by our set of variables about tourism. Thus we accepted this hypothesis. Hypothesis 4: “Culture has an impact on people’s perception of the city” is undoubtedly to be accepted since 66,3% of the variance of the perception variable can be explained by the set of cultural variables even if we counterbalance this with the fact that the Umeå ECC event of 2014 may reinforce the power of culture here.
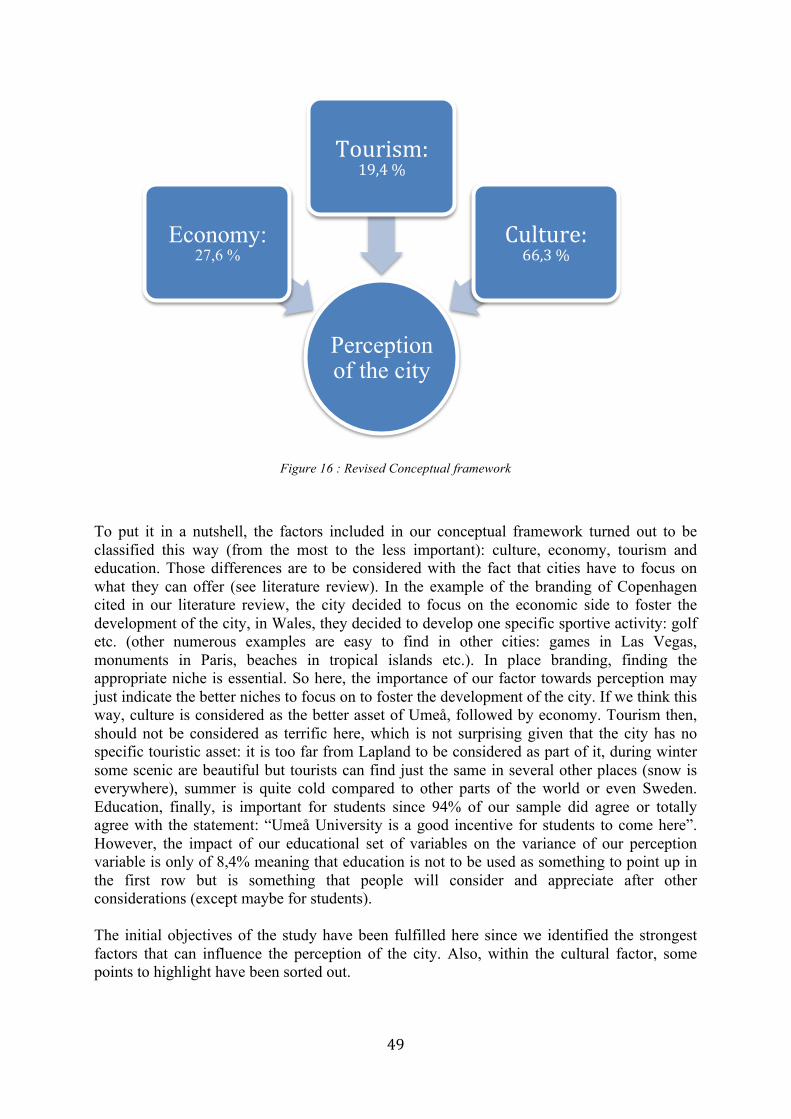
49
Figure 16 : Revised Conceptual framework
To put it in a nutshell, the factors included in our conceptual framework turned out to be classified this way (from the most to the less important): culture, economy, tourism and education. Those differences are to be considered with the fact that cities have to focus on what they can offer (see literature review). In the example of the branding of Copenhagen cited in our literature review, the city decided to focus on the economic side to foster the development of the city, in Wales, they decided to develop one specific sportive activity: golf etc. (other numerous examples are easy to find in other cities: games in Las Vegas, monuments in Paris, beaches in tropical islands etc.). In place branding, finding the appropriate niche is essential. So here, the importance of our factor towards perception may just indicate the better niches to focus on to foster the development of the city. If we think this way, culture is considered as the better asset of Umeå, followed by economy. Tourism then, should not be considered as terrific here, which is not surprising given that the city has no specific touristic asset: it is too far from Lapland to be considered as part of it, during winter some scenic are beautiful but tourists can find just the same in several other places (snow is everywhere), summer is quite cold compared to other parts of the world or even Sweden. Education, finally, is important for students since 94% of our sample did agree or totally agree with the statement: “Umeå University is a good incentive for students to come here”. However, the impact of our educational set of variables on the variance of our perception variable is only of 8,4% meaning that education is not to be used as something to point up in the first row but is something that people will consider and appreciate after other considerations (except maybe for students). The initial objectives of the study have been fulfilled here since we identified the strongest factors that can influence the perception of the city. Also, within the cultural factor, some points to highlight have been sorted out.
Perception of the city
Economy: 27,6 %
Tourism: 19,4 %
Culture: 66,3 %
50
Part 6: Conclusion 6.1 General conclusions The principal goal of our survey was to identify the principal points to focus on in order to develop and improve the image of the city of Umeå. Thus the results can serve as simple pieces of advice for urban planners and managers of the city of Umeå. However, prior to this investigation, it was important for us to determine what is the actual image of the city of Umeå as a starting point. Finally, as the city is going to host the European Capital of Culture event in 2014, it was interesting for us to investigate what is people’s perception of this. To provide answers to these questions, we designed one questionnaire declined in two languages: English and Swedish. Each part of the questionnaire actually corresponds to one research question and the dataset obtained from the analysis of the answers of our 250 respondents’ sample via the SPSS software. RQ1: What is the general image that people have about Umeå? We created a perception variable by computing 8 variables of the first part of our questionnaire and the mean obtained is 3,79 which is closest to 4 standing for “agree” than 3 standing for “undecided”. By looking at the detail of the mean scores of the components of this multiple item variable we realized that the better scores were achieved by the variables “Umeå is a pleasant city”, “Umeå is a multicultural city” and “Umeå is one of the most important cities in Norrland” while the lowest score corresponded to the “Umeå has a rich history”. We also noticed that our International sample scored the perception variable slightly higher than our International sample. However an independent sample t-test for this variable indicated that there was no real statistical significance in comparing those samples. RQ2: What are the key points to focus on in order to improve the image of the city of Umeå? Our conceptual framework model aimed at analysing the weight of the impact of the different factors investigated in the second part of our questionnaire on the perception that people have of the city of Umeå. The results of our analysis showed that culture has the most important impact on the perception of the city. This means that fostering cultural activity in the city would impact the image of the city in a positive way since there is a positive correlation between the cultural set of variables and the perception variable. Also, but in a less important way, the better the economy is perceived and the better would be the perception of the city. Finally improvements in the tourism sector would also benefit the image of Umeå. RQ3: In people’s mind, what asset of the city of Umeå should be highlighted during the European Capital of Culture event in 2014? By looking at the frequency table of the variable “In your opinion, what is the point that should be emphasized during the ECC 2014 event”, we saw that cultural activity had the highest score with 38 per cent of the answers, which is understandable since this event should obviously be focusing on culture. However, Swedish respondents rated the item with a higher grade than International respondents (54,5 per cent against 32,2 per cent). Then for the total sample again the second best rated item was the promotion of winter activities (15 per cent of the answers). The interesting thing to notice here is that this variable obtains a really higher

51
grade among the International sample and a low one among the Swedish sample (19 per cent against 4,5 per cent). The same occurs for the variable “promotion of Sami’s life”. Then managers of the city of Umeå should not forget that they do not only need to care about the wants of the Swedish residents but that they also need to take into account the opinion of Internationals, especially since the city intends to attract foreigners and to gain more international visibility. Finally “the promotion of academic offers” got the third highest score with 14,2 per cent of the answers which is correlated to the fact that the variable “Umeå University is a good incentive for students to come here” displays a very high mean of 4,5. Thus we think that the ECC 2014 event is a good opportunity for the city to advertise its academic offers since it can provide it with more residents (even if they are short-term residents). However it is strange that respondents do not perceive the education factor of our model as important to improve the image of the city since they think that Umeå University is a good incentive for student to come in the city (the mean of the variable being 4,5). 6.2 Theoretical and Managerial Implications From a theoretical point of view, our dissertation adds content to the body of literature about application of city marketing theories to a specific place. We did not find any city-marketing- related article nor any example of marketing strategy applied to cities of the same type than Umeå (all that we find being mostly related to bigger cities much more touristic like Las Vegas, Paris, London etc.). That’s why our study is of interest: it brings something new and reminds that smaller cities can also benefit from marketing attention. Also, a great number of the city-marketing-related literature that we found was focusing on one or another asset of a given city while our study was meant to identify those assets for Umeå. We suspect that often, urban planners do not even ask for people opinion about what can be done and immediately make their plans with what they think should be done leading to marketing myopia cases. Consequently our study represents something new and rather unreleased that researchers and urban planners can rely on. Later on, the analysis of the results of this study alongside with the strategy employed by the staff of the Umeå Capital of Culture event of 2014 and the outcomes of the event can serve as a model of strategy implementation. We can also assume that the implications of the present study can be the same for similar cities needing to attract people for development purposes. From a practical and managerial point of view, it stresses some interesting insights about the perception of people of what can be done to improve the image of the city of Umeå. The strong internationality of our sample can be seen as a strength since the ECC event is clearly aiming at ensuring the promotion of the city internationally (at a European level but also at a worldwide level). That’s why having international opinions is precious. However we do think that urban planners should consider the differences (when there are some) between the international sample results and the national sample results. Then, as an immediate outcome, concerning the European Capital of Culture event of 2014, we think that the city of Umeå can obtain good results in the city promotion by scrutinizing the results of our study and by extending it to other aspects that we did not investigate because of lack of time, because it is a great opportunity to promote the city in front of Europe.

52
6.3 Limitations Our sample being almost restricted to students of the University of Umeå (except for the face-to-face data collection), we cannot generalize it to the population of the city of Umeå. Indeed 81 per cent of our sample belongs to the 18-25 age category. Also the use of English in the questionnaire designed for our International sample can have lead to misunderstandings since English is not the native language of most of the international students in the university of Umeå. In addition to that, the scope of our survey has been reduced by the lack of time and money that we experienced as students. Also, our main findings obtained by the multiple regression analysis did not take into account the fact that we found several discrepancies between the samples whereas some findings could have been more meaningful by dividing the samples. We just considered that we should deal with the heterogeneity of our sample while running our analyses. 6.4 Further research To be more reliable further similar research should be done using a more homogeneous sample. Also doing a qualitative study on the same topic can add more in-depth information about the topic. Indeed quantitative studies do not really measure people’s attitudes and behaviors while qualitative studies offer more opportunities to observe and understand this kind of variable. It could be also interesting to ask the Umeå 2014 ECC event about their strategies and the different studies they did before starting their communication campaign since their objectives are quite the same than the objectives of this study. Their strategies are undoubtedly closer to reality since they are implementing them and they have a limited budget to achieve their objectives.
53
Reference List: Articles Berg, L. van den & Braun, E., 1999. Urban Competitiveness, Marketing and the Need for Organising Capacity. Urban Studies, 36, p. 987-999. Bomfim, Z.A.C., Urrutia, E.P. (2005) Affective dimension in cognitive maps of Barcelona and Sao Paulo. International Journal of Psychology. Vol. 40 (1), 37-50. Braun, E. (2008). City Marketing: Towards and integrated approach. Rotterdam: Erasmus Research Institute of Management (ERIM). Chi, W., Qian, X. (2010) The role of education in regional innovation activities: spatial evidence from China. Journal of the Asia Pacific Economy. Vol. 15 (4), 396-419 Fulmer, J.E. (2009) What in the world is infrastructure?. Investment Strategy. July/August, 30-32. Hospers, G.J. (2010) Lynch´s The Image of the City after 50 Years: City Marketing Lessons from an Urban Planning Classic. European Planning Studies. Vol. 18 (12), 2073-2081.
Kavaratzis, M. (2004). From city marketing to city branding : Towards a theoretical framework for developing city brands. Place branding. Vol. 1 (1), 58-73
Kampshulte, A. (1999) ‘Image as an instrument of urban management’, Geographica Helvetica, Vol. 54, No. 4, pp. 229–241. Kijkuit, B., Enden van den. J. (2007) Networks in the Front End: The Organizational Life of an Idea. Journal of Management Studies, Vol. 44 Issue 6, p863-882 Kotler, P., Levy, S.J. (1969) Broadening the Concept of marketing. Journal of Marketing. Vol. 33, No 1, 10-15. Levitt, T., (1960). Marketing myopia. Harvard Business Review, July/August, 3-13. Tross, O. (2006). Implementation of City Marketing. Master. Giessen Friedberg University of applied sciences. German.

54
Likert, R. (1932). A Technique for the Measurement of Attitudes. Archives of Psychology. 140: 1–55. Morello, E., Ratti, C. (2009) A digital image of the city: 3D isovists in Lynch´s urban analysis. Environment and Planning B: Planning and design. Vol. 36, 837-853. Richards, G., Wilson, J. (2004). The Impact of Cultural Events on City Image: Rotterdam, Cultural Capital of Europe 2001. Urban Studies, Vol.41, No. 10, 1931-1951. Sattler, H., Högl, S., Hupp, O. (2002). Evaluation of the Financial Value of Brands. University of Hamburg. August (7). Van Vught, F., Garlick, S., Nordström, L., Yelland, R. (2006). Supporting the Contribution of Higher Education Institutions to Regional Development., Värmland Region Sweden. Books Aaker, D. (2002). Building strong brands. First Edition. New-York: Free Print. Anholt, S. (2004). Nation-brands and the value of provenance. In N. Morgan, A. Pritchard, R. Pride, Destination branding. Burlington: Elsevier Butterworth-Heinemann. pp. 26-39.
Bryman, A., & Bell, E. (2011). Business Research Methods. 3rd Edition. Oxford University Press. NewYork
Colman, A., Pulford, B. (2006). A Crash Course in SSPS for Windows. 3rd Edition. Blackwell Publishing. United kingdom.
Holliday, A. R. (2007). Doing and Writing Qualitative Research. 2nd Edition. Sage Publications. London:
Kotler, P., Gertner, D. (2004). Country as brand, product and beyond: a place marketing and brand management perspective. In N. Morgan, A. pritchard, R. Pride, Destination branding. Burlington: Elsevier Butterworth-Heinemann. pp 40-55. Kotler, P., Keller, K. L. (2009) Marketing Management. 13th edition. New Jersey: Pearson/Prentice-Hall. McMahon, W.W., (1999). Education and Development: measuring the social benefits. Oxford University Press. New York.
55
Moilanen, T., Rainisto, S. (2009). City and destination branding. In T. Moilanen, S. Rainisto, Theorical Framework for Developing a Place Brand. London: Palgrave Macmillan. pp. 3-22. Moilanen, T., Rainisto, S. (2009). How to brand nations, cities and destinations. London: Palgrave Macmillan. Pallant, J. (2001) SPSS Survival Manual. First Edition. Open University Press. USA. Pride, R. (2004). A challenger brand: Wales, golf as it should be. In N. Morgan, A. Pritchard, R. Pride, Destination branding. Burlington: Elsevier Butterworth-Heinemann. pp. 159-168. Rainisto, S.K., (2003). Success factors of place marketing: A study of place marketing practices in northern Europe and the United States. Ph. D. Helsinki: Helsinki University of Technology. Shiu, E., Hair, J., Bush, R., Ortinau, D. (2009) Marketing Research. European Edition. London: McGraw-Hill Higher Edition. Smyth, H. (1994). Marketing the city: the role of flagship developments in urban regeneration. Taylor & Francis. London. Solomon, M., Bamossy, G., Askegaard, S., Hogg, M., (2010), Consumer Behaviour, A European perspective, Fourth Edition. Prentice Hall. England. Electronic references Encyclopaedia Britannica, (2012). City. Encyclopaedia Britannica website http://www.britannica.com/EBchecked/topic/118952/city [Retrieved: 2012-04-15] OECD. Directorate for Education. OECD website http://www.oecd.org/department/0,3355,en_2649_35961291_1_1_1_1_1,00.html [Retrieved: 2012-04-22] Oxford Dictionaries. Resident. http://oxforddictionaries.com/definition/resident?q=resident [Retrieved: 2012-06-02] Saffron Consultants, (2008). Paris, London and Barcelona are Europe’s top city brands. City Mayors website
56
http://www.citymayors.com/marketing/city-brands.html [Retrieved: 2012-04-20] The Oriental Institute of the University of Chicago. The first cities. The Oriental Institute of Chicago website http://oi.uchicago.edu/OI/MUS/ED/TRC/MESO/cities.html [Retrieved: 2012-04-20] Trade Ideas. R squared. Trade Ideas website http://www.trade-ideas.com/Glossary/R-Squared.html [Retrieved: 2012-06-01] Uneecc (2007) History: European Capital of Culture. Uneecc website http://www.uneecc.org/htmls/history1.html [Retrieved: 2012-04-09] Umeå2014 (2010). Our objectives. Umeå2014 website http://www.Umeå2014.se/inenglish/makingithappen/ourobjectivesandstrategies/objectives.4.5ae6b78f12b6597d14080007072.html. [Retrieved 2012-05-04]. Umeå2014 (2010). Visit Umeå. Short film about Umeå. Umeå2014 website http://www.umea2014.se/inenglish/visitumea.4.3c0da0312b9e04c40880001444.html [Retrieved 2012-05-04]. Umeå. Vill mer (2009). Umeå’s history. Umeå website http://www.umea.se/mer/otherlanguages/inenglish/umeashistory.4.1255481e123d7d67aaa800010669.html [Retrieved 2012-04-18].

Appendix 1: English questionnaire Questionnaire : Promoting the image of Umeå. This survey designed by two Marketing students of Umeå University aims at identifying your perception of the essential points to develop the city of Umeå. The survey is entirely anonymous and the information collected won’t be used for other purposes (according to the ESOMAR code). If you don’t understand the questions, feel free to contact and ask us. The survey is composed of three sets of questions with different purposes. Please read them carefully and remember that we do not judge your answers and that there is no right or wrong answers. We are only interested in your opinion.
Part 1: Perception measures The first part of this questionnaire is composed of general questions on your perception of the city. A number of statements are given about opinions using a scale from 1 to 5, with 1 being “totally disagree” and 5 being “totally agree”. After each statement, please tick the box that better expresses your extent of agreement to the statement. Umeå is a pleasant city. []
Totally
Disagree Disagree Undecided Agree Totally Agree
Umeå is one of the most important cities in Norrland. []
Totally
Disagree Disagree Undecided Agree Totally Agree
Umeå has an international reputation. []
Totally
Disagree Disagree Undecided Agree Totally Agree
Umeå has a good image. []
Totally
Disagree Disagree Undecided Agree Totally Agree
Umeå is developing a good advertising strategy. []
Totally
Disagree Disagree Undecided Agree Totally Agree
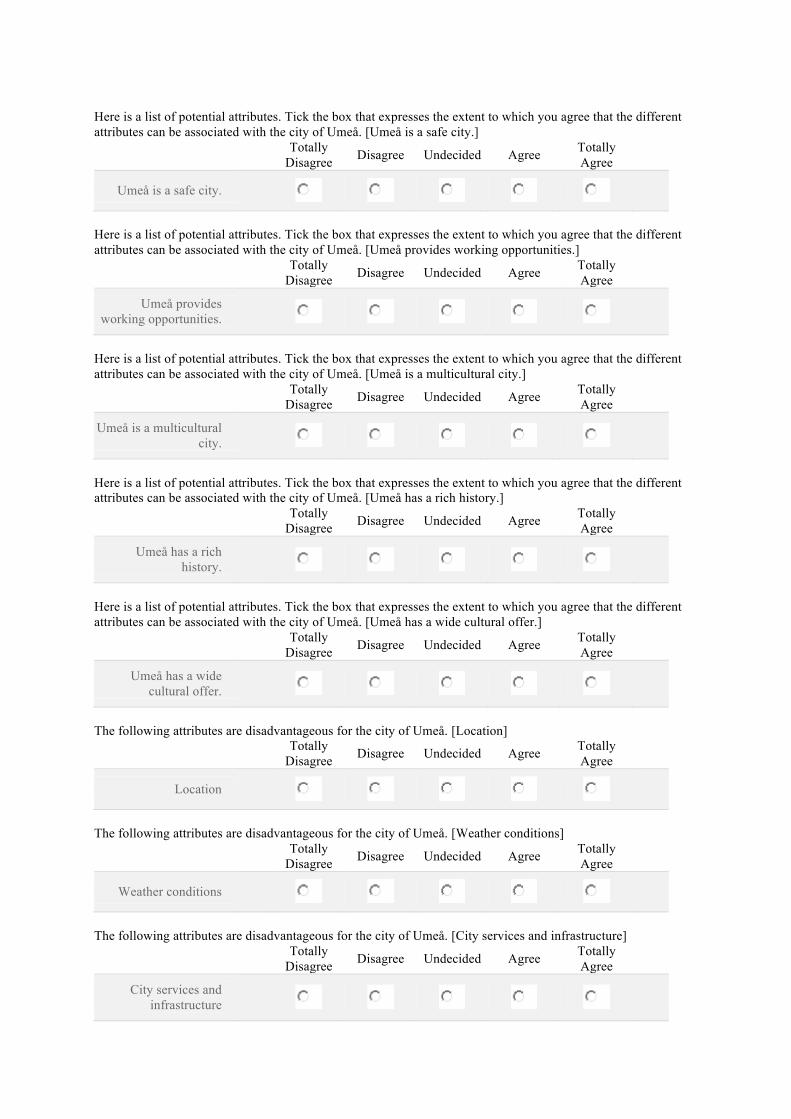
Here is a list of potential attributes. Tick the box that expresses the extent to which you agree that the different attributes can be associated with the city of Umeå. [Umeå is a safe city.]
Totally
Disagree Disagree Undecided Agree Totally Agree
Umeå is a safe city. Here is a list of potential attributes. Tick the box that expresses the extent to which you agree that the different attributes can be associated with the city of Umeå. [Umeå provides working opportunities.]
Totally
Disagree Disagree Undecided Agree Totally Agree
Umeå provides working opportunities.
Here is a list of potential attributes. Tick the box that expresses the extent to which you agree that the different attributes can be associated with the city of Umeå. [Umeå is a multicultural city.]
Totally
Disagree Disagree Undecided Agree Totally Agree
Umeå is a multicultural city.
Here is a list of potential attributes. Tick the box that expresses the extent to which you agree that the different attributes can be associated with the city of Umeå. [Umeå has a rich history.]
Totally
Disagree Disagree Undecided Agree Totally Agree
Umeå has a rich history.
Here is a list of potential attributes. Tick the box that expresses the extent to which you agree that the different attributes can be associated with the city of Umeå. [Umeå has a wide cultural offer.]
Totally
Disagree Disagree Undecided Agree Totally Agree
Umeå has a wide cultural offer.
The following attributes are disadvantageous for the city of Umeå. [Location]
Totally
Disagree Disagree Undecided Agree Totally Agree
Location The following attributes are disadvantageous for the city of Umeå. [Weather conditions]
Totally
Disagree Disagree Undecided Agree Totally Agree
Weather conditions The following attributes are disadvantageous for the city of Umeå. [City services and infrastructure]
Totally
Disagree Disagree Undecided Agree Totally Agree
City services and infrastructure
The following attributes are disadvantageous for the city of Umeå. [Language]
Totally
Disagree Disagree Undecided Agree Totally Agree
Language
Part 2: What are the key points to develop the city? This part of the questionnaire includes subdivisions dealing each with one particular aspect that we want to investigate. Those aspects are the following: education, economy, infrastructure and tourism. About education: Umeå University is a good incentive for students to come in the city. []
Totally
Disagree Disagree Undecided Agree Totally Agree
It is important for Umeå to have a skilled workforce. []
Totally
Disagree Disagree Undecided Agree Totally Agree
It is positive for businesses to have partnerships with higher education institutions. []
Totally
Disagree Disagree Undecided Agree Totally Agree
About economy: Umeå has a strong economy. []
Totally
Disagree Disagree Undecided Agree Totally Agree
In your opinion, what is the most important economic area in Umeå?
• Agriculture
• Industry
• Tourism About infrastructures: There is a good transportation network inside the city. [](linking the different parts of the city between them)
Totally
Disagree Disagree Undecided Agree Totally Agree

There is a good transportation network between Umeå and the rest of Sweden. []
Totally
Disagree Disagree Undecided Agree Totally Agree
There is a good transportation network between Umeå and the rest of Europe. []
Totally
Disagree Disagree Undecided Agree Totally Agree
This mean of transportation is convenient here. [Plane]
Totally
Disagree Disagree Undecided Agree Totally Agree
Plane This mean of transportation is convenient here. [Train]
Totally
Disagree Disagree Undecided Agree Totally Agree
Train This mean of transportation is convenient here. [Bus]
Totally
Disagree Disagree Undecided Agree Totally Agree
Bus This mean of transportation is convenient here. [Car]
Totally
Disagree Disagree Undecided Agree Totally Agree
Car This mean of transportation is convenient here. [Bike]
Totally
Disagree Disagree Undecided Agree Totally Agree
Bike About tourism: Umeå has a great touristic potential. []
Totally
Disagree Disagree Undecided Agree Totally Agree

Here is a list of touristic aspects about the city of Umeå. Please specify how important you think those aspects are with the help of the following scale from 1 to 5, with 1 being "not important at all" and 5 being "very important". [The proximity with Lapland and the Sami People]
Not important at
all
Of little importance Undecided Important Very
important
The proximity with Lapland and the Sami
People
Here is a list of touristic aspects about the city of Umeå. Please specify how important you think those aspects are with the help of the following scale from 1 to 5, with 1 being "not important at all" and 5 being "very important". [The snow activities (dog sledging, snowmobiles, ski resorts etc.)]
Not important at
all
Of little importance Undecided Important Very
important
The snow activities (dog sledging,
snowmobiles, ski resorts etc.)
Here is a list of touristic aspects about the city of Umeå. Please specify how important you think those aspects are with the help of the following scale from 1 to 5, with 1 being "not important at all" and 5 being "very important". [The natural environment (lake, forest, the Ume river, proximity with the sea and islands)]
Not important at
all
Of little importance Undecided Important Very
important
The natural environment (lake,
forest, the Ume river, proximity with the sea
and islands)
Here is a list of touristic aspects about the city of Umeå. Please specify how important you think those aspects are with the help of the following scale from 1 to 5, with 1 being "not important at all" and 5 being "very important". [Cultural events (Umeå Jazz Festival etc.)]
Not important at
all
Of little importance Undecided Important Very
important
Cultural events (Umeå Jazz Festival etc.)
Part 3: Umeå 2014 This part of the questionnaire deals with the fact that Umeå will be the European Capital of Culture in 2014. Did you know that Umeå will be the European Capital of Culture in 2014?
• Yes
• No
Do you know the activities program for this year?
• Yes
• No This event is an opportunity for developing the city. []
Totally
Disagree Disagree Undecided Agree Totally Agree
Do you know which 2 cities are European Capitals of Culture this year?
• Yes
• No Choose the most appropriate valuation in each of the following sentences. [Umeå should display a strong cultural activity.]
Totally
Disagree Disagree Undecided Agree Totally Agree
Umeå should display a strong cultural activity.
Choose the most appropriate valuation in each of the following sentences. [Umeå should display its potential for tourism.]
Totally
Disagree Disagree Undecided Agree Totally Agree
Umeå should display its potential for
tourism.
Choose the most appropriate valuation in each of the following sentences. [Umeå should advertise sport events.]
Totally
Disagree Disagree Undecided Agree Totally Agree
Umeå should advertise sport events.
Choose the most appropriate valuation in each of the following sentences. [Umeå should advertise academic offers.]
Totally
Disagree Disagree Undecided Agree Totally Agree
Umeå should advertise academic offers.
Choose the most appropriate valuation in each of the following sentences. [Umeå should advertise its healthcare structures.]
Totally
Disagree Disagree Undecided Agree Totally Agree
Umeå should advertise its healthcare
structures.
Choose the most appropriate valuation in each of the following sentences. [Umeå should advertise the history of the city.]
Totally
Disagree Disagree Undecided Agree Totally Agree
Umeå should advertise the history of the city.
Choose the most appropriate valuation in each of the following sentences. [Umeå should advertise winter activities.]
Totally
Disagree Disagree Undecided Agree Totally Agree
Umeå should advertise winter activities.
Choose the most appropriate valuation in each of the following sentences. [Umeå should advertise summer activities.]
Totally
Disagree Disagree Undecided Agree Totally Agree
Umeå should advertise summer activities.
Choose the most appropriate valuation in each of the following sentences. [Umeå should show that the city cares about the environment.]
Totally
Disagree Disagree Undecided Agree Totally Agree
Umeå should show that the city cares about the
environment.
Choose the most appropriate valuation in each of the following sentences. [Umeå should advertise Sami's life.]
Totally
Disagree Disagree Undecided Agree Totally Agree
Umeå should advertise Sami's life.
In your opinion, among the previous points, what is the one that should be emphasized in 2014?Please pick only one choice.
• Umeå should display a strong cultural activity.
• Umeå should display its potential for tourism.
• Umeå should advertise sport events.
• Umeå should advertise academic offers.
• Umeå should advertise its healthcare structures.
• Umeå should advertise the history of the city.
• Umeå should advertise winter activities.
• Umeå should advertise summer activities.
• Umeå should show that the city cares about the environment.
• Umeå should advertise Sami's life.

Demographics For each question, please choose the option that describes you best. What is your gender?
• Female
• Male What is your category of age?
• 18-25
• 26-35
• 36-50
• 51-65
• + 65 What is your nationality?
• Swedish
• Others If you are Swedish, are you from Umeå?
• Yes
• No
Appendix 2: Swedish questionnaire Enkät: Främjar bilden av Umeå Denna enkät, som är designad av två st marknadsförningsstudenter från umeå universitet, strävar mot att identifiera era uppfattningar om dem viktiga elementen i utvecklandet av Umeå som en stad. Denna enkät är helt anonym och den insamlade informationen kommer inte användas i några andra syften (i enlighet med ESOMAR koden). Om ni inte förstår frågorna tveka inte att kontakta oss. Denna enkät är uppbyggd i tre set av frågor med olika syften. Var noggrann när ni läser frågorna. Det finns inga fel eller rätt svar, utan vi är endast ute efter er åsikt.
Del 1: Uppfattningsmätning Den första delen av denna enkät är uppbyggd av generella frågor om din uppfattning av staden. Olika påståenden kommer göras, vilka graderas på en skala från 1-5, där 1 är ”håller inte med” och 5 ”håller fullständigt med”. Efter varje påstående, fyll i det svarsalternativ som bäst passar in på din åsikt. Umeå är en trevlig stad.
Jag håller
inte alls med Jag håller inte med Obestämd Jag håller
med
Jag håller fullständigt
med
Umeå är en av norrlands viktigaste städer.
Jag håller
inte alls med Jag håller inte med Obestämd Jag håller
med
Jag håller fullständigt
med
Umeå är internationellt känd.
Jag håller
inte alls med Jag håller inte med Obestämd Jag håller
med
Jag håller fullständigt
med
Umeå har en bra image.
Jag håller
inte alls med Jag håller inte med Obestämd Jag håller
med
Jag håller fullständigt
med
Umeå utvecklar en bra marknadsföringsstrategi.
Jag håller
inte alls med Jag håller inte med Obestämd Jag håller
med
Jag håller fullständigt
med

Här är en lista av potentiella attribut. Markera valet som uttrycker hur attributen associeras med Umeå.
Jag håller
inte alls med Jag håller inte med Obestämd Jag håller
med
Jag håller fullständigt
med
Umeå är en säker stad
Umeå bidrar med arbetsmöjligheter
Umeå är en multikulturell stad
Umeå har en rik historia
Umeå har ett stort kulturell utbud
De följande attribut är ofördelaktiga för staden.
Jag håller
inte alls med Jag håller inte med Obestämd Jag håller
med
Jag håller fullständigt
med
Läge
Väder
Stadsservice och infrastruktur
Språk
Del 2: Vilka är huvudelementen för att utveckla staden? Denna del av enkäten innehåller subdivisioner som vardera behandlar en aspekt vi vill undersöka. dessa aspekter är utbildning, ekonomi, infrastruktur och turism.
Ø Om utbildning: Umeå universitet bidrar till att folk kommer staden.
Jag håller
inte alls med Jag håller inte med Obestämd Jag håller
med
Jag håller fullständigt
med
Det är viktigt för umeå att ha kompetent arbetskraft.
Jag håller
inte alls med Jag håller inte med Obestämd Jag håller
med
Jag håller fullständigt
med
Det är positivt för företag att samarbeta med lärosäten
Jag håller
inte alls med Jag håller inte med Obestämd Jag håller
med
Jag håller fullständigt
med
Ø Om ekonomi: Umeå har en stark ekonomi.
Jag håller
inte alls med Jag håller inte med Obestämd Jag håller
med
Jag håller fullständigt
med
Enligt din åsikt vad är Umeås starkaste ekonomiska area?
• Jordbruk
• Industri
• Turism
Ø Om infrastruktur: Det finns ett bra transportnätverk i Umeå.(som länkar stadens olika delar)
Jag håller
inte alls med Jag håller inte med Obestämd Jag håller
med
Jag håller fullständigt
med
Det finns ett bra transportnätverk utanför Umeå.(som länkar Umeå med resten av Sverige)
Jag håller
inte alls med Jag håller inte med Obestämd Jag håller
med
Jag håller fullständigt
med
Det finns ett bra transportnätverk utanför Umeå.(som länkar Umeå med resten av Europa)
Jag håller
inte alls med Jag håller inte med Obestämd Jag håller
med
Jag håller fullständigt
med
Denna form av transportmedel är lämplig här.
Jag håller
inte alls med Jag håller inte med Obestämd Jag håller
med
Jag håller fullständigt
med
Flygplan
Jag håller
inte alls med Jag håller inte med Obestämd Jag håller
med
Jag håller fullständigt
med
Tåg
Buss
Bil
Cykel
Ø Om turism: Umeå har stor potential inom turismen.
Jag håller
inte alls med Jag håller inte med Obestämd Jag håller
med
Jag håller fullständigt
med
Vänligen specifiera hur viktigt ni tycker dessa aspekter är för Umeå.
Inte viktigt
alls Av liten
betydelse Obestämd Viktigt Väldigt viktigt
Närheten till Lappland och den samiska
befolkningen
Snöaktiviteter (Hundspann, snöskoter,
skidbackar etc.)
Naturmiljön (Sjöar, skog, Umeälven,
närheten till havet och dess öar)
Kulturella event (Umeå jazz festival etc.)
Del 3: Umeå 2014 Denna del av enkäten handlar om Umeå som Europas kulturhuvudstad 2014. Visste du att Umeå kommer bli Europas kulturhuvudstad 2014?
• Ja
• Nej Känner du till aktivitetsprogrammet för i år?
• Ja
• Nej

Välj det val som bäst passar in på er åsikt i de följande meningarna.
Jag håller
inte alls med Jag håller inte med Obestämd Jag håller
med
Jag håller fullständigt
med
Känner du till vilka två städer är kulturhuvudstäder i år?
• Ja
• Nej Denna form av transportmedel är lämplig här.
Jag håller
inte alls med Jag håller inte med Obestämd Jag håller
med
Jag håller fullständigt
med
Umeå borde uppvisa en stark kulturell aktivitet
Umeå borde uppvisa sin potential för turism
Umeå borde marknadsföra sport evenemang
Umeå borde marknadsföra utbildningar
Umeå borde marknadsföra sjukvårdsinfrastruktur
Umeå borde marknadsföra stadens historia
Umeå borde marknadsföra vinteraktiviteter
Umeå borde marknadsföra sommaraktiviteter
Umeå borde visa att staden bryr sig om naturen
Umeå borde marknadsföra samernas liv

Enligt er åsikt, vilken av de förgående påstående borde Umeå lyfta fram i 2014?
• Umeå borde uppvisa en stark kulturell aktivitet
• Umeå borde uppvisa sin potential för turism
• Umeå borde marknadsföra sport evenemang
• Umeå borde marknadsföra utbildningar
• Umeå borde marknadsföra sjukvårdsinfrastruktur
• Umeå borde marknadsföra stadens historia
• Umeå borde marknadsföra vinteraktiviteter
• Umeå borde marknadsföra sommaraktiviteter
• Umeå borde visa att staden bryr sig om naturen
• Umeå borde marknadsföra samernas liv
Demografi Välj det val som bäst passar in. Kön?
• Kvinna
• Man Ålder?
• 18-25
• 26-35
• 36-50
• 51-65
• + 65 Nationalitet
• Svensk
• Annan Om du är svensk, är Umeå din hemstad?
• Ja
• Nej
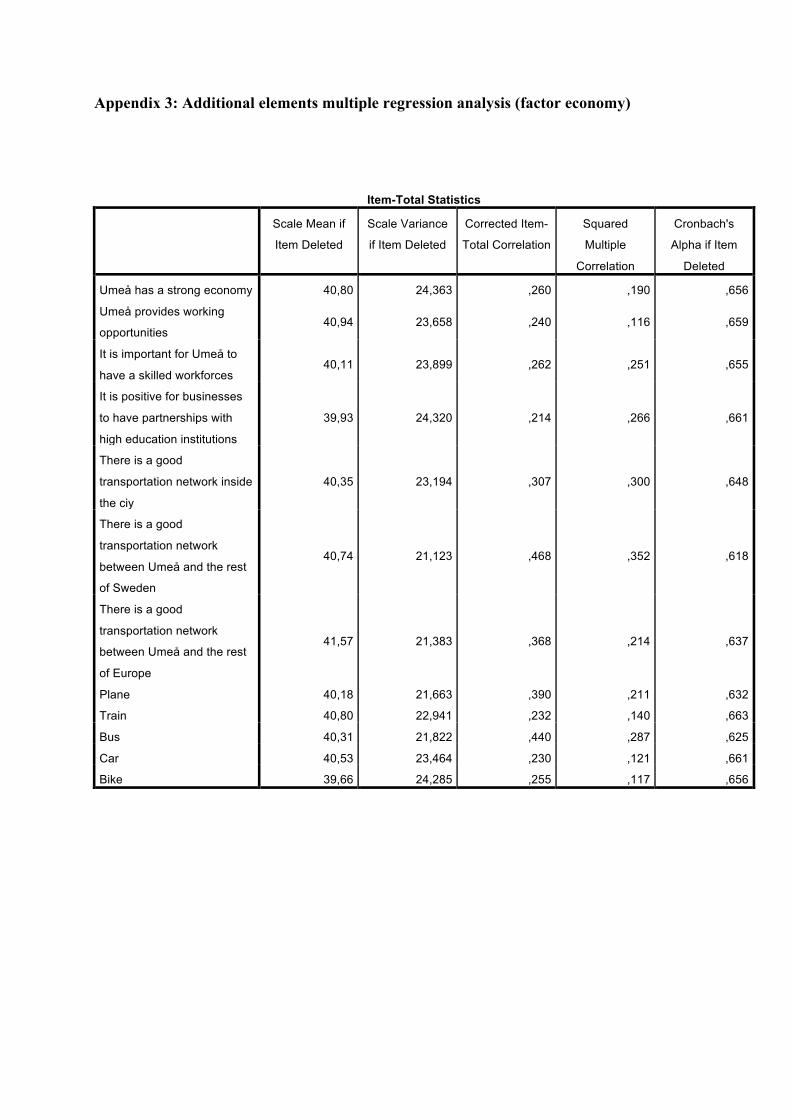
Appendix 3: Additional elements multiple regression analysis (factor economy)
Item-Total Statistics
Scale Mean if
Item Deleted
Scale Variance
if Item Deleted
Corrected Item-
Total Correlation
Squared
Multiple
Correlation
Cronbach's
Alpha if Item
Deleted
Umeå has a strong economy 40,80 24,363 ,260 ,190 ,656
Umeå provides working
opportunities 40,94 23,658 ,240 ,116 ,659
It is important for Umeå to
have a skilled workforces 40,11 23,899 ,262 ,251 ,655
It is positive for businesses
to have partnerships with
high education institutions
39,93 24,320 ,214 ,266 ,661
There is a good
transportation network inside
the ciy
40,35 23,194 ,307 ,300 ,648
There is a good
transportation network
between Umeå and the rest
of Sweden
40,74 21,123 ,468 ,352 ,618
There is a good
transportation network
between Umeå and the rest
of Europe
41,57 21,383 ,368 ,214 ,637
Plane 40,18 21,663 ,390 ,211 ,632
Train 40,80 22,941 ,232 ,140 ,663
Bus 40,31 21,822 ,440 ,287 ,625
Car 40,53 23,464 ,230 ,121 ,661
Bike 39,66 24,285 ,255 ,117 ,656
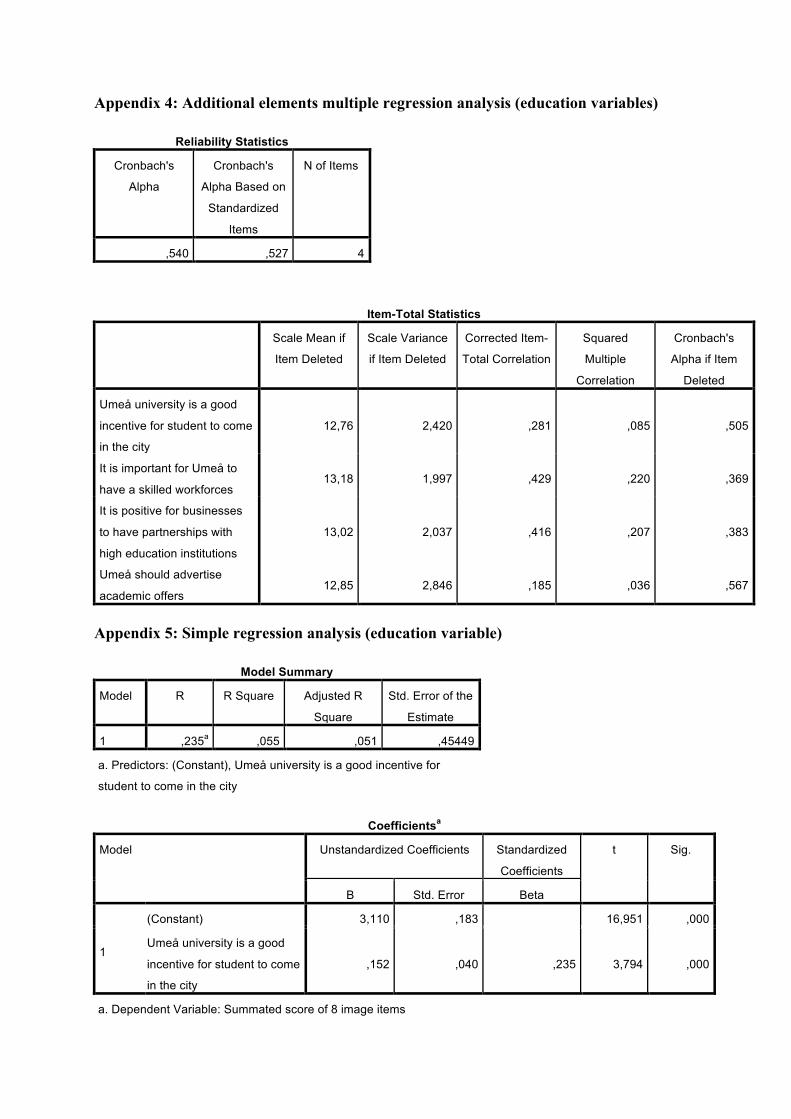
Appendix 4: Additional elements multiple regression analysis (education variables)
Reliability Statistics
Cronbach's
Alpha
Cronbach's
Alpha Based on
Standardized
Items
N of Items
,540 ,527 4
Item-Total Statistics
Scale Mean if
Item Deleted
Scale Variance
if Item Deleted
Corrected Item-
Total Correlation
Squared
Multiple
Correlation
Cronbach's
Alpha if Item
Deleted
Umeå university is a good
incentive for student to come
in the city
12,76 2,420 ,281 ,085 ,505
It is important for Umeå to
have a skilled workforces 13,18 1,997 ,429 ,220 ,369
It is positive for businesses
to have partnerships with
high education institutions
13,02 2,037 ,416 ,207 ,383
Umeå should advertise
academic offers 12,85 2,846 ,185 ,036 ,567
Appendix 5: Simple regression analysis (education variable)
Model Summary
Model R R Square Adjusted R
Square
Std. Error of the
Estimate
1 ,235a ,055 ,051 ,45449
a. Predictors: (Constant), Umeå university is a good incentive for
student to come in the city
Coefficientsa
Model Unstandardized Coefficients Standardized
Coefficients
t Sig.
B Std. Error Beta
1
(Constant) 3,110 ,183 16,951 ,000
Umeå university is a good
incentive for student to come
in the city
,152 ,040 ,235 3,794 ,000
a. Dependent Variable: Summated score of 8 image items

Appendix 6: Additional elements multiple regression analysis (tourism variables)
Item-Total Statistics
Scale Mean if
Item Deleted
Scale Variance
if Item Deleted
Corrected Item-
Total Correlation
Squared
Multiple
Correlation
Cronbach's
Alpha if Item
Deleted
Umeå has a great touristic
potential 28,64 17,538 ,349 ,183 ,782
The proximity with Lapland
and Sami people 28,17 16,114 ,487 ,449 ,760
The snow activities 27,83 16,123 ,611 ,531 ,738
The natural enviroment 27,72 16,880 ,518 ,309 ,754
Umeå should advertise
Sami´s life 28,13 15,817 ,532 ,382 ,751
Umeå should display its
potential for tourism 27,88 17,859 ,439 ,274 ,766
Umeå should advertise
winter activities 27,67 17,010 ,592 ,474 ,745
Umeå should advertise
summer activities 27,86 17,369 ,409 ,304 ,771
ANOVAa
Model Sum of Squares df Mean Square F Sig.
1
Regression 10,703 8 1,338 6,957 ,000b
Residual 44,418 231 ,192
Total 55,121 239
a. Dependent Variable: Summated score of 8 image items
b. Predictors: (Constant), Umeå should advertise Sami´s life, Umeå has a great touristic potential,
Umeå should advertise summer activities, The snow activities, Umeå should display its potential
for tourism, The natural enviroment, The proximity with Lapland and Sami people, Umeå should
advertise winter activities

Appendix 7: Additional elements multiple regression analysis (culture variables)
Item-Total Statistics
Scale Mean if
Item Deleted
Scale Variance
if Item Deleted
Corrected Item-
Total Correlation
Squared
Multiple
Correlation
Cronbach's
Alpha if Item
Deleted
Umeå has a wide cultural
offer 14,93 5,115 ,351 ,158 ,539
Umeå is a multicultural city 14,31 6,009 ,256 ,077 ,583
Umeå has a rich history 15,39 5,251 ,406 ,198 ,507
Umeå should display a
strong cultural activity 14,36 5,857 ,368 ,199 ,534
Umeå should advertise the
history of the city 14,90 4,895 ,382 ,244 ,520
Appendix 8: Umeå has a strong economy * What is your nationality? Crosstabulation
What is your nationality?
Total Swedish Others Umeå has a strong economy
Disagree Count 4 11 15 % within What is your nationality? 6,0% 6,2% 6,1%
Undecided Count 43 92 135 % within What is your nationality? 64,2% 51,7% 55,1%
Agree Count 19 63 82 % within What is your nationality? 28,4% 35,4% 33,5%
Totally Agree Count 1 12 13 % within What is your nationality? 1,5% 6,7% 5,3%
Total Count 67 178 245 % within What is your nationality? 100,0% 100,0% 100,0%
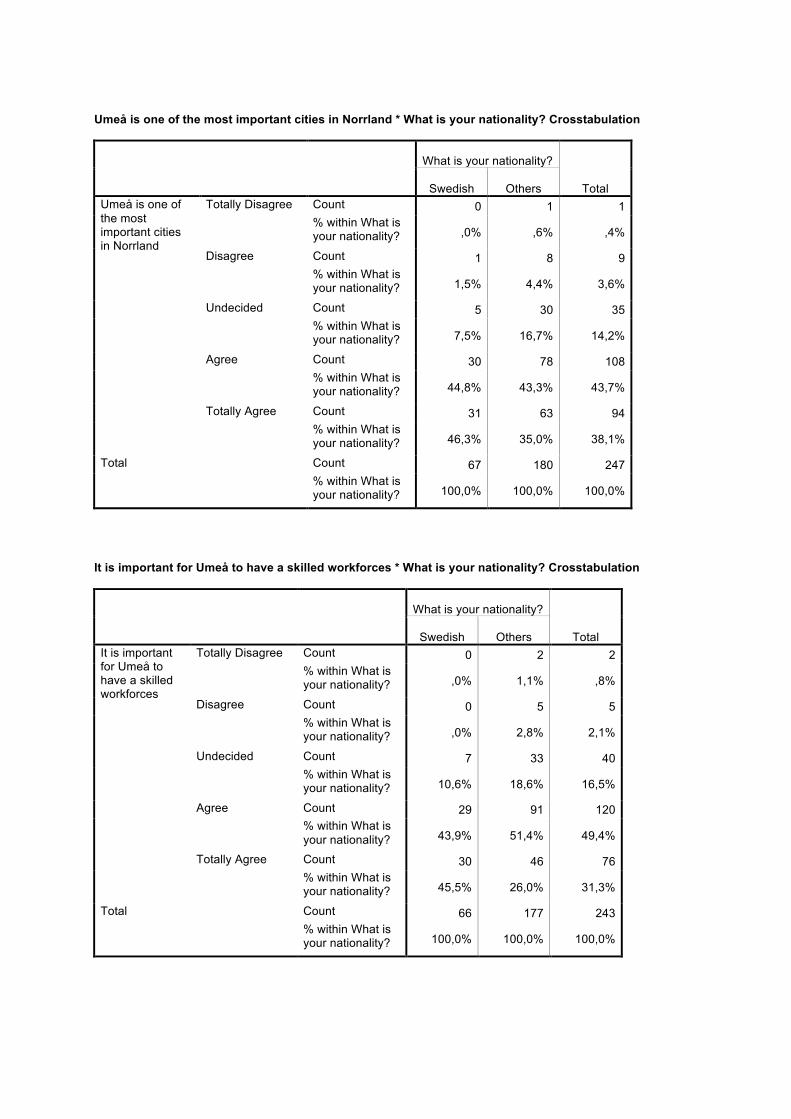
Umeå is one of the most important cities in Norrland * What is your nationality? Crosstabulation
What is your nationality?
Total Swedish Others Umeå is one of the most important cities in Norrland
Totally Disagree Count 0 1 1 % within What is your nationality? ,0% ,6% ,4%
Disagree Count 1 8 9 % within What is your nationality? 1,5% 4,4% 3,6%
Undecided Count 5 30 35 % within What is your nationality? 7,5% 16,7% 14,2%
Agree Count 30 78 108 % within What is your nationality? 44,8% 43,3% 43,7%
Totally Agree Count 31 63 94 % within What is your nationality? 46,3% 35,0% 38,1%
Total Count 67 180 247 % within What is your nationality? 100,0% 100,0% 100,0%
It is important for Umeå to have a skilled workforces * What is your nationality? Crosstabulation
What is your nationality?
Total Swedish Others It is important for Umeå to have a skilled workforces
Totally Disagree Count 0 2 2 % within What is your nationality? ,0% 1,1% ,8%
Disagree Count 0 5 5 % within What is your nationality? ,0% 2,8% 2,1%
Undecided Count 7 33 40 % within What is your nationality? 10,6% 18,6% 16,5%
Agree Count 29 91 120 % within What is your nationality? 43,9% 51,4% 49,4%
Totally Agree Count 30 46 76 % within What is your nationality? 45,5% 26,0% 31,3%
Total Count 66 177 243 % within What is your nationality? 100,0% 100,0% 100,0%
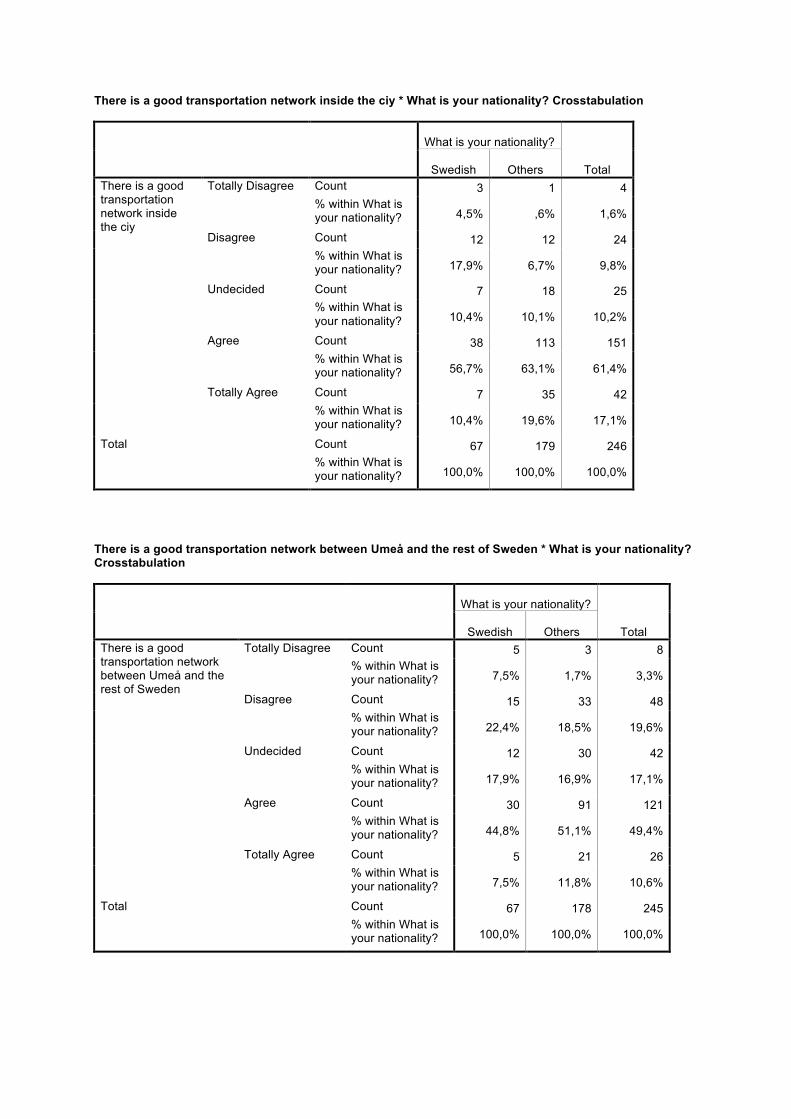
There is a good transportation network inside the ciy * What is your nationality? Crosstabulation
What is your nationality?
Total Swedish Others There is a good transportation network inside the ciy
Totally Disagree Count 3 1 4 % within What is your nationality? 4,5% ,6% 1,6%
Disagree Count 12 12 24 % within What is your nationality? 17,9% 6,7% 9,8%
Undecided Count 7 18 25 % within What is your nationality? 10,4% 10,1% 10,2%
Agree Count 38 113 151 % within What is your nationality? 56,7% 63,1% 61,4%
Totally Agree Count 7 35 42 % within What is your nationality? 10,4% 19,6% 17,1%
Total Count 67 179 246 % within What is your nationality? 100,0% 100,0% 100,0%
There is a good transportation network between Umeå and the rest of Sweden * What is your nationality? Crosstabulation
What is your nationality?
Total Swedish Others There is a good transportation network between Umeå and the rest of Sweden
Totally Disagree Count 5 3 8 % within What is your nationality? 7,5% 1,7% 3,3%
Disagree Count 15 33 48 % within What is your nationality? 22,4% 18,5% 19,6%
Undecided Count 12 30 42 % within What is your nationality? 17,9% 16,9% 17,1%
Agree Count 30 91 121 % within What is your nationality? 44,8% 51,1% 49,4%
Totally Agree Count 5 21 26 % within What is your nationality? 7,5% 11,8% 10,6%
Total Count 67 178 245 % within What is your nationality? 100,0% 100,0% 100,0%

There is a good transportation network between Umeå and the rest of Europe * What is your nationality? Crosstabulation
What is your nationality?
Total Swedish Others There is a good transportation network between Umeå and the rest of Europe
Totally Disagree Count 7 34 41 % within What is your nationality? 10,4% 18,9% 16,6%
Disagree Count 25 69 94 % within What is your nationality? 37,3% 38,3% 38,1%
Undecided Count 12 30 42 % within What is your nationality? 17,9% 16,7% 17,0%
Agree Count 20 38 58 % within What is your nationality? 29,9% 21,1% 23,5%
Totally Agree Count 3 9 12 % within What is your nationality? 4,5% 5,0% 4,9%
Total Count 67 180 247 % within What is your nationality? 100,0% 100,0% 100,0%
Appendix 9: Umeå should advertise academic offers * What is your nationality? Crosstabulation
What is your nationality?
Total Swedish Others Umeå should advertise academic offers
Disagree Count 0 1 1 % within What is your nationality? ,0% ,6% ,4%
Undeciced Count 3 9 12 % within What is your nationality? 4,5% 5,1% 4,9%
Agree Count 29 85 114 % within What is your nationality? 43,9% 48,0% 46,9%
Totally Agree Count 34 82 116 % within What is your nationality? 51,5% 46,3% 47,7%
Total Count 66 177 243 % within What is your nationality? 100,0% 100,0% 100,0%
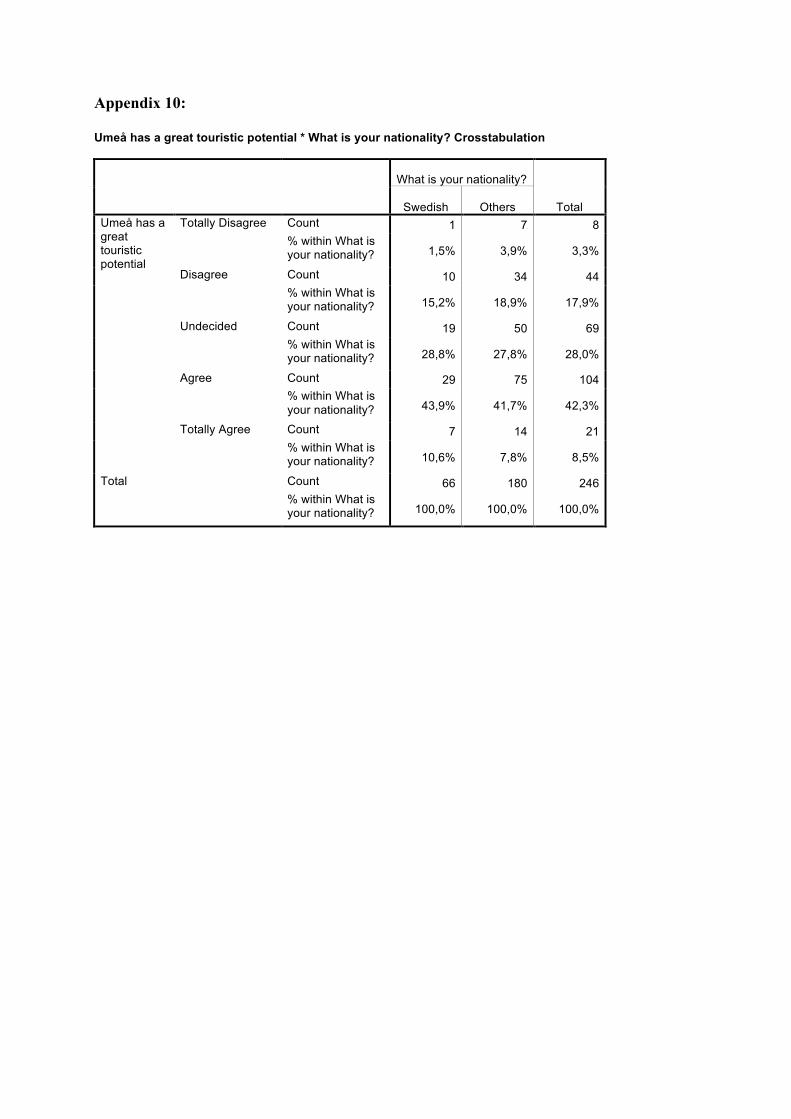
Appendix 10: Umeå has a great touristic potential * What is your nationality? Crosstabulation
What is your nationality?
Total Swedish Others Umeå has a great touristic potential
Totally Disagree Count 1 7 8 % within What is your nationality? 1,5% 3,9% 3,3%
Disagree Count 10 34 44 % within What is your nationality? 15,2% 18,9% 17,9%
Undecided Count 19 50 69 % within What is your nationality? 28,8% 27,8% 28,0%
Agree Count 29 75 104 % within What is your nationality? 43,9% 41,7% 42,3%
Totally Agree Count 7 14 21 % within What is your nationality? 10,6% 7,8% 8,5%
Total Count 66 180 246 % within What is your nationality? 100,0% 100,0% 100,0%
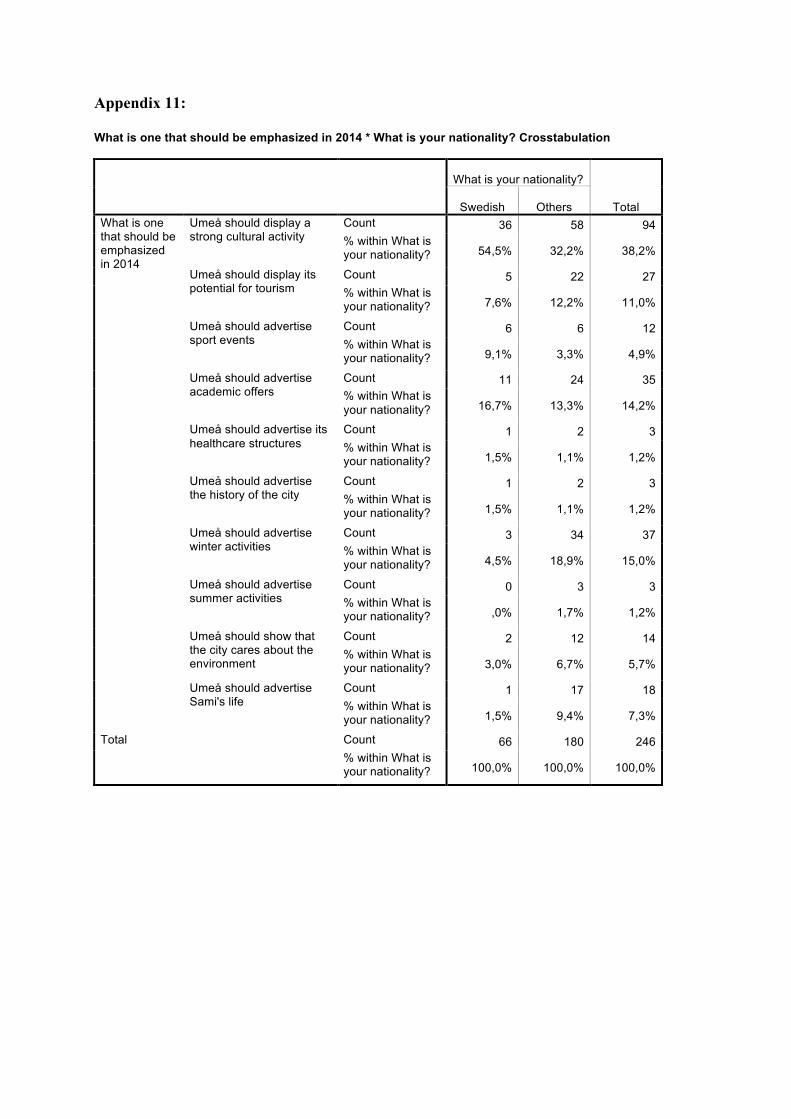
Appendix 11: What is one that should be emphasized in 2014 * What is your nationality? Crosstabulation
What is your nationality?
Total Swedish Others What is one that should be emphasized in 2014
Umeå should display a strong cultural activity
Count 36 58 94 % within What is your nationality? 54,5% 32,2% 38,2%
Umeå should display its potential for tourism
Count 5 22 27 % within What is your nationality? 7,6% 12,2% 11,0%
Umeå should advertise sport events
Count 6 6 12 % within What is your nationality? 9,1% 3,3% 4,9%
Umeå should advertise academic offers
Count 11 24 35 % within What is your nationality? 16,7% 13,3% 14,2%
Umeå should advertise its healthcare structures
Count 1 2 3 % within What is your nationality? 1,5% 1,1% 1,2%
Umeå should advertise the history of the city
Count 1 2 3 % within What is your nationality? 1,5% 1,1% 1,2%
Umeå should advertise winter activities
Count 3 34 37 % within What is your nationality? 4,5% 18,9% 15,0%
Umeå should advertise summer activities
Count 0 3 3 % within What is your nationality? ,0% 1,7% 1,2%
Umeå should show that the city cares about the environment
Count 2 12 14 % within What is your nationality? 3,0% 6,7% 5,7%
Umeå should advertise Sami's life
Count 1 17 18 % within What is your nationality? 1,5% 9,4% 7,3%
Total Count 66 180 246 % within What is your nationality? 100,0% 100,0% 100,0%