city grafton epsom tamaki - university of auckland · button, on the top right of the table and...
TRANSCRIPT
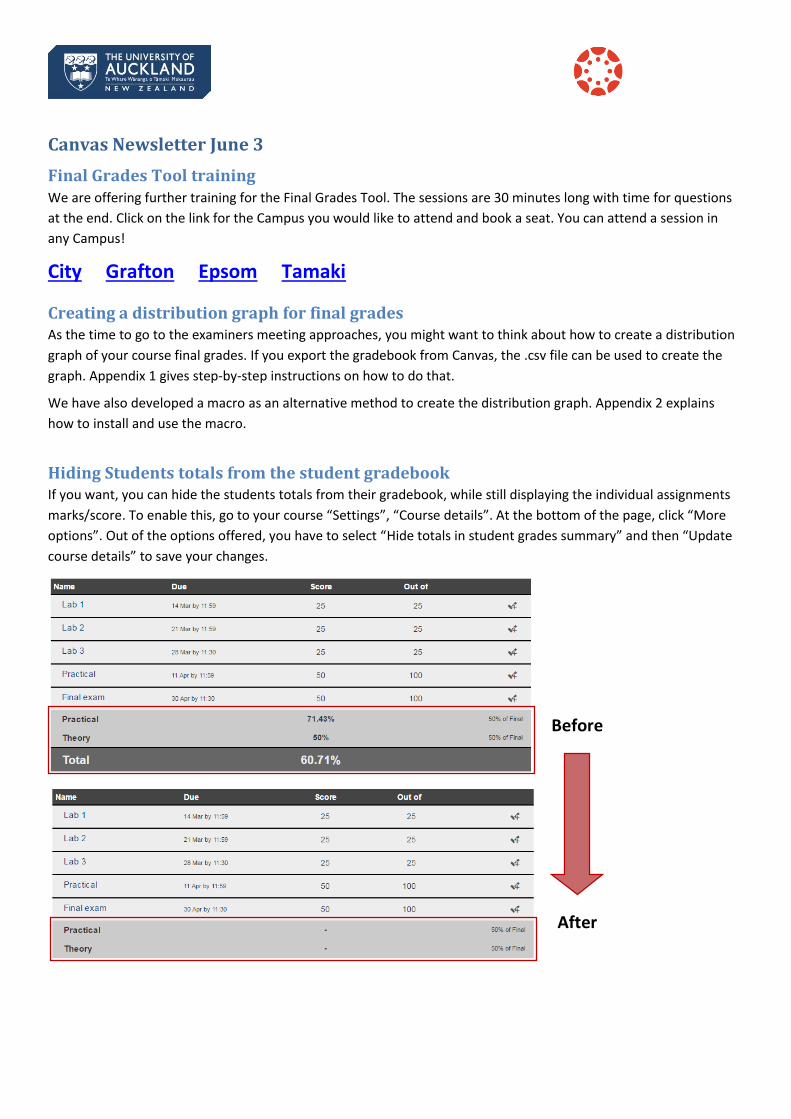
Before
After
Canvas Newsletter June 3
Final Grades Tool training We are offering further training for the Final Grades Tool. The sessions are 30 minutes long with time for questions
at the end. Click on the link for the Campus you would like to attend and book a seat. You can attend a session in
any Campus!
City Grafton Epsom Tamaki
Creating a distribution graph for final grades As the time to go to the examiners meeting approaches, you might want to think about how to create a distribution
graph of your course final grades. If you export the gradebook from Canvas, the .csv file can be used to create the
graph. Appendix 1 gives step-by-step instructions on how to do that.
We have also developed a macro as an alternative method to create the distribution graph. Appendix 2 explains
how to install and use the macro.
Hiding Students totals from the student gradebook If you want, you can hide the students totals from their gradebook, while still displaying the individual assignments
marks/score. To enable this, go to your course “Settings”, “Course details”. At the bottom of the page, click “More
options”. Out of the options offered, you have to select “Hide totals in student grades summary” and then “Update
course details” to save your changes.

Important dates
July 18
The end date for courses in Canvas is July 18, two weeks after the end of term. After this date, courses will be
read-only, meaning you will not be able to do further edits to your course. However, you will still be able to
export your course content for future use in the coming semester(s).
July 4The publishing deadline for Semester 2 is July 4. Publishing will allow students to see their courses in the
dashboard. To publish the course, go to your course’s “Home” and press “Publish”.
PhD research on Canvas
We encourage you to support the research of Qian Liu, a PhD student in the Faculty of Business and Economics.
Appendix 3 outlines his approach to discovering ways to support lecturers adopting new learning technologies, using
Canvas as an example. If you have been using Canvas to teach in Semester 1, please click here to start the 15-minute
survey.
Canvas Assignment Moderated Marking feature When creating or editing an assignment, you can select the option “Moderate marking”.
If you choose to select this option, be aware that even if the grades are uploaded to the gradebook, students won’t be able to see these grades until they have been released by the moderator.
Canvas Test Environment The Canvas test environment can be used to try different features in Canvas. This instance of Canvas doesn’t impact
the students, so you can, for example, try the Final Grades Tool without submitting the final grades. Before you
decide to use the test environment, keep in mind the following: The test environment is available for use with the
understanding that it may have different versions of integration code and LTI tools. The data is also used for test
purposes and may not be the same as your production course. It is also refreshed from production every 3 weeks as
Canvas receives a new release. It will also shortly be protected via Test SSO rather than production. So as long as
you are happy with all the above, feel free to take advantage of it!
The Canvas test environment is visually similar to the Canvas production instance. You will notice that the
Global Navigation Bar is a different colour from the blue Canvas production instance.

To get a password for the test environment, contact 86000.
We will release more on the test environment later in the year.
Tips & Tricks: Canvas Gradebook: Names and IDs
Canvas Gradebook is where you’d find all your published assignments and any marks entered for these assignments.
It shows students preferred names and the UoA username (a.k.a UPI), whereas many of our existing practices
involve using the legal name and the student ID number.
Before Semester 2 starts, it is a good opportunity to update any existing assignment instructions in your coursebook,
course materials and in Canvas. We suggest that students hand in their work with their username and their
preferred name that matches their name in Canvas. This makes things easier for everyone involved in marking.
Please do remind your students that following these instructions are important to ensure that they receive their
marks in a timely manner.
Note: You can obtain the student ID number by exporting the Gradebook to a .csv file and working in Excel for mark
entry instead as another option.
Known issues
Turnitin Rubrics Issue in Canvas
Turnitin is one of the submission types you can choose in Canvas. If you are using rubrics within GradeMark to
mark submissions, please note that ONLY ONE staff member should set up and edit the Turnitin ‘Settings’. Once you have created and attached a rubric in the Turnitin Settings, if other users edit any of the Turnitin Setting
options, the rubric will lose its association to the assignment. This occurs even when you have already marked
submissions using the rubric.
The rubric can be reinstated by the staff member who set up the rubric initially by selecting the rubric again in
Turnitin (optional) Settings. It may be safer to make any changes to the rubric via Turnitin.com directly. For any
other users who access the Turnitin Settings in the Canvas Assignment, the rubric option will always display ‘no
rubric to show’, even if the rubric has been attached. This is because Turnitin is linked to a user, not a course.
Who you can contact for assistance
A reminder to staff that 24-hour support contacts and online resources to support your transition to Canvas are available.
Online support
Online live chat 24/7 – select ‘Chat with Canvas Support’ from the Help menu (click the question mark in the bottom left
of your Canvas screen)
Canvas Support Hotline 24/7 – call 0800 001469 from a landline or mobile to speak with a Canvas Support
representative
Report a problem – file a support ticket when you’ve encountered a problem
Find out more about Canvas - For more information on what’s happening visit Canvas @ the University of Auckland or contact
[email protected] to log your request.
About this Newsletter - This update supports University staff with using our new Learning Management System, Canvas. If the
information is not relevant to you, please contact [email protected] to be removed from the list.

APPENDIX 1
To create a quick grades distribution graph in Excel follow the steps below. 1. Export the gradebook and open the file in Excel2. Select the whole spreadsheet3. On the menu task bar, select insert – Recommended pivot tables
4. Select the table which offers Final Grades as Row and Count of Students as values.
If excel doesn’t give you this option automatically, you can chose any of the
other options or Blank PivotTable and modify the table.

APPENDIX 1
5. The table created will look like this:
6. Once the table is created, click on the table and select 2-D Column chart to create a chart similar to the onebelow.
APPENDIX 2
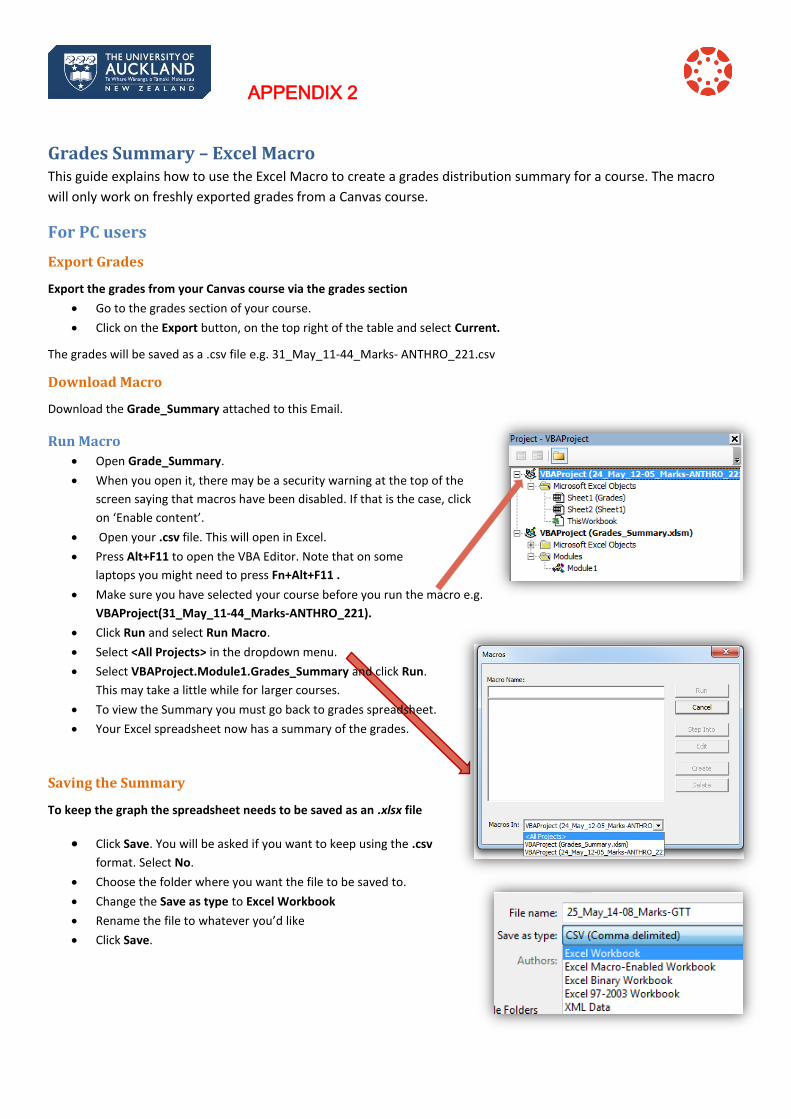
Grades Summary – Excel MacroThis guide explains how to use the Excel Macro to create a grades distribution summary for a course. The macro
will only work on freshly exported grades from a Canvas course.
For PC users
Export Grades
Export the grades from your Canvas course via the grades section
Go to the grades section of your course. Click on the Export button, on the top right of the table and select Current.
The grades will be saved as a .csv file e.g. 31_May_11-44_Marks- ANTHRO_221.csv
Download Macro
Download the Grade_Summary attached to this Email.
Run Macro
Open Grade_Summary.
When you open it, there may be a security warning at the top of the
screen saying that macros have been disabled. If that is the case, click
on ‘Enable content’.
Open your .csv file. This will open in Excel.
Press Alt+F11 to open the VBA Editor. Note that on some laptops you might need to press Fn+Alt+F11 .
Make sure you have selected your course before you run the macro e.g. VBAProject(31_May_11-44_Marks-ANTHRO_221).
Click Run and select Run Macro.
Select <All Projects> in the dropdown menu.
Select VBAProject.Module1.Grades_Summary and click Run.
This may take a little while for larger courses.
To view the Summary you must go back to grades spreadsheet.
Your Excel spreadsheet now has a summary of the grades.
Saving the Summary
To keep the graph the spreadsheet needs to be saved as an .xlsx file
Click Save. You will be asked if you want to keep using the .csv
format. Select No.
Choose the folder where you want the file to be saved to.
Change the Save as type to Excel Workbook
Rename the file to whatever you’d like
Click Save.

APPENDIX 2
For MAC users
Export Grades
Export the grades from your Canvas course via the grades section. Go to the grades section of your course. Click on the Export button, on the top right of the table and select Current.
The grades will be saved as a .csv file e.g. 31_May_11-44_Marks- ANTHRO_221.csv
Download Macro
Download the Grade_Summary attached to this email.
Run Macro
Open Grade_Summary, this will open up in Excel.
A pop up window will appear asking if you wish to disable
Macros. Select to Enable Macros.
Open your .csv file. This will open in Excel.
Click Tools on the top menu bar.
Mouse over Macro and select Macros.
Click Run.
To view the Summary you must go back to grades spreadsheet.
Your Excel spreadsheet now has a summary of the grades.

Request for feedback on your use of Canvas
Dear Colleague,
We would very much appreciate your participation in an online questionnaire. The
questionnaire begins by asking about your IT skills and your approach to teaching and
technologies. It then asks about your views on the Canvas learning management system
and the experiences you have had as you learnt to use Canvas in your teaching.
The survey is being undertaken as part of a PhD study. The aim of the research is to
discover ways to support lecturers and make adopting new learning technologies easier.
The questionnaire takes about 15-20 minutes and is confidential. If you have been using
Canvas to teach in Semester 1, please click on the link to learn more about the research
and to access the survey.
https://auckland.au1.qualtrics.com/SE/?SID=SV_025oeYAFhXiwLlj
I hope you are able to help. Thank you very much in advance for your time.
Kind regards,
Qian Liu
The University Canvas project team
APPENDIX 3