citric acid and certain citrate salts from belgium ... · pdf filenot enter a separate...
TRANSCRIPT

U.S. International Trade CommissionPublication 4710 July 2017
Washington, DC 20436
Citric Acid and Certain Citrate Salts from Belgium, Colombia, and Thailand
Investigation Nos. 701-TA-581 and 731-TA-1374-1376 (Preliminary)

U.S. International Trade Commission
COMMISSIONERS
Rhonda K. Schmidtlein, Chairman David S. Johanson, Vice Chairman
Irving A. Williamson Meredith M. Broadbent
Catherine DeFilippo
Staff assigned
Address all communications to Secretary to the Commission
United States International Trade Commission Washington, DC 20436
Director of Operations
Carolyn Carlson, Investigator Lawrence Jones, Investigator
Jeffrey Clark, Industry Analyst Lauren Gamache, Economist
Mary Klir, Accountant Mara Alexander, Statistician
Carolyn Holmes, Statistical Assistant Courtney McNamara, Attorney
Douglas Corkran, Supervisory Investigator

U.S. International Trade CommissionWashington, DC 20436
www.usitc.gov
Publication 4710 July 2017
Citric Acid and Certain Citrate Salts from Belgium, Colombia, and Thailand
Investigation Nos. 701-TA-581 and 731-TA-1374-1376 (Preliminary)


CONTENTS
Page
i
Determinations............................................................................................................................ 1
Views of the Commission ............................................................................................................. 3
Introduction ................................................................................................................... I-1 Part I:
Background ...................................................................................................................................... I-1
Statutory criteria and organization of the report ............................................................................ I-1
Statutory criteria .......................................................................................................................... I-1
Organization of report.................................................................................................................. I-3
Market summary .............................................................................................................................. I-3
Summary data and data sources ...................................................................................................... I-4
Previous and related investigations ................................................................................................. I-4
Nature and extent of alleged subsidies and sales at LTFV ............................................................... I-7
Alleged subsidies .......................................................................................................................... I-7
Alleged sales at LTFV .................................................................................................................... I-7
The subject merchandise ................................................................................................................. I-8
Commerce’s scope ....................................................................................................................... I-8
Tariff treatment ............................................................................................................................ I-9
The product ...................................................................................................................................... I-9
Description and applications ........................................................................................................ I-9
Manufacturing processes ........................................................................................................... I-12
Domestic like product issues .......................................................................................................... I-15
Part II: Conditions of competition in the U.S. market ................................................................ II-1
U.S. market characteristics ............................................................................................................. II-1
Channels of distribution .................................................................................................................. II-1
Geographic distribution .................................................................................................................. II-2
Supply and demand considerations ................................................................................................ II-3
U.S. supply ................................................................................................................................... II-3
U.S. demand ................................................................................................................................ II-5
Substitutability issues ...................................................................................................................... II-7
Lead times ................................................................................................................................... II-8
Non-GMO and organic certified CACCS ...................................................................................... II-8
Other certifications ..................................................................................................................... II-9
Factors affecting purchasing decisions ....................................................................................... II-9
Comparison of U.S.-produced and imported CACCS ................................................................ II-10
CONTENTS
Page
ii
Part III: U.S. producers’ production, shipments, and employment ............................................ III-1
U.S. producers ................................................................................................................................ III-1
Related firms .............................................................................................................................. III-1
Changes in operations ................................................................................................................ III-2
U.S. production, capacity, and capacity utilization ........................................................................ III-2
Operations on CACCS ................................................................................................................. III-2
Alternative products .................................................................................................................. III-4
U.S. producers’ U.S. shipments and exports .................................................................................. III-4
U.S. producers’ inventories ............................................................................................................ III-7
U.S. producers’ imports and purchases ......................................................................................... III-8
U.S. employment, wages, and productivity ................................................................................... III-8
Part IV: U.S. imports, apparent U.S. consumption, and market shares...................................... IV-1
U.S. importers ............................................................................................................................... IV-1
U.S. imports ................................................................................................................................... IV-3
Negligibility .................................................................................................................................... IV-6
Cumulation considerations ........................................................................................................... IV-8
Fungibility .................................................................................................................................. IV-8
Geographical markets ............................................................................................................. IV-16
Presence in the market ........................................................................................................... IV-18
Apparent U.S. consumption and market shares ......................................................................... IV-19
Part V: Pricing data .................................................................................................................. V-1
Factors affecting prices .................................................................................................................. V-1
Raw material costs ..................................................................................................................... V-1
U.S. inland transportation costs ................................................................................................. V-2
Pricing practices ............................................................................................................................. V-3
Pricing methods.......................................................................................................................... V-3
Sales terms and discounts .......................................................................................................... V-4
Price data ....................................................................................................................................... V-5
Price trends ................................................................................................................................ V-7
Price comparisons ...................................................................................................................... V-8
Lost sales and lost revenue .......................................................................................................... V-10
CONTENTS
Page
iii
Part VI: Financial experience of U.S. producers ........................................................................ VI-1
Introduction .................................................................................................................................. VI-1
Operations on CACCS .................................................................................................................... VI-1
Variance analysis ....................................................................................................................... VI-5
Capital expenditures, research & development expenses, total assets, and return on assets .... VI-6
Capital and investment ................................................................................................................. VI-7
Part VII: Threat considerations and information on nonsubject countries ............................... VII-1
The industry in Belgium ............................................................................................................... VII-3
Overview .................................................................................................................................. VII-3
Changes in operations .............................................................................................................. VII-3
Operations on CACCS ............................................................................................................... VII-3
Exports ...................................................................................................................................... VII-5
The industry in Colombia ............................................................................................................. VII-6
Overview .................................................................................................................................. VII-6
Changes in operations .............................................................................................................. VII-7
Operations on CACCS ............................................................................................................... VII-7
Alternative products ................................................................................................................ VII-8
Exports ...................................................................................................................................... VII-8
The industry in Thailand ............................................................................................................. VII-10
Overview ................................................................................................................................ VII-10
Changes in operations ............................................................................................................ VII-11
Operations on CACCS ............................................................................................................. VII-11
Exports .................................................................................................................................... VII-12
The industry in subject countries ............................................................................................... VII-14
U.S. inventories of imported merchandise ................................................................................ VII-15
U.S. importers’ outstanding orders ............................................................................................ VII-16
Antidumping or countervailing duty orders in third-country markets ...................................... VII-16
Information on nonsubject countries ........................................................................................ VII-16
CONTENTS
Page
iv
Appendixes
A. Federal Register notices ......................................................................................................... A-1
B. Conference witnesses ............................................................................................................. B-1
C. Summary data ......................................................................................................................... C-1
D. Nonsubject country price data ............................................................................................... D-1
Note.—Information that would reveal confidential operations of individual concerns may not be published and therefore has been deleted. Such deletions are indicated by asterisks.

1
UNITED STATES INTERNATIONAL TRADE COMMISSION
Investigation Nos. 701-TA-581 and 731-TA-1374-1376 (Preliminary) Citric Acid and Certain Citrate Salts from Belgium, Colombia, and Thailand
DETERMINATIONS
On the basis of the record1 developed in the subject investigations, the United States International Trade Commission (“Commission”) determines, pursuant to the Tariff Act of 1930 (“the Act”), that there is a reasonable indication that an industry in the United States is materially injured by reason of imports of citric acid and certain citrate salts from Belgium, Colombia, and Thailand, provided for in subheadings 2918.14, 2918.15, and 3824.99 of the Harmonized Tariff Schedule of the United States, that are allegedly sold at less than fair value (“LTFV”) and that are allegedly subsidized by the government of Thailand.
COMMENCEMENT OF FINAL PHASE INVESTIGATIONS
Pursuant to section 207.18 of the Commission’s rules, the Commission also gives notice of the commencement of the final phase of its investigations. The Commission will issue a final phase notice of scheduling, which will be published in the Federal Register as provided in section 207.21 of the Commission’s rules, upon notice from the Department of Commerce (“Commerce”) of affirmative preliminary determinations in the investigations under sections 703(b) or 733(b) of the Act, or, if the preliminary determinations are negative, upon notice of affirmative final determinations in those investigations under sections 705(a) or 735(a) of the Act. Parties that filed entries of appearance in the preliminary phase of the investigations need not enter a separate appearance for the final phase of the investigations. Industrial users, and, if the merchandise under investigation is sold at the retail level, representative consumer organizations have the right to appear as parties in Commission antidumping and countervailing duty investigations. The Secretary will prepare a public service list containing the names and addresses of all persons, or their representatives, who are parties to the investigations.
BACKGROUND
On June 2, 2017, Archer Daniels Midland Company (Decatur, Illinois), Cargill, Inc. (Minneapolis, Minnesota), and Tate & Lyle Ingredients Americas LLC (Hoffman Estates, Illinois) filed a petition with the Commission and Commerce, alleging that an industry in the United States is materially injured or threatened with material injury by reason of subsidized imports of citric acid and certain citrate salts from Thailand and LTFV imports of citric acid and certain citrate salts from Belgium, Colombia, and Thailand. Accordingly, effective June 2, 2017, the 1 The record is defined in sec. 207.2(f) of the Commission’s Rules of Practice and Procedure (19 CFR 207.2(f)).

2
Commission, pursuant to sections 703(a) and 733(a) of the Act (19 U.S.C. 1671b(a) and 1673b(a)), instituted countervailing duty investigation No. 701-TA-581 and antidumping duty investigation Nos. 731-TA-1374-1376 (Preliminary).
Notice of the institution of the Commission’s investigations and of a public conference to be held in connection therewith was given by posting copies of the notice in the Office of the Secretary, U.S. International Trade Commission, Washington, DC, and by publishing the notice in the Federal Register of June 8, 2017 (82 FR 26712). The conference was held in Washington, DC, on June 23, 2017, and all persons who requested the opportunity were permitted to appear in person or by counsel.
3
Views of the Commission
Based on the record in the preliminary phase of these investigations, we determine that there is a reasonable indication that an industry in the United States is materially injured by reason of imports of citric acid and certain citrate salts (“CACCS”) from Belgium, Colombia, and Thailand that are allegedly sold in the United States at less than fair value and imports of the subject merchandise from Thailand that are allegedly subsidized by the government of Thailand.
I. The Legal Standard for Preliminary Determinations
The legal standard for preliminary antidumping and countervailing duty determinations requires the Commission to determine, based upon the information available at the time of the preliminary determinations, whether there is a reasonable indication that a domestic industry is materially injured or threatened with material injury, or that the establishment of an industry is materially retarded, by reason of the allegedly unfairly traded imports.1 In applying this standard, the Commission weighs the evidence before it and determines whether “(1) the record as a whole contains clear and convincing evidence that there is no material injury or threat of such injury; and (2) no likelihood exists that contrary evidence will arise in a final investigation.”2
II. Background
A. The Current Investigations
Archer Daniels Midland Company (“ADM”), Cargill, Inc. (“Cargill”), and Tate & Lyle Ingredients Americas LLC (“Tate & Lyle”) (collectively “Petitioners”), domestic producers of CACCS, filed the petitions in these investigations on June 2, 2017. Petitioners appeared at the staff conference and submitted a postconference brief.
Several respondent entities participated in these investigations. S.A. Citrique Belge N.V. (“Citrique Belge”), a producer of CACCS in Belgium, participated in the staff conference and submitted a postconference brief. Several other respondent parties did not participate in the staff conference but nonetheless submitted postconference briefs including the following: Proctor & Gamble Manufacturing Co. (“Proctor & Gamble”),3 an importer of subject CACCS from ***; Sucroal S.A. (“Sucroal”), a producer of CACCS in Colombia; COFCO Biochemical
1 19 U.S.C. §§ 1671b(a), 1673b(a) (2000); see also American Lamb Co. v. United States, 785 F.2d 994, 1001-04 (Fed. Cir. 1986); Aristech Chem. Corp. v. United States, 20 CIT 353, 354-55 (1996). No party argues that the establishment of an industry in the United States is materially retarded by the allegedly unfairly traded imports.
2 American Lamb Co., 785 F.2d at 1001; see also Texas Crushed Stone Co. v. United States, 35 F.3d 1535, 1543 (Fed. Cir. 1994).
3 Proctor & Gamble is referred to as “PG Manufacturing” in table IV-1 of the confidential report. Confidential Report (“CR”), Public Report (“PR”) at Table IV-1.

4
(Thailand) Co., Ltd. (“COFCO”), and Sunshine Biotech International Co., Ltd. (“Sunshine”) (collectively “Thai Respondents”), producers of CACCS in Thailand; Quaker Sales & Distribution Inc., Tropicana Manufacturing Company, Inc., and Pepsi-Cola Sales and Distribution Inc. (“Quaker, Tropicana, and Pepsi-Cola”),4 importers of subject CACCS from ***; and Zhong Ya Chemical, Ltd. (“Zhong Ya”), an importer of subject CACCS from ***.
U.S. industry data are based on the questionnaire responses of three producers, believed to account for all of U.S. production of CACCS in 2016. U.S. import data are based on official Department of Commerce (“Commerce”) import statistics and on questionnaire responses from 37 U.S. importers, accounting for *** percent of subject imports from Belgium, *** percent of subject imports from Colombia, and *** percent of subject imports from Thailand in 2016. The Commission received responses to its questionnaires from one producer of CACCS in Belgium accounting for virtually all U.S. imports of CACCS from Belgium, one firm in Colombia accounting for virtually all U.S. imports of CACCS from Colombia, and four firms in Thailand accounting for virtually all U.S. imports of CACCS from Thailand in 2016.5
B. Previous and Related Investigations
In 1999, ADM, Cargill, and Tate & Lyle filed an antidumping petition on imports of CACCS from China. The investigation was terminated after the Commission made a negative determination in the preliminary phase.6
In 2008, the same three firms filed antidumping and countervailing duty petitions on imports of CACCS from Canada and China.7 After affirmative Commission determinations, Commerce subsequently issued a countervailing duty order on CACCS from China and antidumping duty orders on CACCS from Canada and China.8 These orders remain in effect.9
4 PepsiCo, Inc. submitted an importer questionnaire ***. PepsiCo, Inc.’s Importer Questionnaire
at question I-2. 5 CR at I-5 – I-6; PR at I-4. 6 Citric Acid and Sodium Citrate from China, Inv. No. 731-TA-863 (Preliminary), USITC Pub. 3277
at 1 (Feb. 2000); Citric Acid and Sodium Citrate From China, 65 Fed. Reg. 7889 (Feb. 16, 2000). 7 Citric Acid and Certain Citrate Salts from Canada and China, Inv. Nos. 701-TA-456 and 731-TA-
1151-1152 (Final), USITC Pub. 4076 (May 2009); Citric Acid and Certain Citrate Salts from Canada and China, 74 Fed. Reg. 25771 (May 29, 2009).
8 Citric Acid and Certain Citrate Salts from the People’s Republic of China: Notice of Countervailing Duty Order, 74 Fed. Reg. 25705 (May 28, 2009); Citric Acid and Certain Citrate Salts from Canada and the People’s Republic of China: Antidumping Duty Order, 74 Fed. Reg. 25703 (May 29, 2009).
9 Citric Acid and Certain Citrate Salts from Canada and the People’s Republic of China: Continuation of the Antidumping Duty Orders on Canada and the People’s Republic of China, and Continuation of the Countervailing Duty Order on the People’s Republic of China, 80 Fed. Reg. 36318 (June 24, 2015); Citric Acid and Certain Citrate Salts from Canada and China, Inv. Nos. 701-TA-456 and 731-TA-1151-1152 (Review), USITC Pub. 4538 (June 2015).

5
III. Domestic Like Product
In determining whether there is a reasonable indication that an industry in the United States is materially injured or threatened with material injury by reason of imports of the subject merchandise, the Commission first defines the “domestic like product” and the “industry.”10 Section 771(4)(A) of the Tariff Act of 1930, as amended (“the Tariff Act”), defines the relevant domestic industry as the “producers as a whole of a domestic like product, or those producers whose collective output of a domestic like product constitutes a major proportion of the total domestic production of the product.”11 In turn, the Tariff Act defines “domestic like product” as “a product which is like, or in the absence of like, most similar in characteristics and uses with, the article subject to an investigation.”12
The decision regarding the appropriate domestic like product(s) in an investigation is a factual determination, and the Commission has applied the statutory standard of “like” or “most similar in characteristics and uses” on a case-by-case basis.13 No single factor is dispositive, and the Commission may consider other factors it deems relevant based on the facts of a particular investigation.14 The Commission looks for clear dividing lines among possible like products and disregards minor variations.15 Although the Commission must accept Commerce’s determination as to the scope of the imported merchandise that is subsidized and/or sold at less than fair value,16 the Commission determines what domestic product is like
10 19 U.S.C. § 1677(4)(A). 11 19 U.S.C. § 1677(4)(A). 12 19 U.S.C. § 1677(10). 13 See, e.g., Cleo Inc. v. United States, 501 F.3d 1291, 1299 (Fed. Cir. 2007); NEC Corp. v.
Department of Commerce, 36 F. Supp. 2d 380, 383 (Ct. Int’l Trade 1998); Nippon Steel Corp. v. United States, 19 CIT 450, 455 (1995); Torrington Co. v. United States, 747 F. Supp. 744, 749 n.3 (Ct. Int’l Trade 1990), aff’d, 938 F.2d 1278 (Fed. Cir. 1991) (“every like product determination ‘must be made on the particular record at issue’ and the ‘unique facts of each case’”). The Commission generally considers a number of factors including the following: (1) physical characteristics and uses; (2) interchangeability; (3) channels of distribution; (4) customer and producer perceptions of the products; (5) common manufacturing facilities, production processes, and production employees; and, where appropriate, (6) price. See Nippon, 19 CIT at 455 n.4; Timken Co. v. United States, 913 F. Supp. 580, 584 (Ct. Int’l Trade 1996).
14 See, e.g., S. Rep. No. 96-249 at 90-91 (1979). 15 See, e.g., Nippon, 19 CIT at 455; Torrington, 747 F. Supp. at 748-49; see also S. Rep. No. 96-249
at 90-91 (Congress has indicated that the like product standard should not be interpreted in “such a narrow fashion as to permit minor differences in physical characteristics or uses to lead to the conclusion that the product and article are not ‘like’ each other, nor should the definition of ‘like product’ be interpreted in such a fashion as to prevent consideration of an industry adversely affected by the imports under consideration.”).
16 See, e.g., USEC, Inc. v. United States, 34 Fed. App’x 725, 730 (Fed. Cir. 2002) (“The ITC may not modify the class or kind of imported merchandise examined by Commerce.”); Algoma Steel Corp. v. United States, 688 F. Supp. 639, 644 (Ct. Int’l Trade 1988), aff’d, 865 F.3d 240 (Fed. Cir.), cert. denied, 492 U.S. 919 (1989).

6
the imported articles Commerce has identified.17 The Commission may, where appropriate, include domestic articles in the domestic like product in addition to those described in the scope.18
In its notice of initiation, Commerce defined the imported merchandise within the scope of these investigations as follows:
…all grades and granulation sizes of citric acid, sodium citrate, and potassium citrate in their unblended forms, whether dry or in solution, and regardless of packaging type. The scope also includes blends of citric acid, sodium citrate, and potassium citrate; as well as blends with other ingredients, such as sugar, where the unblended form(s) of citric acid, sodium citrate, and potassium citrate constitute 40 percent or more, by weight, of the blend. The scope also includes all forms of crude calcium citrate, including dicalcium citrate monohydrate, and tricalcium citrate tetrahydrate, which are intermediate products in the production of citric acid, sodium citrate, and potassium citrate. The scope includes the hydrous and anhydrous forms of citric acid, the dihydrate and anhydrous forms of sodium citrate, otherwise known as citric acid sodium salt, and the monohydrate and monopotassium forms of potassium citrate. Sodium citrate also includes both trisodium citrate and monosodium citrate which are also known as citric acid trisodium salt and citric acid monosodium salt, respectively. The scope does not include calcium citrate that satisfies the standards set forth in the United States Pharmacopeia and has been mixed with a functional excipient, such as dextrose or starch, where the excipient constitutes at least 2 percent, by weight, of the product. Citric acid and sodium citrate and classifiable under 2918.14.0000 and 2918.15.1000 of the HTSUS, respectively. Potassium citrate and crude calcium citrate are classifiable under 2918.15.5000 and, if included in a mixture or blend, 3824.99.9295 of the HTSUS. Blends that include citric acid, sodium citrate, and potassium citrate are classifiable under 3824.99.9295 of the HTSUS. Although the HTSUS subheadings are provided for convenience and customers purposes, the written description of the merchandise is dispositive.19
17 Hosiden Corp. v. Advanced Display Mfrs., 85 F.3d 1561, 1568 (Fed. Cir. 1996) (the Commission
may find a single like product corresponding to several different classes or kinds defined by Commerce); Cleo, 501 F.3d at 1298 n.1 (“Commerce’s {scope} finding does not control the Commission’s {like product} determination.”); Torrington, 747 F. Supp. at 748-52 (affirming the Commission’s determination defining six like products in investigations where Commerce found five classes or kinds).
18 See, e.g., Pure Magnesium from China and Israel, Inv. Nos. 701-TA-403 and 731-TA-895-96 (Final), USITC Pub. 3467 at 8 n.34 (Nov. 2001); Torrington, 747 F. Supp. at 748-49 (holding that the Commission is not legally required to limit the domestic like product to the product advocated by the petitioner, co-extensive with the scope).
19 Citric Acid and Certain Citrate Salts from Thailand: Initiation of Countervailing Duty Investigation, 82 Fed. Reg. 29836 (June 30, 2017); Citric Acid and Certain Citrate Salts from Belgium, Colombia, and Thailand: Initiation of Less-Than-Fair Value Investigations, 82 Fed. Reg. 29828 (June 30, 2017); Department of Commerce, AD Initiation Checklist, Inv. Nos. A–423–813, A–301–803, A–549–833; Department of Commerce, CVD Initiation Checklist, Inv. No. C-549-834, June 22, 2017.

7
Citric acid, sodium citrate, and potassium citrate are chemical products used in the production and formulation of a wide variety of foods, beverages, pharmaceuticals, and cosmetics, as well as in commercial and household products, including detergents and metal cleaners, and in textile finishing treatments and other industrial applications.20
In the prior investigations and first reviews regarding CACCS from China and Canada, which involved an identical scope as the current investigations, the Commission defined one domestic like product consisting of citric acid (whether in crude form as calcium citrate or finished form), sodium citrate, and potassium citrate in all chemical and physical forms and grades.21 22
In the instant investigations, petitioners argue that there is one domestic like product consisting of all items corresponding to the scope and that there is no clear dividing line differentiating citric acid, sodium citrate, and potassium citrate.23 Although it acknowledges that citric acid and citrate salts share many features and are used in a variety of applications in the food and beverage industry, for medicines and pharmaceuticals, and for commercial and industrial cleaning operations, respondent Zhong Ya contends that there are clear dividing lines in the characteristics and uses between citric acid and citrate salts (sodium citrate, potassium citrate, and crude calcium citrate) that warrant defining two separate domestic like products.24
Based on the record in the preliminary phase of these investigations, we define a single domestic like product consisting of CACCS.
Physical Characteristics and Uses. CCC is an intermediate product that is internally consumed for the production of citric acid,25 and citric acid is used to produce sodium citrate
20 CR at I-3 – I-4; PR at I-11. 21 The Commission found no clear dividing lines among domestically produced products
corresponding to the scope of the investigations. Although observing that citric acid, sodium citrate, and potassium citrate were not substitutable in all applications, it found that they were used in an overlapping manner in some of the same types of end-use products as buffers, acidulants, and preservatives. Citric Acid and Certain Citrate Salts from Canada and China, Inv. Nos. 701-TA-456 and 731-TA-1151-1152 (Final), USITC Pub. 4076 at 5-9 (May 2009); Citric Acid and Certain Citrate Salts from Canada and China, Inv. Nos. 701-TA-456 and 731-TA-1151-1152 (Review), USITC Pub. 4538 at 6 (June 2015).
22 The Commission also previously considered whether citric acid and sodium citrate constituted separate like products in its earlier preliminary negative determination in the initial investigation regarding CACCS from China, and determined that citric acid and sodium citrate were a single like product. Citric Acid and Sodium Citrate from China, Inv. No. 731-TA-863 (Preliminary), USITC Pub. 3277 at 5-7 (Feb. 2000). We note that Commerce’s scope in that investigation did not include crude calcium citrate (“CCC”), potassium citrate, or certain blends. Citric Acid and Sodium Citrate from China, Inv. No. 731-TA-863 (Preliminary), USITC Pub. 3277 at 4-5 (Feb. 2000).
23 Petitioners’ Postconference Br. at 2-8. In particular, they contend that, although citric acid, sodium citrate, and potassium citrate are not substitutable in all applications, they have the same end uses as buffers, acidulants, and preservatives, and are used in an overlapping manner in the same types of end products, primarily beverage and food applications.
24 Zhong Ya’s Postconference Br. at 1-12. 25 CR at I-12; PR at I-10.

8
and potassium citrate. Each may be produced in more than one chemical form.26 Citric acid, sodium citrate, and potassium citrate are all available as odorless, translucent crystals. In their dry form, they are sold as either granular, fine granular, or powder products. A water solution form of citric acid (normally a 50-percent solution) is produced and sold in the United States, both forms can be easily converted to the other, and purchasers sometimes buy the dry product and put it into a solution at their own facilities or at the facilities of an independent converter. Zhong Ya claims that citric acid, sodium citrate, and potassium citrate each have different molecular weights and different boiling points,27 whereas petitioners assert that minor molecular modifications do not change the essential character and use of these products.28 Whether dry or dissolved in water, the product’s chemical properties are the same.
Citric acid, sodium citrate, and potassium citrate must meet Food Chemical Codex (“FCC”) standards for use in beverage and food products in the United States and U.S. Pharmacopeia (“USP”) standards for use in pharmaceutical products in the United States.29 Non-conforming products, however, may be used in industrial applications.30 Citric acid, sodium citrate, and potassium citrate are each used in foods and beverages,31 in pharmaceutical applications,32 and in industrial uses.33
26 CR at I-14; PR at I-9. Citric acid may be produced as citric acid anhydrous (C6H8O7) and as citric
acid monohydrate (C6H8O7•H2O). Sodium citrate may be produced as sodium citrate anhydrous or trisodium anhydrous form (Na3C6H5O7), as sodium citrate dihydrate or trisodium citrate dihydrate (Na3C6H5O7•H2O), and as monosodium citrate (NaH2(C3H5O(COO)3). Potassium citrate may be produced as potassium citrate monohydrate or tripotassium citrate monohydrate (K3C6H5O7•H2O) and monopotassium citrate (KH2C6H5O7). Crude calcium citrate (“CCC”) may be produced as tricalcium citrate (Ca3(C6H5O7)2), dicalcium citrate (Ca2H2(C3H5O)(COO)3•H2O), and tricalcium citrate tetrahydrate (Ca3(C6H5O7)2(COO)3•4H2O). Id.
27 Zhong Ya’s Postconference Br. at 5. 28 Petition at 4. 29 CR/PR at II-1; Petition at 5. 30 Petition at 9-10. 31 Citric acid is used in foods and beverages (such as carbonated and non-carbonated drinks, dry
powdered beverages, wine and wine coolers, jams, jellies, preserves, gelatin desserts, candies, frozen foods, and canned fruits and vegetables) as an acidulant, preservative, and flavor enhancer because of its tartness, high solubility, acidity, and buffering capabilities. Sodium citrate is used for carbonated beverages, dry beverage mixes, fruit drinks, jams, jellies, preserves, gelatin desserts, and candies, and in cheese and dairy products (to improve emulsifying properties, texture, and melting properties and to act as a preservative and aging agent). Potassium citrate can be used for many of the same food and beverage applications as sodium citrate, particularly for no- or low-sodium content products. CR at I-14 – I-15; PR at I-11; Petition at 5-6.
32 Citric acid is used in pharmaceuticals and cosmetics, and sodium citrate is used in pharmaceuticals as an expectorant in cough syrups and in over-the-counter antacids. Potassium citrate is also used in pharmaceutical applications as an antacid, a diuretic, an expectorant, in dietary supplements, to treat kidney stones, and as a systemic and urinary alkalizer. CR at I-14 – I-15; PR at I-11; Petition at 6; Zhong Ya’s Postconference Br. at 7-8.
33 Citric acid is used in industrial applications such as in household detergents, metal finishers and cleaners, and durable press textile finishing treatments. Sodium citrate also is used in household (Continued…)

9
Manufacturing Facilities, Production Processes, and Employees. In the United States, citric acid, sodium citrate, and potassium citrate are produced at the same manufacturing facilities by the same employees, at least for the early production stages.34 At the first manufacturing stage, domestic producers ferment a starch or sugar base (primarily corn but sometimes molasses or other products) using a fermenting organism (normally a specific mold or yeast) in a deep tank. At the second stage, domestic producers recover the crude citric acid produced by fermentation and refine it by one of two processes: the lime/sulfuric acid method or the solvent extraction method. Both methods yield citric acid dissolved in water, and producers produce hydrous or anhydrous citric acid by adjusting the temperature of the crystallization process.35 Citric acid can then be sold as is or converted into salts, such as sodium citrate or potassium citrate.36
Tate & Lyle only produces citric acid, but both ADM and Cargill produce citric acid, sodium citrate, and potassium citrate.37 ADM and Cargill produce sodium citrate by diverting some of the citric acid slurry to a line dedicated to citric salt production, where the slurry is reacted with sodium hydroxide or sodium carbonate. Similarly, they produce potassium citrate by reacting citric acid slurry with potassium hydroxide or potassium carbonate using the same equipment and processes.38
Channels of Distribution. Domestic producers shipped *** percent of their CACCS to end users, and the remainder to distributors,39 during the January 2014 to March 2017 period of investigation (“period of investigation”).
Interchangeability. Petitioners contend, and no party disputes, that the monohydrate and anhydrous forms of citric acid are completely interchangeable, that the dihydrate and anhydrous forms of sodium citrate are also completely interchangeable, and that sodium and potassium citrates have similar physical and chemical characteristics, being citric acid reacted with a salt.
Although, as described above, citric acid, sodium citrate, and potassium citrate are not substitutable in all applications, they share some of the same end uses as buffers, acidulants, and preservatives. According to petitioners, purchasers also use both citric acid and citrate salts for carbonated beverages, dry beverage mixes, fruit drinks, jams, jellies, preserves, gelatin desserts, and candies, as discussed above.40
Producer and Customer Perceptions. According to petitioners, because citric acid, sodium citrate, and potassium citrate have the same basic physical characteristics and many of (…Continued) cleaner products to act as a buffering agent and metal ion sequestrant, and potassium citrate also can be used in electropolishing and as a buffering agent. CR at I-15; PR at I-11; Petition at 6; Zhong Ya’s Postconference Br. at 7-8.
34 CR at I-17 – I-21; PR at I-12 – I-15. 35 CR at I-17 – I-21; PR at I-12 – I-15. 36 CR at I-21; PR at I-15. 37 CR at I-13; PR at I-10. 38 CR at I-21; PR at I-11; Petition at 9. 39 CR/PR at Table II-1. 40 Petition at 5-6.

10
the same end uses, producers and customers view them similarly. They claim that domestic producers group all three products within a single product line, and market studies treat all three as one industry.41 Zhong Ya contends that this demonstrates only that customers and producers recognize that they are closely related products, and it notes that citric acid and citrate salts are not referred to interchangeably and ***.42
Price. Petitioners contend that, although prices for CACCS may differ depending on whether the product is citric acid or a citrate salt, the citric molecule is priced the same and the salt element is correlated with the salt’s value. They further contend that, because sodium and citric molecules are close in value, sodium citrate and citric acid also are close in overall value, and there are no price differences between citric acid sold in a solution form or on a dry basis or between genetically modified organisms (“GMO”) and non-GMO CACCS.43 Zhong Ya agrees that citric acid and sodium citrate tend to be priced equivalently on a per pound basis but argues that there are greater distinctions between the per unit prices of sodium citrate and potassium citrate.44 The pricing data in the preliminary phase of these investigations indicate that citric acid and sodium citrate are comparably priced.45
Conclusion. The record in the preliminary phase of these investigations indicates that there is a spectrum or grouping of domestically produced products corresponding to the scope of the investigations without clear dividing lines based on chemical or physical form, grade (food, pharmaceutical, or industrial and GMO, non-GMO, or verified non-GMO), or product type (citric acid or citrate salts). Whether in an intermediate form as crude calcium citrate, as citric acid, or transformed into sodium citrate or potassium citrate, citric acid and its citrate salts come in a variety of chemical and physical forms and grades for a variety of end uses, and physical appearance varies accordingly. All have similar chemical composition. Whereas crude calcium citrate is only used to produce citric acid, and some citric acid is used to produce sodium citrate or potassium citrate, citric acid, sodium citrate, and potassium citrate are all used as buffers, acidulants, and preservatives and in some of the same food and beverage applications. Although citric acid, sodium citrate, and potassium citrate are not substitutable in all applications, they are used in an overlapping manner in some of the same types of end products. There may be some limitations on interchangeability with respect to certain end uses, but as the Commission has indicated in other investigations where the scope encompasses a variety of products, a lack of interchangeability among types of products along the spectrum or included in a grouping of similar products is not unexpected. In those cases, the Commission considers the spectrum or grouping itself to constitute the domestic like
41 Petitioners’ Postconference Br. at 6. 42 Zhong Ya’s Postconference Br. at 11. 43 Petitioners’ Postconference Br. at 7. 44 Zhong Ya’s Postconference Br. at 12. 45 CR/PR at Tables V-3 – V-10 (showing that citric acid pricing ranges from $*** per dry pound to
$*** per dry pound and that sodium citrate pricing ranges from $*** per dry pound to $*** per dry pound). Id.

11
product, and it disregards minor variations, absent a clear dividing line between particular products.46
In light of these facts, for purposes of the preliminary phase of these investigations, we define a single domestic like product consisting of the CACCS products corresponding to the scope of these investigations, including crude calcium citrate, citric acid, sodium citrate, and potassium citrate in all chemical and physical forms.47
IV. Domestic Industry
The domestic industry is defined as the domestic “producers as a whole of a domestic like product, or those producers whose collective output of a domestic like product constitutes a major proportion of the total domestic production of the product.”48 In defining the domestic industry, the Commission’s general practice has been to include in the industry producers of all domestic production of the like product, whether toll-produced, captively consumed, or sold in the domestic merchant market.
In the United States, ADM and Cargill produce citric acid, sodium citrate, and potassium citrate, while Tate & Lyle produces only citric acid.49 There are no related party issues in these investigations.50 Consistent with our definition of the domestic like product, and in the absence of arguments otherwise, we define the domestic industry as including these three known domestic producers of CACCS.
V. Negligible Imports
Pursuant to Section 771(24) of the Tariff Act, imports from a subject country of merchandise corresponding to a domestic like product that account for less than 3 percent of all such merchandise imported into the United States during the most recent 12 months for which data are available preceding the filing of the petition shall be deemed negligible.51 The statute further provides that subject imports from a single country which comprise less than 3 percent of total such imports of the product may not be considered negligible if there are
46 See, e.g., Carbon and Certain Alloy Steel Wire Rod from Belarus, Italy, Korea, Russia, South
Africa, Spain, Turkey, Ukraine, United Arab Emirates, and the United Kingdom, Inv. Nos. 701-TA-573-574 and 731-TA-1349-1358 (Preliminary), USITC Pub. 4693 at 11-12 (May 2017); Carbon and Certain Alloy Steel Wire Rod from China, Germany, and Turkey, Inv. Nos. 731-TA-1099-1101 (Preliminary), USITC Pub. 3832 at 10 (Jan. 2006); Outboard Engines from Japan, Inv. No. 731-TA-1069 (Preliminary), USITC Pub. 3674 at 7-8 (Mar. 2004).
47 This approach is consistent with prior investigations and reviews, as discussed above. 48 19 U.S.C. § 1677(4)(A). 49 CR at I-13; PR at I-10. 50 No U.S. producer imported CACCS from any of the subject countries, and none of them is
related to any exporter or importer of CACCS from any of the subject countries. CR/PR at Tables III-2 & III-6.
51 19 U.S.C. §§ 1671b(a), 1673b(a), 1677(24)(A)(i), 1677(24)(B); see also 15 C.F.R. § 2013.1 (developing countries for purposes of 19 U.S.C. § 1677(36)).
12
several countries subject to investigation with negligible imports and the sum of such imports from all those countries collectively accounts for more than 7 percent of the volume of all such merchandise imported into the United States.52 In the case of countervailing duty investigations involving developing countries (as designated by the United States Trade Representative), the statute indicates that the negligibility limits are 4 percent and 9 percent, rather than 3 percent and 7 percent.53
Subject imports from Belgium, Colombia, and Thailand accounted for *** percent, *** percent, and *** percent of total imports of CACCS by quantity, respectively, during May 2016 through April 2017, the most recent 12-month period preceding the petitions’ filing for which data are currently available.54 Because subject imports from each subject country exceed the applicable statutory threshold (3 percent for imports from Belgium, Colombia, and Thailand subject to antidumping duty investigations and 4 percent for imports from Thailand subject to the countervailing duty investigations),55 we find that imports from each subject source are not negligible.
VI. Cumulation
For purposes of evaluating the volume and effects for a determination of reasonable indication of material injury by reason of subject imports, section 771(7)(G)(i) of the Tariff Act requires the Commission to cumulate subject imports from all countries as to which petitions were filed and/or investigations self-initiated by Commerce on the same day, if such imports compete with each other and with the domestic like product in the U.S. market. In assessing whether subject imports compete with each other and with the domestic like product, the Commission generally has considered four factors:
(1) the degree of fungibility between subject imports from different
countries and between subject imports and the domestic like product, including consideration of specific customer requirements and other quality related questions;
(2) the presence of sales or offers to sell in the same geographic markets of subject imports from different countries and the domestic like product;
(3) the existence of common or similar channels of distribution for subject imports from different countries and the domestic like product; and
52 19 U.S.C. § 1677(24)(A)(ii). 53 19 U.S.C. § 1677(24)(B). The United States Trade Representative has designated Thailand as a
developing country. See 15 C.F.R. § 2013.1 (developing countries for purposes of 19 U.S.C. § 1677 (36)). 54 CR at IV-8; PR at IV-7. Trade data were not yet available for May 2017 as of the time that the
staff report was issued. CR/PR at Table IV-3, note. 55 The United States Trade Representative has designated Thailand to be a developing country
subject to the 4 percent negligibility threshold for countervailing duty investigations. 15 C.F.R. § 2013.1; see 19 U.S.C. § 1677(24)(B).

13
(4) whether the subject imports are simultaneously present in the market.56
While no single factor is necessarily determinative, and the list of factors is not exclusive, these factors are intended to provide the Commission with a framework for determining whether the subject imports compete with each other and with the domestic like product.57 Only a “reasonable overlap” of competition is required.58
Petitioners argue that imports from all three subject countries should be cumulated because there is a reasonable overlap of competition among subject imports and the domestic like product.59 Citrique Belge argues that subject imports from Belgium should not be cumulated with imports from other countries because there is limited overlap in competition between imports from Belgium and other subject sources and the domestic like product.60
We consider subject imports from Belgium, Colombia, and Thailand on a cumulated basis, because the statutory criteria for cumulation are satisfied. As an initial matter, petitioner filed the antidumping/countervailing duty petitions with respect to all three countries on the same day, June 17, 2017.61 The record also supports finding a reasonable overlap of competition among CACCS produced in Belgium, Colombia, Thailand, and the United States, as indicated below.
Fungibility. U.S. producers’ and subject importers’ U.S. shipments consisted of CACCS in granular, fine granular, powder, and solution forms.62 For both domestic producers and importers from each subject country, the *** of all U.S. shipments were granular or fine
56 See Certain Cast-Iron Pipe Fittings from Brazil, the Republic of Korea, and Taiwan, Inv. Nos.
731-TA-278-80 (Final), USITC Pub. 1845 (May 1986), aff’d, Fundicao Tupy, S.A. v. United States, 678 F. Supp. 898 (Ct. Int’l Trade), aff’d, 859 F.2d 915 (Fed. Cir. 1988).
57 See, e.g., Wieland Werke, AG v. United States, 718 F. Supp. 50 (Ct. Int’l Trade 1989). 58 The Statement of Administrative Action (“SAA”) to the Uruguay Round Agreements Act
(“URAA”), expressly states that “the new section will not affect current Commission practice under which the statutory requirement is satisfied if there is a reasonable overlap of competition.” H.R. Rep. No. 103-316, Vol. I at 848 (1994) (citing Fundicao Tupy, 678 F. Supp. at 902); see Goss Graphic Sys., Inc. v. United States, 33 F. Supp. 2d 1082, 1087 (Ct. Int’l Trade 1998) (“cumulation does not require two products to be highly fungible”); Wieland Werke, AG, 718 F. Supp. at 52 (“Completely overlapping markets are not required.”).
59 Petitioners’ Postconference Br. at 14-22. In particular, petitioners assert that subject imports and the domestic like product are fungible as commodity chemical products manufactured to the same specifications. Petitioners further contend that domestic and subject producers all compete for the same customers nationwide, are sold in overlapping channels of distribution to end users and distributors, and were simultaneously present in the U.S. market in each of the past three years. Id.
60 Citrique Belge’s Postconference Br. at 5-8 & Attachments 2, 3. Citrique Belge claims to be the only producer that meets seven specific standards – Kosher, Kosher for Passover, Halal, ISO9001, ISO14001, ISO22000, and Global Food Safety Initiative (British Retail Consortium/International Food Standard) (“GFSI (BRC/IFS)”). It further contends that, although it is not currently Non-GMO Project Verified, the GMO and non-GMO distinction is becoming increasingly relevant in the U.S. market, and it believes that its product qualifies as non-GMO, unlike CACCS produced by the domestic industry. Id.
61 None of the statutory exceptions to cumulation applies. 62 CR at IV-9; PR at IV-8 & CR/PR at Table IV-4.

14
granular CACCS.63 The current record indicates that citric acid in all of these forms is interchangeable and that citric acid in dry form is readily converted into a solution.64
During the period of investigation, both U.S. producers and U.S. importers of CACCS from each of the three subject countries shipped citric acid, sodium citrate, and potassium citrate.65 For U.S. producers and importers of CACCS from all three subject countries, citric acid accounted for the vast majority of their U.S. shipments, with sodium citrate accounting for a much smaller percentage and potassium citrate accounting for the smallest percentage of U.S. shipments.66
The current record indicates that subject imports from each subject country are generally interchangeable with each other and the domestic like product. All domestic producers reported that domestically produced CACCS are always interchangeable with CACCS from each subject country and that CACCS from each subject country are always interchangeable with CACCS from each other subject country. Most importers reported that domestically produced CACCS are always or frequently interchangeable with subject imports from Belgium and Colombia, while a plurality of importers reported that subject imports from Thailand and the domestic like product are sometimes interchangeable. U.S. importers generally reported that CACCS from each subject country were interchangeable with the CACCS imports from each of the other subject countries, although their answers were more mixed for imports from Thailand.67
Citrique Belge’s alleged use of non-GMO raw materials to manufacture its CACCS does not, in our view, establish a lack of fungibility between subject imports from Belgium and the domestic like product, which is allegedly produced using GMO inputs, or subject imports from Colombia and Thailand that reportedly have been Non-GMO Project Verified.68 By their own admission, Citrique Belge’s products lack Non-GMO Project Verification but have been sold to
63 CR at IV-9; PR at IV-8 & CR/PR at Table IV-4. In 2016, the domestic industry’s U.S. shipments
of CACCS in granular and fine granular forms accounted for *** percent of its total U.S. shipments. With respect to subject importers, CACCS in granular and fine granular forms accounted for *** percent of subject imports from Belgium, nearly *** percent of subject imports from Colombia, and *** percent of subject imports from Thailand. CR/PR at Table IV-4. A smaller percentage of the domestic industry’s U.S. shipments consisted of CACCS in solution form, while importers of CACCS from Colombia and Thailand reported *** amounts of U.S. shipments of CACCS in solution form and importers of CACCS from Belgium *** shipments of CACCS in solution form. U.S. producers and importers of CACCS from Thailand shipped *** amounts of CACCS in powder form, while importers of CACCS from Belgium and Columbia *** CACCS in powder form. CR/PR at Table IV-4. In 2016, domestic producers’ U.S. shipments of CACCS in powder form accounted for *** percent of its total U.S. shipments, while CACCS in powder form accounted for *** percent of subject imports from Thailand. Id.
64 Conference Transcript (“Tr.”) at 30, 64, 77-78 (Erickson), 64 (Jones), 65 (Aud). 65 CR/PR at Table IV-5. 66 CR/PR at Table IV-5. 67 CR at II-14 – II-15; PR at I-10 & CR/PR at Table II-6. 68 See, e.g., Sucroal’s Postconference Br. at 1-5 & Exhibits 1, 2; Tr. at 111 (de Backer).

15
non-GMO accounts, which petitioners claim that the domestic industry is also able to supply.69 Indeed, both the domestic industry and Citrique Belge increased shipments for food and beverage end uses as a percentage of their total U.S. commercial shipments during the period of investigation, notwithstanding that both lack Non-GMO Project Verification.70 Because subject imports from Belgium are sold to purchasers of both non-GMO and GMO products, GMO status does not appear to limit competition between subject imports from Belgium and either the domestic like product or other subject imports.
Although there may be some limitations on the fungibility of GMO and non-GMO CACCS based on certain customer preferences for CACCS made from non-GMO substrate,71 the record in the preliminary phase of these investigations indicates a reasonable level of fungibility between and among the domestic like product and CACCS from each subject source. As discussed in greater detail below, we intend to explore the significance of the distinction between GMO and non-GMO CACCS in the U.S. market in any final phase of these investigations.
Channels of Distribution. Domestic producers and importers of CACCS from all subject countries sold CACCS to distributors and end users, although U.S. producers and importers of CACCS from Belgium and Colombia sold mainly to end users, while importers of CACCS from Thailand sold mainly to distributors.72
Geographic Overlap. Domestically produced CACCS are sold throughout the United States, as are subject imports from Belgium, Colombia, and Thailand, except that imports of CACCS from Belgium are not sold in the “other” geographic market, consisting of Alaska, Hawaii, Puerto Rico, and the U.S. Virgin Islands.73
Simultaneous Presence in Market. Import and pricing data show that the domestic like product and CACCS imported from all subject countries have been present in the U.S. market throughout the period of investigation.74
Conclusion. The record in the preliminary phase of these investigations indicates that subject imports from each subject country are reasonably fungible with the domestic like
69 Citrique Belge’s Postconference Br. at 6; Petitioners’ Postconference Br. at 12-13; Tr. at 51-52
(Aud). 70 CR/PR at Table II-1. With respect to other certifications, Citrique Belge argues that its
products are unique in that they meet additional standards that U.S. and other subject producers cannot meet. Citrique Belge’s Postconference Br. at 5. We observe, however, that the domestic industry reports that it also meets halal and kosher standards. Petitioners’ Postconference Br. at 19-20. Moreover, the significance of other certifications in the U.S. market is not clear from the record in the preliminary phase of these investigations.
71 Eight importers reported that non-GMO certification requirements somewhat limited interchangeability between the domestic like product and subject imports. CR at II-14 – II-15; PR at II-10 & CR/PR at Table II-6. Notwithstanding this, as discussed above, most producers and importers found that subject imports from Belgium were always or frequently interchangeable with the domestic like product and imports from other subject sources. CR/PR at Table II-6.
72 CR/PR at II-1 & CR/PR at Table II-1. 73 CR/PR at Table II-2. 74 CR/PR at Tables IV-8, V-3 – V-10.

16
product and each other, that subject imports from each subject country and the domestic like product are sold in similar channels of distribution and in similar geographic markets, and have been simultaneously present in the U.S. market. In light of the foregoing, we find that there is a reasonable overlap of competition among the domestic like product and subject imports from each subject country and between imports from each subject country.
VII. Reasonable Indication of Material Injury by Reason of Subject Imports
A. Legal Standard
In the preliminary phase of antidumping and countervailing duty investigations, the Commission determines whether there is a reasonable indication that an industry in the United States is materially injured or threatened with material injury by reason of the imports under investigation.75 In making this determination, the Commission must consider the volume of subject imports, their effect on prices for the domestic like product, and their impact on domestic producers of the domestic like product, but only in the context of U.S. production operations.76 The statute defines “material injury” as “harm which is not inconsequential, immaterial, or unimportant.”77 In assessing whether there is a reasonable indication that the domestic industry is materially injured by reason of subject imports, we consider all relevant economic factors that bear on the state of the industry in the United States.78 No single factor is dispositive, and all relevant factors are considered “within the context of the business cycle and conditions of competition that are distinctive to the affected industry.”79
Although the statute requires the Commission to determine whether there is a reasonable indication that the domestic industry is “materially injured by reason of” unfairly traded imports,80 it does not define the phrase “by reason of,” indicating that this aspect of the injury analysis is left to the Commission’s reasonable exercise of its discretion.81 In identifying a causal link, if any, between subject imports and material injury to the domestic industry, the Commission examines the facts of record that relate to the significance of the volume and price effects of the subject imports and any impact of those imports on the condition of the domestic
75 19 U.S.C. §§ 1671b(a), 1673b(a). The Trade Preferences Extension Act of 2015, Pub. L. 114-27,
amended the provisions of the Tariff Act pertaining to Commission determinations of reasonable indication of material injury and threat of material injury by reason of subject imports in certain respects. We have applied these amendments here.
76 19 U.S.C. § 1677(7)(B). The Commission “may consider such other economic factors as are relevant to the determination” but shall “identify each {such} factor ... {a}nd explain in full its relevance to the determination.” 19 U.S.C. § 1677(7)(B).
77 19 U.S.C. § 1677(7)(A). 78 19 U.S.C. § 1677(7)(C)(iii). 79 19 U.S.C. § 1677(7)(C)(iii). 80 19 U.S.C. §§ 1671b(a), 1673b(a). 81 Angus Chemical Co. v. United States, 140 F.3d 1478, 1484-85 (Fed. Cir. 1998) (“{T}he statute
does not ‘compel the commissioners’ to employ {a particular methodology}.”), aff’g 944 F. Supp. 943, 951 (Ct. Int’l Trade 1996).
17
industry. This evaluation under the “by reason of” standard must ensure that subject imports are more than a minimal or tangential cause of injury and that there is a sufficient causal, not merely a temporal, nexus between subject imports and material injury.82
In many investigations, there are other economic factors at work, some or all of which may also be having adverse effects on the domestic industry. Such economic factors might include nonsubject imports; changes in technology, demand, or consumer tastes; competition among domestic producers; or management decisions by domestic producers. The legislative history explains that the Commission must examine factors other than subject imports to ensure that it is not attributing injury from other factors to the subject imports, thereby inflating an otherwise tangential cause of injury into one that satisfies the statutory material injury threshold.83 In performing its examination, however, the Commission need not isolate the injury caused by other factors from injury caused by unfairly traded imports.84 Nor does
82 The Federal Circuit, in addressing the causation standard of the statute, has observed that “{a}s long as its effects are not merely incidental, tangential, or trivial, the foreign product sold at less than fair value meets the causation requirement.” Nippon Steel Corp. v. USITC, 345 F.3d 1379, 1384 (Fed. Cir. 2003). This was re-affirmed in Mittal Steel Point Lisas Ltd. v. United States, 542 F.3d 867, 873 (Fed. Cir. 2008), in which the Federal Circuit, quoting Gerald Metals, Inc. v. United States, 132 F.3d 716, 722 (Fed. Cir. 1997), stated that “this court requires evidence in the record ‘to show that the harm occurred “by reason of” the LTFV imports, not by reason of a minimal or tangential contribution to material harm caused by LTFV goods.’” See also Nippon Steel Corp. v. United States, 458 F.3d 1345, 1357 (Fed. Cir. 2006); Taiwan Semiconductor Industry Ass’n v. USITC, 266 F.3d 1339, 1345 (Fed. Cir. 2001).
83 SAA, H.R. Rep. 103-316, Vol. I at 851-52 (1994) (“{T}he Commission must examine other factors to ensure that it is not attributing injury from other sources to the subject imports.”); S. Rep. 96-249 at 75 (1979) (the Commission “will consider information which indicates that harm is caused by factors other than less-than-fair-value imports.”); H.R. Rep. 96-317 at 47 (1979) (“in examining the overall injury being experienced by a domestic industry, the ITC will take into account evidence presented to it which demonstrates that the harm attributed by the petitioner to the subsidized or dumped imports is attributable to such other factors;” those factors include “the volume and prices of nonsubsidized imports or imports sold at fair value, contraction in demand or changes in patterns of consumption, trade restrictive practices of and competition between the foreign and domestic producers, developments in technology and the export performance and productivity of the domestic industry”); accord Mittal Steel, 542 F.3d at 877.
84 SAA at 851-52 (“{T}he Commission need not isolate the injury caused by other factors from injury caused by unfair imports.”); Taiwan Semiconductor Industry Ass’n , 266 F.3d at 1345. (“{T}he Commission need not isolate the injury caused by other factors from injury caused by unfair imports ... . Rather, the Commission must examine other factors to ensure that it is not attributing injury from other sources to the subject imports.” (emphasis in original)); Asociacion de Productores de Salmon y Trucha de Chile AG v. United States, 180 F. Supp. 2d 1360, 1375 (Ct. Int’l Trade 2002) (“{t}he Commission is not required to isolate the effects of subject imports from other factors contributing to injury” or make “bright-line distinctions” between the effects of subject imports and other causes.); see also Softwood Lumber from Canada, Inv. Nos. 701-TA-414 and 731-TA-928 (Remand), USITC Pub. 3658 at 100-01 (Dec. 2003) (Commission recognized that “{i}f an alleged other factor is found not to have or threaten to have injurious effects to the domestic industry, i.e., it is not an ‘other causal factor,’ then there is nothing to further examine regarding attribution to injury”), citing Gerald Metals, 132 F.3d at 722 (the statute (Continued…)
18
the “by reason of” standard require that unfairly traded imports be the “principal” cause of injury or contemplate that injury from unfairly traded imports be weighed against other factors, such as nonsubject imports, which may be contributing to overall injury to an industry.85 It is clear that the existence of injury caused by other factors does not compel a negative determination.86
Assessment of whether material injury to the domestic industry is “by reason of” subject imports “does not require the Commission to address the causation issue in any particular way” as long as “the injury to the domestic industry can reasonably be attributed to the subject imports” and the Commission “ensure{s} that it is not attributing injury from other sources to the subject imports.”87 Indeed, the Federal Circuit has examined and affirmed various Commission methodologies and has disavowed “rigid adherence to a specific formula.”88
The Federal Circuit’s decisions in Gerald Metals, Bratsk, and Mittal Steel all involved cases in which the relevant “other factor” was the presence in the market of significant volumes of price-competitive nonsubject imports. The Commission interpreted the Federal Circuit’s guidance in Bratsk as requiring it to apply a particular additional methodology following its finding of material injury in cases involving commodity products and a significant market presence of price-competitive nonsubject imports.89 The additional “replacement/benefit” test looked at whether nonsubject imports might have replaced subject imports without any benefit to the U.S. industry. The Commission applied that specific additional test in subsequent cases, including the Carbon and Certain Alloy Steel Wire Rod from Trinidad and Tobago determination that underlies the Mittal Steel litigation.
Mittal Steel clarifies that the Commission’s interpretation of Bratsk was too rigid and makes clear that the Federal Circuit does not require the Commission to apply an additional test nor any one specific methodology; instead, the court requires the Commission to have
(…Continued) “does not suggest that an importer of LTFV goods can escape countervailing duties by finding some tangential or minor cause unrelated to the LTFV goods that contributed to the harmful effects on domestic market prices.”).
85 S. Rep. 96-249 at 74-75; H.R. Rep. 96-317 at 47. 86 See Nippon, 345 F.3d at 1381 (“an affirmative material-injury determination under the statute
requires no more than a substantial-factor showing. That is, the ‘dumping’ need not be the sole or principal cause of injury.”).
87 Mittal Steel, 542 F.3d at 877-78; see also id. at 873 (“While the Commission may not enter an affirmative determination unless it finds that a domestic industry is materially injured ‘by reason of’ subject imports, the Commission is not required to follow a single methodology for making that determination ... {and has} broad discretion with respect to its choice of methodology.”) citing United States Steel Group v. United States, 96 F.3d 1352, 1362 (Fed. Cir. 1996) and S. Rep. 96-249 at 75. In its decision in Swiff-Train v. United States, 793 F.3d 1355 (Fed. Cir. 2015), the Federal Circuit affirmed the Commission’s causation analysis as comporting with the Court’s guidance in Mittal.
88 Nucor Corp. v. United States, 414 F.3d 1331, 1336, 1341 (Fed. Cir. 2005); see also Mittal Steel, 542 F.3d at 879 (“Bratsk did not read into the antidumping statute a Procrustean formula for determining whether a domestic injury was ‘by reason’ of subject imports.”).
89 Mittal Steel, 542 F.3d at 875-79.

19
“evidence in the record ‘to show that the harm occurred ‘by reason of’ the LTFV imports,’” and requires that the Commission not attribute injury from nonsubject imports or other factors to subject imports.90 Accordingly, we do not consider ourselves required to apply the replacement/benefit test that was included in Commission opinions subsequent to Bratsk.
The progression of Gerald Metals, Bratsk, and Mittal Steel clarifies that, in cases involving commodity products where price-competitive nonsubject imports are a significant factor in the U.S. market, the Court will require the Commission to give full consideration, with adequate explanation, to non-attribution issues when it performs its causation analysis.91
The question of whether the material injury threshold for subject imports is satisfied notwithstanding any injury from other factors is factual, subject to review under the substantial evidence standard.92 Congress has delegated this factual finding to the Commission because of the agency’s institutional expertise in resolving injury issues.93
B. Conditions of Competition and the Business Cycle
The following conditions of competition inform our analysis of whether there is a reasonable indication of material injury by reason of subject imports.
1. Demand Conditions
Demand for CACCS in the U.S. market depends on demand for U.S.-produced downstream products. The range of reported end uses included acidulants, baby care wipes, beverages, candy, cosmetics, dairy formulas, detergents and cleaners, citrate salts, and pharmaceuticals. Petitioners estimated that nearly 50 percent of CACCS consumption is for beverages, 19 percent for food, 15 percent for detergents, and 8 percent each for industrial and pharmaceutical uses.94 Petitioners expect demand to remain flat due to the declining
90 Mittal Steel, 542 F.3d at 873 (quoting from Gerald Metals, 132 F.3d at 722), 875-79 & n.2 (recognizing the Commission’s alternative interpretation of Bratsk as a reminder to conduct a non-attribution analysis).
91 To that end, after the Federal Circuit issued its decision in Bratsk, the Commission began to present published information or send out information requests in the final phase of investigations to producers in nonsubject countries that accounted for substantial shares of U.S. imports of subject merchandise (if, in fact, there were large nonsubject import suppliers). In order to provide a more complete record for the Commission’s causation analysis, these requests typically seek information on capacity, production, and shipments of the product under investigation in the major source countries that export to the United States. The Commission plans to continue utilizing published or requested information in the final phase of investigations in which there are substantial levels of nonsubject imports.
92 We provide in our respective discussions of volume, price effects, and impact a full analysis of other factors alleged to have caused any material injury experienced by the domestic industry.
93 Mittal Steel, 542 F.3d at 873; Nippon Steel Corp., 458 F.3d at 1350, citing U.S. Steel Group, 96 F.3d at 1357; S. Rep. 96-249 at 75 (“The determination of the ITC with respect to causation is ... complex and difficult, and is a matter for the judgment of the ITC.”).
94 CR at II-8; PR at II-6.

20
consumption of carbonated beverages, but they allege that this decline will be offset by growing demand for packaged foods and other applications.95 An equal number of importers anticipated increased or unchanged demand.96 Proctor & Gamble stated that demand for CACCS in the detergent end-use application increased due to a shift away from the use of phosphates and towards the use of CACCS.97 CACCS generally accounts for a small share of the cost of the end-use products in which it is used,98 and there are very few substitutes for CACCS.99 Demand for CACCS is highly seasonal, and peaks during the spring and summer months as demand for soft drinks and food and other beverage applications is at its highest.100
From 2014 to 2016, apparent U.S. consumption of CACCS fluctuated, but increased overall, in a relatively narrow range. It increased from *** dry pounds in 2014 to *** dry pounds in 2015 and declined to *** dry pounds in 2016. Apparent consumption was *** dry pounds in January through March (“interim”) 2016 and, and higher, at *** dry pounds in interim 2017.101
2. Supply Conditions
The three sources of supply in the U.S. market are domestic producers, importers of subject merchandise from Belgium, Colombia, and Thailand, and importers of CACCS from nonsubject countries. During the period of investigation, the domestic industry held the largest share of the U.S. market, although its market share decreased from *** percent in 2014 to *** percent in 2015 and *** percent in 2016; it was *** percent in interim 2016 and *** percent in interim 2017.102 Subject and nonsubject imports held roughly similar shares of the market during that time, although subject import market share increased as nonsubject import market share decreased slightly. Subject imports’ market share increased from *** percent in 2014 to *** percent in 2015 and *** percent in 2016; it was *** percent in interim 2016 and *** percent in interim 2017.103 The share of the market held by nonsubject imports decreased from *** percent in 2014 to *** percent in 2015 and *** percent in 2016; it was *** percent in interim 2016 and *** percent in interim 2017.104 During the period of investigation, the largest sources of nonsubject imports were Canada and Israel, which combined accounted for *** percent of nonsubject imports in 2016.105 As indicated earlier, nonsubject imports from China and Canada are subject to countervailing and/or antidumping duty orders.
95 CR at II-10; PR at II-7; Tr. at 32, 49 (Erickson). 96 CR/PR at Table II-4. 97 CR at II-10; PR at II-7. 98 CR at II-8; PR at II-6. 99 CR at II-10; PR at II-7. 100 CR at II-9; PR at II-6. 101 CR/PR at Table C-1. 102 CR/PR at Table C-1. 103 CR/PR at Table C-1. 104 CR/PR at Table C-1. 105 CR at II-7; PR at II-5.

21
3. Substitutability and Other Conditions
The record in the preliminary phase of these investigations indicates that there is at least a moderate degree of substitutability between domestically produced CACCS and CACCS imported from subject sources. As discussed above, all domestic producers reported that domestically produced CACCS are always interchangeable with CACCS from each subject country. Most importers reported that domestically produced CACCS are always or frequently interchangeable with subject imports from Belgium and Colombia, while a plurality of U.S. importers reported that subject imports from Thailand and the domestic like product are sometimes interchangeable.106
The record also indicates that price is an important factor in purchasing decisions. All domestic producers reported that differences other than price are never significant.107 Responses from importers were mixed. Most importers reported that differences other than price were only sometimes or never significant with respect to domestically produced CACCS and subject imports from Belgium and Thailand, but a slight majority of importers reported that differences other than price are always or frequently significant between subject imports from Colombia and the domestic like product.108
The parties disagree whether there are standard market definitions of GMO and non-GMO CACCS and what portion of the U.S. market will only accept non-GMO verified CACCS. Petitioners argue that non-GMO CACCS was not a significant factor in the U.S. market during the period of investigation because: there is no official definition of non-GMO in the U.S. market; attempts to qualify for non-GMO certifications are a recent development; sales of CACCS that are required to be non-GMO represent only a small fraction of the overall U.S. market; and, although domestic producers also make non-GMO CACCS, both in the United States and in third countries, they have not sold them in large quantities due to low demand and the lack of a price premium for such products.109 According to Citrique Belge, the U.S. market for non-GMO is “blurred,” although it claims that the distinction between GMO and non-GMO products is becoming increasingly important, and it is currently working on becoming
106 CR/PR at Table II-6. 107 CR/PR at Table II-7. 108 CR/PR at Table II-7. Thirteen importers reported that differences other than price were only
sometimes or never significant between domestically produced CACCS and CACCS imported from Belgium, compared to nine that reported that differences other than price were always or frequently significant. Fourteen importers reported that differences other than price were only sometimes or never significant between domestically produced CACCS and CACCS imported from Thailand, compared to 11 that reported that differences other than price were always or frequently significant. Eight importers reported that differences other than price were always or frequently significant between domestically produced CACCS and CACCS imported from Colombia, compared to seven that reported that differences other than price were only sometimes or never significant. Id.
109 Petitioners’ Postconference Br. at 10-13; Tr. at 67-68 (Aud, Erickson). Petitioners contend that, although they use GMO corn as a substrate, as a result of the chemical transformation that occurs in the production processes for CACCS, all CACCS is effectively non-GMO, regardless of whether the substrate used is GMO or non-GMO. Tr. at 52-53 (Anderson).

22
Non-GMO Project Verified.110 The Thai Respondents and Sucroal, along with importers Quaker, Tropicana, and Pepsi-Cola, contend that demand for non-GMO verified CACCS is growing and that Non-GMO Project Verification provides a clear and recognized standard, which is a significant factor in purchasing decisions.111 Several subject producers reportedly have obtained the Non-GMO Project Verification: Thai producers COFCO, Sunshine, and Niran (Thailand) Co., Ltd., and Colombian producer Sucroal.112 Although none of the U.S. producers has obtained this certification for domestically produced CACCS, Tate & Lyle has obtained it for the CACCS it produces in Brazil.113
The record in these investigations suggests that the distinction between GMO and non-GMO products plays some role in the U.S. market, though the precise nature and significance of that role is unclear at this stage. Eight importers reported that non-GMO certification requirements somewhat limited interchangeability between the domestic like product and subject imports,114 and many indicated that non-GMO and organic115 certifications are always or frequently significant non-price purchasing factors.116 Importers provided varying accounts of which country sources satisfy non-GMO requirements, but each subject country source was identified at least once.117 In addition, responding purchasers reported increasing purchases of CACCS from Colombia and Thailand because of increasing requirements for non-GMO and organic CACCS.118 Both the domestic industry and Citrique Belge contend that they produce CACCS that qualifies as non-GMO, notwithstanding the lack of Non-GMO Project Verification.119 In addition, as discussed above, although the distinction between GMO and non-GMO appears to be most significant for food and beverage end uses,120 both the domestic industry and Citrique Belge increased shipments for food and beverage end uses as a percentage of their total U.S. commercial shipments from 2014 to 2016, notwithstanding their lack of Non-GMO Project Verification.121 122 We intend in any final phase of these investigations to explore
110 Citrique Belge’s Postconference Br. at 5-8 & Attachments 2, 3. 111 Thai Respondents’ Postconference Br. at 5-9 and Exhibits 1-3; Sucroal’s Postconference Br. at
1-5 & Exhibits 1, 2; Quaker, Tropicana, and Pepsi-Cola’s Postconference Br. at 1-8. See also CR at I-16 – I-17; PR at I-12. Zhong Ya also contends that demand for non-GMO products is rapidly increasing. Zhong Ya’s Postconference Br. at 2-3, 16-19.
112 CR at I-17; PR at I-12. 113 CR at I-17; PR at I-12. 114 CR at II-14 – II-15; PR at II-10 & CR/PR at Table II-6. 115 Products labeled as “organic” cannot include the use of GMOs. Zhong Ya’s Postconference
Br. at 16-17 & Exhibits F-I. 116 CR at II-16; PR at II-11. 117 CR at II-15; PR at II-10. 118 CR at V-30; PR at V-11. 119 Petitioners’ Postconference Br. at 12-13; Citrique Belge’s Postconference Br. at 6-7. 120 See, e.g., Thai Respondents’ Postconference Br. at 6; Quaker, Tropicana, and Pepsi-Cola’s
Postconference Br. at 5; Zhong Ya’s Postconference Br. at 2-3, 16-19. 121 CR/PR at Table II-1. For U.S. producers, shipments of CACCS to food and beverage end uses
increased from *** percent in 2014 to *** percent in 2015 and *** percent of total commercial U.S. shipments; they accounted for *** percent in interim 2016 and *** percent in interim 2017. With (Continued…)

23
further the distinction between GMO and non-GMO CACCS and its significance in the U.S. market.
Both the domestic industry and importers of subject merchandise primarily sell CACCS by annual contracts, accounting for *** percent and *** percent of their U.S. commercial shipments, respectively.123 They differ, however, in terms of the next largest method of sales. The domestic industry’s second largest share of U.S. commercial shipments by type was long-term contracts, accounting for *** percent, whereas importers’ second largest share was spot sales, accounting for *** percent.124
The primary raw material for CACCS production is a starch, or substrate, that is fermented by yeast or mold to produce CACCS.125 The substrate a producer uses varies depending on costs, and producers seek to obtain the least expensive substrate, which varies by region.126 Domestic producers of CACCS typically use a corn substrate, while producers in Belgium typically use beet sugar or molasses, producers in Colombia use sugarcane, and producers in Thailand use tapioca.127 During the period of investigation, substrate prices decreased by varying degrees.128 U.S. producers reported that raw materials as a share of the total cost of goods sold (“COGS”) remained constant at about 48 percent during the period of investigation, and substrate costs in turn were approximately *** percent of the total raw material costs during that time.129
(…Continued) respect to subject imports from Belgium, shipments of CACCS to food and beverage end uses increased from *** percent in 2014 to *** percent in 2015 and *** percent of total commercial U.S. shipments; they accounted for *** percent in interim 2016 and *** percent in interim 2017. Id.
122 With respect to other certifications, as noted previously, Citrique Belge argues that its products are unique in that they meet additional standards that U.S. and other subject producers cannot. Citrique Belge’s Postconference Br. at 5. We observe, however, that the domestic industry reports that it also meets halal and kosher standards. Petitioners’ Postconference Br. at 19-20. The significance of other certifications in the U.S. market is not clear from the record in the preliminary phase of these investigations, and we will explore this issue as well in any final phase of these investigations.
123 CR/PR at Table V-2. 124 CR/PR at Table V-2. Aside from annual and long-term contracts, the domestic industry’s U.S.
shipments sold by short-term contracts accounted for *** percent of their U.S. commercial shipments and spot sales accounted for only *** percent of their shipments. Importers’ U.S. shipments sold by short term contracts accounted for *** percent of their U.S. commercial shipments and long-term contracts accounted for only *** percent. Id.
125 CR/PR at V-1. 126 CR/PR at V-1; Tr. at 70 (Erickson). 127 CR/PR at V-1. 128 CR/PR at V-1 & Figure V-1. 129 CR/PR at V-1.

24
C. Volume of Subject Imports
Section 771(7)(C)(i) of the Tariff Act provides that the “Commission shall consider whether the volume of imports of the merchandise, or any increase in that volume, either in absolute terms or relative to production or consumption in the United States, is significant.”130
Cumulated subject imports had a significant and increasing presence in the U.S. market during the period of investigation. The volume of cumulated subject imports increased 26.1 percent from 2014 to 2016, increasing from 139.2 million dry pounds in 2014 to 159.9 million dry pounds in 2015 and 175.5 million dry pounds in 2016.131 Subject imports were also 29.9 percent higher in interim 2017 than in interim 2016; the volume of subject imports in interim 2016 was 36.4 million dry pounds, and it was 47.3 million dry pounds in interim 2017.132 Cumulated subject imports as a share of apparent U.S. consumption also increased throughout the period of investigation, accounting for *** percent of the U.S. market in 2014, *** percent in 2015, and *** percent in 2016; their market share was *** percent in interim 2016 and *** percent in interim 2017.133 In contrast, the domestic industry’s market share declined from 2014 to 2016 and was lower in interim 2017 than in interim 2016; its market share was *** percent in 2014, *** percent in 2015, *** percent in 2016, *** percent in interim 2016, and *** percent in interim 2017.134
We therefore conclude that the volume of subject imports, and the increase in that volume, was significant in absolute terms and relative to apparent U.S. consumption.
D. Price Effects of the Subject Imports
Section 771(7)(C)(ii) of the Tariff Act provides that, in evaluating the price effects of subject imports, the Commission shall consider whether –
(I) there has been significant price underselling by the imported merchandise as compared with the price of domestic like products of the United States, and
(II) the effect of imports of such merchandise otherwise depresses prices to a significant degree or prevents price increases, which otherwise would have occurred, to a significant degree.135
As discussed above in section IV.B.3, the record indicates that the domestic like product and subject imports are at least moderately substitutable and price is an important factor in purchasing decisions.
130 19 U.S.C. § 1677(7)(C)(i). 131 CR/PR at Table C-1. 132 CR/PR at Table C-1. 133 CR/PR at Table C-1. 134 CR/PR at Table C-1. 135 19 U.S.C. § 1677(7)(C)(ii).

25
All three U.S. producers and 22 importers of subject merchandise provided usable quarterly data on the total quantity and f.o.b. value of their U.S. shipments of eight CACCS products sold to unrelated U.S. customers during January 2014 through March 2017, although not all firms reported pricing data for all products for all quarters.136 137 The pricing data reported by these firms accounted for approximately 60 percent of U.S. producers’ shipments of CACCS, 87 percent of U.S. shipments of subject imports from Belgium, 86 percent of subject imports from Colombia, and 97 percent of subject imports from Thailand.138
The pricing data show that cumulated subject imports undersold the domestic like product in 85 out of 243 quarterly comparisons, representing 35 percent of available comparisons. However, in terms of volume, 172 million dry pounds (or 59 percent of the quantity of cumulated subject imports) were in comparisons involving underselling of the domestic like product, versus 121 million dry pounds that oversold the domestic like product. Margins of underselling ranged from 0.01 percent to 41 percent.139 Additionally, underselling
136 CR at V-5; PR at V-5. The eight pricing products are as follows: Product 1 – Citric acid, granular, in dry form in 25 kilogram and 50 pound bags, spot sales. Product 2 – Citric acid, granular, in dry form in 25 kilogram and 50 pound bags, contract sales. Product 3 – Citric acid, fine granular, in dry form in 25 kilogram and 50 pound bags, spot sales. Product 4 – Citric acid, fine granular, in dry form in 25 kilogram and 50 pound bags, contract
sales. Product 5 – Citric acid, granular, in dry form in bulk sacks (“supersacks”), spot sales. Product 6 – Citric acid, granular, in dry form in bulk sacks (“supersacks”), contract sales. Product 7 – Sodium citrate, granular, in dry form in in 25 kilogram and 50 pound bags, spot
sales. Product 8 – Sodium citrate, granular, in dry form in in 25 kilogram and 50 pound bags, contract
sales. 137 Petitioners argue that the Commission should rely on average unit value (“AUV”) data rather
than the pricing product data, asserting among other things that AUV data capture the point of competition between U.S. producers and subject producers more closely than importer resale data in quarterly pricing comparisons. Petitioners’ Postconference Br. at 28-31. In the preliminary phase of these investigations, we assign greater weight to the more detailed data from the quarterly comparisons, which are representative of both U.S. producers’ and importers’ U.S. shipments of CACCS. In their comments on the draft questionnaires for the final phase of these investigations, we invite the parties to provide comments and arguments regarding the types of pricing data the Commission should collect and analyze, including any direct import or other data. Proctor & Gamble also challenges the pricing data collected in these investigations as incomplete. Proctor & Gamble’s Postconference Br. at 6-7. To the extent that Proctor & Gamble believes the Commission can improve upon how representative the pricing products are in the U.S. market, we invite it to provide such information in its comments on the questionnaires. Similarly, in its postconference brief, Sucroal identified several issues that it contends should be addressed in these investigations. Sucroal’s Postconference Br. at 11-14. To the extent that Sucroal wishes to raise these issues in any final phase of these investigations, we invite it to provide comments on the draft questionnaires regarding the data it contends the Commission should collect.
138 CR at V-6; PR at V-5. 139 CR/PR at Tables V-3 – V-10; CR at V-25; PR at V-8.
26
by cumulated subject imports increased over the period of investigation both in terms of instances and the quantity involved.140 Given the significant and increasing volume of subject imports, which took market share from the domestic industry, we find this underselling to be significant. Other information in the record provides further support that the domestic industry lost sales of CACCS to low-priced subject imports. Four purchasers that responded to petitioners’ lost sales allegations reported that subject imports were priced lower than the domestic like product, and three of those purchasers reported price was the primary reason for their decision to purchase subject imports rather than the domestic like product.141
We also examined changes in prices for the domestic like product and cumulated subject imports. Prices for seven of the eight pricing products declined over the period of investigation, particularly towards the end of the period of investigation as the volume of subject imports increased to its highest level.142 Price trends for subject imports varied by product and country; prices of subject imports from Thailand, which accounted for the largest quantities of subject import pricing data, declined substantially.143 Other record evidence provides further support that the domestic industry lowered prices to compete with low-priced subject imports; four purchasers reported that U.S. producers reduced prices in order to compete with lower-priced imports.144
To the extent that respondents argue that the falling cost of corn, and not subject imports, caused price declines, we do not find that assertion to be persuasive on the current record.145 The price of corn declined the most in 2014 and did not decline dramatically at the end of the period of investigation.146 Domestic prices, on the other hand, followed different trends with the most significant declines in prices occurring later in the period of investigation. Indeed, while the price of corn increased in the second quarter of 2016 and the first quarter of 2017,147 prices for the domestic like product were often at particularly low levels in the corresponding quarters.148 Moreover, raw materials accounted for only about *** percent of total COGS during the period of investigation and substrate costs accounted for approximately *** percent of raw material costs.149 The domestic industry’s substrate costs declined more modestly than its net sales AUVs. Unit substrate costs only declined from $0.20 per dry pound
140 Calculated from CR/PR Tables V-3 – V-10; CR at V-25. 141 CR at V-31; PR at V-12. 142 CR/PR at Tables V-3 – V-10 & C-2. From the first quarter of 2014 to the last four quarters of
the period of investigation, the domestic industry’s prices for product 1 declined *** percent, product 2 declined *** percent, product 3 declined *** percent, product 4 declined *** percent, product 6 declined *** percent, and product 8 declined *** percent. CR/PR at Table V-11. Product 5, which involved only three quarterly comparisons, declined from $*** per dry pound to $*** per dry pound. CR/PR at Table V-7.
143 CR/PR at Table V-11. 144 CR at V-32; PR at V-12. 145 See, e.g., Proctor & Gamble’s Postconference Br. at 10-12. 146 CR/PR at Figure V-1. 147 CR/PR at Figure V-1. 148 CR/PR at Tables V-3 – V-8, V-10. 149 CR/PR at V-1.

27
in 2014 to $0.18 per dry pound in 2015 and $0.17 per dry pound in 2016; they were $0.17 per dry pound in both interim periods.150 In contrast, net sales AUVs declined from $0.71 per dry pound in 2014 to $0.67 per dry pound in 2015 and $0.62 per dry pound in 2016; they were $0.63 per dry pound in interim 2016 and $0.60 per dry pound in interim 2017.151 Accordingly, we do not find that declines in the price of corn can explain the magnitude of declines in prices for the domestic like product.
We also do not find that demand trends explain any price declines. From 2014 to 2016, demand was relatively flat.152 In addition, apparent U.S. consumption was higher in interim 2017 than in interim 2016,153 whereas prices for the domestic like product in the first quarter of 2017 were generally lower than prices in the first quarter of 2016.154 Consequently, we find on this preliminary record that cumulated subject imports depressed prices of the domestic like product to a significant degree.
We therefore find on the basis of the record in the preliminary phase of these investigations that there was significant underselling of the domestic like product by cumulated subject imports, and that low-priced cumulated subject imports significantly depressed prices of the domestic like product.
E. Impact of the Subject Imports155
Section 771(7)(C)(iii) of the Tariff Act provides that the Commission, in examining the impact of the subject imports on the domestic industry, “shall evaluate all relevant economic factors which have a bearing on the state of the industry.” These factors include output, sales, inventories, capacity utilization, market share, employment, wages, productivity, gross profits, net profits, operating profits, cash flow, return on investment, return on capital, ability to raise capital, ability to service debt, research and development, and factors affecting domestic prices. No single factor is dispositive and all relevant factors are considered “within the context of the business cycle and conditions of competition that are distinctive to the affected industry.”156
150 CR/PR at Table VI-1. 151 CR/PR at Table VI-1. 152 CR/PR at Table C-1. Apparent U.S. consumption initially increased from *** dry pounds in
2014 to *** dry pounds in 2015 and then declined to *** dry pounds in 2016. Id. 153 CR/PR at Table C-1. Apparent U.S. consumption was *** dry pounds in interim 2016 and ***
dry pounds in interim 2017. 154 CR/PR at Tables V-3, V-4, V-6, V-8, V-10. 155 In its notice initiating the antidumping duty investigation on CACCS from Belgium, Colombia,
and Thailand, Commerce reported estimated dumping margins ranging from 15.80 percent to 62.13 percent for imports of CACCS from Belgium, 41.8 percent to 49.46 percent for imports of CACCS from Colombia, and 15.18 percent to 39.98 percent for imports from Thailand. Citric Acid and Certain Citrate Salts from Belgium, Colombia, and Thailand: Initiation of Less-Than-Fair Value Investigations, 82 Fed. Reg. 29828 (Dep’t of Commerce June 30, 2017).
156 19 U.S.C. § 1677(7)(C)(iii). This provision was amended by the Trade Preferences Extension Act of 2015, Pub. L. 114-27.

28
During the period of investigation, the domestic industry’s output indicia declined overall from 2014 to 2016 and were lower in interim 2017 than in interim 2016. The domestic industry maintained the same level of capacity throughout the period of investigation; it was 551.7 million dry pounds from 2014 to 2016 and 137.9 million dry pounds in both interim periods.157 Production, however, fluctuated and decreased overall, initially increasing from 480.6 million dry pounds in 2014 to 508.5 million dry pounds in 2015 and then decreasing to 476.0 million dry pounds in 2016; production was lower in interim 2017 at 107.4 million dry pounds than in interim 2016 at 123.1 million dry pounds.158 Capacity utilization also fluctuated, but decreased overall, initially increasing from 87.1 percent in 2014 to 92.2 percent in 2015 and then decreasing to 86.3 percent in 2016; it was lower in interim 2017 at 77.9 percent than in interim 2016 at 89.3 percent.159 The domestic industry’s U.S. shipments followed the same trend.160 The U.S. producers’ market share also declined from 2014 to 2016, and was lower in interim 2017 than in interim 2016.161 The domestic industry’s ending inventories were 60.6 million dry pounds in 2014, 79.1 million dry pounds in 2015, and 77.7 million dry pounds in 2016; they were 76.6 million dry pounds in interim 2016 and 60.5 million dry pounds in interim 2017.162 The domestic industry’s employment indicia were mixed during the period of investigation.163
Many of the domestic industry’s financial performance indicia showed significant declines from 2014 to 2016 and were considerably lower in interim 2017 than interim 2016. Net sales, by quantity and value, fell from 2014 to 2016 and were lower in interim 2017 than in interim 2016.164 The ratio of COGS to net sales initially decreased from 82.5 percent in 2014 to
157 CR/PR at Table III-3. 158 CR/PR at Table III-3. 159 CR/PR at Table III-3. 160 CR/PR at Table III-4. The domestic industry’s U.S. shipments were *** dry pounds in 2014,
*** dry pounds in 2015, and *** dry pounds in 2016; they were *** dry pounds in interim 2016 and *** dry pounds in interim 2017. Id.
161 The U.S. producers’ market share was *** percent in 2014, *** percent in 2015, and *** percent in 2016; it was *** percent in interim 2016 and *** percent in interim 2017. CR/PR at Table C-1.
162 CR/PR at Table III-5. 163 The number of production-related-workers (“PRWs”) increased from 317 in 2014 to 320 in
2015 and 322 in 2016; the number of PRWs was 319 in interim 2016 and 321 in interim 2017.163 Total hours worked were 757 in 2014 and 743 in 2015 and 2016; they were 189 in interim 2016 and 184 in interim 2017.163 Productivity increased from 634.9 dry pounds per hour in 2014 to 684.4 dry pounds per hour in 2015 and then fell to 640.6 dry pounds per hour in 2016; it was 651.4 dry pounds per hour in interim 2016 and 583.7 dry pounds per hour in interim 2017.163 Wages paid initially increased from $25.5 million in 2014 to $26.9 million in 2015, then decreased to $25.5 million in 2016; they were $6.6 million in interim 2016 and $6.8 million in interim 2017. CR/PR at Table III-7.
164 By quantity, net sales fell from 494.3 million dry pounds in 2014 to 490.0 million dry pounds in 2015 and 477.3 million dry pounds in 2016; they were 125.6 million dry pounds in interim 2016 and 124.8 million dry pounds in interim 2017. By value, net sales fell from $348.5 million in 2014 to $330.0 million in 2015 and $296.7 million in 2016; they were $79.0 million in interim 2016 and $75.0 million in interim 2017. CR/PR at Table VI-1.

29
78.1 percent in 2015 and then increased to 85.5 percent in 2016; it was 81.4 percent in interim 2016 and 88.3 percent in interim 2017.165 Gross profits, operating income, and net income fluctuated but decreased overall from 2014 to 2016 and were lower in interim 2017 than in interim 2016.166 The domestic industry’s COGS decreased from 2014 to 2016, but was higher in interim 2017 than interim 2016.167 The domestic industry’s capital expenditures increased from $*** in 2014 to $*** in 2015 and decreased to $*** in 2016; they were $*** in both interim periods.168 Research and development expenses were $*** in 2014 and 2015 and $*** in 2016; they were $*** in interim 2016 and $*** in interim 2017.169
For purposes of the preliminary phase of these investigations, we find that cumulated subject imports had a significant impact on the domestic industry. As discussed above, significant and increasing volumes of low-priced cumulated subject imports that were at least moderately substitutable with the domestic like product entered the U.S. market and significantly undersold the domestic like product. As a result, the domestic industry lost market share to cumulated subject imports, and its production, capacity utilization, and U.S. shipments declined overall from 2014 to 2016. In addition to the loss of market share and decreases in production and shipments, cumulated subject imports depressed domestic prices to a significant degree. Consequently, the domestic industry’s revenues and financial performance showed declines and were worse than they would have been otherwise. We therefore find that the significant and increasing volume of cumulated subject imports, which gained market share through significant underselling and depressed U.S. prices to a significant degree, had a significant impact on the domestic industry.
We have also considered whether there are other factors that may have had an impact on the domestic industry during the period of investigation to ensure that we are not attributing injury from such other factors to subject imports. In particular, we have considered the role of nonsubject imports, which maintained a presence in the U.S. market throughout the period of investigation. As discussed above, during the period of investigation, the largest sources of nonsubject imports were Canada and Israel, which combined accounted for *** percent of nonsubject imports in 2016.170 The share of the market held by nonsubject imports was largely steady from 2014 to 2016, and was similar in interim 2017 and interim 2016.
165 CR/PR at Table VI-1. 166 Gross profits were $61.2 million in 2014, $72.2 million in 2015, and $43.0 million in 2016;
they were $14.7 million in interim 2016 and $8.7 million in interim 2017.166 Operating income was $40.9 million in 2014, $54.2 million in 2015, and $21.9 million in 2016; it was $10.8 million in interim 2016 and $3.1 million in interim 2017.166 Net income was $38.1 million in 2014, $49.6 million in 2015, and $18.4 million in 2016; it was $9.9 million in interim 2016 and $92,000 in interim 2017. CR/PR at Table VI-1.
167 The domestic industry’s COGS were $287.4 million in 2014, $257.8 million in 2015, and $253.7 million in 2016; they were $64.3 million in interim 2016 and $66.2 million in interim 2017. CR/PR at Table VI-1.
168 CR/PR at Table VI-4. 169 CR/PR at Table VI-4. 170 CR at II-7; PR at II-5. As mentioned above, imports from Canada have been subject to the
discipline of an antidumping duty order since 2009; that order was continued in 2015. CR at I-7 – I-8; PR at I-5 – I-6.
30
Nonsubject imports’ market share decreased slightly from *** percent in 2014 to *** percent in 2015 and *** percent in 2016, and it was *** percent in interim 2016 and *** percent in interim 2017.171 Consequently, nonsubject imports cannot explain the domestic industry’s declines in market share.
Respondents contend that the domestic industry was unable to meet demand in the U.S. market, particularly for non-GMO products.172 As indicated above, we intend to explore further the significance of the distinction between GMO and non-GMO CACCS in the U.S. market in any final phase of these investigations. To the extent that respondents are arguing that the domestic industry cannot supply the entire U.S. market, we note that the fact that a domestic industry may not be able to supply all of demand does not mean that it cannot be materially injured or threatened with material injury.173
Respondents also claim that the industry’s poor aggregate financial performance resulted to a significant degree from ***.174 The Commission, however, must evaluate the impact of subject imports on the domestic industry “as a whole.”175 In any event, we observe that *** members of the domestic industry experienced the same trends in their financial performance, improving in 2015 and subsequently declining in 2016, which corresponds to increased underselling by cumulated subject imports and their continued increase in market share at the expense of the domestic industry.
Respondents also contend that the low capacity utilization rate in interim 2017 was due to an apparent business decision by *** to reduce production and rely instead on inventories.176 We observe that inventories ended in interim 2017 at about the same level they were at the end of 2014.177 We will further explore the role of inventories with respect to production and capacity utilization in any final phase of these investigations.
Finally, respondents contend that any problems the domestic industry has experienced are due to competition among the three domestic producers, and in particular, the aggressive pricing of ***.178 As an initial matter, respondents’ argument is based on AUV data rather than more detailed pricing data. Moreover, *** has lower average unit sales values than the other two domestic producers because it sells citric acid ***.179 This may explain *** lower AUVs, but we will further explore this issue in any final phase of these investigations. In any event, competition among the three domestic producers does not explain the significant gain in market share by cumulated subject imports, discussed above.
171 CR/PR at Table C-1. 172 Thai Respondents’ Postconference Br. at 11-13; Proctor & Gamble’s Postconference Br. at 2-
4, 19-20. 173 See, e.g., Citric Acid and Certain Citrate Salts from Canada and China, Inv. Nos. 701-TA-456
and 731-TA-1151-1152 (Review), USITC Pub. 4538 at 35 (June 2015). 174 Proctor & Gamble’s Postconference Br. at 4-5, 7-8; Sucroal’s Postconference Br. at 9-11. 175 19 U.S.C. § 1677(4). 176 Proctor & Gamble’s Postconference Br. at 4. 177 CR/PR at Table III-5. 178 Sucroal’s Postconference Br. at 19-20; 179 ***. See also Proctor & Gamble’s Postconference Br. at 7-8.
31
We therefore conclude, for purposes of the preliminary phase of these investigations, that cumulated subject imports have had a significant impact on the domestic industry.
VIII. Conclusion
For the reasons stated above, we determine that there is a reasonable indication that an industry in the United States is materially injured by reason of subject imports of CACCS from Belgium and Colombia that are allegedly sold in the United States at less than fair value and imports of CACCS from Thailand that are allegedly sold in the U.S. market at less than fair value and allegedly subsidized by the government of Thailand.


I-1
PART I: INTRODUCTION
BACKGROUND
These investigations result from petitions filed with the U.S. Department of Commerce (“Commerce”) and the U.S. International Trade Commission (“USITC” or “Commission”) by Archer Daniels Midland Company (Decatur, Illinois), Cargill, Inc. (Minneapolis, Minnesota), and Tate & Lyle Ingredients Americas LLC (Hoffman Estates, Illinois), on June 2, 2017, alleging that an industry in the United States is materially injured and threatened with material injury by reason of subsidized citric acid and certain citrate salts (“CACCS”)1 from Thailand and less-than-fair-value (“LTFV”) imports of CACCS from Belgium, Colombia, and Thailand. The following tabulation provides information relating to the background of these investigations.2 3
Effective date Action
June 2, 2017
Petitions filed with Commerce and the Commission; institution of Commission investigations (82 FR 26712, June 8, 2017)
June 22, 2017 Commerce’s notices of initiation (82 FR 29828, June 30, 2017 and 82 FR 29836)
June 23, 2017 Commission’s conference July 14, 2017 Commission’s vote July 17, 2017 Commission’s determinations July 24, 2017 Commission’s views
STATUTORY CRITERIA AND ORGANIZATION OF THE REPORT
Statutory criteria
Section 771(7)(B) of the Tariff Act of 1930 (the “Act”) (19 U.S.C. § 1677(7)(B)) provides that in making its determinations of injury to an industry in the United States, the Commission--
1 See the section entitled “The Subject Merchandise” in Part I of this report for a complete description of the merchandise subject in this proceeding.
2 Pertinent Federal Register notices are referenced in appendix A, and may be found at the Commission’s website (www.usitc.gov).
3 A list of witnesses appearing at the conference is presented in appendix B of this report.
I-2
shall consider (I) the volume of imports of the subject merchandise, (II) the effect of imports of that merchandise on prices in the United States for domestic like products, and (III) the impact of imports of such merchandise on domestic producers of domestic like products, but only in the context of production operations within the United States; and. . . may consider such other economic factors as are relevant to the determination regarding whether there is material injury by reason of imports.
Section 771(7)(C) of the Act (19 U.S.C. § 1677(7)(C)) further provides that--4
In evaluating the volume of imports of merchandise, the Commission shall consider whether the volume of imports of the merchandise, or any increase in that volume, either in absolute terms or relative to production or consumption in the United States is significant.. . .In evaluating the effect of imports of such merchandise on prices, the Commission shall consider whether. . .(I) there has been significant price underselling by the imported merchandise as compared with the price of domestic like products of the United States, and (II) the effect of imports of such merchandise otherwise depresses prices to a significant degree or prevents price increases, which otherwise would have occurred, to a significant degree.. . . In examining the impact required to be considered under subparagraph (B)(i)(III), the Commission shall evaluate (within the context of the business cycle and conditions of competition that are distinctive to the affected industry) all relevant economic factors which have a bearing on the state of the industry in the United States, including, but not limited to. . . (I) actual and potential decline in output, sales, market share, gross profits, operating profits, net profits, ability to service debt, productivity, return on investments, return on assets, and utilization of capacity, (II) factors affecting domestic prices, (III) actual and potential negative effects on cash flow, inventories, employment, wages, growth, ability to raise capital, and investment, (IV) actual and potential negative effects on the existing development and production efforts of the domestic industry, including efforts to develop a derivative or more advanced version of the domestic like product, and (V) in {an antidumping investigation}, the magnitude of the margin of dumping.
In addition, Section 771(7)(J) of the Act (19 U.S.C. § 1677(7)(J)) provides that—5
4 Amended by PL 114-27 (as signed, June 29, 2015), Trade Preferences Extension Act of 2015. 5 Amended by PL 114-27 (as signed, June 29, 2015), Trade Preferences Extension Act of 2015.

I-3
(J) EFFECT OF PROFITABILITY.—The Commission may not determine that there is no material injury or threat of material injury to an industry in the United States merely because that industry is profitable or because the performance of that industry has recently improved.
Organization of report
Part I of this report presents information on the subject merchandise, alleged subsidy and dumping margins, and domestic like product. Part II of this report presents information on conditions of competition and other relevant economic factors. Part III presents information on the condition of the U.S. industry, including data on capacity, production, shipments, inventories, and employment. Parts IV and V present the volume of subject imports and pricing of domestic and imported products, respectively. Part VI presents information on the financial experience of U.S. producers. Part VII presents the statutory requirements and information obtained for use in the Commission’s consideration of the question of threat of material injury as well as information regarding nonsubject countries.
MARKET SUMMARY
CACCS are chemical products used in the production and formulation of various foods and beverages as an acidulant, preservative, and flavor enhancer due to their tart flavor, high solubility, acidity, and buffering capabilities. CACCS are also used in pharmaceuticals and cosmetics as well as in household and industrial applications such as laundry detergents, metal cleaners, and textile finishing treatments.6 Cargill, Inc. (“Cargill”) is the leading U.S. producer of CACCS, *** Archer Daniels Midland Company (“ADM”) and Tate & Lyle Ingredients Americas LLC (“Tate & Lyle”).
Leading producers of CACCS outside the United States include SA Citrique Belge NV (“Citrique Belge”) of Belgium, Jungbunzlauer (“JBL”) of Canada and the European Union, and multiple firms in China.7
The leading U.S. importers of CACCS from Belgium include ***. The leading U.S. importers of CACCS from Colombia include ***. The leading U.S. importers of CACCS from Thailand include ***. The leading importers of CACCS from nonsubject countries (primarily Canada) include ***. U.S. purchasers of CACCS include distributors and end-users including food and beverage producers, detergent producers, and pharmaceutical producers. Leading purchasers in 2016, in order of size, include ***.
6 Petition, Vol. I, pp. 4-6. 7 *** indicated that the four top Chinese producers and their name plate capacity were as follows;
Ensign-*** metric tons of capacity, TTCA-*** metric tons of capacity, RZBC-*** metric tons of capacity, and Yixing-*** metric tons of capacity. According to Mr. Hunt, the four top producers in China have more than 1.1 million metric tons of production capacity. ***.

I-4
Apparent U.S. consumption of CACCS totaled approximately *** dry pounds ($***) in 2016. Currently, ADM, Cargill, and Tate & Lyle are the only known producers of CACCS in the United States. U.S. producers’ U.S. shipments of CACCS totaled *** dry pounds ($***) in 2016, and accounted for *** percent of apparent U.S. consumption by quantity and *** percent by value. U.S. imports from subject sources totaled 175.5 million dry pounds ($97.5 million) in 2016 and accounted for *** percent of apparent U.S. consumption by quantity and *** percent by value. U.S. imports from nonsubject sources totaled *** dry pounds ($***) in 2016 and accounted for *** percent of apparent U.S. consumption by quantity and *** percent by value.
SUMMARY DATA AND DATA SOURCES
A summary of data collected in these investigations is presented in appendix C, table C-1. Except as noted, U.S. industry data are based on the questionnaire responses of ADM, Cargill, and Tate & Lyle. Staff believes these firms accounted for all U.S. production of CACCS during 2016. U.S. imports are based on official import statistics8 and on questionnaire responses from 37 U.S. importers that are believed to account for *** percent of CACCS imports from Belgium, *** percent of CACCS imports from Colombia, *** percent of CACCS imports from Thailand, and *** percent of CACCS imports from nonsubject sources in 2016.
Foreign industry data are based on questionnaire responses of Citrique Belge of Belgium; Sucroal S.A. (“Sucroal”) of Colombia; and COFCO Biochemical (Thailand) Co., Ltd. (“COFCO”), Niran (Thailand) Co., Ltd. (“Niran”), Sunshine Biotech International Co., Ltd. (“Sunshine”), and Thai Citric Acid Company Limited (“TCA”) of Thailand. These six manufacturers reported exports to the United States equivalent to virtually all U.S. imports from Belgium, Colombia, and Thailand in 2016.
PREVIOUS AND RELATED INVESTIGATIONS
The Commission has conducted an antidumping investigation with respect to China as well as antidumping and countervailing investigations and related five-year reviews with respect to Canada and China. On December 15, 1999, petitions were filed with Commerce and the Commission alleging that an industry in the United States was threatened with material
8 Official imports statistics are based on statistical reporting numbers 2918.14.0000 (citric acid), 2918.15.1000 (sodium citrate), and 2918.15.5000 (other salts and esters of citric acid). HTS statistical reporting number 3824.99.9295 also includes other chemical products and preparations of the chemical or allied industries (including those consisting of mixtures of natural products) that are not elsewhere specified or included within the U.S. Harmonized Tariff Schedule (“HTSUS”) with minimal imports that fall within the scope of these investigations. No firm reported imports of crude calcium citrate and only one firm, ***, reported imports of blends, which accounted for *** percent of its total imports in 2016. In addition, imports from nonsubject countries are based on *** data because imports from Canada are suppressed. A single firm, ***, imported CACCS from Canada, the largest nonsubject country, in 2016.

I-5
injury by reason of imports of citric acid and sodium citrate from China that were sold at LTFV.9 On February 16, 2000, the Commission determined in the preliminary phase of this investigation that there was no reasonable indication that an industry in the United States was materially injured or threatened with material injury, or that the establishment of an industry in the United States was materially retarded by reason of citric acid and sodium citrate from China.10
On April 14, 2008, petitions were filed with Commerce and the Commission alleging that an industry in the United States was materially injured and threatened with material injury by reason of imports of CACCS from Canada and China that were sold at LTFV and subsidized by the government of China.11 On April 13, 2009, Commerce issued final affirmative determinations with respect to the countervailing duty investigation regarding imports of CACCS from China12 and the antidumping duty investigations regarding imports of CACCS from Canada13 and China.14 On May 8, 2009, the Commission determined that a domestic industry was materially injured by reason of imports of CACCS subsidized by the government of China and LTFV imports of CACCS from Canada and China.15 Thereafter, Commerce issued a countervailing duty order on CACCS from China16 and antidumping duty orders on CACCS from Canada and China.17
On April 1, 2014, the Commission instituted the first five-year reviews of the countervailing duty order on imports of CACCS from China and the antidumping duty orders on
9 The petitions were filed by ADM, Cargill, and Tate & Lyle Citric Acid, Inc. Citric Acid and Sodium Citrate From China: Investigation No. 731-TA-863 (Preliminary), USITC Publication 3277, February 2000, p. I-1. The scope of the investigation consisted of only citric acid and sodium citrate. It did not include potassium citrate and crude calcium citrate.
10 Citric Acid and Sodium Citrate From China: Investigation No. 731-TA-863 (Preliminary), USITC Publication 3277, February 2000, p. 1; Citric Acid and Sodium Citrate From China, 65 FR 7889, February 16, 2000.
11 The petitions were filed by ADM, Cargill, and Tate & Lyle Americas, Inc. Citric Acid and Certain Citrate Salts From Canada China: Investigation Nos. 701-TA-456 and 731-TA-1151-1152 (Final), USITC Publication 4076, May 2009, p. I-1.
12 Citric Acid and Certain Citrate Salts From the People’s Republic of China: Final Affirmative Countervailing Duty Determination, 74 FR 16836, April 13, 2009.
13 Notice of Final Determination of Sales at Less Than Fair Value: Citric Acid and Certain Citrate Salts from Canada, 74 FR 16843, April 13, 2009.
14 Citric Acid and Certain Citrate Salts From the People’s Republic of China: Final Affirmative Determination of Sales at Less Than Fair Value, 74 FR 16838, April 13, 2009.
15 Citric Acid and Certain Citrate Salts From Canada China: Investigation Nos. 701-TA-456 and 731-TA-1151-1152 (Final), USITC Publication 4076, May 2009, p. 1; Citric Acid and Certain Citrate Salts From Canada and China, 74 FR 25771, May 29, 2009.
16 Citric Acid and Certain Citrate Salts From the People’s Republic of China: Notice of Countervailing Duty Order, 74 FR 25705, May 28, 2009.
17 Citric Acid and Certain Citrate Salts from Canada and the People’s Republic of China: Antidumping Duty Orders, 74 FR 25703, May 29, 2009.

I-6
imports of CACCS from Canada and China.18 In June 2015, the Commission completed its full first five-year reviews and determined that revocation of the countervailing duty order on CACCS from China and the antidumping duty orders on CACCS from Canada and China would be likely to lead to continuation or recurrence of material injury to an industry in the United States within a reasonably foreseeable time.19 Following affirmative determinations with respect to imports of CACCS from Canada and China in the first five-year reviews by Commerce and the Commission,20 Commerce issued a continuation notice for the countervailing duty order on CACCS from China and the antidumping duty orders on CACCS from Canada and China, effective June 24, 2015.21
On October 15, 2015, Commerce published its final determination regarding the administrative review on CACCS from Canada for the period May 1, 2013 through April 30, 2014. Commerce determined a weighted-average dumping margin of zero percent for imports of CACCS produced in Canada and exported into the United States by JBL.22 Commerce completed two subsequent administrative reviews regarding CACCS from Canada for the periods May 1, 2014 through April 30, 2015 as well as May 1, 2015 through April 30, 2016. In both of these administrative reviews, Commerce continued to find a weighted-average dumping margin of zero for imports of CACCS produced in Canada and exported into the United States by JBL.23
18 Citric Acid and Certain Citrate Salts from Canada and China; Institution of Five-Year Reviews, 79 FR 18311, April 1, 2014.
19 Citric Acid and Certain Citrate Salts from Canada and China: Investigation Nos. 701-TA-456 and 731-TA-1151-1152 (Review), USITC Publication 4538, June 2015, p. 1.
20 Citric Acid and Certain Citrate Salts From the People’s Republic of China: Final Results of Expedited Sunset Review of the Countervailing Duty Order, 79 FR 45761, August 6, 2014; Citric Acid and Certain Citrate Salts From Canada and the People’s Republic of China: Final Results of Expedited First Sunset Reviews of the Antidumping Duty Orders, 79 FR 45763, August 6, 2017; Citric Acid and Certain Citrate Salts From Canada and China, 80 FR 34693, June 17, 2015.
21 Citric Acid and Certain Citrate Salts From Canada and the People’s Republic of China: Continuation of the Antidumping Duty Orders on Canada and the People’s Republic of China, and Continuation of the Countervailing Duty Order on the People’s Republic of China, 80 FR 36318, June 24, 2015.
22 Citric Acid and Certain Citrate Salts From Canada: Final Results of Antidumping Duty Administrative Review; 2013-2014, 80 FR 62016, October 15, 2015.
23 Citric Acid and Certain Citrate Salts From Canada: Final Results of Antidumping Duty Administrative Review; 2014-2015, 81 FR 28827, May 10, 2016; Citric Acid and Certain Citrate Salts From Canada: Final Results of Antidumping Duty Administrative Review; 2015-2016, 82 FR 18284, April 18, 2017.

I-7
NATURE AND EXTENT OF ALLEGED SUBSIDIES AND SALES AT LTFV
Alleged subsidies
On June 30, 2017, Commerce published a notice in the Federal Register of the initiation of its countervailing duty investigation on CACCS from Thailand.24 Commerce has initiated the investigation based on an estimated countervailing duty margin of at least four percent for CACCS from Thailand and identified the following government programs in Thailand:25
A. IPA Section 30 Import Duty Reduction on Raw or Essential Materials Used in
Promoted Production Activity B. IPA Section 31 Income Tax Exemption on Net Profit from Promoted Activity C. IPA Section 35 Income Tax Deductions and Rate Reductions in Specified Locations or
Zones D. IPA Section 36 Export Promotion Programs E. Measures to Promote Improvement Of Production Efficiency F. Thailand Export-Import Bank Medium- and Long-Term Loan and Buyer’s Credit
Programs G. Thai BOI measures to promote investment in food innovation, including the
“food lnnopolis” H. Grants for Electricity Generation from Biogas and Biomass
Alleged sales at LTFV
On June 30, 2017, Commerce published a notice in the Federal Register of the initiation of its antidumping duty investigations on CACCS from Belgium, Colombia, and Thailand.26 Commerce has initiated antidumping duty investigations based on estimated dumping margins of 15.80 percent to 62.13 percent for CACCS from Belgium, 41.18 percent to 49.46 percent for CACCS from Colombia, and 15.18 percent to 39.98 percent for CACCS from Thailand.
24 Citric Acid and Certain Citrate Salts from Thailand: Initiation of Countervailing Duty Investigation, 82 FR 29836, June 30, 2017.
25 Department of Commerce, CVD Initiation Checklist, Inv. No. C-549-834, June 22, 2017. 26 Citric Acid and Certain Citrate Salts from Belgium, Colombia, and Thailand: Initiation of Less-Than-
Fair Value Investigations, 82 FR 29828, June 30, 2017.

I-8
THE SUBJECT MERCHANDISE
Commerce’s scope
Commerce has defined the scope of these investigations as follows:27
…all grades and granulation sizes of citric acid, sodium citrate, and potassium citrate in their unblended forms, whether dry or in solution, and regardless of packaging type. The scope also includes blends of citric acid, sodium citrate, and potassium citrate; as well as blends with other ingredients, such as sugar, where the unblended form(s) of citric acid, sodium citrate, and potassium citrate constitute 40 percent or more, by weight, of the blend. The scope also includes all forms of crude calcium citrate, including dicalcium citrate monohydrate, and tricalcium citrate tetrahydrate, which are intermediate products in the production of citric acid, sodium citrate, and potassium citrate. The scope includes the hydrous and anhydrous forms of citric acid, the dihydrate and anhydrous forms of sodium citrate, otherwise known as citric acid sodium salt, and the monohydrate and monopotassium forms of potassium citrate. Sodium citrate also includes both trisodium citrate and monosodium citrate which are also known as citric acid trisodium salt and citric acid monosodium salt, respectively. The scope does not include calcium citrate that satisfies the standards set forth in the United States Pharmacopeia and has been mixed with a functional excipient, such as dextrose or starch, where the excipient constitutes at least 2 percent, by weight, of the product. Citric acid and sodium citrate and classifiable under 2918.14.0000 and 2918.15.1000 of the HTSUS, respectively. Potassium citrate and crude calcium citrate are classifiable under 2918.15.5000 and, if included in a mixture or blend, 3824.99.9295 of the HTSUS. Blends that include citric acid, sodium citrate, and potassium citrate are classifiable under
27 Citric Acid and Certain Citrate Salts from Thailand: Initiation of Countervailing Duty Investigation, 82 FR 29836, June 30, 2017; Citric Acid and Certain Citrate Salts from Belgium, Colombia, and Thailand: Initiation of Less-Than-Fair Value Investigations, 82 FR 29828, June 30, 2017; Department of Commerce, AD Initiation Checklist, Inv. Nos. A–423–813, A–301–803, A–549–833; Department of Commerce, CVD Initiation Checklist, Inv. No. C-549-834, June 22, 2017.

I-9
3824.99.9295 of the HTSUS. Although the HTSUS subheadings are provided for convenience and customers purposes, the written description of the merchandise is dispositive.
Tariff treatment
Based upon the scope set forth by the Department of Commerce, information available to the Commission indicates that the merchandise subject to these investigations is classified in HTS subheadings 2918.14.00, 2918.15.10, and 2918.15.50. The merchandise subject to these investigations are also classified in HTS subheading 3824.99.92 (statistical reporting number 3924.99.9295)28 of the HTSUS only if it is included in a mixture or blend with at least 40 percent consisting of CACCS.
The 2017 general rates of duty are 6 percent, 6.5 percent, 3.7 percent, and 5 percent ad valorem, respectively. In addition, the special rate of duty is free for CACCS imported from Colombia under these statistical reporting numbers. Decisions on the tariff classification and treatment of imported goods are within the authority of U.S. Customs and Border Protection.
THE PRODUCT
Description and applications
The imported products subject to these investigations are citric acid and certain citrate salts, specifically sodium citrate and potassium citrate; blends containing citric acid, sodium citrate, and potassium citrate; and crude calcium citrate (“CCC”). Citric acid, sodium citrate and potassium citrate are all available in either dry form or in solution. CCC is an intermediate form in the production of citric acid via the lime/sulfuric acid process.29 CCC can be shipped to another facility for further processing into refined citric acid.30
Citric acid, sodium citrate, and potassium citrate are all available as odorless, translucent crystals.31 These crystals are normally sold in three granulations: granular, fine granular, and powder.32 Purchasers can buy the dry product and put it into solution or have an independent converter do it.33 Petitioners argue that the products have only minor molecular differences which do not significantly alter their essential characteristics or uses.34
28 The corresponding chapter 38 statistical reporting number was 3824.90.9290 in 2015 and 3824.90.9295 in 2016. Both of these HTS statistical reporting numbers are basket categories of chemical products and preparations of the chemical or allied industries (including those consisting of mixtures of natural products) that are not elsewhere specified or included with very minimal subject merchandise. 29 Petition, Vol. I, pp. 3-4 and 10-11. 30 Conference transcript, p. 99 (Anderson). 31 Petition, Vol. I, p. 4. 32 Ibid. 33 Petition, Vol. I, pp. 4-5. 34 Petition, Vol. I, pp. 3-4.

I-10
Citric acid is produced and sold in the U.S. market in both its dry and solution forms, and according to petitioners can be easily and reversibly converted between these two forms. Whether dry or dissolved in water, the product’s chemical properties are the same.35 The petitioners stated that the bulk of their shipments are in the dry form, but they do ship some citric acid in solution, generally only to nearby customers.36 According to the petitioners, the three products are used basically for the same purposes, sold in the same markets, and produced in the same production facilities.37
ADM and Cargill produce citric acid, sodium citrate, and potassium citrate. Tate & Lyle produces only citric acid. The Belgian producer, Citrique Belge, makes citric acid and sodium citrate.38 Sucroal ***.39 Among the Thai producers, COFCO and Niran ***. No information is available regarding whether Sunshine and Thai Citric produce any citrate salts. The petitioners and Citrique Belge confirmed during the conference that they sell neither blends nor CCC.40 No information is available on the other subject producers as to whether they sell blends or CCC.
The formal chemical names and formulas for the typical commercial forms of the products are:
• Citric acid: Citric acid anhydrous (C6H8O7) and citric acid monohydrate (C6H8O7-
H2O);
• Sodium citrate: Sodium citrate anhydrous or trisodium citrate anhydrous (Na3C6H5O7), sodium citrate dihydrate or trisodium citrate dihydrate (Na3C6H5O7-H2O), and monosodium citrate (NaH2(C3H5O(COO)3);
• Potassium citrate: Potassium citrate monohydrate or tripotassium citrate
monohydrate (K3C6H5O7-H2O), and monopotassium citrate (KH2C6H5O7); and
• Calcium citrate: Tricalcium citrate (Ca3(C6H5O7)2), dicalcium citrate (Ca2H2(C3H5O)(COO)3-H2O), and tricalcium citrate tetrahydrate (Ca3(C6H5O7)2(COO)3-4H2O).41
Citric acid is produced as a white granular or crystalline powder with a strong acidic taste. It is produced by the fermentation of glucose from a substrate such as corn, molasses,
35 Petition, Vol. I, p. 4. 36 Conference transcript, p. 64 (Erickson). 37 Ibid.
38 Ibid., p. 137 (Braeuer). 39 ***. 40 Ibid. 41 Petition, Vol. I, p. 4.

I-11
beet molasses, sugarcane, or tapioca.42 Citric acid is produced both in anhydrous form and as a monohydrate. Both forms are isolated and purified through successive recrystallizations.
Sodium citrate is a white, granular crystalline powder with a pleasant acidic taste. Sodium citrate is produced by mixing citric acid slurry with sodium hydroxide (or sodium carbonate) and then crystallizing the resulting sodium citrate.43 Potassium citrate is produced by reacting citric acid slurry with potassium hydroxide (or potassium carbonate).44
Citric acid, sodium citrate, and potassium citrate are chemical products used in the production and formulation of a wide variety of foods, beverages, pharmaceuticals, and cosmetics as well as commercial and household products including detergents and metal cleaners, and in textile finishing treatments and other industrial applications.45 As described above, citric acid is used in the food and beverage industry as an acidulant, preservative, and flavor enhancer because of its tart flavor, high solubility, acidity, and buffering capabilities.46 It is commonly used in carbonated and non-carbonated drinks, dry powdered beverages, wines and wine coolers, jams, jellies, preserves, gelatin desserts, candies, frozen foods, and canned fruits and vegetables.47
Sodium citrate, in addition to similar applications as citric acid, is used in cheese and dairy products to improve emulsifying properties, texture, and melting properties and to act as a preservative and aging agent.48 It also has pharmaceutical applications such as a diuretic and an expectorant in cough syrup.49
Potassium citrate is used as an antacid, a diuretic, an expectorant, and as a systemic and urinary alkalizer. In industrial applications, potassium citrate can be used in electropolishing and as a buffering agent. In food and beverage applications, potassium citrate has been replacing sodium citrate as a means of reducing sodium content in low- or no-salt products.50
The petitioners and Citrique Belge stated that they always produce citric acid and certain citrate salts to meet the high purity U.S. Pharmacopoeia (“USP”) or Food Chemical Codex (“FCC”) standards, regardless of the intended customer/application.51 The products must meet these high standards to be used in food and beverage or pharmaceutical applications and some of the largest customers are in the food and beverage business.
Citrique Belge noted that there is increasing interest in non-GMO CACCS.52 While U.S. producers claim that they can make, and have made, CACCS that qualifies as non-GMO, they do
42 Ibid., p. 7. 43 Ibid., p. 9. 44 Ibid. 45 Ibid., pp. 5-6. 46 Ibid., p. 5. 47 Ibid., pp. 5-6. 48 Ibid., p. 6. 49 Ibid. 50 Ibid.
51 Conference transcript, pp. 66-67 (Anderson, Aud, Erickson, Peel, Tuma); Petitioners’ postconference brief, p. 4.
52 Conference transcript, pp. 110-111 (De Backer).

I-12
not have dedicated production facilities for such production.53 Petitioners assert that demand is still too small and the price premium is insufficient to make the product profitable.54 Citrique Belge claims that it has been able to sell some of its product as non-GMO in the U.S. market, but the company is pursuing the U.S. Non-GMO Project “Verified” certification so that it can sell its product more easily and to those customers who want to obtain similar certification for their own downstream products.55
At present, the Non-GMO Project “Verified” certification is being applied based on a number of factors, including the feedstock.56 Petitioners assert, however, that as a consequence of a chemical transformation, all CACCS is in essence already non-GMO regardless of the feedstock.57 Petitioners also claim that there is ambiguity as to the non-GMO standard and that their product already qualifies as non-GMO under some standards.58 U.S. producers use genetically modified corn as their primary feedstock so they would have to disrupt their production to change out the feedstocks to meet the current Non-GMO Project requirements for a non-GMO product.59 Citrique Belge stated that its feedstock, sugar beet molasses, is not genetically modified.60 Other subject producers also use non-GMO feedstock and several have obtained the Non-GMO Project “Verified” certification: COFCO, Niran, Sucroal, and Sunshine.61 Although none of the U.S. producers has obtained this certification for their U.S. CACCS operations, Tate & Lyle has obtained it for its Brazilian operations.62
Manufacturing processes
Citric acid is produced in a two-stage process. In the first stage, sugars are fermented using a fermenting organism such as molds or yeasts. In the second stage, the crude citric acid is recovered and refined. Sodium citrate and potassium citrate are produced by reacting citric acid slurry with a solution containing certain sodium or potassium compounds (e.g., sodium
53 Conference transcript, p. 51 (Aud). 54 Conference transcript, pp. 51-52 (Aud, Peel). 55 Conference transcript, pp. 111-112 (De Backer). 56 The Non-GMO Project web site (https://www.nongmoproject.org) accessed July 5, 2017. Quaker,
Tropicana, and Pepsi-Cola’s postconference brief, pp. 5-6. 57 Conference transcript, pp. 52-53 (Anderson). 58 Conference transcript, pp. 51-52 (Aud, Peel). “So there is an EU standard, or a European standard
for non-GM, and our product meets that standard. And so many of our customers require that standard, and our non-GM product that's the same as our GM product to certain customers is the same exact product.” Conference transcript, p. 54 (Aud).
59 Conference transcript, pp. 67-68 (Aud, Erickson). 60 Ibid., p. 111 (De Backer). 61 The Non-GMO Project web site (https://www.nongmoproject.org) accessed July 5, 2017. Sucroal
Postconference brief, p. 2. 62 The Non-GMO Project web site (https://www.nongmoproject.org) accessed July 5, 2017. Sucroal
Postconference brief, p. 2.

I-13
hydroxide or potassium hydroxide).63 ADM and Cargill produce sodium citrate and potassium citrate using the same equipment and workers that are used for citric acid.64
Modern, large-scale production of citric acid is achieved through fermentation.65 The fermentation process involves the action of specific strains of organisms such as the Aspergillus niger mold or the Candida lipolytica or Candida guilliermondii yeast upon a substrate.66 Once the substrate is turned into glucose, it is fermented into crude citric acid by the organism.67 The yield of citric acid can be optimized through the careful control of fermentation conditions, such as temperature, acidity or alkalinity, dissolved air or oxygen, and the rate of stirring of the mixture. Each fermentation reaction is done in batch in large tanks which hold several thousand gallons and takes approximately *** to achieve a citric acid yield of *** percent, based on the weight of the sugar.68
Producers ferment the substrate by one of three different methods: shallow pan, deep tank, or solid-state.69 Citric acid was originally produced using a shallow pan or liquid surface culture technology, where microbial fermentation occurred on the surface of the liquid. Most modern production of citric acid uses a deep tank or a submerged culture process, where the reaction is constantly agitated or stirred with air in order to allow the organism to grow throughout the mixture.70 The submerged culture process is generally favored due to the economics of increased yields and lower labor costs, although reaction conditions must be more tightly controlled.71 The petitioners use the *** method. The Belgian respondent uses the shallow pan method because it claims that this fermentation method results in higher yields.72 The Colombian producer uses the *** method.73 According to petitioners, solid-state fermentation is used only in Japan.74
Corn starch is the principal substrate in the United States, although other feedstocks such as molasses are also used.75 The Belgian producer uses sugar beet molasses, the Colombian producer uses sugarcane, and the Thai producers use tapioca as the substrate.76
63 Petition, Vol. I, p. 7. 64 Conference transcript, pp. 63-64 (Erickson). 65 “Citric acid,” Kirk-Othmer Encyclopedia of Chemical Technology (John Wiley & Sons, New York, 1979), Vol. 6, pp. 156-159. 66 Petition, Vol. I, p. 7. 67 Ibid. 68 ***. 69 Petition, Vol. I, pp. 7-8.
70 Petition, Vol. I, p. 8. 71 “Citric acid,” Kirk-Othmer Encyclopedia of Chemical Technology (John Wiley & Sons, New York, 1979), Vol. 6, pp. 156-157. 72 Conference transcript, p. 136 (De Backer).
73 ***. 74 Petition, Vol. I, p. 8.
75 Ibid., p. 7. 76 Ibid., conference transcript, p. 111 (De Backer).

I-14
The second stage of production, recovery and refining, is normally performed by one of three common processes: the lime/sulfuric acid method, the solvent extraction method, or the ion exchange method. All three of these processes are compatible with either the shallow pan or deep tank fermentation processes.77
In the lime/sulfuric acid refining process, calcium hydroxide (lime) is added to the fermentation broth to precipitate out calcium citrate slurry, the CCC that is also part of the scope. After the calcium citrate is separated by filtration, it is washed to remove soluble impurities. The citrate is then mixed with sulfuric acid to produce a citric acid/charcoal slurry and gypsum (calcium sulfate). The citric acid is then purified through evaporation, crystallization, centrifugation, and drying.78 This process is used by ***.79
The second common refining method, used by ***,80 is the solvent extraction process. This process does not involve the production of calcium citrate or gypsum. Instead, solvents separate the citric acid slurry from spent biomass. The subsequent processes of evaporation, crystallization, centrifugation, and drying are similar to those used in the lime/sulfuric acid process.81
The third refining method, ion exchange, is a recent development. In this method, the slurry is passed through a bed of polymer-based resin. Ionic mineral elements such as calcium and magnesium adhere to the resin, thus removing them from the citric acid slurry. The subsequent steps are similar to the other two processes.82
All three refining methods produce citric acid that is dissolved in water. The temperature used for the crystallization process determines whether the anhydrous or hydrous form is produced.83 Some manufacturers use different equipment for crystallizing hydrous versus anhydrous citric acid, whereas other producers use the same equipment and adjust the process to produce the preferred product.84
Producers can either sell the citric acid or convert it into salts. Petitioners produce dihydrate sodium citrate and anhydrous sodium citrate by diverting some of the citric acid slurry to a line dedicated to citric salt production, where the slurry is reacted with sodium hydroxide or sodium carbonate. Similarly, potassium citrate is produced by reacting citric acid slurry with potassium hydroxide or potassium carbonate.85
The dry forms of the subject merchandise are packaged in polyethylene-lined paper bags, typically holding 50 pounds or 25 kilograms. “Super sacks” containing 500 to 2,000
77 Petition, Vol. I, p. 8. 78 Ibid.
79 ***. 80 Ibid. 81 Petition, Vol. I, p. 8.
82 Ibid., p. 9. 83 Ibid.
84 Ibid. 85 Ibid.

I-15
pounds are also used. When preferred in solution form, the subject product is shipped in drums, railcars, or tank trucks. Drums are usually 200 to 275 pounds.86
Sodium citrate and potassium citrate can also be produced by some distributors that are known as “converters.” Converters can provide either citric acid as purchased from the manufacturer, or have the equipment on hand to blend sodium hydroxide or potassium hydroxide with citric acid, thus producing sodium citrate or potassium citrate, respectively.87
DOMESTIC LIKE PRODUCT ISSUES
In the antidumping investigation on imports of citric acid and sodium citrate from China in 2000, the Commission concluded that citric acid and sodium citrate constitute one domestic like product.88 In the antidumping and countervailing duty investigations on imports of CACCS from Canada and China in 2009, the Commission found no clear dividing lines among domestically produced CACCS corresponding to the scope of the investigations based on chemical and physical form, grade, or product type, and determined that the domestic like product consisted of citric acid (whether in crude form as crude calcium citrate or in finished form), sodium citrate, and potassium citrate in all chemical and physical forms and grades.89 In its full first five-year reviews, the Commission again defined a single domestic like product consisting of citric acid (whether in crude form as calcium citrate or in finished form), sodium citrate, and potassium citrate in all chemical and physical forms and grades.90
In these preliminary phase investigations, petitioners propose the Commission define the domestic like product as co-extensive with the scope of these investigations.91 Citrique Belge, the only respondent to appear at the staff conference, stated that it agrees with the petitioners’ definition of the domestic like product.92 The other responding foreign producers and importers, with the exception of Zhong Ya, do not dispute the definitions of the domestic like product as proposed by the petitioners.93
86 Ibid., p. 10. 87 Citric Acid and Certain Citrate Salts from Canada and China: Investigation Nos. 701-TA-456 and 731-TA-1151-1152 (Review), USITC Publication 4538, June 2015, p. I-18.
88 Citric Acid and Sodium Citrate From China: Investigation No. 731-TA-863 (Preliminary), USITC Publication 3277, February 2000, p. 7.
89 Citric Acid and Certain Citrate Salts From Canada China: Investigation Nos. 701-TA-456 and 731-TA-1151-1152 (Final), USITC Publication 4076, May 2009, pp. 7-9.
90 Citric Acid and Certain Citrate Salts from Canada and China: Investigation Nos. 701-TA-456 and 731-TA-1151-1152 (Review), USITC Publication 4538, June 2015, p. 6.
91 Petition, Vol. I, p. 13; Petitioners’ postconference brief, pp. 1-8. 92 Conference transcript, p. 127 (Schaefer). 93 Foreign producers COFCO and Sunshine stated in their postconference brief that they agree with
the petitioners’ definition of the domestic like product. Foreign producer Sucroal and importers Proctor & Gamble, Quaker Sales & Distribution, Inc., Tropicana Manufacturing Company, Inc, and Pepsi-Cola Sales and Distribution Inc. did not address the domestic like product issue in their postconference briefs. COFCO and Sunshine’s postconference brief, p. 3.

I-16
U.S. importer Zhong Ya did not participate in the staff conference but filed a postconference brief arguing that citric acid and certain citrate salts (sodium citrate, potassium citrate, and unrefined calcium citrate) covered by the scope of these investigations should be two separate domestic like products. Zhong Ya contends that the domestic industry is not materially injured or threatened with material injury by reason of imports of citrate salts from the subject countries. Zhong Ya further explains that citric acid has different physical characteristics and end uses, is not interchangeable, is partially made on different manufacturing facilities, with different production processes and production employees, has different channels of distribution, and has different customer and producer perceptions as compared to certain citrate salts, although prices of citric acid are generally the same as compared to certain citrate salts.94
94 Zhong Ya’s postconference brief, pp. 1-2, 4-12.

II-1
PART II: CONDITIONS OF COMPETITION IN THE U.S. MARKET
U.S. MARKET CHARACTERISTICS
CACCS are used in a wide variety of foods, beverages, pharmaceuticals, and cosmetics, as well as in commercial and household products including detergents and metal cleaners, and in textile finishing treatments and other industrial applications.1 CACCS are available in both dry form (granular, fine, and powder) and in aqueous solutions.2 3 CACCS are also storable for multiple years and can be shipped relatively inexpensively.4 Both domestic and imported CACCS are generally produced to the same Food Chemical Codex (“FCC”) and U.S. Pharmacopoeia (“USP”) standards.5 Petitioners stated that all subject producers produce to these standard specifications and CACCS only varies in size and moisture level.6
Apparent U.S. consumption of CACCS fluctuated during January 2014-March 2017.7 Overall, apparent U.S. consumption in 2016 was *** percent higher than in 2014, after peaking in 2015.
CHANNELS OF DISTRIBUTION
U.S. producers and importers of CACCS from Belgium and Colombia sold mainly to end users while importers of CACCS from Thailand sold mainly to distributors, as shown in table II-1.
1 Petition, p. 4. 2 A water solution form of CACCS is normally a 50-percent citric acid solution. Petition, pp. 3-4. 3 Aqueous solutions are priced on a dry basis, and there is effectively no price difference between the
different forms. Generally geographic proximity and application dictate whether a customer will request liquid or dry forms of CACCS. Conference transcript, pp. 64 (Erickson) and 78 (Tuma).
4 Conference transcript, p. 35 (Anderson). 5 Petition, p. 5. FCC standards are the highest, and CACCS that is produced to FCC standards can be
used for every other end use. Conference transcript, pp. 34 (Anderson) and 67 (Tuma). 6 Conference transcript, p. 30 (Erickson). 7 Apparent consumption the first quarter of 2017 was nearly *** percent higher than during the
same period in 2016.

II-2
Table II-1 CACCS: U.S. producers’ and importers’ U.S. commercial shipments, by sources and channels of distribution, 2014-16, January-March 2016, and January-March 2017
* * * * * * * Petitioners stated that most responding importers are either large distributors or large
end users, which also purchase from U.S. producers. They stated that ***.8
GEOGRAPHIC DISTRIBUTION
U.S. producers and importers of subject CACCS reported selling CACCS to all regions in the contiguous United States (table II-2). For U.S. producers, *** percent of sales were within 100 miles of their production facility, *** percent were between 101 and 1,000 miles, and *** percent were over 1,000 miles. Importers sold *** percent within 100 miles of their U.S. point of shipment, *** percent between 101 and 1,000 miles, and *** percent over 1,000 miles.
Table II-2 CACCS: Geographic market areas in the United States served by U.S. producers and importers
Region U.S. producers
Subject U.S. importers
Belgium Colombia Thailand Subject sources
Northeast 3 10 2 12 20 Midwest 3 8 1 11 15 Southeast 3 10 2 8 15 Central Southwest 3 6 1 10 14 Mountains 3 6 1 8 12 Pacific Coast 3 8 3 12 17 Other1 3 0 2 3 4 All regions (except Other) 3 4 1 5 8 Reporting firms 3 14 4 20 29 1 All other U.S. markets, including AK, HI, PR, and VI. Source: Compiled from data submitted in response to Commission questionnaires.
8 Petitioners’ postconference brief, pp. 29-30.

II-3
SUPPLY AND DEMAND CONSIDERATIONS
U.S. supply
Domestic production
Based on available information, U.S. producers of CACCS have the ability to respond to changes in demand with small changes in the quantity of shipments of U.S.-produced CACCS to the U.S. market. The main contributing factors to this low degree of responsiveness of supply are limited unused capacity and inventories, a limited ability to shift shipments from alternate markets, and an inability to shift production from other products. Industry capacity
Domestic capacity utilization fluctuated over the period, rising from 87 percent in 2014 to 92 percent in 2015, and then returning to 86 percent in 2016.9 This moderately high level of capacity utilization suggests that U.S. producers may have limited ability to increase production of CACCS in response to an increase in prices. 10 Domestic capacity remained constant at over 550 million pounds during January 2014-2016.
Alternative markets
U.S. producers’ exports, as a percentage of total shipments, fluctuated over the period, first decreasing from *** percent in 2014 to *** percent in 2015, and rising to *** percent in 2016.11 These export shares indicate that U.S. producers have a limited ability to shift shipments between the U.S. market and other markets in response to price changes.
Inventory levels
U.S. producers’ inventories increased from 2014 to 2016. U.S. producers’ inventories, as a share of total shipments, increased from 12 percent in 2014 to 16 percent in 2016.12 These inventory levels suggest that U.S. producers may have some ability to respond to changes in demand with changes in the quantity shipped from inventories.
9 Domestic capacity utilization was 89 percent during January-March 2016 and 78 percent during January-March 2017.
10 According to petitioners, producers of CACCS must run at full capacity for maximum efficiency. Conference transcript, p. 18 (Aud).
11 Domestic producers’ export shipments as a share of total shipments increased slightly but remained about *** percent in both January-March 2016 and January-March 2017.
12 Domestic producers’ inventories as a share of total shipments were 15 percent during January-March 2016 and 12 percent during January-March 2017.

II-4
Production alternatives
All three U.S. producers reported that they are unable to shift production of CACCS to other products.
Subject imports13
Table II-3 provides a summary of supply-related data for subject countries. Table II-3 CACCS: Foreign industry factors that affect ability to increase shipments to the United States
Item
Capacity (1,000 dry pounds)
Capacity utilization (percent)
Inventories as a ratio to total
shipments (percent)
Ability to shift to
alternate product (number of firms)
Home market
shipments as a share
of total shipments
in 2016 (percent)
Exports to markets
other than the US as a share of
total shipments
in 2016 (percent) 2014 2016 2014 2016 2014 2016
Belgium *** *** *** *** *** *** *** *** *** Colombia *** *** *** *** *** *** *** *** *** Thailand *** *** *** *** *** *** *** *** *** Source: Compiled from data submitted in response to Commission questionnaires. Subject imports from Belgium
Based on available information, producers of CACCS from Belgium have the ability to respond to changes in demand with moderate changes in the quantity of shipments of CACCS to the U.S. market. The main contributing factor to this degree of responsiveness of supply is the ability to shift shipments from alternate markets,14 but is mitigated by the limited availability of unused capacity, a limited ability to shift shipments from inventories, and no ability to shift production from alternate products.
Subject imports from Colombia
Based on available information, producers of CACCS from Colombia have the ability to respond to changes in demand with small-to-moderate changes in the quantity of shipments of
13 For data on the number of responding foreign firms and their share of U.S. imports from Belgium, Colombia, and Thailand, please refer to Part IV.
14 Respondent Citrique Belge stated that it is home-market focused because prices are too low in the United States and over half of its sales to EU customers are under annual or long-term contracts. Conference transcript, p. 104 (De Backer).

II-5
CACCS to the U.S. market. The main contributing factors to this degree of responsiveness of supply are some availability of unused capacity, some availability of inventories, and some ability to shift shipments from alternate markets. This responsiveness is mitigated by the inability to shift production from alternate products.
Subject imports from Thailand
Based on available information, producers of CACCS from Thailand have the ability to respond to changes in demand with small-to-moderate changes in the quantity of shipments of CACCS to the U.S. market. The main contributing factors to this degree of responsiveness of supply are some availability of unused capacity and some ability to shift shipments from alternate markets. This responsiveness is mitigated by a limited availability of inventories and the inability to shift production from alternate products.
Nonsubject imports
Nonsubject imports accounted for almost *** percent of total U.S. imports in 2016.15 The largest sources of nonsubject imports during January 2014-March 2017 were Canada and Israel, in order of size.16 However, petitioners stated that the largest nonsubject CACCS sources are Austria, Canada, China, and Brazil, and that Israeli producer Gadot has limited capacity and has not been a consistent, large-volume supplier to the U.S. market.17
Supply constraints
One of three U.S. producers and 6 of 35 importers reported facing supply constraints, including a ***, a slowdown of imports from China due to antidumping duties in 2014, and short supply in 2016. Three importers cited untimely shipments, and two of those three cited port strikes in the United States.
Petitioners stated that the domestic industry has not had any supply disruptions over the past few years, and that domestic firms keep inventory on hand to handle minor disruptions that are inherent to CACCS production.18
U.S. demand
Based on available information, the overall demand for CACCS are likely to experience small changes in response to changes in price. The main contributing factors are the small cost share of CACCS in most of its end-use products, and the lack of substitute products.
15 See table IV-2. 16 Canada accounted for *** percent and Israel accounted for *** percent of all imports in 2016. 17 Conference transcript, pp. p. 15 (Aud), and 59 (Anderson and Aud). 18 Conference transcript, p. 45 (Aud).

II-6
End uses and cost share
U.S. demand for CACCS depends on the demand for U.S.-produced downstream products. Reported end uses include acidulants, baby care wipes, beverages, candy, cosmetics, diary formulas, detergents and cleaners, citrate salts, and pharmaceuticals. Petitioners estimated that nearly 50 percent of CACCS consumption is for beverages, 19 percent for food, 15 percent for detergents, and 8 percent each for industrial and pharmaceutical uses.19 CACCS accounts for a small share of the cost of the end-use products in which it is used. Reported cost shares for some end uses were as follows:
• Beverages (<1 to 3 percent); • Detergents and cleaners (1 to 6 percent); • Pharmaceuticals (1 percent); • Industrial applications (1 to 50 percent)
Business cycles
All three U.S. producers and 12 of 36 importers indicated that the market was subject to business cycles or conditions of competition. Specifically, demand for CACCS is highly seasonal, and demand peaks during the spring and summer months as demand for soft drinks and agricultural applications is at its highest.20
All three U.S. producers reported that a major condition of competition is the high utilization rate required for CACCS production. U.S. producer *** reported that a lower price is often conceded instead of scaling back on capacity utilization. U.S. producer *** reported that in addition to continuously operating plants, the contract season during the fourth quarter is another unique condition of competition that affects sales of CACCS.21
Demand trends
*** of three U.S. producers reported that there has been no change in demand since 2014, and equal numbers of importers (10 each) reported increased or unchanged demand. (table II-4).
19 Conference presentation by petitioners, Slide 5. 20 Petitioners have not seen a change in seasonality due to the declining demand in the beverage
industry. Conference transcript, p. 90 (Aud). 21 For additional information regarding contracts, see Part V.
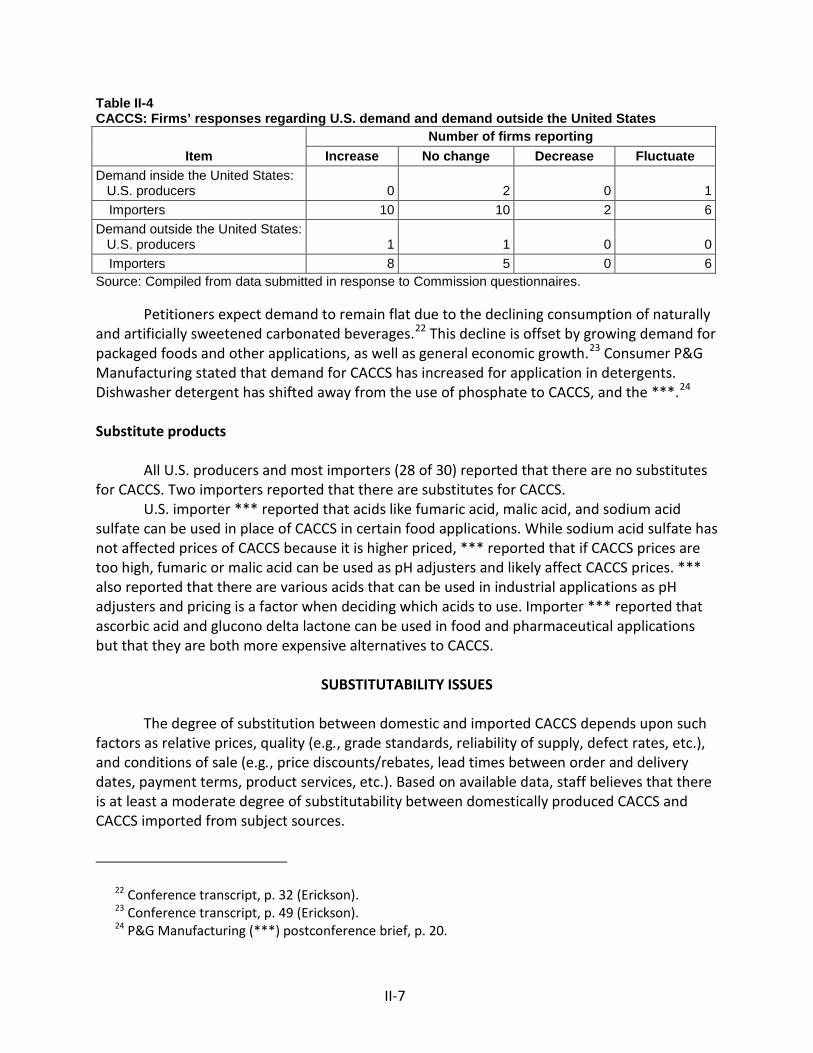
II-7
Table II-4 CACCS: Firms’ responses regarding U.S. demand and demand outside the United States
Item Number of firms reporting
Increase No change Decrease Fluctuate Demand inside the United States: U.S. producers 0 2 0 1
Importers 10 10 2 6 Demand outside the United States: U.S. producers 1 1 0 0
Importers 8 5 0 6 Source: Compiled from data submitted in response to Commission questionnaires.
Petitioners expect demand to remain flat due to the declining consumption of naturally and artificially sweetened carbonated beverages.22 This decline is offset by growing demand for packaged foods and other applications, as well as general economic growth.23 Consumer P&G Manufacturing stated that demand for CACCS has increased for application in detergents. Dishwasher detergent has shifted away from the use of phosphate to CACCS, and the ***.24
Substitute products
All U.S. producers and most importers (28 of 30) reported that there are no substitutes for CACCS. Two importers reported that there are substitutes for CACCS.
U.S. importer *** reported that acids like fumaric acid, malic acid, and sodium acid sulfate can be used in place of CACCS in certain food applications. While sodium acid sulfate has not affected prices of CACCS because it is higher priced, *** reported that if CACCS prices are too high, fumaric or malic acid can be used as pH adjusters and likely affect CACCS prices. *** also reported that there are various acids that can be used in industrial applications as pH adjusters and pricing is a factor when deciding which acids to use. Importer *** reported that ascorbic acid and glucono delta lactone can be used in food and pharmaceutical applications but that they are both more expensive alternatives to CACCS.
SUBSTITUTABILITY ISSUES
The degree of substitution between domestic and imported CACCS depends upon such factors as relative prices, quality (e.g., grade standards, reliability of supply, defect rates, etc.), and conditions of sale (e.g., price discounts/rebates, lead times between order and delivery dates, payment terms, product services, etc.). Based on available data, staff believes that there is at least a moderate degree of substitutability between domestically produced CACCS and CACCS imported from subject sources.
22 Conference transcript, p. 32 (Erickson). 23 Conference transcript, p. 49 (Erickson). 24 P&G Manufacturing (***) postconference brief, p. 20.

II-8
Lead times
CACCS are primarily sold from inventory. U.S. producers reported that over *** percent of their commercial shipments were from inventories (with lead times averaging 17 days). U.S. importers reported that nearly 92 percent of their commercial shipments were from U.S. or foreign inventories (averaging 20 and 47 days, respectively). The remaining *** percent of shipments of domestically produced CACCS and 8 percent of shipments of subject CACCS were produced-to-order and averaged ***25 and 90 days, respectively.
Non-GMO and organic certified CACCS
While there is some demand for non-genetically modified organism (“non-GMO”) CACCS, petitioners stated that there is not an official standard in the U.S. market, and Citrique Belge stated that the U.S. market for non-GMO CACCS is “blurred.”26 Consumers Quaker, Tropicana, and Pepsi-Cola stated that the U.S.-based Non-GMO Project provides a well-recognized standard for non-GMO products.27 Most U.S.-produced CACCS is produced using a GMO corn substrate. The substrates used in the production of CACCS in Belgium, Colombia, and Thailand are capable of being non-GMO certified.28 The Colombian producer, Sucroal, and three of four Thai producers are certified by the Non-GMO Project, which requires that the substrate is non-GMO.29
Petitioners stated that domestic producers make a CACCS product that is considered non-GMO under some standards, but that demand is small and that non-GMO CACCS is not sold as a premium product.30 Petitioners stated that there is no price difference between GMO and non-GMO CACCS, and that non-GMO certification does not qualify for a price premium in the U.S. market.31 Respondents stated that there is no additional cost to producing non-GMO CACCS because their substrates are already non-GMO.32
U.S. producer *** and petitioners stated that certifications for subject producers are relatively new.33 Respondent Citrique Belge stated that U.S. customers are increasingly requesting non-GMO CACCS, and although there is not a clear standard for non-GMO product,
25 This reported average is *** than the average lead time for shipments from inventories because *** reported ***.
26 Petitioners’ postconference brief, p. 11; Conference transcript, pp. 110-11 (De Backer). 27 Quaker, Tropicana, and Pepsi-Cola postconference brief, pp. 4-5. 28 Zhong Ya (Thailand) postconference brief, p. 17; COFCO and Sunshine (Thailand) postconference
brief, p. 9. 29 Sucroal (Colombia) postconference brief, pp. 1-2; Quaker, Tropicana, and Pepsi-Cola
postconference brief, pp. 3-5. 30 Conference transcript, pp. 43 (Anderson), 51-52 (Aud), p. 59 (Aud). 31 Petitioners’ postconference brief, p. 7. 32 Respondent Citrique Belge (Beligum) postconference brief, p. 6 33 Petitioners’ postconference brief, p. 11.

II-9
it is pursuing a non-GMO certificate from the Non-GMO Project Board.34 Thai producers COFCO and Sunshine stated that non-GMO requirements are critical in food and beverage applications, which account for nearly 80 percent of the CACCS market.35 Consumer Tropicana stated that there is value in qualifying their product, orange juice, under this non-GMO standard.36
Other certifications
U.S. producers and some subject producers produce CACCS that are halal and kosher certified.37 Respondent Citrique Belge stated that it is also able to meet additional standards that its competitors from U.S. and other sources cannot, including some ISO certifications, as well as the Global Food Safety Initiative (“GFSI”) standard.38
Factors affecting purchasing decisions
Purchasers responding to lost sales lost revenue allegations39 were asked to identify the main purchasing factors their firm considered in their purchasing decisions for CACCS. The major purchasing factors identified by firms include price, quality, and availability of supply (table II-5). Four of 11 purchasers indicated that non-GMO product was a factor that influenced their purchasing decisions.
Table II-5 CACCS: Ranking of factors used in purchasing decisions as reported by U.S. purchasers, by factor
Item 1st 2nd 3rd Total
Number of firms (number) Price / Cost 3 2 6 11 Quality 5 2 0 7 Availability / Supply 1 3 1 5 Non-GMO product 2 2 0 4 All other factors1 2 4 4 NA 1 All other factors include relationship with or reputation of the supplier (3), customer approval (2), and global sourcing (1). Source: Compiled from data submitted in response to Commission questionnaires.
34 Conference transcript, pp. 110-11 (De Backer). 35 COFCO and Sunshine (Thailand) postconference brief, p. 6. 36 Quaker, Tropicana, and Pepsi-Cola postconference brief, p. 5. 37 Conference transcript, pp. 118 (De Backer) and 144 (Jones); Respondent Citrique Belge (Belgium)
postconference brief, p. 5. 38 Respondent Citrique Belge (Belgium) postconference brief, p. 5. 39 This information is compiled from responses by purchasers identified by Petitioners to the lost
sales lost revenue allegations. See Part V for additional information.

II-10
Comparison of U.S.-produced and imported CACCS
In order to determine whether U.S.-produced CACCS can generally be used in the same applications as imports from Belgium, Colombia, and Thailand, U.S. producers and importers were asked whether the products can always, frequently, sometimes, or never be used interchangeably. As shown in table II-6, U.S. producers reported that domestically produced CACCS are always interchangeable with subject and nonsubject sources. Most importers reported that U.S.-produced CACCS are always or frequently interchangeable with Belgian and Colombian CACCS, and a plurality of importers reported that Thai CACCS are sometimes interchangeable with U.S.-produced product. Table II-6 CACCS: Interchangeability between CACCS produced in the United States and in other countries, by country pair
Country pair U.S. producers U.S. importers
A F S N A F S N United States vs. Belgium 3 0 0 0 6 9 5 2 United States vs. Colombia 3 0 0 0 3 6 4 2 United States vs. Thailand 3 0 0 0 5 7 12 1 Belgium vs. Colombia 3 0 0 0 3 5 2 0 Belgium vs. Thailand 3 0 0 0 2 6 6 0 Colombia vs. Thailand 3 0 0 0 2 6 5 0 United States vs. Other 3 0 0 0 3 7 3 1 Belgium vs. Other 3 0 0 0 2 7 1 0 Colombia vs. Other 3 0 0 0 3 5 1 0 Thailand vs. Other 3 0 0 0 4 6 0 0 Note.—A=Always, F=Frequently, S=Sometimes, N=Never. Source: Compiled from data submitted in response to Commission questionnaires.
Eight importers reported that non-GMO certification requirements somewhat limited interchangeability of U.S.-produced and subject CACCS. Importer *** reported that the food and agriculture industries have become stricter in their non-GMO and organic certification requirements. Importers reported varying accounts of which country sources satisfy non-GMO requirements, but each country source was identified at least one. Two importers reported that caking or clumping of product due to moisture sometimes limited interchangeability of Thai CACCS with domestically produced CACCS, and one importer reported that Thai CACCS is often “hard material.”
In addition, U.S. producers and importers were asked to assess how often differences other than price were significant in sales of CACCS from the United States, subject, or nonsubject countries. As seen in table II-7, U.S. producers reported that factors other than price are never significant. Most importers reported that differences other than price between U.S.-produced and Belgian or Thai CACCS are sometimes or never significant. Most importers reported that differences other than price between U.S.-produced and Colombian CACCS are always or sometimes significant.

II-11
Table II-7 CACCS: Significance of differences other than price between CACCS produced in the United States and in other countries, by country pair
Country pair U.S. producers U.S. importers
A F S N A F S N United States vs. Belgium 0 0 0 3 4 5 8 5 United States vs. Colombia 0 0 0 3 5 3 4 3 United States vs. Thailand 0 0 0 3 5 6 9 5 Belgium vs. Colombia 0 0 0 3 2 2 3 3 Belgium vs. Thailand 0 0 0 3 3 2 7 2 Colombia vs. Thailand 0 0 0 3 3 3 6 2 United States vs. Other 0 0 0 3 3 3 4 4 Belgium vs. Other 0 0 0 3 0 3 4 3 Colombia vs. Other 0 0 0 3 2 1 4 2 Thailand vs. Other 0 0 0 3 1 2 4 4 Note.--A = Always, F = Frequently, S = Sometimes, N = Never. Source: Compiled from data submitted in response to Commission questionnaires.
Many importers indicated that differences in non-GMO and organic certifications are always or frequently significant. In addition to non-GMO and organic requirements, importers *** reported that factors such as availability, customer service and technical support, product range, transportation networks, and quality are differences that are always or frequently significant for sales of CACCS. Consumer P&G Manufacturing stated that ***.40
40 P&G Manufacturing (***) postconference brief, p. 9.


III-1
PART III: U.S. PRODUCERS’ PRODUCTION, SHIPMENTS, AND EMPLOYMENT
The Commission analyzes a number of factors in making injury determinations (see 19 U.S.C. §§ 1677(7)(B) and 1677(7)(C)). Information on the subsidies and dumping margins was presented in Part I of this report and information on the volume and pricing of imports of the subject merchandise is presented in Part IV and Part V. Information on the other factors specified is presented in this section and/or Part VI and (except as noted) is based on the questionnaire responses of three firms that accounted for all U.S. production of CACCS during 2016.
U.S. PRODUCERS
The Commission issued a U.S. producer questionnaire to three firms based on information contained in the petition and other available industry resources. All three firms provided usable data on their productive operations. Staff believes that these responses represent all U.S. production of CACCS in 2016.1 Table III-1 lists U.S. producers of CACCS, their production locations, positions on the petition, and shares of total production. Table III-1 CACCS: U.S. producers of CACCS, their positions on the petition, production locations, and shares of reported production, 2016
Firm Position on
petition Production location(s)
Share of production (percent)
ADM Petitioner Southport, NC *** Cargill Petitioner Eddyville, IA *** Tate & Lyle Petitioner Dayton, OH ***
Total 100.0 Source: Compiled from data submitted in response to Commission questionnaires.
Related firms
Table III-2 presents information on U.S. producers’ ownership, and related and/or affiliated firms. ***, a foreign producer and exporter, is a subsidiary of Cargill. Tate & Lyle is
1 While there are firms that purchase citric acid and convert it into potassium citrate or sodium citrate, petitioners do not view these firms as part of the U.S. industry since most of the capital investment is for the purpose of creating the citric acid molecule itself. The capital investment associated with converting citric acid is characterized by petitioners as “minimal.” Conference transcript, p. 69 (Anderson).

III-2
***, a foreign producer and exporter of CACCS, through this common parent. In addition, ***.2 In addition, as discussed in greater detail below, Tate & Lyle ***.3 Table III-2 CACCS: U.S. producers’ ownership related and/or affiliated firms
* * * * * * *
Changes in operations
U.S. producers were asked to report any changes in operations since January 1, 2014. ADM noted that is it planning on replacing turbines as well as equipment that has started to deteriorate.4 Cargill reported that it ***.
U.S. PRODUCTION, CAPACITY, AND CAPACITY UTILIZATION
Operations on CACCS
Table III-3 and figure III-1 present U.S. producers’ production, capacity, and capacity utilization. U.S. producers reported a collective annual capacity of 551.7 million dry pounds, equivalent to *** percent or less of apparent U.S. consumption throughout the period for which data were collected. U.S. producers’ total capacity was stable from 2014 to 2016 and was unchanged in January to March 2017 as compared to January to March 2016. U.S. producers’ total production increased by 5.8 percent from 2014 to 2015, decreased by 6.4 percent from 2015 to 2016, and was 12.8 percent lower during January to March 2017 than during January to March 2016. U.S. producers’ total production decreased overall by less than one percent from 2014 to 2016.5 U.S. producers collectively operated at capacity utilization levels of 87.1 percent in 2014; 92.2 percent in 2015; and 86.3 percent in 2016. During this three-year timeframe, *** consistently operated at capacity utilization levels exceeding *** percent, while *** operated at capacity utilization levels exceeding *** percent only in ***. In the first quarter of 2017, however, U.S. producers’ collective production levels were 15.7 million dry pounds lower than during the first quarter of 2016, with a corresponding reduction in capacity utilization of 11.4 percentage points to 77.9 percent.
2 ***. 3 ***. ***. 4 Conference transcript, p. 47 (Peel). 5 *** producers experienced an increase in production from 2014 to 2015 and a decrease in
production from 2015 to 2016. Only *** production was higher during January to March 2017 than during January to March 2016.

III-3
Table III-3 CACCS: U.S. producers’ production, capacity, and capacity utilization, 2014-16, January to March 2016, and January to March 2017
Item Calendar year January to March
2014 2015 2016 2016 2017
Capacity (1,000 dry pounds)
ADM *** *** *** *** *** Cargill *** *** *** *** *** Tate & Lyle *** *** *** *** ***
Total capacity 551,710 551,710 551,710 137,927 137,927
Production (1,000 dry pounds)
ADM *** *** *** *** *** Cargill *** *** *** *** *** Tate & Lyle *** *** *** *** ***
Total production 480,639 508,482 475,991 123,119 107,402
Capacity utilization (percent)
ADM *** *** *** *** *** Cargill *** *** *** *** *** Tate & Lyle *** *** *** *** ***
Average capacity utilization 87.1 92.2 86.3 89.3 77.9 Note.--All responding domestic producers reported capacity based on operating 168 hours per week 52 weeks per year. Source: Compiled from data submitted in response to Commission questionnaires. Figure III-1 CACCS: U.S. producers’ production, capacity, and capacity utilization, 2014-16, January to March 2016, and January to March 2017
Source: Compiled from data submitted in response to Commission questionnaires.

III-4
Alternative products
All domestic production consisted of CACCS. The domestic firms reported that they do not produce alternative products on the same equipment or using the same employees. In addition, ***.6
Producers were also asked to describe the constraints that set the limits of their production capacity. ADM identified ***. Cargill and Tate & Lyle reported that ***.
U.S. PRODUCERS’ U.S. SHIPMENTS AND EXPORTS
Table III-4 presents U.S. producers’ U.S. shipments, export shipments, and total shipments. The quantity of U.S. producers’ collective U.S. shipments increased between 2014 and 2015, before declining in 2016, while exports exhibited the opposite trend. The quantity of U.S. shipments was also lower in the first quarter of 2017, compared to the first quarter of 2016, while the quantity of exports was higher. The value of both U.S. shipments and exports declined between 2014 and 2016, as the average unit value for U.S. shipments decreased by $*** per dry pound and the average unit value for exports decreased by $*** per dry pound. The value of U.S. shipments was also lower in the first quarter of 2017 relative to the first quarter of 2016, consistent with lower shipment quantities and average unit values. In contrast, the value of export shipments was higher, consistent with higher shipment quantities and stable average unit values. Export shipments, whether measured by quantity or value, consistently accounted for less than *** percent of total shipments.
6 Petitioners’ postconference brief, Answers to Questions Presented by ITC Staff, p. 2.

III-5
Table III-4 CACCS: U.S. producers’ U.S. shipments, exports shipments, and total shipments, 2014-16, January to March 2016, and January to March 2017
Item Calendar year January to March
2014 2015 2016 2016 2017
Quantity (1,000 dry pounds)
U.S. shipments ADM *** *** *** *** *** Cargill *** *** *** *** *** Tate & Lyle *** *** *** *** *** Total *** *** *** *** *** Export shipments
ADM *** *** *** *** *** Cargill *** *** *** *** *** Tate & Lyle *** *** *** *** *** Total *** *** *** *** *** Total shipments
ADM *** *** *** *** *** Cargill *** *** *** *** *** Tate & Lyle *** *** *** *** *** Total 494,303 490,010 477,277 125,566 124,833
Value (1,000 dollars)
U.S. shipments ADM *** *** *** *** *** Cargill *** *** *** *** *** Tate & Lyle *** *** *** *** *** Total *** *** *** *** *** Export shipments
ADM *** *** *** *** *** Cargill *** *** *** *** *** Tate & Lyle *** *** *** *** *** Total *** *** *** *** *** Total shipments
ADM *** *** *** *** *** Cargill *** *** *** *** *** Tate & Lyle *** *** *** *** *** Total 348,542 330,015 296,678 79,006 74,980 Table continued on next page.

III-6
Table III-4 -- Continued CACCS: U.S. producers’ U.S. shipments, exports shipments, and total shipments, 2014-16, January to March 2016, and January to March 2017
Item Calendar year January to March
2014 2015 2016 2016 2017
Unit value (dollars per pound)
U.S. shipments ADM *** *** *** *** *** Cargill *** *** *** *** *** Tate & Lyle *** *** *** *** *** Total *** *** *** *** *** Export shipments
ADM *** *** *** *** *** Cargill *** *** *** *** *** Tate & Lyle *** *** *** *** *** Total *** *** *** *** *** Total shipments
ADM *** *** *** *** *** Cargill *** *** *** *** *** Tate & Lyle *** *** *** *** *** Total 0.71 0.67 0.62 0.63 0.60
Share of quantity (percent)
U.S. shipments ADM *** *** *** *** *** Cargill *** *** *** *** *** Tate & Lyle *** *** *** *** *** Total *** *** *** *** *** Export shipments
ADM *** *** *** *** *** Cargill *** *** *** *** *** Tate & Lyle *** *** *** *** *** Total *** *** *** *** *** Total shipments
ADM *** *** *** *** *** Cargill *** *** *** *** *** Tate & Lyle *** *** *** *** *** Total 100.0 100.0 100.0 100.0 100.0 Table continued on next page.
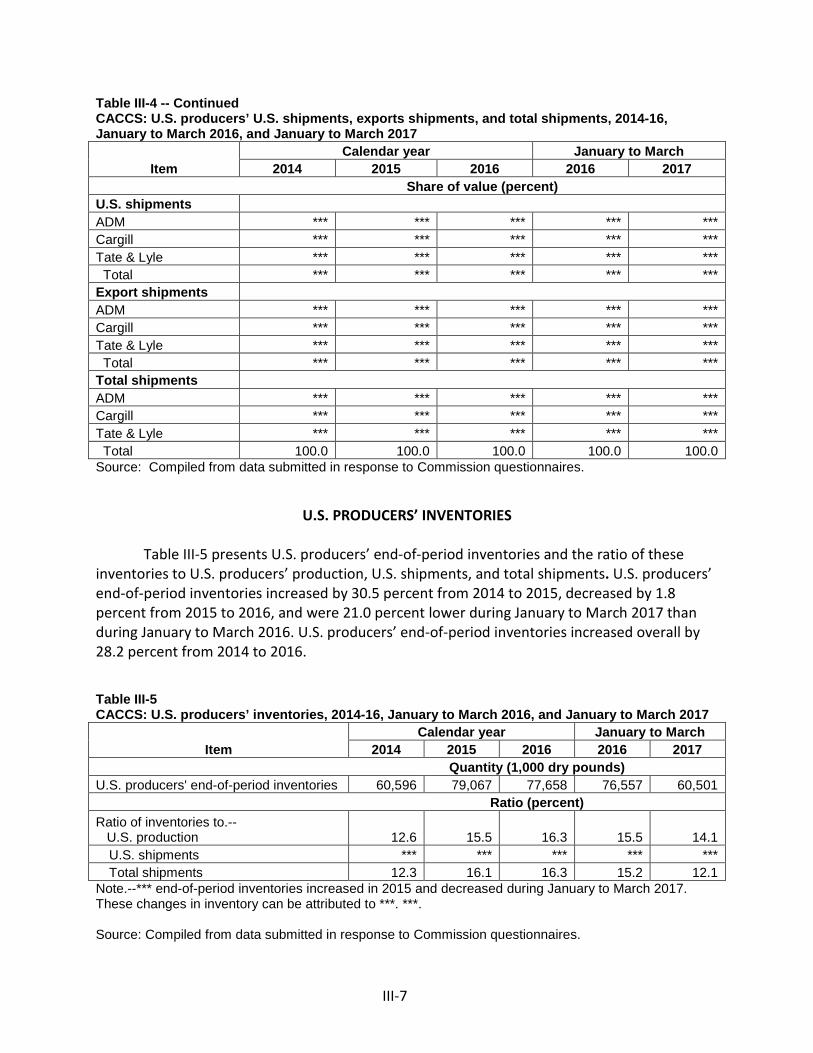
III-7
Table III-4 -- Continued CACCS: U.S. producers’ U.S. shipments, exports shipments, and total shipments, 2014-16, January to March 2016, and January to March 2017
Item Calendar year January to March
2014 2015 2016 2016 2017
Share of value (percent)
U.S. shipments ADM *** *** *** *** *** Cargill *** *** *** *** *** Tate & Lyle *** *** *** *** *** Total *** *** *** *** *** Export shipments
ADM *** *** *** *** *** Cargill *** *** *** *** *** Tate & Lyle *** *** *** *** *** Total *** *** *** *** *** Total shipments
ADM *** *** *** *** *** Cargill *** *** *** *** *** Tate & Lyle *** *** *** *** *** Total 100.0 100.0 100.0 100.0 100.0 Source: Compiled from data submitted in response to Commission questionnaires.
U.S. PRODUCERS’ INVENTORIES
Table III-5 presents U.S. producers’ end-of-period inventories and the ratio of these inventories to U.S. producers’ production, U.S. shipments, and total shipments. U.S. producers’ end-of-period inventories increased by 30.5 percent from 2014 to 2015, decreased by 1.8 percent from 2015 to 2016, and were 21.0 percent lower during January to March 2017 than during January to March 2016. U.S. producers’ end-of-period inventories increased overall by 28.2 percent from 2014 to 2016. Table III-5 CACCS: U.S. producers’ inventories, 2014-16, January to March 2016, and January to March 2017
Item Calendar year January to March
2014 2015 2016 2016 2017
Quantity (1,000 dry pounds)
U.S. producers' end-of-period inventories 60,596 79,067 77,658 76,557 60,501
Ratio (percent)
Ratio of inventories to.-- U.S. production 12.6 15.5 16.3 15.5 14.1
U.S. shipments *** *** *** *** *** Total shipments 12.3 16.1 16.3 15.2 12.1
Note.--*** end-of-period inventories increased in 2015 and decreased during January to March 2017. These changes in inventory can be attributed to ***. ***. Source: Compiled from data submitted in response to Commission questionnaires.

III-8
U.S. producers’ collective inventory levels peaked in 2015, followed by a modest reduction in 2016 and a substantially lower level by March 2017 than in March 2016. The ratio of U.S. producers’ end-of-period inventories to production, U.S. shipments, and total shipments all increased from 2014 to 2015 and from 2015 to 2016. The ratio of U.S. producers’ end-of-period inventories to U.S. production increased by 3.7 percentage points and was 1.5 percentage points lower during January to March 2017 than during January to March 2016. The ratio of U.S. producers’ end-of-period inventories to U.S. shipments increased by *** percentage points from 2014 to 2016, and was *** percentage points lower during January to March 2017 than during January to March 2016. The ratio of U.S. producers’ end-of-period inventories to total shipments increased by 4.0 percentage points from 2014 to 2016, and was 3.1 percent lower during January to March 2017 than during January to March 2016.
U.S. PRODUCERS’ IMPORTS AND PURCHASES
U.S. producers’ imports of CACCS are presented in table III-6. Of the three U.S. producers, only Tate & Lyle imported *** CACCS. *** decreased by *** percent during 2014-16, while its ratio of U.S. production to imports declined to *** percent. This firm noted that it imported and purchased CACCS because ***.
Table III-6 CACCS: U.S. producers’ U.S. production, imports and purchases, 2014-16, January to March 2016, and January to March 2017
* * * * * * *
U.S. EMPLOYMENT, WAGES, AND PRODUCTIVITY
Table III-7 presents U.S. producers’ employment-related data. U.S. producers increased employment of production and related workers (“PRWs”) between 2014 and 2016, adding five PRWs. During this period, productivity increased, while the total hours worked declined. Increased productivity offset higher hourly wage rates, resulting in relatively stable unit labor costs.
The number of PRWs was higher in the first quarter of 2017 (321) than the first quarter of 2016 (319). Hours worked, however, were lower in aggregate (by 5,000 hours) and per PRW (19 hours less per PRW) in the first quarter of 2017, relative to the first quarter of 2016. Productivity was at its lowest level during January to March 2017 and hourly wages were at their highest, resulting in higher unit labor costs.

III-9
Table III-7 CACCS: Average number of production and related workers, hours worked, wages paid to such employees, hourly wages, productivity, and unit labor costs, January to March 2016, and January to March 2017
Item Calendar year January to March
2014 2015 2016 2016 2017 Production and related workers (PRWs) (number) 317 320 322 319 321 Total hours worked (1,000 hours) 757 743 743 189 184 Hours worked per PRW (hours) 2,388 2,322 2,307 592 573 Wages paid ($1,000) 25,535 26,833 25,843 6,586 6,751 Hourly wages (dollars per hour) $33.73 $36.11 $34.78 $34.85 $36.69 Productivity (dry pounds per hour) 634.9 684.4 640.6 651.4 583.7 Unit labor costs (dollars per dry pound) $0.05 $0.05 $0.05 $0.05 $0.06 Source: Compiled from data submitted in response to Commission questionnaires.


IV-1
PART IV: U.S. IMPORTS, APPARENT U.S. CONSUMPTION, AND MARKET SHARES
U.S. IMPORTERS
The Commission issued importer questionnaires to 112 firms believed to be importers of CACCS, as well as to all U.S. producers of CACCS.1 Usable questionnaire responses were received from 37 companies, representing *** percent U.S. imports from Belgium,2 *** percent U.S. imports from Colombia, and *** percent of U.S. imports from Thailand between January 1, 2016 to December 30, 2016 under HTS statistical reporting numbers 2918.14.0000 (citric acid), 2918.15.1000 (sodium citrate), and 2918.15.5000 (other salts and esters of citric acid).3 Table IV-1 lists all responding U.S. importers of CACCS from Belgium, Colombia, Thailand, and other sources, their locations, and their shares of U.S. imports, in 2016.
1 The Commission issued questionnaires to those firms identified in the petition, along with firms that, based on a review of data provided by U.S. Customs and Border Protection (“Customs”), may have accounted for more than one percent of total imports under HTS statistical reporting numbers 2918.14.0000, 2918.15.1000, 2918.15.5000, and 3824.99.9295 during 2014-16.
2 According to *** data, *** was one of the largest importers of record for CACCS from Belgium during 2014-16, importing *** of all Belgian-produced CACCS. *** indicated that the company is one legal entity, and that “S.A. Citrique Belge N.V. is the sole Belgian citric acid producer named in this enquiry - of which I am the CEO/Managing Director -, so we are not an importer.” ***, June 8, 2017.
3 The coverage estimates presented are based on official import statistics. Official import statistics are based on statistical reporting numbers 2918.14.0000 (citric acid), 2918.15.1000 (sodium citrate), and 2918.15.5000 (other salts and esters of citric acid). HTS statistical reporting number 3824.99.9295 also includes other chemical products and preparations of the chemical or allied industries (including those consisting of mixtures of natural products) that are not elsewhere specified or included within the U.S. Harmonized Tariff Schedule (“HTSUS”) with minimal imports that fall within the scope of these investigations. In addition, imports from nonsubject countries are based on *** data because imports from Canada are suppressed. A single firm, ***, imported CACCS from Canada, the largest nonsubject country.
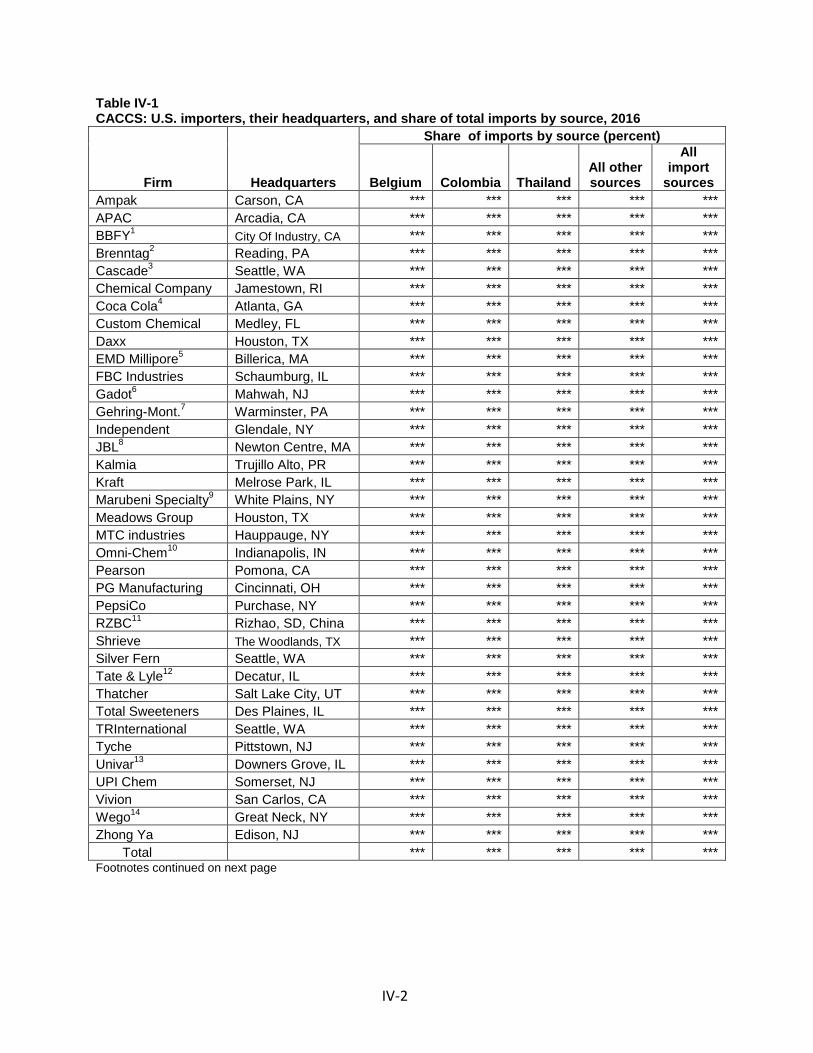
IV-2
Table IV-1 CACCS: U.S. importers, their headquarters, and share of total imports by source, 2016
Firm Headquarters
Share of imports by source (percent)
Belgium Colombia Thailand All other sources
All import
sources Ampak Carson, CA *** *** *** *** *** APAC Arcadia, CA *** *** *** *** *** BBFY1 City Of Industry, CA *** *** *** *** *** Brenntag2 Reading, PA *** *** *** *** *** Cascade3 Seattle, WA *** *** *** *** *** Chemical Company Jamestown, RI *** *** *** *** *** Coca Cola4 Atlanta, GA *** *** *** *** *** Custom Chemical Medley, FL *** *** *** *** *** Daxx Houston, TX *** *** *** *** *** EMD Millipore5 Billerica, MA *** *** *** *** *** FBC Industries Schaumburg, IL *** *** *** *** *** Gadot6 Mahwah, NJ *** *** *** *** *** Gehring-Mont.7 Warminster, PA *** *** *** *** *** Independent Glendale, NY *** *** *** *** *** JBL8 Newton Centre, MA *** *** *** *** *** Kalmia Trujillo Alto, PR *** *** *** *** *** Kraft Melrose Park, IL *** *** *** *** *** Marubeni Specialty9 White Plains, NY *** *** *** *** *** Meadows Group Houston, TX *** *** *** *** *** MTC industries Hauppauge, NY *** *** *** *** *** Omni-Chem10 Indianapolis, IN *** *** *** *** *** Pearson Pomona, CA *** *** *** *** *** PG Manufacturing Cincinnati, OH *** *** *** *** *** PepsiCo Purchase, NY *** *** *** *** *** RZBC11 Rizhao, SD, China *** *** *** *** *** Shrieve The Woodlands, TX *** *** *** *** *** Silver Fern Seattle, WA *** *** *** *** *** Tate & Lyle12 Decatur, IL *** *** *** *** *** Thatcher Salt Lake City, UT *** *** *** *** *** Total Sweeteners Des Plaines, IL *** *** *** *** *** TRInternational Seattle, WA *** *** *** *** *** Tyche Pittstown, NJ *** *** *** *** *** Univar13 Downers Grove, IL *** *** *** *** *** UPI Chem Somerset, NJ *** *** *** *** *** Vivion San Carlos, CA *** *** *** *** *** Wego14 Great Neck, NY *** *** *** *** *** Zhong Ya Edison, NJ *** *** *** *** ***
Total *** *** *** *** *** Footnotes continued on next page

IV-3
Table IV-1 -- Continued CACCS: U.S. importers by source, 2016 1 BBFY is ***. 2 Brenntag North America, Inc. is ***. 3 Cascade is ***. 4 Coca-Cola is ***. 5 EMD Millipore Corp. is ***. 6 Gadot America Inc. is ***. 7 Gehring-Montgomery, Inc. is ***. 8 JBL is ***. 9 Marubeni is ***. 10 Omni-Chem 136, LLC is ***. 11 RZBC Imp & Exp Co., Ltd. is ***. 12 Tate & Lyle Ingredients Americas LLC is ***. 13 Univar is ***. 14 Wego Chemical & Mineral Corp. is ***. Source: Compiled from data submitted in response to Commission questionnaires.
U.S. IMPORTS
Table IV-2 and figure IV-1 present data for U.S. imports of CACCS from Belgium, Colombia, Thailand, and all other sources. The quantity of CACCS imports from the subject countries increased by 26.1 percent from 2014 to 2016, while the quantity of all imports from all countries increased by *** percent over the same period. From 2014 to 2016, the quantity of imports from nonsubject countries decreased by *** percent during 2014-16. From 2014 to 2016, the value of imports from subject countries increased by 8.6 percent, while the value for all imports decreased by 6.5 percent. During 2014-16, the value of nonsubject imports declined by 16.6 percent. From 2014 to 2016, the average unit values of CACCS imports from the subject countries decreased by 13.9 percent, while the average unit values of CACCS imports from all countries decreased by *** percent. The average unit values for nonsubject countries decreased by *** percent.

IV-4
Table IV-2 CACCS: U.S. imports by source, 2014-16, January to March 2016, and January to March 2017
Item Calendar year January to March
2014 2015 2016 2016 2017
Quantity (1,000 dry pounds)
U.S. imports from.-- Belgium 21,338 25,339 19,607 4,583 4,498
Colombia 41,339 45,239 48,960 10,988 5,859 Thailand 76,491 89,355 106,904 20,867 36,964
Subject sources 139,168 159,933 175,471 36,438 47,320 Canada *** *** *** *** *** Israel 27,695 25,037 20,272 7,174 4,366 All other 54,753 51,219 35,175 8,518 7,682
Nonsubject sources *** *** *** *** *** All import sources *** *** *** *** ***
Value (1,000 dollars)
U.S. imports from.-- Belgium 15,983 18,205 12,985 3,131 3,023
Colombia 25,315 28,020 29,727 6,687 3,680 Thailand 48,471 51,689 54,740 11,233 18,987
Subject sources 89,769 97,913 97,451 21,050 25,689 Canada 57,676 58,356 64,669 16,488 16,972 Israel 25,258 21,058 17,045 6,236 3,901 All other 49,620 49,190 28,822 7,677 7,139
Nonsubject sources 132,554 128,604 110,536 30,400 28,011 All import sources 222,323 226,517 207,987 51,450 53,700
Unit value (dollars per dry pound)
U.S. imports from.-- Belgium 0.75 0.72 0.66 0.68 0.67
Colombia 0.61 0.62 0.61 0.61 0.63 Thailand 0.63 0.58 0.51 0.54 0.51
Subject sources 0.65 0.61 0.56 0.58 0.54 Canada *** *** *** *** *** Israel 0.91 0.84 0.84 0.87 0.89 All other 0.91 0.96 0.82 0.90 0.93
Nonsubject sources *** *** *** *** *** All import sources *** *** *** *** ***
Table continued on next page.
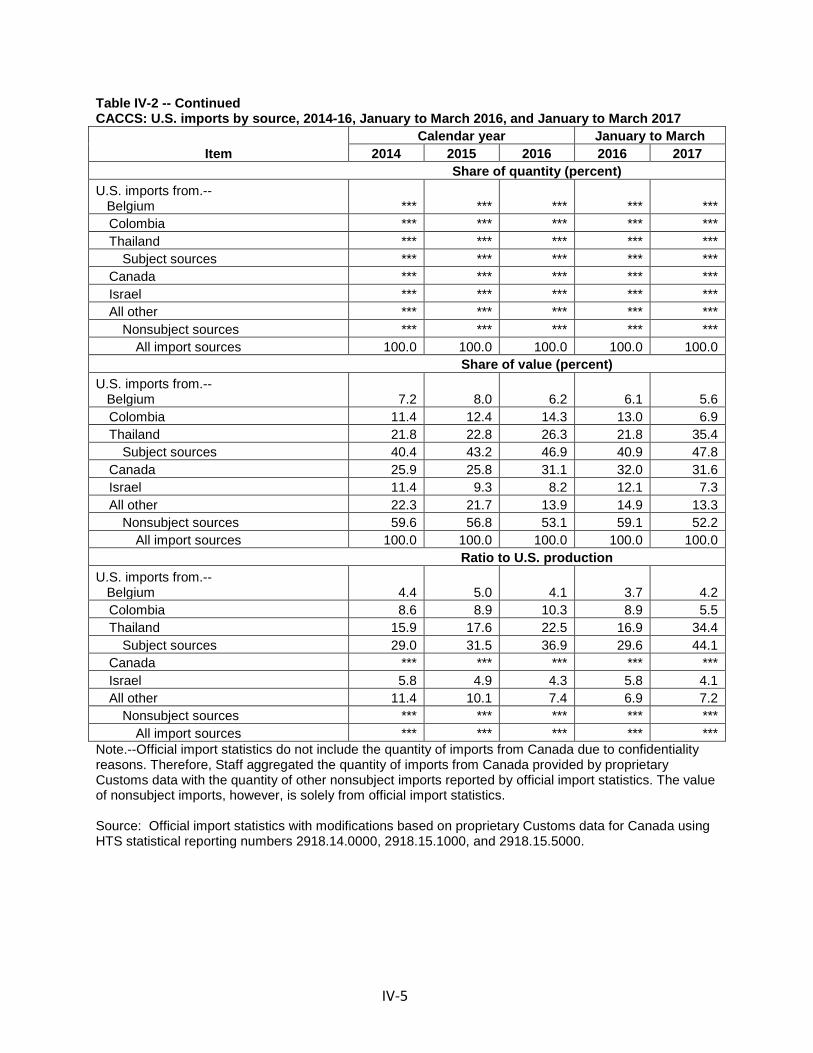
IV-5
Table IV-2 -- Continued CACCS: U.S. imports by source, 2014-16, January to March 2016, and January to March 2017
Item Calendar year January to March
2014 2015 2016 2016 2017
Share of quantity (percent)
U.S. imports from.-- Belgium *** *** *** *** ***
Colombia *** *** *** *** *** Thailand *** *** *** *** ***
Subject sources *** *** *** *** *** Canada *** *** *** *** *** Israel *** *** *** *** *** All other *** *** *** *** ***
Nonsubject sources *** *** *** *** *** All import sources 100.0 100.0 100.0 100.0 100.0
Share of value (percent)
U.S. imports from.-- Belgium 7.2 8.0 6.2 6.1 5.6
Colombia 11.4 12.4 14.3 13.0 6.9 Thailand 21.8 22.8 26.3 21.8 35.4
Subject sources 40.4 43.2 46.9 40.9 47.8 Canada 25.9 25.8 31.1 32.0 31.6 Israel 11.4 9.3 8.2 12.1 7.3 All other 22.3 21.7 13.9 14.9 13.3
Nonsubject sources 59.6 56.8 53.1 59.1 52.2 All import sources 100.0 100.0 100.0 100.0 100.0
Ratio to U.S. production
U.S. imports from.-- Belgium 4.4 5.0 4.1 3.7 4.2
Colombia 8.6 8.9 10.3 8.9 5.5 Thailand 15.9 17.6 22.5 16.9 34.4
Subject sources 29.0 31.5 36.9 29.6 44.1 Canada *** *** *** *** *** Israel 5.8 4.9 4.3 5.8 4.1 All other 11.4 10.1 7.4 6.9 7.2
Nonsubject sources *** *** *** *** *** All import sources *** *** *** *** ***
Note.--Official import statistics do not include the quantity of imports from Canada due to confidentiality reasons. Therefore, Staff aggregated the quantity of imports from Canada provided by proprietary Customs data with the quantity of other nonsubject imports reported by official import statistics. The value of nonsubject imports, however, is solely from official import statistics. Source: Official import statistics with modifications based on proprietary Customs data for Canada using HTS statistical reporting numbers 2918.14.0000, 2918.15.1000, and 2918.15.5000.

IV-6
Figure IV-1 CACCS: U.S. imports by source, 2014-16, January to March 2016, and January to March 2017
* * * * * * *
From 2014 through 2016, the quantity of imports from Belgium decreased by 8.1 percent, while the quantity of imports from Colombia and Thailand increased by 18.4 and 39.8 percent, respectively. During 2014-16, the value of imports from Belgium decreased by 18.8 percent, while the value of imports from Colombia and Thailand increased by 17.4 percent and 12.9 percent, respectively. The average unit values of imports from Belgium were consistently higher than those from Colombia and Thailand. The average unit value of CACCS imports from Thailand decreased by 19.2 percent during 2014-16, which was the largest average unit value decline of CACCS imports from the subject countries. After 2014, the average unit values of imports from Thailand were consistently lower than those from Belgium and Colombia.
During 2014-16, the share of quantity for imports from subject sources increased by *** percentage points. The share of quantity for imports from Colombia and Thailand increased by *** percentage points and *** percentage points, respectively. However, the share of quantity of imports from Belgium decreased by *** percentage points during 2014-16. The share of value for imports from the subject countries increased by 6.5 percentage points. Imports from Colombia and Thailand increased as a share of value by 2.9 and 4.5 percentage points, respectively. From 2014 to 2016, the share of value for U.S. imports from Belgium decreased by 0.9 percentage points.
The ratio of U.S. production to U.S. imports from subject sources increased by 7.9 percentage points during 2014-16, while nonsubject sources decreased by *** percentage points. The ratio of imports from Belgium to U.S. production decreased by less than one percentage point from 2014 to 2016, while those from Colombia and Thailand increased by 1.7 and 6.6 percentage points, respectively.
NEGLIGIBILITY
The statute requires that an investigation be terminated without an injury determination if imports of the subject merchandise are found to be negligible.4 Negligible imports are generally defined in the Tariff Act of 1930, as amended, as imports from a country of merchandise corresponding to a domestic like product where such imports account for less than 3 percent of the volume of all such merchandise imported into the United States in the most recent 12-month period for which data are available that precedes the filing of the petition or the initiation of the investigation. However, if there are imports of such merchandise from a number of countries subject to investigations initiated on the same day that individually account for less than 3 percent of the total volume of the subject merchandise, and if the
4 Sections 703(a)(1), 705(b)(1), 733(a)(1), and 735(b)(1) of the Act (19 U.S.C. §§ 1671b(a)(1), 1671d(b)(1), 1673b(a)(1), and 1673d(b)(1)).

IV-7
imports from those countries collectively account for more than 7 percent of the volume of all such merchandise imported into the United States during the applicable 12-month period, then imports from such countries are deemed not to be negligible.5 Imports from Belgium, Colombia, and Thailand accounted for *** percent, *** percent, and *** percent (combined subject imports accounted for *** percent) of total imports of CACCS by quantity during May 2016 through April 2017, respectively. Table IV-3 presents data on U.S. imports for May 2016 through April 2017.6 Table IV-3 CACCS: U.S. imports in the twelve months preceding the filing of the petition, May 2016 through April 2017
Belgium Colombia Thailand
Subject sources
Nonsubject sources All sources
2016-- May 2,183 6,152 9,460 17,796 *** ***
June 1,957 5,508 10,035 17,501 *** *** July 1,729 5,244 8,866 15,839 *** *** August 1,396 5,068 13,209 19,673 *** *** September 1,589 3,920 10,044 15,552 *** *** October 2,243 2,819 6,685 11,747 *** *** November 1,608 2,755 9,063 13,426 *** *** December 1,005 2,018 10,932 13,956 *** ***
2017-- January 1,305 1,135 12,722 15,161 *** ***
February 1,355 2,887 11,691 15,933 *** *** March 1,838 1,837 12,551 16,226 *** *** April 1,309 2,835 10,424 14,568 *** ***
Note.--Trade data from Census and Customs are not yet available after April 2017 while Census updates its data. Source: Official import statistics with modifications based on proprietary Customs data for Canada using HTS statistical reporting numbers 2918.14.0000, 2918.15.1000, and 2918.15.5000.
5 Section 771 (24) of the Act (19 U.S.C § 1677(24)). 6 Imports from Thailand under HTS statistical reporting number 2918.14.0000 (citric acid) accounted
for *** percent of total imports of citric acid by quantity during May 2016 through April 2017 (most recent data), while imports from Belgium and Colombia accounted for *** percent and *** percent, respectively, during the same period. Imports from Thailand under HTS statistical reporting numbers 2918.15.1000 and 2918.15.5000 (sodium citrates and potassium citrates) accounted for *** percent of total combined imports of sodium citrates and potassium citrates by quantity during April 2016 through March 2017, while imports from Belgium and Colombia accounted for *** percent and *** percent, respectively, during the same period. Since official statistics do not include quantity from Canada due to suppression, *** data for quantity were added to nonsubject imports from official import statistics.

IV-8
CUMULATION CONSIDERATIONS
In assessing whether imports should be cumulated, the Commission determines whether U.S. imports from the subject countries compete with each other and with the domestic like product and has generally considered four factors: (1) fungibility, (2) presence of sales or offers to sell in the same geographical markets, (3) common or similar channels of distribution, and (4) simultaneous presence in the market. Information regarding channels of distribution, market areas, and interchangeability appear in Part II. Additional information concerning fungibility, geographical markets, and simultaneous presence in the market is presented below.
Fungibility
As discussed in Part II, CACCS were sold to distributors, for food and beverage applications, industrial applications, pharmaceutical applications, and other applications.
Table IV-4 presents U.S. shipments by product form for 2016. Combined shipments of granular and fine granular CACCS by U.S. producers and U.S. importers accounted for the vast majority of all U.S. shipments (*** percent). The shares of U.S. shipments of powder form CACCS from domestic and subject sources were small, as was the share of U.S. shipments from subject sources of CACCS in solution form. U.S. producers’ shipments of CACCS in solution form, however, accounted for *** percent of their total shipments in 2016.7 Table IV-4 CACCS: U.S. producers’ and importers’ U.S. shipments by product form, 2016
* * * * * * *
Table IV-5 presents U.S. producers’ U.S. shipments and U.S. importers’ imports by product type. Citric acid accounted for more than 80 percent of U.S. shipments in each full and partial year. U.S. imports from each of the subject countries were similarly predominantly citric acid, as were (to a lesser extent) imports from nonsubject countries.
7 Tate & Lyle explained that during CACCS production, “you basically get to a dried citric acid and then you can deliver it as an aqueous solution, depending on customer need. So if there's a customer in a relatively close to the geographical proximity to the plant and they're going to use it as a liquid solutions anyway, they may want to purchase it in liquid form. Typically, it's a freight disadvantage to be shipping water, so that's where your geographic proximity will dictate whether or not you're buying a liquid bases or dry bases,” Conference transcript, p. 64 (Erickson).

IV-9
Table IV-5 CACCS: U.S. producers’ shipments and U.S. importers’ imports by product type, 2014-16, January to March 2016, and January to March 2017
Item Calendar year January to March
2014 2015 2016 2016 2017
Quantity (1,000 dry pounds) U.S. producers' U.S. shipments of:-- Citric acid *** *** *** *** ***
Sodium citrate *** *** *** *** *** Potassium citrate *** *** *** *** *** U.S. shipments *** *** *** *** ***
Value ($1,000)
U.S. producers' U.S. shipments of:-- Citric acid *** *** *** *** ***
Sodium citrate *** *** *** *** *** Potassium citrate *** *** *** *** *** U.S. shipments *** *** *** *** ***
Unit value (dollars per dry pound)
U.S. producers' U.S. shipments of:-- Citric acid *** *** *** *** ***
Sodium citrate *** *** *** *** *** Potassium citrate *** *** *** *** *** U.S. shipments *** *** *** *** ***
Share of quantity (percent)
U.S. producers' U.S. shipments of:-- Citric acid *** *** *** *** ***
Sodium citrate *** *** *** *** *** Potassium citrate *** *** *** *** *** U.S. shipments 100.0 100.0 100.0 100.0 100.0
Table continued on next page.

IV-10
Table IV-5 -- Continued CACCS: U.S. producers’ shipments and U.S. importers’ imports by product type, 2014-16, January to March 2016, and January to March 2017
Item Calendar year January to March
2014 2015 2016 2016 2017
Quantity (1,000 dry pounds)
U.S. importers' U.S. imports from Belgium of:-- Citric acid 17,522 19,149 16,015 4,196 3,759
Sodium citrate 3,183 5,076 2,381 168 51 Potassium citrate 633 1,114 1,211 220 688 U.S. imports 21,338 25,339 19,607 4,583 4,498
Value ($1,000)
U.S. importers' U.S. imports from Belgium of:-- Citric acid 12,861 13,235 10,453 2,810 2,394
Sodium citrate 2,397 3,548 1,488 116 35 Potassium citrate 725 1,422 1,043 204 594 U.S. imports 15,983 18,205 12,985 3,131 3,023
Unit value (dollars per dry pound)
U.S. importers' U.S. imports from Belgium of:-- Citric acid 0.73 0.69 0.65 0.67 0.64
Sodium citrate 0.75 0.70 0.62 0.70 0.68 Potassium citrate 1.15 1.28 0.86 0.93 0.86 U.S. imports 0.75 0.72 0.66 0.68 0.67
Share of quantity (percent)
U.S. importers' U.S. imports from Belgium of:-- Citric acid 82.1 75.6 81.7 91.5 83.6
Sodium citrate 14.9 20.0 12.1 3.7 1.1 Potassium citrate 3.0 4.4 6.2 4.8 15.3 U.S. imports 100.0 100.0 100.0 100.0 100.0
Table continued on next page.

IV-11
Table IV-5 -- Continued CACCS: U.S. producers’ shipments and U.S. importers’ imports by product type, 2014-16, January to March 2016, and January to March 2017
Item Calendar year January to March
2014 2015 2016 2016 2017
Quantity (1,000 dry pounds)
U.S. importers' U.S. imports from Colombia of:-- Citric acid 37,979 40,874 45,408 10,144 5,055
Sodium citrate 3,000 3,722 2,335 359 638 Potassium citrate 359 643 1,217 486 166 U.S. imports 41,339 45,239 48,960 10,988 5,859
Value ($1,000)
U.S. importers' U.S. imports from Colombia of:-- Citric acid 23,148 25,283 27,247 6,092 3,153
Sodium citrate 1,865 2,267 1,503 237 431 Potassium citrate 303 470 977 358 96 U.S. imports 25,315 28,020 29,727 6,687 3,680
Unit value (dollars per dry pound)
U.S. importers' U.S. imports from Colombia of:-- Citric acid 0.61 0.62 0.60 0.60 0.62
Sodium citrate 0.62 0.61 0.64 0.66 0.68 Potassium citrate 0.84 0.73 0.80 0.74 0.58 U.S. imports 0.61 0.62 0.61 0.61 0.63
Share of quantity (percent)
U.S. importers' U.S. imports from Colombia of:-- Citric acid 91.9 90.4 92.7 92.3 86.3
Sodium citrate 7.3 8.2 4.8 3.3 10.9 Potassium citrate 0.9 1.4 2.5 4.4 2.8 U.S. imports 100.0 100.0 100.0 100.0 100.0
Table continued on next page.

IV-12
Table IV-5 -- Continued CACCS: U.S. producers’ shipments and U.S. importers’ imports by product type, 2014-16, January to March 2016, and January to March 2017
Item Calendar year January to March
2014 2015 2016 2016 2017
Quantity (1,000 dry pounds)
U.S. importers' U.S. imports from Thailand of:-- Citric acid 67,835 80,897 99,107 18,711 34,655
Sodium citrate 8,430 8,370 7,621 1,980 2,265 Potassium citrate 226 88 176 176 44 U.S. imports 76,491 89,355 106,904 20,867 36,964
Value ($1,000)
U.S. importers' U.S. imports from Thailand of:-- Citric acid 42,752 46,529 50,331 9,975 17,631
Sodium citrate 5,505 5,078 4,267 1,116 1,315 Potassium citrate 214 81 142 142 41 U.S. imports 48,471 51,689 54,740 11,233 18,987
Unit value (dollars per dry pound)
U.S. importers' U.S. imports from Thailand of:-- Citric acid 0.63 0.58 0.51 0.53 0.51
Sodium citrate 0.65 0.61 0.56 0.56 0.58 Potassium citrate 0.95 0.92 0.81 0.81 0.94 U.S. imports 0.63 0.58 0.51 0.54 0.51
Share of quantity (percent)
U.S. importers' U.S. imports from Thailand of:-- Citric acid 88.7 90.5 92.7 89.7 93.8
Sodium citrate 11.0 9.4 7.1 9.5 6.1 Potassium citrate 0.3 0.1 0.2 0.8 0.1 U.S. imports 100.0 100.0 100.0 100.0 100.0
Table continued on next page.
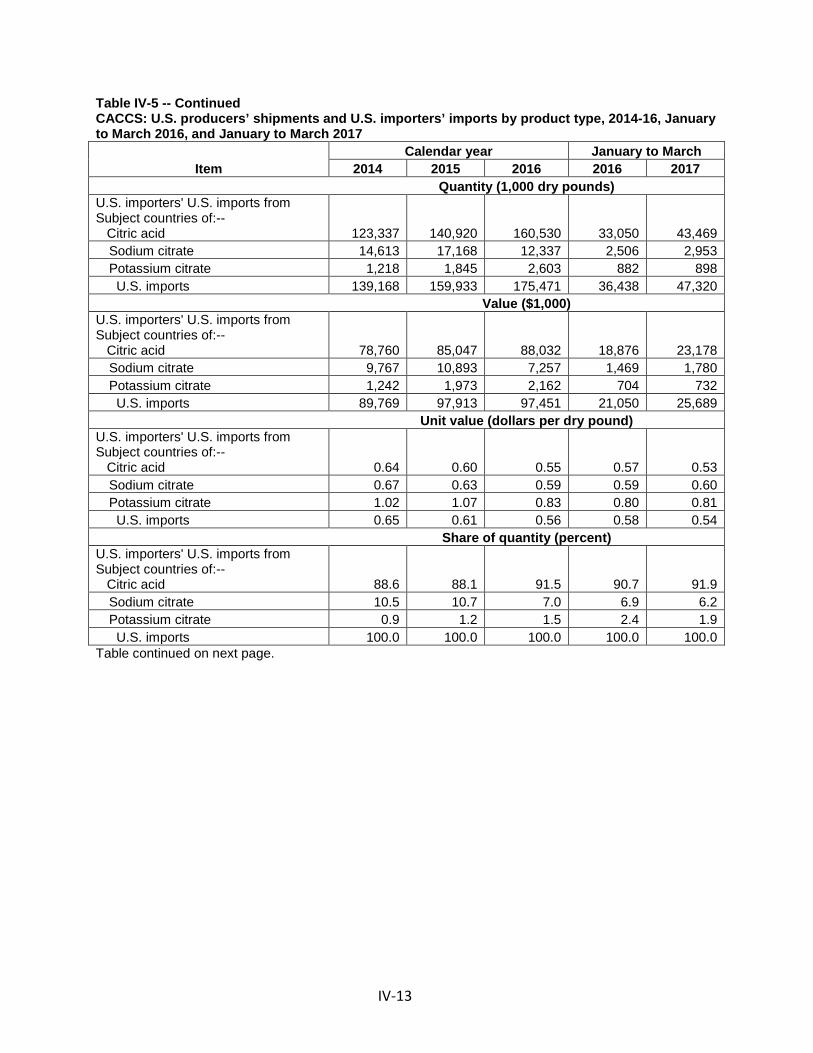
IV-13
Table IV-5 -- Continued CACCS: U.S. producers’ shipments and U.S. importers’ imports by product type, 2014-16, January to March 2016, and January to March 2017
Item Calendar year January to March
2014 2015 2016 2016 2017
Quantity (1,000 dry pounds)
U.S. importers' U.S. imports from Subject countries of:-- Citric acid 123,337 140,920 160,530 33,050 43,469
Sodium citrate 14,613 17,168 12,337 2,506 2,953 Potassium citrate 1,218 1,845 2,603 882 898 U.S. imports 139,168 159,933 175,471 36,438 47,320
Value ($1,000)
U.S. importers' U.S. imports from Subject countries of:-- Citric acid 78,760 85,047 88,032 18,876 23,178
Sodium citrate 9,767 10,893 7,257 1,469 1,780 Potassium citrate 1,242 1,973 2,162 704 732 U.S. imports 89,769 97,913 97,451 21,050 25,689
Unit value (dollars per dry pound)
U.S. importers' U.S. imports from Subject countries of:-- Citric acid 0.64 0.60 0.55 0.57 0.53
Sodium citrate 0.67 0.63 0.59 0.59 0.60 Potassium citrate 1.02 1.07 0.83 0.80 0.81 U.S. imports 0.65 0.61 0.56 0.58 0.54
Share of quantity (percent)
U.S. importers' U.S. imports from Subject countries of:-- Citric acid 88.6 88.1 91.5 90.7 91.9
Sodium citrate 10.5 10.7 7.0 6.9 6.2 Potassium citrate 0.9 1.2 1.5 2.4 1.9 U.S. imports 100.0 100.0 100.0 100.0 100.0
Table continued on next page.

IV-14
Table IV-5 -- Continued CACCS: U.S. producers’ shipments and U.S. importers’ imports by product type, 2014-16, January to March 2016, and January to March 2017
Item Calendar year January to March
2014 2015 2016 2016 2017
Quantity (1,000 dry pounds)
U.S. importers' U.S. imports from Nonsubject countries of:-- Citric acid *** *** *** *** ***
Sodium citrate *** *** *** *** *** Potassium citrate *** *** *** *** *** U.S. imports *** *** *** *** ***
Value ($1,000)
U.S. importers' U.S. imports from Nonsubject countries of:-- Citric acid 79,384 75,441 72,078 18,602 18,551
Sodium citrate 19,344 18,097 13,208 4,302 2,713 Potassium citrate 33,826 35,066 25,250 7,496 6,747 U.S. imports 132,554 128,604 110,536 30,400 28,011
Unit value (dollars per dry pound)
U.S. importers' U.S. imports from Nonsubject countries of:-- Citric acid *** *** *** *** ***
Sodium citrate *** *** *** *** *** Potassium citrate *** *** *** *** *** U.S. imports *** *** *** *** ***
Share of quantity (percent)
U.S. importers' U.S. imports from Nonsubject countries of:-- Citric acid *** *** *** *** ***
Sodium citrate *** *** *** *** *** Potassium citrate *** *** *** *** *** U.S. imports 100.0 100.0 100.0 100.0 100.0
Table continued on next page.

IV-15
Table IV-5 -- Continued CACCS: U.S. producers’ shipments and U.S. importers’ imports by product type, 2014-16, January to March 2016, and January to March 2017
Item Calendar year January to March
2014 2015 2016 2016 2017
Quantity (1,000 dry pounds)
U.S. importers' U.S. imports from all countries of:-- Citric acid *** *** *** *** ***
Sodium citrate *** *** *** *** *** Potassium citrate *** *** *** *** *** U.S. imports *** *** *** *** ***
Value ($1,000)
U.S. importers' U.S. imports from all countries of:-- Citric acid 158,143 160,488 160,109 37,478 41,728
Sodium citrate 29,111 28,990 20,446 5,771 4,493 Potassium citrate 35,069 37,038 27,412 8,201 7,479 U.S. imports 222,323 226,517 207,987 51,450 53,700
Unit value (dollars per dry pound)
U.S. importers' U.S. imports from all countries of:-- Citric acid *** *** *** *** ***
Sodium citrate *** *** *** *** *** Potassium citrate *** *** *** *** *** U.S. imports *** *** *** *** ***
Share of quantity (percent)
U.S. importers' U.S. imports from all countries of:-- Citric acid *** *** *** *** ***
Sodium citrate *** *** *** *** *** Potassium citrate *** *** *** *** *** U.S. imports 100.0 100.0 100.0 100.0 100.0
Source: Compiled from data submitted in response to Commission questionnaires, and from official import statistics with modifications based on proprietary Customs data for Canada using HTS statistical reporting numbers 2918.14.0000, 2918.15.1000, and 2918.15.5000.

IV-16
Geographical markets
Table IV-6 presents importers’ shipments by border entry and table IV-7 presents imports from Belgium, Colombia, and Thailand by U.S. customs districts for 2016. The Eastern and Western border entries were the most frequently utilized by imports coming from the subject countries during 2016.
New York, New York was the largest district of entry for subject imports, accounting for 27.4 percent of the total subject imports. Los Angeles, California was the second largest district with 26.9 percent of the total subject imports. Los Angeles and New York were the largest customs districts for imports from both Belgium and Thailand, while San Francisco, California and New York were the largest customs districts for imports from Colombia. Table IV-6 CACCS: U.S. importers’ imports by border of entry, 2016
Country Border of Entry
East North South West Total
Value ($1,000)
U.S. imports from.-- Belgium 4,816 2,156 2,227 3,786 12,985
Colombia 13,488 2,979 3,286 9,974 29,727 Thailand 19,187 4,163 6,233 25,156 54,740
Subject sources 37,491 9,299 11,746 38,916 97,451 Nonsubject sources 64,052 32,830 4,952 8,701 110,536
All import sources 101,543 42,129 16,697 47,618 207,987
Share across (percent)
U.S. imports from.-- Belgium 37.1 16.6 17.2 29.2 100.0
Colombia 45.4 10.0 11.1 33.6 100.0 Thailand 35.1 7.6 11.4 46.0 100.0
Subject sources 38.5 9.5 12.1 39.9 100.0 Nonsubject sources 57.9 29.7 4.5 7.9 100.0
All import sources 48.8 20.3 8.0 22.9 100.0
Share down (percent)
U.S. imports from.-- Belgium 4.7 5.1 13.3 8.0 6.2
Colombia 13.3 7.1 19.7 20.9 14.3 Thailand 18.9 9.9 37.3 52.8 26.3
Subject sources 36.9 22.1 70.3 81.7 46.9 Nonsubject sources 63.1 77.9 29.7 18.3 53.1
All import sources 100.0 100.0 100.0 100.0 100.0 Note.--Value was used since Canadian quantities were suppressed. Source: Official import statistics using HTS statistical reporting numbers 2918.14.0000, 2918.15.1000, and 2918.15.5000, accessed June 19, 2017.

IV-17
Table IV-7 CACCS: U.S. importers’ imports by customs district, 2016
Source / Customs district of entry
U.S. imports 2016
Quantity (1,000 dry pounds)
Share of quantity (percent)
Belgium-- Los Angeles, CA 5,404 27.6
New York, NY 4,955 25.3 Chicago, IL 1,770 9.0 Minneapolis, MN 1,326 6.8 Baltimore, MD 1,187 6.1 Houston-Galveston, TX 1,174 6.0 All other districts 3,791 19.3
All districts 19,607 100.0 Colombia-- San Francisco, CA 11,800 24.1
New York, NY 11,232 22.9 San Juan, PR 3,787 7.7 Houston-Galveston, TX 3,602 7.4 Los Angeles, CA 3,482 7.1 Chicago, IL 3,235 6.6 All other districts 11,822 24.1
All districts 48,960 100.0 Thailand-- Los Angeles, CA 38,324 35.8
New York, NY 31,966 29.9 San Francisco, CA 9,257 8.7 Houston-Galveston, TX 8,194 7.7 Chicago, IL 4,588 4.3 Savannah, GA 3,920 3.7 All other districts 10,656 10.0
All districts 106,904 100.0 Subject sources-- New York, NY 48,153 27.4
Los Angeles, CA 47,210 26.9 San Francisco, CA 21,576 12.3 Houston-Galveston, TX 12,970 7.4 Chicago, IL 9,593 5.5 Savannah, GA 6,567 3.7 All other districts 29,403 16.8
All districts 175,471 100.0 Source: Official import statistics using HTS statistical reporting numbers 2918.14.0000, 2918.15.1000, and 2918.15.5000, accessed June 19, 2017.

IV-18
Presence in the market
CACCS from Belgium, Colombia, and Thailand were present in every month between January 2014 and March 2017. Table IV-8 presents monthly imports into the United States by source. Table IV-8 CACCS: U.S. importers’ monthly imports, January 2014 through March 2017
Item
U.S. imports
Belgium Colombia Thailand Subject sources
Nonsubject sources
All import sources
Quantity (1,000 dry pounds) 2014: January 1,239 2,893 6,640 10,772 *** ***
February 1,657 2,701 5,203 9,562 *** *** March 1,629 3,143 6,199 10,970 *** *** April 2,362 3,629 6,675 12,665 *** *** May 2,652 4,335 5,654 12,641 *** *** June 2,405 3,711 7,970 14,087 *** *** July 2,443 3,478 6,914 12,834 *** *** August 1,171 2,927 6,281 10,379 *** *** September 1,114 3,621 5,670 10,405 *** *** October 1,753 4,121 8,570 14,443 *** *** November 1,795 3,130 5,804 10,729 *** *** December 1,119 3,651 4,911 9,681 *** ***
2015: January 2,200 2,021 4,074 8,296 *** ***
February 3,298 2,968 3,452 9,718 *** *** March 2,555 4,656 9,607 16,817 *** *** April 2,866 4,033 12,820 19,719 *** *** May 3,228 4,710 9,462 17,400 *** *** June 3,021 3,650 7,423 14,093 *** *** July 1,793 3,936 10,609 16,338 *** *** August 1,698 3,826 9,188 14,711 *** *** September 1,265 3,462 7,597 12,324 *** *** October 928 4,012 5,699 10,639 *** *** November 1,695 3,392 5,253 10,341 *** *** December 791 4,573 4,170 9,535 *** ***
Table continued on next page.

IV-19
Table IV-8 -- Continued CACCS: U.S. importers’ monthly imports, January 2014 through March 2017
Item
U.S. imports
Belgium Colombia Thailand Subject sources
Nonsubject sources
All import sources
Quantity (1,000 dry pounds) 2016: January 1,251 4,441 7,327 13,020 *** ***
February 2,097 2,717 5,745 10,559 *** *** March 1,235 3,830 7,795 12,860 *** *** April 1,312 4,488 7,743 13,543 *** *** May 2,183 6,152 9,460 17,796 *** *** June 1,957 5,508 10,035 17,501 *** *** July 1,729 5,244 8,866 15,839 *** *** August 1,396 5,068 13,209 19,673 *** *** September 1,589 3,920 10,044 15,552 *** *** October 2,243 2,819 6,685 11,747 *** *** November 1,608 2,755 9,063 13,426 *** *** December 1,005 2,018 10,932 13,956 *** ***
2017: January 1,305 1,135 12,722 15,161 *** ***
February 1,355 2,887 11,691 15,933 *** *** March 1,838 1,837 12,551 16,226 *** ***
Source: Official import statistics with modifications based on proprietary Customs data using HTS statistical reporting numbers 2918.14.0000, 2918.15.1000, and 2918.15.5000.
APPARENT U.S. CONSUMPTION AND MARKET SHARES
Table IV-9 and figure IV-2 present data on apparent U.S. consumption and market shares for CACCS during 2014-16, January to March 2016, and January to March 2017. From 2014 to 2016, apparent U.S. consumption based on quantity increased by *** percent, while apparent U.S. consumption based on value decreased by *** percent. During 2014-16, U.S. producers’ market share based on quantity decreased by *** percentage points, while U.S. producers’ market share based on value decreased by *** percentage points. The market share of imports based on quantity of CACCS from the subject countries increased by *** percentage points, while the market share of imports of CACCS from all sources increased by *** percentage points.8 The market share of imports of CACCS based on value from the subject
8 Citrique Belge noted that the Thai have been taking market share from everybody. “I think we can say that openly. The figures are there and that’s also the reason why we have been facing a tough time too. That’s why we have been shrinking. We certainly did not want to follow these prices and the big change in market share in United States is very obvious. Its Thai imports.” Conference transcript, p. 126 (De Backer).
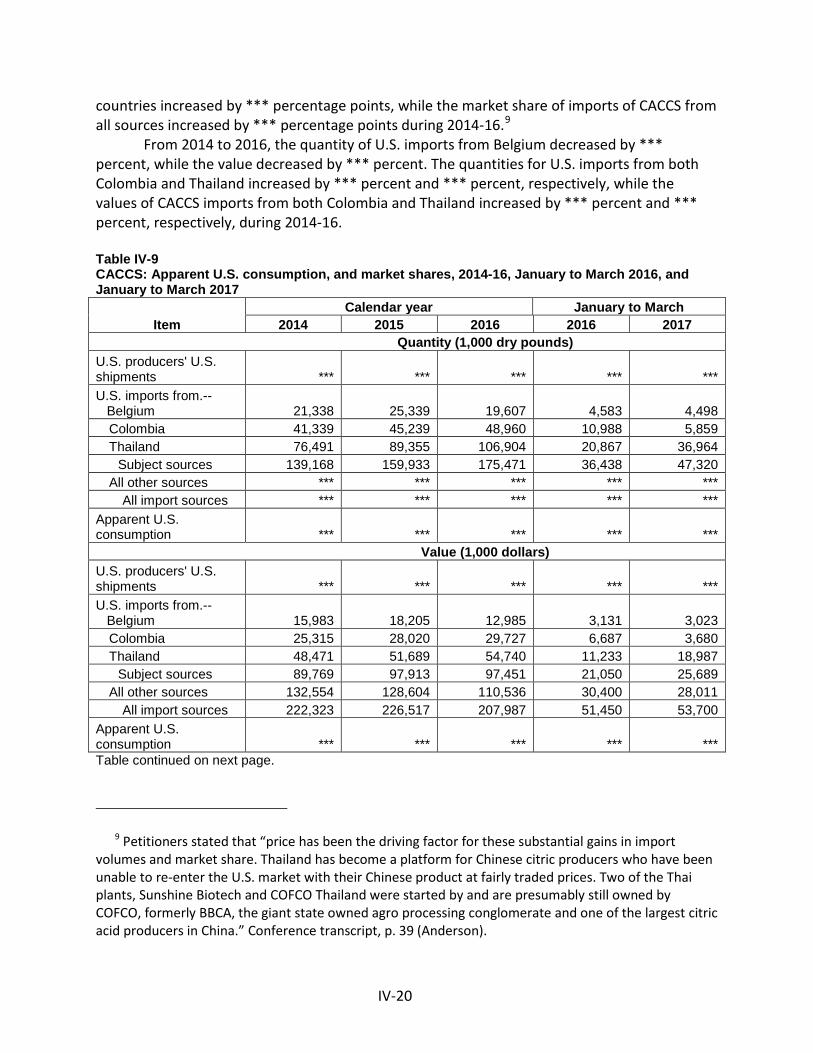
IV-20
countries increased by *** percentage points, while the market share of imports of CACCS from all sources increased by *** percentage points during 2014-16.9
From 2014 to 2016, the quantity of U.S. imports from Belgium decreased by *** percent, while the value decreased by *** percent. The quantities for U.S. imports from both Colombia and Thailand increased by *** percent and *** percent, respectively, while the values of CACCS imports from both Colombia and Thailand increased by *** percent and *** percent, respectively, during 2014-16. Table IV-9 CACCS: Apparent U.S. consumption, and market shares, 2014-16, January to March 2016, and January to March 2017
Item Calendar year January to March
2014 2015 2016 2016 2017
Quantity (1,000 dry pounds)
U.S. producers' U.S. shipments *** *** *** *** *** U.S. imports from.-- Belgium 21,338 25,339 19,607 4,583 4,498
Colombia 41,339 45,239 48,960 10,988 5,859 Thailand 76,491 89,355 106,904 20,867 36,964
Subject sources 139,168 159,933 175,471 36,438 47,320 All other sources *** *** *** *** ***
All import sources *** *** *** *** *** Apparent U.S. consumption *** *** *** *** ***
Value (1,000 dollars)
U.S. producers' U.S. shipments *** *** *** *** *** U.S. imports from.-- Belgium 15,983 18,205 12,985 3,131 3,023
Colombia 25,315 28,020 29,727 6,687 3,680 Thailand 48,471 51,689 54,740 11,233 18,987
Subject sources 89,769 97,913 97,451 21,050 25,689 All other sources 132,554 128,604 110,536 30,400 28,011
All import sources 222,323 226,517 207,987 51,450 53,700 Apparent U.S. consumption *** *** *** *** *** Table continued on next page.
9 Petitioners stated that “price has been the driving factor for these substantial gains in import volumes and market share. Thailand has become a platform for Chinese citric producers who have been unable to re-enter the U.S. market with their Chinese product at fairly traded prices. Two of the Thai plants, Sunshine Biotech and COFCO Thailand were started by and are presumably still owned by COFCO, formerly BBCA, the giant state owned agro processing conglomerate and one of the largest citric acid producers in China.” Conference transcript, p. 39 (Anderson).

IV-21
Table IV-9 -- Continued CACCS: Apparent U.S. consumption, and market shares, 2014-16, January to March 2016, and January to March 2017
Item Calendar year January to March
2014 2015 2016 2016 2017
Share of quantity (percent)
U.S. producers' U.S. shipments *** *** *** *** *** U.S. imports from.-- Belgium *** *** *** *** ***
Colombia *** *** *** *** *** Thailand *** *** *** *** ***
Subject sources *** *** *** *** *** All other sources *** *** *** *** ***
All import sources *** *** *** *** *** Apparent U.S. consumption 100.0 100.0 100.0 100.0 100.0
Share of value (percent)
U.S. producers' U.S. shipments *** *** *** *** *** U.S. imports from.-- Belgium *** *** *** *** ***
Colombia *** *** *** *** *** Thailand *** *** *** *** ***
Subject sources *** *** *** *** *** All other sources *** *** *** *** ***
All import sources *** *** *** *** *** Apparent U.S. consumption 100.0 100.0 100.0 100.0 100.0 Source: Compiled from data submitted in response to Commission questionnaires, and from official import statistics with modifications based on proprietary Customs data for Canada using HTS statistical reporting numbers 2918.14.0000, 2918.15.1000 and 2918.15.5000. Figure IV-2 CACCS: Apparent U.S. consumption 2014-16, January to March 2016, and January to March 2017
* * * * * * *

V-1
PART V: PRICING DATA
FACTORS AFFECTING PRICES
Raw material costs
The primary raw material for CACCS production is a starch (“substrate”) that is fermented by yeast to produce CACCS. The substrate varies by producer depending on proximity to the production plants and cost, which varies by region.1 Domestically produced CACCS begins with a corn substrate, Belgian CACCS with beet sugar or molasses, Colombian CACCS with sugarcane, and Thai CACCS with tapioca.2 During January 2014-May 2017, substrate prices decreased to varying degrees (figure V-1).3 4
U.S. producers reported that raw materials as a share of cost of goods sold (“COGS”) remained constant at about *** percent during January 2014-May 2017, and substrate costs were approximately *** percent of the total raw material costs during the period. U.S. producers reported different trends in raw material costs, one each reporting constant, decreasing, and fluctuating costs. Most importers reported decreasing raw material prices over the period.
1 Conference transcript, p. 68 (Erickson). 2 Petition, p. 35. Producers usually choose substrates that are the lowest cost and most prevalent
available, which typically does not change. Each producer has its own in-house bred yeast that is designed to achieve optimal yields based on specific plant conditions and specific substrates, and it is generally not possible to switch between substrates in production. Conference transcript, pp. 35-36 (Anderson), 75 (Erickson), and 87 (Erickson).
3 Belgian respondent Citrique Belge stated that sugar quotas in the EU will be lifted at the end of September 2017, and that it expects that prices for beet sugar will fall even further. Conference transcript, p. 119.
4 U.S. corn prices decreased by 22 percent during the period, EU white sugar prices decreased by nearly 38 percent, and Thai tapioca prices decreased by 16 percent. The Andean Community’s price band for raw sugar decreased by over 3 percent.
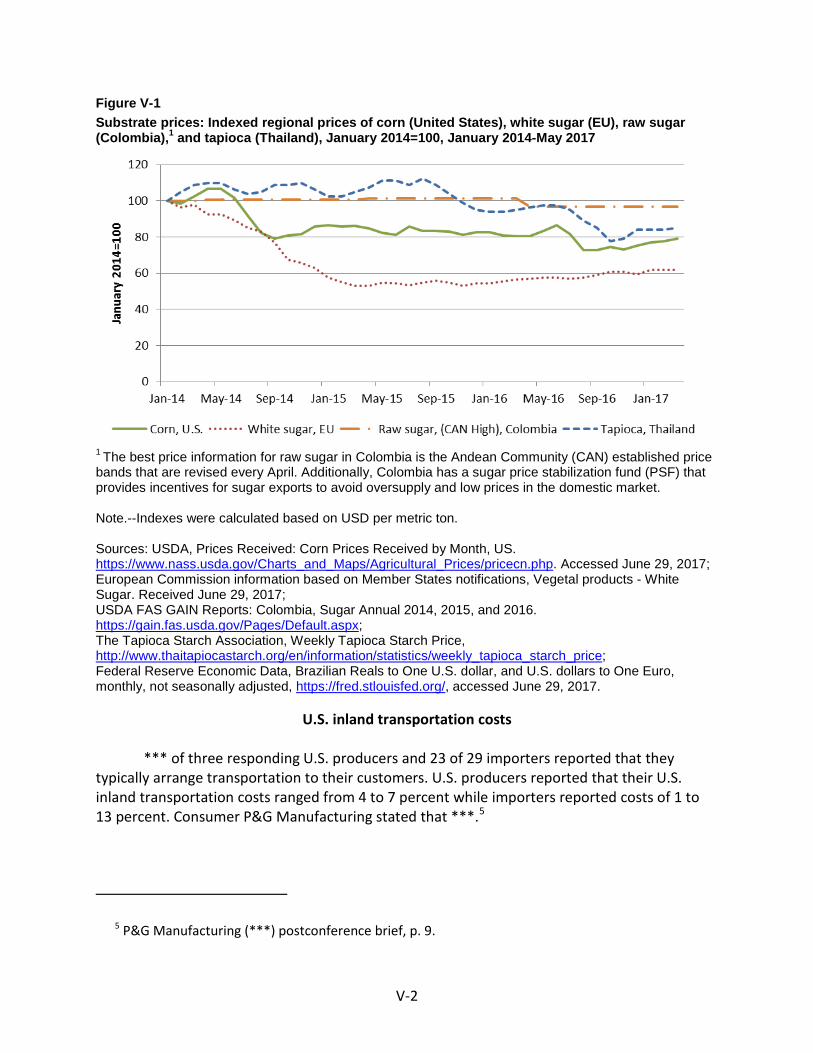
V-2
Figure V-1 Substrate prices: Indexed regional prices of corn (United States), white sugar (EU), raw sugar (Colombia),1 and tapioca (Thailand), January 2014=100, January 2014-May 2017
1 The best price information for raw sugar in Colombia is the Andean Community (CAN) established price bands that are revised every April. Additionally, Colombia has a sugar price stabilization fund (PSF) that provides incentives for sugar exports to avoid oversupply and low prices in the domestic market. Note.--Indexes were calculated based on USD per metric ton. Sources: USDA, Prices Received: Corn Prices Received by Month, US. https://www.nass.usda.gov/Charts_and_Maps/Agricultural_Prices/pricecn.php. Accessed June 29, 2017; European Commission information based on Member States notifications, Vegetal products - White Sugar. Received June 29, 2017; USDA FAS GAIN Reports: Colombia, Sugar Annual 2014, 2015, and 2016. https://gain.fas.usda.gov/Pages/Default.aspx; The Tapioca Starch Association, Weekly Tapioca Starch Price, http://www.thaitapiocastarch.org/en/information/statistics/weekly_tapioca_starch_price; Federal Reserve Economic Data, Brazilian Reals to One U.S. dollar, and U.S. dollars to One Euro, monthly, not seasonally adjusted, https://fred.stlouisfed.org/, accessed June 29, 2017.
U.S. inland transportation costs
*** of three responding U.S. producers and 23 of 29 importers reported that they typically arrange transportation to their customers. U.S. producers reported that their U.S. inland transportation costs ranged from 4 to 7 percent while importers reported costs of 1 to 13 percent. Consumer P&G Manufacturing stated that ***.5
5 P&G Manufacturing (***) postconference brief, p. 9.

V-3
PRICING PRACTICES
Pricing methods
As presented in table V-1, U.S. producers and importers sell primarily through transaction-by-transaction negotiations and contracts. Table V-1 CACCS: U.S. producers’ and importers’ reported price setting methods, by number of responding firms1
Method U.S. producers U.S. importers Transaction-by-transaction 3 28 Contract 3 13 Set price list 0 7 Other 0 2
The sum of responses down may not add up to the total number of responding firms as each firm was instructed to check all applicable price setting methods employed. Source: Compiled from data submitted in response to Commission questionnaires.
In 2016, U.S. producers and importers sold most of their CACCS under annual contracts, which are generally negotiated during the fourth quarter for the following calendar year (table V-2).6 7 U.S. producers also reported that a sizeable share of their sales was sold through long-term contracts ranging up to 3 years. Importer *** reported that it does not have formal contracts, but will provide annual pricing confirmation based on purchase orders that are typically negotiated during the fourth quarter contract period.
6 Conference transcript, pp. 19 (Aud) and 37 (Anderson). 7 Petitioners explained that larger purchasers are generally more likely to purchase through annual
contracts and most provide their annual requirements for bids around the same period, while smaller end users are more likely to purchase on the spot market from distributors. Conference transcript, pp. 10 (Jones) and 79 (Erickson).

V-4
Table V-2 CACCS: U.S. producers’ and importers’ shares of U.S. commercial shipments by type of sale, 2016
Item U.S. producers Subject U.S. importers Share (percent)
Share of commercial U.S. shipments.-- Long-term contracts *** ***
Annual contract *** *** Short-term contracts *** *** Spot sales *** ***
Note.--Because of rounding, figures may not add to the totals shown. Source: Compiled from data submitted in response to Commission questionnaires.
Most U.S. producers reported that their annual contracts fix price and do not contain meet-or-release provisions. Petitioners stated that in practice, some customers have asked to renegotiate prices mid-contract, or decrease their project volume.8
Purchasers responding to lost sales and lost revenue allegations provided a general description of their firms’ method of purchase for CACCS. Nine of 11 purchasers reported requesting bids for annual contracts, two purchasers reported also making individual purchases on the spot market. Two purchasers reported only purchasing on the spot market, and purchaser *** reported that it purchases on a quarterly basis from *** sources and on an annual basis from domestic producers.
Sales terms and discounts
*** of three U.S. producers reported that they typically quote prices on an f.o.b. basis, while most importers (23 of 29) reported typically quoting on a delivered basis. *** U.S. producers reported sales terms of net 30 days, and *** reported terms of net 60 days, and generally have no discount policy. U.S. producer *** reported that it offers ***. U.S. importer *** reported that it has a standard sales agreement that covers both spot and contract customers with respect to general terms and conditions.9
Most importers (27 of 31) reported sales terms of net 30 days. Importers *** reported net sales terms of 45 days and 120 days, respectively. Most importers (22 of 32) reported having no discount policy. Six importers reported offering quantity discounts, and five reported offering total volume discounts. Importer *** reported that it will offer discounts as needed to compete.
8 Conference transcript, pp. 30-31 (Erickson) and 37 (Anderson). 9 See staff email with ***, June 29, 2017.
V-5
PRICE DATA
The Commission requested U.S. producers and importers to provide quarterly data for the total quantity and f.o.b. value of the following CACCS products shipped to unrelated U.S. customers during January 2014-March 2017.
Product 1.--Citric acid, granular, in dry form in 25 kilogram and 50 pound bags, spot sales.
Product 2.-- Citric acid, granular, in dry form in 25 kilogram and 50 pound bags, contract sales.
Product 3.-- Citric acid, fine granular, in dry form in 25 kilogram and 50 pound bags, spot sales.
Product 4.-- Citric acid, fine granular, in dry form in 25 kilogram and 50 pound bags, contract sales.
Product 5.-- Citric acid, granular, in dry form packed in bulk sacks (“supersacks”), spot sales.
Product 6.-- Citric acid, granular, in dry form packed in bulk sacks (“supersacks”), contract sales.
Product 7.--Sodium citrate, granular, in dry form in 25 kilogram and 50 pound bags, spot sales.
Product 8.--Sodium citrate, granular, in dry form in 25 kilogram and 50 pound bags, contract sales.
All three U.S. producers and 22 of 37 importers provided usable pricing data for sales of the requested products, although not all firms reported pricing for all products for all quarters.10 11 Pricing data reported by these firms accounted for approximately 60 percent of U.S. producers’ shipments of CACCS, 87 percent of U.S. shipments of subject imports from Belgium, 86 percent of subject imports from Colombia, and 97 percent of subject imports from Thailand in 2016.
Price data for products 1-8 are presented in tables V-3 to V-10 and figures V-2 to V-9. Nonsubject country prices reported by *** for pricing products 1-4 are presented in Appendix D.
10 Per-unit pricing data are calculated from total quantity and total value data provided by U.S. producers and importers. The precision and variation of these figures may be affected by rounding, limited quantities, and producer or importer estimates.
11 Importer *** maintains annual sales records and was unable to break out quarterly quantities and values of sales. It also reported that it does not have a process for separating contract and spot customers. See staff email with ***, June 29, 2017. *** accounted for ***.

V-6
Table V-3 CACCS: Weighted-average f.o.b. prices and quantities of domestic and imported product 11 and margins of underselling/(overselling), by quarters, January 2014-March 2017
* * * * * * * Table V-4 CACCS: Weighted-average f.o.b. prices and quantities of domestic and imported product 21 and margins of underselling/(overselling), by quarters, January 2014-March 2017
* * * * * * * Table V-5 CACCS: Weighted-average f.o.b. prices and quantities of domestic and imported product 31 and margins of underselling/(overselling), by quarters, January 2014-March 2017
* * * * * * * Table V-6 CACCS: Weighted-average f.o.b. prices and quantities of domestic and imported product 41 and margins of underselling/(overselling), by quarters, January 2014-March 2017
* * * * * * * Table V-7 CACCS: Weighted-average f.o.b. prices and quantities of domestic and imported product 51 and margins of underselling/(overselling), by quarters, January 2014-March 2017
* * * * * * * Table V-8 CACCS: Weighted-average f.o.b. prices and quantities of domestic and imported product 61 and margins of underselling/(overselling), by quarters, January 2014-March 2017
* * * * * * * Table V-9 CACCS: Weighted-average f.o.b. prices and quantities of domestic and imported product 71 and margins of underselling/(overselling), by quarters, January 2014-March 2017
* * * * * * * Table V-10 CACCS: Weighted-average f.o.b. prices and quantities of domestic and imported product 81 and margins of underselling/(overselling), by quarters, January 2014-March 2017
* * * * * * *

V-7
Figure V-2 CACCS: Weighted-average f.o.b. prices and quantities of domestic and imported product 11 and margins of underselling/(overselling), by quarters, January 2014-March 2017
* * * * * * *
Figure V-3 CACCS: Weighted-average f.o.b. prices and quantities of domestic and imported product 21 and margins of underselling/(overselling), by quarters, January 2014-March 2017
* * * * * * *
Figure V-4 CACCS: Weighted-average f.o.b. prices and quantities of domestic and imported product 31 and margins of underselling/(overselling), by quarters, January 2014-March 2017
* * * * * * *
Figure V-5 CACCS: Weighted-average f.o.b. prices and quantities of domestic and imported product 41 and margins of underselling/(overselling), by quarters, January 2014-March 2017
* * * * * * *
Figure V-6 CACCS: Weighted-average f.o.b. prices and quantities of domestic and imported product 51 and margins of underselling/(overselling), by quarters, January 2014-March 2017
* * * * * * *
Figure V-7 CACCS: Weighted-average f.o.b. prices and quantities of domestic and imported product 61 and margins of underselling/(overselling), by quarters, January 2014-March 2017
* * * * * * *
Figure V-8 CACCS: Weighted-average f.o.b. prices and quantities of domestic and imported product 71 and margins of underselling/(overselling), by quarters, January 2014-March 2017
* * * * * * *
Figure V-9 CACCS: Weighted-average f.o.b. prices and quantities of domestic and imported product 81 and margins of underselling/(overselling), by quarters, January 2014-March 2017
* * * * * * *
Price trends
In general, prices generally decreased during January 2014-March 2017 for all pricing products with the exception of pricing product 7. Table V-11 summarizes the price trends, by

V-8
country and by product. As shown in the table, domestic price decreases ranged from *** percent to *** percent during January 2014-March 2017 while import price decreases ranged from *** percent to *** percent. Subject import price increases ranged from *** percent to *** percent.
Price changes of U.S.-produced CACCS sold on the spot market (pricing products 1, 3, and 7) were quite volatile, but these large price increases and decreases varied in timing, and do not seem to correspond directly with the contracting season. While price changes of subject imports also fluctuated, they were generally more moderate. Table V-11 CACCS: Summary of weighted-average f.o.b. prices for products 1-8 from the United States, Belgium, Colombia, and Thailand during January 2014-March 2017
* * * * * * *
Price comparisons
As shown in table V-12, prices for CACCS imported from subject countries were below those for U.S.-produced CACCS in 35 percent of instances (85 of 243 instances) and for 59 percent of quantity sold (171 million dry pounds); margins of underselling ranged from 0.01 percent to 41 percent. In the remaining 157 instances (121 million dry pounds), prices for CACCS from subject countries were between 0.2 percent and 76 percent above prices for the domestic product.
Table V-12 CACCS: Instances of underselling/overselling and the range and average of margins, by country, January 2014-March 2017
Source
Underselling
Number of quarters
Quantity (dry pounds)
Average margin
(percent)
Margin Range
(percent) Min Max
Belgium 15 2,706,624 10.3 0.9 18.7 Colombia 16 5,894,904 14.6 0.01 25.2 Thailand 54 163,103,185 13.8 1.1 40.8
Total, underselling 85 171,704,263 13.3 0.01 40.8
Source
(Overselling)
Number of quarters
Quantity (dry pounds)
Average margin
(percent)
Margin Range
(percent) Min Max
Belgium 66 25,868,732 (26.2) (4.1) (76.0) Colombia 63 34,820,227 (18.5) (0.2) (56.2) Thailand 28 60,357,531 (12.6) (1.3) (35.9)
Total, overselling 157 121,046,490 (20.7) (0.2) (76.0) Note.--These data include only quarters in which there is a comparison between the U.S. and subject product. Source: Compiled from data submitted in response to Commission questionnaires.

V-9
Most Belgian and Colombian CACCS (by quantity and by instance) were priced above domestically produced CACCS, while most Thai CACCS were priced below domestically produced CACCS. Patterns of overselling and underselling by subject country source were consistent throughout the period. Imported Belgian and Colombian CACCS were generally priced higher than domestic product for pricing products sold both via contracts and on the spot market, while imports of Thai product were generally priced lower than domestic product for all pricing product sold on the spot market, but were generally higher priced for contract sales.12
A vast majority of sales of pricing product 1 (Citric acid, granular, in dry form in 25 kilogram and 50 pound bags, spot sales) from all subject countries was priced lower than domestic product, but most sales of the other pricing products sold on the spot market were priced higher than domestic product (table V-13a). Most sales, by instance and by quantity, of all pricing products sold via contract from subject countries were priced higher than domestic sales by contract (table V-13b).
Table V-13a CACCS: Instances of underselling/overselling and the range and average of margins, by product, sold on the spot market (pricing products 1, 3, 5, and 7), January 2014-March 2017
Source
Underselling
Number of quarters
Quantity (dry pounds)
Average margin
(percent)
Margin Range
(percent) Min Max
Product 1 37 67,959,780 19.1 1.6 40.8 Product 3 15 34,052,520 10.2 0.0 23.4 Product 5 3 5,156,820 5.9 1.6 13.8 Product 7 9 957,786 14.0 0.9 30.3
Total, underselling 64 108,126,906 15.7 0.0 40.8
Source
(Overselling)
Number of quarters
Quantity (dry pounds)
Average margin
(percent)
Margin Range
(percent) Min Max
Product 1 2 300,834 (6.6) (5.3) (7.9) Product 3 24 25,977,691 (14.0) (0.3) (35.0) Product 5 5 2,733,330 (14.5) (0.2) (31.7) Product 7 18 686,359 (29.6) (4.1) (56.2)
Total, overselling 49 29,698,214 (20.5) (0.2) (56.2) 1 These data include only quarters in which there is a comparison between the U.S. and subject product. Source: Compiled from data submitted in response to Commission questionnaires.
12 Except for sales of pricing product 4 (Citric acid, fine granular, in dry form in 25 kilogram and 50 pound bags, contract sales) from *** which were also lower priced than domestically produced product.

V-10
Table V-13b CACCS: Instances of underselling/overselling and the range and average of margins, by product, sold under contract (pricing products 2, 4, 6, and 8), January 2014-March 2017
Source
Underselling
Number of quarters
Quantity (dry pounds)
Average margin
(percent)
Margin Range
(percent) Min Max
Product 2 3 22,553,791 2.5 2.2 2.9 Product 4 13 30,531,903 6.9 1.1 13.9 Product 6 5 10,492,113 6.6 1.4 9.6 Product 8 0 0 --- --- ---
Total, underselling 21 63,577,807 6.2 1.1 13.9
Source
(Overselling)
Number of quarters
Quantity (dry pounds)
Average margin
(percent)
Margin Range
(percent) Min Max
Product 2 35 57,878,930 (25.9) (1.3) (76.0) Product 4 26 19,920,234 (21.7) (7.4) (37.8) Product 6 29 10,557,386 (16.2) (2.7) (41.5) Product 8 17 2,993,930 (22.4) (4.2) (38.1)
Total, overselling 108 91,350,480 (21.7) (1.3) (95.2) 1 These data include only quarters in which there is a comparison between the U.S. and subject product. Source: Compiled from data submitted in response to Commission questionnaires.
LOST SALES AND LOST REVENUE
The Commission requested that U.S. producers of CACCS report purchasers where they experienced instances of lost sales or revenue due to competition from imports of CACCS from Belgium, Colombia, and Thailand during January 2014-March 2017. Of the three responding U.S. producers, *** reported that they had to either reduce prices or roll back announced price increases, and *** firms reported that they had lost sales. *** U.S. producers submitted lost sales and lost revenue allegations and identified 13 firms where they lost sales or revenue (6 consisting of lost sales allegations, 4 consisting of lost revenue allegations, and 3 consisting of both types of allegations). Lost sales and lost revenue allegations were with respect to Colombia and Thailand. No producer alleged lost sales or revenue against Belgium. All allegations were for contract sales in 2016 and 2017.
Staff contacted 13 purchasers and received responses from 11 purchasers. Responding purchasers reported purchasing over *** pounds of CACCS during 2014-16, and over *** pounds in 2016 (table V-14). *** purchasers, *** reported also importing *** pounds of CACCS in 2016 from ***.

V-11
Table V-14 CACCS: Purchasers’ responses to purchasing patterns, 2016
* * * * * * *
During 2016, responding purchasers purchased *** percent from U.S. producers, ***
percent from Belgium, *** percent from Colombia, and *** percent from Thailand. Nearly *** percent of purchases were from all other sources and *** percent were from unknown sources. During 2014-16, the reported share of purchases from domestic sources declined by almost 10 percent, while the share of purchases from subject sources grew by 3 percent. Of the responding purchasers, four purchasers each reported decreasing or fluctuating purchases from domestic producers, and two reported increasing purchases (table V-15).
Table V-15 CACCS: Changes in purchase patterns from United States, subject, and nonsubject countries
Source of purchases Did not
purchase Decreased Increased Constant Fluctuated United States 0 4 2 0 4 Belgium 7 2 1 0 0 Colombia 9 0 1 0 0 Thailand 5 0 4 1 1 All other sources 2 2 4 0 2 Unknown sources 6 0 0 0 2 Source: Compiled from data submitted in response to Commission questionnaires.
Purchasers *** reported decreasing or fluctuating purchases from domestic sources, and increasing purchases from Colombia and Thailand, respectively, because they require more non-GMO and organic certified CACCS. Purchaser *** reported decreasing purchases from domestic sources and increasing purchases from other sources for consolidated deliveries of sodium citrate and citric, fumeric, and malic acid from the same suppliers and needing global supply contingencies.
Of the 11 responding purchasers, six purchasers reported that they had purchased imported CACCS from subject countries instead of U.S.-produced product since 2014. Three purchasers reported purchasing from Belgian imports of CACCS, one reported purchasing Colombian imports of CACCS, and four reported purchasing Thai imports of CACCS instead of domestically produced product (table V-16).

V-12
Table V-16 CACCS: Purchasers’ responses, by country, to purchasing subject imports instead of domestic product
Source
Count of purchasers reporting subject
instead of domestic
Count of purchasers
reported that imports were priced lower
Count of purchasers
reporting that price was a
primary reason for
subject instead of domestic
Quantity (1,000 dry pounds)
Other reasons for
purchasing imports
instead of domestic
Belgium 3 2 1 *** 3 Colombia 1 1 --- *** 2 Thailand 4 3 3 *** 2
All subject sources 6 4 3 *** 4 Source: Compiled from data submitted in response to Commission questionnaires.
Four purchasers reported that subject import prices were lower than U.S.-produced product, and three of these purchasers reported that price was a primary reason for the decision to purchase imported product rather than U.S.-produced product. Three purchasers estimated the quantity of CACCS from Belgium and Thailand purchased instead of domestic product; quantities ranged from *** pounds to *** pounds (table V-17). Purchasers identified non-GMO certification, consolidated deliveries of in-scope and out-of-scope products, and extended credit terms as non-price reasons for purchasing imported rather than U.S.-produced product.
Table V-17 CACCS: Purchasers’ responses, by firm, to purchasing subject imports instead of domestic product
* * * * * * *
Of the 11 responding purchasers, four purchasers reported that U.S. producers had
reduced prices in order to compete with lower-priced imports from subject countries (table V-18; three purchasers reported that they did not know).
Table V-18 CACCS: Purchasers’ responses, by country, to U.S. producer price reductions
Source
Count of purchasers reporting U.S.
producers reduced prices
Simple average of estimated U.S. price reduction (percent)
Range of estimated U.S. price reductions
(percent) Belgium 2 12.5 10 to 15 Colombia 3 10.2 4 to 15 Thailand 3 18.0 9 to 25
All subject sources 4 16.5 4 to 25 Source: Compiled from data submitted in response to Commission questionnaires.

V-13
The reported estimated price reduction ranged from 4 to 25 percent. In describing the price reductions, purchasers referenced contract negotiations and a preference for non-GMO CACCS (table V-19).
Table V-19 CACCS: Purchasers’ responses, by firm, to U.S. producer price reductions
* * * * * * *
Responding U.S. purchasers provided additional information on purchases and market dynamics. Purchaser *** reported that it has mostly purchased domestically and that domestic sources have always been competitive; purchaser *** reported that its domestic supplier *** to compete with other domestic and import sources.
Purchaser *** reported that it purchases a mix of GMO, non-GMO, and Good Manufacturing Practice (“GMP”) citrates, and that its understanding is that U.S. producers do not produce non-GMO citrates. Purchaser *** reported that *** of its citric acid requirements were non-GMO to meet consumer demand, and that non-GMO CACCS are not available in the United States. Purchaser *** identified non-GMO requirements and reported that these products are not available domestically, but for products that do not require non-GMO CACCS (such as ***), it continues to source from U.S. producers.


VI-1
PART VI: FINANCIAL EXPERIENCE OF U.S. PRODUCERS
INTRODUCTION
U.S. producers ADM, Cargill, and Tate & Lyle provided financial data on their operations on CACCS. These data are believed to account for all U.S. production of CACCS from January 2014 to March 2017. While most reported revenue reflects commercial sales, *** reported some sales as internal consumption or transfers to related firms which combined accounted for *** percent of the total net sales quantity between January 2014 and March 2017.1 *** reported a fiscal year end of December 31, while *** reported fiscal year ends of ***, respectively. All firms reported their financial data on a calendar year basis.
OPERATIONS ON CACCS
Income-and-loss data for U.S. producers of CACCS are presented in table VI-1, while selected financial data, by firm, are presented in table VI-2. U.S. producers collectively reported gross, operating, and net income in each requested period; however, the reported gross, operating, and net profitability of the U.S. industry declined from 2014 to 2016. The reported aggregate net sales quantity declined by 3.4 percent during this time, while the aggregate net sales value declined by 14.9 percent. Operating expenses, which includes both the cost of goods sold (“COGS”) and selling, general, and administrative (“SG&A”) expenses, declined by 10.7 percent during this time. As a result of the larger decline in revenue compared to operating expenses, operating income in 2016 declined to about half the level reported in 2014. Gross profit and net income followed generally similar trends of decreasing profitability during this time.2
In January-March 2017 compared to January-March 2016, the reported aggregate net sales quantity was 0.6 percent lower and the aggregate net sales value was 5.1 percent lower. Operating expenses were 5.3 percent higher in interim 2017 compared to interim 2016. As a result of lower revenue and higher operating expenses, operating income was lower. Gross profit and net income were also lower in interim 2017.
1 ***. U.S. producers’ questionnaire response of ***, question II-7, and email from ***, June 21, 2017.
2 Net sales quantity and value continuously declined from 2014 o 2016; however, gross profit, operating income, and net income improved from 2014 to 2015, then declined from 2015 to 2016. From 2014 to 2015, operating expenses declined more than revenue.

VI-2
Table VI-1 CACCS: Results of operations of U.S. producers, 2014-16, January-March 2016, and January-March 2017
Item Calendar year January to March
2014 2015 2016 2016 2017 Quantity (1,000 dry pounds) Commercial sales *** *** *** *** *** Internal consumption *** *** *** *** *** Transfers to related firms *** *** *** *** ***
Total net sales 494,304 490,011 477,276 125,566 124,835 Value ($1,000) Commercial sales *** *** *** *** *** Internal consumption *** *** *** *** *** Transfers to related firms *** *** *** *** ***
Total net sales 348,542 330,015 296,677 79,007 74,980 Cost of goods sold.-- Raw materials: Substrate 96,857 86,730 83,311 21,193 20,700
Raw materials: Materials other than substrate 39,541 36,675 37,315 8,891 8,125
Subtotal, raw materials 136,398 123,405 120,626 30,084 28,825 Direct labor 14,966 14,687 14,624 3,468 3,980 Other factory costs 136,024 119,742 118,439 30,743 33,438
Total COGS 287,388 257,834 253,689 64,295 66,243 Gross profit 61,154 72,181 42,988 14,712 8,737 SG&A expense 20,217 18,004 21,122 3,940 5,619 Operating income or (loss) 40,937 54,177 21,866 10,772 3,118 Other income or (expense), net (2,834) (4,605) (3,455) (898) (3,026) Net income or (loss) 38,103 49,572 18,411 9,874 92 Depreciation/amortization 10,641 11,230 11,016 3,073 2,843 Cash flow 48,744 60,802 29,427 12,947 2,935 Ratio to net sales (percent) Cost of goods sold.-- Raw materials: Substrate 27.8 26.3 28.1 26.8 27.6
Raw materials: Materials other than substrate 11.3 11.1 12.6 11.3 10.8
Subtotal, raw materials 39.1 37.4 40.7 38.1 38.4 Direct labor 4.3 4.5 4.9 4.4 5.3 Other factory costs 39.0 36.3 39.9 38.9 44.6
Total COGS 82.5 78.1 85.5 81.4 88.3 Gross profit 17.5 21.9 14.5 18.6 11.7 SG&A expense 5.8 5.5 7.1 5.0 7.5 Operating income or (loss) 11.7 16.4 7.4 13.6 4.2 Net income or (loss) 10.9 15.0 6.2 12.5 0.1 Table continued on next page.

VI-3
Table VI-1--Continued CACCS: Results of operations of U.S. producers, 2014-16, January-March 2016 and January-March 2017
Item Calendar year January to March
2014 2015 2016 2016 2017 Share of COGS (percent) Share of COGS.-- Raw materials: Substrate 33.7 33.6 32.8 33.0 31.2
Raw materials: Materials other than substrate 13.8 14.2 14.7 13.8 12.3
Subtotal, raw materials 47.5 47.9 47.5 46.8 43.5 Direct labor 5.2 5.7 5.8 5.4 6.0 Other factory costs 47.3 46.4 46.7 47.8 50.5
Total COGS 100.0 100.0 100.0 100.0 100.0 Unit value (dollars per dry pound)
Commercial sales *** *** *** *** *** Internal consumption *** *** *** *** *** Transfers to related firms *** *** *** *** ***
Total net sales 0.71 0.67 0.62 0.63 0.60 Cost of goods sold.-- Raw materials: Substrate 0.20 0.18 0.17 0.17 0.17
Raw materials: Materials other than substrate 0.08 0.07 0.08 0.07 0.07
Subtotal, raw materials 0.28 0.25 0.25 0.24 0.23 Direct labor 0.03 0.03 0.03 0.03 0.03 Other factory costs 0.28 0.24 0.25 0.24 0.27
Total COGS 0.58 0.53 0.53 0.51 0.53 Gross profit 0.12 0.15 0.09 0.12 0.07 SG&A expense 0.04 0.04 0.04 0.03 0.05 Operating income or (loss) 0.08 0.11 0.05 0.09 0.02 Net income or (loss) 0.08 0.10 0.04 0.08 0.001 Number of firms reporting Operating losses 0 0 1 1 1 Net losses 0 0 1 1 1 Data 3 3 3 3 3
Source: Compiled from data submitted in response to Commission questionnaires. Table VI-2 CACCS: Selected results of operations of U.S. producers, by firm, 2014-16, January-March 2016, and January-March 2017
* * * * * * *

VI-4
On a per dry pound basis, raw material costs declined (primarily reflecting a decline in substrate costs which are likely reflective of declines in the price of corn), direct labor costs were essentially unchanged, other factory costs declined, and SG&A expenses were essentially unchanged from 2014 to 2016. The unit net sales value declined by $0.09 from 2014 to 2016, while unit operating expenses declined by about $0.05 during this time. As with the aggregate data, the larger decline in unit net sales value resulted in a decline in unit operating income from 2014 to 2016.
As a ratio to net sales, all components of COGS and SG&A expenses generally increased from 2014 to 2016 as total net sales value declined.
In January-March 2017 compared to January-March 2016, per-dry pound raw material costs were slightly lower, direct labor costs were essentially unchanged, and other factory costs and SG&A expenses were higher. The per-unit net sales value was lower by $0.03, while per-unit total operating expenses were higher by $0.04. As a result of lower revenue and higher unit operating expenses, per-unit operating income was lower. Per-unit gross profit and net income were also lower in interim 2017.
Between the comparable interim periods, ratio-to-net sales values for direct labor, other factory costs, and SG&A expenses were generally higher which was due in part to a lower net sales value, but also reflects higher direct labor and other factory costs, as well as higher SG&A expenses.3
Raw material costs and other factory costs accounted for an average 47.3 4 5 and 47.1 percent of total COGS, respectively, for the reporting period, and thus had the largest influence on gross profit, operating income, and net income during the period examined. SG&A expenses accounted for an average of 7.0 percent of total operating expenses during the period examined, while net other income/expenses, accounted for an average of 1.5 percent of all reported expenses during the period examined.6
***.7 ***.8
3 ***. Email from ***, June 21, 2017. ***. Email from ***, June 21, 2017. 4 Raw material data were broken out between substrate costs and other raw material costs.
Substrate costs represented 31.2 to 33.7 percent of total COGS during the reporting period, while other raw materials represented 12.3 to 14.7 percent of total COGS during this time. According to ***. Email from ***, June 21, 2017.
5 *** reported purchasing some raw materials from related sources. ***. U.S. producers’ questionnaire response of ***, questions III-7 and III-8, and email from ***, June 21, 2017. ***. U.S. producers’ questionnaire response of ***, questions III-7 and III-8, and email from ***, June 21, 2017.
6 ***. Email from ***, June 21, 2017. ***. Email from ***, June 21, 2017. ***. Email from ***, July 3, 2017.
7 Overall, ADM reported sales revenue of $62.3 billion and total segment operating income of $2.7 billion in 2016. Citric acid is included in ADM’s Corn Processing reporting segment. The Corn Processing segment reported sales of $9.5 billion and operating income of $811 million in 2016, accounting for approximately 15.2 percent of ADM’s total sales and 30.0 percent of ADM’s total segment operating income. Citric acid accounted for approximately *** percent of the Corn Processing segment sales in 2016. ADM’s 2016 Form 10-K, pp. 28 and 30.
8 Email from ***, July 3, 2017.

VI-5
Variance analysis
The variance analysis presented in table VI-3 is based on the data in table VI-1.9 The analysis shows that the decrease in operating profitability from 2014 to 2016 is attributable to a negative price variance that exceeds a positive net cost/expense variances (that is, prices declined more than operating expenses), while the reduced operating profit in January-March 2017 compared to January-March 2016 is attributable to both a negative price variance and a negative net cost/expense variance (that is, prices declined and operating expenses increased). Table VI-3 CACCS: Variance analysis on the operations of U.S. producers, 2014-16, and January-March 2016-17
Item Between calendar years January-March
2014-16 2014-15 2015-16 2016-17 Value ($1,000) Total net sales:
Price variance (39,858) (15,500) (24,761) (3,567) Volume variance (12,007) (3,027) (8,577) (460)
Total net sales variance (51,865) (18,527) (33,338) (4,027) Cost of sales:
Cost variance 23,799 27,058 (2,556) (2,322) Volume variance 9,900 2,496 6,701 374
Total cost variance 33,699 29,554 4,145 (1,948) Gross profit variance (18,166) 11,027 (29,193) (5,975) SG&A expenses:
Expense variance (1,601) 2,037 (3,586) (1,702) Volume variance 696 176 468 23
Total SG&A variance (905) 2,213 (3,118) (1,679) Operating income variance (19,071) 13,240 (32,311) (7,654) Summarized as:
Price variance (39,858) (15,500) (24,761) (3,567) Net cost/expense variance 22,197 29,095 (6,142) (4,024) Net volume variance (1,410) (356) (1,408) (63)
Note.--Unfavorable variances are shown in parenthesis; all others are favorable. Source: Compiled from data submitted in response to Commission questionnaires.
9 The Commission’s variance analysis is calculated in three parts: sales variance, cost of sales variance (COGS variance), and SG&A expense variance. Each part consists of a price variance (in the case of the sales variance) or a cost variance (in the case of the COGS and SG&A expense variance), and a volume variance. The sales or cost variance is calculated as the change in unit price or unit cost/expense times the new volume, while the volume variance is calculated as the change in volume times the old unit price or unit cost. Summarized at the bottom of the table, the price variance is from sales; the cost/expense variance is the sum of those items from COGS and SG&A variances, respectively; and the volume variance is the sum of the volume components of the net sales, COGS, and SG&A expense variances.

VI-6
CAPITAL EXPENDITURES, RESEARCH & DEVELOPMENT EXPENSES, TOTAL ASSETS, AND RETURN ON ASSETS
The responding firms’ aggregate data on capital expenditures, research and development (“R&D”) expenses, total assets, and return on assets (“ROA”) are shown in table VI-4. All firms reported both capital expenditures and R&D expenses during the period for which data were requested. Aggregate capital expenditures declined irregularly from 2014 to 2016, and were somewhat lower in interim 2017, while R&D expenses continually declined during these same time frames. The majority of reported capital expenditures reflect the data of ***, while the majority of reported R&D expenses reflect the data of ***. According to ***, the firm’s capital expenditures reflect ***.10 According to ***, the firm’s R&D expenses reflect ***.11
The total assets utilized in the production, warehousing, and sale of CACCS increased irregularly from $209.2 million in 2014 to $213.0 million in 2016, and the ROA declined from 19.6 percent in 2014 to 10.3 percent in 2016.12
Table VI-4 CACCS: Capital expenditures, R&D expenses, total assets, and ROA of U.S. producers, 2014-16, January-March 2016, and January-March 2017
Item Calendar year January-March
2014 2015 2016 2016 2017 Value ($1,000) Capital expenditures *** *** *** *** *** R&D expenses *** *** *** *** *** Total assets 209,231 208,844 213,041 Percent ROA 19.6 25.9 10.3 Source: Compiled from data submitted in response to Commission questionnaires.
10 U.S. producers’ questionnaire response of ***, question III-13. 11 U.S producers’ questionnaire response of ***, question III-13. 12 The return on assets is calculated as operating income divided by total assets. With respect to a
firm’s overall operations, the total asset value reflects an aggregation of a number of assets which are generally not product specific. Thus, high-level allocations are generally required in order to report a total asset value for the subject product.

VI-7
CAPITAL AND INVESTMENT
The Commission requested that U.S. producers of CACCS describe any negative effects of imports of CACCS from Belgium, Colombia, and Thailand on their firms’ return on investment or the scale of capital investments, as well as any negative effects on their firms’ growth, ability to raise capital, or existing development and production efforts. Individual firm responses are shown in tables VI-5a through VI-5c. *** reported different responses by country.
Table VI-5a CACCS: Negative effects of imports as reported by U.S. producer ***, by factor
* * * * * * * Table VI-5b CACCS: Negative effects of imports as reported by U.S. producer ***, by factor
* * * * * * * Table VI-5c CACCS: Negative effects of imports as reported by U.S. producer ***, by factor
* * * * * * *


VII-1
PART VII: THREAT CONSIDERATIONS AND INFORMATION ON NONSUBJECT COUNTRIES
Section 771(7)(F)(i) of the Act (19 U.S.C. § 1677(7)(F)(i)) provides that—
In determining whether an industry in the United States is threatened with material injury by reason of imports (or sales for importation) of the subject merchandise, the Commission shall consider, among other relevant economic factors1-- (I) if a countervailable subsidy is involved, such information as may be
presented to it by the administering authority as to the nature of the subsidy (particularly as to whether the countervailable subsidy is a subsidy described in Article 3 or 6.1 of the Subsidies Agreement), and whether imports of the subject merchandise are likely to increase,
(II) any existing unused production capacity or imminent, substantial increase in production capacity in the exporting country indicating the likelihood of substantially increased imports of the subject merchandise into the United States, taking into account the availability of other export markets to absorb any additional exports,
(III) a significant rate of increase of the volume or market penetration of imports of the subject merchandise indicating the likelihood of substantially increased imports,
(IV) whether imports of the subject merchandise are entering at prices that are likely to have a significant depressing or suppressing effect on domestic prices, and are likely to increase demand for further imports,
(V) inventories of the subject merchandise,
1 Section 771(7)(F)(ii) of the Act (19 U.S.C. § 1677(7)(F)(ii)) provides that “The Commission shall consider {these factors} . . . as a whole in making a determination of whether further dumped or subsidized imports are imminent and whether material injury by reason of imports would occur unless an order is issued or a suspension agreement is accepted under this title. The presence or absence of any factor which the Commission is required to consider . . . shall not necessarily give decisive guidance with respect to the determination. Such a determination may not be made on the basis of mere conjecture or supposition.”

VII-2
(VI) the potential for product-shifting if production facilities in the foreign country, which can be used to produce the subject merchandise, are currently being used to produce other products,
(VII) in any investigation under this title which involves imports of both a raw agricultural product (within the meaning of paragraph (4)(E)(iv)) and any product processed from such raw agricultural product, the likelihood that there will be increased imports, by reason of product shifting, if there is an affirmative determination by the Commission under section 705(b)(1) or 735(b)(1) with respect to either the raw agricultural product or the processed agricultural product (but not both),
(VIII) the actual and potential negative effects on the existing development and production efforts of the domestic industry, including efforts to develop a derivative or more advanced version of the domestic like product, and
(IX) any other demonstrable adverse trends that indicate the probability that there is likely to be material injury by reason of imports (or sale for importation) of the subject merchandise (whether or not it is actually being imported at the time).2
Information on the nature of the alleged subsidies was presented earlier in this report; information on the volume and pricing of imports of the subject merchandise is presented in Parts IV and V; and information on the effects of imports of the subject merchandise on U.S. producers’ existing development and production efforts is presented in Part VI. Information on inventories of the subject merchandise; foreign producers’ operations, including the potential for “product-shifting;” any other threat indicators, if applicable; and any dumping in third-country markets, follows. Also presented in this section of the report is information obtained for consideration by the Commission on nonsubject countries.
2 Section 771(7)(F)(iii) of the Act (19 U.S.C. § 1677(7)(F)(iii)) further provides that, in antidumping investigations, “. . . the Commission shall consider whether dumping in the markets of foreign countries (as evidenced by dumping findings or antidumping remedies in other WTO member markets against the same class or kind of merchandise manufactured or exported by the same party as under investigation) suggests a threat of material injury to the domestic industry.”

VII-3
THE INDUSTRY IN BELGIUM
Overview
The Commission issued foreign producers’ or exporters’ questionnaires to two firms believed to produce and/or export CACCS from Belgium.3 A usable response to the Commission’s questionnaire was received from Citrique Belge, the producer and exporter of CACCS in Belgium. Citrique Belge’s exports to the United States accounted for *** U.S. imports of CACCS from Belgium in 2016. According to estimates requested of the responding producer in Belgium, the production of CACCS in Belgium reported in Part VII of the report accounts for *** production of CACCS in Belgium in 2016. Table VII-1 presents information on the CACCS operations of Citrique Belge.
Table VII-1 CACCS: Summary data for Citrique Belge in Belgium, 2016
* * * * * * *
Changes in operations
Table VII-2 presents Citrique Belge’s operational and organizational changes since January 1, 2014.
Table VII-2 CACCS: Reported changes in operations of Citrique Belge in Belgium, since January 1, 2014
* * * * * * *
Operations on CACCS
Table VII-3 presents information on the CACCS operations of the responding producer and exporter in Belgium during 2014-16, January to March 2016, January to March 2017, and projections for 2017-18. Projections indicate that capacity and end-of-period inventories will remain constant while production and total shipments (***) will increase during 2017-18. Table VII-3 CACCS: Data on Citrique Belge in Belgium, 2014-16, January to March 2016, January to March 2017, and projection calendar years 2017-18
* * * * * * *
3 This firm was identified through a review of information submitted in the petition and contained in *** records.

VII-4
Capacity in Belgium remained constant from 2014 to 2016. Capacity also remained constant during January to March 2017 as compared to January to March 2017. Production increased by *** percent from 2014 to 2015, decreased by *** percent from 2015 to 2016, and was *** percent lower during January to March 2017 than during January to March 2016. Production increased overall by *** percent from 2014 to 2016.4 Capacity utilization increased by *** percentage points from 2014 to 2015, decreased by *** percentage points from 2015 to 2016, and was *** percentage points lower during January to March 2017 than during January to March 2016. Capacity utilization increased overall by *** percentage points from 2014 to 2016. In addition, end-of-period inventories decreased by *** percent from 2014 to 2015, increased by *** percent from 2015 to 2016, and was *** percent higher during January to March 2017 than during January to March 2016. End-of-period inventories decreased overall by *** percent from 2014 to 2016. Citrique Belge ***.
Total shipments of Citrique Belge decreased by *** percent from 2014 to 2016, but were *** percent higher during January to March 2017 than during January to March 2016. Home market shipments, which were ***, increased from *** percent of total shipments in 2014 to *** percent of total shipments in 2015, but decreased to *** percent of total shipments in 2016. Home market shipments by Citrique Belge accounted for *** percent of total shipments during January to March 2017, up from *** percent of total shipments during January to March 2016.
Exports of CACCS to the United States increased by *** percent from 2014 to 2015, decreased by *** percent from 2015 to 2016, and were *** percent lower during January to March 2017 than during January to March 2016. Exports of CACCS to the United States decreased overall by *** percent from 2014 to 2016.5 As a share of total shipments, exports to the United States increased from *** percent in 2014 to *** percent in 2015, decreased to *** percent in 2016, and were *** percent during January to March 2017, down from *** percent during January to March 2016. Exports of CACCS to countries other than the United States accounted for *** of total shipments, decreasing by *** percent from 2014 to 2016, but were *** percent higher during January to March 2017 than during January to March 2016.6 7 Other export markets identified include ***.
4 Production decreased in 2016 due to ***. ***. 5 Citrique Belge reported that ***, exports of CACCS to the United States decreased in 2016. ***.
***. 6 Citrique Belge ***. ***. 7 Citrique Belge explained that it shipments are mainly focused on other countries within the
European Union, particularly Germany, France, Italy, and the United Kingdom. The exchange rate also drove Citrique Belge to focus on exports within the European Union. Conference transcript, pp. 107, 114 (Schaefer, de Backer).

VII-5
Exports
According to GTA, the top export market for CACCS from Belgium was Germany in 2016 (table VII-4). The Netherlands was the second-largest export destination of CACCS from Belgium. During 2016, Germany and the Netherlands accounted for 22.5 and 15.5 percent of total exports from Belgium of CACCS, respectively. All of the leading export markets for CACCS, other than the United States, are in Europe. Table VII-4 CACCS: Exports from Belgium by destination market, 2014-16
Destination market Calendar year
2014 2015 2016
Quantity (1,000 dry pounds)
Exports from Belgium to the United States 4,180 5,267 3,557 Exports from Belgium to other major destination markets.-- Germany 13,591 8,479 8,826
Netherlands 3,896 5,574 6,070 France 7,727 5,120 4,744 United Kingdom 4,113 3,538 3,618 Ireland 3,679 2,942 2,985 Italy 2,881 2,774 1,936 Switzerland 1,629 1,526 1,314 Spain 566 722 1,124 All other destination markets 6,184 5,966 5,004
Total Belgium exports 48,446 41,906 39,178
Value (1,000 dollars)
Exports from Belgium to the United States 3,095 3,510 2,384 Exports from Belgium to other major destination markets.-- Germany 9,301 5,815 5,475
Netherlands 3,837 4,334 5,078 France 6,562 3,317 2,810 United Kingdom 3,064 2,145 2,194 Ireland 2,566 1,664 1,810 Italy 2,401 1,939 1,620 Switzerland 1,895 1,276 1,120 Spain 672 448 866 All other destination markets 17,935 16,027 16,414
Total Belgium exports 51,328 40,475 39,770 Table continued on next page.

VII-6
Table VII-4 -- Continued CACCS: Exports from Belgium by destination market, 2014-16
Destination market Calendar year
2014 2015 2016
Unit value (dollars per dry pound)
Exports from Belgium to the United States 0.74 0.67 0.67 Exports from Belgium to other major destination markets.-- Germany 0.68 0.69 0.62
Netherlands 0.98 0.78 0.84 France 0.85 0.65 0.59 United Kingdom 0.74 0.61 0.61 Ireland 0.70 0.57 0.61 Italy 0.83 0.70 0.84 Switzerland 1.16 0.84 0.85 Spain 1.19 0.62 0.77 All other destination markets 2.90 2.69 3.28
Total Belgium exports 1.06 0.97 1.02
Share of quantity (percent)
Exports from Belgium to the United States 8.6 12.6 9.1 Exports from Belgium to other major destination markets.-- Germany 28.1 20.2 22.5
Netherlands 8.0 13.3 15.5 France 15.9 12.2 12.1 United Kingdom 8.5 8.4 9.2 Ireland 7.6 7.0 7.6 Italy 5.9 6.6 4.9 Switzerland 3.4 3.6 3.4 Spain 1.2 1.7 2.9 All other destination markets 12.8 14.2 12.8
Total Belgium exports 100.0 100.0 100.0 Source: Official exports statistics under HS subheadings 2918.14 and 2918.15, as reported by Eurostat in the IHS/GTA database, accessed June 13, 2017.
THE INDUSTRY IN COLOMBIA
Overview
The Commission issued foreign producers’ or exporters’ questionnaires to one firm, Sucroal, believed to produce and/or export CACCS from Colombia.8 A usable response to the Commission’s questionnaire was received from this firm. Sucroal’s exports to the United States accounted for *** U.S. imports of CACCS from Colombia in 2016. According to estimates
8 This firm was identified through a review of information submitted in the petition and contained in *** records.

VII-7
requested of the responding Colombian producer, the production of CACCS in Colombia reported in Part VII of the report accounts for *** production of CACCS in Colombia in 2016. Table VII-5 presents information on the CACCS operations of Sucroal in Colombia.
Table VII-5 CACCS: Summary data for Sucroal in Colombia, 2016
* * * * * * *
Changes in operations
Table VII-6 presents reported changes in operations by Sucroal since January 1, 2014.
Table VII-6 CACCS: Reported changes in operations of Sucroal in Colombia, since January 1, 2014
* * * * * * *
Operations on CACCS
Table VII-7 presents information on the CACCS operations of the responding producer and exporter in Colombia during 2014-16, January to March 2016, January to March 2017 and projections for 2017-18. Projections indicate that capacity will remain constant, production and end-of-period inventories will increase, while total shipments will fluctuate during 2017-18. Table VII-7 CACCS: Data on Sucroal in Colombia, 2014-16, January to March 2016, January to March 2017, and projection calendar years 2017-18
* * * * * * *
Capacity in Colombia remained constant from 2014 to 2015, increased by *** percent from 2015 to 2016 due to ***,9 but remained constant during January to March 2017 as compared to January to March 2016. As explained above, Sucroal’s capacity increased due to ***. Production increased by *** percent from 2014 to 2016, but was *** percent lower during January to March 2017 than during January to March 2016. Capacity utilization increased by *** percentage points from 2014 to 2015, decreased by *** percentage points from 2015 to 2016, but was *** percentage points lower during January to March 2017 than during January to March 2016. Capacity utilization decreased overall by *** percentage points from 2014 to 2016. In addition, end-of-period inventories increased by *** percent from 2014 to 2015, decreased by *** percent from 2015 to 2016, but were *** percent higher during January to
9 Sucroal explained that ***. ***.

VII-8
March 2017 than during January to March 2016. End-of-period inventories increased overall by *** percent from 2014 to 2016.
Total shipments of the responding Colombian producer increased by *** percent from 2014 to 2016, but were *** percent lower during January to March 2017 than during January to March 2016. Home market shipments increased from *** percent of total shipments in 2014 to *** percent of total shipments in 2015, and further increased to *** percent of total shipments in 2016. Home market shipments by the responding Colombian producer accounted for *** percent of total shipments during January to March 2017, up from *** percent of total shipments during January to March 2016.
Exports of CACCS to the United States increased by *** percent from 2014 to 2015, decreased by *** percent from 2015 to 2016, and were *** percent lower during January to March 2017 than during January to March 2016. Exports of CACCS to the United States increased overall by *** percent from 2014 to 2016. As a share of total shipments, exports to the United States accounted for *** of total shipments, increasing from *** percent in 2014 to *** percent in 2015, decreasing to *** percent in 2016, and were *** percent during January to March 2017, down from *** percent during January to March 2016. Exports of CACCS to countries other than the United States decreased by *** percent from 2014 to 2015, increased by *** percent from 2015 to 2016, and were *** percent higher during January to March 2017 than during January to March 2016. Exports of CACCS to countries other than the United States increased overall by *** percent from 2014 to 2016. Other export markets identified include ***.
Alternative products
As shown in table VII-8, Sucroal ***. Overall capacity utilization increased from *** percent in 2014 to *** percent in 2015, but decreased to *** percent in 2016. Overall capacity utilization was *** percentage point lower during January to March 2017 than during January to March 2016. Production of in-scope CACCS accounted for *** percent of total production and out-of-scope production accounted for *** percent on the same equipment in 2016. Other products produced on the same equipment as CACCS include ***.
Table VII-8 CACCS: Overall capacity and production on the same equipment as in-scope production by Sucroal in Colombia, 2014-16, January to March 2014, and January to March 2017
* * * * * * *
Exports
According to GTA, the top export market for CACCS from Colombia was the United States in 2016 (table VII-9). Brazil was the second-largest export destination of CACCS from Colombia. During 2016, the United States and Brazil accounted for 68.8 and 13.3 percent of total exports from Colombia of CACCS, respectively.

VII-9
Table VII-9 CACCS: Exports from Colombia by destination market, 2014-16
Destination market Calendar year
2014 2015 2016
Quantity (1,000 dry pounds)
Exports from Colombia to the United States 41,482 46,234 47,044 Exports from Colombia to other major destination markets.-- Brazil 2,482 3,276 9,087
Uruguay 1,819 1,836 1,929 Israel 132 617 1,372 Mexico 2,525 1,005 1,246 Philippines 851 1,056 1,222 Indonesia 1,219 1,195 1,190 Guatemala 794 705 1,014 Japan 1,168 1,102 1,011 All other destination markets 11,375 4,833 3,310
Total Colombia exports 63,848 61,858 68,426
Value (1,000 dollars)
Exports from Colombia to the United States 24,491 26,861 26,263 Exports from Colombia to other major destination markets.-- Brazil 2,194 2,384 5,670
Uruguay 1,114 1,098 1,084 Israel 90 373 765 Mexico 1,979 861 949 Philippines 1,189 1,447 1,605 Indonesia 974 858 772 Guatemala 732 656 757 Japan 910 861 786 All other destination markets 8,795 4,244 2,762
Total Colombia exports 42,467 39,644 41,413 Table continued on next page.

VII-10
Table VII-9 -- Continued CACCS: Exports from Colombia by destination market, 2014-16
Destination market Calendar year
2014 2015 2016
Unit value (dollars per dry pound)
Exports from Colombia to the United States 0.59 0.58 0.56 Exports from Colombia to other major destination markets.-- Brazil 0.88 0.73 0.62
Uruguay 0.61 0.60 0.56 Israel 0.68 0.61 0.56 Mexico 0.78 0.86 0.76 Philippines 1.40 1.37 1.31 Indonesia 0.80 0.72 0.65 Guatemala 0.92 0.93 0.75 Japan 0.78 0.78 0.78 All other destination markets 0.77 0.88 0.83
Total Colombia exports 0.67 0.64 0.61
Share of quantity (percent)
Exports from Colombia to the United States 65.0 74.7 68.8 Exports from Colombia to other major destination markets.-- Brazil 3.9 5.3 13.3
Uruguay 2.8 3.0 2.8 Israel 0.2 1.0 2.0 Mexico 4.0 1.6 1.8 Philippines 1.3 1.7 1.8 Indonesia 1.9 1.9 1.7 Guatemala 1.2 1.1 1.5 Japan 1.8 1.8 1.5 All other destination markets 17.8 7.8 4.8
Total Colombia exports 100.0 100.0 100.0 Source: Official exports statistics under HS subheadings 2918.14 and 2918.15 as reported by Colombia's DIAN in the IHS/GTA database, accessed June 13, 2017.
THE INDUSTRY IN THAILAND
Overview
The Commission issued foreign producers’ or exporters’ questionnaires to four firms believed to produce and/or export CACCS from Thailand.10 Usable responses to the Commission’s questionnaire were received from four firms: COFCO, Niran, Sunshine, and TCA. These firms’ exports to the United States accounted for *** U.S. imports of CACCS from
10 These firms were identified through a review of information submitted in the petition and contained in *** records.

VII-11
Thailand in 2016. According to estimates requested of the responding producers in Thailand, the production of CACCS in Thailand reported in Part VII of the report accounts for *** production of CACCS in Thailand. Table VII-10 presents information on the CACCS operations of the responding producers and exporters in Thailand.
Table VII-10 CACCS: Summary data for producers in Thailand, 2016
* * * * * * *
Changes in operations
As presented in table VII-11, *** reported operational and organizational changes since January 1, 2014.
Table VII-11 CACCS: Reported changes in operations by producers in Thailand, since January 1, 2014
* * * * * * *
Operations on CACCS
Table VII-12 presents information on the CACCS operations of the responding producers and exporters in Thailand during 2014-16, January to March 2016, January to March 2017, and projections for 2017-18. Projections indicate that capacity, production, end-of-period inventories, and total shipments will increase during 2017-18.
Capacity in Thailand remained constant from 2014 to 2016. Capacity also remained constant during January to March 2017 as compared to January to March 2017. Production increased by *** percent from 2014 to 2016, and was *** percent higher during January to March than during January to March 2016.11 Capacity utilization increased by *** percentage points from 2014 to 2016, and was *** percentage points higher during January to March 2017 than during January to March 2016. In addition, end-of-period inventories increased by *** percent from 2014 to 2015, decreased by *** percent from 2015 to 2016, and were *** percent lower during January to March 2017 than during January to March 2016. End-of-period inventories decreased over all by *** percent from 2014 to 2016.
11 COFCO and Sunshine contend that this increase in production is due to ***. Furthermore, GMO and non-GMO CACCS are distinctive especially in the food and beverage, nourishment, cosmetic, and pharmaceutical industries. The demand for non-GMO CACCS from these consumers is reportedly increasing rapidly. ***; COFCO and Sunshine’s postconference brief, exh. 1, exh.2.
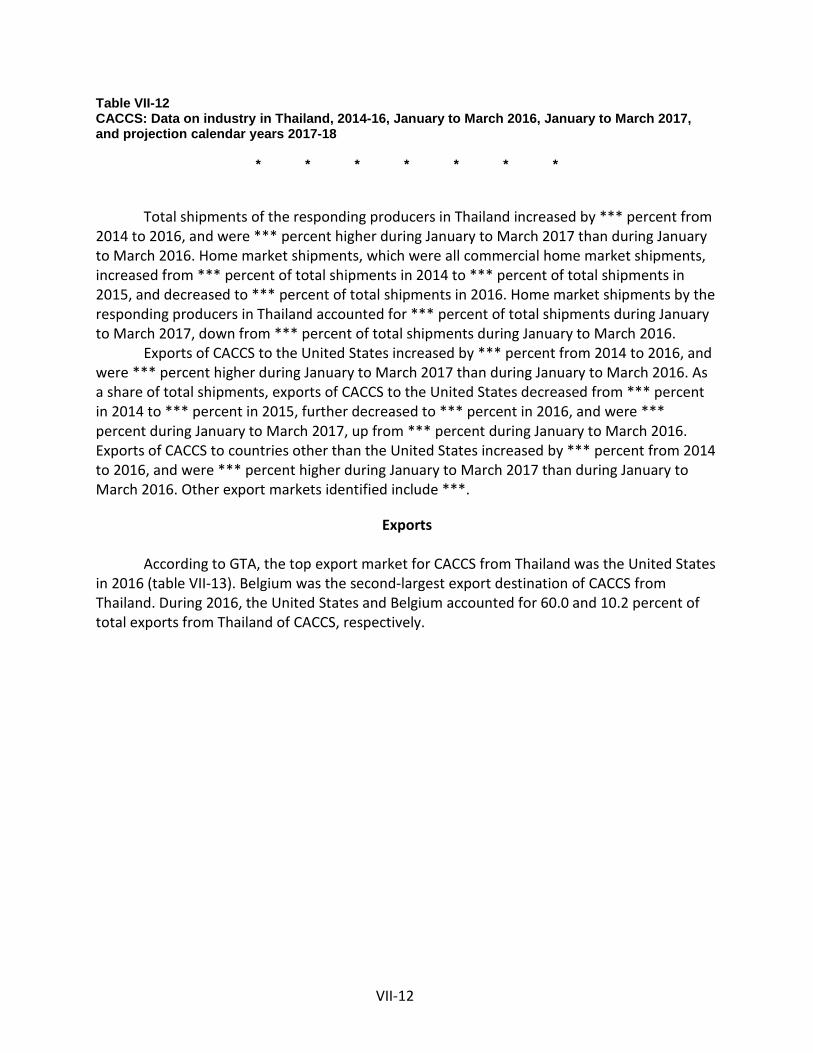
VII-12
Table VII-12 CACCS: Data on industry in Thailand, 2014-16, January to March 2016, January to March 2017, and projection calendar years 2017-18
* * * * * * *
Total shipments of the responding producers in Thailand increased by *** percent from 2014 to 2016, and were *** percent higher during January to March 2017 than during January to March 2016. Home market shipments, which were all commercial home market shipments, increased from *** percent of total shipments in 2014 to *** percent of total shipments in 2015, and decreased to *** percent of total shipments in 2016. Home market shipments by the responding producers in Thailand accounted for *** percent of total shipments during January to March 2017, down from *** percent of total shipments during January to March 2016.
Exports of CACCS to the United States increased by *** percent from 2014 to 2016, and were *** percent higher during January to March 2017 than during January to March 2016. As a share of total shipments, exports of CACCS to the United States decreased from *** percent in 2014 to *** percent in 2015, further decreased to *** percent in 2016, and were *** percent during January to March 2017, up from *** percent during January to March 2016. Exports of CACCS to countries other than the United States increased by *** percent from 2014 to 2016, and were *** percent higher during January to March 2017 than during January to March 2016. Other export markets identified include ***.
Exports
According to GTA, the top export market for CACCS from Thailand was the United States in 2016 (table VII-13). Belgium was the second-largest export destination of CACCS from Thailand. During 2016, the United States and Belgium accounted for 60.0 and 10.2 percent of total exports from Thailand of CACCS, respectively.

VII-13
Table VII-13 CACCS: Exports from Thailand by destination market, 2014-16
Destination market Calendar year
2014 2015 2016
Quantity (1,000 dry pounds)
Exports from Thailand to the United States 75,315 92,760 118,608 Exports from Thailand to other major destination markets.-- Belgium 4,982 8,774 20,106
Brazil 3,597 2,842 17,641 Ireland 0 1,279 7,077 Netherlands 4,462 6,120 5,932 Spain 4,515 3,726 5,870 Israel 3,245 6,916 3,814 Poland 3,845 1,190 2,985 Turkey 0 0 1,852 All other destination markets 11,269 9,984 13,732
Total Thai exports 111,231 133,592 197,617
Value (1,000 dollars)
Exports from Thailand to the United States 42,404 47,047 53,424 Exports from Thailand to other major destination markets.-- Belgium 2,436 3,372 7,671
Brazil 1,872 1,308 7,857 Ireland 0 572 2,922 Netherlands 2,046 2,540 2,282 Spain 2,148 1,483 2,150 Israel 1,863 3,521 1,752 Poland 1,723 458 1,102 Turkey 0 0 744 All other destination markets 5,502 4,377 5,625
Total Thai exports 59,994 64,676 85,529 Table continued on next page.
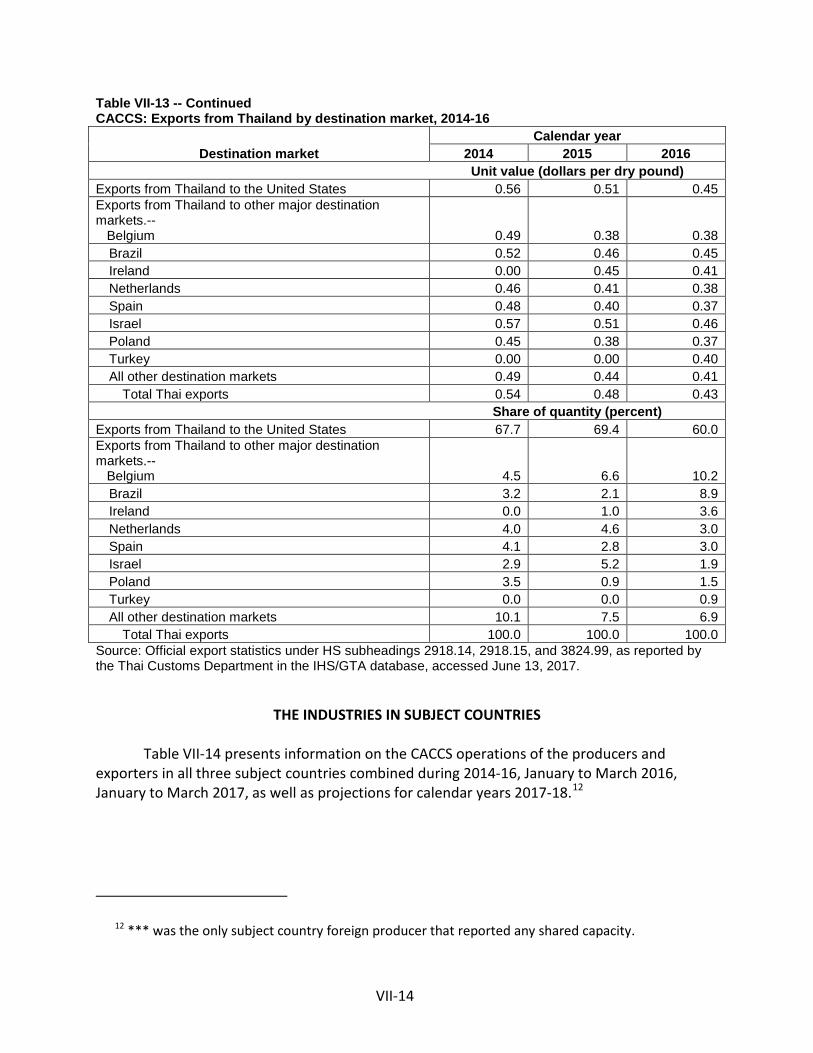
VII-14
Table VII-13 -- Continued CACCS: Exports from Thailand by destination market, 2014-16
Destination market Calendar year
2014 2015 2016
Unit value (dollars per dry pound)
Exports from Thailand to the United States 0.56 0.51 0.45 Exports from Thailand to other major destination markets.-- Belgium 0.49 0.38 0.38
Brazil 0.52 0.46 0.45 Ireland 0.00 0.45 0.41 Netherlands 0.46 0.41 0.38 Spain 0.48 0.40 0.37 Israel 0.57 0.51 0.46 Poland 0.45 0.38 0.37 Turkey 0.00 0.00 0.40 All other destination markets 0.49 0.44 0.41
Total Thai exports 0.54 0.48 0.43
Share of quantity (percent)
Exports from Thailand to the United States 67.7 69.4 60.0 Exports from Thailand to other major destination markets.-- Belgium 4.5 6.6 10.2
Brazil 3.2 2.1 8.9 Ireland 0.0 1.0 3.6 Netherlands 4.0 4.6 3.0 Spain 4.1 2.8 3.0 Israel 2.9 5.2 1.9 Poland 3.5 0.9 1.5 Turkey 0.0 0.0 0.9 All other destination markets 10.1 7.5 6.9
Total Thai exports 100.0 100.0 100.0 Source: Official export statistics under HS subheadings 2918.14, 2918.15, and 3824.99, as reported by the Thai Customs Department in the IHS/GTA database, accessed June 13, 2017.
THE INDUSTRIES IN SUBJECT COUNTRIES
Table VII-14 presents information on the CACCS operations of the producers and exporters in all three subject countries combined during 2014-16, January to March 2016, January to March 2017, as well as projections for calendar years 2017-18.12
12 *** was the only subject country foreign producer that reported any shared capacity.

VII-15
Table VII-14 CACCS: Data on industry in subject countries, 2014-16, projection calendar years 2017-18
Item
Actual experience Projections Calendar year January to March Calendar year
2014 2015 2016 2016 2017 2017 2018
Quantity (1,000 dry pounds)
Capacity 653,704 653,704 675,750 168,390 168,390 681,250 686,750 Production 424,928 513,978 559,792 128,099 149,523 637,253 655,238 End-of-period inventories 50,853 59,128 47,074 63,497 49,540 62,980 80,580 Shipments: Home market shipments: Internal consumption/ transfers *** *** *** *** *** *** ***
Commercial home market shipments *** *** *** *** *** *** ***
Total home market shipments 67,934 93,233 107,371 25,041 27,429 114,969 121,320
Export shipments to: United States *** *** *** *** *** *** ***
All other markets *** *** *** *** *** *** *** Total exports 399,083 412,449 464,430 98,681 119,625 506,379 516,318
Total shipments 467,017 505,682 571,801 123,722 147,054 621,348 637,638
Ratios and shares (percent)
Capacity utilization 65.0 78.6 82.8 76.1 88.8 93.5 95.4 Inventories/production 12.0 11.5 8.4 12.4 8.3 9.9 12.3 Inventories/total shipments 10.9 11.7 8.2 12.8 8.4 10.1 12.6 Share of shipments: Home market shipments: Internal consumption/ transfers *** *** *** *** *** *** ***
Commercial home market shipments *** *** *** *** *** *** ***
Total home market shipments 14.5 18.4 18.8 20.2 18.7 18.5 19.0
Export shipments to: United States *** *** *** *** *** *** ***
All other markets *** *** *** *** *** *** *** Total exports 85.5 81.6 81.2 79.8 81.3 81.5 81.0
Total shipments 100.0 100.0 100.0 100.0 100.0 100.0 100.0 Source: Compiled from data submitted in response to Commission questionnaires.
U.S. INVENTORIES OF IMPORTED MERCHANDISE
Table VII-15 presents data on U.S. importers’ reported inventories of CACCS.
Table VII-15 CACCS: U.S. importers’ end-of-period inventories of imports by source, 2014-16, January to March 2016, and January to March 2017
* * * * * * *

VII-16
U.S. IMPORTERS’ OUTSTANDING ORDERS
The Commission requested importers to indicate whether they imported or arranged for the importation of CACCS from Belgium, Colombia, Thailand, and all other sources after March 31, 2017 (table VII-16).
Table VII-16 CACCS: Arranged imports, April 2017 through March 2018
* * * * * * *
ANTIDUMPING OR COUNTERVAILING DUTY ORDERS IN THIRD-COUNTRY MARKETS
There are currently no antidumping or countervailing duty orders on CACCS from Belgium, Colombia, and Thailand. However, the European Union, Thailand, Russia, Belarus, Kazakhstan, and Ukraine have antidumping dumping orders on citric acid from China. The European Union also has an antidumping duty order on solely citric acid from Malaysia. In addition, Brazil has an antidumping duty order on CACCS from China, while Colombia and India have antidumping duty orders on solely sodium citrate from China.13
INFORMATION ON NONSUBJECT COUNTRIES
Table VII-17 presents data on global exports of citric acid and citrate salts under the harmonized schedule for subheadings 2918.14 and 2918.15. China has at least *** percent of global nameplate capacity for CACCS and is the largest global exporter of these products.14 The United States maintains countervailing and antidumping duty orders on CACCS from China.
13 Petitioners’ postconference brief, Answers to Questions Presented by ITC Staff, p. 1. 14 ***.

VII-17
Table VII-17 CACCS: Global exports by exporter, 2014-16
Exporter Calendar year
2014 2015 2016
Quantity (1,000 dry pounds)
United States 48,565 43,906 53,754 Belgium 48,446 41,906 39,178 Colombia 63,848 61,858 68,426 Thailand 111,231 133,592 197,617 Canada 57,191 64,113 54,087 All other major reporting exporters.-- China 2,057,319 2,113,187 2,211,411
Germany 152,164 160,412 138,706 Netherlands 63,289 54,517 68,233 Poland 25,396 35,416 41,600 Ireland 29,644 27,641 29,655 Slovenia 14,868 19,316 20,305 Brazil 39,024 21,789 13,186 India 8,179 8,596 10,044 Singapore 12,141 6,325 7,537 Spain 8,141 9,479 6,690 All other exporters 104,394 68,145 51,682
Total global exports 2,843,840 2,870,199 3,012,111
Value ($1,000)
United States 66,193 59,725 64,377 Belgium 51,328 40,475 39,770 Colombia 42,467 39,644 41,413 Thailand 59,994 64,676 85,529 Canada 107,095 102,202 103,321 All other major reporting exporters.-- China 840,410 759,621 741,261
Germany 171,966 157,305 138,694 Netherlands 37,186 33,141 37,958 Poland 17,541 19,128 19,652 Ireland 43,763 31,133 28,322 Slovenia 9,222 9,589 9,716 Brazil 33,452 17,503 10,104 India 25,363 8,876 10,061 Singapore 17,165 12,170 12,849 Spain 10,606 10,317 7,133 All other exporters 89,190 66,310 54,148
Total global exports 1,622,941 1,431,815 1,404,308 Table continued on next page.

VII-18
Table VII-17--Continued CACCS: Global exports by exporter, 2014-16
Exporter Calendar year
2014 2015 2016
Unit value (dollars per dry pound)
United States 1.36 1.36 1.20 Belgium 1.06 0.97 1.02 Colombia 0.67 0.64 0.61 Thailand 0.54 0.48 0.43 Canada 1.87 1.59 1.91 All other major reporting exporters.-- China 0.41 0.36 0.34
Germany 1.13 0.98 1.00 Netherlands 0.59 0.61 0.56 Poland 0.69 0.54 0.47 Ireland 1.48 1.13 0.96 Slovenia 0.62 0.50 0.48 Brazil 0.86 0.80 0.77 India 3.10 1.03 1.00 Singapore 1.41 1.92 1.70 Spain 1.30 1.09 1.07 All other exporters 0.85 0.97 1.05
Total global exports 0.57 0.50 0.47
Share of quantity (percent)
United States 1.7 1.5 1.8 Belgium 1.7 1.5 1.3 Colombia 2.2 2.2 2.3 Thailand 3.9 4.7 6.6 Canada 2.0 2.2 1.8 All other major reporting exporters.-- China 72.3 73.6 73.4
Germany 5.4 5.6 4.6 Netherlands 2.2 1.9 2.3 Poland 0.9 1.2 1.4 Ireland 1.0 1.0 1.0 Slovenia 0.5 0.7 0.7 Brazil 1.4 0.8 0.4 India 0.3 0.3 0.3 Singapore 0.4 0.2 0.3 Spain 0.3 0.3 0.2 All other exporters 3.7 2.4 1.7
Total global exports 100.0 100.0 100.0 Note.--Canada's quantity is understated and the unit value, overstated, because the Global Trade Atlas does not report U.S. quantities of imports from Canada. It does report U.S. values. Source: Official export statistics under HS subheadings 2918.14 and 2918.15, as reported by various national agencies in the IHS/GTA database, accessed June 13, 2017.

VII-19
The two major nonsubject sources of CACCS have been Canada and Israel. Jungbunzlauer Canada, with an annual capacity of ***,15 is the sole producer in Canada. Jungbunzlauer, which produces citric acid and sodium citrate, was operating at *** during 2014 and 2015, the latest years for which data are available.16 Based on mirror trade data, Jungbunzlauer exports the bulk of its production. The AD duty order on CACCS imports from Canada remains in place, but the administrative reviews of Canadian imports have set the AD duty rate at 0 percent.17
Israel was the largest nonsubject source of citrate salts. Gadot Biochemical Industries, the only Israeli producer of CACCS, has a nameplate capacity of 66 million pounds.18 According to one of the Conference participants, Gadot has recently stopped producing citric acid but still produces citrate salts.19
15 ***. 16 ***. 17 Citric Acid and Certain Citrate Salts From Canada: Final Results of Antidumping Duty Administrative
Review; 2013–2014, 80 FR 62016, October 15, 2015. Citric Acid and Certain Citrate Salts From Canada: Final Results of Antidumping Duty Administrative Review; 2015–2016, 82 FR 18284, April 18, 2017.
18 Conference transcript, pp. 122-123 (De Backer). ***. 19 Conference transcript, pp. 122-123 (De Backer).


A-1
APPENDIX A
FEDERAL REGISTER NOTICES


A-3
The Commission makes available notices relevant to its investigations and reviews on its website, www.usitc.gov. In addition, the following tabulation presents, in chronological order, Federal Register notices issued by the Commission and Commerce during the current proceeding.
Citation Title Link
82 FR 26712, June 8, 2017
Citric Acid and Certain Citrate Salts From Belgium, Colombia, Thailand Institution of Antidumping and Countervailing Duty Investigations and Scheduling of Preliminary Phase Investigations
https://www.federalregister.gov/d/2017-11917
82 FR 29828 June 30, 2017
Citric Acid and Certain Citrate Salts From Belgium, Colombia, and Thailand: Initiation of Less-Than-Fair-Value Investigations
https://www.federalregister.gov/d/2017-13823

B-1
APPENDIX B
CONFERENCE WITNESSES


B-3
CALENDAR OF PUBLIC PRELIMINARY CONFERENCE
Those listed below appeared as witnesses at the United States International Trade Commission’s preliminary conference:
Subject: Citric Acid and Certain Citrate Salts from Belgium,
Colombia, and Thailand
Inv. Nos.: 701-TA-581 and 731-TA-1374-1376 (Preliminary)
Date and Time: June 23, 2017 - 9:30 a.m.
Sessions were held in connection with these preliminary phase investigations in Courtroom A (room 100), 500 E Street, SW., Washington, DC.
OPENING REMARKS: Petitioners (Stephen A. Jones, King & Spalding LLP) Respondents (Alexander H. Schaefer, Crowell & Morning LLP) In Support of the Imposition of
Antidumping and Countervailing Duty Orders: King & Spalding LLP Washington, DC on behalf of Archer Daniels Midland Company Cargill, Inc. Tate & Lyle Ingredients Americas LLC Christopher B. Aud, Assistant Vice President, Cargill Starches and Sweeteners, Acidulants Product Line, Cargill, Inc. Brett S. Tuma, Commercial Manager, Acidulants, Cargill, Inc. Jeffrey S. Peel, Director, Acidulants, Archer Daniels Midland Company Kenneth F. Erickson, Vice President, Product Line Management Acidulants & Vico, Tate & Lyle Ingredients Americas LLC

B‐4
In Support of the Imposition of Antidumping and Countervailing Duty Orders (continued):
Charles Anderson, Principal, Capital Trade, Inc. Stephen A. Jones ) ) – OF COUNSEL Benjamin J. Bay ) In Opposition to the Imposition of
Antidumping and Countervailing Duty Orders: Crowell & Moring LLP Washington, DC on behalf of Citrique Belge Hans De Backer, Managing Director, Citrique Belge Beate Braeuer, Sales Manager, Citrique Belge Michael Gijsegom, Key Account Manager, Citrique Belge Alexander H. Schaefer ) ) – OF COUNSEL Daniel J. Cannistra ) REBUTTAL/CLOSING REMARKS: Petitioners (Stephen A. Jones, King & Spalding LLP) Respondents (Alexander H. Schaefer, Crowell & Morning LLP)
-END-

C-1
APPENDIX C
SUMMARY DATA


Table C-1CACCS: Summary data concerning the U.S. market, 2014-16, January to March 2016, and January to March 2017
Jan-Mar2014 2015 2016 2016 2017 2014-16 2014-15 2015-16 2016-17
U.S. consumption quantity:Amount.................................................................................... *** *** *** *** *** *** *** *** ***Producers' share (fn1)............................................................. *** *** *** *** *** *** *** *** ***Importers' share (fn1):
Belgium................................................................................. *** *** *** *** *** *** *** *** ***Colombia.............................................................................. *** *** *** *** *** *** *** *** ***Thailand................................................................................ *** *** *** *** *** *** *** *** ***
Subject sources................................................................. *** *** *** *** *** *** *** *** ***Nonsubject sources........................................................... *** *** *** *** *** *** *** *** ***
All import sources........................................................... *** *** *** *** *** *** *** *** ***
U.S. consumption value:Amount.................................................................................... *** *** *** *** *** *** *** *** ***Producers' share (fn1)............................................................. *** *** *** *** *** *** *** *** ***Importers' share (fn1):
Belgium................................................................................. *** *** *** *** *** *** *** *** ***Colombia.............................................................................. *** *** *** *** *** *** *** *** ***Thailand................................................................................ *** *** *** *** *** *** *** *** ***
Subject sources................................................................. *** *** *** *** *** *** *** *** ***Nonsubject sources........................................................... *** *** *** *** *** *** *** *** ***
All import sources........................................................... *** *** *** *** *** *** *** *** ***
U.S. imports from:Belgium:
Quantity................................................................................. 21,338 25,339 19,607 4,583 4,498 (8.1) 18.7 (22.6) (1.9)Value..................................................................................... 15,983 18,205 12,985 3,131 3,023 (18.8) 13.9 (28.7) (3.4)Unit value.............................................................................. $0.75 $0.72 $0.66 $0.68 $0.67 (11.6) (4.1) (7.8) (1.6)Ending inventory quantity...................................................... *** *** *** *** *** *** *** *** ***
ColombiaQuantity................................................................................. 41,339 45,239 48,960 10,988 5,859 18.4 9.4 8.2 (46.7)Value..................................................................................... 25,315 28,020 29,727 6,687 3,680 17.4 10.7 6.1 (45.0)Unit value.............................................................................. $0.61 $0.62 $0.61 $0.61 $0.63 (0.9) 1.1 (2.0) 3.2 Ending inventory quantity...................................................... *** *** *** *** *** *** *** *** ***
ThailandQuantity................................................................................. 76,491 89,355 106,904 20,867 36,964 39.8 16.8 19.6 77.1Value..................................................................................... 48,471 51,689 54,740 11,233 18,987 12.9 6.6 5.9 69.0Unit value.............................................................................. $0.63 $0.58 $0.51 $0.54 $0.51 (19.2) (8.7) (11.5) (4.6)Ending inventory quantity...................................................... *** *** *** *** *** *** *** *** ***
Subject sources:Quantity................................................................................. 139,168 159,933 175,471 36,438 47,320 26.1 14.9 9.7 29.9Value..................................................................................... 89,769 97,913 97,451 21,050 25,689 8.6 9.1 (0.5) 22.0 Unit value.............................................................................. $0.65 $0.61 $0.56 $0.58 $0.54 (13.9) (5.1) (9.3) (6.0)Ending inventory quantity...................................................... *** *** *** *** *** *** *** *** ***
Nonsubject sources:Quantity................................................................................. *** *** *** *** *** *** *** *** ***Value..................................................................................... 132,554 128,604 110,536 30,400 28,011 (16.6) (3.0) (14.0) (7.9)Unit value.............................................................................. *** *** *** *** *** *** *** *** ***Ending inventory quantity...................................................... *** *** *** *** *** *** *** *** ***
All import sources:Quantity................................................................................. *** *** *** *** *** *** *** *** ***Value..................................................................................... 222,323 226,517 207,987 51,450 53,700 (6.4) 1.9 (8.2) 4.4 Unit value.............................................................................. *** *** *** *** *** *** *** *** ***Ending inventory quantity...................................................... *** *** *** *** *** *** *** *** ***
U.S. producers':Average capacity quantity........................................................ 551,710 551,710 551,710 137,927 137,927 0.0 0.0 0.0 0.0Production quantity.................................................................. 480,639 508,482 475,991 123,119 107,402 (1.0) 5.8 (6.4) (12.8)Capacity utilization (fn1)........................................................... 87.1 92.2 86.3 89.3 77.9 (0.8) 5.0 (5.9) (11.4)U.S. shipments:
Quantity................................................................................. *** *** *** *** *** (3.7) 0.5 (4.2) (0.8)Value..................................................................................... *** *** *** *** *** (15.1) (4.0) (11.5) (5.6)Unit value.............................................................................. *** *** *** *** *** (11.8) (4.5) (7.6) (4.8)
Export shipments:Quantity................................................................................. *** *** *** *** *** *** *** *** ***Value..................................................................................... *** *** *** *** *** *** *** *** ***Unit value.............................................................................. *** *** *** *** *** *** *** *** ***
Ending inventory quantity......................................................... 60,596 79,067 77,658 76,557 60,501 28.2 30.5 (1.8) (21.0)Inventories/total shipments (fn1).............................................. 12.3 16.1 16.3 15.2 12.1 4.0 3.9 0.1 (3.1)Production workers.................................................................. 317 320 322 319 321 1.6 0.9 0.6 0.6Hours worked (1,000s)............................................................ 757 743 743 189 184 (1.8) (1.8) 0.0 (2.6)Wages paid ($1,000)............................................................... 25,535 26,833 25,843 6,586 6,751 1.2 5.1 (3.7) 2.5 Hourly wages (dollars)............................................................. $33.73 $36.11 $34.78 $34.85 $36.69 3.1 7.1 (3.7) 5.3 Productivity (dry pounds per hour)........................................... 634.9 684.4 640.6 651.4 583.7 0.9 7.8 (6.4) (10.4)Unit labor costs........................................................................ $0.05 $0.05 $0.05 $0.05 $0.06 2.2 (0.7) 2.9 17.5Net sales:
Quantity................................................................................. 494,304 490,011 477,276 125,566 124,835 (3.4) (0.9) (2.6) (0.6)Value..................................................................................... 348,542 330,015 296,677 79,007 74,980 (14.9) (5.3) (10.1) (5.1)Unit value.............................................................................. $0.71 $0.67 $0.62 $0.63 $0.60 (11.8) (4.5) (7.7) (4.5)
Cost of goods sold (COGS)..................................................... 287,388 257,834 253,689 64,295 66,243 (11.7) (10.3) (1.6) 3.0 Gross profit or (loss)................................................................ 61,154 72,181 42,988 14,712 8,737 (29.7) 18.0 (40.4) (40.6)SG&A expenses...................................................................... 20,217 18,004 21,122 3,940 5,619 4.5 (10.9) 17.3 42.6Operating income or (loss)....................................................... 40,937 54,177 21,866 10,772 3,118 (46.6) 32.3 (59.6) (71.1)Net income or (loss)................................................................. 38,103 49,572 18,411 9,874 92 (51.7) 30.1 (62.9) (99.1)Capital expenditures................................................................ *** *** *** *** *** *** *** *** ***Unit COGS............................................................................... $0.58 $0.53 $0.53 $0.51 $0.53 (8.6) (9.5) 1.0 3.6Unit SG&A expenses............................................................... $0.04 $0.04 $0.04 $0.03 $0.05 8.2 (10.2) 20.4 43.4Unit operating income or (loss)................................................ $0.08 $0.11 $0.05 $0.09 $0.02 (44.7) 33.5 (58.6) (70.9)Unit net income or (loss).......................................................... $0.08 $0.10 $0.04 $0.08 $0.001 (50.0) 31.2 (61.9) (99.1)COGS/sales (fn1).................................................................... 82.5 78.1 85.5 81.4 88.3 3.1 (4.3) 7.4 7.0Operating income or (loss)/sales (fn1)..................................... 11.7 16.4 7.4 13.6 4.2 (4.4) 4.7 (9.0) (9.5)Net income or (loss)/sales (fn1)............................................... 10.9 15.0 6.2 12.5 0.1 (4.7) 4.1 (8.8) (12.4)
Notes:
fn1.--Reported data are in percent and period changes are in percentage points.fn2.--Undefined.
C-3
Period changes
(Quantity=1,000 dry pounds; Value=1,000 dollars; Unit values, unit labor costs, and unit expenses=dollars per dry pound; Period changes=percent--exceptions noted)
Calendar year Calendar yearReported data
January to March
Source: Compiled from data submitted in response to Commission questionnaires, and from official import statistics with modifications based on proprietary Customs data for Canada using HTS statistical reporting numbers 2918.14.0000, 2918.15.1000, and 2918.15.5000

D-1
APPENDIX D
NONSUBJECT COUNTRY PRICE DATA


D-3
*** provided price data for imports of CACCS from Canada for products 1-4, upon Commission staff request.1 Price data reported by *** accounted for *** percent of *** U.S. commercial shipments from nonsubject sources in 2016. These price items and accompanying data are comparable to those presented in tables V-3 to V-6. Price and quantity data for Canada are shown in tables D-1 to D-4 and in figure D-1 to D-4 (with domestic and subject sources).
In comparing nonsubject country pricing data with U.S. producer pricing data, prices for product imported from Canada were lower than prices for U.S.-produced product in 19 instances and higher in 33 instances. In comparing nonsubject country pricing data with subject country pricing data, prices for CACCS imported from Canada were lower than prices for product imported from Belgium in all 51 instances, and from Colombia in 40 of 52 instances. Prices for CACCS imported from Canada were higher than prices of CACCS from Thailand in all 52 instances. A summary of price differentials is presented in table D-5.
Table D-1 CACCS: Weighted-average f.o.b. prices and quantities of imported product 1,1 by quarters, January 2014-March 2017
* * * * * * *
Table D-2 CACCS: Weighted-average f.o.b. prices and quantities of imported product 2,1 by quarters, January 2014-March 2017
* * * * * * *
Table D-3 CACCS: Weighted-average f.o.b. prices and quantities of imported product 3,1 by quarters, January 2014-March 2017
* * * * * * *
Table D-4 CACCS: Weighted-average f.o.b. prices and quantities of imported product 4,1 by quarters, January 2014-March 2017
* * * * * * *
Figure D-1 CACCS: Weighted-average f.o.b. prices and quantities of domestic and imported product 1,1 by quarters, January 2014-March 2017
* * * * * * *
1 See staff email with ***, June 28, 2017.
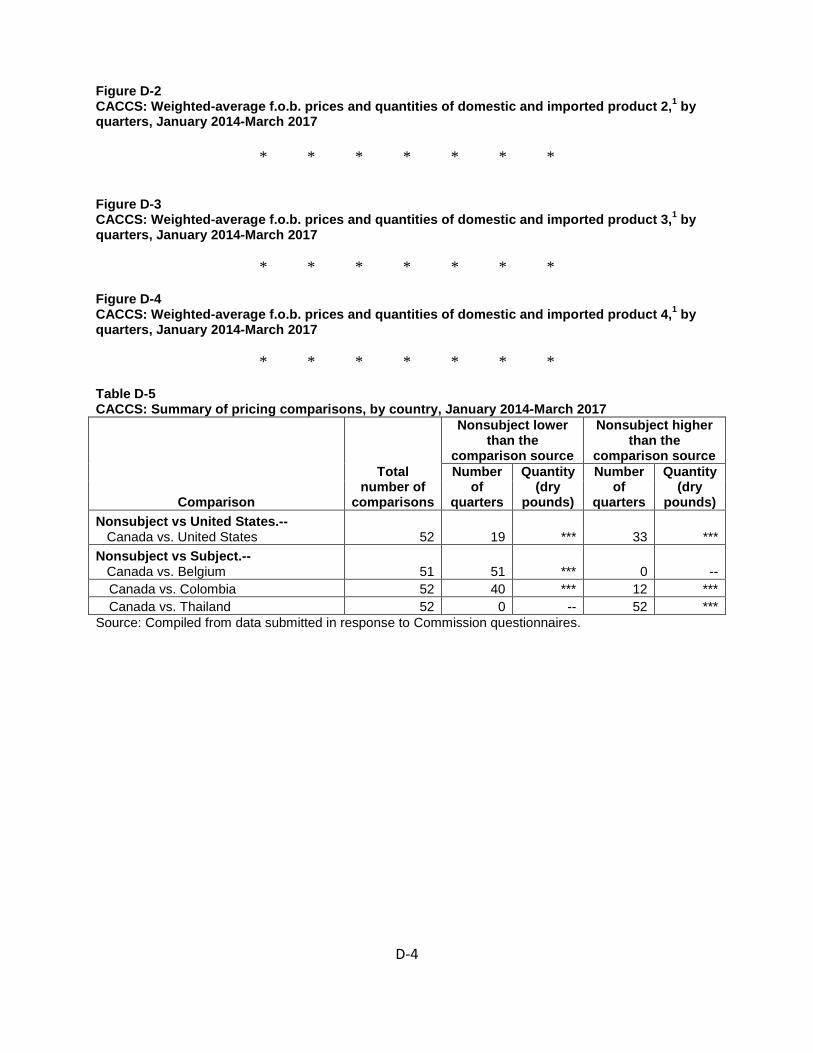
D-4
Figure D-2 CACCS: Weighted-average f.o.b. prices and quantities of domestic and imported product 2,1 by quarters, January 2014-March 2017
* * * * * * *
Figure D-3 CACCS: Weighted-average f.o.b. prices and quantities of domestic and imported product 3,1 by quarters, January 2014-March 2017
* * * * * * *
Figure D-4 CACCS: Weighted-average f.o.b. prices and quantities of domestic and imported product 4,1 by quarters, January 2014-March 2017
* * * * * * *
Table D-5 CACCS: Summary of pricing comparisons, by country, January 2014-March 2017
Comparison
Total number of
comparisons
Nonsubject lower than the
comparison source
Nonsubject higher than the
comparison source Number
of quarters
Quantity (dry
pounds)
Number of
quarters
Quantity (dry
pounds) Nonsubject vs United States.-- Canada vs. United States 52 19 *** 33 *** Nonsubject vs Subject.-- Canada vs. Belgium 51 51 *** 0 --
Canada vs. Colombia 52 40 *** 12 *** Canada vs. Thailand 52 0 -- 52 ***
Source: Compiled from data submitted in response to Commission questionnaires.