c:itoolswmstandf-journals3924291workingfolderrcej a 761834
TRANSCRIPT


66 Z. Guo
There are two urgent issues that need to be addressed of China’s current populationsituation. The first one is about the judgment on the current fertility level. From the 1990s,China’s population and birth control areas have lost the judgement of actual birth rate level.On the one hand, almost all national population censuses in nearly 20 years showed thatChina’s TFR was at a very low level. But these results were constantly challenged as beingcaused by serious omissions in birth reports so that TFR was adjusted to about 1.8 throughvarious kinds of indirect estimations. However, these indirect estimations are mostly flawedbecause there are technical mistakes in methodology and defective data results. They onlyreflect serious subjective prejudice lay by prior hypothesis. The second issue is the counter-measures that should be taken in response to the prospect of population development. Thefirst thing in this issue is at which level the fertility rate should be determined and for thenext 20 to 30 years. Such decision must be made on the basis of far-reaching prospectivestudy on China’s population over a longer period in the future. However, because of theprevious judgment of 1.8 fertility rate, which was widely believed but very unreliable, andout of the consideration to retain stability and avoid chaos in family planning work, somepeople assert that the 1.8 fertility rate should better be kept for another 20 or 30 years.
But as a matter of fact, the main population risk that confronts China now is no longerits rapid population growth but low fertility rate and the serious issues of too few childrenand over-aging caused by such low fertility rate. The task of reconsidering population situ-ation is not only highly important but also very emergent. China’s population developmenthas entered a critical moment. Any misjudgment and hesitation might ruin the opportunityof taking proper measures and endanger the long-term balanced development of China’spopulation.
The Sixth National Population Census (6th NPC) in 2012 revealed that China’s nationalTFR was only 1.18. This renewed its records in lowest fertility rate. Although there mightbe certain error in this statistical figure, it did set an alarm once again on China’s currenttoo low fertility rate and warned people that such a situation should not remain the sameanymore.
TFR is an important indicator in the research on current population situation and futuredevelopment trend. In the past 20 years, the TFRs in the majority of data from nationalpopulation surveys and censuses ranged between 1.3 and 1.5. However, competent gov-ernmental departments stick to the 1.8 TFR all the time so that the population plansformulated by the government, and most population forecasts, including the researcheson national population development strategy, are all based on the hypothesis of an approxi-mate 1.8 fertility rate. The 6th NPC’s population age structure provides the information onthe population development course in the past. With the simulative analysis on the basisof 6th NPC, it is possible that to expand the span of fertility rates comparison to the past20 years.1
Figure 1 provides the comparison of TFRs obtained from different sources. It can beseen that the TFRs simulated on the basis of the SNPC results remain at a lower levelbelow 1.5 for over a decade. In some years the fertility rate is lower than 1.4. In sum, theSNPC results confirm the very low fertility rates found in the nationwide surveys in thepast. So the standard of the 1.8 fertility rate that the competent governmental departmentshave insisted for a long period of time has seriously departed from the actual situation. Theresults of nationwide population and family planning survey in 2006, which shocked bothhigh and low ranking government officials and triggered a trend about the ‘reboundingfertility posing severe problem’, was in the end negated by the results in the populationsurveys in the same period and later, including the SNPC results. This development provedthe challenge and analytical conclusion on the results of this survey (Guo Zhigang 2009)

China Economic Journal 67
1.0
1.2
1.4
1.6
1.8
2.0
2.2
2.4
2.6
2.8
1990 1992 1994 1996 1998 2000 2002 2004 2006 2008 2010
NPFPC documented NSPD Med. Scenario
1997 NPFPC Survey 2001 NPFPC Survey
2006 NPFPC Survey NBS/EWC 2000 Census
NBS Yearly Survey* Simulated 2010 Census
Total
fertility
rate
Figure 1. Comparison between total fertility rates from 1990 to 2010.
that the abnormal results obtained in the survey in 2006 were caused by the severe biasesin the survey samples. As a matter of fact, we never see the huge rebound of fertility ratebut population aging that occurs earlier than expected. However, this seriously misleadingtrend has not yet been eliminated or corrected. It still has impact on various areas.
1.1. Data sources and explanations
(1) National Population and Family Planning Commission (NPFPC) documented: datapublished by the National Population and Family Planning Commission of People’sRepublic of China, from Handbook on Frequently-Used Data about Populationand Family Planning in China (2008), China Population Publishing House, 2009.
(2) National Strategy on Population Development (NSPD) Med. Scenario: the mediumscenario for China’s population strategy, from The Report on China’s NationalStrategy on Population Development, China Population Publishing House, 2007.
(3) 1997 NPFPC Survey: a survey in 1997 with calculations made by Guo Zhigang(2000) on the basis of the data from the nationwide population and reproductivehealth survey in 1997.
(4) 2001 NPFPC Survey: a survey in 2001 with calculations made by Ding Junfeng(2003) on the basis of the data from the national population and reproductive healthsurvey in 2001.
(5) 2006 NPFPC Survey: from Tabulations of the 2006 National Population andFamily Planning Survey, China Population Publishing House. Edited by ZhangWeiqing (2008).
(6) National Bureau of Statistics (NBS)/East and West Center (EWC) 2000 Census:estimations by NBS/EWC (2007) on the basis of the data from the nationalpopulation census in 2000.
(7) NBS Yearly Survey2: results from the surveys on population change in variousyears published by the NBS, see materials in the Department of Population andEmployment of the National Bureau of Statistics of the People’s Republic of China(1990–2010), including the results from the national population censuses and 1%population surveys.

68 Z. Guo
(8) Simulated 2010 Census: made for the SNPC, results obtained by Guo Zhigang(2011) through simulating the SNPC population structure on the basis of the datafrom the Fourth National Population Census.
Figure 1 also provides the estimations of the medium scenario on the TFR in the 1990smade by the national population development strategy research. It is almost the same asthe government-published standard level in the first half of the decade, but it becomesslightly lower in the second half. The estimation for the year 2000 is 1.68. In fact, theresearch specially recommended in its high scenario that the TFR should be estimated at1.77, which is basically similar to the official standard level of 1.8. It can be seen clearly inFigure 1 that the estimations show great departure from the actual survey results and theyare also negated by the results in the SNPC simulation.
When China’s low fertility rate is examined from a different angle, it still reveals theseriousness of the problem. In real life, women of and above 40 years old seldom give birthto children. So demographically, the average number of children born by women betweenthe ages of 35 and 39 in survey data are usually used to represent the birth number in thewhole life of these women. The figures for this statistical indicator obtained in the threenational population censuses in 1990, 2000 and 2010 are respectively 2.48, 1.85 and 1.52.They respcetively corresponds to a women cohort who were born from 1951 to 1955, from1961 to 1965 and from 1971 to 1975. This indicator reflects that the women’s lifetimefertility level had become significantly lower than replacement level (2.1) 10 years ago.At present it is lower than replacement level by 0.5 child. The TFR of 1.8 as shown in theSNPC seems different from the average number of children born by women between theages of 35 and 39 (1.52). But there is no disagreement between the two statistics. On thecontrary, they are highly consistent. The periodical indicator in SNPC shows the fertilitylevel of the current year while lifetime indicator reflects the accumulative fertility levelover many years. Under the circumstance that current fertility rate drops and marriage andchild-rearing ages constantly increase, periodical fertility rate should become significantlylower than the lifetime fertility rate shown by women who just end their fertility periodduring the same period.
Like the statistical results in previous population surveys, the SNPC results prove onceagain that previous population statistics have constantly failed to recognize the reality thatfertility rate is very low in China. There has been a serious prejudice of overestimatingbirth report omissions and fertility level in general so that relevant work has been trappedin a demographic statistical loophole for many years. This problem has severely misguidedthe formulation of population development strategies and hindered the timely adjustmentof fertility policies. Such repeated mistake should not be allowed to reoccur. People mustreconsider population situation and population development prospect. In fact, just like toohigh fertility rate problem, too low fertility rate will also cause huge risk to China’s pop-ulation development in the future. At present, the risk of too low fertility rate has alreadybecome the main risk in population development. But the entire society fails to achievesufficient understanding of this issue.
2. Birth number and population growth were overestimated and population agingwas underestimated in the past
The SNPC data also indicate that the serious mistake in estimating TFR also resulted inserious mistakes in total population growth and population age structure in populationprojecting and planning in the past.

China Economic Journal 69
Very serious biases emerged in the population projections in the recent two 5-yearpopulation plans formulated by competent government departments. In the population pro-jections of the Tenth Five Year Plan, the official standard of 1.8 TFR was adopted, whichwas far higher than all the statistical results in various surveys. In addition, the popula-tion base used in the forecast was a figure of the total population of 1.265 billion obtainedin the population census in 2000 plus about a 17 million adjustment number. This showsthat competent governmental departments did not trust the results in the Fifth NationalPopulation Census and further adjusted and increased the birth number in the 1990s. Theforecast in the population plan for the Tenth Five Year Plan showed that China’s total pop-ulation will reach 1.331 billion in 2005. However, the nationwide 1% population surveyin 2005 showed the result of the total population of 1.308 billion. The Tenth Five YearPlan required that population growth during the period should be no more than fifty sixmillion. In 2005, the actual total population was twenty three million less than the fore-cast in the plan. In comparison with the population forecast of 1.283 billion adjusted andcalculated on the basis of the population in the base period of the year 2000, the growthwas only 25 million. And in comparison with the total population of 1.265 billion in theFifth National Population Census, the growth was just 42 million. Such large biases occurin a forecast over only 5 years. This is reliable enough to prove that the population baseadjustment number and fertility rate parameter hypothesis have both deviated greatly fromthe reality.
In the population plan for the Eleventh Five Year Plan, the population base for the fore-cast was directly taken from the figure obtained in the nationwide 1% population samplingsurvey in 2005, while the fertility rate was set as in the past. The forecast was that totalpopulation would reach 1.360 billion in 2010. However, the total population published bythe 6th NPC was 1.340 billion. This indicates that the population projection in the EleventhFive Year Plan was higher by twenty million. The situation foretold by the population planof the Eleventh Five Year Plan that China’s population would grow by ten million each yeardid not occur at all. The actual average annual population growth was six million. So again,huge bias occurred between the projection in the plan and the actual situation. And this,once again, shows the problem of seriously overestimating the fertility rate in the past.
Due to the huge social influence of official standard, the deviation of overestimatingfertility rate was found generally in the majority of the population researches in previousyears. This in turn misled the understandings of the current population situation in Chinaand the development trend in the future. What is dangerous is that such a situation haslasted for many years and it dominates the mainstream in population research at present.It causes serious social influence and misleads the formulation of population developmentstrategy and the government’s population plans and polices. In fact, if we compare thepopulation statistics published in the Statistics Communiqués of the National Economicand Social Development of the People’s Republic of China in various years and the resultsof the majority of population forecasts with the results of the SNPC simulation, it canbe seen that the population statistics and those forecasts generally show overestimation ofbirth number and underestimation of population aging.
Figure 2 indicates that, in comparison with the SNPC results, the population birth num-bers in the statistical communiqués from 1994 to 2005 are all obviously higher than theactual situation. The problem is very serious with the numbers obtained from 1996 to 1999.The average overestimation is about four million, showing a percentage of deviation thatranges between 24% and 30%. According to the population age structure obtained from theSNPC, we calculated that the annual birth number has already dropped to sixteen millionsince 1996. In several years, the number became even lower than fifteen million. In some

70 Z. Guo
Births (million)
10
12
14
16
18
20
22
24
26
28
30
1990 1992 1994 1996 1998 2000 2002 2004 2006 2008 2010
Yearly Stat. Communiqué
NSPD Med. Scenario
Simulated 2010 Census
Pop. by Age 2000 Census
Figure 2. Comparison of birth numbers from 1990 to 2010.
years it was only about fourteen million. In Figure 2 only the birth number estimation inthe 1990s made by the national population development strategy researches with the mostauthoritative influence in recent years were taken as examples to reflect the common prob-lem in the previous population forecasts. Because the data of younger age population inthe Fifth National Population Census encountered strong challenge and doubt, the researchmust make an acceptable birth number estimation for the period of the 1990s before itstarts to make population projection. It can be seen from relevant curves in Figure 2 thatsets of estimations are roughly based on the statistical communiqués. It is only slightlyhigher in the first half of the decade and a bit lower in the second. Therefore, the problemwith this set of birth number estimations is still being seriously higher. At the same time,the population forecast which is on the basis of the set of estimations will definitely haveserious bias even before it starts to be calculated.
2.1. Data sources and explanations
(1) Yearly Statistical Communiqué: numbers published in statistical communiqué, thebirth numbers in the Statistical Communiqués on the National Economic andSocial Development of the People’s Republic of China.
(2) NSPD Med. Scenario: see The Report on China’s National Strategy on PopulationDevelopment, China Population Publishing House, 2007.
(3) Simulated 2010 Census: results from the 6th NPC simulation, birth numbers from1990 to 2010 calculated by Guo Zhigang on the basis of the SNPC popula-tion structure simulation (Population Census Office under the State Council andDepartment of Population and Employment Statistics of the National Bureau ofStatistics of China, 2011, 2012).
(4) Population by Age 2000 Census: populations of different ages in the Fifth NationalPopulation Census, Tabulation on the 2000 Population Census of the People’sRepublic of China, China Statistics Press, 2002.
Such a situation occurred frequently in previous population researches. It was ratherwidespread and there were few exceptions. This was caused by the strong influence ofthe widely rumored 30% omission in the birth report. In fact, many indirect population

China Economic Journal 71
estimations tried to prove that this high omission show obvious errors and defects. So sucha high report omission level was just a widely spread erroneous message. No conclusiveevidence was ever found nationwide. But because some competent governmental depart-ments adopted and communicated it, this wrong information eventually dominated publicopinion in the society. Because of this situation, many people were greatly surprised whenthe population of young children published in the 6th NPC showed a very low proportionof only 16.6%, a figure far lower than expected which revealed a serious issue of too fewchildren. This issue did not come up overnight. Figure 2 shows that such a trend startedto develop in earlier time and there were traces then. The only problem was that peoplerefused to believe it and built a population landscape very different from the reality on thebasis of some untruthful indirect estimations.
The above comparative study on the SNPC also indicates that the younger age popu-lation obtained in the Fifth National Population Census that was seriously doubted in thepast is in fact closer to the SNPC result although there are certain report omissions in it.Such a situation indicates that the radical cause of the confused situation in demographicstatistical work in the past was the problem of neither data quality nor technical method butthe problem of thought and awareness. People would rather believe in subjective judgmenton the basis of experience than the results from actual investigation. They adopted higherstatistical adjustment rather than a lower one and failed to make it on the basis of scientificevidence and sufficient examination so that serious over-adjustment occurred. Such over-adjustment was worse than no adjustment at all. It caused greater confusion and misled thejudgment on demographic situation and the formulation of the decisions in response.
Overestimation of fertility level and birth number will bring serious underestimation ofpopulation aging. Figure 3 provides the dynamic change of the proportion of the populationover 65 years old as reflected by the SNPC. This change is used to compare with relevantresults in the statistical communiqués in various years,3 with the results of the forecastmade by the National Population and Family Planning Commission of People’s Republicof China according to a TFR of 1.8 in 20014 and used as the basis of the population planof the Tenth Five Year Plan, and with the results of the forecast made in national popula-tion development strategy. Among these data, the results of the SNPC simulation reflect
Proportion old 65+ (%)
6.0
6.5
7.0
7.5
8.0
8.5
9.0
9.5
1995 1996 1997 1998 1999 2000 2001 2002 2003 2004 2005 2006 2007 2008 2009 2010
Simulated 2010 Census
Yearly Stat. Communiqué
Tenth Five Year Plan
NSPD Med. Scenario
Figure 3. Comparison between the proportions of senior-aged population over 65 years old from1990 to 2010.

72 Z. Guo
the even development of population aging in the past 20 years in a roughly linear pattern.In comparison with these results, the proportion of senior-aged population published inthe statistical communiqué in various years shows a pattern that it is closer to the SNPCsimulation results in the years on the two ends while it is obviously lower than them inthe years in the middle of the period. The statistical communiqués in recent years show atendency of acceleration in the increase of senior-aged population. But in fact, this shouldnot be interpreted as the natural result of population age structure because the results inthe SNPC simulation have already incorporated the influence of age structure and also theinfluence of the increase in life expectancy and such results describe a population processwith better consistency. Therefore, the recent acceleration of the increase in the propor-tion of senior-aged proportion in statistical communiqués might indicate that the statisticaldepartments in the government have realized that there were deviations in their previousstatistics and started to make conscious adjustments.
2.2. Data sources
(1) Simulated 2010 Census: results in the SNPC simulation, namely the birth numberfrom 1990 to 2010 in the SNPC population structure simulation made by GuoZhigang (2011).
(2) Yearly Stat. Communiqué: figures published in the statistical communiqués,namely birth numbers in the Statistics Communiqués of the National Economicand Social Development of the People’s Republic of China in various years.
(3) Tenth Five Year Plan: population plan for the Tenth Five Year Plan from theHandbook on Frequently-Used Data about Population and Family Planning inChina (2002) (for internal use) compiled by the National Population and FamilyPlanning Commission of People’s Republic of China.
(4) NSPD Med. Scenario: from The Report on China’s National Strategy onPopulation Development, China Population Publishing House, 2007.
Note: The curve about the statistical communiqués includes the statistics in the nationalpopulation censuses or the nationwide 1% population sampling survey. Besides, as theSNPC simulation is made with the proportion of senior-aged population taken at the endof each year, the results in the simulation in 2010 is slightly higher than that in the actualSNPC (carried out on 1 November 2010).
Comparing with the results in SNPC simulation, the forecast made during the for-mulation of the population plan for the Tenth Five Year Plan in 2001 underestimated thedevelopment trend of the proportion of senior-aged population and the degree of under-estimation became larger and larger later. Although the population forecast made by thenational population development strategy research was completed the latest, the deviationin the proportion of senior-aged population was even larger than the forecast made beforeit. Such problem was in fact caused by the over-adjustment to the underage population inthe year 2000, namely the forecast base period. The proportions of senior-aged popula-tion in these two population forecasts had a difference of about one percentage point fromthe actual situation within only several years. So the deviation will cause more seriousunderestimation in describing the population aging in the future.
The comparison clearly shows that the overestimation of birth number and over-adjustment to statistics in the past caused serious underestimation to and covered up thetrue level of population aging. In fact, the ‘birth number’, which was speculated to be therein the adjustment but actually did not exist, statistically ‘eased’ population aging.

China Economic Journal 73
3. The proper fertility rate in the future must be re-studied carefully
We know that, if a TFR of 2.1 retains over a long period of time, the population will finallystabilize without any increase or decrease. That is to say, the 2.1 TFR is the replacementlevel of population development. Besides, this demographic principle tells that the replace-ment level fertility is the condition for population to achieve long-term balance. However,people might not understand clearly what the population prospects will be in the futureif a low fertility level retains for a long period of time. According to the calculation andanalysis on the basis of the stable population principle (Guo Zhigang 2010), if a TFR of1.8 is retained over long period, the stable population formed in the future will decrease ata rate of half size in every 117 years. In fact, these two calculation results already show thatit is not a good choice in population strategy to stabilize fertility rate at a low level of 1.8.Calculation also indicates that, if TFR is kept at 1.5 over a long period of time, populationwill be halved in every 54 years. This means that, although the difference of 0.3 in fertil-ity rate looks small, it is like a millimeter move at the muzzle and the consequence to thepopulation will be like a bullet that hit a place far from the target. Thirty years ago, somescholars suggested that China’s proper population size should be 0.7–0.8 billion. Becausethe main population issue that China confronted in the past was to control the increase inpopulation size. Such an outlook that pursued population reduction and belief that the lesspopulation the better were extensively publicized. But as a matter of fact, the academiaof demography in China has been holding great controversy against this idea and there isalways criticism that such strategic pursuit only focuses on the quantity of population andoverlooked population structure and relevant social factors. When it is examined today, thepursuit also overlooked historical factors. China does have a big population. But it is aproblem that develops over several centuries and it has not been produced out of people’swill. Besides, this problem of a big population cannot be resolved in one generation or sev-eral generations. It can only be resolved gradually in history. The attempt to resolve it atone fell swoop is equivalent to launching a boastful and unrealistic ‘Great Leap-Forward’in population issue. The mindset about population development strategy is in fact moreimportant during a period of low fertility rate. Biased thinking on this issue will producemore direction jeopardy and loss. In recent years, some people suggested that one childpolicy should be implemented in both the countryside and urban areas throughout Chinawithout distinction. This suggestion was underlain by the 1.0 TFR. The intrinsic populationtrend of such a fertility rate is that the population will be halved every in 20 years or so.This is a utopian idea that disregards the principles of population development, of socialdevelopment and of historical development. It will do harm to both the country and thepeople and it is very dangerous. So the issues such as how to practically reflect the actualcurrent fertility rate and to properly decide fertility rate in the future are not just commonacademic issues anymore. They are important issues in strategic decision that concerns thefuture of the nation.
The calculation and analysis in theory based on stable population principle withoutconsidering the impact of current population structure would not be population forecastsin the real sense. This type of analysis would not specifically reveal the population devel-opment process in China for several decades in the future either. But it does reveal thelong-term population trend and pattern under different fertility rates. It sets up the refer-entil standard to formulate long-term population strategic decision. When the view thatadvocates retaining a low fertility rate of 1.8 for 20–30 years more5 is re-examined underthis framework, people can easily find the problems with it. First, the results of the aboveanalysis on the 1.8 fertility rate already show that it will result in fast reduction in popula-tion. Second, retaining such a low fertility rate for 20–30 years more, which surpasses the

74 Z. Guo
generational interval, will cause great impact to the development course of China’s popu-lation. Third, the 6th NPC data show that the actual fertility rate of China in the past was farlower than 1.8 and such a situation lasted for nearly 20 years. It fails to reveal what prob-lems such a low fertility rate would bring about if it is retained for a long period. Fourth,the policy suggestions proposed after 6th NPC are still to control total population size andto avoid the birth peaks caused by adjusting fertility policy. It fails to consider that whatChina is facing now is the issues of too few children and over-population-aging tendency.Even though it takes some elements of the issues into consideration, it fails to exhibit abroader view in this respect by considering a period that only extends to the middle of thetwenty-first century. However, the basic characteristic of China’s population structure isthat there have been three major birth peaks from 1950 to 1990. The average annual birthnumber in this period was more than twenty million. Among them, the elder generationshave just entered senior age and the main part of them will enter senior age successivelyin 40 years in the future. This determines that the most challenging period of China’spopulation aging will be after 2050. So the population development strategy research inChina must extend its view to cover the entire twenty-first century. Because of the rea-sons above, China’s strategic decisions on population development must be re-studied andre-formulated carefully.
In fact, there has been no single serious study or discussion succeeded in suggest-ing retaining a 1.8 fertility rate a better population development strategy. There is onlya simple description that such a target fertility rate will guarantee the goal proposed atthe Sixteenth CPC National Congress that the GDP doubles by 2020 and GDP per capitareaches USD 3000, and that such a target fertility rate will ensure China’s total populationin the future not exceeding 1.5 billion before drops slowly. So such a target fertility rate isneither high nor low. Now these results have already been nailed down as inevitable out-come, so retaining the 1.8 fertility rate is not the reason to attain them anymore. As it hasbeen announced in the 2008 Statistical Communiqué of the People’s Republic of China onthe 2007 National Economic and Social Development published by the National Bureau ofStatistics in China, China achieved the goal of USD 3000 GDP per capita in 2008. In addi-tion to the reason that the high-speed growth of the economy has gone beyond expectation,another reason for the achievement of this economic goal is that population growth rateis far lower than the forecast in the past, namely that the actual birth number and fertil-ity rate level are far lower than the judgments in the past. This proves the seriousness ofthe problem, namely the population development in the past has gone through an actualprocess of extremely low fertility rate under a nominal fertility rate of 1.8. If people stillbelieve that such a situation should better continue longer, it will only cause larger damageto long-term balanced development of China’s population. This will indiscreetly put thecountry’s development, the nation’s rejuvenation and the society’s harmony under hugepopulation risk. Calculated and examined on the basis of the SNPC results, there is verysmall risk that China’s total population exceeds its proper limit in the future while the risksof over-population-aging and over-negative-population-growth in the future are increas-ing rapidly. This is because, on the one hand, the SNPC population age structure showsthat the issues of too few children and population aging developed beyond expectationin the past while, on the other hand, large amount of surveys indicate that people havelower and lower intention to have children. There are even traces of obvious increase inthe proportion of people who do not want to have any children. Therefore, to effectivelyincrease a very low fertility rate might not be as easy as some people have imagined.The actual situation is that, on the one hand, competent government departments onlyhave focused on strictly controlling high fertility rate and had almost no experience in

China Economic Journal 75
raising fertility rate while, on the other hand, other countries that are facing low fertil-ity in the international community all have failed wretchedly in their efforts in this respect.Nonetheless, we can still assume that fertility rate ‘can’ be raised effectively as some peoplehave wished. Then we can examine on the basis of the population simulation and forecastbased on the 6th NPC population age structure what population consequences will be pro-duced under different fertility rate when the impact of actual population structure taken intoaccount.
On the basis of the SNPC population structure simulation, comparison is made on theprojection and simulation results on four different assumed fertility rate scenarios in thefuture. For the population projections, the progressive fertility rate model by age, estab-lished by Chinese scholars Ma Yingtong et al. (1985), is adopted. The advantage of thismethod is that it overcomes the important defect in regular fertility rate model by age thatthe regular model cannot control the influence of fertile women’s parity structure. First, theadoption of this progressive fertility model can more relevantly reflect the characteristicsof the fertile women parity structure in China formed under the implementation of familyplanning policy over many years. For example, there are a huge proportion of women inChina who only have one child. Second, the parameter of total progressive second-childfertility rate is raised in the projection so as to reflect the increase of the proportion ofwomen who continue to give birth to their second child among the fertile women who haveone child currently. Then, the result on regular fertility rate by age is obtained on the basisof the annual forecast of the number of fertile women by age and the number of womenamong them who have given birth to children. The fertility scenarios discussed here aredivided according to the results on regular fertility rate. Among them, the three scenarios,respectively named as high, medium and low scenarios, are all built on the assumption thatthe current too low fertility rate be raised to a new level within several years from 2012 andretained over a long period.
In the low scenario, the TFR will be raised to 1.60. This reflects the continuation ofretaining very low fertility rate over a long period of time under the nominal fertility rateof 1.8. It roughly reflects effects of some minor adjustments to fertility policies.
In the medium scenario, the TFR will be raised to 1.77. This reflects that people haverealized that the actual fertility rate was already too low and intended to raise it to around1.8 quickly and effectively. But they still believed that the 1.8 fertility rate should better bestuck to over a long period of time.
In the high scenario, the current TFR will be raised to 1.94. This reflects the total aban-donment of the two 1.8 fertility rate standards. The two children policy will be implementedto effectively raise fertility rate to or get close to replacement level.
In the fourth scenario (named as ‘VL→High 2035’), the current low fertility level willbe retained. From 2035, the fertility rate will be gradually raised to 1.94 and retained fromthen on. This reflects that the two 1.8 fertility rate standards will remain unchanged andcontinue to be implemented under the actual extremely low fertility rate.
As it is discussed in the above, we are still not sure if fertility rate can be effectivelyraised when fertility policy adjustment is in place. Therefore, these four forecast and sim-ulation scenarios are only provided for reference under the condition that this assumedfertility rate raise can be achieved. However, the results of these four simulations are dif-ferent from the consequences caused by different fertility rates calculated and analyzedaccording to the stable population principle as the above. This is because these simulationresults reflect the impact of China’s current population structure. And these structures willhave great impacts on China’s population development course in the future. At the sametime, these simulation results can better reflect the population development process itself

76 Z. Guo
Population (mil.)
800
900
1000
1100
1200
1300
1400
1500
1600
2010 2020 2030 2040 2050 2060 2070 2080 2090 2100
High scenario Med. scenario
Low scenario VL → High 2035
2030, 1493
2029, 1454
2026, 1423
1287
1047
845
2023, 1397
989
Figure 4. Comparison between the scenarios in total population sizes from 2010 to 2100.
under different fertility rates. This is different from the calculation and analysis based onstable population principle that can only reflect the final results of retaining certain fertilityrates for a very long period of time.
The results in the total population forecast in Figure 4 indicate that the population peakin the high scenario will reach 1.493 billion in 2030. And this size of population will retainfor a relatively long period of time. However, population will inevitably turn to reductionso that China’s total population will be less than 1.3 billion by the end of the twenty-firstcentury. The population peak in the medium scenario will reach 1.454 billion in 2029.Then population will turn to reduction so that China’s total population will be less than1.05 billion by the end of the twenty-first century. The population peak in the low scenariowill reach 1.423 billion in 2026. The population will quickly turn into reduction so thatChina’s total population will be only 0.85 billion by the end of the twenty-first century.The results of these scenarios all indicate that, as long as the fertility rate is retained underreplacement level, China’s total population will turn to reduction inevitably before themiddle of the twenty-first century. However, different choices in fertility rate will makeChina’s total population size by the end of the twenty-first century fall in a range between0.85 billion and 1.3 billion. The number are greatly different because these results representthe different intentions to consciously pursue too quick reduction of population and to tryto avoid this situation as much as possible.
In the fourth scenario, the raise of fertility rate is delayed. Its results look good in termsof the indicator of total population. Because the raise of fertility rate is postponed for30 years so that the size of total population is kept at a notably low level early in the periodand that later it falls between the results of the medium and low scenarios. When examinedfrom the pace of the progressive population decrease, its results will fall between the highand medium scenarios. Maybe a total population landscape like this did inspire the policysuggestion that relatively low fertility rate should be retained for 30 years more. However,such a plan will cause huge cost in other respects behind the superficial benefit it willbring to total population size.
Figure 5 provides the simulation results on the proportions of the senior-aged popula-tion over 65 years old in various scenarios. The basic characteristic of the results is thatthe general tendency of population aging in the future is irreversible. At present, Chinahas just entered the beginning period of the aging society. The most serious situation of

China Economic Journal 77
Proportion old (65+)
5%
10%
15%
20%
25%
30%
35%
2010 2020 2030 2040 2050 2060 2070 2080 2090 2100
High scenario Med. scenario
Low scenario VL → High 2035
2060, 32.32%
2060, 29.87%
2059, 27.52%
2091, 33.18%
2091, 30.00%
2091, 27.45%
Figure 5. Comparison between the scenarios in the proportions of senior-aged population over65 years old from 2010 to 2100.
population aging will occur at around 2060. After it reaches its peak, this situation willretain a very high level with only a number of fluctuations at the most. Therefore, differentfrom the indicator of total population, the expression ‘peak period’ can hardly be used todescribe the indicator of senior-aged population proportion in the high, medium and lowscenarios. This situation is in fact determined by the current population age structure or,in other words, by China’s population development process in the past. The populationborn in a series of baby booms during the four decades from 1950 to 1990 is now basicallystill in the stage of working age. The earliest groups among them are just about to entersenior age. The majority of the population will enter senior age successively in 40 years inthe future. Therefore, this determines that the burden of senior-aged population will see astage of quick expansion in the following 40 years. This is a new characteristic in a newperiod of China’s population development. It is also the most important one among all thepriorities that must be addressed in population decisions in the future. People will makehistorical mistakes if they overlook this situation.
Figure 5 also indicates the lower the fertility rate, the higher the degrees of aging.This reveals that the decisions on whether to make adjustment to fertility polices or not,to what extent such adjustment should be made and when such adjustment will be madewill result in greatly different proportions of senior-aged population. It must be pointedout particularly that the difference between the results of the high and low scenarios offertility rate is not just two percentage points as some demographers have asserted. Thehigh scenario here sets an assumed fertility rate far lower than replacement level and that inlow scenario is already notably higher than the actual fertility rate. So although the high andlow scenarios have both assumed that fertility level can be raised within the recent period,the difference in their fertility rates has already resulted in five percentage points differencebetween the maximums of the senior-aged population proportion after the middle of thetwenty-first century (respectively 27.5% and 32.3%). The reason that these demographersstill believe that the raise of fertility rate will do nothing to population aging might be verylikely because they are still making population forecast on the basis on the assumed fertilityrate of 1.8. Therefore, the difference that they have seen is only the difference between thehigh and medium scenarios in Figure 5 so that they severely underestimate the seriousnessof population aging in the future.

78 Z. Guo
Any complete description of China population aging prospect should at least includetwo sentences: whether the fertility rate rises or not, the general tendency of populationaging cannot be reversed. And whether the fertility rate can be raised will determine thedifference in degrees of population aging in China in the future. Therefore, if people par-tially stress the first sentence and neglect or weaken the second sentence, they will createan impression that population aging cannot be alleviated or it is not worth any efforts toalleviate. And such an impression will naturally seriously misguide governmental decisionand social public opinion. When judging whether a difference of two or five percentagepoints in the proportion of senior-aged population is big enough, people should first befully aware that the indicator only has 100% for grading. At present, China has entered anaging society, but the proportion of senior-aged population over 65 years old is only 10%.The difference in degree here is the difference when China enters the severe stage of pop-ulation aging (above 25%). This is of very special meaning. Of course, the true problemdoes not lie in which percentage point will become the last straw that collapses the camel’sback but whether the quicker reduction of population size in the future deserves the priceof a more serious problem of the population issues of too few children and over-aging.
Because, in the scenario of delaying the raise of fertility rate, the current low fertilityrate of less than 1.5 as revealed in the SNPC will be retained before the scheduled raiseof fertility rate, the proportion of senior-aged population in this scenario was even slightlyhigher than that in the low fertility scenario in the first half of the twenty-first century.Notably, this scenario displays an obvious dropping tendency different from other scenariosin the second half of the twenty-first century. However, this does not mean that the approachof raising fertility rate 30 years later would have any magical power to ease populationaging. Because the extremely low fertility rate that will be retained first will result in veryhigh over-aging in the middle of the twenty-first century, and then the raise of fertility ratewill alleviate the already very high over-aging situation. In fact, according to the stablepopulation theory, this scenario of later fertility rate raise will result in an aging levelcompletely the same as that in a high scenario in long-term future. So this scenario onlyhas the benefit of reducing total population size and it has no good in lowering over-aging.
Figure 6 reveals what a situation that a scenario of raising fertility rate 30 years laterwould bring about. The total dependency ratio before 2035 will be really the lowest in
Total dependency ratio
2088, 76.92056, 78.8
2088, 79.0
2088, 82.8
2059, 80.4
2058, 84.3
30
40
50
60
70
80
90
2010 2020 2030 2040 2050 2060 2070 2080 2090 2100
High scenario Med. scenario
Low scenario VL → High 2035
Figure 6. Comparison between the scenarios in overall dependency ratio of the population from2010 to 2100.
China Economic Journal 79
this scenario. However, because birth number will increase at a period of worsening over-aging, the growths on the two ends will push the total dependency ratio to a shockinglyhigh level. In recent years, population research and publicity partially over-exaggerated theseriousness of the problem of ‘two heavy ends’ in the early stage in the raise of fertilityrate. But in fact, to increase birth number as early as possible is to supply fresh forces inthe future to ease more serious over-aging. If the increase of birth number is delayed to2035, the new born population in this increase will be underage population before 2050.They will not ease the over-aging at that time but increase social burden. Therefore, thescenario of raising fertility rate later will in fact miss the right time and opportunity andcause a situation that the resources to be ripe in the future cannot be used to resolve thepressing issue at present. Figure 6 shows that the total dependency ratio in the scenario istoo high during the period from 2040 to 2080. Therefore, the scenario of delaying the raiseof fertility rate is totally inadvisable.
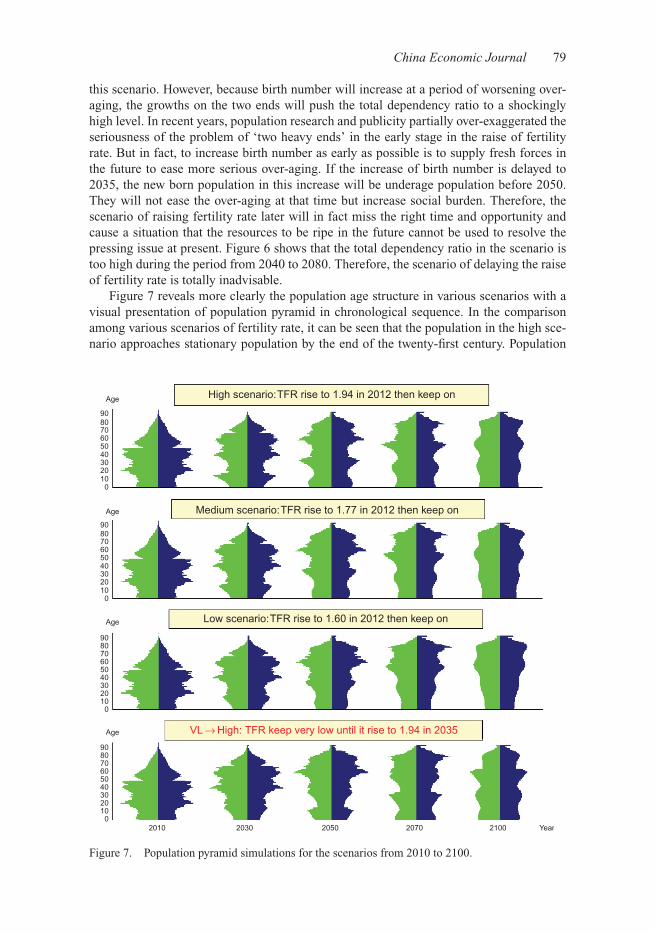
Figure 7 reveals more clearly the population age structure in various scenarios with avisual presentation of population pyramid in chronological sequence. In the comparisonamong various scenarios of fertility rate, it can be seen that the population in the high sce-nario approaches stationary population by the end of the twenty-first century. Population
90
AgeHigh scenario: TFR rise to 1.94 in 2012 then keep on
Medium scenario: TFR rise to 1.77 in 2012 then keep on
Low scenario: TFR rise to 1.60 in 2012 then keep on
VL → High: TFR keep very low until it rise to 1.94 in 2035
Age
Age
Age
8070605040302010
0
908070605040302010
0
908070605040302010
0
908070605040302010
02010 2030 2050 2070 2100 Year
Figure 7. Population pyramid simulations for the scenarios from 2010 to 2100.

80 Z. Guo
quantity and structure only show small changes in this case. And in medium and low sce-narios, because fertility rate is kept far lower than replacement level over a long periodof time, the population in these scenarios is closer to reductively stable population by theend of the twenty-first century. Namely, they will not end population change but leave thetask of raising fertility rate to replacement level to the further future. The similarity in thehigh, medium and low scenarios is that they all raise fertility rate more or less as earlyas possible. So the new born population during a dozen years will start to enter workingage by 2030 and there will be more working age population in 2050 when population agingbecomes very serious. In comparison, no action is taken by 2030 in the scenario of delayingthe raise of fertility rate so that the new born population will still be underage populationin 2050 and thus the total dependency ratio will be exceptionally high in the middle of thetwenty-first century, which means that there will be a serious ‘two heavy ends’ problem.
The scenarios that raise fertility rate as early as possible not only provide more laborforce for the social and economic operations in the future but also provide more fer-tile women to the population reproduction in the future. Figure 7 indicates that the high,medium and low scenarios all form a large or small rise at the bottom of the populationpyramid in 2030. In fact, it is because they employ the fertility potential of fertile womenin the population pyramid in 2010 at different degrees under the current extremely lowfertility rate. This ‘turns around’ more or less the population tendency of too few childrenthat has already lasted for 20 years. However, the scenario of delaying the raise of fertilityrate regards such ‘turnaround’ as a ‘birth peak’ unfavorable to population development inthe future and tries to avoid it, and eventually miss the best opportunity to adjust fertilityrate. When the moment of the best timing for adjusting fertility rate arrives, the populationof fertile women will have already dropped to a terribly low level. What’s more, anotherheavy burden of the rising proportion of underage population will have to be shouldered inthe subsequent period of severe over-aging. In the comparison of the population pyramidsof these four scenarios in 2050, we find that there is smaller working force to shoulderthe burden of the ‘two heavy ends’ situation. This is the huge cost of delaying the raise offertility rate by 30 years. Similarly, the scenarios of delaying the raise of fertility rate by20 or 10 years are of the same problem. The only difference is to what extent.
In sum, the ‘two heavy ends problem’ in population burden is inherent to the populationchange caused by emergency-brake family planning policy and very strict fertility policy.It is unavoidable. If people still hesitate to make relevant adjustment for the reason of ahuge population today when China’s population has entered a stage of low fertility rate for20 years, there will be population over-control and the family planning policy will end upfar from its original goal. The above population forecast and analysis indicate that delayingthe raise of fertility rate to replacement level will not truly avoid the problem of ‘two heavyends’ population burden. It only postpones the population burden into the future so that theproblem of China’s population over-aging will continue to deteriorate when it is already inits worst situation. And what it pays is only a superficial benefit in total population size inthe first half of the twenty-first century and in the quantity and proportion of senior-agedpopulation in the second half. Such countermeasure suggestion is unfavorable for China’spopulation to turn to long-term balanced development.
It needs to be reiterated that the population forecasts in the present study are all madeunder the premise that ‘fertility rate can be effectively raised once it is necessary’. Butmany relevant studies at present already reveal that the ideal number of children in pub-lic opinion is far lower than replacement level. A large number of couples who meet theconditions for having a second child voluntarily give up their opportunity of birthing thesecond child. There is also a rise in proportion of couples who want no child. Therefore,

China Economic Journal 81
Births (mil.)
5
10
15
20
25
30
2010 2020 2030 2040 2050 2060 2070 2080 2090 2100
High scenario Med. scenario
Low scenario VL → High 2035
Figure 8. Birth number simulation for the scenarios from 2010 to 2100.
the above hypothesis might depart from the reality even at present, let alone in the situationwhen a very low fertility rate is retained for 30 years more.
Nevertheless, the results of birth number forecast in Figure 8 can still provide someuseful information. Due to the requirement of a strict fertility policy, there is a large pop-ulation of fertile women with only one child at present. In the figure, the high, mediumand low scenarios start to raise fertility rate gradually in 2012. Although the second birthprogressive proportion in these scenarios will all be obviously lower than 100%, the influ-ence of fertile women’s parity structure will result in conspicuous birth heaping. And suchbirth heaping will form an ‘echo’ of certain magnitude between generations. So it is alsoan important special research subject that proper measures should be adopted to controlthe process when fertility rate is raised so as to level peaks and valleys and avoid the hugerises and falls in birth number. But it is not the subject in the present article. In fact, nearlytwenty demographic scholars jointly signed in 2004 on a suggestion for adjusting fertilitypolicy. They also proposed specific countermeasures for this issue such as ‘to implementby population category’ on the basis of personal conditions and ‘to gradually lift familyplanning policy in different regions’. With these measures, birth heaping can be effectivelyleveled when fertility policy is being adjusted (Research Group of the Study of China’sFertility Policy in the 21st Century 2010).
It needs to be pointed out that the main purpose of leveling birth heaping is to keepthe birth number in different years in a relatively even pattern rather than to reduce thetotal birth number in the entire period. In other words, it aims to keep balanced popula-tion structure rather than to reduce peak population. So this practice is a specific tacticsubordinate to the general strategy to resolve too low fertility rate and over-aging. The sce-nario of delaying the raise of fertility rate in Figure 8 reflects a totally different strategicpurpose. It follows the strategy that the smaller birth number the better, and the smallerthe total population the better. In fact, it wants to stop the fertile couples that have onlyone child at present to have another child. As discussed above, this scenario completelyoverlooks that the main risk in China’s population development at present which are toolow fertility rate and the population issues of too few child and over-aging caused by suchlow fertility. The birth number that this scenario tries to prevent is in fact the populationthat China depends on in the future to cope with over-aging and turn to balanced popu-lation development. Besides, this scenario will cause even bigger number and proportion

82 Z. Guo
of senior-aged families with only one child in China’s aging process in the future. It canalso be seen from the figure that this scenario cannot automatically avoid the problems ofbirth heaping and fluctuation in the future. Further measures are necessary under such ascenario. This indicates that the radical cause of the occurrence of birth heaping duringfertility rate adjustment is the problem that the proportion of fertile women with only onechild is too large among all the fertile women. It is not one of timing adjustment. In sum, toraise fertility rate as early as possible or to continue to retain very low fertility rate reflectsthe argument on basic outlooks and evaluation criteria in population development.
4. Current judgment and decision on population will determine how to respond toover-aging issue in the future
Actual survey data have already revealed for many times that birth number level and fer-tility level were seriously overestimated, that population forecast in the past obviouslyunderestimated the process of population aging in China, and the goals in population devel-opment plan failed to be achieved repeatedly by large gaps. Out of habitual way of thinking,these gaps were covered up as birth report omissions. People failed to make careful and in-depth study on new phenomena and issues in a new period. They even failed to correctthose mistakes that already looked rather obvious. The SNPC data proved once again thatthe fertility rate was too low over a long period of time and revealed the aggravation ofthe population issues of too few children and over-aging. Besides, the SNPC data werealso an important test of results in previous population research. They can fully reflect theproblems present in the population researches in the past.
The real serious problem in the deviated situation of the population researches in thepast does not lie in that their estimations have larger biases, but these biases mislead indevelopment direction. They fail to timely reveal the main conflict and task in popula-tion development in the future so that people can timely formulate decisions to correctlyrespond to and solve these conflicts. In fact, people delay in solving these problems con-sciously or unconsciously so that the conflicts continue to worsen. The present study revealson the basis of the SNPC population forecast and simulation that, as long as fertility ratedoes not exceed replacement level in the future, China’s total population size will be ina dropping course in the future. China’s population will reduce by several hundred mil-lion within the twenty-first century. However, population over-aging will become a seriousproblem in the future. The proportion of senior-aged population and the total dependencyratio in China’s population will become unprecedented in human history. Therefore, themain conflict in China’s population in the twenty-first century has already turned fromthe problem of total population size to the problem of population age structure. AlthoughChina has just entered aging society, people already start to feel the impact and they willhave deeper and deeper feelings to this major change. This situation will not change atpeople’s will. Population development always shows the characteristics of long periods andlarge momentum. We must become aware as early as possible of the changes in differentstages of population development, of the changes in the main conflicts in population issuesdetermined by those changes and also of the changes of the goals and tasks of populationwork.
China’s population has entered lower fertility rate for a period of 20 years. The confu-sion about fertility rate has also lasted for nearly 20 years. China’s population developmentis now at a very critical moment. The drastic fertility decline in the past results in a veryabnormal population age structure in China. The rapid population aging must be addressedearnestly and practically so that China’s population can turn to a sustainable and balanced

China Economic Journal 83
development path. It must be pointed out that because people are confined by the biasesin the publicity of population theory and the estimation and forecast of population in thepast, they have failed to achieve a clear understanding on the above-mentioned importantpopulation change. The right timing and opportunity has been missed because people failto make the correct response and take proper countermeasure. This will result in the pop-ulation issues of excessive too few children and over-aging in the future and endangerChina’s long-term balanced population development and the continuous social and eco-nomic development, and also the rejuvenation of the Chinese nation. The results of theforecast and simulation in various scenarios made on the basis of the SNPC data can provethat to change old population outlook as quickly as possible and to formulate effectivedecisions to raise fertility rate are the key to respond to population over-aging. If we con-tinue to overlook this true population risk of over-aging and take an attitude of inactivityor a wrong countermeasure to aggravate this population conflict, historical mistakes wouldoccur.
China’s current population problem is a historical issue. However, whether China canhandle its population issue well in the future, particularly the issue of population aging,depends on the judgments and decisions made at present.
Notes1. This simulation was completed before the publishing of all the SNPC data. The SNPC population
structure was estimated on the basis of the published population pyramid. See Guo Zhigang(2011) for technical details.
2. This series includes yearly survey data and also some other statistics from population census aswell as the 1% sampling surveys.
3. The Statistical Communiqués of the National Economic and Social Development of the People’sRepublic of China started to provide information on the proportion of senior-aged populationover 65 years old from 1995 and that on the proportion of senior-aged population over 60 yearsold from 2006.
4. There are no content about population aging and no population forecast data in this respect foundin the text of the population plan for the Eleventh Five Year Plan.
5. CNSPD Research Group (2007).
ReferencesCNSPD Research Group. 2007. The general report on China’s national strategy on population
development. Beijing: China Population.Department of Population (and Employment) Statistics of National Bureau of Statistics. 1990–2010
(each year). China population (and employment) statistics yearbook. Beijing: China StatisticsPress.
Ding, J. 2003. Analysis about the impact of changes in fertility pattern on fertility level for Chinabetween 1991∼2000 [in Chinese]. Population Research 2: 55–60.
Guo, Z. 2000. Lifetime fertility of Chinese women: A look at their fertility behavior in recent years.Population Research 1: 7–18.
Guo, Z. 2009. How the notable “pick-up” of the fertility-rates in recent years comes into being:An evaluation on the 2006 national population and family planning survey. Chinese Journal ofPopulation Science 2: 2–15.
Guo, Z. 2010. China’s low fertility rate and its neglected demographic risk. International EconomicReview 6: 112–26.
Guo, Z. 2011. The sixth population census data indicates serious mistakes in past populationestimation and projection. Chinese Journal of Population Science 6: 2–13.
National Bureau of Statistics of China and East-West Centre. 2007. Fertility estimates for provincesof China: 1975–2000. Beijing: China Statistical Press.

84 Z. Guo
National Population and Family Planning Commission & China Population and DevelopmentResearch Center. 2009. Handbook on population and family planning data (2008). Beijing:China Population.
National Population and Family Planning Commission of People’s Republic of China. 2006a.The plan on the development of national population and family planning undertakings forthe Eleventh Five Year Plan. http://www.chinapop.gov.cn/ghjh/sygh/200807/t20080703_157294.html (accessed January 3, 2013).
National Population and Family Planning Commission of People’s Republic of China. 2006b.The plan on the development of National population and family planning undertakingsfor the Tenth Five Year Plan. http://www.clner.com/Html/zhanlueyuzhengce/zhanlueguihua/zhuanxiangguihua/7078495133849.html (accessed January 3, 2013).
Population Census Office under the State Council and Department of Population and EmploymentStatistics of the National Bureau of Statistics of China. 2011. Major figures on 2010 populationcensus of China. Beijing: China Statistics Press.
Population Census Office under the State Council and Department of Population and EmploymentStatistics of the National Bureau of Statistics. 2012. Tabulation on the 2010 population censusof the People’s Republic of China. Beijing: China Statistics Press.
Population Census Office under the State Council and Department of Population, Social, Scienceand Technology Statistics of the National Bureau of Statistics of China. 2002. Tabulation on the2000 population census of the People’s Republic of China. Beijing: China Statistics Press.
Research Group of Study of China’s Fertility Policy in the 21st Century. 2010. Suggestions foradjusting China’s fertility policy. In The debate on China’s population policy in the 21st century,ed. B. Gu and J. Li, 215–19. Beijing: Social Sciences Academic Press [in Chinese].
State Family Planning Commission & China Population and Development Research Center. 2002.Handbook on population and family planning data. Internal document.
Zhang, W. 2008. Tabulations of the 2006 national population and family planning survey. Beijing:China Population.