citizen report card republic of moldova
TRANSCRIPT

Citizen Report Card
Republic of Moldova
A Survey Conducted with the Support of the World Bank, Swedish International Development Cooperation Agency, and UNDP Moldova
January, 2011
2 / 57
Contents
Executive Summary .................................................................................................................. 4
1. Introduction .......................................................................................................................... 7
1.1. Citizen Report Card surveys ............................................................................................ 7
1.2. The Citizen Report Card survey in the Republic of Moldova ......................................... 7
1.3. Objectives of the Survey .................................................................................................. 7
1.4. Institutions included in the survey ................................................................................... 8
1.5. Survey Methodology ....................................................................................................... 9
2. The profile of public services from a client perspective .................................................. 13
2.1. Level of utilisation of services ....................................................................................... 13
2.2. Quality of Public Services ............................................................................................. 13
2.3. Accessibility of Information concerning Public Services ............................................. 16
2.4. Difficulties faced in accessing public services .............................................................. 18
2.5. Level of Corruption in Public Service Provision........................................................... 19
3. Access to Information and Services via the Internet (e-Access) ..................................... 21
3.1. Access to computers and the internet ............................................................................ 21
3.2. E-Access to Public Services .......................................................................................... 24
3.3. Respondents’ attitudes towards the electronic provision of public services ................. 26
4. In-depth analysis of services provided by health care institutions ................................ 28
4.1. Level of utilisation of health services ............................................................................ 28
4.2. Quality of services provided by health care institutions ................................................ 29
4.3. Access to public interest information on health care institutions .................................. 29
4.4. Difficulties faced by the public in accessing health care ............................................... 29
4.5. Level of corruption in health care institutions ............................................................... 30
5. In-depth analysis of services provided by Population Documentation Offices and Civil
Status Offices .......................................................................................................................... 30
5.1. Level of Demand for Services of Population Documentation Institutions .................... 31
5.2. Quality of Population Documentation services ............................................................. 31
5.3. Access to information on Population Documentation Institutions ................................ 32
5.4. Difficulties faced in accessing Population Documentation services ............................. 32
5.5. Levels of corruption in Population Documentation services ......................................... 33
6. Respondents’ opinions on how to improve public services ............................................. 34
7. Conclusions ......................................................................................................................... 37
Annexes .................................................................................................................................... 40
Annex 1. Terms of Reference ............................................................................................... 40
Annex 2. Sample Characteristics .......................................................................................... 44
Annex 3. Questionnaire ........................................................................................................ 46

3 / 57
List of Charts
Chart 1 Level of utilisation of public services .......................................................................... 14
Chart 2 Proportion of respondents satisfied with the quality of services received .................. 15
Chart 3 Degree of satisfaction with the quality of services ...................................................... 16
Chart 4 Share of respondents agreeing that information on specific public services is
accessible and comprehensive ..................................................................................... 17
Chart 5 Share of respondents reporting difficulties in accessing public services .................... 18
Chart 6 Difficulties and problems faced by respondents when accessing services .................. 19
Chart 7 Share of respondents reporting giving a bribe to access services ................................ 20
Chart 8 Proportion of respondents using a computer and the internet by gender and
location ........................................................................................................................ 22
Chart 9 Proportion of respondents who use a computer and the internet, by age-group.......... 22
Chart 10 Proportion of respondents who use a computer and the internet, by monthly
household income category ....................................................................................... 23
Chart 11 Internet Access Technologies .................................................................................... 24
Chart 12 Proportion of respondents contacting a public institution through its website .......... 25
Chart 13 Proportion of respondents accessing public services on-line .................................... 26
Chart 14 Public services which respondents would like to be provided via the internet or
mobile phone ............................................................................................................. 27
Chart 15 Difficulties and problems faced by the public in accessing health care .................... 30
Chart 16 Difficulties and problems faced by respondents in accessing population
documentation services.............................................................................................. 33
Chart 17 Suggestions for interventions to improve public services ......................................... 34

4 / 57
Executive Summary
Getting a good understanding of whether public services are meeting the needs and
expectations of the public is valuable both for mapping out the strategic path for the
development of services, and for solving everyday problems faced by the public when
accessing public services. The Citizen Report Card survey is a first step in understanding
whether or not public services in the Republic of Moldova are delivered in ways which meet
people’s needs and expectations accessibility and quality, and to elicit from the public ideas
on how to improve the delivery of services. The survey assesses the level of utilisation of
services, how the public accesses them, perceptions of the quality of services, and identifies
difficulties faced in accessing services, including the level of corruption.
The Citizen Report Card survey uses a methodology developed by the World Bank which has
been applied in a number of countries. It was conducted in Moldova for the first time in 2010
and gives comprehensive information on services provided by 30 public institutions.
Respondents were asked to assess their experiences relating to each of the services they had
used in the 12 months prior to the survey date.
Sample. The survey included a representative sample of 3 000 respondents randomly selected
from 12 towns and 161 villages throughout the country. With a 95% confidence level the
survey has a ±1.7% margin of error, making it representative at a national level except in
Transnistria, an area not controlled by the Government of the Republic of Moldova.
Utilisation of public services. Three out of four respondents had used public services at least
once over the previous year, with polyclinics and family health centres, the mayor’s office,
public hospitals and population documentation offices the most used. There were no major
differences in the level of demand for services between men and women, nor between urban
and rural populations.
Nearly two thirds of respondents felt that the quality of public service provision was
satisfactory. A larger proportion of urban than rural respondents expressed dissatisfaction
with the quality of services. Nearly half of respondents expressed dissatisfaction with services
provided by the Police, National Archives, the National Employment Agency and social
assistance offices.
Accessibility and comprehensiveness of information. Nearly two thirds of respondents felt that
information about public services was accessible and comprehensive, although male and
urban respondents expressed more negative opinions on the accessibility of information.
Nearly half of respondents considered the information on services provided by Cadastral
offices, the National Archives and the Police as not comprehensive and inaccessible.
Difficulties and problems faced while accessing public services. Nearly one third of
respondents noted problems in accessing services, with respondents in urban communities
more frequently noting problems than respondents in rural areas. The major problems were
lengthy waits and long queues, staff indifference, disorganization in service provision, and
corruption. The main strategies respondents used to overcome these obstacles were
persistence and/or insistence, an appeal to acquaintances or to give a bribe.

5 / 57
Respondents were most likely to report difficulties in accessing the services of the National
Archives, Fire and Rescue services, the National Energy Regulatory Agency, and the Police.
Also noted, though less frequently, were difficulties in accessing Cadastral services, Social
Assistance offices, and the National Employment Agency.
Corruption. Bribery was noted in 24 of the 30 public institutions included in the survey. The
largest proportion of respondents who paid a bribe were applicants for Standards and
Metrology services, Vehicle Documentation and Driving Licence offices, public health
services, and hospitals. Bribery was also prevalent in Fire and Rescue services, education
institutions, the Police, Cadastral offices and the Customs Service.
Use of computers and the internet. Nearly two fifths of respondents had used a computer and
the internet in the previous year. Among computer users, there are gender disparities – women
use computers less than men – and geographical disparities with the share of rural respondents
using a computer and the internet only half that of the share of urban respondents. Digital
inequality is most pronounced between different income groups and between different age
groups: 84% of those with a household monthly income of more than 5000 lei used computers
and 83% in that group used the internet, whilst the comparable figures for respondents with an
income of less than 1000 lei are 17% and 15%. Similarly, 83% of 16-25 year olds had used a
computer and 79% the internet, but only 2% of those over 65 had used a computer or the
internet.
Despite the fact that over a third of respondents were aware that information about certain
public services is available on the internet, only one in ten respondents accessed the websites
of public institutions, and these were in the main urban respondents. Respondents usually
access online services for job searches, to solve health problems, or to consult public libraries.
Computerization of public services. Almost half of respondents support the idea of providing
public services via the internet or mobile phone. This view was more frequently expressed in
urban communities than in the rural areas and among younger people. The proportion of
respondents supporting the computerization of public services increases as household income
increases. Respondents were most interested in online provision of health services,
employment services, issue of personal documents, and enrolment in education institutions.
Quality of health care services. An additional in-depth analysis of services provided by health
institutions showed a high level of demand for health services, and a positive perception by
respondents of the quality of health care services, and the accessibility and
comprehensiveness of information concerning such services. One fifth of respondents noted
problems accessing health services, including lengthy waits and long queues, staff
indifference and incompetence, and corruption. One in five respondents who had used health
services stated that they had given a bribe. Bribery was most likely among young people and
people with a high income.
Quality of population documentation services. These services are, in general, given a positive
assessment by respondents, although respondents noted problems of lengthy waits and long
queues, staff indifference and incompetence, corruption and staff rudeness.
Suggestions to improve public services. More than half of respondents made suggestions for
improving services including: improving the attitude of staff towards the public; raising the
level of staff qualifications; improving management; making service provision more client

6 / 57
oriented; implementing performance-based remuneration for public servants; dealing with
service requests in the order received; and digitisation of public documents and more
computerization of public service provision.
For a comprehensive analysis of each institution, visit the website www.ipp.md.

7 / 57
1. Introduction
1.1. Citizen Report Card surveys
Citizen Report Card surveys collect and analyze information on the public’s level of
satisfaction with the quality, efficiency and accessibility of public services, and can identify
problems faced by users in their interaction with public institutions including hidden costs and
corruption. The surveys are also a useful tool for delivering users’ feedback on ways to
improve public service provision.
If the results of the survey are to be generalised to the whole population, it is important to use
rigorous methods and to ensure that the respondents are representative of the population as a
whole. Citizen Report Card surveys use stratified random sampling to identify respondents
who are representative of the population as a whole, and whose opinions represent those of
the population as a whole. Citizen Report Card surveys use rigorous procedures for
developing the questionnaire, conducting the interviews and for data analysis. As a result, we
can be confident that the Survey provides an accurate picture of the public’s views.
1.2. The Citizen Report Card survey in the Republic of Moldova
The Citizen Report Card (CRC) survey in the Republic of Moldova is the first attempt to
gauge public opinion on the quality, effectiveness and accessibility of public services. At a
time of significant reform of the public sector in Moldova, the study provides a useful input to
the discussion of best practices for reform of the sector. Through the survey, respondents were
asked to assess 30 public institutions, and additionally to provide more detailed feedback on
health care services and population documentation services.
1.3. Objectives of the Survey
The main objectives of the survey are:
to increase transparency and accountability in the public sector by providing client
feedback on services
to strengthen the capacity of civil society to monitor the performance of public
institutions
to provide a baseline for the E-Governance project funded by the World Bank.
The survey assesses the level of utilisation of public services, the views of users of the
accessibility and quality of services, and their levels of satisfaction with service provision. It
elicits information on difficulties faced in accessing services, and the incidence of bribery and
informal payments when using public services. Respondents were also asked to make
suggestions for improvements in service provision. The survey also investigates the
availability and quality of information about public services and how the public usually
8 / 57
contact public authorities, including through technologies such as the internet or mobile
phones. Respondents were asked to identify which services they would prefer to access via
the internet or mobile phone.
1.4. Institutions included in the survey
The institutions and services were selected in accordance with the Terms of Reference
presented in Annex 1. The following institutions were included in the survey:
1. State Tax Office and local branches (Serviciul Fiscal de Stat al Republicii Moldova şi
Inspectoratele fiscale de stat teritoriale)
2. Social Insurance Office and local branches (Casa Naţională şi Casele teritoriale de
asigurări sociale)
3. Social Assistance and Family Protection Office and local branches (Direcţiile /Secţiile de
asistenţă socială şi protecţia familiei în cadrul Consiliilor Raionale)
4. National Health Insurance Company and local branches (Compania Naţională de
Asigurări în Medicină şi agenţiile teritoriale)
5. Population Documentation Offices and local branches (Subdiviziunile teritoriale de
evidenţă şi documentare a populaţiei ale Direcţiei de documentare a populaţiei din cadrul
Întreprinderii de Stat „Centrul Resuselor Informaţionale de Stat „Registru” (Oficiile de
Documentare a Populaţiei)
6. Civil Status Offices (Oficiile Stare Civilă)
7. District Councils (Consiliile Raionale)
8. Mayor’s Office, borough offices in Chişinău Municipality (Primăriile, Preturile în cazul
Municipiului Chişinău)
9. Local Offices of the State Chancellery (Oficiile Teritoriale ale Cancelariei de Stat)
10. The Police Service (Subdiviziunile Departamentului Poliţie al Ministerului Afacerilor
Interne, Comisariatele de poliţie, sectoarele de poliţie (Poliţia))
11. National Employment Agency and local branches (Agenţia Naţională de Ocupare a Forţei
de Muncă şi agenţiile teritoriale)
12. Polyclinics/ Family Health Centres (Policlinicile/ Centrele Medicilor de Familie)
13. Public Hospitals (Spitalele publice)
14. Public Education institutions (Instituţiile publice de învăţământ)
15. Public Libraries (Bibliotecile publice)
16. National Statistics Bureau and local branches (Biroul Naţional de Statistică şi
direcţiile/secţiile teritoriale)
17. State Registration Office (Camera Înregistrării de Stat şi oficiile teritoriale)
18. Licensing Office (Camera de Licenţiere)
19. Standards and Metrology Office (Instituţiile ce prestează servicii de standardizare şi
metrologie (infrastructura calităţii)
20. The Customs and Border Guard Services (Serviciul Vamal şi Serviciul Grăniceri

9 / 57
21. Cadastral Offices (Oficiile Cadastrale)
22. The National Energy Regulator (Agenţia Naţională pentru Reglementare în Energetică
(ANRE))
23. The National Electronic Communications and Information Technology Regulator
(Agenţia Naţională pentru Reglementare în Comunicaţii Electronice şi Tehnologia
Informaţiei (ANCRETI))
24. Fire and Rescue services (Direcţia Salvatori şi Pompieri a Serviciului Protecţie Civilă şi
Situaţii Excepţionale al MAI şi subdiviziunile teritoriale ale acesteia)
25. Public health offices (Centrele de Medicină Preventivă)
26. Environmental Protection Office and its local branches (Inspectoratul Ecologic de Stat şi
subdiviziunile teritoriale ale acestuia)
27. The Sanitary-Veterinary Agency (Agenţia Sanitar-Veterinară şi pentru Siguranţa
Produselor de Origine Animală)
28. The National Archives (Arhiva Naţională a Republicii Moldova)
29. Vehicle Documentation and Driver Licensing Office and local branches (Direcţia
Documentare Mijloace de Transport şi Calificare a Conducătorilor Auto din cadrul
Întreprinderii de Stat „Centrul Resuselor Informaţionale de Stat „Registru” şi
subdiviziunile teritoriale ale acesteia)
30. District Agriculture offices (Direcţiile agricole raionale).
1.5. Survey Methodology
The 3000 respondents in the survey were selected using a stratified random sampling
methodology such that they were representative of Moldova’s population as a whole.
Respondents were aged 16 or more, 29% were from the North of the country, 50% from the
Centre and 21% from the South. 38% of respondents lived in urban areas, 62% in rural areas,
with women constituting 57% of respondents.
The survey was conducted in 173 locations including 12 urban communities and 161 rural
communities. Interviews took place in all the country’s districts, except those temporarily
beyond the jurisdiction of the Republic of Moldova (Transnistria). Annex 2 shows the
distribution of respondents based on age, gender, language, occupation and household
income. Given the rigorous sampling, with a confidence level of 95%, the survey has a
margin of error of ±1.7%.
Data was gathered through face to face interviews undertaken during the period 2nd
23rd
July
2010 by 55 teams of interviewers with experience of similar surveys. All interviewers were
trained in the questionnaire content and were briefed on the survey’s goal. Following the face-
to-face interviews, a test-questionnaire was administered in order to check the reliability of
the data. The test-questionnaire was conducted through telephone interviews (450
respondents) and follow up visits to the homes of respondents (150 respondents). In the case
of six institutions (Licence office, Energy Regulator, District Agriculture office,
Environmental protection, State Registration office and the Standards and metrology office)
very few respondents had utilised the service and so the main survey was supplemented by a

10 / 57
booster survey undertaken at offices where these services are provided, with respondents
selected as they came to use the service.
The questionnaire was developed (in English) by Magenta Consulting based on the
methodology and experience of CRC surveys elsewhere in the world. After approval by the
Institute for Public Policy and the World Bank, the survey was translated into Romanian and
Russian, such that the interview could be conducted in the language requested by the
respondent. A draft questionnaire was pre-tested on 50 respondents.
Using both closed and open-ended questions, respondents were asked to assess services they
had used in the 12 months prior to the date of the interview. These assessments are based on
the user’s own perspective and expectations in terms of accessibility, availability and quality
of public services. Therefore the findings of the survey and any classifications of the quality
of public services are based on the respondents’ subjective opinions.
The survey results were analysed for each public service both at the aggregate level, and
separately. Given the importance of the health sector and Population Documentation offices,
the results relating to these services are presented in separate chapters.
Types of services the public might seek from the institutions included in the survey
For a full list of the official functions of the institutions, see the relevant Government regulations.
State Tax Inspectorate: income taxes
National Social Insurance Office: state pensions
Social Assistance and Family Protection Office: social assistance and welfare payments
National Health Insurance Office: health insurance
Population Documentation offices: issue certificates confirming the personal status of individuals
e.g. birth certificates, marriage certificates and issue passports
Civil status offices: record the personal status of individuals e.g. births, marriages, divorce, death
District Councils, Mayor’s offices and borough offices: provide services at local level if there is no
local office for the specific service required
Local State Chancellery offices: represent national government at local level; deal with public
complaints or concerns about local level decisions
The Police Service: reporting crime
National Employment Agency: unemployment benefits

11 / 57
Polyclinics/ Family Health Centres: health services provided by General Practitioners
Public Hospitals: specialist health services, referrals from Family Health Centres, emergency care
Public Education institutions: tertiary education (in this survey)
Public Libraries: access to information
National Statistics Bureau: allocate statistical codes to enterprises to enable businesses to report data
on enterprises
State Registration office: registration of companies and other legal entities
Licencing office: issue licences for trade/ sale of regulated goods and services e.g. selling alcohol,
providing education services
Standards and Metrology office: monitoring weights and measures for businesses, monitoring of
household water, electricity and gas meters.
Customs Service and Border Guards: international travel and movement of goods
Cadastral offices: land registration and building permits
National Energy Regulator: certification of businesses’ compliance with energy regulations; dealing
with customer queries or complaints regarding billing and service provision by energy companies
Electronic Communication and IT Regulator: regulation of businesses within the sector; addressing
customer queries or complaints regarding billing and service provision by communications and IT
companies
Fire and Rescue services: emergency response
Public health offices: health and hygiene standards in restaurants, schools etc, water quality
monitoring
Environmental Protection Office: advice on and compliance with environmental standards
Veterinary Services offices: advice on and compliance with veterinary standards
National Archives: hold certificates (e.g. birth, marriage, death) over a certain age. The services of
the National Archives are often used in relation to applications for citizenship of other countries.
Vehicle registration and driving licence office: car registration, driving tests and licences
District Agriculture office: advice on and compliance with agriculture standards

12 / 57
There were limitations in data for the booster survey relating to the National Energy
Regulatory Agency and of the State Inspectorate for Environment Protection, both of whom
objected to data collection near their offices. Given the small number of respondents
requesting the services of District Agriculture offices, there was insufficient data to conduct a
distinct analysis.
The link between the Moldova CRC and EU eGovernment Benchmarking studies
The list of institutions included within the CRC encompass services which are included in EU
eGovernment benchmarking studies which are undertaken regularly to assess the quality and
accessibility of services and particularly how they are delivered through electronic means. In many EU
countries there is not an exact match between the institutions and the twelve services included within
the EU studies. This is also the case in Moldova but this first CRC survey in Moldova will allow
comparison with the EU studies. The services assessed in the EU eGovernment benchmarking studies
are:
Income tax Social Security Benefits
Personal documents Certificates
Declarations to the police Job search
Health related services Enrolment in higher education
Public libraries Building permission
Car registration Announcement of moving
Further details are available at:
http://ec.europa.eu/information_society/eeurope/i2010/docs/benchmarking/egov_benchmark_2009.pdf

13 / 57
2. The profile of public services from a client perspective
This chapter focuses on:
the level of utilisation of public services;
perceptions of the quality of public services;
the level of satisfaction with the way services are provided;
accessibility of information concerning public services;
difficulties faced by respondents in accessing services;
the level of corruption in public service provision.
2.1. Level of utilisation of services
Utilisation of services was measured by the proportion of respondents who had accessed a
service at least once during the last 12 months. 73% of all respondents had used at least one
public service, with little difference in utilisation between male and female respondents, nor
between rural and urban respondents. However, people aged 65 or more tend to use services
slightly less, with only 67% of people aged 65 or more using public services in the last year.
The most frequently accessed services were polyclinics and family health centres (39% of
respondents), municipalities (24%), public hospitals (18%) and population documentation
offices (16%). The services with the least utilisation (0.5% or less of respondents) were
Environmental Protection, the National Energy Regulatory Agency and Standards and
Metrology services. A relatively large share of respondents – nearly 21% – had not utilised
any public services in the previous 12 months.
2.2. Quality of Public Services
The quality of public services was measured based on the proportion of respondents who
responded “yes” to the question Are you satisfied with the quality of public services? This
question was asked for each institution the respondent had used.
In general, the majority of respondents were satisfied with the quality of services provided by
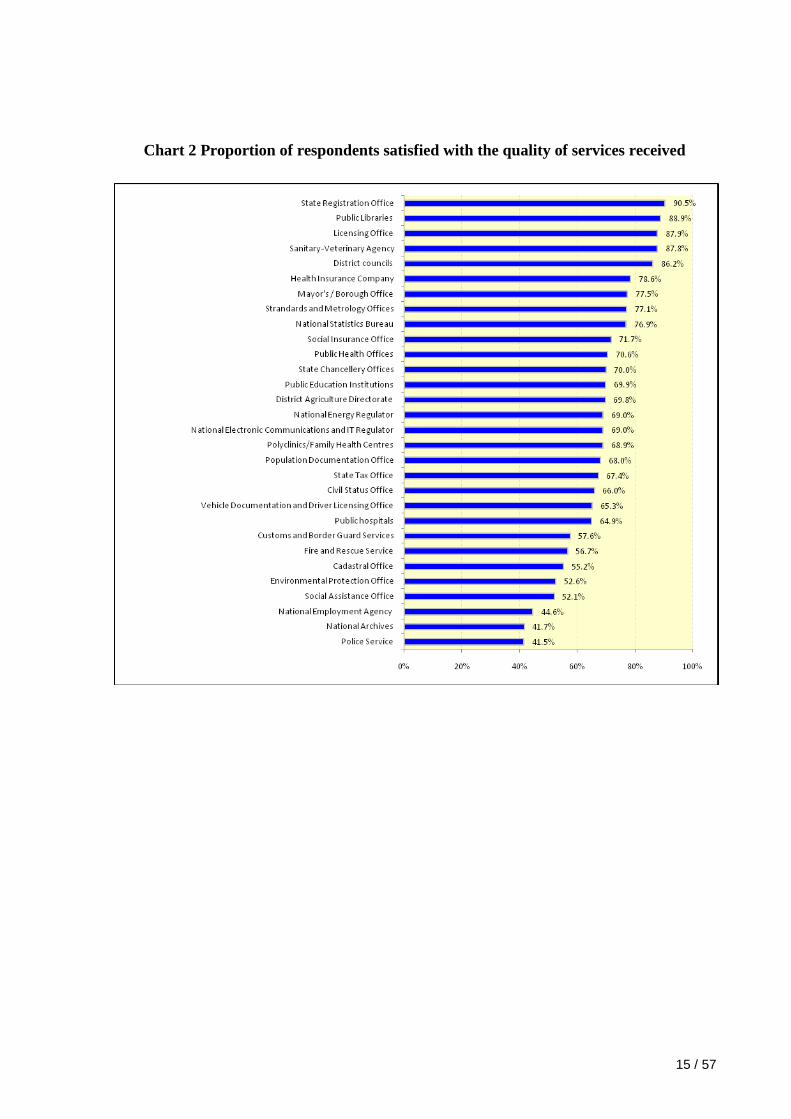
public institutions. 90% of respondents expressed satisfaction with State Registration services,
89% with public libraries and 88% with Licensing offices. Local public administration –
District Councils (86%), Mayor’s offices and boroughs (78%) – also received high
satisfaction ratings.
Public hospitals and education institutions are in the middle of the rankings, with 65% and
67% respectively of respondents satisfied with the quality of their services. The Police (42%),
National Archives (42%), and National Employment Agency (45%) are at the bottom of the
ranking.

14 / 57
In general, both men and women gave a similar assessment of the quality of services,
although there was a small gender difference of about 3 percentage points, but there was no
consistency in this across the different institutions: in some cases men were more satisfied
with services than women, and in other cases vice versa. There were much larger differences
between rural and urban populations, with 76% of rural respondents expressing satisfaction,
compared to only 60% of urban respondents.
Chart 1 Level of utilisation of public services
Respondents made a quantitative assessment of their level of satisfaction with the quality of
services using a 7 point scale from 1 (totally dissatisfied) to 7 (totally satisfied). The highest
levels of satisfaction were expressed for services relating to Income Tax (6.9 points), Public
Libraries (6.4 points), State Registration office (6.0 points), and the Veterinary Agency (6.0
points). The lowest levels of satisfaction were expressed for the State Chancellery (3.6
points), the Police (3.8 points) and the National Employment Agency (4.0 points). Education
institutions (5.3 points), public hospitals (5.2 points), Civil Status offices (5.1 points) and
Population Documentation offices (5.0 points) are in the middle of the classification.
The level of satisfaction with the quality of public services is higher among rural respondents
(5.2 points) than urban respondents (4.7 points). There was no difference between men and
women in the level of satisfaction with the quality of services.
15 / 57
Chart 2 Proportion of respondents satisfied with the quality of services received

16 / 57
Chart 3 Degree of satisfaction with the quality of services
2.3. Accessibility of Information concerning Public Services
To assess the level of accessibility and comprehensiveness of information concerning public
services, respondents were asked the question Is the information about the services of this
public institution comprehensive and accessible, in your opinion? for each of the services they
had used.
Respondents ranked as the most accessible and comprehensive the information about services
provided by Public Libraries (88% of respondents), District Councils (86%), and the
Licensing office (82%).

17 / 57
Chart 4 Share of respondents agreeing that information on specific public services is
accessible and comprehensive
Institutions whose services are used relatively often are in the middle of the ranking: Mayor’s
offices and Boroughs (75% of respondents agreeing that information is comprehensive and
accessible), public education institutions (73%), Polyclinics/Family Health Centres (70%),
and Population Documentation offices (68%). Cadastral offices (49%), National Archives
(50%) and the Police (51%) are at the bottom of the ranking.
For all public services taken together, only 60% of urban respondents agreed that information
about public services is comprehensive and accessible, in comparison with 68% of rural
respondents. Since urban inhabitants generally have better access to information, the
difference of 8 percentage points could be due to urban residents’ higher expectations of
public services.
There was also a small gender difference, with 61% of men and 68% of women agreeing that
information on public services was comprehensive and accessible.
18 / 57
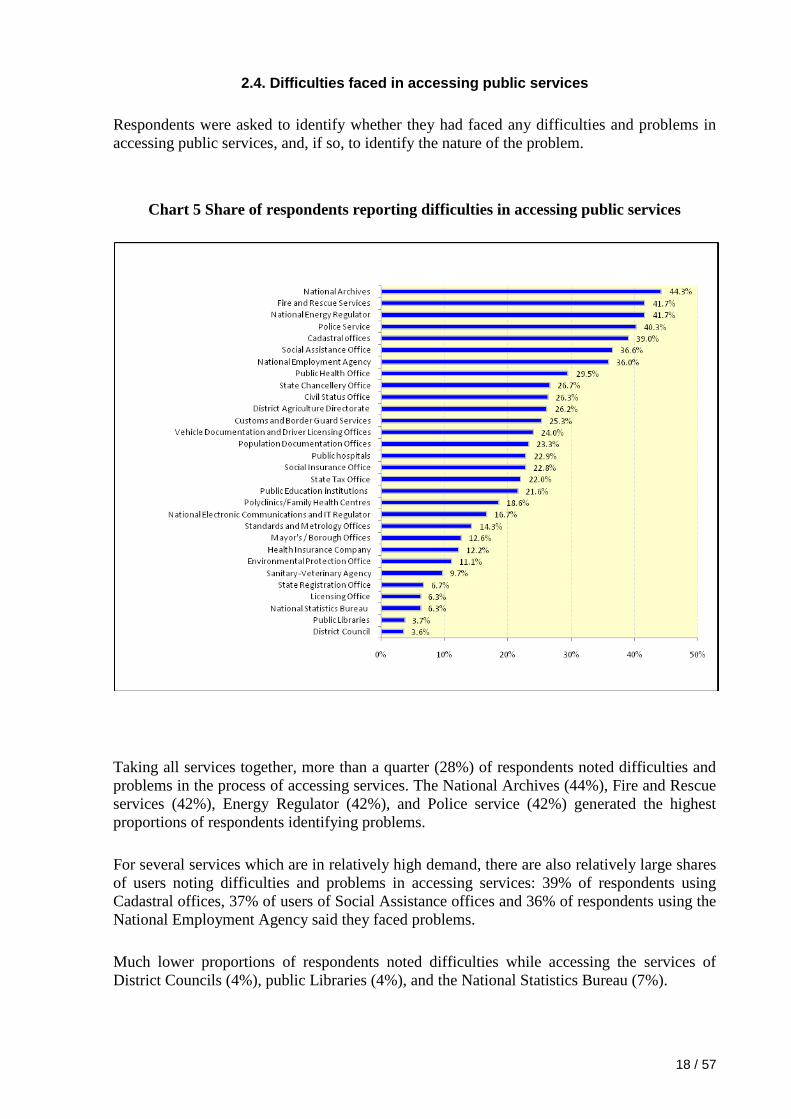
2.4. Difficulties faced in accessing public services
Respondents were asked to identify whether they had faced any difficulties and problems in
accessing public services, and, if so, to identify the nature of the problem.
Chart 5 Share of respondents reporting difficulties in accessing public services
Taking all services together, more than a quarter (28%) of respondents noted difficulties and
problems in the process of accessing services. The National Archives (44%), Fire and Rescue
services (42%), Energy Regulator (42%), and Police service (42%) generated the highest
proportions of respondents identifying problems.
For several services which are in relatively high demand, there are also relatively large shares
of users noting difficulties and problems in accessing services: 39% of respondents using
Cadastral offices, 37% of users of Social Assistance offices and 36% of respondents using the
National Employment Agency said they faced problems.
Much lower proportions of respondents noted difficulties while accessing the services of
District Councils (4%), public Libraries (4%), and the National Statistics Bureau (7%).

19 / 57
There were no gender differences in reports of problems, with 28% of men and 28% of
women reporting problems in accessing services. However urban residents were more likely
to report difficulties (33%) than rural residents (23%).
Respondents were asked to define the problems they faced, and identified nine key issues (see
Chart 6). Most of the problems identified were related to the professional qualifications and
behaviour of staff, rather than material resources of the institutions. The problems were
lengthy waits and long queues (reported by 55% of respondents), staff indifference (44%),
disorganization in service provision (32%), corruption (31%), poor quality (23%)
incompetence (22%), rudeness (20%), shortage of information (19%) and bureaucracy (19%).
Chart 6 Difficulties and problems faced by respondents when accessing services
2.5. Level of Corruption in Public Service Provision
Levels of corruption in public service provision were assessed based on the proportion of
people using a specific service who gave an affirmative response to the question Have you
ever given a bribe in order to get this service?
Only six of the thirty institutions in the survey had no reported cases of bribery: the Energy
Regulator, the Electronic Communications and IT Regulator, the National Statistics Bureau,
State Chancellery offices, Licensing offices and State Registration offices.
For the other institutions, the largest incidence of bribery in return for service was amongst
users of Standards and Metrology offices (26%). Lower rates, but still more than 10% of

20 / 57
users, were reported for other services – Car Registration and Driving Licence offices (19%),
public health offices (18%), hospitals (17%), Fire and Rescue services (17%), education
institutions (16%), the Police (15%), Cadastral offices (14%), the Customs Service (14%),
Family Health Centres (13%), District Agriculture offices (12%), Environmental Protection
services (10%) and District Councils (10%).
Chart 7 Share of respondents reporting giving a bribe to access services

21 / 57
3. Access to Information and Services via the Internet (e-Access)
The Citizen Report Card survey investigated the possibilities for the public to access public
services electronically, in particular via computers and the internet. The survey identified:
respondents’ access to personal computers and the internet;
current levels of utilisation of the internet to access public services;
respondents’ attitudes to the computerization of public services.
3.1. Access to computers and the internet
3.1.1. Use of Computers
41% of respondents had used a computer over the previous 12 months, but there were major
variations based on gender, location, income group and age:
Men were more likely than women to use computers – 45% compared to 38%.
62% of the urban population reported using a computer – much more than the 28%
of the rural population.
Residents of the Central zone were more likely to have used a computer – 49% in
comparison to residents in the Northern (33%) and Southern (33%) zones
A very large proportion of young people use computers – 83% of the 16 25 age
group, but only 13% of the 56 65 age group.
Usage rates are similarly skewed based on income: 84% of respondents whose
monthly household income exceeded 5000 lei but only 17% of respondents with
monthly household incomes of less than 1000 lei had used a computer

22 / 57
Chart 8 Proportion of respondents using a computer and the internet by gender and
location
Chart 9 Proportion of respondents who use a computer and the internet, by age-group
23 / 57
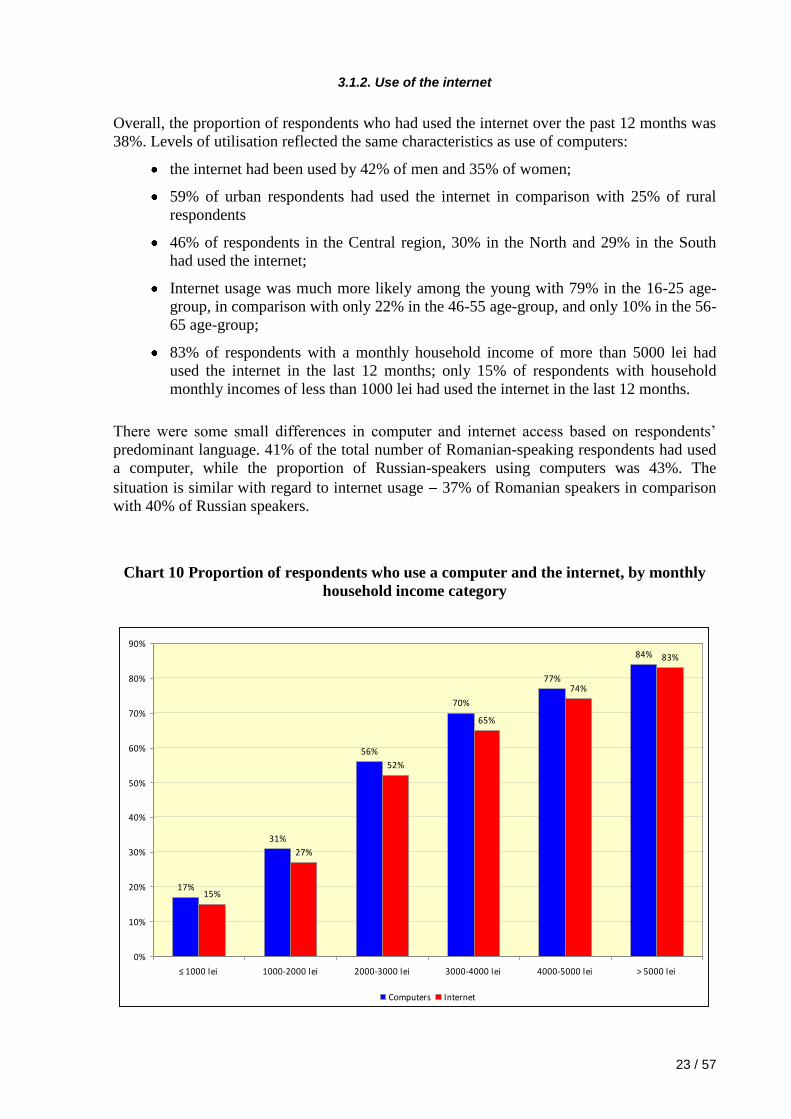
3.1.2. Use of the internet
Overall, the proportion of respondents who had used the internet over the past 12 months was
38%. Levels of utilisation reflected the same characteristics as use of computers:
the internet had been used by 42% of men and 35% of women;
59% of urban respondents had used the internet in comparison with 25% of rural
respondents
46% of respondents in the Central region, 30% in the North and 29% in the South
had used the internet;
Internet usage was much more likely among the young with 79% in the 16-25 age-
group, in comparison with only 22% in the 46-55 age-group, and only 10% in the 56-
65 age-group;
83% of respondents with a monthly household income of more than 5000 lei had
used the internet in the last 12 months; only 15% of respondents with household
monthly incomes of less than 1000 lei had used the internet in the last 12 months.
There were some small differences in computer and internet access based on respondents’
predominant language. 41% of the total number of Romanian-speaking respondents had used
a computer, while the proportion of Russian-speakers using computers was 43%. The
situation is similar with regard to internet usage 37% of Romanian speakers in comparison
with 40% of Russian speakers.
Chart 10 Proportion of respondents who use a computer and the internet, by monthly
household income category
17%
31%
56%
70%
77%
84%
15%
27%
52%
65%
74%
83%
0%
10%
20%
30%
40%
50%
60%
70%
80%
90%
≤ 1000 lei 1000-2000 lei 2000-3000 lei 3000-4000 lei 4000-5000 lei > 5000 lei
Computers Internet

24 / 57
3.1.3. Means of accessing the internet
The most common internet access technology is ADSL, used by nearly 60% of respondents,
with 25% of respondents using optical fibre connections. 3G (wireless) technology was used
by 9% of respondents, and other types of connections by less than 6% of respondents. The
most advanced technology (3G) is available in urban areas and in districts in the Central
region, and, unsurprisingly, respondents on higher incomes are the major users of this
technology.
Chart 11 Internet Access Technologies
Users, %
60%
25%
9%6%
4%2% 3%
0%
10%
20%
30%
40%
50%
60%
70%
ADSL modem Optical fibre 3G Dial-up Wi-Fi GPRS Other
3.2. E-Access to Public Services
3.2.1. Using the websites of public institutions to access information
Nearly 39% of respondents were aware that information about public institutions is available
on the internet, but only 7% had accessed a public authority website at least once over the
previous 12 months. Again, there are differences in utilisation reflecting geography, age and
income. Urban residents were more likely (14%) to have done so than rural residents (3%).
Young people aged 16-25 (12%) were also more likely to access these websites than those
aged over 65 (1%). Only 1% of respondents whose monthly household income was up to
1000 lei had used the websites of public institutions, in comparison to 28% of those whose
income was greater than 5000 lei.
Respondents were asked the question How did you contact this public institution? with one
possible response being Website which allows you to leave a message. The institution most

25 / 57
frequently accessed via the internet was the National Statistics Bureau with 22% of
respondents using the internet to access their services. Lower figures for access via the
internet were given for District Agriculture Directorates (10%), the National Archives (10%),
National Energy Regulatory Agency (8%), public education institutions (8%), and public
libraries (7%).
For several institutions which are utilised by a large proportion of the public, the share of
users who access them via the internet is relatively small: National Employment Agency
(4%), Police (2%), Population Documentation offices (2%), public hospitals (1%).
Chart 12 Proportion of respondents contacting a public institution through its website
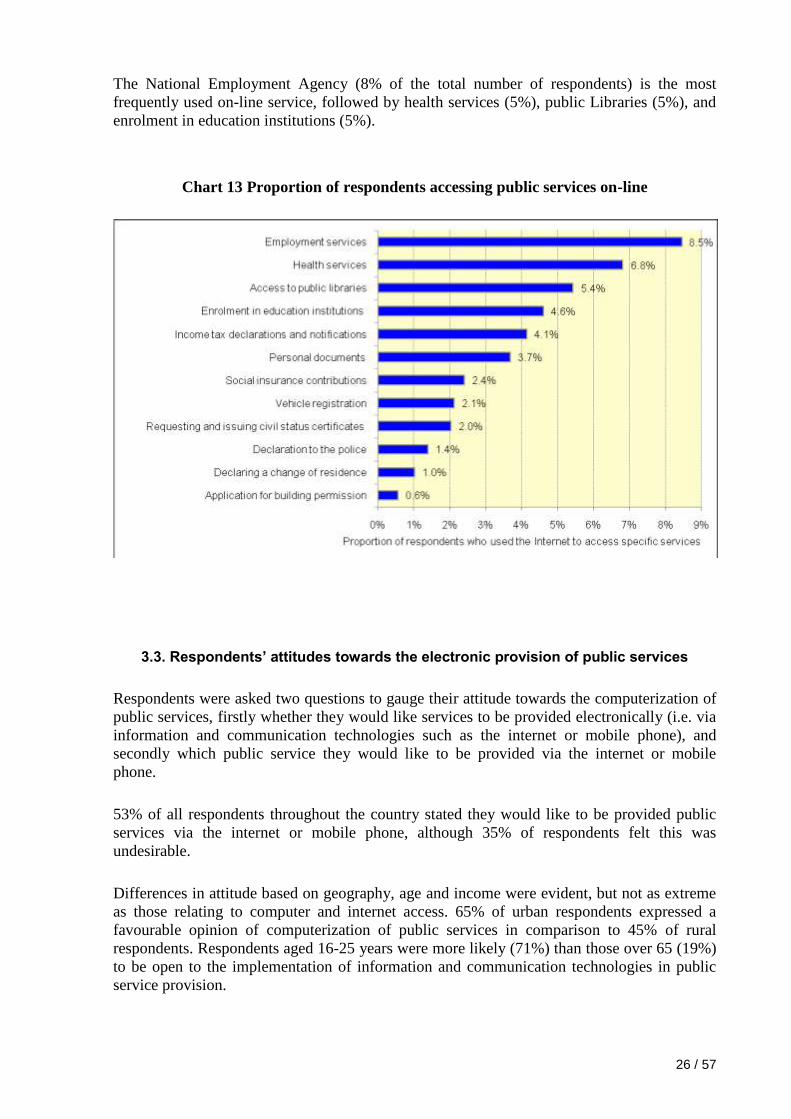
3.2.2. On-line access to public services
There are twelve public institutions which allow users to access services – not just
information about services – via the internet. Utilisation rates for these services were gauged
by asking the question Have you applied for services available on the internet, followed by a
list of the 12 public services. 84% of respondents have never accessed any public service by
the means of the internet. 16% had accessed at least one services on-line..
26 / 57
The National Employment Agency (8% of the total number of respondents) is the most
frequently used on-line service, followed by health services (5%), public Libraries (5%), and
enrolment in education institutions (5%).
Chart 13 Proportion of respondents accessing public services on-line
3.3. Respondents’ attitudes towards the electronic provision of public services
Respondents were asked two questions to gauge their attitude towards the computerization of
public services, firstly whether they would like services to be provided electronically (i.e. via
information and communication technologies such as the internet or mobile phone), and
secondly which public service they would like to be provided via the internet or mobile
phone.
53% of all respondents throughout the country stated they would like to be provided public
services via the internet or mobile phone, although 35% of respondents felt this was
undesirable.
Differences in attitude based on geography, age and income were evident, but not as extreme
as those relating to computer and internet access. 65% of urban respondents expressed a
favourable opinion of computerization of public services in comparison to 45% of rural
respondents. Respondents aged 16-25 years were more likely (71%) than those over 65 (19%)
to be open to the implementation of information and communication technologies in public
service provision.

27 / 57
Support for computerisation of public services was positively correlated to income; with 32%
of respondents on a monthly household income below 1000 lei up to 85% of people on an
income of more than 5000 lei having a favourable attitude to computerised access to services.
Respondents who supported the idea of computerisation of public services were asked to
choose the services they would like to be provided via the internet or mobile phone. Health
services (60%), employment services (60%), issue of personal documents (49%), enrolment
in education institutions (40%) were the most frequently specified.
Chart 14 Public services which respondents would like to be provided via the internet or
mobile phone

28 / 57
4. In-depth analysis of services provided by health care institutions
This chapter gives a more detailed analysis of services provided by Polyclinics/Family Health
Centres and by public hospitals, showing levels of utilisation, perceptions of quality, access to
information, difficulties and problems faced by respondents in accessing the services and
levels of corruption.
4.1. Level of utilisation of health services
Of all the institutions included in the survey, services provided by Polyclinics/Family Health
Centres were the most frequently utilised by survey respondents, 39% of whom had used
them. 18% of respondents had utilised public hospitals. Of all the respondents who had
accessed health services, utilisation is quite frequent, with 55% of respondents who use health
services doing so every month.
Women are more likely to utilise health services 25% of the total number of female
respondents – compared to 19% of men, and there are slightly higher utilisation rates in urban
areas (24%) then rural areas (21%). There appears to be a slightly higher level of utilisation in
the Northern region (54%) than in the Central (50%) and Southern (50%) regions. Those on a
lower household monthly income (up to 1000 lei) were more likely to use health services than
those on an income of more than 5000 let, with 51% of respondents in the lower income
group using health services in comparison to 41% of those in the higher income group.
The most common method of accessing health services is directly at a health facility – 91% of
those who had used health services did so at a health facility. Of those respondents not
required to attend a health facility directly, 19% of them contacted the facility by phone and
only 2.4% did so via the internet.
One of the most important factors influencing the level of utilisation of health services is the
distance to the nearest health facility which varied from 10 metres to 18 km, with an average
of 1403 meters, and a median of 800 metres for all survey respondents.
The distance to a health facility was shorter in rural areas than in urban areas. In rural areas
the distance to a medical institution varied from 10 metres to 18km, with an average of 1248
metres and a median of 700 metres. Rural respondents usually walked to medical facilities
(85% of respondents), took public transport (6%) or used their personal transport (5%).
In urban areas, the distance varied from 20 metres to 6km, with an average of 1643 metres
and a median of 1000 metres. Urban respondents in the main walk to health facilities (53%),
while others take public transport (28%) or their personal transport (15%). The shorter
distances for rural respondents are likely to be due to the fact that most villages have a Family
Health Centres.

29 / 57
4.2. Quality of services provided by health care institutions
Two thirds (67%) of all respondents throughout the country who utilised health care
institutions felt that the quality of services received was satisfactory. There were no gender
differences in this view, with 67% of men and 66% of women holding this view.
Rural respondents were more likely to be satisfied with the quality of service 75%,
compared to 57% in urban communities. There were also similar differences in opinion
between those on a low monthly household income (less than 1000 lei), 73% of whom were
satisfied with the quality of health services, and those on a high income (over 5000 lei per
month), only 56% of whom felt the quality of services was satisfactory.
Nationally, the level of public satisfaction with the quality of health services was 5.1 points on
a scale from 1 (totally dissatisfied) to 7 (totally satisfied). This puts health services in the
middle of this ranking amongst all 30 services included in the survey.
4.3. Access to public interest information on health care institutions
Nearly 67% of respondents stated that information about the services provided by health care
institutions is comprehensive and accessible. Again there was little difference by gender (68%
of men in comparison to 67% of women) but obvious differences between rural residents
(72%) and urban residents, only 60% of whom felt information was comprehensive and
accessible. This was similar to the differences between respondents on a lower income (up to
1000 lei per month), 74% of whom felt information was comprehensive and accessible, and
those on higher incomes (more than 5000 lei per month), only 56% of whom agreed with this
view.
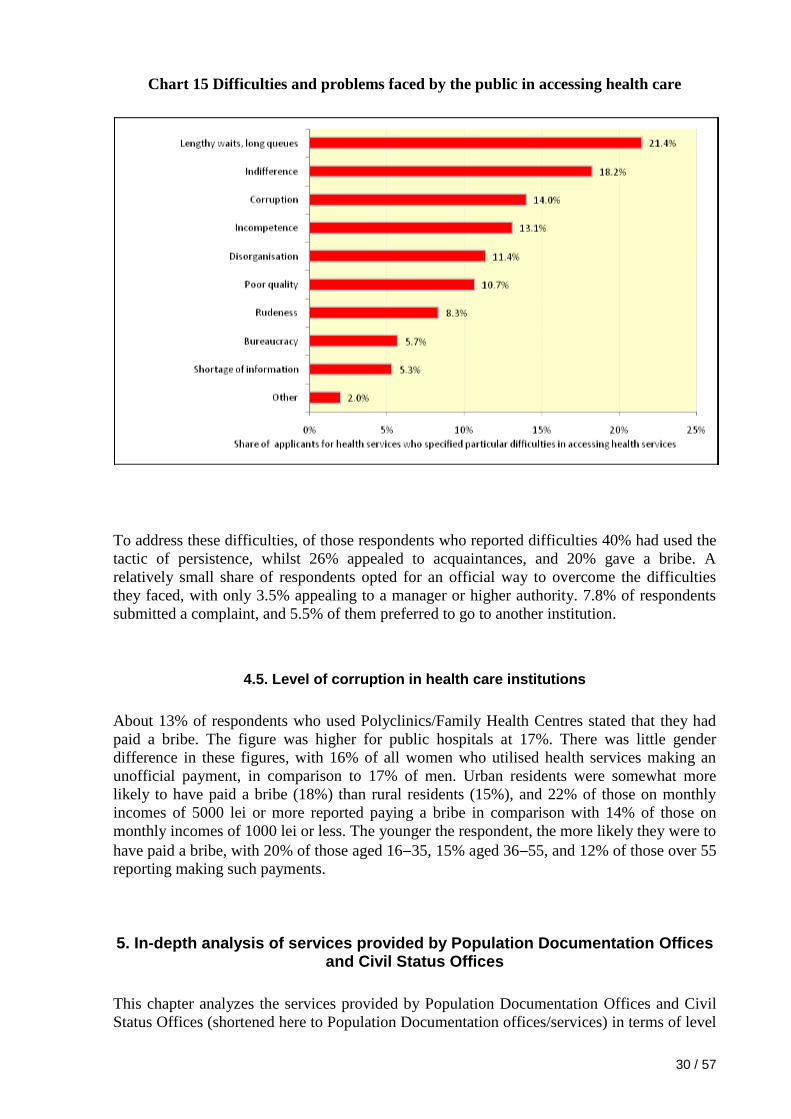
4.4. Difficulties faced by the public in accessing health care
Nationally, nearly 24% of respondents reported difficulties in accessing health services, the
major problems being: lengthy waits and long queues (22%), staff indifference (18%) and
corruption (14%). Other problems included staff incompetence (13%), disorganization in the
provision of services (11%), poor quality (11%) and staff rudeness (8%).
30 / 57
Chart 15 Difficulties and problems faced by the public in accessing health care
To address these difficulties, of those respondents who reported difficulties 40% had used the
tactic of persistence, whilst 26% appealed to acquaintances, and 20% gave a bribe. A
relatively small share of respondents opted for an official way to overcome the difficulties
they faced, with only 3.5% appealing to a manager or higher authority. 7.8% of respondents
submitted a complaint, and 5.5% of them preferred to go to another institution.
4.5. Level of corruption in health care institutions
About 13% of respondents who used Polyclinics/Family Health Centres stated that they had
paid a bribe. The figure was higher for public hospitals at 17%. There was little gender
difference in these figures, with 16% of all women who utilised health services making an
unofficial payment, in comparison to 17% of men. Urban residents were somewhat more
likely to have paid a bribe (18%) than rural residents (15%), and 22% of those on monthly
incomes of 5000 lei or more reported paying a bribe in comparison with 14% of those on
monthly incomes of 1000 lei or less. The younger the respondent, the more likely they were to
have paid a bribe, with 20% of those aged 16 35, 15% aged 36 55, and 12% of those over 55
reporting making such payments.
5. In-depth analysis of services provided by Population Documentation Offices and Civil Status Offices
This chapter analyzes the services provided by Population Documentation Offices and Civil
Status Offices (shortened here to Population Documentation offices/services) in terms of level

31 / 57
of utilisation, perceptions of quality, access to information, difficulties and problems faced by
the public in terms of accessing services, and level of corruption.
5.1. Level of Demand for Services of Population Documentation Institutions
Population Documentation offices provide a wide range of services to the public. 21% of all
survey respondents had used population documentation offices in the last 12 months. Both
men and women utilised the services equally (21% in both cases). There are differences in the
proportion of urban users (28%) than rural users (17%) and in those respondents on a higher
household income (≥ 5000 lei per month), 33% of whom had used the services in comparison
to 13% of respondents on a low income (≤ 1000 lei per month).
The most commonly requested population documentation services are:
issuing passports 57% of all respondents who applied to population documentation
offices;
issuing birth certificates 52%;
issuing identity cards 43%;
issuing marriage certificates 29%.
Services related to changing personal data which do not require changing documents (2%)
and issue of certificates of adoption/paternity (1%) were the least utilised.
Almost all users of Population Documentation services (97%) did so through a direct visit to
the office. 9% of respondents noted that they used the phone (presumably in addition to direct
visits). Only 1% of respondents who used Population Documentation offices did so via the
internet.
Amongst all users of Population Documentation services, the distance from home to the
Population Documentation office varied from 20 metres to 15 km, with an average of 1927
metres, and a median of 1000 metres. In rural areas, the distance to population documentation
offices ranged from 20 metres to 15 km, with an average of 1734 metres and a median of 800
metres. More than three quarters (76%) of rural users of such services walked to the
Population Documentation office, with only 10% using public transport and 7% using their
own personal transport.
In urban areas, the distance to Population Documentation offices varied from 20 metres to 5
km, with an average of 2232 metres and a median of 1500 metres. People travelled to the
office either on foot (39%), public transport (38%) or their personal transport (17%). In rural
areas, population documentation services are provided through the Mayor’s office, which
explains the shorter distance to these services in rural areas.
5.2. Quality of Population Documentation services
About 68% of all respondents who utilised Population Documentation offices were satisfied
with the quality of services, though women were more likely to be satisfied (71% of all
32 / 57
women who used the services) than men (63%). Similar differences were evident between
rural populations (73% of whom were happy with the quality of services) and urban
populations, of which only 62% expressed satisfaction. Overall, the level of public
satisfaction with the quality of population documentation services was 5.0 on a scale from 1
(totally dissatisfied) to 7 (totally satisfied). This score ranks Population Documentation
offices in the middle of the 30 institutions assessed in the survey.
5.3. Access to information on Population Documentation Institutions
Nearly 68% of all respondents stated that information about population documentation
services was comprehensive and accessible, with rather more rural respondents (73%) than
urban respondents (61%) holding this view. 69% of women felt that information was
comprehensive and accessible, in comparison to only 63% of men. Bigger differences in
respondents’ views on access to information were found between those on a monthly income
of less than 1000 lei (78% considered information comprehensive and accessible), and those
on monthly incomes of more than 5000 lei, of whom 53% considered information
comprehensive and accessible. Limited access to information on population services was
noted by 10% of respondents to be a problem in accessing Population Documentation
services.
5.4. Difficulties faced in accessing Population Documentation services
Nearly 23% of all respondents who used Population Documentation services reported
difficulties and problems in accessing services. The main difficulties were lengthy waits and
long queues (39% of respondents who noted problems), staff indifference (18%),
disorganisation (16%) and corruption (10%). Lengthy waits and long queues were particularly
noted in relation to issuing passports (42%) and the modification of personal data which does
not require the change of documents (50%). Respondents also noted problems of bureaucracy
(10%), shortage of information (10%), rudeness (8%), staff incompetence (6%), and poor
quality of services (6%).

33 / 57
Chart 16 Difficulties and problems faced by respondents in accessing population
documentation services
To overcome these problems, the tactics reported by respondents who had noted problems
were insistence and persistence (40%), with 22% of respondents appealing to acquaintances
for assistance, while 13% of respondents gave a bribe. As with other services, a relatively
small proportion of respondents used official channels to resolve problems with access: 7%
had appealed to a higher body, 5% had submitted a complaint and 4% had applied to another
authority.
5.5. Levels of corruption in Population Documentation services
8.5% of respondents nationwide stated they had paid a bribe in the process of getting
population documentation services. Men were more likely than women to offer a bribe – 12%
in comparison to 7%, with urban residents marginally more likely to pay a bribe than rural
residents – 11% in comparison to 7%. As with health services, those on higher incomes were
more likely to have paid a bribe than those on lower incomes – 21% of those with monthly
incomes exceeding 5000 lei had paid a bribe to get services, but the comparable figure for
those on monthly incomes of less than 1000 lei was 6%. Ten percent of respondents aged 16-
55 had paid a bribe, in comparison with 5% if those aged over 55.

34 / 57
6. Respondents’ opinions on how to improve public services
Respondents were asked to make suggestions for ways to improve public service provision
and 1244 respondents, i.e. nearly 57% of the total of 2190 respondents who had requested at
least one public service over the past 12 months, did so. Suggestions were grouped into 16
categories, shown in Chart 17. The most commonly mentioned suggestion was to improve
staff qualifications and their attitudes towards the public.
Chart 17 Suggestions for interventions to improve public services
Respondents felt that many staff of public authorities do not have the necessary professional
qualifications for their job and they have a poor attitude towards the public. This was
commonly mentioned in connection with Population Documentation services, for example
when respondents identified grammar or spelling errors in documents but staff reacted rudely
to requests to modify them. Respondents who had faced problems accessing services and
were persistent in their attempts to get them mentioned that requests for supplementary
information were met with staff indifference and rudeness.

35 / 57
Survey responses suggest that in all of the institutions included in the survey, the public have
encountered civil servants who they feel act unprofessionally: not paying adequate attention
to clients, undertaking work unrelated to their job, and putting the public in an uncomfortable
or humiliating position.
Nearly a quarter of proposals made by respondents were aimed at improving the management
and provision of services. Respondents also noted the complexity of procedures, lack of
clarity concerning the organization of public institutions, the division of responsibilities
among different offices and branches of the same service, and the difficulties in identifying
which official can actually solve their problems. Citizens living in small towns and rural
communities would prefer to be provided the most commonly used services directly in their
communities through local branches of district institutions.
10% of respondents suggested that service provision needs to be more efficient. They noted
that public servants lack motivation and have little incentive to improve service delivery.
Service delivery is slow, causing lengthy queues, especially in the most frequently utilised
services.
Proposals for improving public information mostly relate to posting information about human
rights in general, and about the rights of the public in relation to the specific service in
particular. Respondents also suggested that information be available on complaints procedures
including where and to whom to submit complaints.
7% of respondents proposed improving the physical conditions of public offices, especially in
rural communities and some district towns where public institutions are located in old
buildings needing renovation. Many waiting rooms are small, dark and have insufficient
chairs. Respondents noted that improving the physical conditions would make offices more
pleasant for the public and could also improve the efficiency of service provision. About 5%
of respondents suggested that public offices should be equipped with office furniture, modern
computers, office supplies and aids for posting information. Some respondents suggested
digitizing documents and computerization of procedures.
In terms of tackling corruption, 4% of respondents suggested strengthening and enforcing
legislation, raising salaries of civil servants and eliminating procedures which facilitate
bribery.
Nearly 4% of respondents suggested reducing the prices for some services, and 2% of
respondents suggested making the work schedule of public institutions more flexible.
Respondents in towns proposed that public institutions are open in the evening and on
Saturdays. Rural respondents would like public services provided at district level, for
example, medical consultations, to be provided in their village at least once a week.
A small number of respondents (2%) suggested that public service provision could be
improved by extending controls such as inspections or audit both at institutional level and at
the level of each public servant. Respondents also proposed that public services should follow
more private sector operating principles: to be more client-centred, to use performance-based
remuneration, more incentives for staff, and increased targets for service provision to ensure
timely delivery of services.

36 / 57
Proposals to counteract bureaucracy included simplifying and reducing the number of forms,
large-scale implementation of the principle of “one stop shop”, and simplifying procedures for
delivery of documents.

37 / 57
7. Conclusions
1. The Citizen Report Card survey, conducted for the first time in the Republic of
Moldova in 2010, provides comprehensive information on services delivered by 30 public
institutions. The survey’s results are representative at national level, except in Transnistria, an
area not controlled by the Government of the Republic of Moldova. At the 95% confidence
level, the survey has a margin of error of ±1.7%.
2. Key issues investigated by the survey were the level of utilisation and means of
accessing and contacting public institutions, perceptions of quality of service provision, and
difficulties faced by clients in accessing services.
3. Three out of four respondents had used at least one public service over the previous
year, with polyclinics and family health centres, the mayor’s office, public hospitals and
population documentation offices the most used. There were no major differences in the level
of utilisation of services between men and women, nor between urban and rural populations.
4. Nearly two thirds of respondents felt that the quality of public service provision was
satisfactory. A larger proportion of urban than rural respondents expressed dissatisfaction
with the quality of services. Nearly half of respondents expressed dissatisfaction with services
provided by the Police, National Archives, the National Employment Agency and social
assistance offices.
5. Accessibility and comprehensiveness of information. Nearly two thirds of respondents
felt that information about public services was accessible and comprehensive, although male
and urban respondents expressed more negative opinions on the accessibility of information.
Nearly half of respondents considered the information on services provided by Cadastral
offices, the National Archives and the Police as not comprehensive and inaccessible.
6. Difficulties and problems faced while accessing public services. Nearly one third of
respondents noted problems in accessing services, with respondents in urban communities
more frequently noting problems than respondents in rural areas. The major problems were
lengthy waits and long queues, staff indifference, disorganization in service provision, and
corruption. The main strategies respondents used to overcome these obstacles were
persistence and/or insistence, an appeal to acquaintances or to give a bribe.
7. Respondents were most likely to report difficulties in accessing the services of the
National Archives, Fire and Rescue services, the National Energy Regulatory Agency, and the
Police. Also noted, though less frequently, were difficulties in accessing Cadastral services,
Social Assistance offices, and the National Employment Agency.
8. Corruption. Bribery was noted in 24 of the 30 public institutions included in the survey.
The largest proportion of respondents who paid a bribe were applicants for Standards and
Metrology services, Vehicle Documentation and Driving Licence offices, public health
services, and hospitals. Bribery was also prevalent in Fire and Rescue services, education
institutions, the Police, Cadastral offices and the Customs Service.

38 / 57
9. Use of computers and the internet. Nearly two fifths of respondents had used a
computer and the internet in the previous year. Among computer users, there are gender
disparities – women use computers less than men – and geographical disparities with the
share of rural respondents using a computer and the internet only half that of the share of
urban respondents. Digital inequality is most pronounced between different income groups
and between different age groups: 84% of those with a household monthly income of more
than 5000 lei used computers and 83% in that group used the internet, whilst the comparable
figures for respondents with an income of less than 1000 lei are 17% and 15%. Similarly,
83% of 16-25 year olds had used a computer and 79% the internet, but only 2% of those over
65 had used a computer or the internet.
10. Despite the fact that over a third of respondents were aware that information about
certain public services is available on the internet, only one in ten respondents accessed the
websites of public institutions, and these were in the main urban respondents. The most
commonly accessed services via the internet were the National Statistics Bureau, District
Agriculture Directorates, National Archives, National Energy Regulatory Agency, Education
institutions and public libraries. Respondents usually access online services for job searches,
to solve health problems, or to consult public libraries.
11. Computerization of public services. Almost half of respondents support the idea of
providing public services via the internet or mobile phone. This view was more frequently
expressed in urban communities than in rural areas, and among younger people. The
proportion of respondents supporting the computerization of public services increases as
household income increases. Respondents were most interested in online provision of health
services, employment services, issue of personal documents, and enrolment in education
institutions.
12. Quality of health care services. An additional in-depth analysis of services provided by
health institutions showed a high level of demand for health services, and a positive
perception by respondents of the quality of health care services, and the accessibility and
comprehensiveness of information concerning such services. One fifth of respondents noted
problems accessing health services, including lengthy waits and long queues, staff
indifference and incompetence, and corruption. One in five respondents who had used health
services stated that they had given a bribe. Bribery was most likely among young people and
people with a high income.
13. Quality of population documentation services. These services are, in general, given a
positive assessment by respondents, although respondents noted problems of lengthy waits
and long queues, staff indifference and incompetence, corruption and staff rudeness.
14. Suggestions to improve public services. More than half of respondents made suggestions
for improving services including: improving the attitude of staff towards the public; raising
the level of staff qualifications; improving management; making service provision more client
oriented; implementing performance-based remuneration for public servants; dealing with
service requests in the order received; and digitisation of public documents and more
computerization of public service provision.
15. In conclusion, the study has revealed that there are levels of dissatisfaction in the
delivery of public services which should be further investigated if improvements are to be
made. Qualitative studies would be useful to identify further the causes of such

39 / 57
dissatisfaction, as well as to identify in further detail how the public feels that service
provision might be improved.

40 / 57
Annexes
Annex 1. Terms of Reference
Background
Governance is a significant challenge to growth and poverty reduction in Moldova. Weak
governance, uncompetitive private sector, and fragmented civil society together create a
dynamic circle where a large part of the population migrates abroad instead of being agents
for wealth creation at home. The World Bank’s Moldova Country Governance and Anti-
Corruption Strategy emphasizes that the Bank should put incremental efforts and resources
into measures to strengthen the demand side for good governance.
The Government of Moldova emphasizes the need for a more efficient and transparent public
administration in its most recent policy document (Rethink Moldova 24 March 2010): “Our
strategic objective is to create an efficient, professional, honest and transparent public
administration aligned with democratic principles and enabled to provide high value services
to Moldova’s people”.
Both Government and donors believe that E-Government will be an important instrument to
improve governance in Moldova. E-Government is about using the tools and systems made
possible by Information and Communication Technologies (ICTs) to provide better public
services to citizens and businesses. ICTs are already widely used by government bodies, just
as in enterprises, but E-Government involves much more than just the tools. Effective E-
Government also involves rethinking organisations and processes, and changing behaviour so
that public services are delivered more efficiently to the people who need to use them.
“The Government sees ICT as a new engine of sustained growth and citizen-centric
government transformation” (Rethink Moldova 24 March 2010).
UNDP is implementing a project to assist the Government in the implementation of the e-
Governance component of the National Strategy on Building of Information Society in
Moldova. As a part of the project UNDP commissioned a survey “Population priorities needs
assessment in public services” in in 2007 (see attachment). The World Bank is currently
preparing a USD 15 million project (Moldova governance e-transformation) that aims to
increase availability and quality of a selected range of public services to citizens and
businesses through innovative use of ICT in the public sector. The present assignment will
build upon UNDP’s previous survey and will serve as a key input in the design of the new e-
governance project, as well as a baseline to measures changes over time and enable systematic
feedback from stakeholders.
Citizen report card
Evolved from the pioneering experience of Bangalore and disseminated in many countries
such as the Philippines, Vietnam, Ukraine, Ethiopia and Tanzania, the Citizen Report Card
(CRC) is an international best practice tool for improving service delivery. By means of

41 / 57
collecting citizen feedback on the performance and quality of public services from actual
users, CRC provides a rigorous basis and a proactive agenda for communities and local
governments to engage in a dialogue to improve the delivery of public services.
The Citizen Report Card (CRC) is a simple but powerful tool to provide public agencies with
systematic feedback from users of public services. CRCs are client feedback surveys that
provide a quantitative measure of user perceptions on the quality, efficiency and adequacy of
different public services. CRCs facilitate prioritization of reforms and corrective actions by
drawing attention to the problems highlighted. Beyond the process of executing a survey,
CRCs involve efforts at dissemination and institutionalization that make them effective
instruments to exact public accountability.
Scope of consultant work
The objectives of the assignment are to:
increase transparency and accountability in the public sector by providing client
feedback on services
strengthen capacity of civil society to do performance monitoring
provide a baseline for the new World Bank e-governance project
The main task is to do a quantitative survey (a so called citizen report card) with a
representative sample of the Moldovan population regarding selected public institutions –
how satisfied are citizens with service delivery, what are the means of contacting the
authority, have they experienced unofficial payments for public services? The outputs are 1)
a report, 2) report cards where services are ranked by citizen satisfaction, 3) public hearings
with dissemination of findings.
The selection of services and methodology could be based on the UNDP study from 2007 (see
attachment 1) which will enable a longer view, but the final selection of services will be
decided in collaboration with World Bank. The vulnerable, excluded groups in society should
be given specific attention in the survey, knowing that these groups are more dependent on
the public services but at the same time generally have less access to them.
A tentative list of public authorities to be included in the survey is given below:
1. Polyclinics / public hospitals
2. Municipalities, district councils
3. State Tax Inspectorate
4. Offices for population documentation (issuance of passports, identity cards)
5. National House for Social Insurance / Territorial offices
6. Public educational institutions
7. National Company for Health Insurance
8. Cadastral offices
9. Police
10. Social assistance directorates

42 / 57
11. Public libraries
12. Civil status offices
13. Employment agencies
14. National Archives
15. Customs Service
16. National Bureau for Statistics
17. Boroughs (in Chisinau municipality)
18. Centre of Preventive Medicine
19. State Registration Chamber
20. Sanitary-Veterinary Agency
21. Licensing Chamber
22. Institutions providing standardization and metrology services (quality infrastructure)
23. National Regulatory Agency for Electronic Communications and Information
Technology
24. Fire Service
25. State Inspectorate for Environment Protection
26. National Energy Regulatory Agency
27. Other authorities
The report should tentatively include feedback from actual users regarding:
Availability, access & usage of services
Quality & reliability
Incidence of problems & responsiveness of service providers
Hidden costs - corruption & forced investments
Satisfaction with service
Reasons for dissatisfaction
Suggestions for improvements
The availability and quality of information about services
Citizens’ means of contacting public authorities
Services that citizens prefer to access through the internet or mobile phones
Deliverables and tentative timeline
The assignment will have an estimated duration of 2 months and commence in June, 2010. A
limited number of Moldovan NGO-s are invited to tender (and the organizations can choose
to liaise with market research firms). In order to fulfil the study’s objectives the selected
organization has to provide one senior professional with adequate experience to coordinate
the entire assignment and mobilize an adequate number of field survey investigators. The

43 / 57
deliverables mentioned below should be delivered in English, and the final report and citizen
report cards in both English and Romanian.
Date Deliverable
By May 28, 2010 Contract
By June 4, 2010 Consultant to WB: Inception Report with a detailed description of survey
methodology, questionnaire and work plan.
By June 9, 2010 WB to Consultant: Comments on the Inception Report
June 10-24, 2010 Survey implemented by consultant
June 24-29, 2010 Data processed by consultant
By June 30, 2010 Consultant to WB: Draft Report
By July 7, 2010 WB to Consultant: Comments on Draft Report
By July 21, 2010 Consultant to WB: Final Report
By July 26, 2010 Citizen Report Cards
July 27-30, 2010 Dissemination and public hearings on findings
Reporting
The consultant will report to Kristin Sinclair, Governance Operations Officer in the WB
Office in Chisinau. Transactions will be processed by Diana Calugher in the WB office.
Institute/organization qualifications
An understanding of governance and E-Government
Sound knowledge of execution and analysis of quantitative surveys
Experience in media and advocacy campaigns
Superior writing skills in English
Excellent communication skills in Romanian and Russian

44 / 57
Annex 2. Sample Characteristics
Total number of respondents, N = 3000.
Indicator % in the total number of respondents
Region
North 28.8
Centre 50.4
South 20.8
Area
Urban 38.5
Rural 61.5
Age
16 25 years of age 23.8
26 35 years of age 16.0
36 45 years of age 15.5
46 55 years of age 17.6
56 65 years of age 14.6
over 65 years of age 12.4
Gender
Male 42.8
Female 57.2
Language
Romanian 75.7
Russian 24.3
Occupation
Enterprise manager 1.4
Department manager 1.0
Self-employed 5.8
Specialist 10.0
Public employee 2.9
Qualified worker 6.1
Worker 10.3
Student 13.9
Not working, nor searching a job 4.8
Unemployed 12.4
Housewife 10.0
Pensioner 21.2

45 / 57
Indicator % in the total number of respondents
Other 0.1
Field of activity
Heavy Industry 0.0
Light industry 1.5
Electronics 0.9
Agriculture 5.2
Trade 5.9
Constructions 3.3
Education 5.5
Transport 3.2
Services 7.3
Real estate agency 0.0
Banks and stock exchanges 0.7
Advertisement 0.0
Medical field 2.5
Other 0.0
Not working 62.2
Monthly household income
Up to 1000 MDL 34.5
1000 2000 MDL 22.5
2001 3000 MDL 20.7
3001 4000 MDL 9.8
4001 5000 MDL 5.7
Over 5000 MDL 6.7
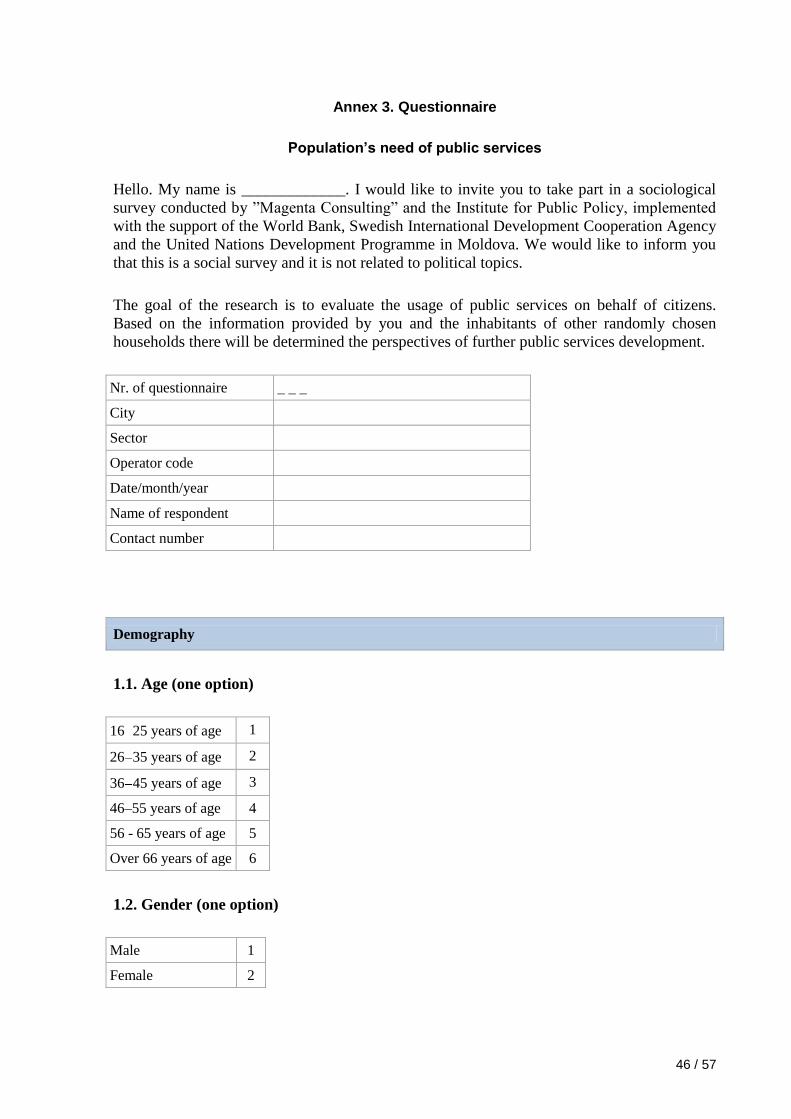
46 / 57
Annex 3. Questionnaire
Population’s need of public services
Hello. My name is _____________. I would like to invite you to take part in a sociological
survey conducted by ”Magenta Consulting” and the Institute for Public Policy, implemented
with the support of the World Bank, Swedish International Development Cooperation Agency
and the United Nations Development Programme in Moldova. We would like to inform you
that this is a social survey and it is not related to political topics.
The goal of the research is to evaluate the usage of public services on behalf of citizens.
Based on the information provided by you and the inhabitants of other randomly chosen
households there will be determined the perspectives of further public services development.
Nr. of questionnaire _ _ _
City
Sector
Operator code
Date/month/year
Name of respondent
Contact number
Demography
1.1. Age (one option)
16 25 years of age 1
26 35 years of age 2
36 45 years of age 3
46–55 years of age 4
56 - 65 years of age 5
Over 66 years of age 6
1.2. Gender (one option)
Male 1
Female 2

47 / 57
1.3. Current position/title (one option)
Company director 1
Department manager 2
Work on my own 3
Specialist (with higher education) 4
Public servant 5
Qualified worker 6
Worker (including driver) 7
Student 8
Unemployed, not looking for a job 9
Unemployed, looking for a job 10
Housewife 11
Retired 12
Other, specify ___________ 13
1.4. Field of activity (one option)
Heavy industry (auto, equipment) 1
Light industry (textile, etc.) 2
Electronics (PC/IT) 3
Agriculture 4
Retail/ wholesale 5
Construction 6
Education 7
Transportation 8
Services 9
Real estate , insurance 10
Banks, stock markets 11
Advertisement 12
Medicine 13
Other, specify ___________ 14
Unemployed 15
1.5. Monthly household income (one option)
< 1000 lei 1
1001 – 2000 lei 2
2001 – 3000 lei 3

48 / 57
3001 – 4000 lei 4
4001 – 5000 lei 5
> 5001 lei 6
1.6. Location (one option)
Urban 1
Rural 2
1.7. Region (one option)
North 1
Centre 2
South 3
Use of the internet and computers
2.1. Is there a computer in your household? (one option)
Yes 1
No 2 → go to 2.4
2.2. Do you have internet access at home? (one option)
Yes 1
No 2 → go to 2.5
2.3. What type of internet connection do you have at home? (several options)
Dial-up 1
ADSL/modem 2
Optic fibre 3
WiFi 4
GPRS (mobile phone, card) 5 – Indicate the number ____
3 G (mobile phone or other
mobile device)
6 – Indicate the number ____
Other, specify ______________ 7
49 / 57
2.4. Have you personally used a computer during past 12 months (regardless of the
location of the computer? (one option)
Yes 1
No 2 → go to 3.1
2.5. Have you accessed the internet during the past 12 months (regardless of the location
of internet access)? (one option)
Yes 1
No 2 – go to 3.1
2.6. Where did you access the internet during past 12 months? (several options)
At home 1
Friends, acquaintances 2
School, university 3
At work 4
Library, post office etc. (free of charge) 5
Internet cafe, hotel (paid access) 6
Any location via cell phone 7
Any location via mobile device for Internet access (notebook with Wi-Fi etc.) 8
2.7. Why have you used the internet? (several options)
To gain information regarding merchandise, services 1
To gain information regarding health, health services 2
To gain general information about governmental organizations, public authorities 3
To solicit information from governmental organizations, public authorities 4
To send or receive e-mail messages 5
For phone calls via Internet/ VoIP 6
To post information 7
Chat (skype, messenger) 8
To purchase or order merchandise or services through Internet 9
For banking operations via Internet 10
For training and education activities 11
For on-line games and video games downloads 12
For downloading movies, images, music, books 13
For watching TV, video and images, listening to radio and music 14
For downloading software 15

50 / 57
For reading news, newspapers, on-line magazines 16
To gain information related to cultural institutions (theatre, cinema, museum, concert
halls’ schedules etc.)
17
2.8. How often did you use the internet during the past 12 months from any location?
(one option)
At least once a day 1
At least once a week 2
Less than once a week 3
Use of public services
3.1. Have you accessed any public services during the past 12 months? (one option)
Yes 1
No 2 → go to 3.16
DK/NR 3
3.2. Tick the public institutions you have contacted during the last 12 months (several
options)
1 The State Tax Inspectorate
2 The National House for Social Insurance
3 Social Assistance services
4 The National Company for Health Insurance
5 Services of the Population Documentation Offices (including passport, identity card ,citizenship,
address change, other data changes not requiring change of documents – ethnicity, scientific
degrees etc)
6 Rayonal (District) Council services
7 Services of the Mayor’s office, (or the borough in Chişinău municipality)
8 State Chancellery local offices
9 Civil Status Office (Certificates and attestations of birth, marriage, divorce, name change, death,
adoption, fatherhood)
10 The Police service
11 The National Employment Agency and its local branches
12 Polyclinics/family health centres (information on services, appointments, inquiries about medical
services, medical certificates, recipes, sick leave
13 Public hospitals (information on services, appointments, inquiries about medical services, medical

51 / 57
certificates, recipes, sick leave, in-patient appointments)
14 Public Education Institutions
15 Public Libraries
16 National Statistics Bureau
17 State Registration offices
18 Licensing offices
19 Standards and metrology services
20 Customs Service and Border Guard Service
21 Cadastral services
22 National Energy Regulation Agency
23 National Electronic Communications and Information Technology Regulation Agency
24 Fire and Rescue services
25 Public Health offices
26 Environmental Protection office
27 Public Veterinary Services
28 National Archives
29 Vehicle Registration and Driver Licencing offices
30 District Agriculture Department
31 Other (subsidies. Merchandise compliance certificates, grants, land enhancement, equipment,
public acquisition, irrigation services)
32 Other, specify______________
Operator, be careful! Tables 3.3 3.15 should be filled in for each service ticked in Table
3.2!
3.3. How did you contact these institutions? (multiple response)
Directly to the office 1
Via telephone 2
E-mail 3
Web, given the possibility of posting messages 4
Other, specify
3.4. How often did you use the services of this institution during past 12 months? (one
option, only for the ones ticked in 3.2)
Monthly 1
Once every 2-3 months 2
Once every 6 months 3

52 / 57
Once a year 4
When needed 5
Did not address for any 6
3.5. How long did you wait in line to get the service, both applying and receiving it? (one
option)
Up to 15 min 1
Up to 30 min 2
Up to 4 hours 3
Up to 1 day 4
Over one day 5
Did not benefit of any 6
3.6. How long did the service itself last? (one option)
Up to 1 hours 1
Up to 4 hours 2
1 day 3
5 days 4
10 days 5
30 days 6
Over 30 days 7
Did not benefit of
any
8
3.7. How long should service provision last? (one option)
1 hour 1
Up to 4 hours 2
1 day 3
5 days 4
10 days 5
30 days 6
Over 30 days 7
Did not benefit of
any
8

53 / 57
3.8. Did you face any difficulties of problems in accessing the service? (one option)
Yes 1
No → go to 3.10 2
3.9. How did you solve the problem? (several choices)
Addressing a superior body 1
Addressing other bodies 2
Insisting 3
Complaint 4
Bribe 5
Acquaintances 6
Internet 7
Not solved 8
Other, specify
_________________________________ 9
3.10. Have you paid additional, unofficial payments to receive the service? (one option)
Yes 1
No 2
3.11. Do you think that the information about public services is complete and accessible?
(one option)
Yes 1
No 2
3.12. Are you satisfied with the quality of the service? (one option)
Yes 1
No 2
3.13. On a scale from 1 to7 grade your level of satisfaction regarding the quality of
services, where 1- totally unsatisfied, 7 – totally satisfied
1 2 3 4 5 6 7

54 / 57
3.14. Which of the following difficulties you have come across when accessing services?
(multiple response)
Unorganized 1
Lack of information 2
Rudeness 3
Carelessness 4
Lack of competence 5
Corruption 6
Poor quality 7
Bureaucracy 8
Not solved 9
Long wait 10
Other, specify ____________________ 11
(Do not read) None 12
3.15. Improvement suggestions
_________________________________
Operator, be careful! Check up if you have filled in Tables 3.3 3.15 for each service
ticked in Table 3.2!
3.16. To what extent is the information about public services accessible and
comprehensive, in general, in your opinion? (one option)
Yes 1
No 2
3.17. From your perspective, what is the best way to interact with public authorities?
(several options)
Directly at the office 1
Through telephone 2
E-mail 3
Web given the possibility of placing messages 4
Other, indicate _________________ 5

55 / 57
3.18. From your point of view are public authorities (listed above) receptive to public
enquiries? (one option)
Yes 1
No 2
(Do not read) DK/NA 3
3.19. What distance do you have to travel to reach the nearest medical services?
meters
3.20. How do you usually reach the medical facility? (one option)
Call the ambulance 1
On foot 2
Personal car 3
Relatives/friends’ car 4
Public transportation 5
Other, specify _____________________ 6
3.21. What distance is the nearest office to obtain documents and certificates?
meters
3.22. What means of transportation do you use to reach the offices to benefit from these
services?
By foot 1
Personal car 2
Friends/relatives’ car 3
Public transportation 4
Other, specify 5
Do not address 6
3.23. Have you ever accessed the web pages of public authorities? (several options)
Yes 1 -
indicate
No 2

56 / 57
3.24. Are you aware that information on certain public authorities is available on-line?
(one option)
Yes 1
No 2 → go to 3.26
(Do not read) DK/NR 3
3.25. Have you ever used the services available via the internet? (several options)
Public service
Frequency of use
Monthly
2 3
times
per
month
Once
every 6
months
Once
a
year
As
needed
a) Public services for citizens
1 Income taxes
2 Job search services at employment offices
3 Social insurance contributions/ Social Security
Benefits
4 Personal documents (passport, identity card, driver’s
license)
5 Car Registration
6 Building permission
7 Reports/ Declaration to the Police
8 Public libraries
9 Civil status offices
10 Enrolment in higher education
11 Report about change of residence address
12 Health services
13 b) Other, specify_________
14 I didn’t use
3.26. Do you think there is a need for public authorities to computerise their services
(ITC implementation), meaning providing services via the internet or mobile phone?
(one option)
Yes 1
No 2 – end of questionnaire
(Do not read) DK/NA 3

57 / 57
3.27. Which of the services below would you like to receive via the internet or mobile
phone? (several options)
Public service
a) Public services for citizens
1 Income taxes
2 Job search services at employment offices
3 Social insurance contributions/ Social Security Benefits
4 Personal documents (passport, identity card, driver’s license)
5 Car Registration
6 Building permission
7 Reports/ Declaration to the police
8 Public Libraries
9 Civil Status offices
10 Enrolment in higher education
11 Report about change of residence address
12 Health services
13 b) Other, specify _________
Thank you for participation!