citizen-driven dashboards in smart ecosystems: a framework
TRANSCRIPT

Citizen-driven dashboards in smart ecosystems: a framework
Óscar Mealha
Departamento de Comunicação e Arte/DIGIMEDIA, Universidade de Aveiro, Campus
Universitário de Santiago, 3810-193 Aveiro. Portugal [email protected]
Abstract. This position paper is concerned with the research and design of infocommunication technologies for citizen engagement and learning in smart ecosystems. The work assumes a human-centric citizen-driven smart city design approach and also proposes a R&D iterative framework model based on SOA work that goes from citizen inquiry to a front-end dashboard paradigm proposal. A research framework is discussed alongside scientific and public state of the art projects, their methods, techniques and main goals/results that inform smart ecosystem R&D agenda today. The specific contribution of this work concentrates on the proposal of affordant visual personal dashboards to represent selected open data smart ecosystem dimensions to be interpreted by the common citizen, capable of engaging the citizen and supporting in loco learning of real context of need/use situations.
Keywords: infocommunication, smart city, personal dashboard, open data, learning
1 Introduction
The smart city/territory concept is driving and enormous amount of research worldwide on urban development. Scopus1 database reveals 2303 documents directly related with transdisciplinary work in the "smart city" context since 2012, 11 documents associated to the "smart territory" concept since 2010 and 16 documents since 2009 if the "smart ecosystem" keyword combination is used. The "smart" adjective associated to a place or system is nowadays also highly related with information and communication technologies (ICT) and occurs in the sequence of former related initiatives such as the "European Digital City". In Portugal, Aveiro was a pioneer Portuguese digital city with a pool of projects coordinated by the triad Aveiro Municipality, University of Aveiro, and Portuguese Telecom Innovation branch. A R&D cycle that took place from 1999-2002. A broader national digital city initiative took place afterwards from 2006-2009.
The smart city paradigm shift means going from a technology driven urban development into a citizen-driven smart ecosystem development that uses technology
1 Scopus: www.scopus.com
Interaction Design and Architecture(s) Journal - IxD&A, N.31, 2016, pp. 32-42
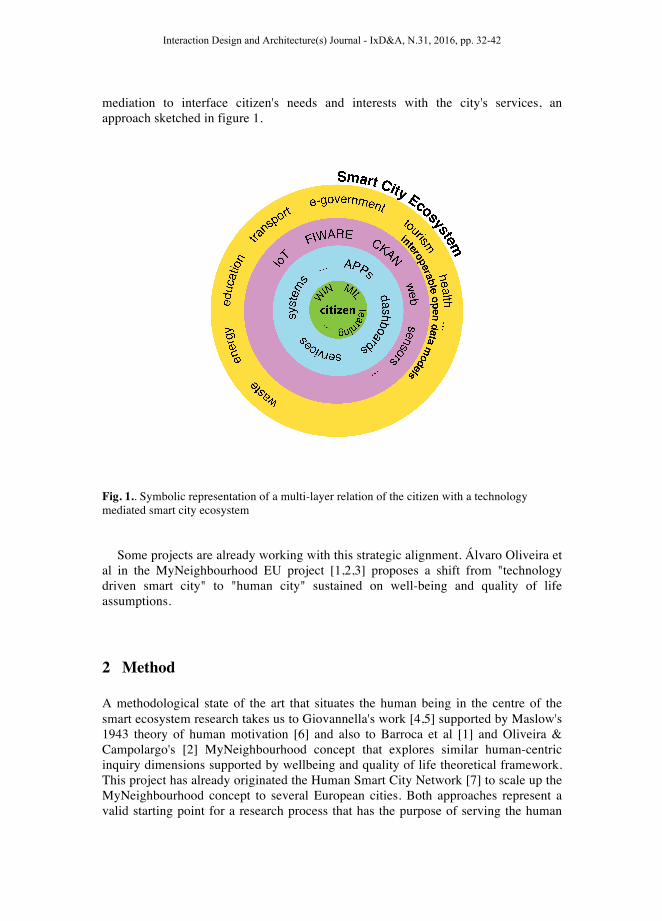
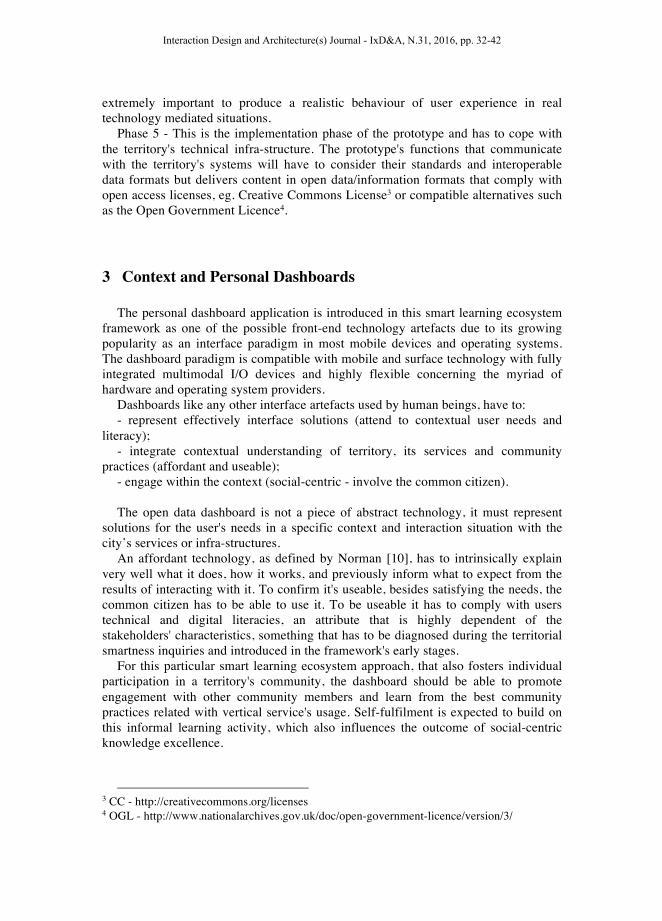
mediation to interface citizen's needs and interests with the city's services, an approach sketched in figure 1.
Fig. 1.. Symbolic representation of a multi-layer relation of the citizen with a technology mediated smart city ecosystem
Some projects are already working with this strategic alignment. Álvaro Oliveira et
al in the MyNeighbourhood EU project [1,2,3] proposes a shift from "technology driven smart city" to "human city" sustained on well-being and quality of life assumptions.
2 Method
A methodological state of the art that situates the human being in the centre of the smart ecosystem research takes us to Giovannella's work [4,5] supported by Maslow's 1943 theory of human motivation [6] and also to Barroca et al [1] and Oliveira & Campolargo's [2] MyNeighbourhood concept that explores similar human-centric inquiry dimensions supported by wellbeing and quality of life theoretical framework. This project has already originated the Human Smart City Network [7] to scale up the MyNeighbourhood concept to several European cities. Both approaches represent a valid starting point for a research process that has the purpose of serving the human
Interaction Design and Architecture(s) Journal - IxD&A, N.31, 2016, pp. 32-42
being and foster citizen-driven technology that integrates and copes with citizen wishes, interests and needs, as Oliveira & Campolargo [2] mention, WIN methodology, in a real context of use, inspired from the Living Labs initiative.
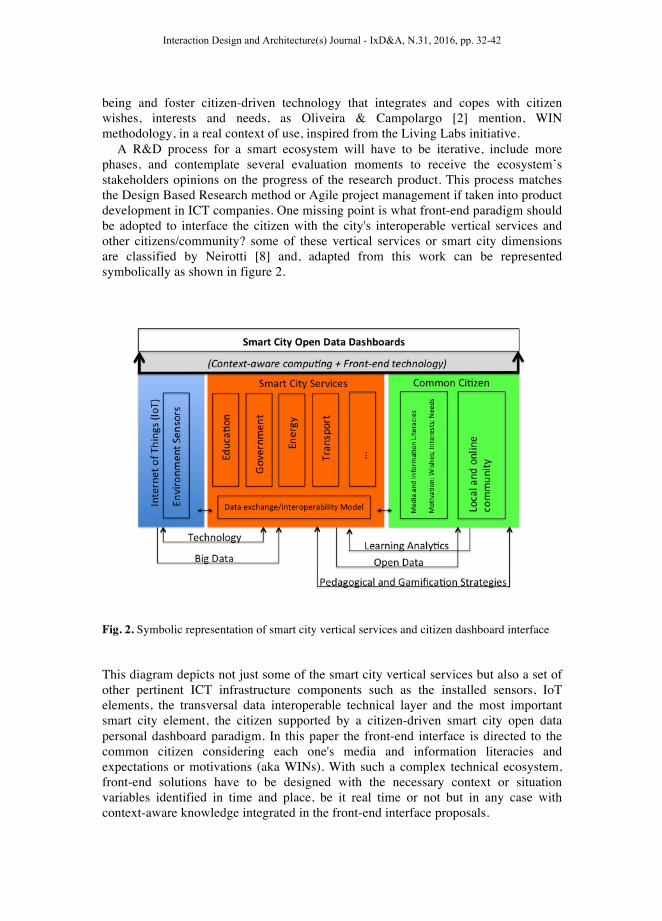
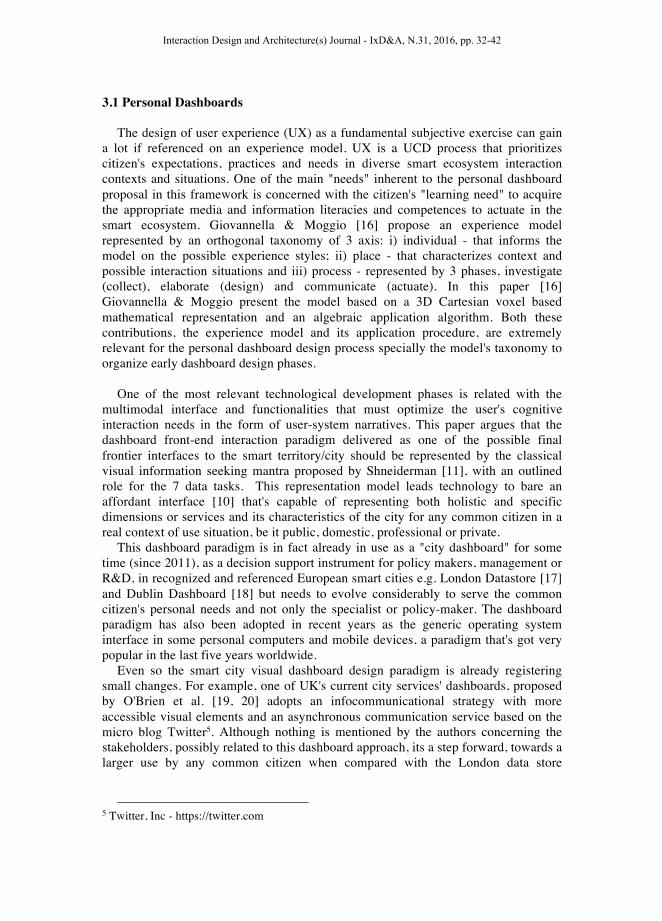
A R&D process for a smart ecosystem will have to be iterative, include more phases, and contemplate several evaluation moments to receive the ecosystem’s stakeholders opinions on the progress of the research product. This process matches the Design Based Research method or Agile project management if taken into product development in ICT companies. One missing point is what front-end paradigm should be adopted to interface the citizen with the city's interoperable vertical services and other citizens/community? some of these vertical services or smart city dimensions are classified by Neirotti [8] and, adapted from this work can be represented symbolically as shown in figure 2.
Fig. 2. Symbolic representation of smart city vertical services and citizen dashboard interface
This diagram depicts not just some of the smart city vertical services but also a set of other pertinent ICT infrastructure components such as the installed sensors, IoT elements, the transversal data interoperable technical layer and the most important smart city element, the citizen supported by a citizen-driven smart city open data personal dashboard paradigm. In this paper the front-end interface is directed to the common citizen considering each one's media and information literacies and expectations or motivations (aka WINs). With such a complex technical ecosystem, front-end solutions have to be designed with the necessary context or situation variables identified in time and place, be it real time or not but in any case with context-aware knowledge integrated in the front-end interface proposals.
Interaction Design and Architecture(s) Journal - IxD&A, N.31, 2016, pp. 32-42
For example, MyNeighbourhood EU project [1] proposes apps and web interfaces and services in its framework. An approach that solves a specific citizen WIN but looses the city as a whole and a part of context-aware knowledge. This framework minimises the loss of contextual and holistic perspective and in order to do so proposes for some of its phases the "Service Design Thinking (SDT)" approach [9]. Stickdorn and Schneider [9] support the service design thinking concept on 5 driving principles: i) User-centred; ii) Co-creative; iii) Sequencing;
iv) Evidencing and v) Holistic The argument to introduce SDT is due to the fact that both service design thinking
and this proposal's framework, both nurture from historical user-centred design concepts. The first principle, "User-Centred Design" is determinant in explaining the attitude, but is generic in the sense you can user-centre in various forms, without ever consulting or involving final users in the design process. This paper argues that the user-centred strategy must adopt user-driven design, design issues and contributions driven by direct influence of the users. When the user in context has an identity it should be used also, e.g. in smart territories the users are citizens, stakeholders within a certain social category: i) residents, seniors, children, visitors. The other service design thinking principles and their influence in this framework can be discussed in the following way:
- "Co-creative" comes from "Contextual Design" and "Collaborative Design" - to work with final users as design team partners in real context of use;
- "Sequencing" is related with the identification of user interaction streams that nowadays drives the interaction design as "user stories" or "user narratives", a approach that evolved from traditional "use cases" in computer science;
- "Evidencing" is related with a historical and fundamental human-computer interaction principle called "Affordance". The product or service's interface, as argued classically by Donald Norman [10], must be able to show with evidence what it does, or is able of doing for its user;
- "Holistic" - the visual representation of information has been argued by Shneiderman [11] to be both specific and complex without loosing the global context, the holistic perspective. You shouldn't lose track of the forest while analysing each tree, and vice-versa also. Shneiderman [11] proposes an information mantra that explains and constitutes a good working reference for infographical interface design.
As mentioned earlier the R&D framework able of answering to citizen
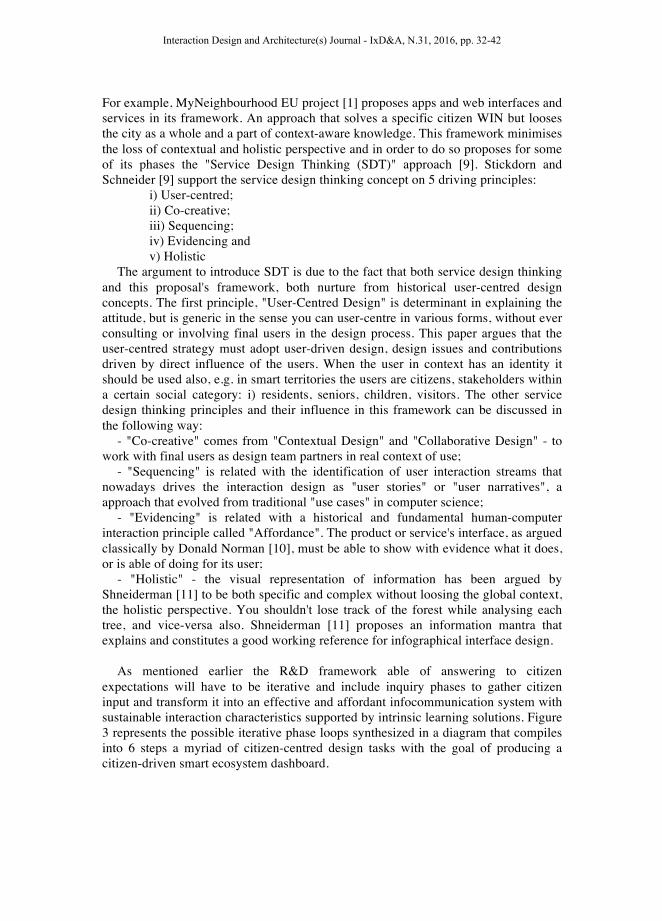
expectations will have to be iterative and include inquiry phases to gather citizen input and transform it into an effective and affordant infocommunication system with sustainable interaction characteristics supported by intrinsic learning solutions. Figure 3 represents the possible iterative phase loops synthesized in a diagram that compiles into 6 steps a myriad of citizen-centred design tasks with the goal of producing a citizen-driven smart ecosystem dashboard.
Interaction Design and Architecture(s) Journal - IxD&A, N.31, 2016, pp. 32-42

Fig. 3. An iterative framework that goes from citizen inquiry to a smart ecosystem personal dashboard
Phase 1 - One of the most important elements of this framework is related with the inquiry method, (phase 1 in Fig. 3) supported by the territorial smartness inquiry model proposed by Giovannella [4,5]. This model uses the questionnaire as an inquiring technique with closed and open ended questions with the purpose of understanding the human being's 4 main motivational dimensions in a specific territory, from Maslow's [6] theory of motivation: i) basic (structures, infrastructures and services); ii) security; iii) social (activities, institutions, self/other-esteem) and iv) self-fulfilment (internal/intrinsic challenges). A recent application of the smart questionnaire in a university campus was reported by Diego Galego [22, 24], a study that builds on former smart campus studies by Giovannella et al. [23] and also informs on the degree of smartness that, based on qualitative analysis, is missing in the territory.
Each citizen's media and information literacies must also be inquired and considered in the prototype design moments. The reference indicators used for this purpose are based on the results of UNESCO's2 Media and Information Literacy (MIL) indicators project coordinated and reported by Susan Moeller et al. [12, p. 27]. The set of indicators considered important to diagnose each citizens literacy is reported in category 2 - media and information availability, consisted of 3 sub-categories: i) creation and availability (existence of newspapers, books, online media and journals); ii) distribution and supply (radio, TV, computers, internet access) and iii) information reception (capability of people to receive - eg. newspaper readership,
2 UNESCO - United Nations Educational, Scientific and Cultural Organization
Interaction Design and Architecture(s) Journal - IxD&A, N.31, 2016, pp. 32-42
social networking, TV viewing, internet usage, library use). The "information reception" literacy category with a thorough diagnosis of the territory's media "distribution and supply" will establish the direction to go concerning technology mediation devices and how to design the interface and corresponding "user narratives". The correct representation of the territory with a technology mediated system starts here and is highly dependent of the context and people that inhabit it at a certain moment of time. Information representation will highly influence its reception by each citizen and needs to be affordant. The "affordance" guidance during the design phases, in a usage context that can be highly MIL unbalanced, has to integrate learning cues in technology design, with real-time in context support, social centric support and complementary links pointing to tutorial information.
Phase 2 - Results from phase 1 will indicate what kind of Open Data citizens are needing and how the information visualization narratives should be organized to effectively represent value for them. Open Data streams are usually a filtered subset of Big Data streams that are gathered from diverse sources in the territory. Some may be generated automatically from installed sensors (eg. environment variables - temp. humidity, rain/snow, wind, etc) others are a result of citizen interaction with territorial infrastructure or services, eg. amount of daily visits to the public library, amount of daily commuters in a metro station, etc. The appropriate analytic algorithms will have to answer to the "user narratives" (use cases) considered in the interface. The Open Data initiative [13] is an example of how policy makers and governments around the world are embracing this approach to actively engage the citizen in managing the territory on a daily, real time basis, of need and expectation. Particularly interesting is the promotion of Tim Berners-Lee's 5 star open data deployment scheme [14] that can be used when the data source so requires. Such an example comes from Águeda Smart City, Portugal, [15] with some of its open data being gathered and processed manually from administrative documents by municipality's staff.
Phase 3 - The user narratives, usually mentioned in computer science as use cases, are important design elements because they must contain or represent the citizen's needs. Due to this they constitute the first information instances that can be tested with the territory's stakeholders. A common method to do this takes on focus groups to inquire and involve citizens in the co-design of the user narratives. A possible user experience reference model to organize and design the user narratives is proposed by Giovannella & Moggio [16]. Its potentialities and usefulness for this exercise will be explained in the next section alongside the contextual and interaction situations intrinsic to a common citizen open data dashboard.
Phase 4 - The low-fidelity prototype is the first technological instrument capable of integrating the user narratives with an almost near to final visual aspect of the interface and with an interaction behaviour that represents each one of the user narratives. This peace of technology does not usually support dynamic middleware or back-end technology, it's not the issue at this point. The design approach in this framework is clearly a front-to-back end system design approach, strategically aligned with bottom-up models to deliver citizen needs and contributions into the territory's government/management universe. Like the previous phase, the prototype can be tested and co-designed in a focus group context with the citizen. The visual/graphic complexity of the individual interface mockups, their relational setup and the rigor of the territorial interaction simulation (graphic interface data/information examples) are
Interaction Design and Architecture(s) Journal - IxD&A, N.31, 2016, pp. 32-42
extremely important to produce a realistic behaviour of user experience in real technology mediated situations.
Phase 5 - This is the implementation phase of the prototype and has to cope with the territory's technical infra-structure. The prototype's functions that communicate with the territory's systems will have to consider their standards and interoperable data formats but delivers content in open data/information formats that comply with open access licenses, eg. Creative Commons License3 or compatible alternatives such as the Open Government Licence4.
3 Context and Personal Dashboards
The personal dashboard application is introduced in this smart learning ecosystem framework as one of the possible front-end technology artefacts due to its growing popularity as an interface paradigm in most mobile devices and operating systems. The dashboard paradigm is compatible with mobile and surface technology with fully integrated multimodal I/O devices and highly flexible concerning the myriad of hardware and operating system providers.
Dashboards like any other interface artefacts used by human beings, have to: - represent effectively interface solutions (attend to contextual user needs and
literacy); - integrate contextual understanding of territory, its services and community
practices (affordant and useable); - engage within the context (social-centric - involve the common citizen). The open data dashboard is not a piece of abstract technology, it must represent
solutions for the user's needs in a specific context and interaction situation with the city’s services or infra-structures.
An affordant technology, as defined by Norman [10], has to intrinsically explain very well what it does, how it works, and previously inform what to expect from the results of interacting with it. To confirm it's useable, besides satisfying the needs, the common citizen has to be able to use it. To be useable it has to comply with users technical and digital literacies, an attribute that is highly dependent of the stakeholders' characteristics, something that has to be diagnosed during the territorial smartness inquiries and introduced in the framework's early stages.
For this particular smart learning ecosystem approach, that also fosters individual participation in a territory's community, the dashboard should be able to promote engagement with other community members and learn from the best community practices related with vertical service's usage. Self-fulfilment is expected to build on this informal learning activity, which also influences the outcome of social-centric knowledge excellence.
3 CC - http://creativecommons.org/licenses 4 OGL - http://www.nationalarchives.gov.uk/doc/open-government-licence/version/3/
Interaction Design and Architecture(s) Journal - IxD&A, N.31, 2016, pp. 32-42
3.1 Personal Dashboards
The design of user experience (UX) as a fundamental subjective exercise can gain a lot if referenced on an experience model. UX is a UCD process that prioritizes citizen's expectations, practices and needs in diverse smart ecosystem interaction contexts and situations. One of the main "needs" inherent to the personal dashboard proposal in this framework is concerned with the citizen's "learning need" to acquire the appropriate media and information literacies and competences to actuate in the smart ecosystem. Giovannella & Moggio [16] propose an experience model represented by an orthogonal taxonomy of 3 axis: i) individual - that informs the model on the possible experience styles; ii) place - that characterizes context and possible interaction situations and iii) process - represented by 3 phases, investigate (collect), elaborate (design) and communicate (actuate). In this paper [16] Giovannella & Moggio present the model based on a 3D Cartesian voxel based mathematical representation and an algebraic application algorithm. Both these contributions, the experience model and its application procedure, are extremely relevant for the personal dashboard design process specially the model's taxonomy to organize early dashboard design phases.
One of the most relevant technological development phases is related with the
multimodal interface and functionalities that must optimize the user's cognitive interaction needs in the form of user-system narratives. This paper argues that the dashboard front-end interaction paradigm delivered as one of the possible final frontier interfaces to the smart territory/city should be represented by the classical visual information seeking mantra proposed by Shneiderman [11], with an outlined role for the 7 data tasks. This representation model leads technology to bare an affordant interface [10] that's capable of representing both holistic and specific dimensions or services and its characteristics of the city for any common citizen in a real context of use situation, be it public, domestic, professional or private.
This dashboard paradigm is in fact already in use as a "city dashboard" for some time (since 2011), as a decision support instrument for policy makers, management or R&D, in recognized and referenced European smart cities e.g. London Datastore [17] and Dublin Dashboard [18] but needs to evolve considerably to serve the common citizen's personal needs and not only the specialist or policy-maker. The dashboard paradigm has also been adopted in recent years as the generic operating system interface in some personal computers and mobile devices, a paradigm that's got very popular in the last five years worldwide.
Even so the smart city visual dashboard design paradigm is already registering small changes. For example, one of UK's current city services' dashboards, proposed by O'Brien et al. [19, 20] adopts an infocommunicational strategy with more accessible visual elements and an asynchronous communication service based on the micro blog Twitter5. Although nothing is mentioned by the authors concerning the stakeholders, possibly related to this dashboard approach, its a step forward, towards a larger use by any common citizen when compared with the London data store
5 Twitter, Inc - https://twitter.com
Interaction Design and Architecture(s) Journal - IxD&A, N.31, 2016, pp. 32-42
dashboard [17], the traditional dashboard for specialists, decision makers, public managers, etc. Not at all designed with the common citizen in mind.
Its usual to see the dashboard referenced as an application that integrates sensor network data e.g. Suakanto et al. [21] represented with several technical indicators, but conceptualized without profound inquiring of stakeholders' needs or interests or their co-design participation in the R&D iterative process. The personal dashboard design process has to integrate and effectively represent the 3 main Maslow's [6] motivational dimensions used and adapted by Giovannella [5] to diagnose the citizen's perspective of smart city and smart learning needs.
The first personal dashboard tab must represent the individual's activities, services used, performance in time, organized according to territory's vertical services. An interface that translates "What have I done lately in the city? What does the city have for me today or in a near future? How can I improve my participation in the city's services?".
A second dashboard tab reflects the individual's activities referenced to the community's performance, social services and activities in the territory. In other words, "What or How am I doing in the city's social, cultural, sports services, etc compared with the community's dynamic/organic and performance indicators?".
A third tab directed to participation and learning - "How can I help others or share with other community members my experience related with a vertical service/activity and how can I learn from them also?".
This personal dashboard paradigm represents a citizen interface that integrates information respecting well-identified and validated user narratives, but in order to do so it is also a powerful front-end computational device that integrates open data from various vertical city services and sources.
4. Citizen-driven City Smartness
This position paper alerts to the fact that a paradigm shift has to take place in order to really start getting impact of installed ICT infrastructure concerning the European Smart City agenda. A shift that has to effectively centralize the final user or citizen in the R&D framework as co-designer and stakeholder of the project's pilots. The smartness of the city/territory starts and ends with the people that adopted or inhabit, at some point, the territory, mediated by its vertical services.
This paradigm switch will drive design teams to work on services co-designed with the city stakeholders and abandon the traditional ICT approach of persona profiling that assumes to know what the final user/citizen needs are, by simply believing the final result will, in some way, contribute for the well being of the citizen. The collaborative strategy hereby proposed reduces the distance between ICT design teams and citizen expectations, in fact it optimizes or quasi-aligns their cognitive motivational models. A framework that surely will take the initial R&D investment to a much more efficient impact measured result of technology mediated citizen-territory relation. This will surely couple on an increase in technology, system and service affordance for the citizen, independently of literacy variables or personal learning
Interaction Design and Architecture(s) Journal - IxD&A, N.31, 2016, pp. 32-42
efforts, situations that are minimized with frameworks similar to the one explained in this paper.
Acknowledgments. Most of these concepts, methods and reflections have had the collaboration, discussion and at some point the influence of various colleagues and friends, namely: i) Carlo Giovannella, Fernando Ramos, João Lopes Batista colleagues at ASLERD6 and DIGIMEDIA7 and João Paulo Barraca from Telecommunications Institute8, University of Aveiro; ii) Águeda Municipality9 Mayor, Gil Nadais, Águeda Municipality Architect, Marlene Marques and several other staff members directly related with the Águeda Smart City initiative, Portugal; ii) Rui Isidro and Carolina Alves from Talents & Treasures10 for their ongoing partnership concerning Águeda big data and open data, Águeda, Portugal | and to all pos-grad students working with the author on the smart ecosystem topic - Diego Galego, Rúben Duarte, Rafael Guedes, Ricardo Carvalho and Andreia Bastos.
References
1. Barroca J., Brito D., Campolargo M., Concilio G., Ferreira V., Martires P., Molinari F., Oliveira A., Oliveira M., Peterson S.A., Sa Couto A., Rizzo F., MyNeighbourhood Concept, (2013)
2. Oliveira Á., Campolargo M., Martins M., Human Smart Cities: A Human-Centric Model aiming at the wellbeing and quality of life of citizens eChallenges e-2014 Conference Proceedings, 1–8 (2014)
3. Oliveira Á., Campolargo M., From smart cities to human smart cities Proceedings of the Annual Hawaii International Conference on System Sciences, 2336–2344 (2015)
4. Giovannella C., Smart Territory Analytics: toward a shared vision 47th SIS Scientific Meeting of the Italian Statistical Society, 1–10. , Cagliari, Italy (2014)
5. Giovannella C., Territorial smartness and the relevance of the learning ecosystems IEEE International Smart City Conference (ISC2), 1–5. , Guadalajara, Mexico (2015)
6. Maslow A.H., A Theory of Human Motivation, Psychological Review 50 (4), 370–396 (1943)
7. HSCN, Human Smart Cities Network Manifesto, http://humansmartcities.eu/join-our-network/manifesto/ (2013)
8. Neirotti P., De Marco A., Cagliano A.C., Mangano G., Scorrano F., Current trends in smart city initiatives: Some stylised facts Cities, 38, 25–36 (2014)
9. Stickdorn M., Schneider J., This is Service Design Thinking, BIS Publishers, Amsterdam, The Netherlands, (2011)
10. Norman D.A., The Design of Everyday Things, Basic Books, (1988)
6 Association for Smart Learning Ecosystems and Regional Development (ASLERD) -
aslerd.org 7 Digital Media and Interaction research Center - http://www.cicdigital.org/?page_id=338 8 Instituto Telecomunicações, Aveiro - https://www.it.pt/ITSites/Index/3 9 Câmara Municipal de Águeda - https://www.cm-agueda.pt/ 10 Talents & Treasures - http://www.talents-e-treasures.pt/
Interaction Design and Architecture(s) Journal - IxD&A, N.31, 2016, pp. 32-42
11. Shneiderman B., The eyes have it: a task by data type taxonomy for information visualizations Proc. 1996 IEEE Symp. Vis. Lang., 336–343 (1996)
12. Moeller S., Ammu J., Lau J., Carbo T., Towards Media and Information Literacy Indicators, Paris, France, (2011)
13. GODI, Global Open Data Initiative, http://globalopendatainitiative.org/ (2013) 14. Berners-Lee T., 5 Star Open Data Deployment Scheme,
https://www.w3.org/DesignIssues/LinkedData.html (2006) 15. CMA, Águeda is a Smart City, http://agueda.isasmartcity.com/ (2015) 16. Giovannella C., Moggio F., Toward a general model of the learning experience ICALT
2011, IEEE, 644–645 (2011) 17. GLA, London Datastore, http://data.london.gov.uk/ (2011) 18. DCC, Dublin Dashboard City Intelligence,
http://www.dublindashboard.ie/HealthEducation/stats (2015) 19. O’Brien O., Hudson-Smith A., Milton R., Gray S., UK City Dashboard,
http://oobrien.com/citydashboard/ (2012) 20. Roumpani F., O’Brien O., Hudson-Smith A., Creating, visualizing and modelling the real-
time city Proceedings of Hybrid City II “Subtle rEvolutions” (2013) 21. Suakanto S., Supangkat S.H., Suhardi, Saragih R., Smart city dashboard for integrating
various data of sensor networks Proceedings - International Conference on ICT for Smart Society 2013: “Think Ecosystem Act Convergence”, ICISS 2013, 52–56 (2013)
22. Galego D., Giovannella C., Mealha Ó., An investigation of actors’ differences in the perception of learning ecosystems’ smartness: the case of the Aveiro University in Vasiu, R., Martens, A., and Wolff, A. (eds.) 1st International Conference on Smart Learning Ecosystems and Regional Developments - SLERD2016. Interaction Design & Architecture(s) Journal, Timisoara, Romenia (2016)
23. Giovannella C., Andone D., Dascalu M., Popescu E., Rehm M., Roccasalva G., Smartness of Learning Ecosystems and its bottom-up emergence in six European Campuses. Smart Learning Ecosystems in Smart Regions and Cities, EC-TEL 2015, ASLERD, Toledo, Spain, 1–12 (2015)
24. Galego, D., Giovannella, C., Mealha, O., Determination of the Smartness of a University Campus: the case study of Aveiro. Procedia - Social and Behavioral Sciences | 2nd International Symposium New Metropolitan Perspective: Strategic Planning, Spatial Planning, Economic Programs and Decision Support Tools. - ISTH2020, 223, 147–152 (2016)
Interaction Design and Architecture(s) Journal - IxD&A, N.31, 2016, pp. 32-42