citi basic materials conference · po/tba plant growing producer of polyethylene in europe...
TRANSCRIPT

www.lyondellbasell.com
Citi Basic Materials Conference
Thomas Aebischer
CFO
November 27, 2018
1

www.lyondellbasell.com
The statements in this presentation relating to matters that are not historical facts are forward-looking statements. These forward-looking
statements are based upon assumptions of management which are believed to be reasonable at the time made and are subject to
significant risks and uncertainties. Actual results could differ materially based on factors including, but not limited to, the business cyclicality
of the chemical, polymers and refining industries; the availability, cost and price volatility of raw materials and utilities, particularly the cost of
crude oil, natural gas, and associated natural gas liquids; competitive product and pricing pressures; labor conditions; our ability to attract
and retain key personnel; operating interruptions (including leaks, explosions, fires, weather-related incidents, mechanical failure,
unscheduled downtime, supplier disruptions, labor shortages, strikes, work stoppages or other labor difficulties, transportation interruptions,
spills and releases and other environmental risks); the supply/demand balances for our and our joint ventures’ products, and the related
effects of industry production capacities and operating rates; our ability to achieve expected cost savings and other synergies; our ability to
successfully execute projects and growth strategies; any proposed business combination, the expected timetable for completing any
proposed transactions and the receipt of any required governmental approvals, future financial and operating results, benefits and synergies
of any proposed transactions, future opportunities for the combined company; legal and environmental proceedings; tax rulings,
consequences or proceedings; technological developments, and our ability to develop new products and process technologies; potential
governmental regulatory actions; political unrest and terrorist acts; risks and uncertainties posed by international operations, including
foreign currency fluctuations; and our ability to comply with debt covenants and service our debt. Additional factors that could cause results
to differ materially from those described in the forward-looking statements can be found in the “Risk Factors” section of our Form 10-K for
the year ended December 31, 2017, which can be found at www.LyondelBasell.com on the Investor Relations page and on the Securities
and Exchange Commission’s website at www.sec.gov.
The illustrative results or returns of growth projects are not in any way intended to be, nor should they be taken as, indicators or guarantees
of performance. The assumptions on which they are based are not projections and do not necessarily represent the Company’s
expectations and future performance. You should not rely on illustrated results or returns or these assumptions as being indicative of our
future results or returns.
This presentation contains time sensitive information that is accurate only as of the date hereof. Information contained in this presentation
is unaudited and is subject to change. We undertake no obligation to update the information presented herein except as required by law.
Reconciliations for our non-GAAP measures can be found in the Appendix to this presentation or on our website at www.LyondellBasell.com/investorrelations.
Cautionary Statement
2

www.lyondellbasell.com
LyondellBasell A Strong, Global Company Delivering Outstanding Performance
3
(1) Enterprise value means market capitalization plus preferred equity (non-controlling interests), total debt and minority interest less cash and cash equivalents and short term investments as of September 30, 2018.
(2) Source IHS, LYB. 2017 ranking as of Dec. 31, 2017
GLOBAL
Manufacturing in 24 countries and our products are sold in more than 100 countries
$47 billon enterprise value(1)
LEADING(2)
OLEFINS & POLYOLEFINS
Expanded polypropylene compounds capacity in
China, India and Europe
Building the first world-scale Hyperzone HDPE plant
Acquired A. Schulman
INTERMEDIATES & DERIVATVIES
Began construction for the world’s largest
PO/TBA plant
GROWING
Producer of
polyethylene in
Europe
POLYETHYLENE
ETHYLENE
Producer of
polypropylene in
N. America and Europe
POLYPROPYLENE
PROPYLENE
Producer of
propylene oxide
in the world
PROPYLENE
OXIDE
PROPYLENE
www.lyondellbasell.com
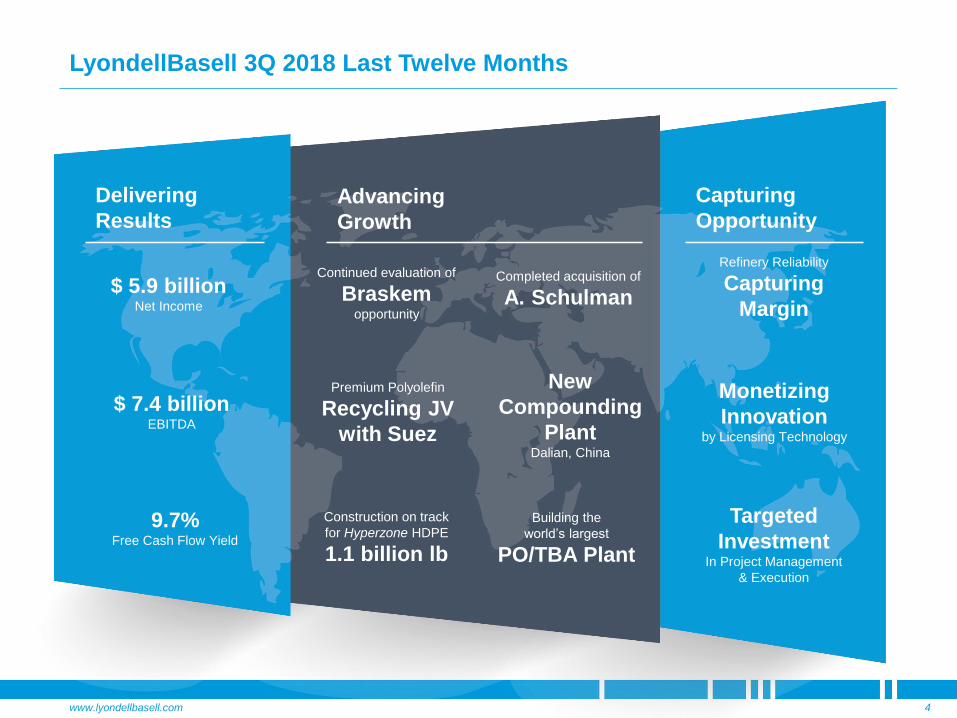
LyondellBasell 3Q 2018 Last Twelve Months
4
Delivering
ResultsAdvancing
Growth
Capturing
Opportunity
$ 7.4 billionEBITDA
Targeted
Investment In Project Management
& Execution
Monetizing
Innovationby Licensing Technology
Refinery Reliability
Capturing
Margin
Construction on track
for Hyperzone HDPE
1.1 billion lb
Building the
world’s largest
PO/TBA Plant
New
Compounding
PlantDalian, China
Premium Polyolefin
Recycling JV
with Suez
9.7% Free Cash Flow Yield
$ 5.9 billionNet Income
Continued evaluation of
Braskemopportunity
Completed acquisition of
A. Schulman

www.lyondellbasell.com
LYB Portfolio Diversity Increases Earnings Resiliency
5
EPS
USD per share
Segment EBITDA
LyondellBasell Profitability
Stable:
Global Portfolio
Improved:
I&D performance
Refining operations
Growing:
Acquisition of A. Schulman
Technology licensing
2,000
4,000
$6,000
2016 2016 2017 2017 3Q 18 LTM 3Q 18 LTM
2016 2017 3Q18 LTM
USD, millions
O&P - AM, O&P - EAI and APS EBITDA
I&D, Refining and Technology EBITDA
4
8
12
16
$20
2,000
4,000
6,000
8,000
$10,000
2016 2017 3Q18LTM2016 2017 3Q18 LTM
EBITDAUSD, millions
EBITDA EPS

www.lyondellbasell.com
2
4
6
8
10
12
14
16
O&P - EAI O&P - Americas Advanced PolymerSolutions
lbs., billions
A. Schulman PE + PP PPC Catalloy & PB-1
0.0
0.5
1.0
1.5
2.0
2.5
$3.0
O&P - EAI O&P - Americas Advanced Polymer
Solutions
USD, billions
A. Schulman PE + PP PPC, Catalloy and PB-1
Advanced Polymer Solutions: Creating a New Platform for Growth
6
2017 Sales Volume(1)
▪ A. Schulman ~ 2.4 Blb
▪ LyondellBasell ~ 3.4 Blb
▪ PP Compounds
▪ Catalloy
▪ PB-1
Product shift to new segment
Catalloy & PB-1
2017 EBITDA(2)
EBITDA shift to
new segment
PPC, Catalloy & PB-1
▪ A. Schulman ~ $200 MM
▪ LyondellBasell ~ $440 MM
▪ PP Compounds
▪ Catalloy
▪ PB-1
(1) 2017 sales volume represents LyondellBasell’s third party polyethylene, polypropylene, polypropylene compounds, Catalloy and polybutene-1 sales for the twelve-
month period ended December 31, 2017. A. Schulman was acquired on August 21, 2018. A. Schulman information was obtained from publicly available quarterly
release data and management estimate for the twelve-month period ended November 30, 2017.
(2) A. Schulman EBITDA is adjusted EBITDA based on publicly available quarterly release data for the twelve-month period ended November 30, 2017.
www.lyondellbasell.com
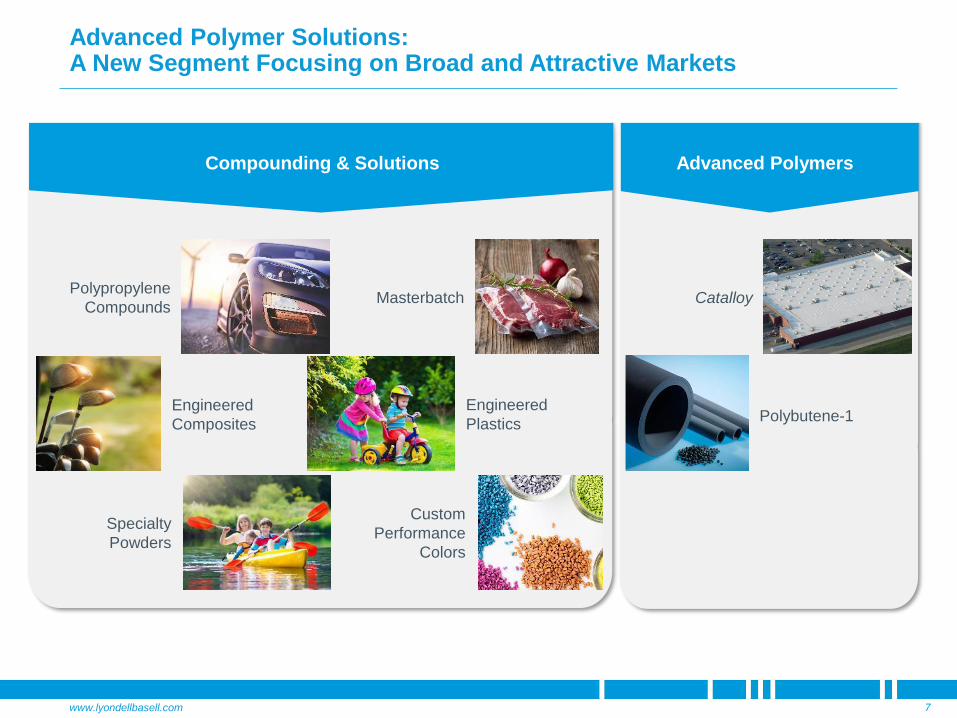
Advanced Polymer Solutions: A New Segment Focusing on Broad and Attractive Markets
7
Masterbatch
Engineered
Composites
Specialty
Powders
Engineered
Plastics
Custom
Performance
Colors
Polypropylene
Compounds
Polybutene-1
Catalloy
Advanced PolymersCompounding & Solutions

www.lyondellbasell.com
Olefins & Polyolefins - Americas: Strong Demand Fundamentals Support Polyolefin Chain Margins
8
Key Messages
▪ Proven operational reliability
▪ U.S. feedstock advantaged
▪ Strong earnings and cash generator in
diverse market
EBITDA History
2017 Product Capacities and Rankings(1)
Botlek, The Netherlands
Product Capacity
(Blbs)
North America
Ranking
Ethylene 11.8 #2
Polyethylene 6.4 #3
Polypropylene 3.3 #1
(1) Source: IHS and LYB. LYB wholly-owned capacity and proportional share of JV capacity as of December 31, 2017. Polypropylene does not include Catalloy which was shifted to the new Advanced Polymer Solutions segment.
Corpus Christi, Texas
1,000
2,000
$3,000
2016 2017 3Q18 LTM
USD, millions

www.lyondellbasell.com
Recent Mont Belvieu ethane price volatility
~ 25 - 60 ¢/gal
Aggravating factors:
▪ New ethylene capacity
▪ Fewer fractionation additions
▪ Pipeline constraints
Relieving factors:
▪ Ethylene feedstock flexibility
▪ New fractionation capacity
▪ Fewer ethylene capacity additions
▪ Pipeline builds/expansions/repurposing
▪ Ethylene industry downtime
Cracker Flexibility & Midstream Investment: Expected to Reduce Ethane Price Volatility by 2020
9
Source: EIA, IHS, Jacobs Consultancy and LYB estimates. Gulf coast data represents PADD 3. Minimum ethane demand includes ethane exports, ethane demand for ethane crackers and minimum ethane demand for flexible crackers. Flexible ethane demand reflects the ability of flexible crackers to switch to alternative feeds similar to levels consumed during 2006-2008.
Gulf Coast Ethane Demand & Supply from Fractionation
500
1,000
1,500
2,000
2,500
2014 2015 2016 2017 2018 2019 2020 2021
bpd, thousands
Flexible Ethane Demand
Minimum Ethane Demand
Ethane Supply from Fractionation
www.lyondellbasell.com
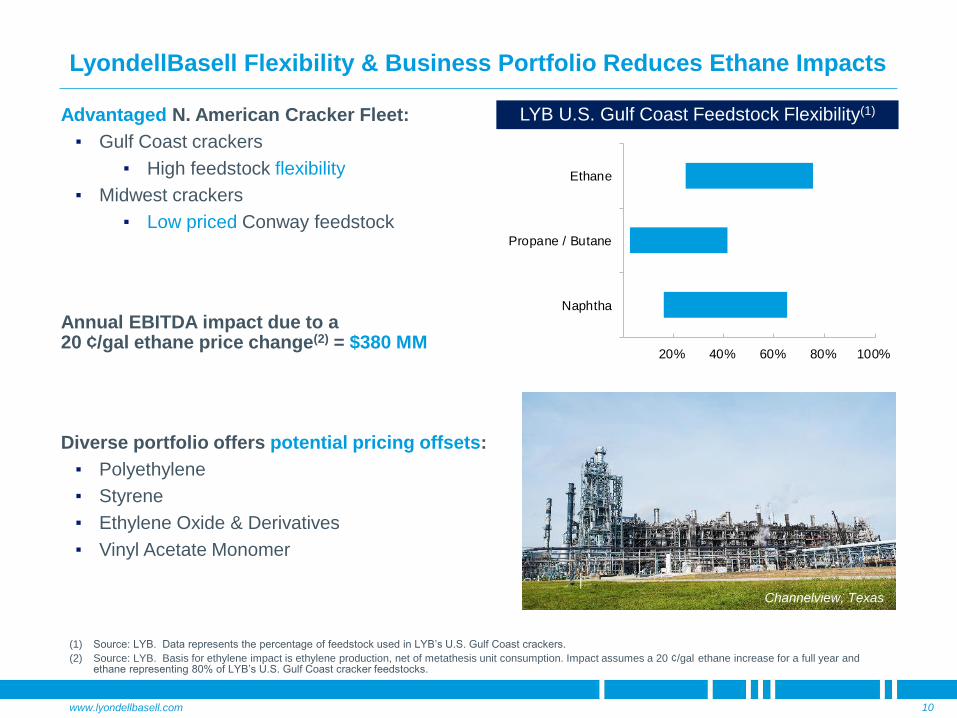
Advantaged N. American Cracker Fleet:
▪ Gulf Coast crackers
▪ High feedstock flexibility
▪ Midwest crackers
▪ Low priced Conway feedstock
Annual EBITDA impact due to a 20 ¢/gal ethane price change(2) = $380 MM
Diverse portfolio offers potential pricing offsets:
▪ Polyethylene
▪ Styrene
▪ Ethylene Oxide & Derivatives
▪ Vinyl Acetate Monomer
LyondellBasell Flexibility & Business Portfolio Reduces Ethane Impacts
10
LYB U.S. Gulf Coast Feedstock Flexibility(1)
(1) Source: LYB. Data represents the percentage of feedstock used in LYB’s U.S. Gulf Coast crackers.
(2) Source: LYB. Basis for ethylene impact is ethylene production, net of metathesis unit consumption. Impact assumes a 20 ¢/gal ethane increase for a full year and ethane representing 80% of LYB’s U.S. Gulf Coast cracker feedstocks.
Channelview, Texas
20% 40% 60% 80% 100%
Naphtha
Propane / Butane
Ethane

www.lyondellbasell.com
Demand GrowthCapacity Additions
LYB’s Hyperzone PE Technology is Poised to Capture HDPE Demand
11
5
10
15
2015-2017 2018-2020Estimate
World Scale Plants (1)
LDPE 5
10
15
2015-2017 2018-2020Estimate
World Scale Plants (1)
5
10
15
2015-2017 2018-2020Estimate
World Scale Plants (1)
La Porte Hyperzone HDPE
▪ 1.1 billion pounds per year
▪ Estimated investment: ~$725 million
▪ Startup 2019
▪ Estimated EBITDA(2): $150 - $200 MM/year
(1) Source: IHS polyethylene supply-demand data with an operating rate of 90%. World scale plant equivalents are 1.1 billion pounds.
(2) For the purpose of this slide, estimated EBITDA for Hyperzone Polyethylene is volume times average 2015-2017 margins.
LLDPE
HDPE
La Porte, Texas

www.lyondellbasell.com
Olefins & Polyolefins – Europe, International and Asia: Leveraging O&P Restructuring in a Diverse Market
12
Key Messages
▪ Capacity leader in European polyethylene
and polypropylene
▪ Stable portfolio of wholly-owned and joint
venture assets
▪ Modestly growing market with limited capacity
additions
EBITDA History
2017 Product Capacities and Rankings(1)
Botlek, The Netherlands
Product Europe
Capacity
(Blbs)
Europe
Ranking
Ethylene 4.3 #5
Polyethylene 4.8 #1
Polypropylene 5.2 #1
(1) Source: IHS and LYB. LYB wholly-owned capacity and proportional share of JV capacity as of December 31, 2017. Polypropylene does not include Catalloy which was shifted to the new Advanced Polymer Solutions segment.
Wesseling, Germany
1,000
2,000
$3,000
2016 2017 3Q18 LTM
USD, millions

www.lyondellbasell.com
Intermediates and Derivatives: Structural Changes and Reliable Operations Capturing Opportunities
13
Key Messages
▪ Improved contracting strategies
▪ Broad product portfolio with feedstock
integration
▪ Leading market positions and differential
technologies create a platform for growth
EBITDA History
2017 Product Capacities and Rankings(1)
Botlek, The Netherlands
Product Capacity Global Ranking
Propylene
Oxide
2.8 Blbs #2
Oxyfuels 75 MBPD #2
Styrene 3.8 Blbs #3
(1) Source: IHS and LYB. LYB wholly-owned capacity and proportional share of JV capacity as of December 31, 2017
1,000
2,000
$3,000
2016 2017 3Q18 LTM
USD, millions

www.lyondellbasell.com
Advancing Our Leading PO/TBA Technology and Market Position
14
Value-driven growth supported by advantaged feedstocks and technology
(1) For the purpose of this slide, estimated EBITDA for Propylene Oxide / TBA is volume times 2015-2017 average margins.
▪ 1.0 billion pounds Propylene Oxide, 2.2 billion pounds TBA
▪ Est. cost: ~$2.4 billion
▪ Groundbreaking – Mid 2018
▪ Startup 2021
▪ Estimated EBITDA(1): $350 - $450 MM/year
www.lyondellbasell.com
2
4
6
8
$10
5
10
15
20
$25
Jan-19 Jul-19 Jan-20 Jul-20 Jan-21 Jul-21
ULSD - Brent,USD per bbl
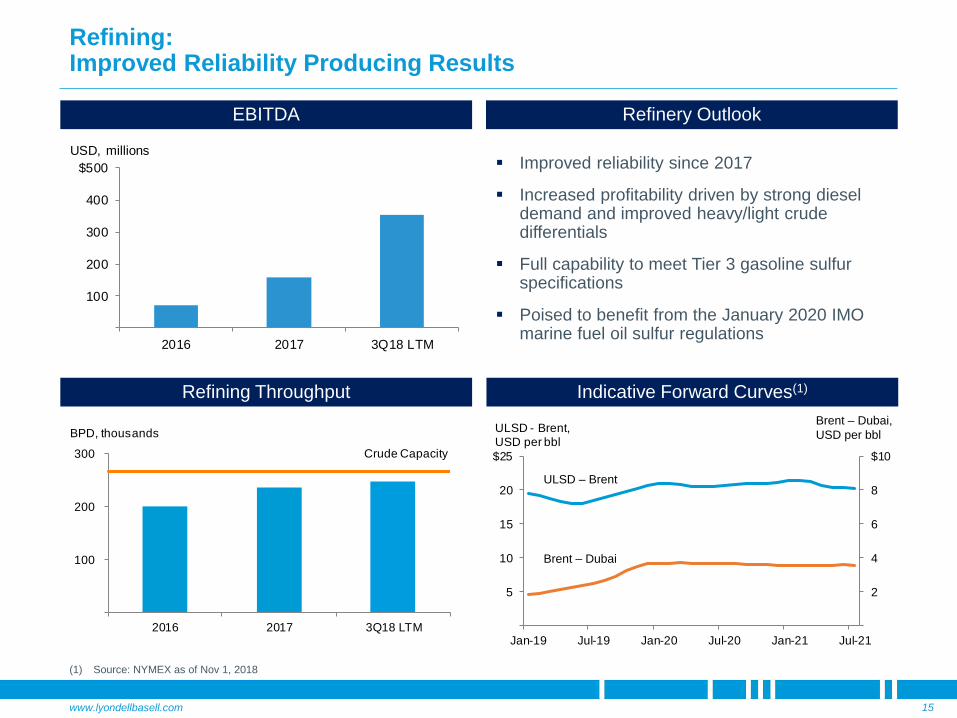
▪ Improved reliability since 2017
▪ Increased profitability driven by strong diesel demand and improved heavy/light crude differentials
▪ Full capability to meet Tier 3 gasoline sulfur specifications
▪ Poised to benefit from the January 2020 IMO marine fuel oil sulfur regulations
Refining: Improved Reliability Producing Results
15
EBITDA
Refining Throughput
Refinery Outlook
(1) Source: NYMEX as of Nov 1, 2018
Indicative Forward Curves(1)
Brent – Dubai,
USD per bbl
ULSD – Brent
Brent – Dubai 100
200
300
2016 2017 3Q18 LTM
BPD, thousands
Crude Capacity
100
200
300
400
$500
2016 2017 3Q18 LTM
USD, millions
www.lyondellbasell.com
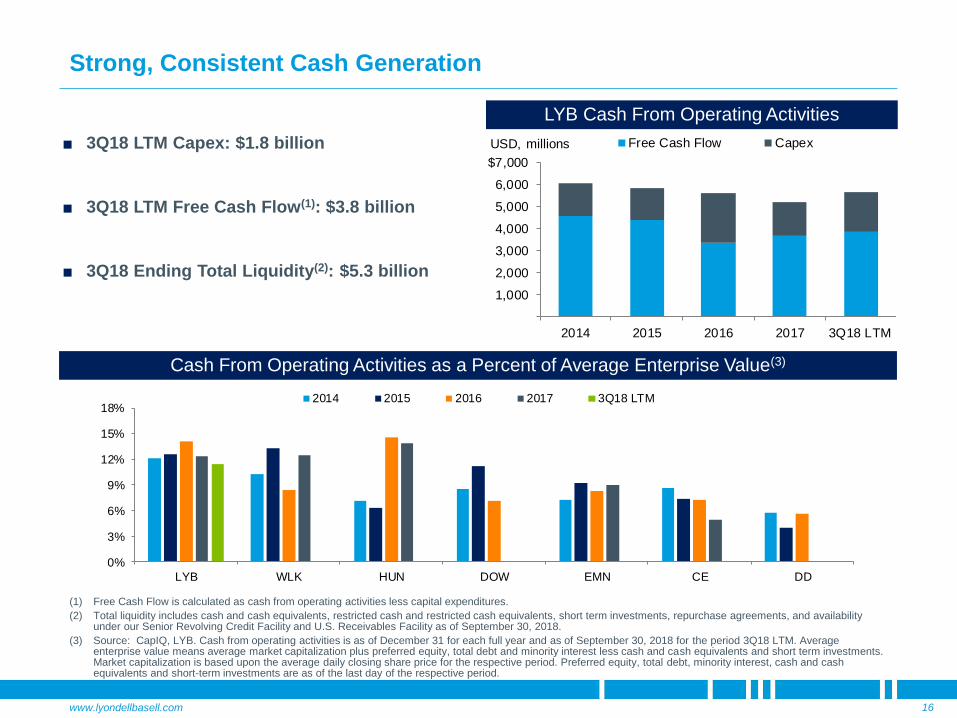
Strong, Consistent Cash Generation
16
LYB Cash From Operating Activities
Cash From Operating Activities as a Percent of Average Enterprise Value(3)
(1) Free Cash Flow is calculated as cash from operating activities less capital expenditures.
(2) Total liquidity includes cash and cash equivalents, restricted cash and restricted cash equivalents, short term investments, repurchase agreements, and availability under our Senior Revolving Credit Facility and U.S. Receivables Facility as of September 30, 2018.
(3) Source: CapIQ, LYB. Cash from operating activities is as of December 31 for each full year and as of September 30, 2018 for the period 3Q18 LTM. Average enterprise value means average market capitalization plus preferred equity, total debt and minority interest less cash and cash equivalents and short term investments. Market capitalization is based upon the average daily closing share price for the respective period. Preferred equity, total debt, minority interest, cash and cash equivalents and short-term investments are as of the last day of the respective period.
■ 3Q18 LTM Capex: $1.8 billion
■ 3Q18 LTM Free Cash Flow(1): $3.8 billion
■ 3Q18 Ending Total Liquidity(2): $5.3 billion
1,000
2,000
3,000
4,000
5,000
6,000
$7,000
2014 2015 2016 2017 3Q18 LTM
USD, millions Free Cash Flow Capex
0%
3%
6%
9%
12%
15%
18%
LYB WLK HUN DOW EMN CE DD
2014 2015 2016 2017 3Q18 LTM
www.lyondellbasell.com
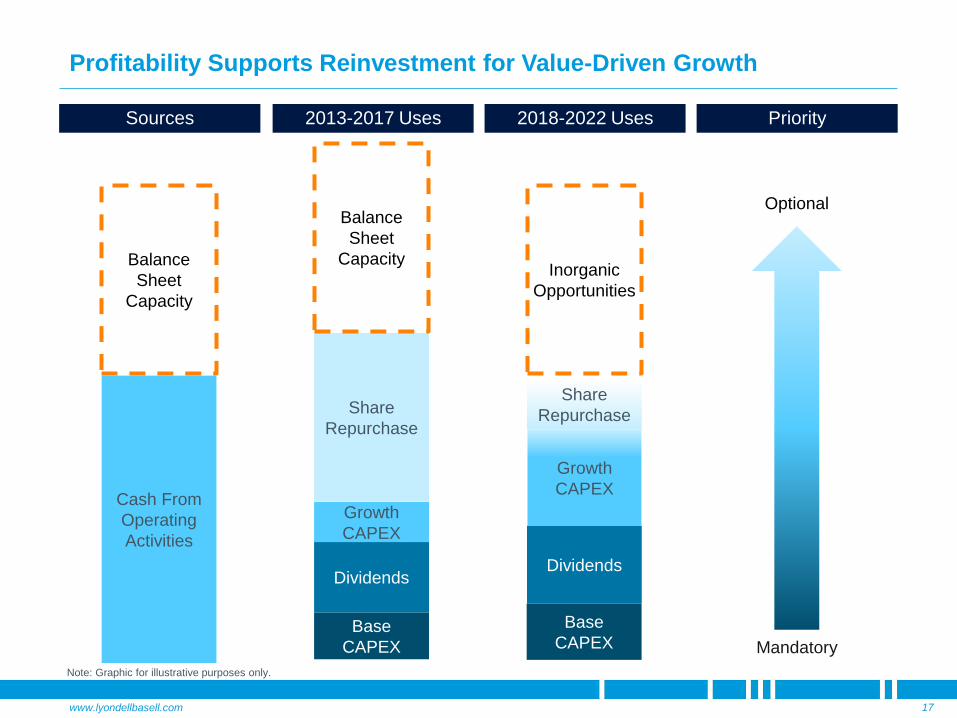
Sources 2013-2017 Uses Priority
Cash From
Operating
Activities
Balance
Sheet
Capacity
Optional
Mandatory
Profitability Supports Reinvestment for Value-Driven Growth
17
Base
CAPEX
Dividends
Growth
CAPEX
Share
Repurchase
Balance
Sheet
Capacity
2018-2022 Uses
Base
CAPEX
Dividends
Growth
CAPEX
Share
Repurchase
Inorganic
Opportunities
Note: Graphic for illustrative purposes only.
www.lyondellbasell.com
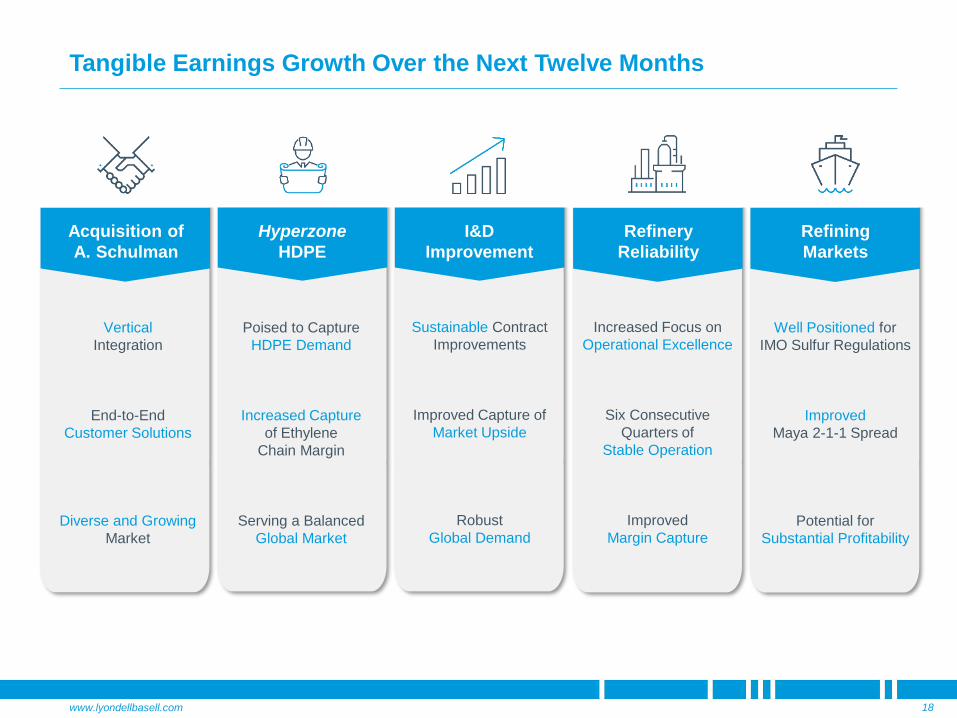
Tangible Earnings Growth Over the Next Twelve Months
18
Hyperzone
HDPE
Refinery
Reliability
I&D
Improvement
Vertical
Integration
End-to-End
Customer Solutions
Diverse and Growing
Market
Poised to Capture
HDPE Demand
Increased Capture
of Ethylene
Chain Margin
Serving a Balanced
Global Market
Acquisition of
A. Schulman
Sustainable Contract
Improvements
Improved Capture of
Market Upside
Robust
Global Demand
Increased Focus on
Operational Excellence
Six Consecutive
Quarters of
Stable Operation
Improved
Margin Capture
Well Positioned for
IMO Sulfur Regulations
Improved
Maya 2-1-1 Spread
Potential for
Substantial Profitability
Refining
Markets

www.lyondellbasell.com
Growth Guided by Strategic Goals
19
Leverage Core Strengths:▪ Safe & reliable operations
▪ Cost discipline
▪ Global reach and broad portfolio
Advance Profitable Growth:▪ Focus on advantaged and
differentiated products and
markets
Capture Opportunities:▪ Consistent with LYB strengths
▪ Create tangible value
Consistent
Top-Quartile
TSR
MAINTAIN INVESTMENT-GRADE CREDIT RATING
www.lyondellbasell.com
Appendix
20

www.lyondellbasell.com
-40
-30
-20
-10
0
PE PPlbs., billions
2017 2022
50
100
150
200
250
1990 1994 1998 2002 2006 2010 2014 2018Fcst.
lbs., billions
PE PP
Global Macro Trends - Demographics Driving Demand
21
2016 Polyolefins Consumption
World PE and PP Demand
Source: IHS.
1. China polyolefin trade deficit is production less domestic demand.
China Polyolefin Trade Deficit(1)
’90 – ’16
PE: 4.4%
PP: 6.6%
’11 – ’16
PE: 3.6%
PP: 4.9%
’15 – ‘16
PE: 3.9%
PP: 4.4%0
100
200
300
400
2012 2013 2014 2015 2016 2017 2018 2019 2020 2021
China India Western Europe U.S.
Households, millions
20
40
60
80
0 10 20 30 40 $50GDP per capita, USD thousands
Consumption, lb/personN. America
W. EuropeNortheast
AsiaSoutheast
Asia
Indian Subcontinent
PE
PP
Upper/Middle Class Households
www.lyondellbasell.com
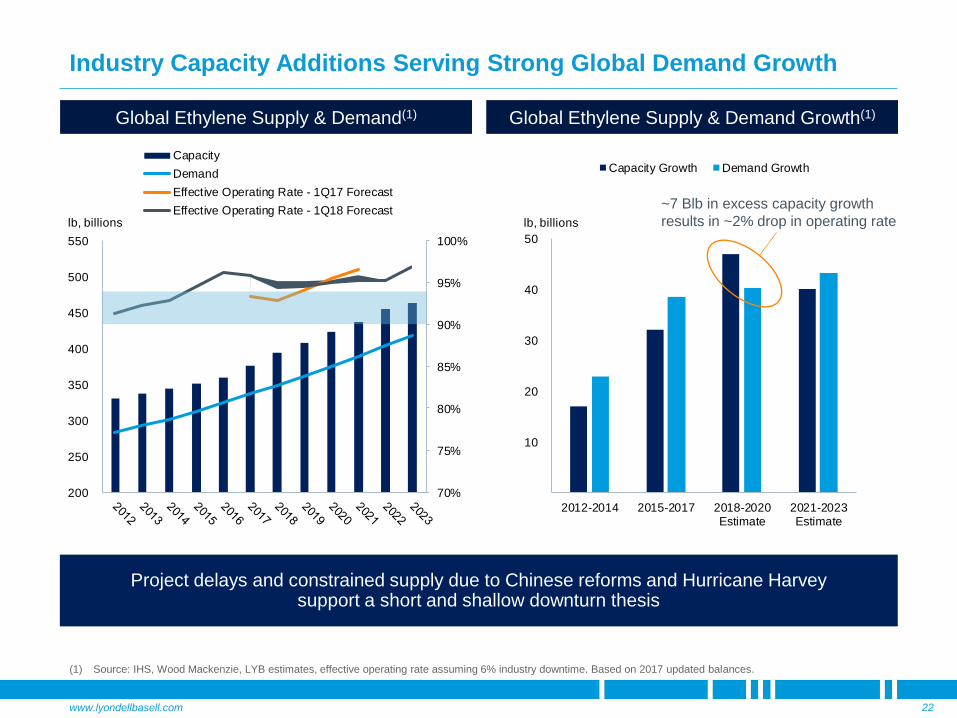
Project delays and constrained supply due to Chinese reforms and Hurricane Harvey support a short and shallow downturn thesis
Industry Capacity Additions Serving Strong Global Demand Growth
22
Global Ethylene Supply & Demand(1)
(1) Source: IHS, Wood Mackenzie, LYB estimates, effective operating rate assuming 6% industry downtime. Based on 2017 updated balances.
Global Ethylene Supply & Demand Growth(1)
70%
75%
80%
85%
90%
95%
100%
200
250
300
350
400
450
500
550
lb, billions
Capacity
Demand
Effective Operating Rate - 1Q17 Forecast
Effective Operating Rate - 1Q18 Forecast
10
20
30
40
50
2012-2014 2015-2017 2018-2020Estimate
2021-2023Estimate
lb, billions
Capacity Growth Demand Growth
~7 Blb in excess capacity growth
results in ~2% drop in operating rate

www.lyondellbasell.com
Majority of New N. American Industry Capacity Already in the Market
23
2016-2019: N. America Capacity Startups(1)
(1) Source: IHS and LYB estimates.
(2) Source: IHS and LYB estimates. Polyethylene domestic demand growth is YTD 2018 compared to YTD 2017. YTD 2018 includes actuals for 2Q18 and forecasts for 3Q18.
2016-2019: Polyethylene Trade(1)
▪ Ethylene units are running well
▪ New PE capacity is in the market
▪ PE exports are expected to increase
Status & Impact of New Capacity
100
200
Net Exports Net Imports
lbs., billions
North America China
Asia ex. China Europe
Middle East Rest of World
2018 YTD: Strong Operations and Markets(2)
~ 65% of 19 Blbs of Polyethylene
~ 65% of 24 Blbs of Ethylene
Ethylene
Effective
Operating Rate
Polyethylene
Domestic
Demand Growth
U.S. & Canada 94% 5.3%
Northeast Asia 98% 6.3%
Europe 95% 1.9%

www.lyondellbasell.com
This presentation makes reference to certain “non-GAAP” financial measures as defined in Regulation G of the U.S. Securities Exchange Act of 1934, as amended. The non-GAAP measures we have presented include EBITDA, LTM Adjusted EBITDA and LTM Adjusted EBITDA Margin. We report our financial results in accordance with U.S. generally accepted accounting principles, but believe that certain non-GAAP financial measures, such as EBITDA and earnings provide useful supplemental information to investors regarding the underlying business trends and performance of the company's ongoing operations and are useful for period-over-period comparisons of such operations. Non-GAAP financial measures should be considered as a supplement to, and not as a substitute for, or superior to, the financial measures prepared in accordance with GAAP.
EBITDA, as presented herein, may not be comparable to a similarly titled measure reported by other companies due to differences in the way the measure is calculated. We calculate EBITDA as income from continuing operations plus interest expense (net), provision for (benefit from) income taxes, and depreciation & amortization. EBITDA should not be considered an alternative to profit or operating profit for any period as an indicator of our performance, or as an alternative to operating cash flows as a measure of our liquidity.
Additionally, LTM Adjusted EBITDA, as presented herein, may not be comparable to similarly titled measures of A. Schulman or as reported by other companies due to differences in the way the measure is calculated. LTM Adjusted EBITDA, as presented for LyondellBasellPolypropylene Compounding (PPC) business, is calculated based upon a standard inventory costing methodology. For GAAP purposes, we present EBITDA for our Olefins and Polyolefins Europe, Asia, and International segment which includes PPC based upon last-in, first-out (LIFO) inventory costing methodology. To date, we have not allocated a ‘LIFO effect’ to PPC as it is not available. As such, we are unable to provide a quantitative reconciliation of Adjusted EBITDA to the most directly comparable GAAP measure. We calculate PPC Adjusted EBITDA in this presentation as income from continuing operations, with cost of goods sold valued at standard cost, plus interest expense (net), provision for (benefit from) income taxes, and depreciation & amortization. Adjusted EBITDA should not be considered an alternative to profit or operating profit for any period as an indicator of our performance, or as an alternative to operating cash flows as a measure of our liquidity.
While we also believe that free cash flow (FCF) and free cash flow yield (FCF Yield) are measures commonly used by investors, free cash flow and free cash flow yield, as presented herein, may not be comparable to similarly titled measures reported by other companies due to differences in the way the measures are calculated. For purposes of this presentation, free cash flow means net cash provided by operating activities minus capital expenditures and free cash flow yield means the ratio of free cash flow to market capitalization.
Additionally, total liquidity, enterprise value and the ratio of cash from operating activities to average enterprise value are measures that provide an indicator of value to investors. For purposes of this presentation, total liquidity includes cash and cash equivalents, restricted cash and restricted cash equivalents, short term investments, repurchase agreements, and availability under our Senior Revolving Credit Facility and U.S. Receivables Securitization Facility. Enterprise value means market capitalization plus preferred equity (non-controlling interests), total debt and minority interest less cash and cash equivalents and short term investments. The ratio of cash from operating activities to average enterprise value means cash from operating activities divided by average enterprise value. Average enterprise value means average market capitalization plus preferred equity (non-controlling interests), total debt and minority interest less cash and cash equivalents and short term investments.
Reconciliations for our non-GAAP measures can be found on our website at www.lyondellbasell.com/investorrelations.
Information Related to Financial Measures
24

www.lyondellbasell.com
Enterprise Value
25
Calculation of Enterprise Value
In Millions of Dollars, except share amounts
September 30,
2018
Common Shares Outstanding 387,177,776
Closing Price $ 102.51
Market Capitalization 39,690
Current Maturities of Long Term Debt $ 984
Short-Term Debt 214
Long-Term Debt 7,471 8,669
Redeemable noncontrolling interests 123
Noncontrolling Interests 25
Less:
Cash and Cash Equivalents 521
Short-Term Investments 944
Enterprise Value 47,042$
Enterprise Value, in billions $ 47

www.lyondellbasell.com
EBITDA by Segment to EBITDA
26
For the Year
Ended
For the Year
Ended
For the Year
Ended
Last Twelve
Months
In Millions of Dollars
December 31,
2016
December 31,
2017
December 31,
2017
September 30,
2017
September 30,
2018
September 30,
2018(a)
EBITDA:
Olefins & Polyolefins - Americas 2,788$ 2,899$ 2,899$ 2,130$ 2,131$ 2,900$
Olefins & Polyolefins - EAI 1,729 1,927 1,927 1,638 1,036 1,325
Intermediates & Derivatives 1,333 1,490 1,490 1,080 1,632 2,042
Advanced Polymer Solutions 427 438 438 356 314 396
Refining 72 157 157 53 251 355
Technology 262 223 223 155 267 335
Other (9) - - (4) 24 28
Continuing 6,602 7,134$ 7,134$ 5,408$ 5,655$ 7,381$
of the current year.
Reconciliation of EBITDA by Segment to EBITDA
For the Nine Months Ended
(a) Last twelve months EBITDA is calculated as annual EBITDA for the prior year less EBITDA for the first nine months of the prior year plus EBITDA for the first nine months

www.lyondellbasell.com
Net Income to EBITDA
27
Reconciliation of Net Income To EBITDA
For the Year
Ended
Last Twelve
Months
In Millions of Dollars
December 31,
2014
December 31,
2015
December 31,
2016
December 31,
2017
December 31,
2017
September 30,
2017
September 30,
2018
September 30,
2018
Net Income(a)(c)
$ 4,168 4,474$ 3,837$ 4,877$ 4,877$ 2,983$ 3,998$ 5,892$
Loss from Discontinued Operations 4 5 10 18 18 14 3 7
Income from Continuing Operations(a)(c)
4,172 4,479 3,847 4,895 4,895 2,997 4,001 5,899
Add:
Provision for (benefit from) Income Taxes(a)
1,540 1,730 1,386 598 598 1,154 514 (42)
Depreciation and Amortization 1,019 1,047 1,064 1,174 1,174 876 908 1,206
Interest expense, net(b)
319 277 305 467 467 381 232 318
EBITDA(d)
7,050$ 7,533$ 6,602$ 7,134$ 7,134$ 5,408$ 5,655$ 7,381$
(c) Includes an after-tax gain of $103 million in 2017 on the sale of our interest in Geosel.
(d) Includes a pre-tax gain of $108 million in 2017 on the sale of our interest in Geosel.
For the Nine Months Ended
(a) Includes an $819 million non-cash tax benefit in 2017 related to the lower federal income tax rate resulting from the U.S. Tax Cuts and Jobs Act enacted in December 2017. Also includes a $346 million non-cash benefit
For the Years Ended
in 2018 from the release of unrecognized tax benefits and associated accrued interest.
(b) Includes pre-tax charges totaling $113 million in 2017 related to the redemption of $1,000 million aggregate principal amount of our then ourstanding 5% Senior Notes due 2019.

www.lyondellbasell.com
Free Cash Flow Yield
28
Calculation of Free Cash Flow Yield
Last Twelve
In Millions of Dollars (except share data)
December 31,
2017
March 31,
2018
June 30,
2018
September 30,
2018
September 30,
2018
Net Cash Provided by Operating Activities $ 1,482 $ 1,006 $ 1,727 $ 1,441 $ 5,656
Less:
Capital Expenditures 401 429 496 482 1,808
Free Cash Flow $ 1,081 $ 577 $ 1,231 $ 959 $ 3,848
Divided by:
Market Capital:
Common stock outstanding 387,177,776
Closing Share Price, end of period $ 102.51
Market Capital $ 39,690
Free Cash Flow Yield 9.7%
Three Months Ended
www.lyondellbasell.com
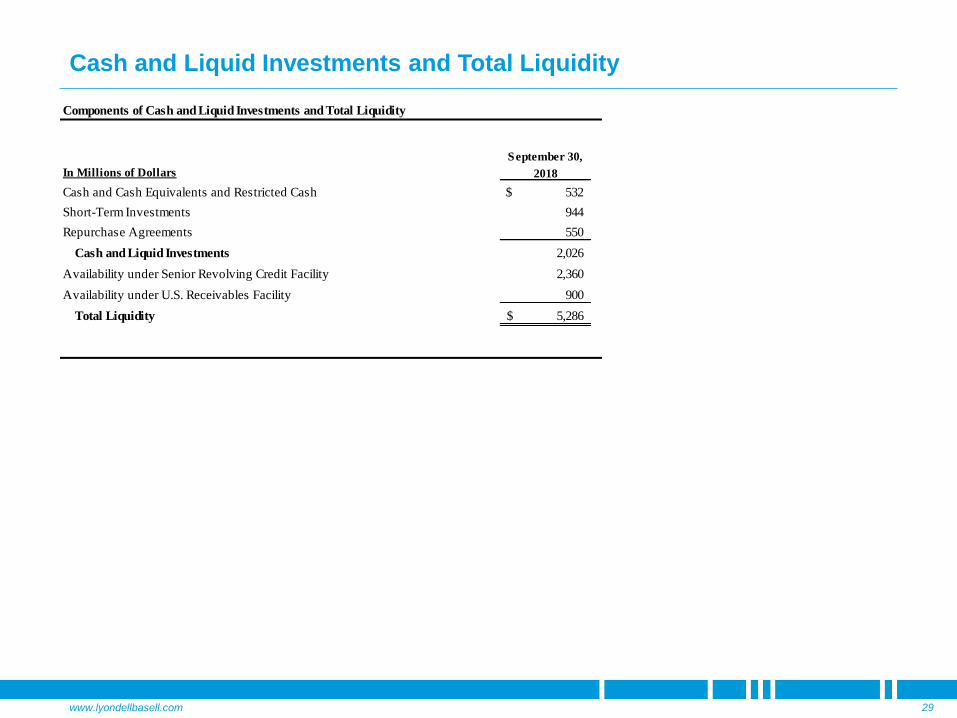
Cash and Liquid Investments and Total Liquidity
29
In Millions of Dollars
September 30,
2018
Cash and Cash Equivalents and Restricted Cash $ 532
Short-Term Investments 944
Repurchase Agreements 550
Cash and Liquid Investments 2,026
Availability under Senior Revolving Credit Facility 2,360
Availability under U.S. Receivables Facility 900
Total Liquidity 5,286$
Components of Cash and Liquid Investments and Total Liquidity

www.lyondellbasell.com
Free Cash Flow to Net Cash Provided by Operating Activities
30
Reconciliation of Free Cash Flow to Net Cash Provided by Operating Activities
Year Ended
Last Twelve
Months(a)
In Millions of Dollars 2014 2015 2016 2017
December 31,
2017
September 30,
2018
September 30,
2018
September 30,
2018
Free Cash Flow $ 4,549 $ 4,402 $ 3,363 $ 3,659 $ 3,659 $ 2,578 $ 2,767 $ 3,848
Add:
Capital Expenditures 1,499 1,440 2,243 1,547 1,547 1,146 1,407 1,808
Net Cash Provided by Operating Activities 6,048$ 5,842$ 5,606$ 5,206$ 5,206$ 3,724$ 4,174$ 5,656$
(a) Last twelve months Free Cash Flow and Capital Expenditures are calculated as annual Free Cash Flow and Capital Expenditures for the prior year less Free Cash Flow and Capital Expenditures for the
Years Ended December 31, Nine Months Ended
first nine months of the prior year plus Free Cash Flow and Capital Expenditures for the first nine months of the current year.

www.lyondellbasell.com
Cash from Operating Activities as a Percent of Average Enterprise Value
31
Cash from Operating Activities as a Percent of Average Enterprise Value
Last Twelve
Months
In Millions of Dollars, except share amounts 2014 2015 2016 2017
September 30,
2018
Cash from Operating Activities $ 6,048 $ 5,842 $ 5,606 $ 5,206 $ 5,656
Average Enterprise Value:
Common Shares Outstanding 486,969,402 440,150,069 404,046,331 394,512,054 387,177,776
Daily Average Closing Price $ 93.66 $ 91.47 $ 81.00 $ 92.00 $ 108.64
Market Capitalization 45,610 40,261 32,728 36,295 42,063
Current Maturities of Long Term Debt 4 4 2 2 984
Short-Term Debt 346 353 594 68 214
Long-Term Debt 6,695 7,671 8,385 8,549 7,471
Redeemable noncontrolling interests - - - - 123
Non controlling interests 30 24 25 1 25
Less:
Cash and Cash Equivalents 1,031 924 875 1,523 521
Short-Term Investments 1,593 1,064 1,147 1,307 944
Enterprise Value 50,061$ 46,325$ 39,712$ 42,085$ 49,415$
Cash from Operating Activities as a
Percent of Enterprise Value 12% 13% 14% 12% 11%
For the Years Ended December 31,