citation analysis: state of the art, good practices, and...
TRANSCRIPT

Citation analysis: State of the art, good
practices, and future developments
Ludo Waltman
Centre for Science and Technology Studies, Leiden University
Bibliometrics & Research Assessment: A Symposium for Librarians
& Information Professionals
Bethesda, Maryland
October 31, 2016

Centre for Science and Technology
Studies (CWTS)
• Research center at Leiden
University in the Netherlands
• History of more than 25 years in
bibliometric and scientometric
research
• Commercial bibliometric analyses
for clients worldwide
1

State of the art
2

3
What do citations measure?
Quality Scientific impact
Relevance
Visibility
Other factors
Reputation
Citations

Citizen bibliometrics vs. professional
bibliometrics
Citizen bibliometrics
• Do-it-yourself bibliometrics by
researchers, research
managers, and librarians
• Publication and citation counts,
impact factor, h-index
• Web of Science, Scopus, Google
Scholar
• Mainly at the level of individual
researchers
Professional bibliometrics
• Bibliometric analyses
supported by professional
bibliometricians or specialized
bibliometric software tools
• Field-normalized indicators
• Web of Science, Scopus
• Mainly at the level of research
institutes
4

Impact factor
5
Impact factor=# citations in 2015 to 2013−2014
# citable articles 2013−2014

Common criticism on impact factor
• Too short citation window
• Too sensitive to highly cited publications
• Inflation by review articles
• Numerator/denominator inconsistency
• Vulnerability to manipulation
• Incomparability between fields
• Impact factor not suitable for assessing individual
publications and their authors
6

7
Skewness of citation distributions

Skewness of citation distributions
8

San Francisco Declaration on
Research Assessment (DORA)
9

10

11

12
h-index
A scientist has index h if h of his papers have at least
h citations each and the other papers have at most
h citations each

Common criticism on h-index
• Undervaluation of highly cited publications
• Dependence on career length
• Inflation by co-authored publications
• Incomparability between fields
13

14
Arbitrariness of the h-index

Consistency of an indicator
15
If two scientists achieve the same performance
improvement, their ranking relative to each other
should remain unchanged

16
Inconsistency of the h-index
Source: Waltman and Van Eck (2012). JASIST, 63(2), 406-415.

Differences in citation density
between fields
17

Field normalization
• Professional bibliometrics is focused mainly on the
institutional level, where field normalization is
essential
• Standard field normalization approach:
– Consider a publication from 2010 in an oncology journal
– The publication has 45 citations
– On average, publications from 2010 in oncology journals have 15
citations
– Normalized citation score of the publication is 45 / 15 = 3
18

Adoption of standard field
normalization approach
19

Limitations of standard field
normalization approach
• Inaccuracies in journal-based field classification
systems
• Multidisciplinary journals
• Fields are too broad
20

Fields are too broad (Clinical
Neurology)
21
Neurosurgery
Neurology

Alternative field normalization
approaches
• Publication-level rather than journal-level field
classification systems (CWTS Leiden Ranking)
• Source normalization (SNIP)
• Flexible field definitions, for instance based on co-
citations (Relative Citation Ratio)
22

4000 fields in publication-level
classification system
23
Social sciences
and humanities
Biomedical and
health sciences
Life and earth
sciences
Physical
sciences and
engineering
Mathematics and
computer science

CWTS Leiden Ranking 2016
(www.leidenranking.com)
24

Source normalization (SNIP)
25
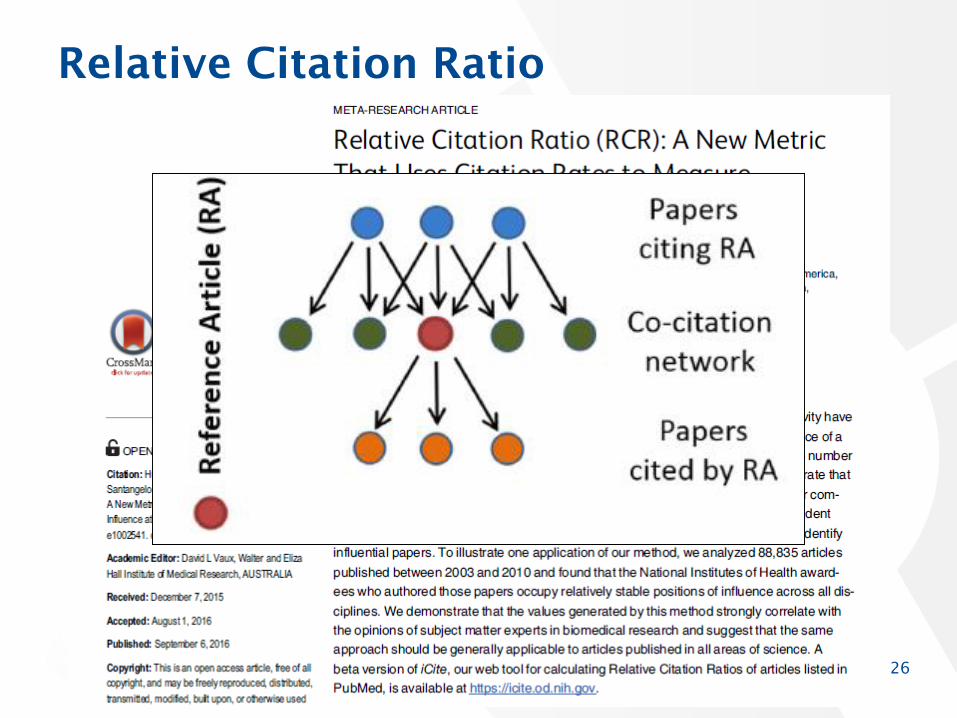
Relative Citation Ratio
26

Challenges in constructing field
normalized indicators
• Accuracy:
– Indicators should provide accurate field-normalized citation
scores
• Transparency/simplicity:
– Indicators should be transparent and easy to explain
• Validity:
– Being cited should never be harmful
– Indicators should behave consistently
27

Good practices
28

29
Diana Hicks, Paul Wouters, Ludo Waltman, Sarah de Rijcke, and Ismael Rafols
Nature, April 23, 2015
www.leidenmanifesto.org

Keep analytical processes open,
transparent and simple
32

Keep analytical processes open,
transparent and simple
• Using non-transparent indicators to support expert
judgment is difficult
• Documenting an indicator in a scientific paper
doesn’t give full transparency
• Citizen bibliometrics may be more transparent than
professional bibliometrics
33

34
Social sciences
and humanities
Biomedical and
health sciences
Life and earth
sciences
Physical
sciences and
engineering
Mathematics and
computer science
Field normalization based on 4000
publication-level fields: Transparent?

Recognize systemic effects of
indicators: Impact factor
35
Source: Hicks et al. (2015). Nature, 520, 429-431.

Recognize systemic effects of
indicators: Impact factor
36% of journals with more than threefold overrepresentation
of self-citations to past two years

Future
developments
37

New data sources: Altmetrics
38

New data source: Full text
39Source: Bertin et al. (2016). JASIST, 67(1), 164-177.

New data sources: Full text
40Source: Rahulja et al. (in press). Natural Language Engineering.

Contextualized scientometrics:
Beyond just indicators
• Indicators should be used to complement expert
judgment
• Complex black-box indicators tend to replace
expert judgment rather than to complement it
• Indicators should be presented together with
contextual information; one should be able to see
what is behind the numbers
41

Contextualized scientometrics:
What is behind the numbers?
42

Contextualized scientometrics:
What is behind the impact factor?
43
PNAS EMBO Journal
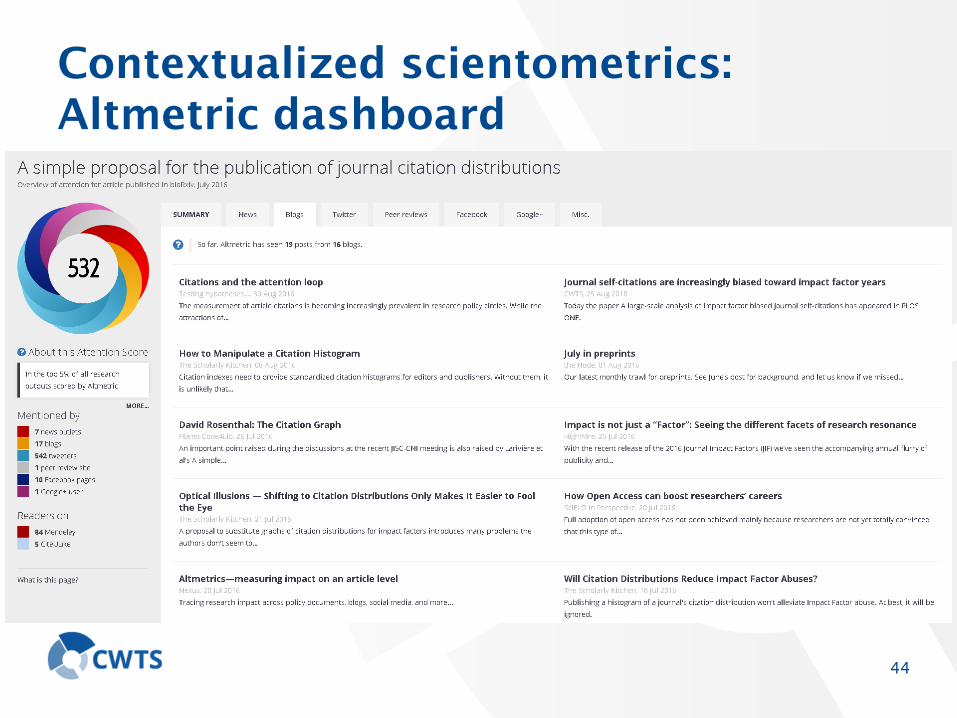
Contextualized scientometrics:
Altmetric dashboard
44

Contextualized scientometrics:
Visual user interfaces
45
