cis 595 bioinformatics lecture 2 based on the book chapter: hunter, l., molecular biology for...
Post on 21-Dec-2015
216 views
TRANSCRIPT
CIS 595 Bioinformatics
Lecture 2Based on the book chapter:
Hunter, L., Molecular Biology for Computer Scientists. Artificial Intelligence for Molecular Biology, Ed. L. Hunter, pp. 1-46, AAAI
Press, 1993.
Contains figures taken from Molecular Biology of the Cell. 4th ed.
Alberts, B., Johnson, A., Lewis, J., Raff, M., Roberts, K., Walter, P.,New York: Garland Publishing; 2002.:
Available fromhttp://www.ncbi.nlm.nih.gov/books/

DNA
• All of the genetic information in any living creature is stored in deoxyribonucleic acid (DNA) and ribonucleic acid (RNA)
• DNA - polymers of four simple nucleic acid units, called nucleotides.
• Four nucleotides (or bases): – Purines: adenine (A) and guanine (G)– Pyrimidines: cytosine (C) and thymine (T) (uracil: U)
• Each nucleotide consists of – one of two base molecules (a purine or a pyrimidine)– sugar (ribose in RNA and deoxyribose DNA)– one or more phosphate groups.

Nucleic Acids
Figure 4-3. DNA and its building blocks. DNA is made of four types of nucleotides, which are linked covalently into a polynucleotide chain (a DNA strand) with a sugar-phosphate backbone from which the bases (A, C, G, and T) extend. A DNA molecule is composed of two DNA strands held together by hydrogen bonds between the paired bases. The arrowheads at the ends of the DNA strands indicate the polarities of the two strands, which run antiparallel to each other in the DNA molecule. In the diagram at the bottom left of the figure, the DNA molecule is shown straightened out; in reality, it is twisted into a double helix, as shown on the right. For details, see Figure 4-5
Genes and Genetic Code
• Genetic information can be stored in several DNA molecules (chromosomes)– In diploids, each chromosome contains two similar
DNA molecules, one from each parent– Bacteria have a single circular chromosome
• Primary role of DNA: carry the encoding of the proteins– Each triplet of nucleotides (called codon) codes for a
single AA– Stop codons define the end of a protein– Open reading frame: long enough stretch of codons
without intervening stop codons– There are 6 different ways to start parsing a segment
of DNA
Chromosomes
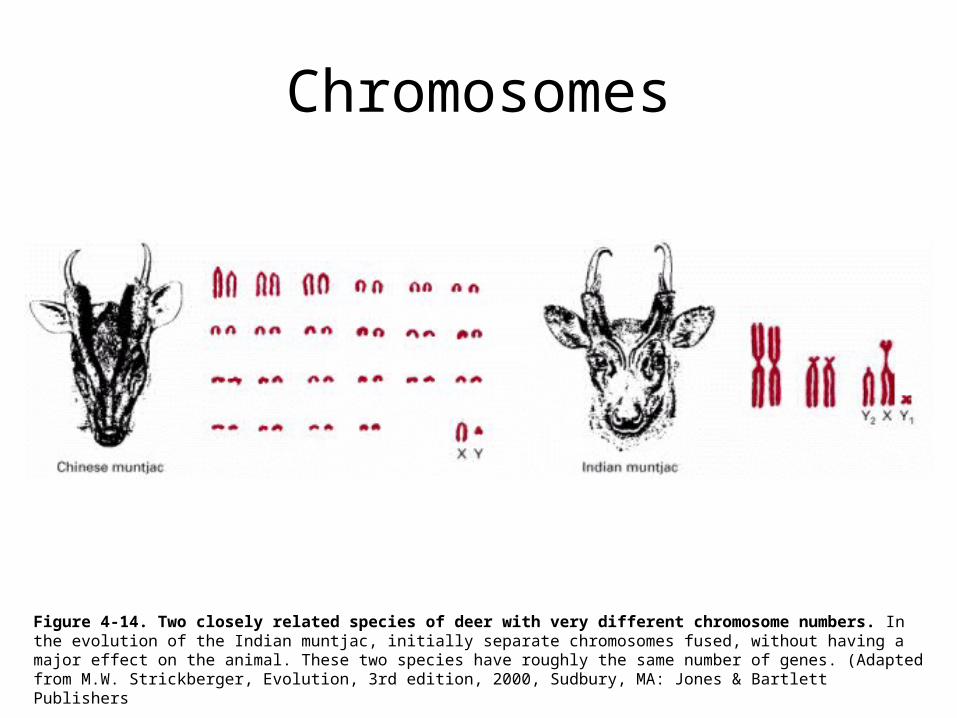
Figure 4-14. Two closely related species of deer with very different chromosome numbers. In the evolution of the Indian muntjac, initially separate chromosomes fused, without having a major effect on the animal. These two species have roughly the same number of genes. (Adapted from M.W. Strickberger, Evolution, 3rd edition, 2000, Sudbury, MA: Jones & Bartlett Publishers

Genetic Code
Figure 6-50. The genetic code. The standard one-letter abbreviation for each amino acid is presented below its three-letter abbreviation (see Panel 3-1, pp. 132 133, for the full name of each amino acid and its structure). By convention, codons are always written with the 5 -terminal nucleotide to the left. Note that most amino acids are represented by more than one codon, and that there are some regularities in the set of codons that specifies each amino acid. Codons for the same amino acid tend to contain the same nucleotides at the first and second positions, and vary at the third position. Three codons do not specify any amino acid but act as termination sites (stop codons), signaling the end of the protein-coding sequence. One codon AUG acts both as an initiation codon, signaling the start of a protein-coding message, and also as the codon that specifies methionine

Organization of Genes
Figure 4-15. The organization of genes on a human chromosome. (A) Chromosome 22, one of the smallest human chromosomes, contains 48 × 106 nucleotide pairs and makes up approximately 1.5% of the entire human genome. Most of the left arm of chromosome 22 consists of short repeated sequences of DNA that are packaged in a particularly compact form of chromatin (heterochromatin), which is discussed later in this chapter. (B) A tenfold expansion of a portion of chromosome 22, with about 40 genes indicated. Those in dark brown are known genes and those in light brown are predicted genes. (C) An expanded portion of (B) shows the entire length of several genes. (D) The intron-exon arrangement of a typical gene is shown after a further tenfold expansion. Each exon (red) codes for a portion of the protein, while the DNA sequence of the introns (gray) is relatively unimportant. The entire human genome (3.2 × 10⁹ nucleotide pairs) is distributed over 22 autosomes and 2 sex chromosomes (see Figures 4-10 and 4-11). The term human genome sequence refers to the complete nucleotide sequence of DNA in these 24 chromosomes. Being diploid, a human somatic cell therefore contains roughly twice this amount of DNA. Humans differ from one another by an average of one nucleotide in every thousand, and a wide variety of humans contributed DNA for the genome sequencing project. The published human genome sequence is therefore a composite of many individual sequences. (Adapted from International Human Genome Sequencing Consortium, Nature 409:860 921, 2001

Reading Frames
Figure 6-51. The three possible reading frames in protein synthesis. In the process of translating a nucleotide sequence (blue) into an amino acid sequence (green), the sequence of nucleotides in an mRNA molecule is read from the 5 to the 3 end in sequential sets of three nucleotides. In principle, therefore, the same RNA sequence can specify three completely different amino acid sequences, depending on the reading frame. In reality, however, only one of these reading frames contains the actual message

Transcription and Translation
• Steps in mapping from DNA sequence to folded protein:– Transcription: from DNA segment to
messenger RNA (mRNA)– Translation: from mRNA to protein – Post-translational modification: transformation
of a protein into its functional form (i.e. by attaching various chemical groups)

From DNA to Protein
Figure 6-21. Summary of the steps leading from gene to protein in eucaryotes and bacteria. The final level of a protein in the cell depends on the efficiency of each step and on the rates of degradation of the RNA and protein molecules. (A) In eucaryotic cells the RNA molecule produced by transcription alone (sometimes referred to as the primary transcript) would contain both coding (exon) and noncoding (intron) sequences. Before it can be translated into protein, the two ends of the RNA are modified, the introns are removed by an enzymatically catalyzed RNA splicing reaction, and the resulting mRNA is transported from the nucleus to the cytoplasm. Although these steps are depicted as occurring one at a time, in a sequence, in reality they are coupled and different steps can occur simultaneously. For example, the RNA cap is added and splicing typically begins before transcription has been completed. Because of this coupling, complete primary RNA transcripts do not typically exist in the cell. (B) In procaryotes the production of mRNA molecules is much simpler. The 5 end of an mRNA molecule is produced by the initiation of transcription by RNA polymerase, and the 3 end is produced by the termination of transcription. Since procaryotic cells lack a nucleus, transcription and translation take place in a common compartment. In fact, translation of a bacterial mRNA often begins before its synthesis has been completed

E.Coli Example
Figure 7-33. The clustered genes in E. coli that code for enzymes that manufacture the amino acid tryptophan. These five genes are transcribed as a single mRNA molecule, a feature that allows their expression to be controlled coordinately. Clusters of genes transcribed as a single mRNA molecule are common in bacteria. Each such cluster is called an operon
Transcription
• Steps:– Binding of RNA polymerase to promoter region of
DNA• Promoter – DNA region upstream and near a protein coding
region
– Creation of a complementary strand of RNA• Contains introns and exons• Ends with 250 or more adenosines (poly-A tail)
– Splicing our introns and connecting exons using spliceosome to create mRNA
– mRNA is transported to the cytoplasm to bind with a ribosome

DNA Transcription
Figure 6-8. DNA is transcribed by the enzyme RNA polymerase. The RNA polymerase (pale blue) moves stepwise along the DNA, unwinding the DNA helix at its active site. As it progresses, the polymerase adds nucleotides (here, small "T" shapes) one by one to the RNA chain at the polymerization site using an exposed DNA strand as a template. The RNA transcript is thus a single-stranded complementary copy of one of the two DNA strands. The polymerase has a rudder (see Figure 6-11) that displaces the newly formed RNA, allowing the two strands of DNA behind the polymerase to rewind. A short region of DNA/RNA helix (approximately nine nucleotides in length) is therefore formed only transiently, and a "window" of DNA/RNA helix therefore moves along the DNA with the polymerase. The incoming nucleotides are in the form of ribonucleoside triphosphates (ATP, UTP, CTP, and GTP), and the energy stored in their phosphate-phosphate bonds provides the driving force for the polymerization reaction (see Figure 5-4). (Adapted from a figure kindly supplied by Robert Landick

Transcription Initiation
Figure 6-16. Initiation of transcription of a eucaryotic gene by RNA polymerase II. To begin transcription, RNA polymerase requires a number of general transcription factors (called TFIIA, TFIIB, and so on). (A) The promoter contains a DNA sequence called the TATA box, which is located 25 nucleotides away from the site at which transcription is initiated. (B) The TATA box is recognized and bound by transcription factor TFIID, which then enables the adjacent binding of TFIIB (C). For simplicity the DNA distortion produced by the binding of TFIID (see Figure 6-18) is not shown. (D) The rest of the general transcription factors, as well as the RNA polymerase itself, assemble at the promoter. (E) TFIIH then uses ATP to pry apart the DNA double helix at the transcription start point, allowing transcription to begin. TFIIH also phosphorylates RNA polymerase II, changing its conformation so that the polymerase is released from the general factors and can begin the elongation phase of transcription. As shown, the site of phosphorylation is a long C-terminal polypeptide tail that extends from the polymerase molecule. The assembly scheme shown in the figure was deduced from experiments performed in vitro, and the exact order in which the general transcription factors assemble on promoters in cells is not known with certainty. In some cases, the general factors are thought to first assemble with the polymerase, with the whole assembly subsequently binding to the DNA in a single step. The general transcription factors have been highly conserved in evolution; some of those from human cells can be replaced in biochemical experiments by the corresponding factors from simple yeasts

Transcription Initiation
Figure 7-43. Activation of transcription initiation in eucaryotes by recruitment of the eucaryotic RNA polymerase II holoenzyme complex. (A) An activator protein bound in proximity to a promoter attracts the holoenzyme complex to the promoter. According to this model, the holoenzyme (which contains over 100 protein subunits) is brought to the promoter separately from the general transcription factors TFIID and TFIIA. The "broken" DNA in this and subsequent figures indicates that this portion of the DNA molecule can be very long and of variable length. (B) Diagram of an in vivo experiment whose outcome supports the holoenzyme recruitment model for gene activator proteins. The DNA-binding domain of a protein has been fused directly to a protein component of the mediator, a 20-subunit protein complex which is part of the holoenzyme complex, but which is easily dissociable from the remainder of the holoenzyme. When the binding site for the hybrid protein is experimentally inserted near a promoter, transcription initiation is strongly increased. In this experiment, the "activation domain" of the activator (see Figure 7-42) has been omitted, suggesting that an important function of the activation domain is simply to interact with the RNA polymerase holoenzyme complex and thereby aid in its assembly at the promoter. The ability of gene activator proteins to recruit the transcription machinery to promoters has also been demonstrated directly, using chromatin immunoprecipitation (see Figure 7-32). DNA-bound activator proteins typically increase the rate of transcription by up to 1000-fold, which is consistent with a relatively weak and nonspecific interaction between the activator and the holoenzyme (a 1000-fold change in affinity corresponds to a change in DG of ~4 kcal/mole, which could be accounted for by just a few weak, noncovalent bonds
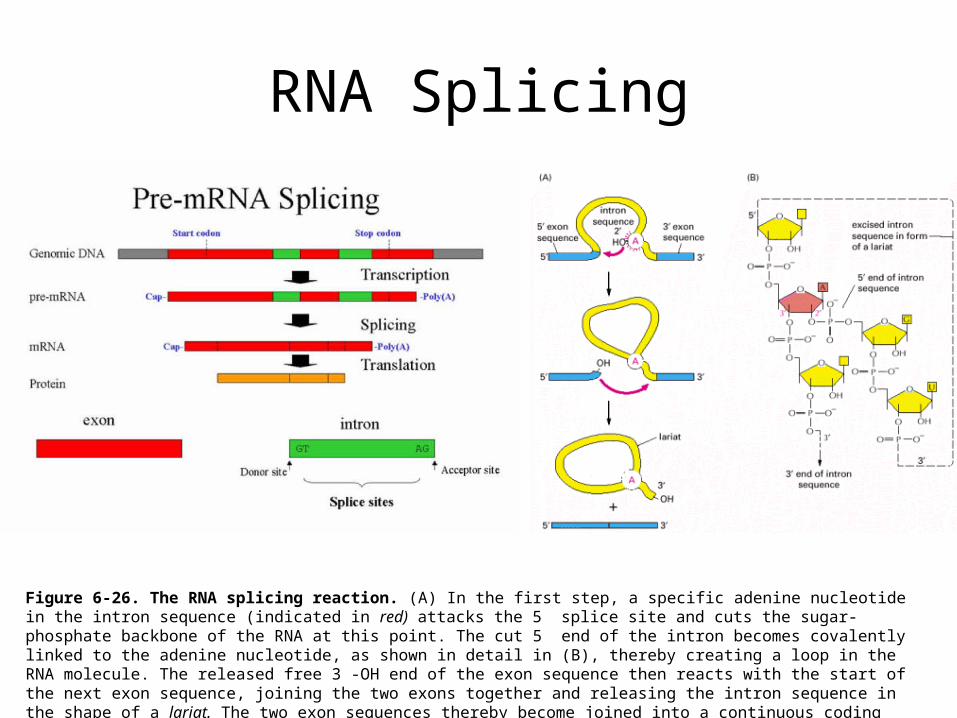
RNA Splicing
Figure 6-26. The RNA splicing reaction. (A) In the first step, a specific adenine nucleotide in the intron sequence (indicated in red) attacks the 5 splice site and cuts the sugar-phosphate backbone of the RNA at this point. The cut 5 end of the intron becomes covalently linked to the adenine nucleotide, as shown in detail in (B), thereby creating a loop in the RNA molecule. The released free 3 -OH end of the exon sequence then reacts with the start of the next exon sequence, joining the two exons together and releasing the intron sequence in the shape of a lariat. The two exon sequences thereby become joined into a continuous coding sequence; the released intron sequence is degraded in due course

Alternative Splicing
Figure 6-27. Alternative splicing of the a-tropomyosin gene from rat. a-tropomyosin is a coiled-coil protein (see Figure 3-11) that regulates contraction in muscle cells. The primary transcript can be spliced in different ways, as indicated in the figure, to produce distinct mRNAs, which then give rise to variant proteins. Some of the splicing patterns are specific for certain types of cells. For example, the a-tropomyosin made in striated muscle is different from that made from the same gene in smooth muscle. The arrowheads in the top part of the figure demark the sites where cleavage and poly-A addition can occur

Translation
• Ribosome – a complex combination of RNAs and proteins that produces a protein from mRNA
• Transfer-RNA (tRNA) – critical for translation. They have– an anti-codon (that binds to codon) near one end– The corresponding AA on the other end
• After translation and post-translation modification, the protein is transported by– Passive diffusion– And active transport mechanism

mRNA Translation
Figure 6-65. Translating an mRNA molecule. Each amino acid added to the growing end of a polypeptide chain is selected by complementary base-pairing between the anticodon on its attached tRNA molecule and the next codon on the mRNA chain. Because only one of the many types of tRNA molecules in a cell can base-pair with each codon, the codon determines the specific amino acid to be added to the growing polypeptide chain. The three-step cycle shown is repeated over and over during the synthesis of a protein. An aminoacyl-tRNA molecule binds to a vacant A-site on the ribosome in step 1, a new peptide bond is formed in step 2, and the mRNA moves a distance of three nucleotides through the small-subunit chain in step 3, ejecting the spent tRNA molecule and "resetting" the ribosome so that the next aminoacyl-tRNA molecule can bind. Although the figure shows a large movement of the small ribosome subunit relative to the large subunit, the conformational changes that actually take place in the ribosome during translation are more subtle. It is likely that they involve a series of small rearrangements within each subunit as well as several small shifts between the two subunits. As indicated, the mRNA is translated in the 5 -to-3 direction, and the N-terminal end of a protein is made first, with each cycle adding one amino acid to the C-terminus of the polypeptide chain. The position at which the growing peptide chain is attached to a tRNA does not change during the elongation cycle: it is always linked to the tRNA present in the P site of the large subunit

Genetic Regulation
• At any particular time, a cell is producing only a small fraction of the proteins coded for in its DNA
• The amount of each protein must be precisely regulated in order for the cell to function properly
• The cell regulates protein production in response to the environment or other cues
• The production process is controlled by a complex collection of proteins that influence which genes are expressed.

Expression Efficiency
Figure 6-3. Genes can be expressed with different efficiencies. Gene A is transcribed and translated much more efficiently than gene B. This allows the amount of protein A in the cell to be much greater than that of protein B
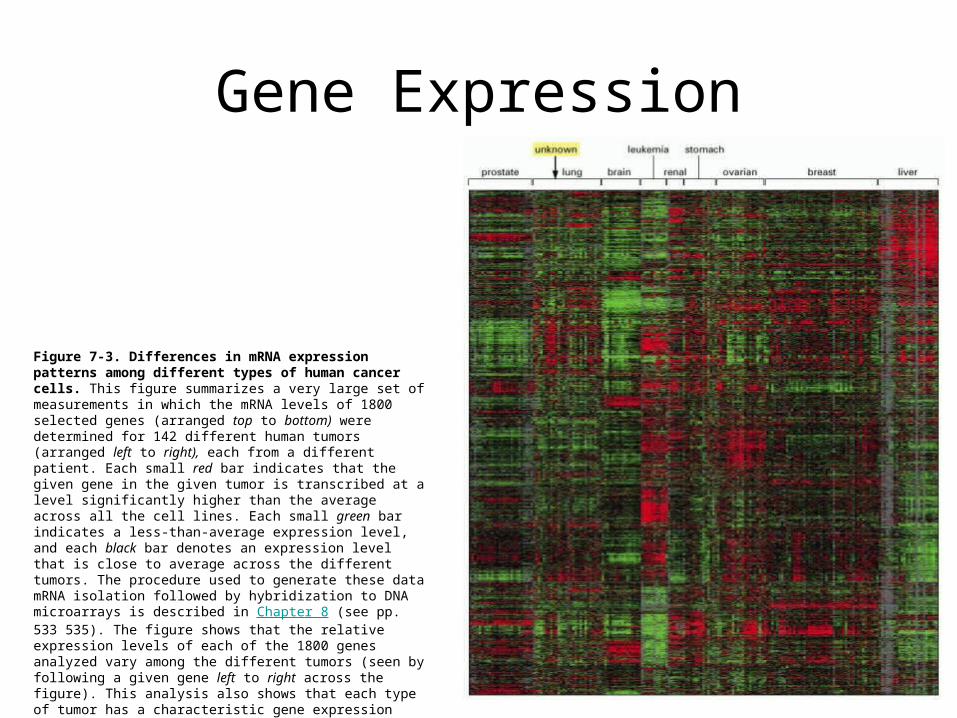
Gene Expression
Figure 7-3. Differences in mRNA expression patterns among different types of human cancer cells. This figure summarizes a very large set of measurements in which the mRNA levels of 1800 selected genes (arranged top to bottom) were determined for 142 different human tumors (arranged left to right), each from a different patient. Each small red bar indicates that the given gene in the given tumor is transcribed at a level significantly higher than the average across all the cell lines. Each small green bar indicates a less-than-average expression level, and each black bar denotes an expression level that is close to average across the different tumors. The procedure used to generate these data mRNA isolation followed by hybridization to DNA microarrays is described in Chapter 8 (see pp. 533 535). The figure shows that the relative expression levels of each of the 1800 genes analyzed vary among the different tumors (seen by following a given gene left to right across the figure). This analysis also shows that each type of tumor has a characteristic gene expression pattern. This information can be used to "type" cancer cells of unknown tissue origin by matching the gene expression profiles to those of known tumors. For example, the unknown sample in the figure has been identified as a lung cancer. (Courtesy of Patrick O. Brown, David Botstein, and the Stanford Expression Collaboration
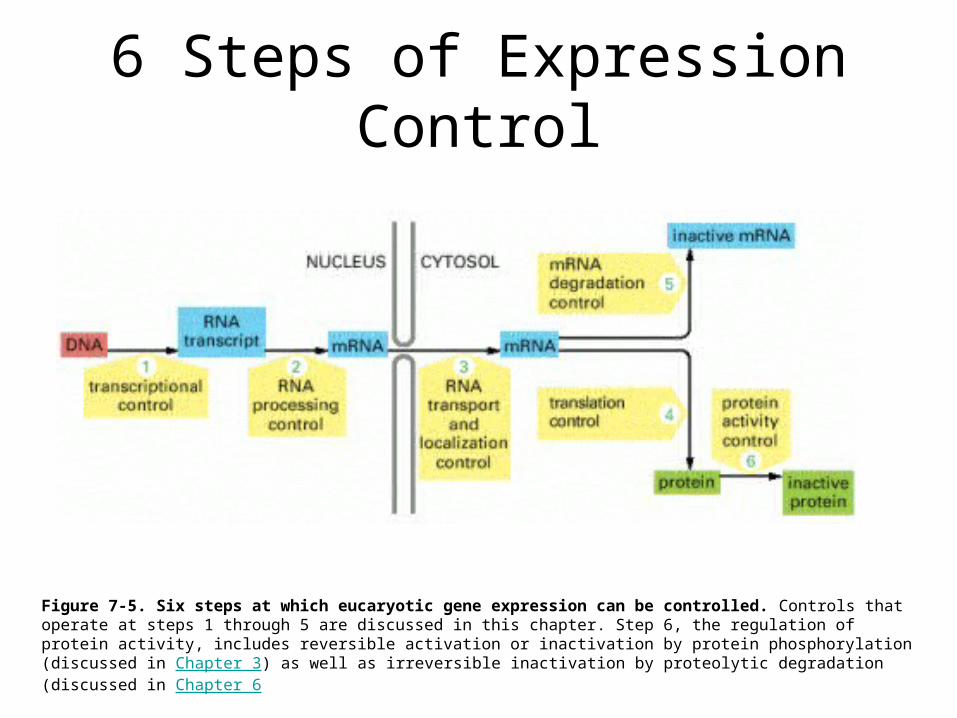
6 Steps of Expression Control
Figure 7-5. Six steps at which eucaryotic gene expression can be controlled. Controls that operate at steps 1 through 5 are discussed in this chapter. Step 6, the regulation of protein activity, includes reversible activation or inactivation by protein phosphorylation (discussed in Chapter 3) as well as irreversible inactivation by proteolytic degradation (discussed in Chapter 6
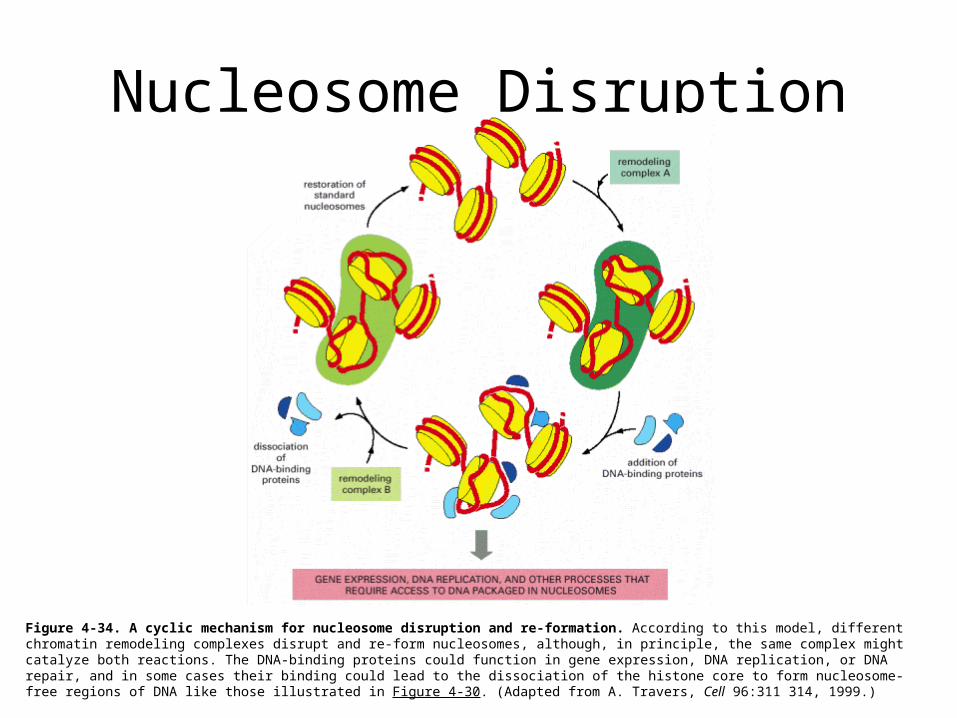
Nucleosome Disruption
Figure 4-34. A cyclic mechanism for nucleosome disruption and re-formation. According to this model, different chromatin remodeling complexes disrupt and re-form nucleosomes, although, in principle, the same complex might catalyze both reactions. The DNA-binding proteins could function in gene expression, DNA replication, or DNA repair, and in some cases their binding could lead to the dissociation of the histone core to form nucleosome-free regions of DNA like those illustrated in Figure 4-30. (Adapted from A. Travers, Cell 96:311 314, 1999.)

Control Regions
• The control mechanisms are responsive to the level of a product already in the cell as well as to a tremendous variety of extracellular signals.
• Regulatory proteins recognize and bind to very specific sequences in the DNA (control regions)
• Control regions tend to border the protein coding regions of genes
• Control regions just upstream of the coding region that encourage expression are called promoters
• Similar regions either downstream of the coding region or relatively far upstream are called enhancers
• Sequences that tend to prevent the production of a protein are called repressors
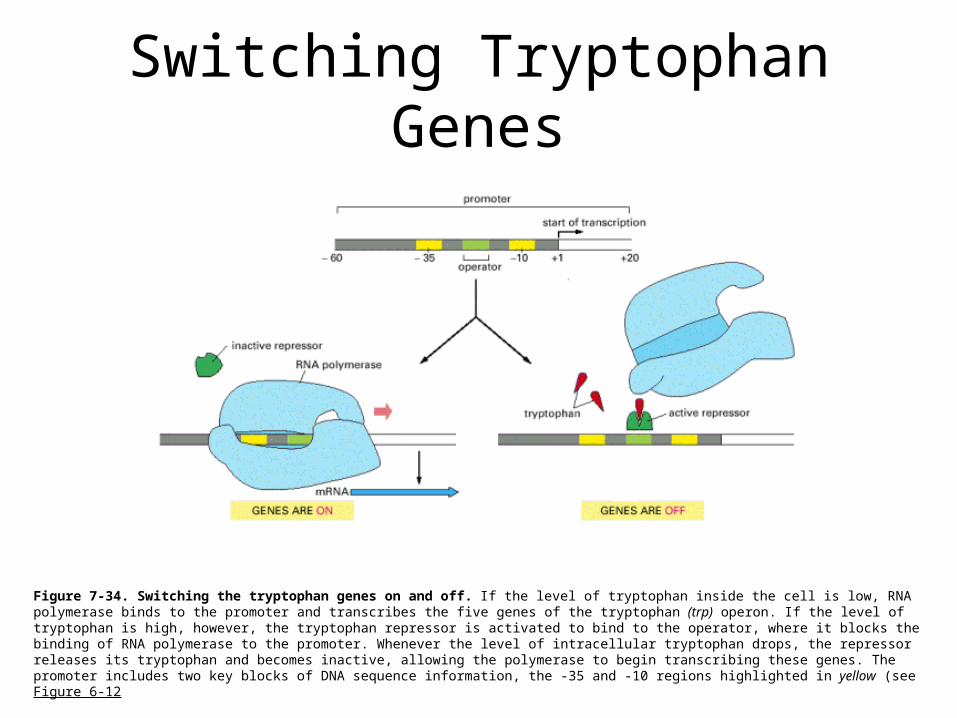
Switching Tryptophan Genes
Figure 7-34. Switching the tryptophan genes on and off. If the level of tryptophan inside the cell is low, RNA polymerase binds to the promoter and transcribes the five genes of the tryptophan (trp) operon. If the level of tryptophan is high, however, the tryptophan repressor is activated to bind to the operator, where it blocks the binding of RNA polymerase to the promoter. Whenever the level of intracellular tryptophan drops, the repressor releases its tryptophan and becomes inactive, allowing the polymerase to begin transcribing these genes. The promoter includes two key blocks of DNA sequence information, the -35 and -10 regions highlighted in yellow (see Figure 6-12

Repressor Proteins
Figure 7-49. Five ways in which eucaryotic gene repressor proteins can operate. (A) Gene activator proteins and gene repressor proteins compete for binding to the same regulatory DNA sequence. (B) Both proteins can bind DNA, but the repressor binds to the activation domain of the activator protein thereby preventing it from carrying out its activation functions. In a variation of this strategy, the repressor binds tightly to the activator without having to be bound to DNA directly. (C) The repressor interacts with an early stage of the assembling complex of general transcription factors, blocking further assembly. Some repressors also act at late stages in transcription initiation, for example, by preventing the release of the RNA polymerase from the general transcription factors. (D) The repressor recruits a chromatin remodeling complex which returns the nucleosomal state of the promoter region to its pre-transcriptional form. Certain types of remodeling complexes appear dedicated to restoring the repressed nucleosomal state of a promoter, whereas others (for example, those recruited by activator proteins) render DNA packaged in nucleosomes more accessible (see Figure 4-34). However the same remodeling complex could in principle be used either to activate or repress transcription: depending on the concentration of other proteins in the nucleus, either the remodeled state or the repressed state could be stabilized. According to this view, the remodeling complex simply allows chromatin structure to change. (E) The repressor attracts a histone deacetylase to the promoter. Local histone deacetylation reduces the affinity of TFIID for the promoter (see Figure 7-46) and decreases the accessibility of DNA in the affected chromatin. A sixth mechanism of negative control inactivation of a transcriptional activator by heterodimerization was illustrated in Figure 7-26. For simplicity, nucleosomes have been omitted from (A)-(C), and the scale of (D) and (E) has been reduced relative to (A)-(C

Complex Example
Figure 7-50. Eucaryotic gene regulatory proteins often assemble into complexes on DNA. Seven gene regulatory proteins are shown in (A). The nature and function of the complex they form depends on the specific DNA sequence that seeds their assembly. In (B), some assembled complexes activate gene transcription, while another represses transcription. Note that the red protein is shared by both activating and repressing complexes
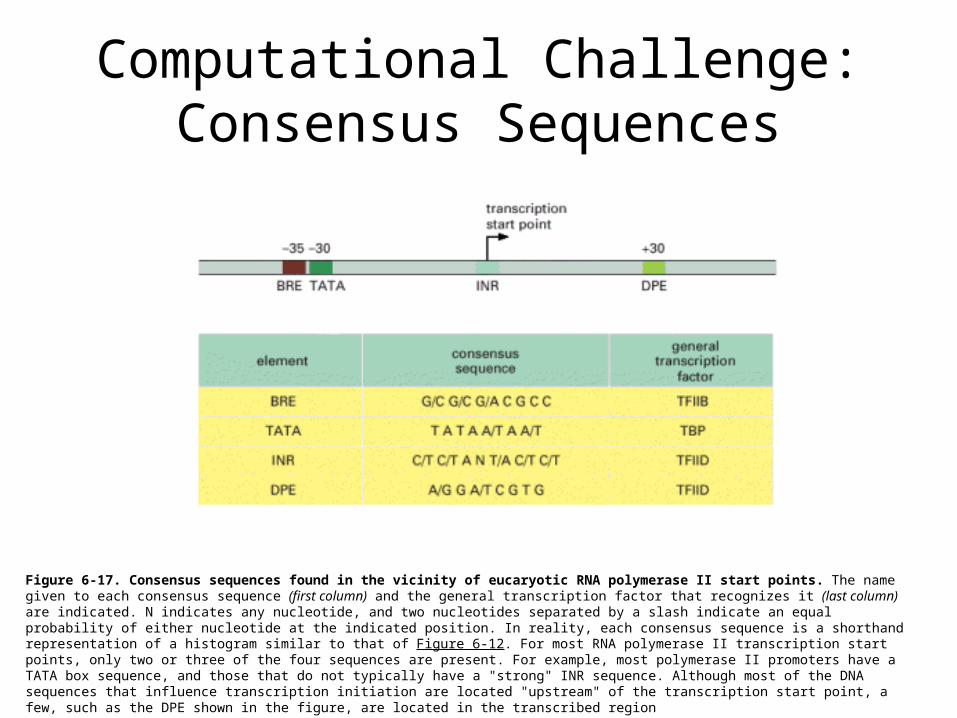
Computational Challenge:Consensus Sequences
Figure 6-17. Consensus sequences found in the vicinity of eucaryotic RNA polymerase II start points. The name given to each consensus sequence (first column) and the general transcription factor that recognizes it (last column) are indicated. N indicates any nucleotide, and two nucleotides separated by a slash indicate an equal probability of either nucleotide at the indicated position. In reality, each consensus sequence is a shorthand representation of a histogram similar to that of Figure 6-12. For most RNA polymerase II transcription start points, only two or three of the four sequences are present. For example, most polymerase II promoters have a TATA box sequence, and those that do not typically have a "strong" INR sequence. Although most of the DNA sequences that influence transcription initiation are located "upstream" of the transcription start point, a few, such as the DPE shown in the figure, are located in the transcribed region

Computational Challenge:Consensus Sequences
Figure 6-28. The consensus nucleotide sequences in an RNA molecule that signal the beginning and the end of most introns in humans. Only the three blocks of nucleotide sequences shown are required to remove an intron sequence; the rest of the intron can be occupied by any nucleotide. Here A, G, U, and C are the standard RNA nucleotides; R stands for either A or G; Y stands for either C or U. The A highlighted in red forms the branch point of the lariat produced by splicing. Only the GU at the start of the intron and the AG at its end are invariant nucleotides in the splicing consensus sequences. The remaining positions (even the branch point A) can be occupied by a variety of nucleotides, although the indicated nucleotides are preferred. The distances along the RNA between the three splicing consensus sequences are highly variable; however, the distance between the branch point and 3 splice junction is typically much shorter than that between the 5 splice junction and the branch point

Mechanisms of Evolution
• The similarities and differences among closely related molecules provide important information about their structure and function
• Molecules (or their sequences) which are related to one another are said to be homologous
• Sources of variation:– Point mutation (insertion, deletion, change)– Gene duplication (create pseudogenes)– Crossover (sexual reproduction)
• Effects of mutations:– Neutral (in introns, third codon position); basis of genetic drift– Lethal (very often)– Advantageous (rarely); get fixed in the population

4 Types of Innovation
Figure 1-23. Four modes of genetic innovation and their effects on the DNA sequence of an organism

Effect of Mutation
Figure 1-29. A mutant phenotype reflecting the function of a gene. A normal yeast (of the species Schizosaccharomyces pombe) is compared with a mutant in which a change in a single gene has converted the cell from a cigar shape (left) to a T shape (right). The mutant gene therefore has a function in the control of cell shape. But how, in molecular terms, does the gene product perform that function? That is a harder question, and needs biochemical analysis to answer it. (Courtesy of Kenneth Sawin and Paul Nurse.)

Gene Duplication
Figure 1-51. The consequences of gene duplication for mutational analyses of gene function. In this hypothetical example, an ancestral multicellular organism has a genome containing a single copy of gene G, which performs its function at several sites in the body, indicated in green. (A) Through gene duplication, a modern descendant of the ancestral organism has two copies of gene G, called G1 and G2. These have diverged somewhat in their patterns of expression and in their activities at the sites where they are expressed, but they still retain important similarities. At some sites, they are expressed together, and each independently performs the same old function as the ancestral gene G (alternating green and yellow stripes); at other sites, they are expressed alone and serve new purposes. (B) Because of a functional overlap, the loss of one of the two genes by mutation (red cross) reveals only a part of its role; only the loss of both genes in the double mutant reveals the full range of processes for which these genes are responsible. Analogous principles apply to duplicated genes that operate in the same place (for example, in a single-celled organism) but are called into action together or individually in response to varying circumstances. Thus, gene duplications complicate genetic analyses in all organisms

Human vs. Mouse
Figure 1-53. Human and mouse: similar genes and similar development. The human baby and the mouse shown here have similar white patches on their foreheads because both have mutations in the same gene (called kit), required for the development and maintenance of pigment cells. (From R.A. Fleischman, Proc. Natl. Acad. Sci. USA 88:10885 10889, 1991. © National Academy of Sciences

Life as a Biochemical Process
• The revolution in biology over the last three decades resulted from the understanding cells in terms of their chemistry
• The functions of life (e.g. cell division, immune reaction) are the interactions of complex, self-regulating networks of chemical reactions
• Biomolecules - the substances that carry out and regulate these activities:– macromolecules (proteins, carbohydrates, lipids) – a variety of small molecules.
Life as a Biochemical Process
• The genetic material specifies how to create proteins, when and how much to create
• Proteins control the flow of energy and materials through the cell– including the creation and transformation of
carbohydrates, lipids and other molecules,
• Proteins ultimately accomplish all of the functions that the cell carries out.

Life as a Biochemical Process
• In even the simplest cell, there are thousands of kinds of biomolecules interacting with each other
• The amount and concentration of molecules in various cell compartments determines what influence they have
• The concentrations vary over time, on scales of seconds to decades.
• Interactions among biomolecules are highly non-linear, as are their interactions with molecules from outside the cell.

Catalysis and Metabolic Pathways
• Intermediary metabolism: most essential chemical processes within a cell – catabolic processes: breaking down proteins, fats and
carbohydrates– anabolic processes: building new materials.
• Processes in intermediary metabolism are almost all catalyzed reactions– require special compounds (catalysts or enzymes) that
facilitate the reaction• Enzymes are mostly proteins
– materials transformed by catalysts are called substrates– catalysts are not changed by the reactions they
participate in
Catalysis and Metabolic Pathways
• Pathways: combinations of reactions which accomplish tasks like turning foods into useable energy or compounds– Even the basic transformations of intermediary
metabolism can involve dozens or hundreds of catalyzed reactions.
• Allosteric regulation: – the presence or absence of substrates can affect the
behavior of the enzymes themselves• Competitive inhibition:
– substance other than the usual substrate of the enzyme binds to the active site of the enzyme
– this is preventing it from having an effect on its substrate.

How Enzymes Work
Figure 2-47. How enzymes work. Each enzyme has an active site to which one or two substrate molecules bind, forming an enzyme-substrate complex. A reaction occurs at the active site, producing an enzyme-product complex. The product is then released, allowing the enzyme to bind additional substrate molecules

How Enzymes Work
Figure 3-52. Some general strategies of enzyme catalysis. (A) Holding substrates together in a precise alignment. (B) Charge stabilization of reaction intermediates. (C) Altering bond angles in the substrate to increase the rate of a particular reaction

Positive regulation
Figure 3-57. Positive regulation caused by conformational coupling between two distant binding sites. In this example, both glucose and molecule X bind best to the closed conformation of a protein with two domains. Because both glucose and molecule X drive the protein toward its closed conformation, each ligand helps the other to bind. Glucose and molecule X are therefore said to bind cooperatively to the protein

Negative regulation
Figure 3-58. Negative regulation caused by conformational coupling between two distant binding sites. The scheme here resembles that in the previous figure, but here molecule X prefers the open conformation, while glucose prefers the closed conformation. Because glucose and molecule X drive the protein toward opposite conformations (closed and open, respectively), the presence of either ligand interferes with the binding of the other
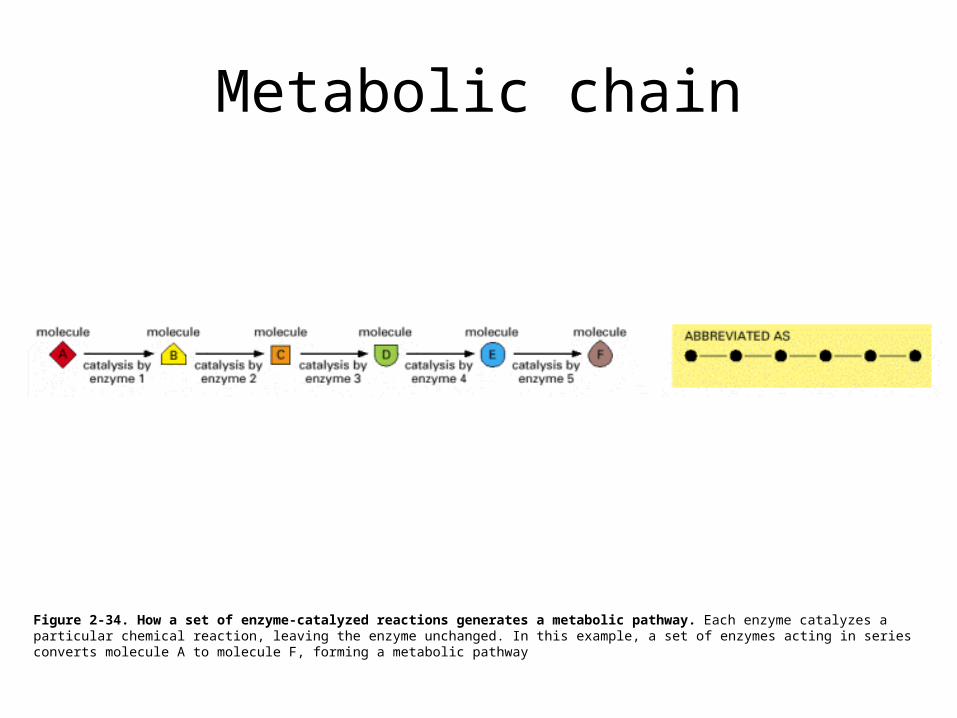
Metabolic chain
Figure 2-34. How a set of enzyme-catalyzed reactions generates a metabolic pathway. Each enzyme catalyzes a particular chemical reaction, leaving the enzyme unchanged. In this example, a set of enzymes acting in series converts molecule A to molecule F, forming a metabolic pathway
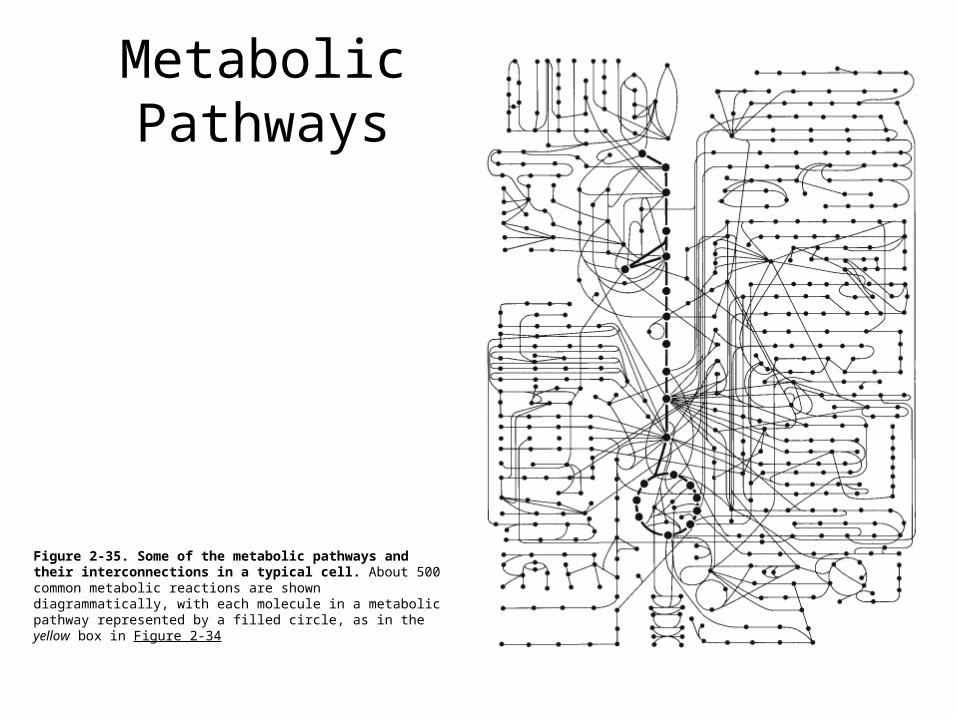
Metabolic Pathways
Figure 2-35. Some of the metabolic pathways and their interconnections in a typical cell. About 500 common metabolic reactions are shown diagrammatically, with each molecule in a metabolic pathway represented by a filled circle, as in the yellow box in Figure 2-34

Model Organisms
• Most valuable methods in biological research – are invasive– require organisms to be sacrificed– require many generations of observation– require observations on large populations
• Much of this work is impractical or unethical to carry out on humans– research involving humans can be done ethically– in some areas of biomedical research, such as final
drug testing, it is obligatory• Biologists have selected a variety of model
organisms for experimentation.

Model Organisms
• E. coli (the ubiquitous intestinal bacterium Escherichia coli)– fast reproduction time, safe and easy to work with– common target for genetic engineering, (genes from other
organisms are inserted into its genome and produced in quantity)
• Saccharomyces cervesiae (brewer’s yeast)– safe, easy to grow, short generation time– yeasts are eukaryotes– useful in in sequencing large amounts of DNA
• Arabidopsis thaliana (a common weed)– useful in agriculture research– very little repetitive DNA (genome 30 times less DNA than corn)
Model Organisms
• Caenorhabditis elegans (the nematode worm)– has exactly 959 cells doing exactly the same thing– one of the simplest creatures with a nervous system (1/3 of its
cells)– useful to gaining insight in gain insight into the mechanisms of
aging and development• Drosophila melanogaster (the fruit fly)
– short generation times– many different genetically determined morphological
characteristics – a staple of classical genetics research
• Mus musculus (laboratory mouse)– mammals– genetically practically identical to people

Experimental Methods
• Important for understanding the strengths and limitations of various sources of data
• Methods:– Imaging/microscopy; new technologies (e.g. Atomic
Force Microscope) offer the potential to create images of individual molecules.
– Gel electrophoresis; a method for separation of a protein mixture by their charge and size
• The resulting individual spots or bands can be removed from the gel for further processing, in a procedure called blotting

Experimental Methods
– Cloning• A group of cells with identical genomes (also called a cell
line)• individual genes could be cloned
– by inserting a piece of DNA containing a gene of interest into the bacterial genome; creating recombinant DNA)
– how: put the new gene into vectors - a virus that infects bacteria or a plasmid; add antibiotic resistance genes
– Genetic engineering: inserting foreign genes into plants, animals, even people.
– Hybridization / Immunological staining; to identify the presence or absence of a particular molecule (or even a region of a molecule) in vanishingly small amounts
• Application in microarrays to measure expression of all genes in a genome

Experimental Methods
– Gene Mapping and Sequencing; to identify the location and size of all of the genes
– Polymerase chain reaction (PCR); to rapidly produce huge amounts of a specific region of DNA, simply by knowing a little bit of the sequence around the desired region
– Crystallography and NMR; to determine 3D structure of biomolecules
– Mass spectrometry; to identify sequence of protein, RNA, or DNA fragments
– Yeast-Two-Hybrid systems; to assess protein-protein interactions