circulation in the strait of juan de fuca · the strait of juan de fuca is a submarine valley...
TRANSCRIPT

NOAA Technical Report ERL 399-PMEL 29
Circulation in the Strait ofJuan de FucaSome Recent OceanographicObservations
G. A. Cannon, Editor
J. R. Holbrook and R. A. Feely, editorial assistants
Contributing Authors
Coastal Physics, PMELG. A. Cannon, R. L. Charnell, N. P. Laird, H. O. Mofjeld, D. J. Pashinski, J. D. Schumacher
Chemistry and Biology, PMELE. T. Baker, D. M. Damkaer, R. A. Feely, J. D. Larrance
Deep Sea Physics, PMELD. Halpern, J. R. Holbrook
Numerical Studies, PMELJ. A. Galt, J. Karpen, J. E. Overland, C. H. Pease, R. W. Stewart
Oceanographic Division, NOSB. B. Parker
Remote Sensing Studies, PMELC. B. Sawyer
Pacific Marine Environmental LaboratorySeattle, Washington
June 1978
u.s. DEPARTMENT OF COMMERCEJuanita M. Kreps, Secretary
National Oceanic and Atmospheric AdministrationRichard A. Frank, Administrator
Environmental Research LaboratoriesBoulder, Colorado
Wilmot Hess, Director
II
NOTICE
Mention of a commercial company or product does not constitute anendorsement by NOAA Environmental Research Laboratories. Usefor publicity or advertising purposes of information from this publication concerning proprietary products or the tests of such products isnot authorized.
CONTENTS
Executive Summary. . . . . . . . . . . . . . . . . . . . . . . . . . . . . . . . . . . . . . . . . . . . . .. vAbstract 11. Introduction . . . . . . . . . . . . . . . . . . . . . . . . . . . . . . . . . . . . . . . . . . . . . . . . .. 12. Physical setting " 3
2.1 Geography . . . . . . . . . . . . . . . . . . . . . . . . . . . . . . . . . . . . . . . . . . . . . . .. 32.2 Tides and tidal currents. . . . . . . . . . . . . . . . . . . . . . . . . . . . . . . . . . . . . .. 42.3 Winds. . . . . . . . . . . . . . . .. . . . . . . . . . . . . . . . . . . . . . . . . . . . ... . . . .. 6
General description. . . . . . . . . . . . . . . . . . . . . . . . . . . . . . . . . . . . . . . . .. 6Recent observations. . . . . . . . . . . . . . . . . . . . . . . . . . . . . . . . . . . . . . . . .. 9Model results. . . . . . . . . . . . . . . . . . . . . . . . . . . . . . . . . . . . . . . . . . . . . .. 12
3. Oceanography. . . . . . . . . . . . . . . . . . . . . . . . . . . . . . . . . . . . . . . . . . . . . . . .. 163.1 Surface drifter observations. . . . . . . . . . . . . . . . . . . . . . . . . . . . . . . . . . .. 163.2 Suspended sediments. . . . . . . . . . . . . . . . . . . . . . . . . . . . . . . . . . . . . . . .. 173.3 Western Strait currents and water properties. . . . . . . . . . . . . . . . . . . . . .. 22
Mean flow. . . . . . . . . . . . . . . . . . . . . . . . . . . . . . . . . . . . . . . . . . . . . . . .. 23Variations . . . . . . . . . . . . . . . . . . . . . . . . . . . . . . . . . . . . . . . . . . . . . . . .. 2SWinter wind forcing . . . . . . . . . . . . . . . . . . . . . . . . .. 2S
3.4 Eastern strait-San Juan Island currents 313.S Plankton observations. . . . . . . . . . . . . . . . . . . . . . . . . . . . . . . . . . . . . . .. 34
4. Oil-spill trajectory modeling. . . . . . . . . . . . . . . . . . . . . . . . . . . . . . . . . . . . .. 364.1 Model description. . . . . . . . . . . . . . . . . . . . . . . . . . . . . . . . . . . . . . . . . .. 364.2 Sample trajectories . . . . . . . . . . . . . . . . . . . . . . . . . . . . . . . . . . . . . . . . .. 37
S. Other studies. . . . . . . . . . . . . . . . . . . . . . . . . . . . . . . . . . . . . . . . . . . . . . . . .. 426. Summary and conclusions. . . . . . . . . . . . . . . . . . . . . . . . . . . . . . . . . . . . . . .. 447. Acknowledgments. . . . . . . . . . . . . . . . . . . . . . . . . . . . . . . . . . . . . . . . . . . . .. 478. References. . . . . . . . . . . . . . . . . . . . . . . . . . . . . . . . . . . . . . . . . . . . . . . . . . .. 48
iii

EXECUTIVE SUMMARY
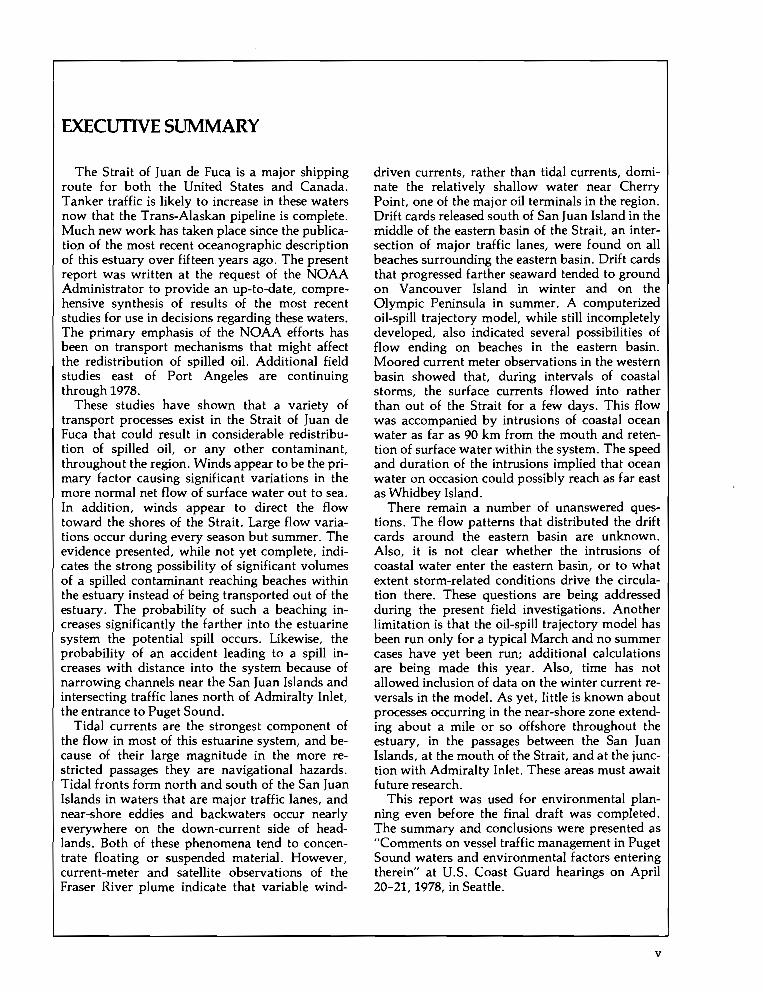
The Strait of Juan de Fuca is a major shippingroute for both the United States and Canada.Tanker traffic is likely to increase in these watersnow that the Trans-Alaskan pipeline is complete.Much new work has taken place since the publicatio,n of the most recent oceanographic descriptionof this estuary over fifteen years ago. The presentreport was written at the request of the NOAAAdministrator to provide an up-to-date, comprehensive synthesis of results of the most recentstudies for use in decisions regarding these waters.The primary emphasis of the NOAA efforts hasbeen on transport mechanisms that might affectthe redistribution of spilled oil. Additional fieldstudies east of Port Angeles are continuingthrough 1978.
These studies have shown that a variety oftransport processes exist in the Strait of Juan deFuca that could result in considerable redistribution of spilled oil, or any other contaminant,throughout the region. Winds appear to be the primary factor causing significant variations in themore normal net flow of surface water out to sea.In addition, winds appear to direct the flowtoward the shores of the Strait. Large flow variations occur during every season but summer. Theevidence presented, while not yet complete, indicates the strong possibility of significant volumesof a spilled contaminant reaching beaches withinthe estuary instead of being transported out of theestuary. The probability of such a beaching increases significantly the farther into the estuarinesystem the potential spill occurs. Likewise, theprobability of an accident leading to a spill increases with distance into the system because ofnarrowing channels near the San Juan Islands andintersecting traffic lanes north of Admiralty Inlet,the entrance to Puget Sound.
Tidal currents are the strongest component ofthe flow in most of this estuarine system, and because of their large magnitude in the more restricted passages they are navigational hazards.Tidal fronts form north and south of the San JuanIslands in waters that are major traffic lanes, andnear-shore eddies and backwaters occur nearlyeverywhere on the down-current side of headlands. Both of these phenomena tend to concentrate floating or suspended material. However,current-meter and satellite observations of theFraser River plume indicate that variable wind-
driven currents, rather than tidal currents, dominate the relatively shallow water near CherryPoint, one of the major oil terminals in the region.Drift cards released south of San Juan Island in themiddle of the eastern basin of the Strait, an intersection of major traffic lanes, were found on allbeaches surrounding the eastern basin. Drift cardsthat progressed farther seaward tended to groundon Vancouver Island in winter and on theOlympic Peninsula in summer. A computerizedoil-spill trajectory model, while still incompletelydeveloped, also indicated several possibilities offlow ending on beaches in the eastern basin.Moored current meter observations in the westernbasin showed that, during intervals of coastalstorms, the surface currents flowed into ratherthan out of the Strait for a few days. This flowwas accompanied by intrusions of coastal oceanwater as far as 90 km from the mouth and retention of surface water within the system. The speedand duration of the intrusions implied that oceanwater on occasion could possibly reach as far eastas Whidbey Island.
There remain a number of unanswered questions. The flow patterns that distributed the driftcards around the eastern basin are unknown.Also, it is not clear whether the intrusions ofcoastal water enter the eastern basin, or to whatextent storm-related conditions drive the circulation there. These questions are being addressedduring the present field investigations. Anotherlimitation is that the oil-spill trajectory model hasbeen run only for a typical March and no summercases have yet been run; additional calculationsare being made this year. Also, time has notallowed inclusion of data on the winter current reversals in the model. As yet, little is known aboutprocesses occurring in the near-shore zone extending about a mile or so offshore throughout theestuary, in the passages between the San JuanIslands, at the mouth of the Strait, and at the junction with Admiralty Inlet. These areas must awaitfuture research.
This report was used for environmental planning even before the final draft was completed.The summary and conclusions were presented as"Comments on vessel traffic management in PugetSound waters and environmental factors enteringtherein" at U.S. Coast Guard hearings on April20-21,1978, in Seattle.
v

vi
Vancouver Island
.;
Figure 1. Strait of Juan de Fuca, showing nearby features and connecting waterways. Additional place names in and north of the San JuanIslands are shown in Fig. 39.
';:. CANADA".;:-- -- -- ----49°
UNITED STATES
CIRCULATION IN THE STRAIT OF JUAN DE FUCA:SOME RECENT OCEANOGRAPHIC OBSERVAnONS
G. A. Cannon, ed.
ABSTRACT. Oceanographic research in the Strait of Juan de Fuca and some of its adjacent waterways,emphasizing transport mechanisms that might affect the redistribution of spilled oiL has focused on nearsurface circulation and its driving mechanisms. Moored current meters, surface drift cards, satelliteimages of suspended sediment, and an oil-spill trajectory model were used. The largest flow variationswere found during fall-winter-spring. Drift cards tended to ground on Vancouver Island in winter, on theOlympic Peninsula in summer, and on beaches in the eastern basin of the Strait throughout the year.Trajectory model experiments also showed flow ending on beaches in the eastern basin. Numerous tidalfronts were observed north and south of the San Juan Islands, and near-shore eddies occurred everywhereon the down-current sides of headlands. Both of these phenomena tend to concentrate floating or suspended material. Moored current meters showed winter intrusions of oceanic surface water almost toPort Angeles lasting several days to over a week. Outflow often occurred only in the deeper water, withsurface water being retained within the system. Winds appeared to be the major cause of all flow variations. Indications were that significant volumes of any contaminant would probably reach beaches withinthe estuary.
1. INTRODUCTION
The Strait of Juan de Fuca estuary is the principal approach from the Pacific Ocean to themajor Canadian and United States populationcenters (Vancouver, Seattle, et al.) located on theStrait and on the adjacent waters of the Strait ofGeorgia and Puget Sound (Fig. 1). The region is aspectacular environment for living and recreation,and its abundant resources provide a substantialbase for economic development. Decisions onquestions regarding new and alternate uses ofthese waters require knowledge of various aspectsof the marine environment. However, the most recent description of oceanographic features of theStrait of Juan de Fuca is more than fifteen yearsold (Herlinveaux and Tully, 1961). While severalstudies have occurred since then, most have beenlimited to descriptions in isolated reports or havenot yet appeared in reports or scientificpublications.
In 1975 the Pacific Marine EnvironmentalLaboratory (PMEL) of NOAA initiated investigations into several oceanographic aspects of thissystem with major emphasis on circulation. Be-
cause of the potential for increased tanker traffic,the primary objective of these investigations wasto describe the important transport mechanismsthat might affect redistribution of spilled oil. Fieldstudies included primarily physical oceanographicand meteorologic measurements to observe surface circulation and to determine causes for itsvariations. Because the surface and deeper waterconstitute a coupled system, some aspects of flowthrough the total water column also weremeasured. Additional studies included suspendedsediment investigations partly using satellite observations, oil-spill trajectory model developments that included a coupled meteorologicalmodel, and biological observations of seasonalplankton distributions. The mooring studies discussed in this report have been west of PortAngeles. Mooring studies east of Port Angeles aretaking place during 1978 and cannot as yet bereported.
Since the fall of 1973 the National Ocean Survey (NOS) of NOAA has carried out several detailed circulatory surveys in the Strait of Juan de
1

Fuca, the Strait of Georgia, and the connectingwaterways through the San Juan Islands. The primary objective of their surveys was to obtain information on tides and tidal currents, along withsupporting auxiliary data. This information wasto provide increased understanding of these watersystems needed in general for safer navigation andmore specifically for possible increased oil tankertraffic. Some of these surveys have been carriedout jointly with PMEL investigators. NOS observations presented in this report have been madeprimarily east of Port Angeles and in the passagesof the San Juan Islands.
The purpose of this report is to summarize andsynthesize some of the scientific information ofthis recent oceanographic research in the Strait ofJuan de Fuca so that it is available in one sourcefor environmental planning. Most of the material
2
presented here has come either from recently published reports or from studies that are in variousstages of being published. More details will befound in the referenced reports. This report primarily describes studies conducted by NOAAand, where appropriate, refers to other knownwork in the area. It emphasizes circulation andwater movement because the majority of recentresearch has been dominated by efforts in theseareas. The Other Studies section mentions ongoing work east of Port Angeles. No attempt hasbeen made to relate this work to ecosystemsstudies, and no implications have been drawn regarding oil transportation or oil-port siting. Otherrecent works have examined some of these topics(e.g., Little, 1977).
The Summary and Conclusions section is a briefself-contained synopsis of this report.

2. PHYSICAL SETTING
2.1 Geography
The Strait of Juan de Fuca is a submarine valleyextending from the Pacific Ocean to the channelsof the San Juan Archipelago, Whidbey Island, andAdmiralty Inlet. It is bounded on the north by thelow Seymour Mountains on Vancouver Island inCanada and on the south by the higher OlympicMountains in Washington State. The Strait contains two basins with depths exceeding 100 m.These are separated by an effective sill (crosschannel ridge) projecting southward from Victoriaat about 60-m depth. Seaward of this sill the outer(or western) basin deepens to more than 200 m atCape Flattery, and these depths continue seawardalong a glacial channel across the entire continental shelf. This western basin is about 20 kmwide and 90 km long. Landward of the sill is thedeeper inner (or eastern) basin which connects tothe Strait of Georgia primarily through HaroStrait with a secondary sill of about 90 m near thenorth side of the San Juan Islands. Shallowerdepths connect across the 64-m Admiralty Inletsill into Puget Sound. Intermediate depths arefound in Rosario Strait, which is the third mainpassage of major shipping importance. This eastern basin topography is more complex withnumerous banks and shoals (Fig. 2). More detailsare given by Parker (1977).
The western Strait of Juan de Fuca may be considered a weakly stratified, partially mixedestuary with a surface-to-bottom salinity difference of 2%0-3%0 (Herlinveaux and Tully, 1961).Although there are important cross-channel variations, the along-channel mean flow is characterized by the classical estuarine circulation withseaward (westward) transport near the surfaceand landward (eastward) transport near thebottom. This circulation is maintained by riverwater which enters the system and sets up a longitudinal sea-surface slope directed toward themouth. The near-surface flow is driven primarilyby the longitudinal sea-surface slope (barotropicforcing) while the deeper return flow is driven by
the longitudinal density gradient (baroclinic forcing). These two driving forces are balanced by theinternal and bottom frictional forces generated bystrong tidal mixing.
Fresh water entering the inland waters is primarily river runoff, with the Fraser River accounting for approximately 80% of the total (Waldichuck, 1957). Precipitation varies considerably(49-250 cm/yr) within the drainage basins. Mostof the drainage areas are high mountainous regions, and winter snow storage plays a major rolein establishing the runoff (Fig. 3). Precipitation isgreatest during winter and at higher elevations,but drainage does not occur until spring warming.
49
48"30'
Figure 2. Topography of the eastern basin of the Strait of Juan de Fucaand the San Juan Islands waterways. Based on Parker (1977).
3

Figure 3. Seasonal variations in monthly rainfall, river discharge, andsurface salinity. From Holbrook and Halpern (1978).
2.2 Tides and Tidal Currents
Observations from various sources indicate thattidal currents dominate the flow regime in thesewaters. Superimposed on the tidal motions are theestuarine and wind-driven currents that transportfloating and suspended material through the system. The tidal currents represent navigationalhazards. In addition, they tend to disperse floatingand dissolved constituents away from shorelinesand to concentrate those constituents in nearshore eddies and at tidal fronts.
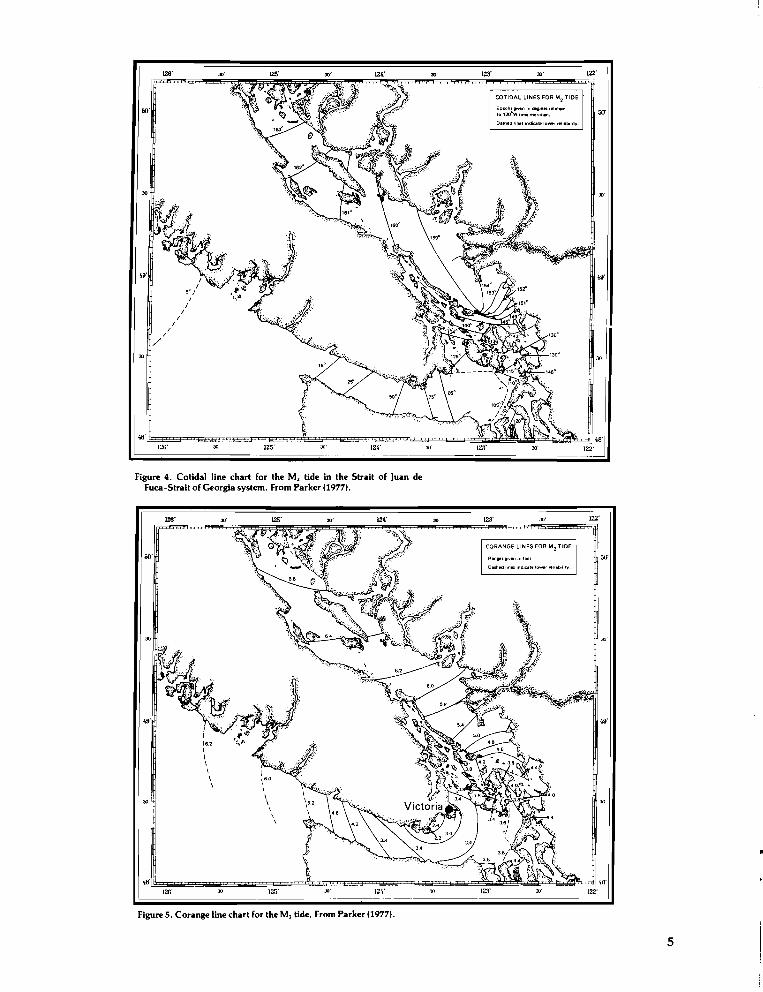
Both the diurnal and semidiurnal tides enter thesystem from the Pacific Ocean as progressive,long waves. (Figs. 4 and 5 show the M2 semidiurnal tide; the diurnal is in Parker, 1977.) Each wavepropagates through the topographically complicated San Juan Archipelago, producing a complexcurrent pattern in this region with strong currentsin Haro and Rosario Straits (Fig. 6). Strong currents also occur in Admiralty Inlet as the tidespropagate into Puget Sound (Fig. 7). The tidalcurrent regime south of the San Juan Archipelago(eastern basin of the Strait of Juan de Fuca) appears to be extremely complex. The volume transported through a cross-section near Neah Bay during a flood tide is approximately 20 km3 and25 km3 for the M2 and K1 components, respectively, and the resulting tidal prism during springtides is nearly 2% of the volume of the system(P. B. Crean, Environment Canada, personalcommunication) .
Further analysis of the tide and tidal current regimes in the Strait of Juan de Fuca, Strait ofGeorgia, and Puget Sound systems is underway atthe National Ocean Survey using a semi-analytical model, and at Environment Canada using anumerical model. It is well established by the earlywork of Redfield (1950), as well as by more recentwork, that reflection of the tides in the Strait ofGeorgia produces standing tides in that region.Around the San Juan and Channel Islands (Canadian), the tidal currents in any given channel areoften controlled by the differing water level at thetwo ends of the channel. Because of their shorterwavelength, the semidiurnal tides such as M2 haveminimums in their range near Victoria (Fig. 5)while diurnal tides such as K1 (not shown) haveprogressively increasing ranges moving landwardfrom the Pacific Ocean.
MEAN RIVERDISCHARGE11958-72 )
12MEAN RAINFALL (1910-401
'.s:: 10'E0E 8
E TATOOSH ISLAND0 6 /
32
Consequently, the Fraser River has maximum discharge in June. Its winter mean discharge represents only approximately 12% of its June peak.The Skagit River (the largest river emptying intoPuget Sound proper), however, has maximum discharges in both summer and winter. The volumeof the maximum Fraser discharge in June over onesemidiurnal tidal period is less than 1 % of thetidal prism (volume of water between high andlow tide levels). The spring freshet lowers the surface salinity north of the San Juan Islands at EastPoint (east end of Saturna Island, shown inFig. 39) by several parts per thousand, while southof the San Juan Islands at Race Rocks, the surfacesalinity remains higher and undergoes smaller seasonal and monthly variations. One important aspect of tidal mixing in the passages of the San JuanIslands is the moderating effect on seasonal freshwater fluctuations'in the Strait of Juan de Fuca.Tidal mixing in Admiralty Inlet similarlymoderates runoff entering from Puget Sound.
...J
...J 4
~Z 2<i0::
:;- 30~S~~~~~~::J::~=~~~====~Q'"
";"0
'"<II
"'Ii: 200w(!)0::<1
i3 100(J)
150::lJ.J
~ 0 S~~~~~~='==~~~~'=~~~~
4
1Z8'
50'
;9'
12;'
JO'
n'
1%:1' JO'
COTIDAL LINES FOR M2 TIDE
Epochl gMln In d8II19n ,elallW'.
\0 l200
W lime m."d,.. ,
Dalhedlonat,ndiC8\l!lo_rel,abohty.
122'
JO'
;9'
30
CQRANGE LINES FOR M2 TIDE
Aanlll'sg,ven '" lUI
D.shed!o""smdIC81'1!Io_'19',aboilty.
Figure 4, Cotidal line chart for the M, tide in the Strait of Juan deFuca-Strait of Georgia system. From Parker (1977).
126'
50'
30'
Figure 5, Corange line chart for the M, tide. From Parker (1977),
JO' 123' ,10' 122'
50'
JO'
30'
5
•

Vancouver Island
............: ....
Figure 6. Tidal current ellipse chart for the tide in the Strait of Juan deFuca-Strait of Georgia system. Direction ellipse points indicatesdirection of tidal current flow. Size of ellipse indicates intensity offlow. from Parker (1977).
While a regional description of the tidal rangeappears to be reasonably accurate, the tidal currents appear to be much more sensitive to localvariations in water depth and details of the shoreline than are the tidal ranges. For example, thetidal currents near Cherry Point are relativelysmall (Schumacher et aI., 1978), while muchstronger tidal currents occur offshore from CherryPoint and in the passages leading to the Strait ofJuan de Fuca (Fig. 6). On the other hand, the tidalranges showed much less variation (Fig. 5).
Moored current meter arrays do not allow a detailed analysis of tidal fronts or discontinuities,but these can be observed in aerial and satelliteimages. Such fronts are common near points ofland in the Strait of Juan de Fuca-Puget Sound region (c. A. Barnes, University of Washington,personal communication; see Section 3.2 below).Tidal fronts act as down-welling centers wherefloating material such as oil could be injected intothe deeper layers of the water column. Verticaldispersion also occurs in passages with strongtidal currents, which produce mixing through thegeneration of turbulence.
The vertical distribution of the tidal currents isrelatively simple in the Strait of Juan de Fuca andin the passages through the San Juan Archipelago.In these regions, the tidal currents are relativelyindependent of depth near the surface, decrease inamplitude below the surface layers, and form abottom boundary layer with active generation ofturbulence during strong current intervals. To thenorth of the passages in the southern Strait of
6
Georgia, internal waves are formed during floodtides. The currents associated with these waveschange across the shallow pycnocline formed bythe Fraser River effluent (Gargett, 1976).
2.3 Winds
General description. Major perturbationsto the seaward, near-surface estuarine flow canoccur as a result of the near-surface wind field.Wind stress can act directly on the surface, transferring momentum or energy downward by vertical mixing. It also can act indirectly by raisingthe sea level at the mouth of the estuary (piling upwater) and thereby modifying the sea-surfaceslope within the estuary, which in turn dominatesthe near-surface circulation. Thus, knowledge oflocal and adjacent wind fields is essential to anydescription of near-surface water motion. Theconventional directions from which the windblows are used in the following description.
The predominant winds along the ocean coastare southwesterly (Le., from the southwest) inwinter and northwesterly in summer, parallelingthe general coastline, and this pattern is reflectedin measurements of typical winter and summermean wind stress fields off the Washington coast(Nelson, 1977). In the Strait of Juan de Fuca thewinds are controlled by orographic factors. Ingeneral, seaward or easterly winds dominate inwinter while landward or westerly winds occurmore frequently in summer (Harris and Rattray,
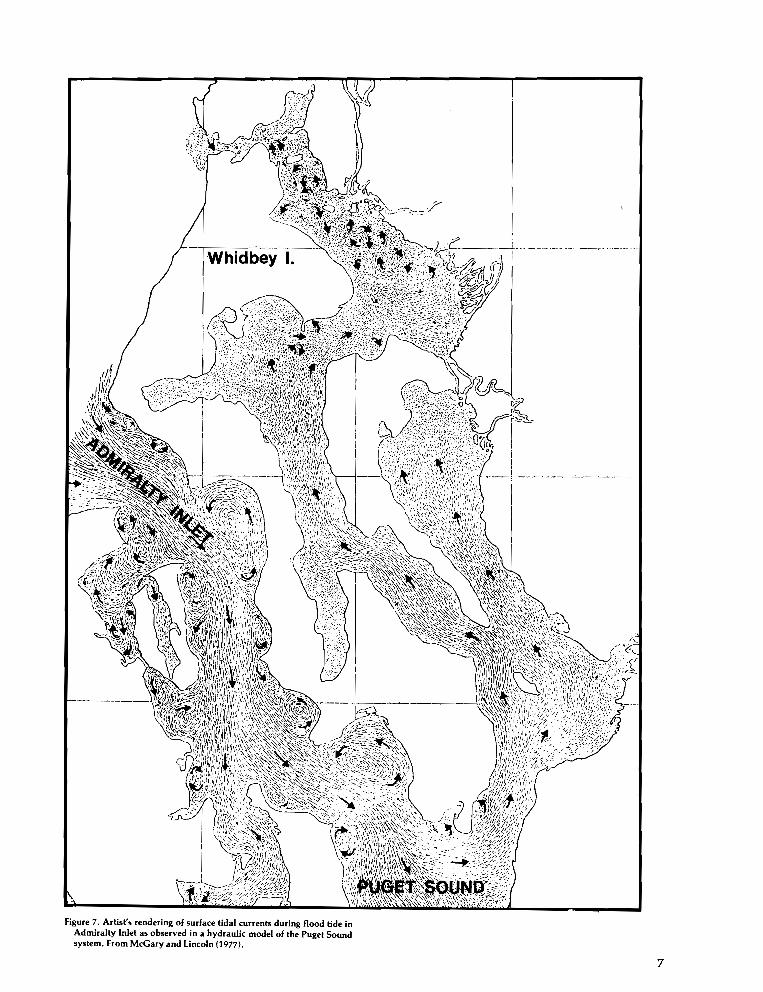
Figure 7. Artist's rendering of surface tidal currents during flood tide inAdmiralty Inlet as observed in a hydraulic model of the Puget Soundsystem. From McGary and Lincoln (1977).
7

The winter season (December-February)weather is dominated by cyclonic storms movingover or to the north of the region, interrupted infrequently by periods of high pressure. Gale force(17-24 m/sec) or higher winds occur frequentlynear Tatoosh Island with southerly gales persisting two or three days accompanied by high seaand swell. While it is difficult to generalize allweather types, there seem to be two typical stormpatterns. In the first, pressure patterns are associated with a large low-pressure area in the Gulf ofAlaska (Fig. 9-A). The center of the low pressureis usually stationary with the frontal systemmoving rapidly across the Pacific. Often the coldfront will rapidly approach the coast, stall, dissipate offshore, and then move inland, leading todifficulties in providing forecasts. The second typeof storm includes disturbances that form in thecentral Pacific between the Aleutian low and theCentral Pacific high and skirt across the Pacific,commonly on an east-northeasterly trajectory,reaching land over Vancouver Island (Fig. 9-B).Such systems are steered by a strong westerlycomponent in the flow at upper levels in the atmosphere. Occasionally the large-scale flowpattern of upper air will shift as it did in winter1976-77 when the storm track occurred to thesouth of Oregon. For frontal systems associatedwith low-pressure centers passing to the north ofthe Strait of Juan de Fuca, the general pattern ofsurface winds just offshore is prevailing south tosouthwesterly flow backing to west-northwest asthe cold front passes. At some time during mostwinters an upper level ridge of high pressure willdevelop over northwest Canada (Fig. 9-C). This isaccompanied by a surface high over Puget Soundbasin. The corresponding weather includes clearskies, near-freezing temperatures, and very stableair in the surface layer. Winds in the Strait arefrom the east, increasing in magnitude from eastto west.
Summer is characterized by the offshore buildup of the eastern Pacific high pressure (Fig. 9-0).
oA
PERCENT WINO SPEEDS:2: 8.5 m· sec-1
(1948- 1958)TATOOSH ISLANO
/
TATOOSH ISLAND PORT ANGELES20 20
15 WINTER 15 WINTER(TOTAL =38.0) (TOTAL; ~ 2)
10 10
I-
"' 5w11u
...r--,'" 0 0WQ.
10 10SUMMER
(TOTAL =3.8)
0 rL 0N E S W N E S W
M A M
40
10 PORT ANGELES
o
I-~ 30u
'"w 20Q.
50r-------------------,
Figure 8. Seasonal distribution of winds greater than 8.5 m/sec atTatoosh Island and Port Angeles. From Holbrook and Halpern(1978). Winter and summer histograms are for December-Februaryand June-August, respectively.
1954). The seasonal variation of winds at TatooshIsland off Cape Flattery shows that during wintermonths 38% of all winds observed have speedsgreater than 8.5 m/sec (Fig. 8). The southerly andeasterly directions shown in the Tatoosh histogram suggest that winter winds reflect the combined influence of the large-scale wind systemsalong the coast and the locally steered winds in theStrait. In contrast to Tatoosh, during wintermonths at Port Angeles only 5% of the windspeeds are greater than 8.5 m/sec. The PortAngeles winds are generally westerly which is consistent with the apparent divergence region west ofPort Angeles suggested by Harris and Rattray.However, about 1%-2% of all observationsshowed strong northeasterly winds.
A B c o
Figure 9. Typical storm patterns affecting the Washington coast.Adapted from Maunder (1968) in Overland and Vimont (1978).
8

The high pressure leads to a dry season with manyclear days and prevailing winds from the west tonorthwest. Superimposed upon the mean flow is astrong diurnal oscillation associated with the seabreeze. Victoria and Port Angeles show a component of wind continuously from the west withmaximum speed occurring at about 1800 localtime and near zero speed in the early morninghours. Over 75% of all wind observations duringthe summer months at Port Angeles are from thewestern quadrant.
The spring season is not significantly differentfrom winter except that temperatures begin to rise,the frequency of cyclonic disturbances decreases,and their distribution over time is irregular. Theautumn season is another transition period. Acommon characteristic of early fall is an Indiansummer, the result of continuing high pressure.
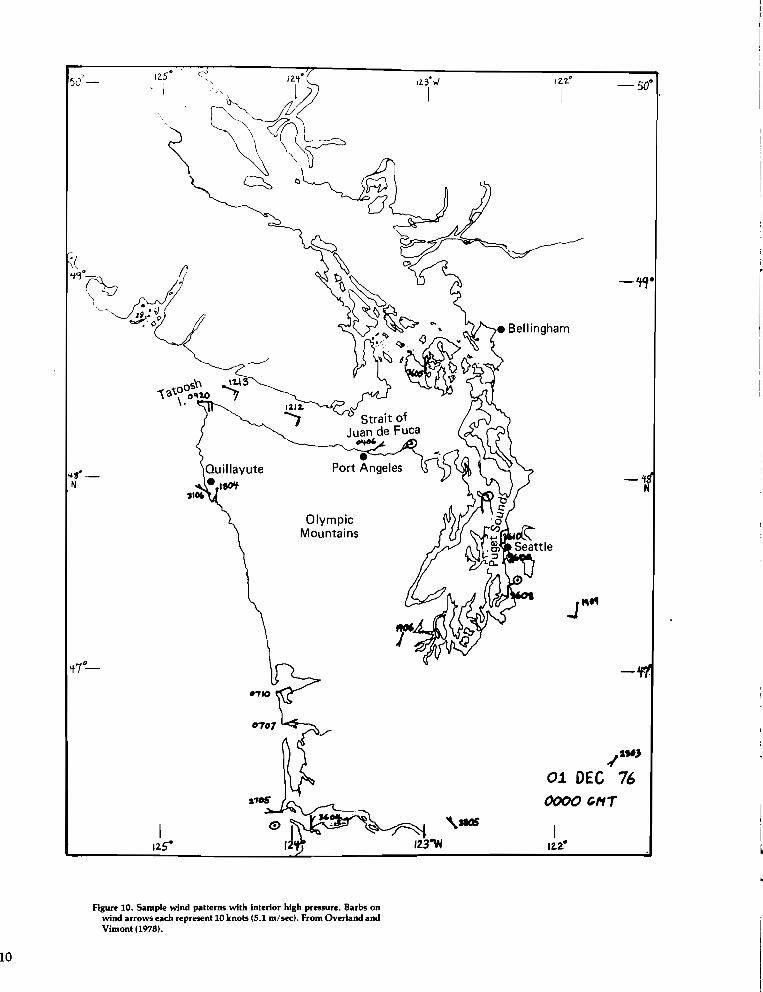
Topography plays the major role in influencingthe winds in the Strait of Juan de Fuca. Due to therotation of the earth, winds tend to blow clockwise around a high and counterclockwise arounda low as viewed from space in the northern hemisphere. However, in places where topography prevents the free flow of air, such as the passagewaysof northwest Washington, winds invariably blowfrom high to low pressure in a direction dictatedby the orientation of the terrain. The Strait of Juande Fuca is very prone to this type of channelingsince the air is often stably stratified, decreasingthe possibility of vertical motion of air parcels. Forexample, when winter high pressure exists in theinterior of Washington State, the pressure ishigher inland at Bellingham than at Quillayute onthe coast (Fig. 10). The airflow acceleratesthrough the Strait with the weak winds at PortAngeles· and strong east winds at Tatoosh. Theseare the so-called gap winds (Reed, 1931). Windsare from the north in the Puget Sound-Seattlearea.
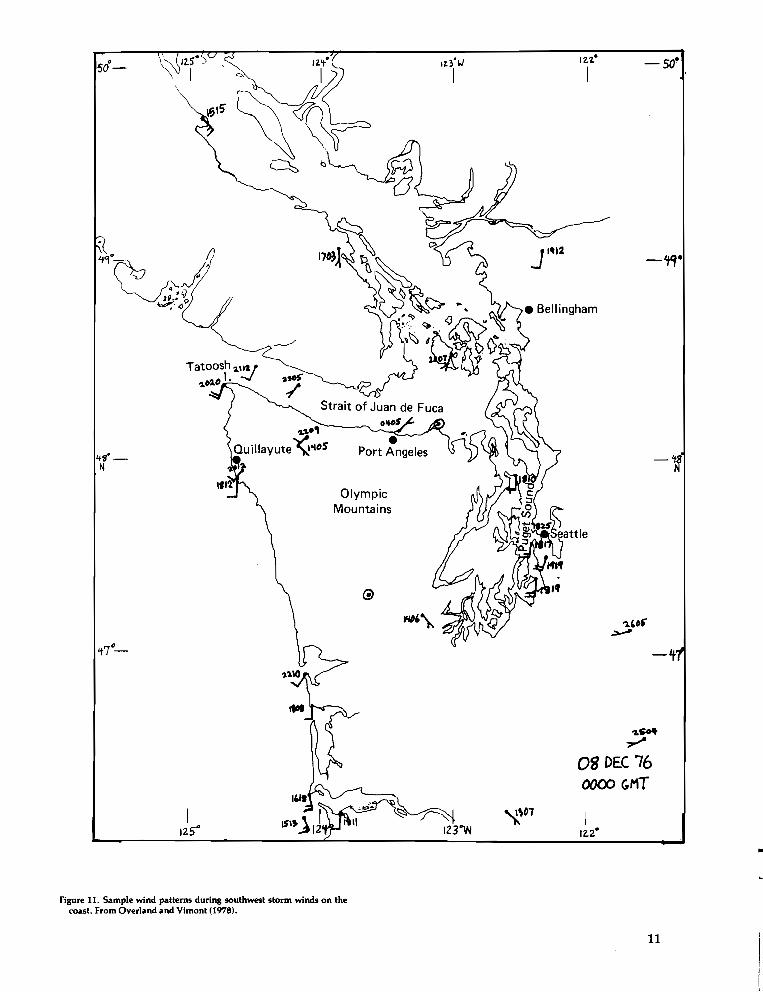
The local air flow is complicated further byinertia, the tendency of the air to flow in the samedirection. Just before the passage of a storm withcoastal winds from the southwest, the flow ischanneled through Puget Sound and around theOlympic Mountains (Fig. 11). However, the airflow overshoots in the lee of the mountain forming an area of calm winds in the vicinity of PortAngeles. As the storm moves northeastward thewinds in the Strait shift to westerly and the convergence zone formed in the lee of the mountainmoves south. This case of westerly winds in theStrait was typical during one of the winter seriesof recent observations described below and laterin Section 3.3. These westerly winds appeared tobe a regularly occurring event during winter.Other examples are in Overland and Vimont(1978).
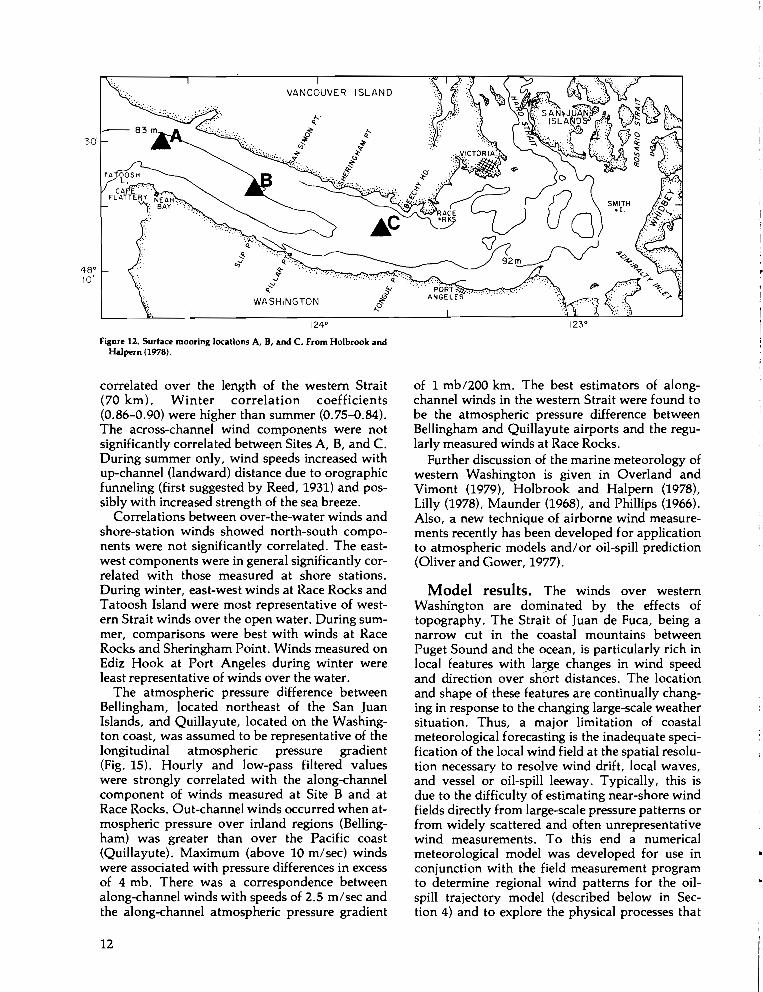
Recent observations. During the late winterof 1976 (February-May), the winter of 1976-1977(November 1976-February 1977), and the summerof 1977 (June-SeptEmber), over-the-water andshore-station wind measurements were made inconjunction with current observations in the western basin of the Strait, as described in theOceanography section. Over-the-water windswere measured from surface buoys located at SitesA, B, and C (Fig. 12) and were recorded by vector-averaging wind recorders. Details of the measurement techniques and preliminary analysis aregiven in Holbrook and Halpern (1978).
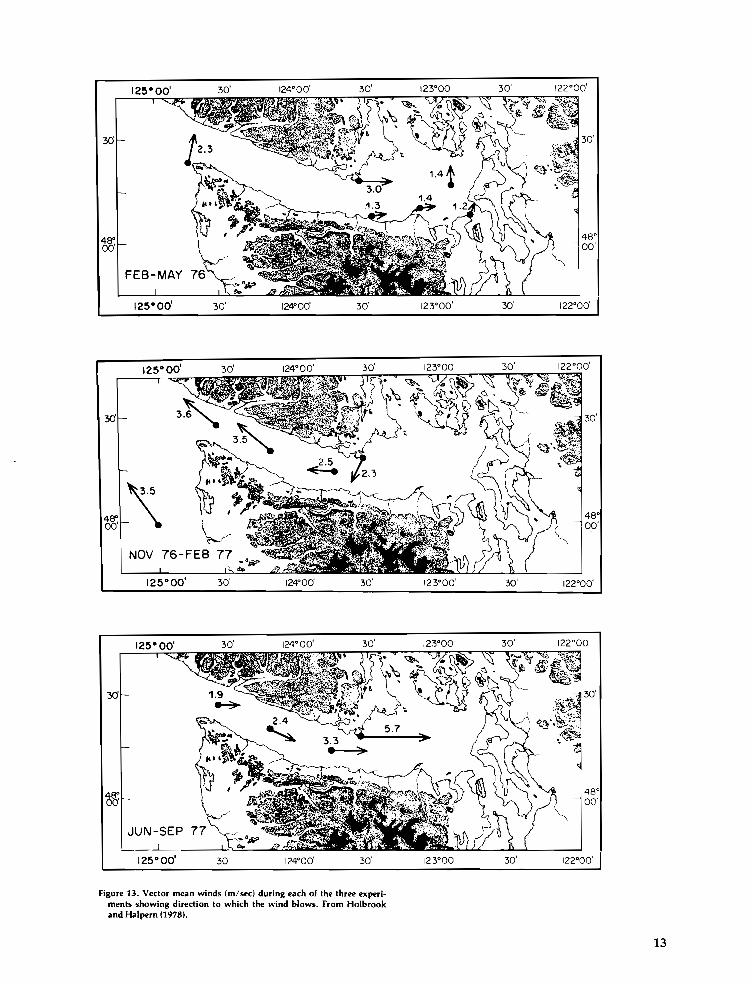
The predominant wind patterns during the threedeployments were different (Fig. 13). During thefirst winter's deployment, coastal winds weresouthwesterly, while Strait winds were westerly asmeasured at Race Rocks and Port Angeles. Noover-the-water winds ~ere recorded. During thesecond winter experiment, coastal winds weresoutheasterly, and Strait winds measured from thesurface buoys were predominantly easterly, incontrast with the winds of the first winter. Duringthe summer experiment, Strait winds measuredfrom the surface buoys were westerly with astrong diurnal sea-breeze component. The secondwinter generally was analogous to that describedby Harris and Rattray (1954), while the mean conditions during the first winter were entirely different.
During the first winter experiment, winds weremeasured at NOS and Environment Canada shorestations (Fig. 14). The two most predominant winter wind patterns occurred on February 15 andMarch 3, 1976. The first was characterized bysoutherly winds off the coast (Tatoosh Island) andover the inland waters (Point Wilson at the entrance to Admiralty Inlet and Smith Island) andweak and variable winds over the middle Strait(Port Angeles, Race Rocks, and New Dungenessspit east of Port Angeles). On March 3, winds atall stations were northeasterly and were generallyassociated with a high pressure system locatedover the Cascade Range.
Other statistical studies showed that the totalwind variance was 81 % greater during winterthan during summer. The along-channel windvariance accounted for most (76%-84 %) of thetotal variance and was primarily distributed atlower frequencies with 87%-90% below 0.04cycles per hour (cph). The only significant spectralpeaks occurred during summer and were associated with the sea-breeze effect. Of the alongchannel variance at frequencies below 0.04 cph,72%-85% was coherent between Sites A and C,and phase lags in this frequency range were notsignificantly different from zero. Of the alongchannel total wind energy, 56%-74% was linearly
9
OlympicMountains
-IfN
-If·,
-50·
J"t1
12.2."
I
-IS..,01 DEC 760000 (;11;
Strait ofJuan de Fuca
o&tO'
•Port Angeles
1:l12...,oS\'\,'OtO 0"2.0
\.
50'-
't7"-
~8·
N
I12.S--
01~ IIZ.~·
Figure 10. Sample wind patterns with interior high pressure. Barbs onwind arrows each represent 10 knots (5.1 m/sec). From Overland andVimont (1978).
10
•
-'t8N
-~.
Irz.,·
IZ:Z.·
I
oz.S414~
08 DE.C 76ooסס GMT
• Bellingham
TatooSh 2."~''3,02.0" ""
I125"
\
50°_
Figure 11. Sample wind patterns during southwest storm winds on thecoast. From Overland and Vimont (1978).
11
VANCOUVER ISLAND
1240
Figure 12. Surface mooring locations A, B, and C. From Holbrook andHalpern (1978).
48 0
10'
WASHINGTON
...........; ••.•: :;".:::. 'Q.'A,,' ••
J'~,,0
correlated over the length of the western Strait(70 km). Winter correlation coefficients(0.86-0.90) were higher than summer (0.75-0.84).The across-channel wind components were notsignificantly correlated between Sites A, B, and C.During summer only, wind speeds increased withup-channel (landward) distance due to orographicfunneling (first suggested by Reed, 1931) and possibly with increased strength of the sea breeze.
Correlations between over-the-water winds andshore-station winds showed north-south components were not significantly correlated. The eastwest components were in general significantly correlated with those measured at shore stations.During winter, east-west winds at Race Rocks andTatoosh Island were most representative of western Strait winds over the open water. During summer, comparisons were best with winds at RaceRocks and Sheringham Point. Winds measured onEdiz Hook at Port Angeles during winter wereleast representative of winds over the water.
The atmospheric pressure difference betweenBellingham, located northeast of the San JuanIslands, and Quillayute, located on the Washington coast, was assumed to be representative of thelongitudinal atmospheric pressure gradient(Fig. 15). Hourly and low-pass filtered valueswere strongly correlated with the along-channelcomponent of winds measured at Site B and atRace Rocks. Out-channel winds occurred when atmospheric pressure over inland regions (Bellingham) was greater than over the Pacific coast(Quillayute). Maximum (above 10 m/sec) windswere associated with pressure differences in excessof 4 mb. There was a correspondence betweenalong-channel winds with speeds of 2.5 m/sec andthe along-channel atmospheric pressure gradient
12
of 1 mb/200 km. The best estimators of alongchannel winds in the western Strait were found tobe the atmospheric pressure difference betweenBellingham and Quillayute airports and the regularly measured winds at Race Rocks.
Further discussion of the marine meteorology ofwestern Washington is given in Overland andVimont (1979), Holbrook and Halpern (1978),Lilly (1978), Maunder (1968), and Phillips (1966).Also, a new technique of airborne wind measurements recently has been developed for applicationto atmospheric models and/ or oil-spill prediction(Oliver and Gower, 1977).
Model results. The winds over westernWashington are dominated by the effects oftopography. The Strait of Juan de Fuca, being anarrow cut in the coastal mountains betweenPuget Sound and the ocean, is particularly rich inlocal features with large changes in wind speedand direction over short distances. The locationand shape of these features are continually changing in response to the changing large-scale weathersituation. Thus, a major limitation of coastalmeteorological forecasting is the inadequate specification of the local wind field at the spatial resolution necessary to resolve wind drift, local waves,and vessel or oil-spill leeway. Typically, this isdue to the difficulty of estimating near-shore windfields directly from large-scale pressure patterns orfrom widely scattered and often unrepresentativewind measurements. To this end a numericalmeteorological model was developed for use inconjunction with the field measurement programto determine regional wind patterns for the oilspill trajectory model (described below in Section 4) and to explore the physical processes that
YJ'
30'
30'
30'
124°00'
124°00'
124°00'
30'
30'
30'
123°00'
123°00'
123°00'
30'
30'
30'
30'
122°00'
122°00'
122°00'
122°00'
Figure 13. Vector mean winds (m/secl during each of the three experiments showing direction to which the wind blows. From Holbrookand Halpern (1978).
13

~
I
302510 15 20
APRIL
530 1252010 15
MARCH
_::~\lli::~,~~= :~~ ~\IV~~ ~: ~ :: =~I:::J
::I~sL~IPP~OINT~~~~~~"dl~~~~A':!I:I'~~~~1~:='~:'~:d~~d":W~~~~':~~:!<i&A~d/~~*h=~'I=~ : :: ~""- ,,7: I
-:: : === : :: =:1:: :: ~:: : :': 1
,11'/ .~I:.~I~li':" ~ ::: :::\WU:"I:'~"" ]::III1:~ ~'~~T= .. ~. :.~., .. ~c - :J
'~":'=':':~':::: ~ ::': .J'. =:1Figure 14. Low-pass filtered wind vedors measured at shore stations
during the first winter experiment and plotted at 6-h intervals. FromHolbrook and Halpern (1978). The vedors point in the direction-toward which the wind blows.
20I: ALONG=STRAITWOOATSTRMi=4
-10
-20 ,
20~ 1: A LONG- STRAIT WINDS AT RACE ROCKS
- -10
-20
: ATMOSPHER IC PRESSURE DIFFERENCE (BA - QA)
2
i2 0r- -2
-4
-6 +'~~~~~~~~~~~~~ri-c~~~~~~'-'-;'~~~~~~~~~~~~~~~~~~~~,--j.1040,-------------------------------------------~
1020
i2r- 1000
ATMOSPHERIC PRESSURE AT QUILLAYUTE (QAl
14
10 15 20 25 301 10 15 20 25 30 I~c ~N76 77
Figure 15. Along-channel winds related to the atmospheric pressure difference between Bellingham (BA) and Quillayute (QA) showinghourly and low-pass filtered values. From Holbrook and Halpern(1978).
10 15 20 25 . 30 IFEe77
10 15
VELOCITY VECTOR PLOT
10 METERS PER SECOND
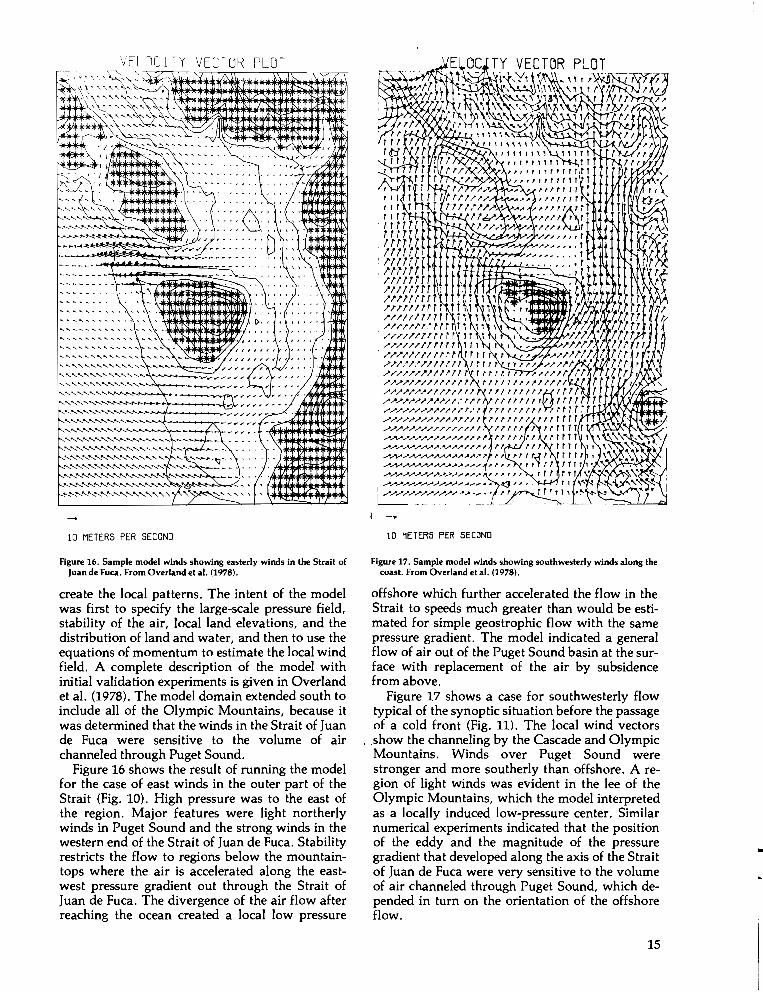
Figure 16. Sample model winds showing easterly winds in the Strait ofJuan de Fuca. From Overland et al. (1978).
create the local patterns. The intent of the modelwas first to specify the large-scale pressure field,stability of the air, local land elevations, and thedistribution of land and water, and then to use theequations of momentum to estimate the local windfield. A complete description of the model withinitial validation experiments is given in Overlandet al. (1978). The model domain extended south toinclude all of the Olympic Mountains, because itwas determined that the winds in the Strait of Juande Fuca were sensitive to the volume of airchanneled through Puget Sound.
Figure 16 shows the result of running the modelfor the case of east winds in the outer part of theStrait (Fig. 10). High pressure was to the east ofthe region. Major features were light northerlywinds in Puget Sound and the strong winds in thewestern end of the Strait of Juan de Fuca. Stabilityrestricts the flow to regions below the mountaintops where the air is accelerated along the eastwest pressure gradient out through the Strait ofJuan de Fuca. The divergence of the air flow afterreaching the ocean created a local low pressure
~/~~/~~/~~~~~~~~ "~'"
....................................-A ~ ,.,.
i / ......./~.......~~:~~:~~~ .
10 METERS PER SECOND
Figure 17. Sample model winds showing southwesterly winds along thecoast. From Overland et al. (1978).
offshore which further accelerated the flow in theStrait to speeds much greater than would be estimated for simple geostrophic flow with the samepressure gradient. The model indicated a generalflow of air out of the Puget Sound basin at the surface with replacement of the air by subsidencefrom above.
Figure 17 shows a case for southwesterly flowtypical of the synoptic situation before the passageof a cold front (Fig. 11). The local wind vectorsshow the channeling by the Cascade and OlympicMountains. Winds over Puget Sound werestronger and more southerly than offshore. A region of light winds was evident in the lee of theOlympic Mountains, which the model interpretedas a locally induced low-pressure center. Similarnumerical experiments indicated that the positionof the eddy and the magnitude of the pressuregradient that developed along the axis of the Straitof Juan de Fuca were very sensitive to the volumeof air channeled through Puget Sound, which depended in turn on the orientation of the offshoreflow.
15
•
3. OCEANOGRAPHY
3.1 Surface Drifter ObservationsA
III
r
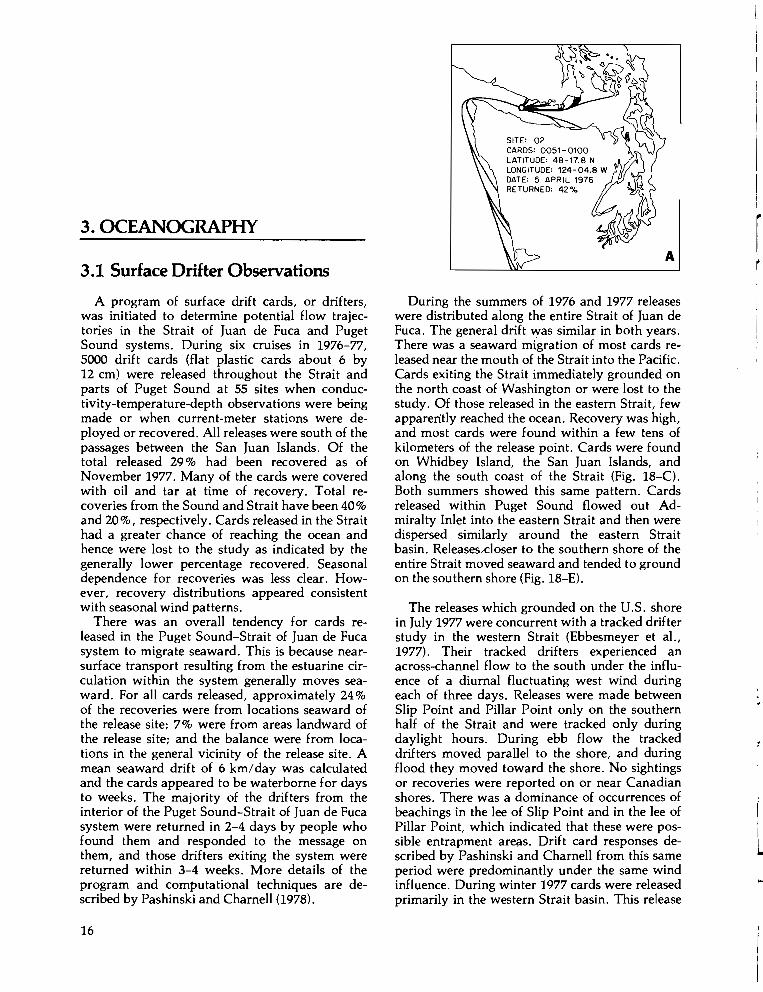
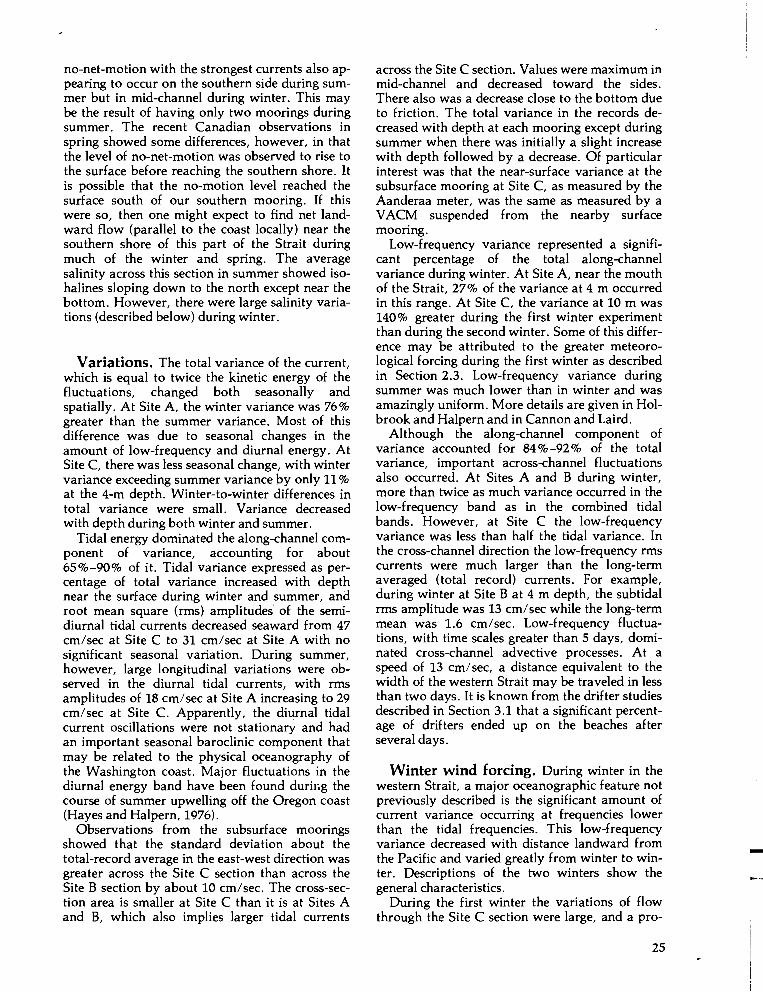
A program of surface drift cards, or drifters,was initiated to determine potential flow trajectories in the Strait of Juan de Fuca and PugetSound systems. During six cruises in 1976-77,5000 drift cards (flat plastic cards about 6 by12 cm) were released throughout the Strait andparts of Puget Sound at 55 sites when conductivity-temperature-depth observations were beingmade or when current-meter stations were deployed or recovered. All releases were south of thepassages between the San Juan Islands. Of thetotal released 29 % had been recovered as ofNovember 1977. Many of the cards were coveredwith oil and tar at time of recovery. Total recoveries from the Sound and Strait have been 40%and 20 %, respectively. Cards released in the Straithad a greater chance of reaching the ocean andhence were lost to the study as indicated by thegenerally lower percentage recovered. Seasonaldependence for recoveries was less clear. However, recovery distributions appeared consistentwith seasonal wind patterns.
There was an overall tendency for cards released in the Puget Sound-Strait of Juan de Fucasystem to migrate seaward. This is because nearsurface transport resulting from the estuarine circulation within the system generally moves seaward. For all cards released, approximately 24 %of the recoveries were from locations seaward ofthe release site; 7% were from areas landward ofthe release site; and the balance were from locations in the general vicinity of the release site. Amean seaward drift of 6 km/day was calculatedand the cards appeared to be waterborne for daysto weeks. The majority of the drifters from theinterior of the Puget Sound-Strait of Juan de Fucasystem were returned in 2-4 days by people whofound them and responded to the message onthem, and those drifters exiting the system werereturned within 3-4 weeks. More details of theprogram and computational techniques are described by Pashinski and Charnell (1978).
16
During the summers of 1976 and 1977 releaseswere distributed along the entire Strait of Juan deFuca. The general drift was similar in both years.There was a seaward migration of most cards released near the mouth of the Strait into the Pacific.Cards exiting the Strait immediately grounded onthe north coast of Washington or were lost to thestudy. Of those released in the eastern Strait, fewapparently reached the ocean. Recovery was high,and most cards were found within a few tens ofkilometers of the release point. Cards were foundon Whidbey Island, the San Juan Islands, andalong the south coast of the Strait (Fig. 18-C).Both summers showed this same pattern. Cardsreleased within Puget Sound flowed out Admiralty Inlet into the eastern Strait and then weredispersed similarly around the eastern Straitbasin. ReleasesA:loser to the southern shore of theentire Strait moved seaward and tended to groundon the southern shore (Fig. 18-E).
The releases which grounded on the U.S. shorein July 1977 were concurrent with a tracked drifterstudy in the western Strait (Ebbesmeyer et aI.,1977). Their tracked drifters experienced anacross-channel flow to the south under the influence of a diurnal fluctuating west wind duringeach of three days. Releases were made betweenSlip Point and Pillar Point only on the southernhalf of the Strait and were tracked only duringdaylight hours. During ebb flow the trackeddrifters moved parallel to the shore, and duringflood they moved toward the shore. No sightingsor recoveries were reported on or near Canadianshores. There was a dominance of occurrences ofbeachings in the lee of Slip Point and in the lee ofPillar Point, which indicated that these were possible entrapment are;lS. Drift card responses described by Pashinski and Charnell from this sameperiod were predominantly under the same windinfluence. During winter 1977 cards were releasedprimarily in the western Strait basin. This release
II
l
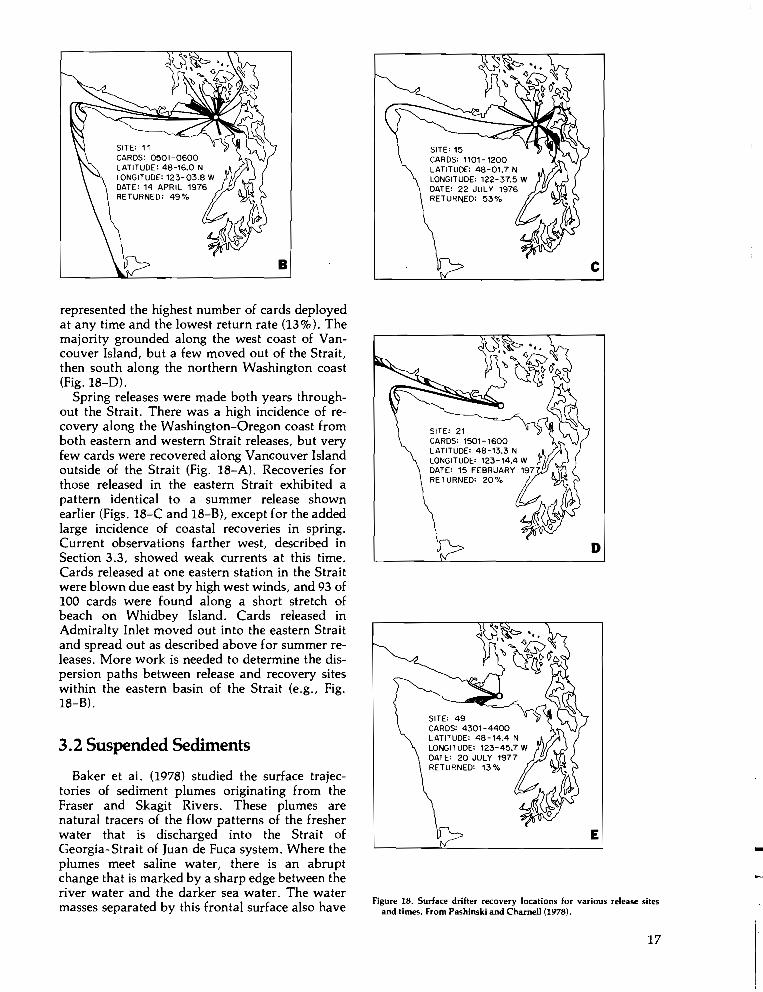
SITE: 11CARDS: 0501-0600LATITUDE: 4B-16.0 NLONGITUDE: 123-03.B WDATE: 14 APRIL 1976RETURNED: 49%
B
SITE: 15CARDS: 1101 - 1200LATITUDE: 4B-01.7 NLONGITUDE: 122-37.5 WDATE: 22 JULY 1976RETUR!'iED: 53%
c
represented the highest number of cards deployedat any time and the lowest return rate (13%). Themajority grounded along the west coast of Vancouver Island, but a few moved out of the Strait,then south along the northern Washington coast(Fig. 18-0).
Spring releases were made both years throughout the Strait. There was a high incidence of recovery along the Washington-Oregon coast fromboth eastern and western Strait releases, but veryfew cards were recovered along Vancouver Islandoutside of the Strait (Fig. 18-A). Recoveries forthose released in the eastern Strait exhibited apattern identical to a summer release shownearlier (Figs. 18-C and 18-B), except for the addedlarge incidence of coastal recoveries in spring.Current observations farther west, described inSection 3.3, showed weak currents at this time.Cards released at one eastern station in the Straitwere blown due east by high west winds, and 93 of100 cards were found along a short stretch ofbeach on Whidbey Island. Cards released inAdmiralty Inlet moved out into the eastern Straitand spread out as described above for summer releases. More work is needed to determine the dispersion paths between release and recovery siteswithin the eastern basin of the Strait (e.g., Fig.18-B).
3.2 Suspended Sediments
Baker et al. (1978) studied the surface trajectories of sediment plumes originating from theFraser and Skagit Rivers. These plumes arenatural tracers of the flow patterns of the fresherwater that is discharged into the Strait ofGeorgia-Strait of Juan de Fuca system. Where theplumes meet saline water, there is an abruptchange that is marked by a sharp edge between theriver water and the darker sea water. The watermasses separated by this frontal surface also have
SITE: 21CARDS: 1501-1600LATITUDE: 4B-13.3 NLONGITUDE: 123- 14.4 WDATE: 15 FEBRUARY 1977RETURNED: 20%
D
SITE: 49CARDS: 4301-4400LATITUDE: 4B-14.4 NLONGITUDE: 123-45.7 WDATE: 20 JULY 1977RETURNED: 13%
E
Figure 18. Surface drifter recovery locations for various release sitesand times. From Pashinski and Charnell (1978).
17
-

Figure 19. MSS Band 5 of LANDSAT image 1727-18290, showing asoutheasterly dispersal (5) of suspended sediments from the FraserRiver into the Strait of Georgia on July 20, 1974. Time of image acquisition was 1029 PST, between major ebb current and slack water.The dispersal pallern suggests movement of Fraser River sedimentsalong Saturna, Mayne, and Galiano Islands and into TrincomaliChannel from Porlier Pass. Suspended sediments from the North
differing velocities, and where the surface velocities are convergent, there must be downwardmovement at the front. For example, oil spilled inDelaware Bay, between Delaware and NewJersey, moved toward fronts and spread out alongthem (Klemas and Polis, 1976). The combinationof downward motion with the presence of suspended particles to which oil might attach suggeststhat a convergent front is the place where oilwould be most likely to sink below the surface,greatly increasing the hazard to marine life.
Suspended matter concentrations and compositions determined by using water samples collectedin situ with la-liter Scott-Richards bottles havebeen used to describe the seasonal variations ofparticulate distributions. However, due to thephysical limitations of operating from a single
18
Arm of the Fraser appear to flow to the northwest and to the northeast into Burrard Inlet (6). A cyclonic eddy (7) can be observed northof Galiano Island. Sediment discharge from the Skagit River intoSkagit Bay (8), and from the Nooksack River into Bellingham Bay (9)is clearly visible. Several tidal fronts are also observed in the Strait ofJuan de Fuca. From Baker el al. (1978).
vessel, the data were not entirely synoptic andwere integrated over several tidal cycles. In orderto obtain synoptic information about plumetrajectories, a set of LANDSAT satellite imagesfrom 1972-1977 has been examined. The sedimentplumes in the LANDSAT images appeared lighterin tone than the less' turbid water. However, theLANDSAT imagery only provided informationabout the upper few meters of the water column.Fortunately, previous studies have shown that thebrackish water is generally confined to the upper5-10 m (Waldichuck, 1957). Therefore, theLANDSAT imagery could be used to study themigration patterns of the brackish water, providing the sediment loadings were sufficiently higherthan the surrounding water. The amount of usefulinformation about seasonal variations of sus-

Figure 20. MSS Band 4 of LANDSAT image 2417-18220 on March 14,1976. Time of image acquisition was 1022 PST, between minor ebbcurrent and slack water. The image shows limited dispersal of suspended sediments into the nearshore waters south and southeast ofthe mouths of the Main, Middle, and North Arms of the Fraser. FromBaker et al. (1978).
pended sediment distributions and dispersalpatterns that can be obtained from LANDSATimagery is somewhat limited because most cloudfree days occurred during the summer; as a result,the majority of available images were from thatseason. Computer enhancement of images is beingdeveloped for future work. More details of theoverall program and of the techniques of using theLANDSAT images are in Baker et al. (1978).
During summer the southward flows of theFraser River's Main Arm (south) and Middle Armwere so strong that the resultant plume maintained its identity for a considerable distance and,in some cases, traversed the entire length of theStrait of Georgia (Fig. 19). Depending upon localchanges in tidal currents, the plumes extendedeither southeast or southwest from the mouths of
the river. Tidal mixing was rapid and numerouseddies could be seen. Also, the Skagit River plumeflowed into Skagit Bay and Saratoga Passage during the summer months. Some plume materialpassed through Deception Pass into Rosario Straitduring ebb tide.
The winter plumes from the Fraser and SkagitRivers, as shown by the three images LANDSATwas able to make in wintertime between January1973 and March 1976, were much less distinct andless well-defined than the summer plumes(Fig. 20). For instance, the Fraser River plumeswere only visible in the near-shore regions just afew kilometers seaward of the river mouth, wherethe primary flow pattern was to the southeast.During this period, the discharge of both water
19
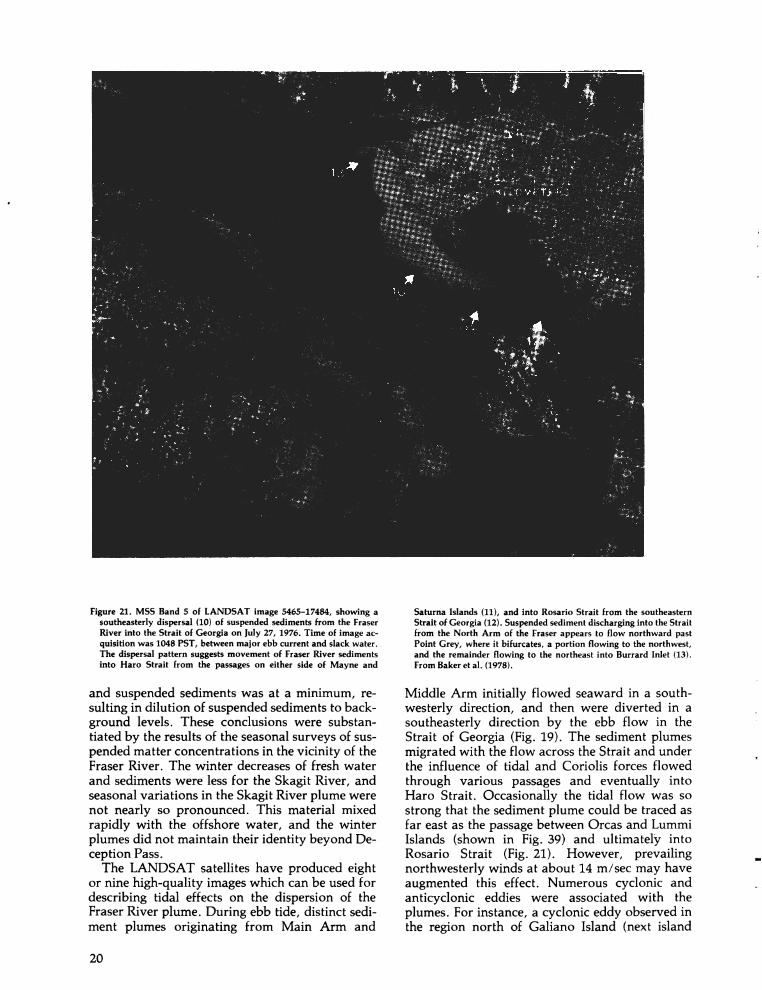
Figure 21. MSS Band 5 of LANDSAT image 5465-17484, showing asoutheasterly dispersal (10) of suspended sediments from the FraserRiver into the Strait of Georgia on July 27, 1976. Time of image acquisition was 1048 PST, between major ebb current and slack water.The dispersal pattern suggests movement of Fraser River sedimentsinto Haro Strait from the passages on either side of Mayne and
and suspended sediments was at a minimum, resulting in dilution of suspended sediments to background levels. These conclusions were substantiated by the results of the seasonal surveys of suspended matter concentrations in the vicinity of theFraser River. The winter decreases of fresh waterand sediments were less for the Skagit River, andseasonal variations in the Skagit River plume werenot nearly so pronounced. This material mixedrapidly with the offshore water, and the winterplumes did not maintain their identity beyond Deception Pass.
The LANDSAT satellites have produced eightor nine high-quality images which can be used fordescribing tidal effects on the dispersion of theFraser River plume. During ebb tide, distinct sediment plumes originating from Main Arm and
20
Saturna Islands (11), and into Rosario Strait from the southeasternStrait of Georgia (12). Suspended sediment discharging into the Straitfrom the North Arm of the Fraser appears to flow northward pastPoint Grey, where it bifurcates, a portion flowing to the northwest,and the remainder flowing to the northeast into Burrard Inlet (13).From Baker et at. (1978).
Middle Arm initially flowed seaward in a southwesterly direction, and then were diverted in asoutheasterly direction by the ebb flow in theStrait of Georgia (Fig. 19). The sediment plumesmigrated with the flow across the Strait and underthe influence of tidal and Coriolis forces flowedthrough various passages and eventually intoHaro Strait. Occasionally the tidal flow was sostrong that the sediment plume could be traced asfar east as the passage between Orcas and LummiIslands (shown in Fig. 39) and ultimately intoRosario Strait (Fig. 21). However, prevailingnorthwesterly winds at about 14 m/sec may haveaugmented this effect. Numerous cyclonic andanticyclonic eddies were associated with theplumes. For instance, a cyclonic eddy observed inthe region north of Galiano Island (next island
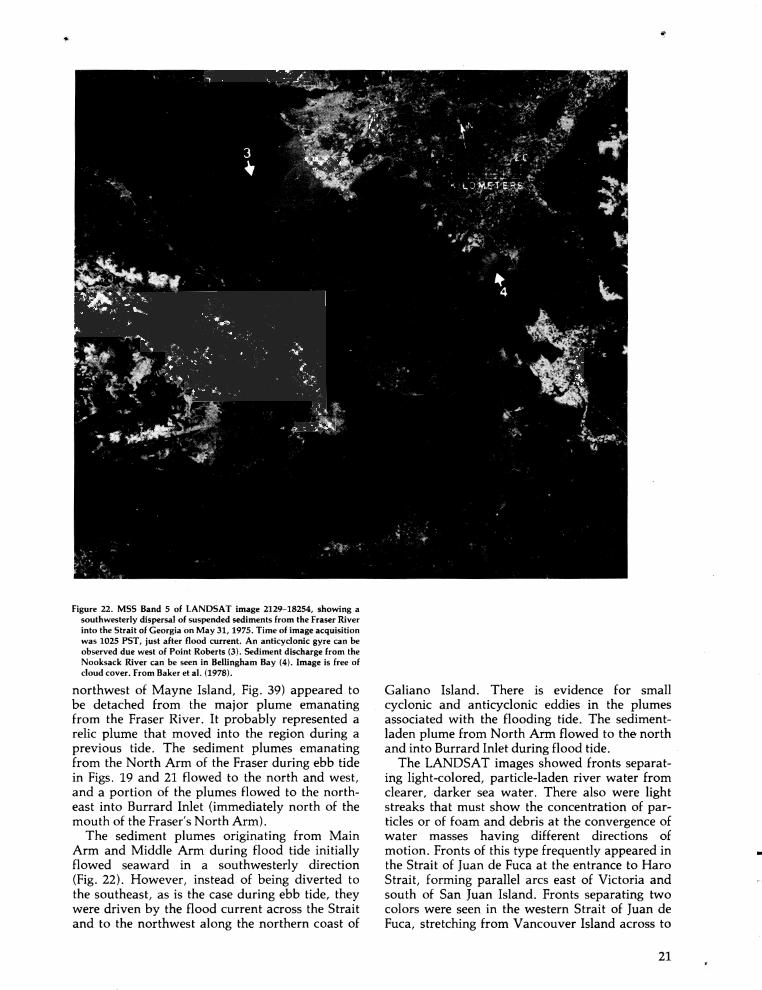
Figure 22. MSS Band 5 of LANDSAT image 2129-18254, showing asouthwesterly dispersal of suspended sediments from the Fraser Riverinto the Strait of Georgia on May 31,1975. Time of image acquisitionwas 1025 PST, just after flood current. An anticyclonic gyre can beobserved due west of Point Roberts (3). Sediment discharge from theNooksack River can be seen in Bellingham Bay (4). Image is free ofcloud cover. From Baker et al. (1978).
northwest of Mayne Island, Fig. 39) appeared tobe detached from the major plume emanatingfrom the Fraser River. It probably represented arelic plume that moved into the region during aprevious tide. The sediment plumes emanatingfrom the North Arm of the Fraser during ebb tidein Figs. 19 and 21 flowed to the north and west,and a portion of the plumes flowed to the northeast into Burrard Inlet (immediately north of themouth of the Fraser's North Arm).
The sediment plumes originating from MainArm and Middle Arm during flood tide initiallyflowed seaward in a southwesterly direction(Fig. 22). However, instead of being diverted tothe southeast, as is the case during ebb tide, theywere driven by the flood current across the Straitand to the northwest along the northern coast of
Galiano Island. There is evidence for smallcyclonic and anticyclonic eddies in the plumesassociated with the flooding tide. The sedimentladen plume from North Arm flowed to the northand into Burrard Inlet during flood tide.
The LANDSAT images showed fronts separating light-colored, particle-laden river water fromclearer, darker sea water. There also were lightstreaks that must show the concentration of particles or of foam and debris at the convergence ofwater masses having different directions ofmotion. Fronts of this type frequently appeared inthe Strait of Juan de Fuca at the entrance to HaroStrait, forming parallel arcs east of Victoria andsouth of San Juan Island. Fronts separating twocolors were seen in the western Strait of Juan deFuca, stretching from Vancouver Island across to
21
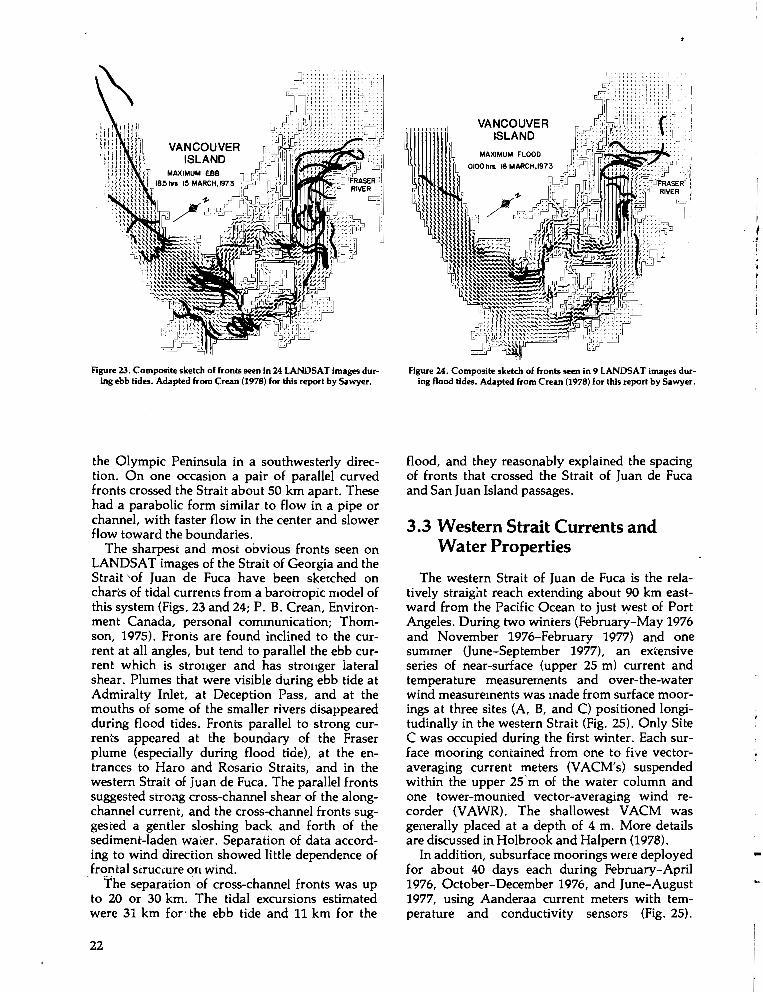
Figure 23. Composite sketch of fronts seen in 24 LANDSAT images durIng ebb tides. Adapted from Crean (1978) for this report by Sawyer.
the Olympic Peninsula in a southwesterly direction. On one occasion a pair of parallel curvedfronts crossed the Strait about 50 km apart. Thesehad a parabolic form similar to flow in a pipe orchannel, with faster flow in the center and slowerflow toward the boundaries.
The sharpest and most obvious fronts seen onLANDSAT images of the Strait of Georgia and theStrait 'of, Juan de Fuca have been sketched oncharts of tidal currents from a barotropic model ofthis system (Figs. 23 and 24; P. B. Crean, Environment Canada, personal communication; Thomson, 1975). Fronts are found inclined to the current at all angles, but tend to parallel the ebb current which is stronger and has stronger lateralshear. Plumes that were visible during ebb tide atAdmiralty Inlet, at Deception Pass, and at themouths of some of the smaller rivers disappearedduring flood tides. Fronts parallel to strong currents appeared at the boundary of the Fraserplume (especially during flood tide), at the entrances to Haro and Rosario Straits, and in thewestern Strait of Juan de Fuca. The parallel frontssuggested stroi'lg cross-channel shear of the alongchannel current, and the cross-channel fronts suggested a gentler sloshing back and forth of thesediment-laden water. Separation of data according to wind direction showed little dependence offrontal si:ruc(ure on wind.
The separation of cross-channel fronts was upto 20 or 30 km. The tidal excursions estimatedwere 31 km for'the ebb tide and 11 km for the
22
Figure 24. Composite sketch of fronts seen in 9 LANDSAT images during flood tides. Adapted from Crean (1978) for this report by Sawyer.
flood, and they reasonably explained the spacingof fronts that crossed the Strait of Juan de Fucaand San Juan Island passages.
3.3 Western Strait Currents andWater Properties
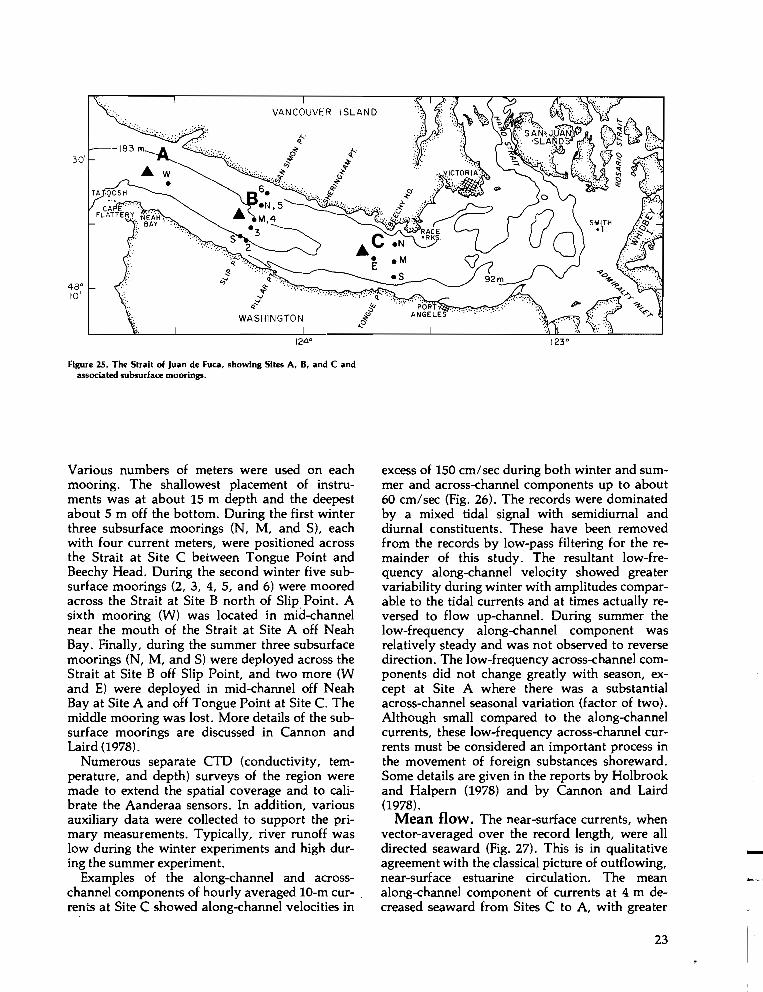
The western Strait of Juan de Fuca is the relatively straight reach extending about 90 km eastward from the Pacific Ocean to just west of PortAngeles. During two winters (February-May 1976and November 1976-February 1977) and onesummer (June-September 1977), an extensiveseries of near-surface (upper 25 m) current andtemperature measurements and over-the-waterwind measurements was made from surface moorings at three sites (A, B, and C) positioned longitudinally in the western Strait (Fig. 25). Only SiteC was occupied during the first winter. Each surface mooring contained from one to five vectoraveraging current meters (VACM's) suspendedwithin the upper 25'm of the water column andone tower-mounted vector-averaging wind recorder (VAWR). The shallowest VACM wasgenerally placed at a depth of 4 m. More detailsare discussed in Holbrook and Halpern (1978).
In addition, subsurface moorings were deployedfor about 40 days each during February-April1976, October-December 1976, and June-August1977, using Aanderaa current meters with temperature and conductivity sensors (Fig. 25).
f,I
48 0
10'
VANCOUVER ISLAND
:""'~;".:-.",~ .
......,"r '. ~....... • .' ••• ~ .:." '; :;
Q.::::'
WASHINGTON
1240 123 0
Figure 25. The Strait of Juan de Fuca, showing Sites A, B, and C andassociated subsurface moorings.
Various numbers of meters were used on eachmooring. The shallowest placement of instruments was at about 15 m depth and the deepestabout 5 m off the bottom. During the first winterthree subsurface moorings (N, M, and S), eachwith four current meters, were positioned acrossthe Strait at Site C between Tongue Point andBeechy Head. During the second winter five subsurface moorings (2, 3, 4, 5, and 6) were mooredacross the Strait at Site B north of Slip Point. Asixth mooring (W) was located in mid-channelnear the mouth of the Strait at Site A off NeahBay. Finally, during the summer three subsurfacemoorings (N, M, and S) were deployed across theStrait at Site B off Slip Point, and two more (Wand E) were deployed in mid-channel off NeahBay at Site A and off Tongue Point at Site C. Themiddle mooring was lost. More details of the subsurface moorings are discussed in Cannon andLaird (1978).
Numerous separate CTD (conductivity, temperature, and depth) surveys of the region weremade to extend the spatial coverage and to calibrate the Aanderaa sensors. In addition, variousauxiliary data were collected to support the primary measurements. Typically, river runoff waslow during the winter experiments and high during the summer experiment.
Examples of the along-channel and acrosschannel components of hourly averaged 10-m cur- .rents at Site C showed along-ehannel velocities in
excess of 150 cm/sec during both winter and summer and across-ehannel components up to about60 cm/sec (Fig. 26). The records were dominatedby a mixed tidal signal with semidiurnal anddiurnal constituents. These have been removedfrom the records by low-pass filtering for the remainder of this study. The resultant low-frequency along-channel velocity showed greatervariability during winter with amplitudes comparable to the tidal currents and at times actually reversed to flow up-channel. During summer thelow-frequency along-channel component wasrelatively steady and was not observed to reversedirection. The low-frequency across-ehannel components did not change greatly with season, except at Site A where there was a substantialacross-channel seasonal variation (factor of two).Although small compared to the along-channelcurrents, these low-frequency across-ehannel currents must be considered an important process inthe movement of foreign substances shoreward.Some details are given in the reports by Holbrookand Halpern (1978) and by Cannon and Laird(1978).
Mean flow. The near-surface currents, whenvector-averaged over the record length, were alldirected seaward (Fig. 27). This is in qualitativeagreement with the classical picture of outflowing,near-surface estuarine circulation. The meanalong-channel component of currents at 4 m decreased seaward from Sites C to A, with greater
23
-
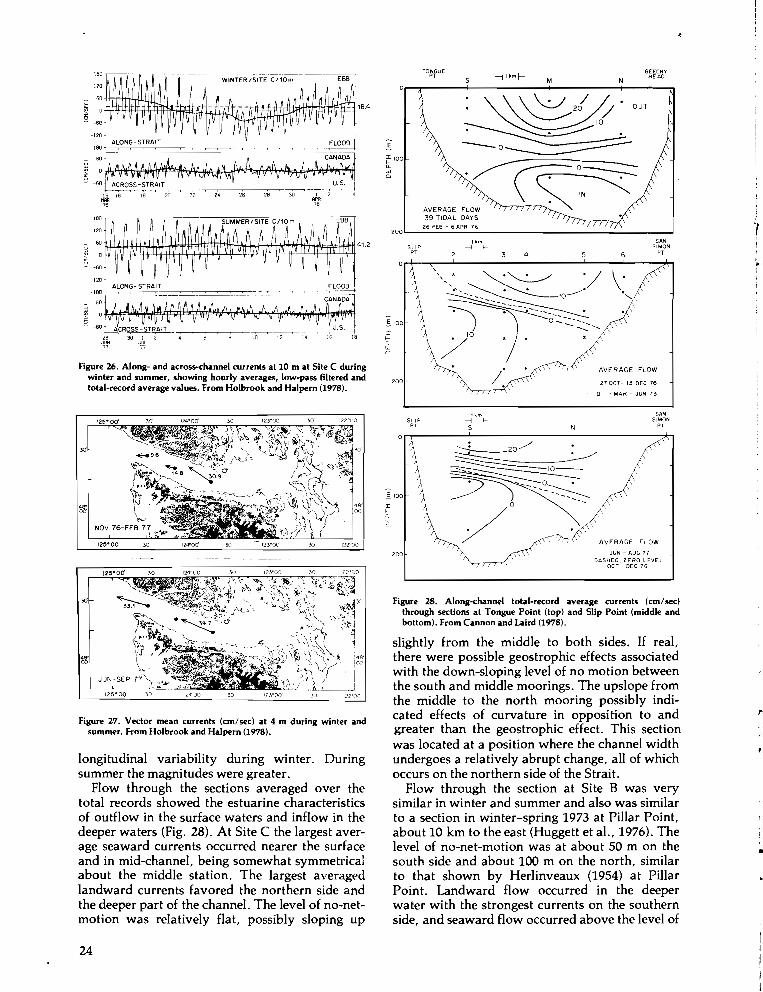
Figure 26. A1ong- and across-channel currents at 10 m at Site C duringwinter and summer, showing hourly averages, low-pass filtered andtotal-record average values. From Holbrook and Halpern (1978).
SA"SI~ON
PT
BEECHYHEAD
6
NM-j Ikmf-TONGuE
PT
\,< ~ :/\'
\~,:I')i~//' .. /.,"ry/."."c C,~
\ ~'\' 270CT- 13 DEC 76
'fr;- --O--MAR-JUN73
SLIPPT
26 FEB - 6APR 76200'-- ---' ---J
t 100Q.
Wo
200
5. tOO
rl-e;.Wo
6°_iWWWM~_m~ -60 l'
-It'D
ALONG-STRAIT FLOOD i-180 I
6D~ rt!:- ,A· CANAD1~ j~.A bd, ,N ~ ",0 ,~,. A. ~.1J, ~~ o~~V1~'<' i or f4\ 1fI~~(JVi V>f\?'ti'V.. ,~i' i ij
-60 ACROSS-~T~~IT. . _ ,.--r--~15 16 18 20 22 24 26 28 30 I 2 4~ WR~ 76
120
180
Figure 27. Vector mean currents (em/sec) at 4 m during winter andsummer. From Holbrook and Halpern (1978).
longitudinal variability during winter. Duringsummer the magnitudes were greater.
Flow through the sections averaged over thetotal records showed the estuarine characteristicsof outflow in the surface waters and inflow in thedeeper waters (Fig. 28). At Site C the largest average seaward currents occurred nearer the surfaceand in mid-channel, being somewhat symmetricalabout the middle station. The largest averagedlandward currents favored the northern side andthe deeper part of the channel. The level of no-netmotion was relatively flat, possibly sloping up
Figure 28. Along-channel total-record average currents (em/sec)through sections at Tongue Point (top) and Slip Point (middle andbottom). From Cannon and laird (1978).
slightly from the middle to both sides. If real,there were possible geostrophic effects associatedwith the down-sloping level of no motion betweenthe south and middle moorings. The upslope fromthe middle to the north mooring possibly indicated effects of curvature in opposition to andgreater than the geostrophic effect. This sectionwas located at a position where the channel widthundergoes a relatively abrupt change, all of whichoccurs on the northern side of the Strait.
Flow through the section at Site B was verysimilar in winter and summer and also was similarto a section in winter-spring 1973 at Pillar Point,about 10 km to the east (Huggett et aI., 1976). Thelevel of no-net-motion was at about 50 m on thesouth side and about 100 m on the north, similarto that shown by Herlinveaux (1954) at PillarPoint. Landward flow occurred in the deeperwater with the strongest currents on the southernside, and seaward flow occurred above the level of
24
no-net-motion with the strongest currents also appearing to occur on the southern side during summer but in mid-channel during winter. This maybe the result of having only two moorings duringsummer. The recent Canadian observations inspring showed some differences, however, in thatthe level of no-net-motion was observed to rise tothe surface before reaching the southern shore. Itis possible that the no-motion level reached thesurface south of our southern mooring. If thiswere so, then one might expect to find net landward flow (parallel to the coast locally) near thesouthern shore of this part of the Strait duringmuch of the winter and spring. The averagesalinity across this section in summer showed isohalines sloping down to the north except near thebottom. However, there were large salinity variations (described below) during winter.
Variations. The total variance of the current,which is equal to twice the kinetic energy of thefluctuations, changed both seasonally andspatially. At Site A, the winter variance was 76%greater than the summer variance. Most of thisdifference was due to seasonal changes in theamount of low-frequency and diurnal energy. AtSite C there was less seasonal change, with wintervariance exceeding summer variance by only 11 %at the 4-m depth. Winter-to-winter differences intotal variance were small. Variance decreasedwith depth during both winter and summer.
Tidal energy dominated the along-channel component of variance, accounting for about65%-90% of it. Tidal variance expressed as percentage of total variance increased with depthnear the surface during winter and summer, androot mean square (rms) amplitudes of the semidiurnal tidal currents decreased seaward from 47em/sec at Site C to 31 em/sec at Site A with nosignificant seasonal variation. During summer,however, large longitudinal variations were observed in the diurnal tidal currents, with rmsamplitudes of 18 em/sec at Site A increasing to 29em/sec at Site C. Apparently, the diurnal tidalcurrent oscillations were not stationary and hadan important seasonal baroc1inic component thatmay be related to the physical oceanography ofthe Washington coast. Major fluctuations in thediurnal energy band have been found duriI,g thecourse of summer upwelling off the Oregon coast(Hayes and Halpern, 1976).
Observations from the subsurface mooringsshowed that the standard deviation about thetotal-record average in the east-west direction wasgreater across the Site C section than across theSite B section by about 10 em/sec. The cross-section area is smaller at Site C than it is at Sites Aand B, which also implies larger tidal currents
across the Site C section. Values were maximum inmid-channel and decreased toward the sides.There also was a decrease close to the bottom dueto friction. The total variance in the records decreased with depth at each mooring except duringsummer when there was initially a slight increasewith depth followed by a decrease. Of particularinterest was that the near-surface variance at thesubsurface mooring at Site C, as measured by theAanderaa meter, was the same as measured by aVACM suspended from the nearby surfacemooring.
Low-frequency variance represented a significant percentage of the total along-channelvariance during winter. At Site A, near the mouthof the Strait, 27% of the variance at 4 m occurredin this range. At Site C the variance at 10 m was140% greater during the first winter experimentthan during the second winter. Some of this difference may be attributed to the greater meteorological forcing during the first winter as describedin Section 2.3. Low-frequency variance duringsummer was much lower than in winter and wasamazingly uniform. More details are given in Holbrook and Halpern and in Cannon and Laird.
Although the along-channel component ofvariance accounted for 84%-92% of the totalvariance, important across-channel fluctuationsalso occurred. At Sites A and B during winter,more than twice as much variance occurred in thelow-frequency band as in the combined tidalbands. However, at Site C the low-frequencyvariance was less than half the tidal variance. Inthe cross-channel direction the low-frequency rmscurrents were much larger than the long-termaveraged (total record) currents. For example,during winter at Site B at 4 m depth, the subtidalrms amplitude was 13 em/sec while the long-termmean was 1.6 em/sec. Low-frequency fluctuations, with time scales greater than 5 days, dominated cross-channel advective processes. At aspeed of 13 em/sec, a distance equivalent to thewidth of the western Strait may be traveled in lessthan two days. It is known from the drifter studiesdescribed in Section 3.1 that a significant percentage of drifters ended up on the beaches afterseveral days.
Winter wind forcing. During winter in thewestern Strait, a major oceanographic feature notpreviously described is the significant amount ofcurrent variance occurring at frequencies lowerthan the tidal frequencies. This low-frequencyvariance decreased with distance landward fromthe Pacific and varied greatly from winter to winter. Descriptions of the two winters show thegeneral characteristics.
During the first winter the variations of flowthrough the Site C section were large, and a pro-
25
•••
ViCTORIA
30'
•
26FEBS /14
'00
.... ~: .';':::.;,
~~;'~".......:.:'": ::-.; ".' "~".'~'
15m SALINITY27 FEB 76
':!-,-""""-""
30'
•
•
'. ;.,:~ ,.
•
10' 15m
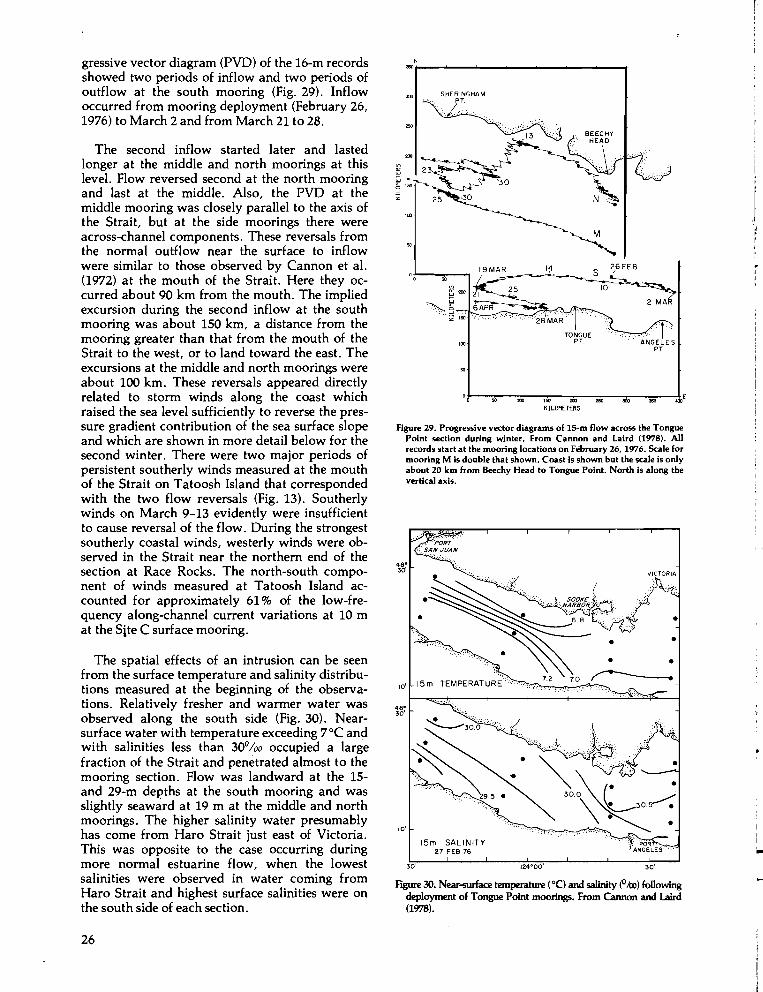
Figure 29. Progressive vector diagrams of 15-m flow across the TonguePoint section during winter. From Cannon and Laird (1978). Allrecords start at the mooring locations on February 26,1976. Scale formooring M is double that shown. Coast is shown but the scale is onlyabout 20 km from Beechy Head to Tongue Point. North is along thevertical axis.
,~,--:"'"..---,,,..---,,"',,.....--,,200,,.....--,,,,..----,,..,-.....,.,""--4..,EKILOMETERS
N"";-------.....--"-----------t
48·30'
figure 30. Near-surface temperature (Oe) and salinity (0Axl) followingdeployment of Tongue Point moorings. From Cannon and Laird(1978).
10'
48·30'
The second inflow started later and lastedlonger at the middle and north moorings at thislevel. Flow reversed second at the north mooringand last at the middle. Also, the PVD at themiddle mooring was closely parallel to the axis ofthe Strait, but at the side moorings there wereacross-channel components. These reversals fromthe normal outflow near the surface to inflowwere similar to those observed by Cannon et al.(1972) at the mouth of the Strait. Here they occurred about 90 km from the mouth. The impliedexcursion during the second inflow at the southmooring was about 150 km, a distance from themooring greater than that from the mouth of theStrait to the west, or to land toward the east. Theexcursions at the middle and north moorings wereabout 100 km. These reversals appeared directlyrelated to storm winds along the coast whichraised the sea level sufficiently to reverse the pressure gradient contribution of the sea surface slopeand which are shown in more detail below for thesecond winter. There were two major periods ofpersistent southerly winds measured at the mouthof the Strait on Tatoosh Island that correspondedwith the two flow reversals (Fig. 13). Southerlywinds on March 9-13 evidently were insufficientto cause reversal of the flow. During the strongestsoutherly coastal winds, westerly winds were observed in the Strait near the northern end of thesection at Race Rocks. The north-south component of winds measured at Tatoosh Island accounted for approximately 61 % of the low-frequency along-channel current variations at 10 mat the Site C surface mooring.
gressive vector diagram (PVD) of the 16-m recordsshowed two periods of inflow and two periods ofoutflow at the south mooring (Fig. 29). Inflowoccurred from mooring deployment (February 26,1976) to March 2 and from March 21 to 28.
The spatial effects of an intrusion can be seenfrom the surface temperature and salinity distributions measured at the beginning of the observations. Relatively fresher and warmer water wasobserved along the south side (Fig. 30). Nearsurface water with temperature exceeding 7°C andwith salinities less than 300
/00 occupied a largefraction of the Strait and penetrated almost to themooring section. Flow was landward at the 15and 29-m depths at the south mooring and wasslightly seaward at 19 m at the middle and northmoorings. The higher salinity water presumablyhas come from Haro Strait just east of Victoria.This was opposite to the case occurring duringmore normal estuarine flow, when the lowestsalinities were observed in water coming fromHaro Strait and highest surface salinities were onthe south side of each section.
26
N
•
Ms
25MAR
0..--.___--+_-----1-----+_--..,..-,
200 l..... - ~...:..._______I
E
i:: 100a...wo
NMs
~~_31_·~ .
, 32 __\
200 L- ---:......:.....:....;..__--l
NMs
~31~-- 32=- 33~~~33
5 APR
O~.___--+_----_t_----+_--.,-,
E
NMs
Figure 31. Daily average salinity across Tongue Point section. FromCannon and Laird (1978). Dashed line is daily average zero-motionlevel.
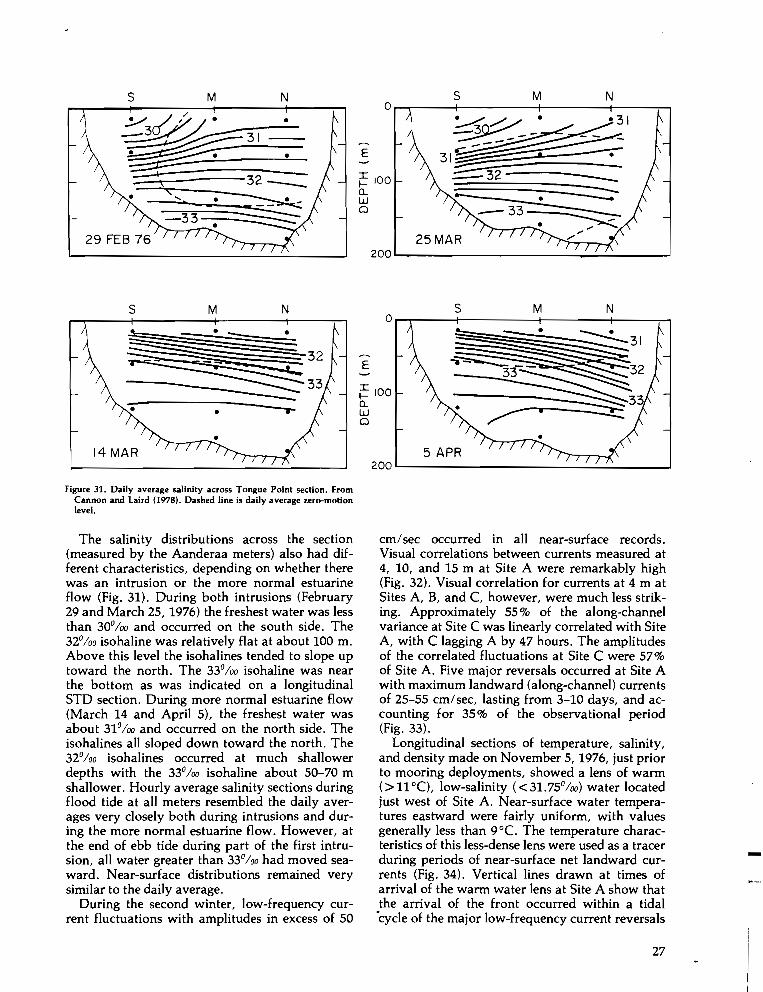
The salinity distributions across the section(measured by the Aanderaa meters) also had different characteristics, depending on whether therewas an intrusion or the more normal estuarineflow (Fig. 31). During both intrusions (February29 and March 25, 1976) the freshest water was lessthan 30%0 and occurred on the south side. The32%
0 isohaline was relatively flat at about 100 m.Above this level the isohalines tended to slope uptoward the north. The 33%0 isohaline was nearthe bottom as was indicated on a longitudinalSTD section. During more normal estuarine flow(March 14 and April 5), the freshest water wasabout 31%0 and occurred on the north side. Theisohalines all sloped down toward the north. The32%
0 isohalines occurred at much shallowerdepths with the 33%0 isohaline about 50-70 mshallower. Hourly average salinity sections duringflood tide at all meters resembled the daily averages very closely both during intrusions and during the more normal estuarine flow. However, atthe end of ebb tide during part of the first intrusion, all water greater than 33%
0 had moved seaward. Near-surface distributions remained verysimilar to the daily average.
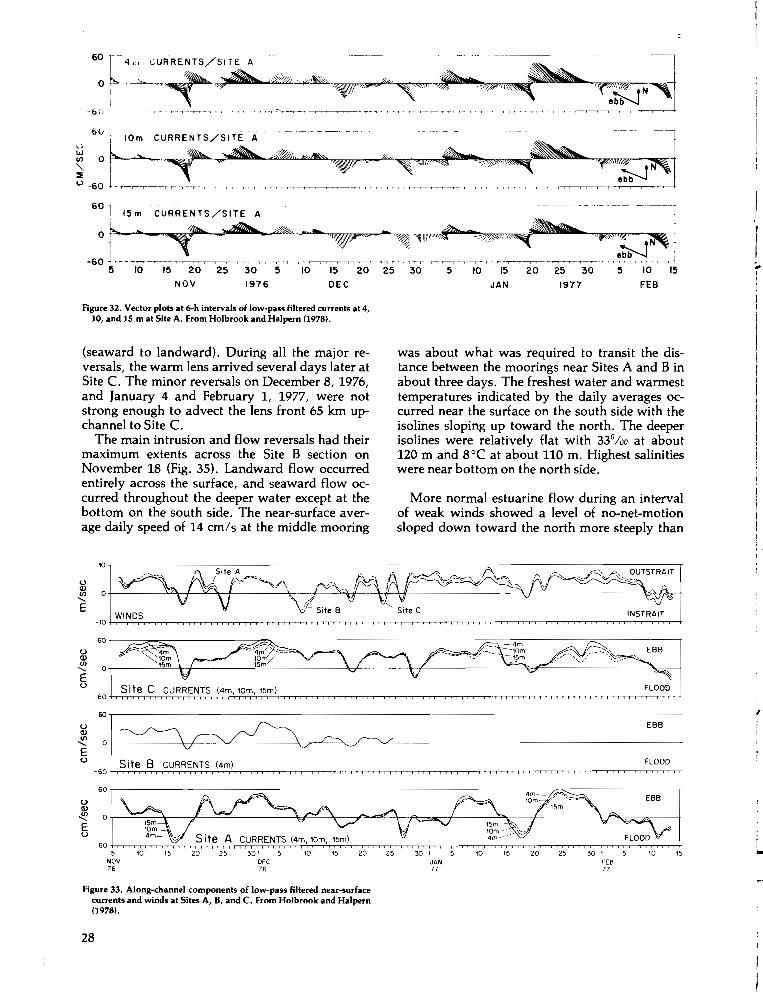
During the second winter, low-frequency current fluctuations with amplitudes in excess of 50
cm/sec occurred in all near-surface records.Visual correlations between currents measured at4, 10, and 15 m at Site A were remarkably high(Fig. 32). Visual correlation for currents at 4 m atSites A, B, and C, however, were much less striking. Approximately 55 % of the along-channelvariance at Site C was linearly correlated with SiteA, with C lagging A by 47 hours. The amplitudesof the correlated fluctuations at Site C were 57%of Site A. Five major reversals occurred at Site Awith maximum landward (along-channel) currentsof 25-55 cm/sec, lasting from 3-10 days, and accounting for 35% of the observational period(Fig. 33).
Longitudinal sections of temperature, salinity,and density made on November 5,1976, just priorto mooring deployments, showed a lens of warm(> 1PC), low-salinity « 31.75%0) water locatedjust west of Site A. Near-surface water temperatures eastward were fairly uniform, with valuesgenerally less than 9°C. The temperature characteristics of this less-dense lens were used as a tracerduring periods of near-surface net landward currents (Fig. 34). Vertical lines drawn at times ofarrival of the warm water lens at Site A show thatthe arrival of the front occurred within a tidal·cycle of the major low-frequency current reversals
-
27
----------- ---- -------- ---- -------.- --- -----, ----------r
~$_ ~.? l'\~~1\~\\\\\r HP - *\~ "ill/III" "';\ ·~#lll"'~ ""'l!lll\~N"\l t
, , 'Tr~~' ~~_" T rT" T' , , "~" T r~' , r 'TTTTT__ '~~TTrO ~_-!~T~ ~Tl5 10 15 20 25 30 5 10 15 20 25 30 5 10 15
DEC JAN 1977 FEB
60 1 15 m CURRENTS/SITE A, ebor ._~~
-60 Lo",-nr~T--,_-rT~r~~T-'5 10 15 20 25 30
NOV 1976
Figure 32. Vector plots at 6-h intervals of low-pass filtered currents at 4,10, and 15 m at Site A. From Holbrook and Halpern (1978).
(seaward to landward). During all the major reversals, the warm lens arrived several days later atSite C. The minor reversals on December 8, 1976,and January 4 and February 1, 1977, were notstrong enough to advect the lens front 65 km upchannel to Site C.
The main intrusion and flow reversals had theirmaximum extents across the Site B section onNovember 18 (Fig. 35). Landward flow occurredentirely across the surface, and seaward flow occurred throughout the deeper water except at thebottom on the south side. The near-surface average daily speed of 14 cm/s at the middle mooring
was about what was required to transit the distance between the moorings near Sites A and B inabout three days. The freshest water and warmesttemperatures indicated by the daily averages occurred near the surface on the south side with theisolines sloping up toward the north. The deeperisolines were relatively flat with 330
/00 at about120 m and 8°C at about 110 m. Highest salinitieswere near bottom on the north side.
More normal estuarine flow during an intervalof weak winds showed a level of no-net-motionsloped down toward the north more steeply than
:..II
!I
I
IIII
II
ii
II
i
oQ)(/)
"-E
-'0 j :"',I~P~, ,,,,,,,,,,,,,,,,,,,,,,,,,,~'1- Site B " Site C
FLOOD
60 ~-~~~--------"-"""--------------------==---;;=------rO::::---------'
Site C CURRENTS (4m, 'Om, 15m)-60 -h-;:.,-,~.;:..~'-'r'r.;::,cc"::,,,:,._T_r:r_,:;-,c:,c..T_r,,rr<~~~~~TTO_rT~~rr<'TT~~_,,_~TTOrrT~TTn''n"", T'~," n',n,,'"T'~," n'",'" rl
oQ)
.!!! a+----""'-'--\-+-----"''''-------\or----\;-{---- ---~~~~--------"I<;;:;c::__tEo
EBB r
II
i!..10 '52520'5'030 ,
JAN77
CURRENTS (4m, 10m, 15m)t-,-~_,,_~,,;:,,~~rr<~r' T'T'" ,n,'::;"",~", rri",-.r~,~~~"~TTOrrTTT'TTOrrT~~rr<~~TTO"'TT~rr<'TT~~.,,_+
30' 5 10 15 20 25DEC76
60 ,-------------------------------------;;-:::---7-=---------
Figure 33. Along-channel components of low-pass filtered near-surfacecurrents and winds at Sites A, B, and C. From Holbrook and Halpern(1978).
28
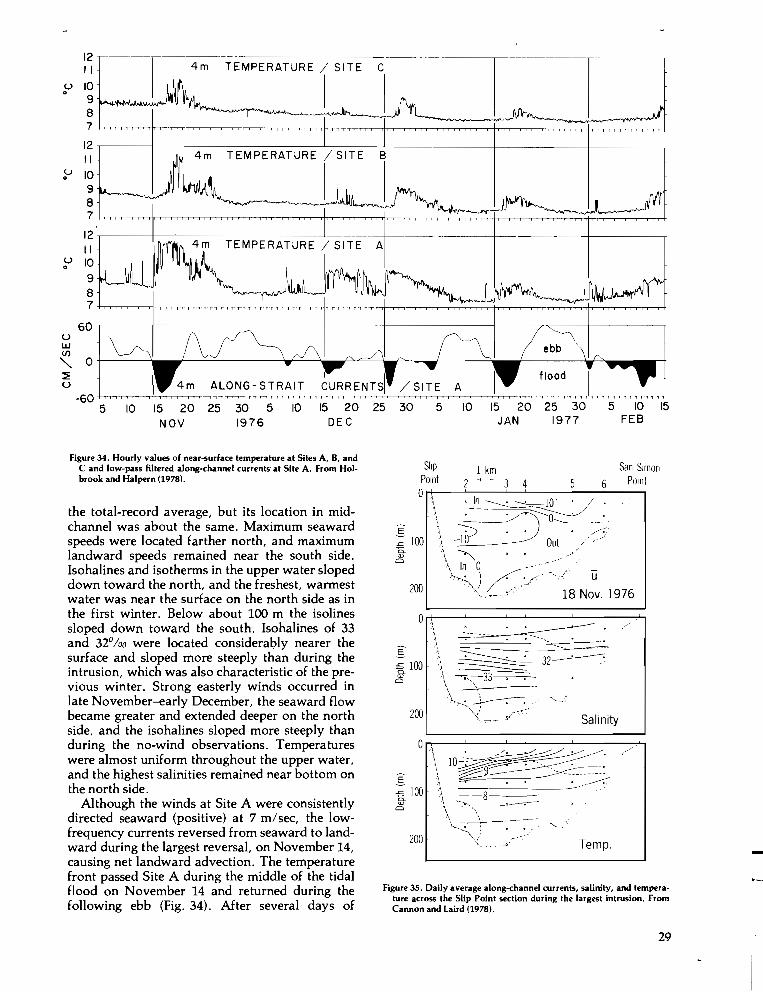
12
"u 100
987
12
"t.J 100
987
12II
u 100
987
-1---- -----4m
4m TEMPERATURE
TEMPERATURE~-~-----+-----~
rv60 ,----+------------+-- --l-------+---~--+_---______,
uw(/)
" 0 t------',
~ ALONG-STRAIT ~URRENTSI /SITE A-60 +--r-,"TT""'~c-ri-~~~~~"TT""'~~~~~~~~'-,....,~~~~~""""";~~~~~~".L~~~~'+
5 10 15 20 25 30 5 10 15 20 25 30 5 10 15 20 25 30 5 10 15NOV 1976 DEC JAN 1977 FEB
Figure 35. Daily average along-channel currents, salinity, and temperature across the Slip Point seclion during the largest intrusion. FromCannon and Laird (1976).
-
San SimonPomt
18 Nov. 1976
1 km
10~~:~9~ m
.' . ...-------;--8-~-
'~-...~--)(---------'\ .
----..--'..------------- "-
~)'. . - Temp.
SlipPOint 2 3 4 5Ot+----'---'---'------.i....---,
..J~~~\ ~ ~~O~_~.-10 ~~ Out
\~O .~-··~,)~:f
A"T---rr_....--.--~
200
200
200
E':;-1000-<VCl
... ~.
~--~. -.§:£ 1000<V
Cl
Figure 34. Hourly values of near-surface temperature at Sites A, B, andC and low-pass filtered along-channel currents at Site A. From Holbrook and Halpern (1976).
the total-record average, but its location in midchannel was about the same. Maximum seawardspeeds were located farther north, and maximumlandward speeds remained near the south side.Isohalines and isotherms in the upper water slopeddown toward the north, and the freshest, warmestwater was near the surface on the north side as inthe first winter. Below about 100 m the isolinessloped down toward the south. Isohalines of 33and 320
/00 were located considerably nearer thesurface and sloped more steeply than during theintrusion, which was also characteristic of the previous winter. Strong easterly winds occurred inlate November-early December, the seaward flowbecame greater and extended deeper on the northside, and the isohalines sloped more steeply thanduring the no-wind observations. Temperatureswere almost uniform throughout the upper water,and the highest salinities remained near bottom onthe north side.
Although the winds at Site A were consistentlydirected seaward (positive) at 7 m/sec, the lowfrequency currents reversed from seaward to landward during the largest reversal, on November 14,causing net landward advection. The temperaturefront passed Site A during the middle of the tidalflood on November 14 and returned during thefollowing ebb (Fig. 34). After several days of
29

rIJ
.II
south
~eU ,,--n d r~, I• I" '~Y'--'
ALONG-STRAIT CURRENTS /SITE A
PRESSURE CORRECTED SEA SURFACE / NEAH BAY
Y \,_ rjl \r-JI ~_r--/J''-/''''~ "~.---/ \..... ",-/
uw(f) 0"-:::E
-15
20
15
&:l10
en 5"-
0:::E
-5
-10
60uw(f) 0"-:::Eu
-60
45
:::E30
u15
05 10 15 20 25 30 5 10 15 20 25 30 5 10 15 20 25 30 5 10 15
NOV 1976 DEC JAN 1977 FEB
Figure 36. Along-ehannel and coastal winds, along-channel currents,and sea-surface elevations showing various correlations. From Holbrook and Halpern (1978).
sloshing back and forth, the warm lens waslocated far enough landward that short periods oftidal ebbs did not advect it seaward through SiteA. Although the along-channel components ofwinds\at Sites A, B, and C (Fig. 22) were stronglycorrelated with each other, local wind forcing ofthe near-surface currents was weak and onlybarely significant.
The wind-stress field off the Washington coastcan indirectly influence the along-channel currentsthrough induced sea-surface height fluctuations.During winter, southerly winds may be expectedto pile up water along the coast through onshoreEkman transport. This increases the coastal seasurface elevation, which in turn decreases thelongitudinal sea-surface slope in the Strait, causing a deceleration of the seaward near-surfacecirculation.
During the second winter surface winds werecomputed for a 3°-square pressure grid centered at48°N, 125°W (25 km off the Washington coast)by rotating directions 15° counterclockwise andby reducjng speeds by 30% to approximate thesurface frictional effects (A. Bakun, NOAA, National Marine Fisheries Service, personal communication) (Fig. 36). Vertical lines were drawn attimes of maximum deceleration of the alongchannel currents when accompanying sea-surfaceheight data existed at Neah Bay. Generally, decelerations occurred during strong southerly
winds off the coast and during increasing seasurface height at Neah Bay. Significant correlations were found: (1) between the along-channel4-m currents at Site A and the north-south Pacificwinds, with currents lagging winds by 42 hours;(2) between the along-channel 4-m currents at SiteA and sea-surface height at Neah Bay, with currents lagging sea-surface height by 6 hours; and(3) between the north-south Pacific winds and seasurface height at Neah Bay, with sea-surfaceheight lagging winds by 24 hours. Temporal decelerations as large as 140 cmlsec in 4 days wereobserved at Site A (Fig. 34). A sea-surface slope of4 cml10 km would be necessary to balance suchdecelerations. Low-frequency sea-surface elevation fluctuations of 15-20 cm near the entrancemay be large enough to set up local 10-20-kmslopes, which travel slowly (30 cmlsec) eastwardas baroclinic waves, The existence of the stronglocal density gradient associated with the warmwater lens would complicate such a picture. Regardless of the coupling mechanism, strong coherence existed between the north-south Pacificwinds and the low-frequency along-channel nearsurface currents in the Strait. Winds measuredduring the first winter at Tatoosh Island also support this concept (Figs. 14 and 28).
The largest seaward flows at Site A tended toparallel the axis of the Strait. During the midNovember intrusion, the flow had a large south-
I
IiI!..
30
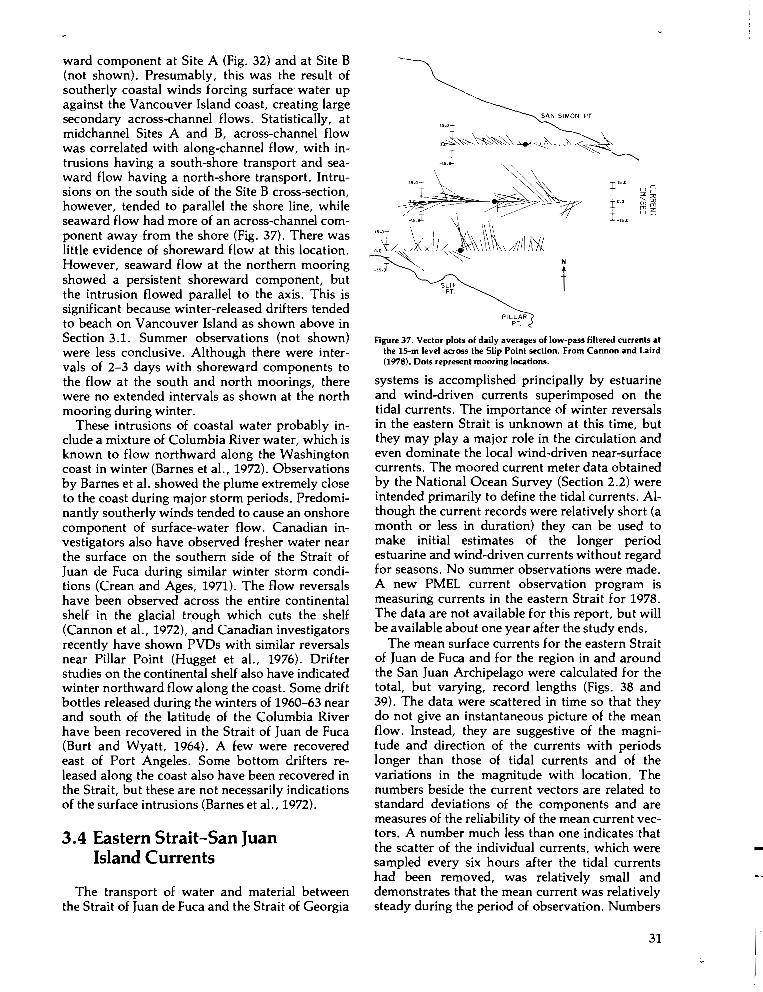
ward component at Site A (Fig. 32) and at Site B(not shown). Presumably, this was the result ofsoutherly coastal winds forcing surface water upagainst the Vancouver Island coast, creating largesecondary across-channel flows. Statistically, atmidchannel Sites A and B, across-channel flowwas correlated with along-channel flow, with intrusions having a south-shore transport and seaward flow having a north-shore transport. Intrusions on the south side of the Site B cross-section,however, tended to parallel the shore line, whileseaward flow had more of an across-channel component away from the shore (Fig. 37). There waslittle evidence of shoreward flow at this location .
. However, seaward flow at the northern mooringshowed a persistent shoreward component, butthe intrusion flowed parallel to the axis. This issignificant because winter-released drifters tendedto beach on Vancouver Island as shown above inSection 3.1. Summer observations (not shown)were less conclusive. Although there were intervals of 2-3 days with shoreward components tothe flow at the south and north moorings, therewere no extended intervals as shown at the northmooring during winter.
These intrusions of coastal water probably include a mixture of Columbia River water, which isknown to flow northward along the Washingtoncoast in winter (Barnes et aI., 1972). Observationsby Barnes et aI. showed the plume extremely closeto the coast during major storm periods. Predominantly southerly winds tended to cause an onshorecomponent of surface-water flow. Canadian investigators also have observed fresher water nearthe surface on the southern side of the Strait ofJuan de Fuca during similar winter storm conditions (Crean and Ages, 1971). The flow reversalshave been observed across the entire continentalshelf in the glacial trough which cuts the shelf(Cannon et al., 1972), and Canadian investigatorsrecently have shown PVDs with similar reversalsnear Pillar Point (Hugget et aI., 1976). Drifterstudies on the continental shelf also have indicatedwinter northward flow along the coast. Some driftbottles released during the winters of 1960-63 nearand south of the latitude of the Columbia Riverhave been recovered in the Strait of Juan de Fuca(Burt and Wyatt, 1964). A few were recoveredeast of Port Angeles. Some bottom drifters released along the coast also have been recovered inthe Strait, but these are not necessarily indicationsof the surface intrusions (Barnes et aI., 1972).
3.4 Eastern Strait-San JuanIsland Currents
The transport of water and material betweenthe Strait of Juan de Fuca and the Strait of Georgia
SAN SIMON PT
1',.0!oon1-1500
SLIPPT.
PILLARPT
Figure 37. Vector plots of daily averages of low-pass filtered currents atthe 15-m level across the Slip Point section. From Cannon and Laird(1978). Dols represent mooring locations.
systems is accomplished principally by estuarineand wind-driven currents superimposed on thetidal currents. The importance of winter reversalsin the eastern Strait is unknown at this time, butthey may playa major role in the circulation andeven dominate the local wind-driven near-surfacecurrents. The moored current meter data obtainedby the National Ocean Survey (Section 2.2) wereintended primarily to define the tidal currents. Although the current records were relatively short (amonth or less in duration) they can be used tomake initial estimates of the longer periodestuarine and wind-driven currents without regardfor seasons. No summer observations were made.A new PMEL current observation program ismeasuring currents in the eastern Strait for 1978.The data are not available for this report, but willbe available about one year after the study ends.
The mean surface currents for the eastern Straitof Juan de Fuca and for the region in and aroundthe San Juan Archipelago were calculated for thetotal, but varying, record lengths (Figs. 38 and39). The data were scattered in time so that theydo not give an instantaneous picture of the meanflow. Instead, they are suggestive of the magnitude and direction of the currents with periodslonger than those of tidal currents and of thevariations in the magnitude with location. Thenumbers beside the current vectors are related tostandard deviations of the components and aremeasures of the reliability of the mean current vectors. A number much less than one indicates thatthe scatter of the individual currents, which weresampled every six hours after the tidal currentshad been removed, was relatively small anddemonstrates that the mean current was relativelysteady during the period of observation. Numbers
31
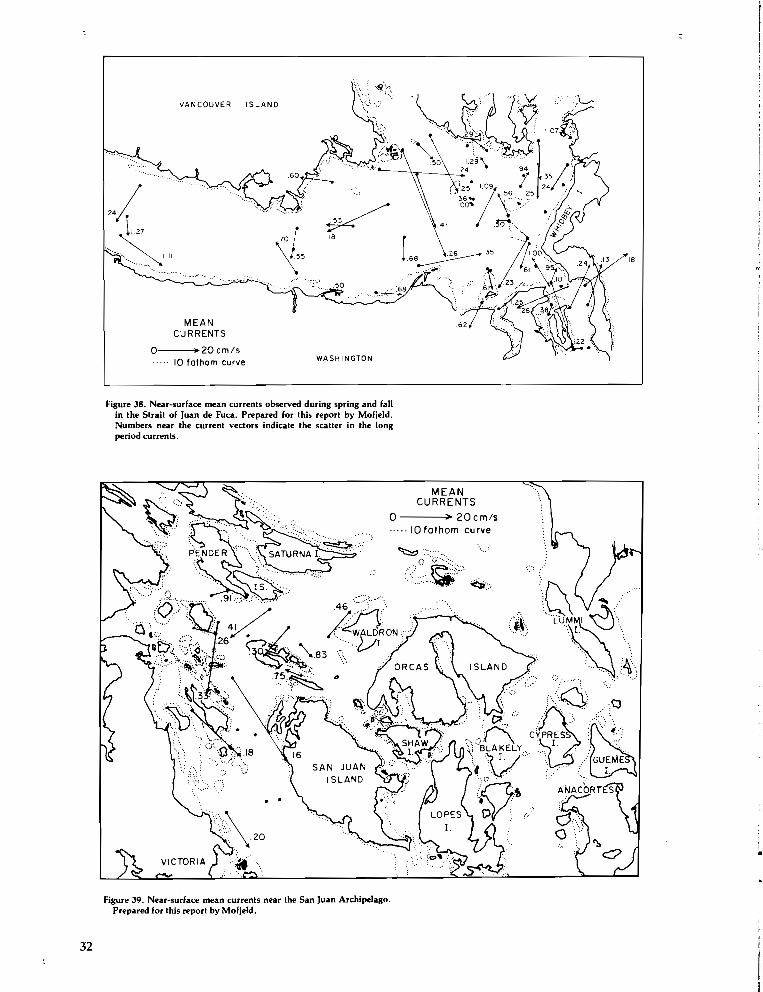
18
WASH INGTON
' ~ ~ .
MEANCURRENTS
0---> 20cm/s10 falhom curve
VANCOUVER ISLAND
\\ '''iI/,'.\.\ .... ~
24/L7.~ IIIt~···....~
Figure 38. Near-surface mean currenIs observed during spring and fallin lhe Slrait of Juan de Fuca. Prepared for lhis reporl by Mofjeld.Numbers near lhe currenl veclors indicale lhe scalier in lhe longperiod currents.
......
MEANCURRENTS
o > 20cm/s·····IOfalhom curve
~:-;.. ....
':':(;~>
.....
..~C:\ ....:,u~.
'~'~"
.' «::.(J: ..:~
c~ep..RES. > .:~.<::,~), ':'.,: 1. ):' .: ..
, ,.: GUEME: ... ' i 1.
......
..
Figure 39. Near-surface mean currenls near lhe San Juan Archipelago.Prepared for lhis reporl by Mofjeld.
32
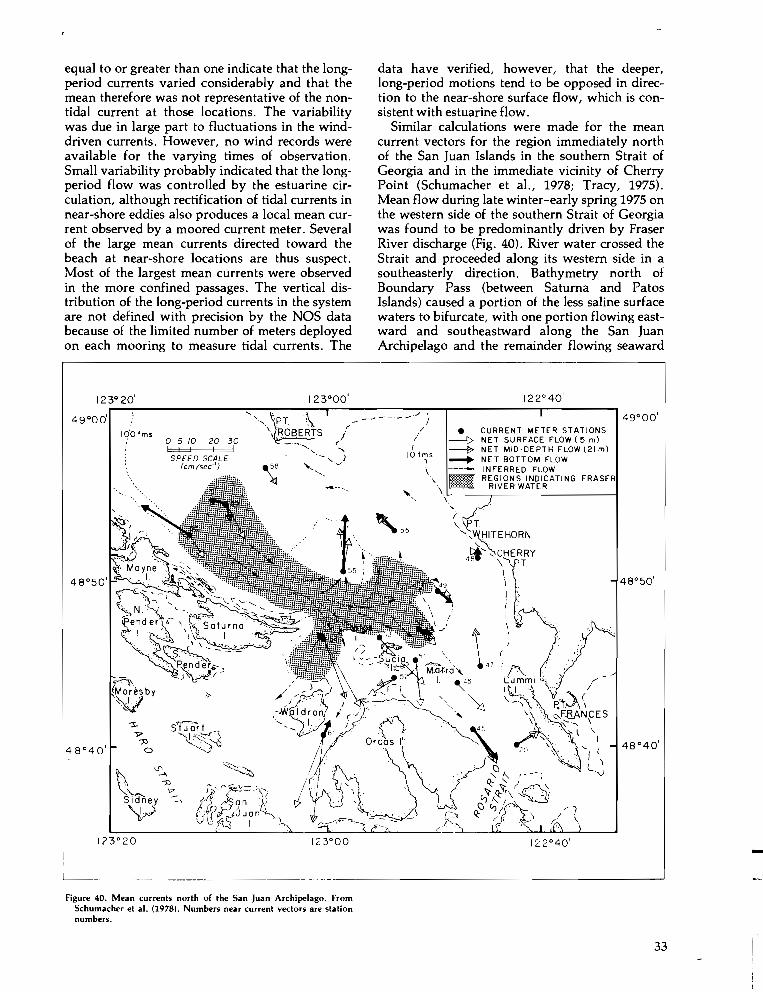
equal to or greater than one indicate that the longperiod currents varied considerably and that themean therefore was not representative of the nontidal current at those locations. The variabilitywas due in large part to fluctuations in the winddriven currents. However, no wind records wereavailable for the varying times of observation.Small variability probably indicated that the longperiod flow was controlled by the estuarine circulation, although rectification of tidal currents innear-shore eddies also produces a local mean current observed by a moored current meter. Severalof the large mean currents directed toward thebeach at near-shore locations are thus suspect.Most of the largest mean currents were observedin the more confined passages. The vertical distribution of the long-period currents in the systemare not defined with precision by the NOS databecause of the limited number of meters deployedon each mooring to measure tidal currents. The
data have verified, however, that the deeper,long-period motions tend to be opposed in direction to the near-shore surface flow, which is consistent with estuarine flow.
Similar calculations were made for the meancurrent vectors for the region immediately northof the San Juan Islands in the southern Strait ofGeorgia and in the immediate vicinity of CherryPoint (Schumacher et aI., 1978; Tracy, 1975).Mean flow during late winter-early spring 1975 onthe western side of the southern Strait of Georgiawas found to be predominantly driven by FraserRiver discharge (Fig. 40). River water crossed theStrait and proceeded along its western side in asoutheasterly direction. Bathymetry north ofBoundary Pass (between Saturna and PatosIslands) caused a portion of the less saline surfacewaters to bifurcate, with one portion flowing eastward and southeastward along the San JuanArchipelago and the remainder flowing seaward
Imso 5 10 20 30I I I I ISPEED SCALE
(cm/sec-')
i 123°20
Il- _
CURRENT METER STATIONSNET SURFACE FLOW (5 m)NET MID-DEPTH FLOW (21 m)NE T BOTTOM FLOWINFERRED FLOWREGIONS INDICATING FRASER
RIVER WATER
I
" PT'-,~ITEHORN
~B"'-~CHERRY,AT \ T
\\I1
'.,:.
rI
122°40'
------------------------
-Figure 40. Mean currents north of the San Juan Archipelago. From
Schumacher et al. (1978). Numbers near current vectors are stationnumbers.
33
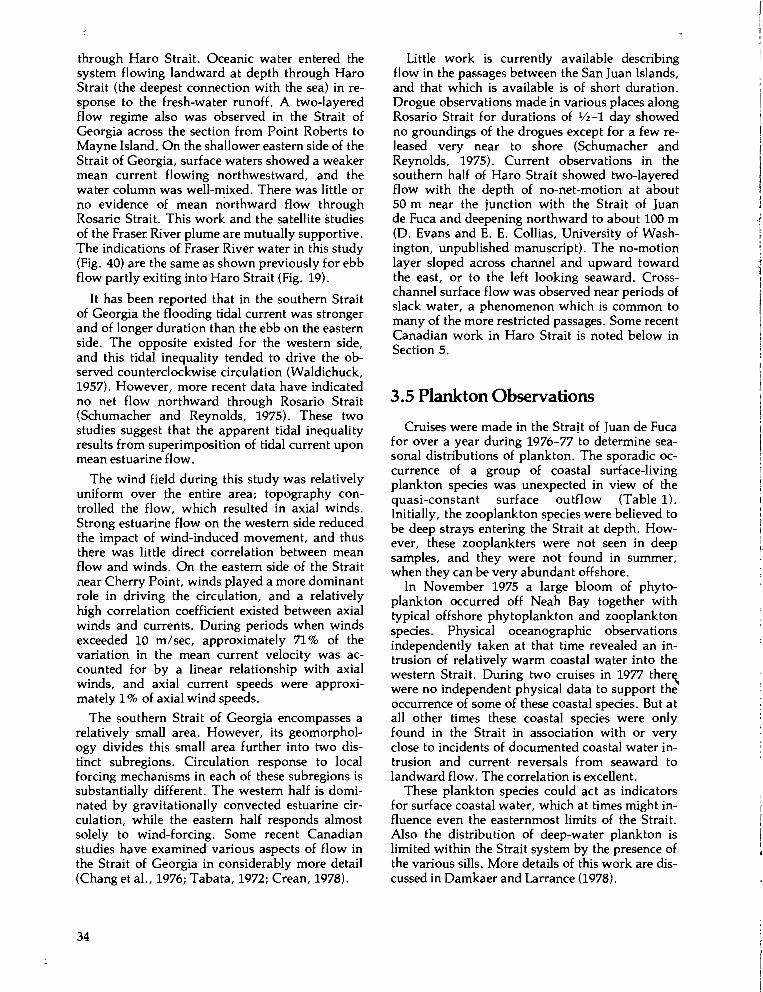
through Haro Strait. Oceanic water entered thesystem flowing landward at depth through HaroStrait (the deepest connection with the sea) in response to the fresh-water runoff. A two-layeredflow regime also was observed in the Strait ofGeorgia across the section from Point Roberts toMayne Island. On the shallower eastern side of theStrait of Georgia, surface waters showed a weakermean current flowing northwestward, and thewater column was well-mixed. There was little orno evidence of mean northward flow throughRosario Strait. This work and the satellite studiesof the Fraser. River plume are mutually supportive.The indications of Fraser River water in this study(Fig. 40) are the same as shown previously for ebbflow partly exiting into Haro Strait (Fig. 19).
It has been reported that in the southern Straitof Georgia the flooding tidal current was strongerand of longer duration than the ebb on the easternside. The opposite existed for the western side,and this tidal inequality tended to drive the observed counterclockwise circulation (Waldichuck,1957). However, more recent data have indicatedno net flow northward through Rosario Strait(Schumacher and Reynolds, 1975). These twostudies suggest that the apparent tidal inequalityresults from superimposition of tidal current uponmean estuarine flow.
The wind field during this study was relativelyuniform over .the entire area; topography controlled the flow, which resulted in axial winds.Strong estuarine flow on the western side reducedthe impact of wind-induced movement, and thusthere was little direct correlation between meanflow and winds. On the eastern side of the Straitnear Cherry Point, winds played a more dominantrole in driving the circulation, and a relativelyhigh correlation coefficient existed between axialwinds and currents. During periods when windsexceeded 10 m/sec, approximately 71% of thevariation in the mean current velocity was accounted for by a linear relationship with axialwinds, and axial current speeds were approximately 1 % of axial wind speeds.
The southern Strait of Georgia encompasses arelatively small area. However, its geomorphology divides this small area further into two distinct subregions. Circulation response to localforcing mechanisms in each of these subregions issubstantially different. The western half is dominated by gravitationally convected estuarine circulation, while the eastern half responds almostsolely to wind-forcing. Some recent Canadianstudies have examined various aspects of flow inthe Strait of Georgia in considerably more detail(Chang et aI., 1976; Tabata, 1972; Crean, 1978).
34
Little work is currently available describingflow in the passages between the San Juan Islands,and that which is available is of short duration.Drogue observations made in various places alongRosario Strait for durations of V2-1 day showedno groundings of the drogues except for a few released very near to shore (Schumacher andReynolds, 1975). Current observations in thesouthern half of Haro Strait showed two-layeredflow with the depth of no-net-motion at about50 m near the junction with the Strait of Juande Fuca and deepening northward to about 100 m(D. Evans and E. E. Collias, University of Washington, unpublished manuscript). The no-motionlayer sloped across channel and upward towardthe east, or to the left looking seaward. Crosschannel surface flow was observed near periods ofslack water, a phenomenon which is common tomany of the more restricted passages. Some recentCanadian work in Haro Strait is noted below inSection 5.
3.5 Plankton Observations
Cruises were made in the Strait of Juan de Fucafor over a year during 1976-77 to determine seasonal distributions of plankton. The sporadic occurrence of a group of coastal surface-livingplankton species was unexpected in view of thequasi-constant surface outflow (Table 1).Initially, the zooplankton species were believed tobe deep strays entering the Strait at depth. However, these zooplankters were not seen in deepsamples, and they were not found in summer,when they can be very abundant offshore.
In November 1975 a large bloom of phytoplankton occurred off Neah Bay together withtypical offshore phytoplankton and zooplanktonspecies. Physical oceanographic observationsindependently taken at that time revealed an intrusion of relatively warm coastal water into thewestern Strait. During two cruises in 1977 therewere no independent physical data to support th;occurrence of some of these coastal species. But atall other times these coastal species were onlyfound in the Strait in association with or veryclose to incidents of documented coastal water intrusion and current reversals from seaward tolandward flow. The correlation is excellent.
These plankton species could act as indicatorsfor surface coastal water, which at times might influence even the easternmost limits of the Strait.Also the distribution of deep-water plankton islimited within the Strait system by the presence ofthe various sills. More details of this work are discussed in Damkaer and Larrance (1978).
II
i
I
II
I
I
;1
!!
f
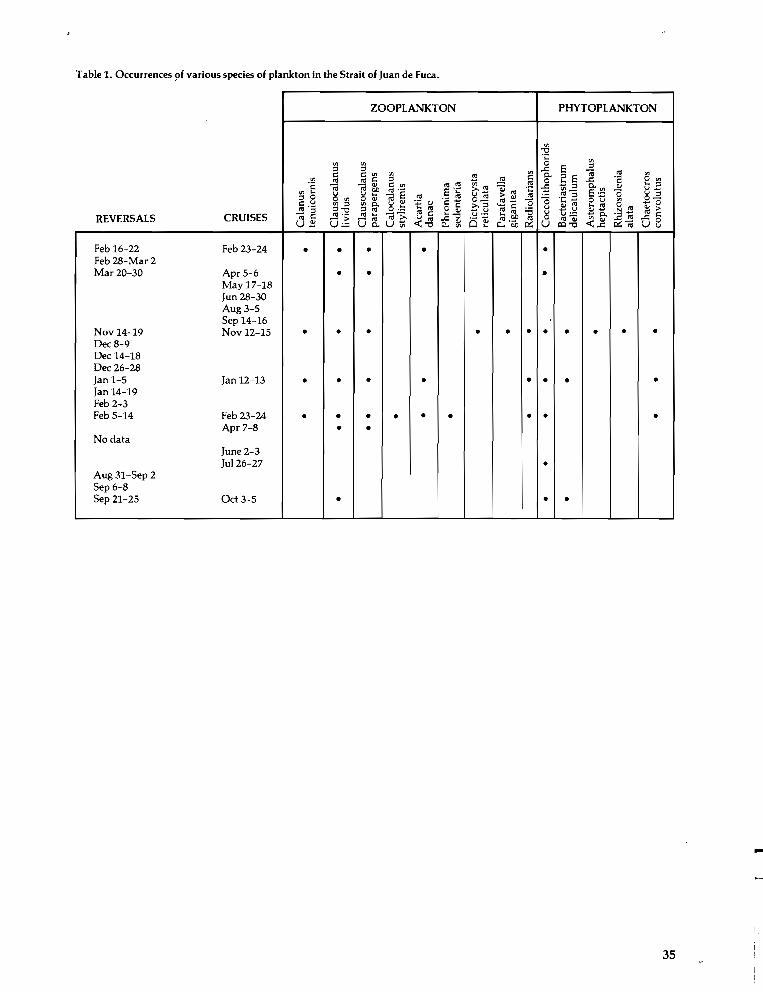
Table 1. Occurrences s>f various species of plankton in the Strait of Juan de Fuca.
ZOOPLANKTON PHYTOPLANKTON
'""'0"C
'"'" '" 0E ;:l;:l ;:l
'".c -;;; '" '"c:: c:: '" '" '" 0.. 2 E'" c:: ;:l .!!! c:: .c "2 o '"'" .!!! ~~ '" 0"2 -;;; QJ c:: '" E"~ Qj", .z - ;:l
E~QJ .. :3
'" 00 .!!! "E "C "'- 0u_
'" .. u u .. '" u '" > QJ '" .~ ~u :3
:3 0 o '" 0 QJ
~.~ "- '" 0_ "'- 0 0 o u '" 0-
~'3 '" :3 '" 0.. 0;:: Cl.I c::-2 '" - 0.. '" o c:: >.:3 '- c:: u ~ u .. '" QJ >:3"'0 ;:l
~ - u '" '" .:e QJ-
CRUISES (;~ "'"- '" -;;;:;' '" c:: ..c:~ u"- .. 00 u u "- -0.. :.2-:;; '" c::REVERSALS - > 0 '" u lIS i5"E ~"6illIS 0 ",Qj
~~.coU_ U;.: 0.. UV; <t:"'O p-'~ ~ U 1:0"'0 ~-;;; Uu
Feb 16-22 Feb 23-24 • • • • •Feb 28-Mar 2Mar 20-30 Apr 5-6 • • •
May 17-18Jun 28-30Aug 3-5Sep 14-16
Nov 14-19 Nov 12-15 • • • • • • • • • • •Dec 8-9Dec 14-18Dec 26-28Jan 1-5 Jan 12-13 • • • • • • • •Jan 14-19Feb 2-3Feb 5-14 Feb 23-24 • • • • • • • • •
Apr 7-8 • •No data
June 2-3Ju126-27 •
Aug 31-Sep 2Sep 6-8Sep 21-25 Oct 3-5 • • •
35
-
II'
i
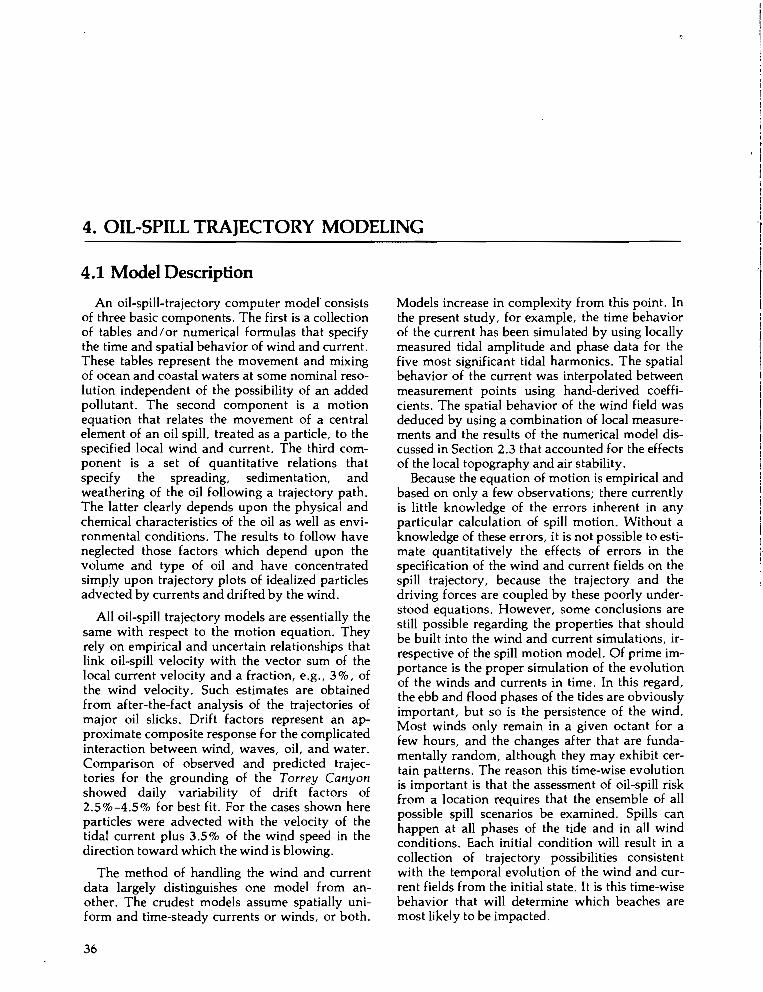
4. OIL-SPILL TRAJECTORY MODELING
4.1 Model Description
An oil-spill-trajectory computer model' consistsof three basic components. The first is a collectionof tables and/or numerical formulas that specifythe time and spatial behavior of wind and current.These tables represent the movement and mixingof ocean and coastal waters at some nominal resolution independent of the possibility of an addedpollutant. The second component is a motionequation that relates the movement of a centralelement of an oil spill, treated as a particle, to thespecified local wind and current. The third component is a set of quantitative relations thatspecify the spreading, sedimentation, andweathering of the oil following a trajectory path.The latter clearly depends upon the physical andchemical characteristics of the oil as well as environmental conditions. The results to follow haveneglected those factors which depend upon thevolume and type of oil and have concentratedsimply upon trajectory plots of idealized particlesadvected by currents and drifted by the wind.
All oil-spill trajectory models are essentially thesame with respect to the motion equation. Theyrely on empirical and uncertain relationships thatlink oil-spill velocity with the vector sum of thelocal current velocity and a fraction, e.g., 3%, ofthe wind velocity. Such estimates are obtainedfrom after-the-fact analysis of the trajectories ofmajor oil slicks. Drift factors represent an approximate composite response for the complicatedinteraction between wind, waves, oil, and water.Comparison of observed and predicted trajectories for the grounding of the Torrey Canyonshowed daily variability of drift factors of2.5%-4.5% for best fit. For the cases shown hereparticles were advected with the velocity of thetidal current plus 3.5% of the wind speed in thedirection toward which the wind is blowing.
The method of handling the wind and currentdata largely distinguishes one model from another. The crudest models assume spatially uniform and time-steady currents or winds, or both.
36
Models increase in complexity from this point. Inthe present study, for example, the time behaviorof the current has been simulated by using locallymeasured tidal amplitude and phase data for thefive most significant tidal harmonics. The spatialbehavior of the current was interpolated betweenmeasurement points using hand-derived coefficients. The spatial behavior of the wind field wasdeduced by using a combination of local measurements and the results of the numerical model discussed in Section 2.3 that accounted for the effectsof the local topography and air stability.
Because the equation of motion is empirical andbased on only a few observations; there currentlyis little knowledge of the errors inherent in anyparticular calculation of spill motion. Without aknowledge of these errors, it is not possible to estimate quantitatively the effects of errors in thespecification of the wind and current fields on thespill trajectory, because the trajectory and thedriving forces are coupled by these poorly understood equations. However, some conclusions arestill possible regarding the properties that shouldbe built into the wind and current simulations, irrespective of the spill motion model. Of prime importance is the proper simulation of the evolutionof the winds and currents in time. In this regard,the ebb and flood phases of the tides are obviouslyimportant, but so is the persistence of the wind.Most winds only remain in a given octant for afew hours, and the changes after that are fundamentally random, although they may exhibit certain patterns. The reason this time-wise evolutionis important is that the assessment of oil-spill riskfrom a location requires that the ensemble of allpossible spill scenarios be examined. Spills canhappen at all phases of the tide and in all windconditions. Each initial condition will result in acollection of trajectory possibilities consistentwith the temporal evolution of the wind and current fields from the initial state. It is this time-wisebehavior that will determine which beaches aremost likely to be impacted.
;
rIII'r1
i'j
I,J
!I
IIiII
II!i
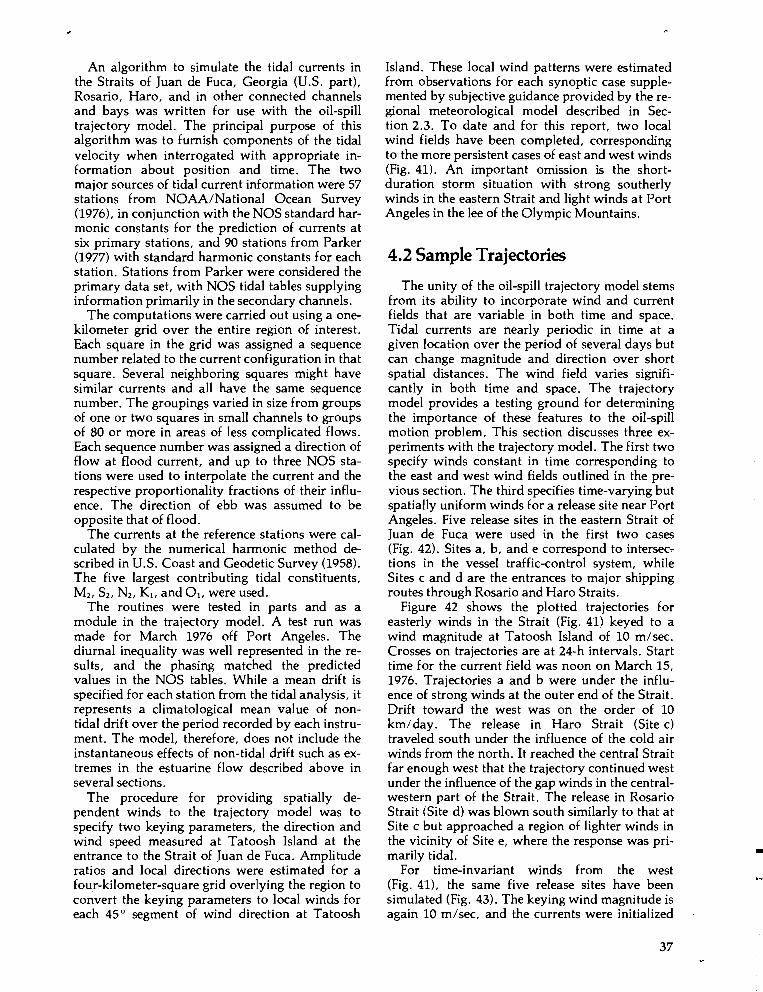
An algorithm to simulate the tidal currents inthe Straits of Juan de Fuca, Georgia (U.S. part),Rosario, Haro, and in other connected channelsand bays was written for use with the oil-spilltrajectory model. The principal purpose of thisalgorithm was to furnish components of the tidalvelocity when interrogated with appropriate information about position and time. The twomajor sources of tidal current information were 57stations from NOAA/National Ocean Survey(1976), in conjunction with the NOS standard harmonic constants for the prediction of currents atsix primary stations, and 90 stations from Parker(1977) with standard harmonic constants for eachstation. Stations from Parker were considered theprimary data set, with NOS tidal tables supplyinginformation primarily in the secondary channels.
The computations were carried out using a onekilometer grid over the entire region of interest.Each square in the grid was assigned a sequencenumber related to the current configuration in thatsquare. Several neighboring squares might havesimilar currents and all have the same sequencenumber. The groupings varied in size from groupsof one or two squares in small channels to groupsof 80 or more in areas of less complicated flows.Each sequence number was assigned a direction offlow at flood current, and up to three NOS stations were used to interpolate the current and therespective proportionality fractions of their influence. The direction of ebb was assumed to beopposite that of flood.
The currents at the reference stations were calculated by the numerical harmonic method described in U.S. Coast and Geodetic Survey (1958).The five largest contributing tidal constituents,M2, S2, N2, K 1 , and 0 1 , were used.
The routines were tested in parts and as amodule in the trajectory model. A test run wasmade for March 1976 off Port Angeles. Thediurnal inequality was well represented in the results, and the phasing matched the predictedvalues in the NOS tables. While a mean drift isspecified for each station from the tidal analysis, itrepresents a climatological mean value of nontidal drift over the period recorded by each instrument. The model, therefore, does not include theinstantaneous effects of non-tidal drift such as extremes in the estuarine flow described above inseveral sections.
The procedure for providing spatially dependent winds to the trajectory model was tospecify two keying parameters, the direction andwind speed measured at Tatoosh Island at theentrance to the Strait of Juan de Fuca. Amplituderatios and local directions were estimated for afour-kilometer-square grid overlying the region toconvert the keying parameters to local winds foreach 45° segment of wind direction at Tatoosh
Island. These local wind patterns were estimatedfrom observations for each synoptic case supplemented by subjective guidance provided by the regional meteorological model described in Section 2.3. To date and for this report, two localwind fields have been completed, correspondingto the more persistent cases of east and west winds(Fig. 41). An important omission is the shortduration storm situation with strong southerlywinds in the eastern Strait and light winds at PortAngeles in the lee of the Olympic Mountains.
4.2 Sample Trajectories
The unity of the oil-spill trajectory model stemsfrom its ability to incorporate wind and currentfields that are variable in both time and space.Tidal currents are nearly periodic in time at agiven location over the period of several days butcan change magnitude and direction over shortspatial distances. The wind field varies significantly in both time and space. The trajectorymodel provides a testing ground for determiningthe importance of these features to the oil-spillmotion problem. This section discusses three experiments with the trajectory model. The first twospecify winds constant in time corresponding tothe east and west wind fields outlined in the previous section. The third specifies time-varying butspatially uniform winds for a release site near PortAngeles. Five release sites in the eastern Strait ofJuan de Fuca were used in the first two cases(Fig. 42). Sites a, b, and e correspond to intersections in the vessel traffic-control system, whileSites c and d are the entrances to major shippingroutes through Rosario and Haro Straits.
Figure 42 shows the plotted trajectories foreasterly winds in the Strait (Fig. 41) keyed to awind magnitude at Tatoosh Island of 10 m/sec.Crosses on trajectories are at 24-h intervals. Starttime for the current field was noon on March 15,1976. Trajectories a and b were under the influence of strong winds at the outer end of the Strait.Drift toward the west was on the order of 10km/day. The release in Haro Strait (Site c)traveled south under the influence of the cold airwinds from the north. It reached the central Straitfar enough west that the trajectory continued westunder the influence of the gap winds in the centralwestern part of the Strait. The release in RosarioStrait (Site d) was blown south similarly to that atSite c but approached a region of lighter winds inthe vicinity of Site e, where the response was primarily tidal.
For time-invariant winds from the west(Fig. 41), the same five release sites have beensimulated (Fig. 43). The keying wind magnitude isagain 10 m/sec, and the currents were initialized
37
-
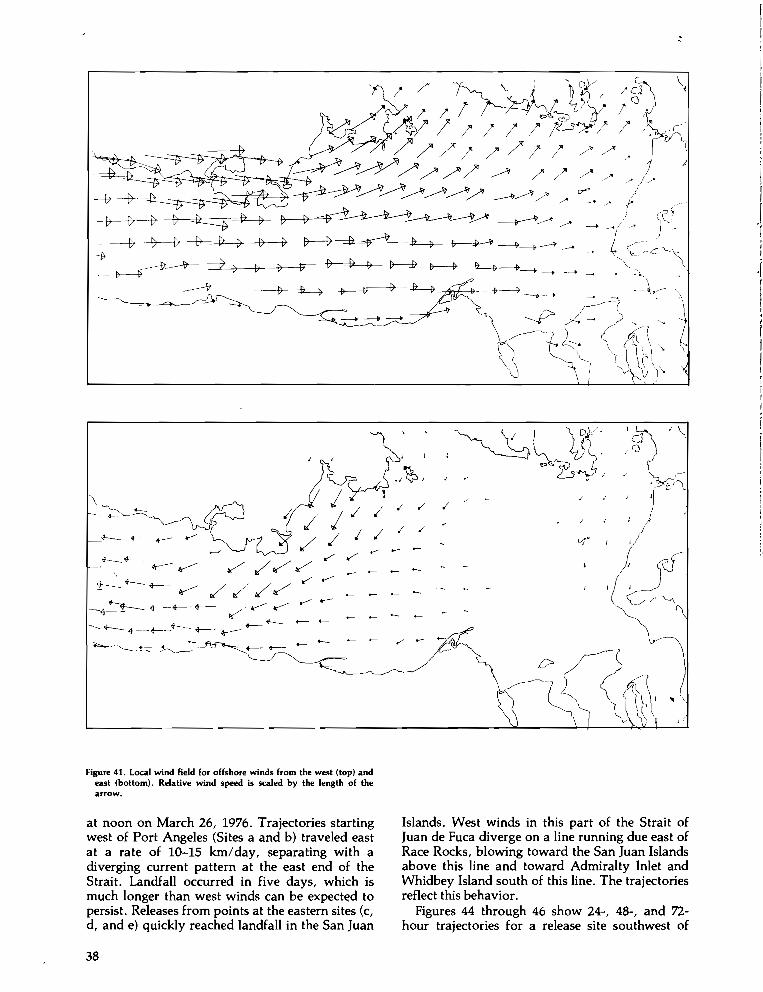
iIJIfI
,I
II
IiIi
-~
----lr-c:t~~H--1t--1t -\ /-.
-:; (~~~~\ )
__+--+~~~~~~*~:::IZ--::::y---- C' b C' ~4==:;L-~~--tr-"''it
-~ b C' ~'-----&-[) ---t>~~I7--tT-c-f:;
--~---C'=::lL.b~--tb>--~b-~[> --jt-=lt---+b-1b1--c£i~'---l:.--+-~__1t---4---> --->--+---+~ ---+-b~~L-lr--+-~~
./ /
I '
./ /
+-
\~
+--
Figure 41. Local wind field for offshore winds from the west (top) andeast (bottom). Relative wind speed is scaled by the length of thearrow.
at noon on March 26, 1976. Trajectories startingwest of Port Angeles (Sites a and b) traveled eastat a rate of 10-15 krn/day, separating with adiverging current pattern at the east end of theStrait. Landfall occurred in five days, which ismuch longer than west winds can be expected topersist. Releases from points at the eastern sites (c,d, and e) quickly reached landfall in the San Juan
Islands. West winds in this part of the Strait ofJuan de Fuca diverge on a line running due east ofRace Rocks, blowing toward the San Juan Islandsabove this line and toward Admiralty Inlet andWhidbey Island south of this line. The trajectoriesreflect this behavior.
Figures 44 through 46 show 24-, 48-, and 72hour trajectories for a release site southwest of
38
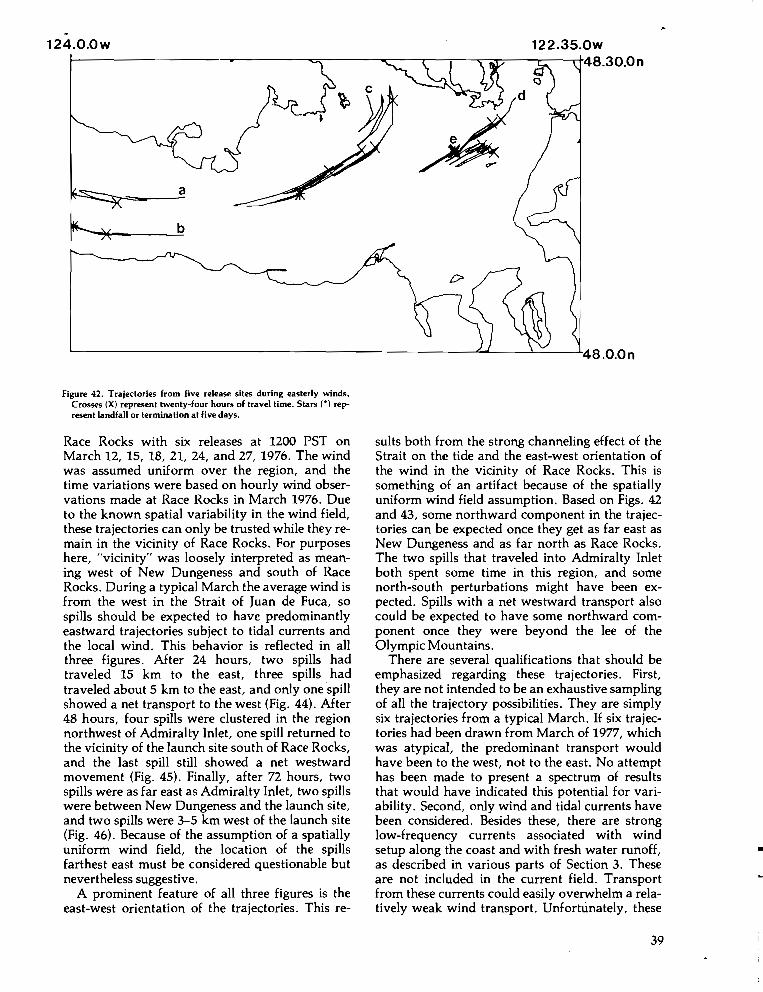
a
b
122.35.0wf-----------~-------..;;:..-----......------,~---.-----...--=--;---......----.+,48.30.0n
124.0.0w
Figure 42. Trajectories from five release sites during easterly winds.Crosses (X) represent twenty-four hours of travel time. Stars (') represent landfall or termination at five days.
Race Rocks with six releases at 1200 PST onMarch 12, 15, 18, 21, 24, and 27, 1976. The windwas assumed uniform over the region, and thetime variations were based on hourly wind observations made at Race Rocks in March 1976. Dueto the known spatial variability in the wind field,these trajectories can only be trusted while they remain in the vicinity of Race Rocks. For purposeshere, "vicinity" was loosely interpreted as meaning west of New Dungeness and south of RaceRocks. During a typical March the average wind isfrom the west in the Strait of Juan de Fuca, sospills should be expected to have predominantlyeastward trajectories subject to tidal currents andthe local wind. This behavior is reflected in allthree figures. After 24 hours, two spills hadtraveled 15 km to the east, three spills hadtraveled about 5 km to the east, and only one spillshowed a net transport to the west (Fig. 44). After48 hours, four spills were clustered in the regionnorthwest of Admiralty Inlet, one spill returned tothe vicinity of the launch site south of Race Rocks,and the last spill still showed a net westwardmovement (Fig. 45). Finally, after 72 hours, twospills were as far east as Admiralty Inlet, two spillswere between New Dungeness and the launch site,and two spills were 3-5 km west of the launch site(Fig. 46). Because of the assumption of a spatiallyuniform wind field, the location of the spillsfarthest east must be considered questionable butnevertheless suggestive.
A prominent feature of all three figures is theeast-west orientation of the trajectories. This re-
suIts both from the strong channeling effect of theStrait on the tide and the east-west orientation ofthe wind in the vicinity of Race Rocks. This issomething of an artifact because of the spatiallyuniform wind field assumption. Based on Figs. 42and 43, some northward component in the trajectories can be expected once they get as far east asNew Dungeness and as far north as Race Rocks.The two spills that traveled into Admiralty Inletboth spent some time in this region, and somenorth-south perturbations might have been expected. Spills with a net westward transport alsocould be expected to have some northward component once they were beyond the lee of theOlympic Mountains.
There are several qualifications that should beemphasized regarding these trajectories. First,they are not intended to be an exhaustive samplingof all the trajectory possibilities. They are simplysix trajectories from a typical March. If six trajectories had been drawn from March of 1977, whichwas atypical, the predominant transport wouldhave been to the west, not to the east. No attempthas been made to present a spectrum of resultsthat would have indicated this potential for variability. Second, only wind and tidal currents havebeen considered. Besides these, there are stronglow-frequency currents associated with windsetup along the coast and with fresh water runoff,as described in various parts of Section 3. Theseare not included in the current field. Transportfrom these currents could easily overwhelm a relatively weak wind transport. Unfortunately, these
•
39
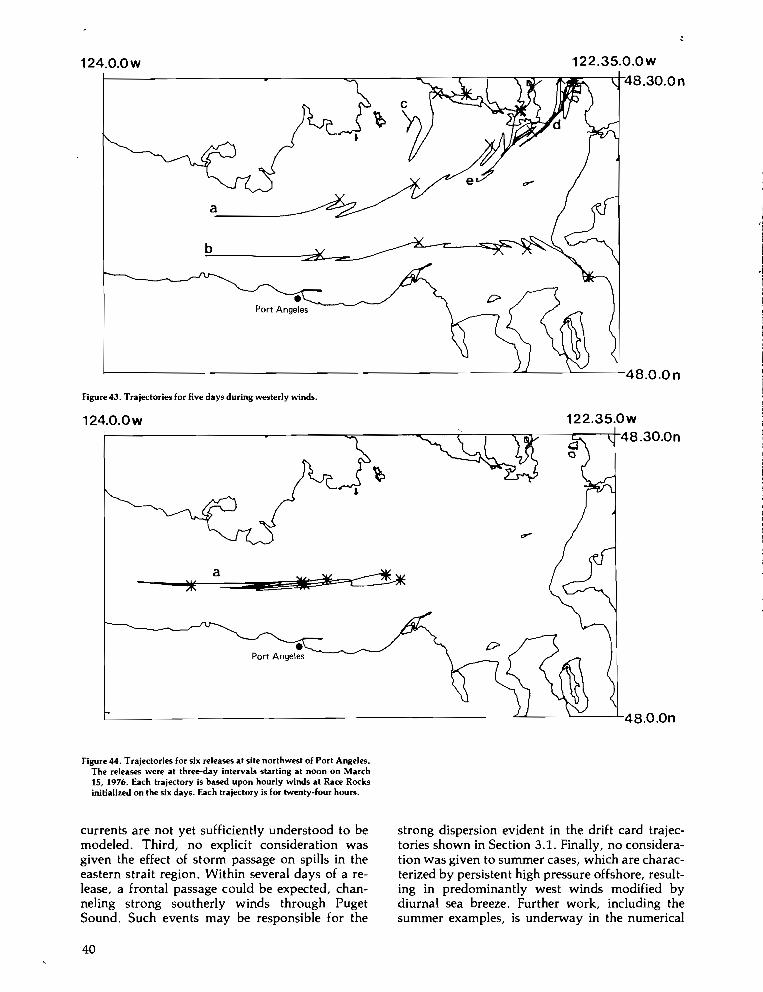
b
a------
122.35.0.0wf-----------~---~;;--------..;:::------.:--,~.......r.;-~~---rt-48.30.0n
124.0.0w
'-------------------------------"''-'------L----'-48.0.0 n
Figure 43. Trajectories for five days during westerly winds.
•Port Angeles
122.35.0wf----------~----"""---oc:--r----.--..,.,~-~-Tt-48.30.0n
124.0.0w
L-----------------------L....L------''----=---~48.0.0n
Figure 44. Trajectories for six releases at site northwest of Port Angeles.The releases were at three-day intervals starting at noon on March15, 1976. Each trajectory is based upon hourly winds at Race Rocksinitialized on the six days. Each trajectory is for twenty-four hours.
currents are not yet sufficiently understood to bemodeled. Third, no explicit consideration wasgiven the effect of storm passage on spills in theeastern strait region. Within several days of a release, a frontal passage could be expected, channeling strong southerly winds through PugetSound. Such events may be responsible for the
strong dispersion evident in the drift card trajectories shown in Section 3.1. Finally, no consideration was given to summer cases, which are characterized by persistent high pressure offshore, resulting in predominantly west winds modified bydiurnal sea breeze. Further work, including thesummer examples, is underway in the numerical
40
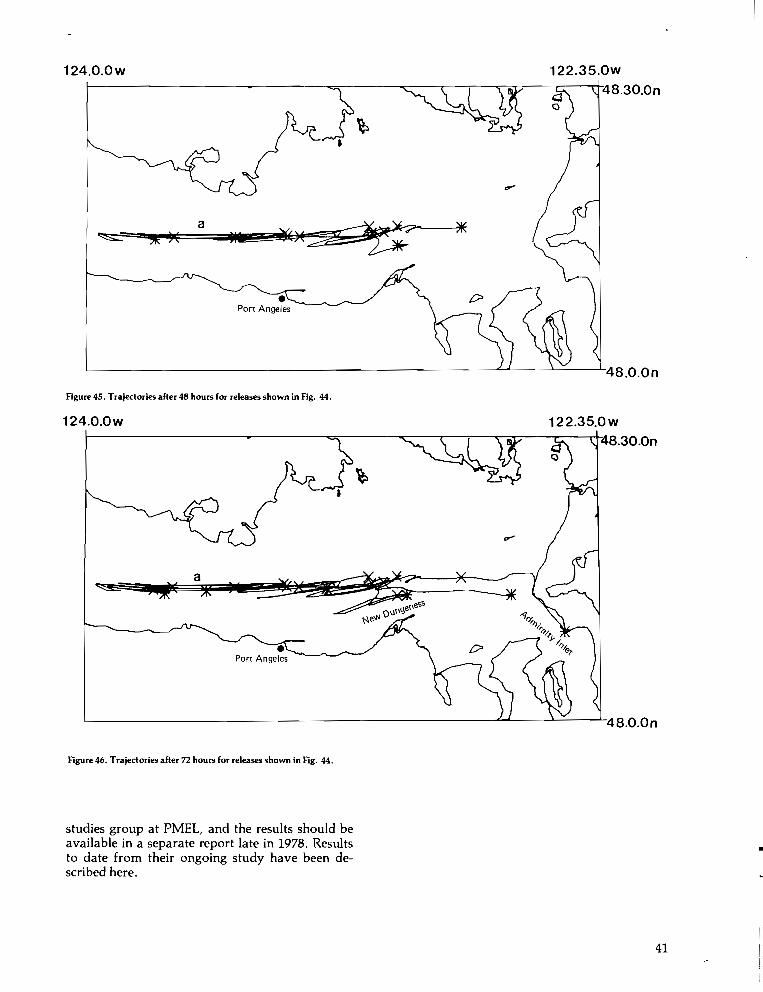
124.0.0w
124.0.0w
122.35.0wf----------~-----....=---------..or---,r-----.----.;--=-;-------,-----..+48.30.0n
•Port Angeles
L----------------------------"-""""-------'-----"-,48.0.0 n
Figure 45. Trajectories after 48 hours for releases shown in Fig. 44.
122.35.0wf----------~-----....~---""""C"--r-----.----...-=-~-----,------rt48.30.0n
a
L-----------------------o<..L---L-'---~48.0.0n
Figure 46. Trajectories after 72 hours for releases shown in Fig. 44.
studies group at PMEL, and the results should beavailable in a separate report late in 1978. Resultsto date from their ongoing study have been described here.
41
•

5. OTHER STUDIES
Canadian investigators conducted a number ofstudies in the western Strait of Juan de Fuca in thevicinity of Pillar Point during 1973 and 1975 andin the southern part of Haro Strait northwest ofVictoria during 1976. Results from these studiesare beginning to be published, and brief summaries from their reports follow. These are part ofongoing studies, and the results should be considered preliminary until completed by the respective scientists. Recent Canadian work in the Straitof Georgia was noted in Section 3.4. Also, thetidal modeling work in the Strait of Juan deFuca-Strait of Georgia system is a continuing endeavor, and the most up-to-date descriptions arein Crean (1978). PMEL trajectory modeling will becontinued this year as outlined in Section 4, andfurther results will be in a future modeling report.Major field investigations in 1978 are underway inthe eastern Strait of Juan de Fuca because of a lackof information about this area. This is a joint investigation between PMEL and the Institute ofOcean Sciences, Environment Canada, and a briefsummary of the study follows. Preliminary resultsfor the eastern Strait work are planned for summer 1979 as a supplement to this report.
The 1973 Canadian oceanographic program inthe Strait of Juan de Fuca was both an investigation into the flushing process of the Strait ofGeorgia and an attempt to obtain current observations as input to the Strait of Georgia numericaltidal model. Continuous records of currents (andtemperature and conductivity at some locations)were obtained for three months, and at two stations for over five months, all commencing inMarch (Huggett et al., 1976). Time series of temperature and salinity profiles were taken at a number of stations during the time the current meterswere- in place and at a few stations from June toDecember when there were no current observations.
Their data showed current speeds from justunder 125 em/sec on the surface to 75 em/sec near
42
the bottom. The principal semidiurnal componentM1 changed very little near the cross-section,averaging around 48 em/sec with a phase angle of245 0
• Similarly, K1 averaged 29 cm/sec wi th aphase angle of 254 0
• The residual currents showeda seaward or westward current in the upper portion of the Strait and a landward or eastward current in the lower half. The line of null velocitysloped upward from around a depth of 110 m onthe north side of the Strait to the surface on thesouthern side about one-half mile offshore. Thetwo layers had the same maximum speed (around14.5 em/sec) with the maximum seaward currentbeing on the surface in the center of the Strait andthe maximum landward current centered aboutthe middle of the lower layer. The close similarityof our overall averages was indicated in Section 3.3. Also, reversals were observed in theircurrent records, but no attempt was made to correlate them with storms or wind events. A significant finding is the possibility of net eastward flowat all depths near the southern shore at this time ofyear at this location.
The 1975 Canadian observations of currents,bottom pressures, and various auxiliary data wereobtained in the Strait of Juan de Fuca from May toJuly. The primary purpose of these measurementswas to investigate the relationship between thecurrents flowing along the Strait and the difference in bottom pressures across the Strait. A closecorrespondence between these two quantitieswould provide a method for computing the currents from pressure measurements made on opposite sides of the Strait (Fissel and Huggett, 1976;Fissel, 1976).
The Canadian group calculated currents fromthese differences of pressure, which generallyagreed within 20% with the measured current.Errors in the method were determined to be due tophysical phenomena which also caused differencesin the pressure across the Strait. These phenomena
i
I.'
were thought to be local accelerations of the crosschannel current and variations in the density oneither side that were not in isostatic balance withthe sea-surface elevation. Thus, for the full signalthe accuracy of the pressure difference methodwill depend largely on the size of these other factors relative to the pressure differences resultingfrom the Coriolis force. The method could not betested properly for residual currents, because largespatial variations of residual current fluctuationsacross the Strait indicated that sampling the current at five locations was not adequate to computea meaningful cross-channel averaged residual current. However, correlation with the pressure differences was surprisingly good.
The 1976 Canadian study in Haro Strait wasconducted from July to September to determinesome of the major water characteristics and flowin that region for late summer. The study includedobservations of currents across a section, temperatures using thermistor chains, several time seriesof CTD profiles over 25 hours, and winds (D. M.Farmer, Environment Canada, personal communication; Webster, 1977).
This study showed estuarine circulation, andthe level between inflow and outflow was observed to vary between 40 and 100 m on the eastern side to greater than 100 m on the western side.Deepening to the west was similar to that noted inSection 3.4. Following spring tides, the velocity,temperature, and salinity gradients were found tobe minimums, and following neap tides they weremaximums. Tidal phases were smallest in the surface on the eastern side. Phases increased withdepth and towards the western side. Pronouncedchanges occurred in the water characteristics inthe whole water column of Haro Strait overperiods of a day. For example, coinciding with the
occurrence of spring tides, the maximum northward flowing tidal current was associated with theappearance of a 250-m-thick layer of almost uniform salinity in the southern end of Haro Strait.
The 1978 PMEL program in the eastern Strait ofJuan de Fuca consists of two separate experiments,one in winter (December 1977-April 1978) andone in summer (July-September 1978), utilizingmoored current meter arrays, surface wind, sensors, and CTD data. Supporting meteorologicaland circulation data will be obtained from NWS,NOS, FNWC, and Environment Canada. Threesurface and three subsurface moorings will bepositioned as centrally as possible in the mainchannels connecting the eastern Strait with thewestern Strait, Haro Strait, and Admiralty Inlet.A triangular configuration of these arrays will beused to describe flow. Additional subsurfacemoorings will be placed near the Admiralty Inletsill and farther west at the same locations occupiedduring the program in the western Strait describedin Sections 2.2 and 3.3. At the same time, Canadian scientists will place several moorings near thenorth end of Haro Strait in the Strait of Georgia.Winds measured at the surface moorings will besupplemented by wind measurements from anemometers located on Smith Island, TatooshIsland, New Dungeness spit, and from the weatherstation at Port Angeles on Ediz Hook. Tidalheights will be available from NOS tide gauges atNeah Bay, Port Angeles, and Port Townsend.CTD sampling of the entire Strait of Juan de Fucaincluding the Admiralty Inlet sill region will bedone during deployment and recovery of themoored arrays and once about midway. Other observations of surface flow on a broader scale maytake place at short intervals during the summerdeployment.
43
-

6. SUMMARY AND CONCLUSIONS
The Strait of Juan de Fuca estuary is a majorshipping route for both the United States andCanada. The most recent published oceanographic description of this estuary is now over fifteen years old, and much new work has sincetaken place. Recently, the Pacific Marine Environmental Laboratory (PMEL) has been studyingnear-surface circulation and its driving mechanisms and has been developing a computer modelto predict possible trajectories of spilled oil. TheNational Ocean Survey of NOAA has beenmeasuring tides and tidal currents in order to provide improved predictions. Environment Canadaalso has been investigating various circulationproblems in these waters and has been developinga numerical tidal model. This report summarizessome of the results to date.
Because of potentially increased tanker traffic inthese waters, this synthesis of ongoing environmental studies has been written so that the mostrecent results will be readily available for use indecisions regarding these waters. The primary emphasis of these studies has been either directly orindirectly on transport mechanisms that mightaffect the redistribution of spilled oil. The primaryquestions that the studies have been attempting toanswer are: Given an oil spill at some location inthe Strait of Juan de Fuca or near the San JuanIslands, what would tidal currents, river discharges, and wind-driven currents do to the oil?Would it come ashore, and if so where, or wouldit be transported out to sea and away from theshorelines? No attempt has been made yet to relatethese results to specific ecosystems in the Strait.More details will become available, especially forthe waters east of Port Angeles, about one yearafter completion of the 1978 field studies.
It is well known that tidal currents dominate thewater motion in this estuarine system. The tidalcurrents are navigational hazards because the currents are quite large in the more restricted passages
44
of the San Juan Islands and in Admiralty Inlet, exceeding 4-5 knots in some places. In addition,tidal currents away from shorelines can mix anddisperse floating and suspended material, but theytend to produce concentrations in near~shore
eddies and at tidal fronts. Satellite photographshave shown large numbers of tidal fronts, particularly on either side of the San Juan Islands (Figs. 23and 24). Studies in the Puget Sound laboratoryhydraulic model at the University of Washingtonhave shown, in the vicinity of Admiralty Inlet (thenorthern limit of the model), the existence of nearshore eddies almost everywhere on the downcurrent side of points-of-Iand and in some embayments (Fig. 7). Canadian numerical tidal modelstudies also have shown similar eddies in the Straitof Juan de Fuca, and they probably exist throughout these waters. Tidal currents appear muchmore sensitive than tidal elevations (the rise andfall of the sea surface) to local variations in waterdepth and details of the shore line. This zone veryclose to shore has had very little study.
Superimposed on the tidal motions are theestuarine (river discharge) and wind-driven currents which transport floating and suspendedmaterial through the system or toward the shores.Studies of these motions have been carried out atPMEL using, for example, surface drift cards (Section 3.1), satellite photographs of suspended sediment (Section 3.2), moored current meters for extended durations (Sections 3.3 and 3.4), and anoil-spill trajectory model (Section 4).
Drift cards released during spring and summersouth of San Juan Island in the middle of the eastern basin of the Strait have been found on allbeaches surrounding the eastern basin (Fig. 18).Cards released in Puget Sound flowed out Admiralty Inlet and were similarly dispersed aroundthe eastern basin. Cards released closer to thesouthern shore throughout the Strait moved seaward and were found primarily on the southernshore. Drifters that were tracked during several

days in summer in the vicinity of Slip Point toPillar Point showed flow parallel to the shore during ebb currents and toward the shore duringflood currents. Cards released in winter werefound mostly on Vancouver Island (Fig. 18). Summer recoveries on the southern shore and winterrecoveries on the northern shore of the westernbasin of the Strait were consistent with the concept of current drift to the right of prevailingwinds. Westerly winds dominated in summer, andeasterly winds dominated in winter. Also, mooredcurrent-meter observations in winter showed seaward flow with a persistent shoreward componentnear the coast of Vancouver Island (Fig. 37). Observations in summer were not as close to thesouthern shore, and flow towards that shore wasobserved only during relatively short intervals.
Satellite observations of suspended sedimentwere most useful north of the San Juan Islands insummer when, sediment concentrations werelargest because of the nearness of the Fraser Riverand its large volume of sediment-laden river runoff. Mixing in the San Juan Island passages considerably reduced the sediment concentrations inthe near-surface water. Sediment plumes andeddies were observed where the Fraser first entersthe Strait of Georgia. The plumes moved seawardprimarily along the western shore of the Strait ofGeorgia, then through various passages, andeventually into Haro Strait (Fig. 19). However,during strong northwesterly winds the flow wasmodified sufficiently so that the sediment plumeextended further southeast along the northerncoasts of the San Juan Islands, flowed betweenOrcas and Lummi Islands, and then into RosarioStrait (Fig. 21). Parts of these plumes remained inthe southern Strait of Georgia at times, and theycontinued eastward and then northward along theWashington coast in the vicinity of Cherry Point.Tidal currents were small in the relatively shallowwater near Cherry Point, and variable winddriven currents dominated. Flow patterns deter-
mined by moored current meters and by observations of water properties showed patterns similarto the Fraser plume (Fig. 40). Many of the plumeswere very close to shore.
Moored current-meter observations in the western basin of the Strait showed that the nearsurface currents averaged over long times wereseaward (or westward). During summer shorterterm averages yielded seaward flow. However,during winter considerable variability was observed, and there were extended periods of 3-10days when the averaged near-surface flow wasdirected landward (or eastward). One month's observations across the Strait at Tongue Pointshowed two periods of inflow and two periods ofoutflow on the southern side (Fig. 28). During thesecond interval of inflow, the eastward-directedsurface flow extended entirely across this section,and significant changes in the deeper flow alsowere observed. In another winter five major flowreversals occurred, accounting for 35% of the observation interval (Fig. 33). These flow reversalswere accompanied by intrusions of coastal oceanicwaters which were relatively fresher and warmer(Fig. 30) and which contained coastal species ofboth phytoplankton and zooplankton (Table 1).The intrusions probably were mixtures ofColumbia River discharge, which is known toflow northward during winter under the influenceof southerly winds. These reversals and intrusionsappeared to be directly related to storm windsalong the coast, which raised the sea level at themouth of the Strait enough to reverse the flowwithin the western basin (Fig. 36). Significant correlations were observed between along-channelcurrents at the mouth and sea-surface height atNeah Bay, and between coastal winds and the seasurface height. The intrusions were observedsouth from Race Rocks as far as 90 km from themouth. The speed and duration of these currentreversals implies that oceanic water on occasioncould possibly reach as far east as Whidbey
45
Island. However, it is not certain whether the intrusions of coastal water actually enter the easternbasin of the Strait; nor is it certain to what extentstorm-related conditions drive the circulation inthe eastern basin. These questions are beingaddressed during the present field investigations.
The oil-spill trajectory model, while still incompletely developed, has nevertheless provided considerable useful information. A simulated oil spill,assumed to be under the influence of easterlywinds that were variable in space but constant intime, had trajectories starting from five releasesites in the eastern basin, all of which remained inopen water for the duration of the calculations.The simulation for westerly winds showed trajectories ending on beaches after a day or two whenthe release sites were near the San Juan Islands,and after about five days when the sites were westof Port Angeles (Fig. 43). However, it is unlikelythat the winds would remain constant for as longas five days. A third case was run for time-varyingbut spatially uniform winds for a release site westof Port Angeles and south of Race Rocks. Six releases were simulated at noon at three-day intervals, using computerized data from winds observed at Race Rocks for March 1976. After threedays, two spills had been transported as far east asAdmiralty Inlet, two were between New Dungeness and the release site, and two were slightlywest of the release site (Fig. 46). Because of the assumption of spatially uniform winds, the easternmost predicted trajectories should be regarded aspreliminary results only. Also, the east-west channeling of these mid-channel releases may be anartifact, because the model does not include all thedetails of the actual currents (data from the drifterexperiment indicate that oil would likely reach thenorthern or southern shore).
These test cases were trajectories from a typicalMarch. However, March 1977 was not typical,and had oil been spilled then, its transport wouldhave been to the west. Also, no summer cases
46
have yet been run. Finally, the model includeswind and tidal currents, but time has not allowedinclusion of the winter current reversals arisingfrom wind setup along the coast. These currentsare not yet sufficiently well understood to bemodeled in the computer.
Drift cards have been found on some beaches atall times of the year. Their recovery in the westernbasin appeared related to local winds. Recovery inthe eastern basin throughout the year appeared tobe independent of season; however, the flowpatterns distributing the cards around the easternbasin remain unknown. The initial trajectorymodel experiments described here also indicatethat beachings would occur, but more comparisons remain to be made with actual observationsfor details of the paths, particularly for those exceeding a day or two in time.
The details of the circulation for the southernStrait of Georgia and for the western basin of theStrait of Juan de Fuca are better known than thosefor the eastern basin. Considerably more information should be available from the ongoing studiesin the latter region in about a year and the gaps inknowledge partially filled. However, little isknown about processes occurring in the nearshorezone extending about a mile or so offshore anywhere in the estuary, in the passages between theSan Juan Islands, at the mouth of the Strait of Juande Fuca, and at the junction with Admiralty Inlet.These areas must await future research.
So far, these studies have shown that in theStrait of Juan de Fuca a variety of transport processes exist which could result in considerable redistribution of spilled oil (or any other contaminant). Although much work remains to better describe and quantify the cause and effect relationships, much evidence has been presented that indicates the strong possibility of significant volumesof contaminant reaching beaches within theestuary instead of being transported out of theestuary and into the ocean.
7. ACKNOWLEDGMENTS
Funding for a significant part of these studieswas provided by the U.S. Environmental Protection Agency to NOAA and managed by NOAA'sPuget Sound Project Office of the Marine Ecosystems Analysis (MESA) Program. MESA providedadditional funding for this report. This support isgratefully acknowledged. In addition, these fundswere supplemented by the Pacific Marine Environmental Laboratory (PMEL). The National OceanSurvey (NOS) was supported primarily by its ownfunds with a small supplement from MESA. TheNOS also provided ship support for many of thePMEL field activities, and assistance by the officers and crews was invaluable.
Special thanks are due Dr. Patrick B. Crean,Dr. Richard E. Thomson, and Mr. W. StanHuggett of Environment Canada's Institute ofOcean Sciences at Patricia Bay. Many discussionsof their work as well as assistance in the field havegreatly aided carrying out much of our own work.
Special credit is due many at PMEL who havecontributed to and made these studies successful.Dr. John R. Apel provided many helpful suggestions during the final writing.
47

8. REFERENCES
Baker, E. T., J. D. Cline, R. A Feely, andJ. Quan, 1978. Seasonal distributions, trajectory studies, and sorption characteristics of suspended particulate matter in the northern PugetSound region, unpublished manuscript.
Barnes, C. A, B. A. Morse, and A C. Duxbury,1972. Circulation and selected properties of theColumbia River effluent at sea. In: The Columbia River estuary and adjacent ocean waters,A. T. Pruter and D. L. Alverson (editors),Univ. of Washington Press, Seattle, 41-80.
Burt, W. V. and B. Wyatt, 1964. Drift bottle observations of the Davidson Current off Oregon.In: Studies on oceanography, K. Yoshida (editor), Univ. of Washington Press, Seattle,156-165.
Cannon, G. A, N. P. Laird, and T. V. Ryan,1972. Currents observed in Juan de Fuca submarine canyon and vicinity, 1971. NOAATech. Rep. ERL 252-POL 14,57 pp.
Cannon, G. A and N. P. Laird, 1978. Circulationin the Strait of Juan de Fuca, 1976-1977, unpublished manuscript.
Chang, P., S. Pond, and S. Tabata, 1976. Subsur. face currents in the Strait of Georgia, west ofSturgeon Bank. /. Fish. Res. Bd. Canada, 33:2218-2241.
Crean, P. B., 1978. A numerical model simulationof barotropic mixed tides in the Strait ofGeorgia. In: Hydrodynamics of estuaries andfjords, J. Nihoul (editor), Elsevier ScientificPub!. Co., Amsterdam, Elsevier OceanographySeries #23,283-313.
Crean, P. B. and A. B. Ages, 1971. Oceanographic records from twelve cruises in the Straitof Georgia and Juan de Fuca Strait, 1968. Department of Energy, Mines and Resources, Mar.Sci. Branch, Victoria, B.C., 5 vols.
Damkaer, D. M. and J. D. Larrance, 1978. Seasonal distributions of plankton in the Strait ofJuan de Fuca, unpublished manuscript.
48
Ebbesmeyer, C. c., J. M. Helseth, and J. M. Cox,1977. Surface drifter movements observed inouter Strait of Juan de Fuca, July 1977. NOAATech. Memo. ERL MESA-22, 70 pp.
Fissel, D. E., 1976. Pressure differences as ameasure of currents in Juan de Fuca Strait. Inst.of Ocean Sciences, Patricia Bay, Victoria, B.C.,Pac. Mar. Sci. Rep. 76-17, 63 pp.
Fissel, D. E. and W. S. Huggett, 1976. Observations of currents, bottom pressures and densitiesthrough a cross-section of Juan de Fuca Strait.Inst. of Ocean Sciences, Patricia Bay, Victoria,B.C., Pac. Mar. Sci. Rep. 76-6, 68 pp.
Gargett, A. E., 1976. Generation of internal wavesin the Strait of Georgia, British Columbia.Deep-Sea Res., 23:17-32.
Harris, R. G. and M. Rattray, Jr., 1954. The surface winds over Puget Sound and the Strait ofJuan de Fuca and their oceanographic effect.Univ. of Washington, Seattle, Tech. Rep. 37,101 pp.
Hayes, S. P. and D. Halpern, 1976. Observationsof internal waves and coastal upwelling: Oregon, July 1973. /. Mar. Res., 33:247-267.
Herlinveaux, R. H., 1954. Tidal currents in Juande Fuca Strait. /. Fish. Res. Bd. Canada,11:799-815.
Herlinveaux, R. H. and J. P. Tully, 1961. Someoceanographic features of Juan de Fuca Strait. /.Fish Res. Bd. Canada, 18:1027-1071.
Holbrook, J. R. and D. Halpern, 1978. Variabilityof near-surface currents and winds in the western Strait of Juan de Fuca, unpublishedmanuscript.
Huggett, W. S., J. F. Bath, and A Douglas, 1976.Juan de Fuca Strait, 1973. In: Data record ofcurrent observations, Volume XV. Inst. ofOcean Sciences, Patricia Bay, Victoria, B.C.,169 pp.

Klemas, V. and D. F. Polis, 1976. Remote sensingof estuarine fronts and their effects on oil slicks.College of Marine Studies, Univ. of Delaware,Newark, Report CMS RANN 4-76, 480 pp.
Lilly, K. E., Jr., 1978. Northwest Washingtonweather for the small boat operator. SeattleForecast Office, National Weather Service, unpublished manuscript.
Little, A. D., Inc., 1977. The onshore impact ofAlaskan oil and gas development in the state ofWashington. Report to the Department of Ecology, State of Washington, Olympia, 2 vols.
McGary, N. and J. H. Lincoln, 1977. Tide prints:surface tidal currents in Puget Sound. Univ. ofWashington, Seattle, Washington Sea GrantPub!., WSG 771-1, 51 pp.
Maunder, W. J., 1968. Synoptic weather patternsin the Pacific Northwest. Northwest Sci., 42:88.
NOAA/National Ocean Survey, 1976. Tidal current tables 1977: Pacific coast of North Americaand Asia. NOAA/National Ocean Survey,Rockville, MD, 254 pp. .
Nelson, C. S., 1977. Wind stress and wind stresscurl over the California Current. NationalMarine Fisheries Service, Seattle, NOAA Tech.Rep. NMFS SSRF-14, 87 pp.
Oliver, B. M. and J. F. R. Gower, 1977. Airbornemeasurements of horizontal wind. Inst. ofOcean Sciences, Patricia Bay, Victoria, B.C.,Pac. Mar. Sci. Rep. 77-15,23 pp.
Overland, J. E., M. H. Hitchman, and Y. J. Han,1978. A regional surface wind model for mountainous coastal areas, unpublished manuscript.
Overland, J. E. and J. C. Vimont, 1979. Marineclimatology of western Washington. To be published in: Puget Sound: oceanography of the inshore waters of Washington, L. K. Coachman(editor), Univ. of Washington Press, Seattle.
Parker, B. B., 1977. Tidal hydrodynamics in theStrait of Juan de Fuca-Strait of Georgia. NOAATech. Rep. NOS-69, 56 pp.
Pashinski, D. J. and R. L. Charnell, 1978. Recovery rate for surface drift cards released in thePuget Sound-Strait of Juan de Fuca during1976-77, unpublished manuscript.
Phillips, E. L., 1966. Washington climate for thesecounties: northeast Clallam, northeast Jefferson, Island, San Juan, Skagit, Snohomish, andWhatcom. Cooperative Extension Service,Washington State University, Pullman, Washington,64 pp.
Redfield, A., 1950. The analysis of tidalphenomena in narrowembayments. Papers inphysical oceanography and meteorology, Vol.XI, No.4, Massachusetts Institute of Technology and Woods Hole Oceanographic Institution, Cambridge and Woods Hole, Massachusetts, 36 pp.
Reed, T. R., 1931. Gap winds of the Strait of Juande Fuca. Mon. Weather Rev., 59:473-576.
Schumacher, J. D. and R. M. Reynolds, 1975.STD, current meter, and drogue observations inRosario Strait, January-March 1974. NOAATech. Rep. ERL 333-PMEL 24, 212 pp.
Schumacher, J. D., C. A. Pearson, R. L. Charnell,and N. P. Laird, 1978. Regional response toforcing in southern Strait of Georgia. Acceptedfor publication in Estuarine and Coastal Mar.Sci.
Tabata, S., 1972. The movement of Fraser Riverinfluenced surface water in the Strait of Georgiaas deduced from a series of aerial photographs.Inst. of Ocean Sciences, Patricia Bay, Victoria,B.C., Pac. Mar. Sci. Rep. 72-6, 69 pp.
Thomson, R. E., 1975. Currents in Juan de FucaStrait: the physical oceanography of the B.C.coast-Part VII. Pac. Yachting, August, 84-91.
Tracy, D. E., 1975. STD and current meter observations in the north San Juan Islands, October1973. NOAA Tech. Memo. ERL PMEL-4,77 pp.
U.S. Coast and Geodetic Survey, 1958. Manual ofharmonic analysis and prediction of tides. Government Printing Office, Washington, D.C.,316 pp.
Waldichuck, M., 1957. Physical oceanography ofthe Strait of Georgia, British Columbia. J. Fish.Res. Bd. Canada, 14:321-486.
Webster, I., 1977. A physical oceanographic studyof Haro Strait: a data summary and preliminaryanalysis. Report for Inst. of Ocean Sciences,Patricia Bay, Victoria, B.C., Contractors Report Series 77-3,90 pp.
49*u.s. GOVERNMENT PRINTING OFFICE, 1978-0-677-072{1202