circulation data: social work library
DESCRIPTION
Circulation Data: Social Work Library. Zack Lane ReCAP Coordinator July 2012. ReCAP Columbia University. Social Work Circulation Data. Looks at Social Work Library circulation activity Is only one measure of collection usage Presents data both SW specific and system-wide - PowerPoint PPT PresentationTRANSCRIPT

Circulation Data: Social Work Library
Zack LaneReCAP Coordinator
July 2012
ReCAPColumbia University
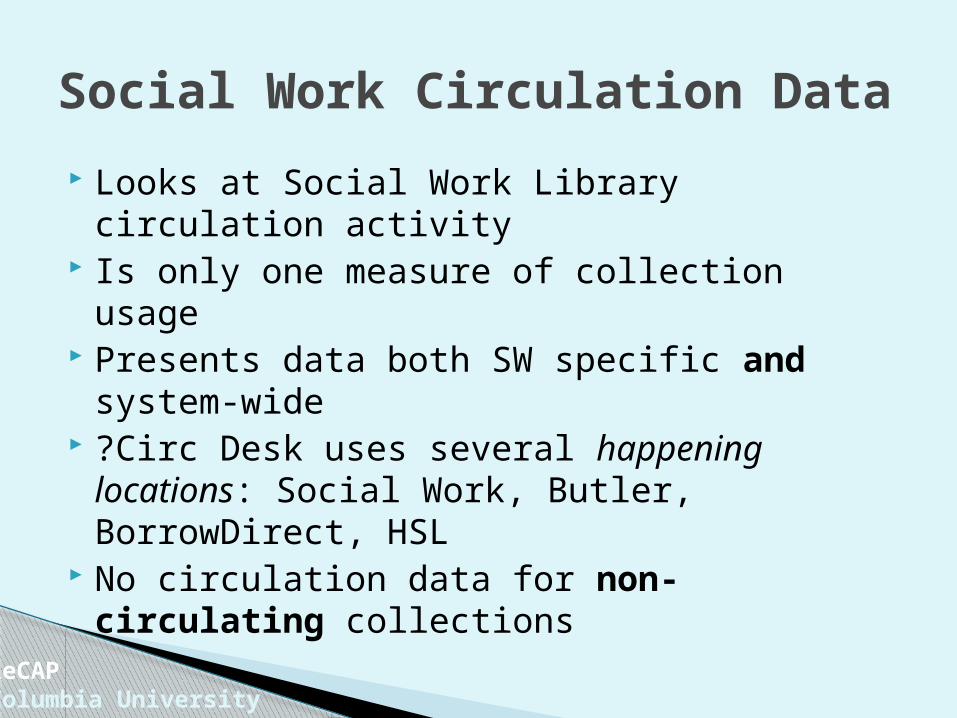
Looks at Social Work Library circulation activity
Is only one measure of collection usage Presents data both SW specific and system-
wide ?Circ Desk uses several happening
locations: Social Work, Butler, BorrowDirect, HSL
No circulation data for non-circulating collections
Social Work Circulation Data
ReCAPColumbia University

ReCAPColumbia University
?SW Library Background ?Social Work Library became independent
entity in August 2004 ?Opening of new Social Work building ?Print collection was previously part of
Lehman Library in SIPA ?Transition period between August 2004
and May 2005 ?Two happening locations:
◦ Social Work Circ. Deck◦ SW Circulation Desk

ReCAPColumbia University
SW Library Happening Location
Data collated by happening location Social Work Library became independent
entity in August 2004 Five primary types of circulation activity:
charge, discharge, renewal, recall and hold
Most renewals and recalls are done in the OPAC happening location, dynamically by patrons themselves
Note: circulation data includes primarily “on campus” collections
ReCAPColumbia University
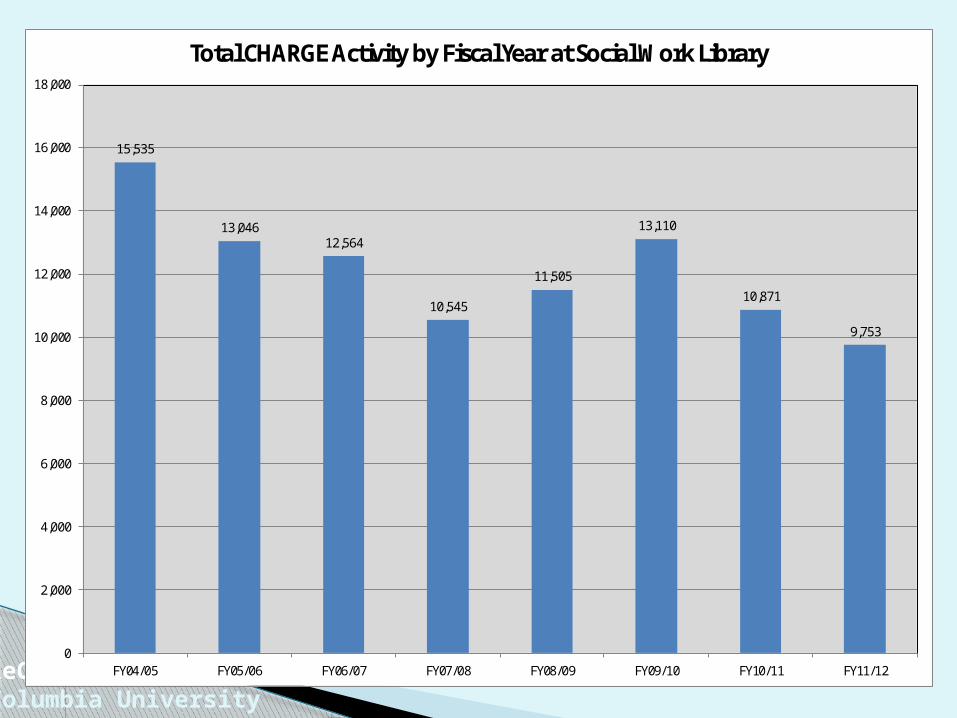
15,535
13,04612,564
10,545
11,505
13,110
10,871
9,753
0
2,000
4,000
6,000
8,000
10,000
12,000
14,000
16,000
18,000
FY04/05 FY05/06 FY06/07 FY07/08 FY08/09 FY09/10 FY10/11 FY11/12
Total CHARGE Activity by Fiscal Year at Social Work Library
ReCAPColumbia University
0
2,000
4,000
6,000
8,000
10,000
12,000
14,000
16,000
18,000
FY04/05 FY05/06 FY06/07 FY07/08 FY08/09 FY09/10 FY10/11 FY11/12
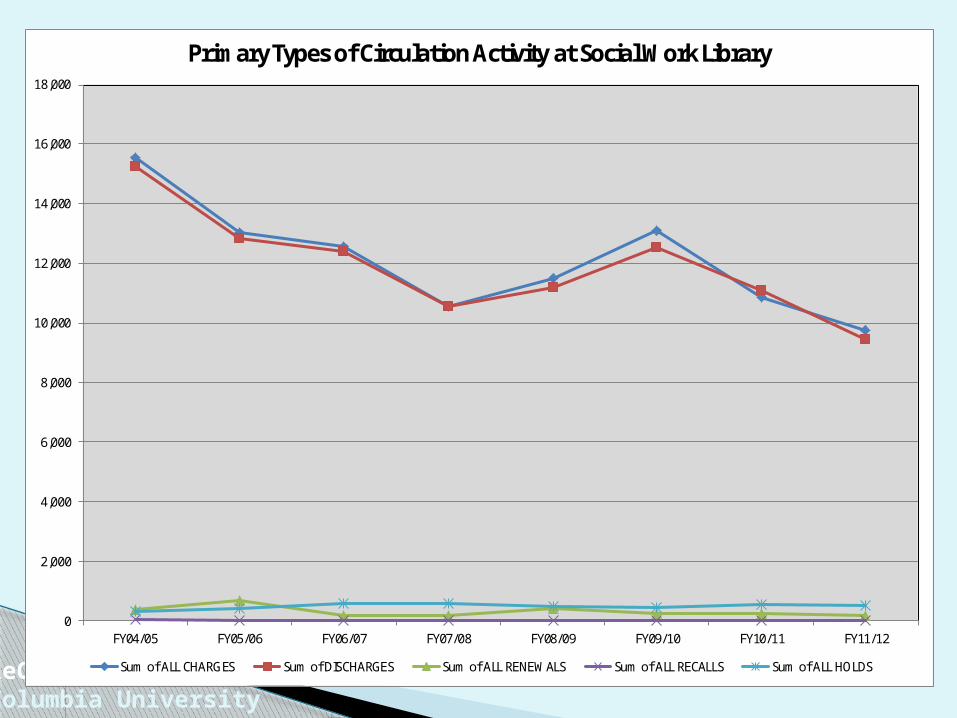
Primary Types of Circulation Activity at Social Work Library
Sum of ALL CHARGES Sum of DISCHARGES Sum of ALL RENEWALS Sum of ALL RECALLS Sum of ALL HOLDS

ReCAPColumbia University
Observations Total volume of charges has fluctuated System-wide there has been a 27.4%
decline Volume of discharge predictably mirrors
charges Other types of circulation activity happen in
much lower volume Majority of renewals occur in the OPAC
happening location

ReCAPColumbia University
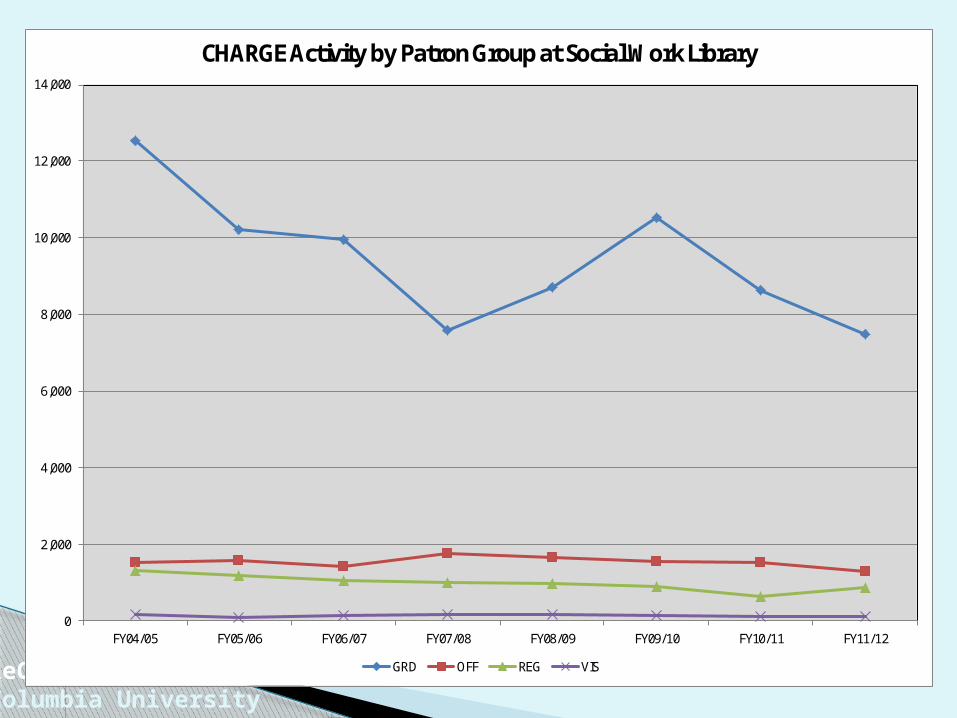
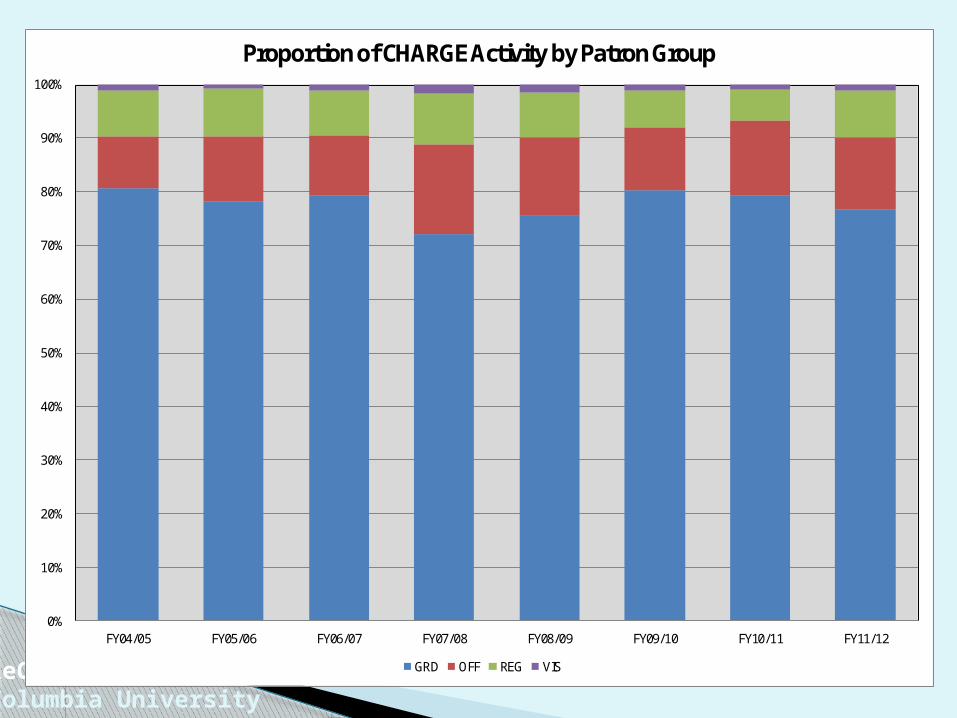
SW Circulation by Patron Group
Almost 3/4 of all charges are to graduate students
Patron Group definitions have changed:◦ Adjunct faculty, in 2008 grad students were given
primary group OFF instead of GRD Pie charts break down data for FY12 only Bar chart compares patron group charges
for each fiscal year
ReCAPColumbia University
0
2,000
4,000
6,000
8,000
10,000
12,000
14,000
FY04/05 FY05/06 FY06/07 FY07/08 FY08/09 FY09/10 FY10/11 FY11/12
CHARGE Activity by Patron Group at Social Work Library
GRD OFF REG VIS

ReCAPColumbia University
0
500
1,000
1,500
2,000
2,5007/
1/20
049/
1/20
0411
/1/2
004
1/1/
2005
3/1/
2005
5/1/
2005
7/1/
2005
9/1/
2005
11/1
/200
51/
1/20
063/
1/20
065/
1/20
067/
1/20
069/
1/20
0611
/1/2
006
1/1/
2007
3/1/
2007
5/1/
2007
7/1/
2007
9/1/
2007
11/1
/200
71/
1/20
083/
1/20
085/
1/20
087/
1/20
089/
1/20
0811
/1/2
008
1/1/
2009
3/1/
2009
5/1/
2009
7/1/
2009
9/1/
2009
11/1
/200
91/
1/20
103/
1/20
105/
1/20
107/
1/20
109/
1/20
1011
/1/2
010
1/1/
2011
3/1/
2011
5/1/
2011
7/1/
2011
9/1/
2011
11/1
/201
11/
1/20
123/
1/20
125/
1/20
12
Monthly CHARGE Activity by Patron Group at Social Work Library
GRD OFF REG VIS

ReCAPColumbia University
GRD76.80%
OFF13.29%
REG8.81%
VIS1.11%
FY12 Breakdown of CHARGE Activity by Patron Group at SW Library
ReCAPColumbia University
0%
10%
20%
30%
40%
50%
60%
70%
80%
90%
100%
FY04/05 FY05/06 FY06/07 FY07/08 FY08/09 FY09/10 FY10/11 FY11/12
Proportion of CHARGE Activity by Patron Group
GRD OFF REG VIS
ReCAPColumbia University
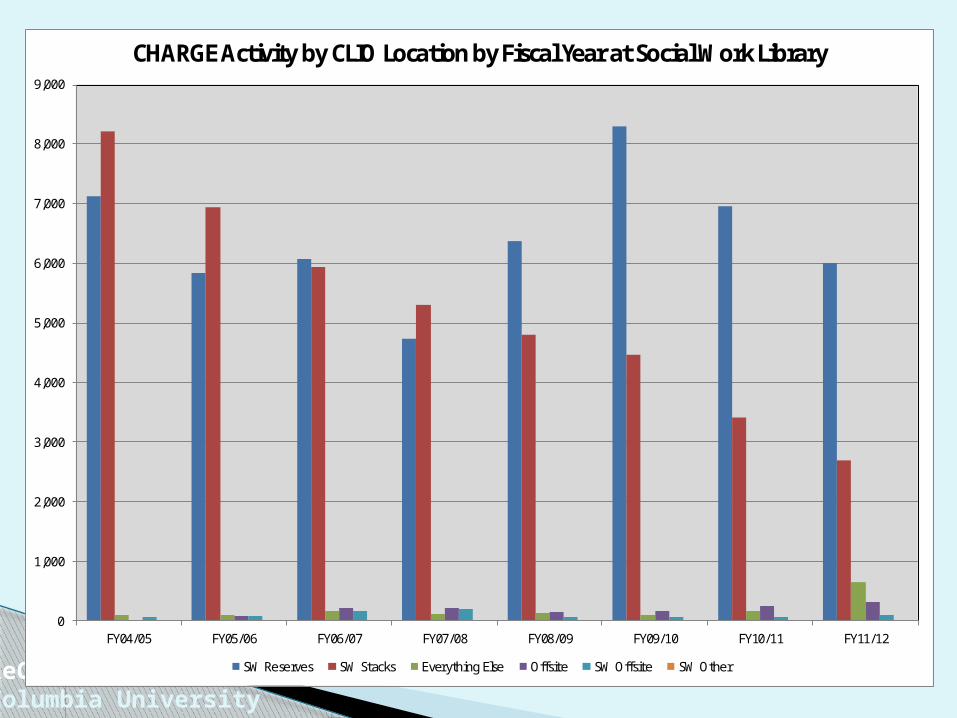
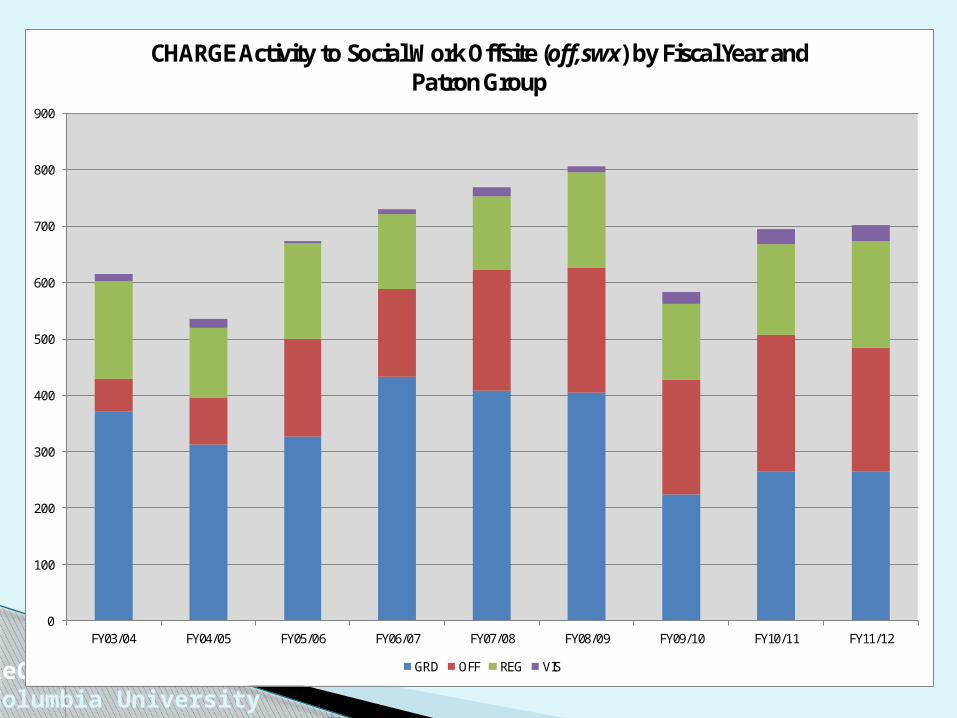
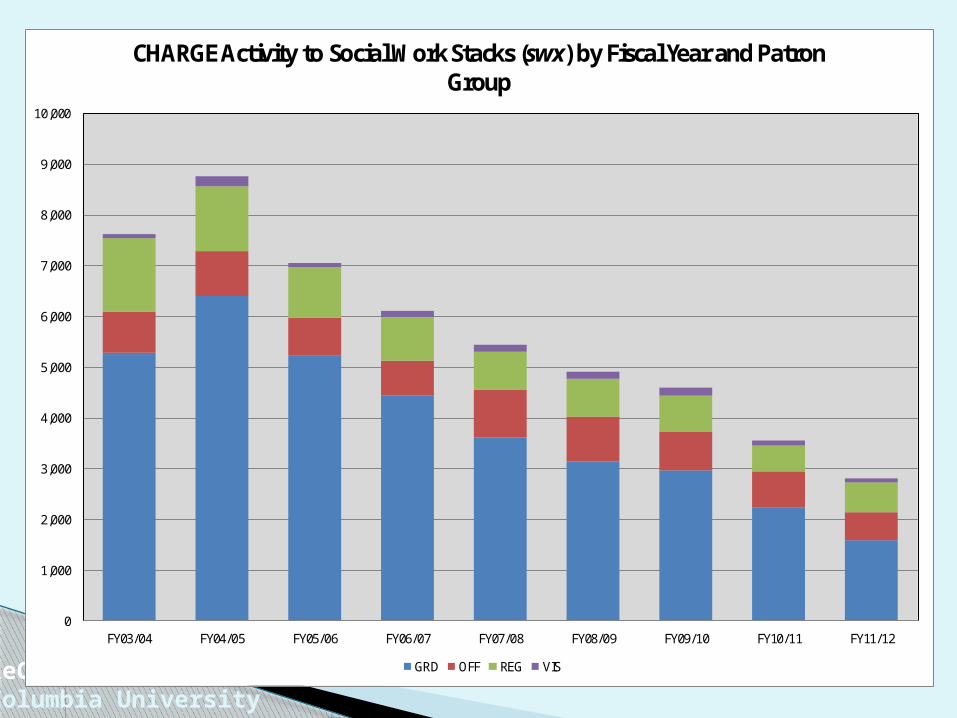
Circ Activity by Collection Over the life of SW, charge activity is split
evenly between stacks and reserves collections
In FY12, activity was heavier with Reserves Charges to SW Stacks has declined steadily
each fiscal year Offsite charges should be placed in the
Butler Happening Location Data unavailable for non-circulating
collections

ReCAPColumbia University
SW Reserves53.03%
SW Stacks43.10%
Everything Else1.56%
Offsite1.46% SW Offsite
0.83%
SW Other0.03%
FY04-FY12 Circulation Activity by CLIO Location at Social Work Library
ReCAPColumbia University
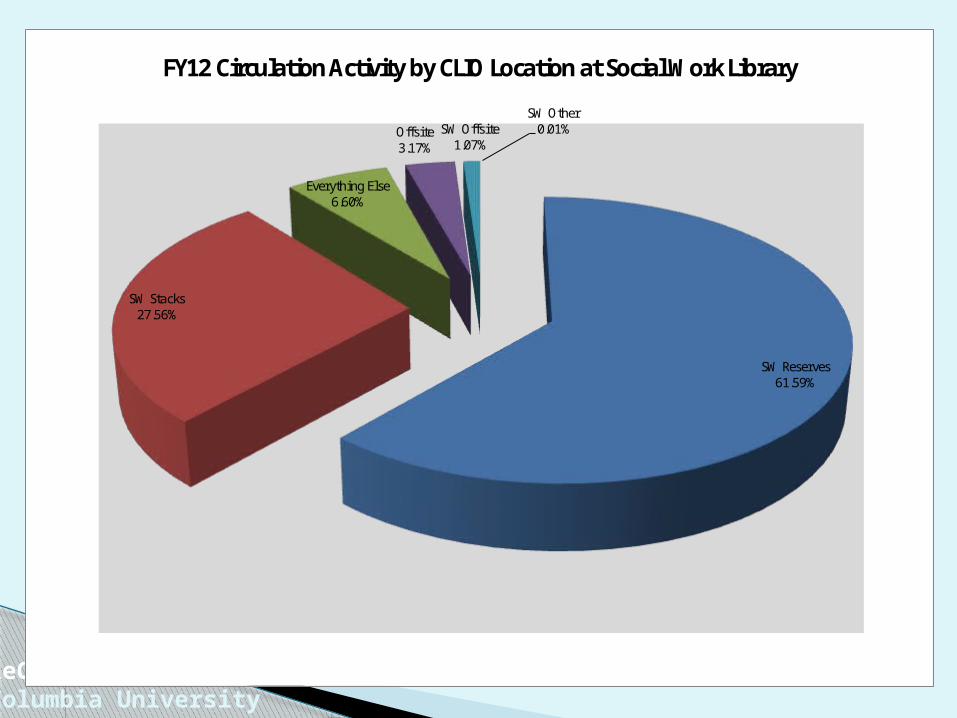
SW Reserves61.59%
SW Stacks27.56%
Everything Else6.60%
Offsite3.17%
SW Offsite1.07%
SW Other0.01%
FY12 Circulation Activity by CLIO Location at Social Work Library
ReCAPColumbia University
0
1,000
2,000
3,000
4,000
5,000
6,000
7,000
8,000
9,000
FY04/05 FY05/06 FY06/07 FY07/08 FY08/09 FY09/10 FY10/11 FY11/12
CHARGE Activity by CLIO Location by Fiscal Year at Social Work Library
SW Reserves SW Stacks Everything Else Offsite SW Offsite SW Other

ReCAPColumbia University
Collection Use by Patron Group
Data for all transactions in the SW Happening Location
Nearly 80% is for the LC Stacks collection alone
Offsite charges are placed in the Butler Happening Location
Data unavailable for non-circulating collections

ReCAPColumbia University
0
1,000
2,000
3,000
4,000
5,000
6,000
7,000
8,000
9,000
FY03/04 FY04/05 FY05/06 FY06/07 FY07/08 FY08/09 FY09/10 FY10/11 FY11/12
CHARGE Activity to Social Work Reserves (swx,res) by Fiscal Year and Patron Group
GRD OFF REG VIS
ReCAPColumbia University
0
100
200
300
400
500
600
700
800
900
FY03/04 FY04/05 FY05/06 FY06/07 FY07/08 FY08/09 FY09/10 FY10/11 FY11/12
CHARGE Activity to Social Work Offsite (off,swx) by Fiscal Year and Patron Group
GRD OFF REG VIS
ReCAPColumbia University
0
1,000
2,000
3,000
4,000
5,000
6,000
7,000
8,000
9,000
10,000
FY03/04 FY04/05 FY05/06 FY06/07 FY07/08 FY08/09 FY09/10 FY10/11 FY11/12
CHARGE Activity to Social Work Stacks (swx) by Fiscal Year and Patron Group
GRD OFF REG VIS

System-wide circulation statistics are available for both on campus and offsite collections
Circulation data are accessible to all staff Offsite collections can be identified by CLIO
location format off,xxx. System-wide data is available from July
2003, the date of Ex Libris Voyager implementation
System-wide Circulation Data
ReCAPColumbia University

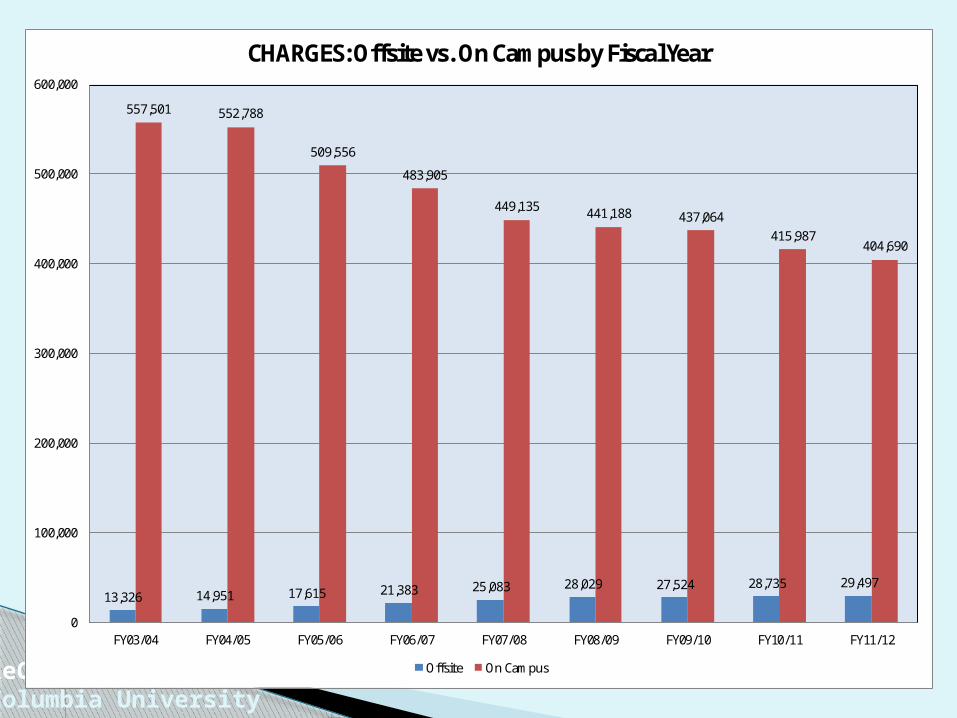
Comparison of on campus and offsite collection charges by volume
On campus charge volume declined by 27.4% between FY04 and FY12
On campus charges have declined every year since FY04
Offsite charge volume increased 121.3% between FY04 and FY12
N.B. On campus collection size declines each year; offsite collections grow each year
On Campus vs. Offsite Charges
ReCAPColumbia University
ReCAPColumbia University
13,326 14,951 17,615 21,383 25,083 28,029 27,524 28,735 29,497
557,501 552,788
509,556
483,905
449,135 441,188 437,064415,987
404,690
0
100,000
200,000
300,000
400,000
500,000
600,000
FY03/04 FY04/05 FY05/06 FY06/07 FY07/08 FY08/09 FY09/10 FY10/11 FY11/12
CHARGES: Offsite vs. On Campus by Fiscal Year
Offsite On Campus

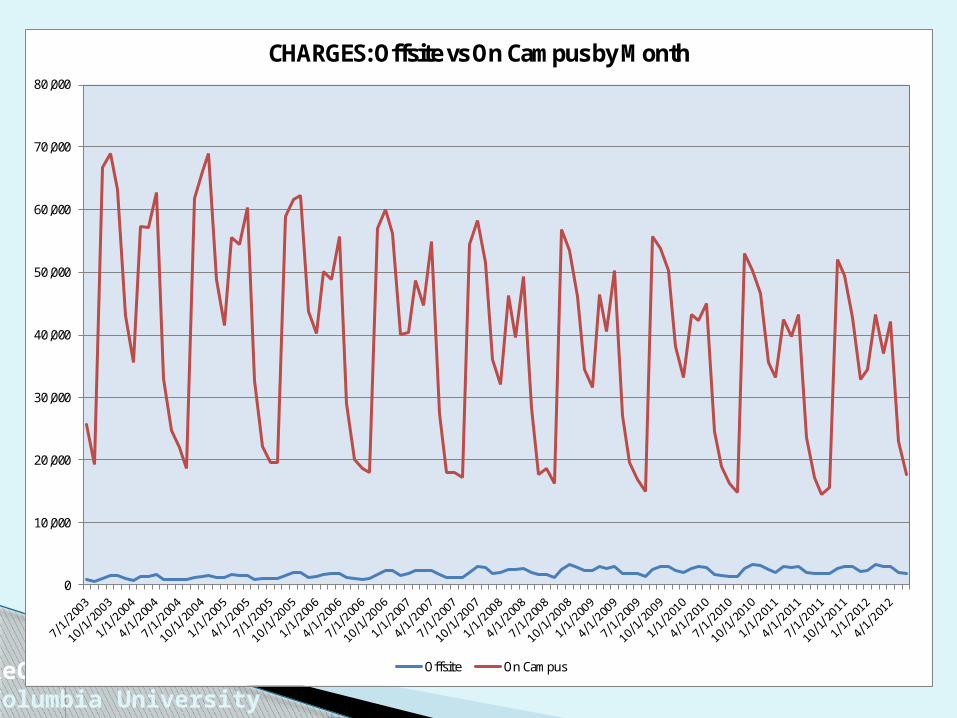
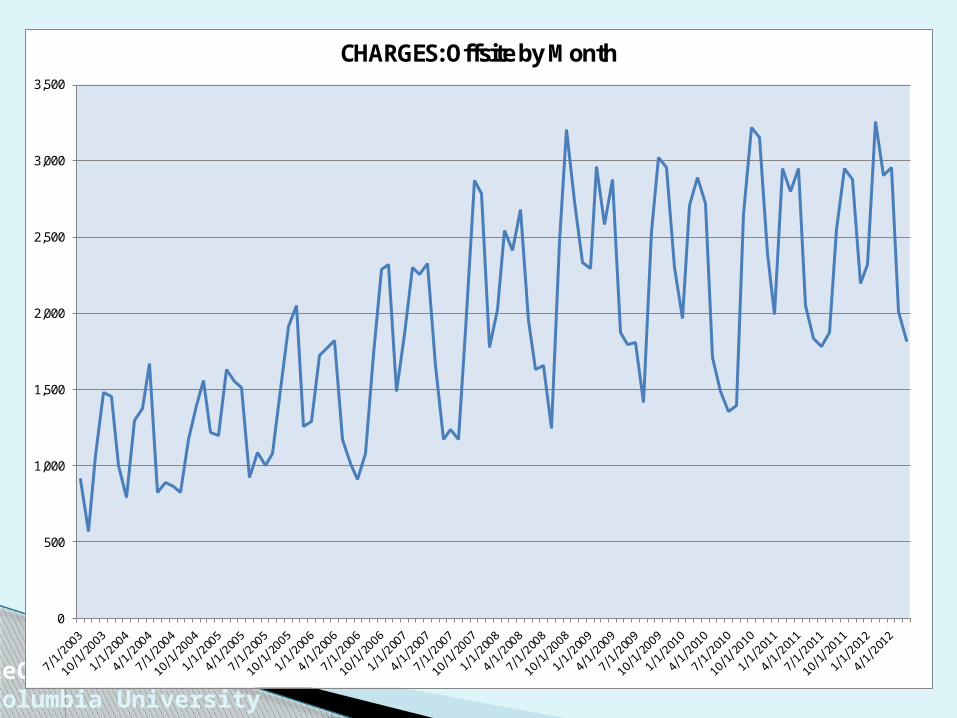
Monthly charges of both onsite and off-site collections are in phase with the academic calendar
Peaks in the middle of Fall and Spring terms The pattern of offsite charges is more
apparent when viewed alone
Monthly Onsite vs. Offsite Charges
ReCAPColumbia University
ReCAPColumbia University
0
10,000
20,000
30,000
40,000
50,000
60,000
70,000
80,000
CHARGES: Offsite vs On Campus by Month
Offsite On Campus
ReCAPColumbia University
0
500
1,000
1,500
2,000
2,500
3,000
3,500
CHARGES: Offsite by Month

On campu and offsite charges can be compared using a ratio
The ratio of offsite to on campus increased from FY04 to FY012
Offsite collections are accounting for proportionally more activity
On Campus vs. Offsite Charges
ReCAPColumbia University

ReCAPColumbia University
2.33%
2.63%
3.34%
4.23%
5.29%
5.97% 5.92%
6.46%
6.79%
0.00%
1.00%
2.00%
3.00%
4.00%
5.00%
6.00%
7.00%
8.00%
FY03/04 FY04/05 FY05/06 FY06/07 FY07/08 FY08/09 FY09/10 FY10/11 FY11/12
CHARGES: Offsite % of Total
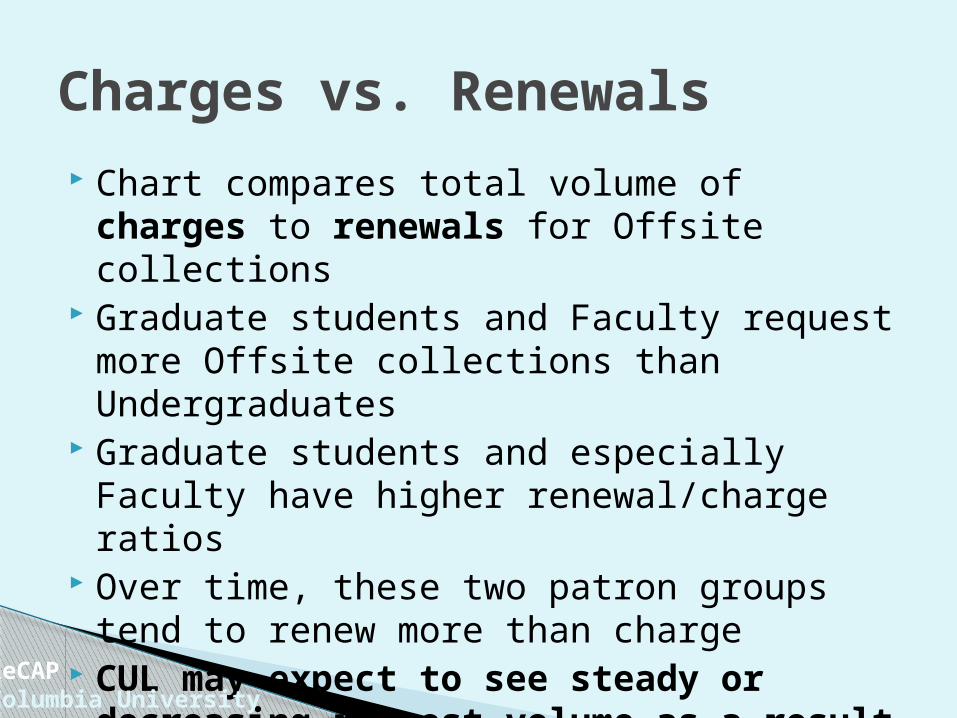
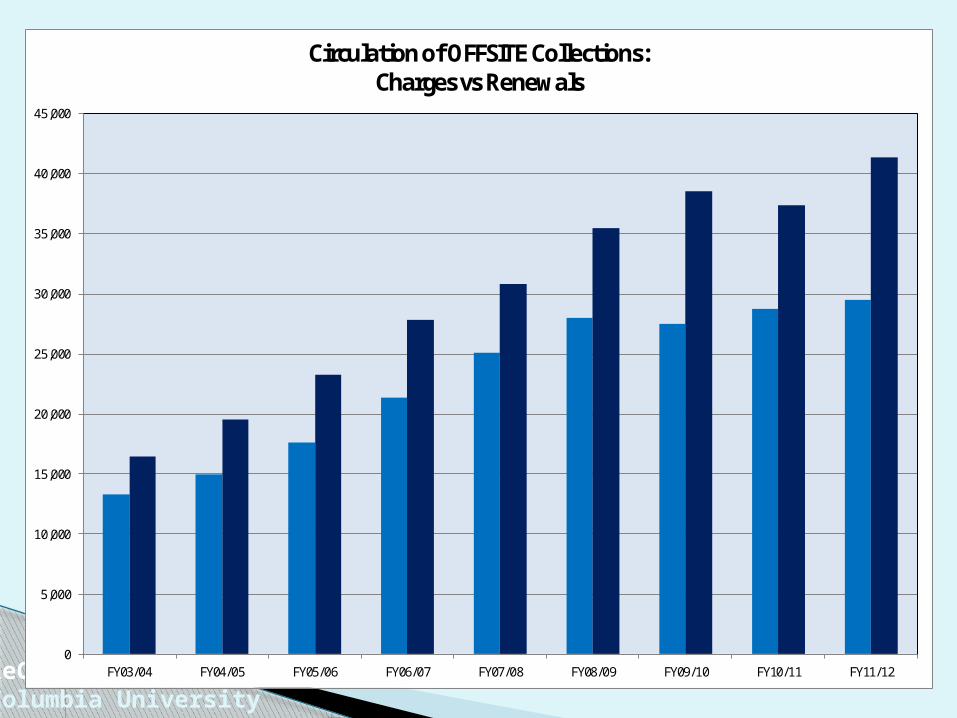
Chart compares total volume of charges to renewals for Offsite collections
Graduate students and Faculty request more Offsite collections than Undergraduates
Graduate students and especially Faculty have higher renewal/charge ratios
Over time, these two patron groups tend to renew more than charge
CUL may expect to see steady or decreasing request volume as a result
Charges vs. Renewals
ReCAPColumbia University
ReCAPColumbia University
0
5,000
10,000
15,000
20,000
25,000
30,000
35,000
40,000
45,000
FY03/04 FY04/05 FY05/06 FY06/07 FY07/08 FY08/09 FY09/10 FY10/11 FY11/12
Circulation of OFFSITE Collections: Charges vs Renewals

ReCAPColumbia University
0
100,000
200,000
300,000
400,000
500,000
600,000
FY03/04 FY04/05 FY05/06 FY06/07 FY07/08 FY08/09 FY09/10 FY10/11 FY11/12
Circulation of ON CAMPUS Collections: Charges vs Renewals
More information about data sets can be found on the ReCAP Data Center website
Primary data categories include: accession, retrieval, delivery and circulation
Tailored data sets and analysis will be provided to staff via the ReCAP Coordinator
Please see the main ReCAP website for general information about CUL procedures and systems
More Data Available
ReCAPColumbia University