cindy seaver six sigma blackbelt and honeywell six sigma plus muskegon site leader
TRANSCRIPT
Cindy Seaver
Six Sigma Blackbelt and Honeywell Six Sigma Plus
Muskegon Site Leader

2
How Six Sigma Relates to Project Management
• Tools for projects• Relates to other
management disciplines• Related tools
– Resource management– Process maps-work
breakdown structure
• 6 changes the culture• Every employee trained• Every project uses 6 tools• Benefits captured &
reported
Similarities Differences
3
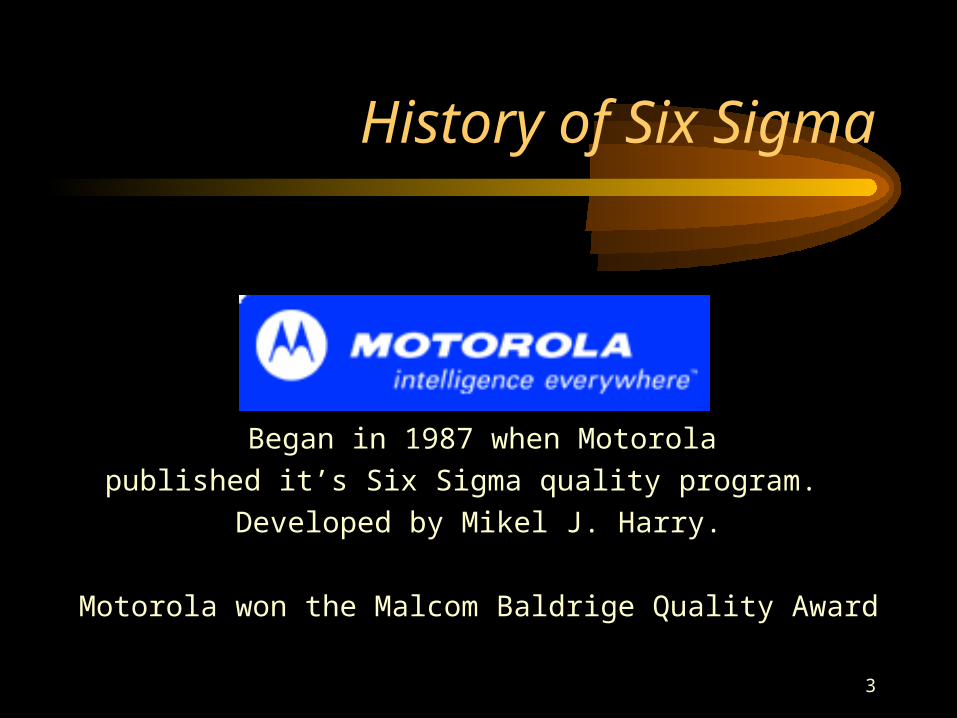
History of Six Sigma
Began in 1987 when Motorola
published it’s Six Sigma quality program.
Developed by Mikel J. Harry.
Motorola won the Malcom Baldrige Quality Award
4
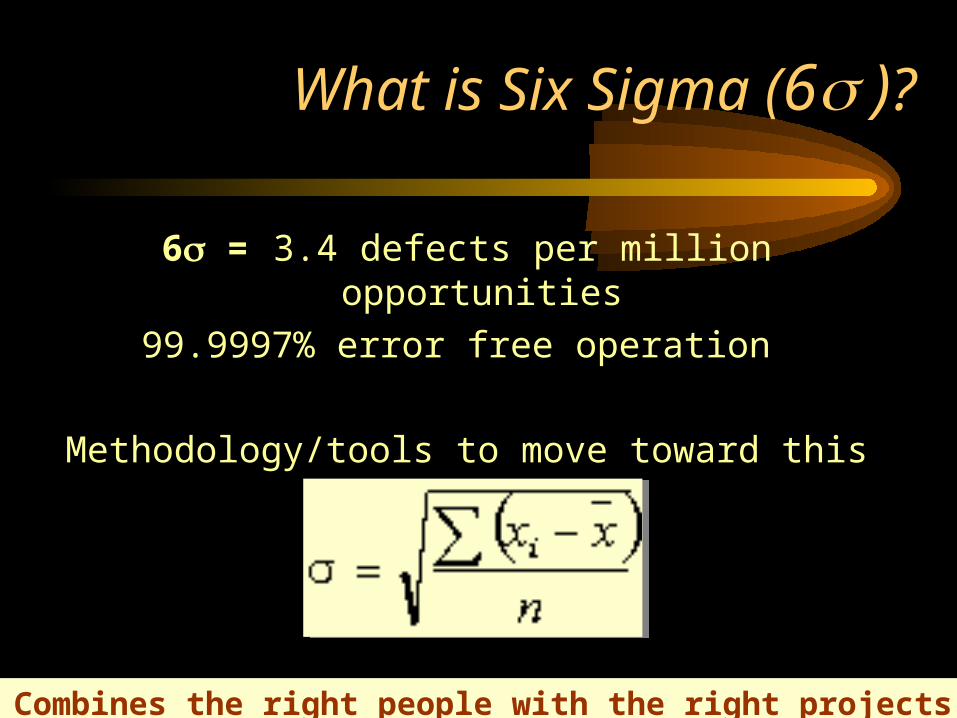
What is Six Sigma (6 )?
6 = 3.4 defects per million opportunities
99.9997% error free operation
Methodology/tools to move toward this target
Combines the right people with the right projects using the right tools

Typical Industrial Company Operates at 4
5 Sigma Results at Shanghai Garrett Plant E-News, January 3, Company-wide News Section -- Achieving a 5 Sigma for any operation is a notable accomplishment. Achieving this high level of performance for an entire plant is an even more impressive feat. That's what occurred at Garrett® Engine Boosting Systems' plant in Shanghai, China, which is performing above a 5 Sigma level by providing customers with the highest level of quality and customer service.
The "5 Sigma" means the plant is maintaining a 99.977% error-free performance -- a defect rate of less than 233 parts per million.
1 690,000
2 308,000
3 66,810
4 6,210
5 233
6 3.4
Statistical Sigma Level
Defects per million
6
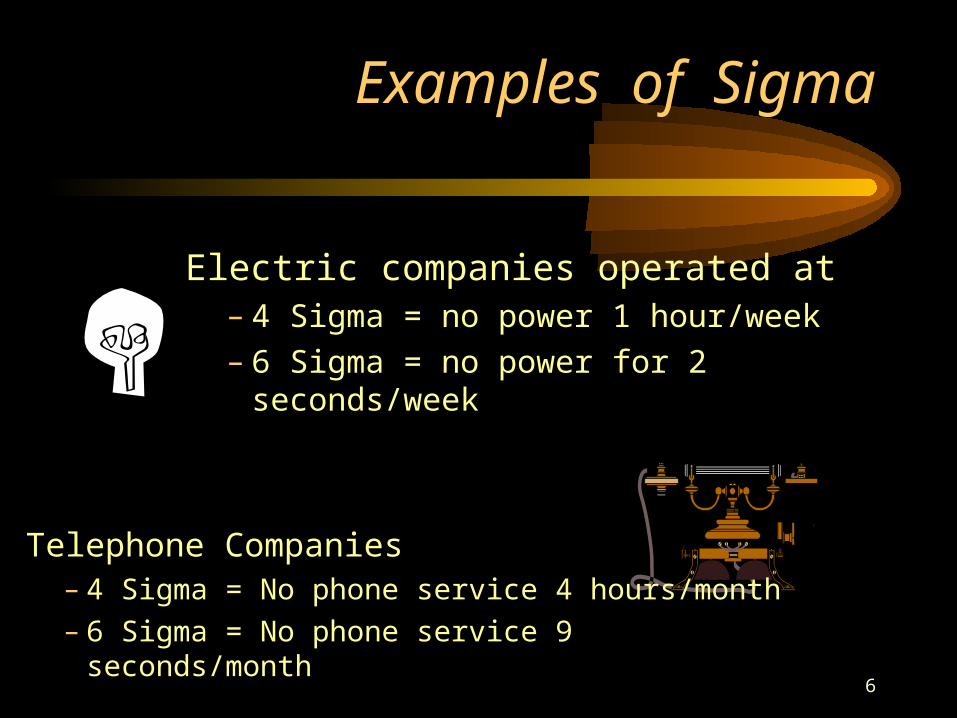
Examples of Sigma
Electric companies operated at – 4 Sigma = no power 1 hour/week– 6 Sigma = no power for 2 seconds/week
Telephone Companies– 4 Sigma = No phone service 4 hours/month– 6 Sigma = No phone service 9 seconds/month
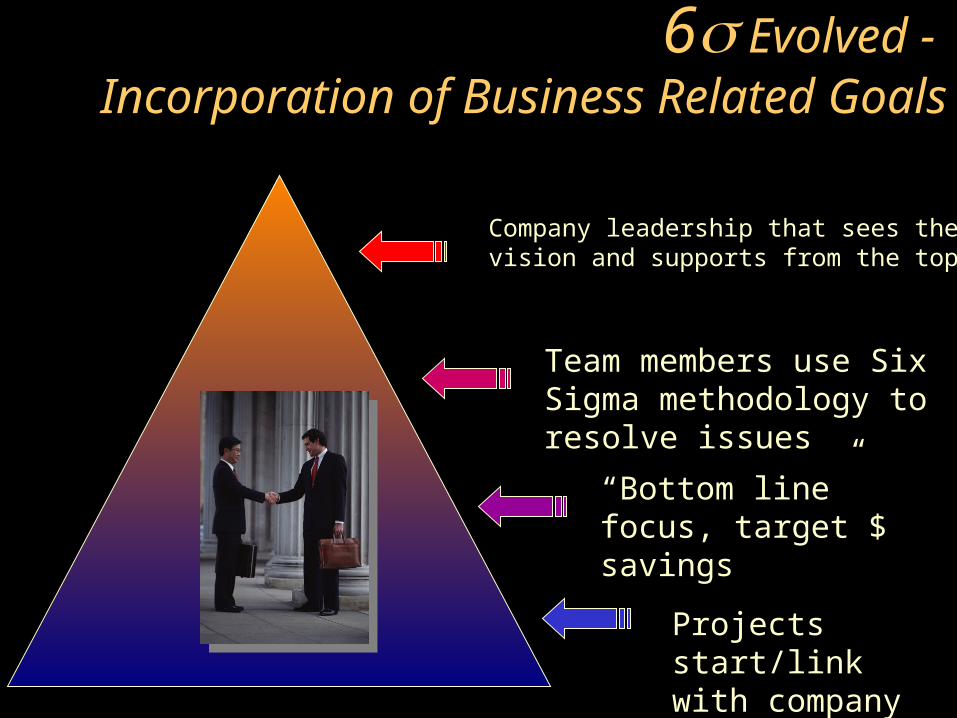
6 Evolved - Incorporation of Business Related Goals
Company leadership that sees the vision and supports from the top
Team members use Six Sigma methodology to resolve issues
“Bottom line” focus, target $ savings
Projects start/link with company goals

8
Improvement strategies for:
• Reducing Variation– Variation is the enemy!
• Reducing Cycle Time– In order to be quicker, we must simplify!
• Reducing Costs– Reducing total life-cycle cost requires improvements
in all processes associated with the product or service!

Key Benefits - Dollar Gains
• New ideas and products that come from Six Sigma effort
• Increased productivity
• Increased sales
• Increased customer loyalty
• 1 in 5 projects at Dupont is creating revenue as well as cost cutting

X
XX
X
XXXX
XXX
Variation- Which Pilot Would You Choose?
Airplane landing’s example
XXX
X
X
XX
X
X
X
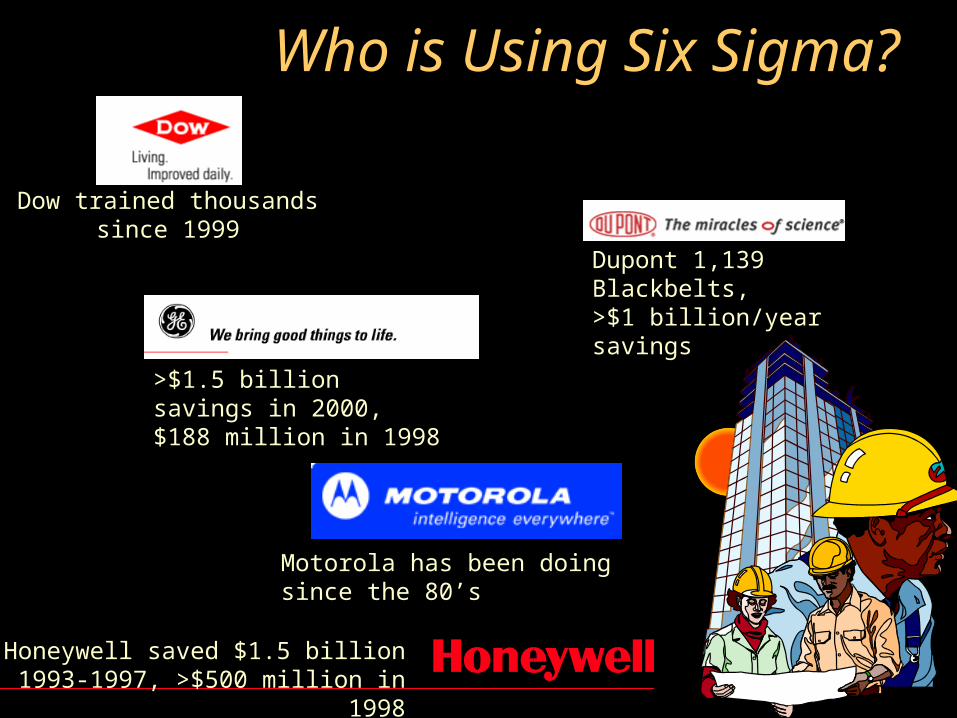
Who is Using Six Sigma?
Dupont 1,139 Blackbelts,>$1 billion/year savings
>$1.5 billion savings in 2000, $188 million in 1998
Honeywell saved $1.5 billion 1993-1997, >$500 million in 1998
Dow trained thousandssince 1999
Motorola has been doing since the 80’s

Wall Street’s Response to Six Sigma
• Companies started touting increases in earnings as results of Six Sigma initiatives
“Companies get more than statistics with Six Sigma”
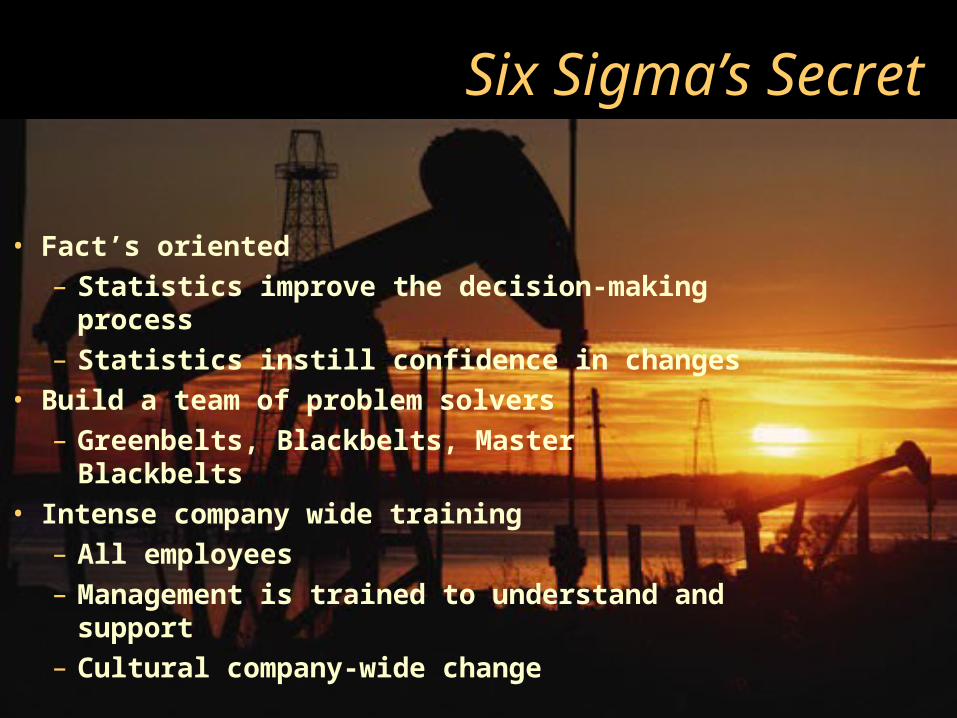
Six Sigma’s Secret
• Fact’s oriented
– Statistics improve the decision-making process
– Statistics instill confidence in changes
• Build a team of problem solvers
– Greenbelts, Blackbelts, Master Blackbelts
• Intense company wide training
– All employees
– Management is trained to understand and support
– Cultural company-wide change
14
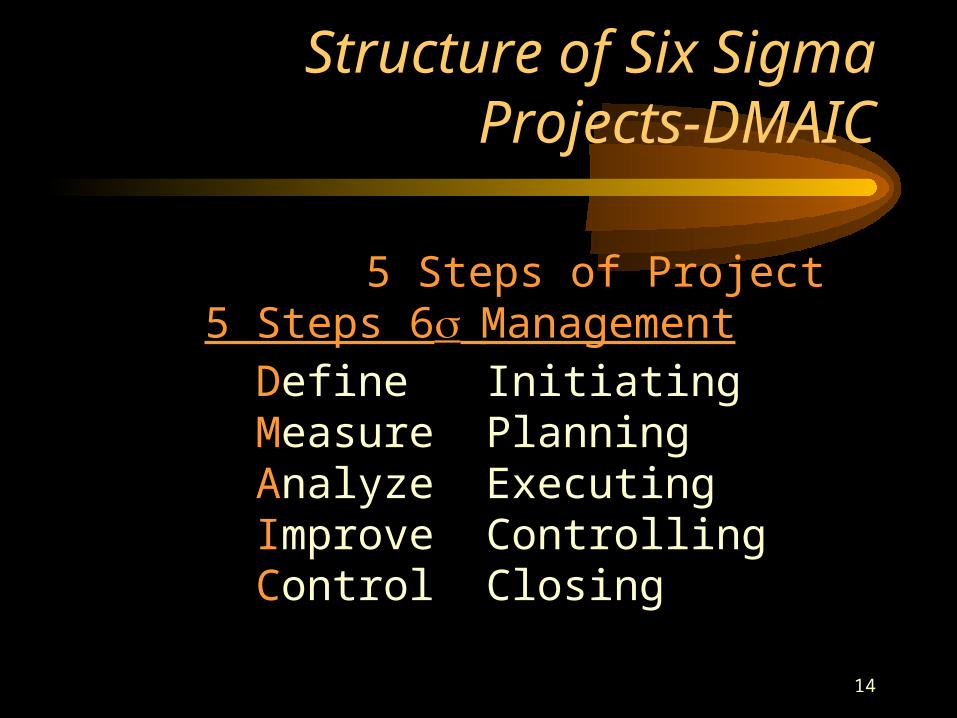
Structure of Six Sigma Projects-DMAIC
DefineMeasureAnalyzeImproveControl
InitiatingPlanningExecutingControllingClosing
5 Steps 6 5 Steps of Project
Management
15
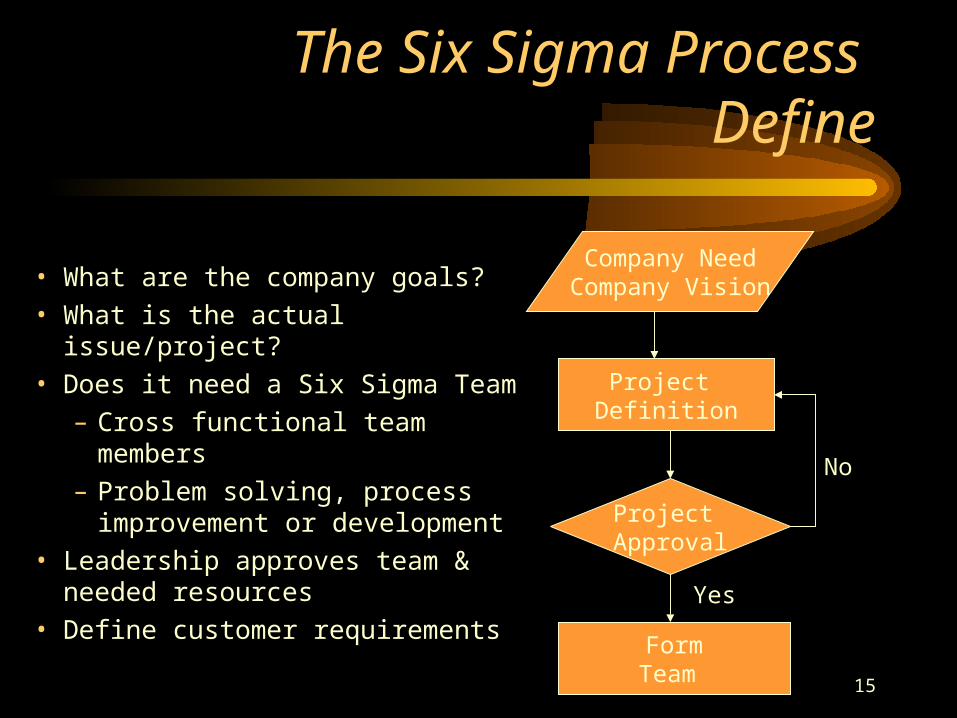
The Six Sigma Process Define
• What are the company goals?
• What is the actual issue/project?
• Does it need a Six Sigma Team
– Cross functional team members
– Problem solving, process improvement or development
• Leadership approves team & needed resources
• Define customer requirements
Company NeedCompany Vision
Project Definition
Project Approval
FormTeam
No
Yes
16
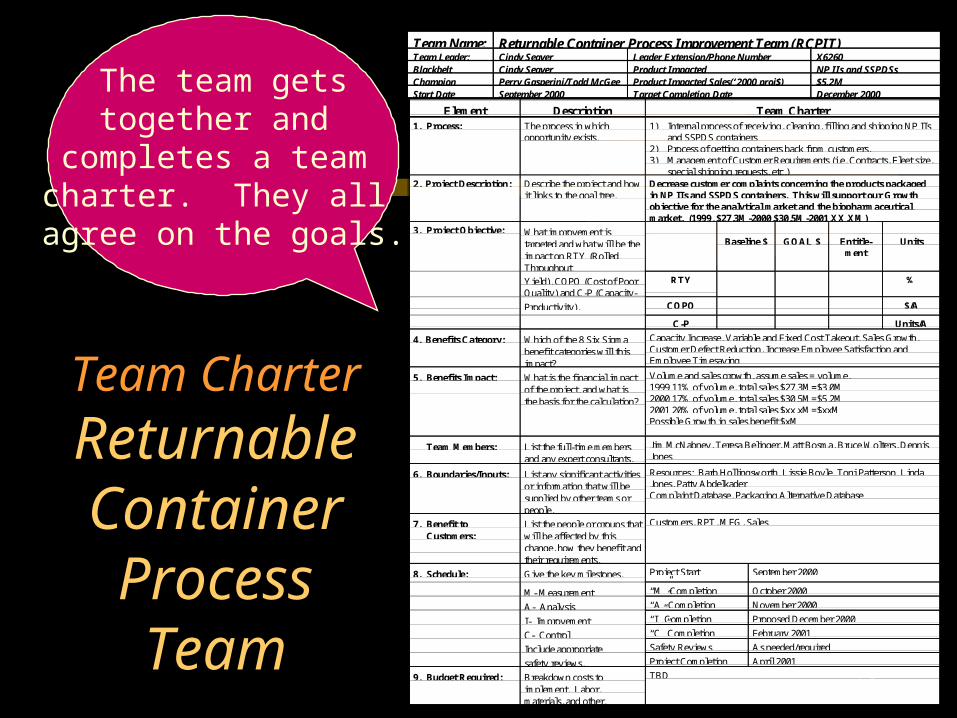
Team Charter
Returnable Container Process Team
Six Sigma Project Team Charter
Team Name: Returnable Container Process Improvement Team (RCPIT)Team Leader: Cindy Seaver Leader Extension/Phone Number X6260Blackbelt Cindy Seaver Product Impacted NP IIs and SSPDSsChampion Perry Gasperini/Todd McGee Product Impacted Sales(‘2000 proj$) $5.2MStart Date September 2000 Target Completion Date December 2000
Element Description Team Charter1. Process: The process in which
opportunity exists.1) Internal process of receiving, cleaning, filling and shipping NP IIs
and SSPDS containers2) Process of getting containers back from customers.3) Management of Customer Requirements (i.e. Contracts, Fleet size,
special shipping requests, etc.)2. Project Description: Describe the project and how
it links to the goal tree.Decrease customer complaints concerning the products packagedin NP IIs and SSPDS containers. This will support our Growthobjective for the analytical market and the biopharmaceuticalmarket. (1999, $27.3M-2000,$30.5M-2001,XX.XM)
3. Project Objective: What improvement istargeted and what will be theimpact on RTY (RolledThroughput
Baseline $ GOAL $ Entitle-ment
Units
Yield), COPQ (Cost of PoorQuality) and C-P (Capacity-
RTY %
Productivity). COPQ $/A
C-P Units/A
4. Benefits Category: Which of the 8 Six Sigmabenefit categories will thisimpact?
Capacity Increase, Variable and Fixed Cost Takeout, Sales Growth,Customer Defect Reduction, Increase Employee Satisfaction andEmployee Timesaving
5. Benefits Impact: What is the financial impactof the project, and what isthe basis for the calculation?
Volume and sales growth, assume sales = volume,1999 11% of volume, total sales $27.3M=$3.0M2000 17% of volume, total sales $30.5M=$5.2M2001 20% of volume, total sales $xx.xM=$xxMPossible Growth in sales benefit $xM
Team Members: List the full-time membersand any expert consultants.
Jim McNabney, Teresa Belinger, Matt Bosma, Bruce Wolters, DennisJones
6. Boundaries/Inputs: List any significant activitiesor information that will besupplied by other teams orpeople.
Resources: Barb Hollingsworth, Lissie Boyle, Toni Patterson, LindaJones, Patty AbdelkaderComplaint Database, Packaging Alternative Database
7. Benefit toCustomers:
List the people or groups thatwill be affected by thischange, how they benefit andtheir requirements.
Customers, RPT, MFG, Sales
8. Schedule: Give the key milestones. Project Start September 2000
M- Measurement “M” Completion October 2000
A- Analysis “A” Completion November 2000
I- Improvement “I” Completion Proposed December 2000
C- Control “C” Completion February 2001
Include appropriate Safety Reviews As needed/required
safety reviews. Project Completion April 2001
9. Budget Required: Breakdown costs toimplement. Labor,materials, and other.
TBD
The team getstogether and
completes a team charter. They all agree on the goals.
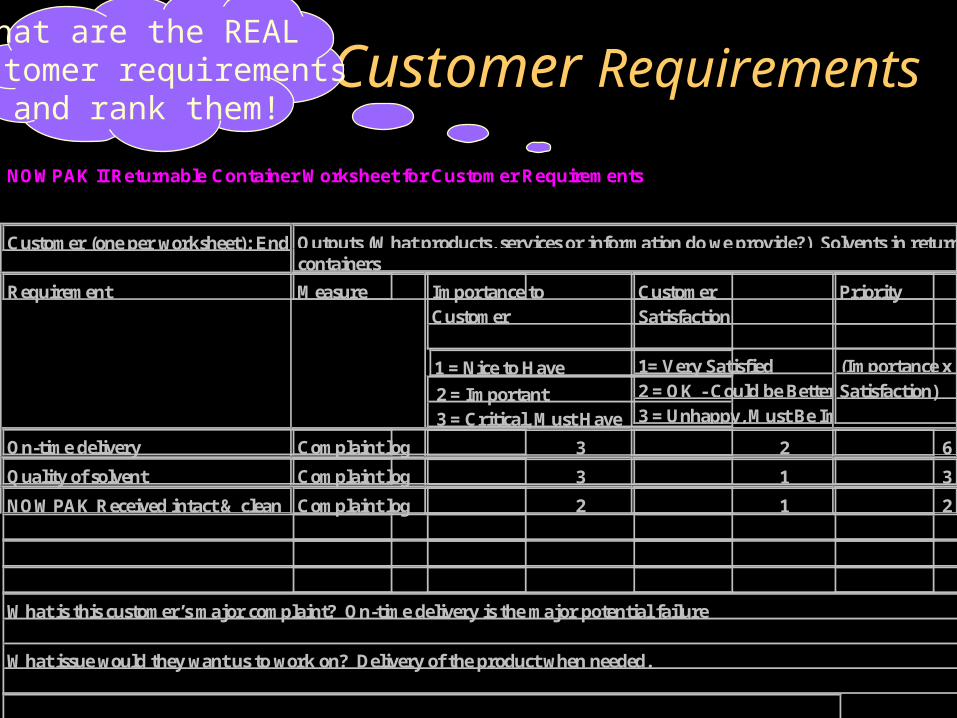
NOWPAK II Returnable Container Worksheet for Customer RequirementsOctober 2000
Customer (one per worksheet): End-userOutputs (What products, services or information do we provide?) Solvents in returnablecontainers
Requirement Measure Importance toCustomer
1 = Nice to Have
2 = Important 3 = Critical, Must Have
CustomerSatisfaction
1= Very Satisfied2 = OK - Could be Better3 = Unhappy, Must Be Improved
Priority
(Importance xSatisfaction)
On-time delivery Complaint log 3 2 6
Quality of solvent Complaint log 3 1 3
NOWPAK Received intact & clean Complaint log 2 1 2
What is this customer’s major complaint? On-time delivery is the major potential failure
What issue would they want us to work on? Delivery of the product when needed.
Customer RequirementsWhat are the REAL
customer requirementsand rank them!

18
The Six Sigma ProcessMeasure
• Identify “key” characteristics that can be measured
• Collect/review statistically
• Develop detailed process map
• Use other tools
– ie. Cause & Effects Diagram
– Gage R&R
– Process Capability
– Benchmarking
MeasurementPhase
Need moreData?
AnalyzeData
Collect data
Yes
No
Yes
Collectexisting data Run DOE’s
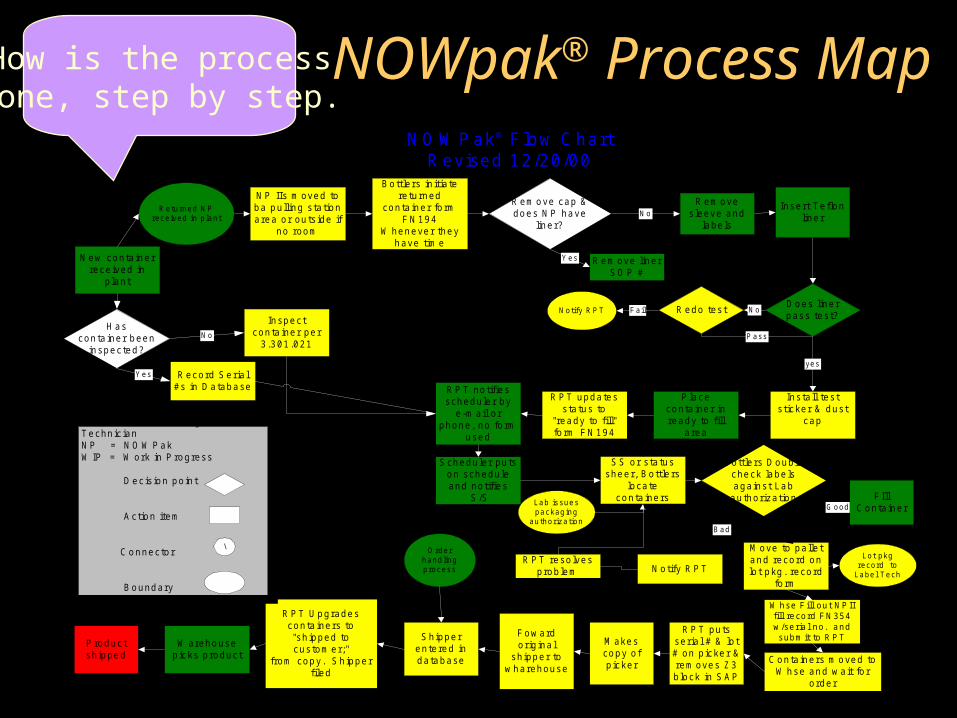
NOWpak® Process MapN O W Pak® Flow C hart
R evised 12/20/00
R eturned N Prece ived in p lant
B ottle rs in itia tere tu rned
con ta ine r fo rmF N 194
W heneve r theyhave tim e
R em ove cap &does N P have
line r?
R em ove line rS O P #
R em oves leeve and
labe ls
Inse rt T e flonline r
D oes line rpass tes t?
R edo tes tN otify R P T
Ins ta ll tes ts ticke r & dus t
cap
P lacecon ta ine r inready to fill
a rea
R P T upda tess ta tus to
"ready to fill"fo rm F N 194
R P T no tifiesschedu le r by
e -m a il o rphone , no fo rm
used
S chedu le r pu tson schedu leand no tifies
S /S
S S o r s ta tusshee r, B o ttle rs
loca tecon ta ine rs
N ew con ta ine rrece ived in
p lan t
H ascon ta ine r been
inspec ted?
Inspec tcon ta ine r pe r
3 .301 .021
Lab issuespackag ing
authorization
B ottle rs D oub lecheck labe lsaga ins t Lab
au tho riza tion
N o tify R P TR P T reso lves
p rob lem
B ad
M ove to pa lle tand reco rd onlo t pkg . reco rd
fo rm
W hse F ill ou t N P IIfill reco rd F N 354w /se ria l no . and
subm it to R P TR P T pu ts
se ria l # & lo t# on p icke r &rem oves Z 3b lock in S A P
Lot pkgrecord to
Labe l Tech
C on ta ine rs m oved toW hse and w a it fo r
o rde r
R P T U pgradescon ta ine rs to"sh ipped tocus tom er;"
from copy . S h ippe rfiled
W arehousep icks p roduc t
P roduc tsh ipped
N o
Y es
yes
N oFail
G ood
Y es
N o P ass
O rderhand lingprocess
KEYR P T = R e tu rn P ackageT echn ic ianN P = N O W P akW IP = W ork in P rog ress
D ec is ion po in t
A c tion item
C onnec to r
B oundary
\
F IllC on ta ine r
R eco rd S e ria l#s in D a tabase
F ow ardo rig ina l
sh ippe r tow ha rehouse
M akescopy o fp icke r
S h ippe ren te red inda tabase
N P IIs m oved toba pu lling s ta tiona rea o r ou ts ide if
no room
How is the processdone, step by step.

Cause & Effect Diagram
Rating of Importance to Customer
6 3 2
1 3 4 6 7 8 9 10 11 12 13 14 15
Returnable Container NP II Process
On-
time
deliv
ery
Sol
vent
Qua
lity
Inta
ct a
nd
clea
n
Total
Process Step Process Input
1 Container Received Delivery by shipping co. 4 1 1 292 Warehouse personnel 4 1 1 293 Paperwork (FN194) 4 1 1 294 Chemical Package operator 10 1 4 715 warehouse 3 1 1 1 116 NP Liner removal NP liner removal equip 7 1 1 477 Chemical Package operator 10 1 4 718 09 Container preparation Remove sleeve & labels 1 1 4 1710 Chemical Package operator 10 1 4 7111 012 Liner insertion new liner 4 7 1 4713 New sleeves & dust caps 1 1 1 1114 personnel 7 1 4 5315 Inflation fixture 4 1 1 2916 test sticker 1 1 1 1117 Ready to fill fill area 1 1 1 1118 Personnel available 10 1 1 6519 FN194 4 1 1 2920 Schedular Scheduler 7 1 1 47
Schedule 10 1 1 65Container fill Chemical Package operator 7 1 4 53
lab authorization 4 7 1 47Spiquot 1 1 1 11WIP form 1 1 1 11Fill record-accurate 10 1 1 65Container available 10 1 1 65Solvent available from prod. 10 7 1 83Scale for weighing-filling 10 1 1 65cart for moving NPs 7 1 1 47
Ship container RPT 7 1 1 47full container/wlabel 7 1 4 53Shipper 4 1 1 29database 4 1 1 29Warehouse personnel 7 1 1 47ship truck 4 1 4 35
00
Total 540
72 66 0 0 0 0 0 0 0 0 0 0 0 0
Lower Spec
Target
Upper Spec
NOWPAK II Returnable Container Cause and Effect Matrix 10/2000
Steps taken from Process Map and rated as
importance to customer requirements
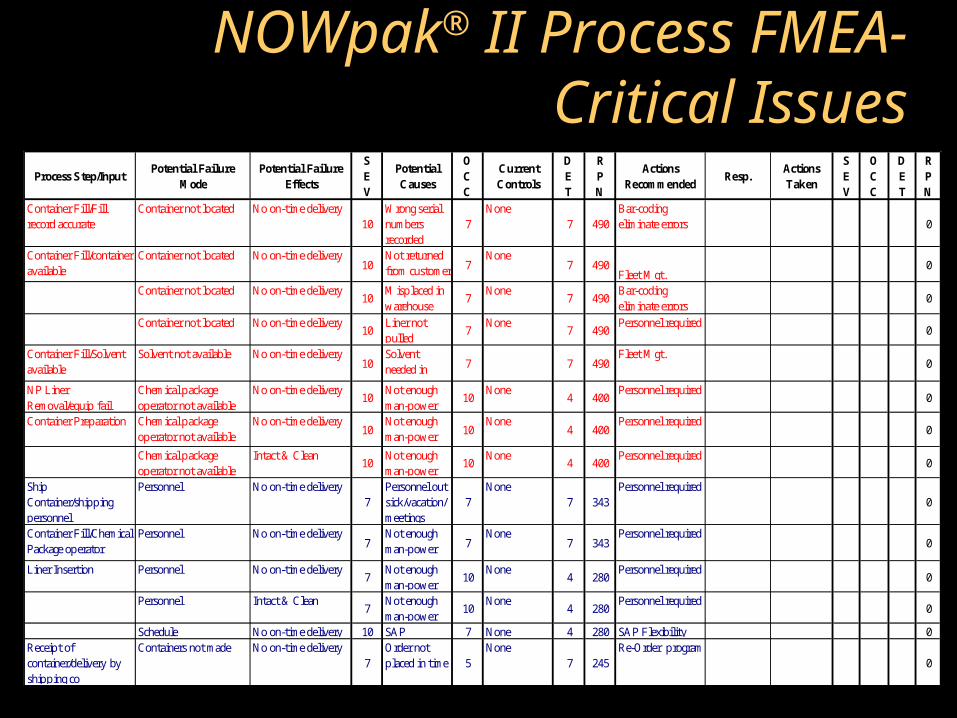
NOWpak® II Process FMEA-Critical Issues
Process Step/InputPotential Failure
ModePotential Failure
Effects
SEV
Potential Causes
OCC
Current Controls
DET
RPN
Actions Recommended
Resp.Actions Taken
SEV
OCC
DET
RPN
Container Fill/Fill record accurate
Container not located No on-time delivery10
Wrong serial numbers recorded
7None
7 490Bar-coding eliminate errors 0
Container Fill/container available
Container not located No on-time delivery10
Not returned from customer 7
None7 490
Fleet Mgt.0
Container not located No on-time delivery10
Misplaced in warehouse
7None
7 490Bar-coding eliminate errors
0
Container not located No on-time delivery10
Liner not pulled
7None
7 490Personnel required
0
Container Fill/Solvent available
Solvent not available No on-time delivery10
Solvent needed in other
7 7 490Fleet Mgt.
0
NP Liner Removal/equip fail
Chemical package operator not available
No on-time delivery10
Not enough man-power
10None
4 400Personnel required
0
Container Preparation Chemical package operator not available
No on-time delivery10
Not enough man-power
10None
4 400Personnel required
0
Chemical package operator not available
Intact & Clean10
Not enough man-power
10None
4 400Personnel required
0
Ship Container/shipping personnel
Personnel No on-time delivery7
Personnel out sick/vacation/ meetings
7None
7 343Personnel required
0
Container Fill/Chemical Package operator
Personnel No on-time delivery7
Not enough man-power 7
None7 343
Personnel required0
Liner Insertion Personnel No on-time delivery7
Not enough man-power
10None
4 280Personnel required
0
Personnel Intact & Clean7
Not enough man-power
10None
4 280Personnel required
0
Schedule No on-time delivery 10 SAP 7 None 4 280 SAP Flexibility 0Receipt of container/delivery by shipping co
Containers not made No on-time delivery7
Order not placed in time 5
None7 245
Re-Order program 0

22
The Six Sigma ProcessAnalyze
• Understand the root cause driving defects (why-why-why-why-why)
• Brainstorm
• Use tools
– FMEA
– reduce process waste
– eliminate scrap
– eliminate rework
• Prioritize & Plan Proposed Solutions
AnalysisPhase
Statistically analyze data
Review dataand draw
conclusions
Brainstorm andpropose solutions
23
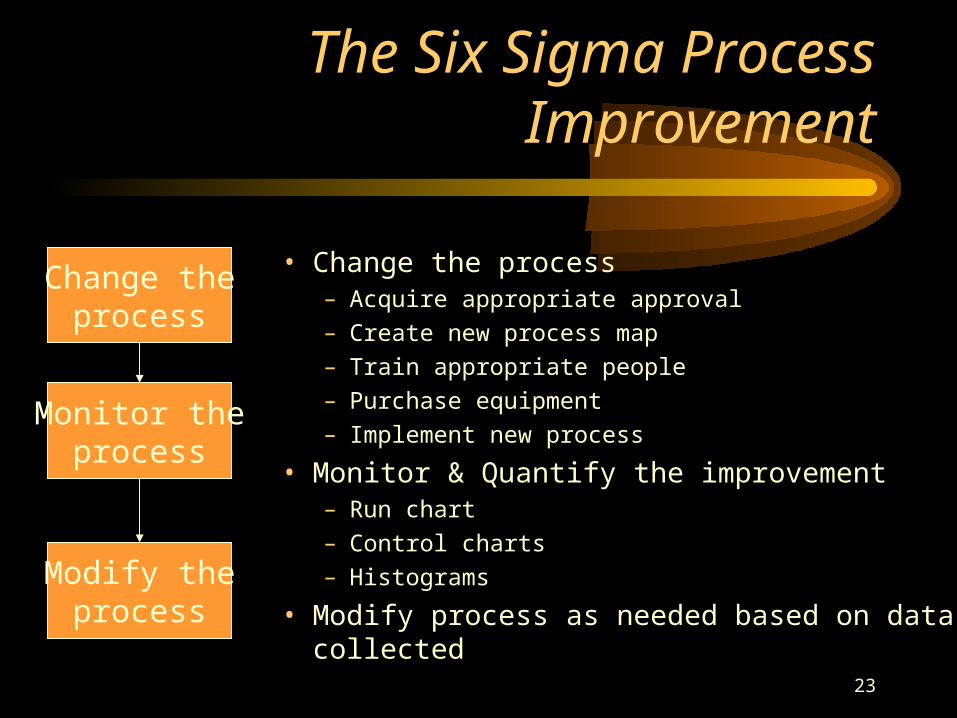
The Six Sigma ProcessImprovement
• Change the process – Acquire appropriate approval– Create new process map– Train appropriate people– Purchase equipment– Implement new process
• Monitor & Quantify the improvement– Run chart– Control charts– Histograms
• Modify process as needed based on data collected
Change theprocess
Monitor theprocess
Modify theprocess

24
Equipment Improvements
Short Term
• Install bar coding equipment ASAP, priority project
• Purchase scale and cart for NPII filling process
• Storage area designated for NPIIs
• Install dual manifold for filling
Long Term
• Dedicated NOWpak® filling room with appropriate conveyors for moving containers safely and in a “flow”
• Filling by weight is timely, develop better/faster ways to fill containers
NOWpak® Improvement Recommendations
25
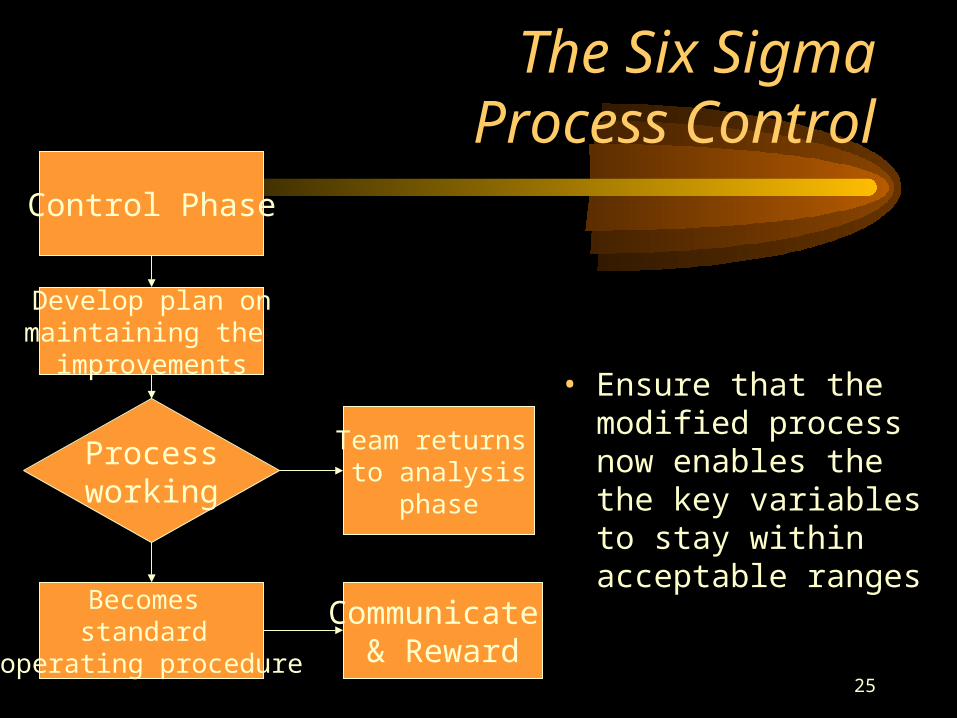
The Six Sigma Process Control
• Ensure that the modified process now enables the the key variables to stay within acceptable ranges
Control Phase
Develop plan onmaintaining the improvements
Becomes standard
operating procedure
Processworking
Communicate & Reward
Team returns to analysis
phase
26
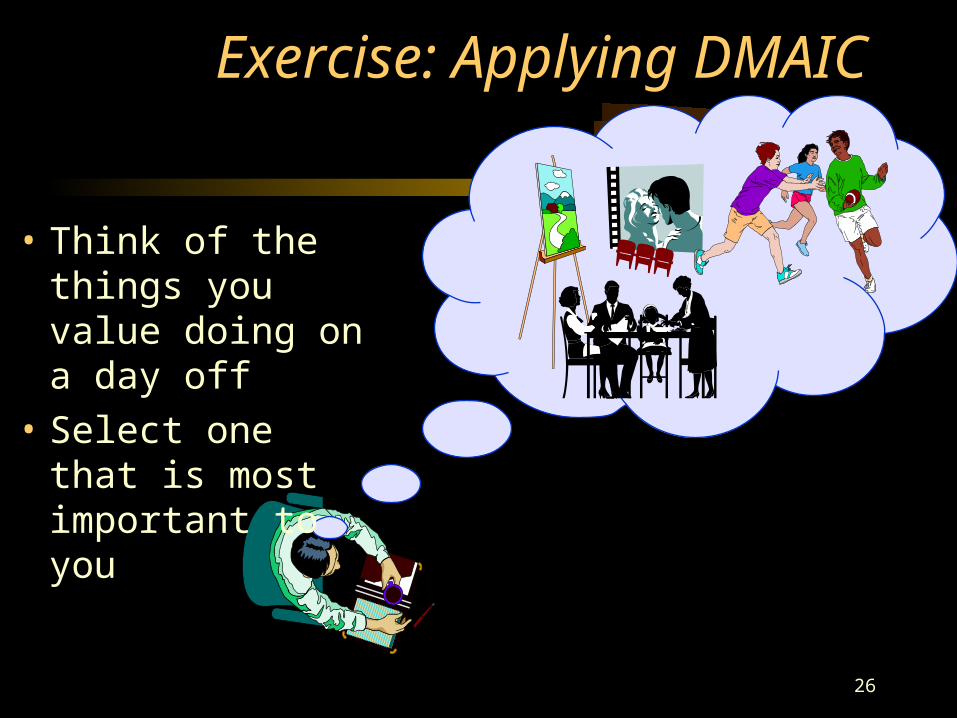
Exercise: Applying DMAIC
• Think of the things you value doing on a day off
• Select one that is most important to you

Example: Achieving What’s Important
Stage Our ActivitiesDefine…what's important
Measure…how we're doing
Analyze…what's wrong
Improve…by fixing what's wrong
Control …to guarantee performance
USING THE PROCESS IMPROVEMENT MODEL
28
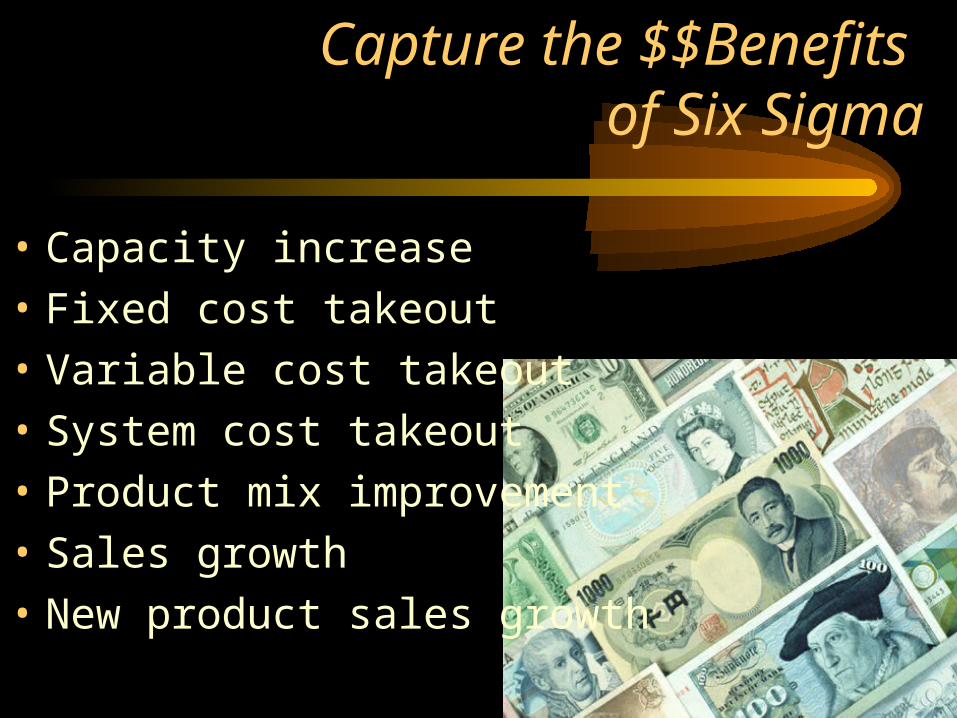
Capture the $$Benefits of Six Sigma
• Capacity increase
• Fixed cost takeout
• Variable cost takeout
• System cost takeout
• Product mix improvement
• Sales growth
• New product sales growth

29
Six Sigma Throughout An Organization
• Manufacturing & Engineering
• Maintenance
• Administration & Support
• Technology
• Planning & Design
• Sales & Marketing

What it takes to be a Six Sigma Organization
• Not a spectator sport
• Leadership commitment
• Cultural Change
• Customer Focus & Driven

31
Levels of Training
• Introduction - 2 days, terms and tools
• Fundamentals - 3 days, how to use tools
• Greenbelts - 3 days, leaders of projects
• Blackbelts - 4 weeks, site expert & trainer
• Master Blackbelts - 8-12 weeks +, mentor & teach

32
Six Sigma Intangibles
• Cross functional teams
• Document actual processes
• Use project data for training
• Find & utilize talent throughout the organization
One focus throughout the
entire organization
33
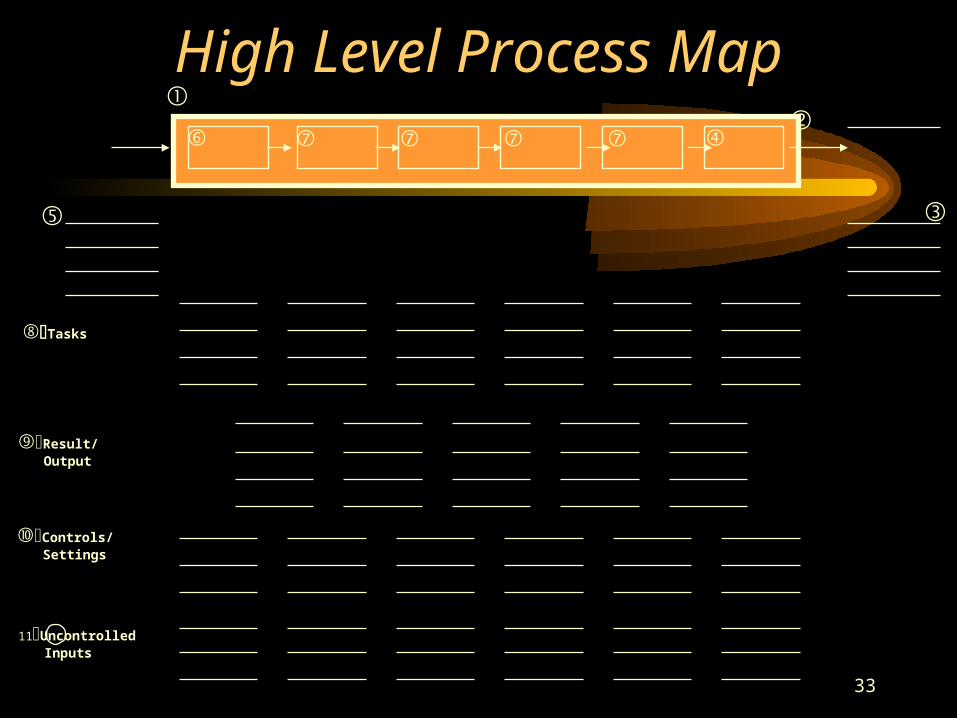
High Level Process Map
Result/Output
Controls/Settings
Tasks
11UncontrolledInputs
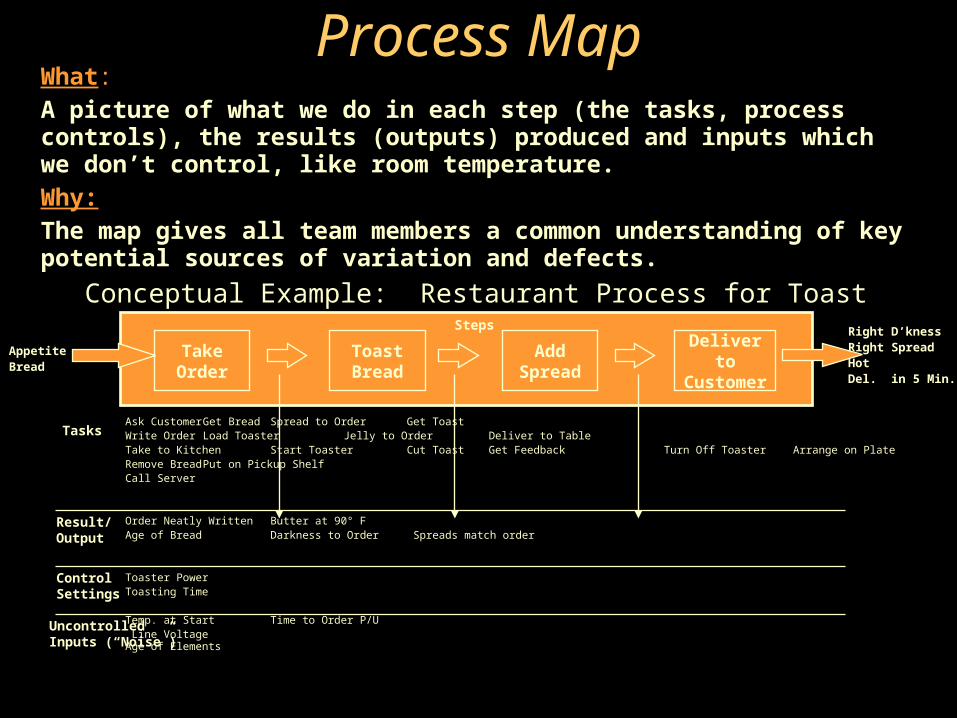
Process Map
Ask Customer Get Bread Spread to Order Get ToastWrite Order Load Toaster Jelly to Order Deliver to TableTake to Kitchen Start Toaster Cut Toast Get Feedback Turn Off Toaster Arrange on Plate
Remove Bread Put on Pickup ShelfCall Server
Order Neatly Written Butter at 90° F Age of Bread Darkness to Order Spreads match order
Toaster PowerToasting Time
Temp. at Start Time to Order P/U Line Voltage Age of Elements
Take Order
Toast Bread
Add Spread
Deliver to Customer
Steps
Result/Output
ControlSettings
UncontrolledInputs (“Noise”)
Tasks
What:A picture of what we do in each step (the tasks, process controls), the results (outputs) produced and inputs which we don’t control, like room temperature.Why:The map gives all team members a common understanding of key potential sources of variation and defects.
Right D’knessRight SpreadHotDel. in 5 Min.
AppetiteBread
Conceptual Example: Restaurant Process for Toast
35
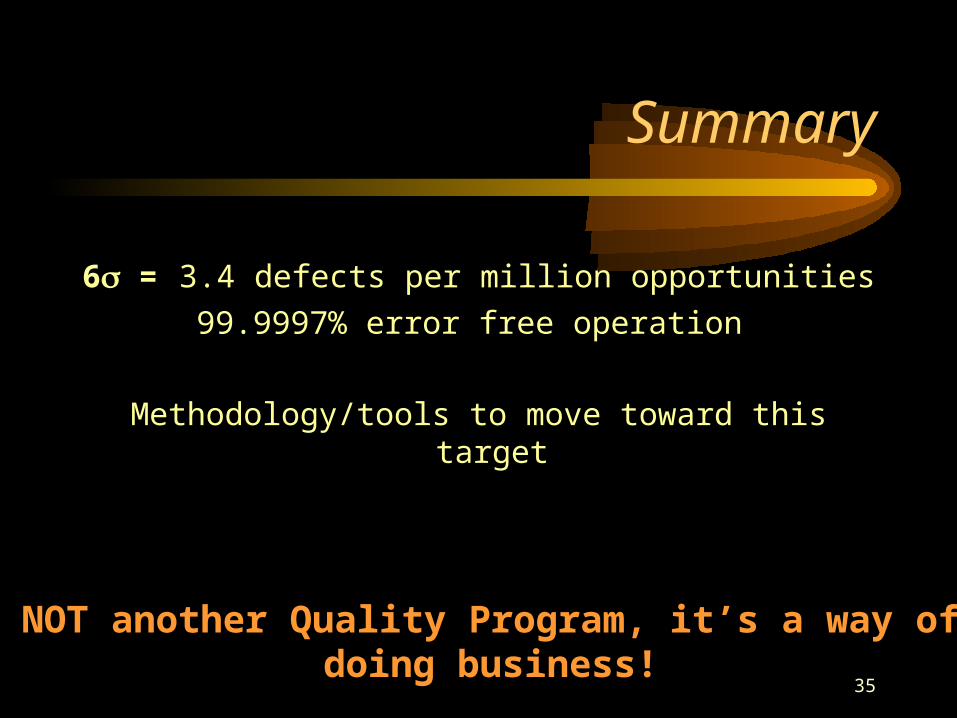
Summary
6 = 3.4 defects per million opportunities
99.9997% error free operation
Methodology/tools to move toward this target
NOT another Quality Program, it’s a way of doing business!