cim_medc@ij_062914_135625
DESCRIPTION
CIM_MEDC@IJ_062914_135625TRANSCRIPT

Oil & Gas Exp & Prodn│Indonesia
June 29, 2014
The CIMB Stock Selection Tools (SST) are designed to complement and enhance the investment decision making process. The SST incorporate a range of analytical tools, providing ready access to key company and market data, valuation tools and charts. If you are interested in subscribing to the 'Stock Selection Tools', please contact your CIMB account manag er.
IMPORTANT DISCLOSURES, INCLUDING ANY REQUIRED RESEARCH CERTIFICATIONS, ARE PROVIDED AT THE END OF THIS REPORT. Designed by Eight, Powered by EFA
Unleashing the gas potentials We initiate MEDC with an Add rating, underpinned by the company’s improving growth outlook, on the back of earnings contributions from the Senoro gas block, and further potential upside from promising key assets like Block A gas and Libya oil. Its current EV/2P of US$5/bbl (at a steep discount to regional E&P peers) implies that the market has yet to factor in MEDC’s strong potential for asset monetisation.
We project a solid 107% EPS growth in 2015 and 24% in 2016, as we forecast contributions from the Senoro gas to start. Our target price is based on DCF (WACC: 7.8% and 5% LT growth). The completion of the Senoro project, and positive news from the Block A gas development should act as catalysts.
Gas-fuelled growth MEDC is refocusing its strategy on the upstream business, having completed the divestments of a few downstream assets in 2013. We forecast a strong jump in MEDC‟s gas production (hence, earnings) in 2015, driven by the contribution from the Senoro block (reserve of 1.96tcf) by 2Q15. Having completed its long-delayed gas sales agreement (GSA) in 2009, Senoro‟s upstream and downstream LNG projects are currently at more than 80% and 98% completion, translating into a low execution risk, in our view. Senoro gas‟ selling price is linked to oil price, which at US$100/bbl crude translates to a favorable US$9.1/ mmBTU price.
Track record and pipelines Having entered the E&P business in 1992, MEDC‟s track record was cemented through the acquisition of its key assets in Sumatra and subsequent years of oil production growth. After recent years‟ successful effort to arrest declining oil production, typical of Indonesia‟s maturing oil fields, MEDC‟s production outlook will turn around in 2015. Key assets to potentially sustain the growth momentum are the Block A gas (which has signed GSA in 2007) and Area-47 oil block in Libya (ample 352 mmboe gross 2P reserve).
Positive industry outlook We expect the new government to implement the long-awaited reforms in Indonesia‟s energy sector. The development of gas infrastructure is likely to be one of the government‟s top priorities which will drive the monetisation of the country‟s gas assets. There is also room for further domestic gas price hikes, given the huge gap between local and international diesel and LNG prices.
Medco Energi Internasional COMPANY NOTE
MEDC IJ / MEDC.JK Current Rp3,460
Market Cap Avg Daily Turnover Free Float Target Rp4,330
US$961.3m US$0.39m 49.3% Prev. Target N/A
Rp11,530,282m Rp4,517m 0.10 m shares Up/Downside 25.1% Conviction| |
Sources: CIMB. COMPANY REPORTS
Notes from the Field
————————————————————————————————————————
Erindra KRISNAWAN, CFA T (62) 21 3006 1732 E [email protected]
Maureen NATASHA T (62) 21 3006 1726 E [email protected]
Company Visit Expert Opinion
Channel Check Customer Views
————————————————————————————————————————
Show Style "View Doc Map"
‘‘‘‘ I would best describe the state of Medco Energi’s business today and the near-future with the remarks: ‘gas, gas, oil and more oil’…”
– Hilmi Panigoro, President Commisioner
89
117
145
173
201
229
1,400
1,900
2,400
2,900
3,400
3,900
Price Close Relative to JCI (RHS)
Source: Bloomberg
10
20
30
Jul-13 Oct-13 Jan-14 Apr-14
Vol m
Financial Summary
Dec-12A Dec-13A Dec-14F Dec-15F Dec-16F
Revenue (US$m) 909 889 803 940 1,046
Operating EBITDA (US$m) 341.5 349.1 370.8 474.8 556.3
Net Profit (US$m) 24.7 12.6 41.2 83.4 102.7
Core EPS (US$) 0.009 0.011 0.012 0.024 0.030
Core EPS Growth (48%) 24% 7% 107% 24%
FD Core P/E (x) 33.26 26.72 24.98 12.08 9.72
DPS (US$) 0.007 0.002 0.002 0.005 0.010
Dividend Yield 2.34% 0.77% 0.52% 1.72% 3.47%
EV/EBITDA (x) 5.26 4.99 4.57 3.71 3.24
P/FCFE (x) NA NA NA 29.92 21.22
Net Gearing 98.0% 85.6% 76.7% 77.7% 75.5%
P/BV (x) 1.15 1.09 1.04 0.97 0.91
ROE 3.44% 4.18% 4.26% 8.34% 9.67%
% Change In Core EPS Estimates
CIMB/consensus EPS (x) 2.06 0.96 1.19
3,460
4,330
1,610 3,480
Target
52-week share price range
Current
SOURCE: CIMB, COMPANY REPORTS
Medco Energi Internasional
June 29, 2014
2
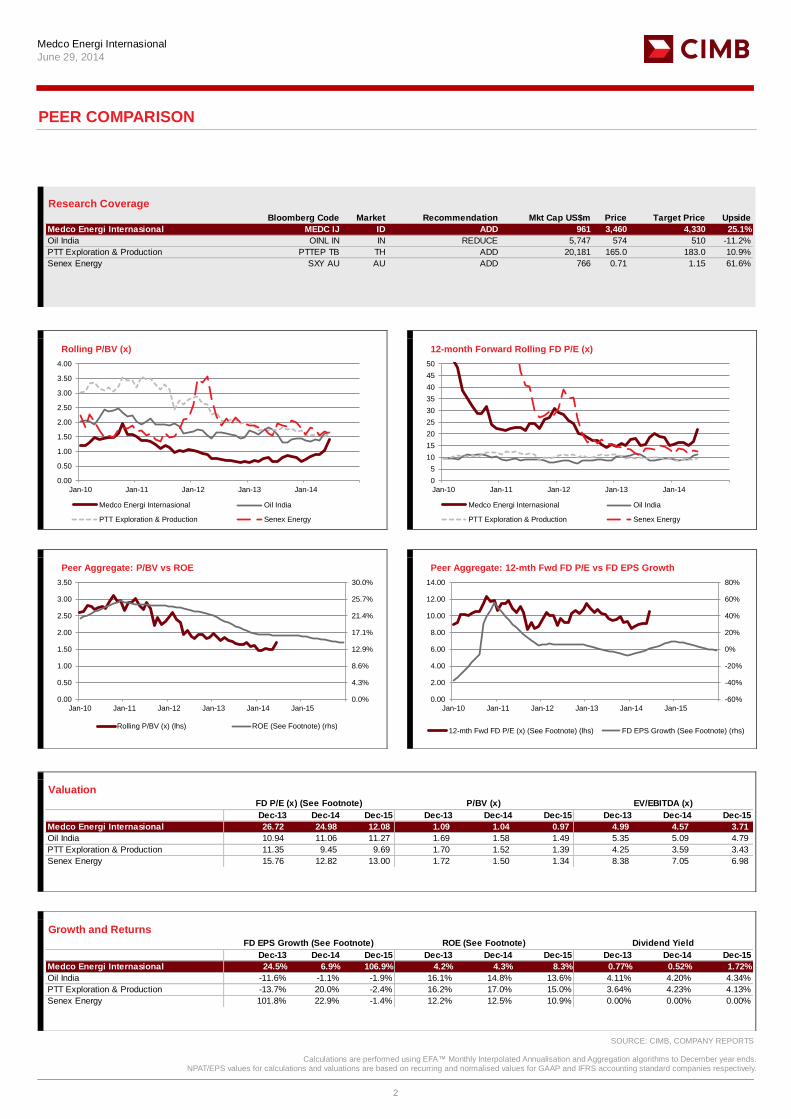
PEER COMPARISON
Research Coverage
Bloomberg Code Market Recommendation Mkt Cap US$m Price Target Price Upside
Medco Energi Internasional MEDC IJ ID ADD 961 3,460 4,330 25.1%
Oil India OINL IN IN REDUCE 5,747 574 510 -11.2%
PTT Exploration & Production PTTEP TB TH ADD 20,181 165.0 183.0 10.9%
Senex Energy SXY AU AU ADD 766 0.71 1.15 61.6%
0.00
0.50
1.00
1.50
2.00
2.50
3.00
3.50
4.00
Jan-10 Jan-11 Jan-12 Jan-13 Jan-14
Rolling P/BV (x)
Medco Energi Internasional Oil India
PTT Exploration & Production Senex Energy
0
5
10
15
20
25
30
35
40
45
50
Jan-10 Jan-11 Jan-12 Jan-13 Jan-14
12-month Forward Rolling FD P/E (x)
Medco Energi Internasional Oil India
PTT Exploration & Production Senex Energy
0.0%
4.3%
8.6%
12.9%
17.1%
21.4%
25.7%
30.0%
0.00
0.50
1.00
1.50
2.00
2.50
3.00
3.50
Jan-10 Jan-11 Jan-12 Jan-13 Jan-14 Jan-15
Peer Aggregate: P/BV vs ROE
Rolling P/BV (x) (lhs) ROE (See Footnote) (rhs)
-60%
-40%
-20%
0%
20%
40%
60%
80%
0.00
2.00
4.00
6.00
8.00
10.00
12.00
14.00
Jan-10 Jan-11 Jan-12 Jan-13 Jan-14 Jan-15
Peer Aggregate: 12-mth Fwd FD P/E vs FD EPS Growth
12-mth Fwd FD P/E (x) (See Footnote) (lhs) FD EPS Growth (See Footnote) (rhs)
Valuation
FD P/E (x) (See Footnote) P/BV (x) EV/EBITDA (x)
Dec-13 Dec-14 Dec-15 Dec-13 Dec-14 Dec-15 Dec-13 Dec-14 Dec-15
Medco Energi Internasional 26.72 24.98 12.08 1.09 1.04 0.97 4.99 4.57 3.71
Oil India 10.94 11.06 11.27 1.69 1.58 1.49 5.35 5.09 4.79
PTT Exploration & Production 11.35 9.45 9.69 1.70 1.52 1.39 4.25 3.59 3.43
Senex Energy 15.76 12.82 13.00 1.72 1.50 1.34 8.38 7.05 6.98
Growth and Returns
FD EPS Growth (See Footnote) ROE (See Footnote) Dividend Yield
Dec-13 Dec-14 Dec-15 Dec-13 Dec-14 Dec-15 Dec-13 Dec-14 Dec-15
Medco Energi Internasional 24.5% 6.9% 106.9% 4.2% 4.3% 8.3% 0.77% 0.52% 1.72%
Oil India -11.6% -1.1% -1.9% 16.1% 14.8% 13.6% 4.11% 4.20% 4.34%
PTT Exploration & Production -13.7% 20.0% -2.4% 16.2% 17.0% 15.0% 3.64% 4.23% 4.13%
Senex Energy 101.8% 22.9% -1.4% 12.2% 12.5% 10.9% 0.00% 0.00% 0.00%
SOURCE: CIMB, COMPANY REPORTS
Calculations are performed using EFA™ Monthly Interpolated Annualisation and Aggregation algorithms to December year ends. NPAT/EPS values for calculations and valuations are based on recurring and normalised values for GAAP and IFRS accounting standard companies respectively.

Medco Energi Internasional
June 29, 2014
3
The bulk of the Senoro’s
volume growth will begin to
kick in from 2015 …
… and generate a strong
operating to support funding of ongoing capex …
Share price info
Share px perf. (%) 1M 3M 12M
Relative 12.9 26.3 102.4
Absolute 10.5 28.9 106
Major shareholders % held
Encore Energy 50.7
0.0%
1.8%
3.6%
5.4%
7.2%
9.0%
0.00
0.50
1.00
1.50
2.00
2.50
Jan-10 Jan-11 Jan-12 Jan-13 Jan-14 Jan-15
P/BV vs ROE
Rolling P/BV (x) (lhs) ROE (See Footnote) (rhs)
-200%
-78%
44%
167%
289%
411%
533%
656%
778%
900%
0.0
10.0
20.0
30.0
40.0
50.0
60.0
70.0
80.0
90.0
Jan-10 Jan-11 Jan-12 Jan-13 Jan-14 Jan-15
12-mth Fwd FD Core P/E vs FD Core EPS Growth
12-mth Fwd Rolling FD Core P/E (x) (lhs)
FD Core EPS Growth (rhs)
Profit & Loss
(US$m) Dec-12A Dec-13A Dec-14F Dec-15F Dec-16F
Total Net Revenues 909 889 803 940 1,046
Gross Profit 399 367 389 496 578
Operating EBITDA 342 349 371 475 556
Depreciation And Amortisation (86) (103) (104) (112) (120)
Operating EBIT 256 246 267 363 437
Financial Income/(Expense) (74) (65) (63) (71) (74)
Pretax Income/(Loss) from Assoc. 0 0 0 0 0
Non-Operating Income/(Expense) 11 13 13 13 13
Profit Before Tax (pre-EI) 193 194 217 305 376
Exceptional Items (5) (24) 0 0 0
Pre-tax Profit 187 170 217 305 376
Taxation (156) (154) (172) (218) (269)
Exceptional Income - post-tax 0 0 0 0 0
Profit After Tax 31 16 45 87 107
Minority Interests (6) (3) (3) (3) (5)
Preferred Dividends 0 0 0 0 0
FX Gain/(Loss) - post tax 0 0 0 0 0
Other Adjustments - post-tax 0 0 0 0 0
Net Profit 25 13 41 83 103
Recurring Net Profit 29 36 38 80 99
Fully Diluted Recurring Net Profit 29 36 38 80 99
Cash Flow
(US$m) Dec-12A Dec-13A Dec-14F Dec-15F Dec-16F
EBITDA 341.5 349.1 370.8 474.8 556.3
Cash Flow from Invt. & Assoc. (200.7) 337.5 266.4 231.7 (132.4)
Change In Working Capital 221.4 (301.1) (262.7) (233.9) 146.3
(Incr)/Decr in Total Provisions 0.0 0.0 0.0 0.0 0.0
Other Non-Cash (Income)/Expense 0.0 0.0 0.0 0.0 0.0
Other Operating Cashflow 0.0 0.0 0.0 0.0 0.0
Net Interest (Paid)/Received (74.4) (65.1) (63.2) (71.1) (73.6)
Tax Paid (149.1) (124.7) (172.2) (218.0) (269.1)
Cashflow From Operations 138.6 195.7 139.2 183.5 227.6
Capex (216.2) (162.1) (337.9) (231.4) (227.3)
Disposals Of FAs/subsidiaries (28.6) (40.9) 0.0 0.0 0.0
Acq. Of Subsidiaries/investments (120.9) (31.4) 253.4 0.0 0.0
Other Investing Cashflow (47.9) (67.0) 0.0 0.0 0.0
Cash Flow From Investing (413.6) (301.3) (84.5) (231.4) (227.3)
Debt Raised/(repaid) 33.4 (224.7) (69.4) 80.0 45.0
Proceeds From Issue Of Shares 0.0 0.0 0.0 0.0 0.0
Shares Repurchased 0.0 0.0 0.0 0.0 0.0
Dividends Paid (22.5) (3.3) (5.0) (16.5) (33.4)
Preferred Dividends 0.0 0.0 0.0 0.0 0.0
Other Financing Cashflow 70.7 79.2 0.0 0.0 0.0
Cash Flow From Financing 81.5 (148.8) (74.4) 63.5 11.6
Total Cash Generated (193.4) (254.4) (19.7) 15.6 11.9
Free Cashflow To Equity (241.6) (330.3) (14.7) 32.1 45.3
Free Cashflow To Firm (179.6) (28.5) 123.8 28.7 79.7
BY THE NUMBERS
SOURCE: CIMB, COMPANY REPORTS

Medco Energi Internasional
June 29, 2014
4
… as well as help improve the
company’s net gearing
position to manageable levels (below 80%)
Balance Sheet
(US$m) Dec-12A Dec-13A Dec-14F Dec-15F Dec-16F
Total Cash And Equivalents 524 264 244 260 272
Total Debtors 226 220 213 229 231
Inventories 37 37 27 30 30
Total Other Current Assets 358 301 47 47 47
Total Current Assets 1,145 821 531 566 580
Fixed Assets 970 988 1,222 1,341 1,449
Total Investments 231 350 350 350 350
Intangible Assets 0 0 0 0 0
Total Other Non-Current Assets 311 372 372 372 372
Total Non-current Assets 1,511 1,710 1,944 2,063 2,171
Short-term Debt 60 60 60 60 60
Current Portion of Long-Term Debt 103 82 81 346 211
Total Creditors 139 145 119 123 125
Other Current Liabilities 130 123 123 123 123
Total Current Liabilities 432 410 383 652 519
Total Long-term Debt 1,187 890 822 637 817
Hybrid Debt - Debt Component 0 0 0 0 0
Total Other Non-Current Liabilities 193 335 335 335 335
Total Non-current Liabilities 1,380 1,225 1,156 971 1,151
Total Provisions 0 0 0 0 0
Total Liabilities 1,813 1,635 1,539 1,623 1,670
Shareholders' Equity 835 885 921 988 1,058
Minority Interests 8 12 15 18 23
Total Equity 843 897 936 1,007 1,081
Key Drivers
Dec-12A Dec-13A Dec-14F Dec-15F Dec-16F
Oil Price (US$/bbl) 111.7 107.7 107.0 105.0 105.0
Volume Growth (%) 10.9% -9.4% -9.2% 2.5% 18.9%
Ratio Of Up To Downstream (x) N/A N/A N/A N/A N/A
Operating Cash Cost (US$/bbl) N/A N/A N/A N/A N/A
Ratio Of High To Low Margin (x) N/A N/A N/A N/A N/A
BY THE NUMBERS
Key Ratios
Dec-12A Dec-13A Dec-14F Dec-15F Dec-16F
Revenue Growth (20.5%) (2.2%) (9.6%) 17.1% 11.2%
Operating EBITDA Growth 1.0% 2.2% 6.2% 28.0% 17.2%
Operating EBITDA Margin 37.6% 39.3% 46.2% 50.5% 53.2%
Net Cash Per Share (US$) (0.25) (0.23) (0.22) (0.23) (0.24)
BVPS (US$) 0.25 0.27 0.28 0.30 0.32
Gross Interest Cover 2.68 3.19 3.86 4.74 5.50
Effective Tax Rate 83.5% 90.6% 79.4% 71.5% 71.5%
Net Dividend Payout Ratio 75.0% 20.3% 12.2% 19.8% 32.5%
Accounts Receivables Days 49.73 49.08 55.17 49.01 47.38
Inventory Days 28.77 25.77 28.14 23.33 23.36
Accounts Payables Days 74.67 66.25 71.32 57.26 56.95
ROIC (%) 3.34% 3.10% 3.33% 6.30% 7.01%
ROCE (%) 12.8% 12.5% 14.2% 18.7% 21.0%
SOURCE: CIMB, COMPANY REPORTS

Medco Energi Internasional
June 29, 2014
5
Unleashing the gas potentials 1. COMPANY BACKGROUND
1.1 A brand name in Indonesian O&G
A medium-sized E&P company in the region
Medco Energi (MEDC) was founded in 1980 by the Panigoro family, who currently still indirectly control 31% of the company. Following its inception, the company has largely focused on upstream E&P operations. Its current operations encompass assets in both the domestic (74% of total reserves) and international (26%) markets.
MEDC‟s current reserves and production ranks the company as a medium-sized oil & gas producer in Indonesia, and in the region. The company‟s small oil production relative to total national production reflects the company‟s declining production due to its maturing oil fields (though this is not unique to MEDC as Indonesia‟s national production is facing the same issue), and the fact that the majority of the country‟s production is currently still contributed by the foreign oil and gas majors (e.g. Chevron, Total, ExxonMobil).
Typical of Indonesia‟s national oil & gas industry profile, MEDC‟s reserves are currently dominated by its gas assets (55% of total), while 46% of production is also contributed by gas. MEDC‟s gas production is expected to increase in the coming years (to around 60%), assuming a successful monetisation of its key gas blocks. However, MEDC‟s oil production could potentially increase back in the future given the potential development of its asset in Libya.
Figure 1: MEDC shareholding Structure
SOURCES: CIMB, COMPANY REPORTS
Table of Contents
1. COMPANY BACKGROUND p.5
2. KEY GROWTH ASSETS p.13
3. INDUSTRY OUTLOOK p.16
4. RISKS p.22
5. FINANCIALS p.23
6. VALUATION AND RECOMMENDATION p.26
‘‘‘‘ I would best describe the state of Medco Energi’s business today and the near-future with the remarks: ‘gas, gas, oil and more oil’…”
– Hilmi Panigoro, President Commisioner

Medco Energi Internasional
June 29, 2014
6
Figure 2: MEDC’s E&P Indonesian assets Figure 3: MEDC’s E&P international assets
SOURCES: CIMB, COMPANY REPORTS SOURCES: CIMB, COMPANY REPORTS
Figure 4: Listed regional E&P producers ranking - by reserves Figure 5: Listed regional E&P producers ranking – by production
Title:
Source:
Please fill in the values above to have them entered in your report
0
200
400
600
800
1,000
1,200
1,400
1,600
1,800
RH
Petr
ogas
Horizo
n O
il
RO
C O
il
Kris
Energ
y
Senex
Energ
y
Sala
mander E
ner
gy
AW
E L
imited
Soco
Inte
rnatio
nal
Energ
i M
ega
Pers
ada
Pre
mie
r O
il
Medco
Energ
i
Cairn
Oil
India
Santo
s
Woodsi
de
Pet
role
um
PT
TE
P
CN
OO
C
4,000
4,200
mmboe
Title:
Source:
Please fill in the values above to have them entered in your report
0
20
40
60
80
100
120
Senex
Energ
y
Horizo
n O
il
RH
Petr
ogas
RO
C O
il
Kris
Energ
y
AW
E L
imited
Sala
mander E
ner
gy
Soco
Inte
rnatio
nal
Energ
i M
ega
Pers
ada
Pre
mie
r O
il
Medco
Energ
i
Oil
India
Santo
s
Cairn
Woodsi
de
Pet
role
um
PT
TE
P
CN
OO
C
360
380
400
420
mmboe
SOURCES: CIMB, COMPANY REPORTS SOURCES: CIMB, COMPANY REPORTS
Figure 6: Indonesia's oil production (2013) – MEDC’s oil production accounts for 3% of Indonesia’s production
Figure 7: Indonesia's gas production (2013) – MEDC’s gas production accounts for 2% of Indonesia’s production but will
rise to an estimated 5% by 2015-16
Title:
Source:
Please fill in the values above to have them entered in your report40%
14%8%
5%
4%
4%
3%
3%
2%
2% 3%
12%
Chevron Pertamina Total E&P PHE - ONWJ
CNOOC SES ConocoPhillips CICO Mobil Cepu
PetroChina Jabung Vico Medco Energi (all) Others
Title:
Source:
Please fill in the values above to have them entered in your report
21%
15%
13%18%
5%
4%
4%
3%
2%
2%13%
Total E&P BP Berau Pertamina
ConocoPhillips (all) Vico ExxonMobil Oil
Kangean Energy PetroChina Jabung PHE - ONWJ
Medco Energi (all) Others
SOURCES: SKK MIGAS SOURCES: SKK MIGAS

Medco Energi Internasional
June 29, 2014
7
Sufficient reserves to sustain growth
The company‟s 2P reserves currently amount to 267mmboe of oil and gas, which, similar to the production profile, also ranks the company as a medium-sized producer in the region. The company‟s current reserves translate to 14 years of reserve life based on current production, suggesting a sustainable growth outlook for the company‟s production in the medium term.
MEDC‟s current reserves within its Indonesian asset account for 74% of the company‟s total reserves, of which 68% is contributed by its gas assets. On the other hand, a majority (83%) of the company‟s international assets are made up of oil reserves.
MEDC‟s contingent resource base of 177mmboe provides further potential for upside in the future. The resource base is still slightly dominated by the Indonesian Senoro gas asset. While the majority of these assets are technically proven, the inclusion of these resources into MEDC‟s reserve base will hinge on the commercialisation of the assets (i.e. gas sales agreement in the case of the Senoro gas, government approval for development in the case of the Libya oil).
Figure 8: MEDC's reserves breakdown by assets
Oil Gas Total Total Oil portion Gas portion
mmbo bcf mmboe as % of total reserve as % of total reserve as % of total reserve
2P Reserves
INDONESIA 62.1 785.8 196.5 74% 32% 68%
A. Production Assets
Rimau, South Sumatra 33.8 - 33.8 13% 100% 0%
South & Central Sumatra 8.0 245.2 49.9 19% 16% 84%
Tarakan, North Kalimantan 2.5 3.4 3.1 1% 81% 19%
Senoro-Toili, Central Sulawesi 2.4 - 2.4 1% 100% 0%
Bawean, East Java 7.0 - 7.0 3% 100% 0%
Lematang, South Sumatra - 39.9 6.8 3% 0% 100%
B. Development Assets
Block A, Aceh 1.3 121.7 22.1 8% 6% 94%
Senoro-Toili, Central Sulawesi 7.1 375.6 71.3 27% 10% 90%
INTERNATIONAL 59.0 70.9 70.8 26% 83% 17%
United States 4.9 25.4 9.1 3% 53% 48%
Libya 47 44.4 45.5 52.0 19% 85% 15%
Yemen 9 9.7 - 9.7 4% 100% 0%
Total 2P Oil & Gas Reserves 121.1 856.7 267.3 100% 45% 55%
Contingent Resources
INDONESIA 10.7 478.9 92.6 52% 12% 88%
Senoro-Toili, Central Sulawesi 10.7 386.1 76.7 43% 14% 86%
Simenggaris, North Kalimantan 92.8 15.9 9% 0% 100%
INTERNATIONAL 62.7 131.9 84.6 48% 74% 27%
Libya 47 60.3 115.0 79.4 45% 76% 25%
Yemen 9 2.4 16.8 5.2 3% 46% 55%
Total Contingent Resources 73.4 610.8 177.2 100% 41% 59% SOURCES: CIMB, COMPANY REPORTS

Medco Energi Internasional
June 29, 2014
8
Figure 9: MEDC reserve movement 1P, 2P, 2P+C (oil and gas)
Title:
Source:
Please fill in the values above to have them entered in your report
201 178
277
202
236 228
294
267
453 445
465445
-
50
100
150
200
250
300
350
400
450
500
2010 2011 2012 2013
Proved (P1) Probable (P2) Contingent (2C)
mmboe
SOURCES: CIMB, COMPANY REPORTS
Strong E&P track record
Medco‟s track record in the oil and gas business was spearheaded by Mr. Arifin Panigoro, an entrepreneur with a background in electrical engineering. Mr. Panigoro teamed up with his confidant to first set up an oil & gas drilling company in 1980. However, it was not until 1992 that the company embarked on acquiring several oil & gas assets, with the purchase of a 100% stake in Stanvac Oil and its operations in Indonesia being a landmark acquisition for the company since 1995.
Medco‟s key oil & gas discovery was the giant oil field of Kaji and Semoga in Rimau Block, South Sumatra back in 1996 – reserve of 304 mmboe at the time. During the period of 2000-2002, the company successfully grew production and reserves from its key assets. This was followed by successful acquisitions of interests in other assets such as Senoro-Toili and oil discoveries.
The declining production from the key assets in recent years has been inevitable due to the maturing age of the oil fields in Indonesia, and is not unique to MEDC. The management‟s key objective for the upstream operations in recent years has been centered on sustaining production and arresting the production decline due to the maturing fields. Such efforts have resulted in a 5% average oil production decline over the past five years, although the company delivered a better outcome in 2013 with 27 mbopd production.
At present, MEDC‟s production is still contributed by its key existing assets namely Rimau, SCS and Tarakan assets which in total contributed 83% of total production. Thus, the declining production has also been a function of the lack of new assets‟ contribution. This, however, is going to change soon given the expected contribution from the Senoro-Toili block starting in 2015 (based on our projection).
MEDC‟s operating costs (total cost per barrel) have been rising in recent years, driven mainly by the increase in lifting cost. This trend is not unique to MEDC given the declining production profile. MEDC‟s lifting and cash cost of around US$14/bbl and US$18/bbl respectively are within the range of costs of other regional oil producers such as PTTEP (lifting cost of US$15 and cash cost of around US$19/bbl in 2013). Similarly, MEDC‟s finding and development cost, which has averaged at US$4.5/bbl over the past 5 years, are comparable to regional F&D players‟ costs of US$4-6/bbl – although MEDC‟s 2013 cost of U$7.3/bbl was above peers and reflect the lack of additional reserves during the year.

Medco Energi Internasional
June 29, 2014
9
Figure 10: MEDC’s oil and gas production – recent years’ decline was largely due to maturing fields, but a turnaround is coming
Title:
Source:
Please fill in the values above to have them entered in your report
0
10
20
30
40
50
60
70
2007 2008 2009 2010 2011 2012 2013 2014F 2015F 2016F 2017F
Rimau SCS Tarakan Senoro Other PSCs
mboepd
SOURCES: CIMB, COMPANY REPORTS
Figure 11: MEDC’s oil and gas costs trend
Title:
Source:
Please fill in the values above to have them entered in your report
0
10
20
30
40
50
60
2010 2011 2012 2013 1Q14
Lifting cost/bbl Cash cost/bbl Total cost/bbl
US$
SOURCES: CIMB, COMPANY REPORTS
1.2 Upstream refocusing strategy
Throughout its development, MEDC has ventured into downstream assets such as power, ethanol, fuel distribution and storage business. This strategy was driven more by a vertical integration rationale, to leverage off the company‟s core expertise in the E&P and available upstream assets. Nonetheless, such past efforts have been largely unsuccessful, resulting in the past divestments of the downstream assets.
1) Asset monetisation
MEDC is currently embarking on the strategy to refocus on its upstream assets, having completed some key asset divestments in 2013. In addition to the downstream assets‟ unprofitable operations, the upstream refocusing strategy has also been driven by the need to reallocate capital to support the monetisation of major upstream assets under current and future development.
Figure 12: Asset divestments in recent years
Year Divestment Company Value (US$ mn) Description
2012 51% ownership PT Medco Power Indonesia (MPI) 112 sold to Saratoga Power 51%, Medco Energy has 49% stakes
2013 Discontinued PT Medco Ethanol Lampung na closed down its ethanol plant due to insufficient sustainable feedstock supply
2014 35.28% ownership PT Medco Sarana Kalibaru 18 selling its remaining ownership in its fuel distribution and storage unit SOURCES: CIMB, COMPANY REPORTS

Medco Energi Internasional
June 29, 2014
10
The company‟s upstream capex rose to US$220m in 2013 and is expected to rise further to US$340m, driven by the funding for assets under development, namely Senoro-Toili (which also includes MEDC‟s 11% stake in the LNG liquefaction plant), the Block A gas block, and Libya oil block.
Among these development assets, we expect the Senoro-Toili asset (based in Central Sulawesi, with a predominant 90% gas production) as the one with the most immediate and biggest contribution to MEDC‟s production and earnings. With current construction progress of around 98% (based on the management‟s comments), the project is expected to be completed in 3Q14 and start contributing by 2015 (we assume a 2Q15 contribution in our projection).
After the Senoro asset, the Block A gas asset is potentially the next asset to come onstream. However, the asset is currently not yet in the development stage and therefore, the timing of the contribution is still uncertain. Assuming development starts in 2015, it is only by 2017 that the asset will make a contribution. We have not yet taken into consideration the potential contribution from this asset, while also keeping our capex forecast limited to exploration spending.
The company‟s 25% interest in Libya‟s Area-47 oil block represents the biggest potential upside from oil operations. MEDC has thus far spent US$200m on this venture. Despite the potential upside from the oil production from this field, the biggest obstacle for the asset is the visibility of the political situation and industry policy in Libya. As such, we have not yet taken into consideration the potential contribution from this asset, while also keeping our capex forecast limited to exploration.
Figure 13: Key prospective assets
Projects Descriptions % Interest PartnersEstimated time of
contribution
Senoro (upstream) Gas plant of 310 mmscfd 30.0% Pertamina (50%), Mitsubishi & Kogas (20%) 2015
Senoro DSLNG (downstream LNG) LNG plant, single train of 2 mtpa capacity 11.1% Pertamina (29%), Mitsubishi & Kogas (59.9%) 2015
Libya Area 47 Oil production capacity: 50,000 bopd 25.0%National Oil Company (NOC), Libyan Investment
Authority (LIA)2018
Block A Gas plant capacity of 60mmscfd 41.7% Premier Oil (42%), Japex (16%) 2017
Rimau OER Oil field - Enhanced Oil Recovery 95.0% PD-PDE 2017 SOURCES: CIMB, COMPANY REPORTS
Figure 14: MEDC’s rising capex plan highlights continued development of its key assets (Senoro, Block A, Libya)
Title:
Source:
Please fill in the values above to have them entered in your report
-
50
100
150
200
250
300
350
400
2011 2012 2013 2014F 2015F 2016F
US$ mn
SOURCES: CIMB, COMPANY REPORTS

Medco Energi Internasional
June 29, 2014
11
2) Exploration and acquisitions
In addition to the development of its key potential upstream assets, MEDC‟s upstream strategy also aims to further lift the company‟s reserves (despite what we see as an already sufficient life at present).
We do not yet include potential development from the company‟s exploration assets in recent years. Nonetheless, the company average 5-years reserve replacement ratio of 2.1x should reflect well on the company‟s exploration programme – admittedly, 2013‟s lack of reserve replacement could become a concern, but we expect potential reserve additions from current resources such as in Libya and Yemen to make up for the absence in the coming years.
Figure 15: MEDC’s reserve addition track record
Production Track record 2009 2010 2011 2012 2013
Oil and gas capex, US$mn 198.61 126.94 143.14 189.21 219.5
2P reserve addition, mmboe 113.2 46.77 -3.66 87.02 -7.34
Actual 3 year average F&D, US$/boe 5.66 3.3 3 3.53 7.26
Actual 3 year average RRR 2.01 2.88 2.53 2.04 1.22
2P Reserves Life Index, years 14.32 12.13 10.52 13.92 13.82 SOURCES: CIMB, COMPANY REPORTS
Figure 16: MEDC’s exploration activities (domestic)
SOURCES: CIMB, COMPANY REPORTS

Medco Energi Internasional
June 29, 2014
12
Figure 17: MEDC’s exploration activities (international)
SOURCES: CIMB, COMPANY REPORTS
MEDC has spent around US$214m for three acquisitions in recent years. These have contributed around 8% (21mmboe) of the existing reserves. Recent acquisitions have been focused on overseas assets (i.e. Tunisia, Yemen and PNG reflecting the lack of available potential assets in Indonesia, and have averaged at around US$10/boe (for the producing oil blocks in Yemen and Tunisia), in-line with the market‟s current asset valuations.
We have yet to include the recently acquired assets into our forecast. Looking at the producing assets which are recently acquired, their future production upside should lift MEDC‟s oil contribution. Similar to the Libya oil operation, the key challenge to develop these assets lie in the political situation of the respective countries, although the conditions for the Tunisia asset appears to be more stable compared to Yemen and Libya.
Figure 18: MEDC recent acquisitions
Year Asset Status Value Reserve (net) Current production Est. peak production
(US$ mn) (mmboe) (bopd) (bopd)
Aug 2012 21.2% interest in Block 9 (Malik), Yemen Producing 99.0 9.7 390 4200
Feb 2014 Exploration interests in Juha Extension, P&G Exploration 3.5 na na na
Jun 2014 Interests in exploration, development and producing blocks in Tunisia Producing 114.0 12.3 1800 16000 SOURCES: CIMB, COMPANY REPORTS

Medco Energi Internasional
June 29, 2014
13
2. KEY GROWTH ASSETS
2.1 Senoro-Toili Block (Senoro gas) – a main growth driver
We forecast a strong jump in MEDC‟s oil & gas production in 2015, driven by the expected contribution from the gas production at the Senoro block. We expect the production from the Senoro asset to come onstream in 2015 (at 188 mmscfd), before ramping up to 250 mmscfd starting in 2016. This is expected to lift MEDC‟s overall production to 349 mmscfd and 407 mmscfd in 2015 and 2016 respectively, translating to a 64% average production growth.
MEDC currently holds a 30% interest in the Senoro block, while Pertamina holds a 50% interest. Mitsubishi is the holder of the remaining 20% interest in the block, having acquired the stake from MEDC which divested the stake in 2011 given the company‟s limited balance sheet capacity to fund the asset‟s development.
Figure 19: Map of Senoro Block
SOURCES: CIMB, COMPANY REPORTS
Gas sales
Once completed (expected by 3Q14 under our projection), the Senoro upstream gas facility will have a total capacity of 310mmscfd. Of this total capacity, 250mmscfd of production will be sold to the gas liquefaction (LNG) facility of Donggi-Senoro LNG (DSLNG) under a 15-year gas sales agreement (GSA), signed in 2009. Additionally, MEDC will also sell another 55mmscfd of gas to PT. Panca Amara Utama (PAU), a domestic ammonia producer. The latter deal has been finalised into a GSA in March 2014.
The conclusion of the GSA with DSLNG in 2009 came as a relief after a long debate regarding the government‟s policy to allocate the domestic portion of the gas from the field. While the actual terms in gas PSC scheme does not require allocation for domestic market obligations (as in the case of oil PSC), the government then was under the pressure to allocate more gas into the domestic market. The signing of first GSA in 2009 facilitated the project to move into the development phase, with the construction for an upstream asset commencing in 2Q15 and is now at a 71% completion rate (for the upstream facility) and 98% completion (for DSLNG plant). Thus, we think the current progress should translate to lower execution risk for the project.
The gas selling price from the Senoro upstream block will follow the following gas formula:
Sales to DSLNG will be tied to the Japanese Crude Cocktail (JCC) oil index with a 15% slope. This should translate to US$9.1/mmBTU of gas selling price if crude price is at US$100/ bbl.

Medco Energi Internasional
June 29, 2014
14
Sales to PAU will be tied to the ammonia price, with floor selling price of US$5/mmBTU if ammonia price hits US$500/mt or below. At the current ammonia price of US$600/mt, the gas selling price will be US$6.0/ mmBTU, hence lower than the selling price to DSLNG.
We detail our assumptions for the Senoro gas in the table below.
Figure 20: Senoro gas key assumptions
2015F 2016F 2017F 2018F
Volume (mmscfd) 187.5 250.0 310.0 310
Price (US$/mmbtu) 9.9 9.7 9.7 9.7 SOURCES: CIMB, COMPANY REPORTS
Figure 21: Senoro-Toili block key milestones
Year Development
2000 MEDC acquired 50% participating interest in the Senoro-Toili PSC JOB Block through the
acquisition of 100% shares of Atlantic Richfield Corporation (ARCO)
2001-2002 JOB Pertamina-Medco Tomori drilled two appraisal wells Senoro-2 and Senoro-3, which proved
that the Senoro structure is a giant gas field with a total estimated reserve of 3.7 TCF gas and
65 MM Barrels condensate
2005 The field began production of crude oil
2006 Pertamina decided to build an LNG terminal for the Matindok and Senoro blocks
2007 Pertamina-Medco And Mitsubishi Agree On Senoro Gas Price
2009 MEDC signed GSA with PT Donggi Senoro LNG (DSLNG) to supply 250 MMSCFD of gas for 15
years with the price being tied to Japan Crude Cocktail (JCC)
2010 MEDC sold a 20% participating interest in the Senoro-Toili PSC JOB Block to Mitsubishi
Corporation for USD 260 million
2011 Construction for upstream and downstream project start
2014 MEDC signed GSA with PT Panca Amara Utama to supply 55 MMSCFD of gas for 15 years
with the price being tied to ammonia price SOURCES: CIMB, COMPANY REPORTS
Future upside
The current gas sales of 305mmscfd (250mmscfd to DSLNG and 55mmscfd to PAU), combined with the 5mmscfd allocated to the facility‟s internal power generation, should cover the Senoro-Toili block‟s current 2P reserve (of 71.3mmboe), assuming production until the expiration of the contract. MEDC‟s financial statement reveals that there exists another 76mmboe of gas contingent resources in the block.
This translates to further monetisation opportunity for the block in the future, which may come in form of further expansion of the LNG facility, or potential sales to power plants in the vicinity.
2.2 Future growth drivers – Block A and Libya
Block A gas
MEDC holds a 42% interest in the Block A gas asset, located in Aceh, with Premier Oil and Japex holding the remaining 42% and 16% interests in the block. MEDC is the operator of the asset.
The block is designed to have a capacity of 60mmscfd. The key problem in the monetisation of the Block A asset lies on the lack of a pipeline to transport the gas to the buyer. Nonetheless, MEDC had in 2007 signed a gas sales agreement with the state-owned fertiliser company Pupuk Iskandar Muda (PIM) for 55mmscfd of annual gas supply. According to the GSA, the gas will be sold at a price of US$6.5/mmBTU, which makes it comparable to the current gas prices from the upstream suppliers.
However, MEDC claimed that the cost of production for the block will be above the average cost of production of other gas blocks due to Block A gas‟s higher H2S content. Thus, the management sees that the contracted gas supply will

Medco Energi Internasional
June 29, 2014
15
need to be increased before the company looks to do any development in the block.
To resolve the lack of pipeline infrastructure, MEDC is currently also in discussion with Pertamina to negotiate a potential „swap‟ between Block A‟s output with that of Pertamina‟s located in Block B. The potential swap appears logical since Pertamina‟s Block B asset is located in closer proximity to PIM (the buyer for MEDC‟s Block A gas), while MEDC‟s Block A asset is also located closer to PLN‟s operation (the buyer for Pertamina‟s Block B gas).
MEDC‟s management expects the proposed swap deal to be completed by the end of 2014. A successful resolution of the deal will drive the project onto the next critical stage, namely completion of the final investment decision (FID), which will then be followed by project construction. Thus, positive newsflow from Block A will be the next potential catalyst for the stock.
Libya Area-47 (Oil)
MEDC has been acquiring interests in overseas oil and gas blocks since 2005 and entered into the Libyan venture in 2009. At present, the overseas assets account for 26% and 17% of MEDC‟s reserve and production.
The Libyan asset is particularly attractive given its sheer size of potential reserve (certified 2P of 352mmboe and 588 mmboe based on contingency reserve valuation done by in-house survey – both on gross basis). MEDC has included 52mboe (according to its 25% interest) of net reserve from Area 47‟s blocks (block A, D and F) which has been approved for commercialisation by the Libyan government. MEDC‟s initial estimation for the asset looks for potential production of 50 mbopd.
The development of the asset currently is still pending further commercialisation approval for the remaining three blocks (block B, C, and J), upon which the asset‟s plan of development could progress and construction should start in 2016. Assuming everything proceeds smoothly, then the production could start by 2018 at the earliest.
Given the substantial risks still surrounding the potential development of the asset, we have not included potential contribution from the Libya oil into our forecast. Likewise, we do not include potential capex for the asset which, according to the management could amount to US$800m (MEDC‟s portion will be US$200m for its 25% interest since under the project agreement, the Libya National Oil Company will take part of the investment capex).
Figure 22: Block A gas map Figure 23: Libya oil block map
SOURCES: COMPANY REPORTS SOURCES: COMPANY REPORTS
Medco Energi Internasional
June 29, 2014
16
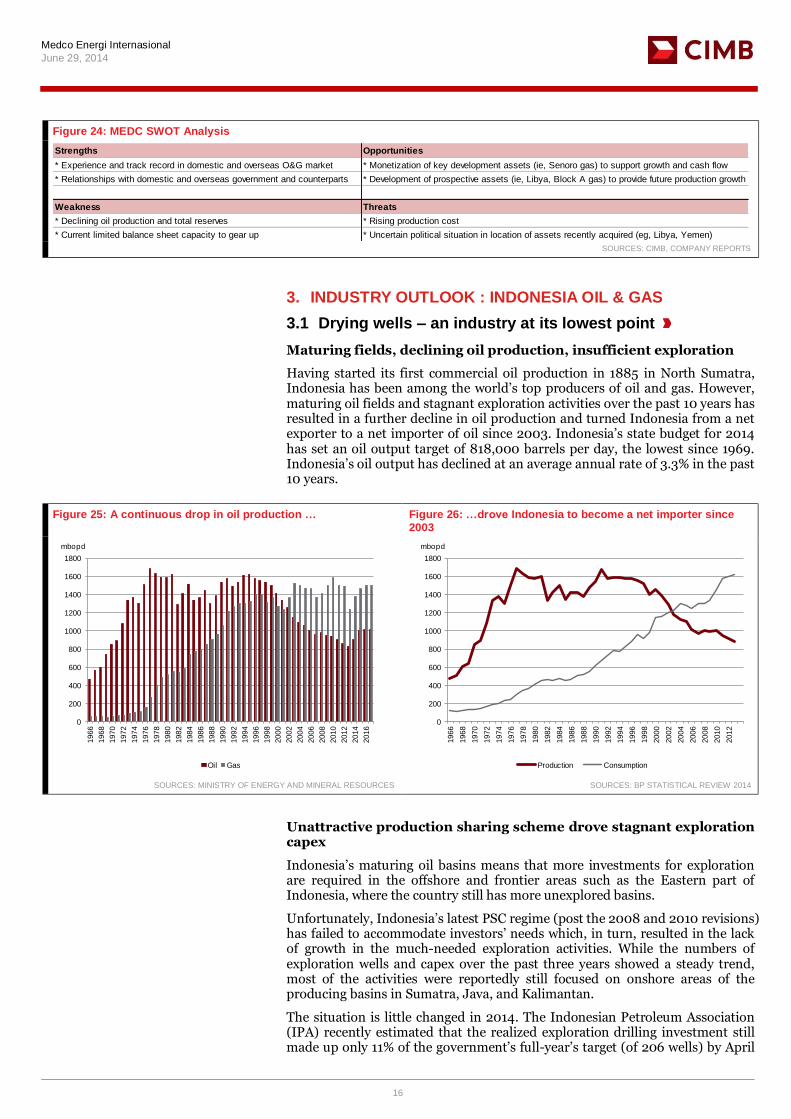
Figure 24: MEDC SWOT Analysis
Strengths Opportunities
* Experience and track record in domestic and overseas O&G market * Monetization of key development assets (ie, Senoro gas) to support growth and cash flow
* Relationships with domestic and overseas government and counterparts * Development of prospective assets (ie, Libya, Block A gas) to provide future production growth
Weakness Threats
* Declining oil production and total reserves * Rising production cost
* Current limited balance sheet capacity to gear up * Uncertain political situation in location of assets recently acquired (eg, Libya, Yemen) SOURCES: CIMB, COMPANY REPORTS
3. INDUSTRY OUTLOOK : INDONESIA OIL & GAS
3.1 Drying wells – an industry at its lowest point
Maturing fields, declining oil production, insufficient exploration
Having started its first commercial oil production in 1885 in North Sumatra, Indonesia has been among the world‟s top producers of oil and gas. However, maturing oil fields and stagnant exploration activities over the past 10 years has resulted in a further decline in oil production and turned Indonesia from a net exporter to a net importer of oil since 2003. Indonesia‟s state budget for 2014 has set an oil output target of 818,000 barrels per day, the lowest since 1969. Indonesia‟s oil output has declined at an average annual rate of 3.3% in the past 10 years.
Figure 25: A continuous drop in oil production … Figure 26: …drove Indonesia to become a net importer since 2003
Title:
Source:
Please fill in the values above to have them entered in your report
0
200
400
600
800
1000
1200
1400
1600
1800
1966
1968
1970
1972
1974
1976
1978
1980
1982
1984
1986
1988
1990
1992
1994
1996
1998
2000
2002
2004
2006
2008
2010
2012
2014
2016
Oil Gas
mbopd
Title:
Source:
Please fill in the values above to have them entered in your report
0
200
400
600
800
1000
1200
1400
1600
1800
1966
1968
1970
1972
1974
1976
1978
1980
1982
1984
1986
1988
1990
1992
1994
1996
1998
2000
2002
2004
2006
2008
2010
2012
Production Consumption
mbopd
SOURCES: MINISTRY OF ENERGY AND MINERAL RESOURCES SOURCES: BP STATISTICAL REVIEW 2014
Unattractive production sharing scheme drove stagnant exploration capex
Indonesia‟s maturing oil basins means that more investments for exploration are required in the offshore and frontier areas such as the Eastern part of Indonesia, where the country still has more unexplored basins.
Unfortunately, Indonesia‟s latest PSC regime (post the 2008 and 2010 revisions) has failed to accommodate investors‟ needs which, in turn, resulted in the lack of growth in the much-needed exploration activities. While the numbers of exploration wells and capex over the past three years showed a steady trend, most of the activities were reportedly still focused on onshore areas of the producing basins in Sumatra, Java, and Kalimantan.
The situation is little changed in 2014. The Indonesian Petroleum Association (IPA) recently estimated that the realized exploration drilling investment still made up only 11% of the government‟s full-year‟s target (of 206 wells) by April

Medco Energi Internasional
June 29, 2014
17
2014. This suggests a possibility of another stagnant year for exploration investment in 2014.
Figure 27: Number of exploration wells in Indonesia Figure 28: Indonesia’s upstream oil and gas investment – lacking sufficient growth for exploration and development (2014 number is still based on government’s budget which in the past
years have failed to materialize)
Title:
Source:
Please fill in the values above to have them entered in your report
0
10
20
30
40
50
60
70
80
90
2001 2002 2003 2004 2005 2006 2007 2008 2009 2010 2011 2012 2013 2014*
Title:
Source:
Please fill in the values above to have them entered in your report
-5%
0%
5%
10%
15%
20%
25%
30%
35%
-
5,000
10,000
15,000
20,000
25,000
30,000
2007 2008 2009 2010 2011 2012 2013 2014*
Administration Exploration Development
Poduction Growth - RHS
US$ bn
SOURCES: SKK MIGAS SOURCES: SKK MIGAS
Industry players and observers have cited the problem with the current PSC regime as failing to compensate for the higher costs and risks associated with exploration in the frontier areas. This is despite the government‟s efforts to provide incentive packages for developments in deepwater and frontier areas (as well as marginal fields) since 1989. Existing investors have also cited the need for a better incentive to conduct the costly enhanced oil recovery (EOR) methods to arrest the production decline, while new investors are also looking for a more favourable bidding process.
Among the key issues highlighted by investors on recent PSC were changes in the cost recovery scheme. In particular, this involved the 2008 change which included the ring-fencing of cost recovery within a block to only include certain pre-selected fields (i.e. unlike the previous PSC term whereby costs from other fields within the block are recoverable against any remaining revenue produced from the asset/ block). Another change is the exclusion of some costs from the list of recoverable items.
Figure 29: Evolution of Indonesia oil & gas PSC scheme – turning less attractive despite higher industry risk
Differences 1st PSC Generation (1965-1976) 2nd PSC Generation (1976-1988) 3rd PSC Generation (since 1988)
FTP None None 20%
Cost Recovery Ceiling 40% 100% (no ceiling) 80% (due to FTP)
Investment Credit 20% 17% to 20%
DMO DMO was defined as 25% of equity oil 25% of equity oil, full price for the first 25% of equity oil, full price for the first
at 0.2 $/barel 60 months and 0.2 $/barel there after 60 months and 10% of export price there after
Equity to be split
Government:Contractor 65%:35% 85%:15% 85%:15% SOURCES: CIMB, COMPANY REPORTS
In 2013, President Susilo Bambang Yudhoyono issued a decree to establish a new regulatory body, Special Task Force “SKK Migas” to replace the previous body, “BP Migas”. Under the transition, most of international companies have postponed their investment as they wait for greater certainty in the sector. The arrest of chief of SKK Migas by the Corruption Eradication Commission (KPK)

Medco Energi Internasional
June 29, 2014
18
for allegedly accepting a bribe had further worsened the situation given delays in approvals of several oil and gas projects.
Widening net import of oil (hence, subsidies) due to strong consumption growth
Indonesia‟s declining oil production since 1990s bodes ill with the growing domestic energy consumption (3% CAGR over the past 10 year). As Indonesia dropped out of OPEC at the end of 2008 as its production has run below 1 million bpd, consumption growth has driven an increase in imports of refined products. Indonesia‟s net oil imports have run about 680,000 bpd over the past three years. Wood Mackenzie has projected that Indonesia is set to become the largest gasoline importer by 2018.
Figure 30: Indonesia’s falling oil production and rising domestic demand resulted in increasing oil imports
Title:
Source:
Please fill in the values above to have them entered in your report
-1000
-500
0
500
1000
1500
1966
1967
1968
1969
1970
1971
1972
1973
1974
1975
1976
1977
1978
1979
1980
1981
1982
1983
1984
1985
1986
1987
1988
1989
1990
1991
1992
1993
1994
1995
1996
1997
1998
1999
2000
2001
2002
2003
2004
2005
2006
2007
2008
2009
2010
2011
2012
2013
mbopd
SOURCES: BP STATISTICAL REVIEW 2014
Rising gas production, but lacking infrastructure
As Indonesia‟s oil production has been declining, Indonesia has attempted to shift towards natural gas to meet its energy needs. Contrary to its declining oil reserves, Indonesia‟s gas reserves have been growing and is currently at 9,656 mmboe, translating to 8.8 years of reserve life. The shift of energy supply toward natural gas has also been supported by higher gas allocation to the domestic market which now accounts for 54% of total allocation.
The domestic gas consumption has grown at 11% CAGR over the past 10 years, driven by the better availability of gas to the domestic market. In 2013, industrial users are the biggest consumers of gas (19% of total consumption), followed by electricity (16%) and fertiliser (10%). The availability of gas on a nationwide basis, however, is constrained by the limited availability of transportation infrastructure. Despite the better prospects for gas discovery, as reflected in the increasing number of gas wells, more investment in pipeline and gas processing facilities are still required to support further resource monetisation.

Medco Energi Internasional
June 29, 2014
19
Figure 31: Indonesia’s domestic gas consumption now accounts for 54% of total (11% CAGR since 2003)
Figure 32: Number of exploration well discovery in Indonesia over the past decade has favoured gas
Title:
Source:
Please fill in the values above to have them entered in your report
75 75 74 63 60 56 5356 56
51 49 46
25 2526
37 40 44 47
4444
4951
54
0
1000
2000
3000
4000
5000
6000
7000
8000
9000
2003 2004 2005 2006 2007 2008 2009 2010 2011 2012 2013 2014
Export Domestic
Title:
Source:
Please fill in the values above to have them entered in your report
0
5
10
15
20
25
30
35
2002 2003 2004 2005 2006 2007 2008 2009 2010 2011 2012
Oil Gas Oil & Gas
SOURCES: SKK MIGAS SOURCES: SKK MIGAS
Figure 33: Indonesia’s gas reserves are in surplus, but require infrastructure development
SOURCES: CIMB, COMPANY REPORTS
3.2 Hope for industry reforms
Having hit its lowest point in history, we think the sector‟s landscape should change in the coming years, unless the country wants to risk further widening of its budget deficit which clearly is unsustainable.
The government has set a clear target of raising crude oil production back to 1m bopd per day and increasing gas allocation to the domestic market. We think the strongest catalyst for a change in sector‟s landscape should come from the upcoming change in government, as any new government is expected to address the problems in energy sector.
In view of the potential change in industry landscape, we expect the following themes to drive positive interests into the Indonesian oil & gas stocks:
1) New government’s focus on improving energy sovereignty
In order to revive oil production and reserves, Indonesia needs to attract investment for E&P, especially in deepwater offshore and frontier areas. In our view, the problems for the sector are well understood namely the need to revise

Medco Energi Internasional
June 29, 2014
20
current PSC terms so that they will offer better incentives for exploration investments, and production through EOR.
The current running presidential candidates have both mentioned “energy sovereignty” as a key priority among their programmes. Overall, the proposals from Jokowi-Jusuf Kalla presidential candidate appears to address the issues in the sector in greater detail than that of Prabowo-Hatta (although this is not unique for just the energy sector). Interestingly, both candidates have proposed for the revision of the 2001 Oil & Gas Law as a means to improve investment incentive to the sector. Thus, we think both candidates clearly understand the need for industry reform.
Figure 34: Presidential candidates’ proposed policies in the energy sector
Jokowi-Kalla Prabowo-Hatta
1) Increasing oil field production 1) Revision of the existing oil & gas law to re-align with the Constitution of Republic of
Indonesia 1945.
2) Extension of life of oil/ gas fields with proper technologies 2) Development of oil refineries
3) Creation of a flexible fiscal system to promote investments in oil/ gas sector 3) Extension of energy conversion to include gas and renewables
4) Creation of an effective and efficient oil/ gas regulation 4) Development of 10,000MW of geothermal power generation
5) Issuance of government regulation in the short-term; revision of Oil & Gas Law no
2001 in the medium term
6) Reduction of subsidy and providing cheap energy. Conversion of 30% of fuel for
transportation to gas with the goal to reduce fuel subsidy by Rp60tn and lower energy
prices by 20%
7) Promoting renewable energies such as geothermal, hydro, biofuel, biomass and
improving procurement system
8) Increasing electrification ratio to 100%
9) Development of oil/gas infrastructure and oil refineries SOURCES: THE GENERAL ELECTIONS COMMISSION
Given the above, we think the sector could see more catalyst if Jokowi-Kalla wins the presidency. A win for Prabowo-Hatta should also be positive for the upstream sector, although the risk is an extreme policy of a review of the existing PSC terms given the statement on “re-allocating the resources for the welfare of the people”.
2) Rising gas volume and price
Having risen in proportion in the recent years, we think both gas production and allocation to the domestic market will continue to increase in the coming years. Indonesia‟s abundant gas reserves offer a logical option for the government to fill in the void left by declining oil production amid rising energy consumption.
Gas pipeline infrastructure and LNG plant development are potential drivers for a further increase in Indonesia‟s gas reserve monetisation. We expect rising gas volume from the projects coming onstream to benefit project owners (eg, MEDC), while additional gas supplies into the domestic market should benefit PGAS as the dominant player in the gas distribution business.

Medco Energi Internasional
June 29, 2014
21
Figure 35: MEDC’s gas production volume
Title:
Source:
Please fill in the values above to have them entered in your report
-
50
100
150
200
250
300
350
400
450
500
2012 2013 2014F 2015F 2016F 2017F
mmscfd
SOURCES: CIMB, COMPANY REPORTS
Concurrent with the rising gas supply, a combination of pent-up demand and domestic gas price‟s big discount to diesel price translate to room for gas prices to rise. Domestic gas prices have risen by 15% over the past five years, and we think there is room for prices to increase further given gas price‟s still big discount to diesel prices.
Figure 36: MEDC’s and PGAS’s average domestic gas selling prices have been rising in recent years
Title:
Source:
Please fill in the values above to have them entered in your report
0
2
4
6
8
10
12
2009 2010 2011 2012 2013 2014F
MEDC PGAS
US$/mmbtu
SOURCES: CIMB, COMPANY REPORTS
3) Industry capex recovery
Despite the overall falling production and discovery prospects, industry players are looking to maintain capex for assets under development and production stages. The upside in production should also come from assets which may be recovered through the EOR method, which at present remains held up by the lack of favourable PSC terms for such operations.
Combined with the potential improvement in the regulation and PSC regime, the above should translate into a potential recovery in the overall industry capex. Drilling and services companies should benefit from this trend, although we think competition, especially from foreign operators, could limit margin and market share upside for local companies with limited expertise.

Medco Energi Internasional
June 29, 2014
22
Figure 37: Indonesia’s oil & gas industry capex
Title:
Source:
Please fill in the values above to have them entered in your report
-5%
0%
5%
10%
15%
20%
25%
30%
35%
-
5,000
10,000
15,000
20,000
25,000
30,000
2007 2008 2009 2010 2011 2012 2013 2014*
Administration Exploration Development Poduction Growth - RHS
US$ bn
SOURCES: SKK MIGAS
Acquisition of assets in the domestic market has thus far only offered a limited upside for the Indonesian E&P players to add reserves. This is generally driven by the lack of available assets with good prospects. The recent acquisitions in the Indonesian oil & gas space have been dominated by assets still in the exploration stages and assets which are divested by foreign operators, mainly given the lack of certainty on the contract extension and declining reserves and production. This opens opportunities for local operators to gain entry into the industry.
PGAS has been quite active in the acquisition market (both domestic and overseas), as part of its efforts to improve its industry positioning. The company has spent US$1.1bn for acquisitions and is looking to spend another US$200m-400m to buy more assets.
Figure 38: Recent acquisitions in Indonesia’s O&G market by PGAS
Asset Stake Location Status Operator Acquisition (US$ m) 2P (mm boe) - nt Acquisition (US$/boe)
Bangkanai PSC 30% Central Kalimantan Development Salamander 27 7.0 3.9
Ketapang PSC 20% East Java Production Petronas Carigali 71 16.7 4.3
Pangkah PSC 100% East Java Production TBA 915 61.7 14.8
Total acquisition 1,013 85.4 11.9 SOURCES: CIMB, COMPANY REPORTS
4. RISKS
We think that the key risks to MEDC‟s outlook are:
4.1 Project execution risks
We have factored in the Senoro block‟s gas production and sales contribution to downstream LNG facility‟s (DSLNG) output starting in 2Q15 (2015 time-weighted sales volume of 188mmscfd). Our estimates assume a full-year sales contribution from 250mmscfd of production by 2016 and an additional 55mmscfd to PAU by 2017. Our assumptions are based on the expectation that the construction of both the upstream project and DSLNG is completed by end-3Q14.
According to management, the upstream project is more than 80% completed, while the downstream LNG project is 98% completed. Thus, we think that the execution risks are manageable at this juncture. However, any delays to the projects‟ completion or commencement of operations (scheduled six months after construction is completed) will have a negative impact on our earnings and valuation forecasts. We estimate that a three-month delay in the

Medco Energi Internasional
June 29, 2014
23
monetisation of Senoro‟s gas assets would lower our projected 2015 core net profit by 14% and DCF value by 1%.
We have not included any earnings contribution from MEDC‟s other growth assets (Block A gas and Libya oil) but we expect these assets to serve as future growth contributors once the supply from Senoro reaches plateau (in 2018). Thus, any delays in the development plans for Block A and the Libya oil blocks could result in MEDC‟s earnings trend declining, especially since the company‟s oil production from its existing assets will continue to decrease as the fields mature.
4.2 Oil price risks
We estimate that around 56% of MEDC‟s total oil and gas production in 2015 will be linked to oil price. This is higher than its oil exposure in 2013 (only around 51% of MEDC‟s total oil and gas production volume) since the additional gas production from the Senoro block will be sold at gas prices that are linked to oil prices.
Our base-case forecast assumes Brent crude oil price of US$105-107/bbl in 2014-16 and long-term price of US$105/bbl. We estimate that a 10% drop in our oil price assumption would lower our 2015 net profit projection by around 23% and DCF value by 16%.
4.3 Regulatory risks
MEDC‟s operations, which involve both domestic and overseas assets, expose the company to regulatory risks in Indonesia and other foreign countries.
Although Indonesia‟s latest production sharing contract (PSC) scheme lacks incentives for new investors, the contracts provide strong legal certainty for the existing projects. MEDC has demonstrated its ability to obtain extensions for expiring oil & gas PSC contracts in the past. Despite the proposal by one of the presidential candidates to review the oil & gas regulations, we think that there is low risk of PSC contracts being annulled by the new government at this juncture.
On the contrary, we think that MEDC faces high regulatory risks in certain foreign countries with unstable political situations such as Libya and Yemen. In particular, the future monetisation of the Libya Area 47 oil block (which currently accounts for 19% of MEDC‟s 2P reserves and 45% of contingent resources) hinges on the government‟s approval for the commercialisation of the total area of operations. Any changes in the government or its plan for the oil industry could severely affect MEDC‟s reserves, future production and earnings growth from the project.
5. FINANCIALS
Following a declining earnings trend in recent years, we expect the contribution of earnings and cash flow stream from the Senoro gas asset (which we project to start in 2015) to drive a strong improvement in MEDC‟s growth outlook and balance sheet.
5.1 Earnings outlook
Over the past three years, MEDC‟s core earnings have been on the declining trend, largely reflecting the drop in revenue (due to falling oil production) and rising costs (lifting and interest costs). We expect the contribution from Senoro asset should drive a 107% growth in core earnings to US$80m in 2015.
We assume revenue contribution from the Senoro asset to start in 2Q15, with construction completion by end of 3Q14 (for both the upstream operations and LNG facility) and successful commissioning period (6 months).
MEDC‟s revenue in the recent years comprised of contributions from oil (73%) and gas (20%) operations. Over the past years, MEDC‟s earnings have been partly supported by the increase in gas prices (21% CAGR in 2010-13), as a result of gas contract re-pricing. The revenue contribution from gas will

Medco Energi Internasional
June 29, 2014
24
increase to 38%, following Senoro‟s contribution in 2015. Given that the pricing of 81% of Senoro‟s gas output (250mmscfd sold to DSLNG) will be linked to oil prices, MEDC‟s future earnings will also be more sensitive to movements in oil prices.
Our earnings forecast assume crude oil prices of US$107, US$105 and US$105/ bbl in 2014-16 and LT assumption of US$105/bbl. We estimate around 23% change in our 2015 profit for every 10% change in crude oil price.
Figure 39: MEDC’s core earnings projection
Title:
Source:
Please fill in the values above to have them entered in your report
-60%
-40%
-20%
0%
20%
40%
60%
80%
100%
120%
-
20
40
60
80
100
120
2012 2013 2014F 2015F 2016F
Core profit growth - RHS
US$ mn
SOURCES: CIMB, COMPANY REPORTS
Figure 40: MEDC’s key earnings assumptions
2011 2012 2013 2014F 2015F 2016F
Rimau
Oil (mbopd) 30.2 30.1 26.9 23.6 22.1 21.9
Gas (bbtupd) 157.9 150.5 147.4 143.8 192.8 206.7
Total Oil & Gas (mboepd) 56.5 56.7 53.3 47.6 54.2 56.3
Average Selling Price
Oil (US$/barrel) 112 113 109 107 105 105
Gas (US$/mmbtu) 3.0 3.2 5.7 6.3 8.1 8.4 SOURCES: CIMB, COMPANY REPORTS
5.2 Cash flow outlook
MEDC had been in negative free cash flow in recent years on the back of the high capex (US$127m-220m per annum) spent on the projects (both on exploration and development). This has driven the increase in debt financing, totalling US$1.04bn over the past three years.
Similar to the projected earnings growth in 21015-16, we expect MEDC‟s operating cash flow to see a strong contribution from the Senoro gas asset. On the other hand, we have assumed that the company‟s capex will continue to remain high (US$230m-340m), as we expect the company to continue investing in its key producing and development assets.
In our capex assumption, we include capex from the Senoro upstream, DSLNG downstream as well as development capex for the producing assets. This is still below the company‟s full capex projection of US$1.4bn for the next three years. Thus, free cash flow may turn in a bigger negative if MEDC‟s capex spending rises beyond our forecast level, assuming that the company ramps up the capex for the development and exploration in the other projects.
Medco Energi Internasional
June 29, 2014
25
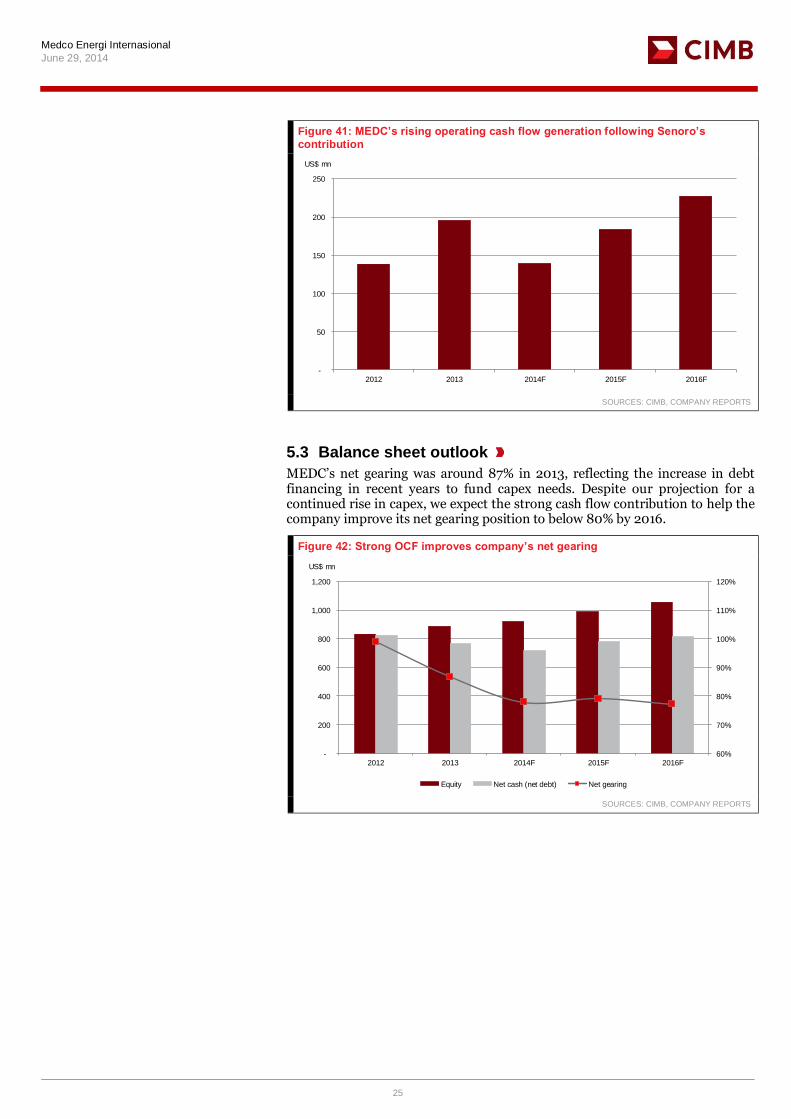
Figure 41: MEDC’s rising operating cash flow generation following Senoro’s contribution
Title:
Source:
Please fill in the values above to have them entered in your report
-
50
100
150
200
250
2012 2013 2014F 2015F 2016F
US$ mn
SOURCES: CIMB, COMPANY REPORTS
5.3 Balance sheet outlook
MEDC‟s net gearing was around 87% in 2013, reflecting the increase in debt financing in recent years to fund capex needs. Despite our projection for a continued rise in capex, we expect the strong cash flow contribution to help the company improve its net gearing position to below 80% by 2016.
Figure 42: Strong OCF improves company’s net gearing
Title:
Source:
Please fill in the values above to have them entered in your report
60%
70%
80%
90%
100%
110%
120%
-
200
400
600
800
1,000
1,200
2012 2013 2014F 2015F 2016F
Equity Net cash (net debt) Net gearing
US$ mn
SOURCES: CIMB, COMPANY REPORTS
Medco Energi Internasional
June 29, 2014
26
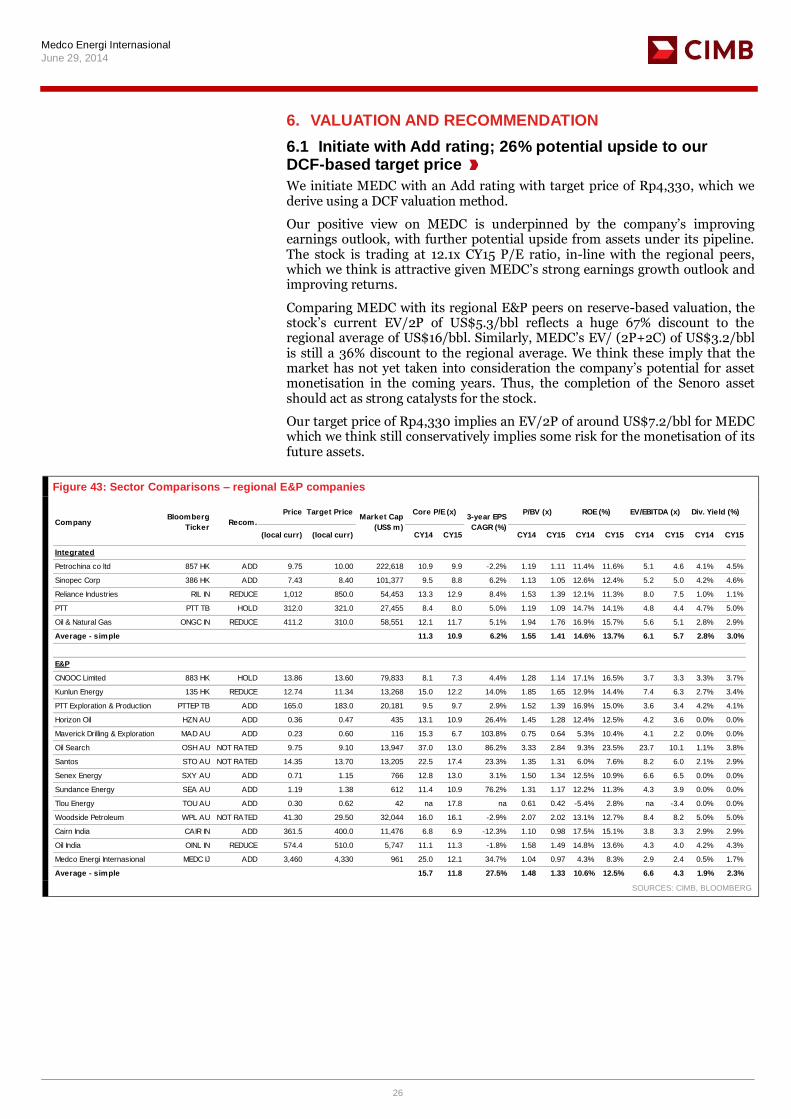
6. VALUATION AND RECOMMENDATION
6.1 Initiate with Add rating; 26% potential upside to our DCF-based target price
We initiate MEDC with an Add rating with target price of Rp4,330, which we derive using a DCF valuation method.
Our positive view on MEDC is underpinned by the company‟s improving earnings outlook, with further potential upside from assets under its pipeline. The stock is trading at 12.1x CY15 P/E ratio, in-line with the regional peers, which we think is attractive given MEDC‟s strong earnings growth outlook and improving returns.
Comparing MEDC with its regional E&P peers on reserve-based valuation, the stock‟s current EV/2P of US$5.3/bbl reflects a huge 67% discount to the regional average of US$16/bbl. Similarly, MEDC‟s EV/ (2P+2C) of US$3.2/bbl is still a 36% discount to the regional average. We think these imply that the market has not yet taken into consideration the company‟s potential for asset monetisation in the coming years. Thus, the completion of the Senoro asset should act as strong catalysts for the stock.
Our target price of Rp4,330 implies an EV/2P of around US$7.2/bbl for MEDC which we think still conservatively implies some risk for the monetisation of its future assets.
Figure 43: Sector Comparisons – regional E&P companies
Price Target Price
(local curr) (local curr) CY14 CY15 CY14 CY15 CY14 CY15 CY14 CY15 CY14 CY15
Integrated
Petrochina co ltd 857 HK ADD 9.75 10.00 222,618 10.9 9.9 -2.2% 1.19 1.11 11.4% 11.6% 5.1 4.6 4.1% 4.5%
Sinopec Corp 386 HK ADD 7.43 8.40 101,377 9.5 8.8 6.2% 1.13 1.05 12.6% 12.4% 5.2 5.0 4.2% 4.6%
Reliance Industries RIL IN REDUCE 1,012 850.0 54,453 13.3 12.9 8.4% 1.53 1.39 12.1% 11.3% 8.0 7.5 1.0% 1.1%
PTT PTT TB HOLD 312.0 321.0 27,455 8.4 8.0 5.0% 1.19 1.09 14.7% 14.1% 4.8 4.4 4.7% 5.0%
Oil & Natural Gas ONGC IN REDUCE 411.2 310.0 58,551 12.1 11.7 5.1% 1.94 1.76 16.9% 15.7% 5.6 5.1 2.8% 2.9%
Average - simple 11.3 10.9 6.2% 1.55 1.41 14.6% 13.7% 6.1 5.7 2.8% 3.0%
E&P
CNOOC Limited 883 HK HOLD 13.86 13.60 79,833 8.1 7.3 4.4% 1.28 1.14 17.1% 16.5% 3.7 3.3 3.3% 3.7%
Kunlun Energy 135 HK REDUCE 12.74 11.34 13,268 15.0 12.2 14.0% 1.85 1.65 12.9% 14.4% 7.4 6.3 2.7% 3.4%
PTT Exploration & Production PTTEP TB ADD 165.0 183.0 20,181 9.5 9.7 2.9% 1.52 1.39 16.9% 15.0% 3.6 3.4 4.2% 4.1%
Horizon Oil HZN AU ADD 0.36 0.47 435 13.1 10.9 26.4% 1.45 1.28 12.4% 12.5% 4.2 3.6 0.0% 0.0%
Maverick Drilling & Exploration MAD AU ADD 0.23 0.60 116 15.3 6.7 103.8% 0.75 0.64 5.3% 10.4% 4.1 2.2 0.0% 0.0%
Oil Search OSH AU NOT RATED 9.75 9.10 13,947 37.0 13.0 86.2% 3.33 2.84 9.3% 23.5% 23.7 10.1 1.1% 3.8%
Santos STO AU NOT RATED 14.35 13.70 13,205 22.5 17.4 23.3% 1.35 1.31 6.0% 7.6% 8.2 6.0 2.1% 2.9%
Senex Energy SXY AU ADD 0.71 1.15 766 12.8 13.0 3.1% 1.50 1.34 12.5% 10.9% 6.6 6.5 0.0% 0.0%
Sundance Energy SEA AU ADD 1.19 1.38 612 11.4 10.9 76.2% 1.31 1.17 12.2% 11.3% 4.3 3.9 0.0% 0.0%
Tlou Energy TOU AU ADD 0.30 0.62 42 na 17.8 na 0.61 0.42 -5.4% 2.8% na -3.4 0.0% 0.0%
Woodside Petroleum WPL AU NOT RATED 41.30 29.50 32,044 16.0 16.1 -2.9% 2.07 2.02 13.1% 12.7% 8.4 8.2 5.0% 5.0%
Cairn India CAIR IN ADD 361.5 400.0 11,476 6.8 6.9 -12.3% 1.10 0.98 17.5% 15.1% 3.8 3.3 2.9% 2.9%
Oil India OINL IN REDUCE 574.4 510.0 5,747 11.1 11.3 -1.8% 1.58 1.49 14.8% 13.6% 4.3 4.0 4.2% 4.3%
Medco Energi Internasional MEDC IJ ADD 3,460 4,330 961 25.0 12.1 34.7% 1.04 0.97 4.3% 8.3% 2.9 2.4 0.5% 1.7%
Average - simple 15.7 11.8 27.5% 1.48 1.33 10.6% 12.5% 6.6 4.3 1.9% 2.3%
P/BV (x) ROE (%) EV/EBITDA (x) Div. Yield (%)
CompanyBloomberg
TickerRecom.
Market Cap
(US$ m)
Core P/E (x)3-year EPS
CAGR (%)
SOURCES: CIMB, BLOOMBERG

Medco Energi Internasional
June 29, 2014
27
Figure 44: Regional E&P companies’ EV/ 2P (US$/ bbl)
Title:
Source:
Please fill in the values above to have them entered in your report
3.9 5.3 5.9
9.3 9.9
12.6 12.8 13.3
15.8 16.8 16.8 16.9
20.8 21.5
29.1
31.6 32.9
Average of US$ 16.2/ bbl
-
5.0
10.0
15.0
20.0
25.0
30.0
35.0
Energ
i M
ega
Pers
ada
Medco
Energ
i
Oil
India
Sala
mander E
ner
gy
AW
E L
imited
PT
TE
P
Santo
s
Senex
Energ
y
RO
C O
il
Pre
mie
r O
il
Soco
Inte
rnatio
nal
Kris
Energ
y
CN
OO
C
Woodsi
de
Pet
role
um
RH
Petr
ogas
Cairn
Horizo
n O
il
SOURCES: CIMB, COMPANY REPORTS
Figure 45: Regional E&Pcompanies EV/ 2P+2C (US$/ bbl)
Title:
Source:
Please fill in the values above to have them entered in your report
1.2 2.1
3.2 3.3
4.1 4.2 4.7 4.8 4.9
5.4 5.5 5.5
6.3
9.1
9.9
Average of US$ 4.9/ bbl
-
2.0
4.0
6.0
8.0
10.0
12.0
Senex
Energ
y
Energ
i M
ega
Pers
ada
Medco
Energ
i
Sala
mander E
ner
gy
Oil
India
RH
Petr
ogas
RO
C O
il
AW
E L
imited
PT
TE
P
Santo
s
Horizo
n O
il
Pre
mie
r O
il
Kris
Energ
y
Cairn
Woodsi
de
Pet
role
um
SOURCES: CIMB, COMPANY REPORTS
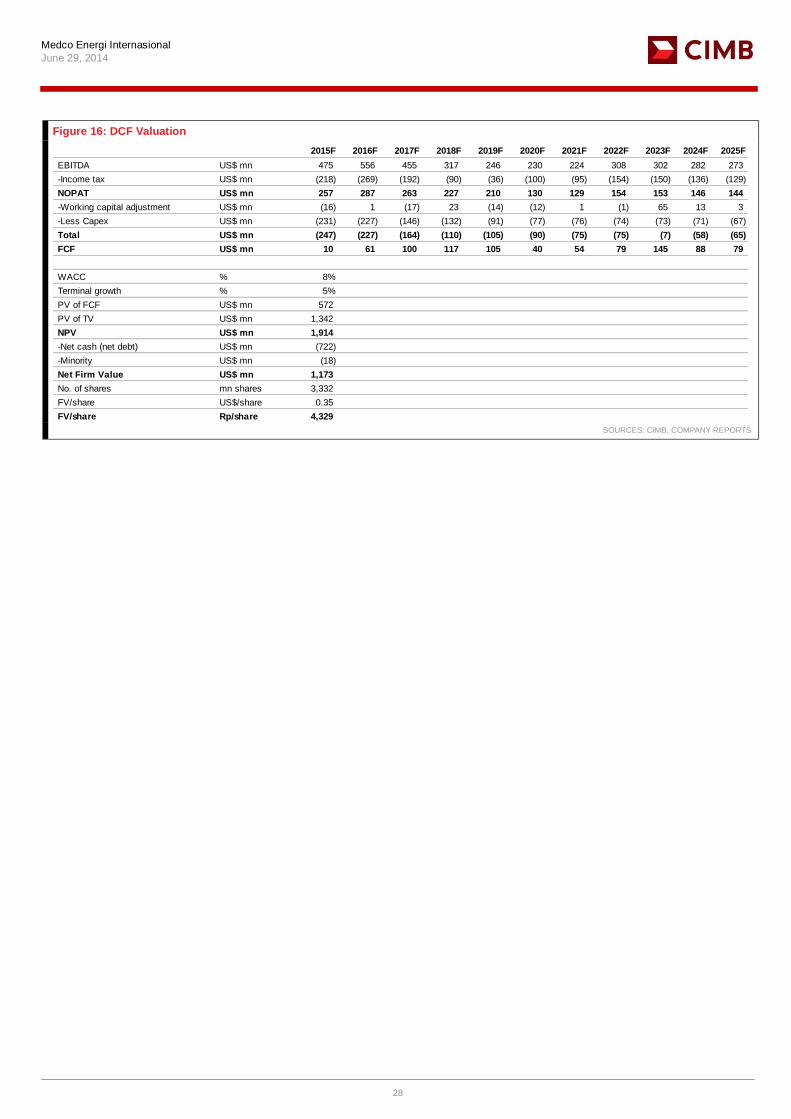
6.2 Target price derivation
We derive the target price of Rp4,330 using a DCF valuation method (WACC: 7.8%, LT growth of 5%). The company‟s low WACC is attributed to its high tax rate, combined with our conservative assumption of 7.5% cost of debt (above the company‟s actual debt cost of 6%). Our 5% LT growth rate is admittedly high, but we think this should reflect the future cash flow and value of MEDC‟s assets which have currently yet to be monetised.
Our DCF-based target price implies a valuation of 14.7x CY15 P/E, which we think is fair given MEDC‟s strong potential earnings growth.
Medco Energi Internasional
June 29, 2014
28
Figure 16: DCF Valuation
2015F 2016F 2017F 2018F 2019F 2020F 2021F 2022F 2023F 2024F 2025F
EBITDA US$ mn 475 556 455 317 246 230 224 308 302 282 273
-Income tax US$ mn (218) (269) (192) (90) (36) (100) (95) (154) (150) (136) (129)
NOPAT US$ mn 257 287 263 227 210 130 129 154 153 146 144
-Working capital adjustment US$ mn (16) 1 (17) 23 (14) (12) 1 (1) 65 13 3
-Less Capex US$ mn (231) (227) (146) (132) (91) (77) (76) (74) (73) (71) (67)
Total US$ mn (247) (227) (164) (110) (105) (90) (75) (75) (7) (58) (65)
FCF US$ mn 10 61 100 117 105 40 54 79 145 88 79
WACC % 8%
Terminal growth % 5%
PV of FCF US$ mn 572
PV of TV US$ mn 1,342
NPV US$ mn 1,914
-Net cash (net debt) US$ mn (722)
-Minority US$ mn (18)
Net Firm Value US$ mn 1,173
No. of shares mn shares 3,332
FV/share US$/share 0.35
FV/share Rp/share 4,329 SOURCES: CIMB, COMPANY REPORTS

Medco Energi Internasional
June 29, 2014
29
DISCLAIMER
This report is not directed to, or intended for distribution to or use by, any person or entity who is a citizen or resident of or located in any locality, state, country or other jurisdiction where such distribution, publication, availability or use would be contrary to law or regulation.
By accepting this report, the recipient hereof represents and warrants that he is entitled to receive such report in accordance with the restrictions set forth below and agrees to be bound by the limitations contained herein (including the “Restrictions on Distributions” set out below). Any failure to comply with these limitations may constitute a violation of law. This publication is being supplied to you strictly on the basis that it will remain confidential. No part of this report may be (i) copied, photocopied, duplicated, stored or reproduced in any form
by any means or (ii) redistributed or passed on, directly or indirectly, to any other person in whole or in part, for any purpose without the prior written consent of CIMB.
Unless otherwise specified, this report is based upon sources which CIMB considers to be reasonable. Such sources will, unless otherwise specified, for market data, be market data and prices available from the main stock exchange or market where the relevant security is listed, or, where appropriate, any other market. Information on the accounts and business of company(ies) will generally be based on published statements of the company(ies), information disseminated by regulatory information services, other publicly available information
and information resulting from our research.
Whilst every effort is made to ensure that statements of facts made in this report are accurate, all estimates, projections, forecasts, expressions of opinion and other subjective judgments contained in this report are based on assumptions considered to be reasonable as of the date of the document in which they are contained and must not be construed as a
representation that the matters referred to therein will occur. Past performance is not a reliable indicator of future performance. The value of investments may go down as well as up and those investing may, depending on the investments in question, lose more than the initial investment. No report shall constitute an offer or an invitation by or on behalf of CIMB or its affiliates to any person to buy or sell any investments.
CIMB, its affiliates and related companies, their directors, associates, connected parties and/or employees may own or have positions in securities of the company(ies) covered in this research report or any securities related thereto and may from time to time add to or dispose of, or may be materially interested in, any such securities. Further, CIMB, its affiliates and its related companies do and seek to do business with the company(ies) covered in this research report and may from time to time act as market maker or have assumed an underwriting commitment in securities of such company(ies), may sell them to or buy them from customers on a principal basis and may also perform or seek to perform significant investment
banking, advisory, underwriting or placement services for or relating to such company(ies) as well as solicit such investment, advisory or other services from any entity mentioned in this report.
CIMB or its affiliates may enter into an agreement with the company(ies) covered in this report relating to the production of research reports. CIMB may disclose the contents of this report to the company(ies) covered by it and may have amended the contents of this report following such disclosure.
The analyst responsible for the production of this report hereby certifies that the views expressed herein accurately and exclusively reflect his or her personal views and opinions about any and all of the issuers or securities analysed in this report and were prepared independently and autonomously. No part of the compensation of the analyst(s) was, is, or will be directly or indirectly related to the inclusion of specific recommendations(s) or view(s) in this report. CIMB prohibits the analyst(s) who prepared this research report from receiving any
compensation, incentive or bonus based on specific investment banking transactions or for providing a specific recommendation for, or view of, a particular company. Information barriers and other arrangements may be established where necessary to prevent conflicts of interests arising. However, the analyst(s) may receive compensation that is based on his/their coverage of company(ies) in the performance of his/their duties or the performance of his/their recommendations and the research personnel involved in the preparation of this report may also participate in the solicitation of the businesses as described above. In reviewing this research report, an investor should be aware that any or all of the foregoing, among
other things, may give rise to real or potential conflicts of interest. Additional information is, subject to the duties of confidentiality, available on request.
Reports relating to a specific geographical area are produced by the corresponding CIMB entity as listed in the table below. The term “CIMB” shall denote, where appropriate, the relevant entity distributing or disseminating the report in the particular jurisdiction referenced below, or, in every other case, CIMB Group Holdings Berhad ("CIMBGH") and its affiliates,
subsidiaries and related companies.
Country CIMB Entity Regulated by
Australia CIMB Securities (Australia) Limited Australian Securities & Investments Commission
Hong Kong CIMB Securities Limited Securities and Futures Commission Hong Kong
Indonesia PT CIMB Securities Indonesia Financial Services Authority of Indonesia
India CIMB Securities (India) Private Limited Securities and Exchange Board of India (SEBI)
Malaysia CIMB Investment Bank Berhad Securities Commission Malaysia
Singapore CIMB Research Pte. Ltd. Monetary Authority of Singapore
South Korea CIMB Securities Limited, Korea Branch Financial Services Commission and Financial Supervisory Service
Taiwan CIMB Securities Limited, Taiwan Branch Financial Supervisory Commission
Thailand CIMB Securities (Thailand) Co. Ltd. Securities and Exchange Commission Thailand
(i) As of June 27, 2014 CIMB has a proprietary position in the securities (which may include but not limited to shares, warrants, call warrants and/or any other derivatives) in the
following company or companies covered or recommended in this report:
(a) PTT Exploration & Production
(ii) As of June 29, 2014, the analyst(s) who prepared this report, has / have an interest in the securities (which may include but not limited to shares, warrants, call warrants and/or any other derivatives) in the following company or companies covered or recommended in this report:
(a) -
The information contained in this research report is prepared from data believed to be correct and reliable at the time of issue of this report. CIMB may or may not issue regular reports on the subject matter of this report at any frequency and may cease to do so or change the periodicity of reports at any time. CIMB is under no obligation to update this report in the
event of a material change to the information contained in this report. This report does not purport to contain all the information that a prospective investor may require. CIMB or any of its affiliates does not make any guarantee, representation or warranty, express or implied, as to the adequacy, accuracy, completeness, reliability or fairness of any such information and opinion contained in this report. Neither CIMB nor any of its affiliates nor its related persons shall be liable in any manner whatsoever for any consequences (including but not limited to any direct, indirect or consequential losses, loss of profits and damages) of any reliance thereon or usage thereof.
This report is general in nature and has been prepared for information purposes only. It is intended for circulation amongst CIMB and its affiliates’ clients generally and does not have regard to the specific investment objectives, financial situation and the particular needs of any specific person who may receive this report. The information and opinions in this report are not and should not be construed or considered as an offer, recommendation or solicitation to buy or sell the subject securities, related investments or other financial instruments thereof.
Investors are advised to make their own independent evaluation of the information contained in this research report, consider their own individual investment objectives, financial situation and particular needs and consult their own professional and financial advisers as to the legal, business, financial, tax and other aspects before participating in any transaction in respect of the securities of company(ies) covered in this research report. The securities of such company(ies) may not be eligible for sale in all jurisdictions or to all categories of investors.
Australia: Despite anything in this report to the contrary, this research is provided in Australia by CIMB Securities (Australia) Limited (“CSAL”) (ABN 84 002 768 701, AFS Licence number 240 530). CSAL is a Market Participant of ASX Ltd, a Clearing Participant of ASX Clear Pty Ltd, a Settlement Participant of ASX Settlement Pty Ltd, and, a participant of Chi X Australia Pty Ltd. This research is only available in Australia to persons who are “wholesale clients” (within the meaning o f the Corporations Act 2001 (Cth)) and is supplied solely for
the use of such wholesale clients and shall not be distributed or passed on to any other person. This research has been prepared without taking into account the objectives, financial situation or needs of the individual recipient.
France: Only qualified investors within the meaning of French law shall have access to this report. This report shall not be considered as an offer to subscribe to, or used in connection with, any offer for subscription or sale or marketing or direct or indirect distribution of financial instruments and it is not intended as a solicitation for the purchase of any financial
instrument.

Medco Energi Internasional
June 29, 2014
30
Hong Kong: This report is issued and distributed in Hong Kong by CIMB Securities Limited (“CHK”) which is licensed in Hong Kong by the Securities and Futures Commission for Type 1 (dealing in securities), Type 4 (advising on securities) and Type 6 (advising on corporate finance) activities. Any investors wishing to purchase or otherwise deal in the securities
covered in this report should contact the Head of Sales at CIMB Securities Limited. The views and opinions in this research report are our own as of the date hereof and are subject to change. If the Financial Services and Markets Act of the United Kingdom or the rules of the Financial Conduct Authority apply to a recipient, our obligations owed to such recipient therein are unaffected. CHK has no obligation to update its opinion or the information in this research report.
This publication is strictly confidential and is for private circulation only to clients of CHK. This publication is being supplied to you strictly on the basis that it will remain confidential. No
part of this material may be (i) copied, photocopied, duplicated, stored or reproduced in any form by any means or (ii) redistributed or passed on, directly or indirectly, to any other person in whole or in part, for any purpose without the prior written consent of CHK. Unless permitted to do so by the securities laws of Hong Kong, no person may issue or have in its possession for the purposes of issue, whether in Hong Kong or elsewhere, any advertisement, invitation or document relating to the securities covered in this report, which is directed at, or the contents of which are likely to be accessed or read by, the public in Hong Kong (except if permitted to do so under the securities laws of Hong Kong).
India: This report is issued and distributed in India by CIMB Securities (India) Private Limited (“CIMB India”) which is registered with SEBI as a stock-broker under the Securities and Exchange Board of India (Stock Brokers and Sub-Brokers) Regulations, 1992 and in accordance with the provisions of Regulation 4 (g) of the Securities and Exchange Board of India (Investment Advisers) Regulations, 2013, CIMB India is not required to seek registration with SEBI as an Investment Adviser.
The research analysts, strategists or economists principally responsible for the preparation of this research report are segregated from the other activities of CIMB India and they have received compensation based upon various factors, including quality, accuracy and value of research, firm profitability or revenues, client feedback and competitive factors. Research analysts', strategists' or economists' compensation is not linked to investment banking or capital markets transactions performed or proposed to be performed by CIMB India or its
affiliates.
Indonesia: This report is issued and distributed by PT CIMB Securities Indonesia (“CIMBI”). The views and opinions in this research report are our own as of the date hereof and are subject to change. If the Financial Services and Markets Act of the United Kingdom or the rules of the Financial Conduct Authority apply to a recipient, our obligations owed to such recipient therein are unaffected. CIMBI has no obligation to update its opinion or the information in this research report.
This publication is strictly confidential and is for private circulation only to clients of CIMBI. This publication is being supplied to you strictly on the basis that it will remain confidential. No part of this material may be (i) copied, photocopied, duplicated, stored or reproduced in any form by any means or (ii) redistributed or passed on, directly or indirectly, to any other person in whole or in part, for any purpose without the prior written consent of CIMBI. Neither this report nor any copy hereof may be distributed in Indonesia or to any Indonesian citizens
wherever they are domiciled or to Indonesia residents except in compliance with applicable Indonesian capital market laws and regulations.
Malaysia: This report is issued and distributed by CIMB Investment Bank Berhad (“CIMB”). The views and opinions in this research report are our own as of the date hereof and are subject to change. If the Financial Services and Markets Act of the United Kingdom or the rules of the Financial Conduct Authority apply to a recipient, our obligations owed to such
recipient therein are unaffected. CIMB has no obligation to update its opinion or the information in this research report.
This publication is strictly confidential and is for private circulation only to clients of CIMB. This publication is being supplied to you strictly on the basis that it will remain confidential. No part of this material may be (i) copied, photocopied, duplicated, stored or reproduced in any form by any means or (ii) redistributed or passed on, directly or indirectly, to any other person in whole or in part, for any purpose without the prior written consent of CIMB.
New Zealand: In New Zealand, this report is for distribution only to persons whose principal business is the investment of money or who, in the course of, and for the purposes of their business, habitually invest money pursuant to Section 3(2)(a)(ii) of the Securities Act 1978.
Singapore: This report is issued and distributed by CIMB Research Pte Ltd (“CIMBR”). Recipients of this report are to contact CIMBR in S ingapore in respect of any matters arising from, or in connection with, this report. The views and opinions in this research report are our own as of the date hereof and are subject to change. If the Financial Services and Markets Act of the United Kingdom or the rules of the Financial Conduct Authority apply to a recipient, our obligations owed to such recipient therein are unaffected. CIMBR has no obligation to update its opinion or the information in this research report.
This publication is strictly confidential and is for private circulation only. If the recipient of this research report is not an accredited investor, expert investor or institutional investor, CIMBR accepts legal responsibility for the contents of the report without any disclaimer limiting or otherwise curtailing such legal responsibility. This publication is being supplied to you strictly on the basis that it will remain confidential. No part of this material may be (i) copied, photocopied, duplicated, stored or reproduced in any form by any means or (ii) redistributed or passed on, directly or indirectly, to any other person in whole or in part, for any purpose without the prior written consent of CIMBR..
As of June 27, 2014, CIMBR does not have a proprietary position in the recommended securities in this report.
South Korea: This report is issued and distributed in South Korea by CIMB Securities Limited, Korea Branch ("CIMB Korea") which is licensed as a cash equity broker, and regulated
by the Financial Services Commission and Financial Supervisory Service of Korea.
The views and opinions in this research report are our own as of the date hereof and are subject to change, and this report shall not be considered as an offer to subscribe to, or used in connection with, any offer for subscription or sale or marketing or direct or indirect distribution of financial investment instruments and it is not intended as a solicitation for the
purchase of any financial investment instrument.
This publication is strictly confidential and is for private circulation only, and no part of this material may be (i) copied, photocopied, duplicated, stored or reproduced in any form by any means or (ii) redistributed or passed on, directly or indirectly, to any other person in whole or in part, for any purpose without the prior written consent of CIMB Korea.
Sweden: This report contains only marketing information and has not been approved by the Swedish Financial Supervisory Authority. The distribution of this report is not an offer to sell to any person in Sweden or a solicitation to any person in Sweden to buy any instruments described herein and may not be forwarded to the public in Sweden.
Taiwan: This research report is not an offer or marketing of foreign securities in Taiwan. The securities as referred to in this research report have not been and will not be registered with
the Financial Supervisory Commission of the Republic of China pursuant to relevant securities laws and regulations and may not be offered or sold within the Republic of China through a public offering or in circumstances which constitutes an offer or a placement within the meaning of the Securities and Exchange Law of the Republic of China that requires a registration or approval of the Financial Supervisory Commission of the Republic of China.
Thailand: This report is issued and distributed by CIMB Securities (Thailand) Company Limited (CIMBS). The views and opinions in this research report are our own as of the date
hereof and are subject to change. If the Financial Services and Markets Act of the United Kingdom or the rules of the Financial Conduct Authority apply to a recipient, our obligations owed to such recipient therein are unaffected. CIMBS has no obligation to update its opinion or the information in this research report.
This publication is strictly confidential and is for private circulation only to clients of CIMBS. This publication is being supplied to you strictly on the basis that it will remain confidential. No
part of this material may be (i) copied, photocopied, duplicated, stored or reproduced in any form by any means or (ii) redistributed or passed on, directly or indirectly, to any other person in whole or in part, for any purpose without the prior written consent of CIMBS.
Corporate Governance Report:
The disclosure of the survey result of the Thai Institute of Directors Association (“IOD”) regarding corporate governance is made pursuant to the policy of the Office of the Securities and Exchange Commission. The survey of the IOD is based on the information of a company listed on the Stock Exchange of Thailand and the Market for Alternative Investment disclosed to the public and able to be accessed by a general public investor. The result, therefore, is from the perspective of a third party. It is not an evaluation of operation and is not based on inside information.
The survey result is as of the date appearing in the Corporate Governance Report of Thai Listed Companies. As a result, the survey result may be changed after that date. CIMBS does not confirm nor certify the accuracy of such survey result.
Score Range: 90 – 100 80 – 89 70 – 79 Below 70 or No Survey Result Description: Excellent Very Good Good N/A
United Arab Emirates: The distributor of this report has not been approved or licensed by the UAE Central Bank or any other relevant licensing authorities or governmental agencies
in the United Arab Emirates. This report is strictly private and confidential and has not been reviewed by, deposited or registered with UAE Central Bank or any other licensing authority or governmental agencies in the United Arab Emirates. This report is being issued outside the United Arab Emirates to a limited number of institutional investors and must not be provided to any person other than the original recipient and may not be reproduced or used for any other purpose. Further, the information contained in this report is not intended to lead to the sale of investments under any subscription agreement or the conclusion of any other contract of whatsoever nature within the territory of the United Arab Emirates.
United Kingdom and Europe: In the United Kingdom and European Economic Area, this report is being disseminated by CIMB Securities (UK) Limited (“CIMB UK”). CIMB UK is

Medco Energi Internasional
June 29, 2014
31
authorised and regulated by the Financial Conduct Authority and its registered office is at 27 Knightsbridge, London, SW1X 7YB. This report is for distribution only to, and is solely directed at, selected persons on the basis that those persons: (a) are persons that are eligible counterparties and professional clients of CIMB UK; (b) have professional experience in
matters relating to investments falling within Article 19(5) of the Financial Services and Markets Act 2000 (Financial Promot ion) Order 2005 (as amended, the “Order”); (c) are persons falling within Article 49 (2) (a) to (d) (“high net worth companies, unincorporated associations etc”) of the Order; (d) are outside the United Kingdom; or (e) are persons to whom an invitation or inducement to engage in investment activity (within the meaning of section 21 of the Financial Services and Markets Act 2000) in connection with any investments to which this report relates may otherwise lawfully be communicated or caused to be communicated (all such persons together being referred to as “relevant persons”). This report is directed
only at relevant persons and must not be acted on or relied on by persons who are not relevant persons. Any investment or investment activity to which this report relates is available only to relevant persons and will be engaged in only with relevant persons.
Only where this report is labelled as non-independent, it does not provide an impartial or objective assessment of the subject matter and does not constitute independent "investment research" under the applicable rules of the Financial Conduct Authority in the UK. Consequently, any such non-independent report will not have been prepared in accordance with legal
requirements designed to promote the independence of investment research and will not subject to any prohibition on dealing ahead of the dissemination of investment research.
United States: This research report is distributed in the United States of America by CIMB Securities (USA) Inc, a U.S.-registered broker-dealer and a related company of CIMB Research Pte Ltd, CIMB Investment Bank Berhad, PT CIMB Securities Indonesia, CIMB Securities (Thailand) Co. Ltd, CIMB Securities Limited, CIMB Securities (Australia) Limited,
CIMB Securities (India) Private Limited, and is distributed solely to persons who qualify as "U.S. Institutional Investors" as defined in Rule 15a-6 under the Securities and Exchange Act of 1934. This communication is only for Institutional Investors whose ordinary business activities involve investing in shares, bonds and associated securities and/or derivative securities and who have professional experience in such investments. Any person who is not a U.S. Institutional Investor or Major Institutional Investor must not rely on this communication. The delivery of this research report to any person in the United States of America is not a recommendation to effect any transactions in the securities discussed herein, or an endorsement
of any opinion expressed herein. CIMB Securities (USA) Inc, is a FINRA/SIPC member and takes responsibility for the content of this report. For further information or to place an order in any of the above-mentioned securities please contact a registered representative of CIMB Securities (USA) Inc.
Other jurisdictions: In any other jurisdictions, except if otherwise restricted by laws or regulations, this report is only for distribution to professional, institutional or sophisticated
investors as defined in the laws and regulations of such jurisdictions.
Rating Distribution (%) Investment Banking clients (%)
Outperform/Buy/Trading Buy/Add 56.2% 4.6%
Neutral/Hold 28.0% 2.7%
Underperform/Sell/Trading Sell/Reduce 15.8% 1.0%
Distribution of stock ratings and investment banking clients for quarter ended on 31 March 2014
1416 companies under coverage for quarter ended on 31 March 2014
Spitzer Chart for stock being researched ( 2 year data )
Medco Energi Internasional (MEDC IJ)
1,200
1,700
2,200
2,700
3,200
3,700
Jun-12 Oct-12 Mar-13 Jul-13 Nov-13 Mar-14
Price Close
As at the time of publishing this report CIMB is phasing in an absolute recommendation structure for stocks (Framework #1). Please refer to all frameworks for a definition of any recommendations stated in this report.
CIMB Recommendation Framework #1 Stock Ratings Definition
Add The stock’s total return is expected to exceed 10% over the next 12 months. Hold The stock’s total return is expected to be between 0% and positive 10% over the next 12 months. Reduce The stock’s total return is expected to fall below 0% or more over the next 12 months.
The total expected return of a stock is defined as the sum of the: (i) percentage difference between the target price and the current price and (ii) the forward net dividend yields of the
stock. Stock price targets have an investment horizon of 12 months.
Sector Ratings Definition
Overweight An Overweight rating means stocks in the sector have, on a market cap-weighted basis, a positive absolute recommendation. Neutral A Neutral rating means stocks in the sector have, on a market cap-weighted basis, a neutral absolute recommendation. Underweight An Underweight rating means stocks in the sector have, on a market cap-weighted basis, a negative absolute recommendation.
Country Ratings Definition
Overweight An Overweight rating means investors should be positioned with an above-market weight in this country relative to benchmark. Neutral A Neutral rating means investors should be positioned with a neutral weight in this country relative to benchmark. Underweight An Underweight rating means investors should be positioned with a below-market weight in this country relative to benchmark.
CIMB Stock Recommendation Framework #2 * Outperform The stock's total return is expected to exceed a relevant benchmark's total return by 5% or more over the next 12 months. Neutral The stock's total return is expected to be within +/-5% of a relevant benchmark's total return. Underperform The stock's total return is expected to be below a relevant benchmark's total return by 5% or more over the next 12 months. Trading Buy The stock's total return is expected to exceed a relevant benchmark's total return by 3% or more over the next 3 months.
Trading Sell The stock's total return is expected to be below a relevant benchmark's total return by 3% or more over the next 3 months.

Medco Energi Internasional
June 29, 2014
32
* This framework only applies to stocks listed on the Singapore Stock Exchange, Bursa Malaysia, Stock Exchange of Thailand, Jakarta Stock Exchange, Australian Securities Exchange, Taiwan Stock Exchange and National Stock Exchange of India/Bombay Stock Exchange. Occasionally, it is permitted for the total expected returns to be temporarily
outside the prescribed ranges due to extreme market volatility or other justifiable company or industry-specific reasons. CIMB Research Pte Ltd (Co. Reg. No. 198701620M)
CIMB Stock Recommendation Framework #3 ** Outperform Expected positive total returns of 10% or more over the next 12 months. Neutral Expected total returns of between -10% and +10% over the next 12 months.
Underperform Expected negative total returns of 10% or more over the next 12 months. Trading Buy Expected positive total returns of 10% or more over the next 3 months. Trading Sell Expected negative total returns of 10% or more over the next 3 months.
** This framework only applies to stocks listed on the Korea Exchange, Hong Kong Stock Exchange and China listings on the Singapore Stock Exchange. Occasionally, it is permitted for the total expected returns to be temporarily outside the prescribed ranges due to extreme market volatility or other justifiable company or industry-specific reasons.
Corporate Governance Report of Thai Listed Companies (CGR). CG Rating by the Thai Institute of Directors Association (IOD) in 2013.
AAV – Good, ADVANC - Excellent, AMATA - Very Good, ANAN – Good, AOT - Excellent, AP - Very Good, BANPU - Excellent , BAY - Excellent , BBL - Excellent, BCH – Good,
BCP - Excellent, BEC - Very Good, BGH - not available, BJC – Very Good, BH - Very Good, BIGC - Very Good, BTS - Excellent, CCET – Very Good, CENTEL – Very Good, CK - Excellent, CPALL - Very Good, CPF – Excellent, CPN - Excellent, DELTA - Very Good, DTAC - Excellent, EGCO – Excellent, GLOBAL - Good, GLOW - Very Good, GRAMMY – Excellent, HANA - Excellent, HEMRAJ - Excellent, HMPRO - Very Good, INTUCH – Excellent, ITD – Very Good, IVL - Excellent, JAS – Very Good, KAMART – not available, KBANK - Excellent, KKP – Excellent, KTB - Excellent, LH - Very Good, LPN - Excellent, MAJOR – Very Good, MAKRO – Very Good, MCOT - Excellent, MEGA – not available,
MINT - Excellent, PS - Excellent, PSL - Excellent, PTT - Excellent, PTTGC - Excellent, PTTEP - Excellent, QH - Excellent, RATCH - Excellent, ROBINS - Excellent, RS – Excellent, SAMART – Excellent, SC – Excellent, SCB - Excellent, SCC - Excellent, SCCC - Very Good, SIRI – Very Good, SPALI - Excellent, STA - Good, STEC - Very Good, TCAP - Excellent, THAI - Excellent, THCOM – Excellent, TICON – Very Good, TISCO - Excellent, TMB - Excellent, TOP - Excellent, TRUE - Excellent, TTW – Excellent, TUF - Very Good, VGI – Excellent, WORK – Good.