cima f2 learning system 2009
DESCRIPTION
Cima F2 Learning System 2009.TRANSCRIPT

CIMA Official Learning System
Managerial Level
F2 — Financial Management
Luisa Robertson

CIMA Publishing is an imprint of Elsevier Linacre House, Jordan Hill, Oxford OX2 8DP, UK 30 Corporate Drive, Suite 400, Burlington, MA 01803, USA
Copyright © 2009 Elsevier Ltd. All rights reserved
No part of this publication may be reproduced, stored in a retrieval system or transmitted in any form or by any means electronic, mechanical, photocopying, recording or otherwise without the prior written permission of the publisher
Permissions may be sought directly from Elsevier’s Science & Technology Rights Department in Oxford, UK: phone ( � 44) (0) 1865 843830; fax ( � 44) (0) 1865 853333; e-mail: [email protected]. Alternatively you can visit the Science and Technology Books website at www.elsevierdirect.com/rights for further information
Notice No responsibility is assumed by the publisher for any injury and/or damage to persons or property as a matter of products liability, negligence or otherwise, or from any use or operation of any methods, products, instructions or ideas contained in the material herein.
British Library Cataloguing in Publication Data A catalogue record for this book is available from the British Library
Library of Congress Catalog in Publication DataA catalog record for this book is available from the Library of Congress
ISBN: 978-1-85617-784-9
For information on all CIMA publicationsvisit our website at www.elsevierdirect.com
Typeset by Macmillan Publishing Solutions(www.macmillansolutions.com)
Printed and bound in Hungary
09 10 11 11 10 9 8 7 6 5 4 3 2 1
Working together to growlibraries in developing countries
www.elsevier.com | www.bookaid.org | www.sabre.org

iii
The CIMA Learning System xi Acknowledgements xi How to use the CIMA Learning System xi Guide to the Icons used within this Text xii Study technique xiii Paper F2 Financial Management xv
1 Introduction to F2 Financial Management 1Learning Outcomes 3
1.1 Introduction 31.2 International Financial Reporting Standards covered by the Financial
Management syllabus 41.3 Advice and guidance for F2 candidates 41.4 Summary 6
2 Accounting for Investments 7Learning Outcomes 9
2.1 Introduction 92.2 Accounting for investments 92.3 Investment in associates 102.4 Investment in subsidiaries 11
2.4.1 The principle of control 112.4.2 The requirement to prepare consolidated fi nancial statements 122.4.3 Exclusion from preparing consolidated accounts 122.4.4 Goodwill 132.4.5 IFRS 3 Business combinations 142.4.6 Fair values in acquisition accounting 14
2.5 Investment in joint ventures 172.6 Summary 17
Revision Questions 19
Solutions to Revision Questions 21
3 The Consolidated Statement of Financial Position 23Learning Outcomes 25
3.1 Introduction 253.2 Applying the principles of consolidation: the consolidated statement
of fi nancial position 25
Contents

FINANCIAL MANAGEMENT F2 iv
CO
NTE
NTS 3.2.1 Goodwill 28
3.2.2 Bargain purchases 293.3 Non-controlling interests 29
3.3.1 Accounting for non-controlling interests 303.4 The elimination of intra-group balances 32
3.4.1 Intragroup loans and preference shares 343.5 The treatment of unrealised profi ts on assets
bought from group companies 353.5.1 Intra-group trading in non-current assets 38
3.6 Adjustments to achieve uniformity of accounting policy 393.7 Adjustments for fair value at the date of acquisition 403.8 Summary 42
Revision Question s 45
Solutions to Revision Question s 51
4 The Consolidated Income Statements of Comprehensive Income and Changes in Equity 57
Learning Outcomes 594.1 Introduction 594.2 IAS 1 (revised) Presentation of fi nancial statements 594.3 Basic principles 614.4 Investments in preference shares and loans 634.5 Intra-group trading 654.6 Adjustments for fair value or to refl ect changes in accounting policy 684.7 Summary 70
Revision Questions 71
Solutions to Revision Questions 75
5 Associates and Joint Ventures 79Learning Outcomes 81
5.1 Introduction 815.2 IAS 28 Accounting for associates 82
5.2.1 Equity accounting 825.2.2 Treatment of unrealised profi ts on intra-group trading 85
5.3 IAS 31 Interests in joint ventures 865.3.1 Accounting for joint ventures 875.3.2 Accounting for jointly controlled entities 875.3.3 Treatment of unrealised profi ts on intra-group trading 905.3.4 Alternative treatment 90
5.4 The impact of different methods of accounting for investments 905.5 Fair values and accounting policies 935.6 Summary 93
Revision Questions 95
Solutions to Revision Questions 101
vFINANCIAL MANAGEMENT
CO
NTEN
TS6 Consolidated Statement of Cash Flows 105
Learning Outcome 1076.1 Introduction 1076.2 IAS 7 – the general principles 107
6.2.1 IAS 7 – standard headings 1086.3 Cash fl ow statements for groups 108
6.3.1 General principles 1086.3.2 Treatment of subsidiaries with non-controlling interests 1086.3.3 Treatment of investments that are equity-accounted 1106.3.4 Treatment of investments acquired during the year 1106.3.5 Treatment of investments disposed of during the year 1126.3.6 Treatment of foreign subsidiaries 115
6.4 Summary 118
Revision Questions 119
Solutions to Revision Questions 125
7 Changes to Group Structures 131Learning Outcomes 133
7.1 Introduction 1337.2 Acquisitions in the accounting period 134
7.2.1 Introduction 1347.2.2 Dividends paid by the subsidiary out of profi ts earned in the
year of acquisition in the fi nancial statements of the parent 1367.2.3 Dividend paid before the date of acquisition 136
7.3 Fair value in acquisition accounting 1367.3.1 The requirements of IFRS 3 Business Combinations (‘IFRS 3’) 1367.3.2 Summary of points given in Chapter 2 regarding fair value for
individual assets and liabilities 1377.3.3 Application of fair value adjustments 138
7.4 Piecemeal acquisitions 1417.4.1 General principles 1417.4.2 Piecemeal acquisitions: increasing a stake from a simple
investment to a subsidiary 1427.4.3 Piecemeal acquisitions: from associate to subsidiary 1447.4.4 Piecemeal acquisitions: increasing a controlling interest 144
7.5 Disposals in the period 1457.5.1 Accounting treatment 1457.5.2 Interim dividends paid in the year of disposal 150
7.6 Business reorganisations 1517.6.1 Future developments 1517.6.2 Intra-group reconstructions 152
7.7 Summary 156
Revision Questions 157
Solutions to Revision Questions 165

FINANCIAL MANAGEMENT F2 vi
CO
NTE
NTS 8 Foreign Currency Translations 175
Learning Outcomes 1778.1 Introduction 1778.2 IAS 21 the effects of changes in foreign exchange rates 177
8.2.1 Foreign currency transactions: the accounting problem 1778.2.2 IAS 21 Objectives and key defi nitions 178
8.3 Single transactions in foreign currencies 1798.4 Translating foreign operations 180
8.4.1 Change in functional currency 1858.5 Hedging 1858.6 Summary 185
Revision Questions 187
Solutions to Revision Questions 191
9 Complex Group Structures 197Learning Outcome 199
9.1 Introduction 1999.2 Accounting for sub-subsidiaries 199
9.2.1 The basics of preparation of the consolidated accounts 1999.2.2 Date of acquisition of sub-subsidiary 202
9.3 Mixed groups 2039.4 Indirect investment in associates or joint ventures 2059.5 Summary 207
Revision Questions 209
Solutions to Revision Questions 213
10 Substance Over Form 217Learning Outcomes 219
10.1 Introduction 21910.2 Principles of substance over form 219
10.2.1 Off-balance-sheet fi nancing 22010.2.2 Applying substance over form 220
10.3 Recognition of Revenue 22110.3.1 Revenue recognition: sale of goods 22210.3.2 Revenue recognition: sale of services 222
10.4 Recognition and derecognition of assets and liabilities 22310.4.1 Recognition of assets and liabilities 22310.4.2 Derecognition of assets and liabilities 223
10.5 Substance over form: cases 22410.5.1 Sale and repurchase agreements 22410.5.2 Consignment stock 22510.5.3 Factoring of receivables 22610.5.4 Securitised assets and loan transfers 227
10.6 Special purpose entities (SPEs) 22710.7 Summary 227

viiFINANCIAL MANAGEMENT
CO
NTEN
TSRevision Questions 229
Solutions to Revision Questions 231
11 Accounting for Financial Instruments 233Learning Outcome 235
11.1 Introduction 23511.2 Financial instruments – relevant accounting standards 23511.3 IAS 32 Financial instruments: presentation 236
11.3.1 Defi nitions 23611.3.2 Classifi cation of fi nancial instruments 23711.3.3 Hybrid instruments 240
11.4 IAS 39 Financial instruments: recognition and measurement 24111.4.1 Initial recognition of fi nancial assets and liabilities 24111.4.2 Initial measurement 24311.4.3 Subsequent measurement of fi nancial instruments fi nancial assets 24411.4.4 Impairment 24611.4.5 Derivatives 247
11.5 Hedging 24911.5.1 Hedging relationships 24911.5.2 Fair value hedges 25011.5.3 Cash fl ow hedges 25111.5.4 Designation of hedges 252
11.6 IFRS 7 Financial instruments:disclosure 25211.7 Summary 253
Revision Questions 255
Solutions to Revision Questions 261
12 Employee Benefi ts 267Learning Outcomes 269
12.1 Introduction 26912.2 IAS 19 Employee benefi ts 269
12.2.1 Key defi nitions 27012.3 Accounting for post-employment benefi ts 271
12.3.1 Defi ned contribution plans 27112.3.2 Defi ned benefi t plans 271
12.4 Amendment to IAS 19 – December 2004 27412.5 IFRS 2 Share-based Payment 27512.6 Accounting for share-based payments 277
12.6.1 Types of share-based payments 27712.6.2 Recognition of share-based payments 27712.6.3 Measurement 277
12.7 Summary 280
Revision Questions 281
Solutions to Revision Questions 285
FINANCIAL MANAGEMENT F2 viii
CO
NTE
NTS 13 Financial Reporting in an Environment of Price
Changes 289Learning Outcomes 291
13.1 Introduction 29113.2 Defects of historical cost accounting 29113.3 Accounting for changing price levels 293
13.3.1 Capital and income 29413.3.2 Replacement cost (entry value) accounting 29613.3.3 Realisable or exit values 29813.3.4 Current cost accounting 29913.3.5 Current purchasing power (CPP) accounting 30313.3.6 The ‘real terms’ system 306
13.4 Financial reporting in hyperinfl ationary economies 30813.4.1 What is hyperinfl ation? 30813.4.2 Dealing with hyperinfl ation 308
13.5 Summary 309
Revision Questions 311
Solutions to Revision Questions 313
14 Interpretation of Accounting Ratios 317Learning Outcome 319
14.1 Introduction 31914.2 Interpretation and analysis 319
14.2.1 Identifi cation of the user of the analysis 32014.2.2 Understanding the business 32114.2.3 Identifying relevant sources of data 322
14.3 Performance ratios 32214.3.1 Profi tability ratios 32214.3.2 Activity ratios 32514.3.3 Return on capital ratios 326
14.4 Liquidity ratios 32714.4.1 Working capital analysis 327
14.5 Analysis of capital structure 33014.5.1 Measuring the performance effects of capital structures 33014.5.2 Measuring statement of fi nancial position gearing 331
14.6 Valuation ratios and analysis for the investor 33114.6.1 Price/earnings ratio 33114.6.2 Dividend-related ratios 33214.6.3 Statement of fi nancial position ratios 333
14.7 Analysing the cash fl ow statement 33614.8 Using ratios in the exam 33814.9 Summary 339
Revision Questions 341
Solutions to Revision Questions 347
15 Earnings Per Share 355Learning Outcome 357
15.1 Introduction 357

ixFINANCIAL MANAGEMENT
CO
NTEN
TS15.2 IAS 33 Earnings per share 35815.3 Basic earnings per share 359
15.3.1 Issue at full market price 35915.3.2 Bonus issue 35915.3.3 Rights issue 36015.3.4 Other relevant points 361
15.4 Diluted earnings per share 36215.4.1 Convertible fi nancial instruments 36215.4.2 Share warrants and options 36315.4.3 Dilutive potential ordinary shares 36415.4.4 Disclosure requirements 365
15.5 Summary 365
Revision Questions 367
Solutions to Revision Questions 371
16 Interpretation of Financial Statements 375Learning Outcomes 377
16.1 Introduction 37716.2 Horizontal, vertical and common size analysis 378
16.2.1 Horizontal analysis 37816.2.2 Vertical analysis 37916.2.3 Common size analysis 380
16.3 Segment analysis 38116.3.1 IFRS 8 Operating Segments 38216.3.2 Operating segments – discussion 384
16.4 The limitations of fi nancial reporting information 38516.5 Limitations of ratio analysis 38816.6 Creative accounting 390
16.6.1 Methods employed by creative accountants 39016.6.2 The motivation to use creative accounting 392
16.7 Special problems in analysing fi nancial obligations 39316.8 Summary 394
Revision Questions 395
Solutions to Revision Questions 405
17 Scope of External Reporting 417Learning Outcomes 419
17.1 Introduction 41917.2 The pressure to extend external reporting 419
17.2.1 Inclusion of forecasts in annual reports 42017.2.2 The effect of accounting scandals 42017.2.3 Corporate social responsibility 42017.2.4 Demands for more information 421
17.3 Increasing the scope of reporting 42117.3.1 The Operating and Financial Review 42217.3.2 The Business Review 42217.3.3 OFR: the ASB’s reporting statement of best practice 423

FINANCIAL MANAGEMENT F2 x
CO
NTE
NTS 17.3.4 International developments 424
17.4 Social accounting and reporting 42517.5 Accounting for the impacts of the entity on the natural environment 426
17.5.1 Measuring and reporting fi nancial information relating to the environment 426
17.5.2 Non-fi nancial disclosures 42817.6 Accounting for, and reporting on, human resource issues 429
17.6.1 Disclosures in respect of social issues 43017.6.2 Intellectual capital reporting 43017.6.3 Human asset accounting 431
17.7 The Global Reporting Initiative 43217.8 Summary 433
Readings 435
Revision Questions 449
Solutions to Revision Questions 455
18 International Issues in Financial Reporting 463Learning Outcomes 465
18.1 Introduction 46518.2 International convergence in fi nancial reporting 465
18.2.1 Recent history of international standard-setting 46618.2.2 The IASB’s progress towards its objectives 467
18.3 Convergence between IFRSs and US GAAP 46818.3.1 US GAAP – background 46818.3.2 Progress towards convergence 46918.3.3 Remaining differences between US GAAP and IFRS 470
18.4 Summary 470
Readings 473
Revision Questions 477
Solutions to Revision Questions 479
Preparing for the Examination 483Revision technique 485
Planning 485Getting down to work 486Tips for the fi nal revision phase 486The format of the examination 486
Structure of the paper 486
How to tackle the examination 487
Revision Questions 489
Solutions to Revision Questions 519
Exam Q & As 553
Index 555

xi
The CIMA Learning System
AcknowledgementsEvery effort has been made to contact the holders of copyright material, but if any here have been inadvertently overlooked the publishers will be pleased to make the necessary arrangements at the fi rst opportunity.
How to use the CIMA Learning SystemThis Financial Management Learning System has been devised as a resource for students attempting to pass their CIMA exams, and provides:
● a detailed explanation of all syllabus areas;● extensive ‘practical’ materials, including readings from relevant journals;● generous question practice, together with full solutions;● an exam preparation section, complete with exam standard questions and solutions.
This Learning System has been designed with the needs of home-study and distance-learning candidates in mind. Such students require very full coverage of the syllabus topics, and also the facility to undertake extensive question practice. However, the Learning System is also ideal for fully taught courses.
The main body of the text is divided into a number of chapters, each of which is organ-ised on the following pattern:
● Detailed learning outcomes. It is expected after your studies of the chapter are complete. You should assimilate these before beginning detailed work on the chapter, so that you can appreciate where your studies are leading.
● Step-by-step topic coverage. This is the heart of each chapter, containing detailed explana-tory text supported where appropriate by worked examples and exercises. You should work carefully through this section, ensuring that you understand the material being explained and can tackle the examples and exercises successfully. Remember that in many cases knowledge is cumulative: if you fail to digest earlier material thoroughly, you may struggle to understand later chapters.

FINANCIAL MANAGEMENT F2 xii
● Question practice. The test of how well you have learned the material is your ability to tackle exam-standard questions. Make a serious attempt at producing your own answers, but at this stage don’t be too concerned about attempting the questions in exam condi-tions. In particular, it is more important to absorb the material thoroughly by complet-ing a full solution than to observe the time limits that would apply in the actual exam.
● Solutions. Avoid the temptation merely to ‘audit’ the solutions provided. It is an illusion to think that this provides the same benefi ts as you would gain from a serious attempt of your own. However, if you are struggling to get started on a question you should read the introductory guidance provided at the beginning of the solution, and then make your own attempt before referring back to the full solution.
Having worked through the chapters you are ready to begin your fi nal preparations for the examination. The fi nal section of the CIMA Learning System provides you with the guidance you need. It includes the following features:
● A brief guide to revision technique.● A note on the format of the examination. You should know what to expect when you
tackle the real exam, and in particular the number of questions to attempt, which ques-tions are compulsory and which optional, and so on.
● Guidance on how to tackle the examination itself.● A table mapping revision questions to the syllabus learning outcomes allowing you to
quickly identify questions by subject area.● Revision questions are of exam standard and should be tackled in exam conditions, espe-
cially as regards the time allocation.● Solutions to the revision questions. As before, these indicate the length and the quality
of solution that would be expected of a well-prepared candidate.
If you work conscientiously through this CIMA Learning System according to the guide-lines above you will be giving yourself an excellent chance of exam success. Good luck with your studies!
Guide to the Icons used within this Text Key term or defi nition
Equation to learn
Exam tip to topic likely to appear in the exam
Exercise
Question
Solution
Comment or Note
THE
CIM
A L
EARN
ING
SYS
TEM

xiiiFINANCIAL MANAGEMENT
Study techniquePassing exams is partly a matter of intellectual ability, but however accomplished you are in that respect you can improve your chances signifi cantly by the use of appropriate study and revision techniques. In this section we briefl y outline some tips for effective study dur-ing the earlier stages of your approach to the exam. Later in the text we mention some techniques that you will fi nd useful at the revision stage.
PlanningTo begin with, formal planning is essential to get the best return from the time you spend studying. Estimate how much time in total you are going to need for each subject that you face. Remember that you need to allow time for revision as well as for initial study of the material. The amount of notional study time for any subject is the minimum estimated time that students will need to achieve the specifi ed learning outcomes set out earlier in this chapter. This time includes all appropriate learning activities, for example, face-to-face tuition, private study, directed home study, learning in the workplace and revision time. You may fi nd it helpful to read Better exam results by Sam Malone, CIMA Publishing, ISBN: 075066357X. This book will provide you with proven study techniques. Chapter by chapter it covers the building blocks of successful learning and examination techniques.
The notional study time for Managerial level – Financial Analysis is 200 hours. Note that the standard amount of notional learning hours attributed to one full-time academic year of approximately 30 weeks is 1,200 hours.
By way of example, the notional study time might be made up as follows:
Hours
Face-to-face study: up to 60Personal study: up to 100‘Other’ study – e.g., learning in the workplace, revision, etc.: up to 40
200
Note that all study and learning-time recommendations should be used only as a guideline and are intended as minimum amounts. The amount of time recommended for face-to-face tuition, personal study and/or additional learning will vary according to the type of course undertaken, prior learning of the student, and the pace at which different students learn.
Now split your total time requirement over the weeks between now and the examination. This will give you an idea of how much time you need to devote to study each week. Remember to allow for holidays or other periods during which you will not be able to study (e.g., because of seasonal workloads).
With your study material before you, decide which chapters you are going to study in each week, and which weeks you will devote to revision and fi nal question practice.
Prepare a written schedule summarising the above – and stick to it!The amount of space allocated to a topic in the study material is not a very good guide
as to how long it will take you.It is essential to know your syllabus. As your course progresses you will become more
familiar with how long it takes to cover topics in suffi cient depth. Your timetable may need to be adapted to allocate enough time for the whole syllabus.
THE C
IMA
LEARN
ING
SYSTEM

FINANCIAL MANAGEMENT F2 xiv
Tips for effective studying1. Aim to fi nd a quiet and undisturbed location for your study, and plan as far as possible
to use the same period of time each day. Getting into a routine helps to avoid wast-ing time. Make sure that you have all the materials you need before you begin so as to minimise interruptions.
2. Store all your materials in one place, so that you don’t waste time searching for items around the house. If you have to pack everything away after each study period, keep them in a box, or even a suitcase, which won’t be disturbed until the next time.
3. Limit distractions. To make the most effective use of your study periods you should be able to apply total concentration, so turn off the TV, set your phones to message mode, and put up your ‘do not disturb’ sign.
4. Your timetable will tell you which topic to study. However, before diving in and becoming engrossed in the fi ner points, make sure you have an overall picture of all the areas that need to be covered by the end of that session. After an hour, allow yourself a short break and move away from your books. With experience, you will learn to assess the pace you need to work at. You should also allow enough time to read relevant articles from newspapers and journals, which will supplement your knowledge and demonstrate a wider perspective.
5. Work carefully through a chapter, making notes as you go. When you have covered a suitable amount of material, vary the pattern by attempting a practice question. Preparing an answer plan is a good habit to get into, while you are both studying and revising, and also in the examination room. It helps to impose a structure on your solu-tions, and avoids rambling. When you have fi nished your attempt, make notes of any mistakes you made, or any areas that you failed to cover or covered only skimpily.
6. Make notes as you study, and discover the techniques that work best for you. Your notes may be in the form of lists, bullet points, diagrams, summaries, ‘mind maps’, or the written word, but remember that you will need to refer back to them at a later date, so they must be intelligible. If you are on a taught course, make sure you highlight any issues you would like to follow up with your lecturer.
7. Organise your paperwork. There are now numerous paper storage systems available to ensure that all your notes, calculations and articles can be effectively fi led and easily retrieved later.
THE
CIM
A L
EARN
ING
SYS
TEM

xv
Paper F2Financial Management
Syllabus OverviewPaper F2 extends the scope of Paper F1 Financial Operations to more advanced topics in fi nancial accounting (preparation of full consolidated fi nancial statements and issues of principle in accounting standards dealing with more complex areas) and to develop-ments in external reporting. With the advanced level of fi nancial accounting and reporting achieved in this paper, the analysis and interpretation of accounts becomes more meaning-ful and this constitutes a substantial element.
Syllabus StructureThe syllabus comprises the following topics and study weightings:
A Group Financial Statements 35%B Issues in Recognition and Measurement 20%C Analysis and Interpretation of Financial Accounts 35%D Developments in External Reporting 10%
Assessment StrategyThere will be a written examination paper of 3 hours, plus 20 minutes of pre-examination question paper reading time. The examination paper will have the following sections:
Section A – 50 marksFive compulsory medium answer questions, each worth 10 marks. Short scenarios may be given, to which some or all questions relate.
Section B – 50 marksOne or two compulsory questions. Short scenarios may be given, to which questions relate.

FINA
NC
IAL M
AN
AG
EMEN
T F2 x
viPAPER F2 FINANCIAL MANAGENEMNT
Learning Outcomes and Indicative Syllabus ContentF2 – A. Group Financial Statements (35%)
Learning Outcomes
On completion of their studies students should be able to:
Lead Component Indicative Syllabus Content
1. Prepare the full consolidated statements of a single company and the consolidated statements of fi nancial position and comprehensive income for a group (in relatively complex circumstances). (3)
(a) prepare a complete set of consolidated fi nancial statements, as specifi ed in IAS 1(revised), in a form suitable for publication for a group of companies;
(b) identify and demonstrate the impact on group fi nancial statements where: there is a minority interest; the interest in a subsidiary or associate is acquired or disposed of part way through an accounting period (to include the effective date of acquisition and dividends out of pre-acquisition profi ts); shareholdings, or control, are acquired in stages; intra-group trading and other transactions occur; the value of goodwill is impaired;
(c) explain and apply the concept of a joint venture and how their various types are accounted for.
• Relationships between investors and investees, meaning of control and circumstances in which a subsidiary is excluded from consolidation. (A)
• The preparation of consolidated fi nancial statements (including the group cash fl ow statement and statement of changes in equity) involving one or more subsidiaries, sub-subsidiaries and associates (IAS 1(revised), 7 & 27, IFRS 3). (A)
• The treatment in consolidated fi nancial statements of minority interests, pre- and post-acquisition reserves, goodwill (including its impairment), fair value adjustments, intra-group transactions and dividends, piece-meal and mid-year acquisitions, and disposals to include sub-subsidiaries and mixed g roups. (A, B)
• The accounting treatment of associates and joint ventures (IAS 28 & 31) using the equity method and proportional consolidation method. (A, C)
2. Explain the principles of accounting for capital schemes and foreign exchange rate changes.
(a) explain the principles of accounting for a capital reconstruction scheme or a demerger;
(b) explain foreign currency translation principles, including the difference between the closing rate/net investment method and the historical rate method;
(c) explain the correct treatment for foreign loans fi nancing foreign equity investments.
• Accounting for reorganisations and capital reconstruction schemes. (A)
• Foreign currency translation (IAS 21), to include overseas transactions and investments in overseas subsidiaries. (B, C)

xvii
FINA
NC
IAL M
AN
AG
EMEN
T
PAPER F2 FINANCIAL MANAGEMENT
F2 – B. Issues in Recognition and Measurement (20%)
Learning Outcomes
On completion of their studies students should be able to:
Lead Component Indicative Syllabus Content
1. Discuss accounting principles and their relevance to accounting issues of contemporary interest. (4)
(a) discuss the problems of profi t measurement and alternative approaches to asset valuations;
(b) discuss measures to reduce distortion in fi nancial statements when price levels change;
(c) discuss the principle of substance over form applied to a range of transactions;
(d) discuss the possible treatments of fi nancial instruments in the issuer’s accounts (i.e. liabilities versus equity, and the implications for fi nance costs);
(e) identify discuss circumstances in which amortised cost, fair value and hedge accounting are appropriate for fi nancial instruments, explain the principles of these accounting methods and discuss considerations in the determination of fair value;
(f ) discuss the recognition and valuation issues concerned with pension schemes (including the treatment of actuarial defi cits and surpluses) and share-based payments.
• The problems of profi t measurement and the effect of alternative approaches to asset valuation; current cost and current purchasing power bases and the real terms system; Financial Reporting in Hyperinfl ationary Economies (IAS 29). (A, B)
• The principle of substance over form and its infl uence in dealing with transactions such as sale and repurchase agreements, consignment stock, debt factoring, securitised assets, loan transfers and public and private sector fi nancial collaboration. (C)
• Financial instruments classifi ed as liabilities or shareholders funds and the allocation of fi nance costs over the term of the borrowing (IAS 32 & 39). (D, E)
• The measurement, including methods of determining fair value, and disclosure of fi nancial instruments (IAS 32 & 39, IFRS 7). (D, E)
• Retirement benefi ts, including pension schemes – defi ned benefi t schemes and defi ned contribution schemes, actuarial defi cits and surpluses (IAS 19). (F)
• Share-based payments (IFRS 2): types of transactions, measurement bases and accounting; determination of fair value. (F)

FINA
NC
IAL M
AN
AG
EMEN
T F2 x
viiiPAPER F2 FINANCIAL MANAGENEMNT
F2 – C. Analysis and Interpretation of Financial Accounts (35%)
Learning Outcomes
On completion of their studies students should be able to:
Lead Component Indicative Syllabus Content
1. Produce a ratio analysis from fi nancial statements and supporting information, and explain its limitations. (4)
(a) calculate and interpret a full range of accounting ratios;
(b) explain and discuss the limitations of accounting ratio analysis and analysis based on fi nancial statements.
• Ratios in the areas of performance, profi tability, fi nancial adaptability, liquidity, activity, shareholder investment and fi nancing, and their interpretation. (A)
• Calculation of Earnings per Share under IAS 33, to include the effect of bonus issues, rights issues and convertible stock. (A)
• The impact of fi nancing structure, including use of leasing and short-term debt, on ratios, particularly gearing. (A)
• Limitations of ratio analysis (e.g. comparability of businesses and accounting policies). (B)
2. Analyse and evaluate performance and position, and discuss the results. (4)
(a) analyse fi nancial statements in the context of information provided in the accounts and corporate report;
(b) evaluate performance and position based on analysis of fi nancial statements;
(c) prepare and discuss segmental analysis, with inter-fi rm and international comparisons taking account of possible aggressive or unusual accounting policies and pressures on ethical behaviour;
(d) discuss the results of an analysis of fi nancial statements and its limitations in a concise report.
• Interpretation of fi nancial statements via the analysis of the accounts and corporate reports. (A, B)
• The identifi cation of information required to assess fi nancial performance and the extent to which fi nancial statements fail to provide such information. (A, B, D)
• Interpretation of fi nancial obligations included in fi nancial accounts (e.g. redeemable debt, earn-out arrangements, contingent liabilities). (A, B, D)
• Segment analysis: inter-fi rm and international comparison (IFRS 8). (C)
• The need to be aware of aggressive or unusual accounting policies (‘creative accounting’), e.g. in the areas of cost capitalisation and revenue recognition, and threats to the ethics of accountants from pressure to report ‘good results’. (C)
• Reporting the results of analysis. (D)

xix
FINA
NC
IAL M
AN
AG
EMEN
T
PAPER F2 FINANCIAL MANAGEMENT
F2 – D. Developments in External Reporting (10%)
Learning Outcomes
On completion of their studies students should be able to:
Lead Component Indicative Syllabus Content
1. Explain and discuss contemporary developments in fi nancial and non-fi nancial reporting. (4)
(a) discuss pressures for extending the scope and quality of external reports to include prospective and non-fi nancial matters, and narrative reporting generally;
(b) explain how information concerning the interaction of a business with society and the natural environment can be communicated in the published accounts;
(c) identify and discuss social and environmental issues which are likely to be most important to stakeholders in an organisation;
(d) explain the process of measuring, recording and disclosing the effect of exchanges between a business and society – human resource accounting;
(e) identify and discuss major differences between IFRS and US GAAP, and the measures designed to contribute towards their convergence.
• Increasing stakeholder demands for information that goes beyond historical fi nancial information and frameworks for such reporting, including, as an example of national requirements and guidelines, the UK’s Business Review and the Accounting Standard Board’s best practice standard, RS1, and the Global Reporting Initiative. (A, B)
• Environmental and social accounting issues, differentiating between externalities and costs internalised through, for example, capitalisation of environmental expenditure, recognition of future environmental costs by means of provisions, taxation and the costs of emissions permit trading schemes. (B, C)
• Non-fi nancial measures of social and environmental impact. (B, C)
• Human resource accounting. (D)• Major differences between IFRS and US GAAP, and
progress towards convergence. (E)

This page intentionally left blank

1
Introduction to F2 FinancialManagement

This page intentionally left blank
3
1 LEARNING OUTCOMES After completing the work in this Learning System students should be able to:
� prepare the full consolidated statements of a single company and the consolidated statements of fi nancial position and comprehensive income for a group (in relatively complex circumstances);
� explain the principles of accounting for capital schemes and foreign exchange rate changes;
� discuss accounting principles and their relevance to accounting issues of contempo-rary interest;
� produce ratio analysis from fi nancial statements and supporting information;
� evaluate performance and position;
� discuss contemporary developments in fi nancial and non-fi nancial reporting.
1.1 IntroductionThe learning outcomes of this course are achieved through study of four principal syllabus areas, given below with the related syllabus weighting:
Group fi nancial statements 35% Issues in recognition and measurement 20% Analysis and interpretation of fi nancial accounts 35% Developments in external reporting 10%
The Learning System has been organised in the same way as this listing:
Chapters 2–9 Group fi nancial statements Chapters 10–13 Recognition and measurement issues Chapters 14–16 Analysis and interpretation of fi nancial accounts Chapters 17–18 Developments in external reporting
This introductory chapter of the Learning System contains the following sections:
1.2 International fi nancial reporting standards covered by the Financial Management syllabus
1.3 Advice and guidance for F2 candidates.
Introduction to F2 Financial Management

STUDY MATERIAL F24
INTR
OD
UC
TIO
N T
O F
2 FI
NA
NC
IAL
MA
NA
GEM
ENT 1.2 International Financial Reporting Standards
covered by the Financial Management syllabus
To successfully achieve the learning aims of F2, we must study aspects of specifi c inter-national accounting standards. The indicative syllabus content provided in the syllabus highlights the areas we must be familiar with. The relevant standards are covered in the forthcoming chapters, however for additional clarity a list is provided below:
Financial Management candidates are expected to have studied the following standards in preparation for the exam:
IAS 1 (revised) Presentation of Financial Statements*IAS 7 Statement of Cash FlowIAS 19 Employee Benefi tsIAS 21 The Effects of Changes in Foreign Exchange RatesIAS 27 (revised) Consolidated and Separate Financial StatementsIAS 28 Investments in AssociatesIAS 29 Financial Reporting in Hyperinfl ationary EconomiesIAS 31 Interests in Joint VenturesIAS 32 Financial Instruments: PresentationIAS 33 Earnings per ShareIAS 39 Financial Instruments: Recognition and MeasurementIFRS 2 Share-based PaymentIFRS 3 (revised) Business CombinationsIFRS 5 Non-current Assets Held for Sale and Discontinued
Operations (Note: In respect only of subsidiaries held exclusively for disposa)l
IFRS 7 Financial Instruments: DisclosureIFRS 8 Operating Segments
*Note: Candidates will not be examined specifi cally on knowledge of IAS 1. However, they are expected to be able to present fi nancial statements prepared in accordance with IAS 1, and to that extent it is examinable and specifi cally mentioned in the indicative syllabus content for F2.
1.3 Advice and guidance for F2 candidatesThe part of the book preceding this chapter (The CIMA Learning System) contains some useful general advice on study techniques. Candidates are advised to take notice of this. The syllabus for F2 is similar in content to its predecessor P8 Financial Analysis. The comments below refer to candidates performance on the recent diets of P8, however as they mostly refer to exam technique and style of answers, they are fully relevant to all F2 candidates.
The best source of detailed feedback about the examinations is found in the Post-Examination Guides (PEGs). PEGs are available on the CIMA website at www.cimaglobal.com (look under the section ‘Studying’). This area of the website will contain other useful information about F2. It is updated frequently, so candidates should refer to it on a regular basis during their period of study.

5FINANCIAL MANAGEMENT
INTRO
DU
CTIO
N TO
F2 FINA
NC
IAL M
AN
AG
EMEN
TSome common themes emerge in the (P8) PEGs particularly with reference to exam
technique:
● Candidates often do not address the question asked. This is especially true of written questions.
● In questions requiring analysis and interpretation of fi nancial statements candidates often demonstrate a lack of commercial awareness. It is not suffi cient to state blandly that fi gures have gone up or down, or to calculate a long list of accounting ratios. In order to fi nd out what is required by these questions, candidates are advised to spend some time studying the questions and answers very carefully. General commercial aware-ness can be improved by reading the fi nancial press and specifi c awareness of the type of information given by fi nancial statements could be addressed by careful reading of a lot of examples of real-life statements.
● Candidates do not allocate their time properly. Often there is evidence of one or more questions having been rushed because too long has been spent on some other question. Sometimes, for example, answers to written questions for 10 marks are as long, or longer, than the answers provided for written questions for 25 marks. In order to increase their chances of a pass, candidates should practise working past exam questions within the time allowance (NB – past papers for P8 are available on the CIMA website, also within the Studying section and as they are testing similar technical areas as F2, many will be relevant to your studying). While sitting the examination they should be absolutely rig-orous with themselves about not exceeding the time allowed on any question.
● Workings for calculation questions, especially consolidated fi nancial statements questions, are sometimes virtually illegible because they are so untidy. If poor handwriting or organisation are a problem, candidates should make it part of their exam preparation to practise being neater. Sometimes, in order to save time, it seems that candidates take short-cuts by doing the calculation on their calculators without writing down their workings. Often this means that no marks can be awarded for questions. An extract from the May 2007 PEG explains:
Some candidates ‘. . . produce very lengthy and cumbersome workings for consolidation questions, using many T accounts, or ‘tree’ diagrams (or, occasionally, both). Errors are penalised only once, and markers give credit for fi gures that, while incorrect because of earlier errors, show the correct application of prin-ciples. However, the nature of some candidates’ workings can make it very diffi cult, even impossible, to follow through the fi gures. Sometimes the workings are so complicated that it is clear that the candidate himself or herself has become thoroughly confused by them’.
● Some candidates do not prepare, apparently, for all sections of the syllabus. It is quite common to fi nd, for example, that they are apparently ignorant of anything to do with fi nancial instruments or other parts of syllabus area B. Candidates who go into the exam knowing about only part of the syllabus are very likely to fail. The examination is designed so as to cover the syllabus according to the syllabus weightings set out earlier in this chapter. There is very little variation from this and so candidates can be confi dent that syllabus area B will account for 20% of the question content, and syllabus area D for another 10%.
● Some candidates are much given to repetition in written questions. Markers will not give additional marks for the same point expressed in a slightly different way.
In each examination it is clear that a minority of candidates is signifi cantly under-prepared for the examination. Such candidates, who have virtually no chance of passing, bring down the average pass rate. Well-prepared candidates who have conscientiously stud-ied all syllabus areas and who have done plenty of practice questions, will be able to pass, and should not be deterred by apparently low historic pass rates.

STUDY MATERIAL F26
INTR
OD
UC
TIO
N T
O F
2 FI
NA
NC
IAL
MA
NA
GEM
ENT It is important to read the PEGs as they provide useful guidance on what not to do if
you wish to pass the examination. They are likely to be of particular use and relevance to those candidates who are not able to attend any formal tuition sessions and whose study-ing comprises this Learning System only.
1.4 SummaryThis introductory chapter lists the examinable accounting standards.
All candidates are advised to read the post-examination guidance (PEGs) which are made available on the CIMA website. Section 1.3 of the chapter identifi es some of the key points from the PEGs covering the 2005, 2006 and 2007 Financial Analysis examinations; however, many of the points cover issues relating to examinable areas that are vital in F2 and so are highly relevant.

2
Accounting for Investments

This page intentionally left blank

9
2LEARNING OUTCOMES
After studying this chapter students should be able to:
� explain the relationships between investors and investees;
� explain the different levels of investment and the conditions required for signifi cant infl uence, control and joint control;
� explain the circumstances in which a subsidiary is excluded from consolidation;
� explain and apply the principles of recognition of goodwill based on the fair value of assets at the date of acquisition.
Achievement of the above learning outcomes will contribute to the overall learning aim of syllabus area A.
2.1 IntroductionThis chapter introduces the appropriate accounting for investments in other entities. The extent of the investment will often determine the appropriate accounting treatment and this chapter examines the investments that will be accounted for as:
● Simple investments● Investments in associates● Investments in subsidiaries● Investments in joint ventures
The focus is mainly on accounting for subsidiaries as the rules and requirements outlined will form the basis of the applications in Chapters 3 and 4.
The accounting for fair values in consolidation and the recognition of goodwill are also covered in this chapter.
2.2 Accounting for investmentsEntities will often invest in the equity of other businesses. The extent of the equity share-holding will normally determine how the investment is accounted for. The accounting
Accounting for Investments

STUDY MATERIAL F210
AC
CO
UN
TIN
G F
OR
INVE
STM
ENTS treatment applied for investments is intended to refl ect the importance of the investment
in the fi nancial statements of the investee and how the future performance and fi nancial position might be affected by these investments. It follows then that the greater the level of investment the more detailed the fi nancial information will be. A signifi cant investment in another entity may require additional fi nancial statements to be produced.
The accounting in the investees’ individual accounts for all investments and for simpleinvestments (commonly less than 20% of the total equity share capital of the entity invested in), will be determined by applying the recognition, measurement and disclosure require-ments of the accounting standards that specifi cally deal with investments:
● IAS 32 Financial instruments: presentation● IAS 39 Financial instruments: recognition and measurement● IFRS 7 Financial instruments: disclosure
The provisions of these standards are dealt with in more detail in Chapter 11, however the basic impact on the fi nancial statements will involve one entry in the statement of fi nancial position (balance sheet) for investments and one entry in the income statement for incomeearned from these investments (dividend received).
2.3 Investment in associatesIf an investor holds, directly or indirectly, 20% of the voting rights of an entity then it is normally considered an associated entity and is accounted for in accordance with IAS 28 Investments in Associates. IAS 28 states that there is a presumption that the investor has signifi cant infl uence over the entity, unless it can be clearly demonstrated that this is not the case.
The key concept in the defi nition is ‘signifi cant infl uence’. IAS 28 explains that signifi -cant infl uence is the power to participate in the fi nancial and operating policy decisions of the entity but is not control over those policies. The existence of signifi cant infl uence by an investor is usually evidenced in one or more of the following ways:
● representation on the board of directors● participation in policy-making processes● material transactions between the investor and the entity● interchange of managerial personnel● provision of essential technical information.
The impact of this level of investment on the investing entity is likely to be greater than that of a simple investment. There is greater exposure to the results of the associate and a decline in its value will have a greater negative impact on the statement of fi nancial posi-tion of the investing entity. The information provided therefore is a step further than that provided for simple investments.
The investment in the associate is equity accounted (covered in depth in Chapter 5) and the investment shown in the statement of fi nancial position will include the investing enti-ty’s share of the gains of the associate from the date the investment was made. The invest-ing entity will show the share of realised and recognised gains it is entitled to by virtue of this investment rather than just the dividend received.

11FINANCIAL MANAGEMENT
AC
CO
UN
TING
FOR IN
VESTMEN
TS2.4 Investment in subsidiariesIt is often the case that businesses conduct part of their operations by making investments in other business entities. For example, a business that aims to expand its market share could opt to purchase one or more of its competitors, rather than taking the slower route of building market share by gradual organic growth. Another example is where a business purchases an investment in one or more of its suppliers of key goods and services in order to integrate and secure its supply chain.
In order to fulfi l the needs of investors and other users, additional information is likely to be required, and therefore the IASB has in issue several accounting standards setting out the principles and practices that must be followed where an investment comprises a signifi -cant proportion of the total equity of the investee entity.
2.4.1 The principle of controlThis chapter will start to examine the accounting required under IFRS for investments in subsidiaries. The accounting standard that sets out the requirements for recognition of an entity as a subsidiary is IAS 27 Consolidated and Separate Financial Statements. This standard was revised in January 2008, but its basic principles have been part of IFRS for many years.
First, some relevant defi nitions taken from the standard:
A parent is an entity that has one or more subsidiaries.A subsidiary is an entity, including an unincorporated entity such as a partner-
ship, which is controlled by another entity (known as the parent).
The key concept in determining whether or not an investment constitutes a subsidiary is that of control.
Control is the power to govern the fi nancial and operating policies of an entity so as to obtain benefi t from its activities.
There is a presumption that control exists where the investor entity owns over half of the voting power of the other entity. If an investor entity, ABC, owns 55% of the voting share capital of entity DEF, in the absence of any special circumstances, ABC is presumed to be in control of DEF. The maximum investment that could be held by another investor is 45%, and so ABC will always have the capacity to win a vote over the other investor(s). The nature of the relationship between ABC and DEF is that of parent and subsidiary.
In most cases, control can be easily determined by looking at the percentage ownership of the ordinary share capital in the investee entity. Provided ownership is greater than 50% a parent/subsidiary relationship can be assumed. However, there are exceptions. A parent/subsidiary relationship can exist even where the parent owns less than 50% of the voting

STUDY MATERIAL F212
AC
CO
UN
TIN
G F
OR
INVE
STM
ENTS power of the subsidiary since the key to the relationship is control. IAS 27 supplies the
following instances:When there is:
(a) power over more than half of the voting rights by virtue of an agreement with other investors;
(b) power to govern the fi nancial and operating policies of the entity under a statute or agreement;
(c) power to appoint or remove the majority of the members of the board of directors or equivalent governing body and control of the entity is by that board or body; or
(d) power to cast the majority of votes at meetings of the board of directors or equivalent governing body and control of the entity is by that board or body.
The reason for describing the nature of control in such detail in IAS 27 is that entities have sometimes created ownership structures designed to evade the requirements for accounting for subsidiaries.
In the Financial Management examination, questions may be set that test understanding of the principle of control, and it is possible that you will be
required to explain these conditions in a written question.
2.4.2 The requirement to prepare consolidated financial statements
Where a parent/subsidiary relationship exists, IAS 27 requires that the parent should pre-pare consolidated fi nancial statements. It is important to realise from the outset that this is an additional set of fi nancial statements. The parent and subsidiary continue to prepare their own fi nancial statements. Therefore in a group comprising one parent and one sub-sidiary, a total of three sets of fi nancial statements are required. Where a group comprises, say, the parent and four subsidiaries, a total of six sets of fi nancial statements are required: one for the parent, one for each of the four subsidiaries and one set of consolidated fi nan-cial statements.
2.4.3 Exclusion from preparing consolidated accountsA full set of fi nancial statements in addition to those already prepared is, of course, quite an onerous requirement. IAS 27 includes some exemptions, as follows:
A parent need not present consolidated fi nancial statements if and only if:
(a) the parent is itself a wholly owned subsidiary, or is a partially-owned subsidiary of another entity and its other owners, including those not otherwise entitled to vote, have been informed about, and do not object to, the parent not presenting consoli-dated fi nancial statements;
(b) the parent’s debt or equity instruments are not traded in a public market (a domestic or foreign stock exchange or an over-the-counter market, including local and regional markets);

13FINANCIAL MANAGEMENT
AC
CO
UN
TING
FOR IN
VESTMEN
TS(c) the parent did not fi le, nor is it in the process of fi ling, its fi nancial statements with a
securities commission or other regulatory organisation for the purpose of issuing any class of instruments in a public market;
(d) the ultimate or any intermediate parent of the parent produces consolidated fi nancial statements available for public use that comply with IFRS.
These provisions have been spelt out in some detail so as to minimise the risk of entities evading the accounting requirements. It will be apparent, though, that quite a lot of groups are not, in fact, required to prepare consolidated fi nancial statements. This is particularly relevant where there are ‘vertical’ group structures, such as the one illustrated below:
ABC
DEF
GHI
100%
100%
There are two groups within this structure:the DEF group, where DEF owns 100% of its subsidiary, GHI.the ABC group, where ABC owns 100% of its subsidiary DEF.
The IAS 27 exemption means that only one set of consolidated fi nancial statements has to be prepared: for the ABC group. DEF is exempted from the requirement. If only 55% of the voting capital of DEF was owned by ABC, and non-controlling interests held the remaining 45%, DEF can still be exempted from the requirement to prepare consolidated fi nancial statements provided that the non-controlling interests do not object.
The only other exemption from the requirement to consolidate is in respect of an invest-ment in subsidiary that has been acquired exclusively with the intention of reselling it. The provisions of IFRS 5 Non-current Assets Held for Sale and Discontinued Operationsapply: the sale must be highly probable, i.e. there must be a plan to sell the asset and the asset must be actively marketed. The sale should be expected to qualify for recognition as a completed sale within one year of its classifi cation as held for sale. It is not therefore possi-ble for a parent’s management to decide not to consolidate a subsidiary that has previously been consolidated on the grounds that they intend to sell it at some point in the future. It is obviously important to prevent this approach so that unscrupulous managers do not remove loss-making subsidiaries from the consolidation process.
2.4.4 GoodwillWhen a controlling investment is made the parent is investing in the net assets of the sub-sidiary. The value of the assets presented on the statement of fi nancial position is unlikely to be what is paid by the investing entity.
Usually, the owners of a profi table business will expect to receive more in exchange for the investment than its net asset value. This additional amount arises for various reasons. It

STUDY MATERIAL F214
AC
CO
UN
TIN
G F
OR
INVE
STM
ENTS is quite likely that the assets recognised in the statement of fi nancial position do not repre-
sent all the assets of the fi rm but intangibles such as good reputation and customer loyalty may be worth something to the purchaser. The difference between the cost of investment and the fair value of the net assets acquired is known as goodwill on acquisition, and the accounting standard IFRS 3 Business Combinations requires its recognition in consolidated fi nancial statements.
2.4.5 IFRS 3 Business combinationsIFRS 3 was originally issued in March 2004 replacing an earlier standard. However, it was just the fi rst stage in a longer term IASB project on accounting for business combinations. The next stage culminated in the issue, in January 2008, of the revised version of IFRS 3.
IFRS 3 requires that entities should account for business combinations by applying the acquisition method of accounting. This involves recognising and measuring the identifi -able assets acquired, the liabilities assumed and any non-controlling interest in the acquiree entity (the recognition and measurement of non-controlling interests will be explained in Chapter 3). Measurement should be at fair value on the date of acquisition. Where 100% of the equity of a subsidiary is acquired, goodwill on acquisition is calculated as follows:
Goodwill on acquisition is the aggregate of:Consideration, measured at fair valueLESSNet assets acquired (the fair value of identifi able assets acquired less liabilities assumed)
This measures goodwill on acquisition which is recognised in the consolidated fi nancial statement of position within non-current assets. Goodwill on acquisition is an asset of the group (not of the individual entities within the group) and is subject to impairment reviews to ensure its value is not overstated. The goodwill arises at the date of acquisition and will not change unless impairment is identifi ed, whereby it will be held net of impair-ment losses (which should be recognised in accordance with IAS 36 Impairment of Assets).
Practical application of recognising and measuring goodwill will be covered in the remaining chapters for Syllabus section A.
2.4.6 Fair values in acquisition accountingIFRS 3 requires that whenever a group entity is consolidated for the fi rst time the purchase consideration and the group share of the net assets of the acquired entity are measured at fair values. The difference between these two fi gures is goodwill. The purpose of a fair-value exercise is to apportion the consideration given by the parent to purchase the shares in the newly acquired entity to the net assets of the newly acquired entity for consolidation purposes. Any difference between the fair value of the consideration given and the fair val-ues of the net assets acquired is goodwill on acquisition.
As far as the net assets of the acquired entity are concerned, the amounts that are ini-tially consolidated should normally be restricted to net assets of the acquired entity that existed at the date of the acquisition. They should be recognised separately as at the date of acquisition if they satisfy IFRS 3’s criteria for recognition:
● In the case of an asset other than an intangible asset, it is probable that any associated future economic benefi ts will fl ow to the acquirer, and its fair value can be measured reliably.

15FINANCIAL MANAGEMENT
AC
CO
UN
TING
FOR IN
VESTMEN
TS● In the case of a liability other than a contingent liability, it is probable that an outfl ow of
resources embodying economic benefi ts will be required to settle the obligation, and its fair value can be measured reliably.
● It is an intangible asset that meets the IAS 38 Intangible Assets defi nition.● In the case of a contingent liability, its fair value can be measured reliably.
General principlesFair value is defi ned in IFRS 3 as:
. . . the amount for which an asset could be exchanged or a liability settled between knowledgeable, willing parties in an arm’s-length transaction.
As a general rule, fair value is market value. More detail regarding the fair valuation of specifi c assets and liabilities is given below.
The cost of a business combination should represent the fair values of assets given, lia-bilities incurred or assumed, and equity instruments issued by the acquirer, in exchange for control of the acquiree.
Fair value of considerationFair value must be measured at the date of the exchange. In cases where the acquisition is for the asset of cash, measurement of fair value is straightforward. However, in some cases the consideration offered will comprise equity shares, wholly or in part. Where this is the case, the shares must be valued at fair value. The published price at the date of exchange is the best evidence of fair value where the equity instruments are listed on a stock exchange. The only exception to this is if, for some reason, the market value of the relevant instru-ment at the date of acquisition is unusually high or low (e.g. if world events have resulted in a temporary signifi cant downturn in market values of securities). In such circumstances it would be necessary to consider the market value of the instrument around the date of acquisition to arrive at a representative and realistic fi gure for fair value.
A special case involves contingent consideration:Entity A might pay $8 million to acquire the shares of entity B, but the contract may be
subject to a clause relating to contingent consideration which stipulates that if certain criteria are met in the fi rst year of ownership (relating perhaps to profi tability), a further $1 million will be payable to the former shareholders of B. Where an element of the consideration is contingent on future events, that element should be included in the overall cost of the acqui-sition if the adjustment is probable and can be measured reliably. Occasionally the terms of the agreement may be such that it is impossible to say whether, and if so how much, addi-tional consideration will be paid, and in such circumstances, the group accounts may have to simply disclose the matter, rather than by making provision. The fair value of the contingent consideration should be based on the present value of future consideration payable.
Any costs incurred in the business combination (legal fees, etc.) will be written off as expenses in the period.
Costs of issuing fi nancial instruments in connection with the acquisition should not be included as part of the fair value of consideration. Instead, they are included as part of the initial measurement of the fi nancial instrument, in accordance with IAS 39 (see Chapter 11).

STUDY MATERIAL F216
AC
CO
UN
TIN
G F
OR
INVE
STM
ENTS Property, plant and equipment
Fair value should be based on depreciated market value unless (in the case of plant and equipment) there is no evidence of market value because of the specialised nature of the plant and equipment or because it is rarely traded, except as part of a continuing business. In such cases fair value should be based on depreciated replacement cost.
InventoriesWhere inventories are replaced by purchases in a ready market, the fair value � market value. However, where, as in the case of manufactured inventories, there is no ready mar-ket fair value is the current cost to the acquiring entity of obtaining the same inventories. If no current cost fi gure is readily available (as may well be the case) it can be approxi-mated by taking inventories at sales values less:
● costs to complete (for work-in-progress inventories)● incidental costs of disposal● a realistic allowance for profi t.
Listed investmentsIn most cases, the price quoted at the date of exchange will represent fair value.
Intangible assetsThe acquirer should recognise an intangible asset of the acquiree at the date of acquisition provided that it meets the defi nition of an intangible asset provided by IAS 38 Intangible Assets, and that it can be measured reliably. Intangible assets must be separable (i.e. must be capable of being separated and divided from the entity and of being sold) or they must arise from contractual or legal rights.
Monetary assets and liabilitiesThe fair value should be based on the amounts due to be received or paid. For many mon-etary assets and liabilities, the fair value will be the amount at which they are stated in the subsidiary undertaking’s statement of fi nancial position at the date of exchange. However, the fair value of some long-term monetary items may be materially different from book value, for example, where an acquired entity is carrying material amounts of long-term borrowings at fi xed rates that are not representative of current interest rates. Where fair value is materially different from book values, fair value should be used. It may be neces-sary, in respect of unlisted fi nancial instruments, to estimate fair value by discounting to present value amounts expected to be received or paid.
Example 2.A
A newly acquired subsidiary has in issue $10 million 5% loan stock that is redeemable at par in 5 years’ time. Current market interest rates are 8%. The relevant cash fl ows are $500,000 per year for 5 years in respect of interest and then a repayment of $10 million in 5 years’ time. In order to approximate the fair value of the instru-ment these cash fl ows are discounted at 8%, as follows:
An annuity of for years:$ ,. , $ , ,
500 000 53 993 500 000 1 996 50� � 00
100 681 10 6 81Plus a payment of m in 5 years’ time:
m$
. $ $ ,� � 00 0008 806 500
,$ , , .Total fair value �

17FINANCIAL MANAGEMENT
AC
CO
UN
TING
FOR IN
VESTMEN
TSProvisions for restructuringOnly the identifi able assets, liabilities and contingent liabilities of the acquiree that exist at the year end date can be recognised separately by the acquirer as part of allocating the cost of the combination. IFRS 3 states that: ‘future losses or other costs expected to be incurred as a result of a combination are not liabilities incurred or assumed by the acquirer in exchange for control of the acquiree, and are not, therefore, included as part of the cost of the combination’.
Contingent liabilitiesContingent liabilities, in accordance with IAS 37 Provisions, Contingent Liabilities and Contingent Assets, are not recognised in fi nancial statements. However, by contrast, IFRS 3 requires that the contingent liabilities of an acquiree are recognised at fair value at the date of acquisition provided that their fair value can be measured reliably. Therefore, when calculat-ing goodwill on acquisition, it is important to remember to include all measurable contin-gent liabilities. Note that contingent assets are not recognised by the acquiring entity.
2.5 Investment in joint venturesWhere an entity enters into an arrangement whereby control over an economic activity is shared between it and other parties, a joint venture arrangement exists. A joint ven-ture can take a number of forms (will be covered in depth in Chapter 5), however one of those is where a new entity is formed and since that entity is under joint control it will be consolidated.
Again the method of accounting refl ects the level of the investment made – it is greater than signifi cant infl uence (associate) but not as much as full control (subsidiary). The joint venture will be consolidated but not using the full consolidation method. Instead IAS 31 Interests in Joint Ventures requires that joint ventures be proportionally consolidated. This will involve only aggregating the parent’s share of the JV’s assets, liabilities, revenues and expenses.
The practical application of proportionate consolidation will be covered in depth in Chapter 5.
2.6 SummaryThis chapter has reviewed the accounting for investments and looked at how the different levels of investment warrant different accounting treatment. The introduction to account-ing for subsidiaries included a review of the principles of control, how to determine fair values of assets and liabilities acquired and how to recognise goodwill on acquisition. The requirements that have to be met to be excluded from preparing consolidated fi nancial statements were also covered.
This chapter covered some key principles in the consolidation process and you may fi nd that you refer back to it as you progress through Chapters 3 to 9.

This page intentionally left blank

19
Revision Questions
The questions below are intended to be tests of understanding. They are not of exam standard as this area is likely to be tested within a question that also covers other technical areas.
Question 1Where the purchase price of an acquisition is less than the aggregate fair value of the net assets acquired, which ONE of the following accounting treatments of the difference is required by IFRS 3 Business Combinations?
(A) Deduction from goodwill in the consolidated statement of fi nancial position?(B) Immediate recognition as a gain in the statement of changes in equity?(C) Recognition in the statement of comprehensive income over its useful life?(D) Immediate recognition as a gain in profi t or loss.
Question 2PQR holds several investments in subsidiaries. In December 20X5 it acquired 100T of the ordinary share capital of STU. PQR intends to exclude STU from consolidation in its group fi nancial statements for the year ended 28 February 20X6, on the grounds that it does not intend to retain the investment in the longer term.
Explain, with reference to the relevant International Financial Reporting Standard, the conditions relating to exclusion of this type of investment from consolidation.
Question 3On 30 September 20X5 GHI purchased 80% of the ordinary share capital of JKL for $1.45 million. The book value of JKL’s net assets at the date of acquisition was $1.35 mil-lion. A valuation exercise showed that the fair value of JKL’s property, plant and equipment at that date was $100,000 greater than book value, and JKL immediately incorporated this revaluation into its own books. JKL’s fi nancial statements at 30 September 20X5 contained notes referring to a contingent liability (with a fair value of $200,000).
GHI acquired JKL with the intention of restructuring the latter’s production facilities. The restructuring plan, including a detailed estimate of costs, was well advanced at 30 September 20X5. The estimated costs totalled $115,000.
Calculate goodwill on acquisition, and identify any of the above items that should be excluded from the calculation in accordance with IFRS 3 Business Combinations.
2

AC
CO
UN
TIN
G F
OR
INVE
STM
ENTS
REVISION QUESTIONS F220
Question 4AB purchase 100% of the equity share capital of CD and at the date of acquisition the net assets of CD were reviewed and the following is discovered:
1. The intangible non-current assets of CD at the acquisition date, consist of the estimated value of a brand that is associated with the entity. This estimate has been made by the directors and no reliable external estimate of the market value of the brand is available.
2. Relevant details of tangible non-current assets of CD are:
Description SOFP carrying value
Market value
Depreciated replacement cost
Recoverable amount
$’000 $’000 $’000 $’000
Property 10,000 12,000 Not given 13,500Plant 10,000 Not given 11,000 14,000
3. Inventories of CD comprise:● Obsolete inventory (year end value: $500,000). This inventory has a net realisable
value of $300,000.● The balance of inventory (statement of fi nancial position value: $3,500,000). This
inventory has a net realisable value of $4,200,000. A reasonable profi t allowance for the sale of the inventory would be $400,000.
4. The provision of $1 million in the statement of fi nancial position of CD is against the reorganisation costs expected to be incurred in integrating the entity into the Sea group. These costs would not be necessary if CD were to remain outside the group. Although the plan was agreed by the board of directors before the acquisition date, it was not made known to those affected by the plan until after that date.
Discuss how the above will affect the fair value of the identifi able net assets in calculating goodwill.
Question 5On 31 July 20X7, AGR acquired 80% of the ordinary share capital of its subsidiary BLK. The book value of BLK’s net assets at the date of acquisition was $1,300,000. This value included $300,000 in respect of certain specialised items of plant, which were bought on 31 July 20X4. The plant is being depreciated on a straight line basis over 6 years with an assumption of nil residual value. No estimate of market value at the date of acquisition is available, but it would cost $700,000 to replace the plant at current prices.
Since 20X5, BLK has been developing a specialised industrial process. Following regis-tration of the patent and some coverage in the trade press, BLK received an offer for the patent of $150,000 in April 20X7. The offer was rejected. BLK does not recognise the pat-ent as an asset. AGR’s directors think it probable that other processes developed by BLK have a market value, and they have made a broad estimate of $75,000 to cover such items which have not been capitalised by BLK.
Shortly before the acquisition of BLK took place, its directors had started a programme to rationalise production. The estimate cost of the programme was $250,000, but no pro-vision for it was recognised in the entity’s fi nancial statements at 31 July 20X7. The pro-gramme has continued and is now (November 20X7) substantially complete.
Calculate the fair value of BLK’s net assets that would be included in the consolidated statement of fi nancial position of AGR at 31 July 20X7, assuming that there are no rele-vant issues other than those given above. If appropriate, explain your reasons for excluding any of the possible adjustments to fair value.

21
Solutions to Revision Questions 2
Solution 1The correct answer is (D).
Solution 2According to IFRS 5 Non-Current Assets held for Sale and Discontinued Operations, a sub-sidiary that has been acquired and is held exclusively with a view to its subsequent disposal, does not require consolidation. However, the investment can be regarded as ‘held for sale’ only if its disposal is intended to take place within 12 months of the date of statement of fi nancial position. In the case of PQR’s investment in STU, the disposal would have to take place before 28 February 20X7.
Solution 3Goodwill on acquisition
$ $Investment in JKL 1,450,000Acquired:Net assets at book value 1,350,000Revaluation 100,000Contingent liability (200,000)
1,250,00080% of fair value of net assets 1,000,000Goodwill on acquisition 450,000
According to IFRS 3, restructuring provisions can be taken into account only if the acqui-ree has an existing liability for restructuring recognised in accordance with IAS 37 Provisions, Contingent Liabilities and Contingent Assets. This condition is not met in this case.
Solution 41. No value should be attached to the intangible asset when determining fair value of net
assets acquired since there is no reliable market value.2. The fair value of the property should be based on the market value of $12,000,000.

AC
CO
UN
TIN
G F
OR
INVE
STM
ENTS
SOLUTIONS TO REVISION QUESTIONS F222
3. The obsolete inventories should be included at the NRV of $300,000. The remaining inventories are carried at $3,500,000, however the fair value can be taken as the sales value less realistic allowance for profi t. The fair value of these inventories is therefore $3,800,000.
4. No amount should be included for the provision. Although the plan is approved it has not been communicated to those that will be affected (e.g. employees, customers, sup-pliers, etc.) and so as per IAS 37 no constructive obligation exists. IFRS 3 only allows provisions where there is a constructive obligation.
Solution 5$’000
Book value before adjustment 1,300Fair value adjustment for PPE: replacement cost of $700,000 less 3/6 years depreciation � $350,000Uplift in value: $350,000 � 300,000 50Recognition of intangible asset 150Provision for rationalisation programme (250)Fair value at 31 July 20X7 1,250
The director’s valuation of $75,000 in respect of other patents has been excluded from the fair value calculation because (i) there appears to be insuffi cient evidence that the intangibles are separable; and (ii) the broad general estimate probably does not meet the requirement that such assets should be measured reliably.

3
The Consolidated Statement of Financial Position

This page intentionally left blank

25
3 LEARNING OUTCOMES After studying this chapter students should be able to:
� prepare a consolidated statement of fi nancial position;
� account for non-controlling interests;
� account for the effects of intra-group balances and transactions in the consolidated statement of fi nancial position;
� apply the concepts of fair value at the date of acquisition.
3.1 IntroductionThis chapter builds upon the foundations established in Chapter 2, and applies the princi-ples of full consolidation in Section 3.2 and prepares a consolidated statement of fi nancial position, fi rstly for a simple group scenario, including:
● Elimination of the investment on consolidation● Recognition goodwill on acquisition.
The chapter continues with the preparation of the consolidated statement of fi nancial position, incorporating the more common complexities in group accounting, including:
● Accounting for partly owned subsidiaries (Section 3.3)● Accounting for the effects of transactions between group entities Sections (3.4 and 3.5)● Accounting for adjustments to fair values at the date of acquisition (Section 3.7).
Adjustments may be required to achieve uniform accounting policies between parent and subsidiary, and this is covered in Section 3.6.
3.2 Applying the principles of consolidation: the consolidated statement of financial position
Consolidated fi nancial statements represent the performance and position of the combined group entities as if they were a single economic entity. All the results and the assets and
The Consolidated Statement of Financial Position

STUDY MATERIAL F226
THE
CO
NSO
LIDAT
ED S
TATE
MEN
T O
F FI
NA
NC
IAL
POSI
TIO
N liabilities that are under the control of the parent are combined together to show single totals for each item in the fi nancial statements. This means that the revenue and expenses, assets and liabilities of the entities in the group are added together, line by line. So, if a par-ent’s revenue for the year is $2m and its only subsidiary has revenue for the year of $1m, group revenue is reported on a single line in the consolidated income statement at $3m.
Of course, the process involved is not quite as simple as this implies, and various com-plexities will be gradually explained in the next few chapters of the Learning System. For the moment, however, we will concentrate on only one of the fi nancial statements: the consolidated statement of fi nancial position, and the fi gures and facts in the example below will be kept very simple so that the basic principles can be demonstrated.
Example 3.A
On 31 December 20X0 A purchased all of the shares of B for $25,000. The statements of fi nancial positions of the individual entities at that date were:
A B$ $
Non-current assets Property, plant and equipment 60,000 20,000 Investment 25,000 –
85,000 20,000Net current assets 15,000 5,000
100,000 25,000Equity Share capital 50,000 10,000 Retained earnings 50,000 15,000
100,000 25,000
Solution
In this introductory example A has paid $25,000 for the investment in 100% of B. B’s equity has a book value of $25,000. The objective is to prepare a consolidated statement of fi nancial position that recognises the assets and liabilities over which A now has control. This means combining the asset and liability fi gures. For example, the consolidated fi gure for property, plant and equipment is calculated by adding across that line: $60,000 �$20,000 � $80,000.
However, it is important to ensure that assets and liabilities are not double counted. It would be incorrect to include both A’s investment in B and the assets and liabilities represented by that investment, and so the invest-ment in B is eliminated. The net asset side of the statement of fi nancial position therefore is as follows:
A Group: consolidated statement of fi nancial position at 31 December 20X0
$ CommentNon-current assets Property, plant and equipment 80,000 A � B Investment in B – Eliminated – B’s net assets recognised insteadNet current assets 20,000 A � B
100,000
The equity side of the consolidated statement of fi nancial position shows the share capital of the parent only. Consolidated retained earnings consist of the total of:
The retained earnings of the parentThe post-acquisition retained earnings of the subsidiary
$ CommentEquity Share capital 50,000 A only Retained earnings 50,000 A � post-acquisition retained earnings of B-$50,000 � $0
100,000

27FINANCIAL MANAGEMENT
THE C
ON
SOLID
ATED STATEM
ENT O
F FINA
NC
IAL PO
SITION
Because the investment was bought on the last day of the fi nancial year, post-acquisition earnings in the subsidi-ary are $0. This will, of course, not usually be the case.
This consolidated statement of fi nancial position shows the effect of a single consolidation adjustment: the investment in B shown in A’s statement of fi nancial position has been eliminated against the share capital and retained earnings of B:
DR Share capital and retained earnings of B 25,000CR Investment in B 25,000
After the initial acquisition, earnings will be made in B. The group share of post-acquisition earnings (in this case 100%) will form part of the total of consolidated retained earnings, balanced by increases in net assets on the other side of the statement of fi nancial position in the future.The example below demonstrates the preparation of the consolidated statement of fi nancial position one year after the initial acquisition.
Example 3.B
Statement of fi nancial positions at 31 December 20X1
A B$ $
Non-current assets Property, plant and equipment 65,000 24,000 Investment 25,000 –
90,000 24,000Net current assets 20,000 6,000
110,000 30,000Equity Share capital 50,000 10,000 Retained earnings 60,000 20,000
110,000 30,000
Solution
Note that the investment has remained exactly the same in the individual statement of fi nancial position of A. This would normally be the case, unless impairment had taken place.
This means, however, that the elimination of the investment against the equity of B leaves a difference of $5,000 ($25,000 is set against a total of $30,000). This difference is post-acquisition retained earnings which will be refl ected as part of consolidated retained earnings.
The same principles as before are following in preparing the consolidated statement of fi nancial position for the A Group:
A Group: consolidated statement of fi nancial position at 31 December 20X1
$ CommentNon-current assets Property, plant and equipment 89,000 A � B Investment in B – Eliminated – B’s net assets recognised insteadNet current assets 26,000 A � B
115,000Equity Share capital 50,000 A only Retained earnings 65,000 A ($60,000 � post-acquisition reserves in B
$5,000)110,000

STUDY MATERIAL F228
THE
CO
NSO
LIDAT
ED S
TATE
MEN
T O
F FI
NA
NC
IAL
POSI
TIO
N 3.2.1 GoodwillIn Example 3.A a subsidiary with a net asset value of $25,000 was acquired for exactly $25,000. This involved two simplifying assumptions:
(a) the investment in B could be acquired from its owners for exactly the amount of net assets in the statement of fi nancial position; and
(b) the carrying value of net assets was equivalent to its fair value.
It will, in practice, hardly ever be the case that both of these conditions exist. Usually, the owners of a profi table business will expect to receive more in exchange for the invest-ment than its net asset value. This additional amount arises for various reasons. It is quite likely that the assets recognised in the statement of fi nancial position do not represent all the assets of the fi rm but intangibles such as good reputation and customer loyalty may be worth something to the purchaser. The difference between the cost of investment and the fair value of the net assets acquired is known as goodwill on acquisition. The requirements of IFRS 3 relating to the recognition of goodwill were discussed in Chapter 2.
Where 100% of the equity of a subsidiary is acquired, goodwill on acquisition is calcu-lated as follows:
The aggregate of: consideration, measured at fair valueLESSNet assets acquired (the fair value of identifi able assets acquired less liabilities assumed)
Example 3.C
C acquired 100% of the equity share capital of D on 31 December 20X2. The statements of fi nancial positions of the two entities at that date were as shown below:
Statement of fi nancial position at 31 December 20X2
C D$ $
Non-current assets Property, plant and equipment 100,000 30,000 Investment 50,000 –
150,000 30,000Net current assets 50,000 10,000
200,000 40,000Equity Share capital 50,000 10,000 Retained earnings 150,000 30,000
200,000 40,000
Note: The fair value of D’s net current assets was the same as carrying value at 31 December 20X2. The fair value of the property, plant and equipment was $32,000.
Prepare the consolidated statement of position at 31 December 20X2.
Solution
Working1. Calculation of goodwill on acquisition
$ $Consideration 50,000Net assets acquired, at fair valueProperty, plant and equipment 32,000Net current assets 10,000Total identifi able net assets 42,000Goodwill 8,000

29FINANCIAL MANAGEMENT
THE C
ON
SOLID
ATED STATEM
ENT O
F FINA
NC
IAL PO
SITION
C Group: consolidated statement of fi nancial position at 31 December 20X2
$ CommentNon-current assets Goodwill 8,000 See working 1 Property, plant and equipment 132,000 100,000 � 30,000 � 2,000 (Fair value adjustment) Investment in D – Eliminated – D’s net assets recognised instead
50,000 � 10,000Net current assets 60,000
200,000Equity Share capital 50,000 C only Retained earnings 150,000 Retained earnings of CTotal assets 200,000
Some points to note:1. The revaluation of D’s property, plant and equipment has been accounted for in the calculation of goodwill.
No revaluation reserve is required in the consolidated fi nancial statements. The adjustment to fair value has been recognised in the consolidated fi nancial statements in order to comply with IFRS 3. However, it need not necessarily be recognised in D’s own fi nancial statements – recognition will depend upon D’s account-ing policies.
2. The retained earnings at 31 December 20X2 are those of C, the parent, only. This is because the acqui-sition has taken place on that day. Remember that in subsequent consolidated statements of position consolidated retained earnings will comprise the retained earnings of the parent plus its share of the post-acquisition retained earnings in the subsidiary.
3. An alternative way of calculating goodwill is to deduct the value of equity plus or miInus any adjustments in respect of fair value from the consideration:
$ $Consideration 50,000Less:Equity acquired 40,000Fair value adjustment 2,000
42,000Goodwill 8,000
This method is likely to be quicker than listing all the assets and liabilities acquired.
3.2.2 Bargain purchasesOccasionally, it happens that the amount of consideration paid for an investment in a sub-sidiary is less than the aggregate of the fair value of net assets acquired. The difference between the two amounts, rather than giving rise to an asset, goodwill, is a credit bal-ance. This difference is sometimes referred to as ‘negative goodwill’. Where this occurs, the acquiring entity must reassess the assets and liabilities acquired to ensure that all are included, and that they are appropriately measured. If, after this exercise, there is still a credit balance, IFRS 3 requires that the acquirer should recognise the credit as a gain through profi t or loss on the date of acquisition.
3.3 Non-controlling interestsThe examples in this chapter so far have all involved a parent company acquiring 100% of the voting share capital of a subsidiary. However, control of a subsidiary can be acquired with a partial acquisition (which will usually involve a purchase of something in excess of 50% of the issued equity share capital). The consequence of a partial acquisition is that

STUDY MATERIAL F230
THE
CO
NSO
LIDAT
ED S
TATE
MEN
T O
F FI
NA
NC
IAL
POSI
TIO
N a part of the shareholding in the subsidiary continues to be held by one or more parties external to the group. This part of the shareholding is designated as ‘non-controlling inter-ests’ (NCI) by IFRS 3 (revised). (Note: Prior to the revision of IFRS 3 in January 2008 ‘non-controlling interests’ were referred to as ‘minority interests’ and this may be the term you fi nd used in older examples and other textbooks.)
3.3.1 Accounting for non-controlling interestsEarlier in the chapter the following accounting technique for acquisitions was explained:
All the results and the assets and liabilities that are under the control of the parent are combined together to show single totals for each item in the fi nancial statements. This means that the revenue and expenses, assets and liabilities of the entities in the group are added together, line by line.
The existence of NCI makes no difference at all to the application of the principle of control. The assets and liabilities of the subsidiary are under the control of the parent regardless of the fact that NCI exist, and therefore the revenue and expenses, assets and liabilities of the entities in the group are added together, line by line.
NCI are recognised within equity in the consolidated fi nancial statements. IFRS (revised) permits a choice of accounting treatment for the measurement of NCI:
Either:
(a) NCI should be measured at fair value; or(b) NCI should be measured at the proportionate share of the acquiree’s identifi able net
assets.
A great deal of discussion preceded the issue of IFRS 3 (revised) on the issue of meas-urement of NCI. The IASB would have preferred to have option (a) as the only treatment, however many of its constituents objected because it would be diffi cult and expensive to undertake this measurement exercise. Where the equity instruments of the subsidiary are themselves quoted on an active market, the exercise of valuing NCI is straightforward. If not, it is likely to involve estimation and assumptions about (eg.) an appropriate discount-ing for the fact the interests are non-controlling and therefore worth less.
Because of the controversy, IFRS 3 (revised) offers a choice of accounting treatments as illustrated in the example below.
Example 3.D
The statements of fi nancial positions of E and its subsidiary F at 31 December 20X3 were as follows:
E F$ $
Non-current assets Property, plant and equipment 90,000 25,000 Investment 32,000 –
122,000 25,000Net current assets 38,000 14,000
160,000 39,000Equity Share capital ($1 shares) 80,000 20,000 Retained earnings 80,000 19,000
160,000 39,000
E acquired 18,000 shares in F on 31 December 20X0 when F’s retained earnings were $10,000.

31FINANCIAL MANAGEMENT
THE C
ON
SOLID
ATED STATEM
ENT O
F FINA
NC
IAL PO
SITION
Required: prepare the consolidated statement of fi nancial position for the E group as at 31 December 20X3, under each of the two following assumptions:1. It is the E group’s policy to value non-controlling interests at acquisition at its proportionate share of the fair
value of the subsidiary’s identifi able net assets.2. It is the E group’s policy to value non-controlling interests at fair value. The fair value of the NCI in F at the
date of acquisition was estimated to be $2,500.
Note: It can be assumed that no fair value adjustments were required to F’s net assets at the date of acquisition.
Solution – assumption 1
First, the group structure must be established. E owns 18,000 of the 20,000 shares of F: a shareholding of 90%. This means that the NCI is 10% (100% � 90%).Workings1. Non-controlling interests This is 10% of the net assets of F at 31 December 20X3: 10% � $39,000 � $3,900.
2. Goodwill on consolidation
$ $Consideration 32,000Net assets at date of acquisition: Share capital ($1 shares) 20,000 Retained earnings 10,000Group share (90%) 27,000Goodwill 5,000
3. Retained earnings
$Retained earnings of E 80,00090% of post-acquisition retained earnings of F: 90% � ($19,000 � $10,000)
8,100
88,100
E Group: consolidated statement of fi nancial position at 31 December 20X3
$ CommentNon-current assets Goodwill 5,000 See working 2 Property, plant and equipment 115,000 90,000 � 25,000
120,000Net current assets 52,000 38,000 � 14,000
172,000Equity attributable to owners of the parent Share capital 80,000 E only Retained earnings 88,100 See working 3
168,100Non-controlling interests 3,900 See working 1
172,000
Solution – assumption 2
Workings1. Goodwill on consolidation
$Consideration transferred 32,000NCI at fair value 2,500
34,500
Net assets at acquisition: Share capital (20,000) Retained earnings (10,000)Goodwill on acquisition 4,500

STUDY MATERIAL F232
THE
CO
NSO
LIDAT
ED S
TATE
MEN
T O
F FI
NA
NC
IAL
POSI
TIO
N 2. Non-controlling interestsNCI at 31 December 20X3 � NCI at date of acquisition � share of post-acquisition profi ts:
At date of acquisition 2,500Post-acquisition profi t share:10% � ($19,000 � $10,000) 900At 31 December 20X3 3,400
3. Retained earnings
$Retained earnings of E 80,000Post-acquisition retained earnings:($19,000 � $10,000) � group share 90% 8,100
88,100
E Group: consolidated statement of fi nancial position at 31 December 20X3
$ CommentNon-current assets Goodwill 4,500 See working 1 Property, plant and equipment 115,000 90,000 � 25,000
119,500Net current assets 52,000 38,000 � 14,000
171,500Equity attributable to owners of the parent Share capital 80,000 E only Retained earnings 88,100 See working 3
168,100Non-controlling interest 3,400 See working 1
171,500
It should be noted that NCI are treated as part of total equity. The other constituent part of equity is described in the statement of fi nancial position above as ‘equity attributable to owners of the parent’, which is the description used in IAS 1.
Note also that the value of goodwill changes because of the valuation at fair value of NCI. This is because the fair value of NCI is lower (in this example) than the attributable share of net assets worked out on a simple percentage basis. This means that, in fair value terms, the value of net assets acquired by E is greater, and there-fore goodwill on consolidation is lower.
In F2, the examination questions will state which of the permitted treatments is to be applied. Where the fair value option is to be followed, the fair value of NCI will be given.
3.4 The elimination of intra-group balances IAS 27 requires that:
‘ Intragroup balances, transactions, income and expenses should be eliminated in full ’ . Intragroup balances are likely to arise where the parent and subsidiary entities trade with
each other. The consolidated fi nancial statements present the results and position of the parent entity and its subsidiary (or subsidiaries) as if they were a single combined entity. Therefore, where balances appear in both a parent and subsidiary statement of fi nancial position, they must be eliminated against each other on consolidation. If this were not done, elements such as receivables and payables would be overstated.

33FINANCIAL MANAGEMENT
THE C
ON
SOLID
ATED STATEM
ENT O
F FINA
NC
IAL PO
SITION
The balances should be cancelled out against each other as part of the consolidation process. Where there are items in transit (usually cash or inventory) the balances may not cancel entirely. Any surplus must be recognised as an in-transit item in the consolidated statement of fi nancial position.
Example 3.E
The statements of fi nancial positions of A and B as at 31.12.X7 are as follows:
A B$ $ $ $
ASSETS Non-current assets
Investment in B (note 1) 15,000 Property, plant and equipment 30,000 15,000
Current assets Inventories 10,000 5,000 Receivables (note 2) 12,000 6,000
22,000 11,00067,000 26,000
EQUITY � LIABILITIES Equity
Issued capital 40,000 10,000 Retained earnings 14,000 8,000
Current liabilities 54,000 18,000 Trade payables (note 2) 8,000 4,000 Bank overdraft 5,000 4,000
13,000 8,000 67,000 26,000
Notes 1. A bought 75% of the shares in B on 31.12.X4 when the retained earnings of B stood at $4,000. Since that
date, there has been no impairment of goodwill on consolidation. 2. The receivables of A include $3,000 in respect of goods supplied to B in the last few months of the year. The
payables of B include $2,000 payable to A. You ascertain that on 30.12.X7 B sent a payment of $1,000 to A. This payment was received and recorded by A on 3.1.X8.
3. It is the group’s policy to value non-controlling interests at acquisition at its proportionate share of the fair value of the subsidiary’s identifi able net assets. (i.e. not at fair value)
Prepare the consolidated statement of fi nancial position as at 31.12.X7.
Solution
Before starting to prepare the consolidated statement of fi nancial position it is worth noting that:
● Since B is a 75% subsidiary, the non-controlling interests is 25%. ● The intra-group balances differ by $1,000 ($3,000 � $2,000). The difference is clearly caused by the cash
in transit of $1,000. We now proceed to prepare the consolidated statement of fi nancial position.
A Group: Consolidated statement of fi nancial position at 31 December 20 X 7
$ $ASSETS Non-current assets
Goodwill 4,500 See working 2 Property, plant and
equipment 45,000 A � B 49,500
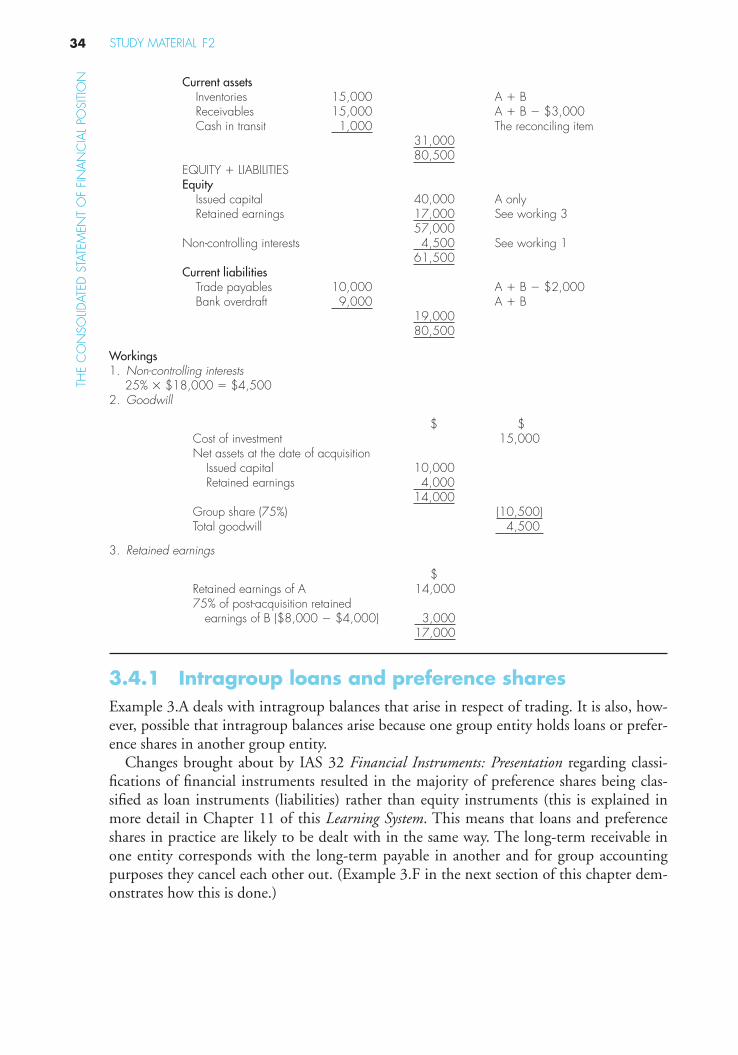
STUDY MATERIAL F234
THE
CO
NSO
LIDAT
ED S
TATE
MEN
T O
F FI
NA
NC
IAL
POSI
TIO
N Current assets Inventories 15,000 A � B Receivables 15,000 A � B � $3,000 Cash in transit 1,000 The reconciling item
31,00080,500
EQUITY � LIABILITIES Equity
Issued capital 40,000 A only Retained earnings 17,000 See working 3
57,000Non-controlling interests 4,500 See working 1
61,500 Current liabilities
Trade payables 10,000 A � B � $2,000 Bank overdraft 9,000 A � B
19,00080,500
Workings 1. Non-controlling interests
25% � $18,000 � $4,500 2. Goodwill
$ $ Cost of investment 15,000 Net assets at the date of acquisition
Issued capital 10,000 Retained earnings 4,000
14,000 Group share (75%) (10,500) Total goodwill 4,500
3. Retained earnings
$ Retained earnings of A 14,000 75% of post-acquisition retained earnings of B ($8,000 � $4,000) 3,000
17,000
3.4.1 Intragroup loans and preference shares Example 3.A deals with intragroup balances that arise in respect of trading. It is also, how-ever, possible that intragroup balances arise because one group entity holds loans or prefer-ence shares in another group entity.
Changes brought about by IAS 32 Financial Instruments: Presentation regarding classi-fi cations of fi nancial instruments resulted in the majority of preference shares being clas-sifi ed as loan instruments (liabilities) rather than equity instruments (this is explained in more detail in Chapter 11 of this Learning System . This means that loans and preference shares in practice are likely to be dealt with in the same way. The long-term receivable in one entity corresponds with the long-term payable in another and for group accounting purposes they cancel each other out. (Example 3.F in the next section of this chapter dem-onstrates how this is done.)

35FINANCIAL MANAGEMENT
THE C
ON
SOLID
ATED STATEM
ENT O
F FINA
NC
IAL PO
SITION
3.5 The treatment of unrealised profits on assets bought from group companies
IAS 27 explains that profi ts and losses arising from intra-group transactions that are rec-ognised in assets, such as inventory and non-current assets, should be eliminated in full. These are commonly known as unrealised profi ts because, from a group point of view, the profi t on such transactions has not yet been realised. Suppose that an entity D habitually purchases inventory from its parent, A. A makes a profi t on the sale which is recognised upon despatch of the goods to D. This is fi ne for the purposes of entity-level fi nancial statements for A and D. However, the A group accounts present the results and position of the group as if it were a single entity. It would be incorrect to artifi cially boost the prof-its of this single entity by including profi t made on transfers of inventories or other assets between the constituent entities, and therefore they must be eliminated as part of the con-solidation process. Profi t on such transactions cannot be recognised until the inventories or other assets are sold outside the group, at which point the profi ts are realised from a group point of view.
Taking the example of A and D a little further:
Example 3.F
D sells inventories to A at a standard profi t margin of 25%. At the group’s year end of 31 December, the invento-ries of A include goods purchased from D at cost to A of $12,500.
Assumption 1: D is a wholly owned subsidiary of A. What is the amount of the adjustment to eliminate intra-group profi ts?
Solution
First, the amount of profi t made by D must be established. The goods at cost to A are $12,500. D’s profi t mar-gin is 25% which means that the value in A of $12,500 represents 125% of cost to D.
Profi t made by D � 25/125 � $12,500 � $2,500 Inventories in A, from a group accounting perspective, are therefore overstated by $2,500 as is profi t in D.
The consolidation adjustment required is:
DR Consolidated profi ts 2,500 CR Consolidated inventories 2,500
Assumption 2: D is 80% owned by A and non-controlling interests (NCI) hold the remaining 20% of the equity share capital of D. All other facts remain the same.
Solution
The amount of profi t in D arising from the intra-group transaction is as before. However, only 80% of the profi ts arising in the subsidiary are attributable to the group, and the NCI take credit for the remainder of 20%. IAS 27 requires that profi ts and losses arising from this type of transaction are eliminated in full which means that the credit to consolidated inventories must be for the full $2,500. In this case, though, because of the existence of NCI, the debit entry is split to give the following consolidation adjustment:
DR Consolidated profi ts 2,000 DR NCI 500 CR Consolidated inventories 2,500
In this example the sale has been from the subsidiary to the parent entity, which potentially brings in the com-plication of non-controlling interests. Where the position is reversed and the parent sells to the subsidiary, the intra-group profi t is recorded in the parent entity, and therefore the issue of non-controlling interests is irrelevant.

STUDY MATERIAL F236
THE
CO
NSO
LIDAT
ED S
TATE
MEN
T O
F FI
NA
NC
IAL
POSI
TIO
N If the positions had been reversed in this example, with A selling to D, the consolidation adjustment would be simply:
DR Consolidated profi ts 2,500 CR Consolidated inventories 2,500
The example below is a comprehensive example that includes consolidation adjustments in respect of elimination of intra-group payables and receivables, both long term and short term and the elimination of intra-group profi ts.
Example 3.G
The statements of fi nancial positions of A and B as at 31.12.X7 are as follows:C D
$ $ $ $ASSETS Non-current assets Property, plant and equipment 145,000 50,000
Investments 53,000 –198,000 50,000
Current assets Inventories 40,000 30,000 Trade receivables 45,000 17,600 Intra-group receivables – 2,500 Cash at bank 17,000 9,900
102,000 60,000300,000 110,000
EQUITY AND LIABILITIES Equity
Ordinary ($1) shares 100,000 40,000 Retained earnings 90,000 32,000
190,000 72,000 Non-current liabilities
Preference shares 50,000 10,000 5% borrowings 20,000 10,000
70,000 20,000 Current liabilities
Trade payables 39,000 18,000 Intra-group payables 1,000 –
40,000 18,000300,000 110,000
Notes 1. The investment by C in D was acquired as follows:
$30,000 ordinary shares of $1 44,000 4,000 preference shares 4,000 5,000 5% borrowings 5,000
53,000
The ordinary shares were acquired when the retained earnings of D were $12,000. Since acquisition there has been no impairment of goodwill.
2. A remittance of $1,500, sent by C to D on 30.12.X2, was not recorded in the books of D until 4.1.X3. 3. Goods had been sold at normal selling price by D to C during the year. The total sales of such goods during
the year were $80,000. The inventory of C at 31.12.X2 contained goods purchased from D at a selling price of $16,000. D earns 20% profi t margin on its sales to H.
4. At the year end there was no liability outstanding in respect of loan interest or preference share dividends payable. 5. It is the group’s policy to value non-controlling interests at acquisition at its proportionate share of the fair value
of the subsidiary’s identifi able net assets.Requirement: prepare a consolidated statement of fi nancial position at 31.12.X2.

37FINANCIAL MANAGEMENT
THE C
ON
SOLID
ATED STATEM
ENT O
F FINA
NC
IAL PO
SITION
Solution The following points are important:
1. C owns 75% of the ordinary shares, 40% of the preference shares and 50% of the borrowings in D. Only the ordinary shares are relevant for determining C’s interest in its subsidiary. The preference shares and borrow-ings are both liabilities, which will be eliminated in part. The balances left over after elimination represent the investment by investors outside of the group, and will be included in the group’s long-term liabilities.
2. There is a difference on intra-group balances of $1,500 (the receivable of D is $2,500 while the payable of C is $1,000. The difference is due to cash in transit between C and D).
3. The inventory of C contains goods costing C $16,000 that were purchased from D. D made a profi t of $3,200 on these goods ($16,000 � 20%). From the group’s perspective the profi t on these goods will not be realised until the goods are sold outside the group. Therefore an adjustment must be made to the clos-ing consolidated inventory fi gure to ensure that it is included at cost to the group. There is no need to adjust consolidated inventory for goods that have been sold by one group company to another and that have been then sold on outside the group. As far as the group is concerned, profi t on the sale of these inventories has been recognised. The unrealised profi t adjustment is made in respect only of inventories sold intra-group that remain in the group at the year end.
The consolidated statement of fi nancial position of the C group as at 31.12.X2 is as follows:
$ $ Comments ASSETS Non-current assets
Goodwill 5,000 See working 1 Property, plant and equipment 195,000 C � D
200,000 Current assets
Inventories 66,800 $40,000 � $30,000 � $3,200 (see note 3 above) Trade receivables 62,600 C � D Cash in transit 1,500 See note 2 above Cash at bank 26,900
157,800357,800
EQUITY AND LIABILITIES Equity
Share capital 100,000 C only Consolidated retained earnings 102,600 See working 2
202,600Non-controlling interests 17,200 See working 3
Non-current liabilities Preference shares 56,000 See working 4 5% borrowings 25,000 See working 4
81,000 Current liabilities
Trade payables 57,000 C � D 357,800
Workings 1. Goodwill
$ $ Cost of investment in ordinary shares 44,000 Net assets at the date of acquisition:
Share capital (75% � $40,000) 30,000 Reserves (75% � $12,000) 9,000
(39,000) Goodwill 5,000

STUDY MATERIAL F238
THE
CO
NSO
LIDAT
ED S
TATE
MEN
T O
F FI
NA
NC
IAL
POSI
TIO
N 2. Consolidated retained earnings
$C 90,000 D (75% � 32,000 � 12,000) 15,000 75% � unrealised profi t in inventory (75% � $3,200) (2,400)
102,600
3. Non-controlling interests
$ 25% � net assets (25% � 72,000) 18,000 25% � unrealised profi t in inventory (25% � $3,200) (800)
17,200
4. Non-current liabilities
$ $ Preference Shares Borrowings
C 50,000 20,000 D ($10,000 � 4,000) 6,000
D ($10,000 � 5,000) 5,00056,000 25,000
3.5.1 Intra-group trading in non-current assets The same principles are followed as explained above in respect of inventory. However, inventory is usually sold quickly, and can be expected to leave the group, thus realising profi t to the group, shortly after the date of the statement of fi nancial position.
The consequences of intra-group trading are somewhat more complicated where non-current assets are involved, because they are likely to continue to be recognised within the group entity for more than one accounting period.
Where there is unrealised profi t on the intra-group sale of a non-current asset item con-solidation adjustments must be made over the life of the asset in order to ensure that unre-alised profi t is eliminated.
The example below explains the required adjustments.
Example 3.H
E owns 75% of the equity shares of F. On 31.12.X0 (the year end date) E sold an item of plant to F for $120,000. The plant cost E $100,000 to manufacture. F depreciated the plant over a 5-year period starting from 1.1.X1. Show the carrying value of the plant in the consolidated statement of fi nancial position as at 31.12.X0, 31.12.X1 and 31.12 .X2 and explain the relevant consolidation adjustments.
Solution
● 31.12.X0. The profi t made by E is $20,000. This is unrealised from a group perspective since the asset has merely been transferred from one group entity to another. The cost to the group of this asset is $100,000 and this is what should appear in group property, plant and equipment. However, the property, plant and equipment of F will (quite correctly from the viewpoint of F as a separate entity) include the asset at a cost of $120,000. Therefore, given that we start the consolidated statement of fi nancial position by aggregating the assets and liabilities from the individual statement of fi nancial positions of the group companies, we need to make the fol-lowing consolidation adjustment:
Credit Property, plant and equipment $20,000Debit Retained earnings $20,000

39FINANCIAL MANAGEMENT
THE C
ON
SOLID
ATED STATEM
ENT O
F FINA
NC
IAL PO
SITION
There is no adjustment to the non-controlling interests since since the unrealised profi t is made by the parent.
● 31.12. X1. The asset will appear in the statement of fi nancial position of F at a carrying amount of $96,000 [(4/5) � $120,000]. The carrying amount based on cost to the group is $80,000 [(4/5) � $100,000]. Therefore a consolidation adjustment of $16,000 is required at 31.12.X1. Once again the adjustment is to property, plant and equipment and consolidated retained earnings. Notice that the adjustment we are making on 31.12.X1 does not add to the adjustment made on 31.12.X0. This is the equivalent adjustment that is required on 31.12.X1.
● 31.12.X2. The carrying amount of the asset in the books of F is $72,000 [(3/5) � $120,000] and the car-rying amount based on cost to the group $60,000 [(3/5) � $100,000]. This means that the consolidation adjustment to property, plant and equipment and retained earnings on 31.12.X2 is $12,000. Over time the required adjustment reduces as the asset is used; the adjustment in this case reduces by $4,000 each year. This is the difference between the depreciation that will have been charged by F [(1/5) � $120,000 � $24,000] each year and the required amount based on cost to the group [(1/5) � $100,000 � $20,000].
The additional depreciation has been charged by the partly owned subsidiary and so the NCI is affected by its share of the adjustment for depreciation.
3.6 Adjustments to achieve uniformity of accounting policy
IAS 27 requires that consolidated fi nancial statements should be prepared using uniform accounting policies for like transactions and other events.
It is quite possible to have a group in which entities adopt different accounting policies in their own fi nancial statements, and there is nothing to prevent them from doing so. However, where this is the case consolidation adjustments are required in order to ensure that the consolidated fi nancial statements all refl ect the accounting policies of the parent.
Example 3.I demonstrates the adjustments required to align accounting policies.
Example 3.I
The statements of fi nancial positions of G and its subsidiary H as at 31 December 20X3 are as follows:
G H$ $
Intangible asset (note) 15,000 Property, plant and equipment 40,000 35,000 Investment in H 50,000 Net current assets 20,000 20,000
110,000 70,000
Ordinary share capital 60,000 50,000 Retained earnings 50,000 20,000
110,000 70,000
Note 1. G purchased 40,000 of the $1 shares of H on 1.1.X0 for $50,000 when the retained earnings of H
showed a balance of $10,000. There has been no impairment of goodwill on consolidation since acquisition.
2. H has all the same accounting policies as G except as regards intangible assets. The intangible assets of H are all of a type whose recognition would not be permitted under IAS 38. IAS 38 is to be followed in preparing the consolidated fi nancial statements. When G made its investment in H on 1.1.X0 the intangible assets of H included $7,500 that would not qualify for recognition under IAS 38.
3. It is the group’s policy to value non-controlling interests at acquisition at its proportionate share of the fair value of the subsidiary’s identifi able net assets.
Prepare the consolidated statement of fi nancial position as at 31.12.X3. No adjustments are needed for intra-group balances or unrealised profi t on inventory.

STUDY MATERIAL F240
THE
CO
NSO
LIDAT
ED S
TATE
MEN
T O
F FI
NA
NC
IAL
POSI
TIO
N Solution
Before we proceed to the consolidated statement of fi nancial position it is worth noting that G owns 80% of the shares of H (40,000 out of a total of 50,000). The adjustment required in respect of H to refl ect the accounting policy difference has the following effects:
● Closing net assets and closing retained earnings are overstated by $15,000. This means that restated clos-ing net assets are $55,000 ($70,000 � $15,000) and restated closing retained earnings are $5,000 ($20,000 � $15,000).
● Pre-acquisition retained earnings are overstated by $7,500. This means that restated pre-acquisition retained earnings are $2,500 ($10,000 � $7,500).
We now have a relatively straightforward consolidated statement of fi nancial position.
$ Comments Goodwill 8,000 See working 2 Property, plant and equipment 75,000 G � H Net current assets 40,000 G � H
123,000
Share capital 60,000 G only Retained earnings 52,000 See working 3
112,000Non-controlling interests 11,000 See working 1
123,000
Workings 1. Non-controlling interests
20% � $55,000 (the restated net assets of H).
2. Goodwill
$ $ Cost of investment 50,000 Net assets at the date of acquisition:
Share capital 50,000 Retained earnings – as restated 2,500
52,500 Group share (80%) (42,000)
Goodwill 8,000
3. Retained earnings
$G 50,000H – based on restated fi gures [80% ($5,000 � $2,500)] 2,000
52,000
3.7 Adjustments for fair value at the date of acquisition
In Chapter 2 it was noted that goodwill was calculated using fair value measurements for assets and liabilities in the subsidiary at the date of acquisition, in accordance with the requirements of IFRS 3. Chapter 2, introduced the principles of fair value measurement on acquisition of a subsidiary. For the moment, in this chapter, we will examine the impli-cations of measurement at fair value on the fi nancial statements subsequent to acquisition.
Sometimes the fair values of net assets at the point of acquisition are recognised in the subsidiary at the date of consolidation, where the accounting policy of the entity itself permits this. However, where the subsidiary adopts the cost model of valuation, there will

41FINANCIAL MANAGEMENT
THE C
ON
SOLID
ATED STATEM
ENT O
F FINA
NC
IAL PO
SITION
be continuing differences on consolidation arising from the fact that the net assets of the subsidiary are recognised at fair value upon acquisition. In the latter case, consolidation adjustments will be required.
The example below illustrates the adjustments required.
Example 3.J
The statements of fi nancial positions of Star and its subsidiary entity Ark as at 31 December 20X7 were as follows:
Star Ark$’000 $’000
Property, plant and equipment 120 177 Investment in Ark 134Inventory 10 5Receivables 30 25 Bank 10 5
304 212
Ordinary share capital 100 75 Retained earnings 144 120
244 195 Current liabilities 60 17
304 212
Additional information
1. On 1 January 20X5, when the retained earnings of Ark showed a balance of $60,000, Star purchased 60,000 ordinary shares in Ark for $134,000.
2. Star sold goods to Ark during the year for $10,000 at a mark-up of 25% on cost. At the year-end, half of these goods were still held in inventory by Ark.
3. On 1 January 20X5 the net assets of Ark had a fair value of $155,000. The excess of fair value over the carrying value in the individual fi nancial statements of Ark was due to plant included in property, plant and equipment. This plant had a useful economic life of 5 years from 1 January 20X5. None of the plant that was subject to a fair-value adjustment at 1 January 20X5 had been sold by 31 December 20X7. Property plant and equipment is measured in Ark’s own fi nancial statements at depreciated cost.
4. Since acquisition there has been no impairment of goodwill on consolidation. 5. It is the group’s policy to value non-controlling interests at acquisition at its proportionate share of the fair value
of the subsidiary’s identifi able net assets.
Prepare the consolidated statement of fi nancial position for the group as at 31.12.X7.
Solution
Before we prepare the consolidated statement of fi nancial position, let us consider the implications of each of the additional pieces of information we have been given (the numbers below correspond with the numbered pieces of information):
1. This tells us that Star owns 80% (60/75) of the shares of Ark. At the date of acquisition the individual fi nancial statements of Ark showed net assets of $135,000 (share capital $75,000 plus retained earnings $60,000).
2. This tells us that there is unrealised profi t in the closing inventory of Ark. The closing inventory of Ark that was bought from Star is $5,000 [(1/2) � $10,000]. The profi t element in this inventory is $1,000 [(25/125) � $5,000]. We need to take care when computing this fi gure – the profi t is expressed as a per-centage of the group cost, not the intra-group selling price.
3. This tells us that the fair value of the net assets of Ark was $20,000 ($155,000 � $135,000) greater than the carrying value in the individual statement of fi nancial position of Ark at the date of acquisition. Since the excess is due to plant that is being depreciated over 5 years the fair-value adjustment will have an impact on closing net assets as well (the acquisition took place three years ago). The impact on closing net assets is an increase of $8,000 [$20,000 � (2/5)].We can summarise the effect as:
● pre-acquisition retained earnings increased by $20,000 to $80,000; ● closing property, plant and equipment increased by $8,000 to $185,000; ● closing net assets increased by $8,000 to $203,000; ● closing retained earnings increased by $8,000 to $128,000.

STUDY MATERIAL F242
THE
CO
NSO
LIDAT
ED S
TATE
MEN
T O
F FI
NA
NC
IAL
POSI
TIO
N We now prepare the consolidated statement of fi nancial position:
$’000 Comment Goodwill 10 See working 2 Property, plant and equipment 305 120 � 185 � using adjusted fi gure Inventory 14 10 � 5 � 1 (unrealised profi t) Receivables 55 S � A Bank 15 S � A
399
Share capital 100 Star only Retained earnings 181.4 See working 3
281.4
Non-controlling interests 40.6 See working 1 Current liabilities 77 60 � 17
399
Workings 1. Non-controlling interests
20% � $203,000 (the adjusted net assets of Ark at 31.12.X7). There is no need to charge the minority shareholders with any unrealised profi t in this example because the profi t is made by the parent.
2. Goodwill
$’000 $’000 Cost of investment 134 Net assets at the date of acquisition:
Share capital 75 Retained earnings – as amended 80
155 Group share (80%) (124)
Total goodwill 10
3. Retained earnings
$’000Star 144 Ark using amended fi gures:
80% ($128,000 � $80,000) 38.4 Unrealised profi t on inventory � made by the parent (1)
181.4
3.8 Summary This chapter introduced the application of the rules for full consolidation. The IFRS 3 requirements for recognition of goodwill were applied and the consolidation was com-pleted for fully owned and partially owned subsidiaries. The consolidated statement of fi nancial position was prepared.
The chapter also covered several additional complexities involved in the preparation of the consolidated statement of fi nancial position, including intra-group trading and bal-ances, fair value adjustments and adjustment to achieve uniformity of accounting policy.
Students should be sure that they have completely understood the chapter and its exam-ples, and should have worked through the revision questions that follow, before moving on to Chapter 4.

43FINANCIAL MANAGEMENT
THE C
ON
SOLID
ATED STATEM
ENT O
F FINA
NC
IAL PO
SITION
A brief note about workings: it was noted in Chapter 1 that a common mistake made by candidates was that of producing untidy and illegible workings for more complex ques-tions. It is important to get into the habit of producing logical and neat workings for con-solidation questions. The style of working used throughout this Learning System involves the use of a columnar approach. Some candidates use double entry consolidation work-ings, showing T accounts, and others use a diagrammatic method. To some extent, the style of working used depends upon that demonstrated by your tutor (where applicable). However, it is strongly recommended that students learn to use the columnar method. Completely accurate answers can be obtained by using other methods, but the problem is that using T accounts or diagrams takes longer. Columnar workings also tend to be easier for markers to follow.
The preparation of the consolidated statement of fi nancial position could be tested in either the shorter style questions or the Long questions (i.e. for 25 marks). The long style questions are likely to contain further complications such as acquisitions or disposals, or the incorporation into consolidated statements of joint venture or associate interests. These are dealt with in subsequent chapters in this Learning System.

This page intentionally left blank

45
Revision Questions 3Note: The questions that are included in the early part of the study system are not usually of exam standard. Tests of knowledge are essential early on in the study process to ensure the basics have been grasped – the exam standard questions will come in later chapters. Please ensure you complete the revision questions in this chapter as they are a fundamental test of your understanding of consolidation, which is essential before moving onto more complex consolidation.
Question 1On 31 December 20X4 AB acquired 100% of the ordinary share capital of its subsidiary, CD for $50,000. The statements of fi nancial positions of the individual entities at that date were:
AB CD$ $
Non-current assets Property, plant and equipment 70,000 30,000 Investment 50,000 –
120,000 30,000Net current assets 30,000 15,000
150,000 45,000Equity Share capital 50,000 20,000 Retained earnings 100,000 25,000
150,000 45,000
RequirementPrepare the consolidated statement of fi nancial position for the AB Group at 31 December 20X4.
Question 2This question relates to AB and CD (facts of the acquisition as in Question 1) one year on from the acquisition. The statements of fi nancial positions of the two entities at 31 December 20X5 were as follows:
AB CD$ $
Non-current assets Property, plant and equipment 75,000 32,000 Investment 50,000 –
125,000 32,000

THE
CO
NSO
LIDAT
ED S
TATE
MEN
T O
F FI
NA
NC
IAL
POSI
TIO
N
REVISION QUESTIONS F246
Net current assets 37,000 17,000162,000 49,000
Equity Share capital 50,000 20,000 Retained earnings 112,000 29,000
162,000 49,000
RequirementPrepare the consolidated statement of fi nancial position for the AB Group at 31 December 20X5.
Question 3AX acquired 30,000 of the 50,000 issued ordinary voting shares of CY on 1 April 20X7, for $60,000. Retained earnings of CY at that date were $25,000. The acquisition was suf-fi cient to give it control over CY’s operating and fi nancial policies.
The statements of fi nancial positions of the two entities were as follows on 31 March 20X8:
AX CY$ $
Non-current assets Property, plant and equipment 125,000 50,000 Investment 60,000 –
185,000 50,000Net current assets 40,000 30,000
225,000 80,000Equity Share capital 100,000 50,000 Retained earnings 125,000 30,000
225,000 80,000
It is the group’s policy to value non-controlling interests at its proportionate share of the fair value of the subsidiary’s identifi able net assets.
RequirementPrepare the consolidated statement of fi nancial position for the AX Group at 31 March 20X8.
Question 4 (same detail as Q 3 but non-controlling interest at fair value)
AX acquired 30,000 of the 50,000 issued ordinary voting shares of CY on 1 April 20X7, for $60,000. Retained earnings of CY at that date were $25,000. The acquisition was suf-fi cient to give it control over CY’s operating and fi nancial policies.

THE C
ON
SOLID
ATED STATEM
ENT O
F FINA
NC
IAL PO
SITION
47FINANCIAL MANAGEMENT
The statements of fi nancial positions of the two entities were as follows on 31 March 20X8:
AX CY$ $
Non-current assets Property, plant and equipment 125,000 50,000 Investment 60,000 –
185,000 50,000Net current assets 40,000 30,000
225,000 80,000Equity Share capital 100,000 50,000 Retained earnings 125,000 30,000
225,000 80,000
It is the group’s policy to value non-controlling interests at fair value. The fair value of the NCI in CY at the date of acquisition was $28,000.
RequirementPrepare the consolidated statement of fi nancial position for the AX Group at 31 March 20X8.
Question 5 The statements of fi nancial positions as at 30 June 20X4 of A and its subsidiary entity B is summarised below.
A B $ $ $ $
ASSETS Non-current assets Property, plant and equipment 9,000 4,800 Investment in subsidiary 10,000 –
19,000 4,800 Current assets Inventories 12,000 18,000 Trade receivables 25,000 21,000 Current account with B 4,000 – Bank balance 20,000 –
61,000 39,000 80,000 43,800
EQUITY � LIABILITIES Equity Issued capital ($1 each) 40,000 8,000 Retained earnings 24,000 9,800
64,000 17,800 Current liabilities Trade payables 16,000 18,000 Current account with A – 2,000 Bank overdraft – 6,000
16,000 26,000 80,000 43,800

THE
CO
NSO
LIDAT
ED S
TATE
MEN
T O
F FI
NA
NC
IAL
POSI
TIO
N
REVISION QUESTIONS F248
Notes 1. A acquired 6,400 ordinary shares in B many years ago. The balance on B’s retained earn-
ings at the date of acquisition by A was $1,000. Goodwill on consolidation had been written off following an impairment review before the start of the current fi nancial year.
2. On 30 June 20X4 there was cash in transit from B to A of $2,000. 3. It is the group’s policy to value non-controlling interests at its proportionate share of
the fair value of the subsidiary’s identifi able net assets.
Requirement Prepare a consolidated balance sheet for the A group as at 30 June 20X4.
Question 6 The statements of fi nancial positions as at 31 December 20X4 of X and its subsidiary entity Y are summarised below:
X Y $ $ $ $
ASSETS Non-current assets Intangible assets 2,000 Property, plant and equipment 29,000 24,800 Investment in Y 21,000 50,000 26,800 Current assets Inventories 12,000 18,000 Trade receivables 24,750 21,000 Trading account with Y 4,000 Interest receivable from Y 250 Bank balance 20,000 61,000 39,000 111,000 65,800 EQUITY � LIABILITIES Equity Ordinary shares of $1 each 40,000 8,000 Retained earnings 21,000 11,000 61,000 19,000 Non-current liabilities Interest bearing borrowings 30,000 20,000 Current liabilities Trade payables 20,000 18,300 Interest payable 500 Current account with X 2,000 Bank overdraft 6,000 26,800 111,000 65,800
Notes 1. X acquired 6,000 ordinary shares in Y on 1 January 20X1. The price paid was $11,000.
The balance on Y’s retained earnings at the date of acquisition by X was $5,000. This included an intangible asset of $1,000 (see note 4 below). Goodwill on consolida-tion is retained at cost in the group statement of fi nancial position. There has been no
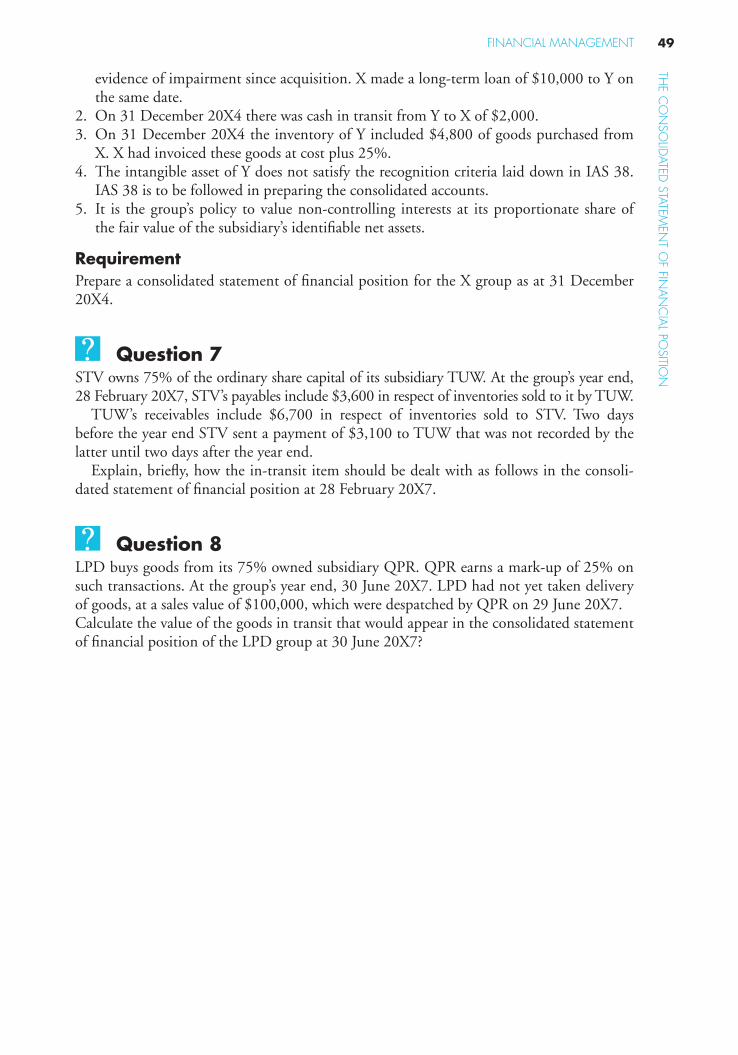
THE C
ON
SOLID
ATED STATEM
ENT O
F FINA
NC
IAL PO
SITION
49FINANCIAL MANAGEMENT
evidence of impairment since acquisition. X made a long-term loan of $10,000 to Y on the same date.
2. On 31 December 20X4 there was cash in transit from Y to X of $2,000. 3. On 31 December 20X4 the inventory of Y included $4,800 of goods purchased from
X. X had invoiced these goods at cost plus 25%. 4. The intangible asset of Y does not satisfy the recognition criteria laid down in IAS 38.
IAS 38 is to be followed in preparing the consolidated accounts. 5. It is the group’s policy to value non-controlling interests at its proportionate share of
the fair value of the subsidiary’s identifi able net assets.
Requirement Prepare a consolidated statement of fi nancial position for the X group as at 31 December 20X4.
Question 7 STV owns 75% of the ordinary share capital of its subsidiary TUW. At the group’s year end, 28 February 20X7, STV’s payables include $3,600 in respect of inventories sold to it by TUW.
TUW’s receivables include $6,700 in respect of inventories sold to STV. Two days before the year end STV sent a payment of $3,100 to TUW that was not recorded by the latter until two days after the year end.
Explain, briefl y, how the in-transit item should be dealt with as follows in the consoli-dated statement of fi nancial position at 28 February 20X7.
Question 8 LPD buys goods from its 75% owned subsidiary QPR. QPR earns a mark-up of 25% on such transactions. At the group’s year end, 30 June 20X7. LPD had not yet taken delivery of goods, at a sales value of $100,000, which were despatched by QPR on 29 June 20X7. Calculate the value of the goods in transit that would appear in the consolidated statement of fi nancial position of the LPD group at 30 June 20X7?

This page intentionally left blank

51
3Solutions to Revision Questions
Solution 1Working 1: Goodwill
$Consideration 50,000Net assets acquired:100% � $45,000 (45,000)Goodwill 5,000
AB Group: consolidated statement of fi nancial position at 31 December 20X4
$ CommentNon-current assets Goodwill 5,000 See working 1 Property, plant and equipment 100,000 70,000 � 30,000Net current assets 45,000 30,000 � 15,000
150,000Equity Share capital 50,000 AB only Retained earnings 100,000 Retained earnings of AB
150,000
Solution 2Working 1: Retained earningsRetained earnings for the group � retained earnings of the parent � post-acquisition retained earnings in the subsidiary:
Retained earnings of the parent 112,000Post-acquisition retained earnings in thesubsidiary (29,000 � 25,000) 4,000
116,000
Tutorial note: goodwill on acquisition is calculated once – upon acquisition.

THE
CO
NSO
LIDAT
ED S
TATE
MEN
T O
F FI
NA
NC
IAL
POSI
TIO
N
SOLUTIONS TO REVISION QUESTIONS F252
AB Group: Consolidated statement of fi nancial position at 31 December 20X5
$ CommentNon-current assets Goodwill 5,000 As in solution 1 Property, plant and equipment 107,000 75,000 � 32,000Net current assets 54,000 37,000 � 17,000
166,000Equity Share capital 50,000 AB only Retained earnings 116,000 See working 1
166,000
Solution 3First, the group structure must be established. AX owns 30,000 of the 50,000 shares of F: a shareholding of 60%. This means that the NCI is 40% (100% � 60%).
Workings1. Non-controlling interests This is 40% of the net assets of CY at 31 March 20X8: 40% � $80,000 � $32,000.
2. Goodwill on consolidation
$ $Consideration 60,000Net assets at date of acquisition: Share capital ($1 shares) 50,000 Retained earnings 25,000
75,000Group share (60%) 45,000Goodwill 15,000
3. Retained earnings$
Retained earnings of AX 125,00060% of post-acquisition retained earnings of CY: 60% �($30,000 � $25,000) 3,000
128,000
AX Group: consolidated statement of fi nancial position at 31 March 20X8$ Comment
Non-current assets Goodwill 15,000 See working 2 Property, plant and equipment 175,000 125,000 � 50,000
190,000Net current assets 70,000 40,000 � 30,000
260,000Equity attributable to owners of the parent Share capital 100,000 AX only Retained earnings 128,000 See working 3
228,000Non-controlling interests 32,000 See working 1
260,000

THE C
ON
SOLID
ATED STATEM
ENT O
F FINA
NC
IAL PO
SITION
53FINANCIAL MANAGEMENT
Solution 4Workings
1. Goodwill on consolidation$
Consideration transferred 60,000NCI at fair value 28,000
88,000
Net assets at acquisition: Share capital (50,000) Retained earnings (25,000)Goodwill on acquisition 13,000
2. Non-controlling interestsNCI at 31 March 20X8 � NCI at date of acquisition � share of post-acquisition profi ts:
At date of acquisition 28,000Post-acquisition profi t share:40% � ($30,000 � $25,000) 2,000At 31 March 20X8 30,000
3. Retained earnings$
Retained earnings of AX 125,000Post acquisition retained earnings:($30,000 � $25,000) � group share 60% 3,000
128,000
$ CommentNon-current assets Goodwill 13,000 See working 1 Property, plant and equipment 175,000 125,000 � 50,000
188,000Net current assets 70,000 40,000 � 30,000
258,000Equity attributable to owners of the parent Share capital 100,000 AX only Retained earnings 128,000 See working 3
228,000Non-controlling interest 30,000 See working 1
258,000

THE
CO
NSO
LIDAT
ED S
TATE
MEN
T O
F FI
NA
NC
IAL
POSI
TIO
N
SOLUTIONS TO REVISION QUESTIONS F254
Solution 5A – consolidated statement of fi nancial position as at 30 . 6 . X4
$ $ ASSETS Non-current assets Goodwill (W3) – Property, plant and equipment 13,800 13,800 Current assets Inventories 30,000 Trade receivables 46,000 Cash in transit 2,000 Bank balance 20,000 98,000 111,800 EQUITY � LIABILITIES Equity Issued capital 40,000 Retained earnings (W4) 28,240 68,240 Non-controlling interests (W2) 3,560
Current liabilities Trade payables 34,000 Bank overdraft 6,000 40,000 111,800
Workings 1. Group structure
A owns 6,400 of B’s 8,000 shares. This represents a holding of 80%. 2. Non-controlling interests
20% � $17,800 � $3,560 3. Goodwill on consolidation (all written off )
$10,000 � 80% ($8,000 � $1,000) � $2,800 4. Consolidated retained earnings
$ Retained earnings of A 24,000 80% of post-acquisition retained earnings of B ($9,800 � $1,000 � $8,800) 7,040 Goodwill written off (W3) (2,800) 28,240

THE C
ON
SOLID
ATED STATEM
ENT O
F FINA
NC
IAL PO
SITION
55FINANCIAL MANAGEMENT
Solution 6 X – consolidated statement of fi nancial position as at 31.12 . X4
$ $ ASSETS Non-current assets Goodwill on consolidation (W5) 2,000 Property, plant and equipment 53,800
55,800 Current assets Inventories (W3) 29,040 Trade receivables 45,750 Cash in transit (W7) 2,000 Bank balance 20,000
96,790 152,590
EQUITY � LIABILITIES Equity Ordinary shares of $1 40,000 Retained earnings (W6) 23,790
63,790 Non-controlling interest (W4) 4,250 Non-current liabilities Interest bearing borrowings (X � Y � 10,000) 40,000
Current liabilities Trade payables 38,300 Interest payable (W8) 250 Bank overdraft 6,000
44,550 152,590
Workings 1. Group structure
X owns 6,000 out of 8,000 Y shares and so owns 75%.
2. Pre-consolidation adjustment Group policy does not recognise the intangible assets that are in Y’s own statement of fi nancial position. This makes the retained earnings of Y at the year end date $9,000 ($11,000 � $2,000) and the retained earnings of Y at the date of acquisition $4,000 ($5,000 – $1,000).
3. Unrealised profi t in inventory Profi t element is 25% of the cost to X, or 25/125 of the selling price charged by X, which is also the cost to Y.
Therefore the unrealised profi t is 25/125 � $4,800 � $960. There is no Non-controlling interest since the profi t is made by the parent. Consolidated inventories are reduced by $960.
4. Non-controlling interests 25% � ($19,000 � $2,000) � $4,250. Remember the accounting policy adjustment!
5. Goodwill Total goodwill is $11,000 � [75% ($8,000 � $4,000)] � $2,000. Pre-acquisition retained earnings are reduced by $1,000 for the intangible asset.

THE
CO
NSO
LIDAT
ED S
TATE
MEN
T O
F FI
NA
NC
IAL
POSI
TIO
N
SOLUTIONS TO REVISION QUESTIONS F256
6. Consolidated retained earnings
$ retained earnings of X 21,000 75% of post-acquisition retained earnings of Y as adjusted ($9,000 � $4,000) 3,750 Unrealised profi t in inventory (W3) (960) 23,790
7. Intra-group balances The intra-group balances (receivables/payables) are cancelled out on consolidation and cash in transit of $2000 represents the difference.
8. Interest payable Half of the interest payable by Y is due to X as X invested $10,000 in the borrowings of Y. This intercompany amount ($250) is eliminated on consolidation.
Solution 7The payment of $3,100 is correctly deducted from STV’s bank but the corresponding payable held by TUW does not yet refl ect it. The cash in transit should be recognised at $3,100 and the intra-company accounts agreed and eliminated in the consolidated accounts (dr payables, cr receivables).
Solution 8The value of the goods in transit should be at the cost to the group, ie less any inrealised profi t. The profi t on $100,000 sales is $20,000 ($100,000 � 25/125) and so the goods in transit should be held at $80,000.

4
The Consolidated Income Statements of Comprehensive Incomeand Changes in Equity

This page intentionally left blank

59
4 LEARNING OUTCOMES After studying this chapter students should be able to:
� prepare a consolidated income statement and a consolidated statement of compre-hensive income;
� prepare a consolidated statement of changes in equity;
� account for intra-group transactions;
� apply the concepts of fair value at the point of acquisition.
4.1 Introduction The previous two chapters introduced some of the basic principles of consolidation accounting and applied them to the preparation of a consolidated statement of fi nancial position. This chapter extends the application of the principles to the preparation of a con-solidated statement of comprehensive income and statement of changes in equity.
Section 4.2 introduces the changes made by IAS 1 (revised) in respect of the income state-ment. Section 4.3 examines the basic principles of preparing the consolidated statements. Section 4.4 looks at the treatment of intra-group fi nance costs arising from investments in preference shares and loans. Section 4.5 covers the elimination of intra-group trading in the consolidated income statement. Section 4.6 revisits the issue of adjusting for fair value and changes in accounting policy, applied to the consolidated statement of comprehensive income.
4.2 IAS 1 (revised) Presentation of financial statements
IAS 1 has been in issue in one form or another for many years. The content of IAS 1 does not form part of the F2 syllabus, and its provisions will not be examined directly in the form of specifi c questions. However, its presentation requirements will affect the way many F2 questions and answers are set out, and to that extent it is pervasive.
The Consolidated Income Statements of Comprehensive Income and Changes in Equity

STUDY MATERIAL F260
THE
CO
NSO
LIDAT
ED IN
CO
ME
STAT
EMEN
TS O
F C
OM
PREH
ENSI
VE IN
CO
ME
AN
D C
HA
NG
ES IN
EQ
UIT
Y IAS 1 was revised in September 2007 and entities are required to apply it for accounting periods beginning on or after 1 January 2009. The requirements of the revised standard will be followed in this study system.
The principal changes in fi nancial statement presentation are briefl y explained below.
Presentation of the income statement and statement of changes in equity (SOCIE).Prior to the issue of the revised IAS 1, entities were required to present an income state-ment that included items of income and expense recognised in profi t or loss. Any other items of income and expenditure, i.e. those not recognised in profi t or loss, were to be presented in the SOCIE, together with owner changes in equity (such as increases in share capital and dividends paid).
IAS 1 (revised) draws a distinction between owner changes in equity and all other items of income and expense (which are known as ‘comprehensive income’). IAS 1 (revised) requires that all non-owner changes in equity should be presented either in:
● A single statement of comprehensive incomeOr● Two statements, one being an income statement and the other a statement of compre-
hensive income.
The SOCIE is to be used exclusively for presenting changes in owner equity.The lower part of the single statement or the statement of comprehensive income are
used to present items of income or expense that IFRS require to be recognised outside profi t or loss such as translation differences relating to foreign operations and gains or losses on available-for-sale investments.
The IASB would have preferred a single statement of comprehensive income, but the Board’s constituents who responded to the exposure draft preceding IAS 1 (revised) mostly preferred the use of two statements.
A pro-forma example showing the headings to be used in a statement of comprehensive income is shown below. This is taken from the illustrative examples in IAS 1 (revised).
Statement of comprehensive income$
Revenue XCost of sales XGross profi t XOther income XDistribution costs XAdministrative expenses XOther expenses XFinance costs XShare of profi t of associates X
Profi t before tax XIncome tax expense X
PROFIT FOR THE YEAR XOther comprehensive income: XExchange differences on translating foreign operationsAvailable-for-sale fi nancial assets XCash fl ow hedges XGains on property revaluation XActuarial gains/(losses) on defi ned benefi t pension plans X
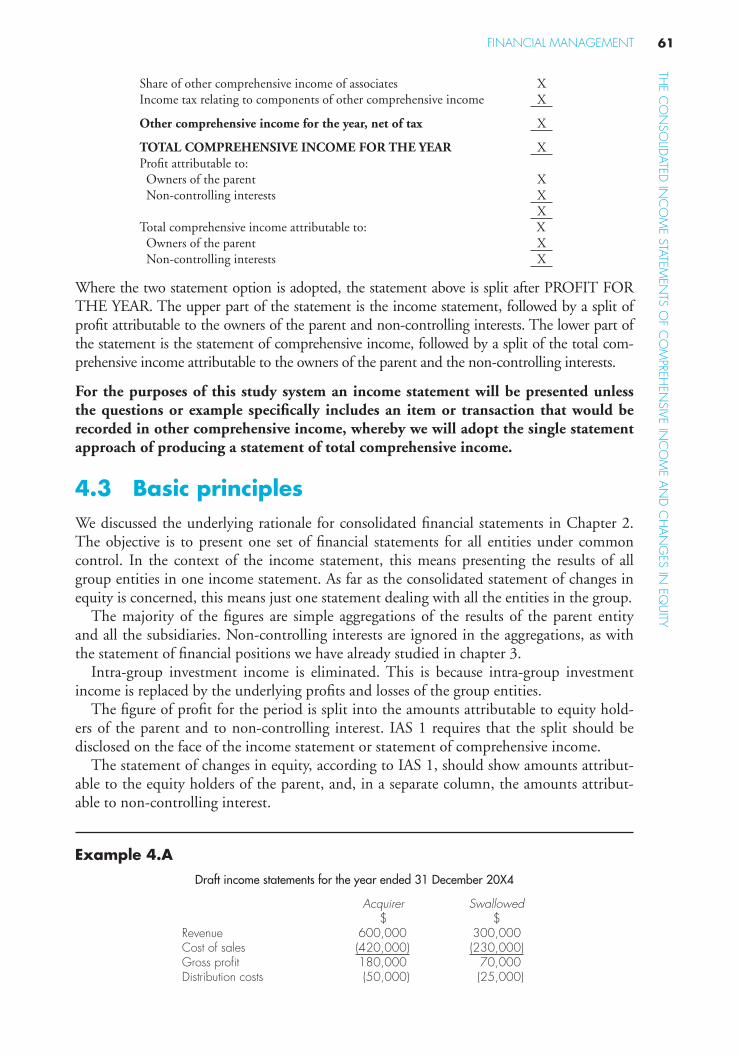
61FINANCIAL MANAGEMENT
THE C
ON
SOLID
ATED IN
CO
ME STATEM
ENTS O
F CO
MPREH
ENSIVE IN
CO
ME A
ND
CH
AN
GES IN
EQU
ITYShare of other comprehensive income of associates XIncome tax relating to components of other comprehensive income X
Other comprehensive income for the year, net of tax X
TOTAL COMPREHENSIVE INCOME FOR THE YEAR XProfi t attributable to: Owners of the parent X Non-controlling interests X
XTotal comprehensive income attributable to: X Owners of the parent X Non-controlling interests X
Where the two statement option is adopted, the statement above is split after PROFIT FOR THE YEAR. The upper part of the statement is the income statement, followed by a split of profi t attributable to the owners of the parent and non-controlling interests. The lower part of the statement is the statement of comprehensive income, followed by a split of the total com-prehensive income attributable to the owners of the parent and the non-controlling interests.
For the purposes of this study system an income statement will be presented unless the questions or example specifi cally includes an item or transaction that would be recorded in other comprehensive income, whereby we will adopt the single statement approach of producing a statement of total comprehensive income.
4.3 Basic principles We discussed the underlying rationale for consolidated fi nancial statements in Chapter 2. The objective is to present one set of fi nancial statements for all entities under common control. In the context of the income statement, this means presenting the results of all group entities in one income statement. As far as the consolidated statement of changes in equity is concerned, this means just one statement dealing with all the entities in the group.
The majority of the fi gures are simple aggregations of the results of the parent entity and all the subsidiaries. Non-controlling interests are ignored in the aggregations, as with the statement of fi nancial positions we have already studied in chapter 3.
Intra-group investment income is eliminated. This is because intra-group investment income is replaced by the underlying profi ts and losses of the group entities.
The fi gure of profi t for the period is split into the amounts attributable to equity hold-ers of the parent and to non-controlling interest. IAS 1 requires that the split should be disclosed on the face of the income statement or statement of comprehensive income.
The statement of changes in equity, according to IAS 1, should show amounts attribut-able to the equity holders of the parent, and, in a separate column, the amounts attribut-able to non-controlling interest.
Example 4.A
Draft income statements for the year ended 31 December 20X4
Acquirer Swallowed$ $
Revenue 600,000 300,000 Cost of sales (420,000) (230,000) Gross profi t 180,000 70,000 Distribution costs (50,000) (25,000)

STUDY MATERIAL F262
THE
CO
NSO
LIDAT
ED IN
CO
ME
STAT
EMEN
TS O
F C
OM
PREH
ENSI
VE IN
CO
ME
AN
D C
HA
NG
ES IN
EQ
UIT
Y Administrative expenses (50,000) (22,000) Profi t from operations 80,000 23,000 Investment income 4,000 – Finance cost (8,000) (3,000) Profi t before tax 76,000 20,000 Income tax expense (30,000) (8,000) Profi t for the year 46,000 12,000
Summarised statements of changes in equity for the year ended 31 December 20X4
Acquirer Swallowed$ $
Balance at start of year 78,000 48,000 Profi t for the year 46,000 12,000Dividends (20,000) (5,000) Balance at end of year 104,000 55,000
Acquirer purchased 16,000 of the 20,000 issued $1 shares in Swallowed on 31 December 20X1 for $33,000. The balance on Swallowed’s equity at that date was $35,000 (issued share capital $20,000 plus retained earnings $15,000). There has been no impairment of goodwill since acquisition.
Prepare a consolidated income statement and a consolidated statement of changes in equity for the Acquirer group for the year ended 31 December 20X4.
Solution
Before we prepare the income statement itself we should note that:
● Acquirer owns 16,000 of Swallowed’s 20,000 issued $1 shares so this makes Swallowed an 80% subsidiary.
Consolidated income statement
$ Comments Revenue 900,000 A � S Cost of sales (650,000) A � S Gross profi t 250,000 Distribution costs (75,000) A � S Administrative expenses (72,000) A � S Profi t from operations 103,000 Finance cost (11,000) A � S: investment income
eliminated as inter-group Profi t before tax 92,000 Income tax expense (38,000) A � S Profi t for the period 54,000
Attributable to: $ Equity holders of the parent 51,600 Non-controlling interest (20% � profi t of S only) 2,400
54,000
Consolidated statement of changes in equity
Attributable to equity holders of the parent
Non-controllinginterestt Total equity
$ $ $ Balance at start of year (W1) 88,400 9,600 98,000 Profi t for the period 51,600 2,400 54,000 Dividends (W2) (20,000) (1,000) (21,000) Balance at end of year 120,000 11,000 131,000

63FINANCIAL MANAGEMENT
THE C
ON
SOLID
ATED IN
CO
ME STATEM
ENTS O
F CO
MPREH
ENSIVE IN
CO
ME A
ND
CH
AN
GES IN
EQU
ITY Workings 1. Balance at the start of the year
Attributable to equity holders of the parent:
$Acquirer 78,000 Swallowed (80% � [$48,000 � $35,000]) 10,400
88,400
The balance attributable to the non-controlling interest is 20% of Swallowed’s brought forward balance: $48,000 � 20% � $9,600
2. Dividends The amount paid to the minority was $5,000 � 20% � $1,000 Note that the non-controlling interest carried forward represents 20% of the equity in Swallowed: $55,000 � 20% � $11,000.
The disclosure requirements in IAS 1 require that the amounts attributable to equity holders of the parent are broken down into share capital and the different categories of reserves. However, this question does not provide suffi cient information for full disclosure.
4.4 Investments in preference shares and loans Investment by the parent in loans to its subsidiary means that there will be an intra-group fi nance cost as well as intra-group dividends. These will cancel out in the same way. The only difference is that loan interest receivable from a subsidiary will cancel out against the fi nance cost of that subsidiary rather than against dividends. The same principle is fol-lowed in respect of preference shares. Preference shares, as noted in Chapter 3, will almost always be classfi ed as liabilities, rather than equity, and so preference dividends constitute part of the fi nance cost.
Note to illustrate the format of the statement of comprehensive income, the following example includes other comprehensive income in the period, being a
revaluation gain. The format followed, therefore is that of the single statement of com-prehensive income.
Example 4.B
Statements of comprehensive income for the year ended 31 December 20X5
A B$ $
Profi t from operations 100,000 30,000 Investment income 6,000 – Finance cost (11,000) (7,000) Profi t before tax 95,000 23,000 Income tax expenses (38,000) (10,000) Profi t for the period 57,000 13,000 Other comprehensive income: Gain on revaluation of property (net of tax)
5,000 2,000
Total comprehensive income
62,000 15,000

STUDY MATERIAL F264
THE
CO
NSO
LIDAT
ED IN
CO
ME
STAT
EMEN
TS O
F C
OM
PREH
ENSI
VE IN
CO
ME
AN
D C
HA
NG
ES IN
EQ
UIT
Y Summarised statements of changes in equity for the year ended 31 December 20X5
A B$ $
Balance at start of period 152,000 65,000Total comprehensive income for the period period
62,000 15 ,000
Dividends – ordinary shares (10,000) (5,000) Balance at end of period 204 ,000 75 ,000
Additional information A made its investments in B on 1 January 20X3 when the statement of fi nancial position of B showed the following:
$ Ordinary share capital – $1 shares 25,000 Preference share capital – $1 shares 20,000Reserves 12,000
57,000
The cost of investing in the shares of B was:
● $27,700 for 15,000 ordinary shares; ● $5,200 for 5,000 preference shares.
On 1 January 20X3 A provided 50% of B’s loans. The fi nance cost of $7,000 in B relates both to the prefer-ence share dividend (2,000) and loan interest (5,000).
Solution
The fi rst step is to establish the group structure and reconcile the investment income that is included in A’s income statement. You may ask: Why bother with the reconciliation if we’re going to eliminate A’s investment income anyway? There are two reasons:
● We only eliminate intra-group investment income. Entity A may have some income from trade investments. ● When the investment income is partly interest and partly dividends then the elimination has different consequences.
The table below shows the position regarding A’s three-part investment in B.
Investment type A’s share Total fi nance
cost/dividend A’s share of total $ $
Loans 50% 5,000 2,500 Preference shares 25% 2,000 500 Ordinary shares 60% 5,000 3,000
6,000
You can see that in this case all of the investment income is intra-group and so should be eliminated.
Consolidated statement of comprehensive income
$ Comments Profi t from operations 130,000 A � B Finance cost (15,000) A � B 2 inter-group fi nance cost of $2,500 � $500 Profi t before tax 115,000Tax (48,000) A � B Profi t for the period 67,000 Other comprehensive income :
Gain on revoluation of property (net of tax) 7,000
Total comprehensive income (TCI) 74,000

65FINANCIAL MANAGEMENT
THE C
ON
SOLID
ATED IN
CO
ME STATEM
ENTS O
F CO
MPREH
ENSIVE IN
CO
ME A
ND
CH
AN
GES IN
EQU
ITY Profi t attributable to: $ Owners of the parent 61,800 Non-controlling interest 5,200 See working 1
67,000
TCI attributable to: $ Owners of the parent 68,000Non-controlling interest 6,000 See working 1
74,000
Consolidated statement of changes in equity
Attributable to equity holders of the parent
Non-controllinginterestt Total equity
$ $ $Balance at the start of the year (W2) 156,800 18,000 174,800 Total comprehensive income for the period
68,000 6,000 74,000
Dividends (W3) (10,000) (2,000) (12,000) Balance at the end of the year 214,800 22,000 236,800
Workings 1. Non-controlling interest in consolidated statement of comprehensive income In profi t for the period $13,000 � 40% � $5,200 In total comprehensive income for the period � $5,200 � (40% � $2,000) � $6,000
The owners share of TCI is the balance $74,000 � $6,000 � $68,000 and represents their share of the profi t of $61,800 � A’s revaluation gain $5,000 � 60% of B’s gain $1,200
2. Balance of equity at the start of the period Attributable to equity shareholders of the parent:
$A 152,000 B [60% � ($65,000 � $57,000)] 4,800
156,800
Attributable to NCI:
$ Share of balance of equity [40% � ($65,000 � $20,000)] 18,000
3. Dividends paid to the NCI:
Ordinary shares ($5,000 � 40%) 2,000
The closing balance in respect of the NCI in the statement of changes in equity can be proved as follows:
Share of balance of equity (40% � [75,000 � 20,000 preference shares]) 22,000
4.5 Intra-group trading There is no need to worry about cancellation of intra-group balances for the consolidated income statement. This is clearly a statement of fi nancial position issue. Intra-group trad-ing will be of relevance in the consolidated income statement to the extent that one group

STUDY MATERIAL F266
THE
CO
NSO
LIDAT
ED IN
CO
ME
STAT
EMEN
TS O
F C
OM
PREH
ENSI
VE IN
CO
ME
AN
D C
HA
NG
ES IN
EQ
UIT
Y entity provides goods or services for another group entity. In these circumstances there are clearly income and costs that are wholly intra-group.
Intra-group revenue must be eliminated in full from revenue. This is the case whatever has subsequently happened to any goods that are sold by one group entity to another. Unless there is unrealised profi t on unsold inventory (see below) then the adjustment to costs is the same as the adjustment to revenue.
We have already seen from our studies of the consolidated statement of fi nancial posi-tion (see Chapter 3) that unrealised profi t on intra-group revenue must be eliminated from closing inventory and profi t. Unrealised profi t on intra-group revenue is deducted from gross profi t. The adjustment to cost of sales is the difference between the adjustment to revenue and the adjustment to gross profi t.
Where there is unrealised profi t brought forward then this amount will have been charged against the consolidated reserves of previous years. Therefore the charge to gross profi t for the year is the movement on the provision for unrealised profi t.
Where the unrealised profi t is made by a subsidiary in which there is a non-controlling interest then a share of the charge to the consolidated income statement is made against the non-controlling interest.
Example 4.C
Income statements of PQR and its subsidiary XYZ for the year ended 31 December 20X1
PQR XYZ$’000 $’000
Revenue 125,000 50,000 Cost of sales (50,000) (20,000) Gross profi t 75,000 30,000 Distribution costs (10,000) (4,000) Administrative expenses (8,000) (3,200) Profi t from operations 57,000 22,800 Investment income 3,180 – Finance cost (24,500) (7,750) Profi t before taxation 35,680 15,050 Income tax (14,000) (7,000) Profi t for the period 21,680 8,050
Summarised statements of changes in equity for PQR and XYZ
PQR XYZ$’000 $’000
Balance at 1 January 20X1 76,700 50,300 Profi t for the period 21,680 8,050 Ordinary dividends (8,000) (2,100) Balance at 31 December 20X1 90,380 56,250
Other information 1. Included in the revenue of XYZ is $5 million in respect of sales to PQR. XYZ earns a profi t of 25% on cost.
These are sales of components that XYZ has been supplying to PQR on a regular basis for a number of years. The amount included in the inventory of PQR in respect of goods purchased from XYZ at the beginning and end of the year was as follows:
Date Inventory of components in PQR’s books $’000
31.12.X1 80031.12.X0 600

67FINANCIAL MANAGEMENT
THE C
ON
SOLID
ATED IN
CO
ME STATEM
ENTS O
F CO
MPREH
ENSIVE IN
CO
ME A
ND
CH
AN
GES IN
EQU
ITY 2. At the date of PQR’s investment in XYZ the statement of fi nancial position of XYZ showed:
$’000 Ordinary share capital (1$ shares) 25,000 Reserves 22,500
47,500
PQR bought 20 million ordinary shares in XYZ at a cost of $27 million. On the same date PQR purchased 25% of the loan stock of XYZ.
XYZ’s fi nance cost for the year ended 31 December 20X1 comprised the following:
$’000 Loan stock interest 6,000 Interest payable on short-term borrowings 1,750
7,750
Solution
1. PQR owns 80% of the ordinary shares of XYZ and 25% of the loans. The intra-group investment income that PQR credits in its own income statement is: ● Loan stock interest $1,500,000 (25% � $6,000,000) ● Dividends $1,680,000 (80% � $2,100,000) ● Total � $3,180,000
2. Intra-group sales of $5 million will be eliminated from revenue and cost of sales: DR Group revenue $5,000,000 CR Group cost of sales $5,000,000 There is unrealised profi t on both opening and closing inventory: ● Unrealised profi t on closing inventory � $160,000 (25/125 � $800,000) ● Unrealised profi t on opening inventory � $120,000 (25/125 � $600,000) So the movement on unrealised profi t and the deduction from gross profi t for the year is $40,000. ● DR Group cost of sales $40,000 ● CR Provision for unrealised profi t $40,000
Consolidated income statement of the PQR Group for the year ended 31 December 20X1
$’000 Comments Revenue 170,000 PQR � XYZ � $5 million Cost of sales (65,040) PQR � XYZ � $5 million � $40,000 Gross profi t 104,960 Distribution costs (14,000) PQR � XYZ Administrative expenses (11,200) PQR � XYZ Finance costs (30,750) PQR � XYZ � ($6 million � 75%) Profi t before tax 49,010 Income tax (21,000) PQR � XYZ Profi t for the period 28,010
Attributable to: Equity holders of parent 26,408
(working 1)
Non-controlling interest 1,602 28,010
Consolidated statement of changes in equity of the PQR Group for the year ended 31 December 20X1
Attributable to equity
holders of parent Non-controlling
interest Total $’000 $’000 $’000
Balance at start of period (working 2) 78,844 10,036 88,880 Profi t for the period 26,408 1,602 28,010 Dividends (working 3) (8,000) (420) (8,420) Balance at end of period 97,252 11,218 108,470

STUDY MATERIAL F268
THE
CO
NSO
LIDAT
ED IN
CO
ME
STAT
EMEN
TS O
F C
OM
PREH
ENSI
VE IN
CO
ME
AN
D C
HA
NG
ES IN
EQ
UIT
Y Working 1 Profi t attributable to non-controlling interest in income statement:
$’000 Profi t for the period per XYZ income statement 8,050 Less: increase in provision for unrealised profi t (40)
8,010 Non-controlling interest (20%) 1,602
Working 2 Balance at start of period: attributable to equity holders of parent:
$’000 In PQR’s own statement of changes in equity 76,700 Share of XYZ’s post-acquisition earnings (50,300 � 47,500 � 120) � 80% 2,144 78, 844
Balance at start of period: attributable to non-controlling interest
$’000 (50,300 � 120) � 20% 10, 036
Working 3 Dividends paid to non-controlling interest: ($2,100 � 20%) � 420
4.6 Adjustments for fair value or to reflect changes in accounting policy
We saw when we studied these aspects in the preparation of the consolidated statement of fi nancial position that the consolidation technique to apply was essentially the same.
The effects of the adjustments will frequently impact on the profi t for the year. This may be because, for example, the group charge for depreciation needs to be increased due to the fair value of the non-current assets of an acquired subsidiary being larger than the carrying value on acquisition.
As we saw in Chapter 3 such adjustments affect the retained earnings of the subsidiary for consolidation purposes, both at the date of acquisition and at the statement of fi nancial position date. Therefore we will need to allow for the effect of these adjustments when computing goodwill on consolidation and opening consolidated equity.
Example 4.D
Income statements of A and its subsidiaries B and C for the year ended 31 December 20X8
A B C$’000 $’000 $’000
Revenue 56,000) 52,000) 44,000 Cost of sales (30,000) (28,000) (24,000) Gross profi t 26,000) 24,000) 20,000 Other operating expenses (13,000) (12,000) (10,000) Investment income 4,000 Finance cost (3,000) (2,000) (1,800) Profi t before tax 14,000 10,000) 8,200 Tax (5,000) (3,000) (2,500) Profi t for the period 9,000 7,000 5,700

69FINANCIAL MANAGEMENT
THE C
ON
SOLID
ATED IN
CO
ME STATEM
ENTS O
F CO
MPREH
ENSIVE IN
CO
ME A
ND
CH
AN
GES IN
EQU
ITY Notes A acquired 80% of the ordinary shares of B on 1 January 20X5 and 75% of the ordinary share capital of C on 1 January 20X6. Details of the cost of the investments and the net assets at the date of acquisition as shown in the statement of fi nancial positions of B and C are given below.
B C$’000 $’000
Cost of investment 36,000 25,500 Net assets at the date of acquisition
Share capital 20,000 15,000 Share premium 10,000 6,000 Retained earnings 8,000 6,000
38,000 27,000
At the dates of acquisition of B and C the fair values of the non-current assets of the companies were $4 mil-lion and $3 million respectively in excess of their carrying values in their fi nancial statements. The non-current assets had an estimated future useful economic life of 5 years. The non-current assets are fully depreciable and the depreciation is charged to cost of sales. None of these non-current assets had been sold by 31 December 20X8. Goodwill on both acquisitions has remained unimpaired. B and C paid a dividend to ordinary sharehold-ers of $3 million and $2 million respectively in the year to 31 December 20X8.
Prepare the consolidated income statement of the A group for the year ended 31 December 20X8.
Solution
The question gives us the group structure. The key issue we need to resolve prior to actually preparing the consoli-dated income statement is the calculation of the fair value adjustments. The fair-value adjustments will affect good-will and depreciation. Since the non-current assets that caused the fair-value adjustment have a useful economic life of 5 years the total additional depreciation is $1,400,000, that is, ($4,000,000 � $3,000,000)/5.
The intra-group investment income that is eliminated is:
● $2,400,000 from B (80% � $3 million); ● $1,500,000 from C (75% � $2 million);
This means that $100,000 remains. We now proceed to the consolidated income statement.
$’000 Comments Revenue 152,000 A � B � C Cost of sales (83,400) A � B � C � $800,000 � $600,000 (extra dep’n) Gross profi t 68,600 Other operating expenses (35,000) A � B � C Investment income 100 A’s income from trade investments Finance cost (6,800) A � B � C Profi t before tax 26,900Tax (10,500) A � B � C
Profi t for the period 16,400
Attributable to: $’000 Equity holders of the parent 13,885
Non-controlling interest 2,515 (See working) 16,400
Working: Non-controlling interest
● B � 20% � ($7,000,000 � $800,000) � $1,240,000. ● C � 25% � ($5,700,000 � $600,000) � $1,275,000. Total $2,515,000.

STUDY MATERIAL F270
THE
CO
NSO
LIDAT
ED IN
CO
ME
STAT
EMEN
TS O
F C
OM
PREH
ENSI
VE IN
CO
ME
AN
D C
HA
NG
ES IN
EQ
UIT
Y 4.7 Summary This chapter has explained various aspects involved in preparing a consolidated statement of comprehensive income, the consolidated income statement and a statement of changes in equity. Students will have noted that the treatment of these items is consistent with their treatment in the consolidated statement of fi nancial position.
This examination may contain long questions (25 or 50 marks) that require the prepara-tion of a consolidated income statement/statement of comprehensive income and possibly a consolidated statement of changes in equity only. It is likely that such questions would contain additional complications that we will be covering in later chapters, such as acquisi-tions or disposals part-way through the year, and the inclusion of interests in joint ventures or associates. The long questions at the end of this chapter are, therefore, not fully repre-sentative of the range of issues that would arise in a practical consolidation questions. They are included here because they are useful for practice. The examination standard questions are contained in the section called preparing for the examination.
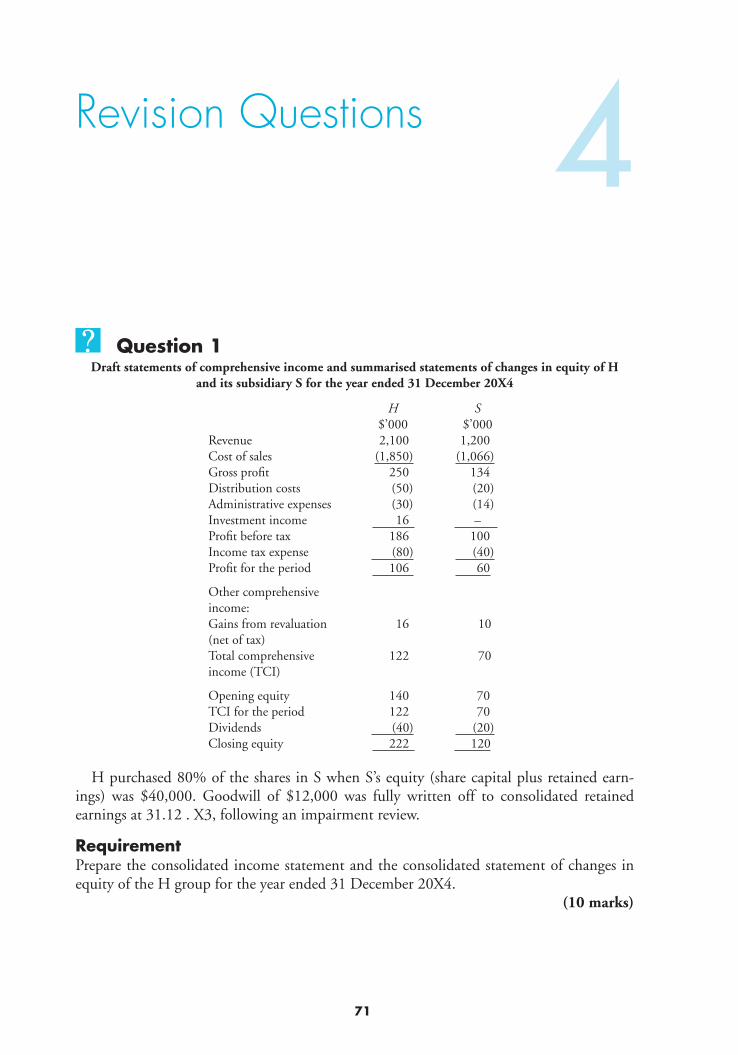
71
Revision Questions 4 Question 1
Draft statements of comprehensive income and summarised statements of changes in equity of H and its subsidiary S for the year ended 31 December 20X4
H S $’000 $’000
Revenue 2,100 1,200 Cost of sales (1,850) (1,066) Gross profi t 250 134 Distribution costs (50) (20) Administrative expenses (30) (14) Investment income 16 – Profi t before tax 186 100 Income tax expense (80) (40) Profi t for the period 106 60
Other comprehensive income:Gains from revaluation (net of tax)
16 10
Total comprehensive income (TCI)
122 70
Opening equity 140 70 TCI for the period 122 70 Dividends (40) (20) Closing equity 222 120
H purchased 80% of the shares in S when S’s equity (share capital plus retained earn-ings) was $40,000. Goodwill of $12,000 was fully written off to consolidated retained earnings at 31.12 . X3, following an impairment review.
Requirement Prepare the consolidated income statement and the consolidated statement of changes in equity of the H group for the year ended 31 December 20X4.
(10 marks)

THE
CO
NSO
LIDAT
ED IN
CO
ME
STAT
EMEN
TS O
F C
OM
PREH
ENSI
VE IN
CO
ME
AN
D C
HA
NG
ES IN
EQ
UIT
Y
REVISION QUESTIONS F272
Question 2 Draft income statements and summarised statements of changes in equity of Hope
and its subsidiary Despair for the year ended 30 June 20X7
Hope Despair $ $
Revenue 159,800 108,400 Cost of sales (79,200) (61,600) Gross profi t 80,600 46,800 Administrative expenses (27,000) (16,000) Investment income: Ordinary dividend 9,000 – Loan interest 1,000 1,500 Finance cost (6,000) (4,000) Profi t before tax 57,600 28,300 Income tax expense (29,400) (14,800) Profi t for the period 28,200 13,500
Opening equity 133,400 53,600 Profi t for the period 28,200 13,500 Ordinary dividends (15,000) (10,000) Closing equity 146,600 57,100
Other information 1. Hope acquired its interest in Despair as follows:
9,000 of the 10,000 $1 ordinary shares on 30 June 20X3 when the equity of Despair was $35,000 (ordinary shares $10,000 plus retained earnings $25,000).
2. Hope has not provided Despair with any of its loan capital. 3. The revenue of Hope includes $19,000 in respect of goods sold to Despair at a price
that yielded a profi t of 20% on selling price. $8,000 of these goods were in the inven-tory of Despair at 30 June 20X7. Inventories of such goods at 30 June 20X6 amounted to $6,000.
Requirements ( a) Explain how the investment in Despair should be accounted for the group accounts.
(3 marks) ( b) Produce the consolidated income statement and statement of changes in equity.
(17 marks) (c) Explain the treatment of the intra-group sales between Hope and Despair.
(5 marks)(Total � 25 marks)
Question 3 (a) On 1 September 20X6, BLT held 60% of the ordinary share capital of its only sub-sidiary CMU. The consolidated equity of the group at that date was $576,600, of which $127,000 was attributable to the non-controlling interest.
On 28 February 20X7, exactly halfway through the fi nancial year, BLT bought a further 20% of the ordinary share capital of CMU. In the year ended 31 August 20X7 BLT’s prof-its for the period were $98,970 and CMU’s were $30,000. BLT paid a divided of $40,000

THE C
ON
SOLID
ATED IN
CO
ME STATEM
ENTS O
F CO
MPREH
ENSIVE IN
CO
ME A
ND
CH
AN
GES IN
EQU
ITY
73FINANCIAL MANAGEMENT
on 1 July 20X7. There were no other movements in equity. It can be assumed that profi ts accrue evenly throughout the year.
Prepare a consolidated statement of changes in equity for the BLT group for the year ended 31 August 20X7. (6 marks)
(b) GPT regularly sells goods to its subsidiary in which it owns 60% of the ordinary share capital. During the group’s fi nancial year ended 31 August 20X7. GPT sold goods to its subsidiary valued at $100,000 (selling price) upon which it makes a margin of 20%. By the group’s year end 70% of the goods had been sold to parties outside the group. Explain, with calculations, the adjustments required to correctly deal with the intra-group trading.
(4 marks)(Total � 10 marks)

This page intentionally left blank

75
Solutions to Revision Questions 4 Solution 1 (a) Consolidated statement of comprehensive income
$’000 Revenue (H � S) 3,300 Cost of sales (H � S) (2,916) Gross profi t 384 Distribution costs (H � S) (70) Administrative expenses (H � S) (44) Income tax expense (120) Profi t for the period 150
Profi t attributable to: $’000 Equity holders of the parent 138 Non-controlling interest (20% � $60) 12
150
TCI attributable to: $’000 Equity holders of the parent 162 Non-controlling interest (20% � $60) 14 � (20% � $10) 176
Consolidated statement of changes inpp equity
Attributable to equity holders of the parent NCI
Total equity
$’000 $’000 $’000 Balance at the start of the year (W1) 152 14 166 TCI for the period 162 14 176 Dividends (W2) (40) (4) (44) Balance at the end of the year 274 24 298
Workings 1. Balance at the start of the year
Attributable to equity holders of the parent:
$’000 H 140 S (80% � [70 � 40]) 24 Less : goodwill impairment (12)
152

THE
CO
NSO
LIDAT
ED IN
CO
ME
STAT
EMEN
TS O
F C
OM
PREH
ENSI
VE IN
CO
ME
AN
D C
HA
NG
ES IN
EQ
UIT
Y
SOLUTIONS TO REVISION QUESTIONS F276
The balance attributable to the non-controlling interest is 20% of the brought forward balance of S (i.e., $70,000 � 20%) � $14,000
2. Dividends The amount paid to the NCI was $20,000 � 20% � $4,000
Solution 2
(a) Hope owns 90% of the equity share capital of Despair and therefore is presumed to have control over the operating and fi nancial policies of the entity. Under IAS 27, Despair should be accounted for as a subsidiary of Hope and should be fully con-solidated. 100% of the assets and liabilities of Despair should be included and the 10% interest held outwith the group should be included separately in both the income statement and the statement of fi nancial position as “non-controlling interests”.
(b) Hope Group: Consolidated income statement for the year ended 30 June 20X7
$ Revenue (H � D � $19,000 [W1]) 249,200 Costs of sales (balancing fi gure) (122,200) Gross profi t (H � D � $400 [W1]) 127,000 Administrative expenses (H � D) (43,000) Investment income (external only) W2 2,500 Finance cost (H � D) (10,000) Profi t before taxation 76,500 Income tax expense (H � D) (44,200) Profi t for the period 32,300
Attributable to: Equity holders of parent 30,950 Non-controlling interest (W3) 1,350 32,300
Hope Group: Consolidated statement of changes in equity for the year ended 30 June 20X7
Attributable to equity holders of the parent
Non-controlling interest Total equity
$ $ $ Balance at the start of the year (W4) 148,940 5,360 154,300 Profi t for the period 30,950 1,350 32,300 Dividends (W5) (15,000) (1,000) (16,000) Balance at the end of the year 164,890 5,710 170,600
Workings 1. Intra-group sales of $19 million are adjusted in the consolidated income statement. The
adjustment at gross profi t level is the movement in the provision for unrealised profi t: ● Unrealised profi t on closing inventory is 20% � $8,000 � $1,600 ● Unrealised profi t on opening inventory is 20% � $6,000 � $1,200
So, the movement is $1,600 � $1,200 � $400. 2. The cancellation of investment income is of the intra-group element only (the dividend
received by Hope from Despair). The interest income of both entities is not intra-group and so it remains in the consolidated income statement: $1,000 � $1,500 � $2,500.
3. Profi t for the period of Despair � 10% � $13,500 � 10% � $1,350

THE C
ON
SOLID
ATED IN
CO
ME STATEM
ENTS O
F CO
MPREH
ENSIVE IN
CO
ME A
ND
CH
AN
GES IN
EQU
ITY
77FINANCIAL MANAGEMENT
4. The opening equity attributable to the equity shareholders of the parent is:
$ Hope 133,400 Despair (90% � $53,600 � $35,000) 16,740 Opening PUP on inventory (W1) (1,200)
148,940
The opening equity attributable to the non-controlling interest is: 10% � $53,600 5,360
5. Dividends paid to the NCI: $10,000 � 10% � $1,000.
( c) The correct treatment of the intra-group sale is to eliminate it in full from revenue in the consolidated income statement. Where the goods have not been sold on outside the group at the year-end then it is necessary to eliminate any profi t made on those goods by the supplying entity (Hope in this case). Where the profi t elimination is required at the beginning and end of the year then a net adjustment is required in the consolidated income statement, since the opening provision for unrealised profi t will be reversed in the year, assuming that the goods are sold on outside the group. The charge is shared between the group and the non-controlling interest depending on the group interest in the entity making the unrealised profi t. In this case the unrealised profi t is made by the parent, so no adjustment is required against the non-controlling interest .
Solution 3 ( a) BLT Group: Statement of changes in equity for the year ended 31 August 20X7
Attributable to equity holders of parent
Non-controlling interest Total
$ $ $ Brought forward 449,600 127,000 576,600 Profi t for the period (W1) 119,970 9,000 128,970 Transfer in respect of shares purchased by BLT 66,500 (66,500) Dividend (40,000) (40,000) Carried forward 596,070 69,500 665,570
W1 Profi t shares
NCI share of profi t $30,000 � 6/12 � 40% 6,000 $30,000 � 6/12 � 20% 3,000
9,000
Group share
$98,970 � ($30,000 � 9,000) � $119,970
W2 Transfer in respect of share purchase
Value of non-controlling interest at date of transfer: $127,000 � 6,000 � $133,000 50% of shareholding transferred: $133,000/2 � $66,500

THE
CO
NSO
LIDAT
ED IN
CO
ME
STAT
EMEN
TS O
F C
OM
PREH
ENSI
VE IN
CO
ME
AN
D C
HA
NG
ES IN
EQ
UIT
Y
SOLUTIONS TO REVISION QUESTIONS F278
(b) The full value of the intra-group sales must be eliminated from the group accounts. $100,000 will be deducted from both revenue and cost of sales in the consolidated income statement. The unrealised profi t of $6,000 (30% � profi t ($100,000 �20%)) will be deducted from inventories and charged to cost of sales. (note the goods fl ow from the parent to the subsidiary and do as the parent has earned the unrealised profi ts, the NCI of Despair is not affected).

5
Associates and Joint Ventures

This page intentionally left blank

81
5 LEARNING OUTCOMES After studying this chapter students should be able to:
� explain the conditions required to be an associate of another entity and the accounting treatment for associates;
� explain the conditions required to account for an operation as a joint venture, thedifferent forms the venture can take, and how they should be accounted for;
� prepare consolidated fi nancial statements including an associate;
� prepare consolidated fi nancial statements including a joint venture.
5.1 Introduction In Chapter 2 we discussed how cost information about investments and investment income is sometimes insuffi cient to give the investors appropriate information does not just hold good in situations where the investor has control. Where the investor has a degree of infl u-ence over the operations of the investment, but not outright control, then there is an argu-ment for saying that the ‘ normal ’ method of accounting for investments is inappropriate.
In this chapter we consider the effect on an investor’s fi nancial position and performance of its interest in two specifi c kinds of investments – associates and joint ventures. In both cases, the investor can exercise a degree of infl uence over the affairs of the investment but cannot direct its operating and fi nancial policies (as is the case with subsidiaries). In these circumstances one of the two alternative forms of accounting may well be appropriate in the consolidated fi nancial statements of the investor. These two forms are equity accounting and proportionate consolidation .
Section 5.2 looks at accounting for associates and the detailed application of equity accounting. Section 5.3 examines accounting for joint ventures, fi rstly looking at the types of ventures and how they are accounted for. Proportionate consolidation will be applied in this section. Section 5.4 uses a detailed worked example to illustrate the different impact on fi nancial statements of the three types of accounting for investments we have learned about so far; full consolidation, proportionate consolidation and equity accounting.
Associates and Joint Ventures

STUDY MATERIAL F282
ASS
OC
IATE
S A
ND
JOIN
T VE
NTU
RES 5.2 IAS 28 Accounting for associates
The IAS 28 defi nes an associate as:
An entity, including an unincorporated entity such as a partnership, over which the investor has signifi cant infl uence and that is neither a subsidiary nor
an interest in a joint venture.
The key concept in the defi nition is ‘signifi cant infl uence’. IAS 28 says that signifi cant infl uence is the power to participate in the fi nancial and operating policy decisions of the entity but is not control over those policies. The existence of signifi cant infl uence by an investor is usually evidenced in one or more of the following ways:
● representation on the board of directors,● participation in policy-making processes,● material transactions between the investor and the entity,● interchange of managerial personnel,● provision of essential technical information.
If an investor holds, directly or indirectly, 20% of the voting rights of an entity, IAS 28 states that there is a presumption that the investor has signifi cant infl uence over the entity, unless it can be clearly demonstrated that this is not the case.
5.2.1 Equity accountingIAS 28 requires that associates are accounted for using equity accounting. This is not a method of consolidation, the assets and liabilities of the associate are not aggregated on a line-by-line basis in the group accounts. Instead, only selected items are included in the consolidated fi nancial statement:
The consolidated statement of comprehensive income:
● The investor will include its share of the results of the associate for the period in its consolidated statement of comprehensive income (or income statement depending on how the statements have been prepared).
● The share of results is based on the associate’s profi t after tax, but is included in the con-solidated profi t before tax in the group accounts.
● The investor will also include its share of any other comprehensive income of the associ-ate in the ‘Income from associate, net of tax’ section of the income statement.
The consolidated statement of fi nancial position:
● The investor will include one fi gure within non-current assets in the consolidated state-ment of fi nancial position, entitled Investment in associate. The balance to be included under this heading is calculated as follows:
Investment at cost; plusShare of profi ts or losses since acquisition; plusShare of any other changes to shareholders’ funds e.g. other comprehensive income (maybe from revaluation of non-current assets); lessImpairment of goodwill; lessDividends received.

83FINANCIAL MANAGEMENT
ASSO
CIATES A
ND
JOIN
T VENTU
RESThis calculation makes sense if we think about the value of the investment to the investor;
the investment increases in value as profi ts are generated and as other gains are recognised, but reduces in value if impairment is required. Dividends received from an associate reduce the value of the associate by the amount of the distribution but this is balanced by an increase to cash in the books of the investor.
Goodwill on acquisitionNote that the starting point for this calculation is cost of investment. This means the value of any goodwill on acquisition is already included. Goodwill is part of the value of invest-ment. It may have to be calculated if any impairment is to be recorded; however, it will not appear under the heading of goodwill in the group statement of fi nancial position. The impairment will simply be deducted from the value of the investment.
Example 5.A
On 1 May 20X6 AB purchased 40% of the share capital of GH for $375,000. The retained earnings of GH at that date were $400,000.
The consolidated fi nancial statements of AB are presented below together with the accounts of GH for the year to 31 May 20X8.
Income statements for the year ended 31 May 20X8
AB GH
$000 $000Profi t from operations 1,270 290Interest paid (130) (40) Profi t before tax 1,140 250Income tax (140) (50) Profi t for the period 1,000 200
Statements of fi nancial position as at 31 May 20X8
AB GH
$000 $000AssetsNon-current assetsInvestment in GH 375Other assets 2,100 900
2,475 900Capital and liabilitiesShare capital 500 250Retained earnings 1,875 550
2,375 800Liabilities 100 100
2,475 900Additional information:1. GH paid a dividend of $100,000 in the year. AB has incorporated its share of this dividend in profi t from
operations.2. Goodwill is impaired by 20% in the year. No impairment was considered necessary in previous years.
RequirementPrepare the consolidated statement of fi nancial position and consolidated income statement for the AB group for the year ended 31 May 20X8.

STUDY MATERIAL F284
ASS
OC
IATE
S A
ND
JOIN
T VE
NTU
RES Solution
Consolidated Income statement for the year ended 31 May 20X8
AB
$000Profi t from operations ($1,270 � W1 $23 �W2 $40)
1,207
Interest paid (130)1,077
Share of profi t of associate (W3) 80Profi t before tax 1,157Income tax (140)Profi t for the period 1,017
Consolidated statement of fi nancial position as at 31 May 20X8
AB
$000AssetsNon-current assetsInvestment in associate (W4) 372Other assets 2,100
2,472Capital and liabilitiesShare capital 500Retained earnings (W5) 1,872
$2,372Liabilities 100
2,472
WorkingsW1 Impairment of goodwill – the impairment is given as a percentage so we will have to calculate goodwill to determine the impairment.
Goodwill on acquisition:
Consideration paid $375Net assets acquired:Share capital $250Retained earnings at acquisition $40040% acquired 260Goodwill on acquisition 115
Impairment of goodwill is therefore 20% � £115,000 � $23,000. This will be charged to the group income statement in the year and will reduce the value of the investment:
Dr Profi t from operations $23,000 Cr Investment in associate $23,000 Being the impairment of goodwill on associate
W2 40% of the dividend of $100,000 paid by GH will have been received by AB. This is currently included in the profi t from operations. Dividends received reduce the value of the investment in associate, and the only fi g-ure that should be included in the income statement in respect of the associate is the share of results for the year. The dividend received should be adjusted in the group accounts as:
Dr Investment in associate $40,000 Cr Profi t from operations $40,000 Being elimination of dividends from the income statement
W3 Share of profi t of associateAB is entitled to 40% of the profi t after tax of GH, 40% � $200,000 � $80,000.

85FINANCIAL MANAGEMENT
ASSO
CIATES A
ND
JOIN
T VENTU
RESW4 Investment in associate
$000Cost of investment 375Plus share of post-acquisition profi ts 40% �($550,000 � $400,000)
60
Less dividend received (40)Less impairment (23)Investment in associate 372
W5 Retained earnings
Group $000 GH $000Retained earnings of AB 1,875Retained earnings of GH 550RE of GH at acquisition (400)
15040% group share of GH 60Impairment of goodwill (23)Less elimination of dividend (40)
1,872
5.2.2 Treatment of unrealised profits on intra-group trading
You will already be aware that, under full consolidation, intra-group profi ts and losses are eliminated in full in the consolidated fi nancial statements.
Example 5.B
Suppose that in the year ended 31 December 20X0 Predator (see Example 5.A) sold goods to Victim having a sales value of $2 million, making a profi t of $500,000. 20% of these goods were unsold by Victim at the year-end.
The unrealised profi t at the year-end is 20% � $500,000 � $100,000. Therefore, in the consolidated fi nan-cial statements, this unrealised profi t is eliminated from retained earnings and inventories as shown below:
DR CR
$’000 $’000Retained earnings 100Inventories 100
In the consolidated income statement, revenue would be reduced by $2 million (removing the intra-group ele-ment) and cost of sales by $1.9 million. The net effect of this adjustment is of course to adjust gross profi t by $100,000.
However, when we equity account our associate we are not aggregating the assets and liabilities on a line-by-line basis – we don’t have its inventories and retained earnings fi gures included in our statement of fi nancial position. There is no adjustment to remove sales and cost of sales, as we have not aggregated the associate’s income statement with the group’s income statement.
When we use equity accounting the associate is only refl ected in one line in the group income statement and one line in the group statement of fi nancial position therefore any adjusting entries for intra-group trading will have to be affecting either; share of associate’s profi ts or investment in associate. The entry required will depend on which direction the goods are going; to the associate or from the associate.
Sale by parent (or subsidiary) to associate (equity method of consolidation)If Predator is consolidated using the equity method of consolidation then the inventories of Victim will not appear on the consolidated statement of fi nancial position. Therefore crediting inventories would be inappropriate. The group share of the net assets of Victim

STUDY MATERIAL F286
ASS
OC
IATE
S A
ND
JOIN
T VE
NTU
RES will appear under the heading ‘Investments’. Therefore the correct consolidation adjust-
ment will be:
DR CR$’000 $’000
Retained earnings 50Investment in Victim 50
In the consolidated income statement, gross profi t would be reduced by $50,000. The issue of whether or not any adjustment should be made to revenue is not made clear in IAS 28 Investments in associates. It could be argued that given the margin that is earned on the intra-group sales (25%) then revenue should be adjusted by $200,000 ($50,000 �100/25). This would lead to a reduction in cost of sales of $150,000 to give the required adjustment of $50,000 to gross profi t. Given that Predator makes a profi t of 25% on sales, this is the sales value that corresponds to an unrealised profi t adjustment of $50,000.
Sale to parent (or subsidiary) from associate (equity method of consolidation)Where the transaction (using the same details as above) is going in the other direction, the overstated inventories are sitting in the parent’s accounts, so inventories are adjusted. The unrealised profi t is made by the associate and so the share of the profi t of associate is over-stated; corrected by:
DR CR$’000 $’000
Share of profi t of associate 50Inventories 50
Note: If you are only asked to prepare the consolidated statement of fi nan-cial position then the debit would be straight to retained earnings.
5.3 IAS 31 Interests in joint venturesThe IAS states that a joint venture is:
A contractual arrangement whereby two or more parties undertake an eco-nomic activity that is subject to joint control.
A joint venture can take a number of forms and the appropriate form of accounting depends on the form of the joint venture. However, IAS 31 states that whatever form the joint venture takes there are two common characteristics:
● Two or more venturers are bound by a contractual arrangement.● The contractual arrangement establishes joint control.
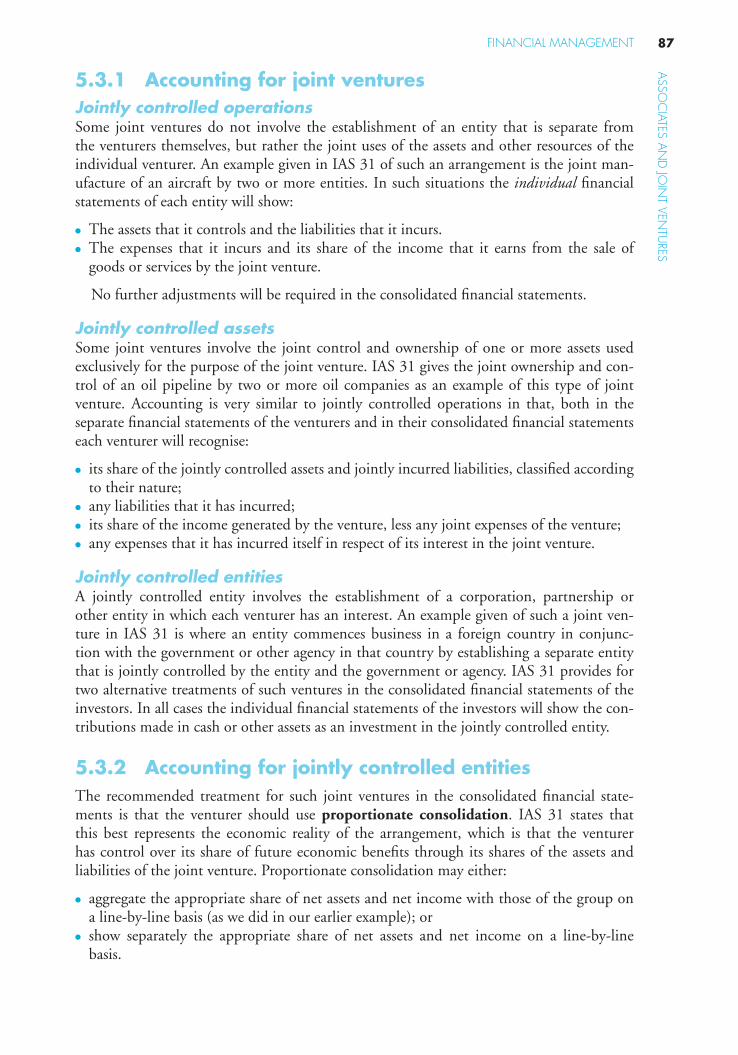
87FINANCIAL MANAGEMENT
ASSO
CIATES A
ND
JOIN
T VENTU
RES5.3.1 Accounting for joint venturesJointly controlled operationsSome joint ventures do not involve the establishment of an entity that is separate from the venturers themselves, but rather the joint uses of the assets and other resources of the individual venturer. An example given in IAS 31 of such an arrangement is the joint man-ufacture of an aircraft by two or more entities. In such situations the individual fi nancial statements of each entity will show:
● The assets that it controls and the liabilities that it incurs.● The expenses that it incurs and its share of the income that it earns from the sale of
goods or services by the joint venture.
No further adjustments will be required in the consolidated fi nancial statements.
Jointly controlled assetsSome joint ventures involve the joint control and ownership of one or more assets used exclusively for the purpose of the joint venture. IAS 31 gives the joint ownership and con-trol of an oil pipeline by two or more oil companies as an example of this type of joint venture. Accounting is very similar to jointly controlled operations in that, both in the separate fi nancial statements of the venturers and in their consolidated fi nancial statements each venturer will recognise:
● its share of the jointly controlled assets and jointly incurred liabilities, classifi ed according to their nature;
● any liabilities that it has incurred;● its share of the income generated by the venture, less any joint expenses of the venture;● any expenses that it has incurred itself in respect of its interest in the joint venture.
Jointly controlled entitiesA jointly controlled entity involves the establishment of a corporation, partnership or other entity in which each venturer has an interest. An example given of such a joint ven-ture in IAS 31 is where an entity commences business in a foreign country in conjunc-tion with the government or other agency in that country by establishing a separate entity that is jointly controlled by the entity and the government or agency. IAS 31 provides for two alternative treatments of such ventures in the consolidated fi nancial statements of the investors. In all cases the individual fi nancial statements of the investors will show the con-tributions made in cash or other assets as an investment in the jointly controlled entity.
5.3.2 Accounting for jointly controlled entitiesThe recommended treatment for such joint ventures in the consolidated fi nancial state-ments is that the venturer should use proportionate consolidation. IAS 31 states that this best represents the economic reality of the arrangement, which is that the venturer has control over its share of future economic benefi ts through its shares of the assets and liabilities of the joint venture. Proportionate consolidation may either:
● aggregate the appropriate share of net assets and net income with those of the group on a line-by-line basis (as we did in our earlier example); or
● show separately the appropriate share of net assets and net income on a line-by-line basis.

STUDY MATERIAL F288
ASS
OC
IATE
S A
ND
JOIN
T VE
NTU
RES
Example 5.C
GHK prepares its group accounts to 31 December. The accounts for GHK and its fully owned subsidiaries are shown below for GHK excluding its joint venture LM.
GHK acquired its interest in LM in 2006. GHK is one of 4 venturers who exercise joint control over the opera-tions of LM. A contractual agreement details the terms of the arrangement. At the date the interest was acquired the retained earnings of LM totalled $400,000.
The consolidated fi nancial statements of GHK are presented below together with the accounts of LM for the year to 31 December 20X8.
Income statements for the year ended 31 December 20X8
GHK LM
$000 $000Revenue 2,700 1,460Cost of sales 2,000 1,000Gross profi t 700 460 Net operating expenses 400 200 Profi t before tax 300 260Income tax expense 100 60 Profi t for the period 400 200
Statements of fi nancial position as at 31 December 20X8
GHK LM
$000 $000AssetsNon-current assetsProperty, plant and equipment 1,320 900Investment in LM 450 -Current assets 1,770 900 Inventories 100 120Receivables 730 380
2,600 1,400Capital and liabilitiesShare capital 1,000 500Retained earnings 1,200 700
2,200 1,200LiabilitiesCurrent liabilities 400 200
2,600 1,400
Additional information:1. There is no impairment of goodwill.2. LM paid a dividend of $100,000 in the year to 31 December 20X8. GHK has included its share of this
dividend in net operating expenses.3. GHK incorporates LM in the group accounts using proportionate consolidation.
RequirementPrepare the consolidated income statement and the consolidated statement of fi nancial position for GHK incorpo-rating the joint venture, LM for the year to 31 December 20X8.
Solution
The share of revenues, costs, assets and liabilities of the JV are aggregated with the group fi gures. There is no non-controlling interest as only the group share (25% as GHK is 1 of 4 venturers) is included.

89FINANCIAL MANAGEMENT
ASSO
CIATES A
ND
JOIN
T VENTU
RESConsolidated income statement for the year ended 31 December 20X8
GHK
$000Revenue $2,700 � (25% � $1,460) 3,065Cost of sales $2,000 � (25% � $1,000) (2,250)Gross profi t 815Net operating exps $400 � (25% � $200) � W1 $25 (475)Profi t before tax 340Income tax expense $100 � (25% � $60) (115)Profi t for the period 225
Statement of fi nancial position as at 31 December 20X8
GHK
$000AssetsNon-current assetsProperty, plant and equipment $1320 � (25% � 900) 1,545Goodwill (W2) 225
1,770Current assetsInventories $100 � (25% � $120) 130Receivables $730 � (25% � $380) 825
2,725Capital and liabilitiesShare capital (parent only) 1,000Retained earnings (W3) 1,275LiabilitiesCurrent liabilities $400 � (25% � $200) 450
2,725
WorkingsW1 Elimination of internal dividend
25% of the $100,000 dividend paid by LM has been received by GHK. This must be eliminated by: Dr Net operating expenses $25,000 Cr Retained earnings $25,000 Being the group share of the dividend paid by the JVThe group retained earnings include 25% of the post-acquisitions earnings of the JV so the net impact on
retained earnings is nil as we have reduced GHK’s retained earnings and increased LM’s retained earnings by the same amount. The amount is correctly deducted from the income statement.
W2 Goodwill on acquisition
Consideration paid $450Net assets acquired:Share capital $500Retained earnings at acquisition $40025% acquired $900 225Goodwill on acquisition 225
W3 Retained earnings
Group $000 LM $000Retained earnings of GHK 1,200Retained earnings of LM 700RE of LM at acquisition (400)
30025% group share of LM 75
1,275

STUDY MATERIAL F290
ASS
OC
IATE
S A
ND
JOIN
T VE
NTU
RES 5.3.3 Treatment of unrealised profits on intra-group
tradingWhen we have used proportionate consolidation, the group share of the inventory of the relevant entity is included in consolidated inventory.
Example 5.D
Suppose that in the year ended 31 December 20X0 Predator (see Example 5.B) sold goods to Victim having a sales value of $2 million, making a profi t of $500,000. 20% of these goods were unsold by Victim at the year-end. The unrealised profi t at the year-end is 20% � $500,000 � $100,000.
Therefore the appropriate journal adjustment would be:
DR CR$’000 $’000
Retained earnings 50Inventory 50
In the consolidated income statement, revenue would be reduced by $1 million (50% � $2 million) and cost of sales by $950,000 (50% � $1,900,000). The net effect is to achieve an adjustment of $50,000 at gross profi t level.
In the case of proportionate consolidation it makes no difference which way the sale goes (from parent/subsidiary or vice versa), the consolidation adjustment is the same.
5.3.4 Alternative treatmentHowever, IAS 31 permits an alternative treatment: the interest is consolidated using the equity method, as for associates. If this treatment is adopted, or if the fi rst form of propor-tionate consolidation is used (see above), then IAS 31 required that entities disclose the aggregate amounts of each of current assets, long-term assets, current liabilities, long-term liabilities, income and expenses related to its interest in joint ventures.
The IASB has continued to permit both the recommended and the alternative treatment of joint ventures: the revised IAS 31 that follows the improvements project is unchanged in this respect. It therefore provides an interesting example of a case where some degree of choice is available to reporting entities.
5.4 The impact of different methods of accounting for investments
Example 5.E
Statement of fi nancial positions of Predator and Victim as on 31 December 20X0Predator Victim$’000 $’000
Non-current assets Investment in Victim 7,200 – Other 16,500 10,000Current assets 14,800 8,800
38,500 18,800Issued capital ($1 shares) 20,000 12,000Retained earnings 12,500 3,000
32,500 15,000Current liabilities 6,000 3,800
38,500 18,800

91FINANCIAL MANAGEMENT
ASSO
CIATES A
ND
JOIN
T VENTU
RESNotes1. The investment in Victim comprises 6 million shares acquired on 31 December 20X4 when Victim’s equity
was $13 million (issued capital $12 million plus retained earnings $1 million).2. Predator sells a product that is used by Victim. The total sales of the product in 20X4 were $1,000,000.
None of the goods were in the inventory of Victim at the year-end. However, the trade receivables of Predator and the trade payables of Victim include $100,000 in respect of the sale of these goods.
Income statements for the year ended 31 December 20X0
Predator Victim$’000 $’000
Revenue 9,000 4,500Operating costs (4,500) (2,250)Investment income 400 –Profi t before tax 4,900 2,250Income tax expense (1,300) (750)Profi t for the period 3,600 1,500
Summarised statements of changes in equity for the year ended 31 December 20X0
Predator Victim$’000 $’000
Opening equity 30,900 14,300Profi t for the period 3,600 1,500Dividends (2,000) (800)Closing equity 32,500 15,000
We will now prepare the consolidated fi nancial statements of the group under the three possible methods of consolidation: full consolidation, equity method of consolidation and proportionate consolidation.
Consolidated statement of fi nancial position
Full Equity Proportionate$’000 $’000 $’000
Goodwill 700 700Investment in Victim 8,200Other non-current assets 26,500 16,500 21,500Current assets 23,500 14,800 19,150
50,700 39,500 41,350Issued capital 20,000 20,000 20,000Retained earnings 13,500 13,500 13,500
33,500 33,500 33,500Non-controlling interest 7,500 – –Current liabilities 9,700 6,000 7,850
50,700 39,500 41,350
WorkingsFull Equity Proportionate
$’000 $’000 $’0001. Goodwill on consolidation Cost of investment 7,200 7,200 7,200 Share of net assets at date of acquisition
(6,500) (6,500) (6,500) Total goodwill 700 700 700
2. Investment under equity method Investment at cost 7,200 Share of post-acquisition profi ts ($2,000 � 50%) 1,000
8,2003. Consolidated retained earnings Predator 12,500 12,500 12,500 Victim [50% ($3 m � $1 m)] 1,000 1,000 1,000
13,500 13,500 13,500

STUDY MATERIAL F292
ASS
OC
IATE
S A
ND
JOIN
T VE
NTU
RES
4. Current assets Predator 14,800 14,800 14,800 Victim 8,800 – 4,400 Intra-group balance (100) – (50)
23,500 14,800 19,1505. Current liabilities Predator 6,000 6,000 6,000 Victim 3,800 – 1,900 Intra-group balance (100) – (50)
9,700 6,000 7,850
Notes explaining the methods of consolidation(a) Full consolidation is the method used to deal with most subsidiaries. You should be familiar with the mechan-
ics of this method from previous chapters. This method is also known as line-by-line consolidation.(b) Equity accounting (or one-line consolidation) deals only with the group share of the assets, and so on, of
Victim. The group’s interest in Victim is shown as one amount in the consolidated fi nancial statements.(c) Under equity accounting the carrying amount of the investment is based on the underlying assets and liabili-
ties of the investment, plus any goodwill not written off. It can be compared with the full consolidation method as follows:
$’000Full consolidationUnderlying net assets at BS date 15,000Goodwill 700
15,700Non-controlling interest (7,500)
8,200Equity methodInvestment at cost 7,200Share of post-acquisition profi ts 1,000
8,200
Under equity accounting intra-group balances do not cancel out because the assets and liabilities of Victim are not shown in group receivables and payables.(d) Proportionate consolidation is a cross between full consolidation and the equity method. The method is simi-
lar to full consolidation in that the assets and liabilities are aggregated on a line-by-line basis. However it is similar to the equity method in that only the group share of assets and liabilities is included and there is no need for a non-controlling interest.
(e) Notice that whatever method of consolidation is used, goodwill and consolidated reserves are the same.
Consolidated income statement
Full Equity Proportionate$’000 $’000 $’000
Revenue 12,500 9,000 10,750Operating costs (5,750) (4,500) (5,125)Share of profi ts of Victim 750 Profi t before tax 6,750 5,250 5,625Income tax expense (2,050) (1,300) (1,675)Profi t for the period 4,700 3,950 3,950Attributable to: $ Equity holders of the parent 3,950 Non-controlling interest 750
4,700

93FINANCIAL MANAGEMENT
ASSO
CIATES A
ND
JOIN
T VENTU
RESWorkings
1. Revenue Predator 9,000 9,000 9,000 Victim 4,500 2,250 Intra-group sales eliminated (1,000) (500)
12,500 9,000 10,7502. Operating costs Predator 4,500 4,500 4,500 Victim 2,250 1,125 Intra-group sales eliminated (1,000) (500)
5,750 4,500 5,1253. Share of profi ts of Victim
Equity$’000
50% of profi t for the period 750
Notice that the principle used here mirrors that used in the statement of fi nancial position. Under full con-solidation, income and expenses are aggregated on a line-by-line basis, with full elimination of intra-group transactions. Under the equity method there is one-line consolidation of operating profi ts, with no elimination of intra-group transactions (unless there is any unrealised profi t – see later in the chapter). Under the proportionate consolidation method there is line-by-line consolidation of the group share of Victim’s balances, with proportion-ate elimination of intra-group transactions.Consolidated statement of changes in equity attributable to equity holders of the parent
Full Equity Proportionate$’000 $’000 $’000
Opening equity 31,550 31,550 31,550Profi t for the period 3,950 3,950 3,950Dividends – Predator (2,000) (2,000) (2,000)Closing equity 33,500 33,500 33,500Working: Opening equityPredator 30,900 30,900 30,900Victim [50% � (14,300 � 13,000)] 650 650 650
31,550 31,550 31,550
The fairly obvious comment here is that the statement in respect of changes in equity attributable to equity hold-ers of the parent is identical whatever method of consolidation is used.
5.5 Fair values and accounting policies Where, at the date of acquisition, the fair value of the net assets of an investment that is equity accounted or proportionally consolidated is signifi cantly different from their carry-ing values in the fi nancial statements of the acquired entity, the initial consolidated carry-ing values should be based on fair values
In addition, wherever possible the fi nancial statements of the investee entity should be prepared to the same date, and using the same accounting policies, as the rest of the group. If the fi nancial statements are not prepared to the same date, the difference between the dates should be no more than 3 months.
5.6 Summary This chapter has reviewed the methods of accounting that are appropriate where an inves-tor does not have complete control over an investee’s activities. Generally, it is appropriate

STUDY MATERIAL F294
ASS
OC
IATE
S A
ND
JOIN
T VE
NTU
RES to use the equity method of accounting for associates. As a general rule of thumb, associate
status is often indicated where an investor holds between 20% and 50% of the equity capi-tal of the investee entity.
Joint ventures involve two or more parties in an economic activity subject to joint con-trol. The recommended accounting treatment for jointly controlled entities is proportion-ate consolidation, but IAS 31 also permits use of the equity method.

95
Revision Questions
Question 1
(a) The following statements refer to a situation where an investing entity (D) seeks to exert control or infl uence over another entity (E). Assume that D is required to prepare consolidated accounts because of other investments.
(i) if D owns more than 20% but less than 50% of the equity shares in E, then E is bound to be an associate of D.
(ii) if D controls the operating and fi nancial policies of E, then E cannot be an asso-ciate of D.
(iii) if E is an associate of D, then any amounts payable by E to D are not eliminated when preparing the consolidated statement of fi nancial position of D.
Which of the above statements are true?
(b) Briefl y explain the preferred treatment of jointly controlled entities in accordance with IAS 31 Interests in Joint Ventures.
Question 2On 30 June 20X3, Sugar entered into an agreement with two other investors to establish a new entity, Spice. All three investors subscribed for 1/3 of the equity shares in Spice and each share carries one vote. All three investors appointed two representatives to the six-member board of directors of Spice. All key policy decisions require the agreement of fi ve of the six board members.
The following statements refer to the treatment of the investment in Spice in the con-solidated fi nancial statements of Sugar for the year ended 30 September 20X3:
(i) Spice will be treated as a joint venture simply because the three investors hold 1/3 of the shares each.
(ii) Spice will be treated as a joint venture in this case, but only because of the require-ment that key policy decisions require the consent of at least fi ve of the directors.
(iii) If Spice carries on a business that is distinct from that of its investors, then it will be consolidated using proportional consolidation.
(iv) Spice is only a joint venture if the requirement that key policy decisions require the consent of fi ve directors is established by contract.
5

ASS
OC
IATE
S A
ND
JOIN
T VE
NTU
RES
REVISION QUESTIONS F296
Assuming that the recommended treatment set out in IAS 31 Interests in Joint Ventures is used, which of the above statements are true?
Question 3On 1 January 20X5, CD purchased 30% of the ordinary share capital of EF for $280,000, which gave it signifi cant infl uence over EF’s activities. In the fi nancial year ended 31 December 20X5. EF reported pre-tax profi ts of $62,000. The tax charge was $20,000. During the fi nancial year ended 31 December 20X5, EF paid a total divided of $5,000 to its shareholders.
In the year ended 31 December 20X6, EF made a pre-tax loss of $18,000, with a tax credit of $4,000. A review of CD’s investment in EF at 31 December 20X6 concluded that impairment had taken place. An impairment loss of $45,000 was charged in CD’s consolidated fi nancial statements for the year.
Calculate the carrying amount of the investment in EF to be included in CD’s consoli-dated statement of fi nancial position at 31 December 20X6.
Question 4AB owns a controlling interest in another entity, CD, and exerts signifi cant infl uence over EF, an entity in which it holds 30% of the ordinary share capital. During the fi nancial year ended 30 April 2005, EF sold goods to AB valued at $80,000. The cost of the goods to EF was $60,000. Twenty-fi ve per cent of the goods remained in AB’s inventory at 30 April 2005. Briefl y explain how the intra-group trading will be dealt with in the consolidated accounts of AB.
Question 5The income statements of ST and two entities in which it holds investments are shown below for the year ended 31 January 20X6:
ST UV WX$’000 $’000 $’000
Revenue 1,800 1,400 600Cost of sales (1,200) (850) (450)Gross profi t 600 550 150Operating expenses (450) (375) (74)Profi t from operations 150 175 76Finance cost (16) (12) –Interest income 6 – –Profi t before tax 140 163 76Income tax expense (45) (53) (26)Profi t for the period 95 110 50
Notes
1. Investments by STSeveral years ago ST acquired 70% of the issued ordinary share capital of UV. On 1 February 20X5 ST acquired 50% of the issued share capital of WX, an entity set up under a contractual arrangement as a joint venture between ST and one of its suppliers. The

ASSO
CIATES A
ND
JOIN
T VENTU
RES
97FINANCIAL MANAGEMENT
directors of ST have decided to adopt a policy of proportionate consolidation wherever appropriate and permitted by International Financial Reporting Standards.
2. UV’s borrowingsDuring the fi nancial year ended 31 January 20X6, UV paid the full amount of interest due on its 6% debenture loan of $200,000. ST invested $100,000 in the debenture when it was issued three years ago.
3. Intra-group tradingDuring the year WX sold goods to ST for $20,000. Half of the goods remained in ST’s inventories at 31 January 20X6. WX’s gross profi t margin on the sale was 20%.
RequirementPrepare the consolidated income statement of the ST group for the year ended 31 January 20X6. (Exam standard questions for 10 marks)
Question 6 AJ is a law stationery business. In 20X2 the majority of the entity’s board of directors were replaced. The new board decided to adopt a policy of expansion through acquisition. The statements of fi nancial position as at 31 March 20X5 of AJ and of two entities in which it holds signifi cant investments are shown below.
AJ BK CL $’000 $’000 $’000 $’000 $’000 $’000
ASSETS Non-current assets Property, plant and equipment 12,500 4,700 4,500 Investments 18,000 – 1,300
30,500 4,700 5,800
Current assets
Inventories 7,200 8,000 – Trade receivables 6,300 4,300 3,100 Financial assets – – 2,000 Cash 800 – 900
14,300 12,300 6,000 44,800 17,000 11,800
EQUITY � LIABILITIES Equity Called up share capital ($1 shares) 10,000 5,000 2,500 Retained earnings 14,000 1,000 4,300
24,000 6,000 6,800
Non-current liabilities Loan notes 10,000 3,000 –
Current liabilities Trade payables 8,900 6,700 4,000 Tax 1,300 100 600 Short-term borrowings 600 1,200 400
10,800 8,000 5,000 44,800 17,000 11,800

ASS
OC
IATE
S A
ND
JOIN
T VE
NTU
RES
REVISION QUESTIONS F298
Notes to the statement of fi nancial positions
1. Investment by AJ in BK On 1 April 20 X 2, AJ purchased $2 million loan notes in BK at par. On 1 April 20 X 3, AJ purchased 4 million of the ordinary shares in BK for $7.5 million in cash, when BK’s retained earnings were $1.5 million. BK is an unquoted entity and so the investment is classifi ed as an available for sale asset in AJ’s own accounts. No reliable measure of fair value can be ascertained and so the invest-ment remains at cost in the individual accounts of AJ.
At the date of acquisition of the shares, BK’s property, plant and equipment included land recorded at cost of $920,000. At the date of acquisition the land was valued at $1,115,000. No other adjustments in respect of fair value were required to BK’s assets and liabilities upon acquisition. BK has not recorded the revaluation in its own accounting records.
2. Investment by AJ in CL On 1 October 20X4, AJ acquired 1 million shares in CL, a book distributor, when the retained earnings of CL were $3.9 million. The purchase consideration was $4.4 million. Since the acquisition, AJ has the right to appoint one of the fi ve directors of CL. The remaining shares in CL are owned principally by three other investors.
No fair value adjustments were required in respect of CL’s assets or liabilities upon acquisition. The investment in CL is held at cost (as with BK) as no reliable measure can be made of its fair value.
3. Goodwill on consolidation Since acquiring its investment in BK, AJ has adopted the requirements of IFRS 3 Business Combinations in respect of goodwill on consolidation. During March 20X5, it has con-ducted an impairment review of goodwill. As a result the value of goodwill on consolida-tion in respect of BK is now $1.7 million. It is the group’s policy to value the non-controlling interest at acquisition at the propor-tionate share of the fair value of the subsidiary’s identifi able net assets.
4. Intra-group trading BK supplies legal books to AJ. On 31 March 20 X 5, AJ’s inventories included books pur-chased at a total cost of $1 million from BK. BK’s mark-up on books is 25%.
Requirements (a) Explain, with reasons, how the investments in BK and CL will be treated in the con-
solidated fi nancial statements of the AJ group. (5 marks) (b) Prepare the consolidated statement of fi nancial position for the AJ group at 31 March
20 X 5. (20 marks)
(Exam standard question-Total marks � 25)
Question 7 You are the accountant responsible for training at Develop, an entity with a number of investments throughout the world. A key fi nancial reporting task is to prepare consolidated fi nancial statements and this forms an important aspect of the training of new accountants.

ASSO
CIATES A
ND
JOIN
T VENTU
RES
99FINANCIAL MANAGEMENT
A recently-employed trainee has sent you this memorandum.
I have just attended my fi rst training course and have learned the mechanics of how to treat subsidiaries, associ-ates and trade investments in the consolidated accounts. I’m reasonably comfortable with the numbers, but the concepts baffl e me. Why does the exercise of adding together the statement of fi nancial position of our entity with those of our subsidiaries give our shareholders useful fi nancial information? Why do we treat associates differently – I fi nd the concept of adding together all the net assets and showing our share as one amount particularly confusing? I’m happier with the treatment of trade investments, at least I can see that the fi gure is what we paid to buy the shares. Why not do this for all our investments. I don’t need a detailed explanation of the mechanics, which I’m already reasonably happy with.
Requirement Draft a reply to your trainee that explains the principles underpinning the preparation of consolidated fi nancial statements. You should clearly explain why subsidiaries, associates and trade investments are treated differently and why the information is of benefi t to the shareholders of the investor. (Exam standard question - 10 marks)

This page intentionally left blank

101
Solutions to Revision Questions 5 Solution 1 (a) The fi rst statement is not true; a simple ownership test does not categorically deter-
mine the nature of the relationship between an investor and investee entity. However, the second and third statements are correct.
(b) The preferred treatment for jointly controlled entities is to account for them using proportional consolidation. This involves including the venturer’s share of the assets, liabilities, income and expenses, and aggregating that share in the group accounts. As only the appropriate share has been included, there is no need to account for non-ontrolling interest.
Solution 2The fi rst statement is not true; in all cases the nature of the relationship and the degree of control exerted must be examined in order to assess whether or not a joint venture exists. The other statements are true.
Solution 3
$’000 $’000Cost of investment 28020X5 profi t after tax (62 � 20) 4220X5 dividend (5)20X6 loss after tax (18 � 4) (14)
23Group share � 30% � $23 6.9
286.9Less: impairment (45)
241.9
Solution 4Unrealised profi t � ($80,000 � $60,000) � 25% � $5,000.
The group share of the fi gure is 30%:$1,500. The profi t and inventory are located in the holding entity, so therefore the adjustment is to consolidated reserves and consolidated inventory.

ASS
OC
IATE
S A
ND
JOIN
T VE
NTU
RES
SOLUTIONS TO REVISION QUESTIONS F2102
Solution 5ST Group: consolidated income statement for the year ended 31 January 20X6
$’000Revenue {1,800 � 1,400 � [(600 � 20)/2]} 3,490Cost of sales [1,200 � (20/2) � 850 � (450/2) � 1(W1)] (2,266)Gross profi t 1,224Operating expenses [450 � 375 � (74/2)] (862)Profi t from operations 362Finance cost [16 � (12 � 6)] (22)Profi t before tax 340Income tax expense [45 � 53 � (26/2)] (111)Profi t for the period 229
$’000Attributable to:Equity holders of the parent 196Non-controlling interest [110 (profi t of UV for the period) � 30%] 33
229
(W1) Provision for unrealised profi t $10,000 � 20% � $2,000. Fifty per cent of this is treated as realised, and the remainder ($1,000) as unrealised.
Solution 6 (a) AJ owns 80% of the shares of BK, which points to the existence of a parent/subsidiary
relationship. Provided that AJ controls the activities of BK (and there is nothing to sug-gest that it does not have control), AJ will account for its investment in BK as a subsidi-ary and will prepare consolidated fi nancial statements, using the acquisition method.
AJ acquired 40% of the shares in CL. An investment of 40% in another entity would normally indicate that the investor has a signifi cant infl uence over (but not con-trol of ) the entity’s activities. The fact that AJ has the power to appoint one director to the board tends to support this conclusion. Also, the fact that three other investors hold most of the remainder of the shares make it unlikely that another investor in CL would be able to control the entity’s activities. AJ will account for CL as an associate using the equity accounting method.
(b) AJ: Consolidated statement of fi nancial position at 31 March 20 X 5
$’000 $’000 Non-current assets Property, plant and equipment [12,500 � 4,700 � 195 (FV)] 17,395 Goodwill 1,700 Investment in associate (W3) 4,560 Other fi nancial assets (W1) 4,100 27,755
Current assets Inventories [7,200 � 8,000 � 200 (W4)] 15,000 Trade receivables (6,300 � 4,300) 10,600 Cash 800 26,400 54,155

ASSO
CIATES A
ND
JOIN
T VENTU
RES
103FINANCIAL MANAGEMENT
Capital and reserves Share capital 10,000 Consolidated reserves (W6) 13,156
23,156 Non-Controlling interest (W5) 1,199
Non-current liabilities Loan notes [10,000 � 3,000 � 2,000 (intra-group)] 11,000
Current liabilities Trade payables (8,900 � 6,700) 15,600 Tax (1,300 � 100) 1,400 Short term borrowings (600 � 1,200) 1,800
18,800 54,155
Workings 1. AJ’s investments
$’000 As stated 18,000 Purchase of BK’s loan notes (2,000) Purchase of BK’s shares (7,500) Purchase of CL’s shares (4,400) Balance: other fi nancial assets 4,100
2. Goodwill on consolidation of BK
$’000 Purchase consideration 7,500 Share of net assets acquired: [5,000 � 1,500 � 195 (FV adjustment)] � 80% (5,356) Goodwill as originally calculated 2,144 Impairment loss (balancing fi gure) (444) Goodwill carried forward 1,700
3. Investment in associate
$’000 Purchase consideration 4,400 Group share of post-acquisition profi ts [($4,300 � $3,900) � 40%] 160
4,560
4. Intra-group trading Total provision for unrealised profi t (PURP) � $1 million � 25/125 � $200,000
$’000 $’000 DR Minority share (20%) 40 DR Consolidated reserves 160 CR Consolidated inventories 200
5. Non-controlling interest
$’000 Share of net assets in BK: (6,000 � 195) � 20% 1,239 Less : PURP (W4) (40)
1,199

ASS
OC
IATE
S A
ND
JOIN
T VE
NTU
RES
SOLUTIONS TO REVISION QUESTIONS F2104
6. Consolidated reserves
$’000 AJ 14,000 BK – share of post-acquisition loss: (1,500 � 1,000) � 80% (400) CL – share of post-acquisition profi ts: (4,300 � 3,900) � 40% 160 Impairment loss (W2) (444) PURP (W4) (160) 13,156
Solution 7 Consolidated fi nancial statements show the resources deployed by a single economic entity and the return generated by those resources. The boundary of the single economic entity is determined by common control. Control is essentially the ability to direct the operating and fi nancial policies of an entity. IAS 27 Consolidated and separate fi nancial statements – defi nes a subsidiary in terms of the ability of the parent to exercise control. That is why a group consists of a parent undertaking and its subsidiary undertakings. Because this sin-gle economic entity (comprising more than one separate legal entities) is under common control, it is logical to show one statement of fi nancial position containing 100% of the controlled resources and one income statement containing 100% of the returns earned by those resources. However, a further function of fi nancial statements is to show the interests of the investors in the resources under common control, so the ownership interests section of the statement of fi nancial position needs to separately identify the interests of the parent undertaking’s shareholders from those of other ‘ non-controlling interests ’ in the economic entity.
It is inappropriate to treat associates and trade investments the way we treat subsidiaries because they are outside the boundary of control. However, associates do qualify for special treatment. Although the parent undertaking cannot control the deployment of resources, it is in a position to exercise a signifi cant degree of infl uence over their deployment. If they actively exercise this signifi cant infl uence, then mere inclusion of the amount invested, plus the amounts that happen to be received as dividends, is unlikely to adequately refl ect the extent of the investor’s interest. Therefore, although full consolidation is inappropri-ate, because control is not present, a special form of treatment is needed. This treatment, known as the equity method of consolidation, shows the investor’s share of the net assets of the associate and its share of the profi ts.
Trade investments do not qualify for special treatment because control of signifi cant infl uence is not present. If there is no control or infl uence over resources, then it is inap-propriate to show those resources in any way in the consolidated statement of fi nancial position and it is better to show the initial amount invested. Similarly, if there is not control or infl uence over the distribution of profi ts then it is better to restrict amounts included in the consolidated income statement to dividends received .

6
Consolidated Statement of Cash Flows

This page intentionally left blank

107
6 LEARNING OUTCOME After studying this chapter students should be able to:
� prepare a consolidated statement of cash fl ow for a group of entities.
6.1 Introduction Section 6.2 outlines the requirements of IAS 7 Cash Flow Statements (note IAS 1 revised the title of the statement to ‘statement of cash fl ows’). Section 6.3 works through detailed examples to explain the preparation of group cash fl ow statements including the following complexities:
● acquisition of a subsidiary during the year; ● disposal of a subsidiary during the year; ● exchange differences arising on the translation of a foreign operation.
6.2 IAS 7 – the general principles A cash fl ow statement is an integral part of a complete set of fi nancial statements. It presents information that is not available from the income statement and the statement of fi nancial position.
One of the key features of the cash fl ow statement is that it gives an indication of the relationship between the profi tability of an entity and the cash-generating ability of that entity. Profi tability and cash-generating ability are both important but distinct aspects of corporate performance. Additionally, of course, the cash fl ow statement provides informa-tion on how an entity has used the cash it has generated.
While a cash fl ow statement is an extremely important and useful document taken on its own, it is of most relevance when considered in conjunction with the income statement and the statement of fi nancial position. This is because some of the cash fl ows for a period will result from transactions that took place in earlier years and some cash fl ows may well result in further cash fl ows in a future period. It is usually necessary to refer to the profi t and loss account and statement of fi nancial position to evaluate the cash fl ows in this way.
Consolidated Statement of Cash Flows
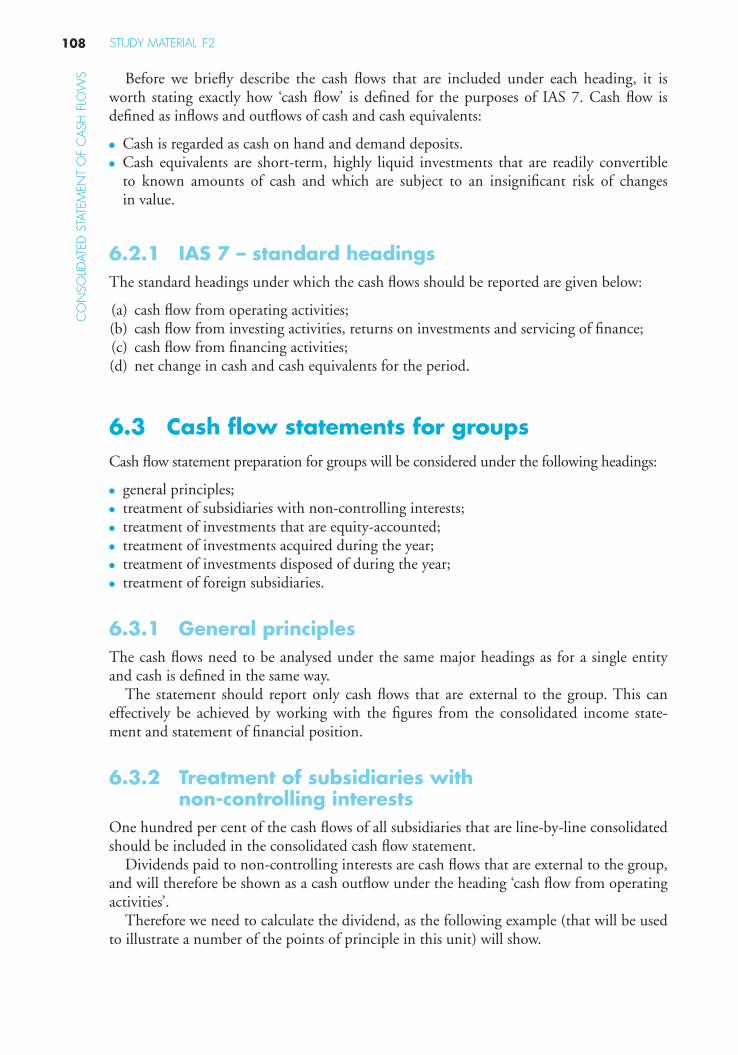
STUDY MATERIAL F2108
CO
NSO
LIDAT
ED S
TATE
MEN
T O
F C
ASH
FLO
WS Before we briefl y describe the cash fl ows that are included under each heading, it is
worth stating exactly how ‘ cash fl ow ’ is defi ned for the purposes of IAS 7. Cash fl ow is defi ned as infl ows and outfl ows of cash and cash equivalents:
● Cash is regarded as cash on hand and demand deposits. ● Cash equivalents are short-term, highly liquid investments that are readily convertible
to known amounts of cash and which are subject to an insignifi cant risk of changes in value.
6.2.1 IAS 7 – standard headings The standard headings under which the cash fl ows should be reported are given below:
(a) cash fl ow from operating activities; (b) cash fl ow from investing activities, returns on investments and servicing of fi nance; (c) cash fl ow from fi nancing activities; (d) net change in cash and cash equivalents for the period.
6.3 Cash flow statements for groups Cash fl ow statement preparation for groups will be considered under the following headings:
● general principles; ● treatment of subsidiaries with non-controlling interests; ● treatment of investments that are equity-accounted; ● treatment of investments acquired during the year; ● treatment of investments disposed of during the year; ● treatment of foreign subsidiaries.
6.3.1 General principles The cash fl ows need to be analysed under the same major headings as for a single entity and cash is defi ned in the same way.
The statement should report only cash fl ows that are external to the group. This can effectively be achieved by working with the fi gures from the consolidated income state-ment and statement of fi nancial position.
6.3.2 Treatment of subsidiaries with non-controlling interests
One hundred per cent of the cash fl ows of all subsidiaries that are line-by-line consolidated should be included in the consolidated cash fl ow statement.
Dividends paid to non-controlling interests are cash fl ows that are external to the group, and will therefore be shown as a cash outfl ow under the heading ‘ cash fl ow from operating activities ’ .
Therefore we need to calculate the dividend, as the following example (that will be used to illustrate a number of the points of principle in this unit) will show.

109FINANCIAL MANAGEMENT
CO
NSO
LIDATED
STATEMEN
T OF C
ASH
FLOW
S
Example 6.A
We are given the following information concerning the Investor group for the year to 31 December 20 X 3.
Consolidated income statement
$’000 $’000 Profi t from operations Group entities 16,600 Associate 980 Profi t before tax 17,580 Income tax expense Group entities 7,900 Associate 420
(8,320) Profi t for the period 9,260 Attributable to: Equity holders of the parent 7,710 Non-controlling interest 1,550
9,260
Summarised consolidated statement of changes in equity (in respect of equity holders of the parent)
$’000 Balance at 1 January 20 X 3 21,845 Profi t for the period 7,710 Dividends paid (2,100) New shares issued 2,000 Balance at 31 December 20 X 3 29,455
Consolidated statements of fi nancial position 31.12. X 3 31.12. X 2 ASSETS $’000 $’000 $’000 $’000 Non-current assets Investment in associate 6,200 5,700
Goodwill on acquisition 680 280 Property, plant and equipment 21,200 16,900
28,080 22,880 Current assets Inventories 16,600 12,200 Receivables 15,000 9,300
Cash 50 1,44531,650 22,94559,730 45,825
EQUITY & LIABILITIES Share capital 14,000 13,000 Share premium 2,645 1,645 Retained earnings 12,810 7,200
29,455 21,845
Non-controlling interest s 8,200 6,60037,655 28,445
Long-term loans 1,655 5,280 Current liabilities Trade payables 7,700 5,800
Taxation 9,100 4,900 Bank overdraft 3,620 1,400
20,420 12,10059,730 45,825

STUDY MATERIAL F2110
CO
NSO
LIDAT
ED S
TATE
MEN
T O
F C
ASH
FLO
WS Notes
1. On 1 July 20 X 3 the Investor group acquired 80% of the issued capital of Vulnerable, whose net assets at that date were as follows:
$’000 Property, plant and equipment 2,600Inventories 900Receivables 980Cash 200 Trade payables (1,380)Tax (300)
3,000
The purchase consideration was $2.8 million in cash. 2. Depreciation charged in the year amounted to $2,200,000. There were no disposals of property, plant and
equipment during the year.
Given the information concerning Investor, we can calculate the dividend that was paid to the non-controlling interest by reconciling the movement in the non-controlling interest per the statement of fi nancial position to profi ts credited to the non-controlling interest per the income statement. This reconciliation is provided below:
$’000Non-controlling interest as at 1 January 20 X 3 6,600Non-controlling interest in profi ts for the year 1,550 Increase in non-controlling interest due to acquisition * 600 Dividend paid to non-controlling interest (balance) (550)Non-controlling interest as at 31 December 20 X 3 8,200
*The identifi able net assets of Vulnerable at the date of acquisition were $3 million. Because Vulnerable becomes an 80% subsidiary we then have a non-controlling interest of 20% of $ 3 million, which is $600,000.
6.3.3 Treatment of investments that are equity-accounted
The cash fl ows of such entities should not be included in the cash fl ow statement for the group. The only time the cash fl ows of the group are affected by investments that are equity-accounted is when the entity in which the investment is made makes a dividend payment.
Dividends received from such investments should be shown as a cash infl ow. These divi-dends should be shown under the heading ‘ cash fl ow from investing activities ’ .
The dividend fi gure can be derived in a similar way to dividends paid to non-controlling interest, as the working below indicates.
$’000 Investment in associates at 1 January 20X 3 5,700 Share of profi t before taxation for the year 980 Share of tax charge for the year (420) Dividend received in the year (to balance) (60) Investment in associates at 31 December 19X 3 6,200
6.3.4 Treatment of investments acquired during the year
If the investment is line-by-line consolidated, then the cash fl ows from the investment will be included in the consolidated cash fl ow statement from the date of acquisition. IAS 7

111FINANCIAL MANAGEMENT
CO
NSO
LIDATED
STATEMEN
T OF C
ASH
FLOW
Srequires that the cash paid to acquire the investment, net of any cash or overdrafts that the investment brings to the group, be shown as an outfl ow of cash under the heading ‘ invest-ing activities ’ .
When computing cash fl ows in a year when a new investment has been acquired, it is important to ensure that the net assets of the new investment at the date of acquisition are not double counted. We will show below the consolidated cash fl ow statement of the Investor group (see Section 6.3.1) to demonstrate this procedure.
Investor – statement of cash fl ows for the year ended 31 December 20X 3
$’000 $’000 Cash fl ow from operating activities Net profi t from group entities before tax 16,600 Depreciation 2,200 Increase in inventory (W2) (3,500) Increase in receivables (W2) (4,720) Increase in payables (W2) 520 Tax paid (W3) (4,000) Dividends paid Parent shareholders (2,100) Non-controlling interest (550)
4,450 Cash fl ow from investing activities Dividend received from associate 60 Purchase of property, plant and equipment (W4) (3,900) Purchase of subsidiary (net of cash acquired – W2) (2,600)
(6,440) Cash fl ow from fi nancing activities Issue of shares 2,000 Repayment of loans (3,625)
(1,625) (3,615)
Decrease in cash Cash in hand (1,395) Bank overdraft (2,220)
(3,615)
Workings 1. The goodwill account can be reconciled as follows:
$’000 Opening balance 280 Increase due to acquisition
$2.8 m � 80% � $3 m 400 Closing balance 680
2. The cash outfl ow in respect of the purchase of Vulnerable in the accounting period is the amount paid ($2.8 million) minus the cash balance of Vulnerable at the date of acquisition ($0.2 million). This cash outfl ow effectively entitles the group to consoli-date the net assets of Vulnerable and so, to the extent that increases in the net assets of the group were due to the acquisition of Vulnerable, they are taken into account in the cash outfl ow of $2.6 million. Therefore, in reconciling movements on working capital that

STUDY MATERIAL F2112
CO
NSO
LIDAT
ED S
TATE
MEN
T O
F C
ASH
FLO
WS are added back in determining the cash fl ow from operating activities, the net assets at
the date of acquisition should not be double counted. Therefore we have the following:
Item Overall movement Vulnerable at
date of acquisition As per cash fl ow
statement $’000 $’000 $’000 Inventories 4,400 900 3,500 Receivables 5,700 980 4,720 Payables 1,900 1,380 520
3. Movements in the tax account can be reconciled as follows (remembering once again not to double count the tax liability assumed on acquisition of Vulnerable):
$’000 Tax balance at 1 January 20X 3 4,900 Increase due to acquisition of Vulnerable 300 Income statement for the year 7,900 Cash paid (to balance) (4,000) Tax balance at 31 December 20X 3 9,100
4. In a similar way, we can reconcile movements in property, plant and equipment:
$’000 Balance as 1 January 20X 3 16,900 Additions in the year Due to acquisition of Vulnerable 2,600 Other (to balance) 3,900 Depreciation charge for the year (2,200) Balance as at 31 December 20 X 3 21,200
Acquisitions of investments that are equity accounted or treated as a trade investment present few problems as far as the preparation of the consolidated cash fl ow statement is concerned. Since none of the net assets are line-by-line consolidated the only amount that is included in the cash fl ow statement is to show the cash paid to purchase the investment as a cash outfl ow under the heading ‘ cash fl ow from investing activities ’ . Any dividends received after the date of acquisition will be shown as a cash infl ow under the heading ‘ cash fl ow from fi nancing activities ’ .
6.3.5 Treatment of investments disposed of during the year
As far as the consolidated cash fl ow statement is concerned, disposals are very much the mirror image of acquisitions.
If the investment was line-by-line consolidated prior to the disposal, and is no longer line-by-line consolidated after the disposal, then the proceeds of disposal of the investment (net of any cash and overdrafts of the investment at the date of disposal) will be shown as a cash infl ow under the heading ‘ acquisitions and disposals ’ .
The principles regarding the reconciliation of the movements on net assets apply here as applied in the case of the acquisition of investments.

113FINANCIAL MANAGEMENT
CO
NSO
LIDATED
STATEMEN
T OF C
ASH
FLOW
S Example 6.B
The consolidated income statement and extracts from the consolidated statement of changes in equity of the JCN group for the year ended 31 December 20X 0, and the consolidated statements of fi nancial position of the group at the beginning and end of 20X 0, are given below:
Consolidated income statement – year ended 31 December 20X 0
$’000 Profi t from operations 20,000 Finance cost (1,400) Profi t on disposal (N1) 700 Profi t before tax 19,300 Income tax expense (6,500) Profi t for the period 12,800 Attributable to: Equity holders of the parent 11,800 Non-controlling interests 1,000
12,800
Summarised consolidated statement of changes in equity – year ended 31 December 20 X 0 (in respect of equity holders of the parent)
$’000 Balance at 1 January 20X 0 49,500 Profi t for the period 11,800 Dividends paid 0(3,000) Balance at 31 December 20X 0 58,300
Consolidated statements of fi nancial position – as at 31 December: 20 X 0 20W9 ASSETS $’000 $’000 $’000 $’000 Property, plant and equipment (N2)
51,350 50,000
Current assets Inventories 25,000 23,000 Trade receivables 21,000 19,000 Cash in hand 6,000 2,000
52,000 44,000103,350 94,000
EQUITY & LIABILITIES Share capital 20,000 20,000 Retained earnings 38,300 29,500
58,300 49,500Non-controlling interest s 5,050 5,750
63,350 55,250 Long-term loans 9,500 12,500 Current liabilities Trade payables 18,500 16,250 Tax 6,000 5,000 Bank overdraft 6,000 5,000
30,500 26,250103,350 94,000

STUDY MATERIAL F2114
CO
NSO
LIDAT
ED S
TATE
MEN
T O
F C
ASH
FLO
WS Notes
1. On 30 June 20X 0 JCN disposed of its investment in Pear, a subsidiary in which it had a shareholding of 80%. The proceeds of the disposal were $5.5 million. Details of the disposal were as follows:
$’000 Net assets at the date of disposal Property, plant and equipment 4,000 Inventories 2,000 Receivables 2,500 Trade payables (1,500)Tax (300) Bank overdraft (200)Long-term loan (500)
6,000
JCN had acquired its investment on 30 June 20V8 for $1.9 million when the net assets of Pear were $2 million. Goodwill was found to be impaired several years ago, and so was fully written off before the start of the current fi nancial year.
2. Depreciation charged during the period in the consolidated income statement amounted to $10.1 million. There were no disposals of property, plant and equipment by the group other than those effectively made upon disposal of the investment in Pear. The consolidated cash fl ow statement for the group for the year ended 31 December 20 X 0 would be as follows:
$’000 $’000Cash fl ow from operating activities Profi t before tax 19,300 Finance cost 1,400 Profi t on disposal (700)Depreciation 10,100 Increase in inventories (W1) (4,000) Increase in receivables (W1) (4,500) Increase in payables (W1) 3,750 Interest paid (1,400) Tax paid (W3) (5,200)
18,750Cash fl ow from investing activities Purchase of property, plant and equipment (W5) (15,450) Sale of Pear (W4) 5,700
(9,750)Cash fl ow from fi nancing activities Repayment of long-term loan (2,500) Dividends paid: Non-controlling interest (W2) (500)
Parent shareholders (3,000)
Increase in cash and cash equivalents Cash in hand 6,000 Bank overdraft (3,000)
3,000
Workings 1. As with acquisitions, care must be taken not to double count working capital movements when an investment
is disposed of during the year. When we have disposed of a subsidiary, we have already accounted for a working capital reduction (the working capital of the subsidiary which is removed from the group statement of fi nancial position on disposal). Therefore we must take care to add this movement back so as to derive the movement from operating sources. Therefore the fi gures in the cash fl ow statement can be derived as follows:
Item
Net movement per the statement of fi nancial position
Movement due to the disposal
Movement per the cash fl ow statement
$’000 $’000 $’000Inventories 2,000 2,000 4,000Receivables 2,000 2,500 4,500 Trade payables (2,250) (1,500) (3,750)

115FINANCIAL MANAGEMENT
CO
NSO
LIDATED
STATEMEN
T OF C
ASH
FLOW
S 2. The movement in the non-controlling interest account is as follows:
$’000Non-controlling interest as at 1 January 20X 0 5,750 Reduction due to disposal (20% � $6 m) (1,200)Non-controlling interest in the profi ts of the year 1,000 So dividend paid to non-controlling interest (500) (to balance) Non-controlling interest as at 31 December 20X0 5,050
3. The movement in the tax account is:
$’000 Tax liability as at 1 January 20 X 0 5,000 Reduction due to disposal (300) Tax charge for the year 6,500 Cash paid (to balance) (5,200) Tax liability as at 31 December 20X 0 6,000
4. The cash outfl ow shown in the cash fl ow statement that is caused by the disposal of Pear is the proceeds of sale ($5.5 million) plus the bank overdraft of Pear at the date of disposal. A reduction in a bank overdraft is a reduction in a negative component of cash and so increases the cash of the group.
5. The outfl ow of cash in respect of the purchase of property, plant and equipment can be computed by recon-ciling the statement of fi nancial position movement in property, plant and equipment as shown below:
$’000 Balance at 1 January 20 X 0 50,000 Reduction due to disposal of Pear (4,000) Depreciation charge for the year (10,100) Additions for the year (to balance) 15,450 Balance at 31 December 20X 0 51,350
6. While the overall loans balance has been reduced by $3 million, there was a reduction of $500,000 due to the disposal of Pear. Therefore there must have been a repayment of $2.5 million.
Disposals of investments that are not line-by-line consolidated do not cause any particular problems. The pro-ceeds of sale are shown as a cash infl ow under the heading ‘cash fl ow from investing activities ’. No allowance needs to be made when reconciling individual assets and liabilities, since the assets and liabilities of the invest-ment that is being disposed of were not line-by-line consolidated prior to disposal.
6.3.6 Treatment of foreign subsidiaries Where the investment is in a foreign undertaking, exchange differences are quite likely to arise. Exchange differences (covered in more depth in Chapter 8) arising on the translation of a foreign operation are recognised within equity, and are reported in other comprehen-sive income in the period in which they occur.
Where consolidated net assets are increased or decreased by the effect of exchange dif-ferences then this needs to be allowed for in reconciling their movement in the cash fl ow statement. The workings for this look similar to those prepared for acquisition/disposal in the period.

STUDY MATERIAL F2116
CO
NSO
LIDAT
ED S
TATE
MEN
T O
F C
ASH
FLO
WS
Example 6.C
The consolidated income statement and extracts from the statement of changes in equity of Etac for the year ended 31 December 20 X 0 and the consolidated statement of fi nancial positions at that date and at the begin-ning of the year are given below:
Consolidated statement of comprehensive income – year ended 31 December 20 X 0
$’000Revenue 30,000 Cost of sales (20,000) Gross profi t 10,000 Other operating expenses (6,000) Finance cost (1,000) Profi t before tax 3,000 Income tax expense (1,000) Profi t for the period 2,000Other comprehensive income:Exchange difference (N1) 310Total comprehensive income 2,310 Profi t attributable to: Equity holders of parent 1,700 Non-controlling interest 300
2,000
Total comprehensive income attributable to: Equity holders of parent 1,950
Non-controlling interest $300 � (310-250)
360
2,310
Extract from consolidated statement of changes in equity (parent only) – year ended 31 December 20 X 0
$’000 Balance at 1 January 20 X 0 6,200 TCI for the period 1,950 Dividends paid (1,200) Balance at 1 January 20 X 0 6,950
Statements of fi nancial position – as at 31 December 20 X 0 20W9 ASSETS $’000 $’000 $’000 $’000 Property, plant and equipment (N2) 15,450 11,500 Current assets
Inventories 4,000 3,500 Receivables 5,000 4,500 Cash in hand 600 500
9,600 8,50025,050 20,000
EQUITY & LIABILITIES Share capital 4,000 4,000 Retained earnings 2,950 2,200
6,950 6,200 Non-controlling interests 3,300 3,050
10,250 9,250 Long-term loan 6,000 3,000 Current liabilities
Trade payables 4,200 3,900 Tax 1,000 850 Bank overdraft 3,600 3,000
8,800 7,75025,050 20,000
Notes

117FINANCIAL MANAGEMENT
CO
NSO
LIDATED
STATEMEN
T OF C
ASH
FLOW
S 1. The exchange differences on retranslation of the opening net assets and profi ts of the foreign subsidiary were
as follows: $’000
On property, plant and equipment 225 On inventories 75 On receivables 95 On cash in hand 10 On trade payables (65) On taxation payable (20) On bank overdraft (60) On profi ts for the period 50
310The group share of these differences is included in consolidated equity. The exchange difference on profi ts
all relate to operating items excluding depreciation. 2. The depreciation of property, plant and equipment for the year was $1,600,000. No disposals took place
during the year. 3. Goodwill on acquisition was fully written off several years before the start of the current fi nancial year.
Consolidated statement of cash fl ows for the year to 31 December 20 X 0
$’000 $’000 Cash fl ow from operating activities Profi t before tax 3,000 Finance cost 1,000 Depreciation 1,600 Inventory increase (500) Receivables increase (500) Payables increase 300 Exchange differences on working capital 105 Exchange differences on profi t 50 Interest paid (1,000) Tax paid (W2) (870) Dividends paid * Non-controlling interest (W1) (110) Parent shareholders (1,200)
1,875 Cash fl ow from investing activities (W3) (5,325) Cash fl ow from fi nancing activities Increase in long-term loan 3,000
(450) Increase/decrease in cash Cash in hand 90 Bank overdraft (600 � 60) (540)
(450)
*Tutorial note: Dividends paid may be shown as either operating cash fl ows or cash fl ows from fi nancing activities according to IAS 7
Workings 1. Reconciliation of non-controlling interest
$’000Non-cnontrolling interest at 1 January 20X 0 3,050 Exchange differences 60 Profi t for the year 300 Dividends (balancing fi gure) (110) Non-controlling interest at 31 December 20 X 0 3,300
2. Reconciliation of tax

STUDY MATERIAL F2118
CO
NSO
LIDAT
ED S
TATE
MEN
T O
F C
ASH
FLO
WS $’000
Tax liability at 1 January 20 X 0 850 Exchange difference 20 Income statement 1,000 Cash paid (balancing fi gure) (870) Tax liability at 31 December 20X 0 1,000
3. Reconciliation of property, plant and equipment $’000
Balance at 1 January 20 X 0 11,500 Exchange difference 225Depreciation (1,600) Additions (balancing fi gure) 5,325 Balance at 31 December 20 X 0 15,450
This chapter contains some detailed calculations and explanations relating to the preparation of a cash fl ow statement for a group of entities. Where questions in
this area are set in the examination students will often fi nd that they incorporate an addition and/or a disposal during the year. It is also quite possible that questions will be set that involve exchange differences arising on the translation of a foreign operation.
6.4 Summary
Students should note that the basic principles involved in preparing a group cash fl ow statement are the same as for the other consolidated fi nancial statements: the statement should show 100 per cent of the cash fl ows arising from the assets and liabilities that the group controls, and intra-group cash fl ows should be eliminated.

119
Note that a few short questions are included as tests of understanding. Exam standard questions have the mark allocation noted.
Question 1STB is preparing its consolidated statement of cash fl ows for the year ended 31 October 20X7. Its consolidated opening balance at net book value for property, plant and equip-ment was $207,000. During the year the STB group disposed of plant for proceeds of $8,500 that had cost $62,000 several years ago and which was fully written down at 1 November 20X6. There were no other disposals. The depreciation charge for the year ended 31 October 20X7 was $32,000. The consolidated closing book value for property, plant and equipment was $228,000.
Calculate the cash outfl ow in respect of purchases of property, plant and equipment for inclusion in the consolidated cash fl ow statement of STB group for the year ended 31 October 20X7?
Question 2GPX’s fi nancial statements included an investment in associate at $6,600,000 in its consol-idated statement of fi nancial position at 30 September 20X5. At 30 September 20X6, the investment in associate had risen to $6,750,000. GPX’s pre-tax share of profi t in the asso-ciate was $420,000, with a related tax charge of $180,000. The net amount of $240,000 was included in the consolidated income statement for the year ended 30 September 20X6.
There were no impairments to the investment in associate, or acquisitions or disposals of shares during the fi nancial year.
Calculate the amount of the cash fl ow related to this investment for inclusion in the consolidated cash fl ow statement for the year ended 30 September 20X6?
Revision Questions 6

CO
NSO
LIDAT
ED S
TATE
MEN
T O
F C
ASH
FLO
WS
REVISION QUESTIONS F2120
Question 3On 1 March 20X4, NS acquired 30% of the shares of TP. The investment is accounted for as an associate in NS’s consolidated fi nancial statements. Both NS and TP have an accounting year end of 31 October. NS has no other investments in associates.
Net profi t for the year in TP’s income statement for the year ended 31 October 20X4 was $230,000. It declared and paid a dividend of $100,000 on 1 July 20X4. No other dividends were paid in the year.
Calculate the amount that will have been included as an infl ow in respect of earnings from the associate in the consolidated cash fl ow statement of NS for the year ended 31 October 20X4?
Question 4 Extracts from the consolidated fi nancial statements of the AH Group for the year ended 30 June 20X 5 are given below.
AH Group: Consolidated income statement for the year ended 30 June 20 X 5
20X 5 $’000 Revenue 85,000 Cost of sales (59,750) Gross profi t 25,250 Operating expenses (5,560) Finance cost (1,400) Profi t before disposal of property 18,200 Disposal of property (N2) 1,250 Profi t before tax 19,450 Income tax (6,250) Profi t for the period 13,200
$’000 Attributable to: Non-controlling interests 655 Equity holders of parent 12,545 13,200
AH Group: Extracts from statement of changes in equity for the year ended 30 June 20 X 5
Share capital Share premium Retained earnings Total $’000 $’000 $’000 $’000 Opening balance 18,000 10,000 18,340 46,340 Issue of share capital 2,000 2,000 4,000 Profi t for period 12,545 12,545 Dividends (6,000) (6,000) Closing balance 20,000 12,000 24,885 56,885
AH Group: Statement of fi nancial position, with comparatives, as at 30 June 20 X 5
20 X 5 20 X 4 $’000 $’000 $’000 $’000 Non-current assets Property, plant and equipment 50,600 44,050 Intangible assets (N3) 6,410 4,160 57,010 48,210
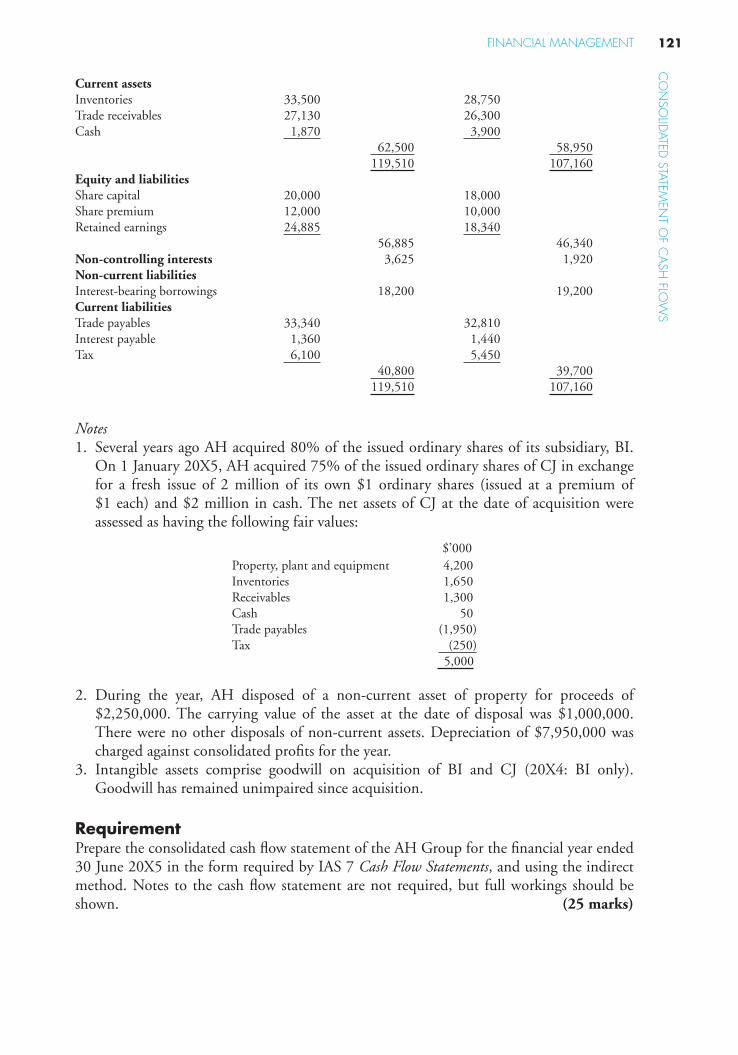
CO
NSO
LIDATED
STATEMEN
T OF C
ASH
FLOW
S
121FINANCIAL MANAGEMENT
Current assets Inventories 33,500 28,750 Trade receivables 27,130 26,300 Cash 1,870 3,900
62,500 58,950 119,510 107,160
Equity and liabilities Share capital 20,000 18,000 Share premium 12,000 10,000 Retained earnings 24,885 18,340
56,885 46,340 Non-controlling interests 3,625 1,920 Non-current liabilities Interest-bearing borrowings 18,200 19,200 Current liabilities Trade payables 33,340 32,810 Interest payable 1,360 1,440 Tax 6,100 5,450
40,800 39,700 119,510 107,160
Notes 1. Several years ago AH acquired 80% of the issued ordinary shares of its subsidiary, BI.
On 1 January 20 X 5, AH acquired 75% of the issued ordinary shares of CJ in exchange for a fresh issue of 2 million of its own $1 ordinary shares (issued at a premium of $1 each) and $2 million in cash. The net assets of CJ at the date of acquisition were assessed as having the following fair values:
$’000 Property, plant and equipment 4,200 Inventories 1,650 Receivables 1,300 Cash 50 Trade payables (1,950) Tax (250)
5,000
2. During the year, AH disposed of a non-current asset of property for proceeds of $2,250,000. The carrying value of the asset at the date of disposal was $1,000,000. There were no other disposals of non-current assets. Depreciation of $7,950,000 was charged against consolidated profi ts for the year.
3. Intangible assets comprise goodwill on acquisition of BI and CJ (20X 4: BI only). Goodwill has remained unimpaired since acquisition.
Requirement Prepare the consolidated cash fl ow statement of the AH Group for the fi nancial year ended 30 June 20 X 5 in the form required by IAS 7 Cash Flow Statements , and using the indirect method. Notes to the cash fl ow statement are not required, but full workings should be shown. (25 marks)

CO
NSO
LIDAT
ED S
TATE
MEN
T O
F C
ASH
FLO
WS
REVISION QUESTIONS F2122
Question 5 Carver is an entity incorporated in 20R8 to produce models carved from wood. In 20U5 it acquired a 100% interest in Olio, a wood importing entity. In 20V9 it acquired a 40% interest in a competitor, Multi-Products. On 1 October 20W9 it acquired a 75% interest in Good Display. It is planning to make a number of additional acquisitions over the next 3 years. The draft consolidated accounts for the Carver group are as follows:
Consolidated income statement for the year ended 30 September 20X 0
$’000 $’000 Profi t from operations 1,485 Share of profi ts of associates 495 Income from trade investments 155 Finance costs (150) Profi t before tax 1,985 Income tax expense Group tax on profi ts 391 Deferred tax 104 Share of tax of associates 145 (640) Profi t for the period 1,345 Attributable to: Equity holders of parent 1,245 Non-controlling interest 100 1,345
Summarised consolidated statement of changes in equity for the year ended 30 September 20X 0 (in respect of the equity holders of the parent)
$’000 Balance at 1 October 20W9 6,395 Profi t for the period 1,245 Dividends (400) Issue of share capital 2,728 Balance at 30 September 20X 0 9,968
Consolidated statement of fi nancial position as at 30 September
20W9 20X 0 $’000 $’000 $’000 $’000 Non-current assets Goodwill on consolidation 100 Buildings – net book value 2,200 2,075 Machinery Cost 1,400 3,000 Aggregate depreciation (1,100) (1,200) 300 1,800 2,500 3,975 Investments in associate 1,000 1,100 Other long-term investments 410 410 Current assets Inventories 1,000 1,975 Trade receivables 1,275 1,850 Short-term investments 1,500 2,675 Cash at bank 1,080 1,890 Cash in hand 10 15 4,865 8,405

CO
NSO
LIDATED
STATEMEN
T OF C
ASH
FLOW
S
123FINANCIAL MANAGEMENT
8,775 13,890 Share capital (25¢ shares) 2,000 3,940 Share premium account 2,095 2,883 Retained earnings 2,300 3,145
6,395 9,968 Non-controlling interests – 115 Non-current liabilities Obligations under fi nance leases 170 710 Loans 500 1,460 Deferred tax 13 30
683 2,200 Current liabilities Trade payables 480 800 Bank overdrafts 770 65 Obligations under fi nance leases 200 240 Corporation tax 217 462 Accrued interest and fi nance charges 30 40
1,697 1,607 8,775 13,890
Notes 1. Non-current assets
● There had been no acquisitions or disposals of buildings during the year. ● Machinery costing $500,000 was sold for $500,000 resulting in a profi t of $100,000.
New machinery was acquired in 20 X 0 including additions of $850,000 acquired under fi nance leases.
2. Investments All current asset investments are readily convertible into cash and are not subject to sig-nifi cant market price risk.
3. Information relating to the acquisition of Good Display
$’000 Net assets at date of acquisition Machinery 165 Inventories 32 Trade receivables 28 Cash 112 Trade payables (68) Tax (17)
252 Non-controlling interest (63) Group share 189 Goodwill on consolidation 100 Purchase consideration 289 Satisfi ed by 880,000 shares 275 Cash 14
289
Goodwill on consolidation of all acquisitions, except that of Good Display had been found to be impaired prior to the current fi nancial year and had been fully written off.

CO
NSO
LIDAT
ED S
TATE
MEN
T O
F C
ASH
FLO
WS
REVISION QUESTIONS F2124
4. Loans Loans were issued at a discount in 20 X 0 and the carrying amount of the loans at 30 September 20X0 included $40,000, representing the fi nance cost attributable to the discount and allocated in respect of the current reporting period.
Requirement Prepare a consolidated cash fl ow statement for the Carver group for the year ended 30 September 20 X 0. (25 marks)
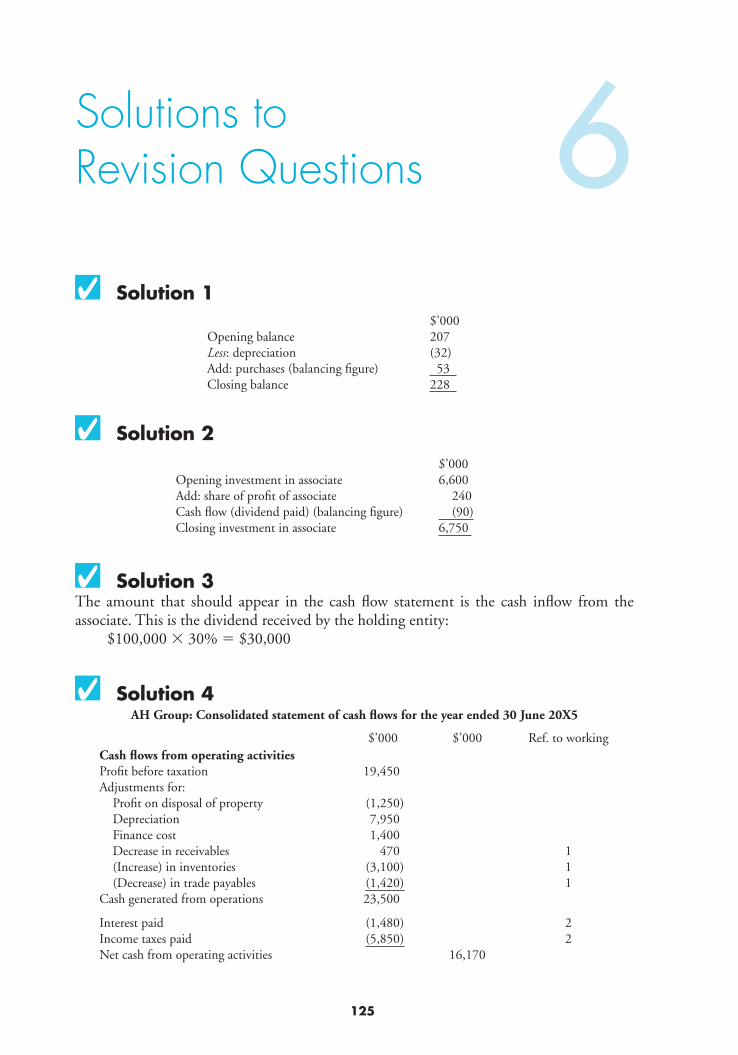
125
Solution 1 $’000
Opening balance 207Less: depreciation (32)Add: purchases (balancing fi gure) 53 Closing balance 228
Solution 2$’000
Opening investment in associate 6,600Add: share of profi t of associate 240Cash fl ow (dividend paid) (balancing fi gure) (90)Closing investment in associate 6,750
Solution 3 The amount that should appear in the cash fl ow statement is the cash infl ow from the associate. This is the dividend received by the holding entity:
$100,000 � 30% � $30,000
Solution 4 AH Group: Consolidated statement of cash fl ows for the year ended 30 June 20X5
$’000 $’000 Ref. to working Cash fl ows from operating activities Profi t before taxation 19,450 Adjustments for: Profi t on disposal of property (1,250) Depreciation 7,950 Finance cost 1,400 Decrease in receivables 470 1 (Increase) in inventories (3,100) 1 (Decrease) in trade payables (1,420) 1 Cash generated from operations 23,500
Interest paid (1,480) 2 Income taxes paid (5,850) 2 Net cash from operating activities 16,170
Solutions to Revision Questions 6

CO
NSO
LIDAT
ED S
TATE
MEN
T O
F C
ASH
FLO
WS
SOLUTIONS TO REVISION QUESTIONS F2126
Cash fl ows from investing activities Acquisition of subsidiary (net of cash) (1,950) 3 Purchase of property, plant and equipment (11,300) 4 Proceeds from sale of property 2,250 Net cash used in investing activities (11,000)
Cash fl ows from fi nancing activities Repayment of interest-bearing borrowings (1,000) Dividends paid by AH (6,000) Dividends paid to non-controlling interests (200) 5 Net cash used in fi nancing activities (7,200)
Net decrease in cash (2,030) Cash at beginning of period (3,900) Cash at end of period 1,870
Workings 1. Working capital changes
Receivables Inventories Trade payables $’000 $’000 $’000 Closing balance (27,130) (33,500) (33,340) Less : acquired with CJ 1,300 1,650 1,950 (25,830) (31,850) (31,390) Opening balance 26,300 28,750 32,810 Decrease/increase/decrease 470 (3,100) 1,420
2. Interest and income taxes
Interest Income taxes $’000 $’000 Liability brought forward 1,440 5,450 Liability acquired with CJ – 250 Charge to income statement 1,400 6,250 Liability carried forward (1,360) (6,100) Balance: amount paid 1,480 5,850
3. Acquisition of subsidiary
$’000 Cash element of consideration 2,000 Less : cash acquired with CJ (50) 1,950
4. Purchase of property, plant and equipment
$’000 Balance brought forward 44,050 Acquired with CJ 4,200 Disposal at net book value (1,000) Depreciation for year (7,950) Less : balance carried forward (50,600) Balance: purchased (11,300)

CO
NSO
LIDATED
STATEMEN
T OF C
ASH
FLOW
S
127FINANCIAL MANAGEMENT
5. Dividend paid non-controlling interests
$’000 Balance brought forward 1,920 Profi t attributable to non-controllign intersts
655
Acquired with CJ ($5,000 � 25%) 1,250 Less : balance carried forward (3,625) Balance: dividend paid 200
Solution 5 Carver: statement of cash fl ows for the year ended 30 September 20X 0
$’000 Cash fl ow from operating activities (W1) 122 Cash fl ow from investing activities (W5) (82) Cash fl ow from fi nancing activities (W9) 2,655 Increase in cash (W13) 2,695
Workings 1. Reconciliation of operating profi t to net cash fl ow from operating activities
$’000 Profi t before tax from group entities (1,985 � 495) 1,490 Income from trade investments (155) Finance costs 150 Depreciation of buildings (reduction in NBV) 125 Depreciation of machinery (see below) 200 Profi t on sale of machinery (100) Increase in inventory (975 � 32) (943) Increase in receivables (575 � 28) (547) Increase in trade payables (320 � 68) 252 Interest paid (W2) (100) Tax paid (W4) (250) Net cash outfl ow from operating activities 122
Note Depreciation of machinery Increase in provision 100 Provision on sold machinery no longer needed 100
200
2. Interest paid
$’000 Charge in income statement 150 Less: charge due to amortisation of discount (40) Increase in liability (10) So cash fl ow 100

CO
NSO
LIDAT
ED S
TATE
MEN
T O
F C
ASH
FLO
WS
SOLUTIONS TO REVISION QUESTIONS F2128
3. Dividends paid to non-controlling interest
$’000 Share of profi t 100 Increase due to acquisition 63 Movement in statement of fi nancial position (115) Dividend paid 48
4. Taxation paid
$’000 Charge in income statement (current plus deferred) 495 Increase due to acquisition 17 Movement in statement of fi nancial position Current tax (245) Deferred tax (17) Cash paid 250
5. Cash fl ow from investing activities
$’000 Dividends received from associates (W6) 250 Dividends received from other long-term investments 155 Sale of non-current assets 500 Purchase of non-current assets (W7) (1,085) Acquisition of Good Display (W8) 98 (82)
6. Dividends received from associates
£’000 Share of profi t after tax 350 Movement in investment (100) Dividend received 250
7. Purchase of non-current assets (machinery)
$’000 Increase in cost per statement of fi nancial position 1,600 Acquired under fi nance leases (850) Disposed of in year 500 Increase due to acquisition (165) Cash fl ow 1,085
8. Purchase of Good Display
$’000 Cash paid to purchase subsidiary undertaking (14) Cash balances acquired with subsidiary 112 98

CO
NSO
LIDATED
STATEMEN
T OF C
ASH
FLOW
S
129FINANCIAL MANAGEMENT
9. Cash fl ow from fi nancing activities
$’000 Issue of loans (W10) 920 Capital repayments under fi nance leases (W11) (270) 650 Dividends paidNon-controlling interest (W3) (48)Parent shareholders (400) Issue of ordinary shares (W12) 2,453
2,655
10. Issue of loans
$’000 Increase per balance sheet 960 Less increase due to amortisation of discount (40) Cash fl ow 920
11. Repayment of loans under leasing obligations
$’000 New obligations 850 Less increase in liability within 1 year (40) after more than 1 year (540) Cash outfl ow 270
12. Issue of shares
$’000 Increase per statement of fi nancial position Share capital 1,940 Share premium 788 Increase due to non-cash consideration (275) Cash fl ow 2,453
13. Movement in cash in the period
$’000 Increase in cash in hand 5 Decrease in bank overdrafts 705 Increase in bank balances 810 Increase in short-term investments 1,175 Increase in cash 2,695

This page intentionally left blank

7
Changes to GroupStructures

This page intentionally left blank

133
7 LEARNING OUTCOMES After studying this chapter students should be able to:
� demonstrate the impact on group fi nancial statements when a subsidiary is acquired part way through an accounting period, and where shareholdings, or control, are acquired in stages;
7.1 Introduction In this chapter we look specifi cally at where there have been changes to the group structure in the period. We will consider acquisitions, disposals and business reorganisations. There will be more opportunities in this chapter to practice the basic principles of consolidation, being the calculation of goodwill on acquisition, group retained earnings and non-controlling interest; however, time apportionment within these calculations will be necessary.
Acquisitions will be covered in the following way:
● In Section 7.2 we will introduce acquisitions in the period with a simple example.● In Section 7.3 we will apply the fair value requirements of IFRS 3 Business Combinations,
introduced in Chapter 2, in a worked example and look at how that impacts the calcula-tion of goodwill and non-controlling interest, and adjusts consolidated net assets.
● The last area of acquisitions that we will consider is the impact on the group accounts where the investment in another entity is built up over time, known as piecemeal acqui-sitions (Section 7.4).
Disposals in the accounting period will be covered in Section 7.5 and again the account-ing treatment will depend on the amount of the investment being disposed of. We will consider:
● Full disposal● Disposal resulting in a subsidiary becoming an associate● Disposal resulting in a subsidiary becoming a trade investment● Disposal resulting in the controlling interest being retained
Business reorganisations will be covered in Section 7.6.
Changes to Group Structures

STUDY MATERIAL F2134
CH
AN
GES
TO
GRO
UP
STRU
CTU
RES 7.2 Acquisitions in the accounting period
7.2.1 IntroductionWhen a group entity is acquired during the accounting period it is not consolidated for the whole period, only from the date of acquisition. This means that, when preparing the consolidated income statement, the profi ts must be time-apportioned and only post-acquisition profi ts included. Unless the question clearly indicates to the contrary, you can assume the profi ts accrue on a time basis.
An additional problem is that the fi gure for pre-acquisition profi ts is unknown. This is needed to compute the goodwill on acquisition. However, the fi gure can be calculated: accumulated profi t in the entity brought forward at the beginning of the year is added to profi t for the year up to the date of acquisition.
Example 7.A
Income statements for the year ended 31 March 20X0
Pig Pinky Perky$’000 $’000 $’000
Revenue 80,700 25,000 11,000Operating expenses (49,000) (20,000) (8,000)Profi t from operations 31,700 5,000 3,000Investment income 1,400 – –Profi t before taxation 33,100 5,000 3,000Income tax expense (13,500) (2,000) (1,200)Profi t for the period 19,600 3,000 1,800
Summarised statements of changes in equity for the year ended 31 March 20X0
Pig Pinky Perky$’000 $’000 $’000
Equity at 1 April 20W9 56,000 23,000 20,200Profi t for the period 19,600 3,000 1,800Dividends paid in March 20X0 (10,000) (1,000) (800)Equity at 31 March 20X0 65,600 25,000 21,200
The equity of the three entities in the statement of fi nancial positions as at 31 March 20X0 showed the following:
Pig Pinky Perky$’000 $’000 $’000
Share capital ($1 shares) 20,000 15,000 10,000Share premium account 8,000 5,000 3,000Retained earnings 37,600 5,000 8,200
65,600 25,000 21,200
On 30 June 20W7, when the retained earnings of Pinky showed a balance of $1.5 million and the equity of Pinky showed a balance of $21.5 million, Pig bought 12 million shares in Pinky for a cash price of $18 million. On 1 October 20W9 Pig bought 7.5 million shares in Perky for a cash price of $16 million. The share premium accounts of Pinky and Perky both arose prior to the investment by Pig.
The main point of principle to bear in mind when preparing the consolidated income statement (see below) is that only the post-acquisition profi ts of subsidiaries should be included. Therefore, for the year ended 31 March 20X0 only the results of Perky must be time apportioned, and only 6 months’ worth included in the consolidated income statement.

135FINANCIAL MANAGEMENT
CH
AN
GES TO
GRO
UP STRU
CTU
RESConsolidated income statement
$’000Revenue (Pig � Pinky � 6/12 � Perky) 111,200Operating expenses (Pig � Pinky � 6/12 � Perky) (73,000)Profi t from operations before tax 38,200Income tax expense (Pig � Pinky � 6/12 � Perky) (16,100)Profi t for the period 22,100Attributable to: Equity holders of parent 21,275 Non-controlling interest (W1) 825
22,100
Consolidated statement of changes in equity
Attributable to equity holders of the parent
Non-controllinginterest Total equity
$ $ $Balance at the start of the year (W2) 57,200 4,600 61,800Non-controlling interest upon acquisition of Perky (W3)
5,275 5,275
Profi t for the period 21,275 825 22,100Dividends (W4) (10,000) (400) (10,400)Balance at the end of the year 68,475 10,300 78,775
Workings1. Non-controlling interest
$’000Pinky ($3,000,000 � 20%) 600,000Perky ($1,800,000 � 6/12 � 25%) 225,000
825,000
2. Balance at the start of the periodAttributable to equity shareholders of the parent:
$’000Pig 56,000Pinky [80% � ($23 m � $21.5 m)] 1,200
57,200
The balance attributable to the non-controlling interest is 20% of the brought forward balance in Pinky of $23 million: $23 m � 20% � $4.6 m.
3. Non-controlling interest upon acquisition of PerkyEquity in Perky at the date of acquisition on 1 October 20W9:
$’000Brought forward at the beginning of the year 20,2006/12 � profi t for the year ($1.8 � 6/12) 900
21,100Minority share (25% � $21.1 m) � $5,275,000
4. Dividends
$’000Pinky (20% � $1 m) 200Perky (25% � $0.8 m) 200
400The closing balance in respect of the minority in the statement of changes in equity can be proved as follows:
’000Pinky (20% � $25 m) 5,000Perky (25% � $21,200) 5,300
10,300

STUDY MATERIAL F2136
CH
AN
GES
TO
GRO
UP
STRU
CTU
RES 7.2.2 Dividends paid by the subsidiary out of profits
earned in the year of acquisition in the financial statements of the parent
Dividend paid after date of acquisitionTreatment of dividends paid in the year of acquisition depends on whether or not the new parent has received (or is to receive) the dividend. If the parent is to receive the dividend, then (as shown in the above example) the group share is regarded as income of the parent.
Dividend causing a reduction in the carrying value of the investmentThere is a minor exception to the general treatment mentioned in the previous paragraph. If a subsidiary pays a large dividend to its parent just after acquisition it may well be that the value of the subsidiary would be considerably diminished by the outfl ow of cash that was required. If this diminution in value were such as to lead to a reduction in the carry-ing value of the investment in the books of the parent then the dividend received would be regarded as a payment from the subsidiary in respect of the reduction in carrying value. The parent would account for this as a reduction in the carrying value of the investment rather than as income.
… It is important to realise that the above matter affects the accounts of the parent but not the consolidated accounts – an intra-group dividend that can-
cels out on consolidation clearly cannot have an effect on the consolidated fi nancial statements.
7.2.3 Dividend paid before the date of acquisitionIf the dividend is paid out before the parent makes its investment, then it is clearly paid out of pre-acquisition profi ts, and so will not be income of the parent at all. However, in computing the goodwill fi gure in these circumstances, the dividend must be deducted in computing the net assets of the subsidiary at the date of acquisition since the cash has left the subsidiary before the date of acquisition.
7.3 Fair value in acquisition accounting 7.3.1 The requirements of IFRS 3
Business Combinations (‘IFRS 3’) IFRS 3 requires that whenever a group entity is consolidated for the fi rst time the purchase consideration and the group share of the net assets of the acquired entity are measured at fair values. The difference between these two fi gures is goodwill.
Net assets of the acquired entity should be recognised separately as at the date of acqui-sition if they satisfy IFRS 3’s criteria for recognition:
● In the case of an asset other than an intangible asset, it is probable that any associated future economic benefi ts will fl ow to the acquirer, and its fair value can be measured reliably;

137FINANCIAL MANAGEMENT
CH
AN
GES TO
GRO
UP STRU
CTU
RES● In the case of a liability other than a contingent liability, it is probable that an outfl ow of
resources embodying economic benefi ts will be required to settle the obligation, and its fair value can be measured reliably;
● It is an intangible asset that meets the IAS 38 Intangible Assets defi nition; ● In the case of a contingent liability, its fair value can be measured reliably.
7.3.2 Summary of points given in Chapter 2 regarding fair value for individual assets and liabilities
Fair value of consideration Fair value must be measured at the date of the exchange. In cases where the acquisition is for the asset of cash, measurement of fair value is straightforward. However, in some cases the consideration offered will comprise equity shares, wholly or in part. Where this is the case, the shares must be valued at fair value.
Property, plant and equipment Fair value should be based on depreciated market value unless (in the case of plant and equipment) there is no evidence of market value. In such cases fair value should be based on depreciated replacement cost.
Inventories Where inventories are replaced by purchases in a ready market, the fair value � market value. However, where there is no ready market fair value is the current cost to the acquir-ing entity of obtaining the same inventories. If no current cost fi gure is readily available it can be approximated by taking inventories at sales values less:
● costs to complete (for work-in-progress inventories) ● incidental costs of disposal ● a realistic allowance for profi t.
Listed investments In most cases, the price quoted at the date of exchange will represent fair value.
Intangible assets The acquirer should recognise an intangible asset of the acquiree at the date of acquisition provided that it meets the defi nition of an intangible asset provided by IAS 38 IntangibleAssets, and that it can be measured reliably. Intangible assets must be separable or they must arise from contractual or legal rights.
Monetary assets and liabilities The fair value should be based on the amounts due to be received or paid.
Provisions for restructuring Only the identifi able assets, liabilities and contingent liabilities of the acquiree that exist at the statement of fi nancial position date can be recognised separately by the acquirer as part of allocating the cost of the combination. IFRS 3 states that: ‘future losses or other costs expected to be incurred as a result of a combination are not liabilities incurred or assumed

STUDY MATERIAL F2138
CH
AN
GES
TO
GRO
UP
STRU
CTU
RES by the acquirer in exchange for control of the acquiree, and are not, therefore, included as
part of the cost of the combination’ (para. 28).
Contingent liabilities IFRS 3 requires that the contingent liabilities of an acquiree are recognised at fair value at the date of acquisition provided that their fair value can be measured reliably.
The following example illustrates the application of the requirements to incorporate fair value.
7.3.3 Application of fair value adjustments
Example 7.B
The statement of fi nancial positions of Sea and its subsidiaries River and Stream as at 31 March 20X0 – the accounting reference date for all three entities – are given below:
Sea River StreamASSETS $’000 $’000 $’000 $’000 $’000 $’000 Non-current assets Intangible assets 5,000 Tangible assets 41,000 30,000 20,000Investments 17,000
58,000 30,000 25,000 Current assets Inventories 8,000 6,000 4,000Receivables 7,000 5,250 1,500Cash 2,000 500 300
17,000 11,750 5,800 75,000 41,750 30,800
EQUITY AND LIABILITIES Equity: Issued capital ($1 shares) 20,000 17,000 12,000 Share premium account 15,000 1,500 Retained earnings 11,600 18,450 5,948
46,600 35,450 19,448 Non-current liabilities Long-term loans 20,000 8,052 Current liabilities Trade payables 5,200 4,000 5,752 Income tax 3,200 2,300 2,600Provision – – 3,000
8,400 6,300 11,352 75,000 41,750 30,800
Notes1. Sea subscribed for 100% of the issued capital of River on the date of its incorporation. No changes have
taken place to the issued share capital of River since that date.2. River supplies a component that is used by Sea in its manufacturing process. River applies a 20% mark-up
to the cost of manufacture of the component to arrive at the selling price to Sea. At 31 March 20X0 the inventories of Sea included $600,000 in respect of components purchased from River.
3. Intra-group trading is meant to cease on 25 March each year to enable agreement of intra-group balances at the year-end. On 24 March 20X0 Sea made a payment of $200,000 to River in respect of compo-nents purchased in February 20X0. This payment cleared the balances due for purchases up to February 20X0. Purchases of the component from 1 March to 24 March 20X0 by Sea amounted to $180,000. This amount was included in the payables of Sea and the receivables of River at 24 March 20X0. On 30

139FINANCIAL MANAGEMENT
CH
AN
GES TO
GRO
UP STRU
CTU
RESMarch 20X0, contrary to normal practice, River despatched goods having an invoiced price of $150,000 and entered the transaction in its books. The transaction was not recorded by Sea in its statement of fi nan-cial position that is given above.
4. Following protracted negotiations the directors of Sea concluded an agreement whereby Sea acquired 9 million $1 shares in Stream on 31 March 20X0. The terms of the acquisition were that Sea would issue two new $1 shares for every three shares acquired in Stream. On 31 March 20X0 the market value of a $1 share of Sea was $3. The share issue by Sea on 31 March 20X0 is not refl ected in the statement of fi nan-cial position of Sea that appears above.
5. The intangible non-current assets of Stream at 31 March 20X0, consist of the estimated value of a brand that is associated with the entity. This estimate has been made by the directors and no reliable external esti-mate of the market value of the brand is available.
6. Relevant details of tangible non-current assets of Stream at 31 March 20X0 are:
Description Statement of fi nancial position carrying value
Market value Depreciated replacement cost
Recoverable amount
$’000 $’000 $’000 $’000Property 10,000 12,000 Not given 13,500Plant 10,000 Not given 11,000 14,000
7. Inventories of Stream at 31 March 20X0 comprise:● Obsolete inventory (statement of fi nancial position value: $500,000). This inventory has a net realis-
able value of $300,000.● The balance of inventory (statement of fi nancial position value: $3,500,000). This inventory has a net
realisable value of $4,200,000. A reasonable profi t allowance for the sale of the inventory would be $400,000.
8. The provision of $1 million in the statement of fi nancial position of Stream is against the reorganisation costs expected to be incurred in integrating the entity into the Sea group. These costs would not be necessary if Stream were to remain outside the group. Although the plan was agreed by the board of directors before 31 March 20X0, it was not made known to those affected by the plan until after 31 March 20X0.
9. No impairment of the goodwill on acquisition of Stream has taken place.
Requirements(a) Calculate the goodwill that arises on the acquisition of Stream by Sea on 31 March 20X0, providing a brief
explanation for each calculation.(b) Prepare the consolidated statement of fi nancial position of Sea as at 31 March 20X0.
Solution(a) Goodwill on consolidation of Stream
1. Fair value of investment by Sea:
923
3 00 18 million � � �$ . $ million
2. Fair value of net assets of Stream as at 31 March 20X0:
Asset Fair value Reason$’000
Intangible asset – No ascertainable market valueProperty 12,000 Market value – less than recoverable amountPlant 11,000 Depreciated replacement cost – less than
recoverable amountObsolete inventory 300 Net realisable value (no profi t allowance)Other inventory 3,800 Net realisable value less profi t allowanceOther current assets 1,800 Monetary assets that are ‘short term’Trade payables (5,752) A short-term liability at carrying valueTaxation (2,600) As aboveProvision – Prohibited by IFRS 3 – also per IAS 37
a ‘constructive obligation’ does not exist at the statement of fi nancial position date
Net assets at FV 20548

STUDY MATERIAL F2140
CH
AN
GES
TO
GRO
UP
STRU
CTU
RES 3. Goodwill calculation:
$18,000,000 � (75% � $20,548,000) � $2,589,000
(b) Consolidated statement of fi nancial position of Sea as at 31 March 20X0Note: Unless otherwise indicated, the fi gures are a simple aggregation of the balance of Sea, River and Stream – with fair-value adjustments as per part (a).
$’000Goodwill on consolidation – from part (a) 2,589Tangible non-current assets 94,000Inventory (W1) 18,125Receivables (W2) 13,420Cash 2,800
130,934Issued capital (W4) 26,000Share premium (W4) 27,000Retained earnings (W5) 29,925
82,925Non-controlling interest (W6) 5,137
88,062Loan 20,000Trade payables (W3) 14,772Taxation 8,100
130,934
Workings1. Consolidated inventory fi gure
$’000Sea � River � Stream 18,100Inventory in transit 150Unrealised profi t on goods in inventory (20/120 � $60) (100)Unrealised profi t on inventory in transit (25)Per consolidated statement of fi nancial position 18,125
2. Consolidated receivables fi gure
Sea � River � Stream 13,750Amount owed by Sea per River’s accounts (330)Per consolidated statement of fi nancial position 13,420
3. Consolidated trade payables fi gure
Sea � River � Stream 14,952Amount owed to River per Sea’s accounts (180)Per consolidated statement of fi nancial position 13,420
4. Consolidated issued capital and share premium Sea only � the fi gure in the CBS refl ect the issue of six million $1 shares at a price of $3.5. Retained earnings
Sea 1 River (Stream all pre-acquisition) 30,050Unrealised profi t on inventory (W1) (125)Per consolidated statement of fi nancial position 29,925
6. Non-controlling interest
25% � net assets @ fair value (as part (a)) � 25% � $20,548,000 � $5,137,000
Recording movements in fair value adjustmentsThe acquisition of Stream was at the end of the year so there was no movement in respect of the non-current assets. Where depreciable assets have had uplift in value on acquisition the movement should represent the cumulative additional depreciation the group will have charged from the acquisition date to the statement of fi nancial position date. It is the net

141FINANCIAL MANAGEMENT
CH
AN
GES TO
GRO
UP STRU
CTU
RESbalance (FV at acquisition date less movement) that should be included in group non-current assets and the non-controlling interest calculation. The retained earnings fi gure will be adjusted for the cumulative movement.
Example 7.C
The fair value adjustment at 31 December 20X6 for non-current assets was $500,000 and the depreciation policy of the group was 20% straight line. Let’s consider the impact of this as at 31 December 20X8.
At acquisition date 31 December 20X6
Movement At reporting date 31 December 20X8
$’000 $’000 $’000Non-current assets 500 (200) 300
The additional depreciation charged on the uplift in value is $100,000 per annum. The impact on the statement of fi nancial position will be as follows:
● $500,000 will be included in the goodwill calculation as the fair value adjustment at the date of acquisition
● $300,000 will be added to the net assets for non-controlling interest calculation● $300,000 will be added to consolidated non-current assets● $200,000 will be deducted from consolidated retained earnings
7.4 Piecemeal acquisitions 7.4.1 General principles Up until this point, the explanations and exercises have assumed that an investment is made in a subsidiary or associate in a single transaction. While this is often the case in practice, it is also quite common for an acquisition to consist of two or more investments made on different dates. This process, involving successive purchases, is sometimes referred to as ‘ piecemeal acquisition ’ .
IFRS 3 prescribes the following treatment for a business combination achieved in stages: ‘ . . . each exchange transaction shall be treated separately by the acquirer, using the cost of the transaction and fair value information at the date of each exchange transaction, to determine the amount of any goodwill associated with that transaction. This results in a step-by-step comparison of the cost of the individual investments with the acquirer’s interest in the fair values of the acquiree’s identifi able assets, liabilities and contingent liabilities at each step ’ .
A further investment transaction to acquire the shares of another entity may involve any of the following:
● increasing a stake so that an entity changes from a simple investment to a subsidiary; ● increasing a stake in an entity that is already a subsidiary; ● increasing a stake so that an entity changes from an associate to a subsidiary;
In the next section of the chapter, a detailed example is examined which involved the increase of a stake in an entity that is accounted for as a simple investment to a subsidiary. It should be noted that the principles involved in changing from an associate are the same as explained below.
The following worked example assumes that the investment held in the investor’s own accounts is accounted for in accordance with IAS 39 Financial Instruments: recognition and measurement. This area is covered in depth in Chapter 11, however to allow effective illus-tration, the accounting treatment that is adopted is fully explained in the example below.

STUDY MATERIAL F2142
CH
AN
GES
TO
GRO
UP
STRU
CTU
RES 7.4.2 Piecemeal acquisitions: increasing a stake
from a simple investment to a subsidiary
Example 7.D
The simplifi ed income statements for Tiny and its investee entity, Teeny, for the year ended 31 December 20X8, together with simplifi ed statements of fi nancial position at that date, are as follows:
Statements of fi nancial position as at 31 December 20X8
Teeny Tiny $’000 $’000
Investment in Tiny 21,800 Non-current assets 15,000 21,000 Current assets 11,200 9,000
48,000 30 ,000 Issued capital ($1 shares) 12,000 15,000 Retained earnings 29,000 12,000
41,000 27,000 Current liabilities 7,000 3,000
48,000 30,000
Income statements for the year ended 31 December 20X8
Teeny Tiny $’000 $’000
Revenue 18,000 6,000Costs (12,000) (4,000) Profi t before tax 6,000 2,000 Income tax (1,500) (500) Profi t for the period 4,500 1,500
Investment in Tiny● Three million shares on 31 December 20X2 when the retained earnings of Tiny were $7.5 million. Although
this gave Teeny a 20% equity holding, there was one controlling shareholder and as a result Teeny was una-ble to exert signifi cant infl uence over the operating and fi nanicial policies of Tiny. The investment was therefore held as a simple investment in the consolidated fi nancial statements. The cost of the investment was $5.4 million.
● Six million shares on 30 June 20X8 when the retained earnings of Tiny were $11.25 million. The cost of investment was $15 million.
Fair value of net assetsThe fair value and book values of Tiny’s net assets on 31 December 20X2 were the same except for a non-current asset of land (non-depreciable). The fair value of the land exceeded its book value by $400,000.
The fair value and book values of Tiny’s net assets on 30 June 20X8 were the same except for the same non-current asset of land. The fair value of the land now exceeded book value by $600,000.
Treatment of the investmentThe investment in Tiny was accounted for in accordance with IAS 39. It was classifi ed as an available for sale asset and held at fair value from its acquisition. The gains resulting from the fair value assessments totalled $1.2 million up to 30 June 20X8. A further $200,000 was recognised for the 6 months to 31 December 20X8. In line with IAS 39 the gains have been recognised in equity.
The standard requires that any gains recognised at the date of derecognition be transferred to the profi t for the period.
The non-controlling interest is measured at the date of acquisition as the proportionate share of the fair value of the net assets of the business.
RequirementPrepare the consolidated statement of fi nancial position (SOFP) for the Teeny Group as at 31 December 20X8.

143FINANCIAL MANAGEMENT
CH
AN
GES TO
GRO
UP STRU
CTU
RESSolutionThe fi rst investment gave Teeny a 20% holding but without signifi cant infl uence. The second investment resulted in an increase in the stake to 60 per cent halfway through the year ended 31 December 20X8. This is the point where Teeny gained control over Tiny.
IFRS 3 (revised) requires that the fair value of the net assets be assessed, only at the date that control is gained. The uplift of $600,000 should therefore be included in the net assets acquired. The workings illustrate the point.
Teeny Group: Consolidated statement of fi nancial position as at 31 December 20X8
$’000 Goodwill (W1) 5,490 Non-current assets (15 � 21 � 0.6) 36,600 Current assets (11.2 � 9) 20,200 62,290 Issued capital ($1 shares) 12,000 Retained earnings (W2) 29,250
41,250 Non-controlling interest (W3) 11,040
52,290 Current liabilities (7 � 3) 10,000 62,290
Workings 1. Goodwill on consolidation
Calculated at the date control is gained:
60% stake $’000 $’000
Consideration transferred (paid for 40% stake)
15,000
Fair value of previously held interest of 20% (FV at date control is gained)
6,600
Net assets at date of acquisition: Issued capital 15,000 Retained earnings 11,250 Fair value uplift 600
26,850 Group share (60%) (16,110) Goodwill 5,490
2. Consolidated retained earnings as at 31 December 20X8 Retained earnings:
Teeny Tiny$000 $000
Retained earnings as per SOFP 29,000 12,000Profi t on derecognition of AFS investment (W3) 1,200Retained earnings at date control gained 11,250
750Share of post-acq (60% � $750) 450Less FV gains recognised in Teeny’s own retained earnings ($1,200 � $200)
(1,400)
Consolidated retained earnings 29,2503. From the group’s perspective the 20% investment is derecognised at the date that control is gained, i.e. 30
June 20X8. On derecognition the gains up to that date must be included in the consolidated retained earn-ings. We must remember, however to remove the total gains of $1,400 (up to 31 December 20X8) that would have been included in Teeny retained earnings to avoid double counting.
4. Non-controlling interest40% � net assets of Tiny at 31 December 20X840% � ($27,000 � FV adj 0.6) � $11,040
The NCI in the SOFP is based on the % holding at the year end, as the balance sheet is intended to show the position of the group at the year end date.

STUDY MATERIAL F2144
CH
AN
GES
TO
GRO
UP
STRU
CTU
RES The consolidated income statement is relatively straightforward:
Teeny Group: Consolidated income statement for the year ended 31 December 20X8
$’000 Revenue (18 � 6) 24,000 Costs (12 � 4) (16,000) Profi t from operation 8,000Gain on derecognition of AFS investment 1,200Profi t before tax 9,200 Income tax (1.5 � 0.5) (2,000) Profi t for the period 7,200 Attributable to: Equity holders of the parents 6,750 Non-controlling interest (W) 450
7,200
WorkingNon-controlling interest
($1.5 m � 6/12 � 40%) � ($1.5 m � 6/12 � 20%) � $450,000
The calculation of the NCI in the consolidated income statement is time apportioned as the income statement shows the profi ts accruing throughout the year.
7.4.3 Piecemeal acquisitions: from associate to subsidiary
Where a piecemeal acquisition takes a stake from that of associate to a subsidiary, the prin-ciples of the accounting treatment remain the same as explained in Section 7.4.2. The fair value of the investment previously held in this case would be the carrying value of the associate. The date that control is gained is the trigger for any fair value adjustment for the net assets of the subsidiary acquired.
7.4.4 Piecemeal acquisitions: increasing a controlling interest
The treatment is different where the parent already holds a controlling interest in the sub-sidiary as it is merely increasing this interest. No gain or loss on derecognition is recorded, instead it is treated as a transaction between owners and any adjustment is to parent’s equity (the parent’s interest has increased and the non-controlling interest has decreased).
The calculation would be as follows:FV of consideration paid (X)Decrease in NCI in net assets at date of acquisition XDecrease in NCI goodwill (only if NCI is held at FV and goodwill has been calculated on their share)
X
� adjustment to parent’s equity (X)
Example 7.E
Using the details of example 7D. Teeny currently holds 60% of the equity shares and purchases a further 3 million equity shares in Tiny at a cost $5.5m on 30 June 20X9. The net assets of Tiny at that date were $28m.
The adjustment to equity in respect of this additional investment is:
$00FV of consideration paid (5,500)Decrease in NCI in net assets at date of acquisition (20% � 28 m) 5,600Adjustment to parent’s equity (100)
This will be credited to retained earnings in the period.

145FINANCIAL MANAGEMENT
CH
AN
GES TO
GRO
UP STRU
CTU
RES
7.5 Disposals in the periodThe accounting for disposals in the period depends on the amount of the investment that is being sold. There are four possible scenarios:
1. Full disposal2. Disposal resulting in a subsidiary becoming an associate3. Disposal resulting in a subsidiary becoming a trade investment4. Disposal resulting in the controlling interest being retained
7.5.1 Accounting treatmentFull and partial disposalsPartial disposals in the accounting period will usually still require all the basic consolida-tion adjustments to be made if the group accounts are to be prepared. Where the classifi ca-tion of the investment changes in the group accounts the calculations will include:
● Calculating consolidated profi t/loss on the disposal, which will be included in the group income statement:
Where the parent loses control of a subsidiary it should: ● Derecognise the assets and liabilities of the subsidiary (including goodwill) at the
date control is lost. ● Derecognise any balance on NCI in the former subsidiary at the date control is
lost. ● Recognise the fair value of the consideration received (proceeds received on dis-
posal). ● Recognise any investment retained (associate or trade investment) at fair value at
date control is lost (this FV will effectively provide a transfer value which will act as the opening cost for investment in associate or trade investment. The loss of control triggers a fair value assessment for the investment retained.
● Reclassify any gains recognised previously through other comprehensive income relating to the investment, to profi t or loss, for example:
❍ A revaluation gain of the subsidiary previously recorded in OCI – the whole of this gain can be realised at the date control is lost.
❍ A gain recorded in the parent’s individual fi nancial statements within equity and included in OCI, on the available for sale investment – can be transferred from equity to profi t or loss on the date that control is lost.
● Recognise any resulting gain or loss in profi t or loss attributable to the parent.
● Time apportioning the calculations for subsidiary, associate and trade investment depending on the level of investment is retained.
Disposal where control is retainedA disposal of part of an investment where the controlling interest is retained is accounted for as an adjustment to parent’s equity. No gain or loss on disposal is recorded. It is a transaction between owners (the parent and the non-controlling interest) similar to the treatment adopted for increases in controlling interests in piecemeal acquisitions. Any dif-ference between the consideration received and the increase in the NCI amount is recog-nised directly in the equity and attributed to the owners of the parent.

STUDY MATERIAL F2146
CH
AN
GES
TO
GRO
UP
STRU
CTU
RES The table below summarises what will be required – read this through carefully and
think about each box before working through the example below, a lot of what it says you will know by this stage in your studies:
Consolidated income statement /TCI Consolidated statement of fi nancial position
Full disposal ● Consolidate sub and show NCI up to date of disposal
● No consolidation as disposed of at year end date
● Include profi t or loss on disposalSub to associate ● Consolidate sub and show NCI
up to date of disposal● Calculate FV of remaining
investment (this will act as opening value of investment)
● Include profi t or loss on disposal ● The investment is equity accounted at year end date
● Equity account for associate from disposal date to year end (time apportion results)
Sub to trade investment ● Consolidate sub and show NCI up to date of disposal
● Calculate FV of remaining investment (this will act as opening cost of investment)
● Include profi t or loss on disposal ● Account for investment under IAS 39.
● Include dividend income from date of disposal to year end date
Sub to reduced sub ● Full consolidation for whole period ● Full consolidation● Time apportion the NCI based on %
holding � number of months● NCI at % held at year end
date● No profi t or loss on disposal ● Calculate adjustment to
parent’s equity
The following example illustrates the treatment for a complete disposal and for a partial disposal resulting in an associate.
Example 7.F
The following extracts are from the draft accounts of A Group. The fi gures presented for A represents A and its fully owned subsidiary (goodwill for this subsidiary is fully impaired). The extracts shown for B are for the year to 31 December 20X8. None of these fi gures have yet been included in the group, which is why the fi gures for A Group are still showing an investment in B.
Extracts from draft income statements A Group B$’000 $’000
Revenue 155,500 25,800Operating costs (97,750) (13,900)Profi t before tax 57,750 11,900Income tax (25,250) (4,300)Profi t for period 32,500 7,600
Extracts from draft statements of fi nancial position
A Group B
$000 $000Investment in B (held at cost) 11,000 -Other assets 83,400 22,000
94,400 22,000Equity and liabilitiesShare capital 30,000 10,000

147FINANCIAL MANAGEMENT
CH
AN
GES TO
GRO
UP STRU
CTU
RESRetained earnings 54,400 10,000
84,400 20,000Liabilities 10,000 2,000
94,400 22,000
Additional information:1. A owns 80% of the 10 million equity shares of B, an unlisted entity, which it purchased for £11 m when the
retained earnings were $1.4 m. There has been no goodwill impairment since the date of acquisition.2. The NCI of B is valued at the proportionate share of the fair value of the net assets.3. B is an unlisted entity and the fair value of the investment cannot be reliably measured. As a result it is classi-
fi ed as an available for sale investment and is held at cost in the individual accounts of A.
RequirementsPrepare the consolidated statement of income and consolidated statement of fi nancial position for A group assuming the following scenarios:(a) A Group sells its entire shareholding in B for $18.9 million on 1 October 20X8. Tax arising on the sale
amounts to $1.3 million.(b) A Group sells 5,000 of its 8,000 shares in B for $14 million on 1 October 20X8. Tax arising on the sale
amounts to $1 million.(c) A Group sells 1,000 shares in B for $1.9 million on 1 October 20X8.
The junior accountant who was drafting the accounts was unsure how to record the disposal so none of the entries have been processed.
Solution(a) The sale will be recorded in A’s own accounts as:
Dr Bank $18,900Cr Investment $11,000Cr Tax liability $1,300Cr Profi t on sale $6,600
This will be the profi t in A’s own accounts and these entries are included in the consolidated fi gures below, calcu-lated as proceeds less carrying value. The group profi t on sale however will be calculated on the group’s share of the carrying value of the subsidiary. See below.
Consolidated income statement for A Group for year ended 31 December 20X8
$Revenue ($155,500 � (9/12 � $25,800)) (W1) 174,850Operating costs ($97,750 � (9/12 � $13,900)) (108,175)Profi t from operations 66,675Profi t on disposal of investment (W2) 2,540Profi t before tax 69,215Income tax ($25,250 � (9/12 � $4,300) � 1,300 tax on disposal (29,775)Profi t for the period 39,440Attributable to:Owners of the parent 38,300Non-controlling interest (W3) 1,140
B is not a subsidiary at the year end date and so the assets and liabilities of B are not included in the group SOFP.
Consolidated statement of fi nancial position for A group as at 31 December 20X8
$Assets ($83,400 � proceeds $18,900) 102,300Equity and liabilitiesShare capital 30,000Retained earnings (W4) 61,000
91,000Liabilities ($10,000 � tax on gain $1,300) 11,300
102,300

STUDY MATERIAL F2148
CH
AN
GES
TO
GRO
UP
STRU
CTU
RES Workings
1. B was a subsidiary until 30 September 20X8 and so the income statement has been consolidated including 9 months of B’s trading.
2. Goodwill on acquisition
$’000 $’000FV of consideration transferred 11,000Less share of FV of the net assets acquired:Share capital 10,000Retained earnings at acquisition 1,400
11,400Group share 80% (9,120)Goodwill on acquisition 1,880
3. Consolidated profi t on disposal of investment
$’000 $’000FV of consideration received (proceeds) 18,900Less share of FV of the consolidated carrying value of the sub at the date of disposal: Share capital 10,000Retained earnings at 30 December 20X8 10,000Less earnings from 1 Oct to 31 Dec (3/12 � 7600) (1,900)
18,100Group share 80% (14,480)Goodwill (W2) (1,880)Consolidated profi t on disposal 2,540
4. Non-controlling interest
20% � B’s profi t for fi rst 9 months � 20% � ($7,600 � 9/12) � 1,140.5. Consolidated retained earnings
A$’000
As per SOFP 54,400Plus profi t on sale (in individual accounts – as was not recorded in the retained earnings of A)
6,600
61,000(b) A Group sells 5,000 of its 8,000 shares in B for $14 million on 1 October 20X8. Tax arising on the sale
amounted to $1 million.The sale will be recorded in A’s own accounts as:
Dr Bank $14,000Cr Investment (50/80 � 11,000) $6,875Cr Tax liability $1,000Cr Profi t on sale $6,125
This will be the profi t in A’s own accounts and these entries are included in the consolidated fi gures below, calcu-lated as proceeds less carrying value. The group profi t on sale however will be calculated on the group’s share of the carrying value of the subsidiary. See below.
B was a subsidiary for 9 months and an associate for the remaining 3 months. The consolidated income state-ment below refl ect that.
Consolidated income statement for A Group for year ended 31 December 20X8
$Revenue ($155,500 � (9/12 � $25,800)) (W1) 174,850Operating costs ($97,750 � (9/12 � $13,900)) (108,175)Profi t from operations 66,675Share of profi t of associate 30% � ($7,600 � 3/12) 570Profi t on disposal of investment (W3) 1,765Profi t before tax 69,010Income tax ($25,250 � (9/12 � $4,300) � 1,000 tax on disposal (29,475)Profi t for the period 39,535Attributable to:Owners of the parent 38,395Non-controlling interest (W4) 1,140

149FINANCIAL MANAGEMENT
CH
AN
GES TO
GRO
UP STRU
CTU
RESB is not a subsidiary at the year end date and so the assets and liabilities of B are not included in the group SOFP. The 30% shareholding retained is equity accounted.
Consolidated statement of fi nancial position for A group as at 31 December 20X8
$Assets ($83,400 � proceeds $14,000) 97,400Investment in associate (W5) 4,695
102,095Equity and liabilitiesShare capital 30,000Retained earnings (W6) 61,095
91,095Liabilities ($10,000 � tax on gain $1,000) 11,000
102,095Workings1. B was a subsidiary until 30 September 20X8 and so the income statement has been consolidated including
9 months of B’s trading.2. Goodwill on acquisition
$’000 $’000FV of consideration transferred 11,000Less share of FV of the net assets acquired:Share capital 10,000Retained earnings at acquisition 1,400
11,400Group share 80% (9,120)Goodwill on acquisition 1,880
3. Consolidated profi t on disposal of investment
$’000 $’000FV of consideration received (proceeds) 14,000Plus FV of 30% retained (30/80 � $11m) 4,125Less share of FV of the consolidated carrying value of the sub at date control is lostShare capital 10,000Retained earnings at 30 December 20X8 10,000Less earnings from 1 Oct to 31 Dec (3/12 � 7600) (1,900)
18,100Group share 80% (14,480)Goodwill (W2) (1,880)Consolidated profi t on disposal 1,765
4. Non-controlling interest
20% � B’s profi t for fi rst 9 months � 20% � ($7,600 � 9/12) � 1,140.5. Investment in associate
$’000Cost of investment – amount transferred to investment in associate on disposal (30/80 � $11m) 4,125Plus group share of post acquisition retained earnings (30% � $7,600 � 3/12) 570
4,6956. Consolidated retained earnings
Group
Parent retained earnings as per SOFP 54,000Plus profi t on sale not yet recorded 6,125Plus post-acquisition retained earnings of associate (30% �$7,600 � 3/12) 570
61,095

STUDY MATERIAL F2150
CH
AN
GES
TO
GRO
UP
STRU
CTU
RES (c) A Group sells 1,000 shares in B for $1.9 million on 1 October 20X8.
Adjustment to parent’s equity on disposal of 1,000 shares $000FV of consideration received (1,900)Increase in NCI in net assets at date of disposal (10% � $18,100) 1,810Adjustment to parent’s equity (90)
The $90,000 will be credited to A Group’s retained earnings.
Disposal resulting in a trade investmentThe principles are the same as those adopted for the disposal resulting in an associate. The FV of the inter-est retained forms the cost transferred as the opening value of the investment e.g. equivalent cost of retaining 1,000 shares in the example above would result in $1,800,000 being transferred to cost of investment. The gain of $175,000 ($1,800,000 less $1,625,000 (1,000/8,000 � $13 million)) would be recognised. The investment would then be accounted for in accordance with IAS 39 Financial instruments: recognition and measurement.
Disposals and IAS 39 Financial instruments: recognition and measurementThe above examples have been slightly simplifi ed for illustrative purposes. The treatment of the investments in the parent’s own accounts will be in accordance with IAS 39. IAS 27 requires that where a parent loses control of a subsidiary, it will be treated as a disposal of an IAS 39 investment. If gains on that investment have, to date, been recognised through other comprehensive income (i.e. it is classifi ed as an available for sale asset in the parent’s own accounts) then all previously recognised gains will be reclassifi ed through the income statement and included in realised retained earnings.
IAS 39 is covered in depth in Chapter 11 and a full example will be incorporated in the revision section of this study system.
7.5.2 Interim dividends paid in the year of disposalWere a dividend to be paid in the year of disposal occurs on a date before the shares were disposed of, the gain on disposal will change as the net assets of the subsidiary at the date of disposal will have reduced by the amount of the dividend paid.
The profi ts (represented by an increase in net assets) out of which the dividend was paid would have been transferred from the subsidiary to the parent entity, and would form part of the parent’s reserves. The fact that a subsequent disposal of shares takes place does not alter the fact that the dividend transfer has already taken place.
It is important to compare the date of disposal with the date of any interim dividend payment, to see whether the disposal preceded the interim payment. In the previous exam-ple where full disposal occurs, if B paid a dividend on 30 September 20X8 of $4,000 then the calculations will be as follows:
Step 1: Calculate profit or loss on disposalThe profi t on disposal in Wolf ’s own fi nancial statements remains the same. However, the profi t on disposal in the consolidated fi nancial statements differs because the net assets at the date of disposal are lower following the dividend payout.
The calculation is now as follows:
WorkingNet assets of B at the date of disposal
$’000Net assets at date of disposal (calc above) 18,100Dividend paid 30 Sept 20X8 (4,000)Revised NA 1 Oct 20X8 14,100

151FINANCIAL MANAGEMENT
CH
AN
GES TO
GRO
UP STRU
CTU
RESProfi t on disposal in the consolidated fi nancial statements:
$’000Sale proceeds 18,900Less: share of net assets at date of disposal [$14,100 (W1) � 80%] (11,280)Less goodwill (1,800)Consolidated profi t on disposal 5,820
The gain recorded in part (a) in Example 7.F above was $2,620 based on share of consoli-dated net assets of $18,100. If a dividend is paid by the subsidiary immediately prior to the disposal then the profi t reported increases as the net assets have reduced.
7.6 Business reorganisationsMotives for reorganisationReorganisations are likely to be undertaken in the following circumstances:
● There is a debit balance on retained earnings.● Reorganisation is forced by a group of stakeholders, for example, by lenders where debt
covenants are breached or are in danger of breach.● A group that has grown by haphazard acquisition requires an improved management
structure or a more logical hierarchy of ownership.● A new structure will facilitate fl otation.● A new structure will facilitate the disposal of an investment in a subsidiary.● Part of a business or of a group of entities is hived off into a separate group (this would
be an example of a ‘demerger’ arrangement).
In many jurisdictions entities are permitted to:
● reduce their share capital or share premium;● enter into a scheme of arrangement with their stakeholders;● liquidate an entity and transfer its business to a new entity;● purchase their own shares.
Any of these mechanisms may be involved in a reorganisation scheme.Little guidance on reconstructions is currently offered by international accounting stand-
ards. IFRS 3 Business combinations discusses reverse acquisitions relatively briefl y. Reverse acquisitions are a type of business combination where, for example, a business entity arranges to have itself ‘acquired’ by a smaller public entity as a means of obtaining a stock exchange listing. It is usually the case that entities have to build up a respectable record of regular and timely reporting in order to obtain a listing. Arranging for a reverse acquisition via a smaller public entity can be a short-cut to listing. IFRS 3 counsels careful considera-tion of the pertinent facts of the case when determining which party, in substance, is the parent. Although in this type of example legal form suggests that the smaller listed entity is the parent, it may be that the legal subsidiary is the acquirer, if it has control over the fi nan-cial and operating policies of the legal parent.
7.6.1 Future developmentsThe IASB’s project on business combinations is complete only as to phase I (which resulted in the issue of IFRS 3). More guidance on accounting for business combinations

STUDY MATERIAL F2152
CH
AN
GES
TO
GRO
UP
STRU
CTU
RES can be expected in due course in phase II of the project, and some of the issues relating
to reconstructions and demergers are likely to be covered in a future fi nancial reporting standard. These may include:
● Accounting for business combinations in which separate legal entities or parts of busi-nesses are brought together to form a joint venture. The IASB has discussed the possibil-ity of applying ‘fresh start’ accounting to such combinations. ‘Fresh start’ accounting is based on the principle that such business combinations result in a completely new entity. Therefore, the assets and liabilities of each of the combining entities should be recorded by the new entity at their fair value. Contrast this approach with the ‘purchase’ or ‘acqui-sition’ method of accounting that is set out in IFRS 3. ‘Purchase’ method accounting requires only that the net assets of a new subsidiary should be measured at fair value; the net assets of the parent continue to be measured in line with its existing policies. Therefore, in a typical group, consolidated net assets comprise net assets that have been brought in at fair value together with net assets at outdated values from earlier acquisi-tions and the net assets of the parent that may be valued at depreciated historical cost.
● Issues arising in respect of business combinations achieved by contractual arrangements only (i.e. not involving ownership). For example, business entities may be brought together by contractual arrangements to form a reporting entity that obtains dual listing on a stock exchange.
7.6.2 Intra-group reconstructionsIn this section we will consider four reconstruction scenarios that may occur within a group of entities.
The transfer of a shareholding in a subsidiary from one group entity to another
Example 7.G
Subsidiary moved downSuppose A, B and C have the following statement of fi nancial positions at the date of reconstruction. A’s invest-ments in B and C were made at the dates of incorporation of B and C.
A B C Consolidated$’000 $’000 $’000 $’000
Investment in B (8 m shares) 8,000Investment in C (4 m shares) 4,000Other net assets 9,000 12,000 9,000 30,000
21,000 12,000 9,000 30,000$1 equity shares 10,000 8,000 5,000 10,000Reserves 11,000 4,000 4,000 18,200
21,000 12,000 9,000 28,200Non-controlling interest (20% � $9 m) 1,800
21,000 12,000 9,000 30,000The investment in C is transferred to B by B issuing 3 million new shares to A in return for A’s investment in C.
The group structure before the reconstruction would be as follows:
B
100% 80%
C
A

153FINANCIAL MANAGEMENT
CH
AN
GES TO
GRO
UP STRU
CTU
RESThe group structure after the reconstruction would then be:
80%
100%
A
B
C
It should be clear that the overall effect on the A group is nil and the consolidated statement of fi nancial posi-tion would not change. Such a reorganisation might be appropriate if:
● the directors of A wished to change the operating and reporting structure of the group to reduce the number of direct subsidiaries and achieve a more ‘hierarchical’ style of management;
● the directors of A wished to create a sub-group to sell off as a separate economic entity.
Where the new owner of the transferred investment issues shares in exchange for the investment then the consoli-dation is made easier if the investment can be transferred across at its existing carrying value.
In the above example this means that B would take the investment in C at cost from A ($4 million). Since B issues 3 million $1 shares then the credit to share premium will be $1 million ($4 million–$3 million). The state-ment of fi nancial positions would be as shown below:
A B C Consolidated$’000 $’000 $’000 $’000
Investment in B 12,000Investment in C 4,000Other net assets 9,000 12,000 9,000 30,000
21,000 16,000 9,000 30,000$1 equity shares 10,000 11,000 5,000 10,000Share premium 1,000Reserves 11,000 4,000 4,000 18,200
21,000 16,000 9,000 28,200Non-controlling interest 1,800
21,000 16,000 9,000 30,000
Example 7.H
Subsidiary moved upSuppose D, E and F have the following statement of fi nancial positions at the date of incorporation (once again the investments are both made at the date of incorporation of the relevant entity).
D E F Consolidated$’000 $’000 $’000 $’000
Investment in E (8 m shares) 8,000Investment in F (3 m shares) 3,000Other net assets 8,000 10,000 7,000 25,000
16,000 13,000 7,000$1 equity shares 10,000 8,000 4,000 10,000Reserves 6,000 5,000 3,000 13,250
16,000 13,000 7,000 23,250Non-controlling interest (25% � $7 m) 1,750
16,000 13,000 7,000 25,000The initial group structure was:
75%
100%
D
E
F

STUDY MATERIAL F2154
CH
AN
GES
TO
GRO
UP
STRU
CTU
RES The group reconstruction transfers E’s shareholding in entity F to entity D and the group structure becomes:
E
100% 75%
F
D
A reconstruction of this type cannot be effected by entity D making a share issue to entity E in exchange for its investment in entity F. This is because entity E is entity D’s subsidiary and it is illegal for a parent to issue shares to its subsidiary. Therefore in these situations the investment would be transferred by entity E declaring a special dividend, known as a dividend in specie. The effect on the individual statement of fi nancial positions and on the consolidated statement of fi nancial position will be as shown below:
D E F Consolidated$’000 $’000 $’000 $’000
Investment in E 8,000Investment in F 3,000Other net assets 8,000 10,000 7,000 25,000
19,000 10,000 7,000 25,000$1 equity shares 10,000 8,000 4,000 10,000Reserves 9,000 2,000 3,000 13,250
19,000 10,000 7,000 23,250Non-controlling interest (25% � $7 m)
1,750
19,000 10,000 7,000 25,000This type of reconstruction might be appropriate if:
● the group wished to move to a ‘fl atter’ management style. The sub-subsidiaries could become ‘direct’ subsidiar-ies through a reorganisation;
● the group wished to dispose of the subsidiary (entity E in the above example) but keep the sub-subsidiary (entity F in the above example).
Note that the reserves of entity D are increased and the reserves of entity E reduced by the dividend in specie.This dividend is often very large in practice so the ‘paying’ entity might need to internally reconstruct its statement of fi nancial position (see the beginning of this unit) to create suffi cient distributable reserves (not necessary in the above example, though).
The addition of a new parent entity to the group● Suppose a group has a parent entity, P, that is a private entity. If the group is expanding
quickly it may wish to obtain a listing and so would need the ultimate parent to be a public limited entity. This could be achieved by incorporating a new parent public lim-ited entity that gained ownership of the shares in entity P by ‘purchasing’ them from the existing shareholders, probably by an issue of its own equity shares.
● One method of combining two separate economic entities is for the two entities to form a group that has a newly incorporated parent.
Example 7.I
Two separate existing groups, group A and group B, become a single group by the shareholders of the parents of the two individual groups exchanging their shares for shares in the new parent to create a group as shown below:
Group A
100% 100%
Group B
P

155FINANCIAL MANAGEMENT
CH
AN
GES TO
GRO
UP STRU
CTU
RESThe transfer of shares in one or more subsidiary undertakings of a group to a new entity that is not a group entity, but whose shareholders are the same as those of the group’s parentSuppose a parent entity, A, has a subsidiary, B. Entity A transfers its shares in entity B to a new entity, C, whose shareholders are the same as the shareholders of entity A. Entity C will typically issue equity shares to fi nance this reconstruction but to the shareholders of entity A rather than to the entity itself. The diagram below shows the change in the group structure.
SHAREHOLDERS
BEFORE
A
B
SHAREHOLDERS
AFTER
A C
B
It is clear that, as far as the ultimate shareholders are concerned, little has happened other than a wholly internal rearrangement of their shareholdings, perhaps to facilitate running companies A and B as separate economic entities. As far as the consolidated accounts of A are concerned, though, there has been a disposal of shares in B. The disposal has effectively been made to the shareholders of A so the reduction in net assets is treated as a distribution to the shareholders – known as a dividend in specie.
Example 7.J
A has two 100% subsidiaries, B and C, which it has owned since their incorporation. The statement of fi nancial positions of the three companies on 31 December 20X0 are as follows:
A B C$’m $’m $’m
Investment in B 50Investment in C 45Property, plant and equipment
60 65 70
Net current assets 30 32 25185 97 95
Share capital ($1 shares) 100 50 45Reserves 85 47 50
185 97 95
● On 31.12 . X0 A transfers its shares in C to a new entity, D. D issues 60 million $1 shares to the shareholdersof A.
● The net assets of the A group will be reduced by $95 million as a result of this disposal. This will be refl ected in the consolidated accounts as a distribution (a dividend in specie) of $95 million. The individual accounts of entity A will show a dividend in specie of $45 million (the cost of the investment). The consolidated statement of fi nancial position of the A group will no longer include any net assets of C and the individual statement of fi nancial positions will be as follows:
A B Consolidated$’m $’m $’m
Investment in B 50Investment in C NilTangible fi xed assets 60 65 125Net current assets 30 32 62
140 97 187
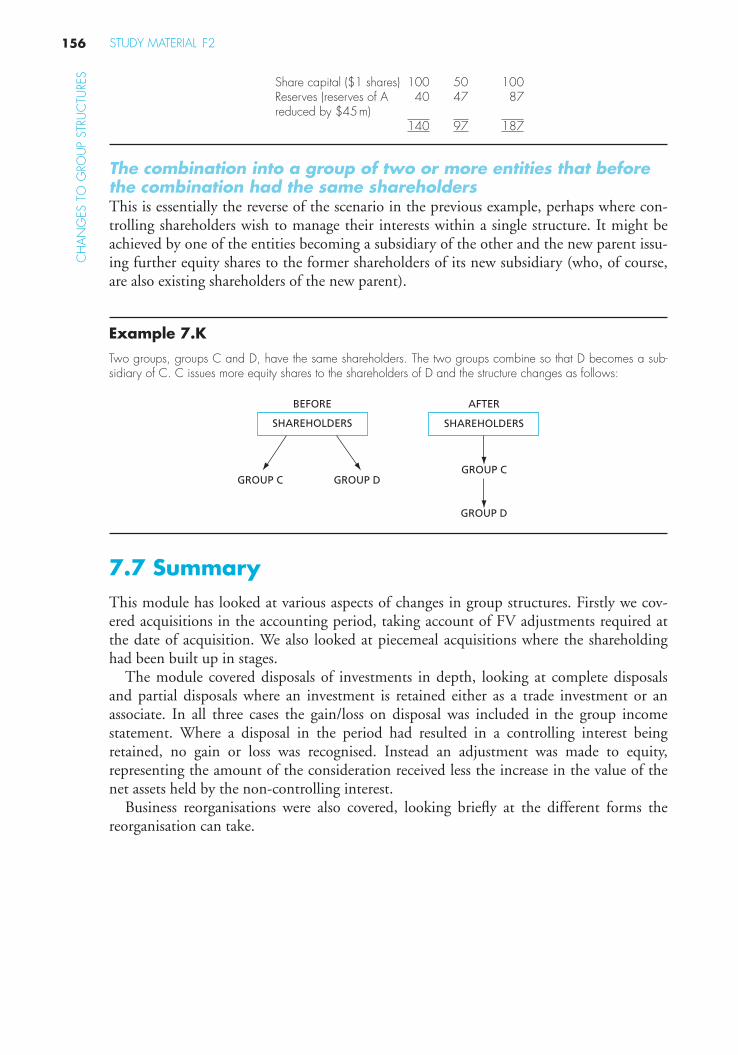
STUDY MATERIAL F2156
CH
AN
GES
TO
GRO
UP
STRU
CTU
RES
Share capital ($1 shares) 100 50 100Reserves (reserves of A reduced by $45 m)
40 47 87
140 97 187
The combination into a group of two or more entities that before the combination had the same shareholdersThis is essentially the reverse of the scenario in the previous example, perhaps where con-trolling shareholders wish to manage their interests within a single structure. It might be achieved by one of the entities becoming a subsidiary of the other and the new parent issu-ing further equity shares to the former shareholders of its new subsidiary (who, of course, are also existing shareholders of the new parent).
Example 7.K
Two groups, groups C and D, have the same shareholders. The two groups combine so that D becomes a sub-sidiary of C. C issues more equity shares to the shareholders of D and the structure changes as follows:
SHAREHOLDERS
BEFORE
SHAREHOLDERS
AFTER
GROUP C GROUP DGROUP C
GROUP D
7.7 SummaryThis module has looked at various aspects of changes in group structures. Firstly we cov-ered acquisitions in the accounting period, taking account of FV adjustments required at the date of acquisition. We also looked at piecemeal acquisitions where the shareholding had been built up in stages.
The module covered disposals of investments in depth, looking at complete disposals and partial disposals where an investment is retained either as a trade investment or an associate. In all three cases the gain/loss on disposal was included in the group income statement. Where a disposal in the period had resulted in a controlling interest being retained, no gain or loss was recognised. Instead an adjustment was made to equity, representing the amount of the consideration received less the increase in the value of the net assets held by the non-controlling interest.
Business reorganisations were also covered, looking briefl y at the different forms the reorganisation can take.

157
Revision Questions 7The list below provides details of what each question covers, to help with your revision of this area.
AcquisitionsQuestion 1 Preparation of a statement of fi nancial position (SOFP), including detailed fair value adjustments. (25 marks)
Question 2 Calculation and explanation of fair value adjustments. (10 marks)Question 3 Preparation of SOFP with a piecemeal acquisition and a FV adjustment.
(15 marks)
DisposalsQuestion 4 Calculation of profi t/loss on disposal (sub to trade investment). (5 marks)
Question 5 Calculation of profi t/loss on disposal (controlling interest retained. (5 marks)
Question 6 Preparation of income statement with disposal (sub to associate). (10 marks)
Question 7 Preparation of SOFP with disposal (sub to associate). (25 marks)
ReorganisationsQuestion 8 Preparation of SOFP after reorganisation (15 marks)
Question 1 The statements of fi nancial position of George and its subsidiary entities Zippy and Bungle at 30 June 20X3 (the accounting date for all three entities) are given below:
George Zippy Bungle $’000 $’000 $’000 $’000 $’000 $’000
ASSETS Non-current assets: Property, plant and equipment ( Note 3 ) 45,000 25,000 20,000 Financial assets ( Notes 1 and 2 ) 20,000 Nil Nil
65,000 25,000 20,000 Current assets: Inventories ( Notes 3 and 4 ) 18,000 12,000 11,000 Trade and other receivables ( Notes 3 and 4 ) 15,000 10,000 9,000
33,000 22,000 20,000 Total assets 98,000 47,000 40,000

CH
AN
GES
TO
GRO
UP
STRU
CTU
RES
REVISION QUESTIONS F2158
EQUITY AND LIABILITIES Equity: Issued ordinary share capital ($1 shares) 25,000 20,000 10,000 Share premium account 10,000 Nil 4,000 Retained earnings 24,000 8,000 9,300 59,000 28,000 23,300 Non-current liabilities Deferred tax ( Note 3 ) 2,000 1,000 1,500 22,000 6,000 1,500 Current liabilities Trade payables ( Note 4 ) 10,000 7,500 8,000 Tax payable 2,000 1,500 1,000 Bank overdraft 5,000 4,000 5,000 Provisions ( Note 3 ) Nil Nil 1,200 17,000 13,000 15,200 Total equity and liabilities 98,000 47,000 40,000
Notes to the statements of fi nancial position 1. On 1 July 20W0, the date of incorporation of Zippy, George subscribed for all the
ordinary shares of Zippy at par. 2. On 30 June 20X3, George purchased eight million $1 shares in Bungle. The terms of
the purchase consideration were as follows: (a) On 30 June 20X3, George issued three $1 ordinary shares for every four shares
purchased in Bungle. The market value of the ordinary shares at 30 June 20X3 was $4 per share.
(b) On 30 June 20X5, George will pay the former shareholders of Bungle $1 in cash for every share in Bungle they have purchased. This payment is contingent on the cumulative profi ts after tax of Bungle for the 2 years ending 30 June 20X5 being at least $3 million. At the date of carrying out the fair value exercise (see Note 3below), the directors of George considered it probable that this cash payment wouldbe made.
(c) No entries in respect of the purchase of shares in Bungle have been made in the statements of fi nancial position of George.
3. Following the acquisition of Bungle, the directors of George carried out a fair value exercise as required by IFRS 3 – Business Combinations . The following matters are rel-evant and all potential fair value adjustments are material:
(a) Property, plant and equipment comprise land and buildings and plant and machinery.At 30 June 20X3, the land and buildings had a carrying value of $12 million and a market value of $18 million. The plant and machinery had a carrying value of $8 million. All the plant and machinery was purchased on 30 June 20X0 and was being depreciated on a straight-line basis over eight years. No reliable estimate was available of the current market value of the plant and machinery, but at 30 June 20X3, the plant would have cost $22 million to replace with new plant.
(b) The inventory at 30 June 20X3 comprised: ● Finished goods which could be sold for $14.5 million. A reasonable profi t allow-
ance for the selling effort of the group would be $3 million. ● Finished goods that had been damaged and could only be sold for $100,000,
representing a signifi cant loss on sale.

CH
AN
GES TO
GRO
UP STRU
CTU
RES
159FINANCIAL MANAGEMENT
(c) Trade receivables includes an amount of $400,000 that the directors of George consider doubtful.
(d) The other provisions of Bungle comprise: ● $400,000 in respect of the closure of various retail outlets to which the direc-
tors of Bungle became committed prior to entering into acquisition negotiations with the directors of George.
● $800,000 in respect of the estimated cost of integrating Bungle into the George group. No detailed integration plans had been formulated by 30 June 20X3.
(e) The additional deferred tax that needs to be provided on the adjustments that are necessary as a result of the fair value exercise is a liability of $3 million.
4. George supplies a component to Zippy at cost plus a mark up of 20%. At 30 June 20X3, the inventories of Zippy included $1.5 million in respect of this component. At 30 June 20X3, the receivables of George showed an amount receivable from Zippy of $1.2 million, while the trade payables of Zippy showed an amount payable to George of $600,000. On 29 June 20X3, George sent a consignment of components to Zippy at an invoiced price of $600,000. The consignment was received and recorded by Zippy on 2 July 20X3.
Requirements (a) Compute the goodwill on consolidation of Bungle that will be shown in the consoli-
dated statement of fi nancial position of George at 30 June 20X3. Provide justifi cation for your fi gures where you consider this is needed. (10 marks)
(b) Prepare the consolidated statement of fi nancial position of George at 30 June 20X3. (15 marks)
(Total marks � 25)
Question 2 ABC is currently expanding its portfolio of equity interests in other entities. On 1 January 20X5, it made a successful bid for a controlling interest in DEF, paying a combination of shares and cash in order to acquire 80% of DEF’s 100,000 issued equity shares. The terms of the acquisition were as follows:
In exchange for each $1 ordinary share purchased, ABC issued one of its own $1 ordi-nary shares plus $1.50 in cash. In addition to the consideration paid, ABC agreed to pay a further $1 per share on 1 January 20X7, on condition that the profi ts of DEF for the year ended 31 May 20X6 will exceed $6,000,000. ABC’s directors consider that it is more likely than not that the additional consideration will be paid. The market value of a $1 share in ABC at 1 January 2005 was $3.50, rising to $3.60 at ABC’s 31 May 20X5 year end.
Legal costs were $40,000 and share issue costs associated with the deal were $20,000. The carrying value of DEF’s net assets at 1 January 20X5 was $594,000. Carrying value
was regarded as a close approximation to fair value, except in respect of the following:
1. The carrying value of DEF’s property, plant and equipment at 1 January 20X5 was $460,000. Market value at that date was estimated at $530,000.
2. DEF had a contingent liability in respect of a major product warranty claim with a fair value of $100,000.
3. The cost of reorganising DEF’s activities following acquisition was estimated at $75,000.

CH
AN
GES
TO
GRO
UP
STRU
CTU
RES
REVISION QUESTIONS F2160
4. DEF’s inventories included goods at an advanced stage of work-in-progress with a carry-ing value of $30,000. The sales value of these goods was estimated at $42,000 and fur-ther costs to completion at $6,000.
Requirement Calculate goodwill on the acquisition of DEF, in accordance with the requirements of IFRS 3 Business Combinations , explaining your treatment of the legal costs, share issue costs and reorganisation costs. (10 marks)
Question 3Extracts from the statements of fi nancial position as at 31 December 20X8 are presented below:
Statements of fi nancial positions as at 31 December 20X8 MC JDASSETS $000 $000Non-current assets 4,000 3,000Available for sale investments 3,440 –
7,440 3,000Current assets 1,720 2,000
9,160 5,000EQUITY AND LIABILITIESShare capital ($1 shares) 1,000 1,000Retained earnings 6,160 3,500
7,160 4,500LIABILITIES 2,000 500
9,160 5,000
Additional information
1. The available for sale investments relate to two acquisitions in JD made by MC. The details of the acquisitions are as follows:31 October 20X7 100,000 equity shares purchased for $500,000.30 June 20X8 500,000 equity shares purchased for $2,800,000.The retained earnings of JD at 30 June 20X8 totalled $3,000,000.The available for sale investments are accounted for in accordance with IAS 39 and
are held at fair value. The cumulative gains recognised in equity as at 30 June 20X8 totalled $100,000. A further $40,000 was recognised by 31 December 20X8.
2. The fair value of the net assets of JD was assessed at 30 June 20X8. The results showed an increase of $650,000 relating to plant and machinery. In line with group policy the related assets will be depreciated on a monthly basis over the remaining useful life, which is estimated at 5 years.
3. There has been no impairment of goodwill.
Requirement:Prepare the consolidated statement of fi nancial position as at 31 December 20X8 for the MC group.

CH
AN
GES TO
GRO
UP STRU
CTU
RES
161FINANCIAL MANAGEMENT
Question 4AMY, an entity with a 30 September year end, holds several investments in subsidiaries. On 1 April 20X6, it disposed of 35,000 of its 40,000 $1 shares in its subsidiary BNZ for $320,000. AMY had acquired the shares, which represented 80% of BNZ’s ordinary share capital, on 1 April 20X4 for $250,000, when BNZ’s reserves totalled $186,000. BNZ’s net assets at the date of disposal were $275,000. Since acquisition, there has been no impair-ment to goodwill. The fair value of the investment retained if $33,000.
Calculate the consolidated profi t or loss on disposal of the shares for inclusion in AMY’s fi nancial statements for the year ended 30 September 20X6. (4 marks)
Question 5Several years ago DVS acquired 75% of the ordinary share capital of EWT at a cost of $1.7 million. The fair value of the total net assets of EWT at the data of acquisition was $1.8 million. Net assets of EWT at 31 January 20X7 totalled $4.7 million. The non-controlling interest is valued at fair value and the resulting goodwill at the date of acquisi-tion on the NCI’s interest is $80,000. There has been no impairment of goodwill since the acquisition of the shares in EWT.
On that date DVS disposed of 10% of the ordinary share capital of EWT, leaving it holding 65% of EWT’s ordinary shares. The disposal proceeds were $900,000.
Calculate the adjustment ot parent’s equity as a result of this disposal.
Question 6RW holds 80% of the 1,000,000 ordinary shares of its subsidiary, SX. Summarised income statements of both entities for the year ended 31 December 20X4 are shown below:
RW SX$’000 $’000
Revenue 6,000 2,500Operating costs (4,500) (1,700)Profi t before tax 1,500 800Income tax (300) (250)Profi t for the period 1,200 550
RW purchased 800,000 of SX’s $1 shares in 20X3 for $3.2 million, when SX’s reserves were $2.4 million. Goodwill has been carried at cost since acquisition and there has been no subsequent impairment.
On 1 July 20X4, RW disposed of 500,000 shares in SX for $3 million. SX’s reserves at 1 January 20X4 were $2.9 million, and its profi ts accrued evenly throughout the year. RW is liable to income tax at 30% on any accounting profi ts made on the disposal of invest-ments. The fair value of the investment retained is $1.4 million.
The effects of the disposal are not refl ected in the income statements shown above.
RequirementPrepare the summarised consolidated income statement for RW for the year ended 31 December 20X4. (10 marks)

CH
AN
GES
TO
GRO
UP
STRU
CTU
RES
REVISION QUESTIONS F2162
Question 7The statement of fi nancial positions of AZ and two entities in which it holds substantial investments as at 31 March 20X6 are shown below:
AZ BY CX$’000 $’000 $’000 $’000 $’000 $’000
Non-current assets:Property, plant and equipment 10,750 5,830 3,300Investments 7,650 – –
18,400 5,830 3,300Current assets:Inventories 2,030 1,210 1,180Trade receivables 2,380 1,300 1,320Cash 1,380 50 140
5,790 2,560 2,64024,190 8,390 5,940
Equity:Share capital ($1 shares) 8,000 2,300 2,600Preference share capital – 1,000 –Retained earnings 10,750 3,370 2,140
18,750 6,670 4,740Current liabilities:Trade payables 3,520 1,550 1,080Income tax 420 170 120Suspense account 1,500 – –
5,440 1,720 1,20024,190 8,390 5,940
Notes1. Investments by AZ in BY
Several years ago AZ purchased 80% of BY’s ordinary share capital for $3,660,000 when the retained earnings of BY were $1,950,000. In accordance with the group’s pol-icy goodwill was recorded at cost, and there has been no subsequent impairment. At the same time as the purchase of the ordinary share capital, AZ purchased 40% of BY’s preference share capital at par. The remainder of the preference shares are held by several private investors. The preference shares are classifi ed as equity, in accordance with IAS 32 Financial Instruments: Presentation, because of the rights and conditions attaching to the shares.
2. Investment by AZ in CXSeveral years ago AZ purchased 60% of CX’s ordinary share capital for $2,730,000 when the retained earnings of CX were $1,300,000. Goodwill was recorded at cost and there has been no subsequent impairment. On 1 October 20X5 AZ disposed of 520,000 ordinary shares in CX, thus losing control of CX’s operations. However, AZ retains a signifi cant infl uence over the entity’s operations and policies. The proceeds of disposal, $1,500,000, were debited to cash and credited to a suspense account. No other accounting entries have been made in respect of the disposal. An investment gains tax of 30% of the profi t on disposal will become payable by AZ within the twelve months following the statement of fi nancial position date of 31 March 20X6, and this liability should be accrued. The investments made by AZ were in unlisted entities and were initially classifi ed as available for sale in AZ’s own

CH
AN
GES TO
GRO
UP STRU
CTU
RES
163FINANCIAL MANAGEMENT
accounts. The fair value of these investments were unable to be measured reliably and so continue to be held at cost in AZ’s accounts. CX’s reserves at 1 April 20X5 were $1,970,000. The entity’s profi ts accrued evenly throughout the year.
3. Additional informationNo fair value adjustments were required in respect of assets or liabilities upon either of the acquisitions of ordinary shares. The called up share capital of both BY and CX has remained the same since the acquisitions were made. All gains and losses on invest-ments held by AZ have been realised through profi t or loss in AZ’s own accounts.
4. Intra-group tradingDuring the year ended 31 March 20X6, BY started production of a special line of goods for supply to AZ. BY charges a mark-up of 20% on the cost of such goods sold to AZ. At 31 March 20X6, AZ’s inventories included goods at a cost of $180,000 that had been supplied by BY.
Requirements(a) Calculate the profi t or loss on disposal after tax of the investment in CX that will be
disclosed in:(i) AZ’s own fi nancial statements(ii) the AZ group’s consolidated fi nancial statements (6 marks)
(b) Calculate the consolidated reserves of the AZ group at 31 March 20X6. (5 marks)(c) Prepare the consolidated statement of fi nancial position of the AZ group as at 31
March 20X6.(14 marks)
(Total marks � 25)
Question 8The following statements of fi nancial position relate to P, Q, R and S as at 31 May 20X7 immediately before the transaction mentioned below:
P Q R S$’m $’m $’m $’m
Property, plant and equipment 3,500 550 60 90Investment in Q 900Investment in R 90Investment in S 50Net current assets 1,830 400 70 60Long-term loans (130) (30) (10) (5)
6,150 1,010 120 145Issued capital ($1 shares) 1,350 100 30 20Share premium account 1,550 100 10 2Retained earnings 3,250 810 80 105
6,150 1,010 120 145
The directors of P decided to reconstruct the group at 31 May 20X7. Under the scheme the existing group was split into two separate groups. This involved P disposing of its shareholding in Q to another company, E. In return, E issued 300 million shares to the shareholders of P.

CH
AN
GES
TO
GRO
UP
STRU
CTU
RES
REVISION QUESTIONS F2164
The following information relates to the dates of acquisition of the investments in group companies:
Investor Company acquired % acquired Balance on share premium
Balance on accumulated profi ts
$’m $’mP Q 100 100 250P S 60 20 90Q R 80 10 60
P’s investment in Q was made before the other two investments. All goodwill on consoli-dation had been written off as impaired by 31 May 20X6.
RequirementPrepare the consolidated statement of fi nancial position of the P and E groups as at 31 May 20X7 immediately after the group reconstruction has been put into effect.
(15 marks)

165
Solutions to Revision Questions
Solution 1 (a)
Step 1: Fair value of net assets acquired
Description Fair value Comment $’000
Land and buildings 18,000 Market value Plant and machinery 13,750 Depreciated replacement cost (5/8 � $22 m) Inventory 11,600 Selling price less profi t allowance
($11.5 m) � scrap value ($100,000) Receivables 8,600 Reduced by provision for doubtful
receivable Current liabilities (14,000) Book value Deferred tax (4,500) Book value plus $3 m Other provisions (400) $800,000 a post-acquisition item
33,050
Step 2: Fair value of consideration given
Shares: 8,000 � 3/4 � $4 � $24,000 Deferred cash: 8,000 � 0.873 � $6,984 Total $30,984
Step 3: Compute goodwill
$30,984 � (80% � FV of net assets acquired $33,050) � $4,544
(b) Consolidated statement of fi nancial position of George at 30 June 20X3
$’000 $’000 ASSETS Non-current assets Property, plant and equipment (45,000 � 25,000 � 18,000 � 13,750) 101,750 Goodwill (requirement a) 4,544
106,294 Current assets Inventories [18,000 � 12,000 � 11,600 � 250 (W1)] 41,350 Inventory in transit [600 � 100 (W1)] 500 Receivables (15,000 � 10,000 � 8,600 � 1,200) 32,400
74,250 Total assets 180,544
7
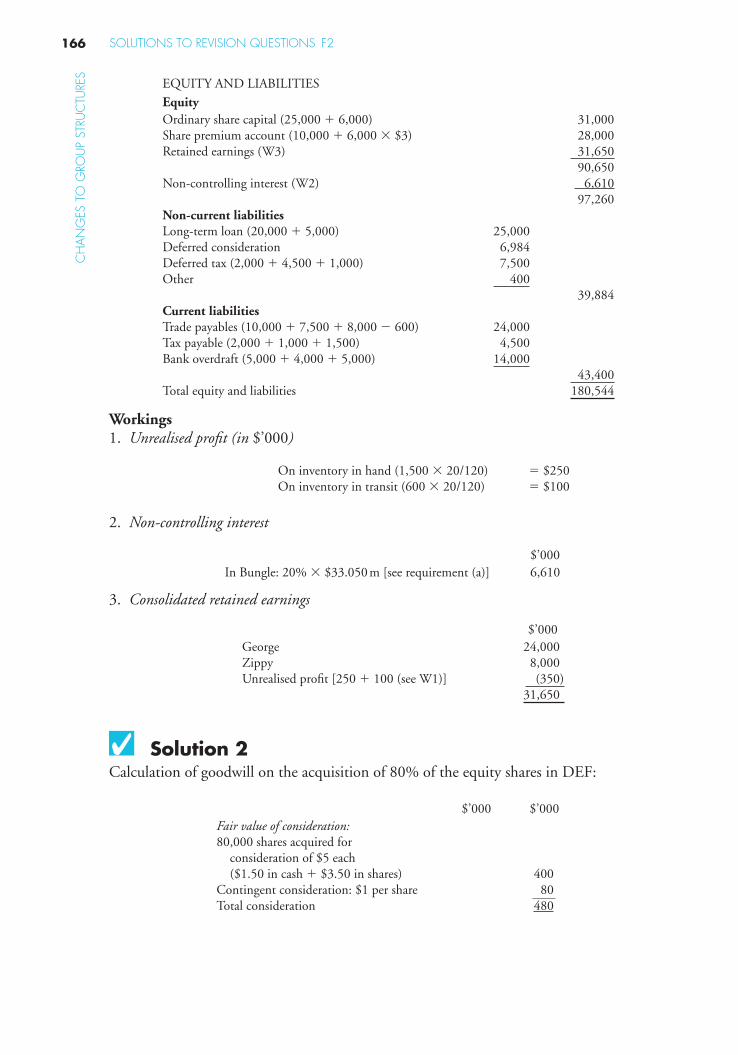
CH
AN
GES
TO
GRO
UP
STRU
CTU
RES
SOLUTIONS TO REVISION QUESTIONS F2166
EQUITY AND LIABILITIES Equity Ordinary share capital (25,000 � 6,000) 31,000 Share premium account (10,000 � 6,000 � $3) 28,000 Retained earnings (W3) 31,650 90,650 Non-controlling interest (W2) 6,610
97,260 Non-current liabilities Long-term loan (20,000 � 5,000 ) 25,000 Deferred consideration 6,984 Deferred tax (2,000 � 4,500 � 1,000) 7,500 Other 400 39,884 Current liabilities Trade payables (10,000 � 7,500 � 8,000 � 600) 24,000 Tax payable (2,000 � 1,000 � 1,500) 4,500 Bank overdraft (5,000 � 4,000 � 5,000) 14,000 43,400 Total equity and liabilities 180,544
Workings 1. Unrealised profi t (in $’000)
On inventory in hand (1,500 � 20/120) � $250 On inventory in transit (600 � 20/120) � $100
2. Non-controlling interest
$’000 In Bungle: 20% � $33.050 m [see requirement (a)] 6,610
3. Consolidated retained earnings
$’000 George 24,000 Zippy 8,000 Unrealised profi t [250 � 100 (see W1)] (350) 31,650
Solution 2 Calculation of goodwill on the acquisition of 80% of the equity shares in DEF:
$’000 $’000 Fair value of consideration: 80,000 shares acquired for consideration of $5 each ($1.50 in cash � $3.50 in shares) 400 Contingent consideration: $1 per share 80 Total consideration 480

CH
AN
GES TO
GRO
UP STRU
CTU
RES
167FINANCIAL MANAGEMENT
Fair value of net assets acquired: Net assets at carrying value 594 Adjustments for fair value: Property, plant and equipment ($530,000 � $460,000)
70
Contingent liability (100) Inventories (fair value of $36,000 less carrying value of $30,000) 6
570 80% acquired (80% � $570,000) 456 Goodwill on acquisition 24
According to IFRS 3 (revised), directly attributable costs of acquisition should be written off when incurred and so will be charged as an expense in the income statement. The costs of issuing equity instruments are to be accounted for in accordance with IAS 39 Financial Instruments: recognition and measurement.
Solution 3 Consolidated statement of fi nancial position of MC Group at 31 December 20X8
$’000ASSETSNon-current assetsPlant and equipment (4,000 � 3,000 � 585 (W1)) 7,585Goodwill (W2) 610
8,195Current assets (1,720 � 2,000) 3,720Total assets 11,915
EQUITY AND LIABILITIESEquityOrdinary share capital 1,000Retained earnings (W3) 6,381
7,381Non-controlling interest (W4) 2,034
9,415Current liabilities (2,000 � 500) 2,500Total equity and liabilities 11,915
Workings1. Fair value adjustment
At acquisition date $000 Movement $000 At statement of fi nancial position date $000
Plant & equipment 650 (65) 585
2. Goodwill on acquisition (30 June 20X8)
$000 $000Consideration transferred (50% paid for) 2,800FV of the investment held previously (FV at the date control is gained, 30 June)
600
Net assets acquired:Share capital 1,000Retained earnings 3,000

CH
AN
GES
TO
GRO
UP
STRU
CTU
RES
SOLUTIONS TO REVISION QUESTIONS F2168
FV uplift on non-current assets 6504,650
Group share of NA (60%) (2,790) 610
3. Retained earnings
MC JD$’000 $’000
At statement of fi nancial position date 6,160 3,500Gains from derecognition of fi nancial asset at 30 June (10% investment held – now fully consolidated)
100
Pre-acquisition retained earnings (3,000) 500
60% share of BD’s post acq’n earnings 300Less gains on AFS investments recognised in MC’s own accounts
(140)
Group share of FV movement60% (650/5 yrs � 6/12 months) (39)Group retained earnings 6,381
4. Non-controlling interest
40% � net assets of JD at 31 December 20X8:
$000Share capital 1,000Retained earnings 3,500Net balance of FV uplift (650 -65) 585
5,08540% 2,034
Solution 4AMY: consolidated profi t or loss on disposal
$FV of consideration 320,000FV of 10% investment retained 33,000Less FV of the consolidated net assets at disposal (80% � $275,000)
(220,000)
Goodwill (W1) (61,200)Gain on disposal 71,800
Working 1
Goodwill on consolidationInvestment at cost 250,000Less: acquired: [$40,000 � (186,000 � 80%)] (188,800)Goodwill 61,200

CH
AN
GES TO
GRO
UP STRU
CTU
RES
169FINANCIAL MANAGEMENT
Solution 5Adjustment to parent’s equity
$Consideration received (900,000)Increase in FV of NCI in net assets at disposal date (10% � $4.7m) 470,000Increase in NCI in goodwill ($80,000 � 25/35) � $80,000 32,000Adjustment to parent’s equity (398,000)
Solution 6RW: Consolidated income statement for the year ended 31 December 20X4
$’000Revenue (6,000 (6/12 � $2,500)) 7,250.0Operating costs (4,500 � (6/12 � $1,700)) (5,350.0)
1,900.0Share of profi t of associate (W3) 82.5Profi t on disposal of investment (W2) 420.0Profi t before tax 2402.5Income tax [300 � (6/12 � $250)� (W4) $540 (965.0)Profi t for the period 1,437.5
Attributable to: Equity holders of the parent 1382.5 Non-controlling interest (W5) 55Profi t for the period 1437.5
Workings1. Goodwill on acquisition
$000 $’000FV of consolidation transferred 3,200Less FV of consolidated net assets at acquisition:Share capital 800Retained earnings 2,400
3,200Group share of 80% (2,560)Gain on disposal 640
2. Consolidated profi t on disposal
$000 $’000FV of consolidation received 3,000FV of 30% retained 1,400Less FV of consolidated net assets as disposal date:Share capital 10,000Retained earnings 1 Jan 2,900Profi t for 6 months to 30 June (6/12 � $550) 275
4,175Group share of 80% (3,340)Goodwill (640)Gain on disposal 420

CH
AN
GES
TO
GRO
UP
STRU
CTU
RES
SOLUTIONS TO REVISION QUESTIONS F2170
3. Share of profi t of associate$550,000 � 6/12 months � 30% � $82,500
4. Tax on gain on disposalThis is calculated on RW’s own profi t:
$’000Proceeds of sale 3,000Less CV of investment sold (30/80 � $3.2m) 1,200Gain in individual accounts 1,800Tax on that gain at 30% 540
5. Non-controlling interest
$’000To 1 July 20X4: ($550 � 6/12) � 20% 55
Solution 7(a) AZ originally acquired 60% of 2,600,000 shares: 1,560,000. On 1 October 20X5, it
disposed of 520,000 shares – that is one third of its holding. After the disposal, AZ retained ownership of 40% of the ordinary share capital of CX.(i) Profi t or loss on disposal in AZ’s own fi nancial statements:
$’000Proceeds of sale 1,500Cost: 1/3 � $2,730,000 (910)Profi t before tax 590Tax charge: $590,000 � 30% (177)Profi t after tax 413
(ii) Profi t on disposal in the AZ group’s consolidated fi nancial statements.
Workings
Consolidated gain on disposal $’000FV of consideration received 1,500FV of 40% retained (40/60 � $2,730) 1,820Less FV of the consolidated NA at disposal date (60% � $4,655 (W2))
(2,793)
Goodwill (W1) (390)Consolidated gain 137
1. Goodwill on the acquisition of CX
$’000Cost of investment 2,730Less: Acquired (2,600 � 1,300 � 3,900 � 60%) (2,340)Goodwill on acquisition 390

CH
AN
GES TO
GRO
UP STRU
CTU
RES
171FINANCIAL MANAGEMENT
2. CX’s net assets at the date of disposal
$’000Share capital 2,600Retained earnings on 1 April 20X5 1,9701/2 � profi t for the year (2,140 � 1,970)/2 85
4,655
(b)1. Provision for unrealised profi t
Cost structure: cost � (20% � cost) � selling price ($’000)
Unrealised profi t � 20/120 � 180 � 30Of this, 20% is attributable to the minority: (6)The remainder reduces consolidated reserves: 24
2. Consolidated retained earnings
$’000Reserves of AZ 10,750Post-acquisition retained earnings of BY: ($3,370 � $1,950) � 80% 1,136Profi t on disposal [see part (a)(i)] 413
Post-acquisition retained earnings in associate entity CX($2,140 � $1,300) � 40% 336Provision for unrealised profi t (W1) (24)
12,611
(c)AZ: Consolidated statement of fi nancial position as at 31 March 20X6
$’000 $’000Non-current assets:Property, plant and equipment (10,750 � 5,830) 16,580Goodwill (W1) 260Investment in associate (W2) 2,156Other investments (W3) 860
19,856Current assets:Inventories (2,030 � 1,210 � 30 PURP) 3,210Trade receivables (2,380 � 1,300) 3,680Cash (1,380 � 50) 1,430
8,32028,176
Equity:Share capital 8,000Consolidated retained earnings [part (b)] 12,611
20,611Non-controlling interest (W4) 1,728Current liabilities:Trade payables (3,520 � 1,550) 5,070Income tax {420 � 170 � 177 [part a (i)]} 767
5,83728,176
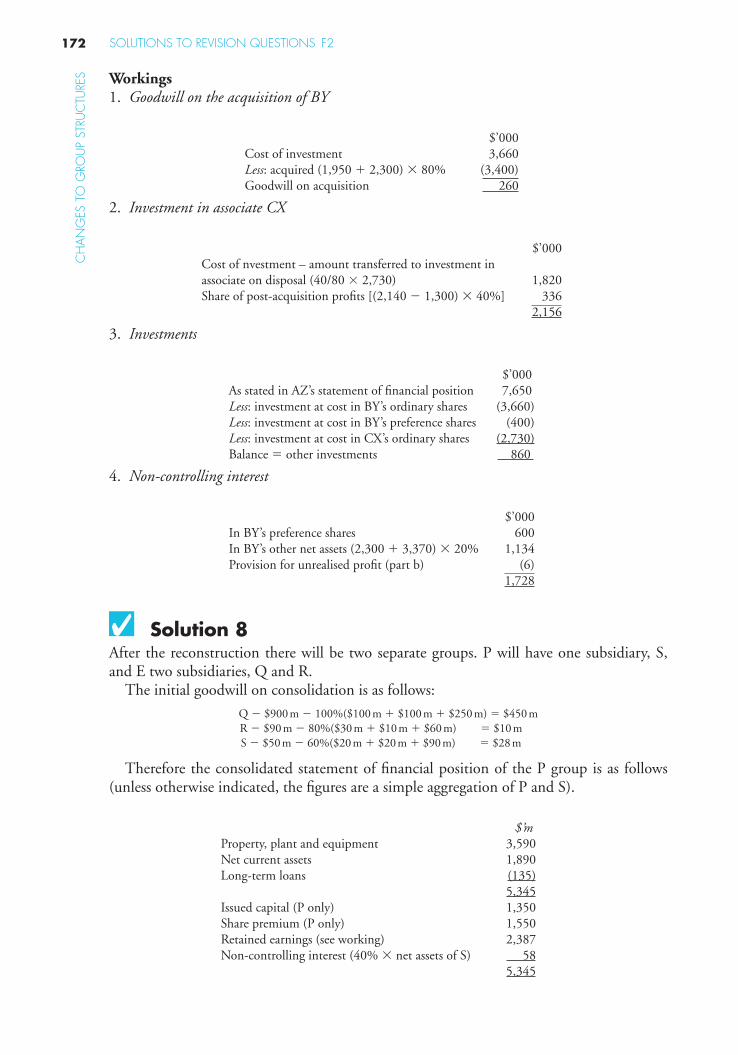
CH
AN
GES
TO
GRO
UP
STRU
CTU
RES
SOLUTIONS TO REVISION QUESTIONS F2172
Workings1. Goodwill on the acquisition of BY
$’000Cost of investment 3,660Less: acquired (1,950 � 2,300) � 80% (3,400)Goodwill on acquisition 260
2. Investment in associate CX
$’000Cost of nvestment – amount transferred to investment in associate on disposal (40/80 � 2,730) 1,820Share of post-acquisition profi ts [(2,140 � 1,300) � 40%] 336
2,156
3. Investments
$’000As stated in AZ’s statement of fi nancial position 7,650Less: investment at cost in BY’s ordinary shares (3,660)Less: investment at cost in BY’s preference shares (400)Less: investment at cost in CX’s ordinary shares (2,730)Balance � other investments 860
4. Non-controlling interest
$’000In BY’s preference shares 600In BY’s other net assets (2,300 � 3,370) � 20% 1,134Provision for unrealised profi t (part b) (6)
1,728
Solution 8After the reconstruction there will be two separate groups. P will have one subsidiary, S, and E two subsidiaries, Q and R.
The initial goodwill on consolidation is as follows:
Q � $900 m � 100%($100 m � $100 m � $250 m) � $450 mR � $90 m � 80%($30 m � $10 m � $60 m) � $10 mS � $50 m � 60%($20 m � $20 m � $90 m) � $28 m
Therefore the consolidated statement of fi nancial position of the P group is as follows (unless otherwise indicated, the fi gures are a simple aggregation of P and S).
$’mProperty, plant and equipment 3,590Net current assets 1,890Long-term loans (135)
5,345Issued capital (P only) 1,350Share premium (P only) 1,550Retained earnings (see working) 2,387Non-controlling interest (40% � net assets of S) 58
5,345

CH
AN
GES TO
GRO
UP STRU
CTU
RES
173FINANCIAL MANAGEMENT
WorkingRetained earnings
$’mP’s retained earnings 3,250Investment in Q distributed to shareholders (900)S’s retained earnings [60% ($105 m � $90 m)] 9Negative goodwill 28
2,387
The consolidated statement of fi nancial position of the E group appears below (unless oth-erwise indicated, the fi gures are a simple aggregation of Q and R).
$’mProperty, plant and equipment 610Net current assets 470Long-term loans (40)
1,040Share capital (E only) 300Other reserves (W1) 600Consolidated retained earnings (W2) 116Non-controlling interest (20% � net assets of R) 24
1,040
Working1. Other reserves
E has issued 300 million shares of $1 to acquire an investment in Q that had a carry-ing value of $900 million. The issue of shares is recorded at par. Given the fact that the reconstruction has no overall effect on the ultimate shareholders or on the non-controlling interests, there should be no effect on the amounts that are included in the consolidated statement of fi nancial position. The ‘other reserve’ is the difference between the nominal value of the shares issued and the original carrying value of the investment in Q that was previously in the statement of fi nancial position of P.
2. Consolidated retained earnings
$’mQ ($810 m � $250 m) 560R [80% ($80 m � $60 m)] 16Goodwill written off as impaired:Q (450)R (10)
116

This page intentionally left blank

8
Foreign Currency Translations

This page intentionally left blank

177
8 LEARNING OUTCOMES After studying this chapter students should be able to:
� explain foreign currency translation principles;
� explain the correct treatment for foreign loans fi nancing foreign equity investments.
8.1 Introduction This chapter examines the provisions of IAS 21 dealing with the effects of foreign exchange rates. Section 8.2 looks at the objectives of the standard and some of the principal defi -nitions it employs. Section 8.3 covers single transactions in foreign currencies. The most complex section of the chapter, Section 8.4, examines the calculations required to translate and then consolidate the fi nancial statements of a foreign operation. Section 8.5 examines hedging of a foreign equity investment by a foreign loan.
8.2 IAS 21 The effects of changes in foreign exchange rates
IAS 21 was revised and reissued in December 2003 as part of the IASB’s improvements projects. It incorporates several important alterations and so those students who have pre-viously encountered foreign currency transactions regulated by the provisions of IAS 21 should study this chapter with care.
8.2.1 Foreign currency transactions: the accounting problem
Businesses frequently conduct transactions and make investments using foreign curren-cies. The accounting problem lies in the fact that the currency used in transactions is not the same as the currency in which the business entity conducts its normal operations. Therefore, in order to refl ect the effect of the transactions in its own books and fi nancial statements, the entity must use a method of currency translation.
Foreign Currency Translations

STUDY MATERIAL F2178
FORE
IGN
CU
RREN
CY
TRA
NSL
ATIO
NS A feature of foreign currency transactions is that they are subject to exchange risk, and
that they may give rise to a loss (or, indeed, a profi t) on translation.
8.2.2 IAS 21 Objectives and key definitions The objective of IAS 21 is stated as follows:
The objective of this standard is to prescribe how to include foreign currency transactions and foreign opera-tions in the fi nancial statements of an entity, and how to translate fi nancial statements into a presentation currency.
Two distinct types of foreign activities are covered by the standard: fi rst, single transactions in foreign currencies, and second, foreign operations.
A foreign currency is a currency other than the functional currency of the entity. A foreign operation is an entity that is a subsidiary, associate, joint venture or branch of
a reporting entity, the activities of which are based or conducted in a country or currency other than those of the reporting entity.
The standard identifi es and defi nes two types of currency: functional currency and presentation currency. Functional currency is the currency of the primary economic envi-ronment in which the entity operates. Presentation currency is the currency in which the fi nancial statements are presented.
As the distinction between the two implies, it is possible for an entity to report in a presentation currency that is not its functional currency.
Functional currency Where an entity operates in several different national environments it may not always be a straightforward matter to determine its functional currency. Entities need to consider the following issues in determining their functional currency:
● Which currency principally infl uences selling prices for goods and services? ● Which country’s competitive forces and regulations principally determine the selling
prices of the entity’s goods and services? ● In which currency are funds for fi nancing activities (debt and equity instruments) generated? ● In which currency are receipts from operations generally kept? ● Which currency infl uences labour, material and other costs of providing goods or services?
Where consideration of the different factors does not result in a clear identifi cation of the functional currency, the issue becomes a matter of judgement for management.
Presentation currency The functional currency of an entity is a matter of fact, although identifying it may not be straightforward. By contrast, the entity’s presentational currency is a matter of choice. IAS 21 permits an entity to present its fi nancial statements in any currency it chooses; this may differ from the entity’s functional currency. Why would an entity choose a presentation cur-rency that is different from its functional currency? One of the following reasons may apply:
● The entity’s functional currency is relatively obscure. The entity may then choose to report in a currency such as US dollars or Euros in order to make its fi nancial statements more transparent.
● The entity’s principal investors tend to function in another currency from the entity’s own functional currency.

179FINANCIAL MANAGEMENT
FOREIG
N C
URREN
CY TRA
NSLATIO
NS
● The entity may be seeking investment from potential investors whose functional cur-rency is not the same as the entity’s functional currency.
8.3 Single transactions in foreign currencies A single foreign currency transaction is one that is denominated in a foreign currency, or requires settlement in a foreign currency. Examples include:
● purchase or sale of goods or services where the price is denominated in a foreign currency; ● borrowing or lending of funds denominated in a foreign currency; ● acquisition or disposal of assets denominated in a foreign currency.
IAS 21 requires that the transaction should be recorded by translating the foreign currency amount into the entity’s functional currency using the spot exchange rate at the date of the transaction (spot rate is the exchange rate for immediate delivery of the currency).
Example 8.A
On 1 July 20X0 entity A which reports in dollars purchased an asset from an entity reporting in euros for ∈200,000. Payment was made on 31 December 20X0. The entity’s year end is 30 September.
Relevant exchange rates are:
Date Exchange rate (as to $1) 1 July 20X0 1.50 30 September 20X0 1.40 1 December 20X0 1.45
How will this transaction be recorded in the books of A? The initial recognition of the transaction is at spot rate on 1 July 20X0. The value of the transaction at that date is:
200,00/1.50 5 $133,333
The following journal records the transaction at 1 July 20X0:
$ $ DR Asset 133,333 CR Liability (supplier) 133,333
By A’s year end the liability has still not been settled. IAS 21 requires that foreign currency monetary items should be translated using the closing rate at the entity’s year end, and that non-monetary items should be trans-lated using the exchange rate at the date of the transaction.
The asset itself is a non-monetary item; it is already included in the books of A using the rate at the date of the transaction, and so there is no need for any adjustment. The liability, however, is a monetary item, and so it must be retranslated at closing rate, as follows:
200,000/1.40 5 $142,857
This increases the liability at the year end (so there will be an additional credit to the supplier account of $142,857 � $133,333 � $9,524. The matching debit represents a loss on exchange, and IAS 21 requires that this should be taken to profi t and loss. The year end journal entry in respect of this transaction, therefore, is:
$ $ DR Income statement 9,524 CR Liability (supplier) 9,524
By the settlement date, the exchange rate has moved again. On 31 December 20X0 A is obliged to pay €200,000. The cost of this to A in dollar terms is:
200,00/1.40 5 $142,857

STUDY MATERIAL F2180
FORE
IGN
CU
RREN
CY
TRA
NSL
ATIO
NS However, the liability recorded in the books is $142,857; because of exchange rate movements, A is obliged
to pay a lesser amount in dollar terms and so has realised a gain on exchange. The following journal entry records the transaction:
DR Liability (supplier) 142,857 CR Cash 137,931 CR Income statement 4,926
8.4 Translating foreign operations Sometimes, foreign operations such as subsidiaries, branches, associates and joint ventures operate using a different functional currency from that of the reporting entity. Where this is the case, the results, assets and liabilities of the foreign operation must be translated into a presentation currency, that is, the currency of the reporting entity.
The method employed is as follows:
(a) assets and liabilities should be translated using the closing rate at the year end date; (b) income and expenses should be translated at the exchange rates in force at the date of
the transactions; (c) all resulting exchange differences are recognised as part of equity, until such time as
the investment in the foreign operation is realised.
Point (b) could involve a foreign operation in a great deal of time consuming work. Therefore, it is accepted by IAS 21 that, for practical reasons, an average rate for the period may be used instead. However, if there are signifi cant fl uctuations in the exchange rate during an accounting period, it may not be acceptable to use the average rate.
Consolidation techniques are the same for foreign operations as for operations reporting under the same functional currency as the investor. The requirements of IFRS 3 Business Combinations, IAS 28 Investments in Associates, IAS 31 Interests in Joint Ventures and IAS 27 Consolidated and Separate Financial Statements apply equally to foreign operations.
Goodwill arising on the consolidation of a foreign operation should be recognised according to the requirements of IFRS 3. Such goodwill is treated as being an investment by the reporting entity in an asset, and it should be translated along with all other invest-ee’s assets at the closing rate. Fair value adjustments to the carrying amounts of assets and liabilities in the foreign operation should also be translated at the closing rate.
The techniques involved in translating a foreign operation are demonstrated in the fol-lowing example.
Example 8.B
BLX holds several investments in subsidiaries. One of these, CMY, is located overseas. CMY prepares its fi nan-cial statements in its local currency, the Crown.
Several years ago, when the exchange rate was 5 Crowns � 1$, CMY purchased land at a cost of 170,000 Crowns. On 1 June 20X5, when the exchange rate was 6.5 Crowns � $1 the land was revalued at a fair value of 600,000 Crowns. The exchange rate at the group’s year end, 31 December 20X5, was 7 Crowns � $1.
In accordance with the requirements of IAS 21 The effects of changes in foreign exchange rates, at what value in $s should the land be recognised in BLX’s group fi nancial statements at 31 December 20X5?
Solution
IAS 21 requires that both the cost and any subsequent revaluiton should be translated at closing rate. The value of the revalued assets would then be 600,000/7 � $85,714.

181FINANCIAL MANAGEMENT
FOREIG
N C
URREN
CY TRA
NSLATIO
NS
Example 8.C
On 1 October 20X4 Erasmus acquired 80% of the ordinary issued share capital of Heinrich. Heinrich’s func-tional currency is the groat (G). The cost of the investment was G800,000, and at the date of acquisition Heinrich’s accumulated profi ts were G86,000. It is the group policy to value non-controlling interest at acquisi-tion at the proportionate share of the fair value of the subsidiary’s identifi able net assets.
Relevant rates of exchange are as follows:
Date Gs to $1 1 October 20X4 4.0 30 September 20X8 3.9 30 September 20X9 3.75 Average for the year ended 30 September 20X9 3.8
The draft income statements, summarised statements of changes in equity and statements of fi nancial position of Erasmus and its subsidiary are set out below:
Income statements for the year ended 30 September 20X9
Erasmus Heinrich$’000 G’000
Revenue 10,290 10,650 Cost of sales (5,145) (5,325) Gross profi t 5,145 5,325 Other operating expenses (4,116) (4,260) Profi t from operations 1,029 1,065 Income from shares in Heinrich 64 – Profi t before tax 1,093 1,065 Income tax expense (348) (385) Profi t for the period 745 680
Summarised statements of changes in equity for the year ended 30 September 20X9
Erasmus Heinrich$’000 G’000
Balance at start of period 1,252 1,336 Profi t for the period 745 680 Dividends (350) (300) Balance at 30 September 20X9 1,647 1,716
Summarised statements of fi nancial position as at 30 September 20X9
Erasmus Heinrich$’000 G’000
Property, plant and equipment 515 920 Investment in Heinrich 200 – Net current assets 1,189 901
1,904 1,821
Share capital 905 850 Retained reserves 742 866
1,647 1,716Loans 257 105
1,904 1,821

STUDY MATERIAL F2182
FORE
IGN
CU
RREN
CY
TRA
NSL
ATIO
NS Requirement
Prepare the summarised consolidated fi nancial statements for the Eramus Group for the year to 30 September 20X9.
Work to nearest $000.
Solution
Erasmus group: Consolidated statement of fi nancial position as at 30 September 20X9
$’000 Goodwill on consolidation (W1) 13.7 Property, plant and equipment (515 � 245.3) 760.3 Net current assets (1,189 � 240.3) 1,429.3
2,203.3 Share capital (Erasmus only) 905.0 Retained reserves (balancing fi gure) 921.8
1,826.8 Non-controlling interest (W3) 91.5 Loans (257 � 28) 285.0
2,203.3
Workings 1. Goodwill on consolidation Goodwill on consolidation in G’000:
G’000 G’000 Cost of acquisition ($200 � 4) 800Acquired:
Share capital 850 Pre-acq reserves 86
936 � 80% (748.8) Goodwill on acquisition 51.2
Remember that IAS 21 requires that goodwill on consolidation is treated as an asset like any other, and translated at closing rate. So, goodwill in the consolidated statement of fi nancial position is: G51,200/3.75 � $13,700 (rounded to the nearest $100).
2. Translation of Heinrich’s statement of fi nancial position All of Heinrich’s assets and liabilities are translated at closing rate:
G’000 Rate $’000 Property, plant and equipment 920 3.75 245.3 Net current assets 901 3.75 240.3
1,821 485.6
Share capital 850 4.00 212.5 Pre-acquisition retained reserves 86 4.00 21.5 Post-acquisition retained reserves 780 Bal. fi g 223.6
1,716 457.6Loans 105 3.75 28.0
1,821 485.6
Note that share capital and pre-acquisition retained reserves are translated at 4.00, the exchange rate ruling at the date of acquisition. However, IAS 21 does not specify the rate at which equity items should be translated, and so closing rate could be used. 3. Non-controlling interest The non-controlling interest is 20% of Heinrich’s net assets: $457,600 � 20% � $91,500 (rounded to the nearest $100).
Note that the consolidation conventions applied are no different from the ones we have covered in previous chapters. The share capital is that of the holding entity only, 100% of the assets and liabilities of the subsidiary

183FINANCIAL MANAGEMENT
FOREIG
N C
URREN
CY TRA
NSLATIO
NS
are included, and a non-controlling interest is calculated in respect of the 20% of the net assets owned by share-holders other than Erasmus.
The retained reserves fi gure calculated for the moment is a balancing fi gure only. We will cover this in more detail when calculating the consolidated statement of changes in equity.
Erasmus group: Consolidated income statement for the year ended 30 September 20X9
$’000 Revenue (10,290 � 2,802.64) 13,092.6 Cost of sales (5,145 � 1,401.3) (6,546.3) Gross profi t 6,546.3 Other operating expenses (4,116 � 1,121.1) (5,237.1)
1,309.2 Tax (348 � 101.3) (449.3) Profi t for the period 859.9 Attributable to:
Equity holders of the parent 824.1 Minority interest (178.9 � 20%) 35.8
859.9
4. Translation of Heinrich’s income statement This is translated throughout at the average exchange rate for the year, as required by IAS 21.
G’000 Rate $’000 Revenue 10,650 3.8 2,802.6 Cost of sales (5,325) 3.8 (1,401.3) Gross profi t 5,325 1,401.3 Other operating expenses (4,260) 3.8 (1,121.1) Profi t before tax 1,065 280.2 Income tax expense (385) 3.8 (101.3) Profi t for the period 680 178.9
The next stage in the process is to prepare the consolidated statement of changes in equity. Note that this is a summarised statement only. In order to make the example relatively straightforward, equity is that relating only to equity holders of the parent.
A statement prepared in accordance with IAS 1 would require a breakdown into the components of share capital and various reserves, and also a column for non-controlling interests.
Erasmus group: Summarised consolidated statement of changes in equity for the year ended 30 September 20X9
$’000 Brought forward at 1 October 20X8 (W5) 1,339.2 Profi t for the period (see consolidated income statement) 824.1 Dividend (Erasmus only) (350.0) Exchange gains (balancing fi gure) 13.5 Carried forward at 30 September 20X9 (see consolidated statement of fi nancial position) 1,826.8
It is clear from the circumstances of the question that the exchange differences will be gains, because of the direction of movements in the rates since acquisition (over time, fewer groats are required to buy $1, so an asset held in groats will produce gains). However, at the moment, we do not know exactly where the $13,500 in gains originates from. We can prove the fi gure, as shown in the following workings.
5. Consolidated equity brought forward
$’000Erasmus 1,252.0 Heinrich: 80% of post-acquisition profi ts (W6) 86.9 Exchange gain on goodwill on acquisition* 0.3
1,339.2
$’000 *Goodwill translated at date of acquisition 51,200/4 12.8 Goodwill at 30 September 20X8: 51,200/3.9 13.1 Exchange gain 0.3

STUDY MATERIAL F2184
FORE
IGN
CU
RREN
CY
TRA
NSL
ATIO
NS 6. Heinrich: Post-acquisition profi ts
Heinrich’s opening equity is G1,336,000. Translated at the opening exchange rate of 3.9, the $ equivalent is: 1,336,000/3.9 � $342,600.
Post-acquisition profi ts at the start of the year � opening equity less share capital less pre-acquisition profi ts:
$’000 Heinrich: opening equity 342.6 Share capital (see translated balance sheet in W2) (212.5) Pre-acquisition retained reserves (see translated statement of fi nancial position in W2)
(21.5)
Heinrich: post acquisition profi ts 108.6
The group share of the post acquisition profi ts is 80%: $108.6 � 80% � $86.9 (fi gures in $’000).
7. Proof of exchange gains These exchange gains arise because of the retranslation of the net assets of Heinrich. The proof is as follows:
$’000 $’000 Opening net assets (G1,336,000) translated at:
Opening exchange rate (1,336,000/3.9) 342.6 Closing exchange rate (1,336,000/3.75) 356.3
Gain on retranslation 13.7
Movement in equity in the year (G380,000) Profi t for the period at average rate (680,000/3.8) 178.9 Dividend (300,000/3.75) (80.0)
98.9
Movement in equity at closing rate (380,000/3.75) 101.3 Gain on retranslation 2.4 Total gain on retranslation of net assets 16.1 Group share (80%) 12.9 Gain on retranslation of goodwill (working 8) 0.6 Total gain 13.5
8. Gain for year on retranslation of goodwill Goodwill was calculated (see W1) as G51,200.
$’000 Goodwill translated at 30 September 20X8: 51,200/3.9 13.1 Goodwill at 30 September 20X9 (see W1) 13.7 Exchange gain 0.6
Note that the group is attributed with only 80 per cent of the gain on the translation of net assets in Heinrich. The remainder is attributable to the non-controlling interest, and is included in the statement of fi nancial position fi gure. However, the group is attributed with 100 per cent of the gain on the retranslation of goodwill. This is logical because the goodwill calculation does not concern the minority.
An examination question might require candidates to prove the exchange differences fi g-ure, and if it does, the requisite calculations are built into the time allowance for the ques-tion. However, if there is no positive requirement to prove the differences, it is sensible to simply slot them in as a balancing fi gure.
Note the treatment of the differences on exchange in this example. The differences are taken to the statement of changes in equity, as required by IAS 21.

185FINANCIAL MANAGEMENT
FOREIG
N C
URREN
CY TRA
NSLATIO
NS
8.4.1 Change in functional currency The example of Erasmus and Heinrich demonstrates the procedures involved where the fi nancial statements of a subsidiary entity have to be translated into the presentation cur-rency used by the group as a whole.
Occasionally, an entity’s functional currency will change because of alterations in busi-ness circumstances. The example given in the standard is where there is a change in the currency that mainly infl uences the prices of goods and services. Where this is the case, a retranslation exercise must be undertaken. IAS 21 requires that the retranslation must be undertaken prospectively from the date of the change. ‘ Prospectively ’ in this context means that the translation into the new functional currency takes place using the exchange rate at the date of the change. The resulting translated amounts for non-monetary items are treated as being the historical cost of those items.
8.5 Hedging Hedging establishes a relationship between a hedging instrument and a hedged item. A hedged item in the context of this chapter is a net investment in a foreign operation of the type that we have examined in the Erasmus and Heinrich example.
A hedging instrument, in the context of this chapter, is a fi nancial liability whose cash fl ows are expected to offset cash fl ows of a designated hedge item.
Hedging relationships are now regulated by IAS 39 Financial Instruments: Recognition and Measurement, and the topic is covered in more detail in Chapter 13 of this Learning System.The particular kind of hedging relationship that is relevant to this present chapter relates to the fi nancing of an investment in a foreign operation by a foreign currency loan taken out by the investing entity.
Example 8.D
G is an acquisitive entity that decides to purchase 75% of the share capital of H, an entity that operates outside G’s country of operation, and whose functional currency is the Euro. The purchase price is €18.7 million, and G takes out a loan in euros to fi nance the purchase. The loan acts as a hedging instrument: any currency movements which adversely affect the investment in H (an asset) will be offset by currency movements in respect of the Euro loan (a liability). Provided that the hedge is designated as such, the exchange movements on both the investment and the hedge can be recognised as part of equity.
If hedging were not permitted, gains or losses on the investment in the foreign operation would be recognised as part of equity (as required by IAS 21) but gains or losses on the loan would be recognised in profi t for the year. Hedging allows for recognition of the substance of the relationship between the investment and the loan that fi nances it.
8.6 Summary This chapter has examined the provisions of IAS 21 The Effects of Changes in Foreign Exchange Rates, in respect of both single transactions and foreign operations. The dis-tinction between functional and presentation currency is important, and students should ensure that they understand the defi nitions of each.

STUDY MATERIAL F2186
FORE
IGN
CU
RREN
CY
TRA
NSL
ATIO
NS
The translation and consolidation of foreign operations as part of a group is a signifi cant element in the Financial Management syllabus. Students can expect
that both the mechanics and the underlying principles of foreign operations transla-tion will be examined on a regular basis. These underlying principles include the hedging of foreign equity investments via a foreign currency loan. The coverage of hedging is continued in more detail in Chapter 11 of this Learning System which covers the requirements of IAS 39.

187
Revision Questions 8 Question 1 The income statements for Home and its wholly owned subsidiary Foreign for the year ended 31 July 20X6 are shown below:
Home Foreign $’000 Crowns ’000
Revenue 3,000 650 Cost of sales (2,400) (550) Gross profi t 600 100 Distribution costs (32) (41) Administrative expenses (168) (87) Finance costs (15) (10) Profi t before tax 385 (38) Income tax (102) 10 Profi t for the period 283 (28)
Notes 1. The presentation currency of the group is the $, and Foreign’s functional currency is
the Crown. 2. Home acquired 100% of the ordinary share capital of Foreign on 1 August 20X4 for
204,000 Crowns. Foreign’s share capital at that date comprised 1,000 ordinary shares of 1 Crown each, and its reserves were 180,000 Crowns. In view of its subsidiary’s losses, Home’s directors conducted an impairment review of the goodwill at 31 July 20X6. They concluded that the goodwill had lost 20% of its original value during the year (before taking exchange differences into account). The impairment should be refl ected in the consolidated fi nancial statements for the year ended 31 July 20X6. It is the group policy to value non-controlling intrest at acquisition at the proportionate share of the identifi able net assets of the subsidiary.
3. On 1 June 20X6, Home purchased an item of plant for 32,000 Florins. At the year end the payable amount had not yet been settled. No exchange gain or loss in respect of this item is refl ected in Home’s income statement above.
4. Exchange rates are as follows:
On 1 August 20X4: 1.7 Crowns � $1 On 31 July 20X6: 2.2 Crowns � $1 Average rate for year ended 31 July 20X6: 2.4 Crowns � $1 On 1 June 20X6: 1.5 Florins � $1 On 31 July 20X6: 1.6 Florins � $1
5. During the year Foreign made sales of 50,000 Crowns to Home. None of the items remained in inventory at the year end.

FORE
IGN
CU
RREN
CY
TRA
NSL
ATIO
NS Requirement
Prepare the consolidated income statement for the Home group for the year ended 31 July 20X6. (Work to the nearest $100). (10 marks)
Question 2 The statement of fi nancial position of Big and Small as at 31 March 20X3 are given below. The statement of fi nancial position of Small is prepared in fl orins, the reporting currency for Small.
Big Small $’000 $’000 Fl’000 Fl’000 Non-current assets Property, plant and equipment 60,000 80,000 Investments 9,500 69,500 80,000 Current assets Inventories 30,000 40,000 Trade receivables 25,000 32,000 Cash 3,000 4,000 58,000 76,000 127,500 156,000 Issued capital and reserves Share capital (50 cents/½ fl orin shares)
30,000 40,000
Revaluation reserve 15,000 – Retained reserves 34,500 44,000 79,500 84,000 Non-current liabilities Interest-bearing borrowings 15,000 30,000 Deferred tax 5,000 9,000 20,000 39,000 Current liabilities Trade payables 12,000 15,000 Tax 16,000 18,000 28,000 33,000 127,500 156,000
Notes 1. Investment by Big in Small
On 1 April 20W7, Big purchased 60 million shares in Small for 57 million fl orins. The retained reserves of Small showed a balance of 20 million fl orins at that date. The accounting policies of Small are the same as those of Big except that Big revalues its land, whereas Small carries its land at historical cost. Small’s land had been purchased on 1 April 20W4. On 1 April 20W7, the fair value of the land of Small was 6 million fl orins higher than its carrying value in the individual fi nancial statements of that entity. By 31 March 20X3, the difference between fair value and carrying value had risen to 11 million fl orins. Apart from this accounting policy difference, no other fair value adjust-ments were necessary when initially consolidating Small as a subsidiary.
2. Intra-group trading On 6 March 20X3, Big sold goods to Small at an invoiced price of $6,000,000, making a profi t of 25% on cost. Small recorded these goods in inventory and payables using an
REVISION QUESTIONS F2188

FOREIG
N C
URREN
CY TRA
NSLATIO
NS
189FINANCIAL MANAGEMENT
exchange rate of 5 fl orins to $1 (there were minimal fl uctuations between the two cur-rencies in the month of March 20X3). The goods remained in the inventory of Small at 31 March 20X3 but on 29 March 20X3 Small sent Big a cheque for 30 million fl orins to clear its payable. Big received and recorded this cash on 3 April 20X3.
3. Exchange rate
Date Exchange rate (Fls to $1)
1 April 20W4 7 1 April 20W7 6 31 March 20X2 5.5 31 March 20X3 5 Weighted average for the year to 31 March 20X3 5.2 Weighted average for the dates of acquisition of closing inventory 5.1
Requirements(a) Translate the statement of fi nancial position of Small as at 31 March 20X3 into $s
and prepare the consolidated statement of fi nancial position of the Big group as at 31 March 20X3. (20 marks)
(b) IAS 21 The Effects of Changes in Foreign Exchange Rates permits an entity to choose a presentation currency that is different from its functional currency.
Identify two possible reasons why an entity might choose to exercise this choice.(5 marks)
Total � 25 marks
Question 3 The statement of fi nancial positions of Home and its subsidiary undertaking Away as at 31 March 20X6 and their income statements and statements of changes in equity for the year then ended are as follows (The functional currency of Away is the ‘Mint’ – the accepted abbreviation for ‘Mint’ is ‘M’).
Statement of fi nancial positions as at 31 March 20X6
Home Away $’000 $’000 M’000 M’000
Non-current assets Property, plant and equipment 20,000 30,000 Investment (notes 1 and 2) 5,500
25,500 30,000 Current assets Inventories 10,000 18,000 Trade payables 10,000 15,000
20,000 33,000 45,500 63,000
Capital and reserves Issued capital (1$/1M shares) 9,000 15,000 Retained reserves 12,500 10,000
21,500 25,000 Long-term loans 10,000 20,000 Current liabilities Trade payables 7,900 10,400 Bank overdraft 6,100 7,600
14,000 18,000 45,500 63,000

FORE
IGN
CU
RREN
CY
TRA
NSL
ATIO
NS Income statements – year ended 31 March 20X6
Home Away $’000 M’000 Revenue 50,000 60,000 Cost of sales (notes 2 and 4) (25,000) (30,000) Gross profi t 25,000 30,000 Other operating expenses (15,000) (16,000) Dividend from Away 1,500 Finance cost (1,000) (2,000) Profi t before tax 10,500 Income tax expense (3,600) (4,200) Profi t for the period 6,900 7,800
Summarised statements of changes in equity – year ended 31 March 20X6
Home Away $’000 M’000 Balance at 1 April 20X5 18,500 21,600 Profi t for the period 6,900 7,800 Dividends paid (3,900) (4,400) Balance at 31 March 20X6 21,500 25,000
Notes 1. On 31 March 20X2 Home purchased 11.25 million shares in Away for M16.5 million.
The retained reserves of Away on this date stood at M5 million. 2. Since the date of investment by Home the dollar has depreciated against the Mint.
Exchange rates at relevant dates have been as follows:
Date Exchange rate (Ms to $1) 31 March 20X2 3.00 31 March 20X5 2.40 Average for the year ended 31 March 20X6 2.35 31 March 20X6 2.20
3. Home received its dividend from Away when the exchange rate was M2.20 to $1.
Requirements (a) Translate the balance sheet of Away into dollars and prepare the consolidated balance
sheet of the Home group as at 31 March 20X6. (11 marks) (b) Translate the income statement of Away into dollars and then prepare the consolidated
income statement of the Home group for the year ended 31 March 20X6. (6 marks) (c) Prepare the consolidated statement of changes in equity in respect of the holders of
equity shares in the parent, for the Home group for the year ended 31 March 20X6. All fi gures in the statement should be supported by relevant workings. (8 marks)
(Total � 25 marks) Work to the nearest $’000.
REVISION QUESTIONS F2190

191
Solutions to Revision Questions 8 Solution 1 Home group: Consolidated income statement for the year ended 31 July 20X6
$’000 Revenue [3,000 � (650/2.4) � 20.8] (W1) 3,250.0 Cost of sales [2,400 � (550/2.4) � 20.8] (W1) (2,608.4) Gross profi t 641.6 Distribution costs [32 � (41/2.4)] (49.1) Administrative expenses [168 � (87/2.4)] (204.3) Goodwill impairment (W2) (1.9) Exchange gain (W3) 1.3 Finance costs [15 � (10/2.4)] (19.2) Profi t before tax 368.4 Income tax [102 � (10/2.4)] (97.8) Profi t for the period 270.6
Workings 1. Intra-group sales
Translate at average rate: 50/2.4 � $20.8 Deduct from both revenue and cost of sales
2. Goodwill on consolidation and impairment
Crowns’000 Cost of investment 204 Acquired (181) Goodwill 23
Impairment � 23,000 � 20% � 4,600 Crowns Translated at average rate: 4,600/2.4 � 1.9 (to nearest $100)
Note: It would be quite acceptable to use closing rate for this calculation.
3. Exchange difference on payable
$’000 Payable recognised on 1 June 2006: 32,000/1.5 21.3 Payable translated at closing rate: 32,000/1.6 (20.0) Exchange gain 1.3
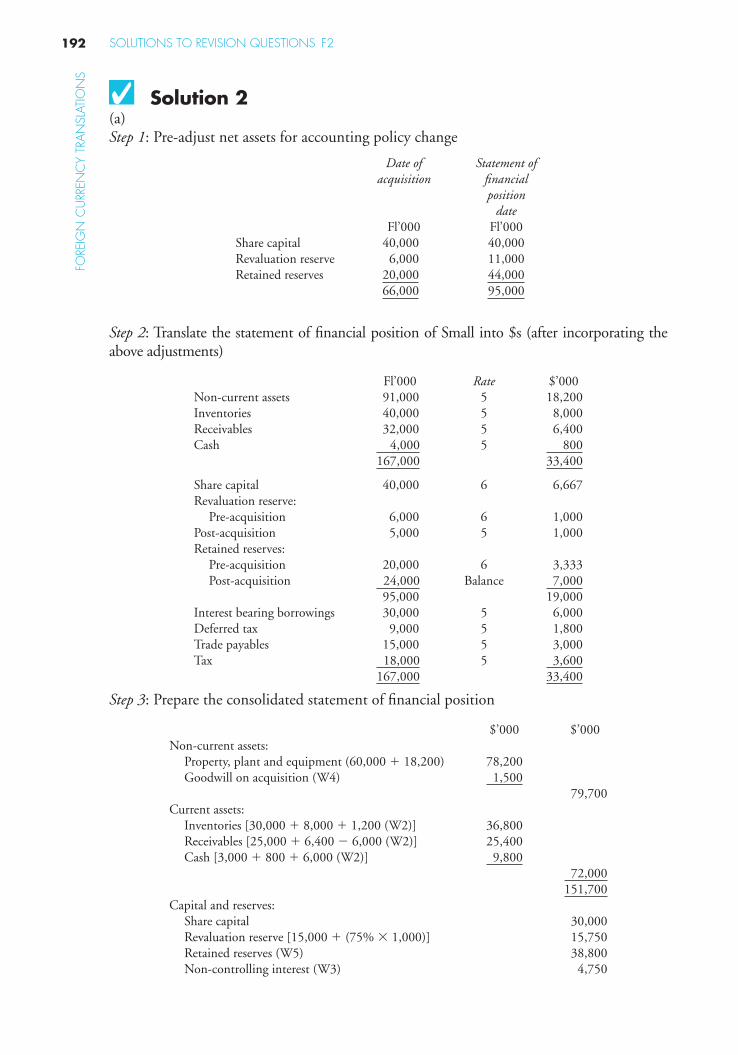
FORE
IGN
CU
RREN
CY
TRA
NSL
ATIO
NS
Solution 2 (a) Step 1: Pre-adjust net assets for accounting policy change
Date of acquisition
Statement of fi nancial position
date Fl’000 Fl’000 Share capital 40,000 40,000 Revaluation reserve 6,000 11,000 Retained reserves 20,000 44,000 66,000 95,000
Step 2 : Translate the statement of fi nancial position of Small into $s (after incorporating the above adjustments)
Fl’000 Rate $’000 Non-current assets 91,000 5 18,200 Inventories 40,000 5 8,000 Receivables 32,000 5 6,400 Cash 4,000 5 800 167,000 33,400
Share capital 40,000 6 6,667 Revaluation reserve: Pre-acquisition 6,000 6 1,000 Post-acquisition 5,000 5 1,000 Retained reserves: Pre-acquisition 20,000 6 3,333 Post-acquisition 24,000 Balance 7,000 95,000 19,000 Interest bearing borrowings 30,000 5 6,000 Deferred tax 9,000 5 1,800 Trade payables 15,000 5 3,000 Tax 18,000 5 3,600 167,000 33,400
Step 3: Prepare the consolidated statement of fi nancial position
$’000 $’000 Non-current assets: Property, plant and equipment (60,000 � 18,200) 78,200 Goodwill on acquisition (W4) 1,500 79,700 Current assets: Inventories [30,000 � 8,000 � 1,200 (W2)] 36,800 Receivables [25,000 � 6,400 � 6,000 (W2)] 25,400 Cash [3,000 � 800 � 6,000 (W2)] 9,800 72,000 151,700 Capital and reserves: Share capital 30,000 Revaluation reserve [15,000 � (75% � 1,000)] 15,750 Retained reserves (W5) 38,800 Non-controlling interest (W3) 4,750
SOLUTIONS TO REVISION QUESTIONS F2192

FOREIG
N C
URREN
CY TRA
NSLATIO
NS
193FINANCIAL MANAGEMENT
Non-current liabilities: Interest bearing borrowings (15,000 � 6,000) 21,000 Deferred tax (5,000 � 1,800) 6,800
27,800 Current liabilities: Trade payables (12,000 � 3,000) 15,000 Tax (16,000 � 3,600) 19,600
34,600 151,700
Workings 1. Group structure
Big owns 60 million of the 80 million Small shares in issue. This is a 75% subsidiary.
2. Intra-group trading The unrealised profi t made by Big is 25/125 � $6 million � $1.2 million. There is cash in transit of $6 million which needs adding onto consolidated cash and taking out of consolidated receivables.
3. Non-controlling interest
25% � 19,000 � $4,750
4. Goodwill
Fl’000 Fl’000 Cost of acquisition 57,000 Purchased: Share capital 40,000 Pre-acquisition revaluation reserve 6,000 Pre-acquisition retained reserves 20,000
66,000 � 75% 49,500
Goodwill 7,500
Translated at closing rate of 5: 7,500/5 � $1,500.
5. Retained reserves
$’000 Big 34,500 Small: post acquisition 7,000 � 75% 5,250 Unrealised profi t (W2) (1,200) Exchange gain on goodwill: Goodwill at acquisition: 7,500/6 1,250 Goodwill at 31 March 20X3: 7,500/5 1,500 250
38,800
(b) Two of the following reasons:1. The entity’s principal investors tend to function in a currency other than the func-
tional currency of the entity.2. The entity’s functional currency is obscure; it may choose to present its fi nancial
statements in a better known currency such as the US dollar or the Euro.3. The entity may be seeking investment from potential investors whose functional
currency is not the same as the entity’s.

FORE
IGN
CU
RREN
CY
TRA
NSL
ATIO
NS 4. In some jurisdictions, entities are obliged to prepare their fi nancial statements in
the local currency, even where this is not the functional currency.
Therefore, to avoid preparing two sets of fi nancial statements, entities may prefer to choose the local currency as their presentation currency.
Solution 3 (a) Step 1. Translate the balance sheet of Away (note that Away is a 75% subsidiary of Home).
M’000 Rate $’000 Property, plant and equipment 30,000 2.2 13,636 Inventories 18,000 2.2 8,182 Trade receivables 15,000 2.2 6,818 63,000 28,636
Issued capital 15,000 3 5,000 Pre-acquisition profi ts 5,000 3 1,667 Post-acquisition profi ts 5,000 Balance 4,697 25,000 11,364 Long-term loans 20,000 2.2 9,091 Trade payables 10,400 2.2 4,727 Bank overdraft 7,600 2.2 3,454 63,000 28,636
Step 2. Prepare the consolidated balance sheet (notice that most fi gures are aggregations).
ASSETS $’000 $’000 Non-current assets Goodwill on consolidation (W2) 682 Property, plant and equipment 33,636 34,318 Current assets Inventories 18,182 Trade receivables 16,818 35,000 69,318 EQUITY AND LIABILITIES Equity Share capital (Home only) 9,000
Retained reserves (balancing fi gure) 16,205 25,205 Non-conrtrolling interest (W1) 2,841 28,046 Long-term loans 19,091 Current liabilities Trade payables 12,627 Bank overdraft 9,554 22,181 69,318
Workings 1. Non-controlling interest
25% � 11,364 � 2,841
SOLUTIONS TO REVISION QUESTIONS F2194

FOREIG
N C
URREN
CY TRA
NSLATIO
NS
195FINANCIAL MANAGEMENT
2. Goodwill
M’000 M’000 Investment 16,500 Share capital 15,000 Pre-acq. reserves 5,000
20,000 � 75% 15,000
Goodwill 1,500
Translated year end rate:
1,500/2.20 � $682
(b) Step 1 . Translate the income statement of Away into dollars
M’000 Rate $’000 Turnover 60,000 2.35 25,532 Cost of sales (30,000) 2.35 (12,766) Gross profi t 30,000 12,766 Other operating expenses (16,000) 2.35 (6,809) Finance cost (2,000) 2.35 (851) Profi t before tax 12,000 5,106 Income tax expense (4,200) 2.35 (1,787) Profi t for the period 7,800 3,319
Step 2. Prepare the consolidated income statement (most fi gures are an aggregation)
$’000 Turnover 75,532 Cost of sales (37,766) Gross profi t 37,766 Other operating expenses (21,809) Finance cost (1,851) Profi t before tax 14,106 Income tax expense (5,387) Profi t for the period 8,719 Attributable to: Equity holders of the parent 7,889 Non-controlling interest (W1) 830
8,719 WorkingNon-controlling interest
This is 25% of the profi t after tax of Away in dollars ($3,319) � $830 .
(c) Consolidated statement of changes in equity (attributable to equity holders of the parent)
$’000 Balance at the start of the year (W1) 20,375 Profi t for the year [see part (b)] 7,889 Dividend of Home (3,900) Exchange difference (W2) 841 Balance at the end of the year [see part (a)] 25,205

FORE
IGN
CU
RREN
CY
TRA
NSL
ATIO
NS Workings
1. Opening consolidated equity
$’000 Home 18,500 Away (75% � 2,333 � see below) 1,750 Exchange gain on goodwill* 125 20,375
$’000
*Goodwill at 31 March 20X51500
2 40.
⎛⎝⎜⎜⎜
⎞⎠⎟⎟⎟ 625
Goodwill at date of acquisition 500 125
In order to compute the opening equity (and the post-acquisition change in equity, repre-sented by post-acquisition profi ts) of Away, we need to translate the opening balance sheet (at last year’s closing rate of M2.40 to $1):
M’000 Rate $’000 Issued capital 15,000 3.00 5,000 Pre-acquisition profi ts 5,000 3.00 1,667 Post-acquisition profi ts 1,600 Balance 2,333 Net assets and equity 21,600 2.40 9,000
2. Exchange difference
$’000 $’000 Opening net assets: M21.6 m at M2.40 to $1 9,000 Opening net assets: M2.20 to $1 9,818 Increase (exchange gain) 818 Profi t for the period: M7.8 m at M2.35 to $1 3,319 Dividend: M4.4 m at M2.20 to $1 (2,000) 1,319 Added to net assets: (M3.4 m) at M2.20 to $1 1,546 227 1,045 Group share (75%) equals 784 Gain for year on retranslation of goodwill Goodwill at 31 March 20X5 (see above) 625 Goodwill at 31 March 20X6 (balance sheet W2) 682 57 841
SOLUTIONS TO REVISION QUESTIONS F2196

9
Complex Group Structures

This page intentionally left blank

199
9 LEARNING OUTCOME After studying this chapter students should be able to:
� prepare a consolidated income statement and statement of fi nancial position for a group of entities.
9.1 Introduction Our study of consolidated accounts to date has confi ned itself to situations where the investments in group entities (whether they be subsidiaries, associates or joint ventures) have been made by the parent entity. Groups where this is the case have a relatively simple structure. In this chapter, we will consider groups where investments in a particular entity are made in whole or in part by an entity other than the parent entity.
The chapter proceeds as follows: Section 9.2 covers complex groups that include sub-subsidiary interests. Section 9.3 looks at mixed groups of entities, that is those in which a parent holds both a direct and indirect investment in a particular entity. Section 9.4 exam-ines a further complexity which arises where a parent has an indirect investment in an associate or joint venture.
9.2 Accounting for sub-subsidiaries 9.2.1 The basics of preparation of the
consolidated accounts The term ‘ sub-subsidiary ’ refers to a situation where the ultimate parent P has a subsidiary H and H itself has a subsidiary S. S is regarded as a subsidiary of P as well as a subsidiary of H and must therefore be line-by-line consolidated in P’s consolidated fi nancial statements. For accounting purposes, we refer to S as a sub-subsidiary of P.
The fact that S is a sub-subsidiary does not affect the manner in which it is consolidated. However, certain matters do need to be treated with particular care:
● the computation of the non-controlling interest in the sub-subsidiary; ● the effective date of acquisition of the sub-subsidiary;
Complex Group Structures

STUDY MATERIAL F2200
CO
MPL
EX G
ROU
P ST
RUC
TURE
S● the computation of the goodwill on consolidation of the sub-subsidiary; ● the elimination of intra-group investments and investment income when computing the
non-controlling in the subsidiary .
Example 9.A
● P made a 75% investment of $20 million in H on 31.12.W6 when the net assets of H were $24 million (issued capital $12 million plus retained earnings $12 million).
● On 31.12.W7 H made a 60% investment of $10 million in S when the net assets of S were $15 million (issued capital $10 million plus retained earnings $5 million).
● None of the entities has issued new shares since 31.12.W6.● There has been no impairment of goodwill since the acquisitions.● The group policy is to value non-controlling interest at the proportionate share of net assets of the subsidiary.● The summarised statement of fi nancial position of the three entities at 31.12.X0 (the latest statement of fi nancial
position date) were as shown below:
P H S$m $m $m
Investments in subsidiaries 20 10 – Non-current assets 30 20 20 Net current assets 10 6 5
60 36 25 Issued capital 30 12 10 Retained earnings 30 24 15
60 36 25
Solution
The summarised consolidated statement of fi nancial position of the P group at 31.12.X0, together with appropriate workings, is:
$’000 CommentGoodwill on consolidation 2,750 W2 Non-current assets 70,000 Simple aggregation of P, H and S Net current assets 21,000 Simple aggregation of P, H and S
93,750 Issued capital 30,000 P only Retained earnings 43,500 W3
73,500 Non-controlling interests 20,250 W1
93,750
Workings 1. Non-controlling interests
The overall group structure is shown in the diagram below:
Therefore the effective interest of P in S is (75% � 60% �) 45%. The non-controlling interest is 55%. The non-controlling interest in S should be based on this effective interest of 55%.
The non-controlling interest calculation for H will not attribute any of the investment in S to the non-controlling interest. This is because the investment in S does not appear in the consolidated statement of fi nancial posi-tion and the purpose of the non-controlling interest calculation is to compute their interest in the net assets that
P
H
S
75%
60%

201FINANCIAL MANAGEMENT
CO
MPLEX G
ROU
P STRUC
TURES
do appear there. The cost of the investment in the subsidiary is therefore deducted from the NCI calculation. Therefore the non-controlling interest calculation is:
● In H: 25% � ($36 m � $10 m) � $6.5 m.● In S: 55% � $25 m � $13.75 m.
So the total non-controlling interest is $20.25 million ($6.5 m � $13.75 m).2. Goodwill on consolidation
P in H H in S $’000 $’000
Cost of investment 20,000 10,000 Investing entity share (75%/60%) of net assets at date of investment (18,000) (9,000) Goodwill 2,000 1,000 Amount attributable to P – the ultimate parent (see below) 2,000 750
The total for goodwill is $2 m � $750,000 � $2,750,000. Notice the two-stage approach to the cal-culation of goodwill relating to S in P’s consolidated accounts. First we calculate the goodwill relating to H’s investment in S (of 60%). Then we relate the goodwill we have calculated to the effective interest of P in S: (75% � 60% � ) 45%. P’s share of the goodwill being 75% � 1,000,000.
3. Retained earnings The consolidated retained earnings fi gure is:
$’000 From P 30,000 From H [75% � ($24 m � 12 m)] 9,000 From S [45% � ($15 m � $5 m)] 4,500
43,500
The key factor to bear in mind when preparing the consolidated income statement is to use the correct percent-age when computing the non-controlling interest in the sub-subsidiary. It is also necessary to eliminate any intra-group investment income when computing the non-controlling interest in the subsidiary .
The income statements of P, H and S for the year ended 31 December 20X0 are as follows:
P H S$m $m $m
Revenue 100 80 60 Cost of sales (50) (40) (30) Gross profi t 50 40 30 Other operating expenses (25) (20) (15) Investment income (intra-group) 6 3 – Profi t before tax 31 23 15 Income tax expense ( 9) (6) ( 5 ) Profi t for the period 22 17 10
Solution
Consolidated income statement for the year ended 31 December 20X0
$m Revenue (P � H � S) 240 Cost of sales (P � H � S) (120) Gross profi t 120 Other operating expenses
(P � H � S) (60) Profi t before tax 60 Income tax expense (P � H � S) (20) Profi t for the peiod 40
Attributable to: Equity holders of the parent 31 Non-controlling interest (W1) 9
40

STUDY MATERIAL F2202
CO
MPL
EX G
ROU
P ST
RUC
TURE
S Workings 1. Non-controlling interest
$m Non-controlling interest in H is 25% ($17 m 2 intra-group investment income of $3 m)
3.5
Non-controlling interest in S is 55% (effective interest) 3 $10 m
5.5
Total 9.0
The consolidated statement of changes in equity does not cause any particular additional problems. The prin-ciple for all subsidiaries (including sub-subsidiaries) is that only the group share of any post-acquisition changes should be included.
Summarised statements of changes in equity for the three entities for the year ended 31 December 20X0
P H S$m $m $m
Balance at start of the period 48 27 20 Net profi t for the period 22 17 10Dividends (10) (8) (5) Balance at end of the period 60 36 25
Solution
Consolidated statement of changes in equity
Attributable to equity holders of the parent
Non-controlling interest Total equity
$m $m $m Balance at the start of the period (W1) 52.5 15.25 67.75 Profi t for the period 31.0 9.0 40.0 Dividends (W2) (10.0) (4.0) (14.0) Balance at the end of the year 73.5 20.25 93.75
Workings 1. Balance at the start of the period
Attributable to equity shareholders of the parent
$mP 48.0H [75% � ($27 m � $24 m)] 2.25 S [45% � ($20 m � $15 m)] 2.25
52.55 Attributable to non-controlling interest
$m H [25% � ($27 � $10m)] 4.25 S (55% � $20m) 11.25
15.25 2. Dividends paid to the non-controlling interest
$mH (25% � 8) 2 S (40% � 5) 2 4
9.2.2 Date of acquisition of sub-subsidiary In the above example, the date P ‘ acquired ’ S was 31.12.X7. This was because on that date H bought shares in S and H was at that time a subsidiary of P.

203FINANCIAL MANAGEMENT
CO
MPLEX G
ROU
P STRUC
TURES
However, if H had bought the shares in S before it became a subsidiary of P (say on 31.12.X5) then this date could not be the date that P ‘ acquired ’ S, because on 31.12.X5 H and S were nothing to do with P.
In these circumstances, S would effectively become a subsidiary of P on the same date that H became a subsidiary of P – 31.12.X6 in the above example.
9.3 Mixed groups A mixed group is one in which a parent has both a direct and an indirect investment in a particular subsidiary. In such situations, both the non-controlling interest and the goodwill must be worked out in two stages.
Example 9.B
Statement of fi nancial position of P, Q and R at 31 December 20X0
P Q R$’000 $’000 $’000
Investment in Q 25,200 Investment in R 10,000 10,600 Property, plant and equipment
53,800 53,400 49,000
Current assets 24,000 21,000 15,000 113,000 85,000 64,000
Issued capital ($) shares) 30,000 20,000 16,000 Share premium account 20,000 10,000 8,000 Retained earnings 35,000 30,000 20,000
85,000 60,000 44,000Loans 20,000 18,000 15,000 Current liabilities 8,000 7,000 5,000
113,000 85,000 64,000
Details regarding intra-group investments are as follows:
Entities No. of shares
acquired Date shares acquired
Accumulated profi ts at acquisition date
£’000 $’000 P in Q 12,000 1.1.X6 10,000 P in R 4,000 1.1.X8 12,000 Q in R 4,800 1.1.X7 8,000
● All share premium accounts arose prior to 1.1.X6.● There has been no impairment of goodwill on consolidation in respect of any of the acquisitions.● NCI is valued at the proportionate share of the FV of the net assets of the subsidiary.
Before we prepare the consolidated statement of fi nancial position, note the group structure:
H
S
T
45/60 = 75%
30/50 = 60%

STUDY MATERIAL F2204
CO
MPL
EX G
ROU
P ST
RUC
TURE
S Notice that P controls 55% of the voting shares of R so R is a subsidiary. The effective interest of P in R is 25% � [60% � 30%] � 43%. The non-controlling interest percentage is 57.
Solution
The consolidated statement of fi nancial position of the P group at 31 December 20X0 is shown below. Unless otherwise indicated, all the fi gures on the net assets side are aggregations:
$’000ASSETS Goodwill on consolidation (W2) 2,800 Property, plant and equipment 156,200 Current assets 60,000
219,000
EQUITY & LIABILITIES Issued capital (P only) 30,000 Share premium account (P only) 20,000 Retained earnings (W3) 51,160
101,160 Non-controlling interests (W1) 44,840
146,000Loans 53,000 Current liabilities 20,000
219,000
Workings 1. Non-controlling interest
$’000 In Q – 40% ($60,000,000 � $10,600,000) 19,760 In R – 57% � $44,000,000 25,080 Total 44,840
2. Goodwill on consolidation
P in Q P in R Q in R $’000 $’000 $’000 $’000 $’000 $’000
Cost of investment 25,200 10,000 10,600 Net assets at acquisition: Issued capital 20,000 16,000 16,000 Share premium 10,000 8,000 8,000 Retained earnings 10,000 12,000 8,000
40,000 36,000 32,000 Investor’s share (24,000) (9,000) (9,600) Goodwill 1,200 1,000 1,000 Amount relating to P 1,200 1,000 600
Total goodwill on consolidation � $1,200 � 1,000 � 600 � $2,800 (all fi gures in $’000s)
3. Consolidated retained earnings
$’000 Reserves of P 35,000 Share of post-acquisition retained earnings of:
Q [60% ($30 m � $10 m)] 12,000 R – direct [25% ($20 m � $12 m)] 2,000 R – indirect [18% ($20 m � $8 m)] 2,160
51,160

205FINANCIAL MANAGEMENT
CO
MPLEX G
ROU
P STRUC
TURES
9.4 Indirect investment in associates or joint ventures
Where there is an indirect investment in an associated undertaking then the question arises as to what proportion of the net assets and profi ts of the associate should be initially included in the consolidated fi nancial statements of the parent. Where the investor is a group the relevant share is the aggregate of the holdings of the parent and the subsidiaries in the entity. Any holdings of the group’s other associates or joint ventures should be ignored for this purpose.
Example 9.C
Summarised statements of fi nancial of H, S and A as at 31 December 20X0
H S A$’000 $’000 $’000
Investments 23,500 10,000 Property, plant and equipment 20,000 22,000 25,000 Net current assets 8,000 6,000 5,000
51,500 38,000 30,000
Issued capital ($1 shares) 20,000 15,000 10,000 Retained earnings 31,500 23,000 20,000
51,500 38,000 30,000
Notes 1. On 31 December 20X5, when the retained earnings of S showed a balance of $11 million, H purchased
12 million shares in S for $23.5 million. 2. On 31 December 20X6, when the retained earnings of A showed a balance of $12 million, S purchased
4 million shares in A for $10 million. 3. There has been no impairment of goodwill on consolidation since the acquisitions took place.
Prepare the consolidated balance sheet of H at 31 December 20X0. 4. It is group policy to value non-controlling interest at acquisition at the proportionate share of the fair value of
the subsidiary’s identifi able net assets.
RequirementPrepare the summarised consolidated statement of fi nancial position of H at 31 December 20X0.
SolutionBefore we prepare the consolidated statement of fi nancial position it is worth identifying the group structure:
H
S
A
80%
40%

STUDY MATERIAL F2206
CO
MPL
EX G
ROU
P ST
RUC
TURE
S When we calculate share of net assets and share of profi ts of A in a situation like this, we take the aggregate group share before allowing for non-controlling interests. Therefore in this example the group share is 40%. This treatment means that the non-controlling interest in S will need to be credited with their share of the net assets of A at the statement of fi nancial position date.
Summarised consolidated statement of fi nancial position of H as at 31 December 20X0
$’000 Goodwill on consolidation of S (W2) 2,700 Investment in associate (W3) 12,960Property, plant and equipment (H � S) 42,000 Net current assets (H � S) 14,000
71,660
Issued capital (H only) 20,000 Retained earnings (W4) 43,660
63,660 Non-controlling interest (W1) 8,000
71,660
Workings 1. Non-controlling interest
$’000 Net assets of S as shown in S’s balance sheet 38,000 Deduct cost of investment in A (10,000) Add share (40%) of net assets of A at 31.12.X0 12,000 40,000 Non-controlling interest (20%) 8,000
Notice that the non-controlling interest are credited with an interest in the net assets of A in the same man-ner that those net assets are reported in the consolidated statement of fi nancial position.
2. Goodwill on acquisition
H in S $’000 $’000
Cost of investment 23,500 Net assets at date of investment:
Share capital 15,000 Retained earnings 11,000
26,000 Investing entity’s share
(80%) (20,800) Goodwill 2,700
3. Investment in A As a fi rst step we need to calculate the goodwill on acquisition of the associate, and then to calculate the element of it that relates to the 20% non-controlling holders of S’s equity.
$’000 $’000 Cost of investment 10,000 Net assets at date of investment Share capital 10,000
Retained earnings 12,000 22,000
40% of net assets (40% � 22,000) (8,800) Goodwill on acquisition 1,200

207FINANCIAL MANAGEMENT
CO
MPLEX G
ROU
P STRUC
TURES
Of this 20% relates to the non-controlling interest: $1,200 � 20% � $240. This is deducted in calculating the investment in associate, as follows:
Investment at cost 10,000 Less : amount of goodwill relating to non-controlling interest
(240)
Add : group share of post-acquisition profi ts (8,000 � 40%) 3,200 Investment in associate 12,960
It should be noted, however, that IAS 28 is not prescriptive in respect of the treatment of an associate entity over which a subsidiary exerts signifi cant infl uence. There are other potentially valid approaches that might be taken, and these would be given appropriate credit in an examination.
4. Retained earnings
$’000H 31,500 S [80% ($23 m � $11m)] 9,600 A [32% ($20 m � $12 m)] 2,560
43,660
Notice that, having attributed the minority shareholders their share of the net assets of A, the fi nal share of retained earnings that is taken to consolidated retained earnings is the effective interest of H in A: (80% � 40% �) 32%.
9.5 Summary This chapter has examined some relatively complex areas of group accounting. Students should ensure that they understand the principles underlying accounting for complex group structures.
Examination questions can be expected that incorporate various aspects of the material covered in this chapter.

This page intentionally left blank

209
Revision Questions 9Question 1
Statement of fi nancial positions as at 31.12.X0
H S T $ $ $
45,000 shares in S 65,000 30,000 shares in T 55,000 Net assets 80,000 33,000 75,000
145,000 88,000 75,000
Issued capital ($1 shares) 100,000 60,000 50,000 Retained earnings 45,000 28,000 25,000
145,000 88,000 75,000
The intra-group shareholdings were acquired on 1.1.X3 when S retained earnings were $10,000 and T retained earnings were $8,000. Goodwill on consolidation has remained unimpaired since acquisition.
RequirementPrepare the consolidated statement of fi nancial position as at 31 December 20X0.
(10 marks)
Question 2
Consider the following scenarios regarding disposals:
(a) F owns 70% of the equity shares of G and G owns 30% of the equity shares of H. G is a subsidiary of F and H is an associate of G. All entities prepare fi nancial statements to 31 March. F has no other investments. Ignore goodwill on consolidation.
Just before 31 March 20X5, G sold some goods to F and made a profi t of $250,000 on the sale. These goods were in the inventory of F at 31 March 20X5. This is the only trading between the entities during the year ended 31 March 20X5. None of the entities has paid or proposed any dividends in the year. The profi t after tax of the three entities in the year ended 31 March 20X5 is:
● F $8 million ● G $4 million ● H $3.2 million

CO
MPL
EX G
ROU
P ST
RUC
TURE
S
REVISION QUESTIONS F2210
What is the non-controlling interest that will be shown in the consolidated income statement of F for the year ended 31 March 20X5?
(b) The FG group of entities comprises FG and its subsidiaries, HI and JK. FG acquired 80% of HI’s ordinary shares on 31 December 20X3, when the retained
earnings of HI stood at $10,000,000, and the retained earnings of JK stood at $7,600,000.
HI acquired 75% of JK’s ordinary shares on 31 December 20X2, when the retained earnings of JK stood at $7,000,000.
At 31 December 20X6, HI’s retained earnings stood at $12,200,000, and JK’s retained earnings stood at $10,600,000.
There have been no other acquisitions and disposals in the group, and no impair-ments of goodwill or intra-group trading adjustments have been recorded.
How much profi t has been added to consolidated retained earnings in the FG group in respect of the investments in HI and JK between acquisition and 31 December 20X6?
(c) CXP owns 75% of the ordinary share capital of its subsidiary, DYQ. The shares were acquired on 1 November 20X7 when DYQ’s retained earnings stood at $152,000. DYQ acquired a 65% investment in its subsidiary, EZR, on 1 May 20X7. EZR’s retained earnings were $189,000 on 1 May 20X7, and $202,000 on 1 November 20X7.
Retained earnings for the three entities at 31 October 20X6, the entities ’ year end, were as follows:
$ CXP 266,000 DYQ 178,000 EZR 214,000
There had been no impairment of goodwill in respect of either investment since acquisition.
Calculate the balance of consolidated retained earnings for inclusion in the consolidated statement of fi nancial position of the group at 31 October 20X8. (10 marks)
Question 3On 1 April 20X1 Machinery bought 80% of the issued capital of Components and on 1 April 20X3 Machinery was itself taken over by Sales, which purchased 75% of the ordi-nary shares in Machinery.
Machinery and Components are unquoted entities. The investments made by Sales are held as Available for Sale investments and since no reliable measure of their fair value is possible, they are subsequently measured at cost.
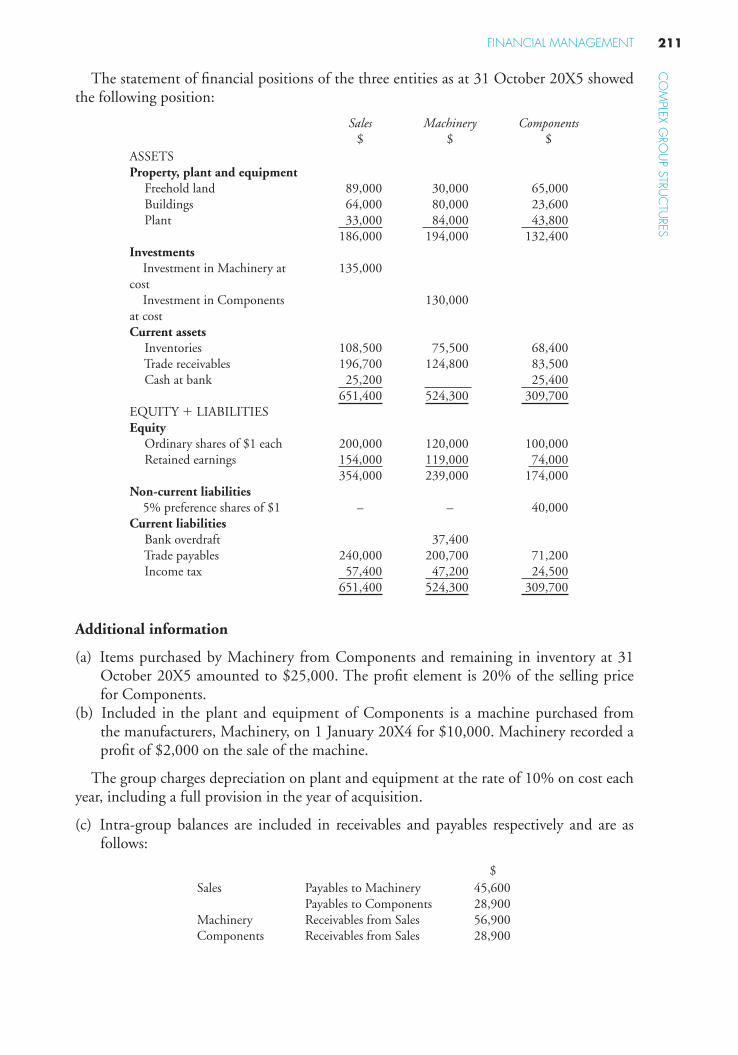
CO
MPLEX G
ROU
P STRUC
TURES
211FINANCIAL MANAGEMENT
The statement of fi nancial positions of the three entities as at 31 October 20X5 showed the following position:
Sales Machinery Components $ $ $
ASSETS Property, plant and equipment Freehold land 89,000 30,000 65,000 Buildings 64,000 80,000 23,600 Plant 33,000 84,000 43,800
186,000 194,000 132,400 Investments Investment in Machinery at cost
135,000
Investment in Components at cost
130,000
Current assets Inventories 108,500 75,500 68,400 Trade receivables 196,700 124,800 83,500 Cash at bank 25,200 25,400
651,400 524,300 309,700 EQUITY � LIABILITIES Equity Ordinary shares of $1 each 200,000 120,000 100,000 Retained earnings 154,000 119,000 74,000
354,000 239,000 174,000 Non-current liabilities 5% preference shares of $1 – – 40,000 Current liabilities Bank overdraft 37,400 Trade payables 240,000 200,700 71,200 Income tax 57,400 47,200 24,500
651,400 524,300 309,700
Additional information
(a) Items purchased by Machinery from Components and remaining in inventory at 31 October 20X5 amounted to $25,000. The profi t element is 20% of the selling price for Components.
(b) Included in the plant and equipment of Components is a machine purchased from the manufacturers, Machinery, on 1 January 20X4 for $10,000. Machinery recorded a profi t of $2,000 on the sale of the machine.
The group charges depreciation on plant and equipment at the rate of 10% on cost each year, including a full provision in the year of acquisition.
(c) Intra-group balances are included in receivables and payables respectively and are as follows:
$ Sales Payables to Machinery 45,600
Payables to Components 28,900 Machinery Receivables from Sales 56,900 Components Receivables from Sales 28,900

CO
MPL
EX G
ROU
P ST
RUC
TURE
S
REVISION QUESTIONS F2212
(d) A cheque drawn by Sales for $11,300 on 28 October 20X5 was received by Machinery on 3 November 20X5.
(e) At 1 April 20X1, retained earnings in Machinery were $28,000 and in Components were $20,000. At 1 April 20X3 the fi gures were $40,000 and $60,000 respectively.
(f ) Goodwill was completely written off some year ago following an impairment review.
RequirementPrepare the consolidated statement of fi nancial position as at 31 October 20X5 for Sales and its subsidiaries. (25 marks)

213
Solutions to Revision Questions
Solution 1 Group structure:
Consolidation %
S Group share 75% Non-controlling interest share 25% T Group share 75% � 60% 45% Non-controlling interest share 55%
Consolidated statement of fi nancial position at 31 December 20X0
$ Net assets 188,000 Goodwill on consolidation 27,650 (W3)
215,650 Capital and reserves Issued capital 100,000 Retained earnings 66,150 (W2) Non-controlling interest 49,500 (W1)
215,650
9S
M
C
75% 1 April 20 X 3
80% 1 April 20 X 1

CO
MPL
EX G
ROU
P ST
RUC
TURE
S
SOLUTIONS TO REVISION QUESTIONS F2214
Workings 1. Non-controlling interest
Share of net assets $ S: 25% � 88,000 22,000 T: 55% � 75,000 41,250 Non-controlling share of cost of investment in T 25% � 55,000 (13,750) 49,500
2. Consolidated reserves
$ Reserves of H 45,000 Group share of post-acquisition profi ts S: 75% � (28,000 � 10,000) 13,500 T: 45% � (25,000 � 8,000) 7,650 66,150
3. Goodwill
S T $ $
Consideration 65,000 55,000 Net assets acquired S: 75% � (60,000 � 10,000) 52,500 T: 60% � (50,000 � 8,000) 34,800 12,500 20,200
H’s share (100%/75%) 12,500 15,150 Total 27,650
Solution 2 (a) The non-controlling interest is 30% [($4,000,000 � $250,000) � (30% �
$3,200,000)] � $1,413,000.(b) Since the group was formed on 31 December 2001 the following amounts of profi t
have been added to consolidated retained earnings in respect of the investments in HI and JK: Consolidation %
$ HI: 80% � ($12.2 m � $10 m) � 1,760,000JK: 60% � ($10.6 m � $7.6 m) � 1,800,000
3,560,000
(c) CXP: Consolidated retained earnings
$ CXP’s own retained earnings 266,000DYQ: ($178,000 � $152,000) � 75% 19,500 EZR: ($214,000 � $202,000) � 75% � 65% 5,850
291,350

CO
MPLEX G
ROU
P STRUC
TURES
215FINANCIAL MANAGEMENT
Solution 3 Group structure:
The effective interest is S in C is (75% � 80% � ) 60 per cent. The MI is 40 per cent.
Consolidated statement of fi nancial at 31 October 20X5
ASSETS $ $ Property, plant and equipment Land 184,000 Buildings 167,600 Plant (160,800 � PUP 1,600) 159,200
510,800 Current assets Inventory (252,400 � PUP 5,000) 247,400 Receivables (405,000 � intra-group 56,900 � 28,900) 319,200 Cash in hand 50,600
617,200 1,128,000
EQUITY � LIABILITIES Equity Issued capital 200,000 Retained earnings 200,950 Non-controlling interest 94,450
495,400 Non-current liabilities 40,000 Current liabilities Overdraft (37,400 � cash in transit 11,300) 26,100 Payables (511,900 � intra-group 45,600 � 28,900) 437,400 Income tax 129,100
592,600 1,128,000
Workings 1. Provision for unrealised profi t on inventory
20% � 25,000 � 5,000
Adjust reserves of Components – entity that made the sale.
2. Provision for unrealised profi t on plant
$ Profi t originally recorded 2,000 Realised via extra depreciation charges 2/10 � 2,000 (400) Provision now required 1,600
Adjust reserves of Machinery – entity that made the sale.
H
S
T
45/60 = 75%
30/50 = 60%

CO
MPL
EX G
ROU
P ST
RUC
TURE
S
SOLUTIONS TO REVISION QUESTIONS F2216
3. Non-controlling interest
$ Machinery 25% � (239,000 � PUP 1,600) 59,350 Components Ordinary 40% � (214,000 � 40,000 � PUP 5,000) 67,600 Cost of investment in C made by M 25% � 130,000 (32,500) 94,450
4. Retained earnings
$ Sales 154,000 Machinery 75% � (119,000 � 40,000 � PUP 1,600) 58,050 Components 60% � (74,000 � 60,000 � PUP 5,000) 5,400 Less: goodwill written off (W5) (16,500) 200,950
5. Goodwill
M C $ $
Consideration 135,000 130,000 Net assets acquired 75% of (120,000 � 40,000) 120,000 80% of (100,000 � 60,000) 128,000 15,000 2,000 Amount relating to Sales (100%/75%) (all written off following impairment review) 15,000 1,500

10
Substance Over Form

This page intentionally left blank

219
10
LEARNING OUTCOMES
� discuss the principle of substance over form applied to a range of transactions; including:● Sale and repurchase agreements;● Consignment stock;● Debt factoring;● Securitised assets and loan transfers;
10.1 IntroductionIn this chapter we will consider the principles of reporting the substance of transactions and not their legal form. The terms of transactions will be scrutinised to determine how a transaction should be recorded and where appropriate the correcting entries that are required. Specifi c transactions will then be considered that commonly raise the issue of substance over form.
10.2 Principles of substance over formThere is no specifi c international fi nancial reporting standard that deals with the topic of substance over form. The IASB Framework describes the principle: ‘If information is to represent faithfully the transactions and other events that it purports to represent, it is nec-essary that they are accounted for and presented in accordance with their substance and economic reality and not merely their legal form’.
Substance Over Form

STUDY MATERIAL F2220
SUBS
TAN
CE
OVE
R FO
RM IAS 18 Revenue and IAS 39 Financial Instruments: Recognition and Measurement also contain some elements that are relevant to a consideration of substance over form. These will be considered later in the chapter.
10.2.1 Off-balance-sheet financingOften the motivation behind transactions that require adjustment for substance over form is the avoidance of liabilities on the statement of fi nancial position. Motivations for keep-ing fi nancing off the statement of fi nancial position include the following:
1. Effect on the gearing (leverage) ratio. If an entity is able to exclude liabilities from its statement of fi nancial position it can manipulate the gearing ratio to the lowest possible level. High gearing levels tend to have adverse effects on share prices because the share is perceived by the market as riskier.
2. Borrowing capacity. The lower the level of liabilities recorded on the statement of fi nan-cial position, the greater the capacity for further borrowings.
3. Borrowing costs. An entity with an already high level of borrowings will pay a risk pre-mium for further borrowing in the form of a higher interest rate.
4. Management incentives. Bonuses and performance-related pay may be based upon reported earnings for a period. If an entity is able to benefi t from off-balance-sheet fi nancing arrangements, costs may be lower, thus improving earnings.
10.2.2 Applying substance over formWhen assessing the validity of a transaction and its effects, it is important to consider the commercial sense of the transaction. Ask yourself:
● Does this make economic sense? – e.g. selling a property for less than market value.● With what I know about business, does this make commercial sense? – e.g. why would
a fi nancial institution purchase a factory that it will not use and then plans to resell it to the previous owner.
● Which party holds the signifi cant risks and rewards associated with the asset/liability? – has a party recorded a sale but will still be subject to the loss if the asset falls in value?
Often the legal aspects of the transaction are perfectly valid however to achieve a fair pres-entation of the fi nancial statements we must adopt the principles of substance over form.
Identifying the signifi cant risks and rewards associated with assets and liabilities is the key to establishing the appropriate treatment of transactions.
Consider the following example:
Example 10.A
A sells a machine to B for $20,000 and at the same time agrees to buy it back in 1 year’s time for $21,800. The machine remains on A’s premises and A continues to use and to insure the machine.
These related transactions are likely to arouse some suspicion. What is actually going on here?In legal terms, following the fi rst transaction, B is clearly the owner of the machine. However, the substance
of the transaction is that A retains the risks and rewards of ownership, and effectively, has taken out a loan for a year at an interest rate of 9%.

221FINANCIAL MANAGEMENT
SUBSTA
NC
E OVER FO
RMCorrecting accounting treatment
Applying the principle of substance over form, A should continue to carry the asset in its statement of fi nancial position, with a corresponding liability to B. B would record the loan as a receivable in its own statement of fi nancial position.
Why might this distinction between substance and form matter? What is the motivation for A to keep the loan off the statement of fi nancial position?
Let us extend the example a little further. A is fi nanced partly by long-term borrowing of $30,000. One of the conditions under which the loan was made (the ‘covenant’) was that A’s total liabilities, both long- and short-term should not exceed $80,000. Extracts from two versions of A’s statement of fi nancial position, one drawn up to show substance over form and the other to show legal form after the transaction are as follows:
Substanceover form Legal form
$ $Non-current assets 100,000 80,000Current assets 85,000 85,000
185,000 165,000Capital and reserves 90,000 90,000Long-term borrowing 30,000 30,000Current liabilities 65,000 45,000
185,000 165,000
The statement of fi nancial position prepared adopting the principle of substance over form shown total liabili-ties of $30,000 �$65,000 � $95,000. This clearly breached the terms of the covenant. The statement of fi nancial position prepared according to strict legal form, on the other hand, shown total liabilities of $30,000 � $45,000 � $75,000. The terms of the covenant, technically, have not been breached.
The key to applying the principle of substance over form is to fully appreciate the princi-ples of:
● Revenue recognition; and● Recognition and derecognition of assets and liabilities.
10.3 Recognition of RevenueThe detailed provisions of the IASB’s framework and IAS 18 Revenue are not specifi cally tested in F2. The principles they contain, however are often essential benchmarks for deciding substance over form on sale versus fi nancing transactions.
The IASB’s Framework for the Preparation and Presentation of Financial Statements pro-vides a defi nition of income, as follows:
… income encompasses both revenue and gains. Revenue arises in the course of the ordinary activities of an entity and is referred to by a variety of different
names including sales, fees, interest, dividends, royalties and rent. Gains represent other items that meet the defi nition of income and may, or may not, arise in the course of the ordinary activities of an entity.

STUDY MATERIAL F2222
SUBS
TAN
CE
OVE
R FO
RM IAS 18 specifi cally concerns itself with revenue and expressly excludes gains from consid-eration. It encompasses revenue arising from three kinds of transactions and events:
1. the sale of goods;2. the rendering of services;3. the use by others of the assets of the entity, yielding interest, royalties and dividends.
10.3.1 Revenue recognition: sale of goodsRevenue is recognised from the sale of goods, provided that all of the conditions below have been satisfi ed:
● the signifi cant risks and rewards of ownership have been transferred to the buyer;● the entity retains no effective control over the goods sole, not does it retain any signifi -
cant degree of the managerial involvement normally associated with ownership;● revenue can be measured reliably;● it is probable that the economic benefi ts associated with the transaction will fl ow to the
entity;● the costs associated with the transaction can be measured reliably.
The standard notes that, in most cases, the transfer of risks and rewards in the transac-tion takes place at the same time as the passing of possession to the buyer, or the transfer of legal title. Therefore, when goods are shipped, for example, the point of recognition would normally be the point at which the goods pass into the control of the purchaser. However, the point at which revenue can be recognised may, in some cases, be more diffi -cult to establish. In complex cases it will be necessary to assess carefully where the risks and rewards of ownership reside.
In Example 10.A, there was an apparent sale of a machine, but it was noted that the seller, A, retained the risks and rewards of ownership.
10.3.2 Revenue recognition: sale of servicesRevenue associated with transactions involving the rendering of services should be recog-nised by reference to the state of completion of the transaction at the year end date. Again, a consideration of the substance of the transaction should be undertaken.
A special problem in relation to revenue recognition arises where an agent acts as an intermediary on behalf of a principal, collecting a commission for arranging provision of goods or services.
Example 10.B
X is an advertising agency. It acts as intermediary in arranging magazine advertisements. A single page dis-play in a nationally distributed women’s magazine cost $3,000. The magazine publisher invoices the agency $3,000 less the agency’s commission of 15%: the net amount of the invoice received by X is, therefore, $2,550 ($3,000 less commission of $450).
X sends an invoice to the advertiser for the full cost of the magazine page, that is, $3,000. There is a related cost of $2,550 payable to the magazine publisher. How much revenue should be recognised by X? There are two possibilities depending upon whether or not X is classed as an agent:
1. Revenue of $3,000 is recognised, together with related costs of $2,550 (presentation of turnover as a principal).2. Revenue of $450 is recognised (presentation of turnover as an agent).

223FINANCIAL MANAGEMENT
SUBSTA
NC
E OVER FO
RMClearly, there is quite a signifi cant distinction between the two modes of presentation. In determining which
mode is appropriate for X, we can examine the transaction from the risks and benefi ts perspective. A principal is exposed to all the risks and benefi ts associated with the selling price of goods and services. Where, by contrast, a seller acts as an agent, it would not normally be associated with the majority of the risks and benefi ts of the transaction.
In the example of X, the selling price of the services (the cost of a one page display advertisement) is deter-mined by the magazine publisher, not by the advertising agency. The relationship of X to the publisher and to the advertiser appears to be one of agency, and the principles of substance over form would appear to require that X recognises only $450 of revenue in respect of this transaction.
10.4 Recognition and derecognition of assets and liabilities
In order to determine the substance of a transaction it is necessary to identify whether or not it has given rise to new assets or liabilities or has increased or decreased existing assets and liabilities. The existence of an asset may be indicated where an entity derives benefi t and is exposed to the element of risk inherent in the benefi t. The existence of a liability is indicated where an entity is unable to avoid, legally or commercially, an outfl ow of eco-nomic benefi ts.
10.4.1 Recognition of assets and liabilitiesThe recognition of assets and liabilities is covered in the Framework for the Preparation and Presentation of Financial Statements. Where a transaction has resulted in an item that meets the defi nition of an asset or liability, it should be recognised if:
● there is suffi cient evidence of the existence of the item;● the item can be measured at a monetary amount with suffi cient reliability.
The Framework for the Preparation and Presentation of Financial Statements defi nes assets and liabilities as follows:
● assets are rights or other access to future economic benefi ts controlled by an entity as a result of past transactions or events;
● liabilities are an entity’s obligation to transfer economic benefi ts controlled by an entity as a result of past transactions or events.
10.4.2 Derecognition of assets and liabilitiesWhere an asset is sold in an outright sale, where all rights and rewards of ownership are transferred and no risks are retained, derecognition (i.e., removal of the asset from the statement of fi nancial position of the transferor) is clearly appropriate. However, where conditions are attached to the transfer, the substance of the transaction must be exam-ined carefully. It may be that each party has access to some of the benefi ts and subject to some of the risks. In this case it is important to assess which are the signifi cant risks and rewards, e.g. in property the main rewards are the cash fl ows likely from its operation and the potential for increases in the value of the asset. The main risks are a fall in the value and obsolescence.
In Example 10.A we examined the case of a business (A) that sold a tangible non-currentasset to another entity with a right of repurchase at a higher price in 1 year’s time. We

STUDY MATERIAL F2224
SUBS
TAN
CE
OVE
R FO
RM identifi ed that the substance of this transaction was that of a lending arrangement, not a sale. In that case there was no derecognition of the asset, it should remain in A’s fi nancial statements.
Financial assets and liabilitiesDerecognition of fi nancial assets and liabilities is covered by IAS 39 Financial Instruments: Recognition and Measurement.
Derecognition may arise, under IAS 39, where a fi nancial asset or fi nancial liability is transferred. This will normally occur where the entity has transferred the contractual rights to the cash fl ows receivable. Financial liabilities should be derecognised only when the obligation which originated the liability is completely extinguished. (See Chapters 11 of this Learning System for more on accounting for fi nancial instruments).
A transferred fi nancial asset should not be derecognised where the transferor has a right to reacquire the transferred asset. Consider the details of the examples below:
Example 10.C
In its fi nancial year ending 31 December 20X4, J enters into the following transactions in respect of its mortgage loans portfolio.
1. J transfers a set of mortgage loans to K, in exchange for $250,000. In 1 year’s time J will be able to repur-chase the loans from K for a fi xed sum of $280,000.
2. J transfers a set of mortgage loans to L, in exchange for $250,000. If L decides subsequently to sell the port-folio of mortgage loans, an agreement between J and L stipulates that J has a right of fi rst refusal to reacquire the portfolio and that the re-acquisition price would be the fair value at the time.
Should the mortgage loans be derecognised as fi nancial assets?In the fi rst case, the answer is almost certainly that the assets should continue to be recognised in the books
of J. This is a very similar situation to the one outlined in Example 10.A. In the second case, the fi nancial assets would probably be derecognised. The reacquisition terms are vague and it is by no means certain that any reacquisition would ever take place. Also, the fact that there is no fi xed price for a subsequent reacquisition is a infl uential factor in the decision.
10.5 Substance over form: casesThe following section provides illustrations of how substance over form is applied to spe-cifi c transactions. The transactions covered are:
● Sale and repurchase agreements● Consignment stock● Factoring of receivables● Securitised assets and loan transfers.
10.5.1 Sale and repurchase agreementsIt is important to consider the terms of the arrangement and whether or not a sale has actually taken place. An assessment of the main risks and rewards will normally focus on the value and ultimate use of the asset being ‘sold’. Consider the commercial sense of the transaction – would a fi nancing company use the asset itself or is it just lending using the asset as security?

225FINANCIAL MANAGEMENT
SUBSTA
NC
E OVER FO
RM
Example 10.D
On 1 February 20X4 BJ sold a freehold interest in land to a fi nancing institution for $7.2 million. The contractual terms require that BJ will repurchase the freehold on 31 January 20X7 for $8.82 million. BJ has the option to repurchase on 31 January 20X5 for $7.7 million or on 31 January 20X6 for $8.24 million. Prior to the disposal the land was recorded at its carrying value of $6 million in BJ’s accounting records. The receipt of $7.2 million has been recorded with a credit to suspense account. No other accounting entries have been made in respect of this transaction.
At 31 January 20X5, BJ’s directors decide not to take up the option to repurchase.
Requirement
Briefl y explain the substance of this transaction, and prepare journal entries to record it correctly in the account-ing records of BJ for the year ended 31 January 20X5.
Solution
The substance of the transaction is that BJ has borrowed $7.2 million against the security of freehold land. The land will be repurchased by BJ and the price it will pay increases over time. In this case, the increase each year in the repayable amount refl ects an interest charge. IAS 39 Financial Instruments: Recognition and Measurement requires initial recognition of the liability, and the related interest expense should be recognised over the relevant period. This is accounted for in the year ended 31 January 20X5 as follows:
$’000 $’000DR Suspense account 7,200CR Non-current liabilities 7,200DR Interest expense for year ($7.7 2 7.2 m)
500
CR Non-current liabilities 500
10.5.2 Consignment stockConsignment stock is held by one party but owned by another. For example, motor deal-ers commonly hold inventory in the form of cars on their premises which will be either sold to customers or returned unsold to the manufacturer. There are benefi ts to both man-ufacturer and dealer in this type of arrangement. The dealer has access to a wider range of stock than would be possible if he or she were required to make a commitment to pur-chase, and the manufacturer avoids the costs of holding large quantities of inventory.
Which party, manufacturer or dealer, receives the benefi ts and is exposed to the risks associated with the inventory? The substance of the commercial arrangement must be examined carefully.
The table below shows the risks and benefi ts that may arise, depending upon the nature of the contractual arrangements, for the dealer:
Benefi ts Risks1. The cash fl ow arising from sales2. The right to retain items of inventory
to assist in making sales3. Insulation from price changes after
the inventory has been consigned4. The right to use the inventory for
demonstration purposes
1. The risk of having to retain obsolete inventory
2. The risk of slow movement of inventory, increasing fi nance costs and the risk of obsolescence

STUDY MATERIAL F2226
SUBS
TAN
CE
OVE
R FO
RM Based on this analysis of risks and benefi ts, the substance of the arrangement is identifi ed:
1. Is the substance of the transaction that the inventory is an asset of the dealer?If this is the case, inventory is shown in the dealer’s statement of fi nancial postion and a corresponding liability to the manufacturer is recognised. The dealer in this case bears all the risks and obtains the rewards of ownership.
2. Is the substance of the transaction that the inventory is an asset of the manufacturer?In this case, the dealer will show neither the inventory nor the related liability in his or her statement of fi nancial position.
Example 10.E
AB runs a car dealership. The terms of the agreement between AB and the car manufacturer are as follows:
● The price that AB pays for inventories is fi xed at the date the cars arrive on the forecourt● AB has no right to return the vehicles● Legal title is not held by AB instead legal title passes when the cars are sold to a third party, or AB uses a car
for demonstration purposes● AB pays a fi nance charge to the manufacturer between the date of delivery and the date legal title passes or
the date of return, whichever is earlier.
Solution
The inventories (cars) should be included in the assets of AB as it is subject to the major risks and rewards associ-ated with the cars. The fact that AB pays the price ruling at the date the cars are delivered suggests that is the date of transfer. AB cannot return the cars and therefore retains the main risk of obsolesce and failure to sell. The fi nance charge that is payable to the manufacturer again points to AB having taking ownership of the cars but not yet having paid for them. In substance the inventories should be held on the books of AB and a correspond-ing liability should be shown for the fi nancing element.
10.5.3 Factoring of receivablesFactoring of receivables can be a very useful way of raising cash quickly. However, where such transactions take place it is important to establish their substance. Factoring can be a fi nancing transaction in substance, where cash is advanced against the security of receiv-ables. Or, the transaction may be more in the nature of a working capital shift, where receivables are simply sold on in order to be able to receive cash more quickly.
Factors provide a range of services, and it can be diffi cult to establish the substance of the transaction. Essentially, the key to understanding lies in the ownership of the receiv-able. If the provider of the cash has any opportunity of recourse to the seller (i.e., being able to pass receivables back) the deal probably constitutes a fi nancing arrangement.
Example 10.F
A decides to transfer responsibility for collection of its receivables to a factor, B. The arrangement is that B admin-isters the sales ledger and handles all aspects of collection of the receivables in exchange for an administration fee of 1% of all receivables factored. A factoring account is opened, and A is able to draw in cash up to 75% of the receivables factored. The account is credited with cash received when the receivables are realised. It is debited with an interest charge of between 5% and 7.5% depending upon the speed of payment of the receiva-bles. Any receivables not recovered after 90 days are resold to A and credited back to the factoring account.

227FINANCIAL MANAGEMENT
SUBSTA
NC
E OVER FO
RMSolution
In this example, A (the seller) bears the risk of slow payment, as refl ected in the interest rate and the repurchase of slow debts. This type of arrangement is essentially a fi nancing one, and should be refl ected as a separate asset and liability in the statement of fi nancial postion of A.
10.5.4 Securitised assets and loan transfersThese are similar in nature to factoring of receivables, where a loan asset is transferred to a third party as a way of securitising fi nance. The benefi ts associated with the asset are the future cash fl ows from the repayments and associated interest. The risks would include the risks of slow and non-payment or reduction in future cash fl ows as a result of early repayment.
10.6 Special purpose entities (SPEs)The use of special purpose entities (SPEs) was an especially prominent feature of the Enron case in the USA. However, the potential of the SPE for accounting manipulation resulted in the IASC, the predecessor body to the IASB, issuing SIC-12 Consolidation: special pur-pose entities in 1998. The IASB intends to re-examine the problem in the future.
The SIC provides the following examples of an SPE’s activities:
● The SPE is principally engaged in providing a source of long-term capital to an entity or funding to support an entity’s ongoing major or central operations.
● The SPE provides a supply of goods or services that is consistent with an entity’s ongo-ing major or central operations which, without the existence of the SPE, would have to be provided by the entity itself.
The purpose of SPEs is very often to remove part of a group’s activities from the require-ment to consolidate. They are often set up using complex legal structures. However, the SIC’s guidance on this point is quite straightforward:
An SPE should be consolidated when the substance of the relationship between an entity and the SPE indi-cates that the SPE is controlled by that entity (para 8).
The true substance of the relationship can be determined by examining where the decision-making powers lie, and which parties benefi t from the rewards and bear the risks related to the SPE.
10.7 SummaryThere is no separate international fi nancial reporting standard that deals with substance over form. In this chapter we examined various sources of guidance on what is often a complex matter; these include IAS 18, IAS 39, SIC 12 and the Framework for the Preparation and Presentation of Financial Statements.

This page intentionally left blank
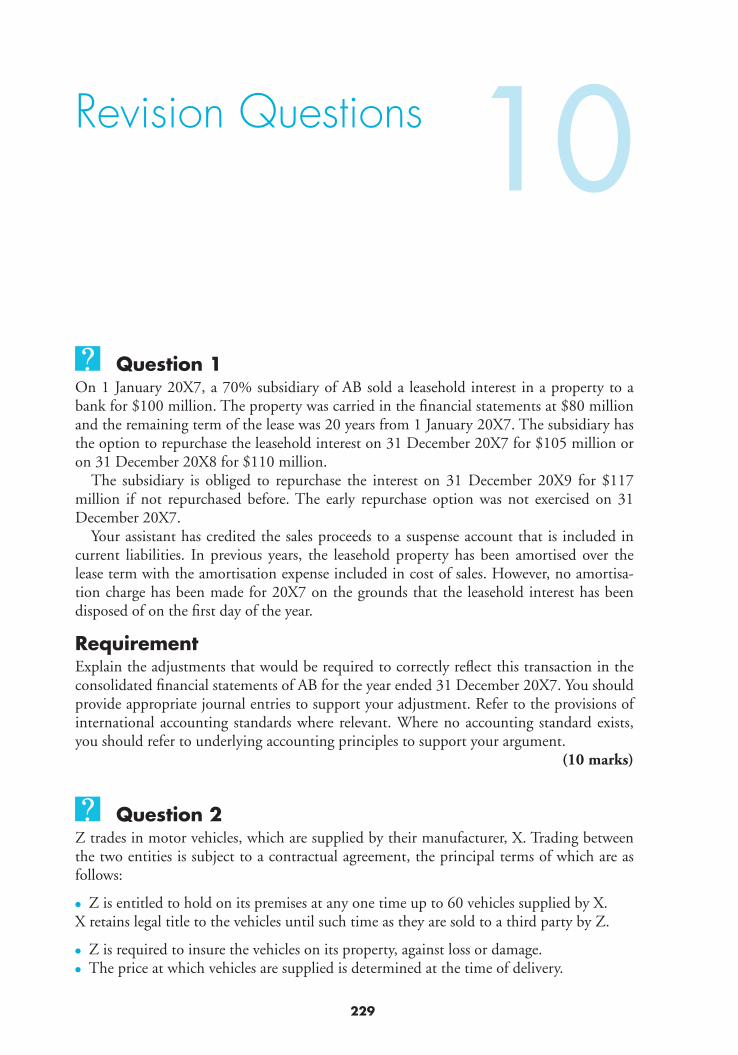
229
10Revision Questions
Question 1On 1 January 20X7, a 70% subsidiary of AB sold a leasehold interest in a property to a bank for $100 million. The property was carried in the fi nancial statements at $80 million and the remaining term of the lease was 20 years from 1 January 20X7. The subsidiary has the option to repurchase the leasehold interest on 31 December 20X7 for $105 million or on 31 December 20X8 for $110 million.
The subsidiary is obliged to repurchase the interest on 31 December 20X9 for $117 million if not repurchased before. The early repurchase option was not exercised on 31 December 20X7.
Your assistant has credited the sales proceeds to a suspense account that is included in current liabilities. In previous years, the leasehold property has been amortised over the lease term with the amortisation expense included in cost of sales. However, no amortisa-tion charge has been made for 20X7 on the grounds that the leasehold interest has been disposed of on the fi rst day of the year.
RequirementExplain the adjustments that would be required to correctly refl ect this transaction in the consolidated fi nancial statements of AB for the year ended 31 December 20X7. You should provide appropriate journal entries to support your adjustment. Refer to the provisions of international accounting standards where relevant. Where no accounting standard exists, you should refer to underlying accounting principles to support your argument.
(10 marks)
Question 2Z trades in motor vehicles, which are supplied by their manufacturer, X. Trading between the two entities is subject to a contractual agreement, the principal terms of which are as follows:
● Z is entitled to hold on its premises at any one time up to 60 vehicles supplied by X.X retains legal title to the vehicles until such time as they are sold to a third party by Z.
● Z is required to insure the vehicles on its property, against loss or damage.● The price at which vehicles are supplied is determined at the time of delivery.

SUBS
TAN
CE
OVE
R FO
RM ● When Z sells a vehicle to a third party, it is required to inform X within three working days. X submits an invoice to Z at the originally agreed price; the invoice is payable by Z within 30 days.
● Z has the right to return any vehicle to X at any time without incurring a penalty.● Z is entitled to use any of the vehicles supplied to it for demonstration purposes and
road testing. However, if more than a specifi ed number of kilometres is driven in a vehi-cle, Z is required to pay X a rental charge.
Requirements(a) Discuss the economic substance of the contractual arrangement between the two enti-
ties, in order to identify which entity should recognise the vehicles in inventory once they have been delivered to Z. (7 marks)
(b) Identify the point at which X should recognise the sale of its vehicles. (3 marks)(10 marks)
REVISION QUESTIONS F2230

231
Solutions to Revision Questions 10
Solution 1This is a sale and repurchase which under the principles of IAS 18 could not be regarded as revenue. In order to identify the appropriate accounting treatment for the ‘sales proceeds’, it is necessary to apply the principles identifi ed in the IASB Framework for the Preparation and Presentation of Financial Statements.
The IASB framework requires entities to account for the economic reality (or substance) of transactions in order to faithfully represent them. It appears that the substance of this transaction is that the entity has a fi nancial liability that would be dealt with according to the requirements of IAS 39 Financial Instruments: Recognition and Measurement.
Furthermore, the instrument appears to be held to maturity fi nancial liability which will be dealt with under the ‘amortised cost’ method. The relevant loan would be regarded as having a maturity date of 31 December 20X9 and therefore the loan would be a non-cur-rent liability. Interest charged at the effective interest rate would be included as an expense in the income statement.
Additionally, under the principles of IAS 16 Property, Plant and Equipment, the lease-hold interest would need to be depreciated since the asset is retained and is consuming economic benefi ts. The charge to cost of sales would be $4 million ($80 m/20).
The overall impact of the adjustments is shown in the following journal entries:
DR CR
$’m $’m
Cost of sales 4
Property 4
Being extra depreciation
Current liabilities 100
Finance cost 5
Non-current liabilities 105
Being reallocation of loan and inclusion of fi nance cost
Non-controlling interest (SOFP) 2.7
Non-controlling interest (income statement) 2.7
Being allocation of minority element of adjustments [30% � (4 � 5)]

SUBS
TAN
CE
OVE
R FO
RM Solution 2
(a) The economic substance of the arrangement between the two entities is determined by analysing the risks and benefi ts of the transaction. The entity that receives the ben-efi ts and bears the risks of ownership should recognise the vehicles as inventory. Z, the motor vehicle dealer, appears to derive the following benefi ts:
● It is free to determine the nature of the inventory it holds, in terms of ranges and models.
● It is protected against price increases between the date of delivery to it and the date of sale because the price is determined at the point of delivery.
● It has access to the inventory for demonstration purposes.
Z incurs the following costs and risks:
● X retains legal title to the goods, so in the case of dispute X would probably be enti-tled to recover its legal property.
● Z is required to bear the cost of insuring the vehicles against loss or damage.● Although Z obtains the benefi t of using vehicles for demonstration purposes a rental
charge may become payable.● If price reductions occur between the date of delivery and the date of sale, Z will
lose out because it will be required to pay the higher price specifi ed upon delivery.
The analysis of the risks and benefi ts of the transaction does not produce a clear deci-sion as to the economic substance of the arrangement between the two parties. X bears the substantial risk of incurring costs related to slow-moving or obsolete vehicles because Z can return any vehicle to it, without incurring a penalty. This point alone is highly signifi cant and may be suffi cient to ensure that X, the manufacturer, should continue to recognise the vehicles in its own inventory. A further relevant point is that X is not paid until the point of sale to a third party, and thus it bears the signifi cant fi nancial risk involved in fi nancing the entity.
(b) In respect of the sale of goods, IAS 18 Revenue requires that a sale should be recog-nised when the selling entity transfers to the buyer the signifi cant risks and rewards of ownership of the goods. As noted above, signifi cant risks and some of the rewards of ownership remain with the manufacturer, X, until such time as the goods are sold by the dealer to a third party. Therefore, revenue should be recognised by X only when a sale to a third party takes place.
SOLUTIONS TO REVISION QUESTIONS F2232

11
Accounting for Financial Instruments

This page intentionally left blank

235
11
LEARNING OUTCOME After studying this chapter students should be able to:
� explain the possible treatments of fi nancial instruments in the issuer’s accounts, including the classifi cation of liabilities and equity, and the implications for the asso-ciated fi nance costs;
� identify circumstances in which amortised cost, fair value and hedge accounting are appropriate for fi nancial instruments, and explain the principles of these accounting methods.
11.1 IntroductionThis chapter looks at accounting for fi nancial instruments. Section 11.2 introduces the relevant standards that provide guidance for fi nancial instruments. In Section 11.3 we will look at how to identify and classify fi nancial instruments. Section 11.4 looks at how fi nan-cial instruments are recognised and measured. We will also study the principles of impair-ment of fi nancial assets. Section 11.5 looks at the basics of hedging relationships. Section 11.6 will provide a brief overview of the disclosure requirements for fi nancial instruments.
11.2 Financial instruments – relevant accounting standards
The provisions are very detailed as fi nancial instruments make up a large part of our state-ment of fi nancial position. As a result the accounting and disclosure requirements are con-tained in three accounting standards:
● IAS 32 Financial instruments: presentation● IAS 39 Financial instruments: recognition and measurement● IFRS 7 Financial instruments: disclosure
Accounting for Financial Instruments

STUDY MATERIAL F2236
AC
CO
UN
TIN
G F
OR
FIN
AN
CIA
L IN
STRU
MEN
TS IAS 39 has been controversial from its original inception. Proposals for changing it have elicited comments and criticisms from many quarters, and several issues remain to be clar-ifi ed and agreed. The current version of the standard should be regarded as an interim measure only; the IASB is currently undertaking research work that will ultimately lead to the replacement of IAS 39 .
The objective of the standard is to establish principles for recognising and measuring fi nancial assets, fi nancial liabilities and contracts to buy or sell a non-fi nancial item that can be settled net in cash or by some other fi nancial instrument.
11.3 IAS 32 Financial instruments: presentationIAS 32 deals mainly with how to identify and classify fi nancial instruments and pays par-ticular note to the issues in classifying debt and equity.
11.3.1 Definitions IAS 32 defi nes a fi nancial instrument as:
Any contract that gives rise to both a fi nancial asset of one entity and a fi nan-cial liability or equity instrument of another entity.
A ‘ fi nancial asset ’ can be any of the following:
● cash; ● a contractual right to receive cash or another fi nancial asset from another entity; ● a contractual right to exchange fi nancial instruments with another entity under conditions
that are potentially favourable; or ● an equity instrument of another entity; ● a contract that will, or may be, settled in an entity’s own fi nancial instruments.
A ‘ fi nancial liability ’ can be: A contractual obligation:
● to deliver cash or another fi nancial asset to another entity; ● to exchange fi nancial instruments with another entity under conditions that are poten-
tially unfavourable.
Or a contract that will, or may be, settled in the entity’s own equity instruments. An equity instrument is: ‘ any contract that evidences a residual interest in the assets of
an entity after deducting all of its liabilities ’ . To take the most common example, ordinary shares in an entity fall into this category.
Some common examples of fi nancial instruments include the following:
● cash; ● deposits available on demand or after the lapse of a specifi ed period of time; ● commercial debt; ● loans receivable and payable; ● debt and equity securities that are fi nancial instruments from the point of view of both
the holder and the issuer;

237FINANCIAL MANAGEMENT
AC
CO
UN
TING
FOR FIN
AN
CIA
L INSTRU
MEN
TS● asset backed securities, for example, mortgages and other forms of secured loan; ● derivatives, such as options, forward contracts, futures contracts, warrants and other
future rights.
Certain types of fi nancial instrument fall outside the scope of the IAS because they are dealt with more fully in other standards. These include: interests in subsidiaries, interests in associates and joint ventures, employee benefi t plans and obligations arising under insurance contracts.
11.3.2 Classification of financial instrumentsIn order to be able to apply the recognition and measurement criteria in IAS 39, we must fi rst decide how a fi nancial instrument should be classifi ed. The classifi cations of fi nancial instruments are based on the defi nitions above.
Financial assets should be easy to identify, however a diffi culty often arises when classi-fying debt and equity. Prior to the introduction of this standard, the equity of the business could include all types of shares. The term ‘share’ being used in the terms of the instru-ment normally resulted in them being classifi ed as equity.
The defi nition that IAS 32 introduced describes a fi nancial liability as containing an obligation to transfer economic benefi t at a future date. It is this ‘obligation’ that resulted in many fi nancial instruments being reclassifi ed from equity to debt when IAS 32 was fi rst applied. Classifi cations as debt as opposed to equity will affect the gearing ratio of the entity.
Gearing is an important measure of an entity’s risk and stability. Debt takes priority over shareholders’ funds, and interest on debt must be paid otherwise the entity’s survival is at risk. The return on shareholders’ funds, in the form of dividends, does not have to be paid. The level of payment of dividend, and whether or not a dividend is paid at all, are under the control of the entity’s directors.
The importance of the gearing ratio as a measure of the riskiness of the entity means that the classifi cation of fi nancial instruments as debt or equity is of signifi cant impor-tance. Where an entity’s gearing ratio is already high, it will probably wish to avoid issu-ing new fi nancial instruments that fall into the debt category. A straightforward way of doing this is to issue uncontroversial equity in the form of ordinary shares. However, there has been a tendency in recent years to issue complex fi nancial instruments that techni-cally meet the classifi cation of equity but that are actually, in most essential respects, debt. Where these instruments contain any element of obligation they will now be classifi ed as fi nancial liabilities in accordance with IAS 32.The classifi cation of the instrument has a signifi cant affect on the income statement of the entity. Distributions associated with debt (interest/fi nance costs) will be deducted from profi t, whereas distributions associated with equity (dividends) will be shown as a reduction in equity through the Statement of Changes in Equity. The classifi cation of fi nancial instruments will have an impact on the reported profi t for the period and the performance ratios that are subsequently calculated. When determining the classifi cation, IAS 32 requires that the substance of the instrument be considered and not merely its legal form.

STUDY MATERIAL F2238
AC
CO
UN
TIN
G F
OR
FIN
AN
CIA
L IN
STRU
MEN
TS Debt or equity?Some of the basic characteristics of debt and equity are set out in the table below:
Equity DebtReturn Dividend InterestRights Legal ownership of the entity Repayment of capitalEffect on income statement Appropriation of profi t after tax
determined by the directorsCharge against profi ts before tax
Interest on winding up of the entity
Residual Preferential, ranking before equity holders
Taxation implications Appropriation of post-tax profi ts Interest payments are tax-deductible
These distinctions appear to be quite straightforward. However, in practice, determining the difference between debt and equity can be quite diffi cult because of the complexity of some of the fi nancial instruments that have been issued in recent years. IAS 32 provides the following guidance:
IAS 32 requires that the issuer of a fi nancial instrument shall classify it upon initial issue as either a liability or equity, according to the following classifi cation principles:
1. The substance of a fi nancial instrument, rather than its legal form, governs its classifi cation.
2. Where there is a contractual obligation, potentially unfavourable to the issue of the instrument, to deliver either cash or another fi nancial asset to the holder of the instru-ment, the instrument meets the defi nition of a fi nancial liability.
3. Where a fi nancial instrument does not give rise to a contractual obligation under potentially unfavourable conditions, then the instrument is classifi ed as equity.
4. Where there is a requirement for mandatory redemption of the instrument by the issuer at a fi xed or determinable future data, the instrument meets the defi nition of a fi nancial liability.
In recent years there has been a trend towards the issue of complex fi nancial instruments whose classifi cation is not immediately obvious, this is when applying substance over form becomes particularly important. In the rest of this section we consider some examples:
Warrants and optionsWarrants and options give the holder the right to subscribe for equity shares at a specifi ed time at a specifi ed price. Share option schemes are commonly used as a form of remunera-tion, especially for senior staff. In February 2004, the IASB issued IFRS 2 on accounting for share-based payment. This fi nancial reporting standard requires that a charge should be made in the income statement to refl ect the benefi t transferred to the holder of the option, with a credit to share capital. Such instruments therefore have an effect on equity, rather than debt capital. IFRS 2 is covered in Chapter 12 of this Learning System.
Perpetual debtPerpetual debt is an instrument that provides the holder with the right to receive pay-ments in respect of interest at fi xed rates, extending into the indefi nite future. There is no redemption date for the debt, which makes it rather akin to equity which, similarly, is issued without a redemption date. Perpetual debt, nevertheless, is classifi ed as debt. When

239FINANCIAL MANAGEMENT
AC
CO
UN
TING
FOR FIN
AN
CIA
L INSTRU
MEN
TSsuch debt is issued, the issuer takes on a fi nancial obligation to make a stream of future interest payments. The payments are regular and fi xed in nature, and therefore the capital element is more akin to debt than equity, and should be classifi ed as such.
Redeemable preference sharesPreference shares usually carry a fi xed rate of return, and sometimes they are issued with redemption terms attached to them. Where the issuer is obliged to redeem the shares at a fi xed or determinable future date, at a fi xed or determinable amount, the instrument has the characteristics of a liability, and should be classifi ed as such.
However, a distinction can be drawn between the type of preference share described above, and a preferred share that is redeemable solely at the option of the issuer (i.e. at the point of issue there is no fi xed or determinable date of redemption attached to the instru-ment). In this case, the instrument is probably equity.
Non-redeemable preference sharesNon-redeemable shares may appear to be rather similar to the perpetual debt described earlier. However, the standard makes it clear that classifi cation as debt or equity is deter-mined by the rights attaching to the shares. If distributions are at the discretion of the issuer, then the non-redeemable shares are likely to be classifi ed as equity. However, where distribution is mandatory, the instrument is much more akin to debt.
Example 11.A
On 1 January 20X1 DP issues preference shares at $1 million par value. There is no redemption date attached to the shares. Under the terms of issue, DP has the option of determining the level of distribution to the holders of the preference shares, and the issue document refers to the possibility that in some years no distribution will be made.
In this example, the fi nancial instrument will be classifi ed as equity.
Example 11.B
On 1 January 20X1 EQ issues 7% preference shares at $1 million par value. There is no redemption date attached to the shares. The preference shares are cumulative in nature, that is, if EQ cannot make the distribution of 7% of par value, the distribution liability is carried forward to a future year.
In this example the distribution cannot be avoided (although it can be deferred). Therefore, the instrument is classifi ed as debt.
Preference shares: conflict with national lawOne other relevant point about the classifi cation of preference shares is that, in some juris-dictions, national laws require that preference shares are classifi ed as equity. Adherence to the law is, obviously, a matter of some importance, and so compliance with IAS 32 in this respect may not be possible. This confl ict exists in respect of the UK, for example. However, it is to be expected that national laws will, in time, be altered in this respect, so that international accounting standards can be adhered to.
Convertible securities with optionsSometimes, debt is issued with an option to convert the debt at some future date into equity shares. So, rather than repaying the debt with cash, the repayment would be with equity shares. Sometimes, such instruments contain an agreement (a put option) which allows holders of the debt to require redemption at a premium; often such securities will

STUDY MATERIAL F2240
AC
CO
UN
TIN
G F
OR
FIN
AN
CIA
L IN
STRU
MEN
TS carry a low rate of interest to balance a high redemption premium. The put option requires buy-back of the debt by the issuer at a premium price if conversion does not take place.
Example 11.C
C issues $1 million in convertible debt securities in 20X4. The debt carries an annual interest rate of 3%, and conversion is available in 20X9 at the option of the holder at a rate of 1 equity share for every $10 of debt. Alternatively, the holder can opt to exercise a put option in 20X9 to redeem the debt at a premium of 10%. At the time of issue, the market rate of interest for similar debt is 5.5%.
In this case, the annual interest rate is low but is balanced by the availability of a high premium on redemp-tion. If the price of 1 equity share in 20X9 is greater than $11 ($10 of debt plus 10% redemption premium) then the holders of the debt will choose that option. If, however, the price of a share is below $11, holders will choose to exercise the put option and will require redemption at par value � 10%.
In this case, the fi nancial instrument should be classifi ed as debt.
Financial instruments with contingent settlementWhere shares are issued that give the holder the right to require redemption, in cash or another fi nancial asset, upon the occurrence of an uncertain future event (e.g. if the entity fails to achieve a certain level of profi ts), the instrument should be classifi ed as debt.
Zero coupon bondsThis is a fi nancial instrument that requires no annual payment of interest. Instead, the issuer has a contractual obligation to repay the holders of the bonds a sum on redemption that refl ects the fact that they have received no interest (i.e. it is higher than it would have been if annual interest had been paid). The redemption sum represents ‘rolled up’ fi nance charges. The obligation is clearly unfavourable to the issuer, it involves the delivery of a fi nancial asset at a fi xed or determinable point in the future, and it is therefore classifi ed as debt.
11.3.3 Hybrid instrumentsIAS 32 recognises certain categories of fi nancial instrument as having characteristics of both debt and equity. These are known as hybrid fi nancial instruments, and the most com-mon example is that of convertible debt securities. The view taken by IAS 32 is that this type of single fi nancial instrument creates both debt and equity interests. The standard requires that the component parts of the instrument should be classifi ed separately, and the following example demonstrates how this is done.
Example 11.D
An entity issues 5,000 convertible bonds at 1 January 20X0. The bonds have a 5 year term and are issued at par with a face value of $100 per bond. Total proceeds from the bond issue are therefore: 5,000 � $100 �$500,000. The interest rate on the bonds is 5%. Each bond is convertible at any time up to maturity into 100 ordinary shares.
When the bonds are issued the prevailing market interest rate for similar debt without conversion options is 7%. At the issue date, the market price of one ordinary share is $2.50. The dividends expected over the 5 year term of the bonds amount to 10 cents per share at the end of each year.

241FINANCIAL MANAGEMENT
AC
CO
UN
TING
FOR FIN
AN
CIA
L INSTRU
MEN
TSIAS 32 requires that the liability element is valued by reference, not to the actual interest rate on the convertible
bond, but rather by reference to the prevailing market interest rate on similar debt without conversion right – in this case 7%. The calculations are as follows:
$Present value of the principal – $500,000 at the end of 5 years discounted to present value: 500,000/(1.07)
5 356,379Present value of the interest – $25,000 payable annually in arrears for 5 years:$25,000 3 annuity factor for 5 years: $25,000 � (1/1.07) � (1/1.07
2) � (1/1.073) � (1/1.07
4) � (1/1.075) 102,500
Total liability component 458,879Equity component (balancing fi gure) 41,121Total value of bond issue 500,000
11.4 IAS 39 Financial instruments:recognition and measurement
This standard deals with the recognition and measurement of all fi nancial instruments (except any that are specifi cally dealt with by a more specifi c standard).
11.4.1 Initial recognition of financial assets and liabilities
The standard requires recognition of a fi nancial asset or fi nancial liability once the entity becomes party to the contractual provisions of the instruments. For example, Entity C enters into a loan agreement with a fi nancial institution, which involves borrowing $50 million. The liability under the agreement will be recognised when, and only when, the contractual arrangements become binding on C.
All fi nancial assets and fi nancial liabilities should be recognised on an entity’s statement of fi nancial position. This may seem uncontroversial, but it is important to note that fi nan-cial assets and fi nancial liabilities include derivative instruments. Prior to IAS 39 being applied, derivatives were not refl ected in the fi nancial statements until they were settled. The result of fi rst time application was a signifi cant number of new fi nancial assets and liabilities being included in the accounts of entities, entities that had probably traded in derivatives for years.
The initial recognition criteria is the same for most elements of the fi nancial statements:
● It is probable that economic benefi t will fl ow to or from the entity.● It can be measured reliabily.
Financial assetsFinancial assets must be classifi ed as one of the following: ● fair value through profi t or loss ● loans and receivables ● held-to-maturity investments ● available-for-sale fi nancial assets.
It is important that classifi cation should take place immediately because it affects the subse-quent measurement rules that apply to the instrument. Each of the categories is described in more detail below.

STUDY MATERIAL F2242
AC
CO
UN
TIN
G F
OR
FIN
AN
CIA
L IN
STRU
MEN
TS Fair value through profit or loss Financial assets categorised as ‘ fair value through profi t or loss ’ are those that fall into one of these categories:
1. Those that are classifi ed as ‘ held-for-trading ’ . This classifi cation is appropriate where fi nancial assets are acquired principally for the purpose of short-term resale, or where the asset is acquired as part of a portfolio where short-term profi t taking is the norm.
2. Those that are held as part of a group of fi nancial assets that are managed on a fair value basis in accordance with a documented risk management or investment strategy.
Loans and receivables These fi nancial assets include non-derivative assets with fi xed or determinable payments that are not quoted in an active market, and that are not held as fair value through profi t or loss, or as available-for-sale assets. Examples would include loans made to other entities that may be sold on or exchanged at some point before they mature.
Held-to-maturity investments These are non-derivative fi nancial assets with fi xed or determinable payments that an entity intends to hold until they mature. The intention to hold until maturity must be demonstrable. For example, if an entity sells a ‘ held-to-maturity ’ investment of a signifi cant amount before its maturity date, the validity of its intentions in respect of other ‘ held-to-maturity ’ investments is called into question. The standard requires that in such cases the investments must be reclassi-fi ed as available-for sale. (Note that this point is important because of differences in approach to measurement of fi nancial assets, which will be discussed in the next section of this chapter.)
Available-for-sale financial assets A fi nancial asset that is not classifi ed as fair value through profi t or loss, or as loans and receiv-ables or as held-to-maturity, will be classifi ed as available-for-sale. Available-for-sale fi nancial assets are held at fair value, with subsequent gains or losses recognised in equity until disposal.
Classifi cation in practice could present some problems. A few examples will help to draw distinctions between the four categories:
Example 11.E
In the course of its normal business, entity D lends $130,000 to entity E at a commercial rate of interest for 5 years. Regular repayments of the loan are scheduled to take place annually. There is no active market for this loan instrument, but in similar circumstances in the past D has sold on such fi nancial assets before they reach maturity.
Initial classifi cation in the books of D: loans and receivables.
Example 11.F
Entity F lends entity G $150,000 for 7 years. The rate of interest on the loan is variable depending on market rates, but there is no commercial market for this fi nancial asset. Regular repayments of the loan are scheduled to take place annually. F will retain the gradually reducing loan in its books until the end of the 7 year period, and intends to hold the asset until maturity.
Initial classifi cation in the books of F: held-to-maturity investments.
Example 11.G
Entity H holds surplus cash of $100,000. Because of the seasonal nature of its business it expects to need the cash to fund investment in inventory in about 6 months ’ time. In the meantime, the directors of H decide to invest in the listed securities of entity J. After 5 or 6 months the investment will be realised.
Initial classifi cation in the books of H: fair value through profi t or loss.

243FINANCIAL MANAGEMENT
AC
CO
UN
TING
FOR FIN
AN
CIA
L INSTRU
MEN
TSFinancial liabilitiesFinancial liabilities is not specifi cally mentioned as a category in IAS 39, however it is obviously a very important category as it includes loans, payables, preference shares, debentures, etc.
Financial liabilities can be designated as ‘fair value through profi t or loss’, provided that it is either held for trading, or is designated by the entity as such.
Note that derivatives would normally fall into the ‘fair value through profi t or loss’ cat-egory and depending on whether the terms are favourable or unfavourable will determine whether it is shown as a fi nancial asset or liability.
11.4.2 Initial measurementThe initial measurement of all fi nancial instruments should be at fair value. Transactions costs should be included in the initial measurement, except for assets and liabilities held at fair value through profi t or loss.
Fair value is the amount for which an asset could be exchanged, or a liability settled, between knowledgeable, willing parties in an arm’s-length transaction.
Determining fair value may not be straightforward. IAS 39 provides the following guid-ance in order of preference:
1. Quoted market prices; these are regarded as the best indicator of fair value and should always be used where available.
2. Where there is no active market, fair value should be established using a valuation technique that refers, where possible, to market conditions. Examples of the type of information that may be used include: recent similar transactions at arm’s length, discounted cash fl ow tech-niques, reference to the market value of similar instruments, and option pricing models.
3. Where there is no active market and if no reliable estimate of fair value can be made, the entity must measure the fi nancial instrument at cost less any impairment
Transactions costs should be included in the initial measurement of assets and liabilities. The normal recording of costs is:
Dr expenses (income statement) Cr Bank
IAS 39 requires that transaction costs be included in the initial measurement of the fi nan-cial instrument.For fi nancial assets the transaction costs will be:
Dr asset Cr bank
And for fi nancial liabilities: Dr liability Cr bank
Example 11.H
AB acquires a loan investment of $5 million. The transaction costs associated with this acquisition totalled $600,000. In the absence of any other information the investment will be classifi ed as loans and receivables and will be initially recognised by:
Dr Loans and receivables (fi nancial assets) $5.6 m Cr Bank $5.6 m

STUDY MATERIAL F2244
AC
CO
UN
TIN
G F
OR
FIN
AN
CIA
L IN
STRU
MEN
TSExample 11.I
CD issues debentures with a value of $4 million. The associated transaction costs were $300,000. The net pro-ceeds of the fi nancial liability will be recorded:
Dr Bank $3.7 m Cr fi nancial liability $3.7 m
The treatment of the transaction costs is very important as they are included in the opening carrying value of the instrument. Subsequent measurement rules will then be applied and adjustments made to this initial carrying amount.
11.4.3 Subsequent measurement of financial instruments Financial assets
The regulations in IAS 39 in respect of fi nancial asset categories are as follows:
● fair value through profi t or loss : fair value; ● loans and receivables : amortised cost, using the effective interest rate method; ● held-to-maturity investments : amortised cost, using the effective interest rate method; ● available-for-sale fi nancial assets : fair value.
Once a decision has been taken on the valuation principles to be applied to a fi nancial asset (i.e., fair value or amortised cost) the entity is not permitted to subsequently change the classifi cation.
Also note that, all derivatives that are not designated as hedging items should be meas-ured at fair value.
Fair value will normally be market value, which in the case of traded instruments will be relatively easy to access (fi nancial press). Where an equity investment cannot be reliably measured (shares in private entities) they must be included in the available for sale category and would be held at cost.
Treatment of gains and lossesWhere fi nancial assets are accounted for at fair value, gains and losses on periodic remeas-urement (e.g., at the year end date) should be taken straight to the income statement. The exception to this is where fi nancial assets are classifi ed as available-for-sale. Gains and losses arising on these assets should be included in other comprehensive income. Upon their dis-posal, gains and losses previously taken to equity (and included in OCI) should then be recognised in the income statement.
Example 11.J
Financial asset held at fair value through profi t of lossP purchases 100,000 shares in a listed entity X. The shares were acquired during 20X8 at 118¢ per share, transaction costs were $2,000. X’s shares are quoted at 31 December 20X8 date at 112¢. P has classifi ed these fi nancial assets as assets held at fair value through profi t or loss.Initial recording:
Dr Financial asset $118,000 Cr Bank $118,000
The transaction costs cannot be included for assets and liabilities held at fair value through profi t or loss (see Section 11.4.2), there are written off as a period expense:
Dr Expenses $2,000 Cr Bank $2,000
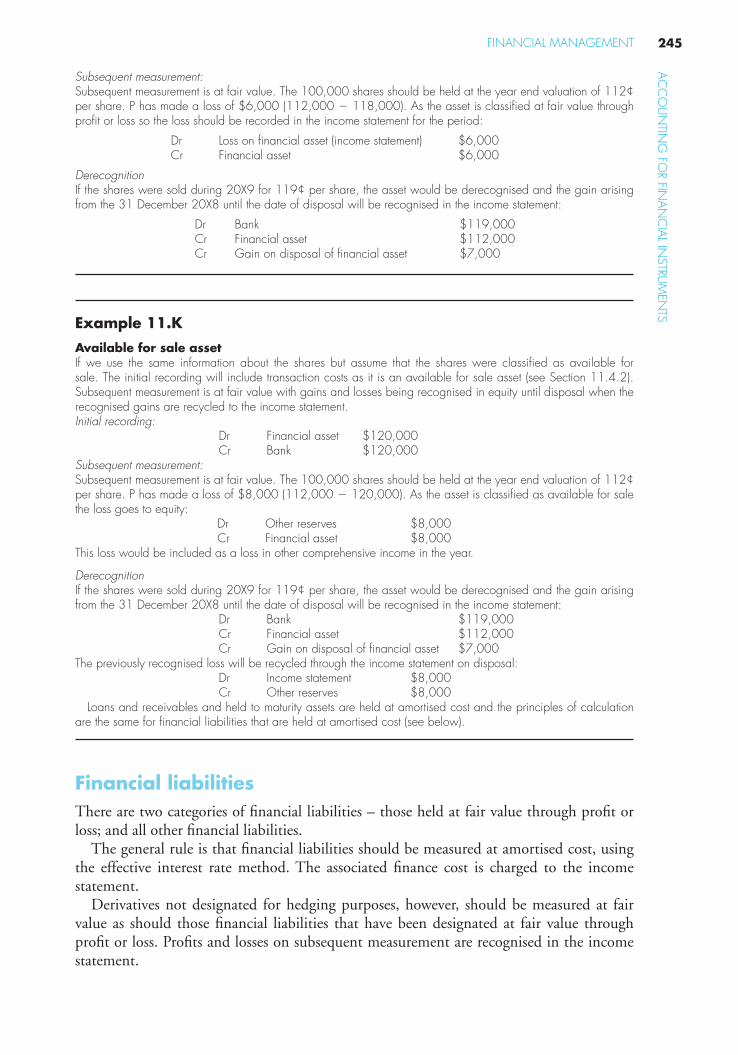
245FINANCIAL MANAGEMENT
AC
CO
UN
TING
FOR FIN
AN
CIA
L INSTRU
MEN
TSSubsequent measurement:Subsequent measurement is at fair value. The 100,000 shares should be held at the year end valuation of 112¢ per share. P has made a loss of $6,000 (112,000 � 118,000). As the asset is classifi ed at fair value through profi t or loss so the loss should be recorded in the income statement for the period:
Dr Loss on fi nancial asset (income statement) $6,000 Cr Financial asset $6,000
DerecognitionIf the shares were sold during 20X9 for 119¢ per share, the asset would be derecognised and the gain arising from the 31 December 20X8 until the date of disposal will be recognised in the income statement:
Dr Bank $119,000 Cr Financial asset $112,000 Cr Gain on disposal of fi nancial asset $7,000
Example 11.K
Available for sale assetIf we use the same information about the shares but assume that the shares were classifi ed as available for sale. The initial recording will include transaction costs as it is an available for sale asset (see Section 11.4.2). Subsequent measurement is at fair value with gains and losses being recognised in equity until disposal when the recognised gains are recycled to the income statement.Initial recording:
Dr Financial asset $120,000 Cr Bank $120,000
Subsequent measurement:Subsequent measurement is at fair value. The 100,000 shares should be held at the year end valuation of 112¢ per share. P has made a loss of $8,000 (112,000 � 120,000). As the asset is classifi ed as available for sale the loss goes to equity:
Dr Other reserves $8,000 Cr Financial asset $8,000
This loss would be included as a loss in other comprehensive income in the year.
DerecognitionIf the shares were sold during 20X9 for 119¢ per share, the asset would be derecognised and the gain arising from the 31 December 20X8 until the date of disposal will be recognised in the income statement:
Dr Bank $119,000 Cr Financial asset $112,000 Cr Gain on disposal of fi nancial asset $7,000
The previously recognised loss will be recycled through the income statement on disposal: Dr Income statement $8,000 Cr Other reserves $8,000
Loans and receivables and held to maturity assets are held at amortised cost and the principles of calculation are the same for fi nancial liabilities that are held at amortised cost (see below).
Financial liabilitiesThere are two categories of fi nancial liabilities – those held at fair value through profi t or loss; and all other fi nancial liabilities.
The general rule is that fi nancial liabilities should be measured at amortised cost, using the effective interest rate method. The associated fi nance cost is charged to the income statement.
Derivatives not designated for hedging purposes, however, should be measured at fair value as should those fi nancial liabilities that have been designated at fair value through profi t or loss. Profi ts and losses on subsequent measurement are recognised in the income statement.
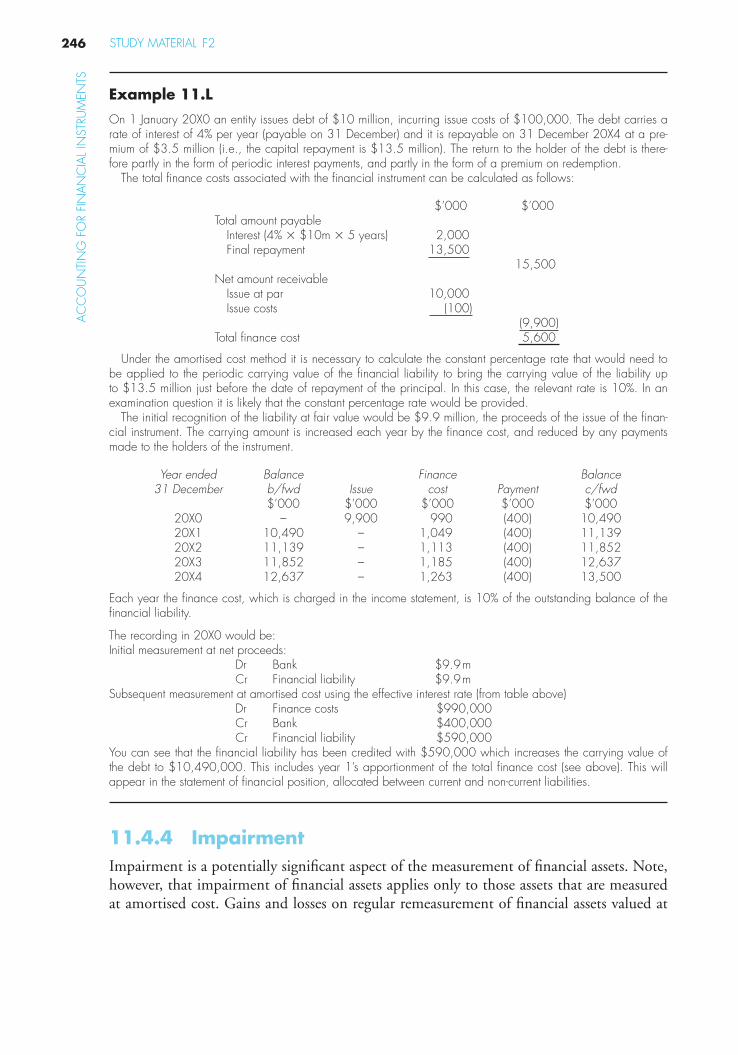
STUDY MATERIAL F2246
AC
CO
UN
TIN
G F
OR
FIN
AN
CIA
L IN
STRU
MEN
TSExample 11.L
On 1 January 20X0 an entity issues debt of $10 million, incurring issue costs of $100,000. The debt carries a rate of interest of 4% per year (payable on 31 December) and it is repayable on 31 December 20X4 at a pre-mium of $3.5 million (i.e., the capital repayment is $13.5 million). The return to the holder of the debt is there-fore partly in the form of periodic interest payments, and partly in the form of a premium on redemption.
The total fi nance costs associated with the fi nancial instrument can be calculated as follows:
$’000 $’000 Total amount payable
Interest (4% � $10m � 5 years) 2,000Final repayment 13,500
15,500 Net amount receivable
Issue at par 10,000Issue costs (100)
(9,900) Total fi nance cost 5,600
Under the amortised cost method it is necessary to calculate the constant percentage rate that would need to be applied to the periodic carrying value of the fi nancial liability to bring the carrying value of the liability up to $13.5 million just before the date of repayment of the principal. In this case, the relevant rate is 10%. In an examination question it is likely that the constant percentage rate would be provided.
The initial recognition of the liability at fair value would be $9.9 million, the proceeds of the issue of the fi nan-cial instrument. The carrying amount is increased each year by the fi nance cost, and reduced by any payments made to the holders of the instrument.
Year ended 31 December
Balance b/fwd Issue
Financecost Payment
Balance c/fwd
$’000 $’000 $’000 $’000 $’00020X0 – 9,900 990 (400) 10,49020X1 10,490 – 1,049 (400) 11,13920X2 11,139 – 1,113 (400) 11,85220X3 11,852 – 1,185 (400) 12,63720X4 12,637 – 1,263 (400) 13,500
Each year the fi nance cost, which is charged in the income statement, is 10% of the outstanding balance of the fi nancial liability.
The recording in 20X0 would be:Initial measurement at net proceeds:
Dr Bank $9.9 m Cr Financial liability $9.9 m
Subsequent measurement at amortised cost using the effective interest rate (from table above) Dr Finance costs $990,000 Cr Bank $400,000 Cr Financial liability $590,000
You can see that the fi nancial liability has been credited with $590,000 which increases the carrying value of the debt to $10,490,000. This includes year 1’s apportionment of the total fi nance cost (see above). This will appear in the statement of fi nancial position, allocated between current and non-current liabilities.
11.4.4 Impairment Impairment is a potentially signifi cant aspect of the measurement of fi nancial assets. Note, however, that impairment of fi nancial assets applies only to those assets that are measured at amortised cost. Gains and losses on regular remeasurement of fi nancial assets valued at

247FINANCIAL MANAGEMENT
AC
CO
UN
TING
FOR FIN
AN
CIA
L INSTRU
MEN
TSfair value are dealt with as explained earlier in the chapter. Note, however, that where an available-for-sale fi nancial asset has been impaired, the cumulative loss recognised to date in equity, should be transferred to profi t or loss (even though the fi nancial asset has not been derecognised).
The rules in the revised IAS 39 are summarised as follows:
● An entity is required to assess at each statement of fi nancial position date whether or not any objective evidence exists of impairment of fi nancial assets (evidence would be e.g. fi nancial distress of the entity you have invested in; an entity you have given a loan to has failed to make a repayment on a due date).
● If there is such evidence a detailed impairment review must be undertaken to assess the extent of any impairment loss.
● If not given the loss amount then the loss is measured as the difference between the car-rying amount of the fi nancial asset and the present value of the cash fl ows estimated to arise from the asset, discounted at the asset’s original effective interest rate.
● Impairment losses are recognised through the income statement.
Note that impairment should be recognised only in respect of losses that have already been incurred – not in respect of losses that may take place in the future (the incurred loss model, not the expected loss model).
Example 11.M
A has a fi nancial asset classifi ed as fair value through profi t or loss, which has a carrying value of $100,000. The entity to which the investment relates is showing signs of fi nancial distress and the directors of A believe it is prudent to conduct an impairment review on this investment. The review shows the value of the asset to be $88,000. The impairment is taken straight to the income statement:
Dr Impairment loss (income statement) $12,000 Cr Financial asset $12,000
If we now assume that the investment was initially classifi ed as available for sale and that previously recognised gains to date were $9,000 and had been posted to equity. This amount will be transferred to income statement as it would be inconsistent to charge the income statement with the impairment while a credit balance exists within equity relating to the same asset.
Dr Impairment loss (income statement) $12,000 Cr Financial asset $12,000 Dr Other reserves $9,000
Cr Income statement $9,000
11.4.5 Derivatives The defi nition of a derivative is as follows:
A derivative is a fi nancial instrument with all three of the following characteristics:
1. its value changes in response to the change in a specifi ed interest rate, security price, commodity price, foreign exchange rate, index of prices or rates, a credit rating or credit index or other variable;

STUDY MATERIAL F2248
AC
CO
UN
TIN
G F
OR
FIN
AN
CIA
L IN
STRU
MEN
TS 2. it requires no initial net investment; 3. it is settled at a future date.
Examples of derivatives include:
● Forward contracts: contracts to purchase or sell specifi c quantities of commodities of foreign currencies at a specifi ed price determined at the inception of the contract, with delivery or settlement to take place at a specifi ed future date.
● Options: these are contracts that give a purchaser the right to buy (call option) or to sell (put option) a specifi ed quantity of, for example, a fi nancial instrument, commodity or currency at a specifi ed price.
First, it may be helpful to look at an example of a derivative fi nancial instrument in order to demonstrate accounting at fair value for derivatives.
Example 11.N
On 30 November 20X1, the directors of an entity, Z, decide to enter into a forward foreign exchange contract to buy one million Swiss francs on 31 March 20X2. This is a promise to purchase which, at the time it is taken out, has a cost of zero.
This contract fulfi ls all three requirements to be classifi ed as a derivative. Until the revised version of IAS 39 was issued this type of stand alone derivative would not have been recorded at all before the date at which the transaction takes place (31 March 20X2). However, IAS 39 now requires that derivatives are recorded at fair value. How is this effected?
More information is required: The balance sheet date of Z is 31 December 20X1. The exchange rate specifi ed in the forward contract is
Sw Fr.2.3 � $1. Therefore, on 31 March Z will be required to pay 1,000,000/2.3 � $434,783. At 31 December, the fair value of the derivative could be more or less than that fi gure. If it is less, Z will have to record a loss on the derivative, but if it is more, there will be a gain. Let us examine both possibilities:
(1) The exchange rate at 31 December � Sw Fr.2.4 � $1. The fair value of the derivative is therefore 1,000,000/2.4 � $416,667. The best way of looking at this is to say that, if this exchange rate persists until settlement of the contract, Z will have made a loss. It will be obliged to spend $434,783 to buy Sw Fr. 1,000,000, but if the actual exchange rate on that date is Sw Fr.2.4 � $1 it will have made a loss on the deal which could have been done, without the forward contract, for $416,667. The difference between the two fi gures of $434,783 � $416,667 � $18,116 at 31 December will be recorded, under the provisions of revised IAS 39 as follows:
DR Income statement (loss) $18,116CR Derivative liability $18,116
(2) The exchange rate at 31 December � Sw Fr.2.1 � $1. The fair value of the derivative is therefore 1,000,000/2.1 � $476,190. At 31 March Z will be obliged to spend $434,783 to buy Sw Fr.1,000,000, but if the actual exchange rate on that day is Sw Fr.2.1 � $1, it will have made a gain on the deal. The difference between the two fi gures of $476,190 � $434,783 � $41,407 at 31 December will be recorded, under the provisions of revised IAS 39 as follows:
DR Derivative asset $41,407CR Income statement (gain) $41,407
The ultimate gain or loss will be determined by the actual exchange rate on 31 March 20X2. Assume that the actual rate is Sw Fr.2.35 � $1. Under the terms of the forward contract Z actually pays
$434,783. However, if the contract did not exist, it would have paid Sw Fr.1,000,000/2.35 � $425,532. The directors ’ actions have resulted in Z incurring an overall loss by taking out the contract of $434,783 � $425,532 � $9,251. This is the overall fair value of the derivative liability.

249FINANCIAL MANAGEMENT
AC
CO
UN
TING
FOR FIN
AN
CIA
L INSTRU
MEN
TSHow will the transaction be accounted for at 31 March 20X2? This depends upon the fair value of the deriva-
tive that is already accounted for in the books. Two possibilities were examined above at 31 December 20X2. Assume that the exchange rate at that date was Sw Fr.2.4 � $1. As we saw this resulted in the recognition of a derivative liability of $18,116. The fi nal fair value of the derivative liability at 31 March 20X2 has been calculated at $9,251. The derivative ceases to exist at this date and so it must be removed from the books. The accounting entries at 31 March 20X2 are as follows:
DR Derivative liability $18,116 CR Gain (income statement) $18,116 � $9,251 $8,865 CR Cash $434,783
DR Swiss francs cash account* $434,783 � $9,251
$425,532
*Note: this is obviously the dollar value of the Swiss franc account. The Swiss franc value of 31 March 20X2 is Sw Fr. 1,000,000.
Understanding this type of complex transaction is easier if the reasoning behind the adjustments is fully understood. The intention of IAS 39 is that users of fi nancial statements should be given suffi cient information to be able to assess the performance of management in respect of this type of transaction, and that it is necessary, therefore, to include the fair value of derivatives.
11.5 Hedging Hedging establishes a relationship between a hedging instrument and a hedged item or items. It is essentially all about making exceptions to the rules we have been learning about above in respect of where gains and losses on subsequent measurement.
11.5.1 Hedging relationshipsHedging is simply one of management’s strategies to reduce risk and volatility in the man-agement of assets and liabilities.
IAS 39 permits hedge accounting with two provisos:
1. The hedging relationship must be formally designated and documented. The formal documentation should include the entity’s risk management objective, its strategy in undertaking the hedge, the nature of the hedged item and of the risk being hedged, and the methods the entity will employ in order to assess the effectiveness of the hedge.
2. The hedge must be expected to be highly effective and its effectiveness must be capable of being reliably measured.
A hedged item is an asset, liability, fi rm commitment, forecast future transac-tion or net investment in a foreign operation that (a) exposes the entity to risk
of changes in fair value or future cash fl ows and (b) is designated as being hedged. A hedging instrument is a designated derivative or (in limited circumstances) a non-
derivative fi nancial asset or non-derivative fi nancial liability whose fair value or cash fl ows are expected to offset changes in the fair value or cash fl ows of a designated hedged item.

STUDY MATERIAL F2250
AC
CO
UN
TIN
G F
OR
FIN
AN
CIA
L IN
STRU
MEN
TS The guidance notes to the standard provide more information as to the criteria that must be met for a hedge to be considered highly effective. It can be regarded as highly effective if two conditions are met:
1. At the inception of the hedge and subsequently, there was an expectation that there would be a high level of correlation between the fair value or cash fl ows of the hedged item and those of the hedging instrument, during the period that the hedge is designated.
2. The actual results of the hedge are within a range of 80–125 per cent. The standard gives the example of a loss on the hedging instrument of CU (Currency Unit) 120, with a gain on the hedged item of CU 100. The offset can be measured either at 120/100 (120 per cent) or 100/120 (83 per cent). In this case the hedge would be regarded as highly effective, provided that condition (1) was also met.
In its original form, IAS 39 prohibited the type of hedging that involves setting a hedg-ing instrument against a group of aggregated hedged items. However, following objec-tions from banks and others, the IASB revisited the issue by issuing an exposure draft, Fair value hedge accounting for a portfolio hedge of interset rate risk (macro hedging) in August 2003. These proposals were incorporated into IAS 39 in March 2004, and are effective for accounting periods beginning on the 1 January 2005 and subsequently. This so-called ‘ portfolio ’ hedging permits a hedging instrument to be set off against a portfolio contain-ing more than one hedged item.
There are two principal types of hedging relationship. It is important to distinguish between them because they have different effects on the income statement and the report-ing of profi t or loss.
11.5.2 Fair value hedges Fair value hedges are those in which the fair value of the item being hedged changes as mar-ket prices change. An example of this would be where the entity is due to pay an amount in a foreign currency at a future specifi ed date and has therefore taken out a forward for-eign exchange contract to buy the stipulated amount at the future date. Until the contracts mature there will be changes in the fair value of the liability and also the related fair value of the hedging instrument. These do not, however, result in cash fl ows until the date speci-fi ed in the future for maturity of the contracts.
Example 11.O
This example was included in the IAS 39 exposure draft to illustrate a fair value hedging arrangement. It illus-trates a hedge of exposure to changes in the fair value of an investment in fi xed rate debt as a result of changes in interest rates. In year 1 an investor purchases for 100 a debt security that is classifi ed as available for sale. At the end of year 1, the current fair value of the security is 110. The increase of 10 is reported as a gain and the carrying amount of the security is increased to 110. To protect the value of 110, the investor acquires a deriva-tive at the beginning of year 2 with no cost. By the end of year 2, the derivative instrument has a gain of 5 and the debt security has a corresponding decline in fair value. (This is an example of a highly effective hedge, where gains and losses match exactly.)

251FINANCIAL MANAGEMENT
AC
CO
UN
TING
FOR FIN
AN
CIA
L INSTRU
MEN
TS The accounting entries are as follows:
Year 1 DR Investment in debt security 100
CR Cash 100 Recording the purchase of the security DR Investment in debt security 10
CR Equity (via statement of changes in equity) 10
Refl ecting the increase in the fair value of the security (note that this is refl ected through the statement of changes in equity because the asset is available for sale).
Also, it should be noted that, at this stage, the fi nancial asset is not hedged.
Year 2 DR Derivative fi nancial asset 5
CR Gain (to be included in the income statement) 5 Refl ecting the increase in the fair value of the derivative DR Loss (to be included in the income statement) 5
CR Investment in debt security 5
Refl ecting the decrease in fair value of the debt security. At the end of year 2, the fi nancial assets subject to the hedging arrangement total 110, the same as at the
end of year 1. The only difference is that the fi nancial assets now comprise a derivative asset (at a value of 5) and the investment in debt security (at a value of 105). The effective hedge means that net profi t is protected from the effects of changes in value, because the gain on the derivative exactly offsets the loss arising from the decrease in fair value of the debt security.
Gains and losses on available for sale investments are normally recorded through equity, but where a fair value hedge exists the rule is broken, and the gain/loss on the available for sale investment is instead taken to the income statement in the same period as the gain/loss on the derivative that is being used to hedge against the risk of the change in value of the investment.
11.5.3 Cash flow hedges Cash fl ow hedges are those in which the cash fl ows of the item being hedged change as market prices change. The accounting treatment of gains and losses differs from that adopted in respect of fair value hedges. Changes in the fair value of the hedging instrument are initially reported in equity, via the statement of changes in equity. They are then transferred to profi t or loss to match the recognition of the offsetting gains or losses on the hedged transaction. This mean that the effect of gains and losses on the hedged transaction is minimised because any gains are matched by losses on the hedging instrument, and vice versa.
Note that a hedge of a net investment in a foreign operation is treated as for a cash fl ow hedge.
In this case, the rules are different as the gain/loss on the derivative would normally be recorded in the income statement from the date the contract is entered into. The transac-tion that it is hedging against, however will not be included in the income statement until some future date (the date the transaction will occur). The rules need to be adjusted as this would mean that gain/losses on each item will appear in different accounting periods. As a result the gain/loss on the derivative is held in equity until the transaction occurs and then is released to the income statement to match against the effect of the transaction it is hedging against.

STUDY MATERIAL F2252
AC
CO
UN
TIN
G F
OR
FIN
AN
CIA
L IN
STRU
MEN
TS 11.5.4 Designation of hedges Hedging is useful to organisations in helping to mitigate risk. However, the regulation in IAS 39 relating to hedges does allow entities some control over the timing of recognition of losses. In order to avoid manipulation of the reporting of profi ts and losses, there are some quite stringent rules in the standard about the designation of hedges:
● the hedging relationship has to be designated and the designation must be documented; ● to the extent that a hedging relationship is effective, the offsetting gains and losses on
the hedging instrument and the hedged item must be recognised in profi t or loss at the same time;
● all hedge ineffectiveness must be recognised immediately in the income statement; ● only items that meet the defi nitions of assets and liabilities are recognised as such in the
statement of fi nancial position.
11.6 IFRS 7 Financial instruments:disclosureThe standard’s disclosure requirements are intended to enhance understanding of the sig-nifi cance of fi nancial instruments to an entity’s fi nancial position, performance and cash fl ows. The disclosures should provide users with information that assists them in assessing the extent of risks related to fi nancial statements.
The disclosure requirements of IFRS 7 are as follows:
1. Information enabling users to evaluate the signifi cance of fi nancial instruments for the entity’s fi nancial position and performance.
2. The carrying amounts of fi nancial assets at fair value through profi t or loss, held- to-maturity investments, loans and receivables, available-for-sale fi nancial assets, fi nancial liabilities at fair value through profi t or loss and fi nancial liabilities at amortised cost.
3. Information about collateral, both collateral pledged in the form of fi nancial assets, and its holding of collateral.
4. Information about compound fi nancial instruments.5. Details of any defaults and breaches in respect of loans payable.6. Information about items of income, expense, gains or losses in respect of fi nancial
instruments.7. Accounting policies relating to fi nancial instruments.8. Description of fair value hedges, cash fl ow hedges and hedges of net investments in for-
eign operations.9. Disclosure of the fair value of fi nancial assets and fi nancial liabilities where fair value
differs from the carrying amount.
Additionally, entities must disclose information about the nature and extent of risks aris-ing from fi nancial instruments, including qualitative descriptions of the exposure to risks and the entity’s objectives, policies and procedures for managing the risk and the methods used to measure the risk. Quantitative disclosures are also required.
RiskThree signifi cant classes of risk are identifi ed in the standard: credit risk, liquidity risk and market risk, but the standard notes that there may be other categories of risk that affect the entity. The following defi nitions of risk are provided in the standard:

253FINANCIAL MANAGEMENT
AC
CO
UN
TING
FOR FIN
AN
CIA
L INSTRU
MEN
TSCredit risk: The risk that one party to a fi nancial instrument will cause a fi nancial loss
for the other party by failing to discharge an obligation.Currency risk: The risk that the fair value or future cash fl ows of a fi nancial instrument
will fl uctuate because of changes in foreign exchange rates.Interest rate risk: The risk that the fair value or future cash fl ows of a fi nancial instru-
ment will fl uctuate because of changes in market interest rates.Liquidity risk: The risk that an entity will encounter diffi culty in meeting obligations asso-
ciated with fi nancial liabilities.Market risk: The risk that the fair value or future cash fl ows of a fi nancial instrument
will fl uctuate because of changes in market prices. Market risk comprises three types of risk: currency risk, interest rate risk and other price risk.
Other price risk: The risk that the fair value or future cash fl ows of a fi nancial instrument will fl uctuate because of changes in market prices (other than those arising from interest rate risk or currency risk), whether those changes are caused by factors specifi c to the indi-vidual fi nancial instrument or its issuer, or factors affecting all similar fi nancial instruments traded in the market.
Risk management policies and hedging activities. In addition to providing specifi c infor-mation about specifi c fi nancial balances and transactions, an entity must provide a dis-cussion of the extent to which fi nancial instruments are used, the associated risks and the business purposes served.
Hedging relationshipsDisclosure of hedging activities is also required:
Terms, conditions and accounting policies. Information about the nature and extent of fi nancial instruments must be provided. This is to include signifi cant terms and conditions that may affect the amount, timing and certainty of future cash fl ows, and the accounting policies and methods adopted.
Interest rate risk. For each class of fi nancial assets and fi nancial liabilities, the entity should disclose information about the extent of its exposure to interest rate risk. This is to include information about the dates of maturity, and the effective interest rates applicable to the instruments.
Credit risk. An entity should disclose information about the extent of its exposure to credit risk, including information about signifi cant concentrations of credit risk (e.g., where an entity is exposed to risk in a particular geographical area).
Fair value. Where an entity does not measure a fi nancial asset or fi nancial liability in its statement of fi nancial position at fair value, it should provide suffi cient fair value infor-mation about fi nancial assets and fi nancial liabilities through supplementary disclosures. Where entities recognise fi nancial instruments at fair value then the methods and assump-tions underlying the fair valuation should be disclosed.
11.7 SummaryThis chapter of the Learning System has covered one of the more complex accounting issues in the syllabus. The following areas of fi nancial instruments have been covered:
● Classifi cation of fi nancial instruments● Initial recognition and measurement of fi nancial instruments● Subsequent measurement of fi nancial instruments, including impairment

STUDY MATERIAL F2254
AC
CO
UN
TIN
G F
OR
FIN
AN
CIA
L IN
STRU
MEN
TS ● Hedging relationships● Disclosure requirements
Accounting for fi nancial instruments is still in the process of development, and there are likely to be further changes.
Students can expect both computational and discussion-type questions to be set in this area of the syllabus. They are expected to be able to calculate
the impact of fi nancial instrument measurement on fi nancial statements in all the aspects explained in the chapter.
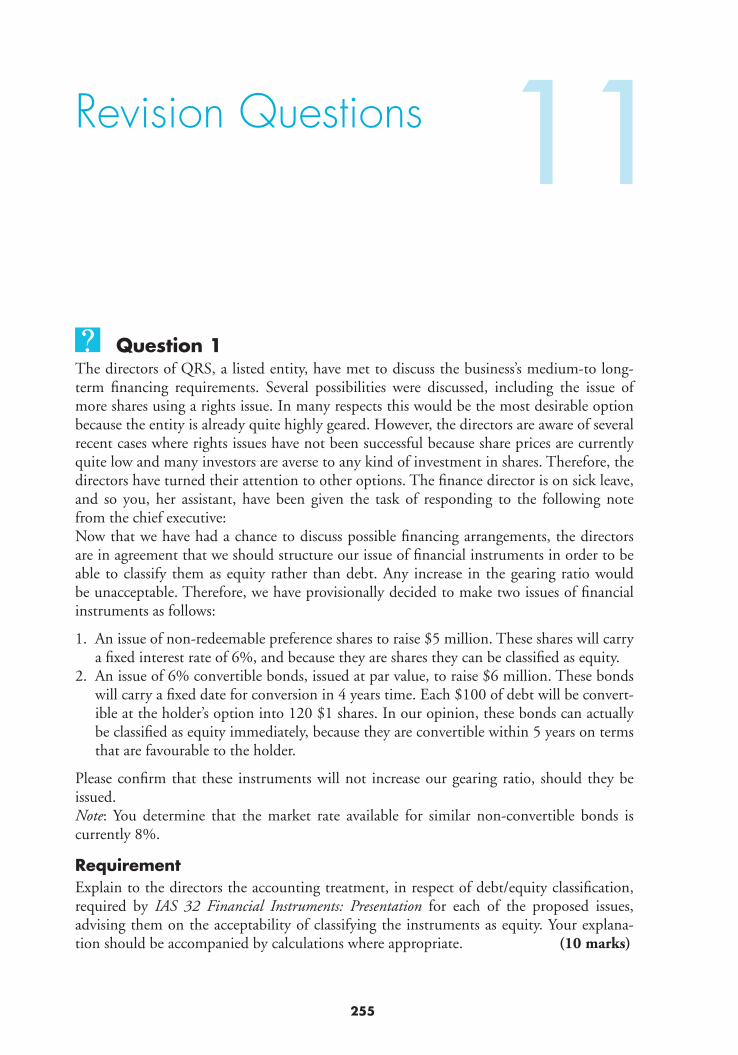
255
Revision Questions
Question 1The directors of QRS, a listed entity, have met to discuss the business’s medium-to long-term fi nancing requirements. Several possibilities were discussed, including the issue of more shares using a rights issue. In many respects this would be the most desirable option because the entity is already quite highly geared. However, the directors are aware of several recent cases where rights issues have not been successful because share prices are currently quite low and many investors are averse to any kind of investment in shares. Therefore, the directors have turned their attention to other options. The fi nance director is on sick leave, and so you, her assistant, have been given the task of responding to the following note from the chief executive:Now that we have had a chance to discuss possible fi nancing arrangements, the directors are in agreement that we should structure our issue of fi nancial instruments in order to be able to classify them as equity rather than debt. Any increase in the gearing ratio would be unacceptable. Therefore, we have provisionally decided to make two issues of fi nancial instruments as follows:
1. An issue of non-redeemable preference shares to raise $5 million. These shares will carry a fi xed interest rate of 6%, and because they are shares they can be classifi ed as equity.
2. An issue of 6% convertible bonds, issued at par value, to raise $6 million. These bonds will carry a fi xed date for conversion in 4 years time. Each $100 of debt will be convert-ible at the holder’s option into 120 $1 shares. In our opinion, these bonds can actually be classifi ed as equity immediately, because they are convertible within 5 years on terms that are favourable to the holder.
Please confi rm that these instruments will not increase our gearing ratio, should they be issued.Note: You determine that the market rate available for similar non-convertible bonds is currently 8%.
RequirementExplain to the directors the accounting treatment, in respect of debt/equity classifi cation, required by IAS 32 Financial Instruments: Presentation for each of the proposed issues, advising them on the acceptability of classifying the instruments as equity. Your explana-tion should be accompanied by calculations where appropriate. (10 marks)
11

AC
CO
UN
TIN
G F
OR
FIN
AN
CIA
L IN
STRU
MEN
TS Question 2 (a) ABC has the following fi nancial instruments in issue:
On 1 January 20X6, ABC issued 10,000 5% convertible bonds at their par value of $50 each. The bonds will be redeemed on 1 January 20Y1. Each bond is convertible at the option of the holder at any time during the 5 year period. Interest on the bond will be paid annually in arrears.
The prevailing market interest rate at the date of issue was 6%.
RequirementCalculate the value that should be recorded in respect of the equity element of the hybrid fi nancial instrument be recognised in the fi nancial statements of ABC at the date of issue.
(b) On 1 January 20X6 an entity, ABC, issued a debt instrument with a value of $5,000,000, incurring $150,000 in issue costs. The coupon rate of the debt is 2.5%. It will become repayable on 1 January 20Y6 at a premium of $1,750,000.
RequirementCalculate the total amount of fi nance cost associated with the debt instrument.
(10 marks)
Question 3 You are the management accountant of Short. On 1 October 20X3 Short issued 10 mil-lion $1 preference shares at par, incurring issue costs of $100,000. The dividend payable on the preference shares was a fi xed 4% per annum, payable on 30 September each year in arrears. The preference shares were redeemed on 1 October 20X8 at a price of $1.35 per share. The effective fi nance cost of the preference shares was 10%. The statement of fi nan-cial position of the entity as at 30 September 20X8, the day before the redemption of the preference shares, was as follows:
$ Ordinary share capital (non-redeemable) 100.0 Redeemable preference shares 13.5 Share premium account 25.8 Retained earnings 59.7 199.0 Total equity 199.0
Requirements (a) Write a memorandum to your assistant which explains:
● how the total fi nance cost of the preference shares should be allocated to the income statement over their period of issue;
Your memorandum should refer to the provisions of relevant accounting standards.(5 marks)
(b) Calculate the fi nance cost in respect of the preference shares for each of the 5 years ended 30 September 20X8.
(5 marks)(Total Marks � 10)
REVISION QUESTIONS F2256

AC
CO
UN
TING
FOR FIN
AN
CIA
L INSTRU
MEN
TS
257FINANCIAL MANAGEMENT
Question 4 On 1 January 20X1 A issued 50,000 $100 2% debentures to investors for $55 each. The debentures are redeemable at their par value of $100 in 5 years ’ time, 31 December 20X5.
The accountant has drafted the fi nancial statements but has omitted to apply IAS 39. The draft income statement and an extract from the balance sheet are as follows:
Income statement
20X2 20X1 $’000 $’000
Revenue 7,830 6,690 Operating expenses 5,322 5,109 Interest payable 100 100 Profi t before taxation 2,408 1,481 Taxation 521 320 Profi t for the period 1,887 1,161 Dividends paid 200 200
Statement of fi nancial position (extract)
20X2 20X1 $’000 $’000
Payable: amounts falling due after 1 year 2% debenture 2,750 2,750
Requirement Amend the draft accounts including comparatives to comply with IAS 39. The rate of interest implicit for the debentures is 15.62% per annum.
(10 marks)
Question 5 During its fi nancial year ended 31 December 20X8, CD entered into the following transactions:
1. In August 20X8, CD made an investment in the securities of a listed entity. The direc-tors intend to realise the investment in the fi rst quarter of 20X9 in order to fund the planned refi t of the head offi ce.
2. CD lent one of its customers, XY, $1,000,000 at a variable interest rate pegged to aver-age bank lending rates. The loan is scheduled for repayment in 5 years time and CD has provided an undertaking to XY that it will not assign the loan to a third party.
3. CD made some small investments in the securities of some other listed entities. CD does not plan to dispose of these investments in the short term.
Requirements In accordance with IAS 39 Financial Instruments: Recognition and Measurement :
(a) Identify the appropriate classifi cation of these three categories of fi nancial asset and briefl y explain the reason for each classifi cation. (6 marks)

AC
CO
UN
TIN
G F
OR
FIN
AN
CIA
L IN
STRU
MEN
TS (b) Explain how the fi nancial assets should be measured in the fi nancial statements of CD at 31 December 20X8. (4 marks)
(Total marks � 10)
Question 6 (a) At its year end, 31 March 20X7, entity JBK held 60,000 $1 shares in a listed entity, X.
The shares were purchased on 11 February 20X7 at a price of 85¢ per share. The mar-ket value of the shares on 31 March 20X7 was 93¢ and the transaction costs associated with the acquisition were $2,000. The investment is categorised as available for sale.
RequirementShow the journal entries required in respect of both the initial acquisition and its subse-quent remeasurement on 31 March 20X7 and show the relevant extract from the state-ment of comprehensive income and the statement of fi nancial position in respect of this investment. (6 marks)
(b) JBK disposed of these shares on 16 May 20X9 for 96¢ per share.
RequirementShow the journal entries required to record the derecognition of this investment and briefl y explain the accounting treatment adopted. (4 marks)
(Total marks � 10)
Question 7 XY purchase 100,000 $1 shares in CD for $1.10 during 20X7. The investment was classi-fi ed on initial recognition as held for trading and transaction costs associated with the pur-chase totalled $3,000. At the year end 31 December 20X7 the shares were trading at $1.15.
During 20X8 it became apparent that CD was in fi nancial distress and the directors of XY thought it prudent to conduct an impairment review. The review showed that the investment was impaired by $10,000.
Requirement (a) Prepare the journal entries to record the initial recognition and subsequent measure-
ment of the instrument above and briefl y describe the accounting treatment adopted for the year ended 31 December 20X7.
(b) Briefl y describe the accounting treatment required in respect of the impairment in the 20X8 accounts and prepare the necessary journal entries. (10 marks)
Question 8 CD has an available for sale investment with a carrying value of $130,000 as at the year end date, 31 December 20X6. The value of the investment at 31 December 20X7 is $138,000.
REVISION QUESTIONS F2258

AC
CO
UN
TING
FOR FIN
AN
CIA
L INSTRU
MEN
TS
259FINANCIAL MANAGEMENT
CD was concerned about the value of the shares falling and in order to mitigate this risk it entered into a derivative contract during 20X8 to hedge against the potential effect on the value of the shares of a general downturn in the market. The hedge is 100% effective and the contract has a positive value of $1,800 as at 31 December 20X8. The fall in the value of the available for sale investment was $2,000 as at 31 December 20X8, however $200 of that related to a change in the credit rating of the entity invested in.
RequirementBriefl y describe the treatment of the investments noted above and prepare the required journal entries for the years ended 31 December 20X7 and 20X8. (10 marks)

This page intentionally left blank

261
Solutions to Revision Questions Solution 1 In general, under the requirements of IAS 32 – Financial instruments: presentation – fi nancial instruments that fulfi l the characteristics of a liability should be classifi ed as such. Although preference shares carry the description of ‘shares’ this does not mean that they can neces-sarily be classifi ed as equity. In cases where the payment of the ‘dividend’ is a fi xed sum that is normally paid in respect of each accounting period, the instrument is really a long-term liability and must be classifi ed as such.
The convertible bonds would be classifi ed as a compound, or hybrid, instrument by IAS 32; that is, they have characteristics of both debt and equity, and would therefore be pre-sented partly as debt and partly as equity in the statement of fi nancial position. Valuation of the equity element is often diffi cult. The method required by IAS 32 involves valua-tion of the liability element using an equivalent market rate of interest for non-convertible bonds, with equity as a residual fi gure.
Applying this approach to the proposed instrument, the following debt/equity split results:
Present value of the capital element of the bond issue: $
$6 m � 1/(1.084) 4,410,000Interest at present value:($6,000,000 � 6%) � [1/(1.08) � 1/(1.082) � 1/(1.083) � 1/(1.084)]� $360,000 � 3.312 (from tables) 1,192,320Value of liability element 5,602,320Equity element (balancing fi gure) 397,680Total value of instrument 6,000,000
Apart from the relatively small element of the hybrid instrument that can be classifi ed as equity, the two proposed issues will be classifi ed as debt under the provisions of IAS 32. If the directors wish to obtain fi nance through an issue of fi nancial instruments that can be properly classifi ed as equity, they should reconsider the rights issue proposal.
Solution 2 Bond principal: 10,000 � $50 � 500,000. Annual interest payment � $500,000 � 5% �$25,000.
Present value of principal: $500,000/(1.06)5 (factor from table � 0.747) 373,500Present value of interest: $25,000 � cumulative discount factor (from tables � 4.212) 105,300 478,800Balancing fi gure � equity element 21,200Principal 500,000
The equity element should be held at a value of $21,200.
11

AC
CO
UN
TIN
G F
OR
FIN
AN
CIA
L IN
STRU
MEN
TS $ $Total amount payable: Interest payable: 5,000,000 � 2.5% � 10 1,250,000 Repayment: 5,000,000 � 1,750,000 6,750,000
8,000,000Total amount received: Issue 5,000,000 Less: issue costs (150,000) 4,850,000Total fi nance cost 3,150,000
Solution 3 (a)
MemorandumTo: Assistant accountantFrom: Management accountantDate:Subject: Financial instruments – preference sharesPreference shares are, in substance, similar to a debt instrument. They are issued on the understanding that they will receive a fi xed dividend and will be redeemed at a specifi ed amount on an agreed date. It is likely that IAS 32 would require these instruments to be recognised as a fi nancial liability.
In the income statement, the fi nance charge should be calculated as the effective rate applied to the carrying value of the instrument. However, this charge represents the dif-ference between the net proceeds and the total payments made during the life of the instrument. It will therefore incorporate not only interest charges but also the initial issue expenses, as well as any premiums payable at the end of the instrument’s life.
The carrying value of the non-equity shares will increase each year by the difference between the effective interest charge and the dividends paid in cash. At the end of the instrument’s life the amount outstanding on the statement of fi nancial position should therefore represent the cash that must be paid to extinguish the full debt at the time.
Signed: Management accountant
(b) Short – fi nance cost for each of the 5 years to 30 September 20X8
$’m $’m Total payments over the life of the instrument 10m � $1.35 13.5 Dividends 0.4 m � 5 years 2.0 15.5 Net proceeds Proceeds on issue 10.0 Less issue costs 0.1 9.9 Finance charge 5.6
SOLUTIONS TO REVISION QUESTIONS F2262

AC
CO
UN
TING
FOR FIN
AN
CIA
L INSTRU
MEN
TS
263FINANCIAL MANAGEMENT
The spreading of the annual fi nance cost is as follows:
Opening balance
Finance charge (10%)
Dividend cash fl ow
Closing balance
$’000 $’000 $’000 $’000 20X4 9,900 990 (400) 10,490 20X5 10,490 1,049 (400) 11,139 20X6 11,139 1,114 (400) 11,853 20X7 11,853 1,185 (400) 12,638 20X8 12,638 1,262* (400) 13,500 redeemed
5,600 2,000 (*rounding)
Solution 4 You should fi rst show the table for the allocation of interest as follows (with a slight round-ing adjustment at the end):
Year Balance b/f $
Interest $
Cash fl ow $
Balance c/f $
20X1 2,750,000 429,550 100,000 3,079,550 20X2 3,079,550 481,026 100,000 3,460,576 20X3 3,460,576 540,542 100,000 3,901,118 20X4 3,901,118 609,355 100,000 4,410,473 20X5 4,410,473 689,527 5,100,000 0
In substance the debentures are issued at a discount and repaid at a premium. This must all be allocated in the fi nance charge so that users of the fi nancial statements have full information.
The revised income statement and statement of fi nancial position extract will be as follows:
Income statement
20X2 20X1 $’000 $’000
Revenue 7,830 6,690 Operating expenses 5,322 5,109 Interest payable 481 430 Profi t for the period 2,027 1,151 Taxation 521 320 Profi t after taxation 1,506 831
Dividends paid 200 200
Statement of fi nancial position (extract)
20X2 20X1 $’000 $’000
Payable: amounts falling due after 1 year 2% debenture 3,461 3,080

AC
CO
UN
TIN
G F
OR
FIN
AN
CIA
L IN
STRU
MEN
TS Solution 5
(a) 1. This is classifi ed as a fi nancial asset at fair value through profi t or loss because the directors acquired the securities with the intention of selling them in the short term; they fall into the category of ‘ held-for-trading ’ .
2. The loan is classifi ed as a held-to-maturity fi nancial asset. The loan is an unlisted security with determinable payments. The intention to hold the asset until maturity is demonstrated by the undertaking not to assign the loan to a third party.
3. There is no plan to sell these investments in the short term, but they do not appear to fall into the loans and receivables or held-to-maturity classifi cations either. Financial assets that do not fall into the three other classifi cations identifi ed by IAS 39 are likely to be classifi ed as available-for-sale.
(b) The standard requires that fi nancial assets held for trading (which are classifi ed as fi nancial assets at fair value through profi t or loss, and those available for sale should be measured at fair value (categories 1 and 3 of PX’s fi nancial assets). Held-to-maturity fi nancial assets are measured at amortised cost.
Solution 6 (a) IAS 39 requires that the available for sale investment be initially recorded at cost plus
transaction costs.
Dr Available for sale investment $53,000 Cr Bank $53,000
Being the initial recording of the investment including transaction costs ((60,000 �$0.85) � $2,000)
Subsequent measurement will occur at the year end and available for sale assets are measured at fair value with gains and losses being recorded in equity until derecognition. The shares will be held at $55,800 (60,000 � 0.93) and the gain of $2,800 (55,800 �53,000) will be recorded in equity.
Dr Available for sale investment $2,800 Cr Other reserves $2,800
Being the remeasurement of the available for sale investment
Extracts from the statement of fi nancial position at 31 March 20X7AssetsNon-current assets
Available for sale investment $55,800Equity
Other reserves $2,800
Extracts from the statement of comprehensive income for the year ended 31 March 20X7Other comprehensive income
Gain on available for sale asset $2,800
(b) On disposal the asset will be derecognised and the gain on sale will include the gain in the period (disposal proceeds less carry value) plus the recycled gains that were previ-ously recognised through reserves.
SOLUTIONS TO REVISION QUESTIONS F2264

AC
CO
UN
TING
FOR FIN
AN
CIA
L INSTRU
MEN
TS
265FINANCIAL MANAGEMENT
Dr Bank (60,000 � 0.96) $57,600Cr Available for sale investment $55,800Cr Gain on disposal (income statement) $1,800Dr Other reserves $2,800Cr Gain on disposal (income statement) $2,800
Being the disposal of the shares
Solution 7 (a) The shares are held for trading and so are initially recorded are cost. Transaction costs
are not included for investments classed as fair value through profi t or loss and so they will be written off to the income statement in the year: Dr Held for trading asset $110,000 Cr Bank $110,000Being purchase of held for trading asset Dr Expense $3,000 Cr Bank $3,000Being write off of transaction costs
The investment will subsequently be held at fair value and gains and losses from investment held at fair value through profi t or loss are recorded in the income statement:
Dr Held for trading $5,000 Cr Gain in income statement $5,000
Being the gain on held for trading investment 100,000 � ($1.15 � $1.10)
(b) The impairment should be recorded and the investment should be carried at the impaired value of $105,000. The impairment loss will be charged to the income state-ment when it is incurred: Dr Impairment loss on fi nancial asset $10,000 Cr Held for trading asset $10,000Being the impairment loss in the year
Solution 8 This is an example of a fair value hedge. CD have entered into a hedging arrangement as it wants to minimise the risk of the value of the AFS investment falling as a result of a fall in value of the share price.
In 20X7 the available for sale asset is recorded as normal with the gain of $8,000 being recorded in reserves, in accordance with IAS 39:
Dr Available for sale investment $8,000 Cr Other reserves $8,000
This gain of $8,000 will be shown within other comprehensive income for the year ended 31 December 20X7.
In 20X8 an effective hedge exists to cover any fall in the value of the shares due to gen-eral market conditions. The derivative has a positive value and is therefore an asset held at fair value through profi t or loss. This hedged item is the AFS but only the effective part of the hedge can be offset in the income statement (we break the rules for AFS gains/losses so

AC
CO
UN
TIN
G F
OR
FIN
AN
CIA
L IN
STRU
MEN
TS that the gain/loss on the hedging instrument matches against the gain/loss on the hedged item). Any effective part or any loss not covered by hedge is recorded according to the nor-mal rules for the available for sale asset, i.e. to reserves. The recording for 20X8 is:
Dr Financial asset – derivative $1,800 Cr Gain on derivative (IS) $1,800
Being the accounting for the derivative
Dr Loss on hedged investment $1,800 Dr Other reserves $200 Cr Available for sale investment $2,000
Being the accounting for the AFS investment
SOLUTIONS TO REVISION QUESTIONS F2266

12
Employee Benefits

This page intentionally left blank
269
12 LEARNING OUTCOMES After studying this chapter students should be able to:
� discuss the recognition and valuation issues concerned with pension schemes and the treatment of actuarial defi cits and surpluses;
� discuss the recognition and valuation issues concerned with share-based payments.
12.1 IntroductionThis chapter will cover the accounting treatment of employee benefi ts, including pensions and share-based payments. Section 12.2 covers the objective of IAS 19 Employee Benefi tsand introduces the defi nitions and terms that are specifi c to pension schemes. Section 12.3 deals with the accounting for defi ned benefi t and defi ned contribution schemes, including the treatment of actuarial gains and losses. Section 12.4 reviews the amendment to IAS 19. Section 12.5 covers the requirements of IFRS 2 Share-based payments.
12.2 IAS 19 Employee benefits The objective of IAS 19 is to prescribe accounting and disclosure in respect of employee benefi ts. An entity must recognise:
(a) a liability when an employee has provided service in exchange for employee benefi ts to be paid in the future.
( b) an expense when the entity consumes the economic benefi t arising from service pro-vided by an employee in exchange for employee benefi ts.
Employee Benefits

STUDY MATERIAL F2270
EMPL
OYE
E BE
NEF
ITS Employee benefi ts include:
(a) short-term benefi ts such as wages, salaries, holiday pay, bonuses, profi t-sharing and benefi ts;
(b) post-employment benefi ts such as pensions and post-employment life insurance and medical care;
(c) other long-term benefi ts such as sabbatical leave and deferred compensation; (d) termination benefi ts.
The standard notes that accounting for short-term benefi ts is generally straightforward; the normal accruals principle applies, and so short-term prepayments and accruals may arise, but discounting and actuarial valuations are not required. The principal area of com-plexity arises in respect of accounting for post-employment benefi ts.
Post-employment benefi t plans are classifi ed as either defi ned contribution or defi ned benefi t plans. The standard’s defi nition of defi ned contribution plans is as follows:
Defi ned contribution plans are post-employment benefi t plans under which an entity pays fi xed contribu-tions into a separate entity (a fund) and will have no legal or constructive obligations to pay further contri-butions if the fund does not hold suffi cient assets to pay all employee benefi ts relating to employee service in the current and prior periods.
Defi ned benefi t plans are all plans not classifi ed as defi ned contribution plans. Most of the rest of the part of the chapter on IAS 19 relates to accounting for defi ned benefi t plans.
12.2.1 Key definitions Employee benefi ts are all forms of consideration given by an entity in exchange for service rendered by employees.
Post-employment benefi ts are employee benefi ts which are payable after the completion of employment.
The present value of a defi ned benefi t obligation is the present value, without deducting any plan assets, of expected future payments required to settle the obligation resulting from employee service in the current and prior periods.
Current service cost is the increase in the present value of the defi ned benefi t obligation resulting from employee service in the current period.
Interest cost is the increase during a period in the present value of a defi ned benefi t obli-gation which arises because the benefi ts are one period closer to settlement.
Plan assets comprise assets held by a long-term employee benefi t fund. Assets held by a long-term employee benefi t fund are assets that are held by a fund that is
legally separate from the reporting entity, and exists solely to pay or fund employee ben-efi ts. Such assets are available only for payment or funding of employee benefi ts; they are not available for meeting the reporting entity’s other obligations and they cannot be returned to the reporting entity.
The return on plan assets is interest, dividends and other revenue derived from the plan assets, together with realised and unrealised gains or losses on the plan assets, less any costs of administering the plan and less any tax payable by the plan.
Actuarial gains and losses comprise experience adjustments (the effect of differences between the previous actuarial assumptions and what has actually occurred; these may be gains or losses) and the effect of changes in actuarial assumptions.

271FINANCIAL MANAGEMENT
EMPLO
YEE BENEFITS
Past service cost is the increase in the present value of the defi ned benefi t obligation for employee service in prior periods, resulting in the current period from the introduction of, or changes to, post-employment benefi ts or other long-term employee benefi ts. Past service cost may be either positive (where benefi ts are introduced or improved) or negative (where existing benefi ts are reduced).
12.3 Accounting for post-employment benefits12.3.1 Defined contribution plansWhen an employee has rendered service to an entity during an accounting period, the entity should recognise that contribution payable to a defi ned contribution plan in exchange for that service. The receipt of service is thus matched against the amount of contribution paid by the entity in respect of the service. This is the simplest scheme to deal with.
Example 12.A
C operates a defi ned contribution scheme for all eligible employees. Under the terms of the scheme, C pays 5% of gross salary into the scheme. The payroll cost for the month of October was $450,000.
The pension cost of $22,500 ($450,000 � 5%) will be recorded and paid over to the pension fund. It will normally be included in employee costs in the income statement.Recorded as:
Dr Employee costs – pensions $22,500Cr Bank/pension fund liability $22,500Being pension costs for October (bank or creditor depending on date it is paid over).
12.3.2 Defined benefit plans In a typical (funded) defi ned benefi t scheme cash is paid into the scheme’s fund by employees themselves, or on their behalf by employers, or both. The assets of the scheme are managed separately from the employer entity, and are invested to produce returns which enhance the value of the fund. The value of the fund is reduced when benefi ts are paid out. Defi ned benefi t schemes carry the risk that the assets in the scheme will not be suffi cient to pay out all the future benefi ts to employees that are committed under the rules of the scheme. In such cases meeting any shortfall depends upon the resources of the employer entity. As IAS 19 points out: ‘ the entity is, in substance, underwriting the actu-arial and investment risks associated with the plan ’ .
Periodically, an actuarial valuation is carried out in order to estimate the amount of benefi t that employees have earned in return for their service in the current and prior periods. The valuation involves actuarial assumptions about a range of variables such as mortality rates and future increases in salaries. Using such assumptions, the actuary estimates the value of the scheme liability which is then discounted to present value.
The discounted value of the scheme liabilities is compared to the value of the scheme assets, adjusted for any past service cost that may have arisen, and a total amount of actu-arial gain or loss is calculated. The application of the IAS 19 rules mean that the actuarial gain or loss may or may not be recognised in the accounting period.
The next subsection of the chapter will examine the accounting in detail.

STUDY MATERIAL F2272
EMPL
OYE
E BE
NEF
ITS Defined benefit plan
Accounting for defi ned benefi t plans involves the following steps:
1. Use actuarial techniques to make a reliable estimate of the amount of benefi t employees have earned in return for their service in the current period.
2. Discount that benefi t to determine the present value of the defi ned benefi t obligation and the current service cost.
Example 12.B
Under the terms of a defi ned benefi t plan, a lump-sum benefi t is payable on termination of service equal to 1% of fi nal salary for each year of service. An employee joins on 1.1.20X1 and is paid an annual salary of $10,000. This is assumed to increase at 7% compound each year until the employee leaves. The applicable discount rate is 10%. This particular employee expects to leave on 31.12.20X5. What is the current service cost for 20 X 3,assuming that there are no changes in actuarial assumptions?
When the employee is due to leave on 31.12.20X5 the expected salary is $10,000 � (1.07) 4 � $13,108. Each year’s service earns an extra lump sum of 1% of fi nal salary so the lump-sum entitlement increases by $131 (1% � $13,108) for each year of service. The current service cost for 20X3 is found by dis-counting this entitlement by 2 years at the discount rate of 10%, to $108 [$131 ÷ (1.10) 2 ].
3. The current service cost is charged as an expense in the income statement, together with an interest cost, which is the increase in the present value of liabilities recognised in previous years owing to the fact that they are 1 year closer to payment. The closing liability is then the opening liability plus the interest cost plus the current service cost plus or minus any actuarial differences (see later).
Example 12.C
At the end of 20X2 the employee in the example we are considering would have built up an entitlement to receive $262 (2 � $131) on leaving employment. This would have been shown as a liability of $196 [$262 ÷ (1.10) 3]. The interest charge for 20 � 3 would be $20 ($196 � 0.10). Therefore the closing liability would be $196 � $20 � $108 (the current service cost for 20X3 we worked out earlier) – a total of $324. This is of course 3 years ’ entitlement ($131 � 3 � $393) discounted by 10% per annum to its present value at the end of 20X3.
4. Determine the fair value of any plan assets. These are assets held by a separate legal entity that are to be used only to settle the employee benefi t obligations.
5. The expected rate of return on opening fund assets is recognised as a component of the income statement, effectively reducing the pension cost.
6. Determine the total amount of actuarial gains and losses. Actuarial gains and losses are caused by changes in the actuarial assumptions made regarding the scheme and experi-ence surpluses or defi ciencies (the effect of previous actuarial assumptions proving not to be totally accurate).

273FINANCIAL MANAGEMENT
EMPLO
YEE BENEFITS
Example 12.D
The following additional data relates to the benefi t plan of which the employee we have been considering is a member for 20X3:
● Present value of the total obligation and fair value of the plan assets at the start of the year � $1,000,000. ● Expected rate of return on plan assets at start of year � 12%. ● Current service cost � $130,000. ● Benefi ts paid to plan members $150,000. ● Contributions paid into plan $90,000. ● Present value of total obligation at the end of the year � $1,141,000. ● Fair value of plan assets at the end of the year � $1,092,000.
Using the above information we can compute the actuarial gain or loss for the year. This is done in two parts:
Gain or loss on obligation
$’000 Present value of obligation at start of the year 1,000 Interest cost (10% � $1 m 2 10% is the discount rate) 100 Current service cost 130 Benefi ts paid (150) Actuarial loss on obligation – balancing fi gure 61 Present value of obligation at end of the year 1,141
Gain or loss on assets
$’000 Fair value of plan assets at start of the year 1,000 Expected return on plan assets (12% � $1 m) 120Contributions 90Benefi ts paid (150) Actuarial gain on assets – balancing fi gure 32 Fair value of plan assets at end of the year 1,092
7. The actuarial gains and losses depend on the actuarial assumptions and the experience surpluses or defi ciencies. They are not recognised immediately in the income statement. The only time such gains or losses are recognised in the income statement is if, at the beginning of the period, the net cumulative unrecognised gains, actuarial gains and losses exceeded 10 per cent of the greater of:
● the present value of the obligation before deducting plan assets; ● the fair value of any plan assets.
The limit is referred to in the standard as ‘ the corridor ’ . In those circumstances any excess, divided by the average remaining working lives of
the employees participating in the plan, is recognised in the income statement. Note, however, that a recent amendment to IAS 19 has introduced a futher option
for accounting for actuarial gains and losses (see Section 15.1.3 later in this chapter).
Example 12.E
In the scenario we have been considering, suppose that the average remaining service lives of the employees in the plan is 10 years. At the start of 20X3 the net cumulative unrecognised actuarial gains were $140,000. This means that the amount of actuarial gains and losses recognised in the income statement for 20X3 will be:
● Limits of corridor is $100,000 (10% � $1 m – both liability and asset are this fi gure at the start of the year). ● Excess is $40,000 ($140,000 � $100,000). ● The amount recognised in the income statement in 20X3 is $4,000 $ ,40 000
10 .

STUDY MATERIAL F2274
EMPL
OYE
E BE
NEF
ITS ● And the cumulative unrecognised actuarial gains at the end of 20X3 are $107,000 [$140,000 � $4,000 �
$32,000 (gain on assets) � $61,000 (loss on obligation)]. ● The corridor at the end of 20X3 is $114,100 [10% � $1,141,000 (the closing obligation)]. Therefore no
actuarial gains and losses will be recognised in the income statement in 20X4.
8. The statement of fi nancial position shows the net of the following amounts: ● the present value of the defi ned benefi t obligation; ● plus any unrecognised actuarial gains minus any unrecognised actuarial losses; ● less the fair value of the plan assets.
Example 12.F
In the scenario we have been considering, the net statement of fi nancial position fi gure for the plan in the fi nan-cial statements of the contributing entity will be:
$’000 Present value of pension obligation 1,141 Unrecognised actuarial gains 107 Fair value of plan assets (1,092) Net plan liability 156
An evaluation of the IAS 19 requirements for defined benefit plans The use of actuarial techniques to compute the three ongoing components of the charge to the income statement is a reasonable refl ection of the economic exposure facing the contributing companies. However, the treatment of actuarial gains and losses lacks con-ceptual validity in that it required unrecognised gains to be recognised as residuals in the statement of fi nancial position. Some countries (e.g., the UK) have moved in the direc-tion of immediate recognition of actuarial differences. The IASB intends to undertake a major project on accounting for post-retirement benefi ts, and it is likely that international accounting practice in this area will be substantially revised. In the meantime, the IASB issued an amendment to IAS 19 in December 2004. An important aspect of this amend-ment is examined below.
12.4 Amendment to IAS 19 – December 2004 The amendment to IAS 19 published in December 2004 is entitled ‘ Actuarial gains and losses, group plans and disclosures ’ . This section of the Learning System will focus upon the amendment to the permitted treatments of actuarial gains and losses. This basis for the conclusions on the amendment observes that actuarial gains and losses are economic events of the period in which they occur. Consequently, the original IAS 19 recommended treat-ment of such gains and losses (set out in the previous section) is inappropriate in permitting recognition to be deferred or to be spread over several accounting periods. The amendment therefore permits entities to opt for an accounting policy that recognises these gains and losses immediately. Rather than recognising them in the income statement, the amended standard requires that they should be recognised in a statement of changes in equity.

275FINANCIAL MANAGEMENT
EMPLO
YEE BENEFITS
Now with the introduction of the statement of comprehensive income, the gains or losses would be reported within other comprehensive income in the year.
The purpose of recognising and reporting such gains and losses outside the income statement is to protect reported profi ts from the potentially volatile effects of some very signifi cant items.
In its basis for conclusions, the IASB deals with some of the principal arguments against this amendment. It takes the view that, pending a thorough revision of the standard, which will obviously take some time, it is better to offer an option that allows for more transparent information than that provided by deferred recognition. Also, a drawback of the deferred recognition approach is that it requires recognition of a debit item (where actuarial losses exist) or a credit item (in respect of gains) that do not fulfi l the defi nitions of an asset or a liability.
Some of the principal criticisms of the IASB’s approach in respect of this amendment are as follows:
1. It is inherently undesirable to extend the range of options available in an account-ing standard. Much of the IASB’s improvement project has had the opposite objec-tive of restricting the range of options available. The availability of options impedes comparability.
2. The amendment requires recognition in a separate ‘ statement of recognised income and expense ’ , requiring an amendment to IAS 1. This may be seen as prejudging issues that should, ideally, be resolved as part of the project on comprehensive income reporting.
3. Conceptually, if such gains and losses are to be recognised, recognition should be within the income statement.
4. This approach diverges from US GAAP, and so runs counter to the prevailing trend of convergence of US and international practice.
However, it should be noted that this potentially very signifi cant amendment to account-ing practice is, currently, optional. Entities can, and probably in many cases will, continue with their existing accounting policy. The entities most likely to utilise the amendment are those UK listed entities that have already altered their accounting for post-retirement ben-efi ts in accordance with the UK standard FRS 17 (which requires immediate recognition of actuarial gains and losses).
12.5 IFRS 2 Share-based paymentShare option schemes are frequently used as a means of rewarding employees. They may also be used as a means of buying-in goods or services from parties outside the entity. Such schemes can become very complicated, especially if the options are dependent in some way on entity or employee performance.
In some cases, share schemes of various types are used as a means of replacing substantial parts of remuneration in the form of regular salary, or indeed as a complete substitute for remuneration. In the case of risky business start-ups (particularly in high-tech industries) employees may agree to work for little or nothing, being rewarded instead either by shares in the entity at start-up (at which point the shares are likely to be worth little or nothing) or by options to purchase shares at a minimal price at some future date. Employees in such cases voluntarily take on a risk, in the hope of material reward in future. The advantage to the start-up entity is obvious: it obtains the advantages of highly skilled labour without

STUDY MATERIAL F2276
EMPL
OYE
E BE
NEF
ITS having to pay for it. If the business fails, the value of the stock or options will never
materialise and the employees bear the opportunity cost of their services which, in the event, have been supplied for no return. If the business prospers the shares gain in value, the options are exercised, and, in some cases, the employees gain huge rewards for the risk they have run.
A simple example, set in the context of an established business, will illustrate the issue.
Example 12.G
Entity A, a listed entity, rewards its senior employees from time to time by granting share options. On 1 January 20X3 it grants each member of a group of senior employees an option on 10,000 shares, at an exercise price of the market value of the shares on 1 January 20X3 ($3.50), the option to be exercised no earlier than 1 January 20X6.
Three years later, on 1 January 20X6 the market value of one share is $4.50. Senior employee B decides to exercise the option. He pays A $35,000 (10,000 shares at $3.50) and receives 10,000 shares in exchange. Employee B has thus gained a benefi t with a current value at 1 January 20X6 of $10,000 (current value of shares $4.50 � 10,000 � $45,000 less the $35,000 just paid). Whether or not B chooses to realise his gain immediately by selling the shares at $4.50 each is entirely up to him; henceforth, for as long as he owns the shares, he bears all of the risks and rewards of ownership, just like any other equity shareholder in a listed company.
Accounting for this transaction appears straightforward: $10,000 to be credited to share capital, being the nominal value of shares issued; $25,000 to share premium account; a debit of $35,000 to cash for the amount received from the employee. However, beyond these simple entries there is the question of the $10,000 benefi t to the employee, which can be viewed as representing delayed remuneration for his services over the 3-year period. Applying the accruals concept, remuneration should be matched against the revenue which the services of the employee have helped to create. So, in this case, should there not be an additional debit of $10,000 to the income statement over the 3 years in order to refl ect the cost of these services? The arguments for and against its inclusion are as follows.
For
● The $10,000 represents remuneration and so should be properly refl ected as an expense; the means by which the remuneration is paid is irrelevant.
● If the entity does not fully refl ect remuneration for services to employees the performance statement will be incomplete, and users will neither be able to properly assess the stewardship of management nor to make fully informed economic decisions.
● If costs of employment are fully refl ected in some entities (because they are paid via regular salaries) and not in others (because rewards are wholly or partly in shares or share options) then the performance statements between companies will not be comparable. (Remember: comparability is one of the four key qualitative char-acteristics of fi nancial statements identifi ed by the IASC in its Framework.)
Against
● The $10,000 does not represent an outfl ow of economic benefi ts from the entity. The gain arises because of the entity’s share price performance, and is receivable by the employee independently of any action by the entity.
● The $10,000 does not represent an expense within the terms employed by the conceptual framework. Losses (which include expenses) ‘are decreases in ownership interest not resulting from distributions to owners’. The $10,000 is not a decrease in ownership interest.
● If $10,000 is debited to the entity’s income statement, what should happen to the related credit? It is doubtful whether it fulfi ls the characteristics of either a liability or ownership interest.
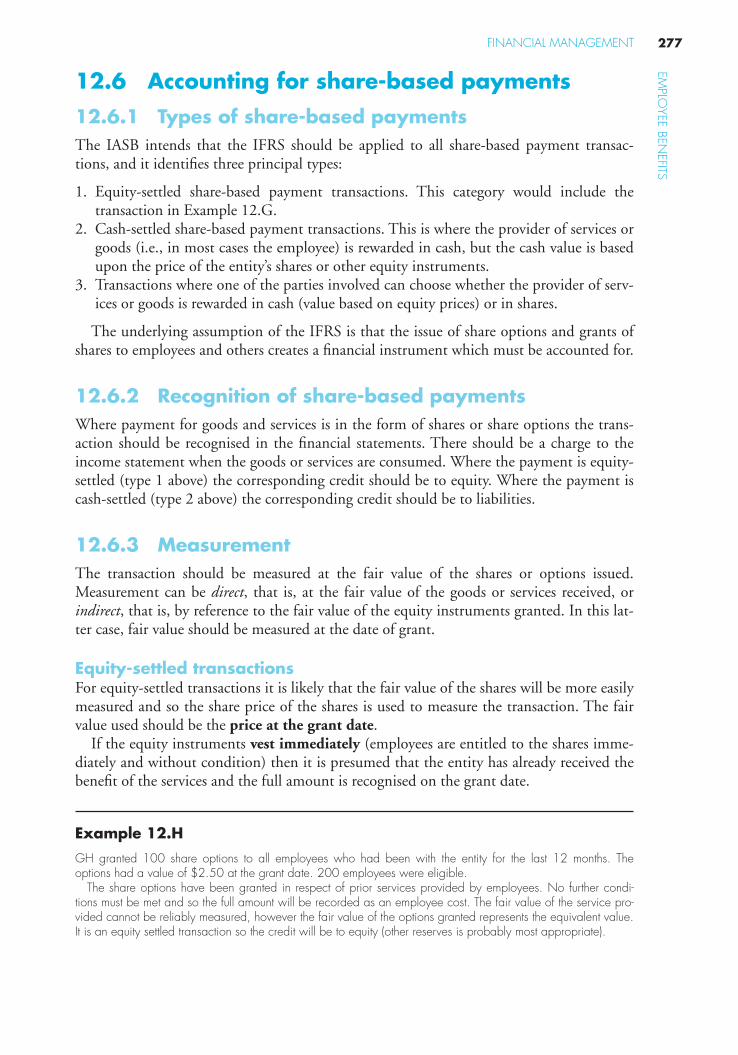
277FINANCIAL MANAGEMENT
EMPLO
YEE BENEFITS
12.6 Accounting for share-based payments12.6.1 Types of share-based paymentsThe IASB intends that the IFRS should be applied to all share-based payment transac-tions, and it identifi es three principal types:
1. Equity-settled share-based payment transactions. This category would include the transaction in Example 12.G.
2. Cash-settled share-based payment transactions. This is where the provider of services or goods (i.e., in most cases the employee) is rewarded in cash, but the cash value is based upon the price of the entity’s shares or other equity instruments.
3. Transactions where one of the parties involved can choose whether the provider of serv-ices or goods is rewarded in cash (value based on equity prices) or in shares.
The underlying assumption of the IFRS is that the issue of share options and grants of shares to employees and others creates a fi nancial instrument which must be accounted for.
12.6.2 Recognition of share-based paymentsWhere payment for goods and services is in the form of shares or share options the trans-action should be recognised in the fi nancial statements. There should be a charge to the income statement when the goods or services are consumed. Where the payment is equity-settled (type 1 above) the corresponding credit should be to equity. Where the payment is cash-settled (type 2 above) the corresponding credit should be to liabilities.
12.6.3 MeasurementThe transaction should be measured at the fair value of the shares or options issued. Measurement can be direct, that is, at the fair value of the goods or services received, or indirect, that is, by reference to the fair value of the equity instruments granted. In this lat-ter case, fair value should be measured at the date of grant.
Equity-settled transactionsFor equity-settled transactions it is likely that the fair value of the shares will be more easily measured and so the share price of the shares is used to measure the transaction. The fair value used should be the price at the grant date.
If the equity instruments vest immediately (employees are entitled to the shares imme-diately and without condition) then it is presumed that the entity has already received the benefi t of the services and the full amount is recognised on the grant date.
Example 12.H
GH granted 100 share options to all employees who had been with the entity for the last 12 months. The options had a value of $2.50 at the grant date. 200 employees were eligible.
The share options have been granted in respect of prior services provided by employees. No further condi-tions must be met and so the full amount will be recorded as an employee cost. The fair value of the service pro-vided cannot be reliably measured, however the fair value of the options granted represents the equivalent value. It is an equity settled transaction so the credit will be to equity (other reserves is probably most appropriate).

STUDY MATERIAL F2278
EMPL
OYE
E BE
NEF
ITS Recorded as:
Dr Staff costs (100 � $2.50 � 200) $50,000Cr Other reserves $50,000Being the recording of the equity-settled share-based transaction
If the equity instruments do not vest immediately the company should assume the benefi ts received will accrue over the vesting period.
Example 12.I
B grants share options to its 1,000 employees in the year to December 20X6. Each employee is entitled to 300 options if they stay employed with B for the next 3 years. At the grant date the options have an estimated value of $2.50.
At the end of 20X6 60 staff had left and another 80 were expected to leave over the next two years.At the end of 20X7 50 staff had left in the year and another 40 were expected to leave in 20X8.20 staff left in 20X8.Let us look at how the associated staff costs would be refl ected in the fi nancial statements over the vesting
period of 3 years. No estimate is given regarding the fair value of the services provided so we assume the equivalent cost can be based on the fair value of the equity transferred (based on the value at the grant date).
20X6 – estimated eligible employees � 860 (1,000 � 60 � 80)Total equivalent cost of issuing options � ($2.50 � 860 employees � 300 options) � $645,000Allocated over the vesting period of 3 years gives a charge of $215,000 ($645,000/3)Recorded as:
Dr Staff costs $215,000Cr Other reserves $215,000Being the recording of the equity based transaction for 20X6.
20X7 – estimated eligible employees � 850 (1,000 � 60 � 50 � 40)Total equivalent cost of issuing options � ($2.50 � 850 employees � 300 options) � $637,500.We want to have recognised two-thirds of this by the end of 20X7 � 425,000Less the amount recognised in 20X6 � $210,000 ($425,000 � $215,000)Recorded as:
Dr Staff costs $210,000Cr Other reserves $210,000Being the recording of the equity based transaction for 20X7.
The balance on other reserves is now $425,000.
20X8 – estimated eligible employees � 870 (1,000 � 60 � 50 � 20)Total equivalent cost of issuing options � ($2.50 � 870 employees � 300 options) � $652,500.Less the amount recognised over the previous two years � $227,500 ($652,500 � $425,000)Recorded as:
Dr Staff costs $227,500Cr Other reserves $227,500Being the recording of the equity based transaction for 20X8.
The balance on other reserves is now $652,500.

279FINANCIAL MANAGEMENT
EMPLO
YEE BENEFITS
Cash-settled transactionsCash-settled equity-based transactions are those where the amount of the goods or services is based on the value of the entity’s shares, but the amount is to be paid in cash. The debit is to income statement if for goods/services and the credit is to cash is settled immediately or to liabilities if it is settled at a future date.
As the liability varies with the value of the company’s shares it should be remeasured at each statement of fi nancial position date until the date of settlement, with any change going to the income statement.
Example 12.J
100 eligible staff members are entitled to receive payment equivalent to 60% of the increase in value of 1,000 of the entity’s shares. During the year to 31 December 20X8 the share price increased from 250 cents to 340 cents. Payment is made on 31 January 20X9.
The amount payable is $54,000 (100 � 1,000 shares � 60% � 0.90) will appear within staff costs and a liability will be shown for the amount due and not yet settled, Recorded as:
Dr Staff costs $54,000Cr Liability $54,000Being the cash-settled transaction.
If the rights to a cash-settled amount vest over a period of time then the cost will be allocated over the vesting period, in a similar way to equity-based transactions. The liability however will be remeasured based on the fair value at the reporting date (as opposed to equity-settled transactions which use the fair value at the grant date and do not remeasure).
Example 12.K
G grants 100 share appreciation rights (SARs) to its 500 employees during 20X7 on the condition that the employees stay with the entity for the next two years. The SARs must be exercised at the start of 20X9.
During 20X7 15 staff leave and another 20 are expected to leave in 20X8.During 20X8 25 staff leave.The fair value of the SARs is $10 at 31 December 20X7 and $13 at 31 December 20X8.The employee cost will be charged over the vesting period of two years. However as this is a cash-settled
transaction the liability will be credited and it will be remeasured based on revised fair values until the date of settlement.
20X7 – estimated eligible employees � 465 (500 � 15 � 20)Total equivalent cost of issuing options � ($10 � 465 employees � 100 SARs) � $465,000.Allocated over the vesting period of 2 years gives a charge of $232,500 ($465,000/2)Recorded as:
Dr Staff costs $232,500Cr Liability $232,500Being the recording of the cash-settled transaction for 20X7.
20X8 – estimated eligible employees � 460 (500 � 15 � 25)Total equivalent cost of issuing options � ($13 � 460 employees � 100 SARs) � $598,000.Less the amount recognised in 20X7 of $365,500 ($598,000 � $232,500)Recorded as:
Dr Staff costs $365,500Cr Liability $365,500Being the recording of the cash-settled transaction for 20X8.

STUDY MATERIAL F2280
EMPL
OYE
E BE
NEF
ITS 12.7 Summary
This chapter looked at the recognition and valuation principles of corporate pension schemes. The accounting treatment adopted for defi ned contribution schemes and defi ned benefi t schemes, in accordance with IAS 19 Employee benefi ts, was covered, including the calculation and treatment of actuarial gains and losses. Share-based payments were also coverd and the principles laid out in IFRS 2 Share-based payment were applied. The treat-ment of equity-settled and cash-settled transactions were covered.

281
Revision Questions
Question 1 You are the fi nancial controller of C, a entity which has recently established a pension scheme for its employees. It chose a defi ned benefi t scheme rather than a defi ned contribu-tion scheme.
C makes payments into the pension scheme on a monthly basis. C prepare fi nancial statements to 31 December each year. On 31 December 20X4 the market value of the scheme’s assets was $20 million and the
present value of the scheme’s liability $22 million. Actuarial losses not yet recognised in the income statement amounted to $1.5 million. In 20 X 5 the following data is relevant:
● current service cost: $2 million, ● unwinding of discount: $1.8 million, ● expected return on pension plan assets: $2.4 million, ● contributions for the year: $1.7 million.
On 31 December 20 X 5 the market value of the scheme’s assets was $21 million and the present value of the scheme’s liability $22.5 million.
C’s accounting policy is to defer actuarial gains and losses to future periods so far as is permissible under the requirements of IAS 19.
Requirement Determine the total charge in the income statement for pensions (excluding amounts deducted from employees ’ gross salaries) and the amounts shown in the statement of fi nancial position in respect of pensions.
Ignore deferred taxation. (10 marks)
Question 2CBA is a listed entity that runs a defi ned benefi t pension scheme on behalf of its employ-ees. In the fi nancial year ended 30 September 20X6 the scheme suffered an actuarial loss of $7.2 million. The entity’s directors are aware that the relevant accounting standard, IAS 19 Employee benefi ts, was amended recently. They have asked you, the fi nancial controller, to write a short briefi ng paper, setting out an outline of the options for accounting for the actuarial loss in accordance with the amended version of the standard.
12

EMPL
OYE
E BE
NEF
ITS Requirement
Prepare the briefi ng paper explaining the options and identifying, as far as possible from the information given, the potential impact on the fi nancial statements of CBA of the two alternative accounting treatments.
(10 marks)
Question 3On 1 April 20X7, the present value of AB’s pension obligation is $1,634,000. The fair value of the pension plan assets is $1,337,000. Unrecognised actuarial losses are $224,000 as at 31 March 20X7. During the year to 31 March 20X8 the current cost if $450,000 and the contributions made totalled $520,000. The expected rate of return on assets was 10% and the interest cost was based on a rate of interest of 12%. The estimated remaining serv-ice lives of employees is 10 years. Round fi gures to the nearest $000.
(a) Calculate the income statement charge in respect of pensions for AB for the year ended 31 March 20X8, assuming that AB adopts the corridor approach under IAS 19.
(6 marks)(b) Briefl y outline the alternative treatment permitted by IAS 19 in respect of actuarial
gains and losses and show the extracts from the statement of comprehensive income of AB for the year ended 31 March 20X8, assuming the actuarial loss on pension assets in the year was $85,000 and the actuarial gain on pension obligations was $55,000.
(4 marks)(Total marks � 10)
Question 4The following information relates to two share-based transactions that LM entered into in 2006.
(i) LM granted share options to its 200 employees on 1 January 20X6. Each employee will receive 500 share options if they continue to work for LM for the next three years. The fair value of the options at the grant date was $2.00 each.
(ii) LM operates an incentive scheme for its employees which it set up during 2006. under the terms of the scheme the workforce will be offered 80% of the share price increase on 10,000 of the entity’s shares. Payment will be made on 31 March 2009. Again the scheme is only open to those who remain employed with LM for the three year period. The fair value of the SARs at the end of each of the three years is:
20X6 – $1.6020X7 – $1.8020X8 – $2.10
During 20X6 20 employees left and another 45 were expected to leave over the next two years.During 20X7 15 employees left and another 20 were expected to leave in 20X8.During 20X8 10 employees left.
REVISION QUESTIONS F2282

EMPLO
YEE BENEFITS
283FINANCIAL MANAGEMENT
RequirementBriefl y describe the accounting treatment to be adopted for these transactions, in accord-ance with IFRS 2 Share-based payment and calculate the amount to be recorded in the income statement for staff costs in respect of each of the three years.
(10 marks)

This page intentionally left blank

285
Solutions to Revision Questions 12 Solution 1 The charge to the income statement for 20X5 will be:
$’000 $’000 Ongoing service cost 2,000 Unwinding of the discount 1,800 Expected return on pension assets (2,400)
(600) Net charge to statement 1,400
The ‘ corridor ’ for recognition of actuarial losses from prior years is the greater of:
● 10% of the opening market value of the scheme’s assets: $20 m � 10% � $2 m. ● 10% of the opening present value of the scheme’s liabilities: $22 m � 10% � $2.2 m.
It is clear that the unrecognised actuarial losses are less than $2.2 million, so no recogni-tion is appropriate for the current year.
The statement of fi nancial position fi gures for the end of 20X5 will be:
$’000 $’000 Market value of plan assets 21,000 Present value of plan liability (22,000)
(1,000) Actuarial differences not yet taken to the income statement (see below)
300
So net liability (700)
Working: Actuarial differences
$’000 Net difference brought forward ($20 m–$22m) (2,000) Net charge to income statement for the year (see above) (1,400) Contributions for the year 1,700 Actuarial difference for the year – to balance 200 Net difference carried forward ($21m–$22.5 m) (1,500)
This means that the end unrecognised actuarial losses at the end of the year are $300,000 ($500,000 � $200,000).

EMPL
OYE
E BE
NEF
ITS Solution 2
The amended version of IAS 19 permits two possible approaches in accounting for actuarial gains and losses:
1. The fi rst option is the accounting treatment that was required by the original IAS 19. Actuarial gains and losses are not recognised immediately in the income statement except where they exceed certain parameters. Where the parameters in the standard are met, the gain or loss is recognised over the average remaining service lives of the employees. This may be a fairly lengthy period (for example, 10 or 15 years would not be unusual), so, even if the actuarial loss of $7.2 million were to exceed the parameters, the impact on the fi nancial statements is likely to be very small.
Where this option requires part of the loss to be recognised, it is recognised in the income statement, and so has a direct effect upon reported profi t.
2. The standard permits entities to adopt any systematic method that results in faster rec-ognition of actuarial gains and loss than stipulated in the fi rst approach, provided that the same basis is applied to both gains and losses, and that the basis is applied consist-ently. Thus, entities are able to opt for a policy of recognising the whole of any actuarial gains or losses in the accounting period in which they occur. In CBA’s case this would mean recognising the full amount of the $7.2 million loss in the fi nancial year ended 30 September 20X6. In such cases (where actuarial gains and losses are recognised in full as they are incurred), the standard requires that such gains and losses should be recognised in a ‘Other Comprehensive Income’, within the statement of comprehensive income.
Solution 3(a) income statement expense for pensions is calculated as follows:
Pension costs $000Current service cost 450Expected return (10% � $1,337,000) (134)Interest cost (12% � $1,234,000) 148Actuarial losses recognised in the period (W1) 9Income statement expense 473
Working 1Actuarial losses to be recognised:Corridor – 10% of the higher or opening plan assets and liabilities � opening liabilities, 10% � $1,337,000 � 133K. Unrecognised actuarial losses brought forward are $224K. The difference of $90,000 will be spread over the remaining service lives of 10 years giving a charge of $9,000 per annum.
(b) IAS 19 permits the actuarial gains/losses to be recognised faster than is achieved using the corridor approach, however to minimise the effect on reported profi ts the entire gains and losses are recognised in equity and shown in other comprehensive income.
Extracts from statement of comprehensive income for the year end 31 March 20X8.
SOLUTIONS TO REVISION QUESTIONS F2286

EMPLO
YEE BENEFITS
287FINANCIAL MANAGEMENT
Income statement
Staff costs $000Pension cost (as per (a) but without the actuarial loss) (464)
Other comprehensive income
Actuarial gain on pension obligations 55Actuarial loss on pension assets (85)
Solution 4Transaction (i)This is an equity-settled share-based payment and under IFRS 2 the fair value of the shares will be used to estimate the fair value of the services provided by employees. The total fair value will be allocated over the vesting period of three years and will be based on the fair value at the grant date and will not be remeasured for subsequent changes in the value of the options. The income statement will be charged and equity will be credited in each of the three years of the vesting period.
20X6 – 500 options � $2 per share � (200 � 20 � 45) � $135,000The charge for 20X6 is then $135,000/3 � $45,000
20X7 – 500 options � $2 per share � (200 � 20 � 15 � 20) � $145,000Two-thirds of $145,000 should be recognised to date � $96,667 Less the amount already recognised in 20X6 of $45,000, results in a charge in 20X7 of $51,667.
20X8 – 500 options � $2 per share � (200 � 20 � 15 � 10) � $155,000Less cumulative total recognised to date of $96,667, results in a charge of $58,333 in
20X8.Transaction (ii)
This is a cash-settled equity-based transaction. The cost to the income statement will be calculated in a similar way but will take account of the change in the fair value of the SARs. The income statement will be charged with the equivalent expense but as this is cash settled, the credit will be to liability in the statement of fi nancial position.
20X6 – 80% � 10,000 � $1.60 � (200 � 20 � 45) � $1,728,000. Allocated over vesting period of three years:
The charge for 20X6 is then $576,000.
20X7 – 80% � 10,000 � $1.80 � (200 � 20 � 15 � 20) � $2,088,000Two-thirds of $2,088,000 should be recognised to date � $1,392,000 Less the amount already recognized in 20X6 of $576,000, results in a charge in 20X7 of $816,000.
20X8 – 80% � 10,000 � $2.10 � (200 � 20 � 15 � 10) � $2,604,000 Less cumulative total recognised to date of $1,392,000, results in a charge of $1,212,000 in 20X8.

This page intentionally left blank

13
Financial Reporting in an Environment of Price Changes

This page intentionally left blank

291
13 LEARNING OUTCOMES After studying this chapter students should be able to:
� discuss the problems of profi t measurement and alternative approaches to asset valuations;
� discuss measures to reduce distortion in fi nancial statements when price levels change.
13.1 Introduction Historical cost accounting, which has been the accounting system adopted traditionally in the preparation of fi nancial statements, suffers from some signifi cant defects that are espe-cially pronounced in times of changing prices. Where the historical cost system proves to be unsatisfactory, any one of a range of alternative systems could be adopted. This chapter examines some of the alternatives.
This chapter covers the following areas: Section 13.2 examines the defects of the his-torical cost accounting system. Section 13.3 examines accounting for changing price levels using replacement cost accounting, net realisable value accounting, current cost account-ing, current purchasing power accounting and the ‘ real terms ’ system of accounting. Section 13.4 addresses the problems of fi nancial reporting in hyperinfl ationary economies, and the requirements of IAS 29 Financial Reporting in Hyperinfl ationary Economies.
13.2 Defects of historical cost accounting Historical cost accounting is based upon records of transactions. Transactions such as sales and purchases are recorded at the monetary amount at which goods or services change hands. Once recorded at that amount in the books of the entity, the value remains fi xed. Because of these fi xed values, historical cost accounting is said to be objective, and up to a point that is true. However, accounting is a process by which raw transaction data is trans-lated into useful and informative statements, a process which, as we have seen, involves often substantial judgement-based adjustments like provisions.
Financial Reporting in an Environment of Price Changes

STUDY MATERIAL F2292
FIN
AN
CIA
L RE
PORT
ING
IN A
N E
NVI
RON
MEN
T O
F PR
ICE
CH
AN
GES Nevertheless, historical cost accounting has some claim to objectivity. However, it also
has signifi cant defects, especially in times of changing prices. Some of these defects are explained below.
● In a time of changing prices reported results in the income statement may be distorted as revenues at current values are matched with costs incurred at an earlier date.
● Cost of sales is likely to be understated in a time of price infl ation. ● The valuation of assets in the statement of fi nancial position is at cost less accumulated
depreciation. The resultant net book values may bear no relationship to the current value of the asset.
● The three points listed above are likely to give rise to faulty estimates of return on capital employed (ROCE). Typically, in a time of rising prices, profi ts are likely to be overstated and assets understated, relative to current values, thus giving rise to unrealistically rosy measurements of ROCE (see Chapter 14 of this Learning System for more information about the calculation of ROCE and other accounting ratios).
● The results of comparison of performance and position statements over time will be unreliable, because amounts are not valued in terms of common units. For example, a business reports revenues of $3 million in 20X5. In 20X0 it reported $2.8 million. The apparent increase of $0.2 million may be more than outweighed by infl ationary effects. Even if price infl ation has been as low as 3 per cent per annum, once that effect is adjusted it can be seen that revenues in 20X5 are actually lower in real terms than rev-enues reported in 20X0.
● Borrowings are shown in monetary terms, but in a time of rising prices a gain is actually made (or a loss in times of falling prices) at the expense of the lender as, in real terms, the value of the loan has decreased (in a time of rising prices) or increased (in a time of falling prices).
● Conversely, gains arising from holding assets are not recognised. ● Depreciation writes off the historical cost over time, but, where asset values are low
(because based on outdated historical costs), depreciation will be correspondingly lower, so that a realistic charge for asset consumption is not matched against revenue in the performance statements.
These defects result in signifi cant inadequacies in fi nancial statements based on histori-cal cost information for both decision-making and assessment of stewardship. The IASB’s Framework sets out the objective of fi nancial statements:
To provide information about the fi nancial position, performance and changes in fi nancial position of an entity that is useful to a wide range of users in making economic decisions.
Historical cost accounting produces statements which are unreliable guides for decision-making, and thus fail to achieve the key qualitative characteristic of relevance.
Infl ation is an economic factor of varying importance around the world. During much of the latter part of the twentieth century, most countries in South America experienced very high levels of price infl ation. For this reason, accounting for changing price levels has been adopted in various forms in several South American countries, including Brazil and Argentina. During the 1970s, relatively high levels of price infl ation were experienced in a number of countries where it had not previously been an important issue. The account-ancy professions in the UK, Australia and New Zealand, for example, responded to the

293FINANCIAL MANAGEMENT
FINA
NC
IAL REPO
RTING
IN A
N EN
VIRON
MEN
T OF PRIC
E CH
AN
GES
problem of infl ation by experimenting with the introduction of requirements for price-level adjustments to fi nancial statements. These requirements proved to be almost univer-sally unpopular with business and with accountancy practitioners (although adjustments for changing price levels found favour in some parts of the public sector). The dissent which met attempts by professional bodies in those countries to require reports adjusted for changing price levels was at its height during the early 1980s. This dissent coincided with a reduction in the rate of price-level increases, and by the mid-1980s infl ation was no longer the pressing issue that it had been. Mandatory requirements were dropped in favour of, at most, recommended compliance.
The development of international standards on price-level adjustments refl ects the pat-tern of events in the UK, Australia and New Zealand.
The IASC published IAS 6 Accounting responses to changing prices in 1977. This standard required entities to present information in their fi nancial statements which described the procedures adopted to refl ect the impact of price changes. Where no such procedures were adopted, the entity was required to disclose that fact. The requirements of this standard could not be regarded as onerous, but it was to be replaced by a much more rigorous set of requirements. In 1981, the IASC replaced IAS 6 with IAS 15 Information refl ecting the effects of changing prices. The standard required a minimum set of disclosures relating to the effects of changing prices for those entities ‘ whose levels of revenues, profi t, assets or employment are signifi cant in the economic environment in which they operate ’ .
In 1989 the IASC added the following statement to IAS 15:
The international consensus on the disclosure of information refl ecting the effects of changing prices that was anticipated when IAS 15 was issued has not been reached. As a result, the Board of IASC has decided that entities need not disclose the information required by IAS 15 in order that their fi nancial statements conform with International Accounting Standards. However, the Board encourages entities to present such information, and urges those that do to disclose the items required by IAS 15.
IAS 15 was withdrawn in 2003. The IASB Framework document includes a section on ‘ Concepts of capital and capital
maintenance ’ . It describes two concepts: physical capital maintenance and fi nancial capital maintenance. These are described in detail in the remainder of this chapter.
13.3 Accounting for changing price levels An important part of the advanced study of accounting and reporting issues is that students should acquire an understanding of the issues and key principles involved in accounting for changing price levels.
In this section we will examine:
● capital and income ● replacement cost (entry value) accounting ● net realisable value (exit value) accounting ● current cost accounting ● current purchasing power accounting ● the ‘ real terms ’ system.

STUDY MATERIAL F2294
FIN
AN
CIA
L RE
PORT
ING
IN A
N E
NVI
RON
MEN
T O
F PR
ICE
CH
AN
GES 13.3.1 Capital and income
The accounting equation represents the relationship between assets, liabilities and capital:
Assets Liabilities Capital� �
The equation simplifi es down to three items the constituents of a statement of fi nan-cial position, which is prepared periodically, in order to disclose the position of the entity to interested parties. Measurement of assets and liabilities may be problematical. Where ‘ mixed measurement ’ or historical cost measurement is adopted the statement of fi nancial position total is highly unlikely to represent a market value for capital. Indeed, the users of the fi nancial statements may be understandably confused by the fi gure shown for capital. However, the various users are likely to be interested in, at a minimum, maintaining the capital at the previous year’s level. Investors and potential investors need to know that their investment has not suffered a major diminution in value as represented by the statement of fi nancial position; creditors are interested in ensuring that there is suffi cient asset backing to ensure that their repayment will proceed according to plan.
Conventionally, income is calculated via the income statement; costs are set against rev-enues and a surplus or defi cit emerges. After distribution the surplus or defi cit is added to/set against capital in the statement of fi nancial position.
So far in this section we have examined the conventional accountant’s view of income and capital. Another way of looking at income and capital is from an economist’s viewpoint.Hicks, the economist, defi ned income thus in 1946:
The purpose of income calculations in practical affairs is to give people an indication of the amount they can consume without impoverishing themselves
. . . it would seem that we ought to defi ne a man’s income as the maximum value which he can consume during a week, and still expect to be as well off at the end of the week as he was at the beginning.
Applying the ‘ well-offness ’ idea to business, the maximum income of a business entity in an accounting period is the amount of the maximum distribution which can be made while ensuring that capital at the end of the period is at least what it was at the beginning. Any distribution in excess of that sum would impoverish the business. This seems fair enough, except that in times of price changes it may be very diffi cult to ensure that ‘ well-offness ’ in a business is the same at the end of a period as at the beginning.
An example will illustrate the effects of changing prices on capital maintenance.
Example 13.A
Entity B starts up in business at 1 January 20X2 with capital, in the form of cash, of $5,000. It spends the whole of the cash immediately on stock which it sells on 31 December for $7,000. No other transactions took place and no expenses were incurred. During the year the retail price index moves from 120 to 140. What is the maximum amount that B can distribute for 20X2 and still remain as well off at the end of the year as at the beginning?
In historical cost accounting terms, the calculation is simple: $7,000 of revenue less $5,000 in cost of sales gives a profi t of $2,000. If the maximum $2,000 is distributed to the owners of B, the capital at the end of the year will remain at $5,000, that is exactly the same as it was at the beginning. However, this does not take into account the diminishing real value of money. In order to ensure that the business is as well off in real terms at the end of the year as it was at the beginning, some allowance must be made for the diminution in value of money.

295FINANCIAL MANAGEMENT
FINA
NC
IAL REPO
RTING
IN A
N EN
VIRON
MEN
T OF PRIC
E CH
AN
GES
In order to retain the same amount of purchasing power B will require:
$ , $ ,5 000140120
5 833� �
Therefore, looked at in real terms, the maximum amount of the distribution becomes: $7,000 � $5,833 � $1,167, a fi gure which is substantially less than the $2,000 which would have been available for dis-tribution in historical cost accounting terms.
This example illustrates the danger, in times of rising prices, of making distributions, effec-tively, out of capital. Over time, the capital of the business entity could be diminished in real terms, but that fact would not be evident from the historical cost accounts.
Capital maintenance, as we noted earlier, is important to users, and, as we have seen, may be diffi cult to achieve using historical cost accounting in times of changing prices. Formal defi nitions are given for different types of capital maintenance in CIMA’s Management Accounting: Offi cial Terminology.
Maintenance of physical capital (i.e., of the operating assets of the business) is defi ned as:
The concept that profi t is earned only if the physical productive capacity (or operating capability) of the entity (or the resources or funds needed to achieve
that capacity) at the end of the period exceeds the physical productive capacity at the beginning of the period, after excluding any distributions to, and contributions from, owners during the period.
Maintenance of fi nancial capital is defi ned as:
The concept that profi t is earned only if the fi nancial (or money) amount of the net assets at the end of the period exceeds the fi nancial (or money) amount
of net assets at the beginning of the period, after excluding any distributions to, and contributions from, owners during the period.
Maintenance of fi nancial capital can be further broken down into ‘ money fi nancial cap-ital maintenance ’ and ‘ real fi nancial capital maintenance ’ . The former relates to maintain-ing capital at a value related to historical cost and the latter to capital adjusted for the effects of changing price levels (as in the example above).
Maintenance of operating capital involves ensuring that the business is in no worse posi-tion in terms of physical productive capacity at the end of an accounting period than it was at the beginning. Again, an example may assist understanding:
Example 13.B
Entity C starts up in business at 1 January 20X3 with 100 units of inventory which have cost $50 each. The opening inventory valuation is therefore $5,000 represented by capital employed of the same amount. The inventory is sold on the last day of the year for $7,000. At this date it will cost $5,600 to buy in a further 100 identical items of inventory because the price has gone up. What is the maximum amount that C can distribute for 20X2 and still remain as well off at the end of the year as at the beginning?
As in Example 13.A, using historical cost accounting the maximum distribution is $2,000. However, if ‘ well-offness ’ in C’s case were to be defi ned in terms of operating capital maintenance, then the entity must ensure

STUDY MATERIAL F2296
FIN
AN
CIA
L RE
PORT
ING
IN A
N E
NVI
RON
MEN
T O
F PR
ICE
CH
AN
GES that it can operate at the same level. In order to do this it must retain $5,600 to buy 100 units of inventory. The
maximum amount of the distribution is therefore $7,000 � $5,600 � $1,400.
13.3.2 Replacement cost (entry value) accounting We noted earlier that replacement cost may be applied to asset measurement. Replacement cost is defi ned by CIMA’s Offi cial Terminology as follows:
The price at which identical goods or capital equipment could be purchased at the date of valuation.
Applied to a full set of accounts, in times of rising prices, replacement cost accounting will tend to result in higher asset values than under the historical cost system, and there-fore in revaluation surpluses, also known as holding gains.
Example 13.C
Compare the statement of fi nancial positions of K under the historical cost (HC) and replacement cost (RC) conventions.
HC20X2
HC 20X2
$ $ Non-current assets
Cost 10,000 14,000 Depreciation 5,000 7,000
5,000 7,000Inventories 9,000 10,000Cash 25,000 25,000 Net assets 39,000 42,000 Opening capital 10,000 10,000 Profi t for the period 29,000 32,000 Closing capital 39,000 42,000
It looks at this stage as though profi ts are higher under the replacement cost method than the historical cost profi ts. The following reconciliation from historical cost profi t to replacement cost profi t explains the difference.
$ Historical cost profi t for the period 29,000Less: extra depreciation required under RC due to the replacement cost of non-current assets (2,000) Replacement cost operating profi t 27,000 Gain on holding inventories 1,000 Gain on holding non-current assets 4,000 Replacement cost profi t for the period 32,000
The gains in value from holding the assets while the replacement cost is increasing (holding gains) must be recognised in the replacement cost profi t. The holding gains on inventories are reversed in the next accounting period as the inventories are sold.
Note that the operating profi t is lower under the replacement cost convention than under the historical cost convention.
Net current replacement cost For items of non-current assets the net current replacement cost may be used. It is based on the gross replacement cost, being the replacement cost of the asset as new and the pro-portion of that asset deemed to be used up.

297FINANCIAL MANAGEMENT
FINA
NC
IAL REPO
RTING
IN A
N EN
VIRON
MEN
T OF PRIC
E CH
AN
GES
For example, an asset has a gross current replacement cost, before depreciation, of $40,000 as at 31 December 20X1 and it is assessed to have a 5-year life with nil scrap value. It has been in use for 2 years.
The net current replacement cost will be as follows:
$ Gross current replacement cost 40,000 Less: accumulated depreciation – 2 years (16,000) Net current replacement cost 24,000
Gross replacement cost is usually found using a price index specifi c to the asset.
Backlog depreciation The net replacement cost is arrived at after deducting accumulated depreciation on the replacement cost value of the asset. As time passes and replacement cost increases (assum-ing rising prices) the value of the accumulated depreciation will become out of date and it will also require revaluation to the current replacement value. As Example 13.D shows, where there is an increase in the gross replacement cost of $2,000, to arrive at the correct net replacement cost this increase should be depreciated and netted against the gain.
Example 13.D
An asset with an estimated useful life of 5 years and nil estimated residual value is purchased on 1 January 20X1.
$ Current cost at 31 December 20X1 10,000 Depreciation for year (5 years, straight line) 2,000 Net replacement cost 8,000
Current cost of same asset at 31 December 20X2 12,000 Depreciation (two years of fi ve, straight line) 4,800 Net replacement cost 7,200
Increase in gross replacement cost: (12,000 � 10,000) 2,000 Less: backlog depreciation: (4,800 � 4,000) 800 Net surplus on revaluation 1,200
An appraisal of replacement cost Replacement cost accounting, by separating holding gains from operating profi ts, gives a more meaningful defi nition of income for the business. The amount that can be distrib-uted or paid in a dividend is clearly identifi ed after providing for the replacement of assets and the continuation of the business, thereby keeping within the true spirit of the pru-dence concept and maintaining the operating capital of the business.
Furthermore, the statement of fi nancial position gives more relevant information with assets shown at current values.
On the other hand, there can be several drawbacks to using this convention in the prepa-ration of fi nancial statements:
● The values derived for assets can be very subjective. Unlike the historical cost method where the value can be taken directly from the invoice, the replacement cost method will often be based upon estimates by reference to suppliers ’ lists and government statistics.
● Simply collating the information to prepare replacement cost accounts will be costly. The process may also be time-consuming.
● Assets in the business may not be replaced or a replacement may not be available due to obsolescence or other technological change.

STUDY MATERIAL F2298
FIN
AN
CIA
L RE
PORT
ING
IN A
N E
NVI
RON
MEN
T O
F PR
ICE
CH
AN
GES ● The basis for the use of replacement cost is to focus on maintaining the operating capital
of the business. The investor group, however, is more likely to be interested in maintaining the value of capital in real terms (as affected by the general rate of infl ation in the economy at large). The rates of price infl ation that affect operating capital may be quite signifi cantly different.
13.3.3 Realisable or exit values Another way of looking at current values is from the point of view of the realisable values of assets – valuing the statement of fi nancial position on the basis of the selling values of the assets in the business.
This method measures the value of holding the assets by the movement in their sell-ing value from one statement of fi nancial position to the next. Some users of the fi nancial statements may prefer this method as the information is more relevant in that it gives a useful value for the asset – how much it can be sold for, rather than how much it cost. The method of preparing the fi nancial statements is similar to the replacement cost method.
Example 13.E
HC20X1
RV 20X1
$ $ Non-current assets 160,000 150,000 Inventories 30,000 60,000 Net assets 190,000 210,000
Share capital 100,000 100,000 Retained profi t 90,000 110,000 Shareholders ’ funds 190,000 210,000
If we analyse the realisable value profi t more closely it will give the following results:
$ Historical cost profi t 90,000Less: additional depreciation 10,000 Operating profi ts 80,000 Gain on holding inventories 30,000 Realisable value profi ts 110,000
The information on selling values provided by the realisable value accounts equates to market values and the cash that can be raised by the sale of the asset. This in turn can have advantages for the management of the business as the realisable value approach adopts the principles of opportunity cost, highlighting the current sacri-fi ce of funds employed in the business and returns available elsewhere.
Other users of the fi nancial statements, such as lenders, would fi nd the information relevant in terms of the security of the capital they have loaned to the business. The ultimate liquidation values are the maximum amounts they will receive from the business and so they can assess directly whether their capital is maintained.
In terms of the fi nancial statements the use of realisable values overcomes the problems of depreciation and inventory valuations. These are directly determined by the market and not by arbitrary calculations.
The realisable value method does have several limitations:
● The whole basis for the method is founded on the break-up value of the business and is contrary to the going-concern basis.
● The determination of realisable values in practice may be very diffi cult. There may be a high degree of subjec-tivity, particularly where there is a restricted market for the assets.
● In the case of specialised assets, an oil rig for example, their realisable value will be the scrap value. However, the economic value of such an asset may be substantially higher.

299FINANCIAL MANAGEMENT
FINA
NC
IAL REPO
RTING
IN A
N EN
VIRON
MEN
T OF PRIC
E CH
AN
GES
13.3.4 Current cost accounting In valuing assets, current cost accounting (CCA) adopts the principle of value to the business. Value to the business is often expressed diagrammatically, as follows:
Value to the business
Replacement cost Recoverable amount (being the higher of realisable value and
value in use)
Lower of
For example, suppose we have a machine that cost $10,000. If we wanted to replace the machine it would cost $12,000; alternatively we could get $11,000 by selling it, or if we keep it, it will generate cash returns discounted to net present value of $15,000. What action should be taken?
First, what are the benefi ts we can obtain from the machine? Selling it will produce $11,000; keeping it would produce $15,000. Therefore the decision would be to keep the machine. To relate to the diagram it is the higher of realisable value and value in use.
Second, we need to decide whether the asset would remain in the business – do we replace it? In this case we are generating $15,000 in income and costs are $12,000 to replace. Therefore we make a ‘ profi t ’ by doing so of $3,000 and so the asset would be replaced.
The value to the business of the asset in this case is $12,000. Consider another alternative: realisable value $15,000, replacement value $16,000, and
keeping the asset generates $11,000. In this case, logically, the decision would be to sell the asset. Selling the asset produces
more benefi ts than keeping it and this in turn is lower than the replacement value so we would not replace the asset as we would make a ‘ loss ’ .
The preparation of the fi nancial statements based on value to the business would involve identifying each individual asset and deciding what action would be taken, given the three values available: replacement cost, realisable value and economic value.
In practice replacement cost would be the most likely valuation. Most non-current assets are purchased to be kept in the business; therefore their economic value will normally be higher than the realisable value and so the assets would be replaced. Inventories are bought for resale and if we are making profi ts the inventories are replaced and so replacement val-ues are again the most relevant.
A similar approach can be applied to liabilities, using the concept of ‘ relief value ’ (by contrast to ‘ deprival value ’ ). Relief value is the lowest amount at which the liability could, hypothetically, be settled.
Statement of fi nancial position assets valuations under CCA may, therefore, be a mix of net realisable values, replacement cost and value in use (economic value).
In the income statement CCA requires the disclosure of a set of four adjustments to his-torical cost profi t:
● The cost of sales adjustment (COSA). This adjustment shows the value to the business of the inventories consumed during the year by updating the cost of sales; in practice, this

STUDY MATERIAL F2300
FIN
AN
CIA
L RE
PORT
ING
IN A
N E
NVI
RON
MEN
T O
F PR
ICE
CH
AN
GES adjustment is usually computed by reference to replacement cost. Usually, entities would
use price indices prepared by national statistical services. ● The depreciation adjustment. The CCA depreciation charge is the value to the business of
the assets consumed during the year. In practice, again, the value is usually computed by reference to replacement cost. The depreciation adjustment is the difference between the CCA depreciation charge and the historical cost depreciation charge.
● The monetary working capital adjustment (MWCA). This adjustment takes account of the additional investment required to maintain the monetary working capital of business, recognising that, in a time of rising prices, there may be gains arising from holding trade payables, and losses from holding monetary assets. Monetary working capital comprises trade receivables and trade payables, and the adjustment charges (or credits) the income statement with the increase (or decrease) in the real value of monetary working capital which has arisen between the beginning and the end of the fi nancial year.
● The gearing adjustment. Where an entity is fi nanced by a mixture of debt and equity capital, it may be argued that only part of the three adjustments listed above is attribut-able to equity holders, with the rest attributable to borrowings. The gearing adjustment apportions the total of COSA, depreciation adjustment and MWCA between equity holders and lenders in proportion to their holdings.
As noted earlier, CIMA students will not be required to apply knowledge of any of the systems of accounting for changing price levels to a numerical
examination question. However, it is useful to examine some of the features of a set of CCA-adjusted fi nancial statements in order to demonstrate how the concept works out in practice, and how the statements fi t together. A simple example is given below.
Example 13.F
Entity E commences trading on 1 January 20X0. Prices are changing rapidly and the chief fi nancial offi cer decides that he will prepare a set of CCA-adjusted fi nancial statements each year, in order to illustrate the effects of changing price levels for the benefi t of other directors. He decides that value to the business can be approxi-mated reasonably well by the use of price indices and he obtains the following indices applicable over the fi rst 2 years of the entity’s trading:
Non-current assets Inventories RPI 1 January 20X0 100 120 100 1 November 20X0 109 131 114 31 December 20X0 110 133 116 Average 20X0 106 127 108 1 November 20X1 122 147 139 31 December 20X1 124 149 142 Average 20X1 116 138 126
Using some of this information he is able to draft a statement of fi nancial position which shows CCA-adjusted values for inventories and non-current assets at 31 December 20X0. This is not a full CCA-adjusted set of accounts, but it establishes an opening position.

301FINANCIAL MANAGEMENT
FINA
NC
IAL REPO
RTING
IN A
N EN
VIRON
MEN
T OF PRIC
E CH
AN
GES
Statement of fi nancial positions as at 31 December 20X0
Historical cost Factor CCA-adjusted Difference $ $ $
Non-current assets at cost 7,000 110/100 7,700 Depreciation (at the rate of 10% per annum) (700) 110/100 (770) Net book value 6,300 6,930 630Inventories (average purchase date: 1 November) 3,000 133/131 3,046 46 Trade receivables 4,200 4,200Cash 800 800 8,000 8,046 Total assets 14,300 14,976 Equity 2,000 2,000 Accumulated profi ts 9,500 9,500 Current cost reserve – 676 676
11,500 12,176 Trade payables 2,800 2,800 Total equity and liabilities 14,300 14,976
Note that monetary assets and liabilities are not revalued; they represent amounts receivable, payable or in the bank, and so do not require adjustment.
This set of adjustments establishes a current cost reserve at 31 December 20X0, holding unrealised gains on non-current assets and inventories. In 20X1 it will be possible to prepare a full set of current cost accounts.
At 31 December 20X1, 1 year later, the historical cost statement of fi nancial position of E is as follows:
Historical cost $
Non-current assets at cost (note) 15,000 Depreciation (at the rate of 10% per annum) (1,400) Net book value 13,600 Inventories (average purchase date: 1 November) 3,200 Trade receivables 4,400 Cash 300
7,900 Total assets 21,500 Equity 2,000 Accumulated profi ts 15,900
17,900 Trade payables 3,600 Total equity and liabilities 21,500
The entity’s income statement for the year is, in summary, as follows:
Historical cost Historical cost $ $
Revenue 26,700 Cost of sales
Opening inventories 3,000 Purchases 18,800
21,800 Less: closing inventories (3,200)
18,600 Gross profi t 8,100Depreciation (700)Expenses (1,000) Net profi t 6,400

STUDY MATERIAL F2302
FIN
AN
CIA
L RE
PORT
ING
IN A
N E
NVI
RON
MEN
T O
F PR
ICE
CH
AN
GES Adjustments to current cost income statement
The fi nance director calculates the following CCA adjustments to HC profi t:
● Cost of sales adjustment (COSA) requires a charge of $356 to current cost income, ● The depreciation adjustment requires a charge of $119 to current cost income. ● The monetary working capital adjustment requires a charge of $211 to current cost income.
Note: In this example the value of trade receivables exceeds that of trade payables at both year ends; in a time of rising prices this gives rise to a loss on monetary items and, conse-quently, a charge to the income statement. However, where trade payables tend to exceed trade receivables in a time of rising prices, there is, effectively, a gain to be made on hold-ing trade payables, and so MWCA would be a credit to current cost income.
E has no borrowings, so there is no gearing adjustment.
Adjustments to current cost statement of financial position The chief fi nancial offi cer makes adjustments to the inventories and non-current assets val-uations in the statement of fi nancial position, as follows:
● current value of inventories is calculated as $3,244; ● current gross replacement cost of non-current assets is $16,680; ● current value of accumulated depreciation is $1,736.
He uses the indices which are specifi cally identifi ed for inventories and non-current assets in the table of indices given earlier.
From the above information the chief fi nancial offi cer prepares the current cost income statement and statement of fi nancial position for E as at 31 December 20X1.
Current cost income statement (extract) for the year ended 31 December 20X1
$ $ HC operating profi t 6,400 Current cost adjustments: COSA 356 Depreciation 119 MWCA 211 686 Current cost operating profi t 5,714 Retained profi t b/fwd 9,500 Current cost retained profi t 15,214
Current cost statement of fi nancial position as at 31 December 20X1
$ $ Non-current assets At gross replacement cost 16,680 Accumulated depreciation (1,736) Net replacement cost 14,944 Inventories 3,244 Trade receivables 4,400 Cash 300 7,944 Total assets 22,888 Equity 2,000 Accumulated profi ts 15,214 Current cost reserve (bal. fi gure) 2,074 19,288 Trade payables 3,600 Total equity and liabilities 22,888

303FINANCIAL MANAGEMENT
FINA
NC
IAL REPO
RTING
IN A
N EN
VIRON
MEN
T OF PRIC
E CH
AN
GES
Discussion CCA calculations are far from straightforward. Examining the results of the calculations we can see that current cost profi t is lower than historical cost; this will normally be the case in a time of rising prices. In this example, CC profi t is some 11 per cent lower than HC profi t. We can perhaps start to appreciate why current cost accounting proved to be so unpopular with preparers. However, it can equally be argued that capital maintenance is important and cannot and should not be ignored by users of fi nancial statements. Current cost accounting provides valuable information about the level of profi ts which can be dis-tributed while retaining the capital base of the entity. Its restatement of non-monetary assets to current cost has a higher information value than the outdated fi gures used in his-torical cost accounting.
Advantages of CCA ● CCA incorporates valuable information into the fi nancial statements which allows users
to make informed economic decisions. ● It embodies a concept of capital maintenance which is particularly relevant to industries
which are capital intensive in terms of physical assets. ● Appropriate indices are easily obtainable. ● CCA-adjusted statements could provide the basis for a more rational assessment of cor-
poration tax. ● It provides a more prudent statement of profi t in times of rising prices than that pro-
vided by historical cost accounting.
Disadvantages of CCA ● CCA has been tested in practice and found to be very unpopular with the majority of
preparers. ● It is time-consuming and costly to prepare and audit, and it is diffi cult to assess whether
or not these costs are outweighed by the benefi ts offered by the additional information. ● It is an inappropriate system for service businesses that do not have signifi cant invest-
ments in physical capital. ● The selection of appropriate indices introduces an element of subjectivity and judgement. ● It is questionable whether the majority of users would be able to understand CCA
statements.● Essentially CCA is not an infl ation accounting system.
13.3.5 Current purchasing power (CPP) accounting As noted earlier, CPP accounting is a system based upon the concept of real capital main-tenance. It is defi ned as follows by CIMA’s Offi cial Terminology:
A method of accounting for infl ation in which the values of the non-monetary items in the historical cost accounts are adjusted using a general price index to
show the change in the general purchasing power of money. The CPP statement of fi nancial position shows the effect of fi nancial capital maintenance.

STUDY MATERIAL F2304
FIN
AN
CIA
L RE
PORT
ING
IN A
N E
NVI
RON
MEN
T O
F PR
ICE
CH
AN
GES
Example 13.G
We will use the data from Example 13.F, except that only the RPI index numbers are required for CPP accounting.The chief fi nancial offi cer of E wishes to prepare the fi nancial statements for the second year of the entity’s tradingusing the CPP system, in order to provide a means of comparison with CCA and historical cost.
First of all, the opening statement of fi nancial position as at 1 January 20X1 must be adjusted to current values in order to establish a fi gure for the opening CPP reserve:
Historical cost Factor CPP-adjusted Difference $ $
Non-current assets at cost 7,000 116/100 8,120 Depreciation (at the rate of 10% per annum) (700) 116/100 (812) Net book value 6,300 7,308 1,008
Inventories (average purchase date: 1 November) 3,000 116/114 3,053 53 Trade receivables 4,200 4,200Cash 800 800 8,000 8,053 Total assets 14,300 15,361 1,061
Equity 2,000 116/100 2,320 320 Accumulated profi ts 9,500 Bal. fi g 10,241 741
11,500 12,561 Trade payables 2,800 2,800 Total equity and liabilities 14,300 15,361 1,061
Adjustments to the statement of fi nancial position as at 31 December 20X1 result in the following:
E: CPP statement of fi nancial position as at 31 December 20X1
Historical cost Factor CPP-adjusted$ $
Non-current assets at cost 7,000 142/100 9,940 Newly acquired 8,000 8,000 Depreciation (at the rate of 10% per annum) (1,400) 142/100 (1,988) Net book value 13,600 15,952
Inventories (average purchase date: 1 November) 3,200 142/139 3,269 Trade receivables 4,400 4,400Cash 300 300
7,900 7,969 Total assets 21,500 23,921
Equity 2,000 142/100 2,840 Accumulated profi ts 15,900 Bal. fi g 17,481
17,900 20,321 Trade payables 3,600 3,600 Total equity and liabilities 21,500 23,921
The income statement for year ended 31 December 20X1 can now be adjusted. Note that items that are assumed to accrue evenly during the year, such as revenue, purchases and expenses, are uplifted from average value to closing value. Depreciation is adjusted to closing value using a base point of the date of purchase of the related non-current assets. Opening and closing inventories are adjusted to year end values using a base point of the assumed average date of purchase 2 months before the year-end.

305FINANCIAL MANAGEMENT
FINA
NC
IAL REPO
RTING
IN A
N EN
VIRON
MEN
T OF PRIC
E CH
AN
GES
E: CPP profi t and loss account for year ended 31 December 20X1
Historical cost Factor CPP-adjusted$ $
Revenue 26,700 142/126 30,090 Cost of sales
Opening inventories 3,000 142/114 3,737 Purchases 18,800 142/126 21,187 Closing inventories (3,200) 142/139 (3,269)
18,600 21,655
Gross profi t 8,100 8,435Depreciation (700) 142/100 (994) Other operating expenses (1,000) 142/126 (1,127) Operating profi t 6,400 6,314 Loss on short-term monetary items (note) – (1,369) Profi t for the year 6,400 4,945
Note Under the CPP system it is necessary to calculate a gain or loss on holding monetary items, as follows:
Historical cost Factor CPP-adjusted$ $
Opening monetary items (receivables � cash � payables) 4,200 � 800 � 2,800 2,200 142/116 2,693Revenue 26,700 142/126 30,090Purchases (18,800) 142/126 (21,187) Purchases of non-current assets (8,000) 142/142 (8,000)Overheads (1,000) 142/126 (1,127)
2,469 Closing monetary items: 4,400 � 300 � 3,600 1,100 (1,100) Loss on holding monetary items 1,369
Reconciliation of CPP accumulated profi ts in the statement of fi nancial position as at 31 December 20X1
$ Opening balance adjusted: $10,241 � 142/116 12,536 CPP profi t for the year 4,945 CPP accumulated profi ts at 31 December 20X1 17,481
Discussion It is considerably easier in practice to prepare CPP rather than CCA statements. The RPI is easily obtainable, and movements in it are applied in a mechanistic way to the income state-ment and statement of fi nancial position information. We can see from the income statement above that the CPP profi t is substantially lower (by some 23 per cent) than the historical cost fi gure. The CCA profi t was only around 11 per cent lower. Often, in practice, there would be a substantial difference between the three fi gures: HC, CCA and CPP. The principal reason for the large differences in the E example is that RPI has risen much faster than the non-current assets and inventory indices applicable to the entity. The RPI is an average across the economy as a whole. The prices which mainly affect an entity or an industry may not follow the RPI closely.
Advantages of CPP ● Preparation and audit of CPP statements is not especially costly or time-consuming. ● The method has inherent appeal in that it uses easily obtainable and widely recognised
measures of infl ation.

STUDY MATERIAL F2306
FIN
AN
CIA
L RE
PORT
ING
IN A
N E
NVI
RON
MEN
T O
F PR
ICE
CH
AN
GES ● The conceptual basis of CPP is probably easier than that of CCA for the non-specialist
user of fi nancial statements to understand. ● In times of rising prices the use of CPP allows for a reasonable measure of capital
maintenance.● The use of the RPI is objective; there is no scope for judgement in the selection of indi-
ces as in CCA.
Disadvantages of CPP ● The RPI is based upon average price infl ation across the economy. It may bear little rela-
tionship to the specifi c price infl ation that affects a particular entity or industry. ● The CPP model is particularly weak as a realistic measure of asset valuation, because it
values money rather than assets. This is a very signifi cant objection to its use, especially in the case of entities which employ large amounts of physical capital.
● The application of the CPP model for some entities is as unsatisfactory as historical cost accounting.
13.3.6 The ‘real terms ’ system As we have seen, both CPP and CCA have signifi cant drawbacks both in practice and the-ory. The ‘ real terms ’ system of accounting for changing price levels is a hybrid system which combines the best features of CPP and CCA. One of the key drawbacks to the CPP system is that assets are presented in terms related to general purchasing power and the resultant ‘ values ’ may bear little relationship to the real movement in the value of the asset. The ‘ real terms ’ system therefore avoids the problem by retaining CCA valuations for assets. The assets side of the statement of fi nancial position, therefore adopts entirely the CCA system.
However, shareholders do not invest in individual assets and liabilities; their investment is in the entity as a whole. Their concept of capital maintenance is likely to hinge upon the value of their investment in purchasing power terms. The ‘ real terms ’ system accommo-dates this need by calculating and disclosing the amounts needed to maintain the purchas-ing power of shareholders ’ funds.
The ‘ real terms ’ system serves the useful purpose of clearly comparing the effects of general and specifi c price infl ation. Gains calculated using specifi c price indices (holding gains) can be compared to the general effects of moving prices. A simple example shows this effect in terms of one asset.
Example 13.H
At 1 January 20X3 an item of inventory costs $150. One year later replacement cost is $230. During the year the RPI has moved from 112 to 127.
$ Holding gain on one unit of inventory: (230 � 150) 80 Equivalent general terms capital maintenance adjustment: (150 � 127/112) � 150 20 ‘ Real’ holding gain on the inventory 60
Essentially ‘real terms ’ accounting adopts CCA but also incorporates CPP valuation of shareholders ’ funds. The question then arises of how the combination of the two methods articulates to produce a set of accounts. It is, of course, not necessary for CIMA students to be able to prepare a ‘real terms ’ statement, but it will aid understand-ing to look at an example. The example shows the fi nancial statements for E for the year 20X1, prepared on the ‘ real terms ’ basis.

307FINANCIAL MANAGEMENT
FINA
NC
IAL REPO
RTING
IN A
N EN
VIRON
MEN
T OF PRIC
E CH
AN
GES
Example 13.I
E: ‘ real terms ’ income statement (extracts) for the year ended 31 December 20X1
$ $ Historical cost profi t for the year 6,400 CC adjustments: [note (a)] COSA 356 Depreciation 119
(475) CC retained profi t 5,925 Unrealised holding gains in year: [note (b)] 1,187 Realised holding gains in year: [note (c)] 356
1,543 Less: adjustment to shareholders ’ funds: [note (d)] (2,729) Net loss in respect of changing prices (1,186) Retained ‘ real ’ profi t 4,739
E: ‘ real terms ’ statement of fi nancial position as at 31 December 20X1
$ $ Non-current assets 14,944 Current assets Inventories 3,244 Trade receivables 4,400 Cash 300
7,944 Total assets 22,888 Equity 2,000 Accumulated profi t Brought forward 9,500 Retained ‘ real ’ profi t for the year 4,739
14,239 Financial capital maintenance reserve [note (f)] 3,049
19,288 Trade payables 3,600 Total equity and liabilities 22,888
Notes (a) The cost of sales and depreciation adjustments are reported here but MWCA is absorbed in the general
price level changes adjusted further down. (b) Unrealised holding gains are the gains on non-current assets and inventories which have not yet been realised. (c) COSA is a realised holding gain. (d) The infl ation adjustment to shareholders ’ funds is the point at which CPP principles enter the fi nancial statements.
Opening shareholders ’ funds are restated in current terms by applying the movement in RPI over the year:
($ , / ) , $ ,12 176 142 116 12 176 2 729� � � This will be credited to the real capital maintenance reserve in the statement of fi nancial position, and is
debited to the income statement. Deducted from holding gains, it determines how much of the holding gain (which is calculated by reference to specifi c price movements) remains once the effects of general price infl a-tion have been taken into account. In this instance, we can see that there is nothing left: the holding gains have been more than cancelled out by the eroding of values via general infl ation.
(e) Note that the fi gure for total assets is exactly the same as in the CCA statement of fi nancial position. (f) Financial capital maintenance reserve includes:
$ Brought forward 1 January 20X1 (based on RPI applied to opening capital) 320 Current year adjustment [see note (d)] 2,729
3,049

STUDY MATERIAL F2308
FIN
AN
CIA
L RE
PORT
ING
IN A
N E
NVI
RON
MEN
T O
F PR
ICE
CH
AN
GES 13.4 Financial reporting in hyperinflationary
economies The examples we examined in Section 13.3 used rates of both specifi c and general price infl ation which seem, relative to current circumstances in many countries, to be wildly exaggerated. In some parts of the world, however, very high rates of price infl ation are the norm, as noted earlier.
In times of relatively modest price infl ation users of fi nancial statements are usually able to make broadbrush assumptions about the effect that infl ation is having upon infor-mation they are examining. For example, when comparing 2 years ’ revenue fi gures they may mentally adjust the earlier fi gure in order to estimate the effect of infl ation. However, where a very high rate of infl ation prevails such approximations are no longer possible.
In 1989 the International Accounting Standards Committee issued IAS 29 Financial reporting in hyperinfl ationary economies.
13.4.1 What is hyperinflation? IAS 29 identifi es the following characteristics of the economic environment of a country which would indicate that hyperinfl ation is a problem:
● The general population prefers to keep its wealth in non-monetary assets or in a rela-tively stable foreign currency. Amounts of local currency held are immediately invested to maintain purchasing power.
● The general population regards monetary amounts not in terms of the local currency but in terms of a relatively stable foreign currency. Prices may be quoted in that currency.
● Sales and purchases on credit take place at prices that compensate for the expected loss of purchasing power during the credit period, even if the period is short.
● Interest rates, wages and prices are linked to a price index. ● The cumulative infl ation rate over 3 years is approaching, or exceeds, 100 per cent.
13.4.2 Dealing with hyperinflation The IAS requires that the primary accounting statements of entities reporting in the cur-rency of a hyperinfl ationary economy should be restated in current terms at the year end date. Corresponding fi gures for previous periods should also be restated so that all reported fi gures are expressed in common terms.
The restatement required by the IAS involves the application of a general price index to most non-monetary items and all items in the income statement and is very similar to the CPP system explained earlier in the chapter. The IAS specifi cally notes, however, that where items in the statement of fi nancial position are stated at current cost they do not need to be further adjusted.

309FINANCIAL MANAGEMENT
FINA
NC
IAL REPO
RTING
IN A
N EN
VIRON
MEN
T OF PRIC
E CH
AN
GES
13.5 Summary
This chapter has dealt with some complex areas of accounting. The chapter looked at the defects of historical cost accounting and the alternative valuation
methods available, including replacement cost accounting, net realisable value accounting and current cost accounting. The chapter also considered the problems of fi nancial reporting in hyperinfl ationary economies.
Students should ensure that they understand the principles involved in all of the alterna-tive methods discussed in the chapter. Questions could include:
● arguments for and against adjusting accounting fi gures to take account of changing prices levels;
● pros and cons of the different alternative methods; ● discussion about the need for special accounting measures in hyperinfl ationary conditions; ● knowledge-based questions about features of the different methods of accounting for
changing price levels.

This page intentionally left blank

311
Revision Questions
Question 1 Discuss the advantages and disadvantages of using historical cost accounting in preparing fi nancial statements which are presented to shareholders. (10 marks)
Question 2 ‘ The recognition and correct treatment of holding gains in entity fi nancial statements are vital for a proper understanding of the position and performance of the business entity. ’
Requirements (a) Explain briefl y the signifi cance of the treatment of holding gains for the measurement
of business profi t. (4 marks) (b) Set out the arguments for and against the recognition of holding gains. (6 marks)
(Total marks � 10)
Question 3 DCB is a manufacturing and trading entity with several overseas operations. One of its sub-sidiaries, GFE, operates in a country which experiences relatively high rates of infl ation in its currency, the crown. Most entities operating in that country voluntarily present two ver-sions of their fi nancial statements: one at historical cost, and the other incorporating current cost adjustments. GFE complies with this accepted practice. Extracts from the income cp statement adjusted for current costs for the year ended 30 September 20X5 are as follows:
Crowns Crowns $’000 $’000
Historical cost operating profi t 750 Current cost adjustments: Cost of sales adjustment 65 Depreciation adjustment 43 Loss on net monetary position 16
124 Current cost operating profi t 626
Requirements (a) Explain the defects of historical cost accounting in times of increasing prices.
(4 marks)
13

FIN
AN
CIA
L RE
PORT
ING
IN A
N E
NVI
RON
MEN
T O
F PR
ICE
CH
AN
GES
REVISION QUESTIONS F2312
(b) Explain how each of the three current cost adjustments in GFE’s fi nancial statements contributes to the maintenance of capital. (6 marks)
(Total marks � 10)
Question 4 A consolidated historical cost balance sheet gives a realistic valuation for a group. Discuss. (10 marks)

313
Solutions to Revision Questions 13 Solution 1 The advantages of using historical cost accounting in preparing fi nancial statements for presentation to shareholders are as follows:
(a) Historical cost accounts are generally accepted to be understood by users (to a greater or lesser extent). For a reader with no accounting background the concept of cost is one he or she recognises. The use of valuation of certain assets in historical costs (usu-ally properties of some description) does not cause the reader problems as again he or she can relate property values to their everyday experience.
(b) Historical cost accounts are comparatively less expensive to prepare as the information is readily available because the transactions involved have usually already occurred. This reason also makes them easier and cheaper to audit as auditors can verify the information in the accounts.
(c) Despite the criticisms of historical cost accounting, no one has produced a better method that attracts less criticism. The accountancy profession in many countries has made a number of attempts over the last few years to devise an acceptable alternative, but none has met with the approval of preparers and users.
The disadvantages of using historical costs accounting in preparing fi nancial statements for presentation to shareholders are as follows:
(a) In a period of infl ation, historical costs are misleading as they do not compare like with like. The following points are relevant:
(i) Current revenues are matched with costs incurred at an earlier date, so distorting profi ts and losses for the period.
(ii) Distributions made out of profi ts calculated on an historical cost basis may result in a reduction of capital in real terms.
(iii) The use of historical costs for non-current assets undervalues the actual resources used by the business. Resulting lower depreciation charges in turn distort profi t [see (i) above].
(iv) The result of overstating profi ts and undervaluing assets is that return on capital employed will be overstated. This will indicate a more effi cient use of resources than is actually the case.
(v) Management’s real success or failure in achieving operating results is masked because holding gains or losses attributable to price level changes are not recognised.

FIN
AN
CIA
L RE
PORT
ING
IN A
N E
NVI
RON
MEN
T O
F PR
ICE
CH
AN
GES
SOLUTIONS TO REVISION QUESTIONS F2314
(vi) The trend of performance over a period measured by year-to-year comparisons is misleading because no adjustment is made for the changes in the real value of money.
(vii) Historical cost accounts do not recognise the loss that occurs from holding assets of a fi xed monetary value (and alternatively the gain that arises from liabilities of the same type).
(b) Historical cost accounts cannot easily be adapted to take account of the effects of ris-ing prices in a period of infl ation.
(c) Historical cost accounts which incorporate valuations of assets are often misleading as there is no requirement (except in the case of investment properties), to keep these valuations up to date.
Solution 2 (a) Holding gains are increases in the value of an asset while that asset is owned by a
entity. For example, a entity might buy an item of inventory for $100 and then later sell it for $180 when its replacement cost had gone up to $150. The holding gain of $50 is realised at the date of sale; the ‘ real ’ profi t, or operating gain, on the disposal is $30.
There are several alternative possible accounting treatments for holding gains, both realised and unrealised. Conventional historical cost accounting ignores unreal-ised holding gains, and includes realised holding gains in the income statement of the period in which the asset is disposed of. Current cost accounting, on the other hand, excludes realised holding gains on the disposals of inventory items by charging a cost of sales adjustment (COSA) against reported profi ts so that only operating gains are reported as profi ts.
The signifi cance of the treatment of holding gains is therefore the enormous effect that such treatment will have on reported profi ts. Although earnings per share is not the only important indicator of fi nancial performance, it is still the most important, and the exclusion of holding gains from earnings will materially depress earnings per share and may thereby reduce the share price.
(b) Arguments for the recognition of holding gains The accruals concept would suggest that gains and losses should be recognised in the period in which they occurred, rather than being deferred. So fi nancial assets would be shown on the statement of fi nancial position at their market value. As a separate issue, prudence might dictate that gains should be credited to reserves rather than to the income statement, but the principle of revaluing investments in the statement of fi nancial position remains valid.
The objective of fi nancial statements is set out in the IASC’s Framework as being to provide useful information to a wide range of user groups. Surely the current value of assets held is more useful than historical cost.
If holding gains are not recognised year by year, entities experiencing a bad year can fl atter their reported profi ts by deciding to sell assets held for many years which have large unrealised holding gains. Often these assets may be immediately repurchased as a ‘ bed and breakfast ’ transaction. The profi t generated on this deal does not refl ect the genuine

FINA
NC
IAL REPO
RTING
IN A
N EN
VIRON
MEN
T OF PRIC
E CH
AN
GES
315FINANCIAL MANAGEMENT
economic performance of the entity in that period but under existing accounting practices may be all reported in the year of disposal. Asset-stripping hostile acquisitive entities will not be able to make money by breaking
up target entities whose share prices do not refl ect the real value of their underlying assets.
Arguments against the recognition of holding gains The prudence concept seeks to prevent profi ts being included in the income statement unless their realisation is reasonably certain. Unrealised holding gains may not be recog-nised in the income statement.
Subjectivity and uncertainty exist in trying to determine the current value of an asset at the year end date. An advantage of deferring holding gains until the date of disposal is the avoidance of this uncertainty.
If realised holding gains are included in reported profi ts and distributed out of the business, the entity will not be able to fi nance the replacement of its assets without rais-ing new funds externally. Operating capital will not be maintained if a policy of maxi-mum distributions is carried on.
Solution 3 (a) In times of increasing prices, historical cost accounting displays the following defects: (i) Revenues are stated at current values, but they tend to be matched with costs
incurred at an earlier date. Therefore, profi t is overstated. (ii) Where historical cost accounting is applied consistently, asset values are stated at
cost less accumulated depreciation. Current values of the assets may be considera-bly in excess of net book value, with the result that the historical cost depreciation charge does not constitute a realistic estimate of the value of the asset consumed.
(iii) By the time monetary liabilities are repayable, the amount of the outfl ow in cur-rent value terms is less than the original infl ow. An entity can therefore gain by holding current liabilities, but historical cost accounting does not recognise these gains. The opposite effect is experienced in respect of monetary assets.
(iv) Typically, in a time of rising prices, profi ts are likely to be overstated, and capital to be understated, thus giving rise to unrealistic measurements of return on capi-tal employed.
(b) The cost of sales adjustment comprises the additional amount of value, over and above value at historical cost, that is consumed at current cost. It represents an additional charge against profi ts, thus tending to reduce distributable earnings and ensuring that the business conserves the resources that allow it to continue to trade at current levels.
The depreciation adjustment is the difference between the historical cost account-ing and current cost depreciation charges. Current cost depreciation is the value of the non-current asset consumption that has taken place during the year. In a time of rising prices it is a more realistic representation of the asset consumption. It tends to reduce distributable profi ts thus contributing to capital maintenance.
In the case of GFE, there is a loss on net monetary position. As noted earlier in part (a) holding monetary liabilities in times of rising prices tends to give rise to gains, whereas holding monetary assets produces losses. GFE appears, therefore, to have an excess of monetary assets over monetary liabilities, as the net effect is a loss.
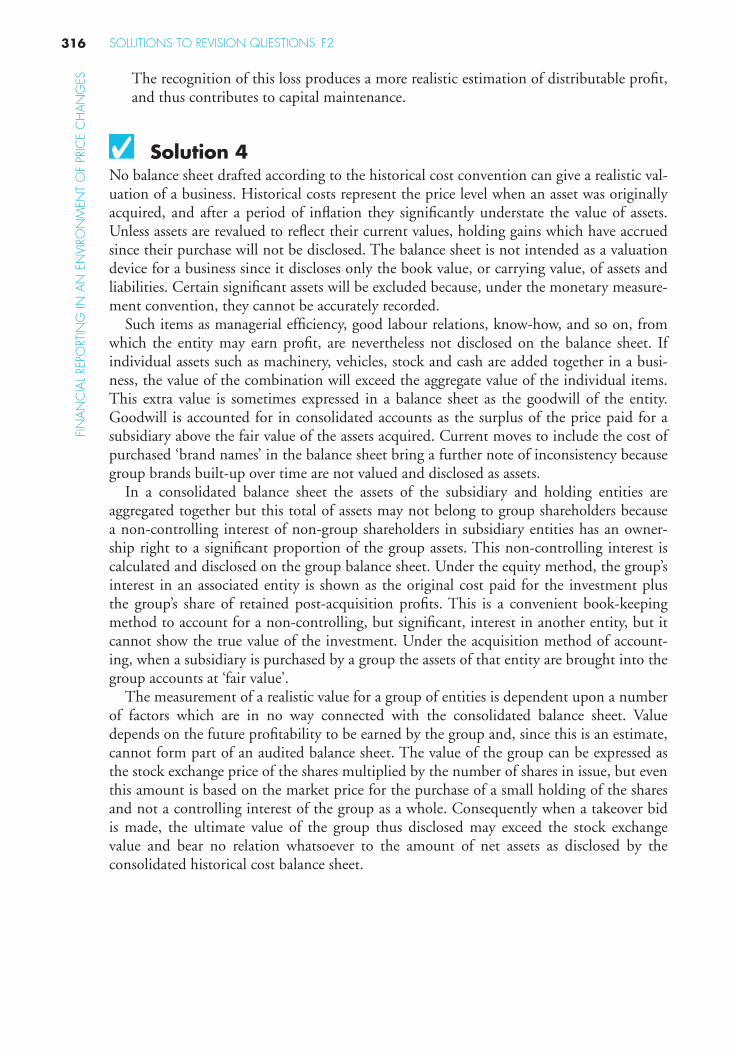
FIN
AN
CIA
L RE
PORT
ING
IN A
N E
NVI
RON
MEN
T O
F PR
ICE
CH
AN
GES
SOLUTIONS TO REVISION QUESTIONS F2316
The recognition of this loss produces a more realistic estimation of distributable profi t, and thus contributes to capital maintenance.
Solution 4 No balance sheet drafted according to the historical cost convention can give a realistic val-uation of a business. Historical costs represent the price level when an asset was originally acquired, and after a period of infl ation they signifi cantly understate the value of assets. Unless assets are revalued to refl ect their current values, holding gains which have accrued since their purchase will not be disclosed. The balance sheet is not intended as a valuation device for a business since it discloses only the book value, or carrying value, of assets and liabilities. Certain signifi cant assets will be excluded because, under the monetary measure-ment convention, they cannot be accurately recorded.
Such items as managerial effi ciency, good labour relations, know-how, and so on, from which the entity may earn profi t, are nevertheless not disclosed on the balance sheet. If individual assets such as machinery, vehicles, stock and cash are added together in a busi-ness, the value of the combination will exceed the aggregate value of the individual items. This extra value is sometimes expressed in a balance sheet as the goodwill of the entity. Goodwill is accounted for in consolidated accounts as the surplus of the price paid for a subsidiary above the fair value of the assets acquired. Current moves to include the cost of purchased ‘brand names’ in the balance sheet bring a further note of inconsistency because group brands built-up over time are not valued and disclosed as assets.
In a consolidated balance sheet the assets of the subsidiary and holding entities are aggregated together but this total of assets may not belong to group shareholders because a non-controlling interest of non-group shareholders in subsidiary entities has an owner-ship right to a signifi cant proportion of the group assets. This non-controlling interest is calculated and disclosed on the group balance sheet. Under the equity method, the group’s interest in an associated entity is shown as the original cost paid for the investment plus the group’s share of retained post-acquisition profi ts. This is a convenient book-keeping method to account for a non-controlling, but signifi cant, interest in another entity, but it cannot show the true value of the investment. Under the acquisition method of account-ing, when a subsidiary is purchased by a group the assets of that entity are brought into the group accounts at ‘fair value’.
The measurement of a realistic value for a group of entities is dependent upon a number of factors which are in no way connected with the consolidated balance sheet. Value depends on the future profi tability to be earned by the group and, since this is an estimate, cannot form part of an audited balance sheet. The value of the group can be expressed as the stock exchange price of the shares multiplied by the number of shares in issue, but even this amount is based on the market price for the purchase of a small holding of the shares and not a controlling interest of the group as a whole. Consequently when a takeover bid is made, the ultimate value of the group thus disclosed may exceed the stock exchange value and bear no relation whatsoever to the amount of net assets as disclosed by the consolidated historical cost balance sheet.

14
Interpretation of Accounting Ratios

This page intentionally left blank

319
14
LEARNING OUTCOME After studying this chapter students should be able to:
� interpret a full range of accounting ratios.
14.1 Introduction This chapter covers the calculation and interpretation of various accounting ratios. Section 14.2 focuses on identifi cation of the user and understanding the business. Sections 14.3 to 14.5 cover ratios that you will be familiar with, including ratios on performance, liquidity, and capital structure. Section 14.6 looks specifi cally at investors’ ratios and fi nally Section 14.7 looks at how to use relevant ratios when analysing the statement of cash fl ows.
14.2 Interpretation and analysis The IASB Framework states:
The objective of fi nancial statements is to provide information … that is useful to a wide range of users in making economic decisions.
Interpretation and analysis of the fi nancial statements is the process of arranging, examin-ing and comparing the results in order that users are equipped to make such economic decisions.
The interpretation process is assisted by adopting an analytical framework. The main components of an appropriate framework are:
● identifi cation of the user of the analysis; ● an understanding of the nature of the business, industry and organisation;
Interpretation of Accounting Ratios

STUDY MATERIAL F2320
INTE
RPRE
TATI
ON
OF
AC
CO
UN
TIN
G R
ATIO
S● identifi cation of relevant sources of data for analysis; ● numerical analysis of the data available; ● interpretation of the results of the analysis; ● writing the report detailing the analysis of the results and recommendations.
14.2.1 Identification of the user of the analysis There is a wide range of user groups that may be interested in an entity’s fi nancial state-ments. Historically, of course, fi nancial statements have been prepared for the benefi t of the investor group. However, those interested in the statements extend far beyond existing investors.
A major creditor of an entity, such as a bank which has provided material amounts of long-term fi nance, may commission specifi c fi nancial reports, in fact it may be a condi-tion of continuing fi nancial backing that the entity prepares, say, quarterly statements to the bank’s specifi cations. Most users, however, are not in a position to command such privileges.
Although the various user groups will almost invariably be using general-purpose fi nan-cial reports, their needs may vary. It is important that any analysis and interpretation exer-cise is oriented towards the needs of the particular user who requires a report.
Examination questions will usually identify the type of user for whom a report is being prepared, so it is important to recognise the differences between users and their needs.
Present and potential investors Both present and potential investors are interested in information that is useful in making buy/sell/hold decisions. Will the entity be able to generate cash in the future? How risky is the investment? Does its fi nancial performance exceed that of other potential investee entities? How much is the investment likely to yield in capital growth and/or dividend? Analysis of the fi nancial statements can help to answer these questions. There is a range of ratios of particular interest to the investor group; these are examined in detail later in the chapter in Section 14.6. In addition, return on capital employed (ROCE) and related per-formance and asset management ratios are likely to be of interest to this group of users.
Lenders and potential lenders Lenders are principally interested in assessing whether or not the loans that they have made are likely to be repaid, and whether or not the related interest charge will be paid in full and on time. Potential lenders require analysis of fi nancial statements in order to assist them in deciding whether or not to lend. Lender groups are likely to be particularly inter-ested in ratios such as interest cover and gearing, and will be interested in the nature and longevity of other categories of loan to the entity.
Suppliers and other creditors This group is interested in information that helps them to decide whether or not to sup-ply goods or services to an entity. Availability of cash will be of particular interest, together with such evidence as is available in general-purpose fi nancial statements about the entity’s record in paying its creditors on time. Working capital ratios, and the working capital cycle, may be appropriate calculations to undertake when analysing fi nancial statements for the benefi t of this class of user.

321FINANCIAL MANAGEMENT
INTERPRETATIO
N O
F AC
CO
UN
TING
RATIOS
Employees In large organisations employees are likely to be particularly interested in one part of the entity’s operations. They may, therefore, fi nd segmental information to be useful. More gen-erally, they need to be able to assess the stability and performance of the entity in order to gauge how reliable it is likely to be as a source of employment in the longer term. Employees are likely to be interested in disclosures about retirement benefi ts and remuneration.
Customers Customers may be in a vulnerable position if there are few potential suppliers in a market for goods. They may therefore be interested in assessing the risks which threaten their sup-plier. Potentially they may be interested in takeover opportunities in order to ensure the continuing supply of a particular raw material.
Governments and their agencies The governmental group is in a position to require special-purpose reports. Tax computa-tions would fall into this category. However, general-purpose reports may also be of use, for example in gathering statistics on particular industries.
The general public Members of the public may have special interests in the activities of certain entities, espe-cially where, say, an individual entity dominates the local employment market. Pressure groups and their members would also fall under the umbrella category of ‘ general public ’ , and their needs will vary according to their special interest. Environmental issues are of increasing concern to many people, and it is likely that pressure groups will take a particu-lar interest in fi rms that are perceived as polluters. Analysis of the fi nancial statements for this type of user would tend to focus on any additional voluntary disclosures made about the entity’s environmental policies, on provisions and contingent liabilities related to envi-ronmental damage, and on capital investment (e.g., investment in new plant).
14.2.2 Understanding the business It is often thought that fi nancial analysis involves the direct application of a routine set of numerical calculations to a set of published accounts. This is only one part of the task. In order to interpret those calculations it is important to understand the relationships between the data and the underlying reasons, economic and other, that account for the business’s current position.
The history of the business underlies the current position and future outlook. Furthermore, the owners and their individual characteristics will infl uence factors such as the level of risk in the business and dividend policy. Knowledge of the quality, qualifi cations and experience of management will assist in evaluating the performance and position of the business.
Financial analysis requires an understanding of the products, services and operating characteristics of the business. This will assist in understanding data such as turnover, prof-itability, inventories and working capital.
The business operates within an industry consisting of businesses with similar operating characteristics. If the analysis requires comparison of the business with the industry norms, it is important to identify the key characteristics of the industry and to establish bench-marks such as gross profi t ratios, receivables collection days, etc.
STUDY MATERIAL F2322
INTE
RPRE
TATI
ON
OF
AC
CO
UN
TIN
G R
ATIO
S 14.2.3 Identifying relevant sources of data In practice, the analyst needs to consider carefully the possible sources of information available about an entity. Perhaps the most obvious source is the wealth of fi nancial and non-fi nancial information contained in the entity’s annual report. In addition to all the information that statute law and accounting standards require to be included in the annual report, there may be further voluntary disclosures that will be helpful to the analyst. Examples of such voluntary disclosures include supplementary information about an enti-ty’s environmental impact, employment reports, graphs, pie charts and ratio calculations. In some jurisdictions, interim fi nancial reports are also available. Listed companies in the USA report quarterly, but in the UK, for example, listed companies (with a very small number of exceptions) report every 6 months.
There are likely to be further useful sources of information available to the analyst, espe-cially in the case of larger, listed, companies. Specialist agencies collect and analyse data about industry sectors from which it may be possible (often at a price) to obtain, say, aver-age return on capital employed fi gures for a sector. Brokers ’ reports may contain informa-tion about the prospects for the entity, together with predictions about certain key ratios such as earnings per share. Because this information has a value it is usually available to the broker’s clients only, at least initially. However, some listed entities have started to make this information available, after a certain lapse of time, on their websites. It is always worth examining the website of an entity in case it contains some additional voluntary disclosures that may be useful in the analysis.
In the Financial Management examination it will not be possible, because of time restric-tions, to carry out an analysis in great depth, and there are obvious limitations on the amount of information that can be provided in an examination question. The information provided for analysis in a question is likely to include one or more of the following:
● income statement data for one or more years; ● cash fl ow data for one or more years; ● industry wide ratios and benchmarks; ● statement of fi nancial position data for one or more years; ● budget data, and variance analysis; ● data regarding a competitor, potential subsidiary or customer applying for credit.
Working with this information and with any descriptive background provided in the ques-tion, we need to gain an understanding of the business and the relationships between the data. Where information in the form of extracts from the fi nancial statements is given, it is often possible (and is often specifi cally required by the requirements of the question) to calculate a set of fi nancial ratios as the basis for further analysis and comment. The rest of this chapter examines numerical data analysis in the form of the most frequently used accounting ratios.
14.3 Performance ratios 14.3.1 Profitability ratios Revenue When analysing the performance of an entity, a useful starting point is the examination of revenue. Revenue is important in both absolute and relative terms. Increases or decreases in

323FINANCIAL MANAGEMENT
INTERPRETATIO
N O
F AC
CO
UN
TING
RATIOS
revenue may be attributable to changes in selling prices or sales volumes or a combination of the two factors.
Problems can arise in making a valid interpretation of movements in revenue. For example:
● Accounting policies on revenue recognition may vary between businesses. There may be inconsistencies between accounting periods, especially where the business derives some or all of its revenue from long-term contracts.
● Infl ation may account for some of the increase in price. ● A detailed breakdown of revenue for the business may not be available. To some extent IFRS 8
Operating Segments (see Chapter 16 of this Learning System for more details) stipulates rev-enue details for different segments of the business. However, there are, as we shall see, prob-lems in using segmental data, in that, for example, segments may not be consistently defi ned.
Understanding the reasons for movements in revenue may help to explain movements in costs such as cost of sales, advertising, selling and distribution costs and telephone charges. If revenue increases, then a similar increase in these revenue-related costs could be expected. Conversely, an increase in, say, marketing and advertising expenditure might help to explain an increase in revenue.
Profitability Several profi t fi gures are identifi ed in a typical income statement. Each may be used to evaluate the profi tability of the business.
Gross profit margin The CIMA Offi cial Terminology defi nition of gross profi t percentage is:
( )Sales cost of sales
Sales for the period
��100
This ratio might be expected to be more or less constant from 1 year to the next within a business. Even if there is an increase in direct costs, an effi cient business could be expected to pass on the increases in the form of increased sales prices. However, this may not be the case in practice.
The gross profi t margin requires a detailed breakdown in order to gain an understand-ing of variations. Ideally, the analyst requires information relating to opening and closing inventories, purchases, direct wages and overheads. Further information as to the following items would be required in order to evaluate gross profi t margin fully:
● breakdown by product, geographical area or other segment; ● inventory valuation policies; ● overhead allocation methods; ● purchasing details such as bulk discounts, purchasing errors, wastage or theft; ● selling prices of different products over the period.
Obviously, much of this information is not available from a business’s annual report. Some businesses do not even report gross profi ts.
Operating profit margin
Operating profit
Revenue�100

STUDY MATERIAL F2324
INTE
RPRE
TATI
ON
OF
AC
CO
UN
TIN
G R
ATIO
S The operating profi t margin is the trading or operating profi t in relation to revenue, expressed as a percentage.
Operating profi t is the profi t from the trading activities of the business; it comprises prof-its after operating costs, but before fi nance costs and tax, and before investment income. Note that IAS 1 revised does not encourage the reporting of operating profi t as a separate line item, although there is nothing to prevent entities providing additional information. It is likely, though that in many cases it will not be possible to calculate operating profi t margin. Further analysis might include measuring operating costs as a percentage of revenue, and comparing to benchmarks, budgets, previous years or industry averages. For example:
Administration costs
Revenue�100
Telephone costs
Revenue�100
Advertising costs
Revenue�100
Net profit margin Net profi t margin expresses the relationship between net profi t and sales. Net profi t for this purpose would be profi t after deduction of fi nance cost. It may be calculated on either pre-tax or post-tax profi t.
Net profit
Revenue�100
Where comparing net profi t year on year, it is important to allow for any exceptional charges or credits. Also, it would be sensible to take into account any large adjustments in respect of under- or over-provided tax provisions.
EBITDA EBITDA is an acronym for earnings before interest, tax, depreciation and amortisation. In recent years many large entities have adopted EBITDA as a key measure of fi nancial per-formance. Sceptics suggest that they do this in order to publicise a higher measure of earn-ings than profi t from operations (this type of measurement is sometimes cynically referred to as EBB – earnings before the bad bits).
However, it does make some sense to measure EBITDA, provided that the user fully understands what is included and what is left out. Depreciation and amortisation are accounting adjustments, not representing cash fl ows, that are determined by management. It can therefore be argued that excluding these items in assessing earnings eliminates a major area where management bias can operate. Unfortunately, EBITDA is consequently often misunderstood as being a measurement of cash fl ow, which of course it is not. Even though two categories of non-cash adjustment are eliminated, fi nancial statements are prepared on an accruals basis. EBITDA makes no adjustments in respect of accruals or working capital movements, and so is emphatically not a cash fl ow measurement.
325FINANCIAL MANAGEMENT
INTERPRETATIO
N O
F AC
CO
UN
TING
RATIOS
14.3.2 Activity ratios A further, related, set of ratios can be calculated that indicate the effi ciency of usage of the entity’s assets in producing revenue and profi ts.
Asset turnover
Revenue
Total assets
This calculation is usually expressed as a simple ratio, rather than as a percentage. It shows how much revenue is produced per dollar of investment in fi xed assets.
The overall ratio can be further broken down to show revenue in relation to other cat-egories of asset. For example, a useful ratio in certain contexts is:
Revenue
Non-current assets, excluding investments
This ratio shows the productivity of non-current assets in generating sales. It should be noted that this ratio is not always useful or informative. Where a business is using assets that are nearing the end of their useful lives, having been subject to annual depreciation charges over a relatively long period, the ratio is likely to be rather high. Similarly, where a business uses the historical cost convention, unmodifi ed by revaluation, asset values are also likely to be relatively low, an effect which is more intrusive as the assets age. Also, in labour-intensive businesses, where the non-current asset base is low, the ratio tends to lack signifi cance.
Note that, where possible, the average asset fi gure over the year should be used in the denominator of the fraction. This is likely to give a more consistent and representative result. External users of annual reports do not have access to monthly information with which to calculate an average, but opening and closing fi gures often give a reasonable approximation.
Inventory turnover Conventionally, inventory turnover is expressed in terms of cost of sales, rather than of rev-enue. If cost of sales is not available, perhaps because the entity does not have a policy of disclosing gross profi t, revenue could be used. Provided it is used consistently when mak-ing comparisons, the ratio will have some information content. However, where the infor-mation is available, cost of sales is to be preferred. The inventory turnover ratio indicates the liquidity of inventories. The higher the ratio, the more quickly inventory is being sold:
Cost of sales
Average inventory
Application of this formula produces a fi gure which shows the number of times, on aver-age, that inventory has turned over during the year. If only a closing fi gure is available for inventory, then that can be used. However, the result must be treated with some caution, as the closing fi gure may be unrepresentative.
The ratio can be inverted to give the number of days, weeks or months that inventory, on average, has remained in the warehouse:
Average inventory
Cost of sales days or weeks, or � 365 52 1( 22 months)

STUDY MATERIAL F2326
INTE
RPRE
TATI
ON
OF
AC
CO
UN
TIN
G R
ATIO
S 14.3.3 Return on capital ratios Return on capital employed Return on capital employed (ROCE) is a measurement that is frequently used in the anal-ysis of fi nancial statements. This shows the overall performance of the business, expressed as a percentage return on the total investment. It measures management’s effi ciency in gen-erating profi ts from the resources available.
Return on capital employed is expressed as a percentage, and is calculated as follows:
Profit
Capital employed�100
For the purposes of the ROCE measurement, capital employed includes the following:
Issued share capital � Reserves � Preference shares � Non-controlling interests � Loan capital � Provisions (including provisions for tax) � Bank overdraft � Investments
It is important in this type of calculation that the numerator and denominator should be consistent. Therefore, in calculating ROCE, the numerator should include profi t before any deductions for fi nance cost. If capital employed includes a bank overdraft, the profi t fi gure used in the calculation should exclude interest paid and payable on the overdraft.
Return on assets Return on assets (ROA) involves a similar calculation to ROCE, but the denominator repre-sents total assets (i.e., the statement of fi nancial position total). Where a business has a policy of regular revaluation of assets, both ROCE and ROA are likely to provide a better measure of economic performance.
ROA, which is expressed as a percentage, is calculated as follows:
Operating profit
Total assets�100
Return on assets: relationship with other ratios ROA can be broken down into two component ratios that have already been introduced: operating profi t margin and asset turnover ratio.
Operating profit margin asset turnover Return on assets� �
The relationship becomes clear when we put the ratio calculations into the formula:
Operating profit
Revenue
Revenue
Assets
Operating profit
Asse� �
tts
Return on shareholders ’ funds Sometimes it can be useful to calculate return from the shareholders ’ point of view. The formula for the ratio is:
Profits attributable to shareholders
Shareholders’ funds

327FINANCIAL MANAGEMENT
INTERPRETATIO
N O
F AC
CO
UN
TING
RATIOS
Profi ts attributable to shareholders comprises profi ts after tax, non-controlling interest and non-equity appropriations (such as preference dividends). Shareholders ’ funds comprise equity share capital and reserves.
14.4 Liquidity ratios 14.4.1 Working capital analysis The profi tability and activity ratios indicate how the business is performing. It is impor-tant to supplement this review with an examination of the effects of the performance on the liquidity and cash position of the business.
The bank balance The analysis of the liquidity of an entity may commence with a review of the actual bank balance in absolute terms. Has the bank balance increased or decreased signifi cantly? It could be that the overdraft is near to its permitted limit or that high cash resources indi-cate a good takeover prospect.
Short-term liquidity The liquidity of the business is measured by examining the relationships between current assets and current liabilities. To what extent is the business able to meet its current liabili-ties as they fall due?
Two common ratios are used to answer this question: the current ratio and the quick ratio:
Current ratioCurrent assets
Current liabilities
Quick ratio
=
==Current assets less inventory
Current liabilities
The quick ratio recognises that the time taken to convert inventory into cash in many businesses is signifi cantly longer than other current assets and so gives a more conservative view of liquidity. However, it is important to select ratios suitable for the circumstances of the business. If inventory is an insignifi cant amount (as it would be, for example, in most service businesses), there is little point in calculating the quick ratio.
There is no standard number that should be expected in these calculations; it should depend on the industry and should be linked to other areas of the analysis. The higher the ratio, the more liquid the business, but high liquidity can itself be a problem. It may mean that the business is unable to utilise cash effectively by investing it profi tably.
The immediate liquidity of a business can be defi ned using the cash balance itself:
Cash
Current liabilities
The working capital cycle The length of the working capital cycle can assist in determining the immediate effects of the fi nancial position on the bank balance.
The working capital cycle comprises cash, receivables, inventory and payables. The busi-ness uses cash to buy inventory. Additional inventory may be purchased on credit.

STUDY MATERIAL F2328
INTE
RPRE
TATI
ON
OF
AC
CO
UN
TIN
G R
ATIO
S Inventories are sold and become receivables. Receivables pay and then the business has cash available to repay payables or buy further inventory.
The length of this cycle is determined using ratios of inventory turnover, receivables days and payables days.
Earlier, we examined the calculation of inventory turnover in terms of days, weeks or months. The same type of calculation is used for both receivables and short-term payables:
Receivables days The number of days it takes for the average customer to pay may be measured as follows:
Average receivables
Credit sales days or weeks or� 365 52( ) ( months12 )
A retail or cash-based business may have zero or very low receivables days. Note that, where a business sells for both cash and on credit, it will be necessary to split revenue into the two types.
Payables days The length of time taken to settle payables may be measured as follows:
Average payables
Credit purchases days or weeks o� 365 52( ) ( rr months12 )
Current payables comprise a form of fi nance which is free, or almost free. However, there may be costs in terms of loss of prompt payment discount, and loss of supplier good-will where excessive time is taken to pay. Effi ciency is measured relative to industry norms, receivables days and supplier terms.
In the ratios above, if fi gures are not available for credit sales and credit purchases (as may well be the case if the data source is a set of published accounts) an approximation may be obtained by using total revenue and cost of sales respectively, but the results of such ratio calculations must be treated with caution.
The total length of the working capital cycle is the inventory turnover days plus the receivables days less the payables days, which approximates to the total time it takes to purchase the inventory, sell the inventory and receive cash.
Example 14.A
X: statement of fi nancial position (extract)
20 X 2 20 X 1 $’000 $’000
Inventories 790 650 Trade receivables 503 535 Financial assets 86 75 Cash 113 –
1,492 1,260Current liabilities * 773 751 Net current assets 719 509

329FINANCIAL MANAGEMENT
INTERPRETATIO
N O
F AC
CO
UN
TING
RATIOS
*Current liabilities analysed as follows:
20 X 2 20 X 1 $’000 $’000
Trade payables 520 443 Income tax 139 164 Other payables 114 108 Bank overdraft � 36
773 751
X: income statement (extract)
20 X 2 20X1 $’000 $’000
Revenue 3,559 3,343 Cost of sales* (2,420) (2,240) Gross profi t 1,139 1,103
*Cost of sales is analysed as follows:
20 X 2 20X1 $’000 $’000
Opening inventory 650 630 Add: purchases 2,560 2,260 Less: closing inventory (790) (650) Cost of sales 2,420 2,240
In both 20X 1 and 20 X 2 credit sales comprise 83% of total revenue. Calculate the working capital cycle for each of 20 X 2 and 20 X 1 for X.
Solution
The components of the working capital cycle are:
Inventories
Average inventoriesCost of sales
days
X : /
�
�
365
20 1650 630 2( )
22 240365 104
20 2790 650 2
2 420365 10
,
( ),
� �
�� �
days days
X : /
days 99 days
Trade receivables
Trade receivablesCredit sales
days
X :
�
��
365
20 1535
3 343 0 83, .3365 70
20 2503
3 559 0 83365 62
days days
X : days days
�
�� �
, .
Trade payables
Trade payablesCredit purchases
days
X :
�
�
365
20 1443
2 260365
,ddays days
X : days days
�
� �
71
20 2520
2 560365 74
,

STUDY MATERIAL F2330
INTE
RPRE
TATI
ON
OF
AC
CO
UN
TIN
G R
ATIO
S Working capital cycle
20X 2 20 X 1 Inventories days 109 104 � Trade receivables days 62 70 � Trade payables days (74) (71) Total 97 103
The working capital cycle has shortened in 20X 2. Although inventories are, on average, spending an extra 5 days on the premises, collection from receivables has improved in 20 X 2 and X is taking an extra 3 days on average to meet its payables. It is very diffi cult to make a judgement, in absolute terms, about this length of work-ing capital cycle. Much depends upon the nature of the industry, the type of inventories held and acceptable pat-terns of payment. If we had access to some industry averages for the working capital cycle we would be able to comment more confi dently.
14.5 Analysis of capital structure The gearing (or leverage) ratio is an important measure of risk. It is important to analyse, particularly for users such as shareholders and creditors, the ability to satisfy debts falling due after 1 year. There are two elements to consider: repayment of capital and payment of interest.
The assessment of an entity’s gearing risk can be identifi ed from two areas. The state-ment of fi nancial position shows the current liquidity and capital structure of the busi-ness, that is the short-term liquidity and the level of fi xed prior charge capital. The income statement shows the profi tability of the business generally, indicating its ability to generate cash, some of which may be available to repay debt.
The capital structure of the business provides information about the relative risk that is accepted by shareholders and creditors. As long-term debt increases relative to shareholders ’ funds then more risk is assumed by long-term creditors and so they would require higher rewards, thereby decreasing resources available for the shareholders. As risk increases, credi-tors require higher interest in order to compensate for the higher risk.
However, the use of debt by management in their capital structure can assist in increas-ing profi ts available to shareholders. Cash received into the business from lenders will be used to generate revenue and profi ts. As interest costs are fi xed, any profi ts generated in excess of the interest costs will accrue to the shareholders. There is, however, a negative side to the use of debt in the business. If the cash from the debt does not raise suffi cient profi ts then the fi xed interest cost must be paid fi rst and so profi ts available to shareholders are decreased, and may be extinguished completely.
14.5.1 Measuring the performance effects of capital structures
Although the use of debt may generate higher profi ts for shareholders there is a limit to its use. This may be gauged from the income statement by focusing on the profi tability and interest repayments in the interest cover ratio:
Profit before interest and tax
Interest expense
331FINANCIAL MANAGEMENT
INTERPRETATIO
N O
F AC
CO
UN
TING
RATIOS
This ratio indicates the number of times profi ts will cover the interest charge; the higher the ratio, the better.
14.5.2 Measuring statement of financial position gearing
The gearing ratio can be calculated using either of the following:
Total long-term debt
Shareholders’ funds�100
Or:
Total long-term debt
Shareholders’ funds long term debt��100
Long-term debt includes debentures, mortgages and other long-term debt, including prefer-ence shares. Any bank overdraft would be included to the extent that it is actually a source of long-term fi nance. Shareholders ’ funds comprises equity share capital and reserves.
Another useful ratio is the ratio of long-term debt to total assets, which is calculated as follows:
Total long-term debt
Total assets�100
This can provide very useful information for creditors as it measures the availability of assets in the business in relation to the total debt.
14.6 Valuation ratios and analysis for the investor
The analytical process for investment purposes will utilise the ratios identifi ed in the above sections. These ratios may be supplemented by further ratios specifi cally for investors. The use of the market price of equity is an important component of this type of analysis.
14.6.1 Price/earnings ratio A common benchmark for investors analysing different companies is the use of the price/earnings (P/E) ratio:
Current market price per share
Earnings per share
Earnings per share is basically the earnings available for distribution divided by the number of ordinary shares in issue. The calculation of earnings per share is covered in detail in Chapter 15 of this Learning System.
The P/E ratio calculation produces a number which can be useful for assessing the rela-tive risk of an investment.

STUDY MATERIAL F2332
INTE
RPRE
TATI
ON
OF
AC
CO
UN
TIN
G R
ATIO
S Example 14.B
V W Current market price per share 396¢ 288¢ Most recent earnings per share 13.4¢ 35.6¢ P/E ratio 29.6 8.1
W has much higher earnings per share than V, but the price of one share in W is lower than one share in V, giving rise to two very different P/E ratios. Generally, the lower the P/E ratio the greater the indication of risk for the investor.
The rational expectations of buyers and sellers in the stock market tend to be incorporated in the price of the share. The P/E ratios of these entities tend to suggest that the market considers investment in W to be riskier than investment in V.
There may be reasons to account for this difference, for example:
● The numerator of the fraction is current (an up-to-date market price can be obtained easily during the market’s opening hours), but the EPS fi gure is the latest available which, for a listed entity in many markets, can be up to 6 months old. The EPS of either entity may therefore be quite signifi cantly out of date.
● W may have issued a profi ts warning, or might have suffered adverse events, such as, for example, the loss of a major contract or the resignation of a key director. These events may have depressed the share price.
● W may be in a sector which is unfashionable or relatively undervalued. ● W may have had a diffi cult recent history with a volatile pattern of earnings. On the whole, markets prefer
companies with a smooth profi t record.
As usual, the process of analysis leads to demands for more information. A better picture could be obtained of V and W if share price graphs for the last year, for example, were available, so that the analyst could see whether the share prices quoted above are near to average or not.
14.6.2 Dividend-related ratios Growth potential and the ability to generate future wealth in the business may depend on the amount of profi ts retained. This relationship may be measured using the profi t retention ratio:
Profit after dividends
Profit before dividends�100
The higher the proportion of earnings retained, the higher the growth potential. Cash is retained in the business for growth as opposed to being paid to shareholders.
Cash dividend per share
Earnings per share�100
When analysing fi nancial statements from an investor’s point of view it is important to identify the objectives of the investor. Does the investor require high capital growth, usually associated with high risk, or a lower risk fi xed dividend payment and low capital growth?
Dividend yield will indicate the return on capital investment, relative to market price:
Dividend per share
Market price per share�100
Dividend cover measures the ability of the entity to maintain the existing level of dividend and is used in conjunction with the dividend yield:
Earnings per share
Dividends per share
The higher the dividend cover, the more likely it is that the dividend yield can be maintained.

333FINANCIAL MANAGEMENT
INTERPRETATIO
N O
F AC
CO
UN
TING
RATIOS
14.6.3 Statement of financial position ratios The statement of fi nancial position may be used in computing ratios of particular interest to the investor. The book value per share indicates the asset backing of the investment:
Shareholders’ funds
No. of equity shares in issue at the ballance sheet date
However, this must be interpreted with care:
1. Assets in the statement of fi nancial position may be measured on historical cost values. Other valuations of assets may be more informative.
2. The ratio may be irrelevant in service-based businesses where the major asset is the quality of staff and other intangibles which may not be included in the statement of fi nancial position.
The book value per share may be compared to the market value per share to determine the market’s evaluation of the business.
Example 14.C
This example will be used to illustrate the calculation of most of the accounting ratios illustrated so far in this chapter. The income statement of PX for the year ended 31 December 20 X 4 and its statement of fi nancial position at
that date are as follows:
Income statement $m $m
Revenue 1,845 Cost of sales (758) Gross profi t 1,087 Distribution costs (136) Administrative expenses (61)
(197) Profi t from operations 890 Finance cost (104)
786 Income tax expense (69) Profi t for the period 717
Statement of fi nancial position$m $m
Assets Non-current assets Property, plant and equipment 4,002 Current assets Inventories 42 Trade receivables 180 Cash and cash equivalents 113
335 Total assets 4,337
Equity and Liabilities Issued capital ($1 shares) 600 Retained earnings 1,132
1,732 Non-current liabilities Interest-bearing borrowings 2,022 Deferred tax 291
2,313 Current liabilities 292 Total equity and liabilities 4,337

STUDY MATERIAL F2334
INTE
RPRE
TATI
ON
OF
AC
CO
UN
TIN
G R
ATIO
S Note 1: The market price of one share of PX at 31 December 20 � 4 was $ 10.22. Note 2: Earnings per share is calculated as $717m/600m � 1 19.5¢ Note 3: All sales are made on credit Note 4: Purchases on credit in the year were $527 million and trade payables at 31 December 20 � 4 was
$61 million Note 5: The dividend for the year was $400 million.
Performance: profi tability ratios Gross profi t margin:
Gross profitRevenue
� � � �10010871845
100 58 9,,
. %
Operating profi t margin:
Operating profitRevenue
� � � �100890
1845100 48 2
,. %
Net profi t margin
Net profitRevenue
� � � �100717
1845100 38 9
,. %
Performance: activity ratios Asset turnover:
RevenueTotal assets
� �18454 337
0 42,,
.
(This means that for every $1 invested in assets, the business has produced $0.42 in revenue)
Non-current asset turnover:
RevenueNon-current assets
� �18454 002
0 46,,
.
Inventory turnover:
Cost of salesAverage inventory
times
Average inven
� �75842
18
ttoryCost of sales
days� � � �36542
758365 20 2.
(Note that in this case the opening inventory fi gure is not available and we cannot, therefore, calculate an aver-age, so closing inventory has been used.)
Performance: return on capital ratios Return on capital employed:
ProfitCapital employed *
� ��
� �100890
4 337 292100 22
,%
*Capital employed is calculated as issued capital � accumulated profi ts � interest-bearing borrowings � deferredtax provision, that is, total assets less current liabilities. If a breakdown of current liabilities were available, any bank overdraft could also be included.
Return on assets
Operating ProfitTotal assets
� � � �100890
4 337100 20 5
,. %
To demonstrate the relationship with other ratios, return on assets can be broken down as follows: Operating profi t margin � asset turnover � return on assets From the calculations above:
48.2% 0.42 20.5%� �

335FINANCIAL MANAGEMENT
INTERPRETATIO
N O
F AC
CO
UN
TING
RATIOS
Liquidity ratios: short term liquidity Current ratio:
Current assetsCurrent liabilities
� �335292
1 151. :
Quick ratio:
Current assets less inventoryCurrent liabilities
��335 42
292�� 1 01. :
Note that these ratios are usually expressed as shown above, that is, as a fi gure compared to 1. Immediate liquidity ratio:
CashCurrent liabilities
� �113292
0 371. :
Liquidity ratios: the working capital cycle Trade receivables days:
Average receivablesCredit sales
days� � � �365180
1845365 35 6
,.
Trade payables days:
Average payablesCredit purchases
days� � � �36561
527365 42 2.
Note that, because of limited information, closing receivables and payables have been used instead of average fi gures. Working capital cycle:
Inventories days 20.2 � Receivables days 35.6 � Trade payables days (42.2)
13.6
Analysis of capital structure: performance effects Interest cover:
Profit before interest and taxInterest expense
� �890104
8 6. ttimes
Analysis of capital structure: gearing Gearing ratio (debt to equity):
Total long-term debtShareholders’ funds
� � �1002 0221 732
100,,
�� 116 7. %
Debt to total assets ratio:
Total long-term debtTotal assets
� � � �1002 0224 337
100 46 6,,
. %
Investor ratios Price/earnings ratio:
Current market price per shareEarnings per share
�1 022119, ¢
.. ¢.
58 6�
Profi t retention ratio:
Profit after dividendsProfit before dividends
� � �100317717
1000 44 2� . %
Dividend payout rate:
Cash dividend per shareEarnings per share
� � �10066 7
119 5. ¢. ¢
1100 55 8� . %

STUDY MATERIAL F2336
INTE
RPRE
TATI
ON
OF
AC
CO
UN
TIN
G R
ATIO
S Dividend yield:
Dividend per shareMarket price per share
� � �10066 7
1 0221
. ¢, ¢
000 6 5� . %
Dividend cover:
Earnings per shareDividends per share 66.7¢
tim� �119 5
1 79. ¢
. ees
Book value per share
Shareholders’ fundsNo. of equity shares in issue at the ballance sheet date
� �1 732600
2 89,
$ .
14.7 Analysing the cash flow statement The cash fl ow of an entity is regarded by many users as being of primary importance in understanding the operations of the business. After all, a business that cannot generate suf-fi cient cash will, sooner or later, fail. The cash fl ow statement provides valuable informa-tion for the analysis of a business’s operations and position. Students should note that the analysis of cash fl ow statements is examinable in Financial Management.
IAS 7 requires that all entities include a cash fl ow statement as an integral part of the fi nancial statements. Chapter 6 of this Learning System explained in detail how to prepare a cash fl ow statement for a group of companies, and so the techniques of preparation will not be explained further in this chapter. It should be remembered that the IAS 7 cash fl ow statement categorises cash fl ow under three principal headings: cash fl ows from operat-ing activities, investing activities and fi nancing activities. As well as comparing these totals from year to year, various useful ratios can also be calculated. These will be illustrated using the example of a relatively simple, single entity, business operation.
Example 14.D
BC is an entity trading in high specifi cation computer equipment. Its income statement and cash fl ow statement for the year ended 31 March 20 X 6 and its statement of fi nancial position at that date are presented below:
Income statement$’000 $’000
Revenue 896Cost of sales (554)Gross profi t 342Distribution costs 76Administrative expenses 142
(218)Profi t from operations 124Finance cost (3)
121Income tax expense (32)Profi t for the period 89
Note: the dividend for the year was $30,000.

337FINANCIAL MANAGEMENT
INTERPRETATIO
N O
F AC
CO
UN
TING
RATIOS
Statement of fi nancial position$’000 $’000
Assets Non-current assets Property, plant and equipment 174 Current assets Inventories 79 Trade receivables 96 Cash and cash equivalents –
175 Total assets 349
Equity And Liabilities Capital and reserves Issued capital ($1 shares) 40 Retained earnings 165 205 Non-current liabilities Deferred tax 26 Current liabilities (including bank overdraft of $33,000) 118 Total equity and liabilities 349
Statement of cash fl ows $’000 $’000
Cash fl ows from operating activities 124 Adjustments for:
Depreciation 14 Operating profi t before working capital changes 138Increase in inventories (43)Increase in trade receivables (61)Increase in trade payables 41
(63) Cash generated from operations 75Interest paid (3)
Income taxes paid (15) Net cash from operating activities 57
Cash fl ows from investing activities Purchase of property, plant and equipment (94) Proceeds from sale of equipment 4 Net cash used in investing activities (90) Cash fl ows from fi nancing activities Dividends paid (24) Net decrease in cash and cash equivalents (57) Cash and cash equivalents at the beginning of the period 24 Cash and cash equivalents at the end of the period
(33)
Certain important features are evident from only a brief scrutiny. The business started the year with $24,000 in the bank, but ends with an overdraft of $33,000. This is despite generating a positive operating profi t. We can also easily see that there has been a substantial investment in working capital, fi nanced partly by an increase in trade payables. Equally, it is clear that the business has made a large investment in property, plant and equip-ment, although it has not obtained long-term fi nancing for this.
Useful ratios which can be calculated include the following:
Return on capital employed: cash
Cash generated from operationsCapital employed
�
�
100
75205 26 ��
� �33
100 28 4. %

STUDY MATERIAL F2338
INTE
RPRE
TATI
ON
OF
AC
CO
UN
TIN
G R
ATIO
S Note that the overdraft is included as part of capital employed in this calculation. Also, the deferred tax provi-sion is included. We could also include the current tax provision, but it is not identifi ed in the information given. For many external users, cash is a more signifi cant indicator than profi t, and this ratio should be calculated where the information is available.
Cash generated from operations to total debt
Cash generated from operationsTotal long-term borrowings
This gives on indication of an entity’s ability to meet its long-term obligations. The inverse ratio can also be calculated:
Total long-term borrowingsCash generated from operations
This provides an indication of how many years it would take to repay the long-term borrowings if all of the cash generated from operations were to be used for this purpose.
We cannot calculate these ratios for BC because the business has no long-term borrowings.
Net cash from operating activities to capital expenditure This is calculated as follows:
Net cash from operating activitiesNet capital expenditure
�1100
In the case of BC:
5790
100 63 3� � . %
This gives some idea of the extent to which the business can fi nance its capital expenditure out of cash fl ows from operating activities. If it cannot meet its capital expenditure from this source, then some kind of longer-term fi nancing is likely to be required. However, this ratio could be misleading unless calculated and compared for several years. In the case of BC the current level of capital expenditure may not be typical. The business appears to be expanding fast (judging by the greatly increased levels of investment in working capital), and it may be that levels of operating profi t and cash fl ow have yet to catch up with the investment.
14.8 Using ratios in the exam When answering a Financial Management question it is important to be able to calculate ratios with a fair degree of accuracy from the information provided. However, students should bear in mind the following points:
● Only a proportion of the marks will be awarded for calculation, and this proportion may be relatively small. Generally, the majority of the marks will be awarded for the analysis and interpretation of data given in the question. Therefore, it is important not to get too absorbed in the calculations themselves; they are a means to an end. This chapter has been an introduction to the calculations; the next following two chapters will provide much more detailed guidance as to the interpretation and analysis of fi nan-cial statements.
● Where a question asks for calculation of, say, ‘ relevant ratios ’ , it is best to be fairly selec-tive. Calculating the full range of ratios, as given in this chapter, may be inappropriate for the circumstances of the question. Time can be wasted in calculating ratios that are really not very useful.

339FINANCIAL MANAGEMENT
INTERPRETATIO
N O
F AC
CO
UN
TING
RATIOS
● Some ratios may be of limited use, or may even be misleading in the context of service businesses. For example, care should be taken in respect of return on capital ratios in businesses with a low level of conventional non-current assets but a high level of unrec-ognised intellectual capital ‘ assets ’ .
● It is usually appropriate to round to no more than one or two decimal places.
Exam candidates should always read recent Post-Examination Guides (PEGs). The anal-ysis learning outcomes for F2 are similar to those of its predecessor, P8 and so many of the comments about the analysis and interpretation of fi nancial statement are valid. The PEG following the November 2006 examination made the following comments about analysis and interpretation questions:
While the general standard of analysis and interpretation has tended to improve since the fi rst sitting of the Paper 8, many candidates produce very poor answers. One of the markers submitted the following com-ment: ‘ Some candidates displayed an inability to calculate basic ratios. The problem with ROCE persists but asset turnover was also a problem. They appear to have a lack of understanding of what they are trying to do and seem to calculate and interpret on a formulaic approach rather than demonstrating that they can apply ratio analysis as a useful tool. They do not appear to really understand what ratios can tell them and what they cannot. There seems to be a rote-learning approach as opposed to full understanding of the uses and limitations of ratio analysis. ’
Please note and act upon the above!
14.9 Summary This chapter has examined part of one learning outcome: to interpret a full range of accounting ratios. In order to interpret ratios we must appreciate how they are calcu-lated and understand the fi gures behind the ratios and what the ratios can tell us about the business activities. More detailed analysis is developed in the forthcoming chapters. Calculation of accounting ratios is a key analytic toll, but it is just a means to an end. The important part is to be able to analyse the information and draw conclusions about the entity’s performance and position.

This page intentionally left blank

341
Revision Questions 14The fi rst two questions are not of exam standard, they are included so as to allow students to practice the calculations of ratios. The calculation of ratios is usually an integral part of a question requiring interpretation of fi nancial statements (covered in more depth in the next chapter). The third question is of exam standard and can be answered using the knowledge gained from studying this chapter.
Question 1 The following balances were extracted from the books of B, a listed entity, at 30 April 20X8:
$m Sales (all on credit) 300 Cost of sales 200 Gross profi t 100 Closing inventory 15 Trade receivables 36 Trade payables 28
(a) Calculate the receivables days for B for the year ended 30 April 20X8. (b) Calculate the working capital cycle for B for the year ended 30 April 20X8.
Tutorial note: a fi gure for purchases is not available, so use cost of sales instead. This gives a less reliable result, but in practice, a purchases fi gure is often not disclosed. B has 100,000,000 issued ordinary shares with a par value of 20¢ each. There were no movements of issued share capital during the year. B had the following results for the year ended 30 April 20X8:
$m Profi t before tax 50 Income tax expense 10 Profi t for the year 40
The dividend for the year was $20 million The quoted price of B shares on 30 April 20X8 was $1.50.
(c) Calculate the P/E ratio of B at 30 April 20X8.
(5 marks)

INTE
RPRE
TATI
ON
OF
AC
CO
UN
TIN
G R
ATIO
S
REVISION QUESTIONS F2342
Question 2 The income statement, statement of changes in equity and cash fl ow statement for DE for the year ended 31 March 20 X 2 and its statement of fi nancial position at that date are given below:
Income statement$’000 $’000
Revenue 3,920Cost of sales (2,743)Gross profi t 1,177Distribution costs (184)Administrative expenses (308)
(492)Profi t from operations 685Income from investments 31Finance cost (191)
(160)Profi t before tax 525Income tax expense (110)
415
Summarised statement of changes in equity$’000
Equity at start of year 1,586Revaluation 989Profi t for the period 415Dividends paid (320)Share issue 1,575Equity at end of year 4,245
Statement of fi nancial position$’000 $’000
AssetsNon-current assetsIntangible assets 550Tangible assets 3,260Investments 400
4,210Current assetsInventories 515Trade receivables 1,000Investments 315Bank 650
2,480Total assets 6,690
Equity And Liabilities Capital and reserves Issued capital ($1 shares) 325 Share premium 2,300 Revaluation reserve 1,339 Retained earnings 281 4,245 Non-current liabilities 10% loan notes 2003/2006 251

INTERPRETATIO
N O
F AC
CO
UN
TING
RATIOS
343FINANCIAL MANAGEMENT
Note 1. all sales are on credit; 2. purchases for the year were $2,555,000; 3. earnings per share for the year is 180¢; 4. the current market price of one share at 31 March 20X 2 is $15.76; 5. dividend per share is 98.5¢.
Requirement Calculate as many accounting ratios as possible from the information provided.
Question 3 BSP, a listed entity, supplies, installs and maintains burglar alarm systems for business clients. As a response to increased competition and falling margins in the burglar alarm market, the entity’s directors decided, towards the end of 20X5, to extend its operations
Current liabilities Trade payables 784 Other payables 460 Bank loans and overdrafts 950
2,194 Total equity and liabilities 6,690
Cash fl ow statement $’000 $’000
Cash fl ows from operating activities Profi t from operations 685 Adjustments for: Depreciation 480 Operating profi t before working capital changes 1,165 Increase in inventories (155) Increase in trade receivables (50) Increase in trade and other payables 158
(47) Cash generated from operations 1,118 Interest paid (191) Income taxes paid (71) Net cash from operating activities 856
Cash fl ows from investing activities Purchase of non-current assets and investment (1,556) Interest received 31 Net cash used in investing activities (1,525)
Cash fl ows from fi nancing activities Proceeds from issuance of share capital 1,575 Repayment of long-term borrowings (728) Dividends paid (320)
527 Net decrease in cash and cash equivalents (142) Cash and cash equivalents at the beginning of the period
(158)
Cash and cash equivalents at the end of the period
(300)

INTE
RPRE
TATI
ON
OF
AC
CO
UN
TIN
G R
ATIO
S
REVISION QUESTIONS F2344
into the provision of fi re alarm and sprinkler systems. A training programme for staff was undertaken in the early months of 20X6 at a cost of around $200,000. An aggressive marketing campaign, costing $250,000, was launched at the same time. Both costs were incurred and settled before the 31 March 20X6 year end. BSP commenced its new opera-tion with effect from the beginning of its fi nancial year on 1 April 20 X 6.
BSP’s cash resources were at a low level in early 20 X 6, so, in order to fi nance the costs of the new operation and the necessary increase in working capital to fund the new opera-tions, BSP made a new issue of shares. The issue took place in May 20 X 6. During March 20 X 7, BSP disposed of its two overseas subsidiaries in order to concentrate on operations in its home market. Both were profi table businesses and therefore sold for an amount sub-stantially in excess of carrying value. Therese subsidiaries accounted for almost 10% of group sales during the 20X 6/20X 7 fi nancial year.
As the fi nance director’s assistant you have been responsible for the preparation of the draft fi nancial statements, which have been circulated to the directors in advance of a board meeting to be held later this week.
The marketing director, who as appointed in June 20 X 6, has sent you the following e-mail:
‘ When I did my university course in marketing I studied a module in fi nance and accounting, which covered the analysis of fi nancial statements. Unfortunately, it was a long time ago, and I’ve forgotten quite a lot about it.
I’m puzzled by the statement of cash fl ows, in particular. The income statement shows a loss, which is obvi-ously bad news, especially as the budget showed a profi t for the year. However, the cash resources of the busi-ness have actually increased by quite a large amount between March 20X6 and March 20X7. It is said that “ cash is king ” , So I’m assuming that the poor profi tability is a short-term problem while the new operation settles down.
As you know, we almost managed to achieve our sales targets in both the fi re and burglar alarm sectors for the year, (although of course we did have to offer some customers special discounts and extended credit as inducements). I’m assuming, therefore, that the lack of profi tability is a problem of cost control.
It would be really helpful if you could provide me with a brief report, in advance of this week’s meeting, which tells me what this statement of cash fl ows means. You could include ratios, provided that you show how they are calculated. ’
The consolidated statement of cash fl ows for the year ended 31 March 20X7 (with com-parative fi gures for 20X6) is as follows:
BSP: Consolidated statement of cash fl ows for the year ended 31 March 20X7
20X7 20X7 20X6 20X6 $000 $000 $000 $000
Cash fl ows from operating activities (Loss)/profi t before tax (453) 306 Adjustments for: Depreciation 98 75 Foreign exchange loss 22 37 Profi t on sale of investments (667) – Interest expense 161 45 (839) 463 Increase in inventories (227) (65) Increase in receivables (242) (36) Increase in payables 62 12 Cash (outfl ow)/infl ow from operations (1,246) 374 Interest paid (157) (42)

INTERPRETATIO
N O
F AC
CO
UN
TING
RATIOS
345FINANCIAL MANAGEMENT
Tax paid (38) (55) Net cash (outfl ow)/infl ow from operating activities (1,441) 277 Cash fl ows from investing activities Proceeds from sale of investments 2,320 – Purchase of property, plant and equipment (661) (425) Income from associates 23 26 Net cash infl ow/(outfl ow) from fi nancing activities 1,682 (399) Cash fl ows from fi nancing activities Proceeds from issue of share capital 850 – Dividends paid – (200) Net cash infl ow/(outfl ow) from fi nancing activities 850 (200) Net increase/(decrease) in cash 1,091 (322) Cash at start of period 27 349 Cash at end of period 1,118 27
Additional information: Revenue in the 20X 5/X6 fi nancial year was $12.11 million. In the 20 X 6/X7 fi nancial year, total revenue was $12.32 million, $10.93 million of which arose in respect of the sale of burglar alarms.
Inventories at the start of the 20X 5/X6 fi nancial year were $591,000, and receivables were $1,578,000. There was no increase in long-term borrowings throughout the two year period covered by the cash fl ow statement above.
Requirement Analyse and interpret the information given, and produce a report to the marketing direc-tor. The report should explain the difference between cash and profi t, and should discuss the business’s profi tability and working capital position. It should also discuss, to the extent possible from the information given, the prospects for BSP’s future. (25 marks)

This page intentionally left blank

347
Solutions to Revision Questions
Solution 1
(a) Trade receivables
Sales days� � � �365
36
300365 43 8.
(b) Working capital cycle:
Trade receivables
Sales days� � � �365
36
300365 43 8.
Trade payables
Cost of sales days� � � �365
28
200365 51 1( . )
Inventory
Cost of sales days� � � �365
15
200365 27 4.
Working capital cycle 20.1 days
(c) Earnings per shareprofit for the year available to ordina
�rry shareholders
number of ordinary shares in issue$
�40 000, ,,
, ,¢
¢
¢.
000
100 000 00040
150
403 75
= per share
P/E ratio is � �
Solution 2 Performance: profi tability ratios Gross profi t margin:
Gross profit
Revenue� � � �100
1 177
3 920100 30
,
,%
14

INTE
RPRE
TATI
ON
OF
AC
CO
UN
TIN
G R
ATIO
S
SOLUTIONS TO REVISION QUESTIONS F2348
Operating profi t margin:
Operating profit
Revenue� � � �100
685
3 920100 17 5
,. %
Net profi t margin:
Net profit
Revenue� � � �100
415
3 920100 10 6
,. %
Performance: activity ratios Asset turnover:
Revenue
Total assets� �
3 920
6 6900 59
,
,.
Non-current asset turnover:
Revenue
Non-current assets� �
3 920
4 2100 93
,
,.
Inventory turnover: Note that in this case it is possible to derive opening inventory by using information in the cash fl ow statement. Closing inventory was $515,000, an increase of $155,000 over the previous year end. Opening inventory was, therefore, $360,000, so the average fi gure for the year is:
$ , ,$ ,
515 000 360 000
2437 500
2
��
�Cost of sales
Average inventory
,,
..
743
437 56 3
365437
�
� �
times
Average inventory
Cost of sales
..
,.
5
2 743365 58 2× � days
Performance: return on capital ratios Return on capital employed:
Profit
Capital employed*� �
� �� �100
685
4 245 251 950100 12 5
,. %
* Capital employed is calculated as issued capital � retained earnings � interest-bearing borrowings � overdraft. Return on assets:
Operating Profit
Total assets� � �100
685
6 690100 10 2
,. %=
Liquidity ratios: short term liquidity Current ratio:
Current assets
Current liabilities:� �
2 480
2 1941 131
,
,.

INTERPRETATIO
N O
F AC
CO
UN
TING
RATIOS
349FINANCIAL MANAGEMENT
Quick ratio:
Current assets less inventory
Current liabilities�
�2 480 515,
22 1940 901
,.� :
Liquidity ratios: the working capital cycle Trade receivables days: As for inventory, we can calculate an opening fi gure for receivables, so it is possible to work out average receivables. Opening receivables was: $1,000,000 � 50,000 � 950,000. The average for the year is $975,000.
Average receivables
Credit sales days� � � �365
975
3 920365 90 8
,.
Trade payables days:
Closing trade payables
Credit sales da� � � �365
784
2 555365 112
,yys
Working capital cycle:
Inventories days 58.2 � Receivables days 90.8 � Trade payables days (112.0)
37.0
Analysis of capital structure: performance effects Interest cover:
Profit before interest and tax
Interest expense�
��
685 31
1913..75 times
Analysis of capital structure: statement of fi nancial position gearing Gearing ratio:
Total long-term debt
Shareholders’ funds� � � �100
251
4 245100 5
,.. %9
Debt to total assets ratio:
Total long-term debt
Total assets� � � �100
251
6 690100 3 7
,. %
Investor ratios Price/earnings ratio:
Current market price per share
Earnings per share�
1576
180
, ¢
¢¢.� 8 7
Profi t retention ratio:
Profit after dividends
Profit before dividends� �
�100
415 320
4115100 22 9� � . %

INTE
RPRE
TATI
ON
OF
AC
CO
UN
TIN
G R
ATIO
S
SOLUTIONS TO REVISION QUESTIONS F2350
Dividend payout rate:
Cash dividend per share
Earnings per share� � �100
98 5
18010
. ¢
¢00 54 7� . %
Dividend yield:
Dividend per share
Market price per share� � �100
98 5
15761
. ¢
, ¢000 6 3� . %
Dividend cover:
Earnings per share
Dividends per share times� �
180
98 51 82
¢
. ¢.
Statement of fi nancial position ratio: book value per share
Shareholders’ funds
No. of equity shares in issue at the ballance sheet date� �
4 245
32513 06
,$ .
Return on capital employed: cash
Cash generated from operations
Capital employed� �100
1118
5
,
,4446100 20 5
*� � . %
* Same as used in the ROCE calculation earlier.
Cash generated from operations to total debt
Cash generated from operations
Total debt� �
1118
2514 5
,.
Net cash from operating activities to capital expenditure:
Net cash from operating activities
Net capital expenditure� 1100
856
1 556100 55� � �
,%
Solution 3 To: Marketing Director of BSP
From: Assistant to Finance Director
Report on draft statement of cash flows for the financial year ended 31 March 20X7
Note: The appendix to this report contains some ratio and other relevant calculations.

INTERPRETATIO
N O
F AC
CO
UN
TING
RATIOS
351FINANCIAL MANAGEMENT
1. The difference between cash and profit Because of the use of the accruals basis in fi nancial accounting, it is often the case that profi t or loss differs signifi cantly from the cash fl ows arising during an accounting period. This is not necessarily a problem, unless signifi cant cash shortages affect the viability of the business, but it does mean that the statement of cash fl ows should be interpreted with some caution. An apparently healthy cash balance can disguise underlying problems.
In the case of BSP’s statement of cash fl ows, there is, indeed, a signifi cant amount of cash at 31 March 20X7. However, upon closer examination, it can be seen that the cash infl ows have arisen from investing and fi nancing activities, rather than from operating activities which produced negative cash fl ows. A total of $3,170,000 (i.e. $2,320,000 from the sale of the subsidiaries and $850,000 from the issue of share capital) was received in cash during the year. While some of this (approximately one-third) remained in the state-ment of fi nancial position at 31 March 20X7, most of it had been absorbed by the major cash outfl ow from operations and the acquisition of property, plant and equipment.
2. Profit and loss BSP’s profi t before tax has declined sharply between 20X6 and 20X7. The decline is even more marked if unusual items are taken into account. Towards the end of the 20X6 fi nan-cial year, the business incurred $450,000 in costs of training and marketing associated with the new product line. Profi t before these items was $756,000. The loss before tax in the year ended 31 March 20X7 was mitigated substantially by the profi t on disposal of the foreign subsidiaries. If this profi t is excluded, the loss from operations is $1,120,000. Using these adjusted fi gures, net profi tability (measured on a pre-tax basis) was 6.2% in the 20 X 6 fi nancial year, whereas the loss in 20X7 represented 9.1% of revenue.
1. Working capital The operating section of the statement of cash fl ows includes adjustments for increases and decreases in working capital. Both inventories and receivables increased by a substantial amount in the year ended 31 March 20X7. Inventories increased by 10.9% in 20X6 and by 34.6% in 20X7. Some increase in inventories is consistent with the move into a new area of operations, but the increase of 34.6% does appear very high.
Receivables have also increased substantially, by 15% between 20X6 and 20X7. The over-all revenue fi gure has increased very little. The receivables fi gure at 31 March 20X7 does not include any amounts relating to the two subsidiaries disposed of. The revenue fi gure for the year has therefore been reduced to 90% of the total, to exclude the revenues relating to these subsidiaries. Using these two fi gures, receivables days at the year end is approximately 61 days. Receivables days at the previous year end was about 49 days. (It should be noted that these two fi gures are not directly comparable because the 20X 6 revenue and receivables fi gures include the two subsidiaries.) The policy of offering extended credit as an inducement to cus-tomers may very well have paid off in terms of additional sales, but there are some drawbacks.
Compared to inventories and receivables, the movements in the 2 years in payables are relatively minor. In both 20X6 and 20X7 there are increases which offset the outfl ows on other working capital items.
2. Prospects for the future Although sales targets for the 20X7 fi nancial year were almost met, the decline in profi t-ability does, as you suggest, indicate that there is a problem in controlling costs. However,

INTE
RPRE
TATI
ON
OF
AC
CO
UN
TIN
G R
ATIO
S
SOLUTIONS TO REVISION QUESTIONS F2352
it cannot necessarily be assumed that this is a short-term problem while the new opera-tion settles down; careful cost control will be required if the business, overall, is to return to profi tability. Offering discounts in order to attract new business may be effective in increasing revenue, but this practice tends to reduce profi tability.
Because the sale of the subsidiaries took place so recently, the revenue fi gures for 20X7 are not affected. However, these two subsidiaries have accounted for around 10% of the sales, and have been consistently profi table. Therefore, unless there is an improvement in sales and profi tability in the remaining group businesses, the 20X8 performance is likely to be even worse than in 20X7. The effect may be mitigated to some extent by lower interest charges. These rose substantially in 20X7, compared to 20X6, but the large cash balance in hand at the beginning of the new fi nancial year should ensure that, for some months at least, there will be no short-term borrowings and hence, no interest payments.
The breakdown of the revenue fi gure shows that there has been a sharp decline in the sales relating to burglar alarms; sales in 20X7 were only 90.3% of sales in 20X6. The short-fall has been made up by sales of fi re alarm systems, which tends to justify the change in business strategy. However, if tough conditions continue in the burglar alarm market, rev-enues from this source may continue to fall.
A fi nal point relates to dividend. A dividend of $200,000 was paid in the 20X6 fi nancial year, but there was no dividend in 20X7. Shareholders made a substantial contribution in the form of new capital in 20X7; while they may be content to wait for a return while the new line of business is getting established, they may become impatient if no dividend is forthcoming in 20X8.
3. Conclusion In conclusion, the statement of cash fl ows serves to emphasise some worrying trends in the business. The cash balance available at 31 March 20X7 will rapidly disappear unless the losses can be reversed. Working capital management and cost control must be improved. This statement of cash fl ows shows the more positive side of disposing of two profi table subsidiaries; the negative aspects are likely to make an impact on the 20X8 and subsequent statement of cash fl ows.
APPENDIX: Calculations 1. (Loss)/profit before tax as a percentage of revenue
20X7 20X6 (453)/12,320 � 100 � (3.7%) 306/12,110 � 100 � 2.5%
2. (Loss)/profit before tax as a percentage of revenue – after adjustment for unusual items
20X6: calculate profi t before deduction of unusual items: $306 � 200 � 250 � $756 20 X 7: calculate loss before setting off profi t on disposal of subsidiaries: $(453) � (667) � (1,120)
20X7 20X6 (1,120)/12,320 � 100 � (9.1%) 756/12,110 � 100 � 6.2%

INTERPRETATIO
N O
F AC
CO
UN
TING
RATIOS
353FINANCIAL MANAGEMENT
3. Inventory movement
$ Increase year on year % At 1 April 20 X 5 591,000 At 31 March 20X 6 (591 � 65) 656,000 10.9% At 31 March 20X 7 (656 � 227) 883,000 34.6%
4. Receivables movement
$ Increase year on year % At 1 April 20X5 1,578,000 At 31 March 20X6 (1,578 � 36) 1,614,000 2.3% At 31 March 20 X 7 (1,614 � 242) 1,856,000 15%
Receivables days (using year end fi gures):
20X7 20X6 1,856/(12,320 � 90%) � 365 � 61.1 days 1,614/12,110 � 365 � 48.6 days

This page intentionally left blank

15
Earnings Per Share

This page intentionally left blank

357
15
15.1 Introduction This chapter is devoted to the study of a single accounting ratio. This may at fi rst seem a little odd, given that a very large number of accounting ratios were covered in Chapter 14. However, earnings per share is regarded as particularly important. Investors and others who are looking for headline measurements of a entity’s performance will often look fi rst (and perhaps last) to the eps fi gure. It has additional signifi cance in that it forms the denominator of the price/earnings ratio, a measurement that is regarded as being of great signifi cance for listed entities.
The status accorded to earnings per share leads to it being dealt with as a special case in accounting standards. There are no regulations about the calculation of any of the other accounting ratios. Earnings per share, on the other hand, has its own accounting standard (IAS 33) which sets out rules relating to its consistent calculation and presentation.
This chapter covers the following areas:
Section 15.2: IAS 33 Earnings per share – some basic defi nitions. Section 15.3: Basic earnings per share, including adjustments for changes in number
of shares in issue during the year (rights issues and bonus issues). Section 15.4: Diluted earnings per share, including adjustments in respect of con-
vertible fi nancial instruments, share warrants and options, and dilutive potential ordinary shares.
Earnings Per Share
LEARNING OUTCOME After studying this chapter students should be able to:
� interpret a full range of accounting ratios.
This chapter completes the work begun in Chapter 14 on how to calculate accounting ratios.

STUDY MATERIAL F2358
EARN
ING
S PE
R SH
ARE 15.2 IAS 33 Earnings per share
The EPS of an entity whose shares are publicly traded is regarded as a very important measure of performance. It is therefore important that EPS should be reported on a stand-ard basis for all relevant companies. IAS 33 lays down clear and generally accepted defi ni-tions and procedures for calculating EPS and applies to all entities whose ordinary shares or potential ordinary shares are publicly traded. The basic principle of EPS is to obtain a consistent and comparable ratio for measuring earnings.
Definitions
Net profi t attributable to ordinary shareholders. Consolidated profi t or loss for the year after tax, minority interests and appropriations in respect of non-
equity shares. The shares of net profi t of associates and joint ventures are included.
Weighted average number of ordinary shares. IAS 33 defi nes an ordinary share thus: ‘ An ordinary share is an equity instrument that is subordinate to all other
classes of equity instruments. ’ The weighted average number of ordinary shares refl ects the issues and repurchases of shares during the year. The weighting of the average is on a time basis.
Example 15.A
A’s year end is 31 December. The following transactions in shares took place during the year ended 31 December 20X1:
1 January ordinary shares in issue 1,000,000 1 April 100,000 shares issued 100,000 1 May 200,000 shares issued 200,000 1 Dec 10,000 shares repurchased (10,000) As at 31 December 1,290,000
The weighted average number of shares is:
1 Jan–31 Mar: 1,000,000 � 3/12 250,000 1 April–30 Apr: 1,100,000 � 1/12 91,667 1 May–30 Nov: 1,300,000 � 7/12 758,333 1 Dec–31 Dec: 1,290,000 � 1/12 107,500 Weighted average number of shares 1,207,500
Shares are included in the weighted average number of shares from the date the consideration is receivable:
● when cash is receivable, where shares are issued in exchange for cash; ● at the date of payment of dividend, when dividends are reinvested as shares; ● when interest ceases to accrue, for convertible debt and other fi nancial instruments; ● at the date of acquisition, when shares are issued for consideration in the acquisition of another entity.

359FINANCIAL MANAGEMENT
EARN
ING
S PER SHA
RE 15.3 Basic earnings per share EPS can be a relatively straightforward ratio to calculate. However here are some complica-tions that may arise in practice.
Problems in arriving at the number of equity shares in issue Arriving at the number of equity shares in issue can present a problem if there is an issue of shares during the year.
The following situations may arise:
● issue at full market price; ● bonus issue (also known as capitalisation issue or scrip issue); ● share exchange; ● rights issue.
The key to understanding the calculations is to assess whether the change in share capi-tal has increased the earnings potential of the entity.
15.3.1 Issue at full market price Where there is an issue at full market price, cash or other assets will fl ow into the entity – these will then generate earnings. In order to refl ect this in the calculations, the earnings are appor-tioned over the average number of shares in issue and ranking for dividend during the period weighted on a time basis.
Example 15.B
A had four million ordinary shares in issue and ranking for dividend at 1 January 20X1. On 30 September, one million further shares were issued. Earnings for the year ended 31 December 20X1 were $500,000.
The number of shares would be time apportioned as follows:
1 Jan–30 Sep: 4,000,000 � 9/12 3,000,000 30 Sept–31 Dec: 5,000,000 � 3/12 1,250,000 Weighted average number of shares 4,250,000
Earnings per share are 500,000/4,250,000 11.8¢
15.3.2 Bonus issue In a bonus issue, no fresh capital enters the business and no further earnings are generated. The effect is merely to revise the number of shares in issue. We therefore use the number of shares ranking for dividend after the bonus issue. This can be done by multiplying the original share capital by the bonus factor. If the bonus issue is a 1 for 4, the bonus factor is 5/4. This is irrespective of the date when the bonus issue was made.
The corresponding fi gures for all earlier periods are recalculated to include the bonus issue. This can be done by multiplying the corresponding EPS by the reciprocal of the bonus factor.
STUDY MATERIAL F2360
EARN
ING
S PE
R SH
ARE
Example 15.C
B has four million ordinary shares in issue at 1 January 20X1. On 30 September the entity made a bonus issue of 1 for 4. Earnings for the year ended 31 December 20X1 were $500,000. The EPS for 20X0 was 9 cents per share.
The number of shares would be:
400000054
5000 000
5000005000000
10
, , , ,
,, ,
¢
� �
�EPS would be per share
The EPS for the previous year’s comparative is restated using the bonus fraction:
20 0 945
7 2X EPS per share� � �¢ . ¢
Share exchange Where shares (ranking for dividend) or loan stock have been issued during the year in con-sideration for shares in a new subsidiary, they are included in the weighting calculation as of the date on which the acquisition is recognised.
In the calculation of EPS, this is treated as an issue at full market price.
15.3.3 Rights issue A rights issue is an issue to existing shareholders, made at a price below current market price, to encourage shareholders to take up the shares. Cash is received into the entity to generate income, but not as much as an issue at full market price. Therefore a rights issue is a combination of an issue at full market price and a bonus issue.
The calculation will have to refl ect the bonus element of the rights issue; this is done by calculating the bonus fraction as follows:
Bonus fractionFair value before the exercise of rights
The�
ooretical ex-rights price
The numerator of the bonus fraction can be obtained from the share prices or is given in the examination question. The denominator is calculated as the theoretical value of the shares after the issue.
The bonus fraction is applied, as with a bonus issue, to all periods and will affect the number of shares prior to the issue and the corresponding year’s EPS.
The other element of the rights issue, the issue at full market price, is refl ected by calcu-lating the weighted average number of shares on a time basis.
Example 15.D
C had four million ordinary shares in issue and ranking for dividend at 1 January 20X1. On 30 September, a rights issue of 1 for 4 at 50 cents per share was made. The market price of the shares prior to the issue was $ 1 per share. Earnings for the year ended 31 December 20X1 were $500,000. The EPS for 20X0 was 9 cents per share.
1. Calculate the price of the shares after the rights issue, the theoretical ex-rights price*:
$ If a shareholder had four shares at $1 per share � 4.00 They would be entitled to a further one share at 50¢ per share � 0.50 Holding after the rights issue fi ve shares (at 90¢) 4.50

361FINANCIAL MANAGEMENT
EARN
ING
S PER SHA
RE * Note: This ex-rights price is theoretical. It may not be (and probably will not be) the same as the market price
of the shares immediately after the rights issue. 2. The bonus fraction would be:
Bonus fractionFair value before the exercise of rights
The�
ooretical ex-rights price
3. Calculate the weighted average number of shares:
1 Jan–30 Sep: (4,000,000 � 100/90) � 9/12 3,333,333 30 Sept–31 Dec: 5,000,000 � 3/12 1,250,000 Weighted average number of shares 4,583,333
4. Calculate EPS:
5000004583333
10 9,
, ,. ¢�
5. The EPS for the prior year comparative is restated using the inverse of the bonus fraction:
20 0 99
108 1X EPS per share� � �¢ . ¢
15.3.4 Other relevant points Changes in ordinary shares without any corresponding changes in resources The bonus issue example discussed above required that the ratio refl ects a change in ordi-nary shares; the increase is due to the bonus, while profi ts are not affected as no new resources were introduced into the entity following the issue. Therefore the EPS ratio is amended for all periods disclosed in the fi nancial statements.
Another example is the scrip dividend. A entity may offer to its shareholders the choice of receiving further fully paid-up shares in the entity as an alternative to receiving a cash dividend.
One interpretation is that the dividend forgone represents payment for the shares. This would mean that there is a change in resources and so no restatement of previous periods is necessary.
Alternatively, it may be interpreted that the market value of the shares received is greater than the dividend value. In this instance a bonus element is identifi ed and should be applied to prior periods. This is then like a rights issue.
Special dividends An entity may declare a special dividend (usually very large) and will then consolidate its ordinary shares.
The two transactions need to be viewed as a whole. The consolidation of shares will reduce the number of shares. In this case there is an outfl ow of resources, being the special dividend, which indicates that prior periods need not be affected. There is no bonus ele-ment to be calculated and applied to prior periods.
Example 15.E
N’s reported earnings for the year ended 31 March 20X4 were $3 million. On 1 December 20X3 the directors decided to declare a special dividend of $ 1,500,000. The 1,000,000 $1 ordinary shares would be consoli-dated on a 2:1 basis. One new share would be issued for every two old shares held. The basic earnings per share for the year ended 31 March 20X3 was 200 cents per share.
Calculate the basic earnings per share year ended 31 March 20X4 with comparatives.

STUDY MATERIAL F2362
EARN
ING
S PE
R SH
ARE Solution
The reduction in shares is compensated by the special dividend. There is an outfl ow of resources from N and so the EPS is calculated using a weighted average number of shares and the comparative is not affected.
1 April 20X3 to 30 November 20X3 1,000,000 � 8/12 666,667 1 December 20X3 to 31 March 20X4 500,000 � 4/12 166,667 Total weighted average number of shares 833,334
20X4 Basic EPS (3m/833,334) 360¢20X3 Basic EPS no change 200¢
15.4 Diluted earnings per share An entity may have in issue at the year end date a number of fi nancial instruments that give rights to ordinary shares at a future date. These are referred to as potential ordinary shares in IAS 33. Examples of potential ordinary shares are:
● convertible debt or equity instruments; ● share warrants and options; ● rights granted under employee share schemes; ● contingently issuable shares, where the ordinary shares are issued upon completion of
some contractual agreement.
When the obligations are realised the number of ordinary shares will increase, therefore low-ering the earnings per share. This is said to have a potential dilutive effect on EPS. Earnings can be affected in some cases and the diluted EPS is calculated using an adjusted profi ts fi gure.
In order that users are informed of the potential ‘ dilution ’ of their earnings, IAS 33 requires that a diluted EPS is calculated.
The diluted EPS ratio is:
Earnings per basic EPS Adustment for dilutive potential or� ddinary shares
Number of shares per basic EPS Adjustment fo� rr dilutive potential ordinary shares
Potential ordinary shares are deemed to be converted to ordinary shares at the start of the period. Where the potential ordinary shares are issued during the period, they are taken from the date of issue of the fi nancial instrument.
We shall look at the effect of each type of fi nancial instrument. It is included in the diluted EPS only if the effect of the conversion to ordinary shares is dilutive. Dilution is where the conversion decreases EPS or increases the loss per share.
15.4.1 Convertible financial instruments Where an entity has in issue at the year end date convertible loan stock or convertible preference shares they will affect the ratio as follows:
● Profi ts – There will be a saving of interest. Interest is a tax-deductible expense and so the post-
tax effects will be brought into the adjusted profi ts. – There will be a saving of preference dividend. There are no associated tax effects here.
● The number of shares will increase . Where there is a choice of dates for conversion, IAS 33 assumes the most advantageous conversion rate or exercise price from the standpoint of the holder that is still available.

363FINANCIAL MANAGEMENT
EARN
ING
S PER SHA
RE
Example 15.F
Throughout the year ended 31 December 20X3 A had in issue $2,000,000 10% convertible loan stock. The terms of conversion for every $100 of loan stock are as follows:
31 December 20X3 122 ordinary shares 31 December 20X4 120 ordinary shares 31 December 20X5 110 ordinary shares
Profi ts attributable to ordinary shareholders for the year amounted to $25,000,000. The weighted average number of shares in issue during the year was 100,000,000. A paid tax at 33%.
1. Adjust profi ts.
$ $Earnings 25,000,000 Add net interest saved
Interest (2m � 10%) 200,000 Taxation (200,000 � 33%) (66,000)
134,000 Fully diluted earnings 25,134,000
2. Adjust number of shares. The maximum number of shares that convertible loan stockholders could take up is 120 on 31 December 20X4. The 122 ordinary shares available at 31 December 20X3 would have already been taken up and so the next available time is the following year (120 shares available).
Weighted average number of shares in issue 100,000,000 Dilution (2,000,000 � 120/100) 2,400,000 Fully diluted number of shares 102,400,000
Fully diluted EPS 24.5¢
15.4.2 Share warrants and options A share option or warrant gives the holder the right to purchase or subscribe for ordinary shares. This would involve an infl ow of resources or monies into the entity and so poten-tially can increase profi ts. For the purpose of computing diluted EPS, IAS 33 requires that the assumed proceeds from these shares should be considered to have been received from the issue of shares at fair value. The difference between the number of shares that would have been issued at fair value and the number of shares actually issued is treated as an issue of ordinary shares for no consideration.
Example 15.G
B has in issue options to subscribe for 1,000,000 $1 ordinary shares at $4 per share. The average fair value of one share during the year was $6 per share.
Profi ts attributable to ordinary shareholders amounted to $25,000,000. The weighted average number of shares in issue during the year was 100,000,000.

STUDY MATERIAL F2364
EARN
ING
S PE
R SH
ARE When the transaction is analysed carefully there are two elements to the issue of options:
1. an amount of shares at fair market value; 2. the remainder for no consideration.
Basic EPS � 25,000,000 � 100,000,000 � 25¢
Diluted EPS: Increase in number of shares 1,000,000
Number of shares that would have been issued at fair value (1,000,000 � $4) � $6 (666,667)
Shares issued for no consideration 333,333
Diluted EPS � 25,000,000 � (100,000,000 � 333,333) � 24.9¢
15.4.3 Dilutive potential ordinary shares It is, of course, possible that potential ordinary shares as above could increase EPS. IAS 33 requires that the fully diluted EPS is adjusted only for those instruments that cause a dilu-tive effect, that is, they decrease EPS or increase loss per share.
IAS 33 requires that the calculation for the inclusion of potential ordinary shares is done by reference to net profi t from continuing operations. There is also an ordering of poten-tial ordinary shares according to their effect on the dilution of EPS from most to least dilution.
Example 15.H
A has the following data:
Profi ts attributable to ordinary shareholders $25,000,000 Net profi t attributable to discontinuing operations $5,000,000 The weighted average number of shares in issue during the year
100,000,000
Average fair value per share $6 Tax rate 33%
Potential ordinary shares as follows:
1. Options to subscribe for 1,000,000 $1 ordinary shares at $4 per share. 2. $10,000,000 2% convertible bonds, the conversion terms being 500 ordinary shares per $1,000 bond. 3. 500,000 convertible preference shares. The dividend is $5 per share and the conversion terms are one ordi-
nary share for one convertible preference share.
As before, we calculate the effects of the potential shares on the EPS calculation using the profi ts from continuing operations. This is done by order of dilution which may be found by calculating the earnings per incremental share.
Options would not increase earnings but shares increase as above by the amount of shares deemed to be issued at no consideration, that is, [1,000,000 � (1,000,000 � $4) � $6] 333,333 shares. Therefore, no earnings per incremental share.
Two per cent convertible bonds would save interest net of tax of [10,000,000 � 2% � (1 � 0.33)] $134,000 and would increase the number of shares by 5,000,000. The incremental earnings per share would be (134,000 � 5,000,000) 2.68 cents.
Convertible preference shares increase earnings by $2,500,000 and increase shares by 500,000, the incre-mental earnings per share being (2,500,000 � 500,000) $5.
The order of dilution is therefore:
1. options; 2. 2% convertible bonds; 3. convertible preference shares.

365FINANCIAL MANAGEMENT
EARN
ING
S PER SHA
RE
Net profi t attributable
to continuing operations Ordinary shares Per share $ ¢
Basic 20,000,000 100,000,000 20.00Options – 333,333
20,000,000 100,333,333 19.90 2% convertible bonds interest saved 134,000 5,000,000
20,134,000 105,333,333 19.11 Convertible preference shares 2,500,000 500,000
22,634,000 105,833,333 21.40
In this example the convertible preference shares increase the diluted EPS and so are eventually excluded from the calculation disclosed in the fi nancial statements.
Final disclosure:
Basic EPS � 25,000,000 ÷ 100,000,000 � 25¢ Diluted EPS � (25,000,000 � 134,000) ÷ 105,333,333 � 23.9¢
Note that the distinction between continuing and discontinuing profi ts is required only for the purpose of the dilution effect calculation, and the full profi t fi gure attributable to ordinary shareholders (i.e., $25 million) is used.
15.4.4 Disclosure requirements The basic and diluted earnings per share should be shown on the face of the income statement.
The calculation of the weighted average number of shares should be disclosed. The number of shares used in the diluted EPS should be reconciled to the weighted average number of shares in the basic EPS.
The profi t attributable to ordinary shareholders should be reconciled to the net profi t or loss for the period.
IAS 33 requires that any historical data in the fi nancial statements should be consistent with the calculations of EPS, and any restatements incorporated into the historical sum-mary. Furthermore, IAS 33 requires that the same rules are applied to any per share calcu-lation, for example, net assets per share, dividend per share.
15.5 Summary This chapter covered earnings per share which is unique amongst accounting ratios in hav-ing an accounting standard devoted to it, and it therefore requires additional care in calcu-lation. The basic calculation of earnings per share is straightforward, but as we have seen in this chapter, it can be complicated, for example, by the issue of new fi nancial instruments during the year, and by the existence of potentially dilutive fi nancial instruments.

This page intentionally left blank

367
Revision Questions 15 Question 1 BAQ is a listed entity with a fi nancial year end of 31 March. At 31 March 20X7, it had 8,000,000 ordinary shares in issue.
The directors of BAQ wish to expand the business’s operations by acquiring competitor entities. They intend to make no more than one acquisition in any fi nancial year.
The directors are about to meet to discuss two possible acquisitions. Their principal cri-terion for the decision is the likely effect of the acquisition on group earnings per share.
Details of the possible acquisitions are as follows:
1. Acquisition of CBR ● 100% of the share capital of CBR could be acquired on 1 October 20X7 for a new
issue of shares in BAQ; ● CBR has 400,000 ordinary shares in issue; ● Four CBR shares would be exchanged for three new shares in BAQ; ● CBR’s profi t after tax for the year ended 31 March 20X7 was $625,000 and the entity’s
directors are projecting a 10% increase in this fi gure for the year ending 31 March 20X8. 2. Acquisition of DCS ● 80% of the share capital of DCS could be acquired on 1 October 20X7 for a cash
payment of $10.00 per share; ● DCS has 1,00,000 ordinary shares in issue; ● The cash would be raised by a rights issue to BAQ’s existing shareholders. For the
purposes of evaluation it can be assumed that the rights issue would take place on 1 October 20X7, that it would be fully taken up, that the market value of one share in BAQ on that date would be $5.36, and that the terms of the rights issue would be one new share for every fi ve BAQ shares held at a rights price of $5.00;
● DCS’s projected profi t after tax for the year ending 31 March 20X8 is $860,000.
BAQ’s profi t after tax for the year ended 31 March 20X8 is projected to be $4.2 million. No changes in BAQ’s share capital are likely to take place, except in respect of the possible acquisitions described above.
Requirements Calculate the group earnings per share that could be expected for the year ending 31 March 20X8 in respect of each of the acquisition scenarios outlined above. (10 marks)

EA
RNIN
GS
PER
SHA
RE
REVISION QUESTIONS F2368
Question 2 On 1 February 20X4, CB, a listed entity, had 3,000,000 ordinary shares in issue. On 1 March 20X4, CB made a rights issue of 1 for 4 at $6.50 per share. The issue was completely taken up by the shareholders.
Extracts from CB’s fi nancial statements for the year ended 31 January 20X5 are pre-sented below:
CB: Extracts from income statement for the year ended 31 January 20X5
CB $’000 Operating profi t 1,380 Interest payable (400) Profi t before tax 980 Income tax (255) Profi t for the period 725
CB: Extracts from summarised statement of changes in equity for the year ended 31 January 20X5
CB $’000 Balance as at 1 February 20X4 7,860 Issue of share capital 4,875 Surplus on revaluation of properties 900 Profi t for the period 725 Ordinary dividends (300) Balance as at 31 January 20X5 14,060
Just before the rights issue, CB’s share price was $7.50, rising to $8.25 immediately after-wards. The share price at close of business on 31 January 20X5 was $6.25.
At the beginning of February 20X5 the average price earnings (P/E) ratio in CB’s busi-ness sector was 28.4, and the P/E of its principal competitor was 42.5.
Requirements (a) Calculate the earnings per share for CB for the year ended 31 January 20X5, and its
P/E ratio at that date. (6 marks) (b) Explain the signifi cance of P/E ratios to investors, and compare CB’s P/E ratio relative
to those of its competitor and industry sector. (4 marks) (Total marks � 10)
Question 3 Earnings per share (EPS) is generally regarded as a key accounting ratio for use by investors and others. Like all accounting ratios, however, it has its limitations. You have been asked to make a brief presentation to CIMA students on the topic.
Requirements (a) Explain why EPS is regarded as so important that the IASB has issued an accounting
standard on its calculation; (2 marks) (b) Explain the general limitations of the EPS accounting ratio and its specifi c limitations
for investors who are comparing the performance of different entities. (8 marks) (Total marks � 10)

EARN
ING
S PER SHA
RE
369FINANCIAL MANAGEMENT
Question 4 (a) GHJ, a listed entity, has 1,000,000 ordinary shares in issue throughout 20X8. The
profi ts after tax for the period total $800,000. The entity has two convertible fi nancial instruments in issue:
● $500,000 10% loan stock, each $1,000 of stock having the right to convert into 2,000 ordinary shares.
● 400,000 convertible $1 non-equity shares, paying a dividend of 10p per share. Each preference share is convertible to 2 ordinary shares.
RequirementCalculate the basic and diluted earnings per share for GHJ assuming a tax rate of 30%. (6 marks)
(b) ACD, another listed entity, has earnings per share in 20X7 of 25 cents per share. ACD has 4,000,000 ordinary shares in issue throughout 20X7. In 20X8 1,500,000 ordinary shares were issued by way of a capitalisation (bonus) issue. The profi ts after tax for the year were $1,200,000.
RequirementCalculate the EPS for 20X8 and the restated eps for 20X7 that will be included in the 20X8 fi nancial statements. (4 marks)
(Total marks � 10)

This page intentionally left blank
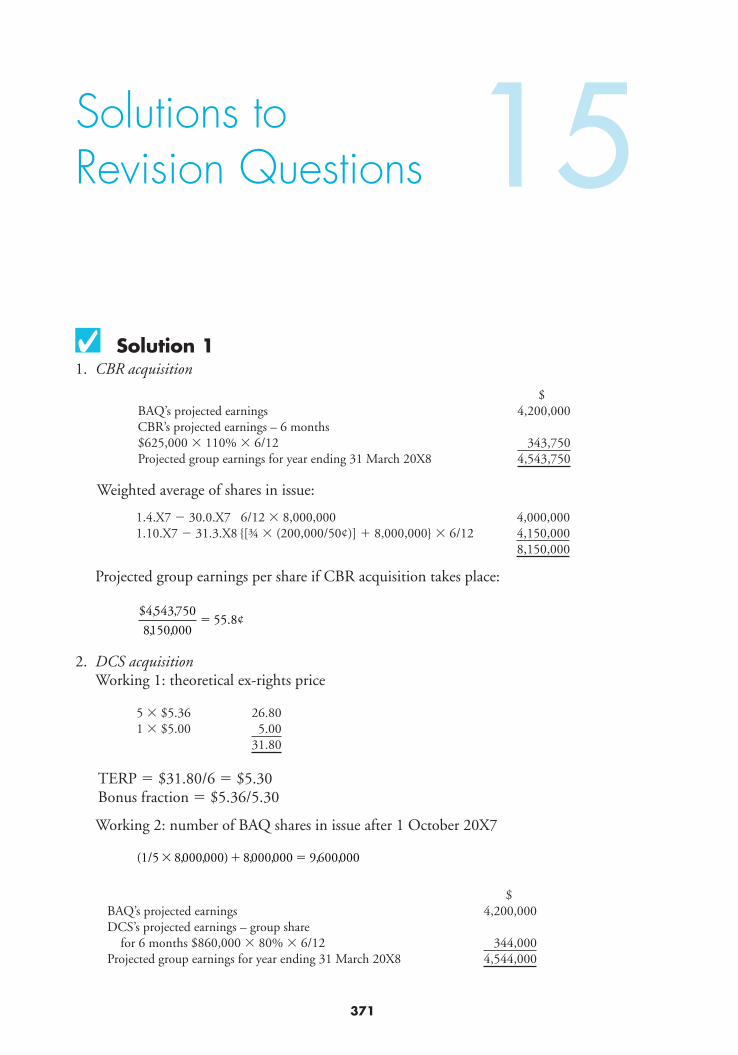
371
Solutions to Revision Questions
Solution 1 1. CBR acquisition
$ BAQ’s projected earnings 4,200,000 CBR’s projected earnings – 6 months $625,000 � 110% � 6/12 343,750 Projected group earnings for year ending 31 March 20X8 4,543,750
Weighted average of shares in issue:
1.4.X7 � 30.0.X7 6/12 � 8,000,000 4,000,000 1.10.X7 � 31.3.X8 { [¾ � (200,000/50¢)] � 8,000,000 } � 6/12 4,150,000
8,150,000
Projected group earnings per share if CBR acquisition takes place:
$ , ,
, ,. ¢
4543 750
815000055 8�
2 . DCS acquisition Working 1: theoretical ex-rights price
5 � $5.36 26.80 1 � $5.00 5.00
31.80
TERP � $31.80/6 � $5.30 Bonus fraction � $5.36/5.30
Working 2: number of BAQ shares in issue after 1 October 20X7
(1/5 )� � �8000000 8000000 9 600000, , , , , ,
$ BAQ’s projected earnings 4,200,000 DCS’s projected earnings – group share for 6 months $860,000 � 80% � 6/12 344,000 Projected group earnings for year ending 31 March 20X8 4,544,000
15

EARN
ING
S PE
R SH
ARE
SOLUTIONS TO REVISION QUESTIONS F2372
Weighted average of shares in issue:
$ 1.4.X7 � 30.9.X7 6/12 � 8,000,000 � 5.36/5.30 (W1)
4,045,283
1.10.X7 � 31.3.X8 6/12 � 9,600,000 (W2) 4,800,000 8,845,283
Projected group earnings per share if DCS acquisition takes place:
$ , ,
, ,. ¢
4544 000
884528351 4�
Solution 2 (a) Workings
1. Calculate theoretical ex-rights price
$ 4 shares � $7.50 30.00 1 share � $6.50 6.50 Theoretical value of holding of 5 shares 36.50
Theoretical ex-rights price of 1 share after rights issue: $36.50/5 7.30
2. Calculate bonus fraction
Fair value of one share before rights issue
Theoretical ex-rrights price of one share W( )
.
.1
7 50
7 30�
3. Weighted average number of shares in issue in the year to 31 January 20X5
Number of shares 1 February–1 March 20X 4: 3,000,000 � 7.50/7.30 � 1/12 256,849 1 March 20X4–31 January 20X5: 3,750,000 � 11/12 3,437,500 3,694,349
Earnings per share
P/E ratio
� �
�
$ ,
, ,. ¢
.
725000
3 694 34919 6
625
19 6631 9� .
(b) The price earnings ratio is a measure of how the stock market views the shares of an entity. A relatively high P/E usually suggests that the shares are regarded as a safe invest-ment. Lower P/Es suggest risk and volatility. However, it is unsafe to generalise too much. Where a listed entity has become a highly fashionable investment for some rea-son (for example, technology shares have in the past been regarded in this way from time to time) its high P/E ratio may help to mask fundamental weaknesses.
CB’s P/E is a little above the sector average indicating that it is probably regarded as a slightly less risky investment within its sector. Its competitor has a substantially higher
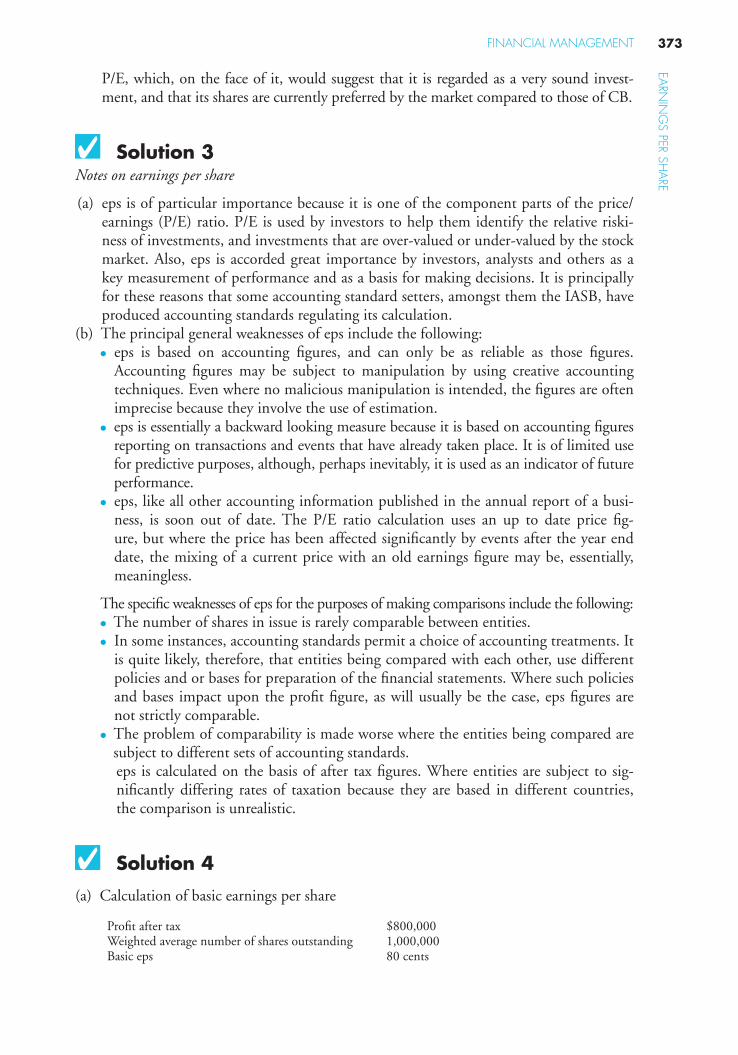
EARN
ING
S PER SHA
RE
373FINANCIAL MANAGEMENT
P/E, which, on the face of it, would suggest that it is regarded as a very sound invest-ment, and that its shares are currently preferred by the market compared to those of CB.
Solution 3 Notes on earnings per share
(a) eps is of particular importance because it is one of the component parts of the price/earnings (P/E) ratio. P/E is used by investors to help them identify the relative riski-ness of investments, and investments that are over-valued or under-valued by the stock market. Also, eps is accorded great importance by investors, analysts and others as a key measurement of performance and as a basis for making decisions. It is principally for these reasons that some accounting standard setters, amongst them the IASB, have produced accounting standards regulating its calculation.
(b) The principal general weaknesses of eps include the following: ● eps is based on accounting fi gures, and can only be as reliable as those fi gures.
Accounting fi gures may be subject to manipulation by using creative accounting techniques. Even where no malicious manipulation is intended, the fi gures are often imprecise because they involve the use of estimation.
● eps is essentially a backward looking measure because it is based on accounting fi gures reporting on transactions and events that have already taken place. It is of limited use for predictive purposes, although, perhaps inevitably, it is used as an indicator of future performance.
● eps, like all other accounting information published in the annual report of a busi-ness, is soon out of date. The P/E ratio calculation uses an up to date price fi g-ure, but where the price has been affected signifi cantly by events after the year end date, the mixing of a current price with an old earnings fi gure may be, essentially, meaningless.
The specifi c weaknesses of eps for the purposes of making comparisons include the following: ● The number of shares in issue is rarely comparable between entities. ● In some instances, accounting standards permit a choice of accounting treatments. It
is quite likely, therefore, that entities being compared with each other, use different policies and or bases for preparation of the fi nancial statements. Where such policies and bases impact upon the profi t fi gure, as will usually be the case, eps fi gures are not strictly comparable.
● The problem of comparability is made worse where the entities being compared are subject to different sets of accounting standards.
eps is calculated on the basis of after tax fi gures. Where entities are subject to sig-nifi cantly differing rates of taxation because they are based in different countries, the comparison is unrealistic.
Solution 4
(a) Calculation of basic earnings per share
Profi t after tax $800,000Weighted average number of shares outstanding 1,000,000Basic eps 80 cents

EARN
ING
S PE
R SH
ARE
SOLUTIONS TO REVISION QUESTIONS F2374
Calculation of diluted earnings per share
Profi t (working 1) $875,000Weighted average number of shares outstanding (working 2) 2,800,000Fully diluted eps 31.25 cents
Calculation of profi t for diluted earnings per share
$Profi t as per basic eps 1,200,000Plus post-tax saving on 10% loan stock (10% � $500,000 � 70%) 35,000Plus saving on preference dividend (10% dividend � $400,000) 40,000Profi t for diluted eps 875,000
Calculation of number of shares for diluted earnings per share
Shares for basic eps 1,000,000Plus conversion of loan stock ($500,000 � 2,000/1,000) 1,000,000Plus conversion of preference shares ($400,000 � 2) 800,000Number of shares for diluted eps 2,800,000
Note that the most dilutive outcome is given and in one calculation
(b) GHJ’s Basic eps for 20X8 is $1,200,000/(4,000,000 1 1,500,000) 5 20 cents(note the basic eps is calculated including the bonus issue in the period – this is not time weighted – it brings no new resources and therefore is treated as if the shares were in issue from the earliest reporting date).
The comparative fi gure for 20X7 eps is restated to:25 cents � 4,000,000 shares � earnings in the year of $1,000,000Restated eps � $1,000,000/6,000,000 � 16.7 centsOr calculated as 25 cents � 4,000,000/6,000,000 � 16.7 cents

16
Interpretation of Financial Statements

This page intentionally left blank

377
16
LEARNING OUTCOMES After studying this chapter students should be able to: � Interpret a full range of accounting ratios; � analyse financial statements in the context of information provided in the accounts
and corporate report; � evaluate performance and position based on analysis of fi nancial statements; � discuss segemental analysis, with inter-fi rm and international comparisons taking
account of possible aggressive or unusual accounting policies and pressures on eth-ical behaviour;
� discuss the results of an analysis of financial statements and its limitations.
16.1 Introduction This chapter extends the range of techniques covered by Chapter 14 in looking at horizon-tal, vertical and common size analysis in Section 16.2. Section 16.3 examines the provi-sions of IFRS 8 Operating Segments. Section 16.4 examines the limitations that are inherent in fi nancial statements themselves. Section 16.5 looks at a closely related issue: the lim-its to the use of ratio analysis in practice. Section 16.6 is concerned with the need to be aware of aggressive or unusual accounting policies that may be employed by preparers in some circumstances to alter the appearance of the fi nancial statements: the problem of crea-tive accounting. Section 16.7 examines some of the particular problems associated with the reporting of fi nancial obligations.
Interpretation of Financial Statements
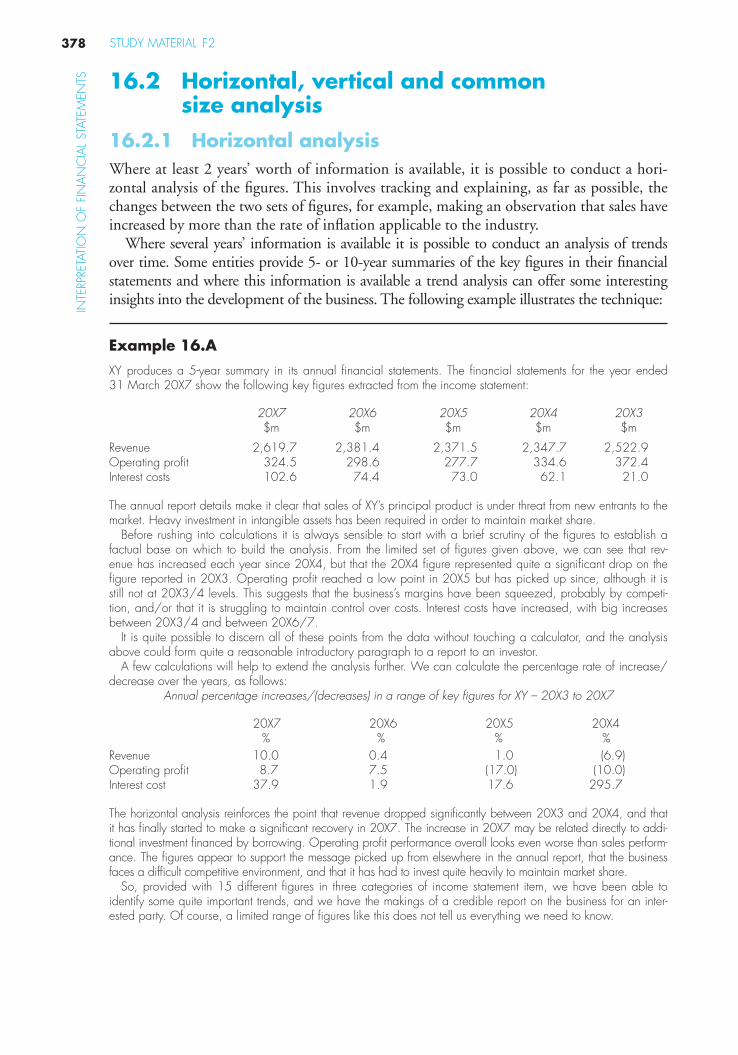
STUDY MATERIAL F2378
INTE
RPRE
TATI
ON
OF
FIN
AN
CIA
L ST
ATEM
ENTS 16.2 Horizontal, vertical and common
size analysis 16.2.1 Horizontal analysis Where at least 2 years ’ worth of information is available, it is possible to conduct a hori-zontal analysis of the fi gures. This involves tracking and explaining, as far as possible, the changes between the two sets of fi gures, for example, making an observation that sales have increased by more than the rate of infl ation applicable to the industry.
Where several years ’ information is available it is possible to conduct an analysis of trends over time. Some entities provide 5- or 10-year summaries of the key fi gures in their fi nancial statements and where this information is available a trend analysis can offer some interesting insights into the development of the business. The following example illustrates the technique:
Example 16.A
XY produces a 5-year summary in its annual fi nancial statements. The fi nancial statements for the year ended 31 March 20X7 show the following key fi gures extracted from the income statement:
20X7 20X6 20X5 20X4 20X3$m $m $m $m $m
Revenue 2,619.7 2,381.4 2,371.5 2,347.7 2,522.9 Operating profi t 324.5 298.6 277.7 334.6 372.4 Interest costs 102.6 74.4 73.0 62.1 21.0
The annual report details make it clear that sales of XY’s principal product is under threat from new entrants to the market. Heavy investment in intangible assets has been required in order to maintain market share.
Before rushing into calculations it is always sensible to start with a brief scrutiny of the fi gures to establish a factual base on which to build the analysis. From the limited set of fi gures given above, we can see that rev-enue has increased each year since 20X4, but that the 20X4 fi gure represented quite a signifi cant drop on the fi gure reported in 20X3. Operating profi t reached a low point in 20X5 but has picked up since, although it is still not at 20X3/4 levels. This suggests that the business’s margins have been squeezed, probably by competi-tion, and/or that it is struggling to maintain control over costs. Interest costs have increased, with big increases between 20X3/4 and between 20X6/7.
It is quite possible to discern all of these points from the data without touching a calculator, and the analysis above could form quite a reasonable introductory paragraph to a report to an investor.
A few calculations will help to extend the analysis further. We can calculate the percentage rate of increase/decrease over the years, as follows:
Annual percentage increases/(decreases) in a range of key fi gures for XY – 20X3 to 20X7
20X7 20X6 20X5 20X4% % % %
Revenue 10.0 0.4 1.0 (6.9) Operating profi t 8.7 7.5 (17.0) (10.0) Interest cost 37.9 1.9 17.6 295.7
The horizontal analysis reinforces the point that revenue dropped signifi cantly between 20X3 and 20X4, and that it has fi nally started to make a signifi cant recovery in 20X7. The increase in 20X7 may be related directly to addi-tional investment fi nanced by borrowing. Operating profi t performance overall looks even worse than sales perform-ance. The fi gures appear to support the message picked up from elsewhere in the annual report, that the business faces a diffi cult competitive environment, and that it has had to invest quite heavily to maintain market share.
So, provided with 15 different fi gures in three categories of income statement item, we have been able to identify some quite important trends, and we have the makings of a credible report on the business for an inter-ested party. Of course, a limited range of fi gures like this does not tell us everything we need to know.

379FINANCIAL MANAGEMENT
INTERPRETATIO
N O
F FINA
NC
IAL STATEM
ENTS
Questions prompted by the analysis might include the following:
● How much has been borrowed, and what are the terms (e.g., interest rates, security provided, repayment conditions)?
● What is the nature of the investment in non-current assets? What kind of intangibles has the business invested in? ● Is there some information about costs that will allow us to see if the business has lost control over certain categories? ● Is the business performing better in some markets than in others?
The fi nancial statements should provide some information on all of these matters. Whether or not it’s suffi cient information to provide comprehensive answers is another matter. There are some problems with horizontal analysis that should be borne in mind:
● Lack of comparability because of changes in the business. Many large businesses choose to grow through acquisitions. Where there is a signifi cant degree of mergers and acquisition activity, it can be diffi cult to iden-tify true underlying trends.
● Lack of comparability because of accounting policy changes and changes in fi nancial reporting standards. Sometimes, when presenting several years ’ worth of data, businesses will adjust the fi gures so that they are all presented in accordance with its current accounting policies and currently valid fi nancial reporting standards. This is, obviously, helpful to the analyst. However, notes should be read very carefully to see whether or not such adjustments have been made.
● Failure to take the effects of changing price levels into account. Usually, no adjustment is made, year on year, to take changing price levels into account. However, even at a low rate of infl ation in the economy, the effects of price changes can be quite substantial over several years. In the example of XY above, it is quite likely that the very small increases in revenue in 20X5 and 20X6 were decreases in real terms, if price infl ation were taken into account.
16.2.2 Vertical analysis Vertical analysis is a simple, but potentially effective technique, that involves expressing each fi gure in a primary fi nancial statement as a percentage of one key fi gure.
Example 16.B
BB has the following summarised income statement for 20X5:
20X5 $’000
Revenue 1,377 Cost of sales (897) Gross profi t 480 Distribution costs (247) Administration expenses (152) Profi t before tax 81
Taking the key fi gure of revenue as 100%, the statement can be vertically analysed as follows:
20X5 20X5$’000 %
Revenue 1,377 100 Cost of sales (897) (65) Gross profi t 480 35 Distribution costs (247) (18) Administration expenses (152) (11) Profi t before tax 81 6

STUDY MATERIAL F2380
INTE
RPRE
TATI
ON
OF
FIN
AN
CIA
L ST
ATEM
ENTS On its own this analysis is not perhaps very helpful: it requires some kind of comparison which will attribute
meaning. If the data is available we can extend it over several periods in the form of common size analysis. Note that it is usual to express fi gures in the income statement in relation to sales. Statement of fi nancial position fi gures would normally be expressed in relation to total assets.
16.2.3 Common size analysis Common size analysis extends across several periods. Vertical common size analy-sis involves the type of calculation shown in Example 16.B but for the data from several accounting periods.
It is also possible to use a horizontal approach to common size analysis: a particular year is recognised as the base year and each component is assigned a value of 100 per cent. The amount of the component for each subsequent year is expressed as a percentage of the base year.
Example 16.C
Extending the example of BB above: the following data is provided for the years 20X2 to 20X5:
BB: income statements
20X5 20X4 20X3 20X2$’000 $’000 $’000 $’000
Revenue 1,377 1,269 1,109 1,100 Cost of sales (897) (844) (789) (750) Gross profi t 480 425 320 350 Distribution costs (247) (225) (210) (199) Administration expenses (152) (103) (85) (100) Profi t before tax 81 97 25 51
The income statement data can be common-sized vertically in relation to sales as follows:
20X5 20X4 20X3 20X2% % % %
Revenue 100 100 100 100 Cost of sales (65) (67) (71) (68) Gross profi t 35 33 29 32 Distribution costs (18) (18) (19) (18) Administration expenses (11) (8) (8) (9) Profi t before tax 6 7 2 5
Some of the income statement data can be common-sized horizontally using 20X2 as a base year:
20X5 20X4 20X3 20X2% % % %
Revenue 125 115 100 100 Profi t before tax 159 190 49 100
From this limited analysis we have an overall view and we can see that sales have increased by 25% over the period but that profi ts have fl uctuated. The vertical common size analysis shows that gross profi t margin has increased, distribution costs have remained more or less the same in relation to sales revenue, and that there has been a sharp increase in administration expenses in the most recent year. We can now investigate further using other techniques.

381FINANCIAL MANAGEMENT
INTERPRETATIO
N O
F FINA
NC
IAL STATEM
ENTS
BB’s statement of fi nancial position data for the same accounting periods is as follows:
BB: Statements of fi nancial position
20X5 20X4 20X3 20X2$’000 $’000 $’000 $’000
Non-current assets Buildings 756 744 732 720Plant 452 460 430 410Other 69 38 30 –
1,277 1,242 1,192 1,130 Current assets
Inventory 267 262 296 309Receivables 174 167 145 130Cash 102 82 107 160
Total assets 1,820 1,753 1,740 1,729
Share capital 100 100 100 100 Retained earnings 1,492 1,440 1,420 1,383
1,592 1,540 1,520 1,483 Current liabilities 228 213 220 246
1,820 1,753 1,740 1,729
BB’s statement of fi nancial position can be common-sized vertically in relation to total assets as follows:
20X5 20X4 20X3 20X2% % % %
Non-current assets Buildings 41 42 42 42Plant 25 26 25 24Other 4 2 2 –
Current assets Inventory 15 15 17 18Receivables 9 10 8 7Cash 6 5 6 9
Total assets 100 100 100 100
Some of the statement of fi nancial position data can be common-sized horizontally, using 20X2 as a base year:
20X5 20X4 20X3 20X2% % % %
Plant 110 112 105 100Inventory 86 85 96 100 Total assets 105 101 101 100
From this limited analysis we can see that, while total assets have increased only slowly over the period, there have been larger fl uctuations in inventory value (which has fallen) and plant (which has increased at a faster rate than total assets).
The common-size data forms a basis for further analysis, which is likely to incorporate some of the ratio calcu-lations explained in Chapter 14.
16.3 Segment analysis Many business organisations have developed into very large multinational corporations whose economic signifi cance is substantial. As we have seen in the early chapters of this Learning System, groups of companies produce consolidated fi nancial statements. These

STUDY MATERIAL F2382
INTE
RPRE
TATI
ON
OF
FIN
AN
CIA
L ST
ATEM
ENTS draw together the results of business that may be engaged in quite disparate activities. The
advantage of such statements is that they allow the user to appreciate the fi nancial results and position of the group as a whole. However, in the process of consolidation a great deal of detail is lost that would potentially be of great assistance to users.
Users of fi nancial statements need suffi cient information to allow them to understand how the individual segments of the business contribute to its overall performance and fi nancial position.
16.3.1 IFRS 8 Operating Segments This fi nancial reporting standard was issued in November 2006, and was effective in respect of accounting periods beginning on or after 1 January 2008. The new IFRS replaced the existing standard IAS 14 Segment Reporting. The principal reason for issuing a new standard in this area was to achieve convergence with US GAAP. In this instance convergence was achieved by adopting many aspects of US SFAS 131 Disclosures about Segments of an Enterprise and Related Information . IFRS 8 has been subject to a degree of criticism in some quarters (and especially within the European Union) because the IASB is seen as having uncritically adopted US regulation, and also because there are, it is argued, fl aws in the new standard. These will be identifi ed and discussed below.
The principal requirements of IFRS 8 are as follows:
Scope The scope of IFRS 8 is limited to those entities whose debt or equity instruments are traded on a public market.
Definition of an operating segment Quoting directly from the standard:
‘ An operating segment is a component of an entity:
(a) that engages in business activities from which it may earn revenues and incur expenses (including revenue and expenses relating to transactions with other components of the same entity),
(b) whose operating results are regularly reviewed by the entity’s chief operating decision maker to make decisions about resources to be allocated to the segment and assess its performance, and
(c) for which discrete fi nancial information is available. ’
This description therefore excludes those parts of a business that do not engage directly in business activities, such as head offi ce functions. However, it does include business seg-ments whose activities are principally concerned with trading intra-group.
One of the criticisms of IFRS 8 is that it allows an entity’s managers to determine what is a reportable segment. Managers therefore are potentially able to conceal informa-tion by judicious selection of segments. A further, related, criticism is that comparabil-ity of segment information between businesses suffers because segment identifi cation is likely to differ between businesses. However, it should be recognised that comparability between businesses is often problematic, and users should in any case be very cautious when comparing entities even if they appear, superfi cially, to be quite similar in their operations.

383FINANCIAL MANAGEMENT
INTERPRETATIO
N O
F FINA
NC
IAL STATEM
ENTS
Criteria for reporting segment results IFRS 8 sets quantitative thresholds for reporting. Entities should report information about an operating segment that meets any one of three quantitative thresholds:
1. Segment reported revenue (including both intra-group and external sales) exceeds 10% of the combined revenue of all operating segments.
2. Segment profi t or loss is 10% of the greater of (i) the combined reported profi t of all operating segments that did not report a loss; and (ii) the combined reported loss of all operating segments that reported a loss.
3. Segment assets exceed 10% of the combined assets of all operating segments.
The revenue of the disclosed operating segments that meet the criteria should equal at least 75% of total revenue of the entity. If this threshold is not met, additional operating segments should be disclosed until at least 75% of reported revenue is included in operat-ing segments.
Reporting of comparatives As with other fi nancial information included in the annual report of an entity, segment disclosures should include comparatives for the previous year. It is possible that an oper-ating segment could meet the reporting criteria in 1 year but not in another. Where a segment ceases to meet the reporting criteria information about it should continue to be disclosed provided that management judge it to be of continuing signifi cance. Conversely, where a segment is newly identifi ed and reported because it meets the reporting criteria for the fi rst time, the previous year’s comparatives should be reported for it, even though the segment was not signifi cant in the prior period.
Disclosure requirements General information about operating segments must be disclosed as follows:
1. The factors used to identify the reportable segments, including the basis on which they have been identifi ed – for example, geographical areas, types of product or service.
2. The types of product or services from which each reportable segment derives its revenues.
The entity must disclose for each segment measures of profi t or loss AND total assets. The extent of other disclosures depends to some extent on the nature and content of infor-mation that is reviewed by the ‘ chief operating decision maker ’ (probably the CEO or equivalent). A measure of liabilities must be disclosed for each segment if that information is regularly made available to the chief operating decision maker. If the following informa-tion is regularly reviewed by the chief operating decision maker it must be disclosed:
● Revenues from external customers ● Revenues from transactions with other operating segments ● Interest revenue ● Interest expense ● Depreciation and amortisation ● Material items of income and expense ● Interests in profi t or loss of associates and joint ventures ● Income tax expense or income

STUDY MATERIAL F2384
INTE
RPRE
TATI
ON
OF
FIN
AN
CIA
L ST
ATEM
ENTS ● Material non-cash items other than depreciation or amortisation
● The amount of investment in associates and joint ventures ● The amounts of additions to non-current assets (with some exclusions).
Reconciliations Reconciliations are required to be disclosed as follows:
The total of the reportable segments ’ revenues to the entity’s revenue The total of the reportable segments ’ profi ts or losses to the entities profi t or loss before
tax and discontinued operations The total of the reportable segments ’ assets to the entity’s assets The total of the reportable segments ’ liabilities to the entity’s liabilities (if reported) The total of the reportable segments ’ amounts in respect of every other reportable item
of information.
Information about products and services In addition to the information requirements set out above, an entity must make the fol-lowing disclosures (unless these are already made via the disclosures described above):
Information about products and services: the revenues from external customers for each product and service, or similar groups of products and services.
Information about geographical areas:
1. Revenues from external customers attributable to the entity’s country of domicile and the total of revenues attributable to all foreign countries.
2. Non-current assets located in the entity’s country of domicile and the total of non-current assets located in all foreign countries.
Information about major customers:
If revenues in respect of a single customer amount to 10% or more of total revenues this should be disclosed (there is no requirement to disclose the name of the customer).
In respect of information about products, services and geographical areas, the disclosure requirement is waived if the cost to develop the information would be ‘ excessive ’ .
16.3.2 Operating segments – discussion The disclosures required by IFRS 8 for a large multinational group of entities could be very extensive indeed. However, the nature and extent of the disclosure is, at least in part, determined by the entity’s own internal reporting and decision-making processes because of the stipulation, applicable to many of the disclosure items, that information is to be disclosed only if it is made available to the chief operating decision maker. This means that disclosures are unlikely to be directly comparable between entities. However, IFRS 8 is designed to allow users to see the type and categories of information that are used at the highest levels in the entity for decision-making. There is the further advantage that dis-closure, while in many cases extensive, should not be excessively costly because it is based upon information reported and used within the business.

385FINANCIAL MANAGEMENT
INTERPRETATIO
N O
F FINA
NC
IAL STATEM
ENTS
16.4 The limitations of financial reporting information
The objective of fi nancial statements is set out in the IASB’s Framework for the Preparation and Presentation of Financial Statements, published in July 1989:
The objective of fi nancial statements is to provide information about the fi nancial position, performance and changes in fi nancial position of an enterprise that is useful to a wide range of users in making economic decisions.
A rather substantial limitation of fi nancial statements, is, however, stated in the following paragraph:
Financial statements prepared for this purpose meet the common needs of most users. However, fi nancial statements do not provide all the information that users may need to make economic decisions since they largely portray the fi nancial effects of past events and do not necessarily provide non-fi nancial information.
In summary, it appears that although fi nancial statements may well be useful to a wide range of users, their usefulness is somewhat limited. The principal drawback is the fact that fi nancial statements are oriented towards events that have already taken place. However, there are other signifi cant limitations in the value of the information contained in a set of fi nancial statements. These can be summarised under the following principal headings.
TimelinessBy the time fi nancial statements are received by users, 2 or 3 months or longer may have elapsed since the year end date. The earliest of the transactions that contribute to the income and expense items accumulated in the income statement will have taken place probably 15 or more months previously.
In some jurisdiction there may be a requirement for large, listed, entities to produce half-yearly or even quarterly fi nancial statements. Where these are available, the timeliness problem is somewhat diminished. However, the information contained in such statements may be limited in comparison to that produced in the annual report. For example, quar-terly statements may include only an income statement without a statement of fi nancial position or statement of changes in equity. Also, it is possible that they will have not been subject to verifi cation is the form of audit.
Comparability1. Comparisons over time between the fi nancial statements of the same entity may prove
to be invalid, or only partially valid, because signifi cant changes have taken place in the business. The disclosure provisions of IFRS 5 Non-current Assets Held for Sale and Discontinued Operations may assist the analyst in respect of this particular category of change. However, it may not be possible to discern the effect of other signifi cant changes. For example, a business that makes an investment in a new non-current item, say a major addition to its production facilities coupled with a signifi cant increase in working capital, is not obliged to disclose any information about how well or badly the new investment has performed. The analyst may, for example, be able to see that the entity’s profi tability overall has decreased, but the explanations could be as follows:

STUDY MATERIAL F2386
INTE
RPRE
TATI
ON
OF
FIN
AN
CIA
L ST
ATEM
ENTS ● The investment has proved to be very successful, but its success is offset by the rap-
idly declining profi tability of other parts of the business’s productive capacity. As these elements are gradually replaced over the next 2 or 3 years, profi tability is likely to increase overall.
● The investment has proved to be less successful than expected and is producing no better a return than the worn-out machinery it replaced.
● Although productive capacity has increased, the quality of goods overall has declined, and the business has not been able to maintain its margins.
Financial statements simply do not provide suffi cient information to permit the analyst to see these fi ner points of detail.
2. Comparability over time is often threatened by the effects of price infl ation. This can, paradoxically, be particularly insidious where the general rate of infl ation in the economy is comparatively low because analysts and others are not conscious of the effect. For example, suppose that the rate of price infl ation applicable to a particular entity has been around 2.5 per cent per year over a 5-year period. Sales in 20X3 were reported at $100,000. A directly comparable level of sales in 20X4 would be $102,500 ($100,000 � 1.025). Therefore, sales in 20X4 would have to have increased to more than $102,500 before any real increase could be claimed. However, the analyst, seeing the two fi gures alongside each other on the income statement, and knowing that infl a-tion is running at a low level, may very well not take this factor into account.
3. Changes in accounting policy and accounting practices may affect comparability over time in the same entity. Also, when comparing the fi nancial statements of two or more entities, it is really quite likely that there will be some differences in accounting policy and/or practice between them. The type of differences which make comparisons diffi -cult include the following:
● Different approaches to valuation of non-current assets, as permitted under IAS 16 Property, Plant and Equipment. An entity that revalues its non-current assets on a regular basis, as permitted by that standard, is likely to have higher carrying values for its assets than an entity that carries non-current assets at depreciated historical cost. Also, the depreciation charges of the revaluing entity are likely to be higher. The two entities are therefore not strictly comparable.
● A different approach to the classifi cation of expenses in the income statement. At the margins it is not always easy to decide whether or not expenses should be clas-sifi ed as part of cost of sales. Different entities may vary in their treatment of some expenses, and so may produce variations between them in gross profi t margin.
● More or less conservative approaches to judgements about the impairment of assets. Impairment review inevitably involves some degree of estimation.
Only the fi rst of these three items relates to, strictly speaking, an accounting policy difference. The other two relate to variations in respect of judgemental issues. Where there is a difference in formal accounting policies adopted, it is, at least, possible to discern this from the fi nancial statements and to make some kind of adjustment to achieve comparability. However, judgemental matters are almost impossible to adjust for.
4. Businesses may appear to be comparable in that they operate in the same business sec-tor. However, each business has unique features, and a particular business may not be

387FINANCIAL MANAGEMENT
INTERPRETATIO
N O
F FINA
NC
IAL STATEM
ENTS
strictly comparable with any other. Segment disclosure does allow for a more required approach to comparisons, although as we have seen:
● Not all entities are required by the accounting standard to make segment disclosures.
● Identifying segments is, necessarily, a judgmental matter. It is quite possible that one entity would identify a particular part of its business as a reportable segment, whereas another would not make the same judgement.
5. Financial statements are prepared to a particular date annually. The annual fi nancial statements of an entity with a year end of 31 December are not strictly comparable with those of an entity with a June year end. The difference is only 6 months, but sig-nifi cant events may have occurred in the industry or the economy as a whole that affect the statements prepared to the later date but not those prepared to the earlier date.
6. It may be inappropriate to compare two companies of very different sizes, or to com-pare a listed with a non-listed entity. A large entity may be able to take advantage of economies of scale that are unavailable to the small entity, but that is not to say that the smaller entity is ineffi cient. It may, relatively speaking, be a better manager of the resources available to it. Conversely, a smaller entity may be able to react more rapidly to changes in economic conditions, because it can be easier to effect radical change in that environment.
Listed entities are subject to a great deal of additional regulation and their activi-ties are far more likely than those of an unlisted entity to attract media coverage. Their share prices are widely advertised and are sensitive to alterations in market perceptions. It can be less acceptable for a listed entity to take risks or any course of action that might affect a regular fl ow of dividends to shareholders. By contrast, an unlisted entity whose shares are held by a limited number of people may be able to make investment decisions that result in a curtailment of dividends in the short term in exchange for pro-jected higher returns in the long-term. So, operational fl exibility varies between compa-nies, and this may mean that their fi nancial statements are not really comparable, or at least, that comparisons must be treated with caution.
VerificationAlthough regulations relating to audit vary from one country to another, it is likely that, in most jurisdictions, the fi nancial statements of larger entities are audited. However, smaller entities’ fi nancial statements may not be subject to audit, and so the analyst has no external report on their validity or the fairness of their presentation.
International issuesWhere the fi nancial statements of entities based in different countries are being compared, there may be further sources of difference in addition to those already covered in this section.
1. The entities may be subject to differing tax regimes.2. The fi nancial statements may be based on different legal and regulatory systems. For
example, traditionally, German, French and Spanish fi nancial statements have been prepared in accordance with tax regulation (so, e.g. the depreciation allowances pro-vided for in the fi nancial statements are exactly those allowable for tax purposes). The preparation of British and Irish fi nancial statements, by contrast, is focused much more

STUDY MATERIAL F2388
INTE
RPRE
TATI
ON
OF
FIN
AN
CIA
L ST
ATEM
ENTS upon the objective of achieving a true and fair view, and the link between accounts for
tax purposes and accounts for fi ling and presentation purposes has been relatively weak.3. The relative strength and weaknesses of a national economy, and of the exchange rate
relating to its national currency, may produce cyclical differences in the profi tability of business entities. These effects may have the result of reducing comparability of the fi nancial statements of two businesses located in different countries.
Provision of non-financial informationIt was noted earlier in this section: ‘… fi nancial statements do not provide all the infor-mation that users may need to make economic decisions since they largely portray the fi nancial effects of past events and do not necessarily provide non-fi nancial information.’ (the IASB’s Framework for the Preparation and Presentation of Financial Statements). Major listed entities have tended, in recent years, to provide more non-fi nancial information in their fi nancial statements, and it is increasingly common to fi nd disclosures relating to, for example, environmental issues. However, there is a dearth of regulation relating to non-fi nancial disclosure, and users cannot rely on fi nding a consistent level of high quality information in annual reports.
16.5 Limitations of ratio analysisRatio analysis is dependent upon the range and quality of quantitative information avail-able in entities’ fi nancial statements. If the quality of information is restricted in one or more of the ways described in Section 16.2, any ratios calculated using the information are likely to be of limited assistance. For example, an accounting ratio that can be very misleading is return on capital employed. The following example illustrates the danger of drawing inappropriate conclusions from accounting information.
Example
Two entities, A and B, operate in the same industry sector and have a similar scale of operations. Their profi t, capital employed and ROCE fi gures are as follows for the year ended 31 December 20X3:
A B $ $
Profi t 260,000 310,000 Capital employed 1,820,000 1,360,000ROCE% 14.3% 22.8%
On the face of it, B appears to produce a ROCE fi gure far in excess of A. However, our view of the comparison might change if we were informed that A has a policy of revaluing non-current assets, whereas B does not. B’s capital employed is lower for this reason, but its profi ts are also higher because it deducts relatively lower depre-ciation fi gures in its income statement.
Additional limitations of ratio analysis include the following:
Calculation methodAs we have seen in preceding chapters the only accounting ratio to have a prescribed method of calculation is earnings per share which is regulated through IAS 33 Earnings per share. In respect of some of the other accounting ratios, there may be more than one, quite

389FINANCIAL MANAGEMENT
INTERPRETATIO
N O
F FINA
NC
IAL STATEM
ENTS
valid, method of calculation. In Section 14.5.2, for example, we encountered two perfectly valid approaches to the calculation of gearing. When making comparisons between fi nan-cial statements it is important to ensure that the same method of calculation is used con-sistently, otherwise the comparison will not be valid.
ReliabilityAs we saw in Chapter 14, many ratios are calculated using average fi gures. Often the aver-age is based on only two fi gures: the opening and closing. However, these may not be representative of a true average fi gure, and so any ratios calculated on the basis of such a fi gure will be unreliable. This effect is noticeable in businesses with seasonal operations. For example, suppose that an artifi cial Christmas tree business starts building up its stock from a low point at the beginning of February, gradually accumulating stock to build up to a maximum level at the beginning of November. Eighty-fi ve per cent of its annual sales total is made in November and December. If the business has an accounting year end of 31 January (which would make sense as there’s not much going on at the time of year), stock levels will be at their lowest level. (Opening stock � closing stock)/2 will certainly produce an average stock fi gure but it will not be representative of the business’s level of activity.
The idea of the normSometimes textbooks and lecturers attempt to set norms for ratios: for example, that cur-rent ratio should ideally be around 2, or 1.5 or 2.5. However, setting norms is both unre-alistic and unhelpful. Some types of successful business can, and do, operate successfully with a substantial excess of current liabilities over current assets. Such businesses typically sell for cash, so don’t have receivables, turn over their stock very quickly (perhaps because it’s perishable) but manage to take the maximum amounts of credit from their suppliers.
Inappropriate use of ratiosNot all ratios are useful or applicable in all business situations, and the analyst must take care over the selection of ratios to use. For example, a business may have a mixture of cash and credit sales, but it would normally not be possible to distinguish between them armed only with the information included in the annual fi nancial statements. However, seeing a line for revenue and a line for receivables, the analyst (or student) might assume that it was therefore sensible to work out the number of days sales represented by receivables. In fact, though, the ratio would be meaningless, and the analyst could be seriously misled by it.
Limited usefulness of ratiosMostly, the calculation and analysis of ratios simply leads to more questions, and these cannot necessarily be answered where information is limited. Ratios, and more impor-tantly, their analysis may contribute to an understanding of a entity’s business operations, but quite often they simply lead to more questions.
A related point is that stand-alone ratios are generally of very limited use. The analyst may be able to calculate that a business’s gross profi t percentage is 14.3 per cent for a par-ticular year. In isolation, that piece of information is really quite useless. It’s reassuring to know that the business has actually made a positive gross profi t, but without comparators, it’s hard to say much more than that.

STUDY MATERIAL F2390
INTE
RPRE
TATI
ON
OF
FIN
AN
CIA
L ST
ATEM
ENTS 16.6 Creative accounting
‘Creative accounting’ goes by many names. In the USA it is more commonly referred to as ‘earnings management’ or ‘aggressive accounting’. ‘Creative accounting’ is probably the most widely used term in the UK and Europe, but the term ‘window dressing’ may also be found. In this chapter the term ‘creative accounting’ will be used.
Defi ning the nature and scope of creative accounting is not a straightforward matter. On a very broad level, it is possible to argue that all accounting is creative, because it involves a series of choices about policies, about what should be included and so on. Financial reports present only a partial view of the business they represent (e.g. internally generated good-will is not capitalised and human resource assets do not fi gure in the statement of fi nancial position). Despite the best efforts of accounting regulators there remains wide scope for the use of judgement in matters such as the determination of useful lives of assets and pro-visions for doubtful debts.
Creativity may be a natural element in the development of accounting. Accountants may need to be creative where, for example, there is no prescribed accounting treatment for a transaction. This need arose more frequently at times in the past when accounting regulation was sketchy or non-existent. Creativity in this context may positively enhance and assist the development of accounting. However, these days, the term ‘creative account-ing’ is more commonly used in a way which suggests that it involves a rather suspect, shady approach to accounting. It carries connotations of manipulation of fi gures, deliber-ate structuring of series of transactions and exploitation of loopholes in the rules.
Is creative accounting wrong? It can be very diffi cult to draw a distinction between aggressive use of the options offered by regulation, creative accounting and fraud. Some years ago, Alun Jones of the securities fi rm UBS Phillips & Drew employed the analogy of a slippery slope in categorising various approaches to accounting. There are six stages on the slippery slope:
1. conservative accounting2. less conservative accounting3. low quality profi ts4. wishful thinking5. creative or misleading accounting6. fraud.
In this analysis creative accounting is next door to outright fraud. Accounting and secu-rities regulation has become more stringent in recent years, and prosecutions for fraud involving accounting manipulation have become more common, especially in the United States.
16.6.1 Methods employed by creative accountantsFinancial statements can be manipulated in many ways, some more acceptable than others. Methods include the following:
Altering the timing of transactionsFor example, the despatch of sales orders could be hurried up or delayed just before the year end to either increase or decrease sales for the reporting period. Other examples include delaying sales of non-current assets and the timing of research and development

391FINANCIAL MANAGEMENT
INTERPRETATIO
N O
F FINA
NC
IAL STATEM
ENTS
expenditure. If an entity needs to improve its results it may decide upon a lower level of research and development activity in the short term in order to reduce costs. Delaying the replacement of worn-out assets falls into the same category. Some people would regard this type of ‘manipulation’ as falling outside of the defi nition of creative accounting.
Artificial smoothingThis approach involves the exploitation of the elements of choice that exist in account-ing regulation. Although the IASB has worked hard to reduce the number of allowed alternative treatments, there remains some scope for artifi cial adjustments in respect of, for example, the choice of inventory valuation method, the estimated useful lives of non-current assets and the choice between valuation of non-current assets at revalued amounts or depreciated historical cost that is permitted by IAS 16 Property, Plant and Equipmentand IAS 40 Investment Property. A change in accounting policy would, of course, have to be noted in the year in which it occurs, but its effects are not so easily discernible after that fi rst year.
The use of provisions has been exploited in the past as a way in which to manage reported earnings. The judicious creation and then subsequent release of provisions has been a very effective way of ensuring that reported profi ts showed a consistent picture of growth. However, by issuing IAS 37 Provisions, Contingent Liabilities and Contingent Assets,the IASB effectively put a stop to many of the abuses of provisions that had taken place previously.
ClassificationOne of the grey areas that persists in accounting is the classifi cation of debit items as either expenses of the current year or as non-current assets. If items are classifi ed as non-current assets they do not impact (unless they are depreciated) on the reported income for the period. One of the most celebrated cases of mis-classifi cation in recent years occurred in the US long-distance phone company WorldCom. Over a 3-year period the business improperly reported $3.8 billion of expenses as non-current assets, thus providing a con-siderable boost to reported earnings. The company is also reported as having manipulated provisions in order to increase reported earnings. In this particular case, the scale of the irregularities has been such that senior offi cers are currently being prosecuted for fraud.
Other areas of the fi nancial statements which provide opportunities for creative account-ing via classifi cation include the categorisation of expenses and income as exceptional or extraordinary items, and the decisions about classifi cation as reportable segments where the entity is required to undertake segment reporting.
Exclusion of liabilitiesUnder-reporting liabilities in the statement of fi nancial position can help to improve accounting ratios. For example, the calculation of gearing would be affected. Also, total capital employed would be reduced, so that return on total capital employed would appear to be higher. Entities have sometimes been able to take advantage of loopholes in account-ing regulation to arrange off-balance sheet fi nancing in the form of subsidiary undertakings that are technically excluded from consolidation. Generally, regulation has been tightened to make this more diffi cult, but as shown by the recent celebrated Enron case (where so-called Special Purpose Entities were set up to provide fi nance to the business; these SPEs

STUDY MATERIAL F2392
INTE
RPRE
TATI
ON
OF
FIN
AN
CIA
L ST
ATEM
ENTS were, however, excluded from the group accounts, so that their liabilities did not impact
on the business) off-balance sheet fi nance remains a possibility.
Recognition of revenueAggressive accounting often exploits relatively tax revenue recognition rules. Some exam-ples of inappropriate revenue recognition include:
● recognising revenue from sales that are made conditionally (i.e. where the purchaser has the right to return the goods for an extended period, or where experience shows that returns are likely);
● failing to apportion subscription revenue over the appropriate accounting periods but instead recognising it immediately;
● recognising revenue on goods shipped to agents employed by the entity;● recognising the full amount of revenue when only partial shipments of goods have been
made.
Managing market expectationsThis fi nal category of manipulation has nothing to do with massaging an entity’s fi gures, but it does involve the way the entity presents itself to the world. Reporting by listed enti-ties, especially in the US market, is driven very much by analysts’ expectations. It may be easier to massage their expectations rather than to improve the reported results by use of creative accounting techniques. Directors of listed entities meet analysts in briefi ng meet-ings where they have the opportunity to infl uence analysts’ expectations by forecasting fairly poor fi gures. When the entity then proceeds to turn in a better result than expected, the market’s view of the shares may be enhanced. This is a psychological game of bluffi ng which may backfi re on the reporting entity if analysts become aware of what it is doing.
16.6.2 The motivation to use creative accountingVarious research studies have examined the issue of managerial motivation to use creative accounting. The following have been identifi ed as signifi cant factors:
Tax avoidance. If income can be understated or expenses overstated, then it may be pos-sible to avoid tax.
Increasing shareholder confi dence. Creative accounting can be used to ensure an appropri-ate level of profi ts over a long period. Ideally, this would show a steady upward trajec-tory without nasty surprises for the shareholders, and so would help to avoid volatility in share prices, and would make it easier to raise further capital via share issues.
Personal gain. Where managerial bonuses are linked to profi tability, there is a clear moti-vation for managers to ensure that profi ts hit the necessary threshold to trigger a bonus payment.
Indirect personal gain. There is a market in managerial expertise, in which demand often appears to outstrip supply. A manager’s personal reputation in the marketplace will almost certainly be enhanced by association with entities that have strong earnings records. So, although the pay-off may not be either immediate or obvious, there is likely over the longer term to be a reward in terms of enhanced reputation and conse-quent higher earning power.
393FINANCIAL MANAGEMENT
INTERPRETATIO
N O
F FINA
NC
IAL STATEM
ENTS
Following the pack. If managers perceive that every other entity in their sector is adopt-ing creative accounting practices, they may feel obliged to do the same.
Meeting covenants. Sometimes, lenders insist on special covenant arrangements as a con-dition of making a loan: for example, they may stipulate that an entity’s current ratio should not fall below 1.5:1, or that gearing never exceeds 35 per cent. In such cases, if the entity cannot meet those covenants that it has agreed to, the lender may be able to insist upon immediate repayment, or to put the entity into liquidation. Where an entity is in danger of failing to meet its covenants, there is an obvious incentive for managers (especially if they genuinely feel that the diffi culty is short-term in nature) to massage the fi gures so that the covenant is, apparently, met.
16.7 Special problems in analysing financial obligations
It was noted in the previous section that one possible method of creative accounting is to under-report liabilities. If liabilities are not reported, investors and other users of fi nancial statements may be seriously misled. The analysis of fi nancial obligations may be compli-cated by the existence of creative accounting techniques designed to keep obligations off the statement of fi nancial position, but there are other problems that do not necessarily fall into the category of creative accounting.
Some of these problems are briefl y discussed below.
Interpretation of redeemable debtDebt may be redeemable at the option of the entity or of the holder. Sometimes it will carry a range of dates. For example, a security may be described as ‘10 per cent redeemable loan notes 2008/2012’. The analyst must be aware of such securities as their redemption could prove diffi cult if the business is short of liquid funds and/or is already highly geared. Where a date range is shown, it is probably most prudent to assume that the business will be obliged to redeem at the earliest possible date.
ContingenciesThe accounting treatment of contingencies is covered by IAS 37 Provisions, Contingent Liabilities and Contingent Assets. Students should recall that a provision is recognised when:
(a) an entity has a present obligation (legal or constructive) as a result of a past event;(b) it is probable that an outfl ow of resources embodying economic benefi ts will be
required to settle the obligation;(c) a reliable estimate can be made of the amount of the obligation.
‘Probable’ means more likely than not; that is, there is a greater than 50 per cent prob-ability of the obligation requiring settlement. If the probability is below 50 per cent but is not regarded as remote, then the potential obligation is noted as a contingent liability. It should be clear that much hinges on the probability estimate. It is quite possible that sub-stantial potential obligations could be included as contingent liabilities on the basis that they have, say, a 40 per cent probability of occurrence. The analyst must read the notes to the fi nancial statements carefully so as to be aware of the existence of contingencies. Where

STUDY MATERIAL F2394
INTE
RPRE
TATI
ON
OF
FIN
AN
CIA
L ST
ATEM
ENTS an item is noted as a contingent liability together with a note of the estimated fi nancial
impact, it may be useful to calculate the impact on the entity’s liquidity and to work out accounting ratios both with and without the item.
Earn-out arrangementsEarn-out arrangements are a special type of contingency that may arise upon the acquisi-tion of a group undertaking.
Example
During its fi nancial year ended 31 December 20X4, CY acquired 80% of the issued share capital of DZ for $3.2 million. An earn-out arrangement was written into the contract whereby if total audited profi t before distri-butions for the two full fi nancial years ending 31 December 20X6 were to exceed $600,000, CY would be obliged to pay an additional $0.4 million to the shareholders from whom it purchased the DZ shares.
How should CY account for this potential obligation in its fi nancial statements for the year ended 31 December 20X5?
The potential obligation should be accounted for in accordance with IAS 37. There is a legal obligation arising from a past event, and the extent of the obligation can be measured reliably. The only point at issue is whether or not the outfl ow of funds associated with the obligation can be regarded as probable or not. If it is probable (and a reasonable probability estimate is feasible given that DZ’s results will be available) then a provi-sion will be made in the fi nancial statements of the group or the year ended 31 December 20X5. If the outfl ow is not probable it is likely to be disclosed as a contingency.
As in the case of other contingent liabilities, the analyst must read the fi nancial statements throughly, so as to be aware of all noted contingencies. If the obligation is not already recognised it may be worth examining the effect of the earn-out payment on the group’s cash fl ow and statement of fi nancial position ratios.
16.8 Summary This chapter has completes the coverage of the learning outcomes associated with the fi nancial analysis section of the learning system. Once this chapter has been fully absorbed and the end of chapter questions have been practiced, students should be able to analyse fi nancial statements in the context of information provided in the accounts and corporate report to comment on an entity’s performance and position.
The chapter has extended the ranges of knowledge about analysis techniques and the disclosure of segment information.
Note to students:It cannot be emphasised too frequently, that the way to acquire the skills of a fi nancial analyst is to keep on practising. Students should obtain a range of annual reports of entities reporting under IFRS, in order to exercise their ability to analyse and interpret fi nancial information. This can be quite hard work, especially at fi rst, but it is worth persevering. A high level of abil-ity in analysing fi nancial information is to be expected of a CIMA qualifi ed accountant.
Students should fi nd that, with the appropriate level of practice they are able to prepare a concise report on the results of their analysis. There are additional notes on how to practice these types of questions in the section entitled preparing for the examination.
Note that question 1 at the end of this chapter is an example of a type of question that could be set in F2: it combines elements of two different syllabus areas, in this case fi nancial analysis and accounting for groups of companies.

395
16 Revision Questions
Question 1 A friend of yours has recently been left a portfolio of investments by a relative. The port-folio includes 150 shares in SDB, a listed entity that designs, manufactures and supplies houses in kit form for export to developing countries. Having recently received the fi nan-cial statements of the entity for the fi nancial year ended 31 July 20X6, your friend, who has some basic knowledge of accounting, has asked you to clarify certain points for him, and to provide him with a brief report on the position of the business.
The income statement, statement of changes in equity, and statement of fi nancial position, together with comparatives are as follows:
SDB: Consolidated income statement for the year ended 31 July 20X6
20X6 20X5 $’000 $’000
Revenue 25,200 25,300 Cost of sales 18,400 18,000 Gross profi t 6,800 7,300 Distribution costs 970 1,030 Administrative expenses 1,750 1,720 Finance costs 1,220 1,140 Share of losses of joint venture 1,670 – Profi t before tax 1,190 3,410 Income tax expense 250 780 Profi t for the period 940 2,630
Attributable to: Equity holders of the parent 810 2,230 Non-controlling interest 130 400 940 2,630

INTE
RPRE
TATI
ON
OF
FIN
AN
CIA
L ST
ATEM
ENTS
REVISION QUESTIONS F2396
SDB: Consolidated statement of changes in equity for the year ended 31 July 20X6
Share capital
Other reserves
Retained earnings
Minority interest
Total equity
$’000 $’000 $’000 $’000 $’000
Balance at 1 August 20X5 4,000 – 18,600 540 23,140 Profi t for the period 810 130 940 Dividends (2,470) (330) (2,800) Issue of share capital 1,600 2,000 3,600 Balance at 31 July 20X6 5,600 2,000 16,940 340 24,880
SDB: Consolidated statement of fi nancial position as at 31 July 20X6
20X6 20X5 $’000 $’000 $’000 $’000 ASSETS Non-current assets: Property, plant and equipment 19,900 17,200 Investment in joint venture 7,500 – 27,400 17,200 Current assets: Inventories 8,300 6,900 Trade receivables 4,700 4,100 Cash 3,100 13,000 16,100 24,000 43,500 41,200 EQUITY AND LIABILITIES Equity attributable to shareholders of the parent:
Called up share capital ($1 shares) 5,600 4,000 Retained earnings 16,940 18,600 Other reserves 2,000 – 24,540 22,600 Non-controlling interest 340 540 Total equity 24,880 23,140 Non-current liabilities: Long-term loans 13,600 13,000 Current liabilities: Trade payables 4,770 4,280 Income tax 250 780 5,020 5,060 43,500 41,200
Your friend’s queries are as follows:
1. ‘ I’ve looked up IAS 31 Interests in joint ventures, which mentions proportionate con-solidation and equity accounting as possible methods of accounting for joint ventures. I’ve not previously encountered joint ventures, or proportionate consolidation. Can you explain how IAS 31 affects these fi nancial statements?
2. The long-term loans are described in a note as redeemable loan notes 20X8–10. What does this mean, and what are the implications for SDB’s position?

INTERPRETATIO
N O
F FINA
NC
IAL STATEM
ENTS
397FINANCIAL MANAGEMENT
3. There is a note about a contingent liability of $10 million. Apparently, one of the models of house kit supplied by SDB has a tendency to collapse in adverse weather conditions, and $10 million is the amount claimed by litigants in a case that is due to be heard within the next 18 months. SDB’s directors think it’s possible that the entity will have to pay out. This seems a very large amount of money. How likely is it that the entity will have to pay out, and how bad would the effect be?
4. I can see that the business’s profi tability has suffered during the year, but if anything, I’m more concerned about the fact that the cash balance has fallen by more than $9 million. I’d very much like to have your opinion on the business’s position. ’
Requirements Write a report to your friend that:
(a) Explains the concept of a jointly controlled entity and the possible approaches to accounting for it, identifying possible reasons for the selection of accounting method by SDB. (9 marks)
(b) Analyses the fi nancial statements of SDB, focusing as requested upon the business’s position, and including references to the queries about the redeemable loan notes and the contingent liability. (16 marks)
(Total marks � 25)
Question 2 AXZ is a rapidly expanding entity that manufactures and distributes hair care and other beauty products. Its directors are currently considering expansion into foreign countries by means of acquisitions of similar entities. Two acquisition possibilities are to be considered at the next board meeting: DCB, an entity operating in Lowland, and GFE which operates in Highland. The targets are of similar size, and operate within similar economic parame-ters and the same currency, although their tax regimes differ substantially. Neither entity is listed. Neither Lowland nor Highland require unlisted entities to comply with IFRS, and consequently both entities comply with local GAAP. Local GAAP in both countries is in most respects similar to IFRS but there are some differences which must be taken into account when making comparisons between fi nancial statements produced in the two countries. AXZ is listed, and complies with IFRS.
The directors of both DCB and GFE have co-operated fully in providing detailed infor-mation about their businesses. Provided that a reasonable price is offered for the shares, takeover is unlikely to be resisted by either entity. AXZ can afford to fund one acquisition but not both.
The most recent income statements of the three entities are provided below, together with some relevant statement of fi nancial position totals.

INTE
RPRE
TATI
ON
OF
FIN
AN
CIA
L ST
ATEM
ENTS
REVISION QUESTIONS F2398
Income statements for the year ended 30 September 20X6
AXZ DCB GFE $’000 $’000 $’000 Revenue 8,300 1,900 2,200 Cost of sales 5,600 1,300 1,400 Gross profi t 2,700 600 800 Distribution costs 252 60 65 Administrative expenses 882 180 250 Finance costs 105 25 65 Profi t before tax 1,461 335 420 Income tax expense 366 134 105 Profi t for the period 1,095 201 315
Extracts from statements of fi nancial position as at 30 September 20X6
Total equity 4,820 1,350 1,931 Non-current liabilities (borrowings)
1,500 500 650
Non-current assets 9,950 1,680 2,400
Notes 1. It is customary for entities complying with local GAAP in Lowland to adopt the
rates of depreciation used by the tax authorities. Tax depreciation is calculated on the straight-line basis in all cases, at a rate of 12.5% each year on all non-current assets. DCB’s non-current assets have been held, on average, for three years, and none are fully depreciated. The age profi le of non-current assets held by AXZ and GFE is very sim ilar, but both entities charge an average of 10% straight line depreciation each year. In order to be able to appraise the potential investments using comparable data, the direc-tors of AXZ intend to use fi gures adjusted by applying a 10% depreciation rate to the non-current assets of DCB.
All depreciation in all three entities has been charged to cost of sales. 2. Accounting for fi nancial instruments is similar under Lowland GAAP and IFRS.
However, Highland’s GAAP takes a less prescriptive approach. GFE has $100,000 of 5% non-participating shares included in equity. Under IFRS, these shares would be classifi ed as long-term liabilities. The 5% fi xed charge on these shares has been refl ected in the statement of changes in equity; under IFRS it would be shown as part of fi nance costs. This charge would not, however, be allowable against income tax in Highland.
3. The directors of AXZ plan to fi nance the acquisition through a combination of equity and debt that will be similar, proportionately, to the existing capital structure. When assessing possible takeover targets the following accounting ratios are of especial interest:
Gross profi t margin Profi t before tax as a percentage of revenue Return on equity Return on total capital employed Non-current asset turnover Gearing (long-term debt as a percentage of equity)
Their policy is to consider targets for takeover only if the above ratios for the combined group would not be adversely affected to any material extent.

INTERPRETATIO
N O
F FINA
NC
IAL STATEM
ENTS
399FINANCIAL MANAGEMENT
Requirements (a) Calculate and tabulate the key ratios both before and after taking into account the
information in notes 1 and 2 above. (15 marks) (b) Analyse, interpret and prepare a concise report for the directors of AXZ upon the
fi nancial statement information provided for the three entities, together with the ratios provided in the table prepared in part (a). (You should calculate any additional ratios that are likely to be useful to the directors in making their decision). (10 marks)
(Total marks � 25)
Question 3 You are the assistant to the fi nance director (FD) of OPQ, a well-known retailer of music, video and games products. The entity’s profi t margins are under increasing pressure because of the entry of on-line retailers into the market. As part of their response to this challenge, OPQ’s directors have decided to invest in entities in the supply chain of their most popu-lar products. They are currently considering the acquisition of the business that supplies some of their best-selling computer games, PJ Gamewriters (PJ). The FD has asked you, as a preliminary step, to examine the most recent fi nancial statements of the entity.
PJ was established in 20W9 by twin brothers, Paul and James, who had recently gradu-ated in computing. Their fi rst business success was a simulated empire building game; this has continued to bring in a large proportion of their revenue. However, they have also been successful in a range of other games types such as combat simulations, golf and foot-ball management games. The business has grown rapidly from year to year, and by 20X5 it employed ten full-time games writers. Manufacture and distribution of the software in various formats is outsourced, and the business operates from offi ce premises in a city cen-tre. PJ bought the freehold of the offi ce premises in 2002, and its estimated market value is now $900,000, nearly $350,000 in excess of the price paid in 2002. Apart from the free-hold building, the business owns few non-current assets.
The equity shares in PJ are owned principally by Paul, James and their parents, who provided the initial start-up capital. Paul and James are the sole directors of the business. A small proportion of the shares (approximately 8%) is owned by fi ve of the senior software writers. PJ is now up for sale as the principal shareholders wish to realise the bulk of their investment in order to pursue other business interests. It is likely that about 90% of the shares will be for sale. The copyrights of the games are owned by PJ, but no value is attrib-uted to them in the fi nancial statements.
PJ’s income statement and summarised statement of changes in equity for the year ended 31 July 20X5, and a statement of fi nancial position at that date (all with compara-tives) are as follows:

INTE
RPRE
TATI
ON
OF
FIN
AN
CIA
L ST
ATEM
ENTS
REVISION QUESTIONS F2400
PJ: Income statement for the year ended 31 July 20X5
20X5 20X4$’000 $’000
Revenue 2,793 2,208Cost of sales (see note) (1,270) (1,040)Gross profi t 1,523 1,168Operating expenses (415) (310)Profi t from operations 1,108 858Interest receivable 7 2Profi t before tax 1,115 860Income tax expense (331) (290)Profi t for the period 784 570
Note: Cost of sales comprises the following:
20X5 20X4$’000 $’000
Games writers’ employment costs 700 550Production costs 215 160
Directors’ remuneration 200 200Other costs 155 130
1,270 1,040
PJ: Summarised statement of changes in equity for the year ended 31 July 20X5
20X5 20X4$’000 $’000
Opening balance 703 483Profi t for period 784 570Dividends (500) (350)Closing balance 987 703
PJ: Statement of fi nancial position at 31 July 20X5
20X5 20X4$’000 $’000 $’000 $’000
Non-current assetsProperty, plant and equipment 610 620
Current assetsInventories 68 59Trade receivables 460 324Cash 216 20
744 4031,354 1,023
EquityShare capital 60 60Retained earnings 927 643
987 703
Current liabilitiesTrade and other payables 36 30Income tax 331 290
367 3201,354 1,023

INTERPRETATIO
N O
F FINA
NC
IAL STATEM
ENTS
401FINANCIAL MANAGEMENT
Requirements (a) Prepare a report commenting upon the fi nancial performance and position of PJ Games
writers, calculating and interpreting any relevant accounting ratios. (17 marks)(b) Explain the limitations of your analysis, identifying any supplementary items of infor-
mation that would be useful. (8 marks)(Total marks � 25)
Question 4You are the accountant of Acquirer. Your entity has the strategy of growth by acquisition and your directors have identifi ed an entity, Target, which they wish to investigate with a view to launching a takeover bid. Your directors consider that the directors of Target will contest any bid and will not be very co-operative in providing background information on the entity. Therefore, relevant fi nancial information is likely to be restricted to the publicly available fi nancial statements.
Your directors have asked you to compute key fi nancial ratios from the latest fi nancial statements of Target (for the year ended 30 November 20X2) and compare the ratios with those for other entities in a similar sector. Accordingly, you have selected ten broadly simi-lar entities and have presented the directors with the following calculations:
Ratio Basis of calculation Ratio for target
Spread of ratios for comparative entities
Highest Average LowestGross profi t margin Gross profi t 42% 44% 38% 33%
RevenueOperating profi t margin Profi t from operations 29% 37% 30% 26%
RevenueReturn on total capital Profi t from operations 73% 92.5% 69% 52%
Total capitalInterest cover Profi t from operations 1.8 times 3.2 times 2.5 times 1.6 times
Finance costGearing Debt capital 52% 56% 40% 28%
Total capitalDividend cover Profi t after tax 5.2 times 5 times 4 times 3 times
DividentTurnover of inventory Cost of sales 4.4 times 4.5 times 4 times 3.2 times
Closing inventoryReceivables days Trade receivables 51 days 81 days 62 days 49 days
1 day’s sales revenue
Requirements (a) Using the ratios provided, write a report that compares the fi nancial performance and
position of Target to the other entities in the survey. Where an issue arises that refl ects particularly favourably or unfavourably on Target, you should assess its relevance to a potential acquirer. (16 marks)

INTE
RPRE
TATI
ON
OF
FIN
AN
CIA
L ST
ATEM
ENTS
REVISION QUESTIONS F2402
(b) Identify any reservations you have regarding the extent to which the ratios provided can contribute to an acquisition decision by the directors of Acquirer. You should highlight the extent to which the fi nancial statements themselves might help you to overcome the reservations you have identifi ed. (9 marks)
(Total marks � 25)
Question 5DM, a listed entity, has just published its fi nancial statements for the year ended 31 December 20X4. DM operates a chain of 42 supermarkets in one of the six major prov-inces of its country of operation. During 20X4 there has been speculation in the fi nancial press that the entity was likely to be a takeover target for one of the larger national chains of supermarkets that is currently under-represented in DM’s province. A recent newspaper report has suggested that DM’s directors are unlikely to resist a takeover. The six board members are all nearing retirement, and all own signifi cant minority shareholdings in the business.
You have been approached by a private shareholder in DM. She is concerned that the directors have a confl ict of interests and that the fi nancial statements for 20X4 may have been manipulated.
The income statement and summarised statement of changes in equity of DM, with comparatives, for the year ended 31 December 20X4, and a statement of fi nancial posi-tion, with comparatives, at that date are as follows:
DM: Income statement for the year ended 31 December 20X4
20X4 20X3$m $m
Revenue, net of sales tax 1,255 1,220Cost of sales (1,177) (1,145)Gross profi t 78 75Operating expenses (21) (29)Profi t from operations 57 46Finance cost (10) (10)Profi t before tax 47 36Income tax expense (14) (13)Profi t for the period 33 23
DM: Summarised statement of changes in equity for the year ended 31 December 20X4
20X4 20X3$m $m
Opening balance 276 261Profi t for period 33 23Dividends (8) (8)Closing balance 301 276
DM: Statement of fi nancial position as at 31 December 20X4

INTERPRETATIO
N O
F FINA
NC
IAL STATEM
ENTS
403FINANCIAL MANAGEMENT
20X4 20X3$m $m $m $m
Non-current assetsProperty, plant and equipment 580 575Goodwill 100 100
680 675Current assetsInventories 47 46Trade receivables 12 13Cash 46 12
105 71785 746
Issued capital and reservesShare capital 150 150Retained earnings 151 126
301 276Non-current liabilitiesInterest-bearing borrowings 142 140Deferred tax 25 21
167 161Current liabilitiesTrade and other payables 297 273Short-term borrowings 20 36
317 309785 746
Notes1. DM’s directors have undertaken a reassessment of the useful lives of non-current
tangible assets during the year. In most cases, they estimate that the useful lives have increased and the depreciation charges in 20X4 have been adjusted accordingly.
2. Six new stores have been opened during 20X4, bringing the total to 42.3. Four key ratios for the supermarket sector (based on the latest available fi nancial state-
ments of twelve listed entities in the sector) are as follows: (i) Annual sales per store: $27.6 million (ii) Gross profi t margin: 5.9% (iii) Net profi t margin: 3.9%(iv) Non-current asset turnover (including both tangible and intangible non-current
assets): 1.93
Requirements(a) Prepare a report, addressed to the investor, analysing the performance and position
of DM based on the fi nancial statements and supplementary information provided above. The report should also include comparisons with the key sector ratios, and it should address the investor’s concerns about the possible manipulation of the 20X4 fi nancial statements. (20 marks)
(b) Explain the limitations of the use of sector comparatives in fi nancial analysis.(5 marks)
(Total marks � 25)

This page intentionally left blank

405
16 Solutions to Revision Questions
Solution 1 Report on the fi nancial statements of SDB for the year ended 31 July 20X6
Requirements (a) Joint ventures, according to IAS 31, fall into three principal categories: jointly control-
led assets, operations and entities. Joint control arises where decisions must be made unanimously between the controlling parties, and no one party is dominant. It appears that during the year, SDB has invested in a jointly controlled entity. A jointly control-led entity is a venture involving the establishment of an entity in which each venturer has an interest. The entity could be, for example, a partnership or a limited liability cor-poration. IAS 31 prefers the adoption of the proportionate consolidation method: this involves combining the entity’s share of assets, liabilities, income and expenses with its own assets, liabilities and so on. However, it also permits the use of the equity method which involves recognising the investment (at cost plus share of any subsequent profi ts less amounts distributed) on one line in the statement of fi nancial position, with a one line entry in the income statement showing the share of profi ts in the joint venture for the period. The proportionate consolidation method has the advantage that it results in fi nancial statements that show the assets, liabilities and profi ts over which the entity has either control or joint control.
IAS 31 permits the use of equity accounting because it recognises the argument that joint control is not the same as control. In SDB’s case, its directors may feel that they exert signifi cant infl uence rather than joint control. However, it is also possible that the directors wish to avoid augmenting, for example, liabilities by including those under joint control because it would provide a less positive view of the entity. (Note: where equity account-ing is adopted, IAS 31 requires extensive disclosure by note of the amounts of assets and liabilities in the joint venture. Therefore, it should be possible to adjust the statement of fi nancial position fi gures to an approximation of proportionate consolidation.)
(b) The position of the business has deteriorated in some respects between 20X5 and 20X6. As you pointed out, the cash balance has declined by almost $9 million. This is not necessarily a problem, of course: cash that is not needed in the working capi-tal cycle should be used for investment in profi table opportunities. There appears to have been some investment in property, plant and equipment (the net book value has increased by $2.7 million – 15.7%), but the principal investment has been in the joint venture. The income statement shows that this investment has resulted in substantial
INTE
RPRE
TATI
ON
OF
FIN
AN
CIA
L ST
ATEM
ENTS
SOLUTIONS TO REVISION QUESTIONS F2406
losses so far, but it is possible that the venture will show improved results in its sec-ond year of operation. Overall, however, it is clear that profi tability is reduced, and if this reduction continues into the longer term it will have an effect upon the business’s position and level of risk. The non-current asset turnover ratio has worsened, indicat-ing that the new investment in property, plant and equipment has not yet paid off in terms of higher revenues.
Another substantial outgoing during the year was the payment of a dividend. This was in excess of the profi t for the period for the year ended 31 July 20X5, and it is likely to be diffi cult for the business to sustain a dividend at that level unless profi tabil-ity improves signifi cantly.
Working capital management has declined in effectiveness. Both inventory and receivables turnover are high in absolute terms and have worsened signifi cantly during the year. Inventory, on average, spends nearly 165 days or 5.5 months on the premises. There may be operational reasons for this, but it could also suggest that management is not in full control of the current assets. While the current and quick ratio suggest no immediate problems, both have declined substantially in the year.
The description attached to the loan notes shows that they are payable between the years 20X8 and 20Y0. It is quite possible that the directors plan to replace them with other long-term loans. However, if the fall in profi tability and the deterioration in working capital management were to continue, a lender might require higher inter-est rates to refl ect increased risk. The interest rates on the current loan appear to be around 9%. Interest cover is not a problem at the moment, but, again, this ratio has declined over the year because of the reduction in profi tability.
The contingent liability is, indeed, worrying. Such liabilities would be recognised (that is, would appear in the statement of fi nancial position) only where the assessment of probability of adverse outcome exceeded 50%. The fact that the contingent liability is noted means that the probability of an adverse outcome is assessed at less than 50%. If the full amount of $10 million were to be payable the outlook for the business could be very poor. If a major product failure were to be proven, it is likely to have a very bad effect on sales of similar products, and could even result in the closure of the busi-ness. Even if other product sales are not affected, the business would be left with the problem of how to fi nd the very large sum required. It is not immediately clear how this could be done, especially as the outcome of the case may very well coincide with the redemption of loan notes.
Conclusion While the business is currently solvent, and, indeed, has a positive cash balance of $3.1 million, the position in the slightly longer term could become very much worse. The product lia-bility case represents a severe threat to the business. Most indicators already show a wors-ening position, and the directors need to address, as a matter of urgency, the disappointing joint venture results, the general decline in profi tability and the poor working capital management.

INTERPRETATIO
N O
F FINA
NC
IAL STATEM
ENTS
407FINANCIAL MANAGEMENT
Appendix
20X6 20X5
Inventory turnover 8,300/18,400 � 365 � 164.6 days 6,900/18,000 � 365 � 139.9 days
Receivables turnover 4,700/25,200 � 365 � 68.1 days 4,100/25,300 � 365 � 59.1 days
Current ratio 16,100/5,020 � 3.2 24,000/5,060 � 4.7
Quick ratio (16,100 � 8,300)/5,020 � 1.6 (24,000 � 6,900)/5,060 � 3.4
Gearing 13,600/24,880 � 100 � 54.7% 13,000/23,140 � 100 � 56.2%
Asset turnover 25,200/19,900 � 1.27 25,300/17,200 � 1.47
Interest cover (6,800 � 970 � 1,750)/1,220 � 3.3 (7,300 � 1,030 � 1,720)/1,140 � 4.0
Solution 2 Requirements (a) Table: key ratios before and after adjustment for GAAP differences
AXZ DCB GFE
Before After Before After adjusting adjusting adjusting adjusting
Gross profi t margin 32.5% 31.6% 35.1% 36.4% Unchanged PBT/Sales % 17.6% 17.6% 21.2% 19.1% 18.9% Return on equity 30.3% 24.8% 25.9% 21.8% 22.6% ROTCE 24.7% 19.5% 20.8% 18.8% 18.8% NCA turnover 0.83 1.13 1.0 0.92 Unchanged Gearing 31.1% 37.0% 32.2% 33.7% 40.1%
Workings (W1) Ratios before adjustment
AXZ DCB GFE
Gross profi t margin 2,700/8,300 � 100 � 32.5%
600/1,900 � 100 � 31.6%
800/2,200 � 100 � 36.4%
PBT/Sales % 1,461/8,300 � 100 � 17.6%
335/1,900 � 100 � 17.6%
420/2,200 � 100 � 19.1%
ROE 1,461/4,820 � 100 � 30.3%
335/1,350 � 100 � 24.8%
420/1,931 � 100 � 21.8%
ROTCE (1,461 � 105)/(4,820 � 1,500) � 100 � 24.7%
(335 � 25)/(1,350 � 500) � 100 � 19.5%
(420 � 65)/(1,931 � 650) � 100 � 18.8%
NCA turnover 8,300/9,950 � 0.83 1,900/1,680 � 1.13 2,200/2,400 � 0.92 Gearing 1,500/4,820 � 100 �
31.1% 500/1,350 � 100 � 37.0%
650/1,931 � 100 � 33.7%

INTE
RPRE
TATI
ON
OF
FIN
AN
CIA
L ST
ATEM
ENTS
SOLUTIONS TO REVISION QUESTIONS F2408
(W2) Adjustments to DCB’s depreciation and non-current assets
Non-current assets at net book value � $1,680,000, after an average 3 years ’ deprecia-tion out of an 8 year estimated life. NBV � 5/8 � cost, so cost � $1,680,000 � 8/5 � $2,688,000. Annual depreciation charges on this basis � $2,688,000 � 12.5% � $336,000.
If a rate of 10% SL depreciation is applied, net book value would be as follows:
$2,688,000 � 7/10 � $1,881,600. Annual depreciation charges on this basis � $2,688,000 � 10% � $268,800.
NBV would increase by $1,881,600 � $1,680,000 � $201,600 Equity would increase to $1,551,600 ($1,350,000 � $201,600)
Cost of sales would decrease by the difference in depreciation charges: $1,300,000 � $336,000 � $268,800 � $1,232,800.
Gross profi t would be: $1,900,000 � $1,232,800 � $667,200. Profi t before tax would be $667,200 � $60,000 � $180,000 � $25,000 � $402,200
(W3) Revised ratio calculations for DCB
DCB
Gross profi t margin 667.2/1,900 � 100 � 35.1% PBT/Sales % 402.2/1,900 � 100 � 21.2% ROE 402.2/1,551.6 � 100 � 25.9% ROTCE (402.2 � 25)/(1,551.6 � 500) � 100 � 20.8% NCA turnover 1,900/1,881.6 � 1.0 Gearing 500/1,551.6 � 100 � 32.2%
(W4) Adjustments in respect of reclassifi cation of GFE’s fi nancial instrument
Equity reduces from $1,931,000 to $1,831,000 Non-current liabilities increase from $650,000 to $750,000 Finance costs increase from $65,000 to $75,000 Profi t before tax decreases from $420,000 to $415,000.
(W5) Revised ratio calculations for GFE
GFE
Gross profi t margin Remains the same PBT/Sales % 415/2,200 � 100 � 18.9% ROE 415/1,831 � 100 � 22.6% ROTCE (415 � 70)/(1,831 � 750) � 100 � 18.8% NCA turnover Remains the same Gearing 750/1,831 � 40.1%
(b) Report on fi nancial statement information for AXZ, DCB and GFE: fi nancial year ended 30 September 20X6
Before any adjustment is made in respect of depreciation, DCB’s ratios indicate a poorer performance and position than GFE in several important respects: gross margin, profi t before tax as a percentage of sales and gearing are all worse than GFE’s, and all ratios, with the exception of non-current asset turnover are worse than AXZ’s.

INTERPRETATIO
N O
F FINA
NC
IAL STATEM
ENTS
409FINANCIAL MANAGEMENT
After adjustment, however, DCB’s ratios are much improved, especially once adjust-ments in respect of GFE’s fi nancial instruments are made. The adjusted fi gures show that both DCB and GFE produce signifi cantly better profi t margins than AXZ. DCB’s profi t before tax as a percentage of sales and return on equity are both superior to those of the other entities. Non-current asset turnover in DCB has reduced following the increase in net book value because of the depreciation adjustment. However, it is still better than the equivalent for the other entities. DCB’s gearing percentage is similar to that of AXZ; both are lower than GFE’s which is signifi cantly higher following the reclassifi cation of some of the equity to debt. Interest cover (see appendix) would not give cause for concern in any of the entities, but GFE’s is signifi cantly lower than in the other two entities.
On most of the key ratios, DCB appears to be the preferable acquisition target. Return on equity and return on total capital employed are both lower, and gearing is slightly higher than in AXZ. However, the effect overall on the new group’s ratios might not be regarded as material. On the other hand, even where the ratios are more advantageous, the overall effect on group ratios might not make much of a difference. For example, if AXZ and DCB were to combine, total profi t before tax would be $1,461,000 � 402,200 � $1,863,200, all other things being equal. Total sales would be $8,300,000 � $1,900,000 � $10,200,000. The group profi t as a percentage of sales fi gure would be $1,863.2/10,200 � 100 � 18.3%. This is only 0.7% higher than AXZ’s existing fi gure.
Further investigation would be needed before making a fi nal decision. DCB has fol-lowed the tax treatment in depreciating its non-current assets; however, it is possible that an average asset life of eight years actually represents a better assessment of DCB’s own asset base. Also, it is worth noting that DCB does appear to be subject to a signifi cantly higher rate of income tax than the other two entities (see appendix). This perception requires further investigation, and detailed tax advice should be obtained before the direc-tors of AXZ make their decision.
Appendix Additional ratio calculations
AXZ DCB GFE
Income tax expense as a percentage of profi t before tax
336/1,461 � 100 � 23.0%
134/335 � 100 � 40%
105/415 � 100 � 25.3%
Interest cover (2,700 � 252 � 822)/105 � 15.5
(667.2 � 50 � 180)/25 � 17.5
(800 � 65 � 250)/70 � 6.9
Solution 3 (a) Report
To: The Finance Director From: Assistant Subject: PJ Gamewriters
PJ Game writers is a very successful business. Between 20X4 and 20X5 its revenue increased by 26.5% and its gross profi t by 30.4%. However, unusually, cost of sales includes directors ’ remuneration, presumably because the directors are directly involved

INTE
RPRE
TATI
ON
OF
FIN
AN
CIA
L ST
ATEM
ENTS
SOLUTIONS TO REVISION QUESTIONS F2410
in games writing. If director’s remuneration is excluded from the analysis, gross profi t restated increased by 26.0%, that is, very much in line with the revenue increase.
Games writers ’ employment costs comprise a signifi cant part of cost of sales (55.1% � 20X4: 52.9%). If the business were to be taken over by OPQ this expense might change if new writers were brought in to replace Paul and James. Production costs have increased to 17% of cost of sales (20X4: 15.4%). These costs are out-sourced, and it may be worth considering whether it is cost effective to continue such arrangements. Distribution costs are, presumably, included within cost of sales, prob-ably under the category ‘ other costs ’ .
Operating expenses have increased by 33.9% between 20X4 and 20X5, that is, at a faster rate than revenue. Given that some of these expenses might be expected to be fi xed, this rate of increase would require further information and explanation. Despite this increase, net profi t margin has increased slightly, helped by an increase in interest receivable.
Turning to the statement of fi nancial position, the position appears healthy. No cash fl ow statement is provided, but nevertheless, it is clear that the business generates sub-stantial amounts of cash. During the 20X4-5 fi nancial year, PJ managed to pay sub-stantial amounts of dividend, directors ’ remuneration and income tax, while increasing its cash balance by almost $200,000. The current ratio has improved by a large margin from 1.26:1 at the 20X4 year end to 2.03:1. There is little change to inventories which, in any case, constitute a relatively minor element in current assets, but trade receivables has increased sharply, representing 60.1 days of sales (20X4: 53.6 days). It might be possible to make a signifi cant improvement in this collection period.
Return on equity is very substantial in both years. However, this ratio should be treated with caution. Equity has been increased by $350,000 for the purposes of the calculation in both years so as to produce a more realistic result. The fi gure of $350,000 is strictly applicable only in 20X5, however, and the equivalent fi gure in 20X4 might well have been lower. It should also be appreciated that a higher asset valuation would give rise to additional depreciation charges which would reduce prof-its. In addition it is worth noting that the value of equity would almost certainly be substantially higher if the intangible asset of software copyrights were to be included.
Conclusion PJ has expanded signifi cantly whilst managing to maintain its margins and a sound fi nancial position. The business is cash rich and has needed no external fi nancing. It appears to be a good prospect for acquisition and further detailed investigation is recommended.
Appendix: calculations
1. Cost of sales analysis
20X5 % of total 20X4 % of total $’000 $’000 Games writers ’ employment costs 700 55.1 550 52.9 Production costs 215 17.0 160 15.4 Directors ’ remuneration 200 15.7 200 19.2 Other costs 155 12.2 130 12.5 1,270 100.0 1,040 100.0

INTERPRETATIO
N O
F FINA
NC
IAL STATEM
ENTS
411FINANCIAL MANAGEMENT
2. Gross profi t margin (excluding directors ’ remuneration from cost of sales)
20X5 20X4 $’000 $’000
Gross profi t (as stated) 1,523 1,168 Add : directors ’ remuneration 200 200 Gross profi t restated 1,723 1,368 Gross profi t margin 1,723/2,793 � 100 � 61.7% 1,368/2,208 � 100 � 62.0%
3. Operating expenses as a percentage of revenue
20X5: 415/2,793 � 100 � 14.9% 20X4: 310/2,208 � 100 � 14.0%
4. Net profi t margin (excluding directors ’ remuneration from profi t)
20X5 20X4 $’000 $’000
Net profi t (as stated) 784 570 Add : directors ’ remuneration 200 200 Net profi t restated 984 770 Net profi t margin 984/2,793 � 100 � 35.2% 770/2,208 � 100 � 34.9%
5. Current ratio
20X5: 744:367 � 2.03:1 20X4: 403:320 � 1.26:1
6. Trade receivables collection period
20 5460
2 793365 60 1X days
,.� �
20 4324
2 208365 53 6X days
,.� �
7. Return on equity (including potential revaluation of $350,000)
20 51 115
987 350100 83 4X
,. %
�� �
20 4860
703 350100 81 7X
�� � . %
Directors ’ remuneration may not be relevant to the analysis here. ROE excluding directors ’ remuneration is:
20 51 115 200
987 350100 98 4X
,. %
�
�� �
20 4860 200
703 350100 100 7X
�
�� � . %
(b) Financial analysis is almost always hampered by limitations. In the case of PJ there are some specifi c limitations in respect of the scope of the information reported in the

INTE
RPRE
TATI
ON
OF
FIN
AN
CIA
L ST
ATEM
ENTS
SOLUTIONS TO REVISION QUESTIONS F2412
annual fi nancial statements. The value of the software titles generated during the life of the business is likely to be a substantial sum. As noted in part (a) it is not possible to calculate a realistic return on equity fi gure without this information. If OPQ is going to enter into serious negotiations to purchase PJ, the value of the copyrights should be established at an early stage. A further limitation is that fi nancial statements place no value on the human assets employed within the business. However, where a business like PJ is to be taken over, such elements should, in any event, be downplayed. Paul and James will, presumably, leave the business, and it may not be possible to retain the services of all of the software writers.
A more detailed breakdown of certain elements in the income statement would be helpful in analysing the performance of the business. Within cost of sales ‘ other costs ’ constitute a signifi cant item in both years, and the nature of operating expenses is obscure.
There are general limitations to the value of fi nancial statements to the analyst. Some of the limitations relevant to PJ include the following:
(i) Financial statements are prepared for the common needs of most users. Where they are being used to assist in making a specifi c decision (such as whether or not to invest in an entity, as in this case) the information they contain is likely to be found wanting.
(ii) Timeliness is often a problem. PJ’s fi nancial statements have apparently been prepared within a quite reasonable timeframe. However, this is clearly a business experiencing rapid growth, and it is likely that more current information will be needed, perhaps in the form of management accounts, in order to make an informed decision.
(iii) It is usually helpful to have a more complete picture than that provided by a single set of fi nancial statements. Also, it is important to obtain a full set of notes to the fi nan-cial statements as these often contain useful information. In the case of PJ, complete sets of the fi nancial statements since the business was founded would be helpful.
Solution 4(a)
Report on the ratios and their implicationsTo: The board of directors of AcquirerFrom: An accountantSubject: Proposed acquisition of TargetDate: 19 November 20X3
Following our earlier discussions, I have computed key ratios for Target and some similar entities. These are attached as an appendix to this report.
It is notable that the gross profi t margin of Target is towards the upper end of the range of comparison, while the net margin is towards the lower end. The relatively high gross margin could be due to a sales mix of relatively more profi table products or, alternatively, because of a tighter than average control of manufacturing costs. Given apparent prob-lems in controlling other operating expenses (see below) a different sales mix is perhaps the most likely explanation.

INTERPRETATIO
N O
F FINA
NC
IAL STATEM
ENTS
413FINANCIAL MANAGEMENT
The superior performance at gross margin level is largely negated by an apparently extremely poor control of other operating expenses. These seem to be running at around 13% of revenue as against 7 or 8% for the entities in the sample. It may be that the costs are being incurred to fi nance future growth and cannot be capitalised under existing accounting standards. However, they could equally be due to inherent ineffi ciencies and this issue will certainly require further investigation before proceeding further.
Return on capital is slightly higher than the average for the sample and given that net profi t margin is towards the lower end, this implies a ratio of revenue to capital that is towards the upper end of the range revealed by the sample. This is quite encouraging as capital investment does appear to produce strong revenue streams provide costs can be controlled.
Interest cover is towards the lower end of the range of comparison and gearing is towards the upper end. There is a good chance these two issues are linked as other things being equal you would expect interest cover to vary in inverse proportion to gearing. The level of gearing may not be a key factor in an acquisition decision as we may well wish to refi nance the entity if it becomes a subsidiary.
Dividend cover is relatively high compared with other entities in the sample. This could be due to strategic decision by current management to retain a greater proportion of prof-its, but it could equally well be indicative of a strain on liquidity and this issue would require further investigation. However, the level of past divided payout will not necessar-ily be a key future issue since, if Target becomes our subsidiary, we will be in a position to determine divided levels within legal constraints.
Both inventory turnover and receivables days are towards the higher end of the perform-ance range. This is a good sign which might have been expected given the relatively high turnover of capital that Target seems to enjoy.
I hope you fi nd this report useful. Please do not hesitate to contract me if you have any queries regarding its contents.
Yours sincerely Accountant
(b)Limitations of the ratiosOne key factor is the appropriateness of the sample as a basis for comparison with Target. It is inevitably subjective to identify 10 entities that are valid for this purpose. It is rare to fi nd two entities with exactly the same operating environments and there may well have been a number of other equally valid samples of 10 entities that would have produced dif-ferent ratios and therefore a different interpretation.
Another issue is the extent to which conventional ratios are computed from the results of a single accounting period. Different entities have different year ends and in the case of Target the most recently available fi nancial statements are nearly a year old. The lat-est available fi nancial statements could be for a period that is not typical of the trend of performance over a longer period due to unusual or non-recurring items. There is also the inherent problem of computing a ratio such as return on capital, where a performance fi g-ure, like profi t, is expressed as a ratio or percentage of a position fi gure like capital.
A further key factor to bear in mind is that, despite the existence of an increasingly com-plex regulatory framework, entities still have considerable discretion in the manner that the fi nancial statements are prepared and presented given the signifi cant amount of judgement that is involved in selecting accounting policies.

INTE
RPRE
TATI
ON
OF
FIN
AN
CIA
L ST
ATEM
ENTS
SOLUTIONS TO REVISION QUESTIONS F2414
A fi nal factor to bear in mind is that fi nancial ratios inevitably focus on historical fi nan-cial aspects. Many useful performance indicators are non-fi nancial in nature. It is possible to compute non-fi nancial ratios, but these are often diffi cult to compare between entities given the voluntary nature of much non-fi nancial information that is currently disclosed. It is also questionable as to how much historical fi nancial data can contribute to a future acquisition decision.
The fi nancial statements themselves would be of some assistance in overcoming the defects mentioned in this report. They would provide information on the key account-ing policies followed by the entity and would provide separate disclosure of non-recurring items. They may well also provide a degree of non-fi nancial information and some predic-tions about the future prospects of the entity. However, as stated earlier, this information is unlikely to be as highly regulated as the historical fi nancial data and so its reliability may be questioned.
Solution 5(a)Report to Investor on DMDate: May 20X5Note: The ratio calculations referred to in the report can be found in the Appendix. In 20X4 DM has expanded rapidly, increasing the number of its stores from 36 to 42. The annual sales fi gure per store has fallen substantially since 20X3; however, this may be because the new stores have been open for only part of the year. Even so, DM’s annual sales per store is signifi cantly higher than the sector average. However, it may simply have larger stores than average.
Gross profi t margin has increased slightly, but the increase in operating profi t margin is substantial. Operating expenses have actually fallen by over 27% in the year. The expenses may have been affected by the lengthening of most non-current asset lives, and the conse-quent decrease in depreciation charges.
The review of depreciation has resulted in higher profi ts and it is certainly possible that the directors have deliberately manipulated the results. Also, the signifi cant decrease in operating expenses may indicate that some items of expenditure have been classi-fi ed as capital rather than revenue in nature. This method of creative accounting can be quite diffi cult to confi rm using the information available in a set of fi nancial statements. Nevertheless, it would be sensible to conduct further comparisons using information in the notes to the fi nancial statements.
Net profi t margin is signifi cantly lower in both years than the sector average, despite higher than average gross profi t margin. It is noticeable, however, that the net profi t mar-gin has increased from 1.9% to 2.6% in the year, and this could, for reasons already given, be a result of deliberate manipulation.
The current ratio in both years is low. It appears that suppliers are being squeezed for credit. The cash level is higher in 20X4 than in 20X3. It appears from the statement of fi nancial position that suppliers may be providing even longer credit than usual. Trade and other payables have increased by over 8%, whereas the increase in cost of sales is only 2.8%. Gearing does not appear to give cause for concern.
INTERPRETATIO
N O
F FINA
NC
IAL STATEM
ENTS
415FINANCIAL MANAGEMENT
Despite several new store openings the level of property, plant and equipment remains almost the same. It may be that the majority of the investment in new stores was made during 20X3. Non-current asset turnover has improved although it has not quite reached the sector level.
SummaryDM is a profi table and rapidly expanding entity. Its margins compare reasonably well with the sector average although net profi t margin is relatively poor. It is possible that the enti-ty’s directors have deliberately manipulated the fi nancial statements in order to produce better results in the hope of affecting the offer price in a takeover bid. They do stand to benefi t personally and may be keen to sell the company in order to realise a lump sum upon retirement. However, it is not possible to state conclusively that the fi nancial state-ments have been manipulated. Further investigation would be required, especially, if suf-fi cient information is available, to ascertain the reasons for the fall in operating expenses.
APPENDIX: ratio calculations
Ratio 20X4 20X3 Sector comparative
Gross profi t 78/1,255 � 100 6.2% 75/1,220 � 100 6.1% 5.9%Operating profi t margin 57/1,255 � 100 4.5% 46/1,220 � 100 3.8% N/ANo of stores 42 36 N/AAnnual sales per store 1,255/42 $29.9 m 1,220/36 $33.9 m $27.6 mNet profi t margin 33/1,255 � 100 2.6% 23/1,220 � 100 1.9% 3.9%Non-current asset turnover 1,255/680 1.85 1,220/675 1.81 1.93Current ratio 105/317 0.33:1 71/309 0.23:1 N/AGearing (debt/equity) 142/301 � 100 47.2% 140/276 � 100 50.7% N/A
Note: (a) The gearing calculation could also include short-term borrowings as part of debt capital.
(b) Sector comparatives often provide useful information for the analyst, but should be treated with some caution for the following reasons:
● The comparatives are usually, as in this case, based on an average of entities. Averages can be skewed by one or two atypical cases.
● No two entities are completely alike. For example, DM trades in only one of six prov-inces in its country. Economic conditions may vary between provinces, and so it may not be valid to compare DM using averages based on entities operating in other provinces.
● Although international standard setters have attempted to reduce the range of account-ing choices available, there remain, quite legitimately, areas of accounting policy differ-ence between entities.
● There are different ways of calculating some of the common accounting ratios. The ana-lyst must be sure that the method of calculation is consistent.
● Information published for the sector may not contain all the ratios that the analyst would ideally require. For example, in this case, it would be useful to know the average gearing and current ratios.

This page intentionally left blank

17
Scope of External Reporting

This page intentionally left blank

419
17 LEARNING OUTCOMES
After studying this chapter students should be able to:
� describe pressures for extending the scope and quality of external reports to include prospective and non-fi nancial matters, and narrative reporting generally;
� explain how fi nancial information concerning the interaction of a business with soci-ety and the natural environment can be communicated in the published accounts;
� discuss social and environmental issues which are likely to be most important to stakeholders in an organisation;
� explain the process of measuring, recording and disclosing the effects of exchanges between a business and society – human resource accounting.
17.1 IntroductionThis chapter covers discusses the current pressures that exist to extend the scope and qual-ity of annual reports. 17.2 includes discussion of user needs in the context of a increased volume of reporting, the need for forecast information, the effect of accounting scandals and the move towards corporate social reporting. Section 17.3 covers the IASB moves to extend narrative reporting, with the management commentary. The section also looks at the example set in the UK with the Operating and Financial Review (OFR) and the Business Review and looks at their current status. Section 17.4 examines social accounting and reporting as a general introduction to later sections in the chapter. Section 17.5 looks at accounting for the impacts of the entity on the natural environment. Section 17.6 exam-ines various aspects of human resource accounting, including intellectual capital reporting, and human asset accounting. Section 17.7 looks at the Global Reporting Initiative.
17.2 The pressure to extend external reporting The annual reports of entities have never been more complex and comprehensive. Despite, or perhaps partly because of, the growth in disclosure that has taken place in recent years, there
Scope of External Reporting

STUDY MATERIAL F2420
SCO
PE O
F EX
TERN
AL
REPO
RTIN
G seems to be an increasing need for different approaches to disclosure of information. Part of the problem lies in a fundamental inconsistency between the overall objective of fi nancial statements and the type of information that has traditionally been provided. The IASB’s Framework states that the objective of fi nancial statements is ‘ to provide information about the fi nancial position, performance and changes in fi nancial position of an entity that is useful to a wide range of users in making economic decisions ’ . However, fi nancial statements, by their very nature, tend to be backward looking in that they report on transactions that have already taken place. In order to be able to make economic decisions, users may feel that they need informa-tion that has an orientation towards the future. This may be provided to a limited extent by the historical information reported in the fi nancial statements: for example, a business that has always turned in a steady profi t may perhaps be relied upon to do so again in the future.
17.2.1 Inclusion of forecasts in annual reports Ideally, perhaps, users would like to see the inclusion of quantifi ed forecast information as part of the annual report. However, the provision of such information is likely to be unac-ceptable to the management of commercial entities. If a business were to include an opti-mistic forecast which was not subsequently met, the fi nancial market’s perception is likely to be that management is incompetent. There might very well be an adverse effect on the share price, which would hardly be of benefi t to shareholders. If, on the other hand, the forecast were too pessimistic, the outcome, in this case too, might be an adverse effect on the share price, resulting in an undervaluation of the business. The sensitivity of share prices to such events is suggested by the fact that there is often an adverse reaction in the fi nancial market where a listed entity’s preliminary announcement does not meet analysts ’ expectations.
Two other potentially sound reasons for not including forecasts are cost and confi denti-ality. The provision of the already complex level of disclosures in annual reports is expen-sive and the inclusion of forecast information would be likely to signifi cantly increase costs. Also, the managers of commercial entities are likely to be very reluctant to disclose commercially sensitive, quantifi ed, information about future plans.
17.2.2 The effect of accounting scandals Whenever there is a major accounting scandal, the usual response of regulatory authorities is to increase regulation resulting in increased levels of disclosure. For example, the Enron case in the United States has resulted in a fundamental reappraisal of regulation, and has been largely responsible for the promulgation of the Sarbanes–Oxley Act which signifi -cantly increases regulation of fi nancial reporting and auditing. Increased regulation usually results in increased quantities of disclosure.
A related effect is that over the last decade or so, there has been an increased demand for listed entities to demonstrate good corporate governance. Although there has not, as yet, been a unifi ed international response to this demand, many countries have taken measures to improve corporate governance via legislation or the implementation of voluntary codes of conduct. The improvements are often accompanied by increased levels of disclosure.
17.2.3 Corporate social responsibility The original model of the corporation envisaged a relationship that subsisted principally between the entity, its management and its owners. The separation between owners and managers resulted in some tension, but this could be at least partially addressed by fi nancial

421FINANCIAL MANAGEMENT
SCO
PE OF EXTERN
AL REPO
RTING
reporting and by the imposition of external audit requirements. However, throughout the latter half of the twentieth century this model looked increasingly old-fashioned. Although some authorities continued to maintain that a corporate entity should be responsible only for increasing shareholder wealth, the idea took hold that corporate entities have ‘ stake-holders ’ , a much more broadly based group of interested parties, and that they bear respon-sibilities towards those stakeholders.
Milton Friedman, the economist, is famous for, amongst other things, asserting the val-ues of the old model of the corporation. In an article in 1970 ( ‘ The social responsibility of business to increase its profi ts ’ , The New York Times Magazine ), he argued as follows:
What does it mean to say that the corporate executive has a ‘ social responsibility ’ in his capacity as a busi-nessman? If this statement is not pure rhetoric, it must mean that he is to act in some way that is not in the interest of his employers [the shareholders]. ... Insofar as his actions in accord with his ‘ social responsibility ’ reduce returns to stockholders, he is spending their money ...
The counter-arguments to Friedman’s view include the following points:
● Modern corporations are so powerful that they are able to infl uence every aspect of com-munity life. Power must, in a just society, be accompanied by responsibility.
● The community bears the hidden cost of many corporate activities. For example, if busi-nesses pollute the environment they do not, unless there is some legal constraint, have to bear the cost of cleaning up. This is borne through public expenditure and is fi nanced by general taxation. The public therefore has some right to hold corporations accountable.
● The corporate business is a legal person, but in fact this is a convenient fi ction. Businesses should not be able to hide behind this fi ction in order to avoid the conse-quences of decisions made by managers (who, obviously, are real people).
● The old-fashioned view of the corporation is too simplistic to operate successfully in a complex modern society.
17.2.4 Demands for more information The pressure to extend the scope of reporting results in demands by stakeholders for the following types of information:
1. a general increase in narrative in fi nancial statement; 2. an increase in the depth of commentary provided by management on both the past
performance of the business and its prospects for the future; 3. more, better quality, and more consistent reporting on environmental and social issues.
In the remainder of this chapter we will look at some of the ways in which entities can, and sometimes do, provide more information to their stakeholders.
17.3 Increasing the scope of reportingIn October 2005, the IASB issued a discussion paper on ‘Management commentary’ (this is a term synonymous with ‘Operating and fi nancial review’ in the UK or ‘Management discussion and analysis’ which is the term commonly used in the USA).
The likely objective of the management commentary is to assist current and potential investors in assessing the strategies adopted by the entity and the potential for achiev-ing these strategies. The management would set out their analysis of the business, which
STUDY MATERIAL F2422
SCO
PE O
F EX
TERN
AL
REPO
RTIN
G supplements and complements the fi nancial statements but taking account of likely future activities. It would be intended that the management commentary be comprehensive, focusing on matters that are relevant to investors and should be understandable, neutral and balanced, comparable and reliable.
Initial indications are that the management commentary would not be included in IFRS but would have a voluntary but best practice status. The terms ‘neutral’ and ‘balanced’ are obviously less onerous than achieving fair presentation, which is what the auditor is charged with ensuring. The issue of verifi ability of the information that is included in the management commentary will be a diffi cult one as much of what is likely to be covered will be forward looking and so not necessarily verifi able. It is intended to be ‘through the management’s eyes’ and so the term ‘balanced’ is used to refl ect the fact that the commen-tary is unlikely to avoid some element of bias as the management is likely to have a posi-tive outlook on their strategies.
The current status of this, and all its other projects, may be determined by accessing the IASB’s website (www.iasb.org). At the time of updating this Learning System the IASB is planning to issue an exposure draft in the second quarter of 2009.
In order to appreciate the content that is likely to form such a report, it is useful to look at what has been introduced in the UK, namely the Operating and Financial Review and the Business Review.
17.3.1 The Operating and Financial Review In 1993, the Accounting Standards Board (ASB) in the UK issued a statement on a form of disclosure known as the Operating and Financial Review (OFR). An OFR is intended to set out the directors’ analysis of the business, so as to provide both an historical and a prospective analysis of the business as seen by senior management. The inclusion of such a review as part of entities’ annual reports was not mandatory. However, the Company Law Review in the UK proposed that all UK companies over a certain size should publish an OFR, and in 2005 a statutory instrument (a statutory instrument is an amending piece of government legislation – in this case amending existing companies’ legislation in the form of the Companies Act 1985) was published that would require listed companies to publish an OFR.
The statutory instrument was supported by detailed guidance in the form of Reporting Standard 1 Operating and fi nancial review (RS1), which was issued by the ASB in May 2005. However, in November 2005 the Chancellor of the Exchequer, Gordon Brown, made a surprise announcement that the statutory instrument would be withdrawn as part of an effort to cut down on red tape affecting UK businesses. The ASB in consequence converted its RS1 in January 2006 into a Reporting Statement of Best Practice (recently updated to refl ect changes in companies’ legislation in the Companies Act 2006) which altered its status from a standard with mandatory application. The key points from this statement are summarised in the section below.
Many listed companies in the UK choose to disclose the OFR information on a volun-tary basis, notwithstanding the withdrawal of the change to the law.
17.3.2 The Business ReviewThe Companies Act 2006 introduced additional requirements in the Business Review that were brought into force for fi nancial years beginning on or after 1 October 2007.

423FINANCIAL MANAGEMENT
SCO
PE OF EXTERN
AL REPO
RTING
The Business Review has a statutory purpose, which is to inform the shareholders and help them assess how the directors have performed their duties to promote the success of the company.
The Act also requires quoted companies to provide additional disclosures in their Business Review to the extent necessary for an understanding of the development, per-formance and position of the business. The additional disclosures include:
● The main trends and factors likely to affect future developments and activities● Information about employees, environmental matters and social and community issues● Information about contractual arrangements that are central to the company’s activities.
All of these provisions were originally introduced in the OFR.
17.3.3 OFR: the ASB’s reporting statement of best practice
The ASB specifi es that an OFR should be a balanced and comprehensive analysis, consist-ent with the size and complexity of the business, of:
(a) the development and performance of the entity during the fi nancial year; (b) the position of the entity at the end of the year; (c) the main trends and factors underlying the development, performance and position of
the business of the entity during the fi nancial year; and (d) the main trends and factors which are likely to affect the entity’s future development,
performance and position.
The OFR should be prepared so as to assist members (i.e., shareholders) to assess the strat-egies adopted by the entity and the potential for those strategies to succeed. It is thus capa-ble, potentially, of addressing some of the traditional limitations of fi nancial statements, in that it specifi cally examines future business developments.
The ASB sets out the following principles for the preparation of an OFR:The OFR shall:
(a) set out an analysis of the business through the eyes of the board of directors; (b) focus on matters that are relevant to the interests of members (i.e., shareholders); (c) have a forward-looking orientation, identifying those trends and factors relevant to the
members’ assessment of the current and future performance of the business and the progress towards the achievement of long-term business objectives;
(d) complement, as well as supplement, the fi nancial statements in order to enhance the overall corporate disclosure;
(e) be comprehensive and understandable; (f ) be balanced and neutral, dealing even-handedly both with good and bad aspects; (g) be comparable over time.
The principal disclosure requirements are as follows:
(a) the nature of the business, including a description of the market, competitive and regulatory environment in which the entity operates, and the entity’s objectives and strategies;
(b) the development and performance of the business, both in the fi nancial year under review and in the future;

STUDY MATERIAL F2424
SCO
PE O
F EX
TERN
AL
REPO
RTIN
G (c) the resources, principal risks and uncertainties, and relationships that may affect the entity’s long-term value;
(d) the position of the business including a description of the capital structure, treasury policies and objectives and liquidity of the entity, both in the fi nancial year under review and the future.
Some more specifi c requirements relating to particular matters are added to this broad, general description of disclosures. The statement specifi es that information should be included about:
(a) environmental matters (including the impact of the business on the environment); (b) the entity’s employees; (c) social and community issues; (d) persons with whom the entity has contractual or other arrangements which are essen-
tial to the business of the entity; (e) receipts from, and returns to, members of the entity in respect of shares held by
them; and (f ) all other matters directors consider to be relevant.
It can be seen, therefore, that a mandatory OFR would have added very materially to the disclosures of many listed businesses, and that some aspects of the disclosures (notably the environmental and social aspects) would have represented a major development in disclo-sure for many businesses
Advantages and drawbacks of the OFRThe advantages of including an OFR as part of the annual report are as follows:
● Such a statement is a useful summary of information that can be found in a more com-plex form elsewhere in the fi nancial statements.
● It may provide genuinely useful statements of management’s intended business strategy, and suffi cient information to be able to assess the relative success of business strategies to date.
● It may be more likely to be read and absorbed than some other parts of the annual report.
There are, however, some potential drawbacks:
● Users may rely too heavily on the OFR, and may read it in preference to a thorough examination of the detailed fi gures.
● Even though there is a basic template for the OFR, these statements may vary signifi -cantly in practice and may not be readily comparable.
● OFRs currently (both in the UK and elsewhere) have the status of voluntary disclosures and so they suffer from all the general drawbacks of voluntary disclosure (e.g., they may not be prepared on an entirely consistent basis, bad news may be underplayed and so on) .
17.3.4 International developments Many entities outside the UK voluntarily include an OFR as part of their annual report.

425FINANCIAL MANAGEMENT
SCO
PE OF EXTERN
AL REPO
RTING
Example 17.A
Novartis is a major multinational pharmaceuticals entity based in Switzerland. Its fi nancial statements are pre-pared in accordance with IFRS, but it also includes an OFR statement in its annual report. In its 2007 annual report, the OFR runs to 31 pages. It can be accessed at the Novartis website ( www.novartis.com ). The content of this OFR can be summarised as follows:
Factors affecting results. This section includes commentary on competitive conditions, identifi cation of new prod-ucts and exchange rate exposures. Critical accounting policies and estimates. This includes comments on revenue, impairment, derivative fi nancial instruments, investments in associates, pension costs and provisions. Results of operations. This section occupies several pages, commenting on growth, the success of product lines and income and expenses.
Several pages in the OFR contain quantitative information in the form of condensed fi nancial statements, or expanded information about income statement and statement of fi nancial position items. However, the OFR is domi-nated by narrative.
17.4 Social accounting and reporting Reporting of non-fi nancial issues is not a new concept. Accounting theorists for many years now have questioned the role of fi nancial reports. Traditionally, such reports have communicated fi nancial information resulting from transactions (denominated in money values) entered into by the fi rm. Such transactions relate primarily to the exchange of goods and services; they exclude recognition of human capital and the effect of the entity on the social and natural environment.
Society can be seen as a set of sub-systems with which the entity interacts. Interaction with the economic sub-system is generally fairly fully reported. However, traditional fi nan-cial reports have not dealt with interactions with the following sub-systems:
1. The natural environment. A business uses physical resources such as coal, gas, water, air but the full cost of this usage is not refl ected in the fi nancial statements. Firms may have adverse impacts on the environment, but until recently, these effects were not rec-ognised at all in the fi nancial statements.
2. The sociological environment. The way in which fi rms attract human resources, and the use of those resources, has an impact on society. For example, a decision to close a large division will have an adverse impact on local society. On a global level, certain groups of consumers are likely to express preferences against those fi rms that exploit child labour in developing countries.
Social accounting and reporting covers both fi nancial and non-fi nancial aspects of reporting. It is potentially very wide-ranging in its coverage, and might encompass such matters as:
● reporting on the environmental impacts of an entity’s policies; ● measuring and reporting the expected value of future obligations related to rectifi cation
of environmental damage; ● measuring and reporting on the value of human assets in an entity; ● reporting policies and measurements relating to the workforce, for example, the policy
on employment of disabled people, and statistics reporting on the numbers of disabled staff employed;

STUDY MATERIAL F2426
SCO
PE O
F EX
TERN
AL
REPO
RTIN
G ● reporting on an entity’s intellectual capital; ● reports on an entity’s policies on ethical issues.
Note that this is not a complete list of potential social reporting issues. In this chapter we will examine two principal strands in social reporting: fi rst, measuring and reporting the impacts of an entity’s activities on the natural environment, and second, measuring, reporting and disclosing the effects of exchanges between a business and society in the form of human resources. Finally, we will look at an important current development in the fi eld of social reporting: the Global Reporting Initiative.
17.5 Accounting for the impacts of the entity on the natural environment
Environmental accounting is an umbrella term that covers many different aspects of reporting. We can distinguish, broadly, between two aspects:
1. accounting for, and disclosing, fi nancial information relating to the interaction of the entity with its environment;
2. providing non-fi nancial disclosures that assist the user in determining, for example, the nature of the entity’s commitment to sound environmental practice, its record on sus-tainable development and so on.
17.5.1 Measuring and reporting financial information relating to the environment
There is an increasing trend towards holding businesses to account for their activities in relation to environmental damage. For example, the Kyoto accord commits governments around the world to signifi cant reductions in greenhouse gas emissions. The business sector in many countries is currently being targeted by governments to meet emissions reduction targets. These have impacts on many aspects of measurement, reporting and dis-closure, and some of the principal areas are described below.
Taxation-related matters Taxation measures relating to the environment are becoming increasingly common. In the UK, for example, some or all of the following may affect organisations:
1. Climate change levy: This may have the effect of encouraging businesses to improve energy effi ciency and to reduce emissions of carbon dioxide.
2. Landfi ll tax: A landfi ll tax was introduced in 1996. This may have signifi cant fi nancial impacts on the profi tability of those businesses that dispose of large volumes of waste.
3. Capital allowances: For example, there are currently 100 per cent fi rst year allowances for capital expenditure on natural gas refuelling infrastructure.
Accounting for additional costs related to the environment Signifi cant costs may be incurred by, for example, house-builders who build on brown-fi eld land that has previously been contaminated. Highly restrictive planning policies limit

427FINANCIAL MANAGEMENT
SCO
PE OF EXTERN
AL REPO
RTING
the use of greenfi eld sites for building, and so in very densely populated areas (such as England) signifi cant decontamination activity may be required before land can be built on.
Increasingly stringent laws may involve business entities in incurring additional costs in respect of environmental damage they have caused. Where sites are polluted by, for example, mining activities, local legislation is increasingly likely to require reinstatement.
Environmental provisions Sometimes anticipated costs related to environmental damage require provisions. Provisions required in respect of environmental costs are no different from any other provisions, in that they must follow the requirements of IAS 37 Provisions, contingent liabilities and contingent assets. Students should remember the recognition rules in respect of provisions.
A provision should be recognised when:
(a) an entity has a present obligation (legal or constructive) as a result of a past event; (b) it is probable that an outfl ow of resources embodying economic benefi ts will be
required to settle the obligation; (c) a reliable estimate can be made of the amount of the obligation.
The issue of recognition of related non-current assets may occur in respect of environmen-tal provisions, as illustrated in the following example.
Example 17.B
B has commissioned an oil rig. The rig has an estimated useful life of 8 years, and initial commissioning costs are $80 million, all of which are incurred shortly before the year ending 31 December 20X0. B adopts a policy of straight-line depreciation and is assuming a residual value of nil in respect of the oil rig asset. Depreciation will be charged for the fi rst time in the year ending 31 December 20X1. B is obliged to recognise decommissioning and environmental restitution costs totalling $10 million which will occur at the end of the 8-year period. These costs are unavoidable. However, the provision carries with it a related asset, in that the oil rig gives rise to future benefi ts in the form of access to valuable oil resources which will be exploited over the 8-year life of the rig. The appropriate rate of discount is 10% per year.
The amount of the provision required is $10 million, on the basis of estimated future prices 8 years from now. How will the above transactions be refl ected in the entity’s statement of fi nancial position at 31 December 20X0 and 31 December 20X1?
Solution
The discounted NPV of the provision at 31 December 20X0 is $4,670,000 ($10m � discount factor from tables of 0.467).
At 31 December 20X0 extracts from B’s statement of fi nancial position show the following:
$ Non-current assets at cost 84,670,000
Provisions for liabilities and charges Provisions for decommissioning and environmental restitution costs
4,670,000
Both the original cost of the asset ($80 million) and the discounted decommissioning and environmental costs have been capitalised. At this point the effect on the income statement is nil.
One year later, the provision is remeasured to take account of the change in the time value of money (assum-ing that the original estimate of $10 million of costs is still valid). The appropriate discount factor is 0.512, giving a balance on the provision account of $5,120,000. The increase of $450,000 will be charged to the income statement as part of fi nancing charges. It is sometimes referred to as ‘the unwinding of the fi nance charge ’ . In 20X1, the fi rst full year of operation of the oil rig, depreciation will be charged for the fi rst time.

STUDY MATERIAL F2428
SCO
PE O
F EX
TERN
AL
REPO
RTIN
G At 31 December 20X1, extracts from B’s statement of fi nancial position show the following:
$ Non-current assets at cost 84,670,000Less: accumulated depreciation (1/8) 10,583,750 Net book value 74,086,250
Provisions for liabilities and charges
Provision for decommmissioning and environmental restitution costs
5,120,000
The income statement will include the depreciation charge for the year ($10,583,750) and the unwinding of the fi nance charge of $450,000.
Contingent environmental liabilities Many industries are now facing a broad range of potential environmental liabilities. Where those liabilities fi t the defi nition of a provision, they must, of course, be recognised in the fi nancial statements. Some potential liabilities may not, however, meet the recognition cri-teria, but should nevertheless be noted as contingent liabilities.
17.5.2 Non-financial disclosures The annual report of an entity is traditionally a vehicle for presenting fi nancial information. However, in recent times, it has also become the medium through which an often large amount of voluntary disclosure is made to stakeholders. Many of the voluntary disclosures include environmental information. This may be no more than a few additional paragraphs on the entity’s policy in respect of, say, waste disposal. However, many entities, especially those engaged in environmentally sensitive operations, make very extensive disclosures. These are often narrative in nature, but they may also contain detailed quantitative data about, for example, emissions. A very thorough example of this type of disclosure is that of the Royal Dutch/Shell business. Each year since 1997, the business has published a separate report with the purpose of illustrating the group’s contribution to sustainable development. The report is published in full on the group’s website at www.shell.com . At the time of updating this Learning System (February 2008) the 2006 Shell Sustainability Report was available on the website. It is extensive, including a lot of information about the group’s policies and activities, and it also contains some hard data in the form of quantitative measurements of, for example:
● carbon dioxide ● methane ● other Kyoto greenhouse gases ● oil spills ● hazardous and non-hazardous waste.
Several years of comparatives are provided.
However, although the standard and volume of environmental disclosure has undoubt-edly increased in recent years, the current situation is not wholly satisfactory. Problems include the following:
● Not all entities report environmental information. Some entities may report only when it suits them to do so, and even where there is annual reporting, there is no guarantee of consistency in approach.
● As the disclosures are still of a voluntary nature, there is a danger that the information is unreliable. Although environmental audit exists, there is no compulsory requirement

429FINANCIAL MANAGEMENT
SCO
PE OF EXTERN
AL REPO
RTING
to have environmental statements audited, unless the disclosures fall under the remit of the fi nancial auditor (as would be the case, for example, where provisions were made or contingent liabilities were disclosed).
● The importance of disclosure varies from one industry to another. Heavily polluting industries may be suspected of putting a positive spin on their environmental disclo-sures. There is, in any case, often a suspicion that such disclosures are made more for public relations reasons than with the aim of genuinely assisting stakeholders.
17.6 Accounting for, and reporting on, human resource issues
Social reporting could take many forms. It could include a ‘ social income statement ’ which would report social costs and benefi ts to different areas of society, and a social statement of fi nancial position disclosing human assets, organisational assets, and the use of public goods, and of fi nancial and physical assets.
One of the most important documents to be produced on the subject was The Corporate Report, published in the UK in 1975. This was, both for its time and ours, a radical docu-ment that advocated not only the publication of fi nancial statements, but also of supple-mentary reports to serve the needs of users other than the investor group. Supplementary reports would include:
1. Statement of corporate objectives. The statement could take many forms, but would include objectives relating to all stakeholders.
2. Employment report. This would give information about the number of employees, wage rates and training.
3. Statement of future prospects. Although The Corporate Report acknowledged the diffi culty of reporting about future prospects, this would provide welcome information to all types of stakeholder.
4. Value-added reports. This would show the development of resources throughout the entity, demonstrating the interdependency of all parties (employee, government and the providers of capital). A typical value-added statement would show a split of ‘ value added ’ between the various providers of resources to the business:
ABC Group: value-added statement for the year ended 31 December 20X1
$ Revenue X Less: bought-in materials and services (X) Value added X
Applied to Employees Wages, pensions and other benefi ts X Government Corporation tax X Providers of capital Interest on loans X Dividends X Retained by the company for future growth and Capital expenditure Depreciation X Retained earnings X Total allocated funds X

STUDY MATERIAL F2430
SCO
PE O
F EX
TERN
AL
REPO
RTIN
G The provision of such information would be costly. There would be a need for independent review or audit, further adding to the cost. The incorporation of this additional informa-tion in the annual report would before truly widespread only if encapsulated in regulation.
17.6.1 Disclosures in respect of social issues Many entities, especially larger listed entities, now include some elements of disclosure relating to social issues and human resources. As in the case of environmental reporting, this may be largely narrative in nature, but it is sometimes appended with quantitative dis-closures. Taking the Shell Report as an example, the following are amongst the quantitative social disclosures made in 2006:
● fatalities ● lost time injury frequency ● reportable occupational illness frequency ● numbers of security personnel ● gender diversity ● child labour ● union membership.
17.6.2 Intellectual capital reporting The defi nition of ‘ intellectual capital ’ (CIMA’s Offi cial Terminology) is as follows:
Knowledge which can be used to create value. Intellectual capital includes (i) human resources: The collective skills, experience and knowledge of employees;
(ii) intellectual assets: Knowledge which is defi ned and codifi ed such as a drawing, computer program or collection of data; and (iii) intellectual property: Intellectual assets which can be legally protected, such as patents or copyrights.
Interest in intellectual capital has grown in recent years, as economic activity has become more oriented towards service and knowledge based industries, by contrast with the old industrial model of industries which employed large amounts of physical capital. Entities in many major industrial sectors these days rely upon human capital to generate wealth. Where physical capital in the form of non-current tangible assets is negligible in size, entities may produce statement of fi nancial position that show very low levels of net worth. At the same time their market capitalisation may be many times greater than book value. This can often be explained in part by out of date valuations for items such as land and buildings, but the more frequently encountered hypothesis is that the gap represents intangible assets in the form of intellectual capital.
Many entities nowadays are taking up the challenge to report their intellectual capital. Such reporting undoubtedly does represent a challenge because intellectual capital is such a nebulous concept. The Swedish insurance company, Skandia, was one of the fi rst companies to attempt comprehensive reporting of intellectual capital. One of the readings at the end of this chapter, ‘ Intellectual assets: the new frontier ’ by Peter Atrill, charts the development of intellectual capital reporting, setting out the key features of the Skandia

431FINANCIAL MANAGEMENT
SCO
PE OF EXTERN
AL REPO
RTING
approach. A more recent initiative is the Meritum Project, fi nanced by the European Union between 1998 and 2001, which brings together academics and professionals from dif-ferent countries to create a guide for companies interested in implementing intellectual capital management systems. (More information on the Meritum project can be found at www.eu-know.net/tools .)
During 2003 the UK government established a taskforce on human capital management reporting, led by Denise Kingsmill. The taskforce reported in November 2003, and the full report can be downloaded from www.accountingforpeople.gov.uk . The readings at the end of this chapter include an account by Lesley Bolton of the setting up and objectives of the taskforce.
17.6.3 Human asset accounting One possible approach to intellectual capital reporting would be to attempt to identify the intangible components of the very large gap that exists between market capitalisation and book value in many ‘ people ’ businesses. The possibility of measuring and recognising a value for the workforce as part of the non-current assets of a business has been recog-nised in theory for the last 30 or 40 years. However, there are many barriers to adopting this approach. The IASB in its Framework for the Preparation and Presentation of Financial Statements defi nes an asset thus:
An asset is a resource controlled by the entity as a result of past events and from which future economic benefi ts are expected to fl ow to the entity.
Although it is certainly realistic to expect that human assets in the form of employ-ees will generate economic benefi ts in the future, a signifi cant problem arises in respect of control. Non-current assets are legally owned or are under the control of the entity as the result of a binding agreement (such as a lease). However, it is hard to see how, unless in conditions of slavery, human assets can be controlled in that way. It is customary to con-trol even the most creative of employees in some way, but that control does not operate for 24 hours a day, and is, in any case, short-term. By giving and serving out notice, an employee can soon be free of the partial control that is exerted by the employer.
A further problem relates to reliable measurement. This was identifi ed by the most recent exposure draft to amend IAS 38 Intangible Assets. The draft discussed the possibility of rec-ognising the workforce as an asset. It stated: ‘ an entity usually has insuffi cient control over the expected future economic benefi ts arising from a team of skilled staff and from training to conclude that these items meet the defi nition of an asset ’ . It goes on the state that, even if control over the future economic benefi ts could be demonstrated, and even if it could be demonstrated that the workforce could meet the criteria for identifi cation as an intan-gible asset, it is highly unlikely that the fair value of the workforce and related intellectual capital could be measured reliably. Therefore, the exposure draft specifi cally prohibited rec-ognition of an assembled workforce as a separately intangible asset.
If the value of the workforce were to be measured, how could it be achieved? Cost-based methods are a possibility. Currently, remuneration and training costs are treated as income statement deductions. However, looked at in a different way, they could be considered as investments in the workforce, and could be capitalised as part of intangible assets. Another possibility would be a valuation based approach, which could, for example, discount a future expected cash outfl ow on salaries to net present value.
STUDY MATERIAL F2432
SCO
PE O
F EX
TERN
AL
REPO
RTIN
G 17.7 The Global Reporting Initiative The Global Reporting Initiative (GRI) was launched in 1997 as a joint initiative of the US non-governmental organisation, the Coalition for Environmentally Responsible Economies (CERES) and the United Nations Environment Programme. The GRI’s goal was to enhance the quality, rigour and utility of sustainability reporting. In June 2000 the GRI issued its fi rst set of reporting guidelines. These were replaced, in 2002, by a new set of guidelines, and have now been replaced by version 3.
The new guidelines are available (at the time of writing) on the organisation’s website at www.globalreporting.org . The guidelines are for voluntary use.
The GRI’s intention is that reporting on economic, environmental and social perform-ance by organisations becomes as routine and comparable as fi nancial reporting. To this end it has created a Sustainability Reporting Framework, some details of which are given below.
The Framework sets out a series of key stages that are involved in the sustainability reporting process:
● defi ning report content ● defi ning report quality ● setting the report boundary ● profi le ● disclosure on management approach ● performance indicators ● Sector supplements.
The ‘ Profi le ’ stage identifi es the base content that should appear in a sustainability report, which can be briefl y summarized as follows:
1. Strategy and analysis This section provides a strategic view of the organization’s relationship to sustainability. It should include a statement from the most senior decision-maker in the organisation (typi-cally, the CEO in a commercial organisation) which should present the overall vision and strategy of the organisation in relation to sustainability. The report should then describe the key impacts, risks and opportunities in relation to sustainability.
2. Organisation profi le This section should provide information on the principal brands, products and services offered, the countries in which the organisation operates, markets service, scale of the organisation (e.g., number of employees, capitalisation) and any signifi cant changes during the reporting period.
3. Report profi le This section should include information on the process for defi ning report content (e.g., how materiality has been defi ned), the boundary of the report, the basis for reporting on joint ventures, subsidiaries and other related organisations, data measurement techniques, and the policy and current practice for seeking assurance on the report.
4. Governance The report should describe under this heading the entity’s governance arrangements, including the mandate and composition of boards and committees, processes in place to avoid confl icts of interest, internally developed statements of mission, values, codes of con-duct, and stakeholder engagement.

433FINANCIAL MANAGEMENT
SCO
PE OF EXTERN
AL REPO
RTING
The disclosure on management approach should report on the following aspects:
1. Economic : Performance, market presence and indirect economic aspects, goals, poli-cies, and any other relevant contextual information.
2. Environmental: A concise disclosure should be provided on materials, energy, water, biodiversity, emissions, effl uent and waste, products and services, compliance, trans-port and any other relevant items. Details should also be provided of policies, goals and performance.
3. Social: This area of the report should report under the headings of Labour Practices and Decent Work, Human Rights and Society. For each of these the report should dis-cuss goals and performance, policies, organisational responsibility, training and aware-ness, monitoring and any other relevant contextual information.
Extensive guidance is also offered in respect of the choice of performance indicators. The GRI website now contains a database of reports prepared by organizations. For
example, go to the website and access the Cadbury Schweppes ’ Corporate and Social Responsibility Report.
This section of the chapter provides only a brief outline of the GRI reporting guidelines. As the GRI has developed, the website has expanded and it now contains a very sizeable and useful resource.
17.8 Summary This chapter has examined the pressures that currently exist to extend the scope of report-ing by business entities, including a review of some of the reasons for the movement towards corporate social reporting.
The Operating and Financial Review is a potentially very useful development that is gradually being extended from its origins in the UK and is now used by several interna-tional businesses, including some that report under international standards.
The chapter proceeded to examine the broad context of social accounting and reporting before going on to describe in some detail the features of environmental reporting. The sec-tion on accounting for human resources considered The Corporate Report and the various statements that it recommended, and then considered some issues in relation to social report-ing, intellectual capital reporting and human asset accounting.
Finally, the last section in the chapter examined the guidelines produced by the Global Reporting Initiative, outlining the nature of the recommended disclosures.
Students should note the dynamic nature of all of the topics covered in this chap-ter. They should try to keep up to date with the latest developments in these areas by consulting the recommended websites and by observing recent developments via the annual reports of businesses, especially those that report internationally.

STUDY MATERIAL F2434
SCO
PE O
F EX
TERN
AL
REPO
RTIN
G Examination questions will certainly be set that relate to the areas covered here. These could take various forms, including the following:
● Discussion questions relating to the need for social reporting in its various forms. Some awareness of current developments would often be expected.
● Questions involving analysis of fi nancial and/or non-fi nancial statements. These might include some commentary on, for example, the usefulness of statements pre-pared using the GRI guidelines.
Bibliography This chapter contains several references to useful websites. These are collected here:
Global Reporting Initiative: www.globalreporting.org Novartis: www.novartis.com (for an example of a group reporting under international
standards that also provides an Operating and Financial Review) Royal Dutch/Shell: www.shell.com (for an example of a group providing a comprehensive
environmental and social report) Kingsmill taskforce: go to www.berr.gov.uk then search for ‘ accounting for people ’ . Meritum project: for subsequent developments and research resources go to ww.som .
cranfi eld.ac.uk and search for ‘ Meritum ’ or ‘ intangible assets ’ .

435
Index fingers bad behaviour Liz Fisher, Accountancy, May 2003, p 58–60. © Liz Fisher. Reprinted with the kind permission of the author.
‘ Our motives, of course, may be misconstrued by a cynical world. ’ It was less than half an hour into one of the largest conferences on corporate responsibility the UK has ever seen, and the words in almost everyone’s mind had been spoken. None of the 300 or so dele-gates seemed particularly surprised. When you are part of a group of large organisations that are committed to telling the world as loudly as possible that you are the good guys, you should expect a degree of cynicism.
Evidence of bad behaviour It took a couple of years of successive and violent protests at World Trade Organisation sum-mits for large corporations to realise that they were seen as the sharp end of the ‘ cancer ’ of capitalism. The reasons for this are many and complicated and encompass both fact and perception. A succession of local and global accidents and incidents – Bhopal, Exxon Valdez, deforestation, the ozone layer, child labour, Twyford Down – built up into an irrefutable pile of evidence against large corporations. The proliferation of fast-food and coffee chains on our high streets, often replacing the local stores that had been put out of business when consum-ers chose the out-of-town supermarket experience, added to the view of large corporations as the enemy of old-fashioned values. But Hollywood, too, made its own unique contribution in the form of ‘ David and Goliath ’ stories such as Erin Brokovich and pantomime corporate super-villains such as Jonathan Price in Tomorrow Never Dies. The end result is that business executives are now considered some of the most untrustworthy people in the developed world – which must be a great relief to estate agents and second-hand car salesman everywhere.
To suggest that the emergence of corporate social responsibility (CSR) is the direct result of the damage caused to the reputation of large organisations is cynical in itself. But there is more than a grain of truth in the statement. Companies have recognised that the bad publicity caused by environmental and social issues can affect their reputation and even their fi nancial performance. It is no accident that the largest oil producers in the world published some of the most comprehensive and glossy environmental and social reports.
The first index of corporate responsibility The main aim of the London conference in March was to launch the fi rst Corporate Responsibility Index, produced and published by Business in the Community (BITC),
Readings 17

436
SCO
PE O
F EX
TERN
AL
REPO
RTIN
G a charity with 700 member companies across the globe. BITC’s mantra is that its members ‘ commit to action and to the continual improvement of their company’s impact on society. ’ In particular, the BITC’s members ‘ integrate responsible business practice throughout their business, impact through collaborative action to tackle disadvantage, and inspire, innovate and lead by sharing learning and experience ’ .
Socially responsible efforts, though, are diffi cult to quantify and this has been a handi-cap of the BITC’s since its inception. The Corporate Responsibility Index represents its answer to the – a tangible measure of how companies are tackling corporate responsibility (see box).
It is hoped that the index will also persuade more companies to consider corporate responsibility in the future. The way corporate responsibility in general and the index in particular is sold to companies, though, is rather striking. Environmental and social issues were a feature of the ‘ caring, sharing ’ 1990s and it is perhaps a refl ection of the tougher economic times that this decade is more about the measurement and communication of companies ’ environment and social performance.
The emphasis during the conference was fi rmly on the economic arguments of corpo-rate responsibility. Stephen Timms, minister for corporate social responsibility, summed up the theme in saying that ‘ companies in the UK are beginning to understand the business benefi ts of socially responsible behaviour ’ . Patrick Mallon of BITC echoed this sentiment: ‘ Senior business leaders realise more than ever that responsible business practice enhances competitiveness – if it is integrated throughout the organisation, ’ he said. Successive speak-ers at the conference repeated the theory that the way to get senior management interested in social responsibility was to emphasise the economic and business benefi ts. Do it because it is good for business, in other words, not because it is good for the world.
Avoiding corporate spin This is probably a sensible approach in the sense that it is language that corporations understand. But it does little to resolve one of corporate responsibility’s major handicaps – the impression that it is nothing more than corporate spin, or ‘ greenwash ’ , as some environmentalists have labelled it. It is easy to be cynical when McDonald’s announces as part of its corpo-rate responsibility programme ‘ World Children’s Day ’ , when the doors of 100 of its restau-rants are thrown open in order to raise money for children in need. True, almost $20 million (£12.9 million) was raised for children’s charities but with so much of McDonald’s market-ing aimed at a younger audience, amid so much concern over the dietary habits of children thanks to fast food outlets such as McDonalds, should the company be surprised at cynicism?
Supporters of corporate responsibility argue that any step towards more socially responsi-ble behaviour has to be welcomed, whatever the motives. The index, though, does serve to highlight a number of diffi culties with corporate responsibility in general. It concentrates, for instance, on the reporting of social and environmental issues and the extent to which the policies and systems are embedded within an organisation. Some of the companies in the highest quintiles of the index are, by their nature, some of those that can potentially cause great damage to the environment, while a number of media groups and companies from other seemingly benign sectors fall into the lower quintile. The fact that the largest oil companies publish comprehensive environmental and social reports does not alter the fact that drilling for oil, however ‘ sensitively ’ it is done, damages the planet and burning oil products damages the atmosphere. The fact that you are honest about something does not make it right. This presents environmental campaigners with a dilemma – social and
READINGS F2

437FINANCIAL MANAGEMENT
SCO
PE OF EXTERN
AL REPO
RTING
environmental reporting must be encouraged, as must the indexes that could highlight the companies that are more reluctant to buy on to corporate responsibility issues. But that could leave the impression that talking about it is enough.
The ultimate aim of the index, according to BITC, was to present a fi gure that analysts and the general public can ‘ kick the tyres of ’ – in other words, to provide some sort of tan-gible evidence that companies were attempting to tackle the issues. There is also the under-lying suggestion that the index may prompt more companies to tackle environmental and social reporting in a more enthusiastic manner. There is some evidence that this index and other voluntary initiatives such as the FTSE4Good ‘ ethical ’ stock market index are proving more effective than previous attempts at persuasion. Fifty-three of the FTSE 100 took part in the BITC’s survey this year, although generally the UK’s record on environmental and social reporting is still poor.
Farcical or sour grapes? That said, it was perhaps predictable that reporting of the BITC’s Corporate Responsibility Index should concentrate on the top and bottom quartiles, or the ‘ good and bad ’ at socially responsible reporting. There was some consternation among speakers at the BITC’s confer-ence that the survey should be reduced to such simple terms, with one speaker saying that the reporting had ‘ done BITC a disservice ’ . Companies features in the lower quintiles of the index were also unhappy. Reuters told the Financial Times that the index was ‘ mean-ingless ’ because it did not refl ect the company’s own personal form of responsible efforts. ‘ To assess us in terms of global warming and solid waste is a waste of time and farcical, ’ director of corporate communications Simon Walker told the newspaper.
The publicity generated by the fi rst index suggests that it has the potential to become a force for good in that it will ensourage companies and investors to look at environmental and social issues. But realistically, the index represents only the tip of a growing iceberg. The number of ethical funds and investors has increased over recent years but, in general, the City remains largely disinterested in social and environmental issues. A delegate at the BITC’s conference pointed out that he was ‘ yet to see a sales-side report that has focused on corporate social responsibility ’ .
Analysts counter that if a company has a CSR policy that is making a difference, they need to be told about it. But, ethical investors aside, analysts are looking for fi nancial results and if campaigners wish to concentrate on the economic case for corporate respon-sibility, there is little solid evidence as yet to support them. A bad environmental record can damage a company’s brand and reputation but there is little evidence to suggest that responsible actions result in a healtheir bottom line – neither, the FTSE4Good index nor the Dow Jones Sustainability Index has outperformed their respective markets.
The ultimate problem is that stockmarkets – and business in general – work on the short-term view. Analysts work on short-term information and companies and executives are re warded for short-term performance. Environmental campaigners necessarily take the long-term view. In 100 years ’ time, circumstances may force their views to converge – but at what cost?
The Corporate Responsibility Index The Corporate Responsibility Index is described as ‘ the fi rst authoritative, voluntary bench-mark of responsible business practice ’ and measures ‘ how companies integrate responsible practices throughout their organisation in four key impact areas: environment, market-place, workplace and community ’ . Unfortunately, it is as complicated as it sounds and it is

438
SCO
PE O
F EX
TERN
AL
REPO
RTIN
G diffi cult to glean clear information from the results. Companies are given an overall score achieved for strategy, integration, management practice on community, environment, mar-ketplace and workplace, as well as their performance in their choice of fi ve out of seven ‘ impact ’ areas (from product safety to global warming). The companies are also ranked according to how well they are managing their corporate responsibility: ‘ A ’ if they are meas-uring and reporting progress, ‘ B ’ if they move beyond a basic commitment and ‘ C if they are beginning to measure progress. The companies were then presented alphabetically in ‘ quintiles ’ , according to their score.
Top quintile Bottom quintile 3m 3 l Group AstraZeneca Amersham Aviva British Sky Broadcasting BAA Brixton BP Capita Group BT Group Croda International Carillion De la Rue Dow Chemical Company Expro International ISIS Geest J Sainsbury GWR Group Marks & Spencer International Power MmO2 Meggitt National Grid Transco Mersey Docks & Harbour Co Rio Tinto Reuters Group Safeway RMC Group Scottish Power Taylor Woodrow Shell International Trinity Mirror Tesco United Business Media Unilever WH Smith Group Waste Recycling Group WPP Group
Intellectual assets: the new frontier Dr Peter Atrill, ACCA Students ’ Newsletter, December 1998. Reprinted with the kind permission of the author. Many readers will probably not remember the mid-1970s. For fashion conscious young men, it was the time to be wearing tank tops, fl ared trousers and cuban-heel boots. However, it was also around this period that the economic environment started to change in a fundamental way. The mid-1970s will probably be remembered, not so much for its contribution to fashion, but as a turning point in the world economy. Since this period we have entered a new economic era.
The period from the industrial revolution up to the mid-1970s is now described as the Industrial Age. During this age, the economic environment was relatively stable and many companies obtained competitive advantage over their rivals through the use of technology. They made large investments in physical assets, such as plant and equipment, which provided the capability to mass produce standard products. Accounting techniques such as ratios, budgeting and standard costing were developed during this Industrial Age to man-age the production process more effi ciently.
However, since the mid-1970s, the world economy has change dramatically. Deregulation, greater competition, rapidly changing technology and the growing sophistication of information systems have resulted in a much less stable environment within which companies must operate.
READINGS F2

439FINANCIAL MANAGEMENT
SCO
PE OF EXTERN
AL REPO
RTING
This new economic era is often described as the Information Age and it demands from compa-nies fresh thinking about how to keep ahead of their rivals. It has been argued that, increasingly, competitive advantage will be gained through exploiting the information technology fully, through developing innovative products and through generating strong customer loyalty.
The demands of the Information Age mean that companies must reconsider their priorities. Knowledge has become the critical factor in achieving success. The successful companies will be those which exploit the knowledge and abilities of its employees most effectively. Knowledge is the ‘ invisible ’ asset which will produce the innovative products, high quality service and satisfi ed customers necessary for success. Companies must, therefore, give prior-ity to developing and managing the knowledge of its employees in order to create value. The growing importance of knowledge means that physical assets, such as plant and equip-ment, will play a less decisive role in determining success. We can see already that for com-panies engaged in business services, pharmaceuticals and information technology, physical assets already play a minor role. The Chief Executive of Merck has said:
A low value product can be made by anyone anywhere. When you have knowledge no one else has access to – that’s dynamite. We guard our research even more carefully than our fi nancial assets. 1
Accounting and economic change The changes in the economy described above have important implications for accounting. Traditional accounting was developed during the Industrial Age. It records transactions with external parties, such as the purchase and sale of goods and services, and it is these external transactions which generate a price, or value, and which, in turn, provide the basis for fi nancial reporting. Whilst traditional accounting may have served companies well dur-ing the Industrial Age, its limitations have become more apparent in the Information Age. We have seen that knowledge is now the key to success and that it is those companies which invest effectively in managing and developing the knowledge of its employees, and in developing relationships with customers, which will succeed. However, the investment in, and condition of, these ‘ intellectual assets ’ is not revealed by traditional accounting methods. It cannot tell us whether the knowledge base of the company or the strength of customer loyalty is increasing or decreasing. Thus, it is diffi cult to assess the current health of the company or its capacity to survive and prosper in the future.
This kind of argument, however, is not really new. Those of us who are old enough to have worn the fl ared trousers and tank tops referred to earlier may remember that a topic called ‘ human asset accounting ’ emerged during the early 1970s and then sank without trace a few years later.
Human asset accounting aimed to raise awareness of the value of a company’s human resources by attempting to place a value on its employees and by including this value in the statement of fi nancial position of the company. Although human asset accounting aroused some interest, the time for such an idea was not right. In the early 1970s, most companies were still enjoying a comfortable existence and the ‘ winds of change ’ had not yet ushered in the new order. At this time, the rhetoric of company chairmen concerning the vital importance of harnessing the knowledge and capabilities of employees to obtain competitive advantage had yet to become reality. This meant there was little incentive to adopt new and radical forms of fi nancial reporting. Furthermore, the rather conservative accounting profession displayed little interest in such fanciful notions and, anyway, had more pressing problems to resolve.
Since the early 1970s, however, we have seen a growing recognition, from both inside and outside the profession, of the need to expand the boundaries of accounting. Accounting is under increasing threat from various quarters and will only survive if it embraces new

440
SCO
PE O
F EX
TERN
AL
REPO
RTIN
G concepts and measurement models. If accounting is to be relevant to companies in the Information Age it must recognise the growing importance of the ‘ intellectual assets ’ which refl ect the knowledge held within a company and fi nd ways of describing their characteris-tics which decision makers will fi nd useful.
Types of intellectual assets Intellectual assets (or ‘ intellectual capital ’ as they are sometimes called) can be categorised in various ways. One approach is to divide intellectual assets into three main types as follows:
1. External assets ( capital ). These include the reputation of brands and franchises and the strength of customer relationships.
2. Internal assets ( capital ). These include patents, trademarks and information held in cus-tomer databases.
3. Competencies. These refl ect the capabilities and skills of individuals. 2
We can see that the term ‘ intellectual assets ’ is much broader in its scope than human asset accounting which preceded it. Although it embraces human assets (under competen-cies), it recognises that the knowledge and skills of individuals is not the only source of competitive advantage. According to Hope and Hope,2 human assets are the mainspring of new ideas and innovation but it will be the other forms of intellectual assets which pro-vide the systems and channels to ensure that value is created. In Figure 1 , further examples of each type of intellectual asset are provided.
READINGS F2
External assetBrandsProduct brandsService brandsCorporate brands
CustomersIndividual customersSales channelsDistribution channels
Management capabilityEntrepreneurshipLeadershipGrowth record
CultureManagement philosophyRecognition and rewardsManagement structure
ContractsFranchise agreementsLicense agreementsOther favourable contracts
Internal assetsIntellectual propertyPatentsCopyrightTrademarks and design rightsTrade secrets and know-how
CompetenciesPeople competenciesProfessional experienceLevels of education and skillsTraining methodsManagement education
InfrastructureProcessesIT systems and databasesCommunication systemsOperating modelsFinancial structure
Learning capabilityKnowledge sharingCommunities of practiceProblem-solving capabilities
Figure 1 Some elements of ‘intellectual assets’
We can see that some of the intellectual assets (e.g., intellectual property and contracts) can fall within the conventional boundaries of accounting as an external transaction will have arisen. However, these items may represent only the ‘ tip of the iceberg ’ . The ‘ invisible ’ intellectual assets can often account for a much larger proportion of the value of a business.
Measuring intellectual assets Value based approach. The challenge facing accountants is how to measure intellectual assets. One approach is to employ existing value based measures. It has been suggested that intel-lectual assets, when taken as a whole, is refl ected in the difference between the market value of a company and the statement of fi nancial position value of its net assets. In many cases, the

441FINANCIAL MANAGEMENT
SCO
PE OF EXTERN
AL REPO
RTING
market value of a company is considerably higher than the statement of fi nancial position fi g-ures. In the case of BP plc, for example, the market value is almost four times higher than the book values. However, there are problems with using this approach. The difference between the market value of the business and the book values of assets cannot be wholly ascribed to intellectual assets. Accounting assets, such as freehold land, may be shown at a fi gure in the statement of fi nancial position which is well below their current market values. Another prob-lem is that share prices may fl uctuate from day-to-day and so may prove unreliable when assessing changes in intellectual assets over the short term.
It has been suggested that this market based approach could be more useful if, instead of taking the absolute measure of the difference between market values and statement of fi nan-cial position values, we take the ratio between the two. In this way, comparisons between similar companies and across time periods would be more meaningful. Although this sug-gestion may be helpful, the information derived will still only provide an overall measure of intellectual assets. The separate elements of intellectual assets are not measured. What man-agers will often need for decision making purposes is a breakdown of the condition of, and changes in, particular types of intellectual assets held. This separability problem places real limitations on value based measures. They are likely to be of most benefi t to managers when taken together with a range of other monetary and non-monetary measures.
Skandia approach Skandia AFS is a large Swedish fi nancial services group which recognised the signifi cance of the gap between the market value of the business and its book value. This led Skandia to develop ways of reporting the ‘ hidden ’ intellectual assets of the business. In a supplement to the company’s 1994 annual report, the fi rst attempt was made to describe the invisible assets of the business. It was argued:
A clearer and more balanced reporting of Skandia not only makes it easier for the world around us to value our operations, it also gives us more effective instruments to better manage and develop our hidden values. And the more tangible we can make our hidden values, the better for all of us. 3
Skandia has developed a model which it refers to as the Skandia Navigator. The model refl ects the four key dimensions of the business and identifi es the critical success factors relating to each dimension. These critical success factors are quantifi ed in order to measure changes overtime. The Skandia Navigator is shown in Figure 2 .
Figure 2 The Skandia Navigator. 3 Skandia life assurance company limited, company report and accounts, 1994
Financial focus
Human focus Customer focus Process focus
Tom
orr
ow
To
day
Inte
llect
ual
cap
ital
Renewal and development focus

442
SCO
PE O
F EX
TERN
AL
REPO
RTIN
G To provide an example of the kind of measures used by the group let us consider the renewal and development focus of one of its subsidiaries, SkandiaBanken Fonder, which operates a fund management business. The key measures refl ecting the critical success fac-tors were:
● competence development expense per employee; ● employee satisfaction index (scale 1–5); ● marketing expenses/managed assets; ● marketing expense per customer.
The critical success factors will differ between businesses and must be derived through an analysis of business processes and operations.
The Skandia Navigator is an interesting approach which is closely related to the bal-anced scorecard approach developed by Robert Kaplan and David Norton. 4
Intellectual capital (IC) index approach The IC index approach attempts to provide a measure of the effi ciency of intellectual assets which can be related to traditional accounting measures of effi ciency. The approach rec-ognises that a company must be effi cient in transforming fi nancial resources into intel-lectual assets and then, in turn, transforming its intellectual assets into fi nancial value for shareholders.
The IC-index approach attempts to consolidate different measures for intellectual assets. To achieve this, the key measures of success must fi rst be identifi ed and then weighted according to their importance in order to provide a single, summary index. The choice of measures and choice of weights will again be specifi c to the company. In the example below, four key dimensions of the intellectual assets of a business, relationship, innovation, human and infrastructure, have been combined to obtain an IC-index score (see Figure 3 ).
An IC-index can be developed for each business segment as well as for the company as a whole. It is designed to be a lead indicator of changes in fi nancial performance. Thus, a fall in the index should provide an early-warning signal of a deterioration in the fi nancial health of the business.
READINGS F2
Figure 3 An example of an IC-index 5
130
40
50
60
70
80
90
2
Time (Years)
Ind
ex v
alu
e
Infrastructure
Human
IC index
Innovation
Relationship
3

443FINANCIAL MANAGEMENT
SCO
PE OF EXTERN
AL REPO
RTING
Summary We have seen that, in the Information Age, knowledge has become the key to achieving competitive advantage. Successful companies will be those who can develop and manage their knowledge base effectively. In order to do this, suitable measures must be developed to provide managers with the guidance they need. This issue will take on increasing impor-tance in future years. The value of intellectual assets will continue to rise and will represent an increasing proportion of the value of most companies. The challenge facing accountants is to contribute towards the development of intellectual asset measures. Unless we face this challenge, accountancy will become less relevant to business. Indeed, it could become as irrelevant as the tank tops and fl ared trousers of the mid-1970s have now become.
References 1. Stewart , T. A. ( 1997 ) Intellectual Capital: The New Wealth of Organizations . Nicholas
Brealey Publishing . 2. Hope , J. and Hope , T. ( 1997 ) Competing in the Third Wave . Harvard Business School Press . 3. Skandia, ‘ Visualizing Intellectual Capital in Skandia ’ , Supplement to Skandia’s 1994
Annual Report. 4. Kaplan , R. and Norton , D. ( 1996 ) The Balanced Scorecard . Harvard Business School Press . 5. Roos , J. , Roos , G. , Dragonetti , N. , and Edvinsson , L. ( 1997 ) Intellectual Capital:
Navigating in the New Business Landscape . Macmillan Press .
Mental Arithmetic Tony Wall, Financial Management, December/January 2002/03
Financial accounting professionals have spent the past decade debating how companies should report their intellectual capital (IC). Some people argue that many more of these intangible assets – beyond those associated with intellectual property such as patents – should appear on the statement of fi nancial position, because without them shareholders aren’t aware of all the elements that contribute to the overall market value of their company.
The main argument against their inclusion is that no universally acceptable method of meas-uring them has yet been determined. Until such an agreement is reached, these assets – generally categorised as human capital, customer capital or organisational capital ( seepanel 1, below ) – could appear at randomly selected valuations, thereby distorting the picture for investors.
1 THE KEY COMPONENTS OF INTELLECTUAL CAPITAL
Human capital Customer capital Organisational capital Knowledge Customer relationships Patents Skills Customer retention Research and development Expertise Customer satisfaction Copyrights Motivation Favourable contracts Trademarks Innovation Reputation Licences Entrepreneurial spirit Brand image Processes Leadership qualities Sales channels Best practices Employee satisfaction Distribution channels Databases Employee turnover Supplier relationships IT systems Vocational qualifi cations Business collaborations Networking systems Education Franchising agreements Management philosophy Training Market intelligence Corporate culture

444
SCO
PE O
F EX
TERN
AL
REPO
RTIN
G Other people see the debate as far too narrow and feel that a lot of work can be done on the strategic management of IC to increase the value of any company.
IC therefore cannot be ignored and, while fi nancial accountants may have to wait for regulatory guidance before these assets can appear on the statement of fi nancial position, it doesn’t mean that the annual report can’t be used as a medium for communicating how an organisation’s IC is adding value. In Scandinavia – particularly Sweden – shareholders already receive a great deal of information about IC, although the reporting of such assets is more piecemeal in the rest of the developed world.
In order to gather the relevant information, fi nancial accountants will have to rely on management accountants to capture, measure and value these assets, and to monitor any changes on a yearly basis. This, of course, will require a robust accounting system.
Although several generic frameworks for this exist, the suggested measurements will have to be adjusted to fi t an organisation’s particular circumstances. Proxy measurements are seen as better than no measurements at all, and there are many that can be made – for example, tracking your company’s investment in training and seeing whether employee turnover decreases or productivity increases as a result of that training.
In order to see how companies in Ireland (both Northern Ireland and the Republic) have been dealing with IC, the University of Ulster conducted a survey last year. Its main aim was to see what stage they had reached when it came to measuring IC. A mixture of traditional manufacturing fi rms and new-economy companies – that is, those in telecoms, software, etc. – were used for the survey.
Part of the questionnaire asked the companies to rank certain elements of IC in order of importance ( see panel 2, below ). It’s notable that the three most highly ranked elements represented each of the three categories of IC. These were software (organisational capital), customer satisfaction (customer capital) and workforce expertise (human capital).
2 THE HIGHEST-RANKED ELEMENTS
1 Software 2 Customer satisfaction 3 Workforce expertise 4 Brands 5 Market intelligence 6 R & D know-how 7 Mailing/phone lists 8 Distribution networks 9 Design rights 10 Licences 11 The Internet 12 Consultancy/advice 13 Manufacturing processes 14 Patents 15 Royalties
The questionnaire also attempted to determine which elements of the three categories of IC were already being measured. The most measured elements of human capital were concerned with employee loyalty – that is, length of service and staff turnover, which were both measured by more than two-thirds of the respondents. Perhaps surprisingly, the next most popular measure concerned the number of employees with professional qualifi cations. Although this might seem less crucial than other elements, the large proportion of respond-ents measuring it is probably explained by the simple fact that the information is easy to fi nd.
READINGS F2

445FINANCIAL MANAGEMENT
SCO
PE OF EXTERN
AL REPO
RTING
Two elements that were measured by a surprisingly small number of companies were value added per employee and new ideas generated. The fi rst fi nding can possibly be explained by the problems of developing an accurate method beyond simple ratio meas-urements such as turnover divided by the number of employees. On the other hand, there is nothing new about staff suggestion schemes. You would assume that, if a company were to have such a scheme, it would assess how well it was working.
As with some of the human capital measures, companies were not examining certain important aspects of customer capital. For example, it’s hard to believe that some busi-nesses still aren’t taking note of the number of customers they have. It is also surprising that, although many respondents said customer satisfaction was important, not all of them were actually measuring it. At the same time, almost 90 per cent of the respondents were keeping track of the number of customer complaints they were receiving.
Relatively few were measuring the effectiveness of advertising campaigns, which is pre-cisely the sort of thing that should be measured, or there is a danger that crucial marketing initiatives will be dropped during times of fi nancial hardship.
Out of the three IC categories, organisational capital was the one that companies meas-ured the least. Only two elements were measured by more than half of the respondents and these were both expense items: expenditure on research and development and IT spending as a percentage of administrative costs. It could be argued that these are the simplest ele-ments to measure, because both fi gures would be gathered as part of the process of drafting the fi nancial statement.
Although some companies measured the value of new ideas generated by members of staff, not all of them kept track of how many of these were actually implemented. You would expect this to be done – if for no other reason than to provide feedback to employees.
Another point of interest was the number of companies that were failing to follow up on their employee and customer satisfaction surveys. Two-thirds of the respondents were measuring employee and customer satisfaction, but fewer-than a third were monitoring any changes resulting from the feedback.
One of the most important aims of the research was to ascertain which formal systems the companies were using to evaluate their IC, having measured the various elements. Just over a third of the respondents were using no system at all. The most popular method was the balanced scorecard, which was being used by 28 percent of our sample.
Although the remaining companies listed a variety of methods by which they measured their IC – for example, key performance indicator systems, employee opinion surveys and value-chain analysis – follow-up interviews revealed that these were generally measurement systems that focused on one particular matter, such as recruitment or procurement, and were not covering all aspects of IC. Apart from those using the balanced scorecard, only one organisation seemed to be using a comprehensive measurement system, which it called a business benefi t scorecard.
There is no doubt that Irish companies are highly aware of IC – most of them are already measuring certain elements of human, customer and organisational capital. But it appears that this may be occurring as part of their normal working practices and not co-ordinated within a single IC programme. The main problem seems to be that much of the work on IC is being done in isolation and is not part of on overall strategy.
Our analysis of the companies ’ responses indicates that there is a lack of a defi ned link between a working practice, the capture of information on this practice and any evaluation of it alongside data gathered from other parts of the organisation. Furthermore, although nearly all of the companies we surveyed were familiar with the term IC, only a tiny proportion

446
SCO
PE O
F EX
TERN
AL
REPO
RTIN
G of them had people dedicated to working with it. Ireland is therefore typical of most devel-oped nations when it comes to IC. Apart from in Scandinavia and North America, little pio-neering work is being done in this area and a ‘ wait and see ’ strategy seems to be in place.
Accounting for people Lesley Bolton, Accountancy, May 2003
Back in the 1980s, during the IT revolution, a constant chorus went up for businesses to recognise the strategic importance of computing at board level. Today a new government taskforce is looking at way to elevate ‘ human capital management ’ to the top of the trans-parency agenda and is examining how organisations can measure the quality and effective-ness of the way they manage people and how this can be refl ected in the annual report.
The taskforce, which is due to present its fi nal report in the autumn, is being led by deputy Competition Commission chairman Denise Kingsmill. Its formation follows one of the recommendations in the 2001 Kingsmill Review into Women’s Pay and Development,although its remit covers far more than gender issues.
‘ You don’t measure the people element in the same way that you’re accustomed to meas-uring how many widgets you’ve got or how many contracts you’ve signed. In our enquiry we’re not looking to develop metrics in a formal way to put people in the statement of fi nancial position, because that would be the wrong approach, ’ says Kingsmill, harking back to the 1970s, when theorists dabbled with ‘ human asset accounting ’ .
Indeed, the method of measurement is crucial if human capital is to be usefully included on the annual report. As PricewaterhouseCoopers UK board partner and taskforce mem-ber Ed Smith puts it: ‘ Unless you convince people of the measurement and recognition criteria, then you will have diffi culty pushing it into an external environment. I start with the business case inside an organisation. How far are companies themselves really focusing on the management of people – recruitment, retention and development – and how do they measure that at board level? ’
Best practice The taskforce’s main objective is to create best practice guidance for organisations on how they can meaningfully account for ‘ human capital assets ’ – as opposed to regarding them as ‘ costs ’ . Its fi rst job is to review existing studies and seek expert evidence from key sectors, including the corporate sector, the investment management community and academic research. ‘ We want all sides of the story, ’ say Smith. ‘ We’re interested in hearing from cynics as well as the enthusiasts. ’
Both Kingsmill and Smith emphasise that the focus is on performance indicators, which will include ‘ fairness of employment ’ and ‘ employee satisfaction. ’
‘ It’s very important to keep this as a performance issue, as something which says ‘ this is an indicator of good performance ’ as opposed to it being a nice add-on. We wouldn’t want to slag off any environmental reporting for instance, but we see this not as an optional extra but as absolutely key to the performance of an organisation, particularly in times of full employment where there is a great deal of competition for the best people, and where retaining people is important. In the past, people management has been confi ned to car policies and redundancy packages and the like rather than being part of the organisation’s strategic objectives, ’ says Kingsmill.
READINGS F2

447FINANCIAL MANAGEMENT
SCO
PE OF EXTERN
AL REPO
RTING
‘ What gets me about glossy company reports is that you fl ick through the pages of smil-ing, happy people, then you look at the text and there’s nothing about them. You get pages and pages about the remuneration of a company’s top team, but it tells you nothing about the company’s performance. If you were a potential investor that report would give you no clue as to whether that was a company worth investing in. If there was information about how the company recruited, developed and grew their human capital, then that might be an indicator of future performance, ’ she adds.
The taskforce may well fi nd the climate right for encouraging companies to take employment practices seriously. The ICAEW has already issued a policy briefi ng, Valuing Human Capital , under which it says that ‘ cultivating and measuring this ‘ great intangible ’ is one of the next big challenges for UK business if the UK is to remain at the forefront of the new economy. ’ The subject is now the mandate of the institute’s dedicated thinktank, the Centre for Business Performance. ‘ We believe there needs to be a dedicated govern-ment drive to help businesses and investors understand how human capital builds long-term corporate value and improves UK competitiveness. ’
Not only that, but a new management book, Going Off the Rails, by John Plender, and reviewed in Accountancy (April, p.21) has as its central argument that we are in the midst of ‘ the transition to an economy in which human and social capital are of far greater importance than physical capital ’ .
Directors take note.

This page intentionally left blank

449
Revision Questions
Question 1 You are the assistant to the fi nance director of MNO, a medium-sized listed entity that complies with IFRS. One of MNO’s directors has proposed the publication of an Operating and Financial Review (OFR) as part of the annual fi nancial statements. Most of the directors know very little about the OFR, and the fi nance director has asked you to produce a short briefi ng paper on the topic for their benefi t.
RequirementsWrite the briefi ng paper, which should discuss the following issues:
● any relevant regulatory requirements for an OFR;● the purpose and, in outline, the typical content of an OFR;● the advantages and drawbacks of publishing an OFR from the entity’s point of view.
(10 marks)
Question 2 In many industries there is a large gap between the market capitalisation of listed entities and the statement of fi nancial position value of their net assets. Some commentators have suggested that the gap comprises unrecognised intangible assets in the form of intellectual capital obtained through the employment of human resources, and that these assets should be capitalised.
RequirementIdentify the principal arguments for and against the proposal to capitalise intellectual capital.
(10 marks)
Question 3 It is becoming increasingly common for listed entities to provide non-fi nancial disclosures intended to inform stakeholders about the business’s environmental policies, impacts and practices. Supporters of such voluntary disclosures argue that stakeholders have a right to be informed above environmental issues in this way. However, there are also arguments against this type of disclosure.
17

SCO
PE O
F EX
TERN
AL
REPO
RTIN
G
REVISION QUESTIONS F2450
RequirementIdentify and explain the principal arguments against against voluntary disclosures by busi-ness of their environmental policies, impacts and practices. (10 marks)
Question 4 The fi rst part of this question relates to the analysis of fi nancial statements. Students may fi nd it useful to review Chapters 16–19 of the Learning System before attempting the question.
FW is a listed entity involved in the business of oil exploration, drilling and refi ning in three neighbouring countries, Aye, Bee and Cee. The business has been consistently profi t-able, creating high returns for its international shareholders. In recent years, however, there has been an increase in environmental lobbying in FW’s three countries of operation. Two years ago, an environmental group based in Cee started lobbying the government to take action against FW for alleged destruction of valuable wildlife habitats in Cee’s protected wet-lands and the displacement of the local population. At the time, the directors of FW took legal advice on the basis of which they assessed the risk of liability at less than 50%. A con-tingent liability of $500 million was noted in the fi nancial statements to cover possible legal costs, compensation to displaced persons and reinstatement of the habitats, as well as fi nes.
FW is currently preparing its fi nancial statements for the year ended 28 February 20X5. Recent advice from the entity’s legal advisers has assessed that the risk of a successful action against FW has increased, and must now be regarded as more likely than not to occur. The board of directors has met to discuss the issue. They accept that a provision of $500 million is required, but would like to be informed of the effects of the adjustment on cer-tain key ratios that the entity headlines in its annual report. All of the directors are con-cerned about the potentially adverse effect on the share price, as FW is actively engaged in a takeover bid that would involve a substantial share exchange. Also, they feel that the public’s image of the entity is likely to be damaged. The chief executive makes the follow-ing suggestion:
‘Many oil businesses nowadays publish an environmental and social report, and I think it may be time for us to do so. It would give us the opportunity to set the record straight about what we do to reduce pollution, and could help to defl ect some of the public attention from us over this law suit. In any case it would be a good public relations opportunity; we can use it to tell people about our equal opportunities programme. I was reading about something called the Global Reporting Initiative (GRI) the other day. I don’t know much about it, but it might give us some help in structuring a report that will get the right message across. We could probably pull something together to go out with this year’s annual report’.
The draft fi nancial statements for the year ended 28 February 20X5 include the follow-ing information relevant for the calculation of key ratios. All fi gures are before taking into account the $500 million provision. The provision will be charged to operating expenses.
$mNet assets (before long-term loans) at 1 March 20X4 9,016Net assets (before long-term loans) at 28 February 20X5 10,066Long-term loans at 28 February 20X5 4,410Share capital � reserves at 1 March 20X4 4,954Share capital � reserves at 28 February 20X5 5,656Revenue 20,392Operating profi t 2,080

SCO
PE OF EXTERN
AL REPO
RTING
451FINANCIAL MANAGEMENT
Profi t before tax 1,670Profi t for the period 1,002
The number of ordinary shares in issue throughout the years ended 29 February 20X4 and 28 February 20X5 were 6,000 million shares of 25 cents each.
FW’s key fi nancial ratios for the 20X4 fi nancial year (calculated using the fi nancial state-ments for the year ended 29 February 20X4) were:
● Return on capital employed (using average capital employed): 24.7%● Return on assets (operating profi t as a percentage of average net assets): 17.7%● Gearing (debt as a percentage of equity): 82%● Operating profi t margin: 10.1%● Earnings per share: 12.2 cents per share
RequirementsIn your position as assistant to FW’s Chief Financial Offi cer produce a briefi ng paper that:
(a) Analyses and interprets the effects of making the environmental provision on FW’s key fi nancial ratios. You should take into account the possible effects on the public percep-tion of FW. (12 marks)
(b) Identifi es the advantages and disadvantages to FW of adopting the chief executive’s proposal to publish an environmental and social report. (7 marks)
(c) Describes the three principal sustainability dimensions covered by the GRI’s frame-work of performance indicators. (6 marks)
(Total marks � 25)
Question 5
This question relates in part to the analysis of fi nancial statements. Students may fi nd it useful to review Chapters 14–16 of this Learning System before
attempting this revision question.
Recycle is a listed company which recycles toxic chemical waste products. The waste prod-ucts are sent to Recycle from all around the world. You are an accountant (not employed by Recycle) who is accustomed to providing advice concerning the performance of companies, based on the data available from their published fi nancial statements. Extracts from the fi nancial statements of Recycle for the 2 years ended 30 September 20X7 are given below.
Recycle: income statements for the year ended 30 September
20X7 20X6 $m $m
Revenue 3,000 2,800 Cost of sales (1,600) (1,300) Gross profi t 1,400 1,500 Other operating expenses (800) (600) Finance costs (200) (100) Profi t before income tax 400 800 Income tax (150) (250) Profi t for the period 250 550

SCO
PE O
F EX
TERN
AL
REPO
RTIN
G
REVISION QUESTIONS F2452
Recycle: statement of fi nancial position as at 30 September
20X7 20X6 $m $m $m $m Assets Tangible non-current assets 4,100 3,800 Current assets Inventories 500 350 Trade receivables 1,000 800 Cash in hand 50 50 1,550 1,200 Total assets 5,650 5,000
Equity and Liabilities Capital and reserves Called-up share capital ($1 shares) 2,000 2,000 Retained earnings 950 900 2950 2900 Non-current liabilities Interest-bearing borrowings 1,000 1,000 Current liabilities Trade payables 600 600 Taxation payable 150 250 Proposed dividend 200 200 Bank overdraft 750 50 1,700 1,100 Total equity and liabilities 5,560 5,000
Proposed dividend is $200 million (20X6: $200 million). You ascertain that depreciation of tangible non-current assets for the year ended 30
September 20X7 was $1,200 million. Disposals of non-current assets during the year ended 30 September 20X7 were negligible.
You are approached by two individuals:
1. A is a private investor who is considering purchasing shares in Recycle. A considers that Recycle has performed well in 20X7 compared with 20X6 because revenue has risen and the dividend to shareholders has been maintained.
2. B is resident in the area immediately surrounding the premises of Recycle and is inter-ested in the contribution made by Recycle to the general well-being of the community. B is also concerned about the potential environmental effect of the recycling of chemi cal waste. B is uncertain how the published fi nancial statements of Recycle might be of assistance in addressing social and environmental matters.
Requirements (a) Write a report to A which analyses the fi nancial performance of Recycle over the 2 years
ended 30 September 20X7. Assume that infl ation is negligible. Your report should refer specifi cally to the observations made by A concerning the
performance of Recycle. (20 marks) (b) Briefl y discuss whether published fi nancial statements satisfy the information needs of B.
You should consider published fi nancial statements in general, not just the extracts which are provided in this question. (5 marks)
(Total marks � 25)

SCO
PE OF EXTERN
AL REPO
RTING
453FINANCIAL MANAGEMENT
Question 6 You are the management accountant of Clean, an entity listed in a country that permits entities to publish fi nancial statements in accordance with IFRS. Clean is considering seek-ing a listing on a US stock exchange in the near future. Your Chief Executive Offi cer takes a keen interest in fi nancial reporting but he is not a professionally qualifi ed accountant. He has recently sent you a memorandum that raises the following issue:
My political contacts tell me that government ministers are very interested in extend-ing the practice of environmental reporting. What exactly does ‘environmental reporting’ mean, and to what extent is it mandatory? Why does there seem to be a trend towards greater environmental reporting? You don’t need to go into massive detail, just give me an outline of what is involved.
Requirements Draft a reply that deals with this issue. You should refer to the provisions of IFRS, and any other relevant documents where you consider them to be of assistance in supporting your reply. (10 marks)
Question 7 You are the Management Accountant of Clean, an entity listed in a country that permits entities to publish fi nancial statements in accordance with IFRS. Your Chief Executive Offi cer takes a keen interest in fi nancial reporting but he is nto a professionally qualifi ed accountant. He has recently sent you a memorandum that includes the following query.
One of the phrases I often hear is ‘ our employees are our most important asset ’ . I largely agree with this sentiment, but if it is true, then surely this should be refl ected in some way on the statement of fi nancial position. I do not recall seeing such an asset in previous statement of fi nancial position and would be most grateful for your advice.
Requirement Draft a reply to the Chief Executive Offi cer’s query. You should refer to the provisions of IFRS and any other relevant documents. (10 marks)

This page intentionally left blank

455
17 Solution 1
Briefing paper to the directors of MNO
The Operating and Financial ReviewMany international entities are choosing to expand the scope of their reporting in the form of an Operating and Financial Review (OFR). There is currency no formal regula-tory requirement to publish such a review. Any such publication would constitute a set of voluntary disclosures.
The principal source of guidance on the purpose and content of an OFR is the UK Accounting Standards Board (ASB) Reporting Statement of Best Practice which was issued in January 2006. However, this statement has no international application, except as a source of general guidance. In October 2005, the IASB issued a discussion paper on ‘Management Commentary’. The topic is on the IASB’s research agenda, and an Exposure Draft is expected during 2008.
The purpose of an OFR is to assist users, principally investors, in making a forward-looking assessment of the performance of the business by setting out management’s analy-sis and discussion of the principal factors underlying the entity’s performance and fi nancial position.
Typically, an OFR would comprise some or all of the following:
● description of the business and its objectives;● management’s strategy for achieving the objectives;● review of operations;● commentary on the strengths and resources of the business;● commentary about such issues as human capital, research and development activities,
development of new products and services;● fi nancial review with discussion of treasury management, cash infl ows and outfl ows and
current liquidity levels.
The publication of such a statement would have the following advantages for MNO:
● It could be helpful in promoting the entity as progressive and as eager to communicate as fully as possible with investors.
● It could be a genuinely helpful medium of communicating the entity’s plans and man-agement’s outlook on the future.
Solutions to Revision Questions

SCO
PE O
F EX
TERN
AL
REPO
RTIN
G
SOLUTIONS TO REVISION QUESTIONS F2456
● If the IASB were to introduce a compulsory requirement for management commentary by listed entities, MNO would already have established the necessary reporting systems and practices.
However, there could be some drawbacks:
● If an OFR is to be genuinely helpful to investors, it will require a considerable input of senior management time. This could be costly, and it may be that the benefi ts of pub-lishing an OFR would not outweigh the costs.
● There is a risk in publishing this type of statement that investors will read it in pref-erence to the fi nancial statements, and that they may therefore fail to read important information.
Solution 2 The principal arguments for the proposal are as follows:
1. Those organisations that depend upon human resources, know-how and intellectual capabilities to generate revenue, often have a relatively low level of traditional capital investment. The statement of fi nancial position of such businesses does not refl ect the true value of the capital used in revenue generation: indeed, as noted in the question, the gap between market capitalisation and the book value of net assets may be very sub-stantial. The mismatch between statement of fi nancial position and revenue generation could be addressed by recognising a wider range of intangible assets, including intellec-tual capital.
2. At present, fi nancial statements fail to provide suffi cient information to permit inter-ested parties to assess the full range of resources available to the organisation. Their information content suffers because of low levels of intangible asset recognition.
3. It is also argued that the recognition of intellectual capital would encourage better man-agement of human resources because it would make visible resources that have tended to be hidden and under-valued.
The principal arguments against the proposal are as follows:
1. The recognition of intellectual capital would present problems in that it does not ful-fi l all aspects of the defi nition of an asset. The Framework defi nes an asset as: ‘… a resource controlled by an entity as a result of past events and from which future eco-nomic benefi ts are expected to fl ow’. The problem lies in the area of control: human resources cannot be fully controlled, because staff are free to leave their employment whenever they wish.
2. The measurement of intellectual capital would present many practical diffi culties. It is unlikely that the fair value of a group of employees could ever be measured m reliably.
3. Recognition and measurement of such intangible factors as know-how and skills would allow for considerable latitude in practice, and it would be possible for the unscrupu-lous to exploit the element of judgement involved in making valuations in order to manipulate their fi nancial statements .

SCO
PE OF EXTERN
AL REPO
RTING
457FINANCIAL MANAGEMENT
Solution 3 Arguments against voluntary disclosures by businesses in respect of their environmental policies, impacts and practices might include the following principal points:
The traditional view of the corporation is that it exists solely to increase shareholder wealth. In this view business executives have no responsibility to broaden the scope or nature of their reporting as doing so reduces returns to shareholders (because there is a cost associated with additional reporting).
From a public policy perspective, if governments wish corporations and similar enti-ties to bear the responsibility for their environmental impacts, they should legislate accordingly. In the absence of such legislation, however, businesses bear no responsi-bility for environmental impacts, and in consequence there is no reporting responsi-bility either.
Voluntary disclosures of any type are of limited usefulness because they are not readily comparable with those of other entities. Therefore, it is likely that the costs of pro-ducing such disclosures outweigh the benefi ts to stakeholders.
The audit of voluntary disclosures is not regulated. Even where such disclosures are audited, the scope of the audit may be relatively limited, and moreover, its scope may not be clearly laid out in the voluntary report. Voluntary reports are not necessarily, therefore, reliable from a stakeholder’s point of view.
Especially where voluntary disclosures are included as part of the annual report package, there is a risk of information overload: stakeholders are less able to identify in a very lengthy report the information that is relevant and useful to them.
Voluntary disclosures by business organisations, because they are at best lightly regu-lated, may be treated by the organisation in a cynical fashion as public relations opportunities. The view of the business’s activities could very well be biased, but it would be quite diffi cult for most stakeholders to detect such bias.
It is questionable whether voluntary disclosures about environmental policies, impacts and practices would meet the qualitative characteristics of useful information set out in the IASB’s Framework. The key characteristics are: understandability, reliability, relevance and comparability. Voluntary environmental disclosures might well fail to meet any of these characteristics and, if this is the case, it is highly questionable whether or not they merit publication.
Solution 4 Briefi ng paper for the attention of the directors of FWFrom: Assistant to CFO
(a) The appendix to this paper demonstrates the effect on our key fi nancial ratios of mak-ing the provision of $500 million for environmental costs. The effect is substantial and is likely to make a difference to the public and market perception of the business.
The ratios before taking into account any adjustment for the provision all show sig-nifi cant improvements in performance during 20X5, demonstrating the strength of the business fundamentals. There is, however, a dramatic change once the provision is accounted for: compared to performance in 20X4, the post-adjustment return on equity fi gure has fallen by just under 2 per cent. Gearing, post-adjustment, is higher

SCO
PE O
F EX
TERN
AL
REPO
RTIN
G
SOLUTIONS TO REVISION QUESTIONS F2458
than in 20X4. Although these are both adverse effects, the 20X5 and 20X4 numbers do not differ greatly from each other. Similarly, return on assets is lower, post-adjust-ment, but not by very much. Unfortunately, the effect on operating profi t margin is much more noticeable. After adjusting for the provision, the ratio falls to 7.7 per cent, substantially lower than the 20X4 fi gure. Earnings per share is also very badly affected; the ratio, post-adjustment, drops to 8.3 cents.
The effect on public perception of our business is likely to be mostly adverse, espe-cially once the key fi gure of earnings per share is absorbed by the market. However, the inclusion of the provision may prove advantageous in some respects in that we will be seen to be acting promptly and responsibly in making a provision for liabilities that have now become probable. The income statement still shows a respectable profi t after all the bad news has been fully refl ected and analysts may prefer to see the worst case position.
AppendixKey fi nancial ratios table
Ratio 20X5 ratio before provision
20X5 ratio after provision
20X4 ratio
Return on equity 31.5% 23.1% 24.7%Return on assets 21.8% 17.0% 17.7%Gearing 78.0% 85.5% 82.0%Operating profi t margin 10.2% 7.7% 10.1%Earnings per share 16.7¢ 8.3¢ 12.2¢
Workings
1. Basis of ratio calculation
Return on equity:Profit before tax
Average share capitalre� sserves
Return on assetsOperating profit
Average net assets
GeearingDebt
Equity
Operating profit marginOperating profit
Revvenue
Earnings per shareProfit for the year
Number of sharess in issue
2. Adjusting for the provision (all fi gures in $ millions)
Profi t before tax: $1,670 � 500 � 1,170Closing share capital � reserves: $5,656 � 500 � 5,156Closing net assets: $10,066 � 500 � 9,566Operating profi t: $2,080 � 500 � 1,580Profi t for the period: $1,002 � 500 � 502

SCO
PE OF EXTERN
AL REPO
RTING
459FINANCIAL MANAGEMENT
3. Ratio calculations
Ratio beforeprovision
Ratio after provision
Return on equity 1 670
4 954 5 656 2100
,
( , , )��
/ 31.5%
1 170
4 954 5 156 2100
,
( , , )��
/ 23.1%
Return on assets 2 080
9 016 10 066 2100
,
( , , )��
/ 21.8% 1 580
9 016 9 566 2100
,
( , , )��
/ 17.0%
Gearing 4 410
5 656100
,
,� 78.0% 4 410
5 156100
,
,� 85.5%
Operating profi t margin 2 080
20 392100
,
,� 10.2% 1 580
20 392100
,
,� 7.7%
Earnings per share 1 002
6 000100
,
,� 16.7¢
502
6 000100
,� 8.3¢
(b) Entities have moved towards meeting stakeholder demands for additional reporting, especially in respect of social and environmental issues. By producing such a report FW would indicate its willingness to respond to the pressure for a wider scope in reporting, and to be a good ‘corporate citizen’. If we genuinely feel that there are cor-porate achievements in respect of social and environmental activity that are currently insuffi ciently publicised, a regular annual report on these aspects could be helpful and would perhaps enhance FW’s reputation.
However, the publication of a social and environmental report is not a risk-free endeavour. If the report is too obviously a public relations document, it may arouse suspicion that we are indeed trying to ‘defl ect attention’ from other matters.
The production of a high-quality report is not a trivial matter and it seems unlikely that it could be ‘pulled together’ very quickly. We are likely to incur substantial costs in producing a good report. Because there are no regulatory constraints on the con-tent of such reports, businesses are able to be selective in their reporting (although it should be noted that the GRI does provide rigorous guidelines). However, having reported a piece of information on one occasion, we will set up an expectation that it will report a valid comparative in the future. This may be inconvenient where the indicator worsens.
Finally, the publication of a report may not produce the anticipated positive reputa-tional effects. It may suffer in comparison with similar reports from our competitors.
(c) The three principal sustainability dimensions are:1.Economic: To include performance ratios related to the direct economic impacts of
the entity on, for example, customers and suppliers.2.Environmental: To include performance ratios related to environmental impacts in
such areas as biodiversity, emissions, effl uents and waste.3.Social: To include performance ratios related to labour practices, human rights and
product responsibility.

SCO
PE O
F EX
TERN
AL
REPO
RTIN
G
SOLUTIONS TO REVISION QUESTIONS F2460
Solution 5 (a) Report
To: A From: Reporting accountant Date:Re: The fi nancial performance of Recycle (R)
The revenue of R has increased by 7.1% during the year, but over the same period its gross profi t has fallen by 6.6%, from a gross profi t ratio of 53.6% to one of 46.6%. During this period, operating expenses have increased by 33.3% and fi nance costs have doubled. These circumstances have had the effect of halving net profi t before income tax, from a rate against sales of 28.5% to one of 13.3%. While income tax is lower, the effect of main-taining the dividend on reduced profi ts is to limit the retained profi ts available to fi nance investment. Dividend cover has fallen from 2.75 times to 1.25 times.
As profi ts have fallen there is evidence of expansion, as tangible non-current assets have increased by $1,500 million [i.e., $4,100m � ($3,800m � $1,200m)], inventories by $150 million and trade receivables by $200 million. This investment has been fi nanced by an increased overdraft of $700 million, depreciation $1,200 million, and retained profi ts $50 million, less reduced credit for unpaid tax $100 million. It is imprudent to fi nance non-current asset purchases from short-term overdraft fi nance.
There is clear evidence of poor management of working capital, which has deteriorated from a positive to a negative fi gure this year. The current ratio shows 0.91:1 for 20X7 as against 1.09:1 last year, and the quick ratio 0.62:1 this year against 0.77:1 last. This situa-tion has been caused by the increase in the inventory-holding period (from 98 days to 114), and the receivables payment period (from 104 days to 122), largely fi nanced by the increased overdraft. Creditors and the bank must be concerned by these items.
The gearing ratio shows little change at about 25%, but the debt:equity ratio has dete-riorated from 0.72:1 to 0.92:1, and the interest cover is now only 3 times, against 9 times last year. This could presage diffi culties in raising long-term funds to refi nance loan pay-ments in 20X9. Unless receivables can be collected faster and inventories controlled there may not be suffi cient future cash fl ow to pay creditors, tax, dividends and the bank.
Signed: Reporting accountant
(b) The contribution made by published fi nancial statements to satisfy the information needs of B, by addressing social and environmental matters, is disappointing. Such information contained in the corporate report is usually in the unaudited public rela-tions section and not part of the fi nancial statements.
GAAP offers little in the way of rules to ensure the disclosure of social or environ-mental information, other than fi gures for charitable donations and a crude analysis of the labour force, and details of the employment of disabled persons. It is very much left up to companies to decide what to disclose and how to disclose it. In the case of a material amount to clean up an environmental disaster, this would be noted as an exceptional item or as a provision for a future liability if a legal obligation existed.
SCO
PE OF EXTERN
AL REPO
RTING
461FINANCIAL MANAGEMENT
Solution 6 As its name suggests, environmental reporting refers to the inclusion in the annual fi nan-cial report of the actions of entities to maintain and enhance the environment. There are no detailed requirements for environmental reporting contained within international accounting standards. However, IAS 37 Provisions, contingent liabilities and contingent assetsrequires the reporting of certain environmental liabilities. Many jurisdictions are encour-aging entities to provide environmental reports on a voluntary basis, and it is becoming increasingly common for listed entities to provide one. There appears to be a clear trend towards making such reports mandatory as the scope of stakeholder reporting widens. Reasons for the increasing incidence of environmental reports include:
● A greater acceptance that the fi nancial report should contain information to appeal to a wide range of stakeholders, rather than merely to the arguably narrow interests of the equity investor group.
● An increasing perception that an annual report is a public relations document that needs to report the extent to which the entity is a good ‘ corporate citizen ’ .
Solution 7 It is very unusual for a company to include its employees as assets in its statement of fi nan-cial position. There are essentially two main reasons for this:
1. Assets are defi ned by the IASB in its Framework for the Preparation and Presentation of Financial Statements as ‘ a resource controlled by the entity as a result of past transactions and events and from which future economic benefi ts are expected to fl ow to the entity ’ . It is questionable whether an employee could be regarded as satisfying this defi nition. It could be argued that, in practice, no contract of employment can force an individual to work so as to provide future benefi ts to the employer. Therefore, the essential features of the defi nition do not appear to be satisfi ed in this context.
2. Even if an employee can be regarded as an asset of an entity, that asset can only be recognised if it can be measured at a monetary amount with suffi cient reliability. This means ascribing a cost or value to the employee. In most cases (although there are cer-tain exceptions) no up-front payment is made in consideration of future services, so no valid cost exists. It would be theoretically possible to arrive at a value for an employee by capitalising the present value of future economic benefi ts but this exercise would be fraught with uncertainty. Even if such a value were to be computed, and the asset duly included on the statement of fi nancial position, the question of period of write off would arise.
The exposure draft proposing changes to IAS 38 Intangible Assets considered, but rejected, the possibility of requiring recognition and measurement of the workforce and its related intellectual capital.
To summarise, the practial problems of accounting for human resources as assets prob-ably outweigh the potential benefi ts.

This page intentionally left blank

18
International Issues in Financial Reporting

This page intentionally left blank

465
18 LEARNING OUTCOME After studying this chapter, students should be able to:
� discuss major differences between IFRS and US GAAP and the measures designed to contribute towards their convergence.
18.1 Introduction This chapter covers the area of international convergence Section 18.2 introduces the developments in this area and the progress that has been achieved, together with some background information on recent developments in international reporting.
Section 18.3 – includes a discussion of recent developments in convergence between IFRS and US GAAP, and the signifi cant differences that remain between interna-tional and US standards.
18.2 International convergence in financial reporting
First, it is worth considering why international convergence is considered to be of such importance. Entities have many reasons for engaging in international commerce. The potential for profi ts can be signifi cantly expanded by seeking new markets overseas. The cost of labour across the world varies enormously, and entities may be able to obtain a competitive advantage by manufacturing a product in a foreign country where labour is fl exible and cheap. Multinational entities attempt to minimise their risks and maximise their potential markets by operating in many countries across the globe.
The increase in international trade and commerce that has taken place in recent years often requires entities to seek additional resources in the form of capital to fi nance their international operations. Many multinational entities are quoted on more than one national stock exchange in order to obtain capital from a broad base. Financial reports play an
International Issues in Financial Reporting

STUDY MATERIAL F2466
INTE
RNAT
ION
AL
ISSU
ES IN
FIN
AN
CIA
L RE
PORT
ING important role in informing the decisions of investors and potential investors. However,
fi nancial reporting has differed widely in the past from one country to another, and it has been diffi cult to make valid comparisons between fi nancial statements prepared in different countries. Major differences in national regulatory and political systems have resulted in diver-gent sets of accounting regulations. Taxation policy and practice have contributed, in many cases signifi cantly, to differences in accounting practice. The advent of international fi nancial reporting standards is having a signifi cant infl uence in diminishing the importance of such differences in practice, and in contributing to improved transparency in capital markets.
18.2.1 Recent history of international standard-setting An international accounting standards board has been in existence in 1973, but the impe-tus for international harmonisation has gathered pace over the last 15 or 20 years. The International Accounting Standards Committee (IASC) was formed in 1973 with the objective of promoting convergence of the accounting principles that are used by busi-nesses and other organisations for fi nancial reporting. The objectives originally set out by the IASC were as follows:
● to formulate and publish in the public interest accounting standards to be observed in the presentation of fi nancial statements and to promote their worldwide acceptance and observance;
● to work generally for the improvement and harmonisation of regulations, accounting standards and procedures relating to the presentation of fi nancial statements.
The IASC lacked the kind of formal authority that is lent by backing under a national legal system, and so its objectives were necessarily quite general in nature. Compliance with its standards could not be enforced, and so instead was ‘ promoted ’ . The objective of stand-ardisation of accounting practice internationally would have been unrealistic at the time, and so a more general thrust towards ‘ harmonisation ’ was encouraged. More recently, the emphasis in international accounting has changed from the promotion of ‘ harmonisation ’ towards ‘ convergence ’ . Harmonisation is a process or set of processes by which differences in fi nancial reporting between countries can be reduced. Harmonisation does not aim for complete uniformity in practice, but rather at the minimisation of differences over time. Convergence, on the other hand, implies a much closer drawing together of accounting practices in different jurisdictions.
The work of the IASC was given signifi cant additional relevance during the 1990s because of the international securities regulator, IOSCO (the International Organization of Securities Commissions). IOSCO was formed in 1983 as a representative body of securities regulators and stock exchanges. Its own legitimacy was assured when the most infl uential body of all, the USA’s Securities and Exchange Commission (SEC), joined it in 1986/7. IOSCO became instrumental in augmenting the authority of international standards when, in 1995, it agreed to adopt a ‘ core ’ set of thirty international accounting standards as binding upon its members in respect of cross-border listings, provided that the standards reached a certain quality threshold. The IASC was required to have the ‘ core ’ standards in place by the end of 1998, a deadline which it only just succeeded in achieving. In May 2000, IOSCO concluded its deliberations by endorsing the 30 ‘ core ’ standards.
The work done by the IASC towards the ‘ core ’ standards project tended to emphasise its own limitations as an underfunded and somewhat unwieldy organisation. Reform was ini-tiated during the 1990s and came to fruition as a new organisational structure was put in

467FINANCIAL MANAGEMENT
INTERN
ATION
AL ISSU
ES IN FIN
AN
CIA
L REPORTIN
Gplace between 1999 and 2001. The International Accounting Standards Board (IASB) has, since 2001, assiduously followed its demanding program of work, under the chairmanship of Sir David Tweedie. The IASB’s objectives are:
(a) to develop, in the public interest, a single set of high-quality, understandable and enforceable global accounting standards that require high-quality, transparent and comparable information in fi nancial statements and other fi nancial reporting to help participants in the world’s capital markets and other users make economic decisions;
(b) to promote the use and rigorous application of those standards; (c) to bring about convergence of national accounting standards and international fi nan-
cial reporting standards to high-quality solutions.
18.2.2 The IASB’s progress towards its objectives There have been major developments in international accounting in recent years, most of which have tended to endorse the authority and scope of the international standards project. (The fact that CIMA examines fi nancial reporting issues only in terms of IFRS exemplifi es the point.) Many countries have already adopted IFRS either partially or fully. A very important endorsement of the international standards was made when the European Union decided to required listed entities throughout Europe to prepare consoli-dated fi nancial statements in accordance with IFRSs by 2005.
There seems little doubt that IFRS are well on the way towards global acceptance. This is not to say that the process has been trouble-free. For example, the European Union requires an endorsement process for the acceptance of international standards. Whilst most of the international standards have been endorsed without signifi cant problems (by the endorsing body, EFRAG), IAS 39 Financial Instruments: Recognition and Measurementproved to be an area of signifi cant controversy, and it was not adopted in full in the fi rst instance. Also, there is still a very large amount of work to be done to achieve convergence, and the process is unlikely to be substantially complete for many years yet.
Also, adoption of IFRS by many countries is incomplete. In Europe, for example, IFRSs are mandatory only for the consolidated fi nancial statements of listed companies, and are optional for unlisted companies. National accounting standards regimes remain in many countries. While the national standard setters of some countries, such as the UK, are pro-ducing new standards that bring national practice into convergence with IFRS, this is not universally the case. Even where national and international practices are similar, important differences may remain. A further potential problem remains in respect of the extent of compliance with IFRS. Having no compliance mechanism of its own, the international standard setter relies upon national regulatory mechanisms to ensure enforcement of the standards. This may not be a uniformly successful process. Also, subtle differences in adop-tion and application may persist, even in fi nancial statements that appear to be fully com-parable with each other. An article by Professor Parker is included in the readings at the end of the chapter, exploring some of the problems of convergence.

STUDY MATERIAL F2468
INTE
RNAT
ION
AL
ISSU
ES IN
FIN
AN
CIA
L RE
PORT
ING 18.3 Convergence between IFRSs and US GAAP
18.3.1 US GAAP – background The SEC plays an important role in the accounting regulatory framework in the USA. It is an independent government agency, with a full-time staff of over 2,500, whose respon-sibility it is to oversee the activities of entities listed on Stock Exchanges in the US – some 12,000 entities. The SEC is authorised to issue accounting standards, but in practice it has always ceded this responsibility to private-sector accounting standard setters. Since 1973 the US standard setter has been the Financial Accounting Standards Board (FASB); during its lifetime it has issued many standards. US standards tend to be very detailed and to fol-low a ‘ rule-book ’ approach.
Although the SEC does not issue standards, it has a host of stringent disclosure require-ments. Taken together the SEC requirements and the fi nancial accounting standards issued by FASB contribute to the most tightly regulated and controlled capital market in the world. It was never likely that the US would simply adopt international accounting stand-ards, and, indeed, in the 1990s the possibility of signifi cant convergence between the two seemed fairly remote. However, in the early years of this century several factors combined to make convergence between the two both desirable and possible. The authority of the international standard setter was greatly increased by the IOSCO endorsement, the adop-tion by the EU and by its new constitution. In the US the stock market bubble came to an abrupt end, and the confi dence of market participants was severely shaken by a series of major accounting scandals. The most signifi cant of these in terms of economic signifi cance was probably WorldCom, but it was Enron that really undermined confi dence in the US regulatory system. Suddenly, it seemed distinctly possible that the rule-book approach to accounting regulation might not be the most effective.
In September 2002, IASB and FASB agreed to undertake a convergence project with the objective of reducing differences between IFRS and US GAAP. The full text of the so-called ‘ Norwalk agreement ’ between the two bodies is given below:
At their joint meeting in Norwalk, Connecticut, USA on September 18, 2002, the Financial Accounting Standards Board (FASB) and the International Accounting Standards Board (IASB) each acknowledged their commitment to the development of high-quality, compatible accounting standards that could be used for both domestic and cross-border fi nancial reporting. At that meeting, both the FASB and IASB pledged to use their best efforts to (a) make their existing fi nancial reporting standards fully compatible as soon as is practicable and (b) to coor-dinate their future work programs to ensure that once achieved, compatibility is maintained.
To achieve compatibility, the FASB and IASB (together, the ‘ Boards ’ ) agree, as a matter of high priority, to:
(a) undertake a short-term project aimed at removing a variety of individual differences between US GAAP and International Financial Reporting Standards (IFRSs, which include International Accounting Standards, IASs);

469FINANCIAL MANAGEMENT
INTERN
ATION
AL ISSU
ES IN FIN
AN
CIA
L REPORTIN
G (b) remove other differences between IFRSs and US GAAP that will remain at January 1,
2005, through coordination of their future work programs; that is, through the mutual undertaking of discrete, substantial projects which both boards would address concurrently;
(c) continue progress on the joint projects that they are currently undertaking; (d) encourage their respective interpretative bodies to coordinate their activities.
The Boards agree to commit the necessary resources to complete such a major undertaking.The Boards agree to quickly commence deliberating differences identifi ed for resolution in the
short-term project with the objective of achieving compatibility by identifying common, high-quality solutions. Both Boards also agree to use their best efforts to issue an exposure draft of proposed changes to US GAAP or IFRSs that refl ect common solutions to some, and perhaps all, of the differences identifi ed for inclusion in the short-term project during 2003.
As part of the process, the IASB will actively consult with and seek the support of other national standard setters and will present proposals to standard setters with an offi cial liaison relationship with the IASB, as soon as is practical.
The Boards note that the intended implementation of IASB’s IFRSs in several jurisdictions on or before January 1, 2005 require that attention be paid to the timing of the effective dates of new or amended reporting requirements. The Board’s proposed strategies will be implemented with that timing in mind.
18.3.2 Progress towards convergence The IASB and FASB have lost no time in pursuing their convergence programme. The fruits of it to date include the following:
● An extensively revised version of IFRS 3 Business Combinations issued in January 2008. ● The standard on segment reporting (IFRS 8 Operating segments ) issued in November
2006 (see Chapter 17 of this Learning System ).● IFRS 5 Non-current Assets Held for Sale and Discontinued Operations .● An extensively revised version of IAS 1 Presentation of Financial Statements , issued in
September 2007.
As well as the projects currently under way which have reached the exposure draft stage (business combinations, non-fi nancial liabilities and segment reporting), there are several other active projects:
Short-term convergence projects ● IAS 12 income taxes ● impairment.
Long-term projects ● revenue recognition ● the conceptual framework ● post-retirement benefi ts.
The biggest step so far was taken by SEC in December 2007 when it removed the need for companies listing in the US and preparing their fi nancial statements in accordance with IFRS, to prepare a reconciliation to US GAAP. The removal of this requirement was seen as the most signifi cant step towards full convergence.
Despite all this activity, many signifi cant differences remain between IFRS and US GAAP. These are the subject of the following section.

STUDY MATERIAL F2470
INTE
RNAT
ION
AL
ISSU
ES IN
FIN
AN
CIA
L RE
PORT
ING 18.3.3 Remaining differences between
US GAAP and IFRS The set of differences between the two sets of regulations changes frequently with the issue of new standards. Signifi cant recent changes have included the issue of IFRS 8 Operating Segments , and the updated versions of IFRS 3, IAS 27 and IAS 1. All of these have signifi -cantly reduced differences between US GAAP and IFRS.
This means that any list of differences is soon out of date, and all such lists should be treated with caution. Nevertheless, the list provided by, for example, the accounting fi rm PricewaterhouseCoopers is helpful. It was last updated (at the time of the update of this Learning System) in August 2007, and is available at www.pwc.com .
The table below summarises some of the signifi cant remaining differences:
Issue IFRS US GAAP
General approach Broadly, principles-based Broadly, rule-based Comparative information One year of comparative
information is required No specifi c requirement, but SEC rules required 3 years of comparative information (2 years for the statement of fi nancial position)
Extraordinary items Prohibited Defi ned as being both infrequent and unusual, and are rare
Jointly controlled entities Both proportionate consolidation and equity method are permitted
Equity method is required except in certain circumstances
Revenue recognition IAS 18 contains general principles only
While principles are similar to IFRS, there is extensive industry-specifi c guidance
Development costs Are capitalised and amortised when specifi c criteria are met
Development costs are expensed as incurred
Property, plant and equipment
Either cost or revaluation bases are permitted
Historical cost is used; revaluation is not permitted
Inventories Use of LIFO is not permitted Use of LIFO is permitted Investment property Measured at fair value or
depreciated cost Depreciated historical cost is the only permitted measurement
Detailed knowledge of the differences is not required for F2 Financial Management.However, it is expected that candidates will be able to identify some of the principal differ-ences that still exist between IFRS and US GAAP. Questions are quite frequently set in this area, and are often badly handled by candidates.
18.4 Summary This chapter has examined a range of issues relating to international fi nancial reporting. Section 18.2 examined the important issue of international convergence in fi nancial reporting. Three relevant readings are appended at the end of this chapter which will help to consolidate knowledge of this important topic. Section 21.3 examined the special case of convergence between IFRS and US GAAP, providing a list of some of the important differences that remaining, as well as a discussion of the substantial progress towards convergence that has been made in a short period of time.

471FINANCIAL MANAGEMENT
INTERN
ATION
AL ISSU
ES IN FIN
AN
CIA
L REPORTIN
G Students should note that the position changes rapidly. They can keep up to date by
referring to the IASB website (at www.iasb.org ). FASB’s website is excellent and compre-hensive ( www.fasb.org ).
Examination questions can be expected relating to the areas covered in this chapter. One pos-sibility is to present a fi nancial statement (or statements) prepared under international stand-ards and to require comment on/calculation of the differences if the statement were presented under US GAAP (or vice-versa). Questions requiring discussion of the issues are also likely to occur from time to time. Students who prove themselves to be knowledgeable about current/recent developments are likely to be at a distinct advantage.

This page intentionally left blank

473
Readings
Have IFRSs conquered the world?
Bob Parker, Accountancy, November 2005. It’s far from a foregone conclusion, argues Bob Parker
‘ Learning International Financial Reporting Standards (IFRSs) is a chore for us account-ants in the UK but once we have mastered them, then not only do we know the rules of British accounting we also know the rules throughout the world. ’ How true is this? Have IFRSs really conquered the world?
Certainly they seem at fi rst sight to have conquered the two parts of the world to which the UK has the greatest political attachment: the EU and the Commonwealth. From 1 January 2005 (or at the latest from 1 January 2007), the consolidated fi nancial state-ments of listed companies within all 25 members of the EU are required to comply with all International Accounting Standards and IFRSs approved by the European Commission (EC). Leading members of the Commonwealth such as Australia, South Africa, New Zealand and Singapore all claim to have adopted international standards. Canada has pledged convergence by 2011.
Not the only game in town But there is the great exception: the US is not giving up US GAAP. IFRSs are not the only game in town. The US Financial Accounting Standards Board is the best-funded in the world, and the Securities and Exchange Commission (SEC) the strictest enforcer of accounting standards. Nevertheless, strenuous efforts are being made to bring IFRS and US GAAP closer together. There has been a ‘ race to the top ’ as international and US standard-setters have competed to produce standards acceptable to stock exchanges and government regulatory bodies. International standards have appealed to the EC not only because they are not US GAAP but also because they are not all that different from US GAAP.
However, within the EU, harmonisation is not as great as it might appear to be. The UK is exceptional in its strong support of the concept of international standards. This should not surprise us. British accountants were active in the formation and development of the International Accounting Standards Committee from 1973 onwards. International standards have been much more infl uenced by UK accounting rules and practices than by continental European ones and thus the adjustment we have to make is much less.
Since IFRSs are mandatory within the EU only for the consolidated statements of listed companies, the great majority of German and French companies will not be applying inter-national standards. In particular, the subsidiaries of German and French parent companies
18

474
INTE
RNAT
ION
AL
ISSU
ES IN
FIN
AN
CIA
L RE
PORT
ING will be using local GAAP. Adjustments will of course be made during the consolidation
process, but many local features (for example, the way depreciation is calculated) are likely to remain.
Casting doubts One may also be permitted to have doubts about the extent to which IFRSs will be com-plied with in practice. For several years now several large companies in Germany and France have purported to be applying International Accounting Standards or US GAAP in their consolidated statements, but research has shown less than complete compliance and a tendency to pick and choose. The monitoring and enforcement of accounting standards is strongest in the US and the UK but noticeably weak in Germany. Germany has recently set up institutions based on both the US SEC and the UK Financial Reporting Review Panel. It remains to be seen how successful they will be.
Finally, there has been an understandable reluctance for national standard-setters and government authorities to accept international standards which they see as against their own interests, especially if major companies lobby against them. Commonwealth countries other than the UK are converging with international standards rather than adopting them. Close scrutiny of what is happening in Australia, for example, suggests convergence rather than adoption, with portions of standards omitted or amended.
So, have IFRSs conquered the world? Not quite, but the achievements of the IASC/B are surely greater than its founders in 1973 dared to hope.
Financial Analysis The Examiner, Financial Management, December/January 2007/2008 The content of the following article is relevant to the F2 exam as the related learning outcome is the same for F2 as it was for P8.
Candidates have tended to struggle with questions on US GAAP versus IFRS. The examiner for paper P8 offers her guidance on the topic.
The P8 learning outcome ‘identify major differences between IFRS and US GAAP’ has been tested twice so far. The November 2005 paper asked candidates to cite exam-ples of the two systems ’ differences and similarities, while a question in May 2007 asked for a brief paper describing the progress of the convergence project. These questions were answered badly in most cases – many candidates didn’t even attempt an answer.
The biggest weakness was a sheer lack of knowledge. Some candidates were unaware that convergence was occurring at all. In May 2007 they were asked to describe how it was progressing, giving examples. Many did the opposite by listing the continuing differences between IFRS and US GAAP. Others repeated the few relevant points that they did know in different guises – also a waste of valuable exam time.
The use of the verb ‘ identify’ in the learning outcome means that the outcome is pitched at the level of ‘ comprehension’ in CIMA’s hierarchy of learning objectives. This is a relatively low level, which means that advanced analytic and evaluative skills are not required to tackle questions in this area. So, although the differences between the sets of regulations are often extremely complex, for the purposes of P8 it’s necessary only to know the key issues.
At a meeting in Norwalk, Connecticut, in 2002 the International Accounting Standards Board (IASB) and the US Financial Accounting Standards Board (FASB) agreed to start the convergence project. The Norwalk agreement set out their plan to reduce the differences
READINGS F2

475FINANCIAL MANAGEMENT
INTERN
ATION
AL ISSU
ES IN FIN
AN
CIA
L REPORTIN
Gbetween IFRS and US GAAP. Today, a list of standards, exposure drafts and discussion papers bears witness to their progress. Some May 2007 P8 candidates could name a few of their joint projects, but many could not.
Despite all this work, there are still many differences that are likely to last. The one that everyone seems to know is that the use of LIFO as an inventory valuation method is per-mitted under US GAAP but not under IFRS. Some others were described in a Study notes article in the June 2007 issue of FM .*
Currently, foreign issuers listed on the US markets must submit a reconciliation of their fi nancial statements with US GAAP to the US Securities and Exchange Commission (SEC). But the SEC recently proposed dropping this rule, so it’s likely that fi ling a rec-onciliation will no longer be required by 2009. Even more striking is an SEC proposal, now out for comment in the form of a ‘ concept release’ , to allow US companies to fi le statements using IFRS rather than US GAAP. It’s unlikely that many of them would take advantage of this change, but the fact that it’s being discussed at all indicates how much more acceptable IFRS has become in the US.
Chapter 18.3 of the Financial Analysis CIMA Learning System (now Chapter 18.3 of theF2 CIMA learning system) covers the background to convergence, the Norwalk agreement, current developments and the key remaining differences. For the 2008 exams, any changes made up to and including December 1, 2007 are examinable. So, as long as you use the latest edition of the learning system, you shouldn’t have a problem. For those students who wish to impress the examiner with the depth of their knowledge – and the examiner will be impressed – several other information sources can be consulted.
The following web sites are useful:
● The International Accounting Standards Board: www.iasb.org . ● The Financial Accounting Standards Board: www.fasb.org . ● The US Securities and Exchange Commission: www.sec.gov . ● Deloitte, which produces comprehensive updates: www.iasplus.com . ● PricewaterhouseCoopers, which has published a booklet entitled ‘ Similarities and differences –
a comparison of IFRS and US GAAP ’ : http://snipurl.com/1t01q .
Once they have gained an outline knowledge of the key issues, candidates should aim to improve this by keeping their eyes open for news of developments and consulting some of the above sources.
The May 2007 post-exam guide included the following observation: ‘ Candidates should be aware (but, on the evidence of this paper, are mostly not aware) that this is not a trivial or marginal topic. On the contrary, it could be argued that the issue of US GAAP/IFRS convergence is the most important contemporary issue in fi nancial reporting.’
The question of whether or not the learning outcome is likely to be examined again in the foreseeable future should, therefore, be relatively easy to answer.
* One of the differences identifi ed in that article is no longer valid: changes in accounting policy under US Gaap are now handled in the same way as they are under IAS8 – that is, there is a requirement to make a full prior period restatement. (Thanks to Malcolm Greenbaum of BPP Professional Education for high-lighting this development.)

This page intentionally left blank

477
Revision Questions 18 Question 1 You are the management accountant of X, an entity with a number of subsidiaries located in Europe and the United States of America (USA). One of these subsidiaries is US Inc., a entity incorporated in the USA. You are looking at the differences between the accounting treatment used in the accounts of US Inc. and X, which prepares fi nancial statements in accordance with IAS.
The fi nancial statements of US Inc. (drawn up in US dollars) are prepared in accord-ance with generally accepted accounting practice (GAAP) prevailing in the USA. The draft fi nancial statements of US Inc. for the year to 31 December 20 X 5 showed a profi t before taxation of $25 million. You are given the following information regarding US Inc. :
(i) During 20 X 4, US Inc. completed a development project, incurring costs of $20 million. US Inc. has no other development projects. The project was expected to generate cost savings of at least $5 million per annum for 5 years from the end of 20 X 4. All neces-sary market testing was carried out in 20 X 4 and the anticipated savings did in fact materialise in 20 X 5 and are expected to continue through until the end of 20 X 9. The costs of $20 million were written off in the income statement of US Inc. in 20 X 4 in accordance with GAAP in the USA. In the consolidated fi nancial statements, X capi-talises development expenditure whenever required by IAS 38.
(ii) The fi nancial statements of US Inc. carry stocks at cost determined according to the last in, fi rst out (LIFO) basis of valuation. However, stock values are also com-puted and reported to X using the fi rst in, fi rst out (FIFO) basis of valuation. X uses the FIFO method of stock valuation in its own (and in its consolidated) accounts. Relevant fi gures for US Inc. for 20 X 5 are given below:
Valuation of stocks of US Inc. under: LIFO FIFO
Date $m $m 1 January 20 X 5 41 44 31 December 20 X 5 55 65
Requirement Prepare a schedule in US dollars, which reconciles the profi t before taxation of US Inc. as computed for its own draft fi nancial statements with the profi t before taxation which will be used for incorporation into the consolidated fi nancial statements of X. Explain clearly the reasons for the adjustments. (10 marks)

INTE
RNAT
ION
AL
ISSU
ES IN
FIN
AN
CIA
L RE
PORT
ING
REVISION QUESTIONS F2478
Question 2 At a recent staff seminar on accounting standards, a senior member of your fi rm’s account-ing staff made the following observation:
‘ International standards have now been adopted in many countries across the world. Unfortunately, though, they can never be truly international because US GAAP will con-tinue to dominate accounting in the USA and therefore in many multinational businesses. ’
Requirement Explain the rationale for this observation, illustrating your explanation with examples of signifi cant differences and similarities between US GAAP and international accounting standards. (10 marks)

479
Solutions to Revision Questions 18 Solution 1 Reconciliation of US to IAS
$m Profi t of US Inc computed according to American GAAP 25 1. Development costs – share charged against profi t (4) 2. Stock valuation – reduction in cost of sales under FIFO 7 Profi t of US Inc to be incorporated into X group accounts 28
● IAS 38 requires development costs to be capitalised and spread over the life of the devel- opment, whereas in the US a more conservative rule prevails and such costs are written off against profi ts when they are incurred. The project is expected to last 5 years and therefore the profi ts would be reduced by ($20 m/5 years) � $4 m amortisation of devel-opment costs.
● Group policy is to value stock using FIFO.
Solution 2 IFRS have, indeed, been adopted in many countries across the world: for example, com-pliance with them is compulsory in companies listed on a Stock Exchange within the European Union, and their adoption in Australia and New Zealand is well underway.
Nevertheless, it is certainly the case that accounting in accordance with international standards continues to differ from US GAAP in many respects. To this extent, the observa-tion by the senior staff member has some validity. An example of an important difference is: Valuation . International accounting practice allows the option to value property, plant and equipment at either depreciated cost or fair value. US GAAP is more restrictive in this respect and reporting at depreciated cost is much more prevalent.
On the other hand, convergence between US and international practice is becoming increasingly common. For example, a signifi cant area of difference in the past has been that of business combinations: it was common in the US until recently to account for many business combinations as pooling of interests. While international practice did not outlaw pooling of interests, its use was far less common. However, developments in US and inter-national standards have now resulted in a position where pooling of interests accounting is no longer available.

INTE
RNAT
ION
AL
ISSU
ES IN
FIN
AN
CIA
L RE
PORT
ING
SOLUTIONS TO REVISION QUESTIONS F2480
The senior staff member does not mention the ‘ Norwalk agreement ’ , which established a formal convergence project between the IASB and its US counterpart, the Financial Accounting Standards Board (FASB). Under the terms of this agreement, the IASB and FASB agreed to work together to remove differences between their respective sets of stand-ards, and to co-ordinate their future programmes of work. The agreement has already resulted in a narrowing of differences: for example, IFRS 5 Disposal of Non-Current Assets and Presentation of Discontinued Operations brings international practice into line with US GAAP. Major recent developments include the issue of the IAS 1 (revised) Presentation of Financial Statements which brings international and US practice much more closely into line with each other.
There is a great deal of work to be done before US GAAP and international practice can be described as ‘ convergent ’ . However, much has already been achieved in a short time. The view expressed by the senior staff member would have been widely regarded as valid until very recently, but it has been overtaken by events. The convergence project has undoubtedly been given additional impetus by the recent, spectacular, corporate and accounting failures in the US. These have resulted in a period of introspection and self-criticism amongst US regulators and in a push towards signifi cant improvement in fi nancial reporting. Traditionally, the US approach to accounting regulation has been ‘ rules-based ’ ; this has resulted in the production of very lengthy, detailed accounting standards. By con-trast, international accounting standards have tended to be ‘ principles-based ’ . For example, instead of having a very detailed international standard addressing substance over form, international accounting practice relies much more upon promulgation and acceptance of the general principle of substance over form. The recent US accounting scandals have led to a great deal of criticism of the ‘ rules-based ’ approach and greater acceptance of the value of the ‘ principles-based ’ approach. On the other hand, international regulation appears to be moving to some extent in the opposite direction, as international standards become lengthier and more prescriptive (e.g.: IAS 39 Financial Instruments: Recognition and Measurement ). Therefore, it seems likely that US and international regulators will fi nd it easier to occupy common ground in their approach to standard setting.
Solution 3 The convergence project: progress to date Traditionally, the US has adopted a ‘ rule-book ’ approach to fi nancial reporting stand-ard setting, whereas the approach taken by the IASB, and its predecessor body, has been to encourage adherence to principles. This fundamental difference in approach made it appear, for a long time, as though the US would never accept international standards. However, the rule-book approach was found wanting in a series of fi nancial scandals in the US in the late 1990s and early years of the 21st century. The climate was therefore ame-nable to a change in approach which would make convergence possible between US and international fi nancial reporting standards.
In September 2002 the US standard setter (Financial Accounting Standards Board – FASB) and the IASB agreed to undertake a project which would have the objective of con-verging their accounting practices, reducing the number of differences between US GAAP and IFRS. This agreement (the ‘ Norwalk agreement ’ ) committed the parties to making their existing standards fully compatible as soon as practicable, and to co-ordinating their future work programmes. In order to address the fi rst commitment, a short-term project

INTERN
ATION
AL ISSU
ES IN FIN
AN
CIA
L REPORTIN
G
481FINANCIAL MANAGEMENT
was undertaken to remove some of the differences between existing standards. The second commitment was to be met by collaborating on the development of standards.
A memorandum of understanding between FASB and the IASB sets out a ‘ Roadmap of Convergence between IFRS and US GAAP 2006-8 ’ . This is aimed at removing the need for a reconciliation to US GAAP requirement for those companies that use IFRS and are registered in the USA.
Progress to date has been impressive. Projects undertaken jointly between FASB and IASB have produced the following:
● IFRS 5 Non-current Assets Held for Sale and Discontinued Operations ● IFRS 3 Business combinations ● IFRS 8 Operating Segments ● IAS 1 Presentation of Financial Statements: a revised presentation
There are several on-going projects that will run into the longer-term. For example, the amendment to IAS 1 noted above represents just a fi rst phase in a larger project on fi nan-cial statement presentation. Subsequent phases will address fundamental issues in present-ing information and the issue of interim reporting.
Other longer-term projects include convergence of the conceptual frameworks and revenue recognition.
Finally, despite the high level of activity on convergence, it should be noted that many signifi cant differences remain between US GAAP and IFRS.

This page intentionally left blank

Preparing for the Examination

This page intentionally left blank

485
This chapter is intended for use when you are ready to start revising for your examination. It contains:
● a summary of useful revision techniques;● details of the format of the examination.
Revision techniquePlanningThe fi rst thing to say about revision is that it is an addition to your initial studies, not a substitute for them. In other words, don’t coast along early in your course in the hope of catching up during the revision phase. On the contrary, you should be studying and revising concurrently from the outset. At the end of each week, and at the end of each month, get into the habit of summarising the material you have covered to refresh your memory of it.
As with your initial studies, planning is important to maximise the value of your revi-sion work. You need to balance the demands of study, professional work, family life and other commitments. To make this work, you will need to think carefully about how to make best use of your time.
Begin as before by comparing the estimated hours you will need to devote to revision with the hours available to you in the weeks leading up to the examination. Prepare a writ-ten schedule setting out the areas you intend to cover during particular weeks, and break that down further into topics for each day’s revision. To help focus on the key areas try to establish:
● which areas you are weakest on, so that you can concentrate on the topics where effort is particularly needed;
● which areas are especially signifi cant for the examination – the topics that are tested frequently.
Don’t forget the need for relaxation, and for family commitments. Sustained intellectual effort is only possible for limited periods, and must be broken up at intervals by lighter activities. And don’t continue your revision timetable right up to the moment when you enter the exam hall: you should aim to stop work a day or even 2 days before the exam. Beyond this point the most you should attempt is an occasional brief look at your notes to refresh your memory.
Preparing for the Examination

STUDY MATERIAL F2486
PREP
ARI
NG
FO
R TH
E EX
AM
INAT
ION Getting down to work
By the time you begin your revision you should already have settled into a fi xed work pat-tern: a regular time of day for doing the work, a particular location where you sit, particu-lar equipment that you assemble before you begin and so on. If this is not already a matter of routine for you, think carefully about it now in the last vital weeks before the exam.
You should have notes summarising the main points of each topic you have covered. Begin each session by reading through the relevant notes and trying to commit the import-ant points to memory.
Usually this will be just your starting point. Unless the area is one where you already feel very confi dent, you will need to track back from your notes to the relevant chapter(s) in the Learning System. This will refresh your memory on points not covered by your notes and fi ll in the detail that inevitably gets lost in the process of summarisation.
When you think you have understood and memorised the main principles and tech-niques, attempt an exam-standard question. At this stage of your studies you should normally be expecting to complete such questions in something close to the actual time allocation allowed in the exam. After completing your effort, check the solution provided and add to your notes any extra points it reveals.
Tips for the final revision phaseAs the exam looms closer, consider the following list of techniques and make use of those that work for you:
● Summarise your notes into more concise form, perhaps on index cards that you can carry with you for revision on the way into work.
● Go through your notes with a highlighter pen, marking key concepts and defi nitions.● Summarise the main points in a key area by producing a wordlist, mind map or other
mnemonic device.● On areas that you fi nd diffi cult, rework questions that you have already attempted, and
compare your answers in detail with those provided in the Learning System.● Rework questions you attempted earlier in your studies with a view to producing more
‘polished’ answers (better layout and presentation earn marks in the exam) and to com-pleting them within the time limits.
● Stay alert for practical examples, incidents, situations and events that illustrate the mate-rial you are studying. If you can refer in the exam to real-life topical illustrations you will impress the examiner and earn extra marks.
The format of the examinationStructure of the paperThe examination paper for Financial Management has two sections:
1. Section A will be a compulsory section for 50 marks, containing fi ve 10 marks questions.
2. Section B will be a compulsory section for 50 marks, containing two questions of 25 marks each, or one case study style question for 50 marks.

487FINANCIAL MANAGEMENT
PREPARIN
G FO
R THE EXA
MIN
ATION
Any changes in the structure of the examination or in the format of questions will be indi-cated well in advance in the appropriate CIMA journals.
How to tackle the examinationThere are a number of general points that are relevant to sitting the Financial Managementexamination.
● Examination pressure. We have all sat examinations at some point in our lives. They are unusual situations; the body and mind can behave in strange and sometimes uncontrol-lable ways. You need to be able to overcome this examination room pressure in order to deliver and show the examiner that you are worthy of passing the examination.
You will need plenty of practice of questions under time constraints, and should prac-tise ‘mock’ examinations. It is also important to have a rest and proper sleep the night before the exam.
● Timing. A common mistake made by students is the failure to allocate time properly. While it is easy to become engrossed in a complex numerical question, it is impera-tive that time available for the whole examination is allocated between the different questions.
Reading time of 20 minutes is allocated to F2 and during this time you may study the exam paper and make annotations on the exam paper, but are prohibited from writing on your answer paper until instructed to do so by the exam invigilator. It is important to use this time effectively. When practising the mock exam questions, allow yourself the 20 minutes reading time and decide how best to use it prior to the exam.
You have 1.8 minutes per mark and should allocate time to questions on this basis. Most marks are obtained within the time allocation and the question should be left when this time has run out. Excessive time applied to a question will almost certainly produce a diminishing return in terms of marks awarded. Any time savings achieved on questions may be used to return to the unfi nished questions at the end.
It is essential to answer all the questions required, if you are to stand a reasonable chance of passing.
The manner in which you tackle questions is important. Attempting the question you know best fi rst is advisable. In sections of the examination which involve little choice you must select the questions that best refl ects your abilities, but not waste time decid-ing which questions these are.
● Planning. In order to overcome examination pressure and time pressure, it is a good idea to train yourself to plan answers before writing. You should prepare across the full sylla-bus and not rely on ‘question-spotting’.
● Understanding the questions. Students sometimes fail because they give a good answer to the ‘wrong’ question.
It is essential that you read the question carefully to ensure a full understanding of what is required.
Time should not be wasted in a detailed reading of a lengthy practical question. You should become practised at scanning these questions to extract the fundamental back-ground, the structure involved and the detailed requirements.

STUDY MATERIAL F2488
PREP
ARI
NG
FO
R TH
E EX
AM
INAT
ION You should fi rst look at the requirements of the question. Second, gain an appreciation
of any complications caused by structure, organisation or circumstances. Third, discover any major factors which will require a modifi ed approach to the question.
Do not just write everything you know about a subject; this may cause you to over-run on time for that question and will give the impression to the marker that you don’t fully understand the question and the key issues. And if there are marks for the format (there are not normally any more than 2 marks attributed to format in this exam) of your answer, make sure you comply with the instructions – report format or memorandum, for example.
● Working calculations. Whatever the form of the question, all calculations and adjust-ments should be written out carefully. Credit is given in examinations for workings, even where you may have inserted the wrong fi gure in the fi nal answer.
● Presentation. A high standard of presentation is an essential quality of a professional accountant. This applies not only to clarity and neatness in both the solutions and workings, but to presentation of answers in accordance with generally accepted account-ing practice, for example, formats followed in accordance with IAS 1 (revised) and IAS 7, and the absence of abbreviations in statements of fi nancial position and income statements.
● Quality of English. Frequent comment is made by examiners about the poor standards of written English. All that is required is care with the written parts of the examination. Some forethought and planning of answers will reap benefi ts in clarity of writing.
Examiners have often stressed that students should avoid contentious remarks such as ‘obviously’. These words should be used very carefully. If something is obvious, why state it? This does not mean to say that an answer should not include the obvious, but it is better not to say that it is! In any case, very often what actually follows the word ‘obvi-ously’ is far from so. Another example is the report which ends with a phrase along the lines of ‘I hope that this has clarifi ed the situation’, or ‘Do not hesitate to contact me if you require further clarifi cation’. Avoid these terms, as all too often they indicate mud-dled thinking.

489
Section AThe following questions are those that refl ect exam standard questions worth 10 marks. These cover all 4 sections of the syllabus and combine numerical and narrative components.
Question 1 (a) Pot owns all the share capital of Noodle. The following information is extracted from
the individual statements of fi nancial position of the two entities on 31 December 20Y0:
Pot Noodle$ $
Current assets 400,000 350,000Current liabilities 250,000 100,000
The receivables of Pot include $40,000 receivable from Noodle, while the payables of Noodle include $25,000 payable to Pot. The difference is accounted for by cash in transit.
RequirementIf there are no other intra-group balances, what is the value of the net current assets in the consolidated statement of fi nancial position of Pot? (3 marks)
(b) Peter owns 75% of the issued capital of Paul. The investment was made when the retained earnings of Paul were $100,000. The draft statements of fi nancial position of the two entities at 31 December 20X0 showed the following balances:
Peter Paul$’000 $’000
Share capital ($1 shares) 250 160Retained earnings 200 180
450 340
On 31 December 20X0 Peter and Paul paid dividends of $40,000 and $20,000 respec-tively. Neither entity has made any entry in its fi nancial statements in respect of either dividend.
RequirementCalculate the balance on the consolidated retained earnings of Peter after accounting for both dividends (ignore goodwill on consolidation)? (3 marks)
(c) BJS, a listed entity, had a weighted average of 27,000 shares in issue in its fi nancial year ended 31 August 20X6. It was also fi nanced throughout the year by an issue of
Revision Questions

PREP
ARI
NG
FO
R TH
E EX
AM
INAT
ION
REVISION QUESTIONS F2490
convertible loan stock with a par value of $50,000. The loan stock is convertible at the option of the holders at the rate of 12 new ordinary shares for every $100 of loan stock at par value. The fi nance cost recognised in BJS’s income statement for the year ended 31 August 20X6 in respect of the loan stock was $6,000. The tax rate applicable to BJS was 30% during the fi nancial year. The profi t attributable to ordinary sharehold-ers for the year ended 31 August 20X6 was $100,000.
RequirementCalculate earnings per share, and diluted earnings per share for BJS for the year ended 31 August 20X6. (4 marks) (Total marks � 10)
Question 2
(a) Abbott purchased 20 million of the 25 million issued $1 ordinary shares in Costello on 31 December 20X4, when the reserves of Costello showed a balance of $25 million and the net assets were $50 million. The cost of the purchase was $62 million. It is group policy to value non-controlling interest at acquisition at fair value. The fair value of the non-controlling interest of Costello was $6.5 million at the acquisition date. For the purposes of the consolidation the following matters may be relevant:
● At 31 December 20X4 there was a contingency in existence that resulted in a gain of $5 million to Costello on 31 March 20X5.
● At 31 December 20X4 the property, plant and equipment of Costello had a fair value that was $10 million in excess of its carrying value in the fi nancial statements of Costello.
● At 31 December 20X4 Costello sold a branded product. The directors of Abbott con-sidered that this brand name was worth around $7.5 million but the brand name has no readily ascertainable market value.
RequirementExplain how the investment in Costello should be accounted for in the consolidated fi nan-cial statements of Abbott and calculate the goodwill on consolidation of Costello that will appear in the consolidated statement of fi nancial position of Abbott at 31 December 20X4? (6 marks)
(b) The statements of fi nancial position of the two entities at 31 December 20X8 showed the following:
Abbott Costello$’000 $’000
Ordinary share capital 50,000 25,000Retained earnings 60,000 35,000
110,000 60,000
● The property, plant and equipment of Costello that was included in its statement of fi nancial position at 31 December 20X4 (the date of acquisition) had an estimated future economic life of 10 at 31 December 20X4. None had been sold or scrapped by 31 December 20X8.

PREPARIN
G FO
R THE EXA
MIN
ATION
491FINANCIAL MANAGEMENT
RequirementCalculate the consolidated retained earnings balance of Abbott at 31 December 20X8?
(4 marks)(Total marks � 10)
Question 3 (a) Tea owns 75% of the ordinary share capital of Cup. Cup supplies goods to Tea at a
profi t margin of 20% on sales. In the year to 31 December 20W9 the total supplies of goods from Cup to Tea were $6 million. At 31 December 20W9 the inventory of Tea included $1,200,000 in respect of goods purchased from Cup.
RequirementExplain what adjustment is required to consolidated revenue in respect of the intra-group sales during 20W9? (3 marks)
(b) The inventory of Tea at 31 December 20W8 included $750,000 in respect of goods purchased from Cup under the same terms as described in (a) above.
RequirementExplain what adjustment is required to the consolidated gross profi t in respect of the intra-group sales for the year ended 31 December 20W9? (3 marks)
(c) At 31 December 20W9 the reserves of Tea and Cup were $6 million and $4 million respectively. Cup is the only subsidiary of Tea and it has been a subsidiary since incorporation.
RequirementCalculate the consolidated reserves of Tea at 31 December 20X9? (4 marks)
(Total marks � 10)
Question 4The following summary statements of fi nancial position relate to Frank, Frank’s subsidiary Dean and Dean’s subsidiary Sammy, at 31 December 20X0:
Frank Dean Sammy$’000 $’000 $’000
Investment in subsidiary 32,000 24,300Other net assets 40,000 30,000 45,000
72,000 54,300 45,000
Ordinary shares of $1 30,000 30,000 20,000Retained earnings 42,000 24,300 25,000
72,000 54,300 45,000
● On 31 December 20W5 Frank purchased 20 million shares in Dean, when the retained earnings of Dean stood at $22 million and the retained earnings of Sammy stood at $12 million.
● On 31 December 20W4 Dean purchased 12 million shares in Sammy, when the retained earnings of Sammy stood at $10.5 million.
● The group’s policy is to value non-controlling interest at the acquisition date at the pro-portionate share of the fair value of the subsidiary’s identifi able net assets.

PREP
ARI
NG
FO
R TH
E EX
AM
INAT
ION
REVISION QUESTIONS F2492
RequirementPrepare the consolidated statement of fi nancial position for the Frank group as at 31 December 20X0. (10 marks)
Question 5 (a) Extracts from the consolidated fi nancial statements of Spender show the following
regarding non-controlling interests:
● Opening non-controlling interests in the statement of fi nancial position were $50 million.
● Closing non-controlling interests in the statement of fi nancial position were $80 million.
● The charge in the consolidated income statement in respect of non-controlling interests was $25 million.
● During the year Spender acquired 80% of the ordinary shares of a new subsidiary, Jacked, that had net assets of $100 million at the date of acquisition.
● There were no unpaid dividends to minority shareholders at the beginning or end of the year.
● The group’s policy is to value non-controlling interest at the acquisition date at the proportionate share of the fair value of the subsidiary’s identifi able net assets.
RequirementCalculate the amount that will be shown in the consolidated cash fl ow statement as pay-ments to the non-controlling interest in the year and explain where this fi gure would be included? (4 marks)
(b) The cost of the acquisition in Jacked, referred to in (a) was $140 million and it was fi nanced as follows:● a cash payment of $20 million;● loan notes of $50 million in Spender issued at par;● 20 million $1 shares in Spender issued when the market value of the shares was
$3.50 per share;● the acquired subsidiary had net bank overdrafts of $10 million at the date of
acquisition.
RequirementCalculate the amount that will be shown as the acquisition cost of Jacked in the consoli-dated cash fl ow statement of Spender and explain where this fi gure would be included?
(3 marks)
(c) The opening balance on non-current assets of Spender totalled $10 million. The closing balance was $14 million. The depreciation charge for the period was $2.6 million and the non-current assets of Jacked at the date of acquisition totalled $3 million. There were no disposals or revaluations in the period.
RequirementCalculate the amount that would be included as purchase of non-current assets in the consolidated cash fl ow statement of Spender and explain where this cash fl ow would be included. (3 marks)
(Total marks � 10)

PREPARIN
G FO
R THE EXA
MIN
ATION
493FINANCIAL MANAGEMENT
Question 6You are the management accountant of XYZ, a company with several subsidiaries.
The fi nancial statements for the year ended 30 June 20X6 are currently being fi nalised and are due to be published and fi led in January 20X7.
Your assistant has a good knowledge of basic accounting techniques but knows little of the provisions of accounting standards. Accordingly, it is the practice within your organisation for your assistant to prepare a fi rst draft of the basic fi nancial statements and a summary of transactions which require your attention, highlighting a recommendation of the appropriate accounting treatment for each transaction.
RequirementsDraft a reply to your assistant which evaluates the correctness, or otherwise, of the pro-posed treatment for each transaction and suggests any changes you consider appropriate.
If you consider the recommended treatment to be incorrect, your advice should include a statement of, and reasoning for, what you consider to be the correct treatment.
In each case, your answer should refer to relevant provisions of IFRS.The transactions highlighted by your assistant are as follows:
(a) XYZ has a subsidiary, GHI, in which it owns 80% of the issued ordinary share capi-tal. On 1 June 20X6, GHI sold goods to XYZ having an invoiced price of $50 mil-lion. These goods (which cost GHI $40 million to manufacture) were included in the inventory of XYZ at 30 June 20X6. Your assistant proposes to eliminate unrealised profi t of $8 million from inventory and consolidated reserves, on the basis that the total unrealised profi t of $10 million was made by a subsidiary in which XYZ has an 80% interest. (5 marks)
(b) For a number of years XYZ has been selling a product called ‘Timid’ which is a supe-rior brand of washing powder. This product was developed by the company and has now become a household name and has captured a substantial share of the market. Your assistant has heard members of the board express the view that the value of the Timid brand name ‘must be worth at least $40 million’ and proposes to bring an intangible asset of $40 million into the fi nancial statements by debiting intangible non-current assets and crediting reserves. (5 marks)
(Total marks � 10)
Question 7Textures manufactures artifi cial limbs. Its fi nancial year end is 30 November 20X6. It man-ufactures in the United Kingdom and exports more than 60% of its output. It has several foreign subsidiary companies.
It has developed a number of arrangements to support its export sales. These include agreements with Pills, Eduaid, Bracos and Computer Control. Information on the agree-ments is as follows.
1. Agreement with Pills. An agreement was made in 20X2 with Pills, a pharmaceutical company, to jointly establish on a 50:50 basis Textures & Pills Joint Venture. Both Textures and Pills guarantee to meet liabilities if the other party fails to meet its share of the costs and risks.

PREP
ARI
NG
FO
R TH
E EX
AM
INAT
ION
REVISION QUESTIONS F2494
Accounts prepared for Texture & Pills Joint Venture for the year ended 30 November 20X6 showed the following:
$’000Non-current assets Premises 300Current assets Bank and cash 30
330CapitalAs at 1 December 20X5 Textures 211 Pills 211
422Less expenses 92As at 30 November 20X6 330
2. Agreement with Eduaid and Bracos. Textures entered into an agreement on 1 December 20X1 with Eduaid, a company that manufactured educational equipment, and Bracos, a South American lawyer, to set up under their joint control an unincorporated under-taking in South America to trade as Eurohelp.
Textures had an effective 30% interest in Eurohelp. The statement of fi nancial posi-tion of Textures as at 30 November 20X6 showed an investment at cost in Eurohelp of $750,000.
The statement of fi nancial position of Eurohelp for the year ended 30 November 20X6 showed:
$’000Non-current assets 7,500Net current assets 1,100
8,600Capital accountAs at 30 November 20X5 6,750Retained profi t for the year 1,850As at 30 November 20X6 8,600
3. Agreement with Computer Control. Textures entered into an agreement on 1 December 20X3 with Computer Control to jointly control Afrohelp, a company in which each company held a 50% interest. Afrohelp assembled mechanical products from Textures and automated them with control equipment from Computer Control.
The joint venture has been equity accounted by each investor company. One of the newly appointed non-executive directors has questioned whether the investment in Afrohelp should be treated as a subsidiary.
On 1 November 20X6 Textures sold inventory costing $110,000 to Afrohelp for $162,000. This inventory was unsold at 30 November 20X6.
Textures adopts proportionate consolidation wherever permitted by IFRS.
RequirementsExplain how the investments in Textures & Pills Joint Venture and Eurohelp would be included in the consolidated fi nancial statements of Textures and prepare appropriate

PREPARIN
G FO
R THE EXA
MIN
ATION
495FINANCIAL MANAGEMENT
extracts from the consolidated statement of fi nancial position of the company as at 30 November 20X6. (10 marks)Note: You should refer to the provisions of international accounting standards where relevant.
Question 8Fair values in acquisition accounting is dealt with in IFRS 3 Business Combinations.
Requirements (a) Explain why such an accounting standard was needed for fair values. (4 marks) (b) Describe the main provisions of IFRS 3 as they relate to fair value. (6 marks)
(Total marks � 10)
Question 9 (a) On 1 January 20X1 J issues a zero-coupon bond for $10,000,000. The bond is
repayable on 31 December 20X5 at a sum of $14,025,245. The bondholders receive no interest over the 5-year life of the bond.
RequirementExplain, with reference to the appropriate international accounting guidance, how this
fi nancial instrument should be accounted for in the fi nancial statements of J and calculate the amount of the fi nance charge that should be recognised by J in its fi nancial statements for the year ending 31 December 20X2? (5 marks)
(b) J also issues 3,000 convertible bonds on 1 January 20X1 at par value of $2,000 per bond. The bonds are redeemable on 31 December 20X3 at par. The bonds pay interest annually in arrears at 4%. Under the terms of the bonds, each can be converted on maturity to 105 $1 shares.
The market rate of interest for a similar instrument with no conversion rights is 6%.
RequirementExplain, with reference to the appropriate international accounting guidance, how this fi nancial instrument should be accounted for in the fi nancial statements of J and show prepare the accounting entry that would record this issue. (5 marks)
(Total marks � 10)
Question 10 (a) At 1 February 20X4, the beginning of its fi nancial year, O has in issue 5,700,000 ordi-
nary shares of $1 each. On 30 September 20X4, the entity raises a further $1,200,000 in capital by the issue of further ordinary shares at par.
Extract from O’s consolidated income statement and statement of changes in equity at 31 January 20X5 shows the following:
$Consolidated profi t before taxation 2,500,000Tax (750,000)
1,750,000Preference dividend (200,000)Ordinary dividend (690,000)
PREP
ARI
NG
FO
R TH
E EX
AM
INAT
ION
REVISION QUESTIONS F2496
RequirementCalculate O’s EPS for the year ending 31 January 20X5. (3 marks)
(b) Z has 3,000,000 shares in issue at 1 April 20X2. On 1 October 20X2 the entity makes a bonus issue of one share for every four held. On 1 October 20X3 Z makes a further bonus issue of one share for every three held.
Earnings attributable to ordinary shareholders for the year ending 31 March 20X3 were $810,000, and for the year ending 31 March 20X4 were $903,000.
RequirementIn the entity’s fi nancial statements for the year ending 31 March 20X4, what is the restated EPS comparative fi gure for 20X3. (3 marks)
(c) H has 3,000,000 shares in issue at 1 October 20X3. On 1 February 20X4 a rights issue of 1 for 6 is made at $1.62 per share. The market price of one share immediately prior to the rights issue was $1.90.
Earnings attributable to ordinary shareholders for the year ending 30 September 20X4 were $1,585,000.
RequirementCalculate the EPS to be reported in the fi nancial statements for the year ending 30 September 20X4. (4 marks)
(Total marks � 10)
Question 11On 1 February 20X7 Jake sold a freehold interest in land to a fi nancing institution for $5 million. The contractual terms require that Jake will repurchase the freehold in 3 years time for $8.82 million. Jake has the option to repurchase on 31 January 20X5 for $6 million or on 31 January 20X6 for $7.1 million. Prior to the disposal the land was recorded at its carrying value of $4 million in Jake’s accounting records. The receipt of $5 million has been recorded with a credit to suspense account. No other accounting entries have been made in respect of this transaction.
At 31 January 20X5, Jake’s directors decide not to take up the option to repurchase.On 1 March 20X8 Jake issued 10 million $1 non-redeemable preference shares with a
dividend rate of 5% which is accumulated if unpaid in any accounting period. The related transaction costs of $50,000 have been debited to share premium account. The proceeds of the issue have been credited to suspense as the accountant is unsure how to record the issue.
RequirementBriefl y explain the substance of both transactions, and prepare journal entries to record them correctly in the accounting records of Jake for the year ended 31 January 20X5.
(10 marks)
Question 12Black has an available for sale investment with a carrying value of $1,130,000 as at the year end date, 31 December 20X6. The value of the investment at 31 December 20X7 is $1,150,000.

PREPARIN
G FO
R THE EXA
MIN
ATION
497FINANCIAL MANAGEMENT
Black was concerned about the value of the shares falling and in order to mitigate this risk it entered into a derivative contract during 20X8 to hedge against the potential effect on the value of the shares of a general downturn in the market. The hedge is 100% effective and the contract has a positive value of $250,000 as at 31 December 20X8. The fall in the value of the available for sale investment was $270,000 as at 31 December 20X8, however $20,000 of that related to a change in the credit rating of the entity invested in.
RequirementBriefl y describe the treatment of the investments noted above and prepare the required journal entries for the years ended 31 December 20X7 and 20X8. (10 marks)
Question 13You are the management accountant of Small. On 1 October 20X3 Small issued 10 million $1 preference shares at par, incurring issue costs of $100,000. The dividend paya-ble on the preference shares was a fi xed 4% per annum, payable on 30 September each year in arrears. The preference shares were redeemed on 1 October 20X8 at a price of $1.35 per share. The effective fi nance cost of the preference shares was 10%. The statement of fi nancial position of the entity as at 30 September 20X8, the day before the redemption of the preference shares, was as follows:
Ordinary share capital (non-redeemable) 100.0Redeemable preference shares 13.5Share premium account 25.8Retained earnings 59.7
199.0Net assets 199.0
Requirements (a) Write a memorandum to your assistant which explains:
● how the total fi nance cost of the preference shares should be allocated to the income statement over their period of issue;
Your memorandum should refer to the provisions of relevant accounting standards.(5 marks)
(b) Calculate the fi nance cost in respect of the preference shares for each of the 5 years ended 30 September 20X8. (5 marks)
(Total marks � 10)
Question 14CBA is a listed entity that runs a defi ned benefi t pension scheme on behalf of its employ-ees. In the fi nancial year ended 30 September 20X6 the scheme suffered an actuarial loss of $7.2 million. The entity’s directors are aware that the relevant accounting standard, IAS 19 Employee benefi ts, was amended recently. They have asked you, the fi nancial controller, to write a short briefi ng paper, setting out an outline of the options for accounting for the actuarial loss in accordance with the amended version of the standard.
RequirementPrepare the briefi ng paper explaining the options and identifying, as far as possible from the information given, the potential impact on the fi nancial statements of CBA of the two alternative accounting treatments. (10 marks)

PREP
ARI
NG
FO
R TH
E EX
AM
INAT
ION
REVISION QUESTIONS F2498
Question 15The IASB requires that a reporting entity’s fi nancial statements should report the substance of the transactions into which it has entered.
You are the management accountant of S. During the most recent fi nancial year (ended 31 August 20X8), the company has entered into a factoring arrangement with F. The main terms of the agreement are as follows:
1. On the fi rst day of every month S transfers (by assignment) all its trade receivables to F, subject to credit approval by F for each receivable transferred by S.
2. At the time of transfer of the receivables to F, S receives a payment from F of 70% of the gross amount of the transferred receivables. The payment is debited by F to a fac-toring account which is maintained in the books of F.
3. Following transfer of the receivables, F collects payments and performs any necessary follow-up work.
4. After collection by F, the cash received is credited to the factoring account in the books of F.
5. F handles all aspects of the collection of the receivables of S in return for a monthly charge of 1 % of the total value of the receivables transferred at the beginning of that month. The amount is debited to the factoring account in the books of F.
6. Any receivables not collected by F within 90 days of transfer are regarded as bad by F and are reassigned to S. The cash previously advanced by F in respect of bad receivables is recovered from S. The recovery is only possible out of the proceeds of other receivables which have been assigned to S. For example, if, in a particular month, S assigned trade receivables having a value of $10,000 and a debt of $500 was identifi ed as bad, then the amounts advanced by F to S would be $6,650 (i.e., 70% � $10,000 � 70% � $500).
7. On a monthly basis, F debits the factoring account with an interest charge which is cal-culated on a daily basis on the balance on the factoring account.
8. At the end of every quarter, F pays over to S a sum representing any credit balance on its factoring account with S at that time.
RequirementsDraft guidance to the board of directors of S, explaining how the factoring arrangement will be reported in the fi nancial statements of S. (10 marks)
Question 16You are the chief accountant of Ant, an entity that prepares fi nancial statements in accord-ance with International Accounting Standards. Your assistant has prepared the fi rst draft of the consolidated fi nancial statements for the year ended 31 October 20X3 and these show a profi t after tax of $66 million, while the statement of fi nancial position shows ownership interests (total assets less total liabilities, including non-controlling interests) of $450 million.
Your assistant has identifi ed the following issues that require your review:
Issue (a)On 1 November 20X2, Ant established a new subsidiary located in a jurisdiction where the unit of currency is the Franco. The initial investment was 40 million Francos (the initial net assets of the subsidiary). The investment was fi nanced by a loan of 40 million Francos from a German bank. No capital repayments of the loan are due until 31 October 20Z2.
The exchange rate at 1 November 20X2 was 1.6 Francos to $1. On 31 October 20X3, the exchange rate was 1.5 Francos to $1. Due to large start-up costs, the subsidiary did

PREPARIN
G FO
R THE EXA
MIN
ATION
499FINANCIAL MANAGEMENT
not make a profi t in the early months of trading and the net assets of the subsidiary at 31 October 20X3 remained at 40 million Francos.
In preparing the draft consolidated fi nancial statements, your assistant has translated both the loan and the fi nancial statements of the subsidiary at 1.6 Francos to $1 on the basis that the fi nancing of the subsidiary was obtained when the exchange rate was 1.6 Francos to $1.
Issue (b)On 1 November 20X2, Ant issued two million $100 loan notes at $90 per note. A mer-chant bank received $4 million to underwrite the issue and Ant incurred other costs of $500,000 relating to the issue of the notes. The notes pay no interest and are redeemable at $135 per note on 31 October 20X7. As an alternative to redemption, the notes can be converted into 50 Equity shares per $100 note on 31 October 20X7.
Your assistant has written off the issue costs of $4.5 million to the income statement for the year ended 31 October 20X3 as an administrative expense and credited the proceeds of issue ($180 million) to a convertible loan notes account. He proposes to show this in the capital and reserves section of the statement of fi nancial position on the basis that the share price on 31 October 20X7 is likely to be at least $4, so conversion, rather than repayment, is likely to be a near certainty.
Your assistant has been informed that, at 1 November 20X2, the fair value of the options to convert the loan notes into shares on 31 October 20X7 was $22.5 million. However, he does not consider this information to be relevant and so has ignored it.
RequirementFor each of the issues, evaluate the treatment adopted by your assistant with reference to currently published Accounting Standards. Where you consider the treatment adopted to be incorrect, you should state the journal adjustment required to correct the error.
In all cases, you should give any supporting explanations you consider appropriate to justify your conclusions.
The allocation of marks to the issues is as follows:
Issue (a) (5 marks)Issue (b) (5 marks)
(Total marks � 10)
Question 17You are the fi nancial controller of Jade, a entity which has recently established a pension scheme for its employees. It chose a defi ned benefi t scheme rather than a defi ned contribu-tion scheme.
Jade makes payments into the pension scheme on a monthly basis.Jade prepares its fi nancial statements to 31 December each year.On 31 December 20X7 the market value of the scheme’s assets was $40 million and the
present value of the scheme’s liability $44 million. Actuarial losses not yet recognised in the income statement amounted to $3 million. In 20X8 the following data is relevant:
● current service cost: $4 million,● unwinding of discount: $3.6 million,● expected return on pension plan assets: $4.8 million,● contributions for the year: $3.4 million.

PREP
ARI
NG
FO
R TH
E EX
AM
INAT
ION
REVISION QUESTIONS F2500
On 31 December 20X8 the market value of the scheme’s assets was $42 million and the present value of the scheme’s liability $25 million.
Jade’s accounting policy is to defer actuarial gains and losses to future periods so far as is permissible under the requirements of IAS 19.
RequirementDetermine the total charge in the income statement for pensions (excluding amounts deducted from employees’ gross salaries) and the amounts shown in the statement of fi nancial position in respect of pensions.
Ignore deferred taxation. (10 marks)
Question 18Make-it is a manufacturing entity. One of its subsidiaries, Do-it, operates in a country which experiences relatively high rates of infl ation in its currency, the Do. Most entities operating in that country voluntarily present two versions of their fi nancial statements: one at historical cost, and the other incorporating current cost adjustments. GFE complies with this accepted practice. Extracts from the income cp statement adjusted for current costs for the year ended 30 September 20X5 are as follows:
Do Do000 000
Historical cost operating profi t 1,500Current cost adjustments: Cost of sales adjustment 130 Depreciation adjustment 86Loss on net monetary position 32
248Current cost operating profi t 1,252
Requirements (a) Explain the defects of historical cost accounting in times of increasing prices.
(4 marks) (b) Explain how each of the three current cost adjustments in GFE’s fi nancial statements
contributes to the maintenance of capital. (6 marks)
Question 19You have been asked by a colleague to present a brief paper to accounting students at the local university about recent attempts at convergence between International Financial Reporting Standards (IFRS) and US Generally Accepted Accounting Practice (GAAP). The students are knowledgeable about IFRS but have not studied US GAAP in any detail.
RequirementPrepare the paper, describing the progress to date of the convergence project, including some examples of areas where convergence has taken place. (10 marks)
Question 20It is becoming increasingly common for listed entities to provide non-fi nancial disclosures intended to inform stakeholders about the business’s environmental policies, impacts and

PREPARIN
G FO
R THE EXA
MIN
ATION
501FINANCIAL MANAGEMENT
practices. Supporters of such voluntary disclosures argue that stakeholders have a right to be informed about environmental issues in this way. However, there are also arguments against this type of disclosure.
RequirementIdentify and explain the principal arguments against voluntary disclosures by businesses of their environmental policies, impacts and practices.
Section BThe following questions are those that refl ect exam standard questions worth 25 marks. These typically cover the syllabus areas of Sections A and C. There may also be areas of Sections B and D covered but they will not account for the majority of the marks.
Question 21The statements of fi nancial position of three entities, AD, BE and CF at 30 June 20X6, the year end of all three entities, are shown below:
AD BE CF$’000 $’000 $’000 $’000 $’000 $’000
ASSETSNon-current assets:Property, plant and equipment 1,900 680 174Financial asset: investments in shares 880 104 –Other fi nancial asset 980 – –
3,760 784 174Current assets:Inventories 223 127 60Trade receivables 204 93 72Other current assets 25 – –Cash 72 28 12
524 248 1444,284 1,032 318
EQUITY AND LIABILITIESEquity:Share capital ($1 shares) 1,000 300 100Retained earnings 2,300 557 122
3,300 857 222Non-current liabilities 600 – –Current liabilities:Trade payables 247 113 84Income tax 137 62 12
384 175 964,284 1,032 318
Notes
1. Investment by AD in BEAD acquired 80% of the ordinary shares of BE on 1 July 20X3 for $880,000 when BE’s retained earnings were $350,000. Goodwill on acquisition continues to be unimpaired.

PREP
ARI
NG
FO
R TH
E EX
AM
INAT
ION
REVISION QUESTIONS F2502
2. Investment by BE in CFBE acquired 40% of the ordinary shares of CF on 1 January 20X6 for $104,000. BE appoints one of CF’s directors and since the acquisition has been able to exert signifi -cant infl uence over CF’s activities. CF’s retained earnings at the date of acquisition were $102,000.
BE and CF are unquoted entities and their fair value cannot be reliably measured, as a result the investments held in the individual accounts of both AD and BE are classi-fi ed as available for sale and are held at cost.
The group’s policy is to value non-controlling interest at the acquisition date at the proportionate share of the fair value of the subsidiary’s identifi able net assets.
3. Other fi nancial assetAD’s other fi nancial asset is a debt instrument with a fi xed interest rate of 5%. The instrument was issued on 1 July 20X4 for proceeds of $1,000,000. The instrument is redeemable at a premium on 30 June 20X8; the applicable effective interest rate over the life of the instrument is 8%. The full annual interest amount was received and recorded by AD in June 20X5 and June 20X6, and the appropriate fi nance charge was recognised in the fi nancial year ended 30 June 20X5. However, no fi nance charge has yet been calculated or recognised in respect of the fi nancial year ended 30 June 20X6.
4. Other current assetsOther current assets of $25,000 in AD represent a holding of shares in a major listed company. AD maintains a portfolio of shares held for trading. At 30 June 20X6 the only holding in the portfolio was 4,000 shares in DG, a major listed company with 2.4 million ordinary shares in issue. The investment was recognised on its date of purchase, 13 May 20X6, at a cost of 625 cents per share. At 30 June 20X6, the fair value of the shares had risen to 670 cents per share.
5. Intra-group tradingBE supplies goods to CF. On 30 June 20X6 CF held inventories at cost of $10,000 that had been supplied to it by BE. BE’s profi t margin on the selling price of these goods is 30%. On 27 June 20X6 AD made a payment of $5,000 to BE, which was not received and recorded by BE until after the year end. The receivables of BE at the year end include $5,000 in respect of this intra-group balance.
Requirements (a) Explain the accounting treatment in the statement of fi nancial position and income
statement for the fi nancial asset and other current asset required by IAS 39 Financial Instruments: Recognition and Measurement. (5 marks)
(b) Prepare the consolidated statement of fi nancial position for the AD Group at 30 June 20X6. (20 marks)
(Total marks � 25)
Question 22You are the accountant responsible for the Rag group consolidation. The income statements of Rag, Tag and Bobtail for the year ended 31 March 20X9 are given below.

PREPARIN
G FO
R THE EXA
MIN
ATION
503FINANCIAL MANAGEMENT
Rag Tag Bobtail$’000 $’000 $’000
Revenue (note 1) 65,000 50,000 100,000Cost of sales (35,000) (28,000) (82,000)Gross profi t 30,000 22,000 18,000Other operating expenses (15,000) (11,000) (9,000)Operating profi t 15,000 11,000 9,000Investment income (note 2) 3,000 1,200 –Interest payable (3,200) (1,800) (1,200)Profi t before taxation 14,800 10,400 7,800Taxation (3,600) (2,800) 2,400)Profi t for the period 11,200 7,600 5,400
Notes to the income statements1. Rag supplies a component which is used by both Tag and Bobtail. Because of the close
relationships between the three entities, the component is supplied at a mark-up of only 10% on cost. Details of inter-entity sales of the product for the year to 31 March 20X9 were as follows:● Rag to Tag $8 million● Rag to Bobtail $4 million
Details of the inventory of the component supplied by Rag which were included in the books of Tag and Bobtail at the beginning and end of the year were:
20X9 20X8$’000 $’000
Tag 2,200 1,980Bobtail 1,100 990
2. Rag holds 75% of the issued share capital of Tag. Tag holds 40% of the issued share capital of Bobtail.
Your assistant is responsible for preparing the draft consolidated fi nancial statements for your review. She is aware that Tag will be dealt with as a 75% subsidiary but is unsure of the way of dealing with Bobtail.
The group’s policy is to value non-controlling interest at the acquisition date at the proportionate share of the fair value of the subsidiary’s identifi able net assets.
Requirements (a) Write a memorandum to your assistant which explains how Bobtail will be incorpo-
rated into the consolidated fi nancial statements of Rag.Your memorandum should refer to relevant accounting standards to support your
explanations. (5 marks) (b) Prepare a working schedule for the consolidated income statement of Rag for the year
ended 31 March 20X9. You should start with the revenue and end with profi t for the period. Do not prepare notes to the consolidated income statement.
(20 marks)(Total marks � 25)

PREP
ARI
NG
FO
R TH
E EX
AM
INAT
ION
REVISION QUESTIONS F2504
Question 23AX, a listed entity, is planning to acquire several smaller entities. In order to raise the cash for its programme of acquisitions, it has recently sold part of its stake in a subsidiary, CY, and has raised $10 million in a bond issue.
Summarised statements of fi nancial position for AX, CY and the other member of the group, EZ, at 31 October 20X7 are given below:
AX CY EZ$’000 $’000 $’000
ASSETSNon-current assets:Property, plant and equipment 20,000 8,900 5,000Investment in subsidiaries (notes 1 & 2) 15,500 – –
35,500 8,900 5,000Current assets 34,500 9,500 4,700
70,000 18,400 9,700EQUITY AND LIABILITIESEquity:Called up share capital ($1 shares) 20,000 4,000 3,000Retained earnings 18,000 7,000 3,000
38,000 11,000 6,000Non-current liabilities – 2,400 1,000Current liabilities 18,000 5,000 2,700Suspense account (notes 1 & 3) 14,000 – –
70,000 18,400 9,700
Notes:
1. The investment in 80% of CY’s ordinary share capital was purchased several years ago for $8 million when CY’s retained earnings were $3.5 million. There has been no change since then in the amount of CY’s share capital, and goodwill has remained unimpaired. No adjustments to fair value of CY’s net assets were made either at acquisi-tion or subsequently.
On 31 October 20X7 AX sold one quarter of its shareholding in CY to an uncon-nected party for $4 million. The retained earnings of CY totalled $6.5 million at the date of disposal. This amount has been debited to cash and credited to the suspense account. Ignore income tax implications.
2. The investment in 100% of EZ’s ordinary share capital was purchased on 30 April 20X5 for $7.5 million when EZ’s retained earnings were $1.5 million. Goodwill has remained unimpaired since the date of acquisition.
Upon acquisition a revaluation exercise was carried out. Plant and equipment in EZ with a book value of $1 million was revalued to $1.5 million. There were no other adjustments in respect of fair value. The revaluation is treated as a consolidation adjust-ment only: EZ continues to recognise non-current assets at depreciated historic cost. The remaining useful life of the plant and equipment at 30 April 20X5 was estimated to be fi ve years, of which thirty months had elapsed by 31 October 20X7.
3. AX issued $10 million of 5% convertible bonds on 31 October 20X7. The bonds were issued in units of $1,000 and are repayable on 31 October 20Y0 However, each bond is convertible into 250 ordinary shares at any time until maturity at the option of the bondholder. The market rate for similar, non-convertible, bonds is 7%. It can be

PREPARIN
G FO
R THE EXA
MIN
ATION
505FINANCIAL MANAGEMENT
assumed that there were no issue costs. The $10 million raised by the issue was debited to cash and credited to the suspense account.
Requirements (a) Explain the appropriate accounting treatment to record the issue of convertible bonds,
discussing the reasons for the approach that is adopted by International Financial Reporting Standards for this type of fi nancial instrument.
(b) Prepare the consolidated statement of fi nancial position for the AX group at 31 October 20X7.
Question 24Extracts from the consolidated fi nancial statements of Holmes for the year ended 30 September 20X9 are given below.
1. Consolidated income statement for the year ended 30 September 20X9
20X9 20X8$’m $’m
Revenue 600 500Cost of sales (300) (240)Gross profi t 300 260Other operating expenses (N1) (150) (130)Other income (N2) 10 –Finance cost (50) (45)Share of profi t of associates 17 17Profi t before tax 127 102Income tax expense (35) (25)Profi t for the period 92 77Attributable to: Equity holders of parent 82 71 Non-controlling interest 10 6
92 77
2. Summarised consolidated statement of changes in equity – year ended 30 September (amounts attributable to equity holders of parent)
20X9 20X8$’000 $’000
Balance at the start of the year 242 196Profi t for the year 82 71Dividends (25) (25)
299 242

PREP
ARI
NG
FO
R TH
E EX
AM
INAT
ION
REVISION QUESTIONS F2506
3. Consolidated statement of fi nancial position as at 30 September
20X9 20X8$’m $’m $’m $’m
Non-current assets Intangible assets (N3) 35 19 Property, plant and equipment (N4) 240 280 Investments in associates 80 70
355 369Current assets Inventories 105 90 Receivables 120 100 Investments 20 70 Cash in hand 10 5
255 265610 634
Share capital 100 100Revaluation reserve – 20Retained earnings 199 122
299 242 Non-controlling interests 65 40Non-current liabilities Obligations under fi nance leases 80 70 Loans – 90 Deferred tax 30 24
110 184Current liabilities Trade payables (N5) 71 60Tax 10 8Obligations under fi nance leases 25 20Bank overdraft 30 80
136 168610 634
Notes
1. Other operating expenses
20X9 20X8$’m $’m
Distribution costs 81 75Administrative expenses 75 70Investment income (6) (15)
150 130
From time to time the group invests cash surpluses in highly liquid investments that are shown as current assets in the consolidated statement of fi nancial position.
2. Other income This represents the gain on sale of a large freehold property that was sold by Holmes
during the year on 1 October 20X8 and leased back on an operating lease in line with the practice adopted by the rest of the group. The property was not depreciated in the current year. The property had been revalued in 20X0 and the revaluation surplus cred-ited to a revaluation reserve. No other entries had been made in the revaluation reserve prior to the sale of the property.
3. Intangible non-current assets This comprises the unimpaired balance of goodwill on consolidation. During the year
ended 30 September 20X9 Holmes purchased 80% of the issued equity share capital of

PREPARIN
G FO
R THE EXA
MIN
ATION
507FINANCIAL MANAGEMENT
Watson plc for $100 million payable in cash. The net assets of Watson plc at the date of acquisition were assessed as having fair values as follows:
$’mPlant and machinery – owned 50Fixtures and fi ttings – owned 10Inventories 30Receivables 25Cash at bank and in hand 10Trade payables (15)Tax (5)
105
4. Property, plant and equipment
30.9.X9 30.9.X8$’m $’m
Freehold land and buildings – 90Plant and machinery – owned 130 100Plant and machinery – leased 90 70Fixtures and fi ttings – owned 20 20
240 280
During the year the group entered into new fi nance lease agreements in respect of certain items of plant and machinery. The amounts debited to property, plant and equipment in respect of such agreements during the year totalled $40 million. No dis-posals of property, plant and equipment (owned or leased) took place during the year. Depreciation of property, plant and equipment for the year totalled $58 million.
5. Trade payables Trade payables at 30.9.X9 and 30.9.X8 do not include any accrued interest.
RequirementsYou are the management accountant of Holmes and you are in the process of preparing the consolidated cash fl ow statement. Your managing director is aware that the statement is required by IAS 7 Cash Flow Statements. She has a reasonable understanding of the rationale behind the cash fl ow statement but is not clear why it adds to the usefulness of fi nancial statements since it is prepared from the income statement and the statement of fi nancial position.
(a) Prepare the statement of cash fl ows for the Holmes group for the year ended 30 September 20X9 in the form required by IAS 7 Cash Flow Statements. Notes to the cash fl ow statement are not required but your workings must be clearly shown.
(20 marks) (b) Write a brief memorandum to your managing director which explains the value
that the cash fl ow statement adds to fi nancial reports. (5 marks)(Total marks � 25)

PREP
ARI
NG
FO
R TH
E EX
AM
INAT
ION
REVISION QUESTIONS F2508
Question 25AT holds investments in three other entities. The draft income statements for the four entities for the year ended 31 March 20X7 are as follows:
AT BU CV DW$’000 $’000 $’000 $’000
Revenue 2,450 1,200 675 840Cost of sales (1,862) (870) (432) (580)Gross profi t 588 330 243 260Distribution costs (94) (22) (77) (18)Administrative expenses (280) (165) (120) (126)Interest received – 2 – –Finance costs (26) – – –Profi t before tax 188 145 46 116Income tax (40) (50) (12) (37) Profi t for the period 148 95 34 79
Notes
1. Investments in BU, CV and DW Several years ago AT purchased 75% of the ordinary shares of BU. On 30 September
20X6 it purchased a further 5% of BU’s ordinary shares. In 20X3 AT, together with two other investor entities, set up CV. Each of the three investors owns one-third of the ordinary shares in CV. All managerial decisions relating to CV are made jointly by the three investor entities. On 1 January 20X7, AT purchased 35% of the ordinary shares in DW. AT exerts signifi cant infl uence over the management of DW, but does not con-trol the entity.
The group’s policy is to value non-controlling interest at the acquisition date at the proportionate share of the fair value of the subsidiary’s identifi able net assets.
2. Intra-group trading BU supplies inventories to AT, earning a gross profi t margin of 20% on such sales.
During the fi nancial year ended 31 March 20X7, BU supplied a total of $80,000 at selling price to AT. Of these items, 25% remained in AT’s inventories at the year end. AT supplies a range of administrative services to BU, at cost. $12,000 is included in BU’s administrative expenses, and in AT’s revenue, in respect of such services supplied during the year ended 31 March 20X7.
3. The group has a policy of adopting proportional consolidation wherever permitted by International Financial Reporting Standards.
4. Revenue and profi ts accrue evenly throughout the year, unless otherwise stated.5. Finance costs The fi nance costs in AT’s income statement are in respect of short-term bank
borrowings only. Finance costs in respect of its long-term borrowings have not yet been included, and an appropriate adjustment must be made. On 1 April 20X4, AT issued bonds at par in the amount of $1,000,000. Issue costs were $50,000. The bonds carry a coupon rate of interest of 5% each year, payable on the last day of the fi nancial year. The interest actually paid on 31 March 20X7 has been debited to a suspense account, which is included under current assets in AT’s draft statement of fi nancial position.
PREPARIN
G FO
R THE EXA
MIN
ATION
509FINANCIAL MANAGEMENT
The bonds will be repaid on 31 March 20X9 at a premium of $162,000. The effective interest rate associated with the bonds is 9%, and the liability is measured, in accord-ance with IAS 39 Financial Instruments: Recognition and Measurement, at amortised cost.
6. Financial asset From time to time BU uses available cash surpluses to make short term investments in
fi nancial assets. Such assets are ‘held-for-trading’ and are invariably sold within a few months. At 31 March 20X7, BU held 4,000 shares in a listed entity, EX. The shares had been purchased on 20 January 20X7 at a price of 1332¢ per share. At 31 March 20X7, the market price per share was 1227¢. No adjustment has been made to the draft income statement above in respect of this fi nancial asset.
RequirementsPrepare the consolidated income statement for the AT group for the fi nancial year ended 31 March 20X7. Show full workings. (25 marks)Note: 8 marks are available for the adjustments in respect of notes 5 and 6.
Work to nearest $100. For the purposes of this question it is not necessary to make any adjustments to income tax.
Question 26You advise a private investor who holds a portfolio of investments in smaller listed compa-nies. Recently, she has received the annual report of the BZJ Group for the fi nancial year ended 31 December 20X5. In accordance with her usual practice the investor has read the chairman’s statement, but has not looked in detail at the fi gures. Relevant extracts from the chairman’s statement are as follows:
‘Following the replacement of many of the directors, which took place in early March 20X5, your new board has worked to expand the group’s manufacturing facilities and to replace non-current assets that have reached the end of their useful lives. A new line of stor-age solutions was designed during the second quarter and was put into production at the beginning of September. Sales efforts have been concentrated on increasing our market share in respect of storage products, and in leading the expansion into Middle Eastern markets.
The growth in the business has been fi nanced by a combination of loan capital and the issue of additional shares. The issue of 300,000 new $1 shares was fully taken up on 1 November 20X5, refl ecting, we believe, market confi dence in the group’s new management. Dividends have been reduced in 20X5 in order to increase profi t retention to fund the further growth planned for 20X6. The directors believe that the implementation of their medium- to long-term strategies will result in increased returns to investors within the next 2 to 3 years.’
The group’s principal activity is the manufacture and sale of domestic and offi ce furniture. Approximately 40% of the product range is bought in from manufacturers in other countries.

PREP
ARI
NG
FO
R TH
E EX
AM
INAT
ION
REVISION QUESTIONS F2510
Extracts from the annual report of the BZJ Group are as follows:
BZJ Group: Income statement for the year ended 31 December 20X5
20X5 20X4$’000 $’000
Revenue 120,366 121,351Cost of sales (103,024) (102,286)Gross profi t 17,342 19,065Operating expenses (11,965) (12,448)Profi t from operations 5,377 6,617Interest payable (1,469) (906)Profi t before tax 3,908 5,711Income tax expense (1,125) (1,594)Profi t for the period 2,783 4,117
Attributable to:Equity holders of the parent 2,460 3,676Non-controlling interest 323 441
2,783 4,117
BZJ Group: Summarised statement of changes in equity for the year ended 31 December 20X5
Retained Share Share Revaluation Total Totalearnings capital premium reserve 20X5 20X4$’000 $’000 $’000 $’000 $’000 $’000
Opening balance 18,823 2,800 3,000 24,623 21,311Surplus on revaluation of properties
2,000 2,000
Profi t for the period 2,460 2,460 3,676Issue of share capital 300 1,200 1,500 –Dividends paid 31 December (155) (155) (364)Closing balance 21,128 3,100 4,200 2,000 30,428 24,623
BZJ Group: Statement of fi nancial position as at 31 December 20X5
20X5 20X4$’000 $’000 $’000 $’000
Non-current assets:Property, plant and equipment 40,643 21,322Goodwill 1,928 1,928Trademarks and patents 1,004 1,070
43,575 24,320Current assets:Inventories 37,108 27,260Trade receivables 14,922 17,521Cash – 170
52,030 44,95195,605 69,271
Equity:Share capital ($1 shares) 3,100 2,800Share premium 4,200 3,000Revaluation reserve 2,000 –Retained earnings 21,128 18,823
30,428 24,623Non-controlling interest 2,270 1,947

PREPARIN
G FO
R THE EXA
MIN
ATION
511FINANCIAL MANAGEMENT
Non-current liabilities:Interest bearing borrowings 26,700 16,700Current liabilities:Trade and other payables 31,420 24,407Income tax 1,125 1,594Short-term borrowings 3,662 –
36,207 26,00195,605 69,271
Requirements (a) Calculate the earnings per share fi gure for the BZJ Group for the years ended 31
December 20X5 and 20X4, assuming that there was no change in the number of ordi-nary shares in issue during 20X4. (3 marks)
(b) Produce a report for the investor that: (i) analyses a nd interprets the fi nancial statements of the BZJ Group, commenting
upon the group’s performance and position; (17 marks) (ii) discusses the extent to which the chairman’s comments about the potential for
improved future performance are supported by the fi nancial statement informa-tion for the year ended 31 December 20X5. (5 marks)
(Total marks � 25)
Question 27Spreader is a UK parent company with a number of wholly owned subsidiaries in Asia and Europe. Extracts from the consolidated fi nancial statements of the group for the year ended 30 April 20X7 are given below.
Income statement – year ended 30 April
20X7 20X6$’000 $’000
Revenue (note 1) 50,000 48,000Cost of sales (25,000) (22,000)Gross profi t 25,000 26,000Other operating expenditure (15,000) (14,200)Operating profi t 10,000 11,800Interest payable (1,000) (900)Profi t before taxation (note 2) 9,000 10,900Taxation (2,800) (3,600)Profi t for the period 6,200 7,300
Notes1. Analysis of turnover for the year by geographical segment
Spreader Asia Europe Total20X7 20X6 20X7 20X6 20X7 20X6 20X7 20X6$’000 $’000 $’000 $’000 $’000 $’000 $’000 $’000
Total revenue 15,000 20,000 10,000 8,000 30,000 25,000 55,000 53,000Inter-segment revenue (2,000) (2,500) (1,000) (500) (2,000) (2,000) (5,000) (5,000)Revenue from third parties 13,000 17,500 9,000 7,500 28,000 23,000 50,000 48,000

PREP
ARI
NG
FO
R TH
E EX
AM
INAT
ION
REVISION QUESTIONS F2512
2. Analysis of profi t before tax for the year by geographical segments
Spreader Asia Europe Total20X7 20X6 20X7 20X6 20X7 20X6 20X7 20X6$’000 $’000 $’000 $’000 $’000 $’000 $’000 $’000
Segment profi t 3,000 6,000 1,500 1,200 6,000 5,000 10,500 12,200Common costs (500) (400)Operating profi t 10,000 11,800Interest payable (1,000) (900)Profi t before taxation 9,000 10,900
3. Analysis of net assets at end of year by geographical segment
Spreader Asia Europe Total20X7 20X6 20X7 20X6 20X7 20X6 20X7 20X6$’000 $’000 $’000 $’000 $’000 $’000 $’000 $’000
Segment net assets 15,000 13,500 6,000 5,000 20,000 20,000 41,000 38,500Unallocated assets 2,000 1,800Total net assets 43,000 40,300
4. DividendsAmounts paid were: 20X7 $3 million; 20X6 $3.2 million.
RequirementsIn your capacity as chief accountant of Spreader:
(a) prepare a report for the board of directors of the company which analyses the results of the group for the year ended 30 April 20X7; (21 marks)
(b) explain why the segmental data which has been included in the extracts may need to be interpreted with caution. (4 marks)
(Total marks � 25)
Question 28You are the accounting adviser to a committee of bank lending offi cers. Each loan applica-tion is subject to an initial vetting procedure, which involves the examination of the appli-cation, recent fi nancial statements, and a set of key fi nancial ratios.
The key ratios are as follows:
● Gearing (calculated as debt/debt � equity, where debt includes both long- and short-term borrowings);
● Current ratio;● Quick ratio;● Profi t margin (using profi t before tax).
Existing levels of gearing are especially signifi cant to the decision, and the committee usu-ally rejects any application from an entity with gearing of over 45%.
The committee will shortly meet to conduct the initial vetting of a commercial loan application made by TYD, an unlisted entity. As permitted by national accounting law in its country of registration, TYD does not comply in all respects with International Financial Reporting Standards. The committee has asked you to interview TYD’s fi nance director to determine areas of non-compliance. As a result of the interview, you have iden-tifi ed two signifi cant areas for examination in respect of TYD’s fi nancial statements for the year ended 30 September 20X6.

PREPARIN
G FO
R THE EXA
MIN
ATION
513FINANCIAL MANAGEMENT
1. Revenue for the period includes a sale of inventories at cost to HPS, a banking institu-tion, for $85,000, which took place on 30 September 20X6. HPS has an option under the contract of sale to require TYD to repurchase the inventories on 30 September 20X8, for $95,000. TYD has derecognised the inventories at their cost of $85,000, with a charge to cost of sales of this amount. The inventories concerned in this transac-tion, are, however, stored on TYD’s premises, and TYD bears the cost of insuring them.
2. Some categories of TYD’s inventories are sold on a sale or return basis. The entity’s accounting policy in this respect is to recognise the sale at the point of despatch of goods. The standard margin on sales of this type is 20%. During the year ended 30 September 20X6, $100,000 (in sales value) has been despatched in this way. The fi nance director estimates that approximately 60% of this value represents sales that have been accepted by customers; the remainder is potentially subject to return.
The fi nancial statements of TYD for the year ended 30 September 20X6 are as presented below. (Note: at this stage of the analysis only one year’s fi gures are considered).
TYD: Income statement for the year ended 30 September 20X6
$’000Revenue 600Cost of sales 450Gross profi t 150Expenses 63Finance costs 17Profi t before tax 70Income tax expense 25Profi t for the period 45
TYD: Statement of changes in equity for the year ended 30 September 20X6
Share capital Retained earnings Total$’000 $’000 $’000
Balances at 1 October 20X5 100 200 300Profi t for the period 45 45 45Balances at 30 September 20X6 100 245 345
TYD: Statement of fi nancial position at 30 September 20X6
$’000 $’000ASSETSNon-current assets:Property, plant and equipment 527
Current assets:Inventories 95Trade receivables 72Cash 6
173700
EQUITY AND LIABILITIESEquity:Called up share capital 100Retained earnings 245
345

PREP
ARI
NG
FO
R TH
E EX
AM
INAT
ION
REVISION QUESTIONS F2514
Non-current liabilities:Long-term borrowings 180
Current liabilities:Trade and other payables 95Bank overdraft 80
175700
RequirementsPrepare a report to the committee of lending offi cers that
(i) discusses the accounting treatment of the two signifi cant areas identifi ed in the inter-view with the FD, with reference to the requirements of International Financial Reporting Standards (IFRS) and to fundamental accounting principles; (8 marks)
(ii) calculates any adjustments to the fi nancial statements that are required in order to bring them into compliance with IFRS (ignore tax); (5 marks)
(iii) analyses and interprets the fi nancial statements, calculating the key ratios before and after adjustments, and making a recommendation to the lending committee on whether or not to grant TYD’s application for a commercial loan. (12 marks)
(Total marks � 25)
Question 29The directors of DPC, a listed entity, have been approached by three out of the fi ve share-holders of PPS, an unlisted competitor. The PPS shareholders are nearing retirement age, and would like to realise their investment in the business. The two remaining shareholders do not object, but would like to retain between them at least a signifi cant infl uence over the business.
The directors of DPC are currently concerned about the threat of a takeover bid for DPC itself. Although they would like to acquire an interest in PPS as it would help them to increase DPC’s market share, they do not want to take any action that would adversely affect their fi nancial statements and certain key accounting ratios (EPS, gearing [calculated as debt/equity], and non-current asset turnover).
There are two possibilities for consideration:
1. DPC could purchase 40% of the ordinary shares of PPS, giving it signifi cant infl uence, but not control. The cost of this would be $3.5 million, to be settled in cash. DPC would pay $1 million out of its cash resources and would increase its existing long-term borrowings for the balance.
2. DPC could purchase 60% of the ordinary shares of PPS, giving it control. The cost of this would be $6 million, to be settled in cash. DPC would pay $3 million out of its cash resources, and would increase its existing long-term borrowings for the balances.
The purchase would take place on the fi rst day of the new fi nancial year, 1 January 20X8. Projected summary income statements for the 20X8 fi nancial year, and projected summary statement of fi nancial position at 31 December 20X8 are shown below. The DPC fi gures are consolidated to include its existing 100% held subsidiaries (it currently holds no inter-ests in associates). The projected fi nancial statements for PPS are for that entity alone.

PREPARIN
G FO
R THE EXA
MIN
ATION
515FINANCIAL MANAGEMENT
Summary projected income statements for the year ended 31 December 20X8
DPC consolidated Projected: 20X8
PPS entity Projected: 20X8
$’000 $’000Revenue 60,300 10,200All expenses including income tax (55,300) (9,500)Profi t for the period attributable to equity holders 5,000 700
Summary projected statements of fi nancial position at 31 December 20X8
DPC consolidated Projected: 20X8
PPS entity Projected: 20X8
$’000 $’000 NotesNon-current assets 50,400 9,800 2Current assets 82,000 16,000
132,400 25,800
Equity 31,400 4,000 3 & 4Long-term liabilities 10,000 9,300Current liabilities 91,000 12,500
132,400 25,800
Notes:1. DPC’s consolidated projected fi nancial statements at 31 December 20X8 do not take
into account the proposed acquisition of PPS.2. DPC’s non-current asset fi gure includes goodwill on acquisition of various subsidiaries.3. PPS’s equity comprises 100,000 ordinary shares of $1 each, $3,200,000 of retained
earnings brought forward on 1 January 20X8 and $700,000 profi t for the period.4. DPC will have 10 million ordinary shares of $1 each on 1 January 20X8. No issues of
shares will be made during 20X8.
Requirements (a) Prepare draft projected fi nancial statements for the DPC group for the year ending 31
December 20X8 under each of the following assumptions. (i) DPC acquires 40% of the ordinary shares of PPS on 1 January 20X8; (ii) DPC acquires 60% of the ordinary shares of PPS on 1 January 20X8.
It can be assumed that no impairment of either investment would have taken place by 31 December 20X8. (14 marks)
(b) Calculate EPS, gearing and non-current asset turnover ratios based on the draft pro-jected 31 December 20X8 fi nancial statements for:
(i) DPC and its existing subsidiaries; (ii) DPC including the acquisition of an associate interest in PPS; (iii) DPC including the acquisition of a subsidiary interest in PPS. (6 marks) (c) Discuss the differences in the accounting ratios under the different scenarios,
identifying reasons for the most signifi cant differences. (5 marks)(Total marks � 25)

PREP
ARI
NG
FO
R TH
E EX
AM
INAT
ION
REVISION QUESTIONS F2516
Question 30You are the assistant to the Chief Financial Offi cer (CFO) of ABC, a light engineering business based in Bolandia. ABC, a listed entity, has expanded over the last few years with the successful introduction of innovative new products. In order to further expand its product range and to increase market share, it has taken over several small, unlisted, enti-ties within its own country.
ABC’s directors have recently decided to expand their markets by taking over entities based in neighbouring countries. As the fi rst step in the appraisal of available investment opportunities the CFO has asked you to prepare a brief report on the position and per-formance of three possible takeover targets: entity W based in Winlandia, entity Y based in Yolandia and entity Z based in Zeelandia. These three countries share a common cur-rency with Bolandia, and all three target entities identify their principal activity as being the provision of light engineering products and services. The report is to comprise a one page summary of key data and a brief written report providing an initial assessment of the targets. The format of the summary is to be based upon the one generally used by ABC for its fi rst-stage assessment of takeover targets, but with the addition of:
(i) price/earnings ratio information (because all three target entities are listed in their own countries), and
(ii) so me relevant country-specifi c information.
You have produced the one-page summary of key data, given below, together with com-parative information for ABC itself, based on its fi nancial statements for the year ended 31 March 20X6.
ABC W Y ZCountry of operation Bolandia Winlandia Yolandia ZeelandiaDate of most recent annual report 31 March
20X631 January 20X6
30 June 20X5
30 June 20X5
Financial statements Yolandian prepared in compliance with: IFRS IFRS GAAP IFRSRevenue $263.4m $28.2m $24.7m $26.3mGross profi t margin 19.7% 16.8% 17.3% 21.4%Operating profi t margin 9.2% 6.3% 4.7% 8.3%Return on total capital employed 11.3% 7.1% 6.6% 12.3%Equity $197.8m $13.6m $14.7m $16.7mLong-term borrowings $10.4m $6.2m $1.3m $0.6mAverage interest rate applicable to long-term borrowings by listed entities 7.5% 6% 8% 10%Income tax rate 30% 28% 31% 38%Inventories turnover 47 days 68 days 52 days 60 daysReceivables turnover 44 days 42 days 46 days 47 daysPayables turnover 46 days 50 days 59 days 73 daysCurrent ratio 1.4:1 0.7:1 1.1:1 0.9:1P/E ratio 18.6 12.6 18.3 15.2
ABC has a cash surplus and would seek to purchase outright between 90% and 100% of the share capital of one of the three entities. The entity’s directors do not intend to increase the gearing of the group above its existing level. Upon acquisition they would, as far as possible, retain the entity’s management and its existing product range. However, they would also seek to extend market share by introducing ABC’s own products.

PREPARIN
G FO
R THE EXA
MIN
ATION
517FINANCIAL MANAGEMENT
RequirementsPrepare a report to accompany the summary of key data. The report should:
(a) Analyse the key data, comparing and contrasting the potential takeover targets with each other and with ABC itself. (13 marks)
(b) Discuss the extent to which the entities can be validly compared with each other, identifying the limitations of inter-fi rm and international comparisons. (12 marks)
(Total marks � 25)

This page intentionally left blank

519
Solutions to Revision Questions
Section A
Solution 1 (a) Consolidated current assets are $400,000 � $350,000 � $40,000 � $15,000 (cash in
transit) � $725,000. Consolidated current liabilities are $250,000 � $100,000 � $25,000 � $325,000. (b) The consolidated reserves are as follows:
$’000Retained earnings of Peter as given 200Own dividend paid (40)Dividend received from Paul 15Share of post-acquisition retained earnings of Paul 45[75% ($180,000 � $20,000 � $100,000)] 220
(c)
1. Adjust earnings: $ $ Earnings as stated 100,000 Interest saving: Finance cost 6,000 Tax effect (6,000 � 30%) (1,800)
4,200 Diluted earnings 104,2002. Diluted ordinary shares $50,000�100 � 12 6,000 Number of ordinary shares in issue 27,000
33,000
Basic eps 5 10Diluted eps � 104,200/33,000 � 315.8¢ per shareDiluted eps � 104,200/33,000 � 315.8¢ per share
Solution 2 (a) The investment in Costello will be accounted for as a subsidiary under IAS27 and as
such will be fully consolidated. The consideration paid will be compared to the fair value of the net assets acquired and the difference recognised as goodwill on acquisition.
The goodwill on consolidation is $62 m � 80% ($50 m � $5 m � $10 m) � $10 million plus goodwill on non-controlling interest of $1.3 m ($6.2 m � 20% NA of $52 m).
PREP
ARI
NG
FO
R TH
E EX
AM
INAT
ION
SOLUTIONS TO REVISION QUESTIONS F2520
The total $11.3 of goodwill will be included in non-current assets in the consolidated statement of fi nancial position.
The brand name is included within the goodwill fi gure rather than dealt with as a separate asset because it has no readily ascertainable market value.
(b) We can show the corrected post-acquisition reserves of Costello in the following table:
Year end date Acquisition date Post-acquisition$’000 $’000 $’000
Share capital 25,000 25,000Retained earnings:Per accounts of Costello 35,000 25,000Contingent gain adjustment – 5,000Property, plant and equipment adjustment 6,000 10,000Brand valuation adjustment – –
66,000 65,000 1,000
So the consolidated reserves are:
$’000Abbott 60,000Costello (80% � $1,000,000) 800
60,800
Solution 3 (a) Intra-group sales are eliminated in full from consolidated turnover and cost of sales.
Recorded as: Dr Revenue $6m Cr Cost of sales $6m
Being elimination of intra-group sales
(b) The adjustment to gross profi t is the movement in the provision for unrealised profi t between the beginning and end of the year. This is 20% ($1,200,000 � $750,000) �$90,000. This will be charged to cost of sales and will therefore reduce gross profi t by $90,000, recorded as:
Dr Cost of sales/GP $90,000 Cr Inventories $90,000
Being elimination of unrealised profi t on inventories.
(c) The consolidated reserves of the Tea group are:
$’000Reserves of Tea 6,00075% of reserves of Cup 3,00075% of provision for unrealised profi t (180)($1,200,000 � 20% � 75%) 8,820
Solution 4The effective interest of Frank in Sammy is 40% (2/3 � 60%). The effective date of
acquisition is 31 December 20W5, when the accumulated profi ts of Sammy stood at $12 million.

PREPARIN
G FO
R THE EXA
MIN
ATION
521FINANCIAL MANAGEMENT
The summary statement of fi nancial position for the group as at 31 December 20X0 would be as follows:
ASSETS $000Goodwill on acquisition (W1) 733Net assets ($40,000 � $30,000 � $32,000) 115,000
115,733EQUITY AND LIABILITIESOrdinary share capital 30,000Retained earnings (W2) 48,733
78,733Non-controlling interest (W3) 37,000
115,733
(W1) – Goodwill on acquisition
$000 $000Consideration transferred 32,000Less net assets acquired:Dean – share capital 30,000Retained earnings at 20W5 22,000Less cost of investment in Sammy
(24,300)
27,700Group share 2/3 (18,467)Sammy – share capital 20,000Retained earnings at 20W5 12,000
32,000Effective group share 40% (12,800)Goodwill on acquisition 733
(W2) – Retained earnings
Frank Dean Sammy $000 $000 $000
Per SOFP 20X0 42,000 24,300 25,000At acquisition – (22,000) (12,000)
2,300Group share of Dean 1,533 13,000Effective share of Sam 5,200Consolidated 48,733
(W3) – Non-controlling interestNCI in Dean 1/3 � ($54,300 – cost of investment in Sammy $24,300) � $10,000NCI in Sammy (based on effective holdings) 60% � $45,000 � $27,000Total $37,000
Solution 5 (a) The dividends paid to non-controlling interest is:
$mOpening balance 50Profi t for the year 25Increase due to acquisition ($100m � 20%) 20Dividend paid (balancing fi gure) (15)Closing balance 80

PREP
ARI
NG
FO
R TH
E EX
AM
INAT
ION
SOLUTIONS TO REVISION QUESTIONS F2522
The dividend paid to non-controlling interest will be included as an outfl ow under the heading ‘cash fl ows from fi nancing activities’. It will be shown separately from dividends paid to equity shareholders.
(b) The cash outfl ow is the cash paid ($20 million) plus the net bank overdrafts acquired ($10 million). Total: $30 million. This will be included as an outfl ow under the head-ing ‘cash fl ows from investing activities’.
(c) The purchase of non-current assets is as follows:
$mOpening balance 10Non-current of sub acquired 3
13depreciation (2.6)
10.4Closing balance 14Balancing fi g is purchase of NCA 3.6
Solution 6MemorandumTo: Assistant accountantFrom: Management accountantDate: 9 January 20X7
Accounting year ended 30 June 20X6 – adjustments to draft fi nancial statementsThe following are my views on how to correctly treat each of the transactions below.
(a) Elimination of unrealised profi ts (IAS 27)Under IAS 27, all unrealised profi ts on inventory transferred between group com-
panies at a market price must be eliminated as these can be realised only on their subsequent disposal to a third party. However, the IAS insists that the full amount of unrealised profi t be eliminated from inventories with the minority shareholders being charged with their share.
The double entry would be recorded as follows:
Debit Non-controlling interests $2 mRetained earnings $8 m
Credit Inventory $10 m
(b) Intangible assets (IAS 38)A number of entities in the past have recorded brands on their statements of fi nancial position but mostly when they have been acquired from other companies as a result of an acquisition.
IAS 38 states that internally generated goodwill, brands and other similar items should not be recognised as assets.

PREPARIN
G FO
R THE EXA
MIN
ATION
523FINANCIAL MANAGEMENT
Solution 7 (a) The accounting treatment of joint ventures is set out in IAS 31 Interests in Joint
Ventures. The treatment in the consolidated accounts depends on whether the form of the joint venture is that the venture comprises:● jointly controlled operations● jointly controlled assets● jointly controlled entities.
The agreement with Pills appears to establish jointly controlled assets. The venture has no separate business of its own but both Textures and Pills have, on a 50:50 basis, contributed assets to it. Under these conditions each venturer will, in its individual fi nancial statements, recognise its share of the assets and liabilities of the joint venture. These amounts will be classifi ed according to the nature of the assets and liabilities. Since all assets are jointly controlled, $150,000 will be included in non-current assets and $15,000 in current assets. The treatment in the consolidated fi nancial statements will be identical.
The agreement with Eduaid and Bracos establishes a jointly controlled entity. In the individual fi nancial statements of the investors the amounts that have been contrib-uted to the joint venture will be shown as an investment. In the consolidated fi nan-cial statements the interest in the joint venture will be proportionally consolidated, irrespective of the actual amounts invested by each investor. Therefore, Textures will include $2,250,000 (30% � $7,500,000) in non-current assets and $330,000 (30% �$1,100,000) in current assets.
Solution 8 (a) The objective of IFRS3 is to ensure that when a business entity is acquired by another,
all the assets and liabilities that existed in the acquired entity at the date of acquisi-tion are recorded at fair values refl ecting their condition at that date. The difference between the fair values of the net assets and the cost of the acquisition is recognised as goodwill or negative goodwill.
There is therefore a clear need for guidance as to which assets and liabilities would be permitted to be included in a fair value exercise and how these would be valued. This should help to ensure consistency and comparability in the calculations of fair values.
(b) The main relevant provisions of IFRS3 are as follows:1. The assets and liabilities of a subsidiary acquires should be valued at their fair val-
ues. However, only those assets/liabilities that existed at the date of acquisition should be recognised. No attempt should be made to provide for any liability which would result from the acquirer’s future intentions for the acquiree.
2. The acquiree should be valued using the acquirer’s accounting policies.3. The fair value of liabilities should also exclude provisions for future operating losses
and reorganisation/restructuring costs.4. The method of calculation of assets should be as follows: Non-monetary assets at lower of replacement cost or recoverable amount refl ecting
the current condition of the assets.

PREP
ARI
NG
FO
R TH
E EX
AM
INAT
ION
SOLUTIONS TO REVISION QUESTIONS F2524
Monetary assets should be based on amounts expected to be received with the possibility of discounting long-term assets to their present value.
5. The fair value of the purchase consideration should represent the actual cash paid plus the present value of any deferred consideration plus the market value of the shares taken up on acquisition.
Solution 9 (a) The bond is repayable and so contains a present obligation to transfer future economic
benefi t, it is therefore a fi nancial liability. In accordance with IAS 39 it will be held at amortised cost using the effective interest rate. The effective rate of interest attached to the zero-coupon bond is:
$, ,
, ,. %
10 000 000
14 025 2450 713 7� � (using PV tables)
Year Carrying value of instrument at 1 Jan.
Income statement charge
Carrying value of instrument at 31 Dec.
$ $ $1 10,000,000 700,000 (7%) 10,700,0002 10,700,000 749,000 (7%) 11,449,000
(b) This instrument is a hybrid, containing both a liability and an equity component. IAS 32 requires that the elements be recorded separately. The liability should be recorded at the value that is equivalent to the PV of a similar instrument that does not have conversion rights and then the difference is accounted for as equity.
It will be recorded as:
Dr Bank $6,000,000 Cr Non-current liabilities (W1) $5,681,520 Cr Other reserves (within equity) $641,520
Being the initial recording of the convertible instrument.
(W1) Fair value of equivalent non-convertible instrumentSimple rate for 3 years at 6% � 0.840Cumulative rate for 3 years at 6% � 2.673
$000PV of principal repayable 31/12/X3 (3,000 � $2,000 � 0.840)
5,040,000
PV of interest annuity for 3 years 641,5205,681,520
Equity element (balancing fi gure) 318,480Total consideration received 6,000,000
Solution 10 (a) The weighted average of ordinary shares in issue:
To 30 September 20X4: 5,700,000 � 8�12 3,800,000From 30 September 20X4 to 31 January 20X5: 6,900,000 � 4�12 2,300,000
6,100,000
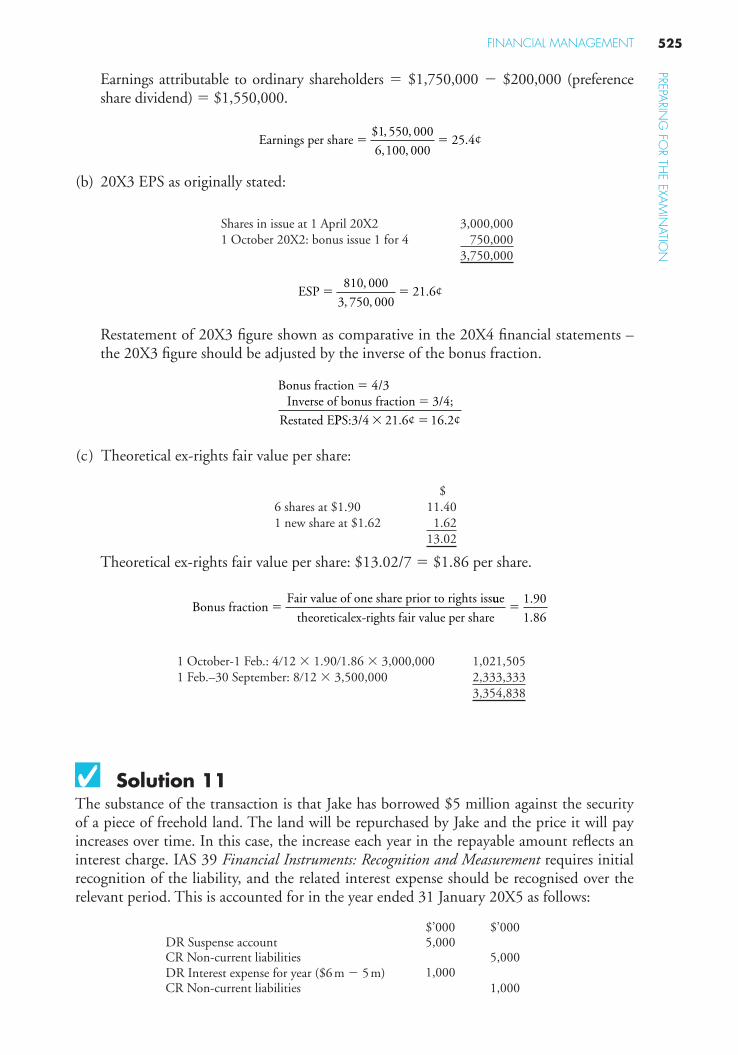
PREPARIN
G FO
R THE EXA
MIN
ATION
525FINANCIAL MANAGEMENT
Earnings attributable to ordinary shareholders � $1,750,000 � $200,000 (preference share dividend) � $1,550,000.
Earnings per share � �$ , ,
, ,. ¢
1 550 000
6 100 00025 4
(b) 20X3 EPS as originally stated:
Shares in issue at 1 April 20X2 3,000,0001 October 20X2: bonus issue 1 for 4 750,000
3,750,000
ESP � �810 000
3 750 00021 6
,
, ,. ¢
Restatement of 20X3 fi gure shown as comparative in the 20X4 fi nancial statements – the 20X3 fi gure should be adjusted by the inverse of the bonus fraction.
Bonus fraction /Inverse of bonus fraction 3/4;
Restated E
��
4 3
PPS:3/4 � �21 6 16 2. ¢ . ¢
(c ) Theoretical ex-rights fair value per share:
$6 shares at $1.90 11.401 new share at $1.62 1.62
13.02
Theoretical ex-rights fair value per share: $13.02/7 � $1.86 per share.
Bonus fractionFair value of one share prior to rights iss
�uue
theoreticalex-rights fair value per share�
1 90
1 86
.
.
1 October-1 Feb.: 4�12 � 1.90�1.86 � 3,000,000 1,021,5051 Feb.–30 September: 8�12 � 3,500,000 2,333,333
3,354,838
Solution 11The substance of the transaction is that Jake has borrowed $5 million against the security of a piece of freehold land. The land will be repurchased by Jake and the price it will pay increases over time. In this case, the increase each year in the repayable amount refl ects an interest charge. IAS 39 Financial Instruments: Recognition and Measurement requires initial recognition of the liability, and the related interest expense should be recognised over the relevant period. This is accounted for in the year ended 31 January 20X5 as follows:
$’000 $’000DR Suspense account 5,000CR Non-current liabilities 5,000DR Interest expense for year ($6 m � 5 m) 1,000CR Non-current liabilities 1,000

PREP
ARI
NG
FO
R TH
E EX
AM
INAT
ION
SOLUTIONS TO REVISION QUESTIONS F2526
The preference shares issued, while non-redeemable, contain a present obligation to transfer future economic benefi t as the dividend is cumulative and will ultimately be paid. In accord-ance with IAS 32, the shares will therefore be included as a liability in the fi nancial state-ments. IAS 39 requires that fi nancial liabilities be initially recorded at the net proceeds ie total proceeds less transaction costs. The debit to share premium will be reversed and the shares recorded as:
Dr Suspense $10,000,000 Cr Non-current liabilities $9,950,000 Cr Share premium $50,000
Solution 12This is an example of a fair value hedge. Black have entered into a hedging arrangement as it wants to minimise the risk of the value of the AFS investment falling as a result of a fall in value of the share price.
In 20X7 the available for sale asset is recorded as normal with the gain of $200,000 being recorded in reserves, in accordance with IAS 39:
Dr Available for sale investment $200,000 Dr Other reserves $200,000
This gain of $200,000 will be shown within other comprehensive income for the year ended 31 December 20X7.
In 20X8 an effective hedge exists to cover any fall in the value of the shares due to gen-eral market conditions. The derivative has a positive value and is therefore an asset held at fair value through profi t or loss. This hedged item is the AFS but only the effective part of the hedge can be offset in the income statement. Any effective part or any loss not covered by hedge is recorded according to the normal rules for the available for sale asset, ie to reserves. The recording for 20X8 is:
Dr Financial asset – derivative $250,000 Cr Gain on derivative (IS) $250,000
Being the accounting for the derivative
Dr Loss on hedged investment $250,000 Dr Other reserves $20,000 Cr Available for sale investment $270,000
Being the accounting for the AFS investment
Solution 13(a)
MemorandumTo: Assistant accountantFrom: Management accountantDate:Subject: Financial instruments – preference sharesPreference shares are, in substance, similar to a debt instrument. They are issued on the understanding that they will receive a fi xed dividend and will be redeemed at a specifi ed amount on an agreed date. It is likely that IAS 32 would require these instru-ments to be recognised as a fi nancial liability.

PREPARIN
G FO
R THE EXA
MIN
ATION
527FINANCIAL MANAGEMENT
In the income statement, the fi nance charge should be calculated as the effective rate applied to the carrying value of the instrument. However, this charge represents the difference between the net proceeds and the total payments made during the life of the instrument. It will therefore incorporate not only interest charges but also the ini-tial issue expenses, as well as any premiums payable at the end of the instrument’s life.
The carrying value of the non-equity shares will increase each year by the difference between the effective interest charge and the dividends paid in cash. At the end of the instrument’s life the amount outstanding on the statement of fi nancial position should therefore represent the cash that must be paid to extinguish the full debt at the time.
Signed: Management accountant
(b) Short – fi nance cost for each of the 5 years to 30 September 20X8
$’m $’mTotal payments over the life of the instrument10m � $1.35 13.5Dividends 0.4m � 5 years 2.0
15.5Net proceedsProceeds on issue 10.0Less issue costs 0.1
9.9Finance charge 5.6
The spreading of the annual fi nance cost is as follows:
Opening balance
Finance charge(10%)
Dividendcash fl ow
Closingbalance
$’000 $’000 $’000 $’00020X4 9,900 990 (400) 10,49020X5 10,490 1,049 (400) 11,13920X6 11,139 1,114 (400) 11,85320X7 11,853 1,185 (400) 12,63820X8 12,638 1,262* (400) 13,500 redeemed
5,600 2,000
(*rounding)
Solution 14The amended version of IAS 19 permits alternative approaches in accounting for actuarial gains and losses:
1. The fi rst option is the accounting treatment that was required by the original IAS 19. Actuarial gains and losses are not recognised immediately in the income statement except where they exceed certain parameters. Where the parameters in the standard are met, the gain or loss is recognised over the average remaining service lives of the employees. This may be a fairly lengthy period (for example, 10 or 15 years would not be unusual), so, even if the actuarial loss of $7.2 million were to exceed the parameters, the impact on the fi nancial statements is likely to be very small.
Where this option requires part of the loss to be recognised, it is recognised in the income statement, and so has a direct effect upon reported profi t.

PREP
ARI
NG
FO
R TH
E EX
AM
INAT
ION
SOLUTIONS TO REVISION QUESTIONS F2528
2. The standard permits entities to adopt any systematic method that results in faster rec-ognition of actuarial gains and loss than stipulated in the fi rst approach, provided that the same basis is applied to both gains and losses, and that the basis is applied consist-ently. Thus, entities are able to opt for a policy of recognising the whole of any actuarial gains or losses in the accounting period in which they occur. In CBA’s case this would mean recognising the full amount of the $7.2 million loss in the fi nancial year ended 30 September 20X6. In such cases (where actuarial gains and losses are recognised in full as they are incurred), the standard requires that such gains and losses should be recognised in a ‘Other Comprehensive Income’, within the statement of comprehensive income.
Solution 15To: The board of directors of SFrom: Management accountantSubject: The determination of the economic substance of a transactionDate: 25 November 20X8
(a) The substance of a transaction is determined by its likely effect on the assets and liabil-ities of the entity. A number of different scenarios are possible.(i) An asset is created. An asset must meet the defi nition provided in the IASB
Framework, that is, the transaction will result in the creation of future economic benefi ts controlled by the entity as a result of a past transaction or event.
(ii) It is probable that future economic benefi ts will materialise. If it is only possible that future benefi ts will materialise, then an asset would not be created even if it is likely that it may ultimately realise benefi ts to the reporting entity. (For example, revenue investments such as advertising, training, maintenance are expensed not capitalised.)
(iii) The cost or value of the asset can be reliably measured. In order for an asset to be capitalised it must have a cost/value that can be reliably measured. For example, a home-grown brand may not pass the test.
An additional aspect of applying the IASB Framework is considering to which party the ‘risks’ of ownership of the asset are attached. It is regarded as a ‘signifi cant indica-tor’ of the party controlling the asset.
Subsequently, the asset will be removed from the statement of fi nancial position if the ‘risks and rewards’ of ownership are transferred to another party, that is, the asset is derecognised.
If the risks and rewards are shared between two parties then the asset description and value may need to be changed. This occurs in a ‘linked presentation’ situation, for example, factoring of receivables, whereby advance non-returnable proceeds are paid to the original selling company. The proceeds are netted off on the face of the statement of fi nancial position, usually in a boxed format.
(b) The appropriate accounting treatment of factoring depends on who bears the risks and rewards of ownership in the factoring contract. Questions such as who bears the risks of slow payments or bad debts and will the seller have to repay monies advanced by the factor must be answered. The terms of the agreement between S and F need to be investigated as follows:

PREPARIN
G FO
R THE EXA
MIN
ATION
529FINANCIAL MANAGEMENT
(i) F only takes receivables after credit approval – risk is still with S.(ii) Any debts not collected by F within 90 days are regarded as bad and reassigned
to S with any advanced payments being recovered – risk is with S.(iii) F charges interest, calculated on a daily basis on the outstanding balance – cost
to S.(iv) F administers the scheme and collects its fee from cash received from receivables –
clearly a reward to F but little risk and S pays the cost.
In summary, it would appear that the seller, S, carries all the risks since there is a full recourse by F to S for any bad debts and slow payments. F is providing a loan to S on the security of its receivables. Legal title may have passed but the commercial real-ity of the transaction is that the receivables should be disclosed as an asset of S until such time as they are cleared by a payment to F. The amount advanced by F should be disclosed as a liability. The cost of interest, administration and bad debts suffered by S should be disclosed on the face of the income statement.
Solution 16
Issue (a)The loan is a monetary liability in the statement of fi nancial position of Ant and IAS 21 – The Effects of Changes in Foreign Exchange Rates – requires that monetary items be trans-lated at the rate of exchange in force at the year end date. This would mean restating the loan from its original carrying value of $25 million (40 m Francos/1.6) to $26,666,667 (40 m Francos/1.5). The resulting exchange loss of $1,666,667 would be reported in the income statement as a fi nancing item.
The net assets of the subsidiary would be translated using the rate of exchange in force at the year end date because the subsidiary is relatively independent of the parent on a day-to-day basis. Because the net assets of the subsidiary are the same as the loan balance, its closing dollar value would also be $26,666,667. There would be an exchange gain of $1,666,667 on the retranslation of the opening net assets which IAS 21 would require is taken to equity.
Where a foreign currency loan is used to fi nance a foreign currency equity investment then IAS 21 requires a form of hedge accounting to be used in the consolidated fi nancial statements (as well as in the fi nancial statements of the parent). Exchange differences aris-ing on a monetary item that, in substance, forms part of the net investment in a foreign entity should be classifi ed as equity until the disposal of the net investments. At that time they should be released to income along with the cumulative exchange differences on the relevant net investments.
The correcting journal entry will be:
DEBIT: Net assetsCREDIT: Long-term loans.
With $1,666,667, no net exchange differences will be reported because the exchanges dif-ferences on the loan and the net investment are both taken to equity and they are equal and opposite.

PREP
ARI
NG
FO
R TH
E EX
AM
INAT
ION
SOLUTIONS TO REVISION QUESTIONS F2530
Issue (b)The loan is a compound fi nancial instrument and IAS 32 – Financial Instruments: Presentation – requires that such instruments be classifi ed in two component parts in the statement of fi nancial position of the issuer. This requirement is unaffected by the likeli-hood or otherwise that the holders of the instrument will exercise their conversion options. In this case, we are provided with the fair value of the option element (which does not change over the period) so the loan element can be derived by deducting the option ele-ment from the total initial carrying value of the instrument.
IAS 39 – Financial Instruments: Recognition and Measurement requires that fi nancial liabilities should be initially measured at ‘cost’. Cost is the proceeds received minus the issue costs. Therefore, in this case ‘cost’ is $175.5 million ($180 million � $4.5 m). The loan element of the instrument is $153 million ($175.5 m � $22.5 m). Since the loan is a held to maturity fi nancial liability it should subsequently be re-measured at amortised cost using the effective interest method to measure the annual fi nance cost. The fi nance cost should be a constant percentage of the outstanding loan for each period.
In this case, the percentage can be found from tables:
● The initial loan amount is $153 million (A).● The terminal loan amount with no interim payments is $270 million (B).● A/B is 0.567.● From tables this equates to an annual interest rate of 12%.
Therefore, the fi nance cost for the fi rst year is $18,360,000 ($153 m � 12%) and the clos-ing loan is $171,360,000. The correcting journal entry that is required is:
DR CR$’000 $’000
Shareholders funds – initial entry 180,000Shareholders funds – option element 22,500Long-term loans 171,360Income statement – admin expenses 4,500Income statement – fi nance cost 18,360
Solution 17The charge to the income statement for 20X8 will be:
$’000 $’000Ongoing service cost 4,000Unwinding of the discount 3,600Expected return on pension assets (4,800)
(1,200)Net charge to statement 2,800
The ‘corridor’ for recognition of actuarial losses from prior years is the greater of:
● 10% of the opening market value of the scheme’s assets: $40 m � 10% � $4 m.● 10% of the opening present value of the scheme’s liabilities: $44 m � 10% � $4.4 m.
It is clear that the unrecognised actuarial losses are less than $4.4 million, so no recogni-tion is appropriate for the current year.

PREPARIN
G FO
R THE EXA
MIN
ATION
531FINANCIAL MANAGEMENT
The statement of fi nancial position fi gures for the end of 20X8 will be:
$’000 $’000Market value of plan assets 42,000Present value of plan liability (44,000)
(2,000)Actuarial differences not yet taken to the income statement (see below)
600
So net liability (1,400)
(W) Actuarial differences
$’000Net difference brought forward ($40 m–$44 m) (4,000)Net charge to income statement for the year (see above) (2,800)Contributions for the year 3,400Actuarial difference for the year – to balance 400Net difference carried forward ($42 m–$45 m) (3,000)
This means that the end unrecognised actuarial losses at the end of the year are $600,000 ($1,000,000 � $400,000).
Solution 18 (a) In times of increasing prices, historical cost accounting displays the following defects:
(i) Revenues are stated at current values, but they tend to be matched with costs incurred at an earlier date. Therefore, profi t is overstated.
(ii) Where historical cost accounting is applied consistently, asset values are stated at cost less accumulated depreciation. Current values of the assets may be considera-bly in excess of net book value, with the result that the historical cost depreciation charge does not constitute a realistic estimate of the value of the asset consumed.
(iii) By the time monetary liabilities are repayable, the amount of the outfl ow in cur-rent value terms is less than the original infl ow. An entity can therefore gain by holding current liabilities, but historical cost accounting does not recognise these gains. The opposite effect is experienced in respect of monetary assets.
(iv) Typically, in a time of rising prices, profi ts are likely to be overstated, and capitalto be understated, thus giving rise to unrealistic measurements of return on capital employed.
(b) The cost of sales adjustment comprises the additional amount of value, over and above value at historical cost, that is consumed at current cost. It represents an additional charge against profi ts, thus tending to reduce distributable earnings and ensuring that the business conserves the resources that allow it to continue to trade at current levels.
The depreciation adjustment is the difference between the historical cost account-ing and current cost depreciation charges. Current cost depreciation is the value of the non-current asset consumption that has taken place during the year. In a time of rising prices it is a more realistic representation of the asset consumption. It tends to reduce distributable profi ts thus contributing to capital maintenance.
In the case of Do-it, there is a loss on net monetary position. As noted earlier in part (a) holding monetary liabilities in times of rising prices tends to give rise to gains, whereas holding monetary assets produces losses. Do-it appears, therefore, to have an excess of monetary assets over monetary liabilities, as the net effect is a loss.

PREP
ARI
NG
FO
R TH
E EX
AM
INAT
ION
SOLUTIONS TO REVISION QUESTIONS F2532
The recognition of this loss produces a more realistic estimation of distributable profi t, and thus contributes to capital maintenance.
Solution 19The convergence project: progress to dateTraditionally, the US has adopted a ‘rule-book’ approach to fi nancial reporting stand-ard setting, whereas the approach taken by the IASB, and its predecessor body, has been to encourage adherence to principles. This fundamental difference in approach made it appear, for a long time, as though the US would never accept international standards. However, the rule-book approach was found wanting in a series of fi nancial scandals in the US in the late 1990s and early years of the 21st century. The climate was therefore ame-nable to a change in approach which would make convergence possible between US and international fi nancial reporting standards.
In September 2002 the US standard setter (Financial Accounting Standards Board – FASB) and the IASB agreed to undertake a project which would have the objective of con-verging their accounting practices, reducing the number of differences between US GAAP and IFRS. This agreement (the ‘Norwalk agreement’) committed the parties to making their existing standards fully compatible as soon as practicable, and to co-ordinating their future work programmes. In order to address the fi rst commitment, a short-term project was undertaken to remove some of the differences between existing standards. The second commitment was to be met by collaborating on the development of standards.
A memorandum of understanding between FASB and the IASB sets out a ‘Roadmap of Convergence between IFRS and US GAAP 2006–8’. This is aimed at removing the need for reconciliation to US GAAP requirement for those companies that use IFRS and are registered in the USA.
Progress to date has been impressive. Projects undertaken jointly between FASB and IASB have produced the following:
● IFRS 5 Non-current Assets Held for Sale and Discontinued Operations● IFRS 3 Business combinations● IFRS 8 Operating Segments● IAS 1 Presentation of Financial Statements: a revised presentation
There are several on-going projects that will run into the longer-term. For example, the amendment to IAS 1 noted above represents just a fi rst phase in a larger project on fi nan-cial statement presentation. Subsequent phases will address fundamental issues in present-ing information and the issue of interim reporting.
Other longer-term projects include convergence of the conceptual frameworks and rev-enue recognition.
Finally, despite the high level of activity on convergence, it should be noted that many signifi cant differences remain between US GAAP and IFRS.
Solution 20Arguments against voluntary disclosures by businesses in respect of their environmental policies, impacts and practices might include the following principal points:
The traditional view of the corporation is that it exists solely to increase shareholder wealth. In this view business executives have no responsibility to broaden the scope or

PREPARIN
G FO
R THE EXA
MIN
ATION
533FINANCIAL MANAGEMENT
nature of their reporting as doing so reduces returns to shareholders (because there is a cost associated with additional reporting).
From a public policy perspective, if governments wish corporations and similar entities to bear the responsibility for their environmental impacts, they should legislate accord-ingly. In the absence of such legislation, however, businesses bear no responsibility for environmental impacts, and in consequence there is no reporting responsibility either.
Voluntary disclosures of any type are of limited usefulness because they are not readily comparable with those of other entities. Therefore, it is likely that the costs of producing such disclosures outweigh the benefi ts to stakeholders.
The audit of voluntary disclosures is not regulated. Even where such disclosures are audited, the scope of the audit may be relatively limited, and moreover, its scope may not be clearly laid out in the voluntary report. Voluntary reports are not necessarily, therefore, reliable from a stakeholder’s point of view.
Especially where voluntary disclosures are included as part of the annual report pack-age, there is a risk of information overload: stakeholders are less able to identify in a very lengthy report the information that is relevant and useful to them.
Voluntary disclosures by business organisations, because they are at best lightly regu-lated, may be treated by the organisation in a cynical fashion as public relations opportu-nities. The view of the business’s activities could very well be biased, but it would be quite diffi cult for most stakeholders to detect such bias.
It is questionable whether voluntary disclosures about environmental policies, impacts and practices would meet the qualitative characteristics of useful information set out in the IASB’s Framework. The key characteristics are: understandability, reliability, relevance and comparability. Voluntary environmental disclosures might well fail to meet any of these characteristics and, if this is the case, it is highly questionable whether or not they merit publication.
Section B SolutionsSolution 21
Requirements (a) The fi nancial asset falls into the category of loans and receivables, and, according to
the standard, should be accounted for using the amortised cost method. The effec-tive interest rate inherent in the fi nancial instrument is used to calculate the annual amount of interest receivable, which is credited to the income statement. If an annual amount of interest is receivable this is credited to the fi nancial asset (with the related debit to cash or receivable).
The other current asset in this case falls into the category of ‘held-for-trading’ and should be accounted for at fair value through profi t and loss account. Where securities are actively traded, the statement of fi nancial position amount (at fair value) is likely to differ from the amount at which the asset was originally recognised. Fair value dif-ferences are debited or credited to profi t or loss, and appear in the income statement.

PREP
ARI
NG
FO
R TH
E EX
AM
INAT
ION
SOLUTIONS TO REVISION QUESTIONS F2534
(b)AD: Consolidated statement of fi nancial position as at 30 June 20X6
$ $ASSETSNon-current assets:Property, plant and equipment (1,900 � 680) 2,580,000Goodwill (W1) 360,000Investment in associate (W5) 106,160Financial asset (W2) 1,062,400
4,108,560Current assets:Inventories (223 � 127) 350,000Trade receivables (204 � 93 � 5) 292,000Other current assets (W3) 26,800Cash in transit 5,000Cash (72 � 28) 100,000
773,8004,882,360
EQUITY AND LIABILITIESEquity:Share capital 1,000,000Retained earnings (W7) 2,555,240
3,555,240Non-controlling interest (W6) 168,120Non-current liabilities 600,000Current liabilities:Trade payables (247 � 113) 360,000Income tax (137 � 62) 199,000
559,0004,882,360
Workings(W1) Goodwill on acquisition of BE
$Cost of investment 880,000Less: acquired (300,000 � 350,000) � 80% (520,000)
360,000
(W2) Financial assetCalculation of fi nance charge for year ended 30 June 20X6:
$1 July 20X4 Proceeds of instrument 1,000,000Year 1 fi nance charge 8% 80,000Less: interest received ($1,000,000 � 5%) (50,000)At 30 June 20X5 1,030,000Year 2 fi nance charge ($1,030,000 � 8%) 82,400Less: interest received ($1,000,000 � 5%) (50,000)At 30 June 20X6 1,062,400
The balance is currently stated at $980,000 (i.e., $1,030,000 brought forward less the interest receipt of $50,000). The following adjustment is required:
DR Financial asset 82,400 CR Interest receivable 82,400
The credit to interest receivable increases retained earnings by $82,400 (see W7)

PREPARIN
G FO
R THE EXA
MIN
ATION
535FINANCIAL MANAGEMENT
(W3) Other current assetsIncrease in fair value: 670¢ � 625¢ � 45¢ � 4,000 shares � $1,800
DR Other current assets 1,800CR Fair value adjustments 1,800
The credit to fair value adjustments increases retained earnings by $1,800 (see W7)
(W4) Provision for unrealised profi tUnrealised profi t in BE: $10,000 � 30% � 40% � $1,200
This is deducted from the investment in associate (W5). The debit is split between group and minority shares:
$Group $1,200 � 80% (W7) 960Minority $1,200 � 20% (W6) 240
1,200
(W5) Investment in associate
Goodwill on acquisition $Investment at cost 104,000Less: acquired (100,000 � 102,000) � 40% (80,800)Goodwill 23,200
The element relating to the non-controlling interest (20%) is excluded: $23,200 � 20% � $4,640
Investment in associate: $Cost of investment 104,000Less: amount of goodwill relating to minority (4,640)Add: share of post-acquisition profi t ($20,000 � 40%) 8,000
107,360Less: PURP (W4) (1,200)
106,160
(W6) Non-controlling interest
$ $Net assets in BE 857,000Less: cost of investment in CF (104,000)Add: share of net assets in CF ($222,000 � 40%) 88,800
841,800 � 20% 168,360Less: share of provision for unrealised profi t (W5) (240)
168,120
(W7) Retained earnings
$AD’s retained earnings 2,300,000Group share of post-acquisition earnings in BE: ($557,000 � 350,000) � 80% 165,600Group share of post-acquisition earnings in CF: ($122,000 � 102,000) � 32% 6,400Financial asset interest credit (W2) 82,400Fair value increase – other fi nancial asset (W3) 1,800
2,556,200Less: group share of provision for unrealised profi t (W5) (960)
2,555,240

PREP
ARI
NG
FO
R TH
E EX
AM
INAT
ION
SOLUTIONS TO REVISION QUESTIONS F2536
Solution 22 (a) Rag – memorandum
To: Assistant accountantFrom: Consolidation accountantDate: 26 May 20X9Subject: Treatment of Bobtail on consolidation
Assuming that all the shares in Tag and Bobtail carry equal voting rights at general meetings, the structure of the Rag group is as follows:
If Rag is actively involved in Bobtail’s strategic decision-making, then a 40% share-holding should give Tag signifi cant infl uence (per IAS 28) over the operating and fi nancial policies of Bobtail. This means that Bobtail is an associate of Tag, by virtue of its direct shareholding.
Of greater importance to the Rag group is Rag’s 30% indirect shareholding in Bobtail, which will need to be included in Rag’s consolidated income statement under the equity accounting requirements of IAS 28. It has already been established that Rag has dominant infl uence over its subsidiary Tag. This means that Rag, indirectly through Tag, has signifi cant infl uence over Bobtail, thereby making Bobtail an associ-ate of Rag. The proportion of Bobtail’s results not belonging to the Rag group will be automatically eliminated as part of the 25% non-controlling interest share of Tag’s profi ts. This will leave the Rag group with its 30% share (75% � 40%) of the results of Bobtail, in accordance with its indirect shareholding. In this way, the signifi cant infl uence that Rag has over Bobtail is refl ected in Rag’s consolidated income statement.
Signed: Consolidation accountant
(b) Working schedule for the consolidated income statement for the year ended 31 March 20X9
Rag Tag Group Bobtail$’000 $’000 $’000 $’000
Revenue 65,000 50,000 115,000 100,000Less: Inter-group (8,000) (8,000)
57,000 50,000 107,000 Cost of sales (35,000) (28,000) (63,000) (82,000)Less: Inter-group 8,000 8,000
(27,000) (28,000) (55,000)Gross profi t 30,000 22,000 52,000 18,000Provision for unrealised profi t on inventory (20) (4) (24)
29,980 21,996 51,976 18,000Other operating expenses (15,000) (11,000) (26,000) (9,000)
14,980 10,996 25,976 9,000Share of associate’s operating profi t 3,600 (40%) 3,600
14,980 14,596 29,576Interest payable (3,200) (1,800) (5,000)Share of interest payable (480) (40%) (480) (1,200)Profi t before taxation 11,780 12,316 24,096 7,800Taxation (3,600) (2,800) (6,400)Share of associate’s taxation (960) (40%) (960) (2,400)Profi t for the period 8,180 8,556 16,736 5,400

PREPARIN
G FO
R THE EXA
MIN
ATION
537FINANCIAL MANAGEMENT
Workings
1. Provisions for unrealised profi t on inventory
Rag to Tag and Tag to Bobtail
Statement of fi nancial
position
Statement of fi nancial
position
Income statement
20X9 20X8 20X9Tag 2,200 � 1/11 200 1,980 � 1/11 180 20Bobtail 1,100 � 1/11 100 990 � 1/11 90 10
90 � 40% 36 � 40% 4
Solution 23 (a) The convertible bond issue is a compound or hybrid fi nancial instrument, accord-
ing to IAS 32 Financial Instruments: Presentation. It is a hybrid in the sense that is contains both a liability and an equity element. The liability embodies the issuer’s obligation to pay interest and to redeem the bond. The equity element comprises the bond holder’s right to claim a share of the issuer’s equity. The appropriate accounting treatment is to determine the fair value of the liability element and to recognise this as part of liabilities. The residual difference between the proceeds of the instrument and the fair value of the liability portion should be recognised as part of equity.
The IASB Framework includes ‘substance over form’ as an important characteristic of fi nancial statements. The required treatment of compound fi nancial instruments follows this approach. The form of the convertible bond is that of a liability, but in substance the instrument contains elements of both debt and equity, and both should be recognised. Another important characteristic is ‘faithful representation’ and the IASB argues that the required accounting treatment in IAS 32 of this type of fi nancial instrument is a more faithful representation.
(b) AX Group: Summary consolidated statement of fi nancial position as at 31 October 20X7
$’000 Ref to workingsASSETSNon-current assetsGoodwill 4,000PPE ($20,000 � $8,900 � $5,000 � $500 � $250 (W3)) 34,150Current assets ($34,500 � $9,500 � $4,700) 48,700
86,850EQUITY & LIABILITIESEquityCalled up share capital ($1) 20,000Equity component of bond issue 528Retained earnings 23,150
43,678Non-controlling interest 4,400Non-current liabilities (9,472 (W6) � 2,400 � 1,000) 12,872Current liabilities (18,000 � 5,000 � 2,700 � 400) 25,700
86,850

PREP
ARI
NG
FO
R TH
E EX
AM
INAT
ION
SOLUTIONS TO REVISION QUESTIONS F2538
Workings
1. Goodwill on acquisition
$’000Investment in CYCost of investment 8,000Acquired ($4,000 � $3,500) � 80% (6,000)Goodwill 2,000Less disposed of (500)
1,500 Investment in EZCost of investment 7,500Acquired ($3,000 � $1,500 � $500 FVA) � 100% (5,000)Goodwill 2,500
2. Adjustment to parent’s equity on disposal of 20% of shareholding
$’000FV of consideration received (4,000)Increase in NCI in net assets at disposal date (20% � $11m (W3)) 2,200 Adjustment to parent’s equity (1,800)
3. Net assets of CY at disposal date
$’000Share capital (4,000)Retained earnings at 31 October 20X7 6,500
10,500)
4. Consolidated retained earnings
$’000AX’s retained earnings 18,000Adjustment to parent’s equity on disposal of shareholding 1,800Share of CY’s post-acquisition profi t ($7,000 � $3,500) � 60% 2,100Share of EZ’s post-acquisition profi t ($3,000 � $1,500) � 100% 1,500Additional depreciation on FV adjustment (250)
23,150)
5. Non-controlling interest 40% � $11,000 �$4,400
6. Hybrid fi nancial instrument
$’000PV of capital element of bond issuePrincipal $10,000 � 0.816 (from tables) 8,160Interest ($10,000 � 5%) � 2.624 (from tables) 1,312Total to be recognised as a long-term liability 9,472Equity element (balancing fi gure) 528Total value of fi nancial instrument 10,000
Solution 24 (a) Holmes: cash fl ow statement for the year ended 30 September 20X9

PREPARIN
G FO
R THE EXA
MIN
ATION
539FINANCIAL MANAGEMENT
$’m $’mNet cash fl ow from operating activities (W1) 105Cash fl ow from investing activities Dividends received from associates (W5) 7 Investment income 6 Purchase of property, plant and equipment (W6) (8) Sale of property 100 Purchase of subsidiary (100 � 10) (90)
15Cash fl ow from fi nancing activities Capital element of fi nance lease rentals (W7) (25) Repayment of loan (90)
(115)Increase in cash and cash equivalents in period (W8) 5
Workings
1. Cash fl ow from operating activities
$’mProfi t before tax from group entities (150 � 50 � 10 other income) 110Exceptional item (10)Finance cost 50Depreciation 58Increase in inventory ($15 m � $30 m) 15Increase in receivables ($20 m � $25 m) 5Increase in payables ($11 m � $15 m) (4)Investment income (6)Interest payable (50)Dividends paid Holmes shareholders (25) Non-controlling interest (W3) (6)Tax paid (W4) (32)
105
2. Reconciliation of non-controlling interest
$’mProfi t for the year 10Increase due to acquisition of Watson 21Movement in statement of fi nancial position (25)Dividend for the year 6
3. Cash fl ow relating to tax
$’mCharge in income statement 35Movement in liability Current (2) Deferred (6)Arising on acquisition 5 Paid 32

PREP
ARI
NG
FO
R TH
E EX
AM
INAT
ION
SOLUTIONS TO REVISION QUESTIONS F2540
4. Dividends received from associates
$’mShare of profi t after tax 17Movement in investment (10)Dividend received 7
5. Purchase of property, plant and equipment
$’mMovement in assets Owned plant 30 Leased plant 20Fixtures –Acquisitions under fi nance leases (40)Acquired with Watson (60)Depreciation 58Purchased for cash 8
6. Capital element of fi nance lease rentals
$’mIncrease in liability Current 5 Non-current 10New debt (40)Capital repayments (25)
7. Increase in cash and cash
$’mCash in hand 5Bank overdraft 50Short-term investments (50)
5
(b) MemorandumTo: Managing directorFrom: Management accountantDate:Re: Cash fl ow statementsA cash fl ow statement is regarded as a key measure of performance. Even though it is often prepared from the other primary statements it presents information that is not readily available from the income statement and the statement of fi nancial position. A particularly important function of the statement is that it shows how the entity has accumulated cash and how that cash has been used. This enables the user to see the extent to which fi nancing and investment have been matched with each other.
Another key factor that makes the cash fl ow statement extremely useful is that the concept of ‘cash fl ow’ is well understood by users. Many users misunderstand the meaning of profi t as they do not fully appreciate the matching principle that is involved in arriving at profi t for the period. Cash fl ow, however, is something that is less open to misinterpretation. Therefore it has a key role to play in providing useful fi nancial reports.
Signed: Management accountant

PREPARIN
G FO
R THE EXA
MIN
ATION
541FINANCIAL MANAGEMENT
Solution 25AT Group: consolidated income statement for the year ended 31 March 20X7
$’000 Ref to workingRevenue 3,783 (1)Cost of sales (2,800) (3)Gross profi t 983Distribution costs (141.7) (4)Administrative expenses (473) (4)Interest received 2Loss on investment in fi nancial asset (4.2) (5)Finance costs (118.2) (6)Share of profi t of associate 6.9 (7)Profi t before tax 254.8Income tax expense (94) (8)Profi t for the period 160.8
Attributable to: $’000 Ref to workingEquity holders of the parent 141.1Non-controlling interest 19.7 (9)
160.8
Workings(W1) – Revenue
$’000AT 2,450BU 1,200CV (1�3 � 675) 225
3,875Less: Intra-group sales of inventories (80)Less: Intra-group sales of admin, services (12)
3,783
(W2) – Provision for unrealised profi t
Closing intra-group inventories � $80,000 � 25% � 20,000.Unrealised profi t � 20% � $20,000 � $4,000.
(W3) – Cost of sales
$’000AT 1,862BU 870CV (1�3 � 432) 144
2,876Add: provision for unrealised profi t (W2) 4Less: Intra-group sales of inventories (80)
2,800
(W4) – Distribution costs and administrative expenses
Distribution costs Administrative expenses$’000 $’000
AT 94 280BU 22 165CV (1�3 � 77)/(1�3 � 120) 25.7 40
141.7 485Less: Intra-group purchases of admin services – (12)
141.7 473

PREP
ARI
NG
FO
R TH
E EX
AM
INAT
ION
SOLUTIONS TO REVISION QUESTIONS F2542
(W5) – Loss on investment in fi nancial assetLoss on investment in EX: 4,000 shares at (1332¢- 1227¢) � $4,200.
(W6) – Finance costs
Y/e 31 March Principal b/fwd Effective interest @ 9% Interest charge C/fwd2005 950.0 85.5 (50) 985.520X6 985.5 88.7 (50) 1,024.520X7 1,024.5 92.2 (50) 1,066.42008 1,066.4 96.0 (50) 1,112.42009 1,112.4 100.1 (50) 1,162.5
The amount for inclusion in the income statement for the year ended 31 March 20X7 is $92.2 � interest of $26 on short term borrowings. Total � $118.2.
(W7) – Share of profi t of associateProfi t after tax � 3�12 � 35% � $79 � 3�12 � 35% � $6.9
(W8) – Income tax
$’000AT 40BU 50CV (1/3 � 12) 4
94
(W9) – Non-controlling interest
6 months to 30 September20X6
6 months to 31 March 20X7
Adjusted profi t of BU:
Profi t for the period, as stated 95 (4)91
Less: provision for unrealised profi t
Split 1:1 45.5 45.5Less: loss on fi nancial asset (4.2)
45.5 41.3
Minority share of profi t:
6 months to 30 September 20X6: 45.5 � 25%41.3 � 20%
� 11.46 months to 31 March 20X7: � 8.3
19.7
Solution 26
(a) Earnings per share for the year ended 31 December 20X4:
$ , ,
, ,. per share
3 676 000
2 800 000131 3� ¢
Earnings per share for the year ended 31 December 20X5:

PREPARIN
G FO
R THE EXA
MIN
ATION
543FINANCIAL MANAGEMENT
$2,460,
, ,. per share
000
2 850 0003� 86 ¢
(W1) Weighted average number of shares in issue
1012/ � 2,800,00 2,333,333
212/ � 3,100,000 516,6672,850,000
(b) ReportTo: InvestorFrom: Adviser
The fi nancial statements of the BZJ Group for the year ended 31 December 20X5
Financial performanceThe performance of the group has declined sharply. Revenue has fallen by 0.8% between 20X4 and 20X5. Gross, operating and pre-tax profi t margins are all substantially lower in 20X5 than in the previous year: gross profi t has fallen from 15.7% to 14.4%; operating profi t has fallen from 5.5% to 4.5%; pre-tax profi t margin has fallen from 4.7% to 3.2%. The fall in revenue is particularly striking, given the large amount of investment in non-current assets that has taken place. Margins may have been adversely affected by additional deprecia-tion charges arising because of the increase in non-current assets. It is also possible that the expansion into new markets and the new storage products will result in permanently lower margins. Return on equity (ROE) and return on total capital employed (ROTCE) have both dropped by signifi cant margins: ROE has fallen from 21.5% to 12.0%, and ROTCE has fallen from 15.3% to 8.5%. Investors will be disappointed with the signifi cant drop in the amount of dividend received. The dividend payout ratio is also substantially lower.
The amount of interest payable has increased by over $500,000 during the year, because of the large increase in borrowings intended, according to the chairman’s statement, to fund business growth. Interest cover has halved, but the group’s current levels of earnings cover the charge 3.7 times, which provides a reasonable margin of safety. However, it is worth noting that the average interest charge (taking interest payable as a percentage of long- and short-term borrowings) is less than 5% in 20X5. This may suggest that borrowings have reached their current level quite recently, and that the interest charge in the 20X6 fi nancial statements will be signifi cantly higher.
The analysis of fi nancial performance suggests that, with falling margins and rising interest, potential returns from the business are likely to be more volatile in future.
Financial positionA very large increase in non-current assets has taken place. The increase of nearly $20 mil-lion appears to be mostly accounted for by purchases of new assets, although a revaluation of $2 million has taken place during the fi nancial year. The investment in non-current assets has been fi nanced in part by an increase in long-term borrowings of $10 million, and also by an issue of share capital at a premium which raised $1.5 million in funds. Current liabilities have increased by around $7 million and the business has moved from a position of holding cash at the end of 20X4 to quite substantial short-term borrowings at the end of 20X5.

PREP
ARI
NG
FO
R TH
E EX
AM
INAT
ION
SOLUTIONS TO REVISION QUESTIONS F2544
Inventories have increased by almost $10 million, and the turnover period is much greater at 131.5 days than at the end of 20X4. It could be that the business is building up stocks of its new products; alternatively, it is possible that the new ranges have not sold as well as expected, in which case the build-up of inventories is a worrying sign. Receivables turnover has improved; this is the only element of working capital management that shows any sign of improvement.
The current ratio is probably adequate at its present level, but it, too, shows a signifi cant decline from the previous year.
Even before the current year’s expansion programme, gearing was at a high level. It has increased still further to the point where borrowings represent over 80% of equity. The business has no cash at the year end, and it may fi nd that it becomes diffi cult and expen-sive to obtain further loan capital. There is an urgent need to improve working capital management and, especially, to start turning over inventories.
Chairman’s commentsThe chairman refers to ‘growth in the business’. However, closer examination of the fi nancial statements shows that the growth is all in statement of fi nancial position items, especially inventories, trade and other payables and non-current assets. The increased investment in fi xed and working capital has not, by the 20X5 year end, started to yield any benefi ts in terms of improved performance; the non-current asset turnover ratio has declined sharply from 4.99 in 20X4 to 2.76 in 20X5. All the performance indicators derived from the income statement are in decline. It is possible that the expansion into new markets and products had not begun to yield benefi ts by the end of 20X5, but inves-tors and other stakeholders will expect the promised improvements to start to pay off in 20X6.
The chairman also refers to the successful issue of further ordinary shares only 2 months before the year end. This is, indeed, reassuring, as it suggests that investors are prepared to accept the high level of gearing, and that they are prepared to place confi dence in the directors’ strategies.
In summary, the business is in no immediate danger of failing, but the position could become critical if management’s current expansionary policies do not succeed.
Solution 27(a) Memorandum To: The board of Spreader
From: Chief accountantDate: 21 May 20X7
Subject: Financial performance of the Spreader group
Group revenue has risen by 4% on last year, but the cost of sales has increased by 13.6%, resulting in a reduction of gross profi t of 3.8%. Operating costs are 5.6% up on last year and, consequently, operating profi t is 15% down at $10 million. Analysed to business segments, this shows the following:
Total Spreader Asia Europe20X7 20X6 20X7 20X6 20X7 20X6 20X7 20X6
Operating profi t to external revenue, % 20.0 24.6 23.0 34.0 16.6 16.0 21.4 21.7ROCE% 24.0 30.6 20.0 44.0 25.0 24.0 30.0 25.0

PREPARIN
G FO
R THE EXA
MIN
ATION
545FINANCIAL MANAGEMENT
Spreader revenue has dropped by 25% ($5 million) but this has been more than replaced by increased revenue in Asia and Europe. More inter-segment sales in Asia have compensated for a reduction in Spreader sales within the group. Segment operat-ing profi t in Spreader has fallen by 50%, but in Asia and Europe it has increased by 25% and 20% respectively. Common costs have increased by 25% this year.
The fall in group profi t is infl uenced by two major factors:
(i) Revenue lost by Spreader has been replaced by less profi table sales in Asia and Europe.
(ii) The profi tability of sales by Spreader (26% of total revenue) has fallen signifi cantly.
During the year, investment has been concentrated on Spreader (up by $1.5 million or 11%) and Asia (up by $1 million or 20%).
Investment has been targeted on Spreader where sales are falling, and Asia, where the profi t margin is smallest. The ROCE on activity by Spreader shows a signifi cant fall. The funds to fi nance this investment are adequately covered by retained profi t, but interest has increased by 11% over last year.
Overall, net profi t before tax is down by 17% and the tax charge is reduced to refl ect lower profi ts and tax allowances on the new investment. Despite the fall in profi t, the payout ratio has increased from 43% to 48% with a consequent impact on retained profi t.
(b) Geographical segmental information should be interpreted with caution since eco-nomic conditions, terms of trade and levels of competition are not the same across the world. Transfer pricing decisions may also infl uence the profi tability of inter-segment sales. The reliability of segmental analysis will be further limited by the fact that con-siderable common costs are not allocated, and there may be a defect in the logic on which geographical segments are identifi ed.
Signed: Chief accountant
Solution 28To: Members of the Lending CommitteeFrom: Accounting AdviserSubject: TYD’s fi nancial statements for the year ended 30 September 20X6
(i) Treatment of two signifi cant items in TYD’s fi nancial statementsThe principle at issue in the case of the fi rst transaction is that of ‘substance over
form’. While there is currently no IFRS that deals specifi cally with substance over form, the principle is recognised as contributing to the reliability of fi nancial state-ments in the IASB’s Framework statement. Transactions and other events should be accounted for and presented in accordance with their substance and economic real-ity, and not merely their legal form. The legal form of this transaction, a sale and repurchase agreement, is that of a contract for sale of inventories. However, the ‘sale’ does not meet the criteria for treatment as a sale set out in IAS 18 Revenue. In sub-stance, the transaction is a secured loan of $85,000 from HPS to TYD. The difference between the amount advanced at 30 September 20X6 ($85,000) and the amount for which the inventories will be repurchased after two years ($95,000) represents, effec-tively, the interest payable on the loan. The existence of the option, exercisable by the bank, to ensure repurchase after two years by TYD is a persuasive indicator of the true substance of the transaction. The facts that the inventories remain on TYD’s premises,

PREP
ARI
NG
FO
R TH
E EX
AM
INAT
ION
SOLUTIONS TO REVISION QUESTIONS F2546
and that TYD bears the cost of insuring them, provide further supporting evidence that TYD continues to bear the risks and rewards of ownership of the inventories. The correct accounting treatment of this transaction is to treat it as a long-term loan.
The question of the transfer of the risks and rewards of ownership is also an issue in determining the true nature of the disposals of inventories on a sale or return basis. As noted above IAS 18 Revenue states that revenue can be recognised provided that a set of conditions have been satisfi ed. One of those conditions is that the risks and rewards of ownership have been transferred to the buyer. Another is that the selling entity should retain no effective control over the goods. Where the option is open to buyers to return the goods, it is likely that neither of these important conditions has been fulfi lled, and that the sales cannot be recognised until and unless there is no pos-sibility of the goods being returned.
(ii) Adjustment of TYD’s fi nancial statementsBoth of these transactions are examples of creative accounting techniques that
would not be permissible under IFRS regulation. In order to be able to fairly assess the loan application, it is necessary to adjust the fi nancial statements, as follows:
TYD: Income statement for the year ended 30 September 20X6
Adjustment Trans ref Adjusted$’000 $’000 $’000
Revenue 600 �85 1 475(W1) � 40 2
Cost of sales 450 (W1) � 32 2 333�85 1
Gross profi t 150 142 Expenses 63 63 Finance costs 17 17Profi t before tax 70 62 Income tax expense 25 25Profi t for the period 45 (W1) � 8 2 37
TYD: Statement of fi nancial position at 30 September 20X6
Adjustment Trans ref Adjusted$’000 $’000 $’000 $’000
ASSETSNon-current assets: Property, plant and equipment 527 527Current assets: Inventories 95 (W1) � 32 2 212
� 85 1 Trade receivables 72 (W1) � 40 2 32 Cash 6 6
173700 777

PREPARIN
G FO
R THE EXA
MIN
ATION
547FINANCIAL MANAGEMENT
EQUITY AND LIABILITIESEquity: Called up share capital 100 100 Retained earnings 245 (W1) � 8 2 237
345Non-current liabilities: Long-term borrowings 180 �85 1 265Current liabilities: Trade and other payables 95 95 Bank overdraft 80 80
175700 777
Workings(W1) Sale or return items
40% of the sales cannot be recognised: 40% � $100,000. Remove from trade receiva-bles and from sales.
The related cost of sales fi gure is $40,000 � 80% (that is, deducting profi t mar-gin) � $32,000. Remove from cost of sales and add to inventories in the statement of fi nancial position.
The net effect on profi t is to remove $8,000.
Examiner’s note:
The income statement and statement of fi nancial position have been adjusted to show the impact of the adjustments; however, there are many other valid ways of setting out the adjustments, for example, using journal entries, that might be quicker under exam conditions. Credit will be given for correct understanding of the adjustments, and not for a particular way of setting them out.
(iii) Key ratio calculations and analysisThe key ratio calculations are shown in the following table:
Before adjustment After adjustment
Gearing180 80
180 80 345100
�
� ��
( )43.0% 265 80
265 80 337100
�
� ��
( )50.6%
Current ratio173
1750.99:1 ( )212 32 6
175
� � 1.43:1
Quick ratio( )72 6
175
� 0.45:1 ( )32 6
175
� 0.22:1
Profi t margin70
600100� 11.7% 62
475100× 13.1%

PREP
ARI
NG
FO
R TH
E EX
AM
INAT
ION
SOLUTIONS TO REVISION QUESTIONS F2548
It is clear from a very quick examination of the fi nancial statements that TYD is quite highly geared. The gearing ratio before making any adjustments is 43%, close to the point where the application is likely to be rejected without discussion. After adjustment, gearing is at the unacceptably high level (for us) of 50.6%.
Although the current ratio improves substantially after adjustment, the already low quick ratio worsens. Also, it should be noted that the uplift in current assets relates to inventories which, after adjusting the fi nancial statements, amount to 63% of cost of sales. It is quite likely that the inventories could not be rapidly realised in case of default, and so for our purposes, the quick ratio is likely to be a more useful guide.
The profi t margin improves after adjustment. However, all other things being equal, it would be due to deteriorate in 20X7 and 20X8 because of the additional interest charge arising from the sale and repurchase agreement.
Taking these various points into consideration, the appropriate course of action is likely to be to reject TYD’s application for loan fi nance.
Solution 29 (a) (i) DPC’s summary projected fi nancial statements to include the acquisition of an
associate interest in PPS:
Summary projected income statement for the year ended 31 December 20X8
Projected:20X8$’000
Revenue 60,300All expenses including income tax (55,300)Share of profi t of associate (W1) 280Profi t for the period attributable to equity holders 5,280
Summary projected statement of fi nancial position at 31 December 20X8
Projected:20X8$’000
Non-current assets 50,400Investment in associate (W2) 3,780Current assets (82,000 � 1,000) 81,000
135,180Equity (W3) 31,680Long-term liabilities (10,000 � 2,500) 12,500Current liabilities 81,000
135,180

PREPARIN
G FO
R THE EXA
MIN
ATION
549FINANCIAL MANAGEMENT
(ii) DPC’s summary projected fi nancial statements to include the acquisition of a sub-sidiary interest in PPS:
Summary projected income statement for the year ended 31 December 20X8
Projected:20X8$’000
Revenue (60,300 � 10,200) 70,500All expenses including income tax (55,300 � 9,500) (64,800)Non-controlling interest in PPS (700 � 40%) (280)Profi t for the period attributable to equity holders 5,420
Summary projected statement of fi nancial position at 31 December 20X8
Projected:20X8
$’000Non-current assets (50,400 � 9,800 � 4,020 (W4) 64,220Current assets (82,000 � 16,000 � 3,000) 95,000
159,220Equity (W5) 31,820Non-controlling interest in PPS (4,000 � 40%) 1,600Long-term liabilities (10,000 � 9,300 � 3,000) 22,300Current liabilities (91,000 � 12,500) 103,500
159,220
Workings1. Share of profi ts of associate: $700,000 � 40% � $280,0002. Investment in associate:
$’000Investment at cost 3,500Share of post-acquisition profi ts 280
3,780
3. Equity
$’000As given in the question 31,400Share of post-acquisition profi ts in associate 280
31,680
4. Goodwill on acquisition
$’000Investment at cost 6,000Share of net assets acquired:([100 � 3,200] � 60%) 1,980Goodwill on acquisition 4,020
5. Equity
$’000As given in the question 31,400Share of post-acquisition profi ts in subsidiary 420
31,820

PREP
ARI
NG
FO
R TH
E EX
AM
INAT
ION
SOLUTIONS TO REVISION QUESTIONS F2550
(b) DPC existing DPC � PPS associate
DPC � PPSsubsidiary
EPS 5,000/10,000 50¢ 5,280/10,000 52.8¢ 5,420/10,000 54.2¢Gearing 10,000/31,400
� 10031.8% 12,500/31,680
� 10039.5% 22,300/33,420
� 10066.7%
NCAturnover
60,300/50,400 1.20 Same 1.20 70,500/64,220 1.10
(d) Earnings per share would be improved under either acquisition scenario. Non-current asset turnover would be reduced if the investment in a subsidiary interest were to be acquired in PPS. However, it is the gearing ratio that shows the biggest potential dif-ferences. The gearing ratio if PPS were acquired as an associate worsens because of the additional borrowing of $2.5 million required to acquire the shareholding. If a subsidi-ary interest were to be purchased not only is there additional borrowing of $3 million to take into account in the gearing calculation, but, much more signifi cantly, PPS’s own borrowings have to be included in long-term liabilities. PPS is highly geared and so the impact on consolidation is very substantial. If an associate interest were acquired PPS’s borrowing would be kept off statement of fi nancial position.
Solution 30ReportTakeover targets: W, Y and Z
(a) The three potential targets are similar in size, each producing revenue at the level of approximately 10% of ABC’s revenue. In respect of performance, Z appears superior to the others: its gross profi t margin and operating profi t margins are signifi cantly higher than those of W and Y. Y’s operating profi t margin is disappointing at 4.7%; however, there may be scope to improve control over its operating expenses. Z’s return on capital employed is also impressive, at almost double that of entity Y, and it is better than that of ABC itself. However, it is relevant to note that the income tax rate in Zeelandia is signifi cantly higher than that of the other countries, and this effect offsets some of its advantages.
The level of gearing in ABC itself is negligible with debt constituting only around 5% of equity. Gearing is also at a low level in Y and Z, but entity W is relatively more highly geared (debt constitutes 45.6% of equity). However, after takeover ABC’s management would be able to control the level of gearing and to repay any long-term debt if it was felt necessary to do so. The economic environments in which the entities operate are, apparently, rather different from each other. As well as the differences in income tax rates already noted, interest rates vary from 6% in Winlandia to 10% in Zeelandia.
Working capital management varies between the entities. For ABC, the turnover in days for inventories, receivables and payables all lie in the mid-40s. Receivables turno-ver across the four entities is broadly similar, but there are some signifi cant differences in respect of inventories and payables. Entity W appears to hold inventories for much longer than the other entities, and there may be problems with slow-moving or obso-lete items. Payables turnover, on the other hand, is relatively fast in entity W, but at 73 days entity Z takes a long time to meet its payables obligations. This may be as a result of poor management, or deliberate policy. ABC has a relatively comfortable current ratio of 1.4:1, but the comparable ratio in all three target entities is less impressive.

PREPARIN
G FO
R THE EXA
MIN
ATION
551FINANCIAL MANAGEMENT
The P/E ratios of the three targets and of ABC itself lie within a fairly narrow band. W’s P/E is the lowest at 12.6; this could indicate that the share is relatively undervalued, that the most recent earnings fi gure was better than expected and the share price has not yet been adjusted upwards to refl ect this, or that the investment is perceived as relatively risky in the market.
On the basis of the preliminary analysis, entity Z appears superior to the others in several aspects of performance. However, a great deal of further analysis will be required before reaching a conclusion, and, as noted below, there are many limitations in the analysis.
(b) There are several general limitations to any inter-fi rm comparisons. These limitations become even more important where international comparisons are made. The limita-tions include the following:
Accounting Standards and policies: in this case, entity Y prepares its fi nancial state-ments in accordance with Yolandian GAAP. This may be very different from the International Standards that the other entities comply with. Even where the same or similar standards are adopted there is often scope for considerable variation in the choice of policies. For example, an entity can choose between valuing property, plant and equipment at depreciated cost, or at valuation. The policy selected by manage-ment may have a signifi cant effect on the fi nancial statements and upon accounting ratios such as return on capital employed.
Accounting reference date: there is a gap of 9 months between the accounting refer-ence date of entities Y and Z on the one hand, and the accounting reference date of ABC on the other hand. A great deal of change can take place in a period of several months, both within the economy as a whole and in the activities of a single entity. The fi gures of Y and Z are, relatively speaking, out of date, and the comparison may be at least partially invalidated because of this effect.
Size of entities: the three target entities are of similar size, and so comparison between them is likely to have some validity. However, ABC is approximately ten times the size of each of the targets. Its expenses, for example, may be subject to economies of scale.
Differences between activities: all of the four entities being compared have the same principal activity. However, it is rarely, if ever, the case that entities are engaged in precisely the same sphere of activity, and there may be relatively minor supplementary activities that distort their performance. For example, one entity may derive part of its income through the hire or leasing of equipment. It is important to examine the details of entities’ activities carefully in order to be sure that they are comparable with those of other entities.
Single period comparisons: there is always a risk that the results of a single period are not representative of the underlying trends within the business. Therefore, it is better, wherever possible, to examine the performance and position at several different dates.
Special problems of international comparison: where entities in different countries are being compared, it is even more important to be cautious about the value of the comparisons and conclusions drawn. National economies often experience cycles of economic growth and decline. These cyclical differences may have a signifi cant effect upon the performance of entities. The entities in this case are, apparently, subject to different tax regimes. Such differences may very well be important factors in making decisions about investment. The size and nature of the stock markets may well differ considerably between different regimes. In a small, illiquid market, for example, share prices may be generally lower, refl ecting the lack of liquidity in the investment. Lower prices would, of course, affect the P/E ratio, which is regarded as important.

This page intentionally left blank

At the time of publication there are no exam Q & As available for the 2010 syllabus. However, the latest specimen exam papers are available on the CIMA website.Actual exam Q & As will be available free of charge to CIMA students on the CIMA website from summer 2010 onwards.
Exam Q & As
553

This page intentionally left blank

Index

This page intentionally left blank

557
AAccounting:
creative accounting, 390–1economic change, 439–40employee benefi ts, 269–70environmental entity impacts, 322, 419, 426for fi nancial instruments, 235foreign currency translations, 177–8human resource issues, 390, 429–31investments, 9, 90–3
in associates, 10in joint ventures, 17revision questions, 19–20simple investments, 9–10in subsidiaries, 11–17
joint ventures, 87policies, 39–40, 323ratios, 322–39scandals, 419, 420, 468
Accounting period:acquisition, 134–6income statements, 26–7
Accounting Standards Board (ASB), 422Acquisitions:
accounting period, 134–6associates, 144contingent liabilities, 138date, 136dividends, 136fair value, 136–41goodwill, 14piecemeal, 141–4revision questions, 157subsidiaries, 142, 144sub-subsidiaries, 199–200
Activity ratios, 325
Actuarial gains/losses, 270Adjustments:
accounting policy changes, 68–9consolidated balance sheet, 39–40fair value, 40–2
Agencies, government, 321Aggressive accounting see Creative accountingAltering transaction timing, 390–1Amortisation:
EBITDA, 324Analysis:
business understanding, 321capital structures, 330–1cash-fl ow statements, 336–8concepts, 319cost of sales, 323fi nancial obligations, 393–4fi nancial statements, 319–22for investors, 331–2segment analysis, 381–4user identifi cation, 320–1
Annual reports, 422Appraisal, 297–8Artifi cial smoothing, 391ASB see Accounting Standards Board (ASB)Asset turnover, 325Assets:
available-for-sale, 242, 244defi nition, 223, 431derecognition, 223–4fair value, 137–8fi xed, 325intangible, 16, 137jointly controlled, 87recognition, 223subsequent measurement, 244
Index

FINANCIAL MANAGEMENT F2558
IND
EX Associates and joint ventures, 81accounting for, 82–90alternative treatment, 90defi nition, 81fair value and accounting policies, 93IAS 28, 82–6IAS 31, 86–90indirect investment, 205–7intra-group trading, 85–6, 90revision questions, 95–9
Atrill, Peter, 430, 438Available-for-sale fi nancial assets, 242, 247
BBacklog depreciation, 297Bank balance, 327Bargain purchases, 29BITC see Business in the Community (BITC)Bolton, Lesley, 446–7Bonus fraction calculation, 360–1Bonus issue, 359–60Business in the Community (BITC), 435–6Business reorganisations, 151–6
future developments, 151–2IFRS, 14intra-group reconstructions, 152–6
Business Review, 422–3Business understanding analysis, 321
CCapital:
allowances, 426changing price levels environment, 293environmental accounting, 426provision, 427–8structure analysis, 330–1
Cash fl ow hedges, 251Cash-fl ow statements:
analysis, 336–8groups, 108–18
Cash-settled share-based payment transactions, 277
CCA see Current cost accounting (CCA)CERES see Coalition for Environmentally
Responsible Economies (CERES)Changes in equity statement see Statement of
changes in equity (SOCIE)Changes without resources change, shares, 361Changing price levels environment, 293
backlog depreciation, 297capital and income, 294–6current cost accounting, 299–303
current purchasing power, 303–6net current replacement cost, 296–7‘real terms’ system, 306–7realisable (exit) value accounting, 298–9replacement cost (entry value) accounting,
298revision questions, 311–12
Classifi cation:accounting systems, 425creative accounting, 390–3fi nancial instruments, 237legal systems, 466
Climate change levies, 426Coalition for Environmentally Responsible
Economies (CERES), 432Common size analysis, 377, 378, 380–1Comparability, 385–7
fi nancial statements, 385international harmonization, 466Operating and Financial Review, 456
Competition, 439Complex group structures:
goodwill, 14joint ventures, 205–7mixed groups, 203–4revision questions, 209–12statements of change in equity, 202sub-subsidiaries, accounting for, 199–203
Comprehensive income, statement of, 60Conditions and accounting policies, 253Confi dence boosting, shareholders, 392Consideration, fair value, 137Consignment stock, 225–6Consolidated accounts, 199–202Consolidated fi nancial statements, 12Consolidated income statement:
accounting policy changes, 39–40adjustments, 68–9basic principles, 61–3comprehensive income and changes in
equity, 59–69fair value, 68–9intra-group trading, 65–8investments in preference shares/loans,
63–5revision questions, 71–4
Consolidated statement of cash fl ows, 107for groups, 108–18IAS 7, 107–8revision questions, 119–24
Consolidated statement of fi nancial position, 25–43

559FINANCIAL MANAGEMENT
IND
EXaccounting policy, 39–40applying principles of consolidation, 25bargain purchases, 29concepts and principles, 25
consolidated fi nancial statements preparation, 25–7
control, principle of, 25date of acquisition:
fair value adjustment, 40–2goodwill, 28
IFRS 3 Business Combinations, 14negative goodwill, 29
group companies assets:unrealised profi ts on, 35–9
intra-group balances, elimination of, 32–4loans and preference shares, 34
intra-group trading:in non-current assets, 38–9
non-controlling interests, 29accounting for, 30–2
Consolidation:cash-fl ow statements, 107equity method, 85–6foreign operations, 180proportionate, 87
Contingencies, 393–4Contingent consideration, 15Contingent liabilities, 17, 138, 393, 427, 464Contingent settlement, 240Control, principle of, 11–12Convertible securities, 239–40The Corporate Report, 429Corporate Responsibility Index, 435–6, 437–8Corporate social responsibility, 420–1Corporate spin, 436–7Cost of sales adjustment (COSA), 299–300Cost reduction, 86CPP see Current purchasing power (CPP)
accountingCreative accounting, 390–3
accountants’ methods, 390–2motivation, 392–3taxation avoidance, 392
Credit risk, 253Creditors, 320Culture, 440Currency risk, 253Current cost accounting (CCA), 299–303Current purchasing power (CPP) accounting,
303–6Current service cost, 270Customers, 321
DData source identifi cation, 322Date of acquisition:
fair value adjustment, 40–2Date of acquisition, sub-subsidiaries, 202–3Debentures, 263Debt:
characteristics, 238perpetual, 238–9redeemable, 393
Defi ned benefi t plans, 270, 271–4Defi ned contribution plans, 270, 271Demands for more information, 421Depreciation:
adjustment, 300backlog depreciation, 297
Derecognition, 223–4Derivatives, 247Diluted earnings per share, 362–5Diluted earnings per share ratio, 362Diluted potential ordinary shares, 364–5Disclosure:
earnings per share, 365non-fi nancial, 388social issues, 430
Disposals, accounting for:controlling interest, 145–50full and partial disposals, 145–50interim dividends, 150–1
Dividend in specie, 155Dividends, 108
disposals, 150–1interim, 150–1related ratios, 332special, 361–2in specie, 155subsidiaries, 136
EEarn-out arrangements, 394Earnings before interest, tax, depreciation and
amortisation (EBITDA), 324Earnings management see Creative
accountingEarnings per share (EPS), 357
arriving at share number, 359basics, 359–62diluted, 362–5disclosure, 365revision questions, 367–9
EBITDA (earnings before interest, tax, depreciation and amortisation), 324

FINANCIAL MANAGEMENT F2560
IND
EX Employee benefi ts, 269amendment to IAS 19, in 2004, 274–5defi nitions, 270–1IAS 19, 269–71IFRS 2 share-based payment, 275–6post-employment benefi ts, 271–4revision questions, 281–3share-based payments, 277–9
Employees, 321Environment of price changes, 291–308Environment Programme, United Nations,
432Environmental accounting:
additional costs, 426–7aspects, 426–9contingent liabilities, 428disclosures, 428–9entity accounting impacts, 426–8fi nancial reporting, 426information, 426–8measurement, 426–8non-fi nancial reporting, 428–9provisions, 427–8taxation, 426
Equipment and plant, 16Equity, 238Equity accounted investments, 110Equity accounting, 82–5Equity instrument, defi nition of, 236Equity method of consolidation, 81Equity statements see Statement of changes in
equity (SOCIE)Equity-settled share-based payment
transactions, 277European Union harmonization, 467The examination:
format, 486–7paper structure, 486–7planning, 485preparation, 485–8revision questions, 489–517revision techniques, 485tips, 486, 487–188
Exclusions:liabilities, 391–2
Existing traditions, 291Exit values, 298Exposure drafts, 431, 461, 475External reporting, 419
environmental accounting, 426–9Global Reporting Initiative (GRI), 432–3
human resource issues, 429–31increasing, 421–5readings, 435–47revision questions, 449–53social accounting and reporting, 425–6
FF2 candidates, advice and guidance for, 4–6F2 Financial Management, 3–6
advice and guidance for F2 candidates, 4–6International Financial Reporting Standard, 4
Factoring receivables, 226–7Fair value, 68–9, 253
acquisition accounting, 14–17, 136–41adjustments, 138–41assets, 137associates and joint ventures, 93of consideration, 137consolidated income statement, 68contingent liabilities, 17general principles, 15hedges, 250–1intangible assets, 137intangible assets, 16inventories, 16investment, 137liabilities, 16, 137, 138listed investments, 16property, plant and equipment, 16, 137provisions for restructuring, 17through profi t or loss, 242
Financial Accounting Standards Board (FASB), 468, 469, 474
Financial assets, 224, 241, 242, 244Financial instruments:
accounting standards, 235–6contingent settlement, 240–1convertible, 362–3defi nitions, 236derivatives, 247dividends, 136hedging, 249–52IAS 32 fi nancial instruments, 236–41IAS 39 recognition and measurement,
241–9derivatives, 247–9fi nancial assets, subsequent measurement,
244fi nancial liabilities, 245–6impairment, 246–7initial measurement, 243–4

561FINANCIAL MANAGEMENT
IND
EXIFRS 7 disclosure, 252–3revision questions, 255–60
Financial liabilities, 224, 243, 245–6Financial obligations:
analysis, 393contingencies, 393–4special problems, 393–4
Financial position ratios, 333–6Financial reporting:
environmental accounting, 426hyperinfl ationary economies, 308infl uences on, 426information limitations, 385international issues, 465–70international standard-setting:
International Accounting Standards Committee (IASC), 466–7
price changes environment, 291regulatory systems, 387revision questions, 477–8
Financial statements, analysis:capital structures, 330–1cash fl ow statements, 336–8common size analysis, 380–1comparability, 385–7earnings per Share, 4horizontal analysis, 378–9interpretation, 319–22liquidity ratio, 327–30objectives, 319performance ratio, 322–7revision questions, 341–5segment analysis, 381
IFRS 8 operating segments, 382–4valuation ratios and analysis for investor,
331–6verifi cation, 387vertical analysis, 379–80
Financial statements, interpretation of:common size analysis, 380–1creative accounting, 390–3fi nancial obligations, 393–4fi nancial reporting information, limitations
of, 385–8horizontal analysis, 378–9ratio analysis, 388–9revision questions, 395–403segment analysis, 381–4
IFRS 8 operating segments, 382–4verifi cation, 387vertical analysis, 379–80
Fisher, Liz, 435Foreign currency transactions:
foreign operations, translating, 180–5hedging, 185IAS 21, 177–9revision questions, 187–90single transaction in, 179–80
Foreign operation, 178consolidation, 180, 186defi nition, 178goodwill, 180–4statements of change in equity, 189translating, 180
Foreign subsidiaries, 115–18Format and style:
the examination, 485–8Forward contracts, 248‘Fresh start’ accounting, 152Friedman, Milton, 421Full disposal, 145Full market price issue, 359Functional currency, 178Funding plans, 270Future developments, IAS, 423Future developments, IASB, 151–2
GGAAP see US GAAPGains/losses:
actuarial, 286personal, 392
Gearing:adjustment, 300manipulation, 391ratios calculation, 331
General public, 321Global Reporting Initiative (GRI),
432–3Goodwill:
amortisation, 324cash-fl ow statements, 336–8complex group structures, 199–207foreign operations, 180–5IFRS 3 Business Combinations, 14IFRS 3 transitional provisions, 14mixed groups, 203–4negative goodwill, 29on acquisition, 14, 83
Government, 321GRI see Global Reporting Initiative (GRI)Gross profi t margin, 323

FINANCIAL MANAGEMENT F2562
IND
EX Group structures, changes to, 133accounting period, 134–6business reorganisations, 151–6disposals in period, 145–51fair value, in acquisition accounting, 136–41piecemeal acquisition, 141–4revision questions, 157–64
Groups:cash-fl ow statements, 336–8complex structures, 199–207consolidated income statement, 59defi nition, 199equity-accounted investments, 110foreign subsidiaries, 115–17intra-group issues, 152–6investments:
acquired during year, 110–12disposed of during year, 112–15quity-accounted, 110
new parents, 124parent same as shareholders, 155–6profi ts, 35share transfers, 155–6unrealised profi ts on assets bought from, 35see also Intra-group; Parent
HHarmonisation, 466, 473Hedged item, 185, 249Hedging, 249–52
cash fl ow hedges, 251designation, 252effectiveness, 249exposure drafts, 250fair value hedges, 250–1instruments, defi nition, 185relationships, 249–50
Held-to-maturity investments, 242, 244Highest-ranked elements, intellectual capital, 444Historical cost accounting defects, 291–3Horizontal analysis, 378–9Human capital management, 431, 446Human resource issues, 429–31Hybrid instruments, 240–1Hyperinfl ationary economies, 291, 308
IIAS 1 Presentation of Financial Statements, 469,
481, 532IAS 18 Revenue and IAS 39 Financial
Instruments:Recognition and Measurement, 220
IAS 27 Consolidated and Separate Financial Statements, 11, 39, 180
IAS 28 Investments in Associates, 180IAS 31 in joint ventures, 86
accounting for, 87jointly controlled entities, 87
IASB see International Accounting Standards Board (IASB)
IASC Foundation see International Accounting Standards Committee (IASC) Foundation
IASs see International Accounting Standards (IASs)
IC see Intellectual capital (IC)ICAEW see Institute of Chartered Accountants
in England and Wales (ICAEW), Valuing Human Capital
Identifi cation of data sources, 322IFRS 2 share-based payment, 275–6IFRS 3 Business Combinations, 14, 136–7,
151, 180IFRS 5 Disposals of Non-current Assets
Held for Sale and Discontinued Operations, 385
IFRS 5 Non-current Assets Held for Sale and Discontinued Operations, 13, 469
IFRS 7 fi nancial instruments, disclosure, 252–3
IFRS 8 Operating Segments, 323, 469, 470
IFRSs see International Financial Reporting Standards (IFRSs)
Impairment, 246–7Income:
defi nition, 221, 294measurement, 294–6
Income statements, presentation of, 60Infl ation, 292Information:
demands for more, 421environmental accounting, 426limitation, 385–8
Initial classifi cation, assets/liabilities, 241–3Institute of Chartered Accountants in England
and Wales (ICAEW), Valuing Human Capital, 447
Intangible assets, 16, 137see also Assets
Intellectual assets, 438–42measurement, 440types, 440value based approach, 440–1

563FINANCIAL MANAGEMENT
IND
EXIntellectual capital (IC)
components, 443defi nition, 430highest-ranked elements, 444index approach, 442reporting, 385see also Intellectual assets
Interest, 86–90, 108Interest cost, 270Interest rate risk, 253Interim dividends, 150–1International Accounting Standards (IASs)
currently in force:IAS 1 Presentation of Financial Statements,
469, 481, 532IAS 6 (replaced by IAS, 15), 293IAS 7 Cash-fl ow Statements, 107–8, 336IAS 14 Segment Reporting, 382IAS 15 (withdrawn), 293IAS 18 Revenue, 221–2IAS 19 Employee Benefi ts, 269–71IAS 21 Effects of Changes in Foreign
Exchange Rates, 177–9IAS 28 Accounting for Investments in
Associates, 82–6IAS 29 Financial Reporting in
Hyperinfl ationary Economies, 291, 308
IAS 31 Interests in Joint Ventures, 86–90
IAS 32 Financial Instruments: Disclosures and Presentation, 236–41
classifi cation, 237disclosure requirements, 252–3hybrid instruments, 240–1
IAS 33 Earnings per share, 357, 388IAS 37 Provisions, Contingent Liabilities
and Contingent Assets, 17, 391, 393, 427
IAS 39 Intangible Assets, 244, 247, 249IAS 40 Investment property, 391
International Accounting Standards Board (IASB), 152, 275, 467, 474
framework for the preparation and presentation of fi nancial statements, 221, 292, 293, 385, 388, 420, 431
objectives, 467International Accounting Standards
Committee (IASC) Foundation, 466–7
replaced, 293
see also International Accounting Standards Board (IASB)
International Financial Reporting Standards (IFRSs), 4, 467, 468–9, 470, 473
FRS 5 Non-current Assets Held for Sale and Discontinued Operations, 13
IFRS 2 share-based payment, 275–6IFRS 3 Business Combinations, 14IFRS 5 Disposals of Non-current Assets
Held for Sale and Discontinued Operations, 13, 385, 469, 481
International Organisation of Securities Commissions (IOSCO), 466
Interpretation:accounting ratios, 319–39concepts, 319fi nancial statements, 319–20redeemable debt, 393
Intra-group:balances, 32–3dividends/interest, 63–4loans and preference share, 34reconstructions, 152–6trading, 38–9, 65–8, 85–6, 90see also Groups
Inventory fair value, 16, 137Inventory turnover, 325Investments:
accounting for, 9–10acquired during the year, 110–12in associates, 10debentures, 257disposed during the year, 112–15equity-accounted, 110fair value, 16, 137groups, 110held-to-maturity, 242indirect, 205–7joint ventures, 17listed, 16, 137partial disposals, 145preference shares/loans, 63–5shares, 63in subsidiaries, 11–17
Investors:analysis for, 331–6present/potential, 320valuation ratios, 331–6
IOSCO see International Organisation of Securities Commissions (IOSCO)

FINANCIAL MANAGEMENT F2564
IND
EX Issues:arriving at share number, 359bonus issue, 359–60full market price, 359rights issue, 360–1
JJoint ventures, 87, 147, 205–7Jointly controlled assets, 87Jointly controlled entities, 87
accounting for, 87–9Jointly controlled operations, 87
LLandfi ll taxes, 426Language differences, 436Legal requirement, Operating and Financial
Review, 422Lenders, 320Leverage ratio see Gearing, ratios calculationLiabilities:
classifi cation, 241–3defi nition, 223derecognition, 223–4exclusion, 391–2fair value, 137recognition, 223
Limitations:accounting ratio analysis, 388–9fi nancial reporting information, 385–8ratio analysis, 388–9
Liquidity ratios, 327–30Liquidity risk, 253Listed investments, 16, 137Loan asset transfers, 227Loans and receivables, 242Loans, consolidated income statement, 63–5Long-term debt, 331Losses see Gains/losses; Statement of changes in
equity (SOCIE)
MMaintenance of fi nancial capital, 295Maintenance of physical capital, 295Market expectation managing, 392Market risk, 253Measurement:
balance sheet gearing, 331capital, 294–6capital structures, 330–1environmental accounting, 426
fi nancial instruments, 241initial measurement, 243–4
income, 294–6intellectual assets, 438performance, 322–7subsequent, 244
Mixed groups, 203–4Monetary assets and liabilities, 16, 137Monetary working capital adjustment
(MWCA), 300Money fi nancial capital maintenance, 295Motivation, creative accounting, 392–3MWCA see Monetary working capital
adjustment (MWCA)
NNational law confl icts, 239Negative goodwill, 29Net current replacement cost, 296–7Net profi t:
defi nitions, 358shareholders, 358
Net profi t margin, 324New parents, groups, 154New York Times Magazine, 421Non-controlling interests, 108, 200,
202, 203accounting for, 30–2cash-fl ow statements, 108–9consolidated balance sheet, 29–30complex groups, 199foreign operations, 180–5partial disposals, 145piecemeal acquisitions, 141–4subsidiaries, 108
Non-equity shares, 358Non-fi nancial:
disclosures, 428–9environmental reporting, 430information provision, 388
Non-redeemable preference shares, 239
OObjective-test:
revision questions, 449–53solutions, 455–61
OFR see Operating and Financial Review (OFR)
Operating and Financial Review (ORF), 422, 455–6
advantages/drawbacks, 424

565FINANCIAL MANAGEMENT
IND
EXguidance, 422increasing reporting scope, 421–2international relevance, 423–4principles, 423–4reliability, 389summary, 433
Operating profi t margin, 323–4Options, 248
defi nitions, 238, 248shares, 238
Ordinary shares, 358, 361Outfl ows, cash statements, 108
PParent, 11–12, 26Partial disposal, 145Past service cost, 271Payables days, 328Pension plans, 60, 281, 499People see Human capital management;
Human resource issuesPerformance:
capital structures, 330–1ratios, 322–7
Perpetual debt, 238–9Personal gains, 392Piecemeal acquisitions, 141–4
interest, controlling, 144stake increases, 142
Plan assets, 270Plant and equipment, 16, 137Policy changes, consolidated income statement,
59Post-employment benefi ts, 270
defi ned benefi t plans, 270, 271–4defi ned contribution plans, 270, 271
Post-Examination Guides (PEGs), 4Potential investors/lenders, 320Preference shares, 239
loans, 63–5Present value of a defi ned benefi t obligation,
270Presentation currency, 178–9Presentation:
balance sheets, 34currency, 178–9
Price changes environment, 291–308Price risk, 253Price/earnings (P/E) ratio, 331–2Probability, defi nition, 393
Profi t and loss:measurement, 279–80see also Consolidated income statement
Profi t margins, 323Profi tability ratios, 322–4Profi ts:
convertible fi nancial instruments, 362–3unrealised on assets bought from groups, 35
Property, plant and equipment, 16, 137Proportionate consolidation, 81, 87Provision:
capital, 294environmental issues, 321non-fi nancial information, 388
RRatio analysis:
calculation, 333–6calculation method, 388–9limitations, 388–9reliability, 389use, 331, 338–9valuation, 331
Real fi nancial capital maintenance, 295‘Real terms’ system, 306–7Realisable (exit) values, 298–9Receivables days, 328Receivables factoring, 226–7Redeemable debt interpretation, 393Redeemable preference shares, 239Regulatory systems, 387Reliability:
Operating and Financial Review, 422ratio analysis, 389
Relief value, 299Reorganisation:
business, 151–6intra-group reconstructions, 152–6transfers, 152–4
Replacement cost accounting, 291, 296–8Reporting:
human resource issues, 429Operating and Financial Review, 422see also Financial reporting
Reports:examination questions, 320see also Annual reports
Retirement see Pension plansReturn on assets (ROAs), 326Return on capital employed (ROCE), 292,
320, 326

FINANCIAL MANAGEMENT F2566
IND
EX Return on capital ratios, 326–7Return on plan assets, 270‘Return on shareholders’ funds, 326–7Revenue, profi tability ratios, 322–3Revenue recognition, 221–2
sale of goods, 222sale of services, 222–3
Revision questions:the examination, 485–8
Revision techniques, 485Rights issue, 360–1Risk management policies, 253ROAs see Return on assets (ROAs)Robustness, existing traditions, 444ROCE see Return on capital employed (ROCE)‘Rule-book’ approach, 468
SSale and repurchase agreements, 224Scandals, 420Securities, 239–40Securities and Exchange Commission (SEC),
466, 468, 473, 475Segment analysis, 381–4Segment reporting:
asset turnover, 325disclosure, 365disclosure, 430profi t margins, 323return on assets, 326
Share, 237Share-based payments:
measurement, 277–9recognition, 277types, 277
Shareholders:combinations, 156confi dence boosting, 392net profi t, 362transfers, 444
Shares, 63consolidated income statement, 59–69diluted potential ordinary, 364exchange, 360options, 363subsidiaries, 108, 199warrants, 363weighted average number, 358
Short-term liquidity, 327SIC see Standing Interpretations Committee
(SIC)
Signifi cant infl uence, 10, 82Simple investments, 9–10Single foreign currency transaction, 179Skandia approach, 441–2Smoothing, artifi cial, 391Social accounting concepts, 425–6Social responsibility, 420–1South American accounting systems, 292Special dividends, 361Special purpose entities (SPEs), 227SPEs see Special purpose entities (SPEs)Stake increases, subsidiaries, 142Standards:
IAS 7 headings, 107–8recent developments, 467US GAAP differences, 468–70see also International Accounting Standards
(IASs); International Accounting Standards Board (IASB); International Financial Reporting Standards (IFRSs)
Standing Interpretations Committee (SIC), 227
Statement of changes in equity (SOCIE), 59, 60–1
accounting period, 59complex group structures, 199foreign operations, 180–5partial disposals, 145
Stocks:fair value, 40, 68, 93, 136, 137
Structure:the examination paper, 486–7
Subsidiaries, 32acquisitions, 142–4cash-fl ow statements, 115–18dividends, 136foreign, 115, 177, 179, 180goodwill calculation, 184investments in, 11–17non-controlling interest, 108–10share transfers, 155–6stake increases, 141, 142see also Sub-subsidiaries
Substance over form:assets and liabilities, recognition and
derecognition of, 223–4cases, 224–7principles, 219–21revenue recognition, 221–3revision questions, 229–30solutions, 231–2

567FINANCIAL MANAGEMENT
IND
EXspecial purpose entities (SPEs), 227
Sub-subsidiaries:acquisitions, 134, 136, 144date of acquisition, 136, 202–3
Suppliers, 320
TTaxation:
avoidance, 392creative accounting, 392environmental accounting, 426
Terms, conditions and accounting policies, 253The Corporate Report, 429The corridor, 273Timeliness, 385Tips:
revision techniques, 485the examination, 486, 487–188
Trade investments, 150full and partial disposals, 145
Transaction timing, 390–1Transfers:
business reorganisations, 151shareholding in subsidiary, 152
Transition, human capital management, 431, 446
Turnover:assets, 325inventory, 325
UUnited Nations, 432Unrealised profi ts:
on group companies assets, 35–9on intra-group trading, 85–6
US GAAP, 468–9, 470User identifi cation, 320–1
VValuation:
ratios, 331–6Value based approach:
verifi cation, 387vertical analysis, 379–80
Valuing Human Capital, 447
WWall, Tony, 443Warrants, 363
and options, 238Websites, 322, 434Weighted average number, 358‘Well-offness’, 294Women’s Pay and Development Review, 446Working capital cycle, 327–30
ZZero coupon bonds, 240