cima - chartered institute of management …...november 2007 5 p1 1.4 a company has budgeted...
TRANSCRIPT

© The Chartered Institute of Management Accountants 2007
November 2007 Examinations Managerial Level Paper P1 – Management Accounting – Performance Evaluation Question Paper 2 Examiner’s Brief Guide to the Paper 23 Examiner’s Answers 24 The answers published here have been written by the Examiner and should provide a helpful guide for both tutors and students. Published separately on the CIMA website (www.cimaglobal.com/students) from mid-February 2008 is a Post Examination Guide for this paper, which provides much valuable and complementary material including indicative mark information. © 2007 The Chartered Institute of Management Accountants. All rights reserved. No part of this publication may be reproduced, stored in a retrieval system, or transmitted, in any form or by any means, electronic, mechanical, photocopying, recorded or otherwise, without the written permission of the publisher.

P1 2 November 2007
Management Accounting Pillar
Managerial Level Paper
P1 – Management Accounting – Performance Evaluation
20 November 2007 – Tuesday Morning Session Instructions to candidates
You are allowed three hours to answer this question paper.
You are allowed 20 minutes reading time before the examination begins during which you should read the question paper and, if you wish, highlight and/or make notes on the question paper. However, you will not be allowed, under any circumstances, to open the answer book and start writing or use your calculator during the reading time.
You are strongly advised to carefully read ALL the question requirements before attempting the question concerned (that is, all parts and/or sub- questions). The requirements for the questions in Section C are contained in a dotted box.
ALL answers must be written in the answer book. Answers or notes written on the question paper will not be submitted for marking.
Answer the ONE compulsory question in Section A. This has 16 sub-questions and is on pages 3 to 9.
Answer ALL SIX compulsory sub-questions in Section B on pages 11 and 12.
Answer ONE of the two questions in Section C on pages 13 to 16.
Maths Tables and Formulae are provided on pages 17 to 21.
The list of verbs as published in the syllabus is given for reference on the inside back cover of this question paper.
Write your candidate number, the paper number and examination subject title in the spaces provided on the front of the answer book. Also write your contact ID and name in the space provided in the right hand margin and seal to close.
Tick the appropriate boxes on the front of the answer book to indicate which questions you have answered.
P1 –
Per
form
ance
Eva
luat
ion

November 2007 3 P1
SECTION A – 40 MARKS [the indicative time for answering this section is 72 minutes] ANSWER ALL SIXTEEN SUB-QUESTIONS
Question One 1.1 T Ltd uses a standard labour hour rate to charge its overheads to its clients’ work. During
the last annual reporting period production overheads were under-absorbed by £19,250. The anticipated standard labour hours for the period were 38,000 hours while the standard hours actually charged to clients were 38,500. The actual production overheads incurred in the period were £481,250.
The budgeted production overheads for the period were
A £456,000 B £462,000 C £475,000 D None of the above.
(2 marks)
Section A continues on the opposite page
Instructions for answering Section A: The answers to the sixteen sub-questions in Section A should ALL be written in your answer book. Your answers should be clearly numbered with the sub-question number then ruled off, so that the markers know which sub-question you are answering. For multiple choice questions, you need only write the sub-question number and the letter of the answer option you have chosen. You do not need to start a new page for each sub-question. For sub-questions 1.11 to 1.16 you should show your workings as marks are available for the method you use to answer these sub-questions.

P1 4 November 2007
1.2 Operation B, in a factory, has a standard time of 15 minutes. The standard rate of pay for operatives is £10 per hour. The budget for a period was based on carrying out the operation 350 times. It was subsequently realised that the standard time for Operation B included in the budget did not incorporate expected time savings from the use of new machinery from the start of the period. The standard time should have been reduced to 12 minutes.
Operation B was actually carried out 370 times in the period in a total of 80 hours. The operatives were paid £850.
The operational labour efficiency variance was
A £60 adverse B £75 favourable C £100 adverse D £125 adverse
(2 marks)
1.3 JP manufactures two joint products X and Y, and a by-product Z, in a single continuous
process. The following information is available for period 3:
Raw materials input 20,000 litres Raw material costs $52,000 Conversion costs $56,000 Outputs 10,000 litres of X, selling price $8 per litre 8,000 litres of Y, selling price $6 per litre 2,000 litres of Z, selling price $1 per litre
Process costs are apportioned on a sales value basis. There was no opening and closing inventory of raw materials. The revenue from the by-product is used to reduce the process costs. What was the cost per litre of joint product X?
A $5·889 B $6·523 C $6·625 D $6·646
(2 marks)
Section A continues on the next page

November 2007 5 P1
1.4 A company has budgeted break-even sales revenue of £800,000 and fixed costs of £320,000 for the next period.
The sales revenue needed to achieve a profit of £50,000 in the period would be
A £850,000 B £925,000 C £1,120,000 D £1,200,000
(2 marks) 1.5 The production volume ratio in a period was 95%.
Which statement will always be true? A Actual hours worked exceeded the budgeted hours. B Actual hours worked exceeded the standard hours of output. C Budgeted hours exceeded the standard hours of output. D Budgeted output was less than the actual output.
(2 marks) 1.6 Two CIMA definitions follow:
1. A system that converts a production schedule into a listing of the materials and components required to meet that schedule so that adequate stock levels are maintained and items are available when needed.
2. An accounting oriented information system, generally software driven, which aids in
identifying and planning the enterprise-wide resources needed to resource, make, account for and deliver customer orders.
Which of the following pairs of terms matches the definitions?
Definition 1 Definition 2 A Material requirements planning Enterprise resource planning
B Manufacturing resource planning Material requirements planning
C Material requirements planning Manufacturing resource planning
D Manufacturing resource planning Enterprise resource planning
(2 marks)

P1 6 November 2007
1.7 The fixed overhead volume variance is defined as A the difference between the budgeted value of the fixed overheads and the standard fixed
overheads absorbed by actual production. B the difference between the standard fixed overhead cost specified for the production
achieved, and the actual fixed overhead cost incurred. C the difference between budgeted and actual fixed overhead expenditure. D the difference between the standard fixed overhead cost specified in the original budget
and the same volume of fixed overheads, but at the actual prices incurred. (2 marks)
1.8 Overheads will always be over-absorbed when A actual output is higher than budgeted output.
B actual overheads incurred are higher than the amount absorbed.
C actual overheads incurred are lower than the amount absorbed.
D budgeted overheads are lower than the overheads absorbed.
(2 marks)
Section A continues on the next page

November 2007 7 P1
The following data are given for sub-questions 1.9 and1.10 below
A manufacturing company recorded the following costs in October for Product X:
$ Direct materials 20,000 Direct labour 6,300 Variable production overhead 4,700 Fixed production overhead 19,750 Variable selling costs 4,500 Fixed distribution costs 16,800 Total costs incurred for Product X 72,050
During October 4,000 units of Product X were produced but only 3,600 units were sold. At the beginning of October there was no inventory.
1.9 The value of the inventory of Product X at the end of October using marginal costing was: A $3,080
B $3,100
C $3,550
D $5,075
(2 marks)
1.10 The value of the inventory of Product X at the end of October using throughput accounting
was A $630
B $1,080
C $1,100
D $2,000
(2 marks)

P1 8 November 2007
1.11 A company has the following budgeted sales figures:
Month 1 £90,000Month 2 £105,000Month 3 £120,000Month 4 £108,000
80% of sales are on credit and the remainder are paid in cash. Credit customers paying within one month are given a discount of 1·5%. Credit customers normally pay within the following time frame:
Within 1 month 40% of credit sales Within 2 months 70% of credit sales Within 3 months 98% of credit sales
There is an expectation that 2% of credit sales will become bad debts.
Outstanding receivables at the beginning of month 1 includes £6,000 expected to be received in month 4.
Calculate the total receipts expected in month 4.
(4 marks) 1.12 The budgeted total costs for two levels of output are as shown below:
Output 25,000 units 40,000 units Total cost £143,500 £194,000
Within this range of output it is known that the variable cost per unit is constant but fixed costs rise by £10,000 when output exceeds 35,000 units.
Calculate for a budgeted output of 36,000 units:
(i) the variable cost per unit; (ii) the total fixed costs.
(3 marks)
1.13 A company can produce many types of product but is currently restricted by the number
of labour hours available on a particular machine. At present this limitation is set at 12,000 hours per annum. One type of product requires materials costing $5 which are then converted to a final product which sells for $12. Each unit of this product takes 45 minutes to produce on the machine. The conversion costs for the factory are estimated to be $144,000 per annum.
Calculate the throughput accounting ratio for this product and state the significance of the result.
(3 marks)

November 2007 9 P1
1.14 A company manufactures three joint products in a continuous single process. Normal losses are 10% of inputs and do not have any value. Budget data is available for the month of January as follows:
Opening and closing work in progress NIL Direct materials input 20,000 kg at a cost of £36,000 Direct labour costs 3,000 hours @ £6 per hour Variable production overheads 3,000 hours @ £1 per hour
Fixed production overheads are absorbed at a rate of £8 per direct labour hour.
Expected outputs Selling price per kg Joint product A 9,000 kg £8 Joint product B 6,000 kg £6 Joint product C 3,000 kg £4
Joint costs are apportioned on a physical unit basis.
Calculate the gross profit margin for each of the joint products.
(3 marks)
1.15 A company has the following balance sheet totals at the end of its most recent financial year:
£million
Non-current assets 3·64 Current assets 0·42 Share capital and reserves* 2·69 Long term debt 1·00 Current liabilities 0·37
* Includes retained profit for the year of £320,000 after deducting:
Ordinary share dividends £200,000 Interest on long term debt £100,000 Taxation £70,000
Calculate the Return on Investment (ROI) of the company for the year (using end year balance sheet values for investment).
(3 marks)
1.16 A division is considering the purchase of a new machine which costs $1,500,000 and is expected to generate cost savings of $450,000 a year. The asset is expected to have a useful life of five years with no residual value. Depreciation is charged on a straight line basis. Divisional performance is evaluated on Residual Income (RI). The division’s cost of capital is 10%.
Calculate for this machine for each of the five years:
(i) the Residual Income (RI); (ii) the Return on Investment (ROI).
Note: When calculating performance measures the division always uses capital values as at the start of the year.
(4 marks)
(Total for Section A = 40 marks)

P1 10 November 2007
Reminder
All answers to Section A must be written in your answer book.
Answers to Section A written on the question paper will not be submitted for marking.
Section B starts on the next page

November 2007 11 P1
SECTION B – 30 MARKS [the indicative time for answering this section is 54 minutes] ANSWER ALL SIX SUB-QUESTIONS. EACH SUB-QUESTION IS WORTH 5 MARKS Question Two
The following data are given for sub-questions 2(a) and 2(b) below
QBQ produces one type of product. Details of the budgeted sales and production are given below. Selling Price and Costs per unit
£ Selling price 40Material FX: 1·5kg @ £6 per kg 9Conversion costs (variable) 8Fixed production overheads 15
The fixed production overhead absorption rate is based on annual production overheads of £720,000 and budgeted annual output of 48,000 units. The fixed overheads will be incurred evenly throughout the year. The company also incurs fixed costs for administration of £200,000 per year. Budgeted Sales
Quarter Units 1 10,000 2 12,000 3 14,000 4 12,000
Inventory It has been decided that inventory levels are to be reduced. Details are as follows: Finished goods: 5,500 units are currently held but it has been decided that the closing
inventories for Quarters 1, 2 and 3 will be 45%, 40% and 35% of the following quarter’s sales respectively.
Raw materials: 4,500 kg are currently held but it has been decided that the closing
inventories for Quarters 1 and 2 will be 25% and 20% of the following quarter’s production requirements respectively.
(a) Prepare a materials purchase budget for Quarter 1.
(5 Marks)

P1 12 November 2007
(b) In Quarter 3 the opening and closing inventories of finished goods will be 5,600 units and 4,200 units respectively. QBQ adjusts for any under- or over-absorption of overheads at the end of each quarter.
Assume that production and sales volumes were as budgeted and that inventory levels were as planned. Also assume that all costs and revenues were as budgeted.
(i) Calculate using marginal costing the profit for Quarter 3; (ii) Calculate using absorption costing the profit for Quarter 3; (iii) Explain the difference, if any, in the profits you have calculated.
(5 Marks)
(c) Explain, giving examples, how budgets can be used for feedback control and feed-forward control.
(5 Marks)
(d) Briefly explain three reasons why budgetary planning and control might be inappropriate in a rapidly changing business environment.
(5 Marks)
(e) Briefly explain Just-in-Time (JIT) and two major requirements for the successful operation of a JIT system.
(5 Marks)
(f) A nursing home uses incremental budgeting. The previous period’s budget is adjusted by reference to a set of indices. It is adjusted firstly for ‘volume changes’ and then for changes in the cost of resources. The indices are referenced to the previous period’s budget by using that budget as the base index number of 100. The index numbers to be used to prepare Period 3’s budget from that of Period 2 are as follows:
Index
Patient days 90 House-keeping costs 106 Nursing costs 105 Administration costs 104
The budget for Period 2 was:
£ House-keeping costs (all variable) 125,000Nursing costs (see below) 324,000Administration costs (all fixed) 100,000
Nursing costs are semi-variable. The nursing costs for Period 2 were adjusted from the total nursing costs of £280,000 for Period 1 by using a Patient days index of 125 and a Nursing costs index of 108.
Prepare the budget for Period 3.
(5 marks) (Total for Question Two = 30 marks)
(Total for Section B = 30 marks)

November 2007 13 P1
SECTION C – 30 MARKS [the indicative time for answering this section is 54 minutes] ANSWER ONE OF THE TWO QUESTIONS
Question Three WC is a company that installs kitchens and bathrooms for customers who are renovating their houses. The installations are either pre-designed ‘off the shelf’ packages or highly customised designs for specific jobs. The company operates with three divisions: Kitchens, Bathrooms and Central Services. The Kitchens and Bathrooms divisions are profit centres but the Central Services division is a cost centre. The costs of the Central Services division, which are thought to be predominantly fixed, include those incurred by the design, administration and finance departments. The Central Services costs are charged to the other divisions based on the budgeted Central Services costs and the budgeted number of jobs to be undertaken by the other two divisions. The budgeting and reporting system of WC is not very sophisticated and does not provide much detail for the Directors of the company. Budget details The budgeted details for last year were:
Kitchens Bathrooms Number of jobs 4,000 2,000 $ $ Average price per job 10,000 7,000 Average direct costs per job 5,500 3,000 Central Services recharge per job 2,500 2,500 Average profit per job 2,000 1,500
Actual details The actual results were as follows:
Kitchens Bathrooms Number of jobs 2,600 2,500 $ $ Average price per job 13,000 6,100 Average direct costs per job 8,000 2,700 Central Services recharge per job 2,500 2,500 Average profit per job 2,500 900
The actual costs for the Central Services division were $17·5 million.
The requirements for Question Three are on the opposite page

P1 14 November 2007
Required: (a) Calculate the budgeted and actual profits for each of the profit centres and for the
whole company for the year. (4 marks)
(b) Calculate the sales price variances and the sales mix profit and sales quantity profit
variances.
(6 marks)
(c) Prepare a statement that reconciles the budgeted and actual profits and shows appropriate variances in as much detail as possible.
(10 marks)
(d) Using the statement that you prepared in part (c) above, discuss
(i) the performance of the company for the year; and (ii) potential changes to the budgeting and reporting system that would
improve performance evaluation within the company.
(10 marks)
(Total for Question Three = 30 marks)
Section C continues on the next page

November 2007 15 P1
Question Four
A multinational computer manufacturer has a number of autonomous subsidiaries throughout the world. Two of the group’s subsidiaries are in America and Europe. The American subsidiary assembles computers using chips that it purchases from local companies. The European subsidiary manufactures exactly the same chips that are used by the American subsidiary but currently only sells them to numerous external companies throughout Europe. Details of the two subsidiaries are given below. America The American subsidiary buys the chips that it needs from a local supplier. It has negotiated a price of $90 per chip. The production budget shows that 300,000 chips will be needed next year. Europe The chip production subsidiary in Europe has a capacity of 800,000 chips per year. Details of the budget for the forthcoming year are as follows:
Sales 600,000 chips $ per chip Selling price 105 Variable costs 60
The fixed costs of the subsidiary at the budgeted output of 600,000 chips are $20 million per year but they would rise to $26 million if output exceeds 625,000 chips. Note: The maximum external demand is 600,000 chips per year and the subsidiary has no other uses for the current spare capacity. Group Directive The Managing Director of the group has reviewed the budgets of the subsidiaries and has decided that in order to improve the profitability of the group the European subsidiary should supply chips to the American subsidiary. She is also thinking of linking the salaries of the subsidiary managers to the performance of their subsidiaries but is unsure which performance measure to use. Two measures that she is considering are “profit” and the “return on assets consumed” (where the annual fixed costs would be used as the “assets consumed”). The Manager of the European subsidiary has offered to supply the chips at a price of $95 each. He has offered this price because it would earn the same contribution per chip that would be earned on external sales (this is after adjusting for increased distribution costs and reduced customer servicing costs).
The requirements for Question Four are on the opposite page

P1 16 November 2007
Required: (a) Assume that the 300,000 chips are supplied by the European subsidiary at a
transfer price of $95 per chip. Calculate the impact of the profits on each of the subsidiaries and the group.
(5 marks) (b) Calculate the minimum unit price at which the European subsidiary would be willing
to transfer the 300,000 chips to the American subsidiary if the performance and salary of the Manager of the subsidiary is to be based on
(i) the profit of the subsidiary (currently $7 million) (ii) the return on assets consumed by the subsidiary (currently 35%).
(9 marks)
(c) Write a report to the Managing Director of the group that discusses issues raised by
the directive and the introduction of performance measures. (You should use your answers to parts (a) and (b), where appropriate, to illustrate points in your report).
(10 marks)
(d) Briefly explain how multi-national companies can use transfer pricing to reduce
their overall tax charge and the steps that national tax authorities have taken to discourage the manipulation of transfer prices.
(6 marks)
(Total for Question Four = 30 marks)
(Total for Section C = 30 marks)
End of question paper Maths Tables and Formulae are on pages 17 to 21

November 2007 17 P1

P1 18 November 2007
PRESENT VALUE TABLE
Present value of $1, that is ( ) nr −+1 where r = interest rate; n = number of periods until payment or receipt.
Interest rates (r) Periods (n) 1% 2% 3% 4% 5% 6% 7% 8% 9% 10% 1 0.990 0.980 0.971 0.962 0.952 0.943 0.935 0.926 0.917 0.909 2 0.980 0.961 0.943 0.925 0.907 0.890 0.873 0.857 0.842 0.826 3 0.971 0.942 0.915 0.889 0.864 0.840 0.816 0.794 0.772 0.751 4 0.961 0.924 0.888 0.855 0.823 0.792 0.763 0.735 0.708 0.683 5 0.951 0.906 0.863 0.822 0.784 0.747 0.713 0.681 0.650 0.621 6 0.942 0.888 0.837 0.790 0.746 0705 0.666 0.630 0.596 0.564 7 0.933 0.871 0.813 0.760 0.711 0.665 0.623 0.583 0.547 0.513 8 0.923 0.853 0.789 0.731 0.677 0.627 0.582 0.540 0.502 0.467 9 0.914 0.837 0.766 0.703 0.645 0.592 0.544 0.500 0.460 0.424 10 0.905 0.820 0.744 0.676 0.614 0.558 0.508 0.463 0.422 0.386 11 0.896 0.804 0.722 0.650 0.585 0.527 0.475 0.429 0.388 0.350 12 0.887 0.788 0.701 0.625 0.557 0.497 0.444 0.397 0.356 0.319 13 0.879 0.773 0.681 0.601 0.530 0.469 0.415 0.368 0.326 0.290 14 0.870 0.758 0.661 0.577 0.505 0.442 0.388 0.340 0.299 0.263 15 0.861 0.743 0.642 0.555 0.481 0.417 0.362 0.315 0.275 0.239 16 0.853 0.728 0.623 0.534 0.458 0.394 0.339 0.292 0.252 0.218 17 0.844 0.714 0.605 0.513 0.436 0.371 0.317 0.270 0.231 0.198 18 0.836 0.700 0.587 0.494 0.416 0.350 0.296 0.250 0.212 0.180 19 0.828 0.686 0.570 0.475 0.396 0.331 0.277 0.232 0.194 0.164 20 0.820 0.673 0.554 0.456 0.377 0.312 0.258 0.215 0.178 0.149
Interest rates (r) Periods
(n) 11% 12% 13% 14% 15% 16% 17% 18% 19% 20% 1 0.901 0.893 0.885 0.877 0.870 0.862 0.855 0.847 0.840 0.833 2 0.812 0.797 0.783 0.769 0.756 0.743 0.731 0.718 0.706 0.694 3 0.731 0.712 0.693 0.675 0.658 0.641 0.624 0.609 0.593 0.579 4 0.659 0.636 0.613 0.592 0.572 0.552 0.534 0.516 0.499 0.482 5 0.593 0.567 0.543 0.519 0.497 0.476 0.456 0.437 0.419 0.402 6 0.535 0.507 0.480 0.456 0.432 0.410 0.390 0.370 0.352 0.335 7 0.482 0.452 0.425 0.400 0.376 0.354 0.333 0.314 0.296 0.279 8 0.434 0.404 0.376 0.351 0.327 0.305 0.285 0.266 0.249 0.233 9 0.391 0.361 0.333 0.308 0.284 0.263 0.243 0.225 0.209 0.194 10 0.352 0.322 0.295 0.270 0.247 0.227 0.208 0.191 0.176 0.162 11 0.317 0.287 0.261 0.237 0.215 0.195 0.178 0.162 0.148 0.135 12 0.286 0.257 0.231 0.208 0.187 0.168 0.152 0.137 0.124 0.112 13 0.258 0.229 0.204 0.182 0.163 0.145 0.130 0.116 0.104 0.093 14 0.232 0.205 0.181 0.160 0.141 0.125 0.111 0.099 0.088 0.078 15 0.209 0.183 0.160 0.140 0.123 0.108 0.095 0.084 0.079 0.065 16 0.188 0.163 0.141 0.123 0.107 0.093 0.081 0.071 0.062 0.054 17 0.170 0.146 0.125 0.108 0.093 0.080 0.069 0.060 0.052 0.045 18 0.153 0.130 0.111 0.095 0.081 0.069 0.059 0.051 0.044 0.038 19 0.138 0.116 0.098 0.083 0.070 0.060 0.051 0.043 0.037 0.031 20 0.124 0.104 0.087 0.073 0.061 0.051 0.043 0.037 0.031 0.026
November 2007 19 P1
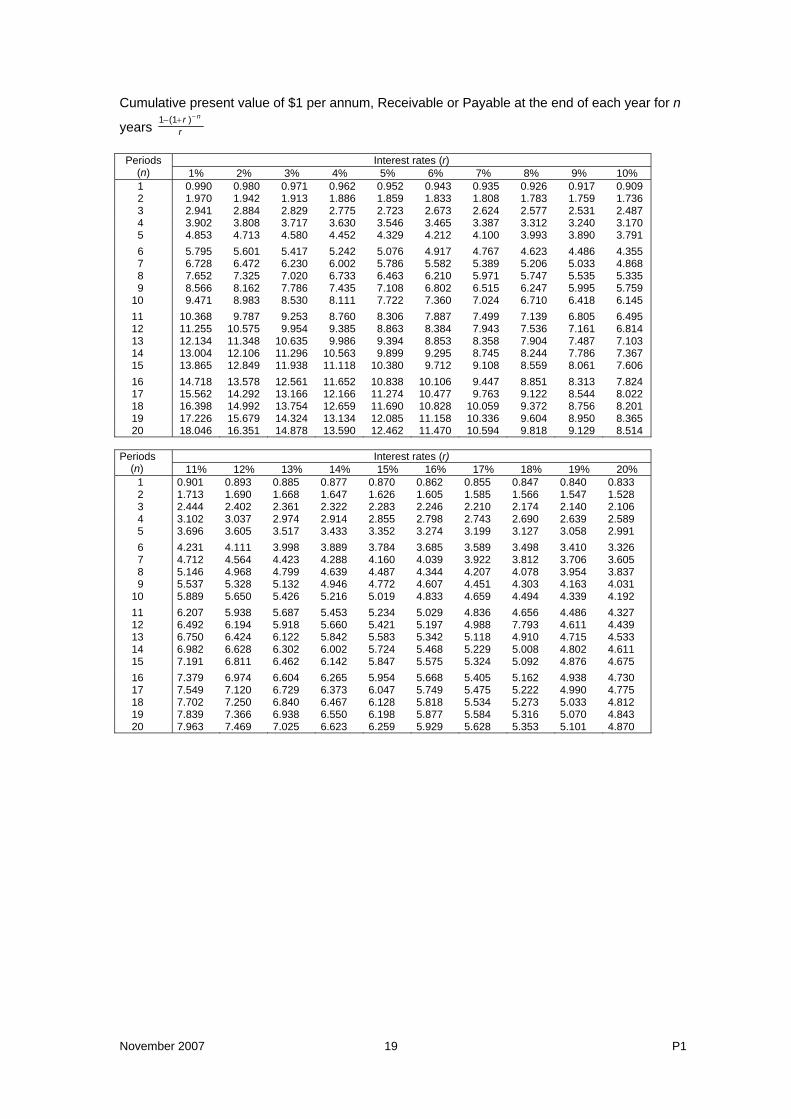
Cumulative present value of $1 per annum, Receivable or Payable at the end of each year for n
years rr n−+− )(11
Interest rates (r) Periods
(n) 1% 2% 3% 4% 5% 6% 7% 8% 9% 10% 1 0.990 0.980 0.971 0.962 0.952 0.943 0.935 0.926 0.917 0.909 2 1.970 1.942 1.913 1.886 1.859 1.833 1.808 1.783 1.759 1.736 3 2.941 2.884 2.829 2.775 2.723 2.673 2.624 2.577 2.531 2.487 4 3.902 3.808 3.717 3.630 3.546 3.465 3.387 3.312 3.240 3.170 5 4.853 4.713 4.580 4.452 4.329 4.212 4.100 3.993 3.890 3.791 6 5.795 5.601 5.417 5.242 5.076 4.917 4.767 4.623 4.486 4.355 7 6.728 6.472 6.230 6.002 5.786 5.582 5.389 5.206 5.033 4.868 8 7.652 7.325 7.020 6.733 6.463 6.210 5.971 5.747 5.535 5.335 9 8.566 8.162 7.786 7.435 7.108 6.802 6.515 6.247 5.995 5.759 10 9.471 8.983 8.530 8.111 7.722 7.360 7.024 6.710 6.418 6.145 11 10.368 9.787 9.253 8.760 8.306 7.887 7.499 7.139 6.805 6.495 12 11.255 10.575 9.954 9.385 8.863 8.384 7.943 7.536 7.161 6.814 13 12.134 11.348 10.635 9.986 9.394 8.853 8.358 7.904 7.487 7.103 14 13.004 12.106 11.296 10.563 9.899 9.295 8.745 8.244 7.786 7.367 15 13.865 12.849 11.938 11.118 10.380 9.712 9.108 8.559 8.061 7.606 16 14.718 13.578 12.561 11.652 10.838 10.106 9.447 8.851 8.313 7.824 17 15.562 14.292 13.166 12.166 11.274 10.477 9.763 9.122 8.544 8.022 18 16.398 14.992 13.754 12.659 11.690 10.828 10.059 9.372 8.756 8.201 19 17.226 15.679 14.324 13.134 12.085 11.158 10.336 9.604 8.950 8.365 20 18.046 16.351 14.878 13.590 12.462 11.470 10.594 9.818 9.129 8.514
Interest rates (r) Periods
(n) 11% 12% 13% 14% 15% 16% 17% 18% 19% 20% 1 0.901 0.893 0.885 0.877 0.870 0.862 0.855 0.847 0.840 0.833 2 1.713 1.690 1.668 1.647 1.626 1.605 1.585 1.566 1.547 1.528 3 2.444 2.402 2.361 2.322 2.283 2.246 2.210 2.174 2.140 2.106 4 3.102 3.037 2.974 2.914 2.855 2.798 2.743 2.690 2.639 2.589 5 3.696 3.605 3.517 3.433 3.352 3.274 3.199 3.127 3.058 2.991 6 4.231 4.111 3.998 3.889 3.784 3.685 3.589 3.498 3.410 3.326 7 4.712 4.564 4.423 4.288 4.160 4.039 3.922 3.812 3.706 3.605 8 5.146 4.968 4.799 4.639 4.487 4.344 4.207 4.078 3.954 3.837 9 5.537 5.328 5.132 4.946 4.772 4.607 4.451 4.303 4.163 4.031 10 5.889 5.650 5.426 5.216 5.019 4.833 4.659 4.494 4.339 4.192 11 6.207 5.938 5.687 5.453 5.234 5.029 4.836 4.656 4.486 4.327 12 6.492 6.194 5.918 5.660 5.421 5.197 4.988 7.793 4.611 4.439 13 6.750 6.424 6.122 5.842 5.583 5.342 5.118 4.910 4.715 4.533 14 6.982 6.628 6.302 6.002 5.724 5.468 5.229 5.008 4.802 4.611 15 7.191 6.811 6.462 6.142 5.847 5.575 5.324 5.092 4.876 4.675 16 7.379 6.974 6.604 6.265 5.954 5.668 5.405 5.162 4.938 4.730 17 7.549 7.120 6.729 6.373 6.047 5.749 5.475 5.222 4.990 4.775 18 7.702 7.250 6.840 6.467 6.128 5.818 5.534 5.273 5.033 4.812 19 7.839 7.366 6.938 6.550 6.198 5.877 5.584 5.316 5.070 4.843 20 7.963 7.469 7.025 6.623 6.259 5.929 5.628 5.353 5.101 4.870

P1 20 November 2007
Formulae
PROBABILITY A ∪B = A or B. A ∩ B = A and B (overlap). P(B A) = probability of B, given A. Rules of Addition If A and B are mutually exclusive: P(A ∪B) = P(A) + P(B) If A and B are not mutually exclusive: P(A ∪B) = P(A) + P(B) – P(A ∩ B) Rules of Multiplication If A and B are independent: P(A ∩B) = P(A) * P(B) If A and B are not independent: P(A ∩B) = P(A) * P(B | A) E(X) = ∑ (probability * payoff) Quadratic Equations If aX2 + bX + c = 0 is the general quadratic equation, the two solutions (roots) are given by:
aacbbX
242 −±−
=
DESCRIPTIVE STATISTICS Arithmetic Mean
nxx ∑
= ffxx
∑∑
= (frequency distribution)
Standard Deviation
nxxSD
2)( −∑= 2
2x
ffxSD −∑∑= (frequency distribution)
INDEX NUMBERS Price relative = 100 * P1/P0 Quantity relative = 100 * Q1/Q0
Price: 100 x w
PP
wo
1
∑
⎟⎟⎠
⎞⎜⎜⎝
⎛∗∑
Quantity: 100 x
1
wQQw
o
∑
⎟⎟⎠
⎞⎜⎜⎝
⎛∗∑
TIME SERIES Additive Model
Series = Trend + Seasonal + Random Multiplicative Model
Series = Trend * Seasonal * Random

November 2007 21 P1
LINEAR REGRESSION AND CORRELATION The linear regression equation of Y on X is given by:
Y = a + bX or Y - Y = b(X – X) where
b = 22 )X(Xn
)Y)(X(XYn)X( Variance
)XY( Covariance∑−∑
∑∑−∑=
and a = Y – bX or solve
∑ Y = na + b ∑ X ∑ XY = a ∑ X + b∑X2
Coefficient of correlation
})Y(Yn}{)X(Xn{
)Y)(X(XYn)Y(Var).X(Var)XY( Covariancer
2222 ∑−∑∑−∑
∑∑−∑==
R(rank) = 1 - )1(
62
2
−
∑
nnd
FINANCIAL MATHEMATICS Compound Interest (Values and Sums) Future Value S, of a sum of X, invested for n periods, compounded at r% interest
S = X[1 + r]n Annuity Present value of an annuity of £1 per annum receivable or payable for n years, commencing in one year, discounted at r% per annum:
PV = ⎥⎥⎦
⎤
⎢⎢⎣
⎡
+−
nrr ]1[111
Perpetuity Present value of £1 per annum, payable or receivable in perpetuity, commencing in one year, discounted at r% per annum:
PV = r1

P1 22 November 2007
LIST OF VERBS USED IN THE QUESTION REQUIREMENTS A list of the learning objectives and verbs that appear in the syllabus and in the question requirements for each question in this paper. It is important that you answer the question according to the definition of the verb.
LEARNING OBJECTIVE VERBS USED DEFINITION
1 KNOWLEDGE
What you are expected to know. List Make a list of State Express, fully or clearly, the details of/facts of Define Give the exact meaning of
2 COMPREHENSION What you are expected to understand. Describe Communicate the key features
Distinguish Highlight the differences between Explain Make clear or intelligible/State the meaning of Identify Recognise, establish or select after
consideration Illustrate Use an example to describe or explain
something
3 APPLICATION How you are expected to apply your knowledge. Apply
Calculate/compute To put to practical use To ascertain or reckon mathematically
Demonstrate To prove with certainty or to exhibit by practical means
Prepare To make or get ready for use Reconcile To make or prove consistent/compatible Solve Find an answer to Tabulate Arrange in a table
4 ANALYSIS How you are expected to analyse the detail of what you have learned.
Analyse Categorise
Examine in detail the structure of Place into a defined class or division
Compare and contrast Show the similarities and/or differences between
Construct To build up or compile Discuss To examine in detail by argument Interpret To translate into intelligible or familiar terms Produce To create or bring into existence
5 EVALUATION How you are expected to use your learning to evaluate, make decisions or recommendations.
Advise Evaluate Recommend
To counsel, inform or notify To appraise or assess the value of To advise on a course of action

November 2007 23 P1
The Examiner for Management Accounting – Performance Evaluation offers to future candidates and to tutors using this booklet for study purposes, the
following background and guidance on the questions included in this examination paper.
Section A – Question One – Compulsory Question One consists of 16 objective test sub-questions. These are drawn from all sections of the syllabus. They are designed to examine breadth across the syllabus and thus cover many learning outcomes.
Section B – Question Two – Compulsory Question Two has six sub-questions. (a) covers learning outcome C(iii) – Calculate projected revenues and costs based on
product/service volumes, pricing strategies and cost structures.
(b) covers learning outcome A(i) – Compare and contrast marginal and absorption costing methods in respect of profit reporting and stock valuation.
(c) covers learning outcome C(x) – Explain the ideas of feedback and feed-forward control and their application in the use of budgets for control.
(d) covers learning outcome C(xiv) – Evaluate the criticisms of budgeting particularly from the advocates of techniques that are ‘beyond budgeting’.
(e) covers learning outcome A(viii) – Evaluate the impact of just-in-time manufacturing methods on cost accounting and the use of ‘back-flush accounting’ when work-in-progress stock is minimal.
(f) covers learning outcome C(ii) – Calculate projected product/service volumes employing appropriate forecasting techniques.
Section C – answer one of two questions Question Three has four parts. (a) covers learning outcome A(v) – Apply standard costing methods within costing systems
and demonstrate the reconciliation of budgeted and actual profit margins.
(b) covers learning outcome B(ii) – Calculate and interpret material, labour, variable overhead, fixed overhead and sales variances.
(c) covers learning outcome B(iii) – Prepare and discuss a report which reconciles budget and actual profit using absorption and/or marginal costing principles.
(d) covers learning outcome C(ix) – Identify controllable and uncontrollable costs in the context of responsibility accounting and explain why 'uncontrollable' costs may or may not be allocated to responsibility centres.
Question Four has four parts. (a) covers learning outcome D(iii) – Prepare revenue and cost information in appropriate
formats for profit and investment centre managers, taking due account of cost variability, attributable costs, controllable costs and identification of appropriate measures of profit centre 'contribution'.
(b) covers learning outcome D(iv) – Calculate and apply measures of performance for investment centres (often 'strategic business units' or divisions of larger groups).
(c) covers learning outcome D(v) – Discuss the likely behavioural consequences of the use of performance metrics in managing cost, profit and investment centres.
(d) covers learning outcome D(vii) – Identify the likely consequences of different approaches to transfer pricing for divisional decision making, divisional and group profitability, the motivation of divisional management and the autonomy of individual divisions.

P1 24 November 2007
Managerial Level Paper
P1 – Management Accounting - Performance Evaluation
Examiner’s Answers
SECTION A
Answer to Question One 1.1 £ Underabsorbed -19,250 Actual 481,250 Charged to clients 462,000
Overhead rate £462,000/38,500 = £12 per hour
Budgeted overheads = 38,000 x £12 = £456,000
The correct answer is A 1.2 Actual time for 370 operations was 80 hours
Revised standard time per operation = 12 minutes = 0·2 hours Revised expected time for actual operations = 370 x 0·2 = 74 hours Operational labour efficiency variance = (80 - 74) x £10 = £60 adverse
The correct answer is A
1.3 $52,000 + $56,000 - $2,000 = $106,000 Sales Value Costs X $80,000 62·5% $66,250 Y $48,000 37·5% $39,750 $128,000 $106,000
$66,250/10,000 = $6·625
The correct answer is C
November 2007 25 P1
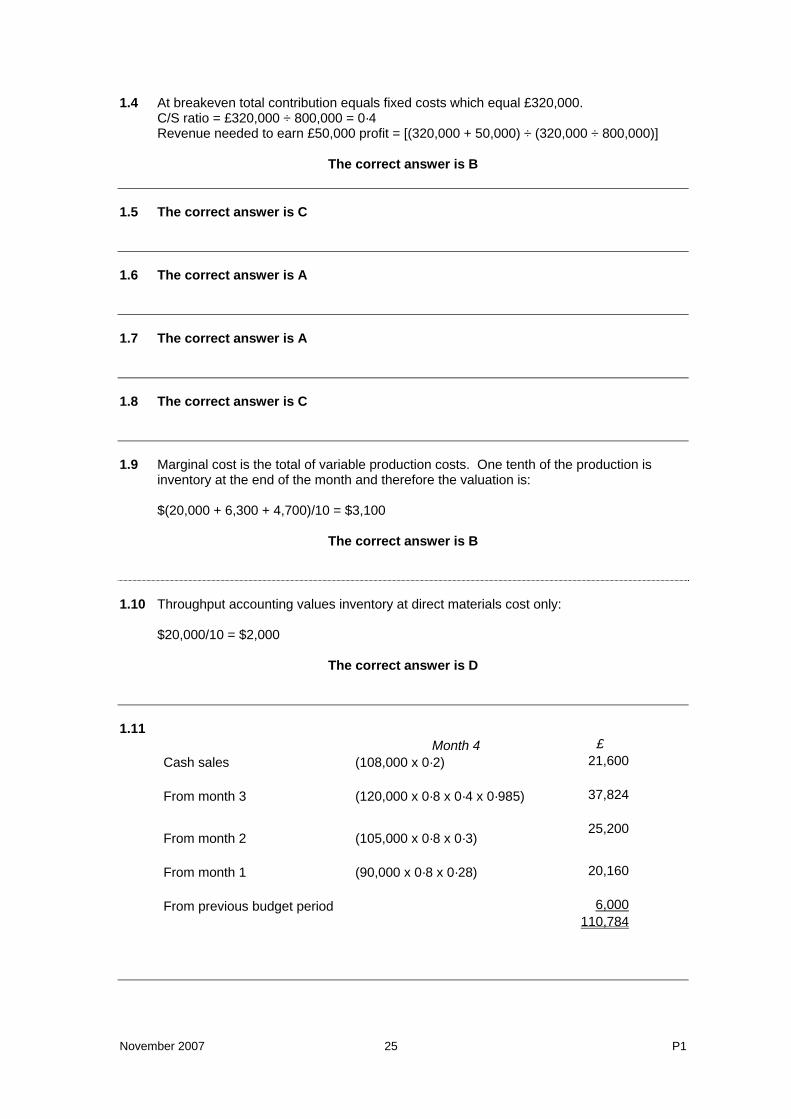
1.4 At breakeven total contribution equals fixed costs which equal £320,000. C/S ratio = £320,000 ÷ 800,000 = 0·4 Revenue needed to earn £50,000 profit = [(320,000 + 50,000) ÷ (320,000 ÷ 800,000)]
The correct answer is B
1.5 The correct answer is C 1.6 The correct answer is A 1.7 The correct answer is A 1.8 The correct answer is C 1.9 Marginal cost is the total of variable production costs. One tenth of the production is
inventory at the end of the month and therefore the valuation is:
$(20,000 + 6,300 + 4,700)/10 = $3,100
The correct answer is B 1.10 Throughput accounting values inventory at direct materials cost only:
$20,000/10 = $2,000
The correct answer is D 1.11
Month 4 £ Cash sales (108,000 x 0·2) 21,600 From month 3 (120,000 x 0·8 x 0·4 x 0·985) 37,824
From month 2 (105,000 x 0·8 x 0·3) 25,200
From month 1 (90,000 x 0·8 x 0·28) 20,160 From previous budget period 6,000 110,784

P1 26 November 2007
1.12 (i) Variable cost per unit
[(£194,000 – £10,000 – £143,500) ÷ (40,000 – 25,000 units)] = £2·70 per unit (ii) Total fixed costs [£194,000 – (40,000 units × £2.70 per unit)] = £86,000 1.13
Where: Return per factory hour = resourcekey on time Total
cost Materialprice Sales −
= (12 – 5)/0⋅75 = $9⋅33 per hour
And: Cost per factory hour = resourcekey on time Totalcostfactory Total
= 144,000/12,000 = $12 per hour
Throughput accounting (TA) ratio = hourfactory per Costhourfactory per Return
9⋅33/12 = 0⋅78 As the throughput accounting ratio is less than 1, the product should not be produced.
1.14 Total production costs:
Direct materials £36,000Direct labour £18,000Variable production overheads £3,000Fixed production overheads £24,000 £81,000
Cost per unit of output £81,000/18,000 = £4·50
Product A Product B Product CSelling price £8 £6 £4 Production cost £4·50 £4·50 £4·50 Gross profit £3·50 £1·50 (£0·50) Gross profit % 43·75% 25% (12·5%)
1.15 Return = £320,000 + £200,000 + £100,000 + £70,000 = £690,000 Investment = £3·64 million + £0·42 million - £0·37 million = £3·69 million
[(690,000 ÷ 3,690,000) × 100] = 18·7%

November 2007 27 P1
1.16 Year 1($) Year 2 ($) Year 3 ($) Year 4($) Year 5 ($) Cost savings 450,000 450,000 450,000 450,000 450,000 Depreciation 300,000 300,000 300,000 300,000 300,000 Profit 150,000 150,000 150,000 150,000 150,000 Cost of capital 150,000 120,000 90,000 60,000 30,000 RI nil 30,000 60,000 90,000 120,000 ROI 10% 12·5% 16·7% 25% 50% Capital value 1·5 1·2 0·9 0·6 0·3

P1 28 November 2007
SECTION B Answer to (a)
Q1 Q2 Production Budget: For sales 10,000 12,000Add closing inventory 5,400 5,600 (12,000 x 45%) (14,000 x 40%)Less opening inventory -5,500 -5,400Production units 9,900 12,200 Material Purchases Budget Kg For production 14,850 (9,900 x 1·5) Add closing inventory 4,575 (18,300 x 25%) Less opening inventory -4,500Purchases (kg) 14,925 Purchases £ (at £6 per kg) £89,550
Answer to (b)
Workings: Q3 £ per unit
Marginal cost £9 + £8 17 Production overheads 15 Absorption cost 32 (i) Calculation of profit by marginal costing for quarter 3 £ Sales (14,000 x £40) 560,000Variable costs (14,000 x £17) 238,000Contribution 322,000Fixed costs (Production and others) 230,000Profit 92,000 (ii) Calculation of profit by absorption costing for quarter 3 £ Sales 560,000Absorption cost of sales (14,000 x £32) (448,000)Over absorbed overhead £180,000 – (12,600 x £15)
9,000
Other fixed costs (50,000)Profit 71,000

November 2007 29 P1
Workings: The inventory of finished goods has fallen during the month and therefore the number of units produced will be less than the number sold. Production = sales – inventory change = 14,000 – 1,400 = 12,600 units. (iii) The difference is caused by the fixed production overheads included in the unit valuations under absorption costing. During Quarter 3 the inventory fell and therefore the profit calculated by absorption costing will be lower than that calculated by marginal costing by £21,000 (calculated as 1,400 units x £15). Reconciliation: £92,000 - £21,000 = £71,000. Answer to (c) Feedback control relates to information about past events. Actual results should be compared to planned or budgeted results as part of the control mechanism. Variance analysis is a good example of feedback control. The feedback should be used to revise future actions as appropriate and to learn from budgeting or operational errors. Feedforward control is a system where deviations from a plan are anticipated and corrective action is taken in advance. An example is a cash flow projection which for example can highlight in advance any shortages of cash and therefore action can be taken before the event to avoid any problems this may bring. Answer to (d) Budgets are often thought of as being bureaucratic and time consuming to produce. Consequently they are not updated on a regular basis and therefore in a dynamic environment budgets can quickly become out of date. Budgets are often seen as constraints on responsiveness and as such stifle the ability of managers to react rapidly to change. Budgets replicate vertical command and control structures and reinforce departmental barriers. Such rigid structures may not suit the organisation culture of companies operating in a rapidly changing environment. Budgets have been criticised for being too inward looking and as such they pay little attention to the external environment. This is even more inappropriate if the environment is changing rapidly.

P1 30 November 2007
Answer to (e) JIT is a commitment to continuous improvement and the pursuit of excellence in the design and operation of the production management system. Under this system, production and resource acquisition is pulled through the system by customer demand and therefore the JIT production system must be able to respond quickly to customer demand and resources are only acquired when needed. In order to be able to operate in this manner, an organisation must achieve excellence in all areas of management. Operating on a JIT basis with low inventories requires excellence in:
• Production scheduling • Supplier relations • Plant maintenance • Information systems • Quality controls • Customer relations.
Candidates were required to explain two requirements. For example: Production scheduling Under JIT it is thought that only the actual production time adds value to the product and that all other activities (inspection, move and storage times) do not add value but they do add cost. JIT aims to reduce and eliminate non-value adding activities. Supplier relations Under a JIT system a company would move towards having fewer suppliers and would build long term relationships with them. The ability to work with the minimum level of inventory will be dependent on having a guaranteed supply of quality resources. Consequently the selection of suppliers will tend not to be based on price alone. Answer to (f)
£ House-keeping £125,000 x 90% x 106% 119,250Nursing: variable £80,000 x 125% x 90% x 108% x 105% 102,060Nursing: fixed £200,000 x 108% x 105% 226,800Administration £100,000 x 104% 104,000
Workings: Period 2’s nursing costs included an uplift of 108% for cost changes. Stripping out the cost change for Period 2 gives an equivalent cost of £300,000 to be used in comparison with Period 1. The total cost rise of £20,000 from Period 1 was caused by the volume change on the variable costs. The volume change was 25% and therefore the variable costs in Period 1 were £80,000.

November 2007 31 P1
SECTION C Answer to Question Three Requirement (a)
Budget Kitchens Bathrooms Group Profit $8m $3m $11m 4,000 x 2000 2,000 x 1,500 Actual Profit $6·5m $2·25m $8·75m 2,600 x 2500 2,500 x 900 Under-absorbed $4·75m $4·00m Absorbed 12·75m (2·6 x 2·5 + 2·5 x 2·5) Actual 17·5m Underabsorbed 4·75m
Requirement (b) Sales Price Variances Kitchens: 2,600 x (13,000 – 10,000) = $7·8m favourable Bathrooms: 2,500 x (6,100 – 7,000) = $2·25m adverse Total sales price variance = $5·55m favourable Sales Mix Profit Variances Kitchens: (2,600 – 3,400) x $2,000 = $1·6m adverse Bathrooms: (2,500 – 1,700) x $1,500 = $1·2m favourable Total Sales mix profit variance = $0·4m adverse Note: alternative calculations of $0·1333m adverse and $0·2666m adverse would also be accepted. Sales Quantity Profit variances Kitchens: (3,400 – 4,000) x 2,000 = $1·2m adverse Bathrooms: (1,700 – 2,000) x 1,500 = $0·45m adverse Total sales quantity profit variance = $1·65m adverse Note: alternative calculations of $1·1m adverse and $0·55 adverse would also be accepted.

P1 32 November 2007
Requirement (c)
Kitchens Bathrooms Group $m $m $m Budgeted Profit 8·00 3·00 11·00 Sales mix 1·60 adv 1·20 fav 0·40 adv Sales quantity 1·20 adv 0·45 adv 1·65 adv Expected profit on actual sales 5·20 3·75 8·95 Sales price variances 7·80 fav 2·25 adv 5·55 fav 14·50 Direct costs 6·50 adv 0·75 fav 5·75 adv Central services expenditure 2·50 adv Central services volume 2·25 adv Actual profit 6·50 2·25 4·00
Requirement (d) To: Managing Director of WC From: Management Accountant Date: November 2007 Terms of Reference: Review of performance and changes to the system Introduction It is clear to see that the group did not achieve the budgeted profit but the budgeting and reporting system does not currently provide enough information for a full review of performance to take place. A major problem contributing to the lack of clarity within the system is the treatment of the costs incurred by the Central Services division. Performance review and suggestions Profit The profit for the group is a lot lower than budgeted even though the system would show that the profits of each of the divisions are not as severely affected. This is caused by the treatment of the recharge for the Central Services division. The Central Services costs are underabsorbed as a result of the volume of jobs and the increased expenditure. Sales Sales volume, in terms of individual jobs was lower than budget for the Kitchens division but higher than budget for the Bathrooms division. This is reflected in the sales mix and quantity profit variances. The sales price variances show that the average price per kitchen was higher than budgeted and the average price per bathroom was lower than budgeted. Perhaps the Kitchens division undertook more customised jobs, and the reverse for the Bathrooms division. The current level of information that the system provides does not reveal the type of jobs undertaken. Although the system tries to be “sophisticated” by calculating mix and quantity variances for the sales of kitchens and bathrooms it is questionable how meaningful this information is. A better analysis of sales would be to look within each division. For example better management information could be provided by analysing the sales into “customised” and “off the shelf” jobs. Direct costs The average costs per job also point to the sales mix within each division. Again more detail is needed. As a minimum the system should record details to enable the calculation of price, rate, usage and efficiency variances for the differing types of job. The reported variances appear to be as a result of the balance of the installations performed by the divisions. For example, the higher direct costs in the Kitchens division is likely to be interrelated with the higher average selling price

November 2007 33 P1
Central services recharge The current treatment of the charges for the Central Services division can lead to many problems within the group. The Central Services include design, administration and finance and therefore it would seem inappropriate to use one blanket rate to cover the use of these three services. The charge per job does not reflect the demands placed on the Central Services by the division. For example the costs of the designers will be driven by the number of designs that they do. Consequently if there are a lot of customised jobs the workload, and therefore costs, of the designing team will increase. The Kitchens and Bathrooms divisions do not face any financial penalty for the demands they place on Central Services. One way to improve the situation could be to set up a Design Division and to make it a profit centre: the divisions would be charged individually for each job based on the specific work undertaken. Answer to Question Four Requirement (a)
Europe Increased contribution 200,000 x $45 $9m Increased fixed costs $6m Net increase in profit $3m
America: Extra cost of chips of 300,000 x $5 = $1·5m reduction in profit
Group Profit = $3m – $1·5m = $1·5m increase in profit Requirement (b) (i) The sales would need to cover the lost contribution from the external sales of $4·5m (100,000 x $45) and the increased fixed costs of $6m. Total contribution needed = $10·5m. This is from 300,000 chips and therefore the contribution per chip is $35. The variable cost of selling to America is $95 - $45 = $50 per chip Minimum price = $85 per chip Requirement (b) (ii) Need to cover the lost contribution of $4·5m and generate a return of $8·1m (calculated as 135% on the increased fixed costs of $6m). This totals $12·6m. Contribution per chip = $12·6m/300,000 = $42 Minimum price = $92 per chip Requirement (c) To: Group Managing Director From: Management Accountant Date: November 2007 Terms of Reference: Issues surrounding internal transfers and performance measures Introduction By issuing the directive that the American subsidiary must source its components from the European subsidiary you will be immediately taking away some of the autonomy of the managers. This could have a major impact on the behaviour and attitude of the managers. This will be compounded by issues surrounding the price of the transfers and this in turn is further complicated by the impact of a performance measurement system.

P1 34 November 2007
Transfer Pricing It is evident from the calculations that it is in the Group’s best interest for the chips to be supplied from Europe; the group’s profit would increase by $1·5m. There is also the possibility that a lower price for the chips could allow the American subsidiary to lower the price of the assembled computer and increase its sales volume and thereby earn even more profits. However the price quoted of $95 per chip by the European manager is clearly not acceptable to the American subsidiary as they can be bought locally for $90. This should be the maximum level of the transfer price. The minimum transfer price should be the sum of the selling division’s marginal cost and the opportunity cost. If output was restricted to 600,000 units this would be $105 but output can be raised above the current maximum demand and consequently the chip plant has some spare capacity. This will allow a price of $85 per chip. Transfer pricing is a tricky area. If you impose a transfer price on the managers then it will take away some of their autonomy and consequently it will be better if the managers are allowed, if possible, to come to a mutually agreeable price. The price that is used should encourage goal congruence, motivate the managers and facilitate performance measurement. Performance Measures Performance measures should encourage goal congruence. If an unsuitable measure is chosen it is possible that managers will be encouraged to act in a way that does not lead to the optimal performance for the group. You have suggested two measures but careful thought should be given before you implement them. Using “profit” as a measure will allow the manager of the European plant to set a transfer price that will enhance the group’s profits. However the manager may be reluctant to do so: at a price of $85 he will have to manage and control additional fixed costs of $6m and the production of an extra 200,000 chips which will take the plant up to its maximum capacity. Using your idea of “return on assets consumed” will not promote goal congruence. The price needed by the European manager of $92 per chip does not satisfy the requirements. It is also higher than the price that can be paid in the open market. Problems can arise when managers react to a single measure of performance, especially if it is a financial measure. An effective performance measurement system should emphasise both financial and non financial measures and encourage behaviour that is in line with the group’s objectives. One way to overcome these problems is to use a series of financial and non-financial measures in a balanced scorecard. Requirement (d) If the taxation rates are different in the countries in which the subsidiaries are based it is possible to set the transfer price to reduce the overall tax paid by the group. The objective will be to maximise the profit in the country that has the lowest tax rate. For example, in this case, if the tax rate is lower in America than in Europe, a low transfer price would be charged in order to produce a higher profit in America and a lower profit in Europe. Transfer prices are monitored by taxation authorities and they will penalise companies they think are manipulating transfer prices. Guidelines were drawn up in 1995 by the Organisation for Economic Co-operation and Development (OECD) to standardise national approaches to transfer pricing. The guidelines were based on using an “arm’s length price”. In the USA.companies are required to provide evidence to justify the transfer price being charged.