ci resources limited for personal use only · 2013. 10. 7. · xi feng international pte ltd ci...
TRANSCRIPT

Annual Report – 30 June 2013
CI Resources Limited
Annual Report
For the financial year ended 30 June 2013
For
per
sona
l use
onl
y

Annual Report – 30 June 2013
2
CI Resources Limited ACN 006 788 754
Contents Page
Chairman’s letter 3
Corporate directory 4
Directors' report 5
Auditor’s independence declaration 17
Corporate Governance Disclosures 18
Financial report 19
Directors' declaration 64
Independent audit report to the members 65
ASX additional information 67
For
per
sona
l use
onl
y

CI RESOURCES LIMITED
Chairman’s Letter
Annual Report – 30 June 2013
3
Dear Shareholder
I am pleased to provide the Annual Report for CI Resources Limited (Company) (CI Resources) for the year
ended 30 June 2013, for the operations of the Company and its principal subsidiary Phosphate Resources Limited
(PRL). The Company holds 63.05% of the issued shares in PRL and is represented on the Board of PRL by Mr
Tee Lip Sin, Mr Tee Lip Jen and Dato' Kamaruddin bin Mohammed.
The reported Statement of Consolidated Income (Profit and Loss) for CI Resources reflects a Net Profit
attributable to members of the Company of AUD$12.93 million. This equates to an Earnings Per Share of 17.75
cents.
This is another excellent result for the Company based upon continued strong performance from the operations of
PRL.
PRL Group consolidated net profit after tax of $24.19 million included $20.88 million profit attributed to the
phosphate mining operations on Christmas Island and $2.08 million profit being achieved from palm oil
plantation and milling operations in the Malaysian peninsula.
As reported by the Managing Director of PRL, Mr Lai Ah Hong, PRL performed well during the financial year,
with a strong profit, and increase in tonnes of phosphate shipped. Mr Lai has warned against complacency, with
increased market pressure on existing markets and downward pressure on prices due to a weaker market in palm
oil. CK Plantations Sdn Bhd achieved a profit after tax of $2.08 million, which was a disappointing result due to
a major slump in CPO prices. Nevertheless, the Board of PRL is confident that the investment will continue to
provide a reasonable return to PRL for the foreseeable future. CI Maintenance Services Pty Ltd, a 100% owned
subsidiary has performed strongly, and successfully won a contract for a further 3 years of administration
management and maintenance services to the Commonwealth Department of Immigration and Citizenship.
A major success for PRL during the year came with the Minister’s approval of a renewed mining lease for a
further 21 years, extending the tenure on the primary mining lease until 2034. This lease extension provides
further security for the medium term outlook for mining operations on Christmas Island. Conversely, the
Chairman of PRL, Mr Clive Brown has provided a cautious outlook due to challenges of quantifying reserves
available to sustain viable mining operations, given current bureaucratic regulatory processes.
During the year, PRL shareholders were provided with the opportunity to participate in a Share Buyback, which
saw some 555,200 shares repurchased by PRL for an amount of $11.1 million. CI resources participated in the
Buyback to a limited extent, with the net result, being an increase in effective shareholding in PRL to 63.05%.
The Board of CII is supportive of the activities of PRL, which continues to maximise opportunities, with the clear
intent to increase value to shareholders for both the short term and long term.
As Chairman of CI Resources, I would like to thank the Board of CI Resource for their efforts over the year, and
to recognise and thank the Board and management of PRL for their dedication and performance over the year.
Yours sincerely
DAVID SOMERVILLE Executive Chairman
For
per
sona
l use
onl
y

CI RESOURCES LIMITED
Corporate directory
Annual Report – 30 June 2013
4
Directors Stock exchange listings
Mr David Somerville – Chairman CI Resources Limited shares are
listed on the Australian Securities Exchange
Mr Tee Lip Sin
Ordinary fully paid shares (ASX code CII)
Mr Tee Lip Jen
Principal registered office in Australia
Mr Adrian Gurgone 12 Lyall Street
South Perth WA 6151
Mr Kelvin Keh Feng Tan
Telephone +61 8 9489 4444
Mr Dato’ Kamaruddin (appointed 17/01/2013)
Email [email protected]
Website www.ciresources.com.au
Share register
Computershare Investor Services Pty Ltd
Level 2 Reserve Bank Building
45 St Georges Terrace
Perth WA 6000
Telephone +61 8 9323 2000
Facsimile +61 8 9323 2033
Auditor
Ernst & Young
11 Mounts Bay Road
Perth WA 6000
Solicitors
Steinepreis Paganin Lawyers
Level 4 Next Building
16 Milligan Street
Perth WA 6000
Bankers
National Australia Bank
1238 Hay Street
West Perth WA 6005
For
per
sona
l use
onl
y

CI RESOURCES LIMITED
Directors’ report
Annual Report – 30 June 2013
5
Your directors present their report on the consolidated entity (“Group”) consisting of CI Resources Limited (“CII” or “Company”) and the entities it controlled at the end of, or during, the financial year ended 30 June 2013. Directors
The following persons were directors of CI Resources Limited for the whole of the financial year and up to the date of this report, unless otherwise stated: Mr David Somerville
Mr Tee Lip Sin
Mr Tee Lip Jen
Mr Adrian Gurgone
Mr Kelvin Keh Feng Tan
Mr Dato’ Kamaruddin (appointed director 21/09/2012)
Prof. Anthony Brennan (resigned 23/11/2012) Principal activities
During the year, the principal activities of entities within the consolidated entity were:
• mining, processing and sale of phosphate rock, phosphate dust and chalk; and
• providing earthmoving, fuel pilotage, maintenance and stevedoring services to other Christmas Island organizations.
• running a palm oil estate, processing and sale of palm oil products.
Dividends
Dividends totaling 1.0 cent per share have been declared and paid during the year ended 30 June 2013. The Directors do not recommend the payment of a final dividend in respect of the year ended 30 June 2013. No final dividend has been declared or paid. Review of operations
A summary of consolidated revenues and results is set out below:
Results
2013
$’000s
Revenue from continuing operations
154,621
Profit before income tax expense
34,684
Income tax expense
(10,322)
Net Profit after income tax expense
24,362
Profit attributable to members of CI Resources Limited
12,934
For
per
sona
l use
onl
y

CI RESOURCES LIMITED
Directors’ report
Annual Report – 30 June 2013
6
Review of operations (continued)
Financial Position
At the end of the financial period the consolidated entity had net cash balances of $40.58 million (2012: $36.61 million) and net assets of $111.80 million (2012: $97.14 M).million. Total liabilities amounted to $57.51 million (2012: $64.31 million), being trade and other creditors, borrowings and taxation liabilities. Phosphate Resources Limited
During the financial year CI Resources continued to acquire shares in Phosphate Resources Limited (PRL). In September 2012, CI Resources acquired a further 100,000 shares under the Creep provisions of the Corporations Act 2001increasing the Company’s holdings in PRL holding to 53.41% of total voting issued capital. In June after PRL completed its Share Buy Back offer to eligible shareholders, CI Resources interest in PRL’s total voting issued capital has grown to 63.05%. The Company is represented on the Board of PRL by Mr Tee Lip Sin, Mr Tee Lip Jen and Dato' Kamaruddin bin Mohammed. PRL posted a post-tax profit of $24.19 million for the year ended 30 June 2013, and paid one dividend during this time. The Company received a total dividend of $1.47 million in dividends from PRL with $1.10 million related to the November dividend and $0.37 million related to the share buyback offer in which the Company participated. Xi Feng International Pte Ltd
CI Resources deregistered this company during the year.
Earnings per share 2013
Cents
2012
Cents
Basic earnings per share 17.75 15.5 Significant changes in the state of affairs
There was no significant change in the state of affairs of the Company or its controlled entities during the financial year other than that referred to in the financial statements or notes thereto.
Matters subsequent to the end of the financial year There are no matters or circumstances that have arisen since 30 June 2013 that has significantly affected, or may significantly affect:
(a) the consolidated entity’s operations in future financial years, or
(b) the results of those operations in future financial years, or
(c) the consolidated entity’s state of affairs in future financial years.
For
per
sona
l use
onl
y

CI RESOURCES LIMITED
Directors’ report
Annual Report – 30 June 2013
7
Likely developments and expected results of operations
The Directors note that current strategies suggest that the 2014 financial year will see the Consolidated Entity remain profitable and in line with the performance of the current year.
Further information on likely developments in the operations of the consolidated entity and the expected results of those operations have not been included in this report because the Directors believe that it would be likely to result in unreasonable prejudice to the Company. Environmental regulation
The Consolidated Entity’s operations are subject to environmental regulations in relation to its mining and exploration activities on Christmas Island. Licenses issue by the Commonwealth Government of Australia include general environmental conditions, air pollution control conditions and water control conditions. These conditions regulate the management of mining waste and restoration, dust, liquid chemical storage and water monitoring. There have been no significant known breaches of the Consolidated Entity’s licenses. Rounding
The amounts contained in this report and in the financial report have been rounded to the nearest $1,000 (where rounding is applicable) under the option available to the Company under the ASIC Class Order 98/0100. The Company is an entity to which the Class Order applies.
Information on directors MR DAVID SOMERVILLE Chairman – Non-executive
Experience and expertise
David Somerville holds a Bachelor of Business degree from Curtin University and a Master of Business Administration from Deakin University, he is an Associate member of CPA Australia and a Fellow of the Australian Institute of Management. Mr Somerville has an accounting background having been a senior partner in a large Western Australian accounting practice, before establishing a financial services company which listed on the Australian Securities Exchange in 2007. He has over 25 years experience in a corporate capacity across a number of companies and a number of industry sectors including financial, resources and property development.
Other directorships
David Somerville is a director of Questus Ltd, an ASX Listed company. David was also a director of Energy Made Clean Ltd, a public unlisted company until 5 April 2013.
MR TEE LIP SIN Director – Non-executive
Experience and expertise
Tee Lip Sin holds an Associate Diploma in Commerce from Curtin University Australia and also a post-graduate Executive Diploma in Plantation Management from the University Malaya.
He has been involved in palm oil milling and management of palm oil plantations since 1995. Currently, he sits on the board of a number of private companies, and is also the Executive Director for the Prosper Group Of Companies which holds six palm oil mills and 50,000 acres of palm oil plantations. He also has experience in operating 35,000 acres of plantation in Indonesia. Other directorships
Mr Tee Lip Sin held no other directorships of ASX listed companies during the last three years.
For
per
sona
l use
onl
y

CI RESOURCES LIMITED
Directors’ report
Annual Report – 30 June 2013
8
Information on directors (continued) MR TEE LIP JEN Director – Non-executive
Experience and expertise
Mr Tee holds a Bachelor of Mechanical Engineering from the Royal Melbourne Institute of Technology (RMIT). Since graduating from Australia, Lip Jen started his career as a Process Engineer in the manufacturing industry for 2 years before expanding his experience as a Project Engineer in a refinery plant specialising in producing downstream palm oil products. He is currently the Assistant Chief Engineer in charge of overseeing engineering and production activities in seven palm oil mills with an estimated production output of 350,000 metric tonnes of crude palm oil per year. Apart from managing the daily activities in palm oil mills, he is also in charge of overseeing three palm oil plantation estates located in Negeri Sembilan, Malaysia with an estimated acreage of 3,400 acres. Other directorships
Mr Tee Lip Jen held no other directorships of ASX listed companies during the last three years. MR ADRIAN GURGONE Director – Non-executive
Experience and expertise
Mr Gurgone is an experienced Chartered Accountant and MBA with significant experience in reporting to boards. In senior roles with Deloitte Consulting along with a UK top-tier consulting firm, he has advised multinational and mid-cap organisations across a variety of industries globally. In 2007 Adrian established a boutique management consultancy and investment firm which has grown quickly to service several ASX listed organisations, in addition to federal government and not for profit agencies. His experience encompasses financial and business analysis, risk management and corporate governance across a range of industries including mining and resources. Adrian has also assisted several boards in Australia and overseas in improving organisational performance and in capital allocation. Other directorships
Mr Adrian Gurgone held no other directorships of ASX listed companies during the last three years. PROF. ANTHONY BRENNAN Director – Non-executive (resigned 23/11/2012)
Experience and expertise
Prof. Brennan holds a Bachelor of Laws degree from the University of Queensland, a Graduate Diploma in Legal Practice and has practised with one of Australia’s largest private law firms as a solicitor in the area of corporate advisory, mergers and acquisitions and banking and finance. He has experience in corporate banking and finance transactions including development finance and refinance transactions, infrastructure and project finance, loan facility and security documentation, general corporate banking matters and significant commercial property transactions. Other directorships
Anthony Brennan was a director of Questus Ltd (resigned 22 May 2012), an ASX listed company. Anthony has also been a director of public unlisted companies Phosphate Resources Limited and Western Potatoes Limited in the past 3 years. MR KELVIN KEH FENG TAN Director – Non-executive (appointed 07/06/2012) Experience and expertise
Kelvin Tan Keh Feng holds a B. Sc (Hons) degree in Business Study from University of Bradford, England. He has been working in the Palm Oil industry for more than 26 years mainly in Sales and Marketing and recently has taken on the management of the Administration Dept of Prosper Sdn Bhd (“Prosper”). He is currently in charge of administrative, marketing and shipping of timber for the Prosper’s Papua New Guinea project.
For
per
sona
l use
onl
y

CI RESOURCES LIMITED
Directors’ report
Annual Report – 30 June 2013
9
Other directorships
Mr Kelvin Keh Feng Tan held no other directorships of ASX listed companies during the last three years. Information on directors (continued) Dato' Kamaruddin bin Mohammed Director – Non-executive (appointed 17/01/2013) Experience and expertise
Dato' Kamaruddin is a business and finance graduate and a Senior Fellow of Financial Services Institute of Australasia. He has had an extensive business career with Amanah Saham MARA Berhad retiring as Group Managing Director in 2008. He has had considerable experience with the palm oil industry and is currently chairman of the Malaysian listed palm oil group Far East Holdings Berhad. He is also the Chairman of Pascorp Paper Industries Berhad and Director of Amanah Saham Pahang Berhad, YTL Cement Berhad and Pasdec Resources South Africa Ltd. Ltd. Other directorships
Dato' Kamaruddin bin Mohammed held no other directorships of ASX listed companies during the last three years. Company Secretary MS ELIZABETH LEE, – B Bus, FCIS, Grad.Dip. Corp. Gov. ASX Listed Entities Company Secretary (Appointed 8 February 2011) Elizabeth has over 19 years experience in the areas of corporate governance and company secretarial functions. Prior to joining Questus, Elizabeth held company secretarial positions for Phosphate Resources Limited, Macmahon Holdings Limited, Corporate Compliance Partners and Lend Lease Primelife Limited. Elizabeth also performed contract company secretarial roles with Macquarie Bank Limited and Austock Group Limited. Elizabeth holds a Bachelor of Business majoring in Finance and Business Law from Edith Cowan University, a Graduate Diploma in Corporate Governance from Chartered Secretaries Australia, a Graduate Diploma in Corporate governance for ASX Listed Entities from Kaplan Financial Institute and is a Fellow member of the Chartered Secretaries in Australia. Directors’ interests in shares and options As at the date of this report the interests of the Directors in the shares and options of the Company were: Ordinary Shares Options over Ordinary Shares Direct Indirect
Direct Indirect
Mr David Somerville - - - -
Mr Tee Lip Sin - 14,566,876 - -
Mr Tee Lip Jen - - - -
Mr Kelvin Tan Keh Feng - 12,000,000 - -
Prof. Anthony Brennan * - - - -
Mr Adrian Gurgone - - - -
Dato’ Kamaruddin - - - -
* Professor Anthony Brennan resigned as a director on the 23/11/2012
For
per
sona
l use
onl
y

CI RESOURCES LIMITED
Directors’ report
Annual Report – 30 June 2013
10
Meetings of directors
The number of meetings of the Company’s board of directors held during the year ended 30 June 2013 and the number of meetings attended by each director were:
Full meetings of Directors Held Attended Mr David Somerville
4 4 Mr Tee Lip Sin
4 4 Mr Tee Lip Jen
4 4 Prof. Anthony Brennan
2 1 Mr Adrian Gurgone
4 4 Mr Kelvin Tan Keh Feng
4 3 Mr Dato’ Kamaruddin
2 2
Held – denoted the number of meetings held during the time the director held office. Retirement, election and continuation in office of directors In accordance with the Constitution Mr Lip Sin Tee will retire, in rotation, as director at the Annual General Meeting to be held in November 2013 and, being eligible, will offer himself for re-election. Dato' Kamaruddin bin Mohammed appointments will be put forward for ratification. . Remuneration report (Audited)
The remuneration report is set out under the following main headings:
A Principles used to determine the nature and amount of remuneration B Details of remuneration C Service agreements D Share-based compensation E Additional information The information in this section has been audited as required by section 308(3c) of the Corporations Act 2001. A Principles used to determine the nature and amount of remuneration
In order to maintain and attract directors to facilitate the efficient and effective management of the Consolidated Entity’s operations, the board reviews the remuneration of directors on an annual basis and makes recommendations. The Company does not have a remuneration committee. Aside from the discretionary bonus disclosed in the remuneration report, no other link exists, at this stage in the Company’s development, between financial performance, shareholder wealth and the remuneration of Directors and Key Management Personnel. Non-executive directors
Fees and payments to non-executive directors reflect the demands which are made on, and the responsibilities of, the directors. Non-executive directors’ fees and payments are reviewed annually by the Board. The Board also ensures non-executive directors’ fees and payments are appropriate and in line with the market as determined by comparison with companies of a similar size. The Chairman’s fees are determined independently to the fees of non-executive directors based on comparative roles in the external market. The Chairman is not present at any discussions relating to determination of his own remuneration.
For
per
sona
l use
onl
y

CI RESOURCES LIMITED
Directors’ report
Annual Report – 30 June 2013
11
Remuneration report (Audited) (continued) Directors’ fees
The current base remuneration was last reviewed with effect from 1st July 2013. Directors’ remuneration is inclusive of committee fees. Non-executive directors’ fees are determined within an aggregate directors’ fee pool limit, which is periodically recommended for approval by shareholders. The total maximum currently stands at $400,000. Remuneration packages may contain the following key elements:
• Director’s fees
• Consultancy fees
• Post-employment benefits – superannuation
• Performance bonuses
• Other non-cash benefits The directors are also remunerated for any additional services they render the Company and such services are carried out under normal commercial terms and conditions. Engagement and payment for such services are approved by the other directors with no interest in the engagement of such services. Executive remuneration
The objective of the Consolidated Entity’s executive reward framework is to ensure reward for performance is competitive and appropriate for the results delivered. The framework aligns executive reward with achievement of strategic objectives and the creation of value for shareholders, and conforms with market best practice for delivery of reward. The Board ensures that executive reward satisfies the following key criteria for good reward governance practices:
• competitiveness and reasonableness
• acceptability to shareholders
• performance linkage / alignment of executive compensation
• transparency
• capital management. The Consolidated Entity has structured an executive remuneration framework that is market competitive and complimentary to the reward strategy of the organisation. Alignment to shareholders’ interests:
• focuses on exploration success as the creation of shareholder value and returns
• attracts and retains high calibre executives. Alignment to program participants’ interests:
• rewards capability and experience
• reflects competitive reward for contribution to growth in shareholder wealth
• provides a clear structure for earning rewards
• provides recognition for contribution. The executive pay and reward framework has the following components:
• Fixed remuneration (base salary, superannuation & other non-monetary benefits)
• Variable Remuneration (incentives through participation in bonus arrangements) The combination of these components comprises the executive’s total remuneration.
For
per
sona
l use
onl
y

CI RESOURCES LIMITED
Directors’ report
Annual Report – 30 June 2013
12
Remuneration report (Audited) (continued)
Fixed Remuneration
• Base salary
Structured as a total employment cost package which may be delivered as a combination of cash and prescribed non-financial benefits at the executives’ discretion.
Executives are offered a competitive base pay that comprises the fixed component of pay and rewards. Base pay for senior executives is reviewed annually to ensure the executive’s pay is competitive with the market.
• Non-monetary benefits
Executives may receive benefits including memberships, car allowances and reasonable entertainment. • Retirement benefits
Directors and employees are permitted to nominate a superannuation fund of their choice to receive superannuation contributions.
Retirement allowances for directors
There is no provision for retirement allowances for non-executive directors.
B Details of remuneration
During the financial year to 30 June 2013 the directors and key management personnel of the Company were:
Directors of CI Resources Limited
Mr David Somerville – Non-executive Chairman
Mr Tee Lip Sin – Non-executive director
Mr Tee Lip Jen – Non-executive director
Mr Adrian Gurgone – Non-executive director Mr Kelvin Tan Keh Feng – Non-executive director
Prof. Anthony Brennan – Non-executive director (resigned 23 November 2012)
Dato' Kamaruddin bin Mohammed – Non-executive director (appointed 21 September 2012)
Other key management personnel of CI Resources Limited
Ms Elizabeth Lee – Company Secretary
For
per
sona
l use
onl
y

CI RESOURCES LIMITED
Directors’ report
Annual Report – 30 June 2013
13
Remuneration report (Audited) (continued) Details of the remuneration of the directors and the key management personnel of the Group are set out in the following tables.
2013
Short-term benefits
Post-employment
benefits
Name
Cash fees and
consulting $
Bonus $
Non-
monetary benefits
$
Superannuati
on $
Total $
Performance
related
Directors of CI Resources Limited
Mr David Somerville 71,500 - 2,920 - 74,420 - Mr Tee Lip Sin 30,000 - 2,920 - 32,920 - Mr Tee Lip Jen 30,000 - 2,920 - 32,920 - Prof. Anthony Brennan 17,476 - 1,168 - 18,644 - Mr Adrian Gurgone 44,000 - 2,920 - 46,920 - Mr Kelvin Keh Feng Tan 31,916 - 2,920 - 34,836 - Dato' Kamaruddin bin Mohammed 13,629 - 1,312 - 14,941 -
Other key management personnel – CI Resources Limited
Questus Administration Services Pty Ltd (Acctg and Secretarial) *
87,026 - - - 87,026 -
Elizabeth Lee - - - - - -
Total 325,547 - 17,080 - 342,627 -
* David Somerville is a director of Questus Administration Services Pty Ltd The non-monetary benefits include the provision of Directors and Officers insurance.
2012
Short-term benefits
Post-employment
benefits
Name
Cash fees and
consulting $
Bonus $
Non-
monetary benefits
$
Superannuati
on $
Total $
Performance
related
Directors of CI Resources Limited
Mr David Somerville 89,375 - 3,089 - 92,464 - Mr Tee Lip Sin 37,500 - 3,089 - 40,589 - Mr Tee Lip Jen 37,500 - 3,089 - 40,589 - Prof. Anthony Brennan 39,205 - 3,089 - 42,294 - Mr Adrian Gurgone 44,000 - 3,089 - 47,089 - Mr Kelvin Keh Feng Tan - - 195 - 195 - Mr Phuar Kong Seng 15,000 - 1,946 - 16,946 -
Other key management personnel – CI Resources Limited
Questus Administration Services Pty Ltd (Acctg and Secretarial) *
72,699 - - - 72,699 -
Elizabeth Lee - - - - - -
Total 335,279 - 17,586 - 352,865 -
* David Somerville is a director of Questus Administration Services Pty Ltd The non-monetary benefits include the provision of Directors and Officers insurance.
For
per
sona
l use
onl
y

CI RESOURCES LIMITED
Directors’ report
Annual Report – 30 June 2013
14
Remuneration report (Audited) (continued)
Company’s Performance
Company’s share price performance
The Company’s share price performance shown in the below graph is a reflection of the Company’s performance
during the year.
The graph below shows the Company’s share price performance during the financial year ended 30 June 2013.
Profit/ (Loss) per share
Below is information on the Consolidated Entity’s profit/ (loss) per share for the previous four financial years and
for the current year ended 30 June 2013.
2013 2012 2011 2010 2009
Basic profit/(loss) per share (cents) 17.75 15.5 6.2 7.9 24.19
Awards
No awards were paid or payable during the year.
For
per
sona
l use
onl
y

CI RESOURCES LIMITED
Directors’ report
Annual Report – 30 June 2013
15
Remuneration report (Audited) (continued) C Service Agreements
Remuneration and other terms of employment for the directors are not formalised in service agreements. The agreement for the Company Secretary of CI Resources Limited provides for the provision of consulting fees. Major provisions of the agreements relating to remuneration are set out below. Questus Administration Services Pty Ltd - Company Secretary and Accounting
• Term of agreement – For a period of 3 years, expiring 8 June 2014.
• Base fee of $7,277 per month for the provision of company secretarial services and an hourly rate of $180 per hour for additional work outside the scope of this contract.
D Share-based compensation
There were no share based payments to directors or other key management personnel during this or the previous financial year. E Additional information
Given CI Resources Limited is involved in investment activities, the remuneration of the persons referred to above is not dependent on the satisfaction of a performance condition. Loans to directors and executives
There are no loans to directors or executives. Shares under option
There are no unissued ordinary shares of CI Resources Limited under option at the date of this report.
- End of Audited Remuneration Report –
Shares issued on the exercise of options There were no options over ordinary shares and no ordinary shares of CI Resources Limited issued during the period ended 30 June 2013 on the exercise of options. Insurance of officers During the period the Company paid a premium to insure the directors and officers of the Company. Under the terms of the policy the Company cannot publish amounts paid for premiums or the extent of the liabilities insured. Proceedings on behalf of the Company No person has applied to the Court under section 237 of the Corporations Act 2001 for leave to bring proceedings on behalf of the Company, or to intervene in any proceedings to which the Company is a party, for the purpose of taking responsibility on behalf of the Company for all or part of those proceedings. No proceedings have been brought or intervened in on behalf of the Company with leave of the Court under section 237 of the Corporations Act 2001.
For
per
sona
l use
onl
y

CI RESOURCES LIMITED
Directors’ report
Annual Report – 30 June 2013
16
Non-audit services The following non-audit services were provided by the entity's auditor, Ernst & Young. The directors are satisfied that the provision of non-audit services is compatible with the general standard of independence for auditors imposed by the Corporations Act 2001. The nature and scope of each type of non-audit service provided means that auditor independence was not compromised. Ernst & Young received or are due to receive the following amounts for the provision of non-audit services: 2013 2012 Ernst & Young received or are due to receive the following amounts for the provision of non-audit services:
General Accounting Advice
- CI Resources - -
- Other members of the Group - 15,000
No non-audit services were provided by the Auditors during the year ended 30 June 2012. Auditors’ Independence Declaration A copy of the auditors’ independence declaration as required under section 307C of the Corporations Act 2001 is set out on page 18. Auditor Ernst & Young continues in office in accordance with section 327 of the Corporations Act 2001. This report is made in accordance with a resolution of the directors. D Somerville Chairman Perth, Western Australia 27 September 2013
For
per
sona
l use
onl
y

A member firm of Ernst & Young Global Limited Liability limited by a scheme approved under Professional Standards Legislation
RC:DR:CI RESOURCES:037
Ernst & Young 11 Mounts Bay Road Perth WA 6000 Australia GPO Box M939 Perth WA 6843
Tel: +61 8 9429 2222 Fax: +61 8 9429 2436 ey.com/au
Auditor’s Independence Declaration to the Directors of CI Resources Limited
In relation to our audit of the financial report of CI Resources Limited for the year ended 30 June 2013, to the best of my knowledge and belief, there have been no contraventions of the auditor independence requirements of the Corporations Act 2001 or any applicable code of professional conduct. Ernst & Young R J Curtin Partner Perth 27 September 2013
For
per
sona
l use
onl
y

CI RESOURCES LIMITED
Corporate Governance disclosures
Annual Report – 30 June 2013
18
During the Consolidated Entity’s financial period the Group has complied with the ASX Principles and Recommendations other than in relation to the matters specified below:
Principle Ref.
Recommendation Ref.
Notification of Departure Explanation for Departure
2
2.1
A majority of board members are not independent directors
Three of the six board members are considered to be independent including the chairman in accordance with the ASX definition. In view of the size of the Company and the nature of its activities the board considers that the current board is a cost effective and practical method of directing and managing the Company.
2
2.4
The board has not established a nomination committee
The board has no formal nomination committee. Acting in its ordinary capacity from time to time as required, the board carries out the process of determining the need for, screening and appointment of new directors. In view of the size of the Company and resources available, it is not considered that a separate nomination committee would add any substance to this process.
8 8.1 The board has not established a remuneration committee
The full board is responsible for setting remuneration levels and individual performance targets. Due to the size of the Company it is considered to be efficient and cost effective. Advice from professional independent advisors will be sought where necessary.
For
per
sona
l use
onl
y

Annual Report – 30 June 2013
19
CI Resources Limited
Financial report – For the financial year ended 30 June 2013 Contents Page
Financial report
Consolidated Statement of Comprehensive Income 20
Consolidated Statement of Financial Position 21
Consolidated Statement of Changes in Equity 22
Consolidated Statement of Cash Flows 23
Notes to the financial statements 24
Directors’ declaration 64
Independent audit report to the members 65
CI Resources Limited is a company limited by shares, incorporated and domiciled in Australia. Its registered office and principal place of business is:
12 Lyall Street South Perth WA 6151
A description of the nature of the consolidated entity’s operations and its principal activities is included in the directors’ report, which is not part of this financial report. The financial report was authorised for issue by the directors on 27 September 2013. The consolidated entity has the power to amend and reissue the financial report. Through the use of the internet, we have ensured that our corporate reporting is timely, complete and available globally at minimum cost to the consolidated entity. All press releases, financial reports and other information are available on our website: www.ciresources.com.au For queries in relation to our reporting please call +61 8 9489 4444 or e-mail [email protected]
For
per
sona
l use
onl
y

CI RESOURCES LIMITED
Consolidated Statement of Comprehensive Income For the financial year ended 30 June 2013
Annual Report – 30 June 2013
20
Consolidated
Notes
2013
$’000s
2012
$’000s
Revenue from continuing operations 3a 154,621 137,292
Cost of sales 3b (102,822) (87,272)
Gross Profit 51,799 50,020
Other income 3c 842 1,220
Other expenses 3d (16,909) (15,689)
Finance costs (1,048) (1,511)
Profit from continuing operations before income tax 34,684 34,040
Income tax expense 4 (10,322) (11,168)
Profit for the period after income tax 24,362 22,872
Other comprehensive income:
Items that may be reclassified subsequently to profit or loss:
Net currency translation differences 4,392 (173)
Other comprehensive income for the year 4,392 (173)
Total comprehensive income for the year 28,754 22,699
Profit is attributable to:
Non-controlling interest 11,428 11,554
Members of CI Resources Limited 12,934 11,318
24,362 22,872
Total comprehensive income for the year is attributable to:
Non-controlling interest 13,020 11,554
Members of CI Resources Limited 15,734 11,145
28,754 22,699
Earnings per share for profit from continuing operations attributable to the ordinary equity holders of the parent
Basic earnings per share 17.75 cents 15.53 cents
Diluted earnings per share 17.75 cents 15.53 cents
Earnings per share for profit attributable to the ordinary equity holders of the parent:
Basic earnings per share 17.75 cents 15.53 cents
Diluted earnings per share 17.75 cents 15.53 cents
The above Consolidated Statement of Comprehensive Income should be read in conjunction with the accompanying notes
For
per
sona
l use
onl
y

CI RESOURCES LIMITED
Consolidated Statement of Financial Position As at 30 June 2013
Annual Report – 30 June 2013
21
Consolidated
Notes
2013
$’000s
2012
$’000s
Current assets
Cash and cash equivalents 6 40,582 36,606
Trade and other receivables 7 26,212 29,486
Derivative financial assets 8 - 384
Inventories 9 9,920 12,106
Total current assets 76,714 78,582
Non-current assets
Other Financial Asset 10 14,855 13,016
Plant & equipment 11 51,526 45,003
Goodwill 12 7,158 7,158
Biological assets 13 11,231 11,135
Deferred tax assets 7,831 6,549
Total non-current assets 92,601 82,861
Total assets 169,315 161,443
Current liabilities
Trade and other payables 15 10,536 10,197
Borrowings 16 5,904 5,599
Tax liability 17 877 6,307
Provisions 18 6,636 5,814
Total current liabilities 23,953 27,857
Non-current liabilities
Borrowings 20 5,446 9,863
Deferred tax liabilities 10,337 10,424
Provisions 21 17,778 16,162
Total non-current liabilities 33,561 36,449
Total liabilities 57,514 64,306
Net assets 111,801 97,137
Equity
Contributed equity 22 17,970 17,970
Reserves 23 11,212 1,653
Retained earnings 14 41,386 29,181
70,568 48,804
Non-controlling interest 41,233 48,333
Total equity 111,801 97,137
The above Consolidated Statement of Financial Position should be read in conjunction with the accompanying notes.
For
per
sona
l use
onl
y

CI RESOURCES LIMITED
Consolidated Statements of changes in Equity For the financial year ended 30 June 2013
Annual Report – 30 June 2013
22
Consolidated Contributed Equity
$’000s
Foreign currency
translation
Reserve
$’000s
Gain on Acquis-ition of
NCI
Retained earnings
$’000s
Owners of the Parent
$’000s
Non-controlling Interest
$’000s
Total
$’000s
1 July 2012 17,970 (87) 1,740 29,181 48,804 48,333 97,137
Profit for the year - - - 12,934 12,934 11,428 24,362
Other comprehensive income for the year
- 2,800 - - 2,800 1,592 4,392
Total comprehensive income for the year
- 2,800 - 12,934 15,734 13,020 28,754
Transactions with owners in
their capacity as owners:
Acquisition of Minority Interest - - 1,278 - 1,278 (2,978) (1,700)
PRL Share Buyback
Return of Capital - - 5,481 - 5,481 (6,182) (701)
Dividend paid - - - - - (10,003) (10,003)
Dividends paid - - - (729) (729) (957) (1,686)
30 June 2013 17,970 2,713 8,499 41,386 70,568 41,233 111,801
1 July 2011 17,970 86 1,587 18,592 38,235 38,549 76,784
Profit for the year - - - 11,318 11,318 11,554 22,872
Other comprehensive income for the year
- (173) - - (173) - (173)
Total comprehensive income for the year
- (173) - 11,318 11,145 11,554 22,699
Transactions with owners in
their capacity as owners:
Acquisition of Minority Interest - - 153 - 153 (414) (261)
Dividends paid - - - (729) (729) (1,356) (2,085)
30 June 2012 17,970 (87) 1,740 29,181 48,804 48,333 97,137
The above Consolidated Statement of Changes in Equity should be read in conjunction with the accompanying notes.
For
per
sona
l use
onl
y

CI RESOURCES LIMITED
Consolidated Statement of Cash Flows For the financial year ended 30 June 2013
Annual Report – 30 June 2013
23
Consolidated
Note
2013
$’000s
2012
$’000s
Cash flows from operating activities
Receipts from customers 176,170 132,296
Payments to suppliers and employees (inclusive of goods and services tax)
(124,447) (96,130)
Interest received 845 561
Borrowing Costs (1,048) (908)
Income taxes paid (17,889) (7,640)
Net cash flows (used in) / from operating activities after income tax
31 33,631 28,179
Cash flows from investing activities
Movement in term deposits (1,840) (2,827)
Proceeds from sale of property, plant and equipment
- 1,229
Purchase of property, plant and equipment
(11,387) (2,986)
Acquisition of Shares in Phosphate Resources Limited
(1,700) (1,151)
Net cash flows (used in) / from operating activities
(14,927) (5,735)
Cash flows from financing activities
Repayment of borrowings (3,936) (15,027)
Finance lease principal paid (175) -
Payments for buy-back of shares by a subsidiary
(10,704) -
Dividends paid (1,686) (2,085)
Net cash flows from financing activities (16,501) (17,112)
Net increase in cash and cash equivalents held
2,203 5,332
Cash and cash equivalents at the beginning of the financial year
36,606 30,523
Impact of foreign exchange 1,773 751
Cash and cash equivalents at the end of the financial year
6 40,582 36,606
The above Consolidated Statement of Cash Flows should be read in conjunction with the accompanying notes.
For
per
sona
l use
onl
y

CI RESOURCES LIMITED
Notes to the financial statements For the year ended 30 June 2013
Annual Report – 30 June 2013
24
1. Corporate Information
This financial report of CI Resources Limited (‘Company’) for the year ended 30 June 2013 comprises the Company and its subsidiaries (‘Group’). The financial report of CI Resources Limited for the year ended 30 June 2013 was authorised for issue in accordance with a resolution of the directors on 27 September 2013. The separate financial statements of the parent entity, CI Resources Limited, have not been presented within this financial report as permitted by the Corporations Act 2001. CI Resources Limited is a for profit company limited by shares incorporated in Australia whose shares are publicly traded on the Australian Securities Exchange.
2. Summary of Significant Accounting Policies
The principal accounting policies adopted in the preparation of the financial report are set out below. These policies have been consistently applied to the financial year ended 30 June 2013, unless otherwise stated. Basis of preparation The financial report is a general-purpose financial report which has been prepared in accordance with the requirements of the Corporations Act 2001, Australian Accounting Standards and other authoritive pronouncements of the Australian Accounting Standards Board. The financial report has also been prepared on a historical cost basis except for derivatives which have been measured at fair value. The financial report is presented in Australian dollars and all values are rounded to the nearest thousand dollars (“$’000”), unless otherwise stated. The financial report covers the Consolidated Entity of CI Resources Limited and its controlled entities. The financial report has also been prepared on an accruals basis and is based on historical costs except for derivatives and biological assets, which have been measured at fair value.
(a) Compliance with IFRS
The financial report complies with Australian Accounting Standards and International Financial Reporting Standards (IFRSs) as issued by the International Accounting Standards Board.
(b) New accounting standards and interpretations (i) Changes in accounting policy and disclosures. The accounting policies adopted are consistent with those of the previous financial year.
For
per
sona
l use
onl
y

CI RESOURCES LIMITED
Notes to the financial statements For the year ended 30 June 2013
Annual Report – 30 June 2013
25
2. Summary of Significant Accounting Policies (continue)
ii) Accounting Standards and Interpretations issued but not yet effective. Australian Accounting Standards and interpretations that have recently been issued or amended but are not yet effective have not been adopted for the annual reporting period ended 30 June 2013. These are outlined in the table below:
Ref Title Summary Application
date of standard
Impact on Group
financial report
Application date for
Group
AASB 10 Consolidate
d Financial
Statements
AASB 10 establishes a new control model that applies to all entities. It replaces parts of AASB 127 Consolidated and Separate Financial Statements dealing with the accounting for consolidated financial statements and UIG-112 Consolidation - Special Purpose Entities.
The new control model broadens the situations when an entity is considered to be controlled by another entity and includes new guidance for applying the model to specific situations, including when acting as a manager may give control, the impact of potential voting rights and when holding less than a majority voting rights may give control.
Consequential amendments were also made to this and other standards via AASB 2011-7 and AASB 2012-10.
1 January 2013 No material impact on group.
1 July 2013
AASB 11 Joint
Arrangeme
nts
AASB 11 replaces AASB 131 Interests in Joint
Ventures and UIG-113 Jointly- controlled Entities -
Non-monetary Contributions by Ventures.
AASB 11 uses the principle of control in AASB 10 to define joint control, and therefore the determination of whether joint control exists may change. In addition it removes the option to account for jointly controlled entities (JCEs) using proportionate consolidation. Instead, accounting for a joint arrangement is dependent on the nature of the rights and obligations arising from the arrangement. Joint operations that give the venturers a right to the underlying assets and obligations themselves is accounted for by recognising the share of those assets and obligations. Joint ventures that give the venturers a right to the net assets is accounted for using the equity method.
Consequential amendments were also made to this and other standards via AASB 2011-7, AASB 2010-10 and amendments to AASB 128.
1 January 2013 No material impact on group.
1 July 2013
For
per
sona
l use
onl
y

CI RESOURCES LIMITED
Notes to the financial statements For the year ended 30 June 2013
Annual Report – 30 June 2013
26
Ref Title Summary
Application date of standard
Impact on Group financial report
Application date for Group
AASB 12 Disclosure
of Interests
in Other
Entities
AASB 12 includes all disclosures relating to an entity's interests in subsidiaries, joint arrangements, associates and structured entities. New disclosures have been introduced about the judgments made by management to determine whether control exists, and to require summarised information about joint arrangements, associates, structured entities and subsidiaries with non-controlling interests.
1 January 2013 No material impact on group.
1 July 2013
AASB 13 Fair Value
Measureme
nt
AASB 13 establishes a single source of guidance for determining the fair value of assets and liabilities. AASB 13 does not change when an entity is required to use fair value, but rather, provides guidance on how to determine fair value when fair value is required or permitted. Application of this definition may result in different fair values being determined for the relevant assets.
AASB 13 also expands the disclosure requirements for all assets or liabilities carried at fair value. This includes information about the assumptions made and the qualitative impact of those assumptions on the fair value determined.
Consequential amendments were also made to other standards via AASB 2011-8.
1 January 2013 No material impact on group.
1 July 2013
AASB 119
Employee
Benefits The main change introduced by this standard is to revise the accounting for defined benefit plans. The amendment removes the options for accounting for the liability, and requires that the liabilities arising from such plans is recognised in full with actuarial gains and losses being recognised in other comprehensive income. It also revised the method of calculating the return on plan assets.
The revised standard changes the definition of short-term employee benefits. The distinction between short-term and other long-term employee benefits is now based on whether the benefits are expected to be settled wholly within 12 months after the reporting date.
Consequential amendments were also made to other standards via AASB 2011-10.
1 January 2013 No material impact on group.
1 July 2013
For
per
sona
l use
onl
y

CI RESOURCES LIMITED
Notes to the financial statements For the year ended 30 June 2013
Annual Report – 30 June 2013
27
Ref Title Summary
Application date of standard
Impact on Group financial report
Application date for Group
AASB 2012-2
Amendments to Australian Accounting Standards - Disclosures
- Offsetting
Financial
Assets and
Financial
Liabilities
AASB 2012-2 principally amends AASB 7 Financial Instruments: Disclosures to require disclosure of the effect or potential effect of netting arrangements, including rights of set-off associated with the entity's recognised financial assets and recognised financial liabilities, on the entity's financial position, when all the offsetting criteria of AASB 132 are not met.
1 January 2013 No material impact on group.
1 July 2013
AASB 2012-5
Amendments to Australian Accounting Standards arising from Annual Improvements 2009-2011 Cycle
AASB 2012-5 makes amendments resulting from the 2009-2011 Annual Improvements Cycle. The standard addresses a range of improvements, including the following:
► Repeat application of AASB 1 is permitted (AASB 1)
Clarification of the comparative information requirements when an entity provides a third balance sheet (AASB 101 Presentation of Financial
Statements).
1 January 2013 No material impact on group.
1 July 2013
AASB 2012-9
Amendment to AASB 1048 arising from the withdrawal of Australian Interpretation 1039
AASB 2012-9 amends AASB 1048 Interpretation of
Standards to evidence the withdrawal of Australian Interpretation 1039 Substantive Enactment of Major
Tax Bills in Australia.
1 January 2013 No material impact on group.
1 July 2013
AASB 2011-4
Amendments to Australian Accounting Standards to Remove
Individual
Key
Manageme
nt
Personnel
Disclosure
Requiremen
ts [AASB 124]
This amendment deletes from AASB 124 individual key management personnel disclosure requirements for disclosing entities that are not companies. It also removes the individual KMP disclosure requirements for all disclosing entities in relation to equity holdings, loans and other related party transactions.
1 July 2013 No material impact on group.
1 July 2013
For
per
sona
l use
onl
y

CI RESOURCES LIMITED
Notes to the financial statements For the year ended 30 June 2013
Annual Report – 30 June 2013
28
Ref Title Summary
Application date of standard
Impact on Group financial report
Application date for Group
AASB 1053
Application
of Tiers of
Australian
Accounting
Standards
This standard establishes a differential financial reporting framework consisting of two tiers of reporting requirements for preparing general purpose financial statements:
(a) Tier 1: Australian Accounting Standards
(b) Tier 2: Australian Accounting Standards - Reduced Disclosure Requirements
Tier 2 comprises the recognition, measurement and presentation requirements of Tier 1 and substantially reduced disclosures corresponding to those requirements.
The following entities apply Tier 1 requirements in preparing general purpose financial statements:
(a) For-profit entities in the private sector that have public accountability (as defined in this standard)
(b) The Australian Government and State, Territory and Local governments
The following entities apply either Tier 2 or Tier 1 requirements in preparing general purpose financial statements:
(a) For-profit private sector entities that do not have public accountability
(b) All not-for-profit private sector entities
(c) Public sector entities other than the Australian Government and State, Territory and Local governments.
Consequential amendments to other standards to implement the regime were introduced by AASB 2010-2, 2011-2, 2011-6, 2011-11, 2012-1, 2012-7 and 2012-11.
1 July 2013 No material impact on
group.
1 July 2013
AASB 2012-3
Amendments to Australian Accounting Standards - Offsetting
Financial
Assets and
Financial
Liabilities
AASB 2012-3 adds application guidance to AASB 132 Financial Instruments: Presentation to address inconsistencies identified in applying some of the offsetting criteria of AASB 132, including clarifying the meaning of "currently has a legally enforceable right of set-off" and that some gross settlement systems may be considered equivalent to net settlement.
1 January 2014 The impact on the group has not yet been assessed
1 July 2014
For
per
sona
l use
onl
y

CI RESOURCES LIMITED
Notes to the financial statements For the year ended 30 June 2013
Annual Report – 30 June 2013
29
The Group has not elected to early adopt any new standards or amendments that are issued but not yet effective.
Ref Title Summary
Application date of standard
Impact on Group financial report
Application date for Group
AASB 9 Financial
Instruments AASB 9 includes requirements for the classification
and measurement of financial assets. It was further
amended by AASB 2010-7 to reflect amendments
to the accounting for financial liabilities.
These requirements improve and simplify the
approach for classification and measurement of
financial assets compared with the requirements of
AASB 139. The main changes are described below.
(a) Financial assets that are debt instruments will
be classified based on (1) the objective of the entity's business model for managing the financial assets; (2) the characteristics of the contractual cash flows.
(b) Allows an irrevocable election on initial recognition to present gains and losses on investments in equity instruments that are not held for trading in other comprehensive income. Dividends in respect of these investments that are a return on investment can be recognised in profit or loss and there is no impairment or recycling on disposal of the instrument.
(c) Financial assets can be designated and measured at fair value through profit or loss at initial recognition if doing so eliminates or significantly reduces a measurement or recognition inconsistency that would arise from measuring assets or liabilities, or recognising the gains and losses on them, on different bases.
(d) Where the fair value option is used for financial liabilities the change in fair value is to be accounted for as follows:
► The change attributable to
changes in credit risk are
presented in other
comprehensive income (OCI)
► The remaining change is
presented in profit or loss
If this approach creates or enlarges an accounting
mismatch in the profit or loss, the effect of the
changes in credit risk are also presented in profit
or loss. Consequential amendments were also made to
other standards as a result of AASB 9, introduced
by AASB 2009-11 and superseded by AASB
2010-7 and 2010-10.
1 Jan 2015 The impact on the group has not yet been assessed
1 July 2015
For
per
sona
l use
onl
y

CI RESOURCES LIMITED
Notes to the financial statements For the year ended 30 June 2013
Annual Report – 30 June 2013
30
2. Summary of Significant Accounting Policies (continue)
(c) Basis of consolidation The consolidated financial statements comprise the financial statements of CI Resources Limited (“company” or “parent entity”) as at 30 June 2013 and the results of its subsidiaries for the financial year then ended. Interests in associates are equity accounted and are not part of the consolidated Group. CI Resources Limited and its subsidiaries together are referred to in this financial report as the Group or Consolidated Entity. The acquisition method of accounting is used to account for the acquisition of subsidiaries by the Group. Subsidiaries are all those entities over which the Group has the power to govern the financial and operating policies so as to obtain benefits from their activities. The existence and effect of potential voting rights that are currently exercisable or convertible are considered when assessing whether a group controls another entity. The financial statements of the subsidiaries are prepared for the same reporting period as the parent company, using consistent accounting policies. In preparing the consolidated financial statements, all intercompany balances, transactions, unrealised gains and losses resulting from intra-group transactions and dividends have been eliminated in full. All controlled entities have a June financial year-end with the exception of the companies domiciled in China which have a December year-end. Subsidiaries are fully consolidated from the date on which control is obtained by the Group and cease to be consolidated from the date on which control is transferred out of the Group. Investments in subsidiaries held by CI Resources Limited are accounted for at cost in the separate financial statements of the parent entity less any impairment charges. Dividends received from subsidiaries are recorded as a component of other revenues in the separate income statement of the parent entity, and do not impact the recorded cost of the investment. Upon receipt of dividend payments from subsidiaries, the parent will assess whether any indicators of impairment of the carrying value of the investment in the subsidiary exist. Where such indicators exist, to the extent that the carrying value of the investment exceeds its recoverable amount, an impairment loss is recognised. The acquisition of subsidiaries is accounted for using the acquisition method of accounting. The acquisition method of accounting involves recognising at acquisition date, separately from goodwill, the identifiable assets acquired, the liabilities assumed and any non-controlling interest in the acquiree. The identifiable assets acquired and the liabilities assumed are measured at their acquisition date fair values. The difference between the above items and the fair value of the consideration (including the fair value of any pre-existing investment in the acquiree) is goodwill or a discount on acquisition. After initial recognition, goodwill is measured at cost less any accumulated impairment losses. For the purpose of impairment testing, goodwill acquired in a business combination is, from the acquisition date, allocated to each of the Group’s cash-generating units that are expected to benefit from the combination, irrespective of whether other assets or liabilities of the acquire are assigned to those units. Where goodwill forms part of a cash-generating unit and part of the operation within that unit is disposed of, the goodwill associated with the operation disposed of is included in the carrying amount of the operation when determining the gain or loss on disposal of the operation. Goodwill disposed of in this circumstance is measured based on the relative values of the operation disposed of and the portion of the cash-generating unit retained. Non-controlling interests are allocated their share of net profit after tax in the statement of comprehensive income and are presented within equity in the consolidated statement of financial position, separately from the equity of the owners of the parent. Losses are attributed to the non-controlling interest even if that results in a deficit balance. A change in the ownership interest of a subsidiary that does not result in a loss of control, is accounted for as an equity transaction.
For
per
sona
l use
onl
y

CI RESOURCES LIMITED
Notes to the financial statements For the year ended 30 June 2013
Annual Report – 30 June 2013
31
2. Summary of Significant Accounting Policies (continue)
(d) Income tax The charge for current income tax expense is based on the profit for the year adjusted for any non-assessable or disallowed items. It is calculated using tax rates that have been enacted or are substantively enacted by the balance sheet date. Deferred tax is accounted for using the balance sheet liability method in respect of temporary differences arising between the tax bases of assets and liabilities and their carrying amounts in the financial statements. No deferred income tax will be recognised from the initial recognition of an asset or liability, excluding a business combination, where there is no effect on accounting or taxable profit or loss. Deferred tax is calculated at the tax rates that are expected to apply to the period when the asset is realised or liability is settled. Deferred tax is credited in the income statement except where it relates to items that may be credited directly to equity, in which case the deferred tax is adjusted directly against equity. Deferred income tax assets are recognised to the extent that it is probable that future tax profits will be available against which deductible temporary differences can be utilised. Unrecognised deferred income tax assets are reassessed at each balance sheet date and are recognised to the extent that it has become probable that future taxable profit will allow the deferred tax asset to be recovered. The amount of benefits brought to account or which may be realised in the future is based on the assumption that no adverse change will occur in income taxation legislation and the anticipation that the economic entity will derive sufficient future assessable income to enable the benefit to be realised and comply with the conditions of deductibility imposed by the law.
(e) Inventories Inventories are measured at the lower of cost and net realisable value. The cost of mining stocks includes direct materials, direct labour, transportation costs and variable and fixed overhead costs relating to mining activities. Overheads are applied on the basis of normal operating capacity. Costs are assigned on the basis of weighted average costs. Net realisable value is the estimated selling price in the ordinary course of business, less estimated costs of completion and the estimated costs necessary to make the sale.
(f) Property, plant and equipment Each class of property, plant and equipment is carried at cost less accumulated depreciation and any impairment losses. Property Freehold land and buildings are measured at cost less accumulated depreciation on buildings. Plant and equipment Plant and equipment are measured on the cost basis less accumulated depreciation and any impairment losses. The carrying amount of plant and equipment is reviewed annually by the directors to ensure it is not in excess of the recoverable amount from these assets (refer to note 2(l) for accounting policy on recoverable amount). The cost of fixed assets constructed within the economic entity includes the cost of materials, direct labour, borrowing costs and an appropriate proportion of fixed and variable overheads. Subsequent costs are included in the asset’s carrying amount or recognised as a separate asset, as appropriate only when it is probable that future economic benefits associated with the item will flow to the group and the cost of the item can be measured reliably. All other repairs and maintenance are charged to the income statement during the financial period in which they are incurred.
For
per
sona
l use
onl
y

CI RESOURCES LIMITED
Notes to the financial statements For the year ended 30 June 2013
Annual Report – 30 June 2013
32
2. Summary of Significant Accounting Policies (continue)
Depreciation The depreciable amount of all fixed assets including building and capitalised lease assets, but excluding freehold land are depreciated on a straight line or diminishing balance basis over their useful lives to the economic entity commencing from the time the asset is held ready for use. Leasehold improvements are depreciated over the shorter of either the unexpired period of the lease or the estimated useful lives of the improvements. The depreciation rates used for each class of depreciation assets are:
Class of Fixed Asset Depreciation Rate
Leasehold and strata title properties Shorter of the lease and 2%
Plant and equipment under lease:
- the shorter of the lease term and life span
20 – 30%
Plant and equipment 13 – 40%
Mine properties Life of mine
The assets’ residual values and useful lives are reviewed, and adjusted if appropriate, at each balance sheet date. Gains and losses on disposals are determined by comparing proceeds with the carrying amount. These gains and losses are included in the income statement.
(g) Mining tenements and exploration expenditure Costs incurred during exploration and evaluation activities related to an area of interest are accumulated at cost. Such costs are only carried forward to the extent that they are expected to be recouped through the successful development of the area of interest, or alternatively its sale, or where activities in the area of interest have not yet reached a stage which permits a reasonable assessment of the existence or otherwise of economically recoverable reserves, and active operations are continuing. Accumulated costs in relation to abandoned areas of interest are written off in full in the year in which the decision to abandon the area is made. A regular review is undertaken of each area of interest to determine the appropriateness of continuing to carry forward costs in relation to that area of interest.
(h) Mine properties Costs incurred prior to the startup of operations or mining assets acquired are accumulated at cost. Such costs are only carried forward to the extent that they are expected to be recouped through the successful exploitation of the known reserves. Impairment The carrying amount of mine properties is reviewed annually by the directors to ensure it is not in excess of the recoverable amount of these assets (refer to note 2(l) for accounting policy on recoverable amount).
For
per
sona
l use
onl
y

CI RESOURCES LIMITED
Notes to the financial statements For the year ended 30 June 2013
Annual Report – 30 June 2013
33
2. Summary of Significant Accounting Policies (continue)
(i) Restoration Estimated rehabilitation expenditure is recognised as a provision when the Group has a present obligation (legal or constructive) as a result of a past event, it is probable that an outflow of resources embodying economic benefits will be required to settle the obligation and a reliable estimate can be made of the amount of the obligation. If the effect of the time value of money is material, the amounts are determined by discounting the expected future cash flows at a pre-tax rate that reflects current market assessments of the time value of money and, where appropriate, the risks specific to the liability. The amortisation or ‘unwinding’ of the discount applied in establishing the net present value of provision is charged to the income statement in each accounting period, and is disclosed as a financing cost. Other changes in the measurement of an existing restoration obligation that result from changes in the estimated timing or amount of future costs, or a change in the discount rate, are recognised as an adjustment to the restoration asset.
(j) Leases Leases of fixed assets where substantially all the risks and benefits incidental to the ownership of the asset, but not the legal ownership that are transferred to entities in the economic entity are classified as finance leases. Finance leases are capitalised by recording an asset and a liability at the lower of the amounts equal to the fair value of the leased property or the present value of the minimum lease payments, including any guaranteed residual values. Lease payments are allocated between the reduction of the lease liability and the lease interest expense for the period. Leased assets are depreciated on a straight-line basis over their estimated useful lives where it is likely that the economic entity will obtain ownership of the asset or over the term of the lease. Lease payments of operating leases, where substantially all the risks and benefits remain with the lessor, are charged as expenses in the periods in which they are incurred. Lease incentives under operating leases are recognised as a liability and amortised on a straight-line basis over the life of the lease term.
(k) Derivative financial instruments
Derivative financial instruments are used by the Group to provide an economic hedge of exposures to exchange rates. The consolidated entity does not apply hedge accounting and accordingly all fair value movements on derivative financial instruments are recognised in the statement of comprehensive income. Derivative financial instruments are stated at fair value on the date a derivative contract is entered into and are subsequently remeasured to their fair value at each reporting date. Derivatives are carried as assets when their fair value is positive and as liabilities when their fair value is negative. The resulting gain or loss is recognised in profit or loss immediately. The fair values of forward currency contracts are calculated by reference to current forward exchange rates for contracts with similar maturity profiles.
For
per
sona
l use
onl
y

CI RESOURCES LIMITED
Notes to the financial statements For the year ended 30 June 2013
Annual Report – 30 June 2013
34
2. Summary of Significant Accounting Policies (continue)
(l) Impairment of non-financial assets other than goodwill
At each reporting date, the company assesses whether there is any indication that an asset may be impaired. Where an indicator of impairment exists, the Company makes a formal estimate of recoverable amount. Where the carrying amount of an asset exceeds its recoverable amount the asset is considered impaired and is written down to its recoverable amount. Recoverable amount is the greater of fair value less costs to sell and value in use. It is determined for an individual asset, unless the asset’s value in use cannot be estimated to be close to its fair value less costs to sell and it does not generate cash inflows that are largely independent of those from other assets or groups of assets, in which case, the recoverable amount is determined for the cash-generating unit to which the asset belongs. In assessing value in use, the estimated future cash flows are discounted to their present value using a pretax discount rate that reflects current market assessments of the time value of money and the risks specific to the asset.
(m) Intangibles
Goodwill Goodwill is initially recorded at the amount by which the purchase price for a business or for an ownership interest in a controlled entity exceeds the fair value attributed to the identifiable net assets at the date of acquisition. Following initial recognition, goodwill is measured at cost less any accumulated impairment losses. Goodwill is reviewed for impairment annually or more frequently if events or changes in circumstances indicate that the carrying value may be impaired. Impairment losses recognised for goodwill are not subsequently reversed. Gains and losses on the disposal of an entity include the carrying amount of goodwill relating to the entity sold. Research and Development Expenditure during the research phase of a project is recognised as an expense when incurred. Development costs are capitalised only when technical feasibility studies indicate that the project will deliver future economic benefits and these benefits can be measured reliably.
(n) Foreign currency transactions and balances
Functional and presentation currency The functional currency of each of the group’s entities is determined by reference to the currency of the primary economic environment in which that entity operates. The consolidated financial statements are presented in Australian dollars which is the parent entity’s functional and presentation currency. Transactions and balances Foreign currency transactions are translated into the functional currency using the exchange rates prevailing at the date of the transaction. Foreign currency monetary items are translated at the year-end exchange rate. Non-monetary items measured at historical cost continue to be carried at the exchange rate at the date of the transaction. Non-monetary items measured at fair value are reported at the exchange rate at the date when fair values were determined. Exchange differences arising on the translation of monetary items are recognised in the income statement.
For
per
sona
l use
onl
y

CI RESOURCES LIMITED
Notes to the financial statements For the year ended 30 June 2013
Annual Report – 30 June 2013
35
2. Summary of Significant Accounting Policies (continue)
Exchange differences arising on the translation of non-monetary items are recognised directly in equity to the extent that the gain or loss is directly recognised in equity, otherwise the exchange difference is recognised in the income statement. Group companies The financial results and position of foreign operations whose functional currency is different from the group’s presentation currency are translated as follows:
• Assets and liabilities are translated at year-end exchange rates prevailing at that reporting date.
• Income and expenses are translated at average exchange rates for the period.
Exchange differences arising on translation of foreign operations are transferred directly to the group’s foreign currency translation reserve in the balance sheet. These differences are recognised in the income statement in the period in which the operation is disposed.
(o) Cash and cash equivalents
Cash and cash equivalents includes cash on hand, deposits held at call with banks, other short-term highly liquid investments with original maturities of three months or less, and bank overdrafts. Bank overdrafts are shown within short-term borrowings in current liabilities on the balance sheet.
(p) Trade and other receivables
Trade receivables, which generally have 30 to 90 day terms, are carried at nominal amounts due less an allowance for any uncollectible amounts. An allowance for doubtful debts is made when there is objective evidence that the Group will not be able to collect the debts. Bad debts are written-off when identified. Receivables from related parties are recognised and carried at the nominal amount due. An estimate for doubtful debts is considered based on the financial position of the related party.
(q) Trade and other payables
Trade payables and other payables are carried at amortised costs and represent liabilities for goods and services provided to the Group prior to the end of the financial year that are unpaid and arise when the Group becomes obliged to make future payments in respect of the purchase of these goods and services.
(r) Segment reporting
An operating segment is a component of an entity that engages in business activities from which it may earn revenues and incur expenses (including revenues and expenses relating to transactions with other components of the same entity), whose operating results are regularly reviewed by the entity's chief operating decision maker to make decisions about resources to be allocated to the segment and assess its performance and for which discrete financial information is available. This includes start up operations which are yet to earn revenues. Management will also consider other factors in determining operating segments such as the existence of a line manager and the level of segment information presented to the board of directors. Operating segments have been identified based on the information provided to the chief operating decision makers — being the executive management team.
For
per
sona
l use
onl
y

CI RESOURCES LIMITED
Notes to the financial statements For the year ended 30 June 2013
Annual Report – 30 June 2013
36
2. Summary of Significant Accounting Policies (continue)
The group aggregates two or more operating segments when they have similar economic characteristics, and the segments are similar in each of the following respects: ► Nature of the products and services ► Nature of the production processes ► Type or class of customer for the products and services ► Methods used to distribute the products or provide the services, and if applicable ► Nature of the regulatory environment Operating segments that meet the quantitative criteria as prescribed by AASB 8 are reported separately. However, an operating segment that does not meet the quantitative criteria is still reported separately where information about the segment would be useful to users of the financial statements. Information about other business activities and operating segments that are below the quantitative criteria are combined and disclosed in a separate category for “all other segments”.
(s) Business Combination
Business combinations are accounted for using the acquisition method. The consideration transferred in a business combination shall be measured at fair value, which shall be calculated as the sum of the acquisition date fair values of the assets transferred by the acquirer, the liabilities incurred by the acquirer to former owners of the acquiree and the equity issued by the acquirer, and the amount of any non-controlling interest in the acquiree. For each business combination, the acquirer measures the non-controlling interest in the acquiree either at fair value or at the proportionate share of the acquiree's identifiable net assets. Acquisition-related costs are expensed as incurred, and included in administrative expenses. When the Group acquires a business, it assesses the financial assets and liabilities assumed for appropriate classification and designation in accordance with the contractual terms, economic conditions, the Group’s operating or accounting policies and other pertinent conditions as at the acquisition date. This includes the separation of embedded derivatives in host contracts by the acquiree. If the business combination is achieved in stages, the acquisition date fair value of the acquirer's previously held equity interest in the acquiree is remeasured to fair value at the acquisition date through profit or loss. Any contingent consideration to be transferred by the acquirer will be recognised at fair value at the acquisition date. Subsequent changes to the fair value of the contingent consideration which is deemed to be an asset or liability will be recognised in accordance with AASB 139 either in profit or loss or as a change to other comprehensive income. If the contingent consideration is classified as equity, it should not be remeasured until it is finally settled within equity.
(t) Revenue
Sale of goods Revenue is recognised when there has been a passing of the significant risks and rewards of ownership, which means the following: 1. The product is in a form suitable for delivery and no further processing is required by or on behalf of the
consolidated entity; 2. The quantity and quality of the product can be determined with reasonable accuracy; 3. The product has been despatched to the customer and is no longer under the physical control of the
consolidated entity; 4. The selling price can be measured reliably; 5. It is probable that the economic benefits associated with the transaction will flow to the consolidated
entity; and 6. The costs incurred, or expected to be incurred, in respect of the transaction can be measured reliably.
For
per
sona
l use
onl
y

CI RESOURCES LIMITED
Notes to the financial statements For the year ended 30 June 2013
Annual Report – 30 June 2013
37
2. Summary of Significant Accounting Policies (continue)
Interest Revenue is recognised as the Interest accrues using the effective interest rate method (which is the rate that exactly discounts estimated future cash receipts through the expected life of the financial instrument to the net carrying amount of the financial asset). Rendering of services Revenue from a contract to provide services is recognised by reference to the stage of completion of the contract. Dividends
Revenue is recognised when the right to receive a dividend has been established.
(u) Government grants
Government grants are recognised when there is reasonable assurance that the grant will be received and all attaching conditions will be complied with. When the grant relates to an expense item, it is recognised as income over the periods necessary to match the grant on a systematic basis to the costs that it is intended to compensate. When the grant relates to an asset, the fair value is credited to a deferred income account and is released to the income statement over the expected useful life of the relevant asset by equal annual installments.
(v) Employee benefits
Provision is made for the Company’s liability for employee benefits arising from services rendered by employees up until balance date. Employee benefits that are expected to be settled within one year have been measured at the amounts expected to be paid when the liability is settled, plus related on-costs. Employee benefits payable later than one year have been measured at the present value of the estimated future cash outflows to be made for those benefits.
(w) Provisions
Provisions are recognised when the group has a legal or constructive obligation, as a result of past events, for which it is probable that an outflow of economic benefits will result and that outflow can be reliably measured.
(x) Borrowing costs
Borrowing costs directly attributable to the acquisition, construction or production of assets that necessarily take a substantial period of time to prepare for their intended use or sale, are added to the cost of those assets, until such time as the assets are substantially ready for their intended use or sale. All other borrowing costs are recognised in income during the period in which they are incurred.
(y) Plantation development costs
Costs incurred on land clearing are capitalised as plantation development costs and is amoritsed over the economic useful life of the asset (25 years). Costs on the concession lease with a term of 60 years are capitalised and amortised over the remaining term of lease.
For
per
sona
l use
onl
y

CI RESOURCES LIMITED
Notes to the financial statements For the year ended 30 June 2013
Annual Report – 30 June 2013
38
2. Summary of Significant Accounting Policies (continue)
(z) Biological assets
Biological assets which include mature and immature oil palm plantations are stated at fair value less estimated point of sale costs except when the fair value cannot be measured reliably. In this instance, the biological assets are measured at cost less any accumulated depreciation and any accumulated impairment losses until such time as its fair value can be reliably measured. Fresh fruit bunches (which are subsequently milled to become palm oil) is the harvested product of a biological asset and is measured at its fair value less estimated point of sale costs at the point of harvest. Net movement in fair value less estimated point of sale costs of biological assets are included in the statement of comprehensive income in the year they arise.
(aa) Goods and services tax (GST) Revenues, expenses and assets are recognised net of the amount of associated GST, unless the GST incurred is not recoverable from the Australian Taxation Office. In this case it is recognised as part of the cost of acquisition of the asset or as part of the expense. Receivables and payables are stated inclusive of the amount of GST receivable or payable. The net amount of GST recoverable from, or payable to, the Australian Taxation Office is included with other receivables or payables in the balance sheet. Cash flows are presented on a gross basis. The GST components of cash flows arising from investing or financing activities which are recoverable from, or payable to the Australian Taxation Office, are presented as operating cash flow. Commitments and contingencies are disclosed net of the amount of GST recoverable from, or payable to, the Australia Taxation Office.
(bb) Financial instruments Recognition Financial instruments are initially measured at fair value, which includes transaction costs, when the contractual rights or obligations exist. Subsequent to initial recognition these instruments are measured as set out below. Loans and receivables Loans and receivables are non-derivative financial assets with fixed or determinable payments that are not quoted in an active market. They arise when the consolidated entity provides money, goods or services directly to a debtor with no intention of selling the receivable. They are included in current assets, except for those with maturities greater than 12 months after the statement of financial position date which are classified as non-current assets and carried at amortised cost. Loans and receivables are included in receivables in the statement of financial position. Financial liabilities Non-derivative financial liabilities are recognised at amortised cost, comprising original debt less principal repayments and amortisation. Impairment The Consolidated Entity assesses at each balance date whether there is objective evidence that a financial asset or group of financial assets is impaired.
For
per
sona
l use
onl
y

CI RESOURCES LIMITED
Notes to the financial statements For the year ended 30 June 2013
Annual Report – 30 June 2013
39
2. Summary of Significant Accounting Policies (continue)
(cc) Investments in associates Associates are all entities over which the Group has significant influence but not control, generally accompanying a shareholding of between 20% and 50% of the voting rights. Investments in associates are accounted for in the consolidated financial statements using the equity method of accounting, after initially being recognised at cost. The Group’s investment in associates includes goodwill (net of any accumulated impairment loss) identified on acquisition. The Group’s share of its associates’ post-acquisition profits or losses is recognised in the Statement of Comprehensive Income, and its share of post-acquisition movements in reserves is recognised in reserves. The cumulative post-acquisition movements are adjusted against the carrying amount of the investment. Dividends receivable from associates are recognised in the parent entity’s income statement, while in consolidated financial statements they reduce the carrying amount of the investment. When the Group’s share of losses in an associate equals or exceeds its interest in the associate, including any other unsecured long-term receivables, the Group does not recognise further losses, unless it has incurred obligations or made payments on behalf of the associate. Unrealised gains on transactions between the Group and its associates are eliminated to the extent of the Group’s interest in the associates. Unrealised losses are also eliminated unless the transaction provides evidence of an impairment of the asset transferred. Accounting policies of associates have been changed where necessary to ensure consistency with the policies adopted by the Group.
(dd) Contributed equity
Ordinary shares are classified as equity. Incremental costs directly attributable to the issue of new shares or options are shown in equity as a deduction, net of tax, from the proceeds.
(ee) Comparative figures Where required by Accounting Standards, comparative figures have been adjusted to conform with changes in presentation for the current financial year.
(ff) Earnings per share
(i) Basic earnings per share
Basic earnings per share is calculated by dividing the profit attributable to equity holders of the consolidated entity, excluding any costs of servicing equity other than ordinary shares, by the weighted average number of ordinary shares outstanding during the year, adjusted for bonus elements in ordinary shares issued during the year. (ii) Diluted earnings per share
Diluted earnings per share adjusts the figures used in the determination of basic earnings per share to take into account the after income tax effect of interest and other financing costs associated with dilutive potential ordinary shares and the weighted average number of shares assumed to have been issued for no consideration in relation to dilutive potential ordinary shares.
(gg) Impairment of assets Assets are reviewed for impairment whenever events or changes in circumstances indicate that the carrying amount may not be recoverable. An impairment loss is recognised for the amount by which the asset’s carrying amount exceeds its recoverable amount. The recoverable amount is the higher of an asset’s fair value less costs to sell and value in use. For the purposes of assessing impairment, assets are grouped at the lowest levels for which there are separately identifiable cash flows (cash generating units).
For
per
sona
l use
onl
y

CI RESOURCES LIMITED
Notes to the financial statements For the year ended 30 June 2013
Annual Report – 30 June 2013
40
2. Summary of Significant Accounting Policies (continue)
(hh) Significant accounting judgments In the process of applying the Group’s accounting policies, management has made the following judgments, apart from those involving estimations, which have the most significant effect on the amounts recognised in the financial statements. Assessment of mine life on Christmas Island The Financial statements have been prepared on the basis that the resource supports continued operations for at least 5 years on the current market parameters and expectations. Determination of mineral resources and ore reserves The Group’s policy for estimating its mineral resources and ore reserves requires that the Australian Code for Reporting of Exploration Results, Mineral Resources and Ore Reserves 2004 (the ‘JORC code’) be used as a minimum standard. The information on mineral resources and ore reserves were prepared by or under the supervision of Competent Persons as defined in the JORC code. The amounts presented are based on the mineral resources and ore reserves determined under the JORC code. There are numerous uncertainties inherent in estimating mineral resources and ore reserves and assumptions that are valid at the time of estimation may change significantly when new information becomes available. Changes in the forecast prices of commodities, exchange rates or production costs may change the economic status of resources and may, ultimately, result in the resources being restated. Such changes in resources could impact on depreciation and amortisation rates, asset carrying values and provisions for decommissioning and restoration. The carrying amounts of certain assets and liabilities are often determined based on estimates and assumptions of future events. The key estimates and assumptions that have a significant risk of causing a material adjustment to the carrying amounts of certain assets and liabilities within the next annual reporting period are: Impairment of property, plant and equipment Property, plant and equipment is reviewed for impairment if there is any indication that the carrying amount may not be recoverable. Where a review for impairment is conducted, the recoverable amount is assessed by reference to the higher of ‘value in use’ (being the net present value of expected future cash flows of the relevant cash generating unit) and ‘fair value less costs to sell’. In determining value in use, future cash flows are based on:
• Estimates of the quantities of ore reserves and mineral resources;
• Future production levels;
• Future commodity prices and foreign exchange rates; and
• Future cash costs of production and capital expenditure. Variations to the expected future cash flows, and the timing thereof, could result in significant changes to any impairment losses recognised, if any, which could in turn impact future financial results. Provisions for decommissioning and restoration costs Decommissioning and restoration costs are a normal consequence of mining and the majority of this expenditure is incurred at the end of a mine’s life. In determining an appropriate level of provision consideration is given to the expected future costs to be incurred, the timing of these expected future costs (largely dependent on the life of the mine), the appropriateness of the discount rate and the estimated future level of inflation.
For
per
sona
l use
onl
y

CI RESOURCES LIMITED
Notes to the financial statements For the year ended 30 June 2013
Annual Report – 30 June 2013
41
2. Summary of Significant Accounting Policies (continue)
(ii) Significant accounting estimates and assumptions The ultimate cost of decommissioning and restoration is uncertain and costs can vary in response to many factors including changes to the relevant legal requirements or the emergence of new restoration techniques. The expected timing of expenditure can also change, for example in response to changes in reserves or to production rates. Changes to any of the estimates could result in significant changes to the level of provisioning required, which would in turn impact future financial results. Fair value of biological assets The fair value of the oil palm plantations is estimated by reference to independent professional valuations using the discounted cash flows of the underlying biological assets. The expected cash flows from the whole life cycle of the oil palm plantations is determined using the market price and the estimated yield of the agricultural produce, being FFB, net of maintenance and harvesting costs and any costs required to bring the oil palm plantations to maturity. The estimated yield of the oil palm plantations is dependent on the age of the oil palm trees, location of the plantations, soil type and infrastructure. The market price of FFB is largely dependent on the prevailing market prices of crude palm oil and palm kernel.
Consolidated
2013 2012
$’000s $’000s
3. Revenue
a) Revenue from continuing operations
Sales of phosphate and oil 145,164 126,858
Rendering of services 8,623 9,459
Interest income 834 975
154,621 137,292
b) Cost of sales
Production costs 79,236 65,446
Shipping & marketing 19,821 18,316
Depreciation 3,765 3,510
102,822 87,272
c) Other income
Net gain on disposal of assets 15 6
Net foreign exchange gains 827 1,214
842 1,220
For
per
sona
l use
onl
y

CI RESOURCES LIMITED
Notes to the financial statements For the year ended 30 June 2013
Annual Report – 30 June 2013
42
3. Expenses Consolidated
2013 2012
$’000s $’000s
d) Other expenses
Administration 13,263 13,109
Bad debt expense / (recovery) (other expenses) 1,739 -
Change in fair value of biological assets 1,021 1,059
Redundancy expense 738 923
Write off of goodwill - 422
Net foreign exchange (gain) / loss 11 117
Allowance for inventory obsolescence 84 25
Depreciation (other expenses) 53 34
16,909 15,689
An outstanding amount is owed by Fertiliser Futures Ltd for the acquisition of the Company’s interest in Phosphate Resources (HauLi) Ltd. The payment of remaining consideration by Fertiliser Futures Ltd was based on the ability of Fertiliser Futures Ltd to consolidate three mining licenses. So far Fertiliser Futures Ltd has not been able to consolidate the mining licenses and has been prevented from mining by the Chinese Government until the consolidation of these mines is finalised. Based on these facts the Company’s management have assessed that the receipt of the remaining consideration seems unlikely and consequently have written off the amount owing as a bad debt expense of $1.739 million.
e) Finance costs
Interest expense 448 904
Finance lease - 7
Accretion on demolition provision 600 600
1,048 1,511
4. Income tax
The major components of income tax are: Statement of Comprehensive Income
Current income tax
Current income tax charge 11,745 13,461
Adjustments in respect of current income tax of previous years (54) 11 Deferred income tax
Relating to origination and reversal of temporary differences (1,369) (2,611) Adjustments in respect of deferred tax of previous years - 307
Income tax expense reported in the Statement of Comprehensive Income 10,322 11,168
For
per
sona
l use
onl
y

CI RESOURCES LIMITED
Notes to the financial statements For the year ended 30 June 2013
Annual Report – 30 June 2013
43
4. Income tax (continue) Consolidated
2013 2012
$’000s $’000s
A reconciliation between tax expense and the product of accounting profit before income tax multiplied by the Group’s applicable income tax rate is as follows:
Accounting profit before income tax 34,684 34,040
At the Group’s statutory income tax rate of 30% (2010: 30%) 10,405 10,212 Income/expenditure not allowable for income tax purposes:
Add:
- Adjustments in respect of current income tax of previous years (54) 11
- Prior year adjustment in respect of temporary difference - 307
- Expenditure not allowable for income tax purposes 47 757
- Deferred tax asset not bought to account 126 131
- Difference in global tax rates (202) (250)
Aggregate income tax expense 10,322 11,168
For
per
sona
l use
onl
y

CI RESOURCES LIMITED
Notes to the financial statements For the year ended 30 June 2013
Annual Report – 30 June 2013
44
4. Income tax (continued)
Statement of Financial Position
Statement of Comprehensive Income
2013 $’000s
2012 $’000s
2013 $’000s
2012 $’000s
Deferred income tax
Deferred income tax at 30 June relates to the following:
CONSOLIDATED
Deferred tax liabilities
Consumables (1,207) (1,624) (417) 272
Accelerated depreciation-fixed assets (9,130) (8,685) 445 (405)
Forward currency contracts - (115) (115) (1,477)
Gross deferred income tax liabilities (10,337) (10,424)
Deferred tax assets
Provisions and accruals 5,412 5,074 (338) (640)
Depreciation – fixed assets 1,625 1,347 (278) (132)
Forward currency contracts 435 - (435) 78
Receivables 359 128 (231) -
Gross deferred income tax assets 7,831 6,549
Deferred tax income/(expense) (1,369) (2,304)
This deferred tax asset will only be obtained if: (a) future assessable income is derived of a nature and of an amount sufficient to enable the benefit to be realised; (b) the conditions for deductibility imposed by tax legislation continue to be complied with; and (c) no changes in tax legislation adversely affect the consolidation entity in realising the benefit.
The entity has made non-current provisions for demolition of $8,704,000 (2012: $8,104,000) and employee redundancies
of $8,052,000 (2012: $7,282,000). The future income tax benefit relating to the provision on restoration and demolition
and the provision for employee redundancy is not probable of being fully recovered, as it is believed that when the
provisions are required the entity may not have future taxable income to utilise the tax benefit.
CI Resources Limited and its wholly owned controlled entities have not entered into a tax consolidation agreement.
For
per
sona
l use
onl
y

CI RESOURCES LIMITED
Notes to the financial statements For the year ended 30 June 2013
Annual Report – 30 June 2013
45
5. Earnings per share
2013
Cents
2012
Cents
Basic earnings per share 17.75 15.53
2013
Number
2012
Number
Weighted average number of shares used as the denominator
Weighted average number of ordinary shares used as the denominator in calculating basic and diluted earnings per share. 72,874,102 72,874,102
2013
$’000s
2012
$’000s
Profit used in calculating basic and diluted losses per share
Net profit 12,934 11,318
There are no instruments (e.g., share options) excluded from the calculation of diluted earnings per share that could potentially dilute basic earnings per share in the future because they are antidilutive for either of the periods presented. There have been no transactions involving ordinary shares or potential ordinary shares that would significantly change the number of ordinary shares or potential ordinary shares outstanding between the reporting date and the date of completion of these financial statements. Consolidated
2013 2012
$’000s $’000s
6. Current assets – Cash and cash equivalents
Cash at bank and on hand 40,582 34,886
Deposits at call - 1,720
40,582 36,606
7. Current assets – Trade and other receivables
Debtors 22,977 28,525
Prepayments and other receivables 3,235 961
26,212 29,486
Trade debtors are non-interest bearing and are generally on 30-90 day terms. As at 30 June 2013, no trade receivables were considered impaired (2012: nil).
For
per
sona
l use
onl
y

CI RESOURCES LIMITED
Notes to the financial statements For the year ended 30 June 2013
Annual Report – 30 June 2013
46
8. Derivative financial asset Consolidated
2013 2012
$’000s $’000s
Forward currency contracts – held for trading - 384
- 384
Consolidated
2013 2012
$’000s $’000s
9. Inventories (current) Consumable materials and stores 3,251 4,726 Finished goods 6,669 7,380
9,920 12,106
10. Other Financial Asset Consolidated
2013 2012
$’000s $’000s
Trust fund term deposit 6,091 5,235
Demolition and restoration bonds 2,326 2,186
Other term deposits 6,438 5,595
14,855 13,016
Under the terms of the current Workplace Agreement between the Union of Christmas Island Workers and Phosphate Resources Limited a trust fund term deposit to meet employee entitlements is maintained. This trust fund may only be used to meet employee entitlements but may be drawn down as they arise. It is supplemented by a minimum amount of $500,000 annually. The trust fund term deposit currently stands at $6,091,000 (2012: $5,235,000). The interest earned on the term deposit of $356,513 (2012: $288,675) has been added to the term deposit. Other term deposits have varying maturities all greater than 12 months and earn interest at commercial rates.
For
per
sona
l use
onl
y

CI RESOURCES LIMITED
Notes to the financial statements For the year ended 30 June 2013
Annual Report – 30 June 2013
47
11. Property, Plant & equipment
Consolidated
2013 2012
$’000s $’000s
Leasehold Land At cost 31,665 26,738 Accumulated depreciation (3,415) (564)
28,250 26,174
Leasehold buildings At cost 5,432 4,869 Accumulated depreciation (2,243) (2,093)
3,189 2,776
Land and buildings At cost 383 383 Accumulated depreciation (146) (146)
237 237
Strata title properties At cost 1,341 1,215 Accumulated depreciation (264) (227)
1,077 988
Plant and equipment At cost 66,795 55,897 Accumulated depreciation and impairment (50,399) (44,941)
16,396 10,956
Plant and equipment under lease At cost 1,358 4,079 Accumulated depreciation (355) (2,576)
1,003 1,503
Construction in progress 1,374 2,369
Total property, plant and equipment At cost 108,348 95,550 Accumulated depreciation and impairment (56,822) (50,547)
Net carrying amount 51,526 45,003
(a) Assets pledged as security:
Included in all balances above are assets of Phosphate Resources Limited, Phosphate Resources Properties Pty Ltd and strata title properties of Phosphate Resources (Singapore) Pte Ltd over which first and second mortgages have been granted as security. The terms of the mortgages preclude the assets being sold or being used as security for further mortgages without the permission of the first mortgage holder. The shares in Cheekah-Kemayan Plantation Sdn Bhd are pledge as a security on a USD bank loan and the assets of Cheekah-Kemayan Plantation Sdn Bhd are pledged as a security over a bank overdraft facility. The net book values of the assets pledged are $54,998,000 (2012: $56,138,000).
For
per
sona
l use
onl
y

CI RESOURCES LIMITED
Notes to the financial statements For the year ended 30 June 2013
Annual Report – 30 June 2013
48
11. Property, Plant & equipment (continue)
(b) Reconciliations Reconciliations of the carrying amounts of property, plant and equipment at the beginning and end of the current financial year.
Consolidated 2013 2012 Leasehold Land $’000s $’000s Carrying amount at beginning 26,174 26,767 Foreign exchange difference 2,625 (100) Depreciation expense (549) (493)
28,250 26,174
Leasehold buildings Carrying amount at beginning 2,776 2,865 Foreign exchange difference 269 (8) Transfer from construction in progress 30 91 Additions 217 12 Disposals (1) - Depreciation expense (102) (184)
3,189 2,776
Land and buildings Carrying amount at beginning 237 237
237 237
Strata title properties Carrying amount at beginning 988 980 Foreign exchange difference (13) 20 Depreciation expense 102 (12)
1,077 988
Plant and equipment Carrying amount at beginning 10,956 11,130 Transfer from construction in progress 6,054 1,549 Foreign exchange difference 638 (76) Additions 436 291 Transfer from/(to) equipment under lease 1,341 - Disposals (10) (13) Depreciation expense (3,019) (1,925)
16,396 10,956
Plant and equipment under lease Carrying amount at beginning 1,503 2,413 Foreign exchange difference 10 (4) Additions - 30 Transfer from construction in progress 965 Transfer (to)/from plant and equipment (1,341) - Depreciation expense (134) (936)
1,003 1,503
Construction in progress Carrying amount at beginning 2,369 1,201 Additions 6,054 2,809 Transferred to plant and equipment (7,049) (1,641)
1,374 2,369
For
per
sona
l use
onl
y

CI RESOURCES LIMITED
Notes to the financial statements For the year ended 30 June 2013
Annual Report – 30 June 2013
49
12. Goodwill Consolidated
2013 2012
$’000s $’000s
Carrying amount at the beginning 7,158 7,635 Impairment - (422) Impact of foreign exchange - (55)
7,158 7,158
Goodwill acquired through business combination has been allocated to the Palm Oil Cash Generating Unit (“CGU”), which is also a reporting and operating segment for impairment testing. The net carrying amount of Goodwill at 30 June 2013 was 7,158,000 (2012: 7,158,000) which includes an accumulated impairment charge of Nil during the year (2012: 422,000). The recoverable amount of the Farming CGU has been determined using a value in use calculation using cash flow projections prepared as part of an external valuation of the plantation. The pre-tax discount rates applied to cash flow projections is 11% (2012: 11%) and the cash flows are forecast for 60 years using a Fresh Fruit Bunch (FFB) price of RM604 (2012: RM726) and an annual inflation rate of 1,6% (2012: 3.2%).
13. Biological Assets Consolidated
2013 2012
$’000s $’000s
Carrying amount at beginning of period 11,135 12,332 Harvest/amortization - (88) Effect of foreign exchange 1,117 (50) Fair value adjustment (1,021) (1,059)
Carrying amount at end 11,231 11,135
Biological assets consist of mature oil palm trees. The Group grows oil palm trees to produce palm oil. The plantation is located in Malaysia. At 30 June 2013 the group held oil palm trees on approximately 1,643 hectares of land. A valuation was conducted by Jones Lang Wootton, an independent professional valuer, on a subsidiary's oil palm estate development comprising land, ancillary facilities and biological assets, for the purposes of revaluing the biological assets of the subsidiary as at 30 June 2013. Significant assumptions applied in the determination of fair value are:
2013 2012
Average remaining life of oil palm trees 10 11 Average annual yield per hectare 21 22 Average life span of trees (years) 25 25 Post tax discount rate 11% 11% Fresh Fruit Bunch (FFB) price (RM per tonne) 604 726 Annual rate of inflation 1.2% 3.72%
For
per
sona
l use
onl
y

CI RESOURCES LIMITED
Notes to the financial statements For the year ended 30 June 2013
Annual Report – 30 June 2013
50
14. Investments in controlled entities
CI Resources Limited owns 63.05% of Phosphate Resources Limited which is incorporated in Australia. The voting power in respect to Phosphate Resources is in proportion to ownership. The Company did own 100% of Xi Feng International Pte Ltd which is incorporated in Singapore, this company was deregistered during the prior year. (a) Carrying amounts
Information relating to controlled entities is set out below:
Name of company Principal activity
Ownership interest
2013 2012
Unlisted
Phosphate Resources Limited and its controlled entities Mining 63.05% 50.48%
Xifeng International Pte Ltd Investment 0% 100.00%
15. Current liabilities – Trade and other payables Consolidated
2013 2012
Notes $’000s $’000s
Trade payables(a) 9,087 10,137
Foreign exchange contracts payable(b) 1,449 -
10,536 10,137 (a) Trade creditors are non-interest bearing and are normally settled on 30-60 terms.
(b)
Forward currency contracts – held for trading
The Group has entered into forward exchange contracts which are economic hedges but do not satisfy the requirements for hedge accounting.
Notional amounts
$AUD Average exchange rate
2013 2012 2013 2012
$’000s $’000s
Sell US$/buy Australian $ Consolidated Sell US$ maturity 0 to 12 months 20,842 17,320 0.9836 0.9815 Sell US$ maturity 12 to 24 months - - - - These contracts are fair valued by comparing the contracted rate to the market rates for contracts with the same length of maturity. All movements in fair value are recognised in profit or loss in the period they occur. The net fair value gains on foreign currency derivatives during the year were $1.833 million for the Group (2012: gain of $0.093 million).
The group uses various methods in estimating the fair value of a financial instrument. The methods comprise: Level 1: the fair value is calculated using quoted price in active markets; Level 2: the fair value is estimated using inputs other than quoted prices included in Level 1 that are observable for the assets or liability, either directly (as price) or indirectly (derived from prices); and Level 3: the fair value is estimated using inputs for the assets or liability that are not based on observable market data. Level 1
‘000 Level 2
‘000 Level 3
‘000 Total ‘000
Forward currency contracts – held for trading - 1,449 - 1,449
- 1,449 - 1,449
Transfer between categories: There were no transfer between level 1 and level 2 during the year.
For
per
sona
l use
onl
y

CI RESOURCES LIMITED
Notes to the financial statements For the year ended 30 June 2013
Annual Report – 30 June 2013
51
16. Current liabilities – Interest bearing loans and borrowings Consolidated
2013 2012
Notes $’000s $’000s
Bank loan 16 (a),(b),
(c),(d) 5,391 4,906 Lease liability 513 693
5,904 5,599
(a) Interest rate risk and liquidity risk Details regarding interest rate risk and liquidity risk are disclosed in Note 32. (b) Fair value The carrying amount of the borrowings approximates their fair value as the borrowings are at floating interest rates
which move in accordance with market rates. (c) Defaults and breaches During the current there were no defaults or breaches on any of the loans. (d) Financing facilities available
At reporting date, the following financing facilities had been negotiated and were available:
Total facilities 11,282 15,219 Facilities utilised at reporting date (10,782) (14,719)
Facility unused at reporting date 500 500
17. Current liabilities – Tax liability Tax payable 877 6,307
18. Current liabilities – Provisions Employee entitlements 6,636 5,814
19. Non-current liabilities – Payables Other payables - -
20. Non-current liabilities – Borrowings
Bank loan 16 (a),(b),
(c),(d) 5,391 9,813 Lease liabilities 55 50
5,446 9,863
For
per
sona
l use
onl
y

CI RESOURCES LIMITED
Notes to the financial statements For the year ended 30 June 2013
Annual Report – 30 June 2013
52
21. Non-current liabilities – Provisions Consolidated
2013 2012
Notes $’000s $’000s
Redundancy (a) 8,052 7,282 Employee entitlements 1,022 776
9,074 8,058
Decommissioning and restoration (b) 8,704 8,104
17,778 16,162
The amounts employees are entitled to receive if made redundant in accordance with their employment agreements are fully provided. The redundancy provision was increased by a net amount of $770,000 during the year ended 30 June 2013 (2012: $783,000).
(b) Provision for decommissioning and restoration
Based on the Mining Lease Agreement between the Commonwealth Government and Phosphate Resources Limited a provision for decommissioning and restoration has been recognised for costs associated with: - Demolition of all improvements specified for the removal of all debris resulting from demolition, removal of
plant and equipment and leaving the leased land in a safe, clean and tidy condition at the expiry of the lease. Estimates of the decommissioning and restoration obligations are based on anticipated technology and legal requirements and future costs, which have been discounted to their present value. In determining the decommissioning and restoration provision, the entity has assumed no significant changes will occur in the relevant Federal and State legislation in relation to demolition or restoration of such mines in the future.
Consolidated
2013 2012
Notes $’000s $’000s
(c) Movement in provisions
Provision for decommissioning and restoration : Carrying amount at the beginning of the financial year 8,104 7,504 Change in net present value of provision: - Credited to profit or loss 600 600
Carrying amount at the end of the financial year 8,704 8,104
22. Contributed equity
(a) Share capital
Number of
Shares $’000s
Ordinary shares – fully paid 72,874,102 17,970
(b) Movements in ordinary share capital Date
Details
Number of shares
$’000s
01 July 2011 Opening balance 72,874,102 17,970
30 June 2012 Closing balance 72,874,102 17,970
30 June 2013 Closing balance
72,874,102 17,970
For
per
sona
l use
onl
y

CI RESOURCES LIMITED
Notes to the financial statements For the year ended 30 June 2013
Annual Report – 30 June 2013
53
22. Contributed equity (continue)
(c) Ordinary shares Ordinary shares entitle the holder to participate in dividends and the proceeds on winding up of the company in proportion to the number of and amounts paid on the shares held. On a show of hands every holder of ordinary shares present at a meeting in person or by proxy, is entitled to one vote, and upon a poll each share is entitled to one vote.
Consolidated
2013 2012
Notes $’000s $’000s
23. Reserves
Foreign exchange translation reserve 2,713 (87)
Acquisition reserve 8,499 1,740
11,212 1,653
Foreign currency translation reserve
Exchange differences arising on translation of the foreign controlled entity are taken to the foreign currency translation reserve. The reserve is recognised in profit and loss when the net investment is disposed of.
Acquisition reserve
Any gain or loss arising on acquisition of non-controlling interest of subsidiaries is recognized in this reserve. Movements in reserves
Foreign exchange translation reserve
Balance at the beginning of the year (87) 86
FX on translation of financial report 2,800 (173)
Balance at the end of the period 2,713
(87)
Acquisition reserve
Balance at the beginning of the year 1,740 1,587
Gain on acquisition of minority interest 1,278 153
Share buy-back by PRL 5,171 -
Balance at the end of the period 8,499 1,740
24. Retained earnings Accumulated losses at the beginning of the year 29,181 18,592
Net profit attributable to members of CI Resources Limited 12,934 11,318
Dividends paid (729) (729)
Accumulated profits/(losses) at the end of the financial year 41,386 29,181
For
per
sona
l use
onl
y

CI RESOURCES LIMITED
Notes to the financial statements For the year ended 30 June 2013
Annual Report – 30 June 2013
54
25. Key management personnel disclosures
(a) Key management personnel compensation
Consolidated
2013 2012
Notes $’000s $’000s
Short term employee benefits 343 353
Post employment benefits - -
343 353
(b) Equity instrument disclosures relating to key management personnel
Options provided as remuneration and shares issued on exercise of such options
There were no options issued to key management personnel for the financial years ended 30 June 2013 and 30 June 2012.
Option holdings No key management personnel held options over ordinary shares in the Group during the current year ended 30 June 2013 (2012: Nil)
Share holdings
The numbers of shares in the Company held during the financial year by each director and the key management personnel of the consolidated entity, including their personally related parties, are set out below. There were no shares granted during the reporting period as compensation.
2013 Name
Balance at the
start of the period
Received during the
period on the exercise of
options
Other changes during the
period
Balance at the end of the period
Directors of CI Resources Limited Mr David Somerville - - - - Mr Tee Lip Jen - - - - Mr Tee Lip Sin 14,566,876 - - 14,566,876 Prof. Anthony Brennan (i) - - - - Mr Adrian Gurgone - - - - Mr Kelvin Tan Keh Feng 12,000,000 - - 12,000,000 Dato' Kamaruddin bin Mohammed(i) - - - -
Other key management personnel Ms Elizabeth Lee - - - -
(i) Dato' Kamaruddin bin Mohammed was appointed on the 17 January 2013 (ii) Prof. Anthony Brennan resigned on the 23 November 2012
Other changes does denote sale of securities, rather that the director has resigned.
For
per
sona
l use
onl
y

CI RESOURCES LIMITED
Notes to the financial statements For the year ended 30 June 2013
Annual Report – 30 June 2013
55
25. Key management personnel disclosures (continued)
2012 Name
Balance at the
start of the period
Received during the
period on the exercise of
options
Other changes during the
period
Balance at the end of the period
Directors of CI Resources Limited Mr David Somerville - - - - Mr Tee Lip Jen - - - - Mr Tee Lip Sin 13,779,876 - 787,000 14,566,876 Prof. Anthony Brennan - - - - Mr Adrian Gurgone - - - - Mr Kelvin Tan Keh Feng (i) - - 12,000,000 12,000,000 Mr Phuar Kong Seng(ii) 10,309,410 - (10,309,410) -
Other key management personnel Ms Elizabeth Lee - - - -
(i) Mr Kelvin Tan Keh Feng was appointed on the 7 June 2012, Change for period reflects opening holding. (ii) Mr Phaur Kong Seng resigned on the 16 February 2012
Other changes does not denote sale of securities rather that the director has resigned. (c) Loans to key management personnel
There are no loans made to directors or other key management personnel of CI Resources Limited.
(d) Other transactions with key management personnel
There were no other transactions with key management personnel. Consolidated
2013 2012
Notes $’000s $’000s
26. Remuneration of auditors
Amounts received or due and receivable by Ernst & Young (Australia) for: - audit of the financial report of the parent entity and the consolidated entity 185 184 - review of the half year financial report of the consolidated entity 72 65 - other services - 5
257 254 Amounts received or due and receivable by related practices of Ernst & Young (Australia) for the audit of the financial statements 45 33
45 33 Amounts received or due and receivable by auditors other than Ernst & Young for:
- an audit or review of the financial report of a controlled entity -
8
302
295
27. Contingent liabilities
There are no contingent assets or liabilities as at the date of this report.
For
per
sona
l use
onl
y

CI RESOURCES LIMITED
Notes to the financial statements For the year ended 30 June 2013
Annual Report – 30 June 2013
56
28. Commitments for expenditure
Consolidated
2013 2012
Notes $’000s $’000s
(a) Lease expenditure commitments Operating leases - not later than one year 469 374 - later than one year and not later than five years 521 235
- total minimum payments 990 609
Operating leases are entered into as a means of providing residential accommodation and office premises for Phosphate Resources Limited; residential accommodation for Indian Ocean Stevedores Pty Ltd and office equipment for Phosphate
Resources (Singapore) Pte Ltd. Finance leases 2013 2012 Minimum Lease
Payments Present Value
of Lease Payments
Minimum Lease
Payments
Present Value of Lease
Payments CONSOLIDATED $’000s $’000s $’000s $’000s Within one year 543 513 716 693 After one year but not more than five years 62 55 58 50
Total minimum lease payments 605 568 774 743 Less amounts representing future finance charges (37) - (31) -
Present value of minimum lease payments 568 568 743 743
Finance leases are entered into as a means of financing the acquisition of plant and equipment.
(b) The Company provides a guarantee and indemnity to the Commonwealth Government of Australia (Commonwealth) to ensure the performance of Indian Ocean Oil Company Pty Ltd’s obligations under the terms of a 20 year fuel lease arrangement.
(c) The Company has committed to undertake various environmental management targets and objectives as detailed in
the Christmas Island Phosphates Environmental Management Plan. (d) The Company has provided a bank guarantee of $1 million to the Commonwealth Government under the terms of
the Mining Lease Agreement.
(e) The Company has capital commitments of $0.059 million (2012: $0.65 million) for items of plant on order but not
yet delivered. 29. Related party transactions
Directors and other key management personnel Disclosures relating to directors and other key management personnel are set out in note 25. Questus Administration Services Pty Ltd a company which David Somerville is a director of was paid $87,026 in fees for the provision of Company Secretarial and Accounting services.
Controlling entities The ultimate parent entity in the group is CI Resources Limited. Ownership interests in related parties Interests held in the following classes of related parties are set out in the following Notes:
Controlled entities – Note 14
For
per
sona
l use
onl
y

CI RESOURCES LIMITED
Notes to the financial statements For the year ended 30 June 2013
Annual Report – 30 June 2013
57
30. Events occurring after reporting date
There are no matters or circumstances that have arisen since 30 June 2013 that has significantly affected, or may significantly affect:
(a) the consolidated entity’s operations in future financial years, or (b) the results of those operations in future financial years, or (c) the consolidated entity’s state of affairs in future financial years.
31. Reconciliation of profit (loss) from ordinary activities after income tax to net cash outflow from operating activities Consolidated
2013 2012
Notes $’000s $’000s
Operating profit (loss) after income tax 24,362 22,872
Adjustment for non-cash items
Accretion of provision 600 600
Bad debts 1,739 -
Change in fair value of biological assets 1,021 1,059
Depreciation 3,818 3,544
Unrealised foreign exchange (gain) / loss 390 2,966
Gain on disposal of non-current assets - 6
Impairment of goodwill - 422
Change in operating assets and liabilities
(Increase)/decrease in trade and other receivables 5,406 (5,166)
Movement in deferred tax balances (1,369) (2,304)
(Increase)/decrease in inventories 2,188 (194)
Decrease in trade creditors and accruals 858 (2,110)
Increase/(decrease) in provisions 2,438 2,743
Decrease/(increase) in prepayments (1,941) -
(Decrease)/increase in tax payable (5,879) 3,741
Net cash inflow/(outflow) from operating activities 33,631 28,179
For
per
sona
l use
onl
y

CI RESOURCES LIMITED
Notes to the financial statements For the year ended 30 June 2013
Annual Report – 30 June 2013
58
32. Financial instruments and financial risk management
The Group’s principal financial instruments comprise receivables, payables, finance leases, cash and short-term deposits, long-term deposits, interest bearing loans and borrowings, and foreign exchange derivatives. Market, liquidity and credit risk (including foreign exchange, commodity price and interest rate risk) arise in the normal course of the Group’s business. The Group manages its exposure to key financial risks, including interest rate, currency and commodity risk in accordance with the Group's risk management procedures. The overall objective of these procedures is to: • Ensure that net cash flows are sufficient to meet all financial commitments as and when they fall due. • Support the delivery of the Group's financial targets whilst protecting future financial security. • Minimise the potential adverse effects resulting from volatility on financial markets. The Group continually monitors its forecast financial position against these criteria. It is, and has been throughout the period under review, Group policy that no speculative trading in financial instruments be undertaken (i) Interest rate risk
The Group’s exposure to market interest rates relates primarily to the Group’s long term debt obligations. Interest rate risk on cash and short term deposits is not considered to be a material risk due to the short term nature of these financial instruments. The interest rates for term deposits are fixed and there is no material risk for interest bearing assets. There is no other financial asset or liability bearing interest rate risk except for interest bearing loans and borrowings, the sensitivity of which is disclosed below. The following sensitivity analysis is based on the interest rate risk exposures in existence at the reporting date: At 30 June 2012, if interest rates had moved, as illustrated in the table below, with all other variables held constant, post-tax profit and other comprehensive income would have been affected as follows:
Consolidated
Higher/(Lower)
2013 2012
$’000s $’000s
Judgments of reasonably possible movements:
Post tax profit
+1.0% (100 basis points) 431 (318)
-1.0% (100 basis points) (431) 318
Reasonable possible movements in interest rates were determined based on the Group’s mix of debt in Australia and foreign countries, relationship with financial institutions and review of last two years’ historical movements and economic forecaster’s expectations. CI Resources, both parent and group, is exposed to interest rate risks in Australia. To minimise the effects of the potential adversities, the management attempt to limit these effects through constant reviewing of the financial markets.
For
per
sona
l use
onl
y
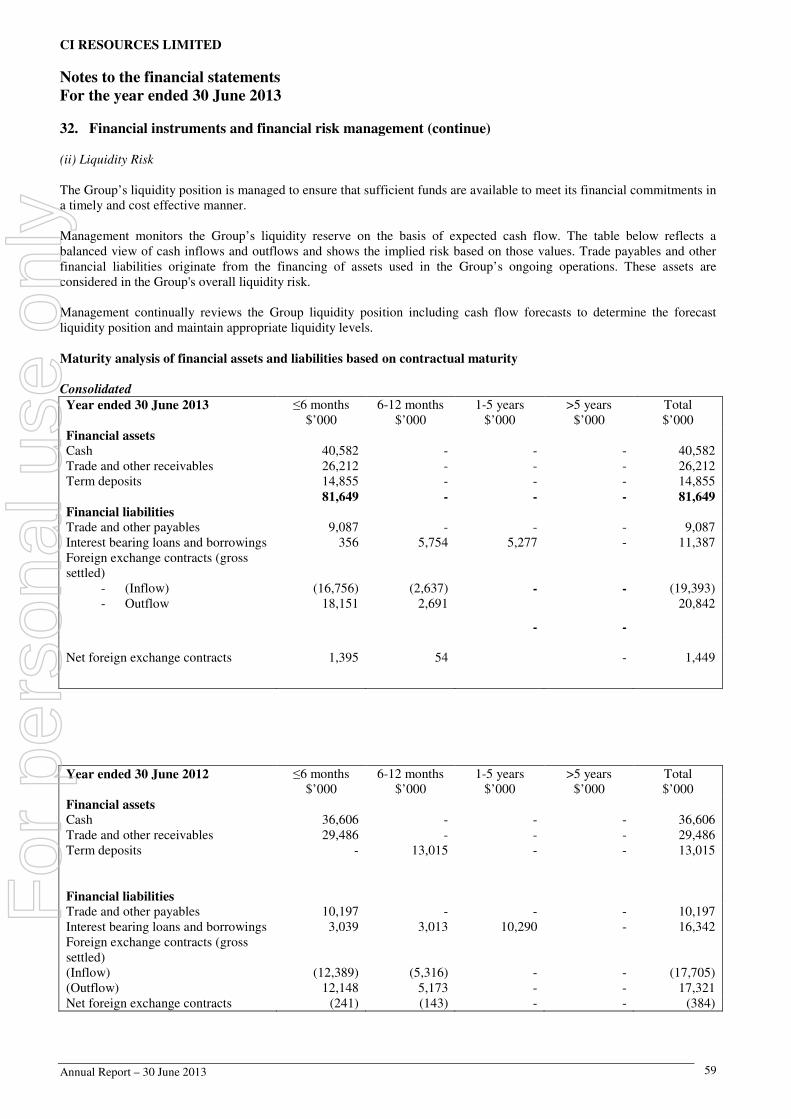
CI RESOURCES LIMITED
Notes to the financial statements For the year ended 30 June 2013
Annual Report – 30 June 2013
59
32. Financial instruments and financial risk management (continue) (ii) Liquidity Risk
The Group’s liquidity position is managed to ensure that sufficient funds are available to meet its financial commitments in a timely and cost effective manner. Management monitors the Group’s liquidity reserve on the basis of expected cash flow. The table below reflects a balanced view of cash inflows and outflows and shows the implied risk based on those values. Trade payables and other financial liabilities originate from the financing of assets used in the Group’s ongoing operations. These assets are considered in the Group's overall liquidity risk. Management continually reviews the Group liquidity position including cash flow forecasts to determine the forecast liquidity position and maintain appropriate liquidity levels. Maturity analysis of financial assets and liabilities based on contractual maturity Consolidated
Year ended 30 June 2013 ≤6 months 6-12 months 1-5 years >5 years Total $’000 $’000 $’000 $’000 $’000 Financial assets Cash 40,582 - - - 40,582 Trade and other receivables 26,212 - - - 26,212 Term deposits 14,855 - - - 14,855 81,649 - - - 81,649 Financial liabilities Trade and other payables 9,087 - - - 9,087 Interest bearing loans and borrowings 356 5,754 5,277 - 11,387 Foreign exchange contracts (gross settled)
- (Inflow) (16,756) (2,637) - - (19,393) - Outflow 18,151 2,691
- -
20,842
Net foreign exchange contracts 1,395 54
- 1,449
Year ended 30 June 2012 ≤6 months 6-12 months 1-5 years >5 years Total $’000 $’000 $’000 $’000 $’000 Financial assets Cash 36,606 - - - 36,606 Trade and other receivables 29,486 - - - 29,486 Term deposits - 13,015 - - 13,015 Financial liabilities Trade and other payables 10,197 - - - 10,197 Interest bearing loans and borrowings 3,039 3,013 10,290 - 16,342 Foreign exchange contracts (gross settled) (Inflow) (12,389) (5,316) - - (17,705) (Outflow) 12,148 5,173 - - 17,321 Net foreign exchange contracts (241) (143) - - (384)
For
per
sona
l use
onl
y

CI RESOURCES LIMITED
Notes to the financial statements For the year ended 30 June 2013
Annual Report – 30 June 2013
60
32. Financial instruments and financial risk management (continue)
(iii) Credit risk
Credit risk is the risk that a contracting entity will not complete its obligation under a financial instrument that will result in a financial loss to the Group. The carrying amount of financial assets represents the maximum credit exposure. Financial instruments that potentially subject the consolidated entity to concentrations of credit risk consist principally of cash deposits and receivables. The Group places its cash deposits and derivatives with high credit-quality financial institutions. Receivables balances are monitored on an ongoing basis with the results that the Group’s exposure to bad debts is not significant.
(iv) Derivative instruments and foreign currency risk
The Group’s future revenues are exposed to movements in foreign exchange rates, particularly the US dollar/Australian dollar rate. The Group may from time to time enter into foreign exchange derivative instruments to manage this exposure. The Group has, as outlined in note 15, forward currency contracts designated as held for trading that are subject to fair value movements through profit or loss as foreign exchange rates move.
At 30 June 2013, had the Australian Dollar moved, as illustrated in the table below, with all other variables held constant, post-tax profit and equity would have been affected as follows:
Judgments of reasonably possible movements: Post tax profit Higher/Lower
2013 2012 $’000s $’000s Consolidated AUD/USD + 10% (1,910) (1,707) AUD/USD - 10% 1,706 1,552
Management believes the balance date risk exposures are representative of the risk exposure inherent in the financial instruments. Significant assumptions used in the foreign currency exposure sensitivity analysis include:
- Reasonably possible movements in foreign exchange rates were determined based on a review of the last two years historical movements.
- The net exposure at balance date is representative of what the Group was and is expecting to be exposed to in the next twelve months from balance date.
(v) Fair values
The Directors have performed a review of the financial assets and liabilities as at 30 June 2013 and have concluded that the fair value of those assets and liabilities are not materially different to book values. The methods and assumptions used to estimate the fair value of financial instruments were:
• Cash - The carrying amount is fair value due to the liquid nature of these assets. • Receivables/payables - due to the short term nature of these financial rights and obligations, and/or market interest
received/paid, their carrying values are estimated to represent their fair values. • Derivatives - The fair values of forward currency contracts are calculated by reference to current forward exchange
rates for contracts with similar maturity profiles. • Finance lease liability – The fair value is the present value of minimum lease payments. • Bank loan – All the bank loans of the Group are interest bearing with floating interest rates which move in
accordance with the market interest rates. Therefore the fair value of the bank loans approximates their carrying value.
For
per
sona
l use
onl
y

CI RESOURCES LIMITED
Notes to the financial statements For the year ended 30 June 2013
Annual Report – 30 June 2013
61
32. Financial instruments and financial risk management (continue) Capital risk management The Group’s objectives when managing capital are to safeguard their ability to continue as a going concern, so that they can continue to provide shareholders and stakeholders in the future and to maintain an optimal capital structure to reduce the cost of capital. Management are constantly adjusting the capital structure as suitable. As the market is constantly changing, management may change the amount of dividends paid to shareholders, return capital to shareholders or issue new shares. Management have no current plans to issue further shares on the market.
33. Parent entity information
Consolidated
2013 2012
Notes $’000s $’000s
Current assets 977 2,388
Total assets 13,162 13,625
Current liabilities 139 614
Total liabilities 139 614
Issued capital 17,970 17,970
Retained earnings (4,947) (4,959)
Total shareholders’ equity 13,023 13,011
Profit of the parent entity 741 1,086
Total comprehensive income 741 1,086
There have been no guarantees entered into by the Parent Entity in relation to any debts of its subsidiaries. The parent has no contingent liabilities as at date of this report. The Parent Entity has no contractual commitments for the acquisition of property, plant or equipment.
For
per
sona
l use
onl
y

CI RESOURCES LIMITED
Notes to the financial statements For the year ended 30 June 2013
Annual Report – 30 June 2013
62
34. Segment reporting
The Group has identified its operating segments based on the internal reports that are reviewed and used by the executive management team (the chief operation decision makers) in assessing performance and in determining the allocation of resource. The Group has identified its operating segments to be Mining and Farming based on the different operating businesses within the Group. Discrete financial information about each of these operating segments is reported to the chief operation decision makers on a monthly basis. The Mining operating segment primarily involves mining, processing and sale of phosphate rock, phosphate dust and chalk The Farming operating segment primarily involves oil palm cultivation and palm oil processing The accounting policy used by the Group in reporting segments internally is the same as those contained in Note 2 to the accounts. Deferred tax assets and liabilities are not allocated to operating segments as they are not considered part of the core operations of any segment.
Year ended 30 June 2013
Mining Farming Unalloc/ Elimination
Total
$’000 $’000 $’000 $’000
Revenue Revenue from external customers 101,556 42,775 - 144,331 Interest income 624 - 175 799 Stevedoring - - 1,578 1,578 Rendering of services - - 7,045 7,045 Other sales - - 868 868
Total segment revenue 102,180 42,775 9,666 154,621 Result Segment net operating profit after tax (attributable to parent) 20,884 2,078 1,400 24,362
Depreciation and amortisation 2,470 1,074 221 3,765 Income tax expense 8,614 1,122 586 10,322 Assets and Liabilities Segment assets 91,224 65,254 12,837 169,315
Segment liabilities 40,351 13,568 3,595 57,514
For
per
sona
l use
onl
y

CI RESOURCES LIMITED
Notes to the financial statements For the year ended 30 June 2013
Annual Report – 30 June 2013
63
34. Segment reporting (continue) Year ended 30 June 2012
Mining Farming Unalloc/ Elimination
Total
$’000 $’000 $’000 $’000
Revenue Revenue from external customers 92,626 33,497 - 126,123 Interest income 657 - 318 975 Stevedoring - - 1,784 1,784 Rendering of services - - 7,710 7,710 Other sales - - 700 700
Total segment revenue 93,283 33,497 10,512 137,292 Result Segment net operating profit after tax (attributable to parent) 20,075 1,795 1,002 22,872
Depreciation and amortisation 2,082 1,007 421 3,510 Income tax expense 9,554 820 794 11,168 Assets and Liabilities Segment assets 88,018 61,885 11,540 161,443
Segment liabilities 49,359 12,372 2,575 64,306
Revenue from external customers by geographical locations is detailed below. Revenue is attributed to geographic location based on the location of the customers. The Company does not have external revenues from external customers that are attributable to any foreign country other than as shown: Consolidated
2013 2012
$’000s $’000s
Australia 102,180 93,283
Malaysia 42,775 33,497
Other foreign countries 9,666 10,512
154,621 137,292
Major customers The Group has number of customers to which it provides the products. There are no customers of the Group who account for more than 10% of total external revenue in 2013 and 2012.
Non-Current Assets by geographical regions: Consolidated
2013 2012
$’000s $’000s
Australia 37,872 27,812
Malaysia 51,065 53,124
Other foreign countries 3,664 1,924
92,601 82,860
For
per
sona
l use
onl
y

CI RESOURCES LIMITED
Directors’ declaration For the year ended 30 June 2013
Annual Report – 30 June 2013
64
In accordance with a resolution of the Directors of CI Resources Limited, I state that: In the directors’ opinion: (a) The financial statements comprising the Consolidated Statement of Comprehensive Income, Consolidated Statement of Financial Position, Consolidated Statement of Cash Flows, Consolidated Statement of Changes in Equity and accompanying notes set out on pages 21 to 64 are in accordance with the Corporations Act 2001, including:
(i) complying with Accounting Standards (including Australian Accounting Interpretations) and Corporations
Regulations 2001; and
(ii) giving a true and fair view of the Company and the consolidated entity’s financial position as at 30 June 2013 and of their performance, for the year ended on that date; and
(b) the financial statements and notes also comply with International Financial Reporting Standards as disclosed in note 2
(c) there are reasonable grounds to believe that the Company will be able to pay its debts as and when they become due and payable; and
The directors have been given the declarations by the chief executive officer and the chief financial officer required by section 295A of the Corporations Act 2001. This declaration is made in accordance with a resolution of the directors.
D Somerville Chairman
Perth 27 September 2013
F
or p
erso
nal u
se o
nly

A member firm of Ernst & Young Global Limited
Liability limited by a scheme approved under Professional Standards Legislation
RC:DR:CI RESOURCES:036
Ernst & Young 11 Mounts Bay Road Perth WA 6000 Australia GPO Box M939 Perth WA 6843
Tel: +61 8 9429 2222 Fax: +61 8 9429 2436 ey.com/au
Independent audit report to members of CI Resources Limited
Report on the financial report
We have audited the accompanying financial report of CI Resources Limited, which comprises the consolidated statement of financial position as at 30 June 2013, the consolidated statement of comprehensive income, the consolidated statement of changes in equity and the consolidated statement of cash flows for the year then ended, notes comprising a summary of significant accounting policies and other explanatory information, and the directors' declaration of the consolidated entity comprising the company and the entities it controlled at the year's end or from time to time during the financial year.
Directors' responsibility for the financial report
The directors of the company are responsible for the preparation of the financial report that gives a true and fair view in accordance with Australian Accounting Standards and the Corporations Act 2001 and for such internal controls as the directors determine are necessary to enable the preparation of the financial report that is free from material misstatement, whether due to fraud or error. In Note 2, the directors also state, in accordance with Accounting Standard AASB 101 Presentation of Financial Statements, that the financial statements comply with International Financial Reporting Standards.
Auditor's responsibility
Our responsibility is to express an opinion on the financial report based on our audit. We conducted our audit in accordance with Australian Auditing Standards. Those standards require that we comply with relevant ethical requirements relating to audit engagements and plan and perform the audit to obtain reasonable assurance about whether the financial report is free from material misstatement.
An audit involves performing procedures to obtain audit evidence about the amounts and disclosures in the financial report. The procedures selected depend on the auditor's judgment, including the assessment of the risks of material misstatement of the financial report, whether due to fraud or error. In making those risk assessments, the auditor considers internal controls relevant to the entity's preparation and fair presentation of the financial report in order to design audit procedures that are appropriate in the circumstances, but not for the purpose of expressing an opinion on the effectiveness of the entity's internal controls. An audit also includes evaluating the appropriateness of accounting policies used and the reasonableness of accounting estimates made by the directors, as well as evaluating the overall presentation of the financial report.
We believe that the audit evidence we have obtained is sufficient and appropriate to provide a basis for our audit opinion.
Independence
In conducting our audit we have complied with the independence requirements of the Corporations Act 2001. We have given to the directors of the company a written Auditor’s Independence Declaration, a copy of which is included in the directors’ report.
For
per
sona
l use
onl
y

A member firm of Ernst & Young Global Limited
Liability limited by a scheme approved under Professional Standards Legislation
A member firm of Ernst & Young Global Limited
Liability limited by a scheme approved under Professional Standards Legislation
RC:DR:CI RESOURCES:036
Opinion
In our opinion:
a. The financial report of CI Resources Limited is in accordance with the Corporations Act 2001, including:
i giving a true and fair view of the consolidated entity's financial position as at 30 June 2013 and of its performance for the year ended on that date; and
ii complying with Australian Accounting Standards and the Corporations Regulations 2001; and
b. The financial report also complies with International Financial Reporting Standards as disclosed in Note 2.
Report on the remuneration report
We have audited the Remuneration Report included in the Directors' Report for the year ended 30 June 2013. The directors of the company are responsible for the preparation and presentation of the Remuneration Report in accordance with section 300A of the Corporations Act 2001. Our responsibility is to express an opinion on the Remuneration Report, based on our audit conducted in accordance with Australian Auditing Standards.
Opinion
In our opinion, the Remuneration Report of CI Resources Limited for the year ended 30 June 2013, complies with section 300A of the Corporations Act 2001. Ernst & Young R J Curtin Partner Perth 27 September 2013
For
per
sona
l use
onl
y

CI RESOURCES LIMITED ASX Additional Information
Annual Report – 30 June 2013
67
Additional information required by the Australian Securities Exchange Limited Listing Rules and not disclosed elsewhere in this report.
SHAREHOLDINGS Substantial shareholders The following substantial shareholders have lodged notices with the Company as at 17 September 2013: Holders Ordinary shares Prosper Trading Sdn Bhd 14,566.876 Keen Strategy Sdn Bhd 12,000,000 Destinasi Emas Sdn Bhd 7,437,410 Poo Ah Lam 3,675,371
Class of shares and voting rights At 17 September 2013 there were 336 holders of ordinary shares on the Company. The voting rights attaching to the ordinary shares are:
• On a show of hands, every person present who is a shareholder or a proxy, attorney or representative of a shareholder has one vote; and
• On a poll, every person present who is a shareholder or a proxy, attorney or representative of a shareholder shall, in respect of each fully paid share held by him, or in respect of which he is appointed a proxy, attorney or representative, have one vote for the share, but in respect of partly paid shares, shall have a fraction of a vote for each partly paid share. The fraction shall be equivalent to the proportion which the amount paid is of the total amounts paid and payable, excluding amounts credited, provided that the amounts paid in advance of a call are ignored when calculating a true portion. Distribution of share holders Category
Ordinary
shares
1 - 1,000 65 1,001 - 5,000 68 5,001 - 10,000 106
10,001 - 100,000 65 100,001 - and over 32 336
There were 60 holders of less than a marketable parcel of ordinary shares. On-market buy back There is no current on-market buy back. Restricted securities The Company does not have any restricted securities.
For
per
sona
l use
onl
y

CI RESOURCES LIMITED ASX Additional Information
Annual Report – 30 June 2013
68
Unquoted securities The Company does not have any unquoted securities Twenty largest holders of ordinary shares (as at 17 September 2013) Ordinary shares
Holder name Number %
PHILLIP SECURITIES PTE LTD <CLIENT ACCOUNT> 33,296,249 45.69
KEEN STRATEGY SDN BHD 12,000,000 16.47
PROSPER TRADING SDN BHD 11,616,000 15.94
KLUANG PTY LTD 1,050,000 1.44
MR WILLY SEE KHIANG TEO 1,049,761 1.44
CITICORP NOMINEES PTY LIMITED 1,016,775 1.40
MS MEE YUEN YONG 835,572 1.15
JP MORGAN NOMINEES AUSTRALIA LIMITED <CASH INCOME A/C> 753,558 1.03
HSBC CUSTODY NOMINEES (AUSTRALIA) LIMITED 734,386 1.01
MR SEE KHIANG WILLY TEO 731,429 1.00
RIVERTREE PTY LTD <THE PHOENIX ACCOUNT> 711,293 0.98
MR PHILIP TUCK SANG WOO 605,715 0.83
SEE KHIANG TEO 527,286 0.72
MR HANG PHOO TAN 500,000 0.69
MR AH HONG & MRS WAI CHING LAI & MR WENG KIN LAI <LAI SUPER FUND A/C>
422,000 0.58
DMG & PARTNERS SECURITIES PTE LTD <CLIENTS A/C> 416,325 0.57
MR XU YI HAO 378,657 0.52
FULLONG WORLDWIDE LIMITED 311,750 0.43
GREAT PIONEER CONSULTANTS LTD 311,750 0.43
MR WILLY SEE KHIANG TEO 308,000 0.42
67,779,050 93.01
Other information CI Resources Limited, incorporated and domiciled in Australia, is a publicly listed company limited by shares. The Company’s shares are quoted on the Australian Securities Exchange.
For
per
sona
l use
onl
y