church of the resurrection tis (8.3.17) - alexandriava.gov · church of the resurrection ... this...
TRANSCRIPT

Traffic Impact Study
Church of the Resurrection
City of Alexandria, Virginia
August 3, 2017
Prepared for: AHC, Inc. 2230 N Fairfax Drive, Suite 100 Arlington, VA 22201

Prepared by:
1140 Connecticut Avenue Suite 600
Washington, DC 20036 Tel: 202.296.8625 Fax: 202.785.1276
3914 Centreville Road Suite 330
Chantilly, VA 20151 Tel: 703.787.9595 Fax: 703.787.9905
15125 Washington Street Suite 316
Haymarket, VA 20169 Tel: 703.787.9595 Fax: 703.787.9905
www.goroveslade.com
This document, together with the concepts and designs presented herein, as an instrument of services, is
intended for the specific purpose and client for which is was prepared. Reuse of and improper reliance on
this document without written authorization by Gorove/Slade Associates, Inc., shall be without liability to
Gorove/Slade Associates, Inc.

Traffic Impact Study – Church of the Resurrection Gorove/Slade Associates
August 3, 2017 1
TABLE OF CONTENTS
List of Figures ............................................................................................................................................................................... 3
List of Tables ................................................................................................................................................................................ 4
Executive Summary ..................................................................................................................................................................... 5
Site Location and Study Area ................................................................................................................................................... 5
Description of Proposed Development ................................................................................................................................... 5
Principal Findings, Conclusions, and Recommendations ......................................................................................................... 5
Introduction and Summary .......................................................................................................................................................... 8
Study Objectives ...................................................................................................................................................................... 8
Study Tasks .............................................................................................................................................................................. 8
Data Sources ............................................................................................................................................................................ 9
Proposed Development and Context ......................................................................................................................................... 10
Site Description ...................................................................................................................................................................... 10
Site Location ...................................................................................................................................................................... 10
Proposed Site Plan ............................................................................................................................................................. 11
Parcel Information ............................................................................................................................................................. 12
Zoning Information ............................................................................................................................................................ 13
Scope and Limits of the Study Area ....................................................................................................................................... 14
Existing Conditions (2017) ......................................................................................................................................................... 16
Existing Transit Facilities ........................................................................................................................................................ 16
Metrorail ............................................................................................................................................................................ 16
Bus ..................................................................................................................................................................................... 16
Existing Bicycle and Pedestrian Facilities ............................................................................................................................... 18
Bicycle Facilities ................................................................................................................................................................. 18
Pedestrian Facilities ........................................................................................................................................................... 19
Existing Roadway Network .................................................................................................................................................... 22
Existing Traffic Volumes ......................................................................................................................................................... 24
Existing Capacity Analysis ...................................................................................................................................................... 26
Future (2021) Without Development Conditions ...................................................................................................................... 31
Planned Future Transportation Improvements ..................................................................................................................... 31
Planned Roadway Improvements ...................................................................................................................................... 31
Future Transit Improvements ............................................................................................................................................ 31
Future Bicycle and Pedestrian Improvements ................................................................................................................... 31
Future (2021) without Development Traffic Volumes ........................................................................................................... 33

Traffic Impact Study – Church of the Resurrection Gorove/Slade Associates
August 3, 2017 2
Future (2021) without Development Capacity Analysis ........................................................................................................ 38
Future (2021) With Development Conditions ........................................................................................................................... 43
Site Access ............................................................................................................................................................................. 43
Site Generated Volumes ........................................................................................................................................................ 43
Site Trip Distribution .............................................................................................................................................................. 45
Future (2021) with Development Traffic Volumes ................................................................................................................ 45
Future (2021) with Development Capacity Analysis .............................................................................................................. 48
Transportation Management Plan Framework ......................................................................................................................... 52
Conclusions ................................................................................................................................................................................ 54
Traffic Impact Study – Church of the Resurrection Gorove/Slade Associates
August 3, 2017 3
LIST OF FIGURES
Figure 1: Site Location ............................................................................................................................................................... 10
Figure 2: Proposed Site Plan ...................................................................................................................................................... 11
Figure 3: Tax Map (Source: City of Alexandria Tax Map, March 2016) ...................................................................................... 12
Figure 4: City of Alexandria Zoning Map .................................................................................................................................... 13
Figure 5: Study Area Intersections 1‐4 ....................................................................................................................................... 14
Figure 6: Study Area Intersections 5‐8 ....................................................................................................................................... 15
Figure 7: Existing Transit Facilities ............................................................................................................................................. 17
Figure 8: Existing Bicycle Map (Source: City of Alexandria, March 2016) .................................................................................. 18
Figure 9: Potential Bicycle Activity (City of Alexandria 2008 Pedestrian and Bicycle Mobility Plan) ......................................... 19
Figure 10: Existing Pedestrian Crossing Peak Hour Volumes ..................................................................................................... 20
Figure 11: Potential Pedestrian Activity (City of Alexandria 2008 Pedestrian and Bicycle Mobility Plan) ................................. 21
Figure 12: Existing (2017) Lanes and Traffic Control Devices .................................................................................................... 23
Figure 13: Existing (2017) Traffic Volumes ................................................................................................................................ 25
Figure 14: Existing (2017) Capacity Analysis Results .................................................................................................................. 30
Figure 15: Off‐Street Bikeways Program (Source: City of Alexandria Bicycle and Pedestrian Mobility Plan) ............................ 32
Figure 16: Recommended Sidewalk Improvements (City of Alexandria 2016 Bicycle and Pedestrian Mobility Draft Plan) ..... 32
Figure 17: Background Growth Traffic Volumes ........................................................................................................................ 35
Figure 18: Background Projects Traffic Volumes ....................................................................................................................... 36
Figure 19: Future (2021) without Development Traffic Volumes .............................................................................................. 37
Figure 20: Future (2021) without Development Capacity Analysis Results ............................................................................... 42
Figure 21: Future (2021) Lanes and Traffic Control Devices ...................................................................................................... 44
Figure 22: Direction of Approach ............................................................................................................................................... 45
Figure 23: Site Generated Traffic Volumes ................................................................................................................................ 46
Figure 24: Future (2021) with Development Traffic Volumes ................................................................................................... 47
Figure 25: Future (2021) with Development Capacity Analysis Results .................................................................................... 51

Traffic Impact Study – Church of the Resurrection Gorove/Slade Associates
August 3, 2017 4
LIST OF TABLES
Table 1: Existing Transit Time Table........................................................................................................................................... 16
Table 2: Existing Roadway Network ........................................................................................................................................... 22
Table 3: Existing (2017) Capacity Analysis Results ..................................................................................................................... 28
Table 4: Future (2021) without Development Capacity Analysis Results .................................................................................. 40
Table 5: Trip Generation ............................................................................................................................................................ 43
Table 6: Future with Development (2021) Capacity Analysis Results ........................................................................................ 49

Traffic Impact Study – Church of the Resurrection Gorove/Slade Associates
August 3, 2017 5
EXECUTIVE SUMMARY
This report presents the findings of a Traffic Impact Study (TIS) conducted for the proposed redevelopment at 2280 N
Beauregard Street. The site is currently occupied by the Church of the Resurrection.
Site Location and Study Area
The site is located in the City of Alexandria, Virginia, and is bounded by Fillmore Avenue to the north, an existing retirement
community to the east and south, and N Beauregard Street to the west. The site is within the Beauregard Small Area Plan
boundary.
Description of Proposed Development
Under the proposed plan, the existing 13,800 square foot church will be replaced with a building with 113 affordable dwelling
units (ADUs) and an additional building that will replace existing church. A total of 112 parking spaces will be provided for
the church and dwelling units.
Vehicular access will be provided via one (1) driveway located off of Fillmore Avenue.
Principal Findings, Conclusions, and Recommendations
This report presents the findings of a Traffic Impact Study (TIS) conducted for the proposed redevelopment of the Church of
the Resurrection site in Alexandria, Virginia. The analysis presented in this report supports the following major conclusions:
The nearest Metro station is the Van Dorn Street Metro station is located approximately 2.65 miles south of the site.
The study area is served by ten Metrobus lines and two DASH lines with many bus stops located within a half mile
of the site. There are two existing bus stops adjacent the site.
The overall pedestrian network surrounding the project site is generally well established, with sidewalks on both
sides of nearly all roadway segments and crosswalks at all signalized intersections and some minor street
approaches.
Off‐street bicycle facilities and bike lanes are provided north of site along South Walter Reed Drive (North
Beauregard Street becomes South Walter Reed Drive north of King Street). These bike facilities connect to the
Washington & Old Dominion Trail and Four Mile Run northeast of the site. On‐street shared lane markings are
currently placed on North Beauregard Street at the Fillmore Avenue intersection, according to the Alexandria
existing bicycle facilities map.
For the purpose of this analysis, it is desirable to achieve a level of service (LOS) of D or better for each lane group
at the intersections. The capacity analysis results indicate that all intersections and movements operate at
acceptable LOS under existing conditions, with the exception of the following:
o Intersection 1: N Beauregard Street and Seminary Road
Eastbound Left, AM and PM Peak Hour
Eastbound Right, PM Peak Hour
Westbound Left, AM and PM Peak Hour
Westbound Thru/Right, AM Peak Hour

Traffic Impact Study – Church of the Resurrection Gorove/Slade Associates
August 3, 2017 6
Northbound Left, PM Peak Hour
Southbound Left, AM Peak Hour
o Intersection 2: N Beauregard Street and Fillmore Avenue
Eastbound Left, AM and Sunday Peak Hour
Westbound Left, PM Peak Hour
Northbound Left/Thru, AM Peak Hour
Northbound Right, AM Peak Hour
Southbound Left/Thru, AM and PM Peak Hour
Southbound Right, AM and PM Peak Hour
o Intersection 3: N Beauregard Street and Braddock Road
Eastbound Left, AM, PM, and Sunday Peak Hour
Westbound Left, AM Peak Hour
Northbound Left, AM and PM Peak Hour
Northbound Left/Thru, AM and PM Peak Hour
Northbound Right, AM and PM Peak Hour
Southbound Left, AM and PM Peak Hour
Southbound Thru/Right, AM and PM Peak Hour
The proposed development of the Church of the Resurrection site is anticipated to be completed in 2021. The future
without development traffic volumes were projected by increasing the existing traffic volumes to the build‐out year
using an inherent growth rate of 0.5 percent per year at the study area intersections and by adding forecasted traffic
volumes for three pipeline developments in the vicinity of the site.
Under future (2021) without development conditions, the capacity analysis results indicate that all intersections and
movements operate at acceptable LOS under existing conditions, with the exception of the:
o Intersection 1: N Beauregard Street and Seminary Road
Eastbound Left, AM and PM Peak Hour
Eastbound Right, PM Peak Hour
Westbound Left, AM and PM Peak Hour
Northbound Left, PM Peak Hour
Southbound Left, AM Peak Hour
o Intersection 2: N Beauregard Street and Fillmore Avenue
Eastbound Left, AM and Sunday Peak Hour
Westbound Left, AM and PM Peak Hour

Traffic Impact Study – Church of the Resurrection Gorove/Slade Associates
August 3, 2017 7
Southbound Left/Thru, AM and PM Peak Hour
Southbound Right, PM Peak Hour
o Intersection 3: N Beauregard Street and Braddock Road
Eastbound Left, AM, PM, and Sunday Peak Hour
Westbound Left, AM Peak Hour
Northbound Left, AM and PM Peak Hour
Northbound Left/Thru, AM and PM Peak Hour
Northbound Right, AM and PM Peak Hour
Southbound Left, AM and PM Peak Hour
Southbound Thru/Right, AM and PM Peak Hour
In order to determine future (2021) traffic volumes on the roadways in the vicinity of the site under the 2021 build
out condition, the site‐generated traffic volumes were added to the future (2021) without development traffic
volumes. The proposed development will generate a total of 33 new trips in the weekday morning peak hour, 45
new trips in the weekday afternoon peak hour, and 32 new trips in the Sunday peak hour.
With the addition of site traffic to the road network, all movements at the study intersections continue to operate
at levels of service consistent with those in the Future (2021) With Development scenario.
Access to the Church of the Resurrection site is provided via a separate driveway parallel to the Private Drive serving
the Goodwin House. The existing access to the church parking lot from the Private Drive serving the Goodwin House
will be restricted to emergency vehicle access only, and future access to the church parking lot will be provided via
the new site driveway. Therefore, no new site trips have been added to the Private Drive serving the Goodwin
House, and there are no new impacts to queuing or delay along the Private Drive.
A TMP will be required for this site and a TMP Framework has been included in the report.
The study results indicate that the additional trips generated by the new apartment building and church will have a
negligible impact on the operations of the study intersections. The analysis results presented in the Future (2021)
With Development scenario are consistent with the results for the Future (2021) Without Development scenario,
which shows conditions in 2021 without trips generated by this project.

Traffic Impact Study – Church of the Resurrection Gorove/Slade Associates
August 3, 2017 8
INTRODUCTION AND SUMMARY
The following report presents the findings of a Traffic Impact Study (TIS) conducted for the proposed redevelopment of the
2280 N Beauregard Street site in the City of Alexandria, Virginia.
The site is currently occupied by the Church of the Resurrection. Under the proposed plan, the redevelopment will replace
the 13,800 square foot church structure with two buildings: one that includes 113 affordable dwelling units (ADUs) and one
that includes approximately 5,000 square feet dedicated to the church. A total of 112 parking spaces will be provided in the
parking garage, a surface lot, and on‐street. A total of 84 spaces will be dedicated for the residential use and 28 for church
uses, including 6 tandem spaces. The proposed build out year is 2021.
Study Objectives
The objectives of this study are to evaluate the transportation network in the vicinity of the site and identify any potential
transportation impacts that may result from the proposed redevelopment. Elements of this report include a description of
the proposed development, an evaluation of the existing transportation network, and evaluations of the future
transportation network with and without the proposed development.
Study Tasks
The following tasks were completed as part of the study:
A scoping meeting was conducted on January 14, 2016 with representatives from the City of Alexandria Department
of Transportation and Environmental Services, and the meeting included discussions about the parameters of the
study and relevant background information. A copy of the signed scoping letter confirming the parameters and
assumptions used in the TIS is included in Appendix A.
Field reconnaissance in the vicinity of the site was performed to collect information related to existing traffic
controls, roadway geometry, and traffic flow characteristics.
Traffic counts were collected at four (4) of the eight (8) study area intersections on Thursday, February 4, 2016 during
the AM and PM peak hours. All other weekday intersection counts were previously collected in 2012 and 2013 and
provided by the City of Alexandria staff. Sunday intersection counts were taken on February 7, 2016 at all intersection
locations. All volumes were grown to provide 2017 existing conditions in the study.
Regional growth was based on historical ADT volumes published by VDOT and consistent with other traffic studies
in the area. Six background developments in the vicinity of the proposed development were identified to be included
in the analysis per discussions held at the scoping meeting.
Future traffic conditions were estimated based on existing traffic volumes, regional growth, traffic generated by
other developments in the study area, and the proposed development plan.
Proposed site traffic volumes were generated based on methodology outlined in the Institute of Transportation
Engineers’ (ITE) Trip Generation, 9th Edition publication.
Intersection capacity analyses were performed using the software package Synchro, Version 9.1 based on the
Highway Capacity Manual (HCM) methodology. HCM 2010 was used to analyze the unsignalized intersections. HCM
2000 was used to analyze the signalized intersections due to the limitations of HCM 2010. Traffic analyses were
performed for the existing conditions (2017) and future with and without development conditions (2021).

Traffic Impact Study – Church of the Resurrection Gorove/Slade Associates
August 3, 2017 9
A Transportation Management Plan framework was developed as a TMP will be necessary to meet City
requirements.
Data Sources
Sources of data for this study include Institute of Transportation Engineers (ITE) Trip Generation, 9th Edition, the City of
Alexandria, the Virginia Department of Transportation (VDOT), AHC Inc., Walter L Phillips Inc., and the office files and field
reconnaissance efforts by Gorove/Slade Associates, Inc.

Traffic Impact Study – Church of the Resurrection Gorove/Slade Associates
August 3, 2017 10
PROPOSED DEVELOPMENT AND CONTEXT
Site Description
Site Location
The site is located within the Beauregard Small Area Plan area. The site is bounded by Fillmore Avenue to the north, the
Goodwin House (an existing retirement community) to the east and south, and N Beauregard Street to the west. The site
location is shown in Figure 1.
Figure 1: Site Location

Traffic Impact Study – Church of the Resurrection Gorove/Slade Associates
August 3, 2017 11
Proposed Site Plan
The proposed site will include a total of 113 affordable dwelling units (ADUs) and approximately 5,000 square feet dedicated
to the church. A total of 112 parking spaces will be included for church and residential uses: an 80‐space enclosed garage
provided for the residents of the development, an existing 20‐space surface parking lot to be expanded to 25 spaces and
remain for church usage, and seven on‐street spaces. The proposed site plan is presented on Figure 2.
Vehicular access will be provided via one (1) driveway located off of Fillmore Avenue. An existing curb cut will service the
driveway that will provide the entrance to the proposed parking garage and surface lot for the residential and church uses. A
curb cut will be added north of the garage entrance to service trash and loading facilities.
Figure 2: Proposed Site Plan

Traffic Impact Study – Church of the Resurrection Gorove/Slade Associates
August 3, 2017 12
Parcel Information
The existing property at 2280 N Beauregard Street is currently occupied by the Church of the Resurrection (Tax Map 11.03).
A tax map showing the location of the property is presented in Figure 3.
Figure 3: Tax Map (Source: City of Alexandria Tax Map, March 2016)

Traffic Impact Study – Church of the Resurrection Gorove/Slade Associates
August 3, 2017 13
Zoning Information
According to the City of Alexandria’s Zoning Map, the site is zoned Residential High for Multi‐Family (RA). The zoning map for
the site is shown in Figure 4.
Figure 4: City of Alexandria Zoning Map

Traffic Impact Study – Church of the Resurrection Gorove/Slade Associates
August 3, 2017 14
Scope and Limits of the Study Area
The following intersections were identified for inclusion in this study, as shown on Figure 5 and Figure 6:
1. N Beauregard Street/Seminary Road
2. N Beauregard Street/Fillmore Avenue
3. N Beauregard Street/Braddock Road
4. Fillmore Avenue/Seminary Road
5. Fillmore Avenue/Newport Village Driveway
6. Fillmore Avenue/Private Drive/Site Driveway/Goodwin House
7. Private Drive/Goodwin House Center Driveway
8. Private Drive/Existing Church Parking/Goodwin House Access/Parking Garage
Figure 5: Study Area Intersections 1‐4

Traffic Impact Study – Church of the Resurrection Gorove/Slade Associates
August 3, 2017 15
Figure 6: Study Area Intersections 5‐8

Traffic Impact Study – Church of the Resurrection Gorove/Slade Associates
August 3, 2017 16
EXISTING CONDITIONS (2017)
Existing Transit Facilities
Metrorail
There is no Metro station within a one (1) mile walking distance of the site. The nearest station is the Van Dorn Street Metro
station, located approximately 2.65 miles south of the site on Eisenhower Avenue between South Van Dorn Street and
Clermont Drive. The station features daily parking, bike parking, and carsharing options. The Van Dorn Street Metro serves
the Blue and Yellow line, and average weekday daily ridership at the station in 2016 was approximately 3,052 boardings
according to the publication Metrorail Average Weekday Daily Boardings (WMATA, June, 2016).
Bus
The study area is served by several Metrobus lines and two DASH lines under existing conditions as shown on Figure 7. There
are two existing bus stops adjacent to the site at the intersection of Fillmore Avenue and North Beauregard Street. Both bus
stops adjacent to the site provide shelters with benches. These bus stops are served by the following routes:
WMATA (Metrobus) – Nine Metrobus routes and one MetroExtra route serve in an around the site area with bus
stops located on N. Beauregard Street, Fillmore Avenue, Seminary Road and Braddock Road Table 1 presents
destinations and frequencies for all routes route.
Alexandria Transit (DASH) – Two DASH routes directly serve the bus stops closest to the subject site. These routes
are detailed in Table 1.
Table 1: Existing Transit Time Table
Route Number Route Name Service Hours Headway Walking Distance to Nearest Bus Stop7A, 7F, 7Y (WMATA)
Lincolnia‐North Fairlington Line
Weekdays: 4:58AM – 3:46 AMWeekends: 6:29AM – 3:47 AM
5‐72 minutes <0.1 miles, 1 minute
16L (WMATA)
Annandale‐Skyline City‐Pentagon Line
Weekdays: 6:30AM – 6:57 PM 26‐31 minutes 0.4 miles, 7 minutes
22F (WMATA)
Barcroft‐South Fairlington Line
Weekdays: 5:55AM – 8:37 PM 18‐30 minutes 0.1 miles, 2 minutes
25B (WMATA)
Landmark‐Ballston Line Weekdays: 5:52AM – 11:21 PMWeekends: 6:29AM – 9:21 PM
11‐90 minutes 0.1 miles, 2 minutes
28A (WMATA)
Leesburg Pike Line Weekdays: 4:23AM – 1:24 AMWeekends: 6:19AM – 1:35 AM
8‐30 minutes 0.1 miles, 2 minutes
28F, 28G (WMATA)
Skyline City Line Weekdays: 5:50AM – 7:23 PM 19‐30 minutes 0.1 miles, 2 minutes
28X (WMATA)
Leesburg Pike Limited Line Weekdays: 5:45AM – 7:18 AM 13‐30 minutes 0.5 miles, 10 minutes
AT6 (DASH)
King Street‐Old Town Metro to NVCC
Weekdays: 5:35AM – 10:43 PM 14‐45 minutes 0.1 miles, 2 minutes
AT9 DASH
Mark Center to Potomac Yard
Weekdays: 6:46AM – 9:43 PM 30 minutes 0.1 miles, 2 minutes

Traffic Impact Study – Church of the Resurrection Gorove/Slade Associates
August 3, 2017 17
Figure 7: Existing Transit Facilities

Traffic Impact Study – Church of the Resurrection Gorove/Slade Associates
August 3, 2017 18
Existing Bicycle and Pedestrian Facilities
Bicycle Facilities
Off‐street bicycle facilities and bike lanes are provided north of site along South Walter Reed Drive (North Beauregard Street
becomes South Walter Reed Drive north of King Street). These bike facilities connect to the Washington & Old Dominion Trail
and Four Mile Run northeast of the site. North Beauregard Street east of Seminary Road provides a bicycle connection to east
Alexandria. The site is connected to bike routes along West Braddock Road to the north and Seminary Road. Additional
Alexandria existing bicycle facilities are shown on Figure 8. The nearest Capital Bikeshare location is over a mile from the site.
Figure 8: Existing Bicycle Map (Source: City of Alexandria, March 2016) Excerpts from the City’s Pedestrian and Bicycle Mobility Plan (June 2008) are included in Figure 9. This figure shows the bicycle
potential as well as indicators for the existing quality of bicycle service in the vicinity of the site. The immediate area on N
Beauregard Street and Fillmore Avenue has a medium‐to‐high potential for bicycle activity, with higher potential on Seminary
Road southeast of the site.

Traffic Impact Study – Church of the Resurrection Gorove/Slade Associates
August 3, 2017 19
Figure 9: Potential Bicycle Activity (City of Alexandria 2008 Pedestrian and Bicycle Mobility Plan)
Pedestrian Facilities
A pedestrian infrastructure inventory was conducted in accordance with City of Alexandria guidelines. The pedestrian and
bicycle inventory area can be generally described by the area included within a 0.25‐mile radius around the site, as agreed
upon in the scope. The overall pedestrian network surrounding the project site is generally well established, with sidewalks
on both sides of nearly all roadway segments and crosswalks at most signalized intersections and minor street approaches.
Crosswalks, pedestrian signal push buttons, and ramps are provided at most signalized intersections within the study area.
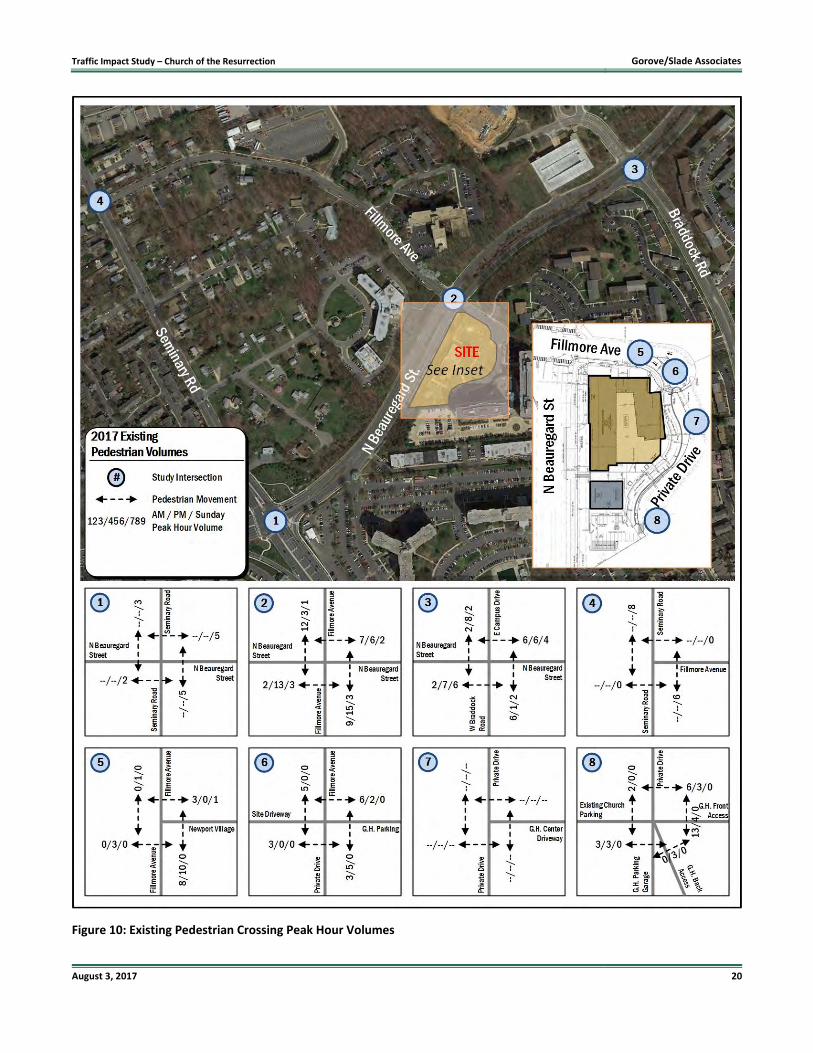
Figure 10 shows the existing pedestrian peak hour volumes at all study area intersections. It should be noted that pedestrian
volumes were not collected at all locations during the AM and PM Peak Hour.
Traffic Impact Study – Church of the Resurrection Gorove/Slade Associates
August 3, 2017 20
Figure 10: Existing Pedestrian Crossing Peak Hour Volumes

Traffic Impact Study – Church of the Resurrection Gorove/Slade Associates
August 3, 2017 21
The proposed site has a WalkScore of 62 from WalkScore.com, indicating “Somewhat Walkable”, with some errands being
accomplished by foot.
Excerpts from the City’s Pedestrian and Bicycle Mobility Plan (June 2008) are included in Figure 11. This figure shows the
walking potential as well as indicators for the existing quality of pedestrian service in the vicinity of the site. As with the
potential bicycle activity, the area around the site shows a medium‐to‐high potential for pedestrians, particularly along N
Beauregard Street, Fillmore Avenue, and Seminary Road.
Figure 11: Potential Pedestrian Activity (City of Alexandria 2008 Pedestrian and Bicycle Mobility Plan)

Traffic Impact Study – Church of the Resurrection Gorove/Slade Associates
August 3, 2017 22
Existing Roadway Network
A description of the roadways within the study area is presented below in Table 2. The existing local roadway network
including lane configurations and intersection control is detailed in and illustrated in Figure 12.
Table 2: Existing Roadway Network
Roadway Classification Lanes Speed On‐Street Parking
ADT*
N Beauregard Street Minor Arterial (VDOT) 4 35 mph No 17,000
Fillmore Avenue Minor Collector (VDOT) 2 25 mph Yes 4,600
Braddock Road Minor Arterial (VDOT) 4 35 mph No 12,000
Seminary Road Minor Arterial (VDOT) 4 to 8 35 mph No 54,000
King Street Other Principal Arterial (VDOT) 4 to 5 35 mph No 45,000
*ADT figures retrieved from VDOT 2016 Traffic Counts Data for City of Alexandria

Traffic Impact Study – Church of the Resurrection Gorove/Slade Associates
August 3, 2017 23
Figure 12: Existing (2017) Lanes and Traffic Control Devices

Traffic Impact Study – Church of the Resurrection Gorove/Slade Associates
August 3, 2017 24
Existing Traffic Volumes
Traffic counts were collected at four (4) of the eight (8) study area intersections on Thursday, February 4, 2016 during the AM
and PM peak hours. Sunday intersection counts were taken on February 7, 2016 at all intersection locations.
City of Alexandria staff provided weekday intersection counts were previously collected in 2012 and 2013 at the following
intersections:
N Beauregard Street and Seminary Road (collected in 2012)
N Beauregard Street and Braddock Road (collected in 2013)
Fillmore Avenue and Seminary Road (collected in 2012)
The traffic counts collected in 2012 and 2013 were grown at a compounded 0.5% percent per year rate to 2017 in order to
establish base existing volumes for 2017. The counts collected in 2016 were grown at the 0.5% rate for an additional year to
establish 2017 volumes. It should be noted, no volume balancing was done between the intersections collected in 2016 and
the counts provided by the City of Alexandria Staff.
Analysis of the existing traffic data determined that the morning peak hour of the system occurred from 7:30 AM to 8:30 AM,
the afternoon peak hour of the system occurred from 5:00 to 6:00 PM, and the Sunday peak hour of the system occurred
from 11:30 AM to 12:30 PM.
The existing peak hour traffic volumes for the intersections within the study area are shown on Figure 13, and the existing
turning movement counts are included in the Appendix.

Traffic Impact Study – Church of the Resurrection Gorove/Slade Associates
August 3, 2017 25
Figure 13: Existing (2017) Traffic Volumes

Traffic Impact Study – Church of the Resurrection Gorove/Slade Associates
August 3, 2017 26
Existing Capacity Analysis
Capacity analyses were performed at the intersections within the study area during the weekday morning and afternoon peak
hours under the existing conditions. Synchro, Version 9.1 was used to analyze the study intersections based on the Highway
Capacity Manual (HCM) methodology and include level of service, delay, and queue length comparisons for the turning
movements analyzed. Signal timing data was obtained from City of Alexandria staff. Signalized intersections were analyzed
using HCM 2000 methodology with unsignalized intersections using HCM 2010 methodology
Peak hour factors were applied in accordance with Transportation Planning Administrative Guidelines prepared by the City
of Alexandria date March 25, 2013. As such, peak hour factors by approach between 0.85 and 1.00 were used for the existing
year analysis. Where the calculated peak hour factor based on the existing turning movement counts was greater than 0.85,
the calculated factor was applied. Where the calculated factor was 0.85 or less, a factor of 0.85 was applied. A heavy vehicle
percentage of 2% was used for existing movements unless determined to be higher from the turning movement counts, in
which case the higher percentage was used. A default heavy vehicle percentage of 2% was used for any new movements.
An existing Synchro network was provided by the City of Alexandria for signalized intersections in the study area.
The results of the intersection capacity analyses are presented in Table 3 and are expressed in level of service (LOS) and delay
(seconds per vehicle) per lane group. The 95% and 50% queue results for each intersection are also presented in Table 3 and
are expressed in feet. The results of the intersection capacity analyses are illustrated on Figure 14. Detailed analysis
worksheets are included in the Technical Appendix.
For the purpose of this analysis, it is desirable to achieve a level of service (LOS) of D or better for each lane group at the
intersections. The capacity analysis results indicate that all intersections and movements operate at acceptable LOS under
existing conditions, with the exception of the following movements:
Intersection 1: N Beauregard Street and Seminary Road
Eastbound Left, AM and PM Peak Hour
Eastbound Right, PM Peak Hour
Westbound Left, AM and PM Peak Hour
Westbound Thru/Right, AM Peak Hour
Northbound Left, PM Peak Hour
Southbound Left, AM Peak Hour
Intersection 2: N Beauregard Street and Fillmore Avenue
Eastbound Left, AM and Sunday Peak Hour
Westbound Left, PM Peak Hour
Northbound Left/Thru, AM Peak Hour
Northbound Right, AM Peak Hour
Southbound Left/Thru, AM and PM Peak Hour
Southbound Right, AM and PM Peak Hour

Traffic Impact Study – Church of the Resurrection Gorove/Slade Associates
August 3, 2017 27
Intersection 3: N Beauregard Street and Braddock Road
Eastbound Left, AM, PM, and Sunday Peak Hour
Westbound Left, AM Peak Hour
Northbound Left, AM and PM Peak Hour
Northbound Left/Thru, AM and PM Peak Hour
Northbound Right, AM and PM Peak Hour
Southbound Left, AM and PM Peak Hour
Southbound Thru/Right, AM and PM Peak Hour

Traffic Impact Study – Church of the Resurrection Gorove/Slade Associates
August 3, 2017 28
Table 3: Existing (2017) Capacity Analysis Results
1 N Beauregard Street and Seminary Road
Overall Intersection (Signalized) D 44.2 D 48.2 C 27.3
Eastbound Left 650 E 61.6 251 296 E 69.3 230 #282 D 41.9 100 140
Eastbound Thru 650 D 48.6 284 321 D 44.5 174 217 D 36.5 61 89
Eastbound Right 550 D 50.2 104 205 F 94.7 ~411 #605 D 38.7 0 0
Westbound Left 150 E 69.3 120 #219 E 61.4 195 #302 D 48.4 62 113
Westbound Thru/Right 1200 E 55.1 123 172 D 47.6 258 303 D 41.9 74 68
Northbound Left 400 D 47.0 212 260 E 71.9 163 #227 D 42.6 55 78
Northbound Thru 600 C 26.6 376 472 D 38.2 533 626 B 18.7 198 276
Northbound Right 275 B 19.4 0 36 C 24.5 21 67 B 14.7 0 13
Southbound Left 100 E 60.7 42 84 D 54.2 67 m97 D 45.2 40 76
Southbound Thru 550 D 43.0 278 336 C 20.6 272 131 B 19.3 124 165
Southbound Right 250 D 40.1 0 70 C 30.7 310 183 C 21.0 0 48
2 N Beauregard Street and Fillmore Avenue
Overall Intersection (Signalized) B 15.7 C 20.0 B 13.5
Eastbound Left 160 E 67.0 55 m54 D 45.2 30 102 E 61.4 18 41
Eastbound Thru/Right 775 A 4.3 8 371 A 7.4 160 233 A 3.7 3 123
Westbound Left 80 D 53.8 6 m25 E 76.7 28 62 D 50.8 7 26
Westbound Thru/Right 1050 A 7.6 76 101 A 6.4 87 104 A 2.4 40 41
Northbound Left/Thru 110 E 57.2 31 53 D 53.2 27 50 D 45.4 26 41
Northbound Right 50 E 55.5 0 0 D 51.8 0 0 D 43.9 0 0
Southbound Left/Thru 300 E 72.7 68 m95 E 69.3 104 m141 D 47.2 24 41
Southbound Right 50 E 55.6 0 m0 E 75.6 7 m49 D 44.0 0 m0
3 N Beauregard Street and Braddock Road
Overall Intersection (Signalized) D 36.1 C 33.5 C 26.2
Eastbound Left 75 E 74.6 155 250 F 80.5 43 88 E 76.2 13 36
Eastbound Thru 1100 B 12.2 135 500 B 20.5 102 71 A 6.4 19 34
Eastbound Right 75 A 5.0 3 33 B 14.8 10 16 A 9.8 0 0
Westbound Left 90 E 57.3 117 186 D 36.3 363 #641 D 43.0 111 #228
Westbound Thru/Right 725 C 20.4 92 190 B 13.4 132 284 A 8.2 8 81
Northbound Left 200 E 58.2 106 143 E 61.1 85 130 D 45.2 31 53
Northbound Left/Thru 650 E 57.2 110 127 E 59.3 79 103 D 43.8 17 28
Northbound Right 50 E 61.2 60 143 E 57.2 0 72 D 44.3 0 50
Southbound Left 100 E 58.8 24 46 E 60.3 45 75 D 48.6 1 7
Southbound Thru/Right 250 E 60.4 47 71 E 60.7 54 75 D 48.6 1 8
4 Fillmore Avenue and Seminary Road
Overall Intersection (Unsignalized) A 1.3 A 3.8 A 0.8
Westbound Left/Right ‐‐ C 19.9 ‐ 10 C 16.7 ‐ 15 B 14.0 ‐ 8
Northbound Thru/Right 425 A 0.0 ‐ 0 A 0.0 ‐ 0 A 0.0 ‐ 0
Southbound Left/Thru 100 B 13.4 ‐ 10 B 13.2 ‐ 5 B 12.0 ‐ 5
Southbound Thru 100 A 1.9 ‐ 0 A 6.4 ‐ 0 A 0.8 ‐ 0
QueueLOS Delay
50th 95th
Intersection (Movement)Storage
Length Queue
AM Peak
LOS Delay50th 95th
Existing 2017
Sunday Peak
LOS DelayQueue
50th 95th
PM Peak

Traffic Impact Study – Church of the Resurrection Gorove/Slade Associates
August 3, 2017 29
5 Fillmore Avenue and Newport Village
Overall Intersection (Unsignalized) A 3.4 A 3.0 A 2.7
Westbound Left/Right 250 A 8.8 ‐ 3 A 8.7 ‐ 3 A 8.9 ‐ 3
Northbound Thru/Right 75 A 0.0 ‐ 0 A 0.0 ‐ 0 A 0.0 ‐ 0
Southbound Left/Thru 125 A 7.4 ‐ 0 A 7.4 ‐ 3 A 7.3 ‐ 0
6 Fillmore Avenue/Private Drive and Site Driveway/Goodwin House
Overall Intersection (Unsignalized) A 0.4 ‐ A 1.1 A 1.9
Eastbound Left/Thru/Right 50 A 8.6 ‐ 0 A 9.1 ‐ 0 A 9.1 ‐ 3
Westbound Left/Thru/Right 50 A 0.0 ‐ 0 A 0.0 ‐ 0 A 0.0 ‐ 0
Northbound Left/Thru/Right 75 A 0.0 ‐ 0 A 0.0 ‐ 0 A 0.0 ‐ 0
Southbound Left/Thru/Right 75 A 7.8 ‐ 0 A 7.3 ‐ 0 A 7.3 ‐ 0
7 Private Drive/Goodwin House Center Driveway
Overall Intersection (Unsignalized) A 0.0 ‐ A 0.0 A 0.0
Westbound Left/Right 50 A 0.0 ‐ 0 A 0.0 ‐ 0 A 0.0 ‐ 0
Northbound Thru/Right 215 A 0.0 ‐ 0 A 0.0 ‐ 0 A 0.0 ‐ 0
Southbound Left/Thru 75 A 0.0 ‐ 0 A 0.0 ‐ 0 A 0.0 ‐ 3
8 Private Drive/Ex. Church Parking/Goodwin House Access/Garage
Overall Intersection (Unsignalized) A 7.1 A 7.0 A 7.1
Eastbound Left/Thru/Right 25 A 6.9 ‐ 0 A 7.0 ‐ 0 A 7.3 ‐ 0
Westbound Left/Thru/Right 125 A 7.0 ‐ 3 A 6.5 ‐ 0 A 6.6 ‐ 0
Northbound Left/Thru/Right* ‐‐ A 7.0 ‐ 3 A 7.1 ‐ 3 A 7.0 ‐ 0
Southbound Left/Thru/Right 215 A 7.3 ‐ 3 A 7.2 ‐ 3 A 7.3 ‐ 5
m ‐ Volume for 95th percentile queue is metered by upstream signal
# ‐ 95th percentile volume exceeds capacity, queue may be longer
~ ‐ Volume exceeds capacity, queue is theoretically infinite
* ‐ Existing five‐way intersection analyzed as four‐way in Synchro due to limititations of HCM capacity analysis
50th 95th
Intersection (Movement)Storage
Length
Existing 2017
AM Peak PM Peak Sunday Peak
LOS DelayQueue
LOS DelayQueue
LOS DelayQueue
50th 95th 50th 95th

Traffic Impact Study – Church of the Resurrection Gorove/Slade Associates
August 3, 2017 30
Figure 14: Existing (2017) Capacity Analysis Results

Traffic Impact Study – Church of the Resurrection Gorove/Slade Associates
August 3, 2017 31
FUTURE (2021) WITHOUT DEVELOPMENT CONDITIONS
Planned Future Transportation Improvements
Planned Roadway Improvements
A reversible High Occupancy Vehicle (HOV) ramp from I‐395 to Seminary Road opened in January 2016. The Virginia
Department of Transportation project connected the I‐395 HOV lanes to the top level of the Seminary Road interchange.
The King Street (Route 7)/Beauregard Street intersection will undergo improvements in order to increase capacity and safety.
An additional left‐turn lane will be created in both directions along King Street, along with medians on King Street and a
shared use path on portions of King Street. The entire project is scheduled to enter construction in Spring 2016 and completed
in late 2018.
N Beauregard Street in the vicinity of the project site is cited as a potential route for the West End Transitway, a Bus Rapid
Transit (BRT) system proposed by the City of Alexandria that provide services between the Van Dorn Street and Pentagon
Metro stations. Currently the project is in the Alternatives Analysis and Environmental Documentation phase. If constructed,
the roadway profile along North Beauregard Street would be significantly altered and could effect on‐street parking along
Fillmore Avenue.
No roadway improvements are planned in the study area for the future 2021 development scenarios; therefore no planned
roadway improvements have been included in this study.
Future Transit Improvements
In 2008 and 2009, the Leesburg Pike Line (Bus Route 28) was studied by WMATA in association with Fairfax County, City of
Falls Church, and City of Alexandria. The route was selected due to passenger feedback concerning slower than normal travel
times and a lack of schedule reliability. Following a series of public meetings, technical analysis, and WMATA Metro board
approval, changes were made to the route. The input of slow travel times on the route led to the creation of a limited‐stop
line, the 28X. With fewer stops in the Leesburg area, it is expected that service times will improve in other areas of the route,
including in Alexandria in the vicinity of the site area.
Future Bicycle and Pedestrian Improvements
According to the City of Alexandria’s 2008 Pedestrian and Bicycle Mobility Plan, upgrades are proposed for the existing bicycle
and pedestrian facilities along North Beauregard Street and King Street. As shown in Figure 15, these upgrades consist of
constructing a side path or widening the existing sidewalk. The City has also identified recommended sidewalk
improvements, which include reconstructing the existing sidewalk along parts of King Street near the North Beauregard Street
intersection, along with long term improvements of creating a buffer along Fillmore Avenue and North Beauregard Street in
the vicinity of the site. Figure 16 details the status of the 2008 recommended improvements, as noted in the City’s 2016 Draft
Pedestrian and Bicycle Master Plan.

Traffic Impact Study – Church of the Resurrection Gorove/Slade Associates
August 3, 2017 32
Figure 15: Off‐Street Bikeways Program (Source: City of Alexandria Bicycle and Pedestrian Mobility Plan)
Figure 16: Recommended Sidewalk Improvements (City of Alexandria 2016 Bicycle and Pedestrian Mobility Draft Plan)
Traffic Impact Study – Church of the Resurrection Gorove/Slade Associates
August 3, 2017 33
Future (2021) without Development Traffic Volumes
The proposed redevelopment is anticipated to be completed by 2021. The future traffic volumes were projected by increasing
the existing traffic volumes to the buildout year using background growth rate based on historical traffic growth provided by
VDOT as well as previous studies in the area.
According to historical data obtained from VDOT, there has been some growth within the study areas in recent years. A 0.5%
growth per year over a two year period was applied to the existing volumes to account for regional increases in traffic. The
total traffic generated by the regional background growth is presented in Figure 17.
In addition to the regional background growth, six approved developments in the vicinity of the site were taken into
consideration. As discussed at the scoping meeting, the following developments were included in the analysis:
Gateway at King and Beauregard: The site is located on the southeast corner of the King Street‐N. Beauregard Street
intersection. It is anticipated to be built by 2021 and will be a mixed‐use development consisting of 352 units,
116,000 sf of retail, and 94,000 sf of office development. The project is expected to generate 317 weekday AM peak
hour vehicle trips, 526 weekday PM peak hour vehicle trips, and 311 Sunday peak hour vehicle trips based on the
Traffic Impact Study prepared by Gorove/Slade Associates with revision date September 10, 2015.
St. James Plaza Apartments: The site is located south of Fillmore Road, north of Echols Road, and west of the
Hermitage Retirement Community building. It is anticipated to be built by 2021 and will consist of 93 residential
units and 31 residential townhomes. The initial Traffic Impact Study prepared by Gorove/Slade Associates dated
October 24, 2014 analyzed an earlier development plan which called for 225 residential units and a 2,000 sf daycare.
In order to provide a conservative analysis, the trips generated by the original development plan shown in the 2014
study were used for this analysis. Based on that development program, the project would generate 86 weekday AM
peak hour vehicle trips, 103 weekday PM peak hour vehicle trips, and a negative Sunday peak hour trip generation.
As a conservative measure, no site trips were added during the Sunday peak hour for this development.
Northern Virginia Community College‐Alexandria Campus Phase I: The site is located east of Fillmore Avenue on
the campus of Northern Virginia Community College. It is anticipated to be built by 2021. The development will
consist of 300 student dwelling units to support an increase of student enrollment. The project is expected to
generate 172 weekday AM peak hour vehicle trips, 172 weekday PM peak hour vehicle trips, and 44 Sunday peak
hour vehicle trips based on the Traffic Impact Analysis prepared by Wells + Associates dated February 20, 2013.
Three other background developments were also discussed at the scoping meeting. These developments will not have site
trips added for analysis for reasons stated below.
Goodwin House: The Goodwin House is located adjacent to the proposed redevelopment site off of Fillmore Avenue.
The additional development happening on this site will have a decrease in units; therefore, the background analysis
for the site will not contain additional trips.
Fairbanks Development: There is no specific timeline for development.
Southern Towers Retail: There is no specific timeline for development.
The total traffic generated by the background developments is presented in Figure 18. Diagrams showing the trips generated
by each background development are presented in Appendix D.

Traffic Impact Study – Church of the Resurrection Gorove/Slade Associates
August 3, 2017 34
The inherent growth rate in conjunction with the trips generated by the approved background developments were applied
to the existing traffic volume in order to generate future (2021) without development traffic volumes. The future (2021)
without development traffic volumes are shown in Figure 19.

Traffic Impact Study – Church of the Resurrection Gorove/Slade Associates
August 3, 2017 35
Figure 17: Background Growth Traffic Volumes

Traffic Impact Study – Church of the Resurrection Gorove/Slade Associates
August 3, 2017 36
Figure 18: Background Projects Traffic Volumes

Traffic Impact Study – Church of the Resurrection Gorove/Slade Associates
August 3, 2017 37
Figure 19: Future (2021) without Development Traffic Volumes

Traffic Impact Study – Church of the Resurrection Gorove/Slade Associates
August 3, 2017 38
Future (2021) without Development Capacity Analysis
Capacity analyses were performed at the intersections contained within the study area during the weekday morning and
afternoon peak hours under the future without development conditions. Synchro, Version 9.1 was used to analyze the study
intersections based on the Highway Capacity Manual (HCM) methodology and include level of service, delay, and queue
length comparisons for the turning movements analyzed. Signalized intersections were analyzed using HCM 2000
methodology with unsignalized intersections using HCM 2010 methodology. Reporting methodology for this scenario is
consistent with the existing conditions analysis.
Peak hour factors were applied in accordance with Transportation Planning Administrative Guidelines prepared by the City
of Alexandria dated March 25, 2013. The guidelines state that “future PHFs should be 15 percent greater than the existing
for the future horizon analysis, not to exceed 0.95.” As such, a PHF of 0.95 was used for all approaches at each study
intersection, as the minimum existing PHF factor used was 0.85.
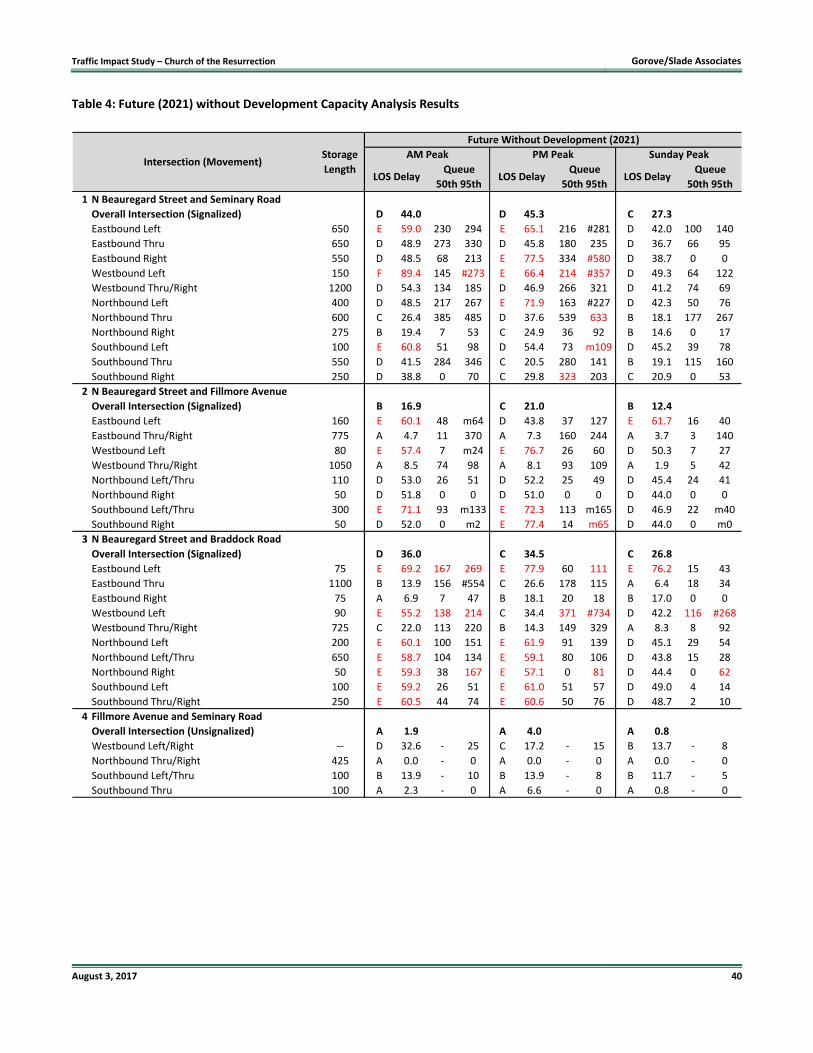
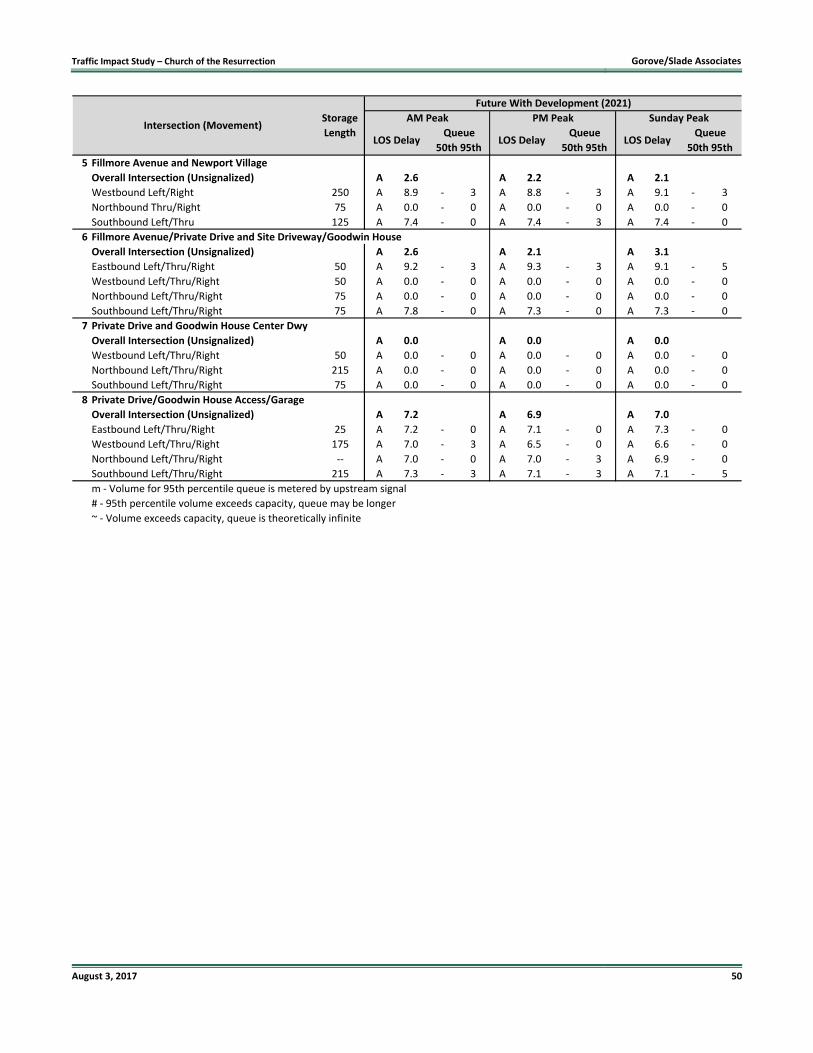
The results of the intersection capacity analyses are presented in Table 4 and are expressed in level of service (LOS) and delay
(seconds per vehicle) per lane group. The 95% and 50% queue results for each intersection are also presented in Table 4.
The results of the intersection capacity analyses are shown on Figure 19, and the detailed analysis worksheets are contained
in the Technical Appendix.
With an inherent growth rate of 0.5% per year at all movements on public roads at the study intersections and the addition
of traffic generated by three pipeline developments, all movements at the study intersections operate at acceptable levels of
service with the exception of the following:
Intersection 1: N Beauregard Street and Seminary Road
Eastbound Left, AM and PM Peak Hour
Eastbound Right, PM Peak Hour
Westbound Left, AM and PM Peak Hour
Northbound Left, PM Peak Hour
Southbound Left, AM Peak Hour
Intersection 2: N Beauregard Street and Fillmore Avenue
Eastbound Left, AM and Sunday Peak Hour
Westbound Left, AM and PM Peak Hour
Southbound Left/Thru, AM and PM Peak Hour
Southbound Right, PM Peak Hour
Intersection 3: N Beauregard Street and Braddock Road
Eastbound Left, AM, PM, and Sunday Peak Hour
Westbound Left, AM Peak Hour
Northbound Left, AM and PM Peak Hour
Northbound Left/Thru, AM and PM Peak Hour
Traffic Impact Study – Church of the Resurrection Gorove/Slade Associates
August 3, 2017 39
Northbound Right, AM and PM Peak Hour
Southbound Left, AM and PM Peak Hour
Southbound Thru/Right, AM and PM Peak Hour
Traffic Impact Study – Church of the Resurrection Gorove/Slade Associates
August 3, 2017 40
Table 4: Future (2021) without Development Capacity Analysis Results
1 N Beauregard Street and Seminary Road
Overall Intersection (Signalized) D 44.0 D 45.3 C 27.3
Eastbound Left 650 E 59.0 230 294 E 65.1 216 #281 D 42.0 100 140
Eastbound Thru 650 D 48.9 273 330 D 45.8 180 235 D 36.7 66 95
Eastbound Right 550 D 48.5 68 213 E 77.5 334 #580 D 38.7 0 0
Westbound Left 150 F 89.4 145 #273 E 66.4 214 #357 D 49.3 64 122
Westbound Thru/Right 1200 D 54.3 134 185 D 46.9 266 321 D 41.2 74 69
Northbound Left 400 D 48.5 217 267 E 71.9 163 #227 D 42.3 50 76
Northbound Thru 600 C 26.4 385 485 D 37.6 539 633 B 18.1 177 267
Northbound Right 275 B 19.4 7 53 C 24.9 36 92 B 14.6 0 17
Southbound Left 100 E 60.8 51 98 D 54.4 73 m109 D 45.2 39 78
Southbound Thru 550 D 41.5 284 346 C 20.5 280 141 B 19.1 115 160
Southbound Right 250 D 38.8 0 70 C 29.8 323 203 C 20.9 0 53
2 N Beauregard Street and Fillmore Avenue
Overall Intersection (Signalized) B 16.9 C 21.0 B 12.4
Eastbound Left 160 E 60.1 48 m64 D 43.8 37 127 E 61.7 16 40
Eastbound Thru/Right 775 A 4.7 11 370 A 7.3 160 244 A 3.7 3 140
Westbound Left 80 E 57.4 7 m24 E 76.7 26 60 D 50.3 7 27
Westbound Thru/Right 1050 A 8.5 74 98 A 8.1 93 109 A 1.9 5 42
Northbound Left/Thru 110 D 53.0 26 51 D 52.2 25 49 D 45.4 24 41
Northbound Right 50 D 51.8 0 0 D 51.0 0 0 D 44.0 0 0
Southbound Left/Thru 300 E 71.1 93 m133 E 72.3 113 m165 D 46.9 22 m40
Southbound Right 50 D 52.0 0 m2 E 77.4 14 m65 D 44.0 0 m0
3 N Beauregard Street and Braddock Road
Overall Intersection (Signalized) D 36.0 C 34.5 C 26.8
Eastbound Left 75 E 69.2 167 269 E 77.9 60 111 E 76.2 15 43
Eastbound Thru 1100 B 13.9 156 #554 C 26.6 178 115 A 6.4 18 34
Eastbound Right 75 A 6.9 7 47 B 18.1 20 18 B 17.0 0 0
Westbound Left 90 E 55.2 138 214 C 34.4 371 #734 D 42.2 116 #268
Westbound Thru/Right 725 C 22.0 113 220 B 14.3 149 329 A 8.3 8 92
Northbound Left 200 E 60.1 100 151 E 61.9 91 139 D 45.1 29 54
Northbound Left/Thru 650 E 58.7 104 134 E 59.1 80 106 D 43.8 15 28
Northbound Right 50 E 59.3 38 167 E 57.1 0 81 D 44.4 0 62
Southbound Left 100 E 59.2 26 51 E 61.0 51 57 D 49.0 4 14
Southbound Thru/Right 250 E 60.5 44 74 E 60.6 50 76 D 48.7 2 10
4 Fillmore Avenue and Seminary Road
Overall Intersection (Unsignalized) A 1.9 A 4.0 A 0.8
Westbound Left/Right ‐‐ D 32.6 ‐ 25 C 17.2 ‐ 15 B 13.7 ‐ 8
Northbound Thru/Right 425 A 0.0 ‐ 0 A 0.0 ‐ 0 A 0.0 ‐ 0
Southbound Left/Thru 100 B 13.9 ‐ 10 B 13.9 ‐ 8 B 11.7 ‐ 5
Southbound Thru 100 A 2.3 ‐ 0 A 6.6 ‐ 0 A 0.8 ‐ 0
Queue
50th 95th 50th 95th 50th 95th
Intersection (Movement)Storage
Length
Future Without Development (2021)
AM Peak PM Peak Sunday Peak
LOS DelayQueue
LOS DelayQueue
LOS Delay

Traffic Impact Study – Church of the Resurrection Gorove/Slade Associates
August 3, 2017 41
5 Fillmore Avenue and Newport Village
Overall Intersection (Unsignalized) A 3.3 A 2.9 A 2.6
Westbound Left/Right 250 A 8.8 ‐ 3 A 8.7 ‐ 3 A 8.9 ‐ 3
Northbound Thru/Right 75 A 0.0 ‐ 0 A 0.0 ‐ 0 A 0.0 ‐ 0
Southbound Left/Thru 125 A 7.4 ‐ 0 A 7.4 ‐ 3 A 7.3 ‐ 0
6 Fillmore Avenue/Private Drive and Site Driveway/Goodwin House
Overall Intersection (Unsignalized) A 0.3 ‐ A 1.1 A 1.8
Eastbound Left/Thru/Right 50 A 8.6 ‐ 0 A 9.1 ‐ 0 A 9.0 ‐ 3
Westbound Left/Thru/Right 50 A 0.0 ‐ 0 A 0.0 ‐ 0 A 0.0 ‐ 0
Northbound Left/Thru/Right 75 A 0.0 ‐ 0 A 0.0 ‐ 0 A 0.0 ‐ 0
Southbound Left/Thru/Right 75 A 7.8 ‐ 0 A 7.3 ‐ 0 A 7.3 ‐ 0
7 Private Drive/Goodwin House Center Driveway
Overall Intersection (Unsignalized) A 0.0 ‐ A 0.0 A 0.0
Westbound Left/Right 50 A 0.0 ‐ 0 A 0.0 ‐ 0 A 0.0 ‐ 0
Northbound Thru/Right 215 A 0.0 ‐ 0 A 0.0 ‐ 0 A 0.0 ‐ 0
Southbound Left/Thru 75 A 0.0 ‐ 0 A 0.0 ‐ 0 A 0.0 ‐ 0
8 Private Drive/Ex. Church Parking/Goodwin House Access/Garage
Overall Intersection (Unsignalized) A 7.2 A 7.0 A 7.1
Eastbound Left/Thru/Right 25 A 6.9 ‐ 0 A 7.0 ‐ 0 A 7.3 ‐ 0
Westbound Left/Thru/Right 125 A 7.0 ‐ 3 A 6.5 ‐ 0 A 6.6 ‐ 0
Northbound Left/Thru/Right* ‐‐ A 7.0 ‐ 0 A 7.1 ‐ 3 A 7.0 ‐ 0
Southbound Left/Thru/Right 215 A 7.3 ‐ 3 A 7.2 ‐ 3 A 7.3 ‐ 5
m ‐ Volume for 95th percentile queue is metered by upstream signal
# ‐ 95th percentile volume exceeds capacity, queue may be longer
~ ‐ Volume exceeds capacity, queue is theoretically infinite
* ‐ Existing five‐way intersection analyzed as four‐way in Synchro due to limititations of HCM capacity analysis
Intersection (Movement)Storage
Length
Future Without Development (2021)
AM Peak PM Peak Sunday Peak
LOS DelayQueue
LOS DelayQueue
LOS DelayQueue
50th 95th 50th 95th 50th 95th

Traffic Impact Study – Church of the Resurrection Gorove/Slade Associates
August 3, 2017 42
Figure 20: Future (2021) without Development Capacity Analysis Results

Traffic Impact Study – Church of the Resurrection Gorove/Slade Associates
August 3, 2017 43
FUTURE (2021) WITH DEVELOPMENT CONDITIONS
The site is currently occupied by the Church of the Resurrection. Under the proposed plan, the site will include the
aforementioned church along with 113 affordable residential dwelling units. A total of 112 parking spaces will be provided
for the church and residences, with an 80‐space enclosed garage provided for residents of the development, an expanded
25‐space lot just south of the site for church uses, and seven on‐street spaces, with four reserved for residential and three
for church uses. The proposed build out year is 2021.
Site Access
Vehicular access will be provided via one (1) driveway located off of Fillmore Avenue. An existing curb cut will service the
driveway that will provide the entrance to the proposed parking garage and surface lot for residential and church uses. A curb
cut will be added north of the garage entrance on Fillmore Avenue to service trash and loading facilities. The existing lot
serving the church will no longer be accessible from the private drive to Goodwin House, with the exception of emergency
vehicles. The proposed site plan is presented on Figure 2 and the lane configuration for the site intersections is presented on
Figure 21.
Site Generated Volumes
The Institute of Transportation Engineer’s (ITE) Trip Generation, 9th Edition, was used to determine the future trips generated
by the proposed residential use. Since the church currently exists at the site, the trips generated by the existing church were
assumed to remain the same for the future use as well. At the time that the existing site trips were collected, the church
shared the site with a daycare facility which has since relocated. Since it was not possible to differentiate the trips made for
church and daycare use, all existing site trips were assumed to remain as is for the future church use with no reduction for
the previous daycare use, which will provide a conservative analysis of site trips.
It is expected that a portion of the residents will travel by transit or on foot/by bicycle during the peak hours, rather than by
personal vehicle; therefore, a 25% mode split reduction was applied to the peak hour vehicular trip generation to reflect the
non‐auto modes for the proposed residential development consistent with other projects in the area. A 25% mode spilt
reduction was also applied to the trip generation based on the City of Alexandria parking code allowing for 0.75 spaces per
unit for affordable housing units.
Table 5: Trip Generation
Table 5 shows that the proposed development is projected to generate 33 new trips in the weekday AM peak hour, 45 new
trips in the weekday PM peak hour, and 32 new trips in the Sunday peak hour.
Weekday
In Out Total In Out Total In Out Total Daily
Existing Buildings to Be Removed
Church ‐‐ ‐‐ Site Trips 7 3 10 3 10 13 7 26 33 130
Existing Site Trips 7 3 10 3 10 13 7 26 33 130
Proposed Development
Church ‐‐ ‐‐ Site Trips 7 3 10 3 10 13 7 26 33 130
Residential 220 Apartment 113 Affordable Units 12 47 59 52 28 80 29 29 58 808
25% (3) (12) (15) (13) (7) (20) (7) (8) (15) (202)
25% (2) (9) (11) (10) (5) (15) (6) (5) (11) (152)
Proposed Development Site Trips 14 29 43 32 26 58 23 42 65 584
Net New Site Trips (Proposed minus Existing) 7 26 33 29 16 45 16 16 32 454
* Alexandria Parking code allows for a 0.75 space/unit
** Residential mode split reduction applied to trip generation plus affordable housing reduction.
*** Existing Weekday Daily trips calculated using 10 times the value of the PM Peak Hour.
Sunday Peak Hour
Trip Generation, 9th Ed.
Affordable Housing Reduction*
Residential Mode Split**
PM Peak Hour
Existing Building / Proposed Use
ITE Land Use Code
Quantity
AM Peak Hour

Traffic Impact Study – Church of the Resurrection Gorove/Slade Associates
August 3, 2017 44
Figure 21: Future (2021) Lanes and Traffic Control Devices

Traffic Impact Study – Church of the Resurrection Gorove/Slade Associates
August 3, 2017 45
Site Trip Distribution
The distribution of site trips was based primarily on existing volumes, anticipated traffic patterns, and other recent studies
conducted in the area. The peak hour trips were calculated and assigned to the roadway network based on the traffic
distribution shown on Figure 22. The trips generated by the site are shown on Figure 23.
Future (2021) with Development Traffic Volumes
In order to determine the traffic volumes on the roadways in the study area under the 2021 build out condition, the site
generated traffic volumes were added to the Future (2021) without Development traffic volumes. The traffic volumes for the
Future (2021) with Development scenario are shown on Figure 24. Church traffic utilizing the existing surface lot (at
Intersection 8) will instead be rerouted to enter the site driveway (at Intersection 6) as access from the private drive to the
surface lot will be closed.
Figure 22: Direction of Approach

Traffic Impact Study – Church of the Resurrection Gorove/Slade Associates
August 3, 2017 46
Figure 23: Site Generated Traffic Volumes

Traffic Impact Study – Church of the Resurrection Gorove/Slade Associates
August 3, 2017 47
Figure 24: Future (2021) with Development Traffic Volumes

Traffic Impact Study – Church of the Resurrection Gorove/Slade Associates
August 3, 2017 48
Future (2021) with Development Capacity Analysis
Capacity analyses were performed at the intersections contained within the study area during the weekday morning, weekday
afternoon, and Sunday peak hours, under the future with development conditions. Synchro, Version 9.1 was used to analyze
the study intersections based on the Highway Capacity Manual (HCM) methodology and include level of service, delay, and
queue length comparisons for the turning movements analyzed. Signalized intersections were analyzed using HCM 2000
methodology with unsignalized intersections using HCM 2010 methodology. Reporting methodology for this scenario is
consistent with the existing and future background conditions analysis.
Peak hour factors were applied in accordance with Transportation Planning Administrative Guidelines prepared by the City
of Alexandria dated March 25, 2013. The guidelines state that “future PHFs should be 15 percent greater than the existing
for the future horizon analysis, not to exceed 0.95.” As such, a PHF of 0.95 was used for all approaches at each study
intersection, as the minimum existing PHF factor used was 0.85.
The results of the intersection capacity analyses are presented in Table 6 and are expressed in level of service (LOS) and delay
(seconds per vehicle) per lane group. The 95% and 50% queue results for each intersection are also presented in Table 6.
The results of the intersection capacity analyses are shown on Figure 25, and the detailed analysis worksheets are contained
in the Technical Appendix.
All movements at the study intersections continue to operate at levels of service consistent or better with those in the Future
(2021) without Development scenario. For the purpose of this analysis, it is desirable to achieve a level of service (LOS) of
“D” or better for each lane group to an intersection. The following movements did not achieve an LOS of “D” or better:
Intersection 1: N Beauregard Street and Seminary Road
Eastbound Left, AM and PM Peak Hour
Eastbound Right, PM Peak Hour
Westbound Left, AM and PM Peak Hour
Northbound Left, PM Peak Hour
Southbound Left, AM Peak Hour
Intersection 2: N Beauregard Street and Fillmore Avenue
Eastbound Left, AM and Sunday Peak Hour
Westbound Left, AM and PM Peak Hour
Southbound Left/Thru, AM and PM Peak Hour
Southbound Right, PM Peak Hour
Intersection 3: N Beauregard Street and Braddock Road
Eastbound Left, AM, PM, and Sunday Peak Hour
Westbound Left, AM Peak Hour
Northbound Left, AM and PM Peak Hour
Northbound Left/Thru, AM and PM Peak Hour

Traffic Impact Study – Church of the Resurrection Gorove/Slade Associates
August 3, 2017 49
Northbound Right, AM and PM Peak Hour
Southbound Left, AM and PM Peak Hour
Southbound Thru/Right, AM and PM Peak Hour
Table 6: Future with Development (2021) Capacity Analysis Results
1 N Beauregard Street and Seminary Road
Overall Intersection (Signalized) D 44.2 D 45.5 C 27.2
Eastbound Left 650 E 59.0 230 294 E 65.1 216 #281 D 42.0 100 140
Eastbound Thru 650 D 48.9 273 330 D 45.8 181 237 D 39.0 66 95
Eastbound Right 550 D 48.0 58 197 E 78.0 336 #583 D 40.9 0 0
Westbound Left 150 F 99.0 151 #285 E 68.4 220 #362 D 48.0 67 127
Westbound Thru/Right 1200 D 52.3 134 183 D 46.3 264 320 D 43.4 75 70
Northbound Left 400 D 47.3 215 264 E 71.9 163 #227 D 42.3 50 76
Northbound Thru 600 C 26.5 385 485 D 37.9 539 633 B 17.4 177 268
Northbound Right 275 B 19.5 8 55 C 25.1 38 95 B 14.1 0 19
Southbound Left 100 E 60.8 51 98 D 54.4 75 m113 D 45.2 40 79
Southbound Thru 550 D 42.6 288 350 C 20.5 280 142 B 18.3 115 161
Southbound Right 250 D 39.6 0 71 C 30.4 324 218 C 20.1 0 53
2 N Beauregard Street and Fillmore Avenue
Overall Intersection (Signalized) B 18.2 C 22.1 B 13.5
Eastbound Left 160 E 59.6 47 m64 D 44.1 38 128 E 62.1 16 40
Eastbound Thru/Right 775 A 5.8 12 375 A 8.6 165 258 A 3.9 3 145
Westbound Left 80 E 57.5 10 30 E 75.6 39 79 D 49.4 11 34
Westbound Thru/Right 1050 A 8.6 75 98 A 8.3 94 111 A 1.9 5 42
Northbound Left/Thru 110 D 53.7 40 70 D 52.6 33 62 D 45.5 30 48
Northbound Right 50 D 51.7 0 0 D 50.8 0 7 D 43.8 0 0
Southbound Left/Thru 300 E 71.2 94 m135 E 72.8 116 m171 D 46.8 24 43
Southbound Right 50 D 51.8 0 m2 E 75.3 17 m69 D 43.8 0 m0
3 N Beauregard Street and Braddock Road
Overall Intersection (Signalized) D 35.8 C 34.2 C 26.6
Eastbound Left 75 E 68.7 168 270 E 76.3 59 112 E 75.3 15 43
Eastbound Thru 1100 B 13.6 158 #561 C 26.3 180 102 A 6.4 19 37
Eastbound Right 75 A 7.1 8 48 B 16.1 11 20 B 17.1 0 1
Westbound Left 90 E 55.2 138 214 C 34.3 371 #734 D 42.2 116 #268
Westbound Thru/Right 725 C 22.1 114 222 B 14.5 153 334 A 8.3 8 93
Northbound Left 200 E 60.4 101 152 E 62.2 95 143 D 45.0 30 54
Northbound Left/Thru 650 E 58.7 104 134 E 58.8 81 107 D 43.8 16 28
Northbound Right 50 E 59.3 38 167 E 56.8 0 81 D 44.3 0 62
Southbound Left 100 E 59.2 26 51 E 61.0 51 87 D 49.0 4 14
Southbound Thru/Right 250 E 60.5 44 74 E 60.6 50 76 D 48.7 2 10
4 Fillmore Avenue and Seminary Road
Overall Intersection (Unsignalized) A 1.9 A 4.0 A 0.9
Westbound Left/Right ‐‐ D 33.0 ‐ 28 C 17.4 ‐ 18 B 13.7 ‐ 8
Northbound Thru/Right 425 A 0.0 ‐ 0 A 0.0 ‐ 0 A 0.0 ‐ 0
Southbound Left/Thru 100 B 14.0 ‐ 13 B 14.0 ‐ 10 B 11.8 ‐ 5
Southbound Thru 100 A 2.3 ‐ 0 A 0.0 ‐ 0 A 0.9 ‐ 0
Queue
50th 95th 50th 95th 50th 95th
Intersection (Movement)Storage
Length
Future With Development (2021)
AM Peak PM Peak Sunday Peak
LOS DelayQueue
LOS DelayQueue
LOS Delay
Traffic Impact Study – Church of the Resurrection Gorove/Slade Associates
August 3, 2017 50
5 Fillmore Avenue and Newport Village
Overall Intersection (Unsignalized) A 2.6 A 2.2 A 2.1
Westbound Left/Right 250 A 8.9 ‐ 3 A 8.8 ‐ 3 A 9.1 ‐ 3
Northbound Thru/Right 75 A 0.0 ‐ 0 A 0.0 ‐ 0 A 0.0 ‐ 0
Southbound Left/Thru 125 A 7.4 ‐ 0 A 7.4 ‐ 3 A 7.4 ‐ 0
6 Fillmore Avenue/Private Drive and Site Driveway/Goodwin House
Overall Intersection (Unsignalized) A 2.6 A 2.1 A 3.1
Eastbound Left/Thru/Right 50 A 9.2 ‐ 3 A 9.3 ‐ 3 A 9.1 ‐ 5
Westbound Left/Thru/Right 50 A 0.0 ‐ 0 A 0.0 ‐ 0 A 0.0 ‐ 0
Northbound Left/Thru/Right 75 A 0.0 ‐ 0 A 0.0 ‐ 0 A 0.0 ‐ 0
Southbound Left/Thru/Right 75 A 7.8 ‐ 0 A 7.3 ‐ 0 A 7.3 ‐ 0
7 Private Drive and Goodwin House Center Dwy
Overall Intersection (Unsignalized) A 0.0 A 0.0 A 0.0
Westbound Left/Thru/Right 50 A 0.0 ‐ 0 A 0.0 ‐ 0 A 0.0 ‐ 0
Northbound Left/Thru/Right 215 A 0.0 ‐ 0 A 0.0 ‐ 0 A 0.0 ‐ 0
Southbound Left/Thru/Right 75 A 0.0 ‐ 0 A 0.0 ‐ 0 A 0.0 ‐ 0
8 Private Drive/Goodwin House Access/Garage
Overall Intersection (Unsignalized) A 7.2 A 6.9 A 7.0
Eastbound Left/Thru/Right 25 A 7.2 ‐ 0 A 7.1 ‐ 0 A 7.3 ‐ 0
Westbound Left/Thru/Right 175 A 7.0 ‐ 3 A 6.5 ‐ 0 A 6.6 ‐ 0
Northbound Left/Thru/Right ‐‐ A 7.0 ‐ 0 A 7.0 ‐ 3 A 6.9 ‐ 0
Southbound Left/Thru/Right 215 A 7.3 ‐ 3 A 7.1 ‐ 3 A 7.1 ‐ 5
m ‐ Volume for 95th percentile queue is metered by upstream signal
# ‐ 95th percentile volume exceeds capacity, queue may be longer
~ ‐ Volume exceeds capacity, queue is theoretically infinite
Intersection (Movement)Storage
Length
Future With Development (2021)
AM Peak PM Peak Sunday Peak
LOS DelayQueue
LOS DelayQueue
LOS DelayQueue
50th 95th 50th 95th 50th 95th

Traffic Impact Study – Church of the Resurrection Gorove/Slade Associates
August 3, 2017 51
Figure 25: Future (2021) with Development Capacity Analysis Results

Traffic Impact Study – Church of the Resurrection Gorove/Slade Associates
August 3, 2017 52
TRANSPORTATION MANAGEMENT PLAN FRAMEWORK
When determining the type of Transportation Management Plan (TMP) that will be required by the City of Alexandria, the
Zoning Ordinance states that for “a development or building that includes more than one use, each use shall be separately
assessed and the highest applicable tier shall apply to the whole development.” The proposed development triggers the
need for a Tier 2 Transportation Management Plan for uses include residential development of 100‐349 residential dwelling
units.
According to the City’s Zoning Ordinance, a Tier 2 TMP requires that the developer
“shall have the option, with the consent of the Director of Transportation and Environmental Services and approval
of this Special Use Permit, of participating in the Citywide TMP program or operating its own stand‐alone TMP and
may be encouraged to partner with a neighboring use.”
A Transportation Management Plan (TMP) has many components that are tailored to accommodate a given facility with the
goal being the reduction of automobile trips by encouraging alternative forms of transportation. A few of the typical TMP
components include the establishment of a TMP coordinator, distribution of transit literature, and designation of carpool
and/or vanpool spaces. Management measures taken by this project can be monitored and adjusted as needed to continually
create opportunities to reduce the amount of traffic generated by the site. A TMP for this project might include, but not be
limited to, the following items:
General
Designate a TMP coordinator for the site
Provide a contribution for transit improvements:
Bus stop bench(es)
Bus stop shelter(s)
Bus stop ADA‐compliance
Contribute to the TMP fund based on a percentage of residents/employees non‐SOV
Conduct an annual survey with minimum response rate of 50% to be submitted to Transportation Planning Division
Provide an annual report to Director of T&ES with occupied space, results of the annual survey and a review of the
TMP program
Create a TMP fund to achieve the TMP goals
Transit Infrastructure and Subsidies
Install and maintain transit information display screens in building lobbies
Construct and maintain a bus shelter on site to enhance transit usage
Provide discounted transit fare media to residents and employees
Bicycle Infrastructure
Install bicycle parking for residents with secure storage areas, covered parking, and accessible and visible visitor
racks

Traffic Impact Study – Church of the Resurrection Gorove/Slade Associates
August 3, 2017 53
Carpool, vanpool and shuttle subsidies
Provide shuttle service from the site to a Metrorail station or bus transit center
Implement a parking pricing strategy that encourages non‐SOV travel
Monitor and enforce the use of reserved parking spaces for carpools and vanpools
Create and administer a ridesharing program that includes participation in the regional Commuter Connections
Program and site‐specific matching efforts
Subsidize carshare vehicles for residents or employees who use alternative modes to work
Marketing and Promotions
Promote the regional Guaranteed Ride Home Program as part of the ridesharing and transit marketing efforts
Provide and promote on‐site business center as a telework options for residents
Distribute and display current marketing for transit schedules, rideshare applications and information, incentive
information, etc.
Promote use of transit, carpooling/vanpooling and participation in the staggered work hour program and other
components of the TMP with prospective tenants during marketing/leasing/sales activities and with both
prospective and existing tenants and employees of the project
Participate in Ozone Action Days and other regionally sponsored clean air, transit, and traffic mitigation promotions
by advertising such promotions in a manner and at such locations within the building acceptable to the condominium
association
Host events or participate in Bike to Work Day, Try Transit Week, Car Free Day, Earth Day or other events with Local
Motion
Any other TMP activities as may be proposed by the TMP Association and approved by the Director of T&ES as
meeting goals similar to those targeted by the required TMP measures
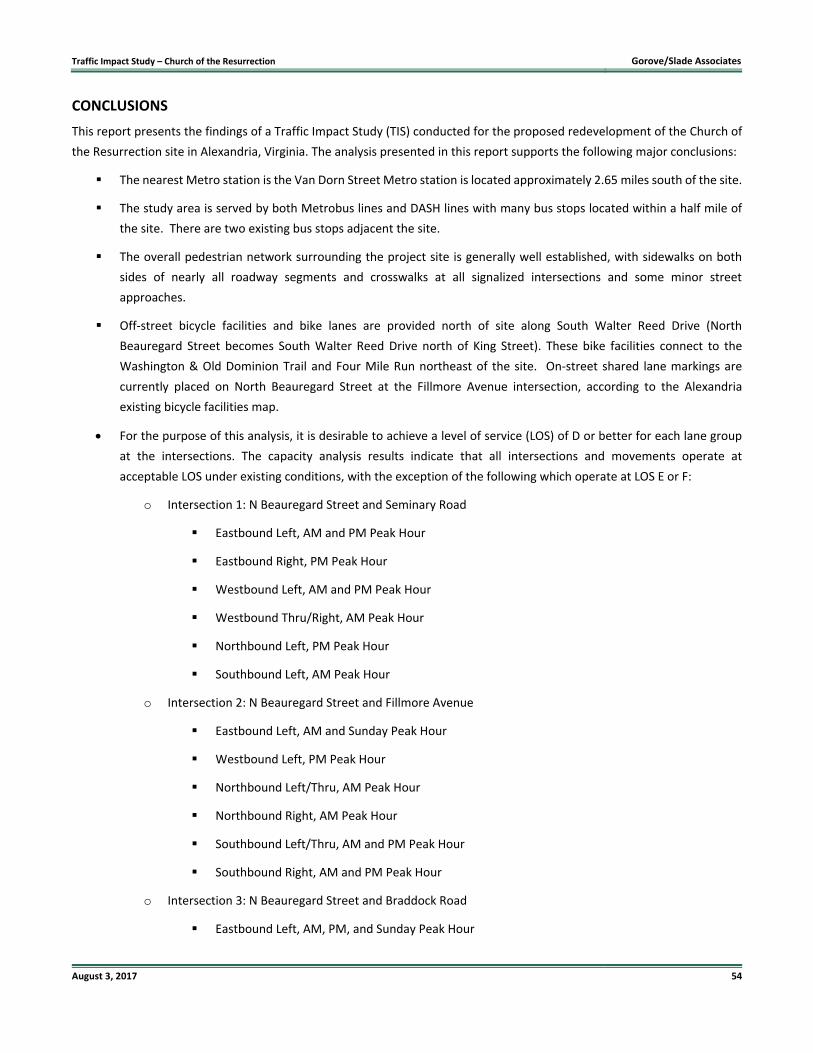
Traffic Impact Study – Church of the Resurrection Gorove/Slade Associates
August 3, 2017 54
CONCLUSIONS
This report presents the findings of a Traffic Impact Study (TIS) conducted for the proposed redevelopment of the Church of
the Resurrection site in Alexandria, Virginia. The analysis presented in this report supports the following major conclusions:
The nearest Metro station is the Van Dorn Street Metro station is located approximately 2.65 miles south of the site.
The study area is served by both Metrobus lines and DASH lines with many bus stops located within a half mile of
the site. There are two existing bus stops adjacent the site.
The overall pedestrian network surrounding the project site is generally well established, with sidewalks on both
sides of nearly all roadway segments and crosswalks at all signalized intersections and some minor street
approaches.
Off‐street bicycle facilities and bike lanes are provided north of site along South Walter Reed Drive (North
Beauregard Street becomes South Walter Reed Drive north of King Street). These bike facilities connect to the
Washington & Old Dominion Trail and Four Mile Run northeast of the site. On‐street shared lane markings are
currently placed on North Beauregard Street at the Fillmore Avenue intersection, according to the Alexandria
existing bicycle facilities map.
For the purpose of this analysis, it is desirable to achieve a level of service (LOS) of D or better for each lane group
at the intersections. The capacity analysis results indicate that all intersections and movements operate at
acceptable LOS under existing conditions, with the exception of the following which operate at LOS E or F:
o Intersection 1: N Beauregard Street and Seminary Road
Eastbound Left, AM and PM Peak Hour
Eastbound Right, PM Peak Hour
Westbound Left, AM and PM Peak Hour
Westbound Thru/Right, AM Peak Hour
Northbound Left, PM Peak Hour
Southbound Left, AM Peak Hour
o Intersection 2: N Beauregard Street and Fillmore Avenue
Eastbound Left, AM and Sunday Peak Hour
Westbound Left, PM Peak Hour
Northbound Left/Thru, AM Peak Hour
Northbound Right, AM Peak Hour
Southbound Left/Thru, AM and PM Peak Hour
Southbound Right, AM and PM Peak Hour
o Intersection 3: N Beauregard Street and Braddock Road
Eastbound Left, AM, PM, and Sunday Peak Hour

Traffic Impact Study – Church of the Resurrection Gorove/Slade Associates
August 3, 2017 55
Westbound Left, AM Peak Hour
Northbound Left, AM and PM Peak Hour
Northbound Left/Thru, AM and PM Peak Hour
Northbound Right, AM and PM Peak Hour
Southbound Left, AM and PM Peak Hour
Southbound Thru/Right, AM and PM Peak Hour
The proposed development of the Church of the Resurrection site is anticipated to be completed in 2021. The future
without development traffic volumes were projected by increasing the existing traffic volumes to the build‐out year
using an inherent growth rate of 0.5 percent per year and by adding forecasted traffic volumes for three pipeline
developments in the vicinity of the site.
Under future (2021) conditions without development, the capacity analysis results indicate that all intersections and
movements operate at acceptable LOS, with the exception of the following
o Intersection 1: N Beauregard Street and Seminary Road
Eastbound Left, AM and PM Peak Hour
Eastbound Right, PM Peak Hour
Westbound Left, AM and PM Peak Hour
Northbound Left, PM Peak Hour
Southbound Left, AM Peak Hour
o Intersection 2: N Beauregard Street and Fillmore Avenue
Eastbound Left, AM and Sunday Peak Hour
Westbound Left, AM and PM Peak Hour
Southbound Left/Thru, AM and PM Peak Hour
Southbound Right, PM Peak Hour
o Intersection 3: N Beauregard Street and Braddock Road
Eastbound Left, AM, PM, and Sunday Peak Hour
Westbound Left, AM Peak Hour
Northbound Left, AM and PM Peak Hour
Northbound Left/Thru, AM and PM Peak Hour
Northbound Right, AM and PM Peak Hour
Southbound Left, AM and PM Peak Hour
Southbound Thru/Right, AM and PM Peak Hour

Traffic Impact Study – Church of the Resurrection Gorove/Slade Associates
August 3, 2017 56
In order to determine future (2021) traffic volumes on the roadways in the vicinity of the site under the 2021 build
out condition, the site‐generated traffic volumes were added to the 2021 future background traffic volumes. The
proposed development will generate a total of 33 new trips in the weekday morning peak hour, 45 new trips in the
weekday afternoon peak hour, and 32 new trips in the Sunday peak hour.
With the addition of site traffic to the road network, all movements at the study intersections continue to operate
at levels of service consistent with those in the Future (2021) With Development scenario.
Access to the Church of the Resurrection site is provided via a separate driveway parallel to the Private Drive serving
the Goodwin House. The existing access to the church parking lot from the Private Drive serving the Goodwin House
will be restricted to emergency vehicle access only, and future access to the church parking lot will be provided via
the new site driveway. Therefore, no new site trips have been added to the Private Drive serving the Goodwin
House, and there are no new impacts to queuing or delay along the Private Drive.
A TMP will be required for this site and a TMP Framework has been included in the report.
The study results indicate that the additional trips generated by the new apartment building and church will have a
negligible impact on the operations of the study intersections. The analysis results presented in the Future (2021)
With Development scenario are consistent with the results for the Future (2021) Without Development scenario,
which shows conditions in 2021 without trips generated by this project.