chuck hughes’ options blueprint · blueprint. 2 nearly 35 years ago, when i had just $4,600 in my...
TRANSCRIPT

Chuck Hughes’ Options Blueprint

2
Nearly 35 years ago, when I had just $4,600 in my brokerage account, my whole life changed forever.
You see, I was an Air Force veteran and a trained commercial airline pilot at the time. I had spent most of my life flying fighter jets, minimizing risks, and keeping my crew and passengers safe.
In fact, even joining the Air Force was an exercise in risk management — the Air Force told me I’d have a 100% chance of flying fighter jets. The Navy? 33%. Who likes those odds?
Anyway, back then, I had a wife, a young daughter, a son on the way, and a huge mortgage to afford.
I knew I had to do something.
Now, I was always interested in the markets… in finance… in making a fortune by trading…
I happened to be staying at the Flamingo Hotel during a layover in Las Vegas. I remember picking up the phone in the lobby and calling my broker (back when you had to call a broker instead of logging on to your account.)
And placing just one trade.
That single trade made me who I am today — among other things, a 10-time Trading Championship winner, a published author, a trader with a 91.2% success rate — not to mention a husband and father (to six kids) with two beautiful homes my family can live in.
And it was a good thing, too, since 15 years later, I was diagnosed with Meniere’s disease (which leads to vertigo,) and grounded from flying.
Chuck Hughes’ Options Blueprint
3
C H U C K H U G H E S’ P O W E RT R E N D O P T I O N S
Since then, I’ve made gains of more than $197,000… $192,000… and $104,000 on single trades — leveraging companies like the Nasdaq, Amazon, Apple, GoPro, Netflix, and more — and totalling over $3.5 million in the last five years, using just this one options strategy.
Not just once or twice…
I’m talking about 187 wins with just 18 losses. All using what I call the PowerTrend Options strategy.
And the best part is…
Finding winning trades doesn’t take a crazy amount of time or energy.
All I have to do is look at the stock itself to know what will happen next.
How?
That’s what I’m going to teach you in this primer. We’re going to go over:
• The principles and guidelines I use to trade simple options. The methods I use are so safe and so consistent, everyone should have access to it.
• How to download the same exact tools that I use so that you can place your own trades, if you’d like.
• Most importantly, the step-by-step process I use to determine which options trades to place, so that you’ll understand why you’re doing what you’re doing.
As you’ll see, it’s very simple and straightforward.
I’m not asking you to trust some strange algorithm, an insider I know, or what my team comes up with behind the curtains.
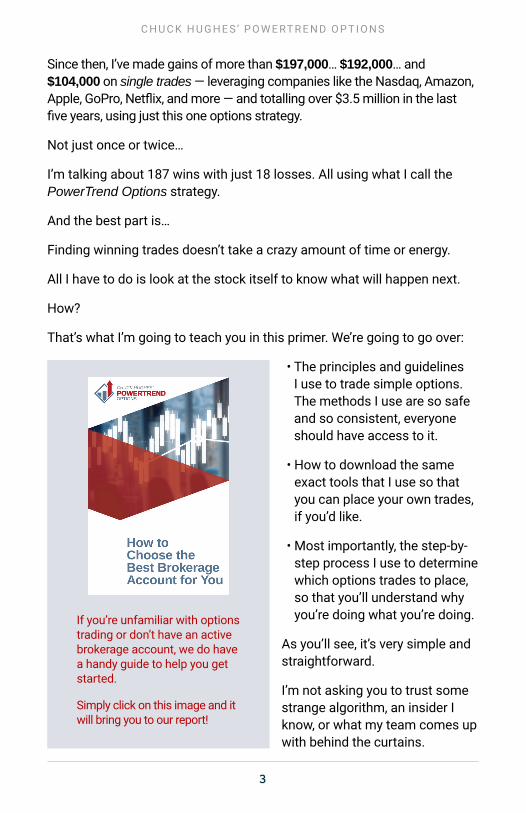
If you’re unfamiliar with options trading or don’t have an active brokerage account, we do have a handy guide to help you get started.
Simply click on this image and it will bring you to our report!

4
C H U C K H U G H E S’ P O W E RT R E N D O P T I O N S
The proof will be right in front of you. You won’t look at another stock chart the same way again. It will almost be like looking through the stock at the true movement beneath.
It’s one reason I call my strategy the “X-ray” system.
But before I explain that strategy, let’s talk about the most important principle in investing…
The Most Important Investing Principle is Not What You ThinkI’ve presented my trading strategies at live seminars around the country for many years. I always like to ask this question: “What is the most im-portant investing principle?”
Normally, I get answers like these:
• Buying stocks that are undervalued
• Using fundamental analysis to select stocks
• Using technical analysis to select stocks
• Investing in blue chip dividend paying stocks
• Buying stocks in companies with popular products or services
• Getting stock picks on TV
But none of those are right.
The answer?
Risk management is the most important factor in investing success. Put another way — investing without ego.
Now, this defies human nature. In my experience, most investors want to take a quick 10% or 15% profit as soon as possible. Most traders tend to trade with limited upside and unlimited downside. They’ll sell a stock when they have a small profit, but continue to hold losing stocks… eventu-ally winding up with a portfolio full of losers.

5
C H U C K H U G H E S’ P O W E RT R E N D O P T I O N S
But if you take emotion out of trading and follow this doctrine very strictly, I can guarantee you’ll be much more likely to win bigger and more fre-quently, cutting your losses down to nothing.
(Note: You want to maintain a 3 to 1 profit-loss ratio. This means that your expected losses are never more than a third of your expected profits in your whole portfolio.)
So whenever possible, make sure that you:
• Limit the size of your trading positions
• Close out your losing trades before they develop into large losses
• Don’t limit your profits by selling winning trades with a small profit
• Invest using several different types of strategies for diversification.
I follow this rule with my subscribers of PowerTrend Options.
I aim to only trade safely, and never with my ego.
This risk management works with stocks, bonds, options — anything. It’s this exact formula that’s allowed me to use my three-tiered options trading system at a 91.2% success rate.
Now, let’s dive into the PowerTrend Options “X-ray” System to understand how it functions differently from higher-risk, lower-yield options strategies.
The Proof Is in the Stock PriceFrom that one trade in Vegas I made years ago, I was able to build, perfect, and eventually program a robust and reliable trading system.
The “X-ray” system is simple, consistent, and didn’t require enormous start-up capital or crazy clearance to use. After all, I started with just $4,600 in my trading account in 1984.
And in two years, I had $460,164 in profit.
Now, I have one confession to make before we move on…

6
C H U C K H U G H E S’ P O W E RT R E N D O P T I O N S
The same strategy I’m going to teach you in this report has gotten me banned from trading in certain competitions.
Let me assure you… There’s nothing shady happening with this strategy — it’s 100% legal.
But if I could guess, I was just winning too much. I’d imagine the trading contests were having trouble getting new people to enter.
That’s because this strategy has the power to succeed during all kinds of market conditions and with all kinds of assets.
How?
By following trends instead of trying to predict them.
You see, so much of mainstream media, financial news, and Wall Street “wisdom” try to explain stock fluctuations with statistics about the com-pany or current events.
When really, none of that matters.
Everything you need to know about a company’s present and its future is right in the stock price and its movements.
With the “X-ray” system, you can look beneath the surface of the stock.
Something else to keep in mind as you’re reading this report…
You don’t have to understand how options trading works to use this sys-tem. You don’t even need to understand how the system works to use it.
That’s because my trade recommendations tell you exactly what to enter into your brokerage account to take action.
But if you’re like me, and you want to know how successful systems work, I’ve created this report for you.
We’re going to take a detailed look at each step that makes up the X-Ray System, and how they all come together to make the PowerTrend Options Alert a reliable and almost uncanny cash machine.
Let’s zoom out and make sure we understand what the three points of my system are.

7
C H U C K H U G H E S’ P O W E RT R E N D O P T I O N S
Tracking a PowerTrend in 3 PointsThe “X-ray” system is based on three critical points of analysis in a tiered system. I break each step down in detail in this report, but here’s a quick rundown:
1. Finding the trend by tracking any stock’s price move-ment. We do this by charting the 1-month short-term mov-ing average and the 10-month long-term moving average to find where they cross. This will show which stock to trade.
2. Using Keltner Channels to determine if a stock is over-bought or oversold. Hint: we want to focus on stocks that are overbought, but on a pullback and temporarily over-sold. Keltner Channels help us to determine when to enter a trade.
3. Choosing the right option trade after selecting the stock and the timing. We do this my isolating trades where the time value is only 1% or less of the strike price for the trade. Put simply, you want the underlying price of the stock to only need to in-crease by 1% for you to break even on the trade. Anything more than 1% is then profit! The 1% rule tells us what option to select by essentially eliminating risk.
Now, I understand that some of those terms might be very new for some people. Or maybe you understand them and you don’t understand how they connect to each other.
But it’s simple, it’s proven, and you can see it for yourself.
Let’s examine each step and break them down to their atoms...
Step One: Finding the TrendTake a look at this chart representing the price trend for Barrick Gold Corp (NYSE: GOLD):

8
C H U C K H U G H E S’ P O W E RT R E N D O P T I O N S
(Please note: this is not an official recommendation. It is simply an ex-ample to illustrate the 1-month and 10-month moving averages.)
We can break this down very simply.
Let’s take a look at the red line. That line represents the stock’s price move-ment, using its daily closing price.
Take a look at the solid gray line. It represents the 10-month SMA (simple moving average).
Finally look at the blue line. It represents the 1-month moving average.
Now let’s look at where the 1-month moving average crosses the 10-month SMA and starts to climb…
Right around June 14th, right?
Here is the stock chart after June 14th.
The Logic Behind the PowerTrend SystemHere’s the basic idea:
You want to identify with some level of certainty which direction a stock is moving.
Without knowing which direction the stock is moving, you could be right about every other point and still have a losing trade.
Then, you want to determine when it enters the PowerTrend ‘buy zone.’ This is the moment of change, the tur-bo-charge in a trend that makes some people millionaires and bankrupts others. Buying at the wrong moment? Also a recipe for a losing trade.
Finally, you want to choose the correct option in the options chain. Choosing a less-expensive option with more risk is an extremely common way for a trader to have all the right informa-tion except this piece, and still lose.
Feb
1-month moving average crosses above 10-month in GOLD stock.Barrick Gold Corp: NYSE
Mar Apr May Jun

9
C H U C K H U G H E S’ P O W E RT R E N D O P T I O N S
The stock soared!
Now, this system works fine for just picking stocks, as we can see from this and many other examples.
But in PowerTrend Options Alert, I’m going to be recommending options trades to maximize our profit potential.
(Note: If you’d feel more comfortable trading stocks rather than options, that’s perfectly fine. Simply buy the underlying stock when I recommend a call option. Options serve to amplify profits during a shorter period of time, so if you choose to buy the stock instead, your gains won’t be the same as someone who bought the option.)
So we’ve seen that the first step is to identify the crossover point between the 1-month and 10-month moving averages.
Let’s break down step two…
Step 2: Using Keltner ChannelsIf you’re unfamiliar with Keltner Channels, don’t worry. Most regular traders are. Here’s all you need to know: They are essentially an indicator of when a stock is either overbought or oversold.
Feb
The ‘buy’ signal proved correct after the moving average crossing. Barrick Gold Corp: NYSE
Mar Apr May Jun
16.5
15.5
14.5
14.0
13.0
12.5
10
C H U C K H U G H E S’ P O W E RT R E N D O P T I O N S
Overbought: overvalued owing to excessive buying at unjustifiably high prices.
Oversold: undervalued and being sold below its true value.
There’s a Top, Middle, and Bottom line, and the channels contain the movement of the stock price, for the most part.
Here’s how you use it: If the stock price is trading near or above the top Keltner line, it’s overbought.
If the stock price is trading below the middle Keltner line, and closer to the bottom one, it’s oversold.
There are many ways to use Keltner Channels, but for our purposes here…
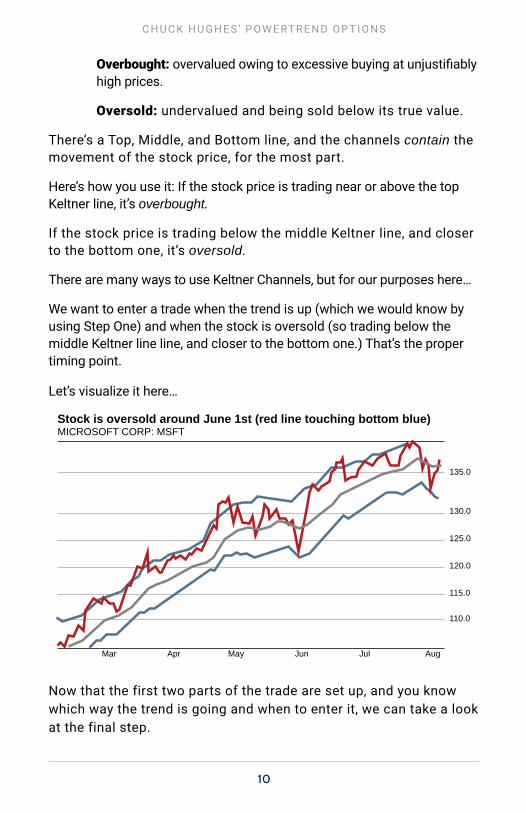
We want to enter a trade when the trend is up (which we would know by using Step One) and when the stock is oversold (so trading below the middle Keltner line line, and closer to the bottom one.) That’s the proper timing point.
Let’s visualize it here…
Now that the first two parts of the trade are set up, and you know which way the trend is going and when to enter it, we can take a look at the final step.
Stock is oversold around June 1st (red line touching bottom blue) MICROSOFT CORP: MSFT
Mar Apr May Jun Jul Aug
135.0
130.0
125.0
120.0
115.0
110.0

11
C H U C K H U G H E S’ P O W E RT R E N D O P T I O N S
Step 3: Choosing the Right Option TradeWhen you look at an option chain, you can see there are many choices. Just look at these option quotes for Apple…
And that’s just one page of a partial list of one week’s worth of options that are available to buy.
This can be so overwhelming that it stacks the odds against most traders. That’s why we use the 1% rule.
Here’s what we do…
We look for an option with a strike price that limits the time value portion of an option premium to less than 1% of the stock price.
In other words, the stock should only have to move 1% in order for you to make a profit.

12
C H U C K H U G H E S’ P O W E RT R E N D O P T I O N S
There are a lot of calculations that go into that, but I built an options calculator that easily breaks it down.
Here is an example from GLD.
After plugging in the current stock price, option strike price and option premium, you can see that just a 1% change in the underlying value of the stock produced a gain.
Again, we don’t really need to understand how it’s calculated. So we won’t get into the weeds on that.
But the general rule of thumb is that we are looking for strike prices that are 8% - 10% lower than the current price of the stock — meaning they are in-the-money options.

13
C H U C K H U G H E S’ P O W E RT R E N D O P T I O N S
By requiring a stock to move more than 1% to profit, the risk becomes much greater.
Cheaper call options (at-the-money or out-of-the-money) are required to move much higher in order to realize a gain.
When you use the 1% rule and select in-the-money options, you’ve mitigat-ed almost all of the risk out of this options trade!
So let’s review…
Putting It All TogetherHere are the three steps that determine how I tell you which option trades to place every week.
1. Finding the trend by tracking any stock’s price movement. We do this by setting the 1-month short term moving average and the 10-month long term moving average against each other to find where they cross. This will show which stock to trade.
2. Using Keltner Channels to determine if a stock is overbought or oversold. Hint: we want to focus on stocks that are over-bought, but on a pullback and temporarily oversold. Keltner Channels help us to determine when to enter a trade.
3. Choosing the right option trade (after selecting the stock and the timing) where the time value is only 1% or less of the strike price for the trade. Put simply, you want the underlying price of the stock to only need to increase by 1% for you to break even on the trade. Anything more than 1% is then profit! The 1% rule tells us what option to select by essentially eliminating risk.
Now, once again, you do not need to understand this system.
Once or twice every single week, I’m going to send you the options trades that have already passed through the ”X-ray” system.
And I’ll provide step-by-step instructions on how to place the trade.
With that in mind, I’d like to walk you through what your trades will look like.

14
C H U C K H U G H E S’ P O W E RT R E N D O P T I O N S
How to Enter an Options TradeOk, now let’s go over how to enter an options trade in your brokerage account, using the same example above. Here’s what you’d do, step-by-step…
[Please note: This is not an active recommendation and pricing has likely changed. This is only being used for educational purposes.]
DAL191122C00055000 Buy to open Delta Air Lines (DAL) Nov. 22, 2019, $55 call options for $1.15
Step 1: Search for options under stock ticker. In this case, it’s DAL.
Step 2: Make sure you choose the right month and date of expira-tion. In this case, it’s November 22, 2019.
Step 3: Choose the strike price. In this case, it’s $55.
Step 4: Select the option type. In this example, it’s a “call” option.
Step 5: Select how many contracts to buy. This is up to you. Remem-ber that each contract represents 100 shares of stock.
Step 6: Once you have the correct contract, select the action. In this example, it’s “Buy to open”
Step 7: Choose “Limit order” and set the price for the trade.
Step 8: Under timing, choose “Day.” This simply means the order will be good for the day only. If you don’t get filled at the correct price, the trade won’t reappear the following day.
Step 9: Click “Buy” to transmit the order.
And you’re all set! Of course, you could always call your broker and simply say, “I want to buy DAL November 22, 2019, $55.00 calls with a $1.15 limit, day order only.”
One other thing about limit orders — if you have trouble buying at our official price of $1.15, you could choose to raise your limit gradually. But that would be your choice.
For readers who would rather not execute options, you’re more than wel-come to simply purchase the stock (when we buy a call option.)
15
C H U C K H U G H E S’ P O W E RT R E N D O P T I O N S
On average, we hold these options for 2-3 months. If the stock remains on a ‘buy’ signal, we will typically roll the option over and purchase another call before the expiration date.
And that’s the whole thing!
So on your end, all you’ll be doing is safely and consistently generating profits week after week. I’ll send my one to two recommendations every week to guide you through.
If you ever have any comments, feedback, or questions, please don’t hesitate to email my team at [email protected]. You can also reach our customer service team at 877-453-1177. They’re available Monday-Friday, 9–8 p.m. EST.
Downloading The Tools Yourself
If you’re interested in learning how to download these tools yourself, so you can place your own trades or simply learn this strategy hands-on, I’ve included in this section a set of directions.
Let’s start with downloading moving averages (which is step one in our three-tiered “X-ray” system.)
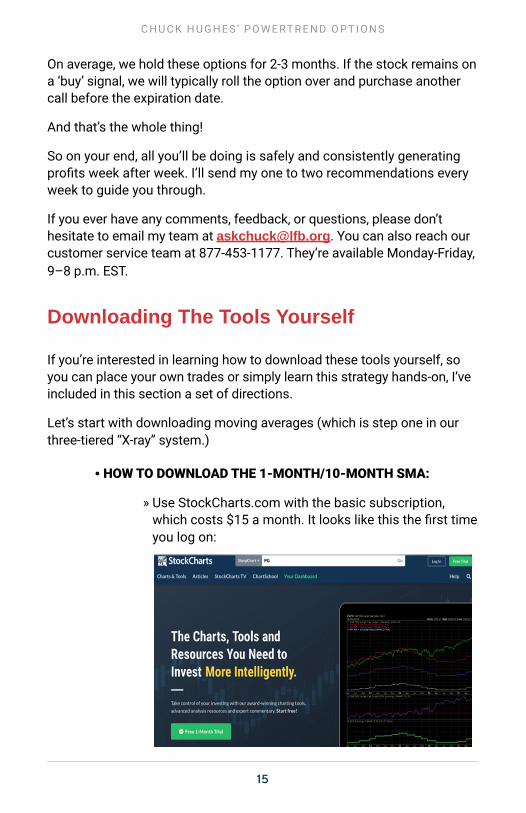
• HOW TO DOWNLOAD THE 1-MONTH/10-MONTH SMA:
» Use StockCharts.com with the basic subscription, which costs $15 a month. It looks like this the first time you log on:
16
C H U C K H U G H E S’ P O W E RT R E N D O P T I O N S
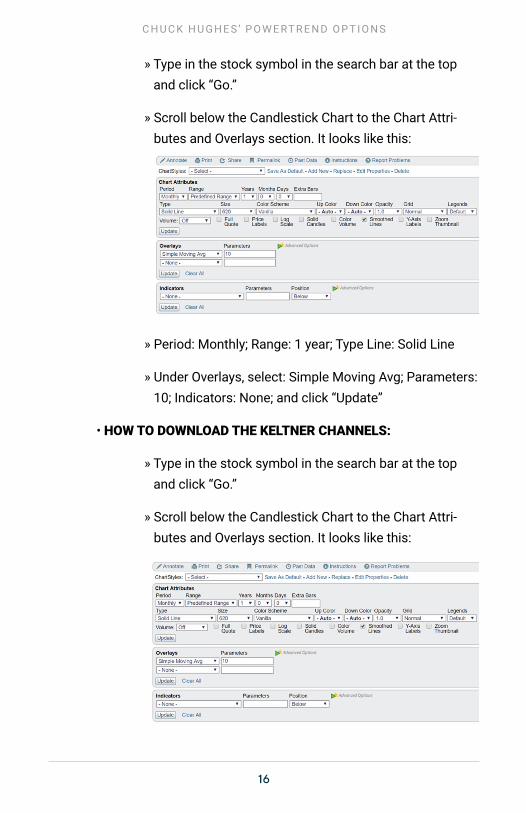
» Type in the stock symbol in the search bar at the top and click “Go.”
» Scroll below the Candlestick Chart to the Chart Attri-butes and Overlays section. It looks like this:
» Period: Monthly; Range: 1 year; Type Line: Solid Line
» Under Overlays, select: Simple Moving Avg; Parameters: 10; Indicators: None; and click “Update”
• HOW TO DOWNLOAD THE KELTNER CHANNELS:
» Type in the stock symbol in the search bar at the top and click “Go.”
» Scroll below the Candlestick Chart to the Chart Attri-butes and Overlays section. It looks like this:

T H U N D E R B I R D O P T I O N S C O U R S E
» Period: Daily; Range: 1 year; Type: OHLC Bars
» Under Overlays, select: Keltner Channels; Parameters: Default (20,2.0,10); Indicators: None; Click Update.
Easy!
For the final step, our 1% rule, there are no charts to download.
So that’s the extent of your chart usage!
Once again, to be successful using this service, you do not have to use this feature. I only include the steps for those who want to, or those who want full transparency.
I can’t wait to get started trading together so that you can experience what just one trade done the right way can do to change your life.

18
C H U C K H U G H E S’ P O W E RT R E N D O P T I O N S
Notes

19
C H U C K H U G H E S’ P O W E RT R E N D O P T I O N S
Notes

Please note: We sent this e-mail to you because you are subscribed to this service. To cancel or for any other subscription issues, please call 1-844-449-6520 or write us at: Customer Service | 808 St Paul St | Baltimore, MD 21202 USA. Nothing in this e-mail should be consid-ered personalized financial advice. Although our employees may answer your general customer service questions, they are not licensed under securities laws to address your particular investment situation. No communication by our employees to you should be deemed as personalized financial advice. We expressly forbid our writers from having a financial interest in any security recommended to our read-ers. All of our employees and agents must wait 24 hours after on-line publication or 72 hours after the mailing of printed-only publication prior to following an initial recommendation. Any investments recommended in this letter should be made only after consulting with your investment advisor and only after reviewing the prospectus or financial statements of the company. © 2019 Laissez Faire Books, LLC. All Rights Reserved. Protected by copyright laws of the United States and international treaties. This Newsletter may only be used pursuant to the subscription agreement and any reproduction, copying, or redistribution (electronic or otherwise, including on the world wide web), in whole or in part, is strictly prohibited without the express written permission of Laissez Faire Books, LLC.