chs/urc quality improvement collaborative project change … · 2019-02-19 · studenic and neeraj...
TRANSCRIPT

Center for Human Services
CHS/URC Quality Improvement Collaborative Project
Change Package
February 2019
Quality Improvement
Collaborative to Improve Access
to and Use of Quality Assured
Viral Load Test Results at
District and Site Level
Throughout Malawi

2
Acknowledgements This project was supported by The Bill & Melinda Gates Foundation (BMGF) Investment ID
OPP1158420. The Change Package was prepared by Dyson Mwandama, Chikondi Mendulo, Amy
Studenic and Neeraj Kak.
Malawi Ministry of Health, Department of HIV/AIDS
We acknowledge the Malawi Department of HIV/AIDS for their enormous contributions and support for
the entirety of this process. We would also like to thank the District Health Management Teams in the
participating districts for their willingness and efforts to participate in the implementation in the quality
improvement initiatives and approaches.
CHS-URC Headquarters
We would like to thank the CHS-URC headquarters team led by Neeraj Kak. Thanks to the technical team
including Amy Studenic and for their tireless support and guidance.
Quality Improvement Teams
We sincerely thank all the quality improvement team members and team leaders who successfully
engaged in the quality improvement work.
DISCLAIMER
The contents of this report are the sole responsibility of Center for Human Services (CHS)/University
Research Co., LLC (URC) and do not necessarily reflect the views of the Bill & Melinda Gates
Foundation.

3
Table of Contents Acronyms ..................................................................................................................................................... 4
Project Background .................................................................................................................................... 5
Document Overview .................................................................................................................................... 5
CHS-URC Continuous Quality Improvement Approach ....................................................................... 5
Key Indicators Targeted for Improvement .............................................................................................. 6
Proportion of clients eligible for VL testing with sample collected ......................................................... 7
Proportion of VL results returned to facility within one month of collection. .......................................... 7
Proportion of clients with unsuppressed VL completing IAC .................................................................. 8
Summary of Successful Change Ideas ....................................................................................................... 9
Health promotion engagement with ART clients ...................................................................................... 9
Viral load and EID test results management and data quality and documentation ................................... 9
Work/client flow mapping modification ................................................................................................... 9
Facility staff modification ....................................................................................................................... 10
Health worker capacity building ............................................................................................................. 10
Enhanced coordination with molecular laboratories ............................................................................... 10
Enhanced coordination with sample/result transportation provider on sample transport ....................... 10
Enhanced district partner’s engagement ................................................................................................. 10
Detailed Change Package ......................................................................................................................... 11
Appendix 1: Summary of Health Facilities Included in Project ........................................................... 16
Appendix 2: Quality Improvement Team Composition ........................................................................ 17
Appendix 3: Summary of Change Ideas Tested ..................................................................................... 18
Change: To maintain high initiation rate of clients on ART after testing positive ................................. 18
Change: To increase the proportion of clients that meet their VL appointment dates ............................ 19
Change: To increase the proportion of clients with VL samples collected at 6 Months ......................... 20
Change: To improve viral load sample collection at all routine milestones ........................................... 21
Change: To increase proportion of clients with documented results in registers and client card ........... 22
Change: To increase percentage of VL results entered into electronic database .................................... 23
Change: To increase proportion of clients with HVL that are notified of their results ........................... 24
Change: To increase the percentage of clients with HVL results enrolled on intense DSD model ........ 26
Change: To increase the proportion of clients with HVL that complete IAC sessions ........................... 27
Appendix 4: Results of Tested Change Ideas ......................................................................................... 28
Appendix 5: Methodology for Harvesting Change Ideas ...................................................................... 34
Appendix 6: VL and EID Harvesting Change Ideas Tool ..................................................................... 35
Appendix 7: Example Daily Health Talk Roster .................................................................................... 37
Appendix 8: Example of Optimized Client Flow ................................................................................... 38

4
Acronyms
BMGF Bill & Melinda Gates Foundation
CHS Center for Human Services
CHW Community Health Workers
CQI Continuous Quality Improvement
DHO District Health Office
DSD Differentiated Service Delivery
EID Early Infant Diagnosis
HC Health Center
HDA HIV Diagnostic Assistants
HSA Health Surveillance Assistants
HTS HIV Testing Services
HVL High Viral Load
IAC Intensive Adherence Counseling
M2M Mother 2 Mother
OPD Out Patient Department
PDSA Plan Do Study Act
PLHIV People Living With HIV
QI Quality Improvement
QIP Quality Improvement Projects
QIT Quality Improvement Teams
R4H Riders for Health
URC University Research Co., LLC
VL Viral Load

5
Figure 1: Model for Improvement
Project Background
The Quality Improvement Collaborative to Improve Access
to and Use of Quality Assured Viral Load Test Results at
District and Site Level in Malawi began in 2017 with
funding from the Bill and Melinda Gates Foundation and
implemented by the Center for Human Services (CHS), an
affiliate of University Research Co., LLC (URC). The
project aims to define, share and ensure effective
implementation of good practices in providing access to and
ensuring use of HIV viral load testing to improve care of
people living with HIV (PLHIV) at five facilities in each of
four focus districts: Balaka, Dedza, Karonga and Mchinji (20
facilities total). See Appendix 1 for a summary of the
facilities supported by project activities. The project has five
key objectives:
1. Improving access to quality laboratory services
2. Promoting district level collaboration in quality
management systems
3. Improving use of laboratory data – specifically viral
load results – for managing HIV patients
4. Proving technical support to improve patient centered care
5. Improving laboratory infrastructure
Document Overview
The overall purpose of this document is to outline the successful interventions tested to date through the
Quality Improvement Collaborative project aimed at improving access to and use of quality assured
laboratory data for the management of patients living with HIV/AIDS in Malawi. First the document
provides an overview of the continuous quality improvement approach used and key indicators tracked to
measure performance across the viral load (VL) and early infant diagnosis (EID) testing cascades. The
remainder of the document describes successful change ideas, or quality improvement interventions,
identified and tested during the project that could be scaled up and spread to improve access to and use of
quality assured viral load and EID testing for patient management within and outside of Malawi.
CHS-URC Continuous Quality Improvement Approach
Continuous quality improvement (CQI) is often defined as the
group of activities, structures and values that an organization
develops, allowing it to systematically measure, report and improve
the quality of its main healthcare processes. CHS-URC’s CQI
approach focuses on reviewing and improving processes to ensure
that health care delivery is effective, efficient, equitable and
responsive to clients. Using quality improvement (QI) methods,
providers can identify quality gaps between desired practices (what
the evidence indicates are best care practices to positively affect
patient outcomes) and the actual practice at a health care facility.
QI approaches mobilize various levels of health care providers and
managers, give them a framework to solve problems, and build on
their insights and efforts. The model for improvement (Figure 1),
frames improvement efforts for providers working in teams by
focusing on client needs and using data to implement and test
The purpose of this change package is to provide a synthesis of the most robust and effective quality improvement (QI) interventions for improved access to and use of viral load testing for patient management in Malawi. This change package represents a synthesis of the strongest and most effective change ideas tested through continuous QI approaches at 20 health facilities in Malawi since 2017. The change package is a result of activities which included:
1) establishing QI teams at hospitals and health centers;
2) mentoring QI teams to document their improvement processes; and
3) supporting QI teams to share learning and experiences with peers and other stakeholders.

6
Figure 2: Activities and Bottlenecks Across Testing Phases
changes to the care system. The model starts with teams discussing and answering three questions: 1)
What are we trying to accomplish?; 2) What changes can we make that will result in an improvement?;
and 3) How will we know if that change is an improvement?
Using the answers to the above questions as their guide, teams test and implement changes in the care
delivery system to improve results. The power of quality improvement is its focus on making iterative
changes in the processes that make up health systems and on consistently measuring the results of these
changes on quality of care and health outcomes. Making changes in how specific tasks are performed or
how care is organized and tracking the effects (positive and negative) of these changes allows health care
workers to determine what changes lead to improvements in compliance with standards and outcomes.
This CQI approach is implemented by clinical QI teams at district hospital and health center levels who:
• Conduct regular chart audits to track key indicators
• Develop and implement facility level quality improvement plans
• Develop and test changes, solutions and approaches to reduce identified gaps
• Meet regularly to review progress and track improvements in patient management towards viral
suppression and other key outcomes
While the project baseline assessment revealed the existence of quality improvement teams (QITs) in all
assessed districts, few were functional and most lacked terms of reference or understanding of their roles
and responsibilities. Since June 2017, the project has been working steadily to revamp QITs at the facility
and district levels in the four target districts. This included setting up and developing terms of reference
for QI teams, training of QI champions on CQI in HIV VL and EID at each of the 20 participating
facilities, providing routine mentorship, and facilitating regular QI planning and review meetings. A
summary of quality improvement team composition by facility is found in Appendix 2. Project efforts
through October 2017 focused on QIT strengthening and coordination, and QIT interventions and efforts
began in November 2017 with 11 QI projects (QIPs) across the four districts. As of December 2018, the
project has initiated 74 QI projects, with 52 completed QI projects to date. Examples of improvement
aims and change ideas tested, including run charts detailing quality improvement interventions and
results, are included in Appendices 3 and 4.
Key Indicators Targeted for Improvement
Throughout QI implementation, the project monitored key indicators related to VL and EID testing at pre-
analytical, analytical and post-analytical testing phases. Critical activities within each testing phase are
detailed in Figure 2, as well
as bottlenecks identified and
addressed during project
implementation using quality
improvement methods and
close collaboration with
stakeholders and partners.
Key indicators that the
project monitors specific to
these three phases include:
Pre-analytical phase
• % of clients eligible
for six months
testing with VL
collected
• % of clients eligible

7
for 24 months testing with VL collected
• Number of VL and EID samples transported per month by sample transportation system
Analytical phase
• % of VL results returned to facility within one month of collection
• % of EID results returned to facility within 14 days
Post-analytical phase
• % of clients with suppressed VL on multi-month prescribing
• % of clients with unsuppressed VL receiving greater than 1 month of refills
• % of clients with unsuppressed VL completing intensive adherence counseling (IAC)
• % of clients with unsuppressed follow-up VL switched to second line regimen
• % of EID results returned to care givers within 14 days and linked to care
Further details on some of these key indicators are included below, including selected improvement
trends over the life of the project, bottlenecks identified, and areas targeted for QI interventions.
Proportion of clients eligible for VL testing with sample collected
Malawi national guidelines include routine viral load monitoring at six- and 24-months following ART
initiation. The project monitors the number of clients eligible for VL testing at both six- and 24-months
ART milestones on a monthly basis, compared to the number of VL samples collected from those eligible
for testing. Bottlenecks identified that affect performance of these indicators include weak knowledge of
and demand for testing at ART milestones and limited ability to track clients who are due for routine VL
testing. Areas targeted for QI intervention included health promotion on the importance of VL testing,
screening of patient master cards to identify clients eligible for VL testing, and use of expert clients to
follow-up with clients who miss appointments. In the districts covered by the project, the introduction of
these QI interventions resulted in an increased proportion of clients receiving VL testing six months after
ART initiation from 57% in June 2018 to 94% in November 2018, as seen in Figure 3.
Figure 3: Proportion of eligible clients with VL sample collected at six months - June to November 2018
Proportion of VL results returned to facility within one month of collection.
The national target for VL results turnaround time is one month from sample collection to results received
at the facility. Malawi struggles with meeting this recommended one-month period, with inconsistent
performance in the four districts supported by this project between January and November 2018 (see
Figure 4 below). Numerous bottlenecks have been identified including increased numbers of samples for
testing and inadequate staffing levels at molecular laboratory facilities. The project closely collaborates

8
with the CDC-funded Strengthening High Quality Laboratory Services Scale-Up for HIV Diagnosis,
Care, Treatment, and Monitoring in Malawi under PEPFAR project, implemented by URC, to implement
strategies to improve sample testing and resolve bottlenecks across the analytical phase in all target
districts. Potential interventions include increasing staffing, instituting multiple laboratory shifts, and
introducing innovations to eliminate cumbersome logging and data entry tasks.
Figure 4: Trend of VL Results Returned within One Month, January-November 2018
Proportion of clients with unsuppressed VL completing IAC
Under the post-analytical testing phase, the project monitors performance across the viral load cascade of
care, including enrollment and completion of IAC for clients with high viral load (HVL) (VL >1000
copies per ml), administration of a follow-up VL test, and appropriate switches to a second line ART
regimen if warranted. Numerous bottlenecks can be present during this phase, including failing to record
results in patient cards and registers, poor coordination among providers resulting in limited follow-up to
clients with high VL results, and poor adherence to IAC guidelines among providers and clients. Areas
the project targeted for QI interventions included identifying staff responsible for updating results in
appropriate registers and cards, using color codes to identify clients on IAC, and increased on-site
coaching and mentorship on current ART treatment guidelines to ensure optimized patient management.
Project performance from June to December 2018 is found in Figure 5.
Figure 5: Trend of IAC performance June to December 2018
9
• Re-engineer the client flow for all clients due for VL testing to first have the blood draw
and finish with drug collection.
Summary of Successful Change Ideas
Following implementation of quality
improvement activities throughout
the project-supported sites, project
staff reviewed data and results trends
of the indicators detailed above to
track improvements over time and link those to successful changes tested. Additionally, the most
successful change ideas were captured through harvesting learning sessions; the harvest learning session
methodology is described in Appendix 5. Below we present successful change ideas that led to
improvements in the uptake and utilization of VL testing and results utilization across all the sites. Further
details on how the change ideas were implemented is included in the following section.
Health promotion engagement with ART clients
• The ART provider/staff advises clients during appointments that expert clients/community health
workers (CHWs) will contact clients via community follow- up or phone when the VL results are
in.
• Advise clients on ART not to send a third person to collect drugs on their behalf.
• Advise clients that have a blood draw for VL testing to avoid transferring to another facility until
their results are in.
Viral load and EID test results management and data quality and documentation
• As soon as results are received, flag unsuppressed results for immediate follow up by CHWs
and/or expert clients.
• Appoint, on rotation, one member of the QIT to attach the VL results to the clients’ master cards
each time results are received.
• QIT members review their facility data after the clinic day and see that all the registers and source
documents are complete.
• The ART clerk reviews the client contact information (phone number, physical address, village
etc.) at every visit.
Work/client flow mapping modification
• Consider the feasibility of dispensing one-month drug re-fill for all clients that have a blood draw
for VL testing.
• Retrieval and review of all client master cards, one day prior to clinic day.
• Assigning one staff at the waiting area to screen master cards and identify all clients that are due
for viral load testing.
Note: Change ideas in boxes below should be considered for prioritization based on importance and beneficial impact to patient management outcomes, particularly in locations with goals related increased VL scale-up.
• QI teams develop a roster for daily health talks on topics related to VL and EID testing
and ART management in general.
• Color code client master cards using stickers to indicate the client is due for VL testing,
has unsuppressed VL, and/or is on an intense model of care (IAC, etc.).
10
• Frequent feedback on prolonged turnaround time (TAT) and determination of solutions to
reduce TAT.
• Linkage with molecular laboratories to understand the reasons and strategies to mitigate
delays of sample processing and release of results.
Facility staff modification
• ART clinic in-charge develops and utilizes a working roster for the facility-based staff with
proper shifts making sure the ART clinic is adequately staffed.
• Task shifting certain responsibilities to other cadres for efficiency in service delivery; for
example, expert clients taking client’s weight and vital signs and providing health talks in the
waiting area.
• Expert clients conduct community follow-up to track clients with HVL to come to the clinic and
enroll them into intense models of care as soon as results are received.
Health worker capacity building
• Provide on-site coaching on QI methods and national current treatment guidelines to optimize
services.
• Peer learning for all ART clinic staff on the current treatment guidelines for ART clients.
Enhanced coordination with molecular laboratories
• Frequent feedback on reasons for invalid samples and missing results and collaborate closely with
clinical partners to address issues related to sample collection.
• Frequent feedback and coordination to identify solutions to address prolonged TAT.
Enhanced coordination with sample/result transport provider on sample transport
• Close collaboration with sample/result transportation to determine the optimal number of visits
and visit schedule to each facility to facilitate sample pick-up and results delivery.
• Regular coordination on missing results and sharing the list with the sample and results
transportation provider to follow up with molecular labs during their next sample collection visits.
Enhanced district partner’s engagement
• Facilitate monthly data sharing with all partners providing care in the district.
• Facilitate quarterly shared learning with the QITs and all partners to share technical briefs,
success stories, best practices and lessons learned
• Facilitate District quality improvement monthly meetings and on-site visits to support the QITs in
the provision of quality care to clients.

11
Detailed Change Package
The following table summarizes the recommendations from the QI teams who were involved in testing
change ideas for quality assured VL testing and EID in the four districts supported by the project (Balaka,
Dedza, Mchinji and Karonga). The change ideas recommended are the changes that yielded the best
results for the improvement aims. The section provides details on how QI teams implemented the change
ideas and other elements to consider when implementing a similar change idea. See Appendix 5 for the
methodology of selecting change ideas for inclusion in the change package and Appendix 6 for the tool
used to harvest change ideas.
Change Concept: Health Promotion Engagement with ART Clients
Change Idea Details on how change idea was implemented Further implementation
elements to consider
Provide daily
health talks on
related topics
• The head of each facility developed a daily roster
including date, staff name, health talk topic and
signature. An example roster is found in
Appendix 7
• Assigned staff (including clinicians, nurses and
expert clients) presented health talks on various
topics, including VL importance and milestones,
adherence, and EID testing, as well as other health
related topics including tuberculosis, family
planning, nutrition, and hygiene and sanitation
• QIT members provided supportive supervision to
staff ensuring health talks were completed and
conducted with appropriate information
Health talks were based
on the national treatment
guidelines developed by
the Department of
HIV/AIDS. It is essential
to standardize information
delivered to clients and
ensure that the
information is evidence-
based
Engage expert
clients and
community health
workers in
unsuppressed VL
result
communication
• ART providers and other staff advised ART
clients during sample collection that expert clients
or CHW would be in contact if unsuppressed VL
results were received, either by home visit or
phone
• When results were received at the facility, expert
clients/CHWs communicated with any patients
with unsuppressed VL results (through home visit
or phone)
Clinical partners were
engaged to provide
credits to CHW to call
clients with high VL
results
Advising clients
on appropriate
ART management
activities
• ART providers and other staff provided ongoing
counseling and advice to clients including:
o Advising clients on ART not to send another
person to collect drugs on their behalf
o Advising clients who have had a recent VL
blood draw or are currently in IAC to wait, if
at all possible, before transferring to a new
health facility (due to relocation, etc.)
All teens (<15 years) are
encouraged to be
accompanied by parents
or guardian when
attending ART services
Change Concept: Viral Load and EID Test Results–Management, Data Quality and
Documentation
Change Idea Details on how change idea was implemented Further implementation
elements to consider
Flag unsuppressed
VL results for • When results arrived at facilities, the HIV
diagnostic assistants (HDA’s) recorded the results
Districts and facilities
should collaborate to
12
immediate follow-
up
in the VL register
• The results are then given to CHW’s/expert
clients for filing into patient cards
• All patient cards with unsuppressed VL are
flagged with a sticker and distributed across
CHW’s for client follow-up
standardize color-coding
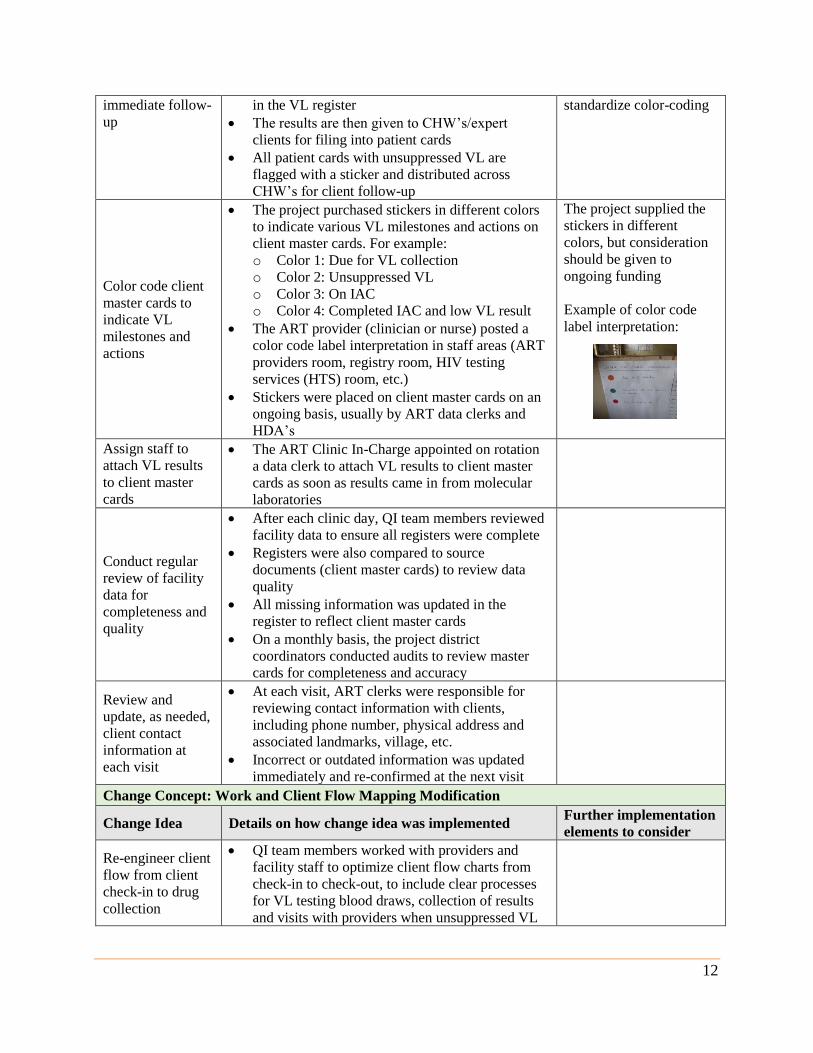
Color code client
master cards to
indicate VL
milestones and
actions
• The project purchased stickers in different colors
to indicate various VL milestones and actions on
client master cards. For example:
o Color 1: Due for VL collection
o Color 2: Unsuppressed VL
o Color 3: On IAC
o Color 4: Completed IAC and low VL result
• The ART provider (clinician or nurse) posted a
color code label interpretation in staff areas (ART
providers room, registry room, HIV testing
services (HTS) room, etc.)
• Stickers were placed on client master cards on an
ongoing basis, usually by ART data clerks and
HDA’s
The project supplied the
stickers in different
colors, but consideration
should be given to
ongoing funding
Example of color code
label interpretation:
Assign staff to
attach VL results
to client master
cards
• The ART Clinic In-Charge appointed on rotation
a data clerk to attach VL results to client master
cards as soon as results came in from molecular
laboratories
Conduct regular
review of facility
data for
completeness and
quality
• After each clinic day, QI team members reviewed
facility data to ensure all registers were complete
• Registers were also compared to source
documents (client master cards) to review data
quality
• All missing information was updated in the
register to reflect client master cards
• On a monthly basis, the project district
coordinators conducted audits to review master
cards for completeness and accuracy
Review and
update, as needed,
client contact
information at
each visit
• At each visit, ART clerks were responsible for
reviewing contact information with clients,
including phone number, physical address and
associated landmarks, village, etc.
• Incorrect or outdated information was updated
immediately and re-confirmed at the next visit
Change Concept: Work and Client Flow Mapping Modification
Change Idea Details on how change idea was implemented Further implementation
elements to consider
Re-engineer client
flow from client
check-in to drug
collection
• QI team members worked with providers and
facility staff to optimize client flow charts from
check-in to check-out, to include clear processes
for VL testing blood draws, collection of results
and visits with providers when unsuppressed VL

13
was detected
• New client flow maps and narratives were posted
at the facilities to facilitate providers and staff to
guide patients through visits
• See Appendix 8 for an example optimized client
flow chart and narrative
Dispense one-
month drug refills
to clients awaiting
VL results
• All clients who had their blood drawn for VL
testing were provided a one-month prescription of
medication to ensure they returned to the facility
to receive the results of their VL test and discuss
clinical care next steps with the provider
Close coordination with
Ministry of Health and
HIV/AIDS departments is
required on policy
feasibility and
implementation, as often
delays in receiving VL
results can place an undue
burden on patients who
must return to facilities
for drug collection,
despite the unavailability
of their VL test results
Conduct retrieval
of client master
cards one day
prior to clinic day
• On the day prior to clinic day, expert clients and
data clerks are assigned to collect all client master
cards for those clients with appointments
• The cards are sorted according to the needs of the
clients, including those due for VL collection or
those due for IAC sessions
• The cards are shared with the data clerks who take
client vital signs and hand over master cards to
clients as they meet providers
• Prior review and sorting of the cards allows the
data clerks to highlight key services the clients
should receive during their visit and avoid missing
key VL milestones
Assigning staff
member to screen
master cards for
those due for VL
testing
• Expert clients and data clerks are assigned to the
waiting area to screen all master cards and
identify all clients that are due for VL testing
• As soon as the clients’ vital signs have been
recorded they are sent for VL sample collection
before proceeding with the remainder of their visit
Change Concept: Facility Staff Modification
Change Idea Details on how change idea was implemented Further implementation
elements to consider
Ensure facility
ART clinic is
always adequately
staffed
• The ART Clinic In-Charge developed and tracked
a roster for the facility-based staff with proper
shifts to make sure the ART clinic was staffed
adequately each day, taking into account leave
schedules, trainings, etc.
Use of locum (temporary)
staff, in the event all
providers at the clinic are
engaged in other activities
Implement task
shifting to increase • QI team members, with guidance from the district
health office (DHO) and facility management,
It was essential to engage
DHO in these efforts and

14
efficiency in
service delivery
discussed task shifting opportunities, with DHO
providing approval of any task shifting decisions
• Specific responsibilities were shifted to other
cadres including:
o Expert clients were assigned to measure and
record client weights and vital signs
o Expert clients were assigned to provide health
talks in clinic waiting room
o Data clerks were assigned to place color-
coded stickers on health passports
• The district ART Coordinator was responsible for
informing cadres of new responsibilities
obtain approval for any
task shifting decisions
Engage expert
clients in
unsuppressed VL
result follow-up
• When VL results were received, expert clients
were tasked with conducting community follow-
up to track patients with unsuppressed VL results,
encouraging them to come to the clinic and enroll
into intense models of care
Change Concept: Health Worker Capacity Building
Change Idea Details on how change idea was implemented Further implementation
elements to consider
Provide routine
on-site coaching
on QI methods
and current
treatment
guidelines
• The project district coordinators and ART nurses
provided monthly on-site mentorship covering QI
methods and current treatment guidelines to
optimize services
• QI methods covered included:
o Fishbone analysis; driver diagrams; plan-do-
study-act (PDSA) cycles; presentation of data
through run charts to determine if change idea
led to improvement
All treatment guidelines
coaching was aligned
with current national
Malawi Guidelines for
Clinical Management of
HIV in Children and
Adults
Conduct peer
learning for all
ART clinic staff
on treatment
guidelines
• Clinical meetings are held every morning on ART
clinic days, where all staff discuss current
treatment guidelines, difficult cases and patient
management strategies, and any policy or clinical
management updates
• Copies of current national treatment guidelines are
available throughout the facility in the ART room
and HTS room for reference by providers during
testing, counseling and treatment sessions
Change Concept: Close Coordination with Molecular Laboratories
Change Idea Details on how change idea was implemented Further implementation
elements to consider
Meet regularly to
discuss
bottlenecks that
delay sample
processing and
release of results
and identify
• On a routine basis, project staff met with
molecular laboratory staff and managers to
understand the reasons for sample processing and
results release delays and identify strategies for
addressing bottlenecks
• Examples of mitigation strategies included:
o Addition of extra data clerks at molecular
Any relevant sample
transportation entities and
clinical implementing
partners should also be
involved in the
discussion.

15
mitigation
strategies to
decrease
turnaround time
laboratories
o Utilization of extra shifts to analyze additional
samples per day, up to 24 hours a day as
needed
Provide frequent
feedback on issues
related to sample
collection
• The project met regularly with molecular staff and
clinical implementing partners to discuss feedback
on reasons for invalid samples and missing
results. All partners were engaged to fix issues
and decrease sample rejection rates
Change Concept: Enhanced Coordination with Sample/Result Transport Entity
Change Idea Details on how change idea was implemented Further implementation
elements to consider
Determine optimal
visit schedule for
sample pick-up
and results return
• Through the CDC-funded Malawi Laboratory
Project, the project engaged facility staff, clinical
implementing partners and Riders for Health
(R4H), the chosen sample transport provider
• R4H was advised to visit each project site twice
per week to retrieve samples and deliver results
between the facilities and molecular laboratories
Provide regular
feedback on
turnaround times
• Project staff provided frequent feedback on
prolonged turnaround times and results delays and
discussed any transportation issues with R4H
management
Staff from molecular
laboratories and any
clinical implementing
partners should also be
involved in the
discussion.
Coordinate
regularly on
delayed and
missing results
• Project staff, in coordination with the CDC-
funded Malawi Laboratory Project, shared a list of
missing results with R4H, who followed-up with
molecular labs during their next sample drop-off
visit
Change Concept: Consistent Collaboration with District Partners
Change Idea Details on how change idea was implemented Further implementation
elements to consider
Facilitate routine
data sharing
• Relevant project staff organized monthly data
sharing with all partners providing care in each
facility, including QIT members and facility staff,
led by the QIT chair of the facility
Facilitate quarterly
shared learning
• The project organized quarterly shared learning
sessions, where QI team members and all partners
could share technical briefs, success stories, best
practices and lessons learned during the QI
process
Facilitate
collaborative
district quality
improvement
• Project staff organized monthly district quality
improvement team meetings and monthly on-site
mentoring visits to support the QI teams in the
provision of quality care to clients

16
Appendix 1: Summary of Health Facilities Included in Project
Table 1: District Hospitals Summary
District Hospitals
District HIV Prevalence Catchment
Population
Number of
Staff
Number of HIV
patients
Dedza 1.5% 830,512 69 12,403
Balaka 4.1% 159,446 44 6,615
Mchinji 0.8% 602,305 6 4,602
Karonga 7.3% 62,348 19 4,532
Table 2: Health Center Summary
Health Centers
District Health
Center Name
HIV
Prevalence
Catchment
Population
Number of
Staff
Number of
HIV patients
Balaka Mbera 3.2% 48,960 21 1,569
Kalembo 4.3% 43,743 32 1,867
Phalula 5.4% 26,069 22 1,420
Phimbi 3.0% 26,423 17 800
Dedza Mayani 2.8% 26,820 11 758
Mtendere 2.6% 69,080 22 1,812
Chikuse 1.1% 32,335 5 365
Mtakataka 2.8% 22,393 6 619
Mchinji Nkhwazi 2.6% 52,667 7 1,345
Kochilira 2.5% 489,44 6 1,210
Kapiri 3.9% 63,983 7 2,519
Mkanda 4.1% 47,991 6 1,970
Karonga Chilumba 17.0% 18,900 18 3,217
Nyungwe 5.8% 40,122 14 2,317
Kaporo 6.7% 61,115 16 4,121
Ngana 4.1% 4,230 4 175

17
Appendix 2: Quality Improvement Team Composition
Table 3: Quality Improvement Team Composition at Each Level of the Health System
District Hospitals
District Number of QIT
Members
Team Composition
Dedza 12 ART District Coordinator, Laboratory Manager, ART Clinic
in-charge, ART Nurses, ART clerks, ART clinicians, ART
nurses, Patient attendants, Data clerks, HIV Diagnostic
Assistants (HDAs), Expert Clients, HTS Counselor
Balaka 9
Mchinji 11
Karonga 15
Health Centers
District Name of Facility Number of QIT Members Team Composition
Balaka Mbera 10 Facility in-charge, ART
clinicians, ART nurses, Data
clerks, Health Surveillance
Assistants (HSAs), HDAs,
HTS Counselors, Expert
Clients, Patient Attendants
Kalembo 11
Phalula 18
Phimbi 12
Dedza Mayani 8
Mtendere 8
Chikuse 8
Mtakataka 8
Mchinji Nkhwazi 10
Kochilira 8
Kapiri 12
Mkanda 11
Karonga Chilumba 9
Nyungwe 10
Kaporo 10
Ngana 9
18
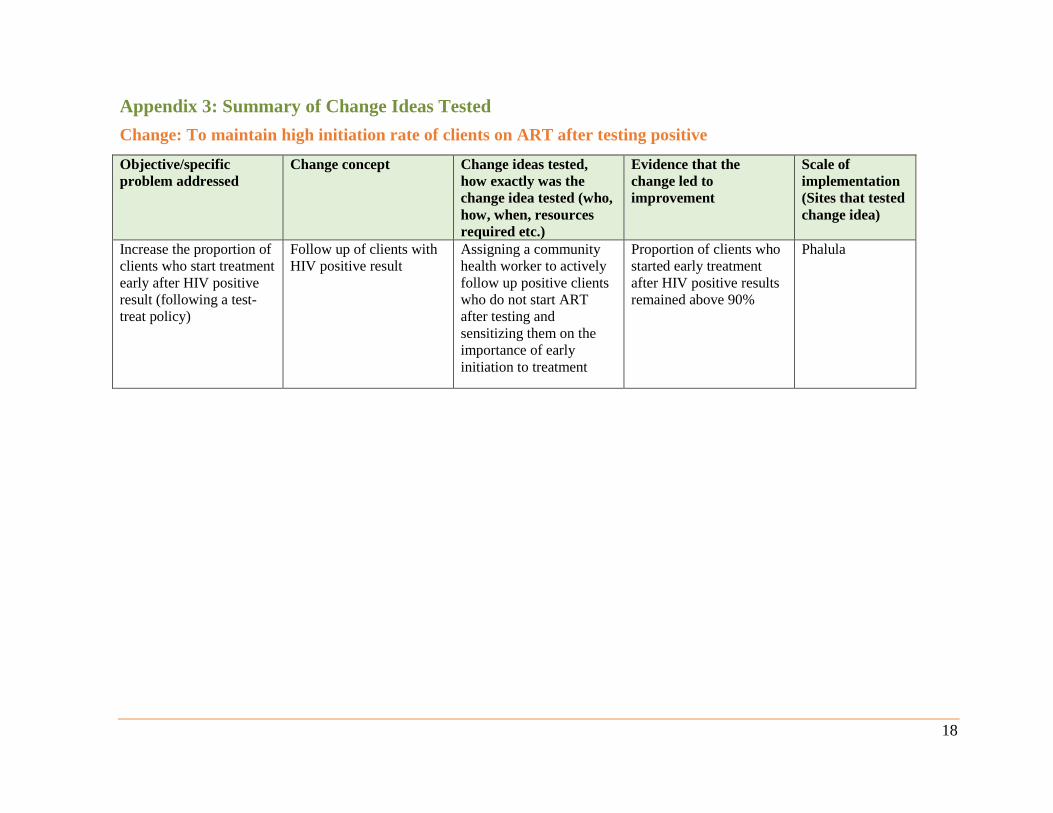
Appendix 3: Summary of Change Ideas Tested
Change: To maintain high initiation rate of clients on ART after testing positive
Objective/specific
problem addressed
Change concept Change ideas tested,
how exactly was the
change idea tested (who,
how, when, resources
required etc.)
Evidence that the
change led to
improvement
Scale of
implementation
(Sites that tested
change idea)
Increase the proportion of
clients who start treatment
early after HIV positive
result (following a test-
treat policy)
Follow up of clients with
HIV positive result
Assigning a community
health worker to actively
follow up positive clients
who do not start ART
after testing and
sensitizing them on the
importance of early
initiation to treatment
Proportion of clients who
started early treatment
after HIV positive results
remained above 90%
Phalula

19
Change: To increase the proportion of clients that meet their VL appointment dates
Objective/specific problem
addressed
Change concept Change ideas tested, how exactly
was the change idea tested (who,
how, when, resources required etc.)
Evidence that
the change led to
improvement
Scale of
implementation
(Sites that tested
change idea)
Complete documentation in
the registers
Daily review of
registers to
capture all the
data
The QIT reviewed registers at the end
of each clinic day
Percentage of
clients that meet
their appointment
dates has
significantly
increased from
87.9% to 95.8%
Applied to all sites
To identify clients who are
due for VL test appointment
Prior sorting of
master cards
Assigning one member of the QI team
to sort Master cards of booked clients
before the clinic day
Applied to all sites
Increase awareness of clients
on benefits of timely testing
Health promotion
on advantages of
meeting VL
appointments
Sensitizing clients on the importance
of not missing VL appointment dates
by ART staff
Applied to all sites

20
Change: To increase the proportion of clients with VL samples collected at 6 Months
Objective/specific
problem addressed
Change concept Change ideas tested,
how exactly was the
change idea tested (who,
how, when, resources
required etc.)
Evidence that the
change led to
improvement
Scale of
implementation
(Sites that tested
change idea)
Increase clients’
awareness on health
benefits of timely VL
testing
Health talks to VL clients Depending on the topic,
clinicians/nurses/expert
clients giving health talks
to clients on VL testing
Percentage of clients
tested increased from
48% to 88%
Karonga DHO
Reduce number of clients
who miss VL testing
during clinic visit
Clients triaging Triaging of clients due for
VL testing by ART staff*
Karonga DHO
Increase number of
clients with VL samples
taken
Active follow up of VL
clients
Following up intensively
of clients due for VL
collection by expert
clients
Karonga DHO
Reduce proportion of
clients who miss VL
testing at 6 months
Use of mobile phones Lead Expert Client/ HDA
Supervisor phone calling
clients who are due for
VL testing
Karonga DHO
* Note: Triaging involves checking of clients’ health passports while the clients are in the waiting room and those identified as due for VL collection are
immediately sent to VL collection room

21
Change: To improve viral load sample collection at all routine milestones
Objective/specific
problem addressed
Change concept Change ideas tested, how exactly was
the change idea tested (who, how,
when, resources required etc.)
Evidence that
the change led
to
improvement
Scale of
implementation
(Sites that tested
change idea)
To increase clients’
awareness on benefits of
VL testing
Health talks on
advantages of VL testing
CHW conducting health talks Proportion of
eligible clients
that had VL
taken increased
from 60.7% to
104% (Note:
the above
100% results
includes
additional
clients who
missed their
appointments
and came on a
clinic day
which they had
no appointment
alongside
clients who had
appointments
(expected
clients) on
particular day)
Mchnji DHO,
Kochilira
Phimbi, Phalula,
Balaka DHO, Mbera
To improve efficiency in
sample collection and
documentation operations
Identification of specific
personnel to carry out
sample collection and
documentation
Assigning of specific personnel to
oversee sample collection and
documentation
Mchinji DHO
Increase proportion of
clients meeting VL
milestones
Review of master cards
and passbook to screen
for VL milestone
ART staff assessing master cards and
health passbook to screen for VL
milestone
Kapiri, Kochilira,
Chikuse, Phimbi,
Phalula, Balaka
DHO, Mbera
Increase number of VL
samples collected
Assigning VL sample
collection to available
personnel
ART clinic In-Charge allocating VL
sample collection monthly target to
available VL sample collection personnel
Kapiri
Increase number of VL
samples collected
Increase quantity of staff
in VL sample collection
room
ART clinic In-Charge ensuring
availability of officers and addition of
another officer in the VL sample
collection room.
Kochilira
Improve follow up of
clients due for VL
Use of HAS’s and partner
field officers in tracking
clients
HSA’s and Mother 2 Mother (M2M)
officers assisting in tracking clients due
for VL
Ntakataka
Flagging eligible clients
for VL testing for easy
follow up
Generation list of eligible
for VL testing at 6
months 24 months
HDA’s generating list of eligible clients
from ART registers per cohort (6 months
and 24 months)
Mayani
To increase proportion of
clients meeting VL
appointments
Active follow up by
expert clients
Using expert clients to assist in tracking
those who miss appointment
Mayani
Easy identification of
clients due for viral
Use of colored stickers HDAs/ ART Nurse putting colored
stickers on the master card
Phimbi, Phalula,
Balaka DHO, Mbera

22
Change: To increase proportion of clients with documented results in registers and client card
Objective/specific
problem addressed
Change concept Change ideas tested, how
exactly was the change
idea tested (who, how,
when, resources required
etc.)
Evidence that the
change led to
improvement
Scale of implementation
(Sites that tested change
idea)
Reduce delays in
documentation of results
when they arrive at the
facility
Empower HDAs in
results documentation
Empowering HDAs in
documenting results soon
after arrival at the facility
Proportion of
results
documented
increased from
22.8% to 95.3%
Chilumba
Involvement of all key
facility staff in VL clinics
Mentorship of clinicians
and nurses on use of
HVL register
Mentoring of clinicians and
nurse on how to use the
HVL register
Karonga DHO
To increase proportion of
results documented and
quality of other VL
testing services
Regular weekly
departmental meetings
ART Clinic In-charge
intensifying regular
meetings at department level
(weekly) to discuss issues of
documentation and other
quality issues
Karonga DHO
Improve accessibility of
HVL results to expert
clients
Generation of HVL
results for use by expert
clients
HDA’s generating list of
clients with high viral load
results and give it to expert
clients to assist in tracking
of the clients
Dedza DHO
Improve accessibility of
results for utilization
Use of focal persons to
oversee documentation
Choosing focal persons to
oversee documentation by
ART Clinic In-charge
Dedza DHO

23
Change: To increase percentage of VL results entered into electronic database
Objective/specific problem
addressed
Change
concept
Change ideas tested, how exactly was
the change idea tested (who, how,
when, resources required etc.)
Evidence that the
change led to
improvement
Scale of
implementation
(Sites that
tested change
idea)
Increase the proportion of
results entered in the
electronic database
Mentorship
of data entry
clerks
ART Coordinator mentoring data entry
clerks in electronic data entry
86.5% of the results were
entered into electronic
database from 5%
Karonga DHO
Full time engagement of data
entry clerks in data entry
Supportive
supervision
of data entry
clerks
Conducting supportive supervisions to
clinics by District- QI Team
Karonga DHO

24
Change: To increase proportion of clients with HVL that are notified of their results
Objective/specific problem
addressed Change concept
Change ideas tested, how
exactly was the change idea
tested (who, how, when,
resources required etc.)
Evidence that
the change
led to
improvement
Scale of
implementation
(Sites that tested
change idea)
To increase number of clients
that receive results as soon as
possible
One-month drug re-fill
ART provider prescribing one-
month drug re-fill for all clients
that had VL sample collected
Proportion of
clients with
HVL notified
of their results
increased from
46.6% to
71.6%
Applied to all sites
Reduce cross transfers from one
clinic to another clinic Retain the client at a clinic
Providers (ART Nurse and
clinicians) not allowing clients
that had viral load sample
collected to get transferred to
another clinic
Mbera, Phimbi
To locate clients for result
notification
Obtain clients physical
location land marks
Assigning one QI member to
collect physical land marks that
give exact location of clients for
easy follow up
Applied to all sites
To improve daily
documentation of results in
master cards for easy follow up
of clients
Daily documentation of VL
results in master cards
ART clerk documenting VL
results in master cards on daily
basis
Applied to all sites
To streamline EID/VL activities
at the clinic
Identification of one person
to be responsible for
EID/VL clinic
Assigning an EID /VL focal
person at the clinic Balaka ART
To improve timely result
notification to clients
Flag VL results in registers
for action
Using stickers to flag results in
registers by ART staff Applied to all sites
To improve timely result
notification to clients
Screening of master cards
one day prior to clinic day
to identify clients with
outstanding results
Screening of master cards
before clinic day by ART staff Applied to all sites
Increase awareness of clients on
benefits of regular VL testing
and knowing the results
Health talks CHW conducting health talks
consistently Applied to all sites

25
Improved timely notification of
results by designated result
notification officer
Usage of duty roster by
designated result
notification officer
Ensuring availability of duty
roster to designated result
notification officer
Applied to all sites
Increase number of clients
notified of their results during
subsequent drug collection
Collection of drugs by
clients themselves
Providers preventing guardians
from collecting ARVs for more
than once.
Applied to all sites
Improved timely notification of
results
Active clients follow up by
expert clients
Tracing of clients using Expert
clients/health surveillance
assistants (HSAs)/CHWs
Applied to all sites

26
Change: To increase the percentage of clients with HVL results enrolled on intense differentiated service delivery model
Objective/specific
problem addressed
Change concept Change ideas tested, how
exactly was the change idea
tested (who, how, when,
resources required etc.)
Evidence that the
change led to
improvement
Scale of implementation
(Sites that tested change
idea)
Increase clients’
awareness on VL testing
Counselling at point of
VL collection
Providers intensively
counselling clients at the
collection point emphasizing
the need to provide collect
addresses for easy tracking.
Proportion of clients
with HVL enrolled in
IAC increased from
49.5% to 78.4%
Dedza DHO
Improve communication
between clinic staff and
expert clients
Improved and frequent
communication with
expert clients
The ART providers holding
regular and feedback meetings
with expert clients
Dedza DHO, Mayani
Ensure immediate access
to HVL results by expert
clients for follow up of
clients
Ensure expert clients’
availability on Fridays
Expert clients coming every
Friday to clinic when the
results are in to provide
counselling.
Dedza DHO
Increase number of
clients notified of HVL
results
Provide list of clients to
expert clients
Generate list of clients with
high viral load results and give
it to expert clients to assist in
tracking clients
Chikuse
Increase proportion of
clients with VL collected
One-month appointment ART staff giving one-month
appointment to HVL clients
Mtendere
Improve accessibility of
results
Documentation of VL
results in registers
Properly documenting results
in the viral Load register by
ART Clerk
Mtendere
Increase proportion of
clients notified of their
results and enrolled into
IAC
Intensified follow up
clients through expert
clients
Enhancing follow up of clients
through expert clients.
Mtendere, Mayani
Increase proportion of
HVL clients properly
managed
Orientation of staff in
management of HVL
clients
Orienting ART staff on
management of HVL clients
Mtendere

27
Change: To increase the proportion of clients with HVL that complete IAC sessions Objective/specific
problem addressed
Change concept Change ideas tested, how exactly
was the change idea tested (who,
how, when, resources required
etc.)
Evidence that the
change led to
improvement
Scale of
implementation
(Sites that tested
change idea)
Early initiation of IAC Active follow up
of HVL clients
Assigning CHWs to follow up
clients with HVL results
Proportion of clients
that complete three
months IAC sessions
increased from 56.1%
to 77.1%
Phalula, Balaka DHO
The client not to miss VL
sample collection
Improve client
flow
The QIT re-designed the client flow
mapping-the client passed through
the HTS for VL sample draw before
drug collection
Applied to all sites
Clients not to miss IAC
sessions
One-month drug
refill
ART provider prescribing one-
month drug re-fill to clients
Applied to all sites
Active follow up of
patients visits
Documentation of
clients visits in
patients’ cards
ART clerk staff documenting
properly clients visits in patients’
cards.
Applied to all sites
Ensure HVL clients are
initiated on IAC
Active follow up
of clients
HSA’s and expert clients following
up actively clients with HVL results
Applied to all sites
To improve identification
of clients on IAC in master
cards
Use of green
labels to identify
clients on IAC in
master cards
ART staff sticking green labels on
master cards of clients on IAC and
with HVL results
Applied to all sites
To identify in advance
clients on IAC before
clinic
Review of master
cards before clinic
Checking client master cards to
capture those on IAC and with HVL
results by ART staff
Applied to all sites

28
Appendix 4: Results of Tested Change Ideas
In this section, we present several examples of improvement aims and change ideas tested by participating
sites during the demonstration phase, including run charts detailing QIP interventions and results.
To increase proportion of results notified to clients at Dedza DHO - May-July 2018.
Dedza District Hospital ART Clinic QI team identified a gap through the review of their records of low
notification of VL results to clients. This affected the provision of quality client management. As shown
in Figure 6 below, from a baseline of 13% (17/127) in April, Dedza DHO set out to improve the
proportion of results notified to clients between May and July 2018 to 60%. A root cause analysis
identified that the low percentage of clients notified of their results was attributed to poor documentation
by the ART clerks and failure to review their facility data on a regular basis. However, when focal
persons were identified to oversee documentation, the proportion of clients steadily increased for three
successive months: 76%, 77% and 86% in May, June and July 2018 respectively.
Figure 6: Proportion results notified to clients at Dedza DHO - May-July 2018

29
To increase proportion of clients enrolled into differentiated service delivery model (IAC)
at Mayani health center (HC), Dedza – October 2017 – March 2018.
The current Malawi ART guidelines recommend that clients with HVL should be enrolled into intense
differentiated service delivery models (including IAC) for three months. Mayani HC, in Dedza district,
aimed to increase the proportion of clients enrolled into IAC from 30% (3/10) in September 2017 to 50%
between October 2017 and March 2018. Although the proportion of clients increased to 38% (3/8) in
October 2017 as Figure 7 below illustrates, the gain was undermined in November 2018 due to
inadequate knowledge of clinic staff to manage HVL clients resulting in only 25% (1/4) of the HVL
clients being enrolled in IAC during the month. Nevertheless, the proportion of clients tremendously
increased to 81% (56/69) in December 2017 due to use of expert clients to track clients missing
appointments, before dropping to 71% and 58% in January and February 2018 respectively. The drops
were still due to inadequate knowledge of clinic staff in HVL clients’ management, a gap that was fixed
in March 2018 when an orientation meeting with ART staff was conducted to help them identify and
follow up HVL clients. In addition, the orientation helped to sharpen ART staffs’ understanding of the
entire IAC cascade together with the recommended guidelines at each stage, resulting into 100% of the
HVL clients enrolled in IAC.
Figure 7: Proportion of clients enrolled in IAC at Mayani HC, Dedza – October 2017 – March 2018

30
To increase proportion of clients collected and tested for VL at six months from Karonga
DHO- June-Sept 2018
At Karonga DHO, the QIP team aimed to increase the proportion of clients with samples collected and
tested for VL at six months between June and September 2018. As shown in Figure 8, from a baseline of
48% (48/70) in May 2018, the proportion of clients collected VL did not improve in June. When various
change ideas, including expert client follow-up of clients in person and by phone and educating clients on
benefits of timely VL testing were implemented, the proportion of clients with VL samples collected and
tested at six months steadily increased in July (84%) and September (88%).
Figure 8: Proportion of clients collected and tested for VL at six months from Karonga DHO- June-Sept 2018

31
To reduce notification period of VL results from 6 weeks to 1 week (7 days) at Nanga HC,
Karonga, from June to September 2018
At Ngana health center in Karonga district, staff tested change ideas to reduce VL results notification
from six weeks to one week. As Figure 9 below shows, from a baseline of 20% (1/5) in May 2018, the
proportion of clients notified of results within 7 days increased to 100% in June before backtracking to
57% in July. The increase in June was largely attributed to active follow up of clients by HSA’s while the
decline in July was due to cross-border clients who were difficult to follow-up with and get notified of
their results. Phone calling of clients by lead expert clients proved very effective in increasing the
proportion of clients to 100% in September 2018.
Figure 9: Proportion of clients notified of their results within 7 days at Ngana HC, Karonga, from June –September 2018

32
To increase proportion of HVL clients enrolled in IAC at Balaka out patient department
(OPD) - July -October 2018.
At Balaka OPD in Balaka district, the QI team aimed to improve the proportion of clients who were
enrolled in IAC sessions, from 50% (8/16) in June, to 70%, between a period of July and October 2018.
Figure 10 below shows that during the first month of project implementation, the proportion of clients
enrolled increased from 50% to 83% (5/6) mainly due to the use of colored stickers in master cards to flag
HVL results and ensure that HVL patients were strictly given one-month drug refill. Although the
proportion of clients stagnated in August at 80%, intensive documentation of results in master cards
significantly increased the proportion of clients to 94.7% in September before dropping to 60% in
October due to some clients who gave false addresses making follow up challenging. To address this,
facility staff are emphasizing the importance of providing correct addresses and biodata during health
talks and ensuring patient are aware that the information will only be used for medical purposes.
Figure 10: Proportion of clients enrolled in IAC sessions at Balaka OPD, Balaka-July – October2018

33
In addition to the QIPs illustrated above, the project also implemented collaborative QIPs at four sites in
Balaka district namely Balaka DHO, Mbera HC, Phimbi HC and Phalula HC. These QIPs included the
following:
• Increasing VL routine testing of eligible clients from 61% in March to 90% between May and
August 2018 and the QIP completed with 100% of the eligible clients virally tested at the four
high burden sites in Balaka. The change ideas tested included:
- Screening of masters’ cards before the clinic day
- Use of colored stickers
- One-month drug refill
- Health education talks on the benefits of VL testing in patient management
- Re-engineered the client flow, in that the drug collection is done as the last process.
• Increasing VL routine testing of eligible clients from 61% in March to 90% between May and
August 2018 and the QIP completed with 100% of the eligible clients virally tested at the four
high burden sites in Balaka. The change ideas tested included:
- Re-engineered client flow in such a way that drug collection is done last
- Use of stickers to identify eligible clients due for VL testing
- Orientation of staff on VL schedule/milestones as per guidelines
- Allocation of three providers on each clinic day
- Use of screen in HIV testing and counseling room to accommodate two providers
- Daily clinic data reviews after the clinic day
• Increasing VL testing of eligible clients at Phalula HC from 61% in March to 90% between
March and August 2018 and the QIP completed with 100% of the clients of eligible clients virally
tested at Phalula HC. The change ideas tested included:
- One-month drug supply
- Comprehensive healthy talks on the importance of VL testing
- Intensive screening of master cards to identify all the clients due for VL testing
- Assigning of HVL clients to CHWs for follow up
• To increase IAC enrollment from 78% in March to 95% between March and August 2018, and
the project completed with 100% of the clients enrolled in IAC in August 2018. The change ideas
tested included:
- Use of colored stickers for patients on IAC- the colors depict the client is on first, second
or third sessions respectively
- Assigning of a person responsible for communication VL results to the clients
- Provision of one-month drug supply while awaiting VL results
- Documentation of VL results on patient’s cards
- Withhold transfers for those awaiting VL results until the results are in and
communicated to the clients

34
Appendix 5: Methodology for Harvesting Change Ideas
Four harvesting learning sessions were held between October and November 2018. The twenty Quality
Improvement teams were provided with the tool for harvesting change ideas (Appendix 6) during the on-
site coaching to all the 20 sites included in the project. Project staff and HDA officers oriented all QIT
members on use of the tool. The teams were advised to score every change idea that they tested at their
site. The teams then presented to all the other members that gathered at the learning sessions on how the
change idea(s) were tested (who tested it, how it was tested, when was it tested, and resources if they were
used). Then each change idea was scored as per Figure 11 below.
Figure 11: Guide to Rating Change Ideas

35
Appendix 6: VL and EID Harvesting Change Ideas Tool
CHS BMGF Project
Viral load and EID Harvesting Change Ideas Tool
Date: Group Members (Sites):
Improvement aim:
Part A: Grading the change ideas
Tested
Change
Source
(which sites
implemented
this change?)
Evidence from
pilot sites (use
qualitative or
quantitative
data; for each
site that
implemented this
change, what was
their baseline vs
final outcome?)
Evidence from
sites (based on
previous column,
how strong is the
evidence that this
change led to an
improvement? 1 –
weak evidence | 5
– very strong
evidence
Relative
Importance
(1 – change
not that
important to
the success of
the project or
attainment of
results | 5 –
crucial to
success of the
QI project)
Simplicity
(1 – not
very simple
to
implement
change | 5 –
very easy to
implement
change in a
short
period)
Scalability (1 –
not very
scalable e.g.
hard to
implement,
depends on
special
circumstances
etc | 5 – easy to
scale up by
anyone willing
to test the
change)
Total Score
(add up all the
scores. The
change(s) with
the highest
score is the
most
implementable
change that is
likely to lead
to a positive
result in a
short period)

36
Part B: Documenting best practices – to be filled by each facility
Date: Site Name:
Group Members:
Specific problem or
indicator being
addressed
Change(s) tested; How
exactly was change
tested/implemented
(where, who, how,
when, resources etc)?
Change successful?
Yes/No? Evidence of
successful change?
Achievements/Promising
practices
Challenges and
Observations
Next Steps

37
Appendix 7: Example Daily Health Talk Roster
Date Name Department/Area Health
Topic
Total Health Talk
Participants Staff
Signature Female Male
Figure 12: Example Daily Health Talk Roster from Buyu Clinic in Karonga District
38
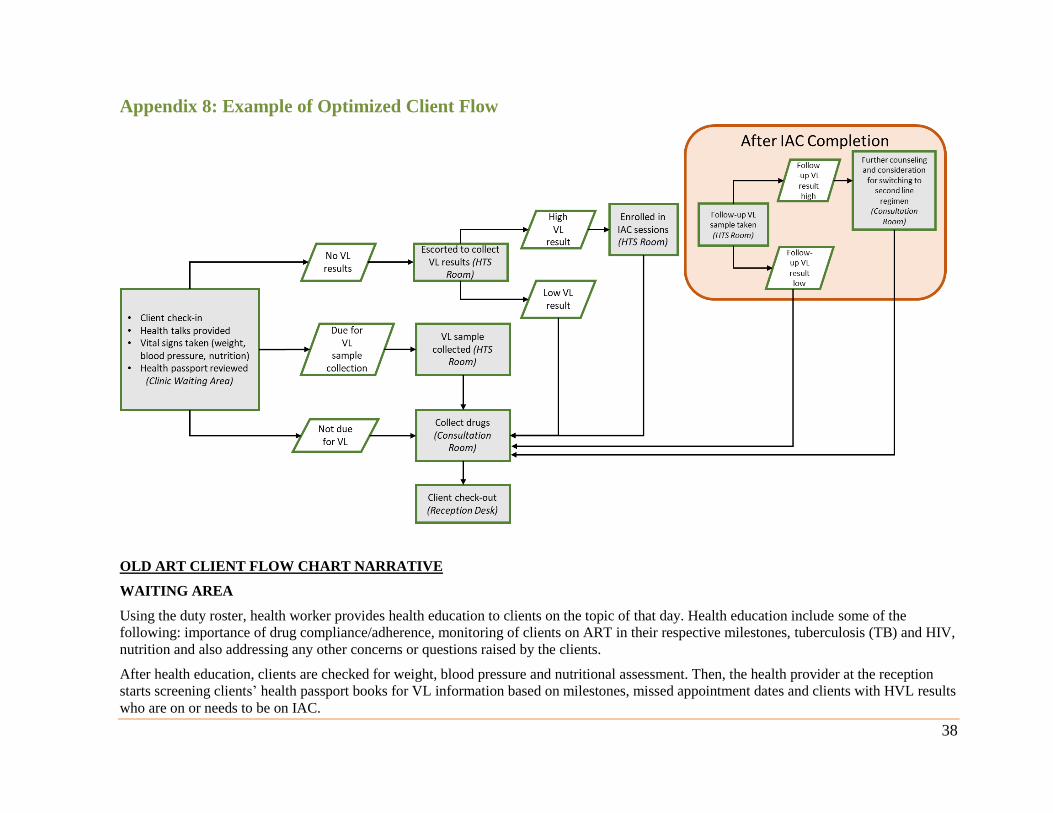
Appendix 8: Example of Optimized Client Flow
OLD ART CLIENT FLOW CHART NARRATIVE
WAITING AREA
Using the duty roster, health worker provides health education to clients on the topic of that day. Health education include some of the
following: importance of drug compliance/adherence, monitoring of clients on ART in their respective milestones, tuberculosis (TB) and HIV,
nutrition and also addressing any other concerns or questions raised by the clients.
After health education, clients are checked for weight, blood pressure and nutritional assessment. Then, the health provider at the reception
starts screening clients’ health passport books for VL information based on milestones, missed appointment dates and clients with HVL results
who are on or needs to be on IAC.
39
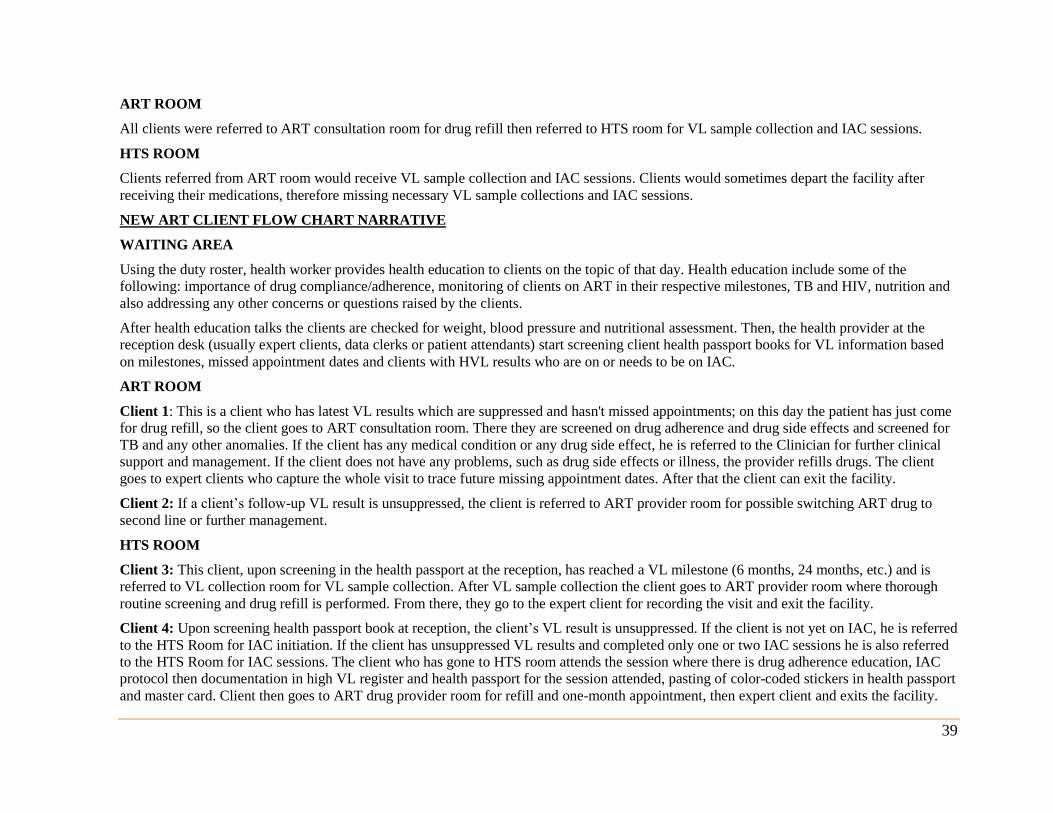
ART ROOM
All clients were referred to ART consultation room for drug refill then referred to HTS room for VL sample collection and IAC sessions.
HTS ROOM
Clients referred from ART room would receive VL sample collection and IAC sessions. Clients would sometimes depart the facility after
receiving their medications, therefore missing necessary VL sample collections and IAC sessions.
NEW ART CLIENT FLOW CHART NARRATIVE
WAITING AREA
Using the duty roster, health worker provides health education to clients on the topic of that day. Health education include some of the
following: importance of drug compliance/adherence, monitoring of clients on ART in their respective milestones, TB and HIV, nutrition and
also addressing any other concerns or questions raised by the clients.
After health education talks the clients are checked for weight, blood pressure and nutritional assessment. Then, the health provider at the
reception desk (usually expert clients, data clerks or patient attendants) start screening client health passport books for VL information based
on milestones, missed appointment dates and clients with HVL results who are on or needs to be on IAC.
ART ROOM
Client 1: This is a client who has latest VL results which are suppressed and hasn't missed appointments; on this day the patient has just come
for drug refill, so the client goes to ART consultation room. There they are screened on drug adherence and drug side effects and screened for
TB and any other anomalies. If the client has any medical condition or any drug side effect, he is referred to the Clinician for further clinical
support and management. If the client does not have any problems, such as drug side effects or illness, the provider refills drugs. The client
goes to expert clients who capture the whole visit to trace future missing appointment dates. After that the client can exit the facility.
Client 2: If a client’s follow-up VL result is unsuppressed, the client is referred to ART provider room for possible switching ART drug to
second line or further management.
HTS ROOM
Client 3: This client, upon screening in the health passport at the reception, has reached a VL milestone (6 months, 24 months, etc.) and is
referred to VL collection room for VL sample collection. After VL sample collection the client goes to ART provider room where thorough
routine screening and drug refill is performed. From there, they go to the expert client for recording the visit and exit the facility.
Client 4: Upon screening health passport book at reception, the client’s VL result is unsuppressed. If the client is not yet on IAC, he is referred
to the HTS Room for IAC initiation. If the client has unsuppressed VL results and completed only one or two IAC sessions he is also referred
to the HTS Room for IAC sessions. The client who has gone to HTS room attends the session where there is drug adherence education, IAC
protocol then documentation in high VL register and health passport for the session attended, pasting of color-coded stickers in health passport
and master card. Client then goes to ART drug provider room for refill and one-month appointment, then expert client and exits the facility.